UNITED STATES
SECURITIES AND EXCHANGE COMMISSION
Washington, D.C. 20549
FORM N-CSR
CERTIFIED SHAREHOLDER REPORT OF REGISTERED
MANAGEMENT INVESTMENT COMPANIES
Investment Company Act file number: 811-08282
Loomis Sayles Funds I
(Exact name of Registrant as specified in charter)
399 Boylston Street, Boston, Massachusetts 02116
(Address of principal executive offices) (Zip code)
Coleen Downs Dinneen, Esq.
Natixis Distributors, L.P.
399 Boylston Street
Boston, Massachusetts 02116
(Name and address of agent for service)
Registrant’s telephone number, including area code: (617) 449-2810
Date of fiscal year end: September 30
Date of reporting period: September 30, 2009
| Item 1. | Reports to Stockholders. |
The Registrant’s annual report transmitted to shareholders pursuant to Rule 30e-1 under the Investment Company Act of 1940 is as follows:

Loomis Sayles Small Cap Growth Fund
Loomis Sayles Small Cap Value Fund
ANNUAL REPORT
SEPTEMBER 30, 2009
FUND AND MANAGER REVIEW
Loomis Sayles Small Cap Growth Fund

Mark F. Burns, CFA
Manager since January 2005

John Slavik, CFA
Manager since April 2005
PORTFOLIO REVIEW
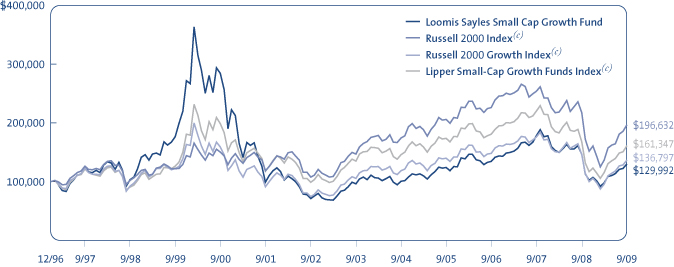
The Fund underperformed its Benchmark, the Russell 2000 Growth Index, during the 12-month period ending September 30, 2009. The majority of the underperformance took place during the second quarter 2009 as the equity markets rebounded off the lows in March. Although the rapid rebound of stocks is positive, quick moves like the one just witnessed often come with a price. That price was a low quality rally that propelled the smallest of the small caps and companies with the most troubled balance sheets and profitability profiles.
Stock selection, which has been a consistent driver of returns for the product, was a detractor in the second quarter and, hence, the 12-month period. From a sector standpoint, the healthcare and consumer discretionary sectors were the most problematic. Partially offsetting this were overweight positions in the energy and technology sectors, with each showing a positive impact from stock selection as well.
Healthcare was the largest detractor to the Fund’s performance, primarily due to the negative macro economic impact on hospital and pharmaceutical budgets. Natus Medical, a medical device company, and ICON Plc., a clinical research provider for pharma companies, were each impacted by this trend. RTI Biologics, a biomedical company, was hurt by discretionary spending on elective surgeries as well as a slower than expected product launch. Each of these holdings were sold from the portfolio as the spending environment remained in question.
Within the consumer discretionary sector, VistaPrint and Gildan Activewear represented the largest performance detractors. VistaPrint, an online supplier of graphic design products for small businesses, fell in the fourth quarter of 2008 after reducing its full-year earnings and revenue forecasts. Gildan Activewear, an apparel manufacturing company, fell in the fourth quarter of 2008, as economic activity contracted and consumer spending plunged. Both stocks were sold.
The technology, consumer staples and energy sectors were among the most positive performers. Within technology, Riverbed Technology and Brocade Communications were among the portfolio’s top performers. Riverbed, which produces appliances to connect computers in wide area networks, advanced late in the period on better-than-expected earnings. Brocade, a company that provides switching solutions for storage area networks, rose dramatically in the second quarter 2009, after the equity markets bottomed in March. Consumer staples holding Green Mountain Coffee Roasters, the company behind the Keurig one-cup coffee brewers, was the largest individual contributor to the Fund’s performance, benefiting from a distribution partnership with Wal-Mart. We sold Riverbed and Green Mountain at a profit. And within the energy sector, the top contributors to performance were Oceaneering and Concho Resources. Oceaneering, an energy service company that supplies the oil and gas industry, rose steadily in the first three quarters of 2009 as demand picked up in-line with the increase in oil prices. Concho, an oil and gas exploration and production company rose in the third quarter of 2009 as commodity prices recovered.
The only significant change we made to the portfolio’s positioning was to substantially increase the technology weighting, in anticipation of an improving economy in the closing quarter of 2009. Technology represented our
FUND FACTS
Symbol | Institutional: LSSIX;
Retail: LCGRX
Objective | Long-term capital growth from investments in common stocks or other equity securities
Strategy | Invests at least 80% of its net assets (plus any borrowings made for investment purposes) in equity securities of companies with market capitalizations that fall within the capitalization range of the Russell 2000 Index or is $3 billion or less at the time of investment. Unlike the Index, the Fund may invest in companies of any size.
Fund Inception Date | 12/31/96
Total Net Assets | $121.0 million
1
largest overweight, and stock selection within this sector became more fruitful due to falling intra-sector correlations. In addition, the sector’s inventory replenishment cycle helped promote strong company fundamentals.
OUTLOOK
As the economic clouds parted this year, investors have grown more confident, leading to improved risk appetites and a dramatic rise in the market. The panic lows of March have been corrected and valuation levels seem to more accurately reflect current improving economic conditions. We believe continued economic improvement will lead to improved, yet bumpy, corporate profit growth, supportive of higher stock prices. The focus now centers on stock selection, as companies with the best business fundamentals and balance sheets are likely to provide the greatest returns.
AVERAGE ANNUAL TOTAL RETURNS
Periods Ended September 30, 2009
| | | | | | | | | | |
| 1 Year | | | 5 Years | | | 10 Years | | | Since
Inception | |
Loomis Sayles Small Cap Growth: Institutional | |
| -11.40 | % | | 5.26 | % | | -3.01 | % | | 2.08 | % |
Loomis Sayles Small Cap Growth: Retail | |
| -11.66 | | | 5.01 | | | -3.27 | | | 1.82 | |
Russell 2000 Growth Index(c) | |
| -6.32 | | | 2.91 | | | 1.10 | | | 2.49 | |
Russell 2000 Index(c) | |
| -9.55 | | | 2.41 | | | 4.88 | | | 5.45 | |
Lipper Small-Cap Growth Funds Index(c) | |
| -3.75 | | | 2.01 | | | 2.47 | | | 3.82 | |
| | | | | | | | |
Gross expense ratio (before reductions and reimbursements)* |
| Institutional: 1.01% | | Retail: 1.42% |
Net expense ratio (after reductions and reimbursements)* |
| Institutional: 1.00% | | Retail: 1.25% |
* As stated in the most recent prospectus
CUMULATIVE PERFORMANCE
Inception to September 30, 2009(a)(b)
Data quoted reflects past performance and cannot guarantee future results. Average annual total returns assume reinvestment of dividends and capital gains distributions. Investment return and principal value will fluctuate so that shares, when redeemed, may be worth more or less than their original cost. For performance current to the most recent month end, please visit www.loomissayles.com. Current performance may be higher or lower than quoted.
Returns do not reflect the taxes that a shareholder would pay on fund distributions or the redemption of shares. Periods of less than one year are not annualized. Performance data reflects certain fee reductions and reimbursements, if any, without which performance would be lower.
(a) Cumulative performance is shown for the Institutional Class of Shares. Performance of the Retail Class would be lower due to higher fees. (b) The mountain chart is based on the initial investment minimum of $100,000 for the Institutional Class. (c) See page 5 for a description of the Indices.
WHAT YOU SHOULD KNOW
Small- and mid-cap stocks may be more volatile than larger, more established companies. The secondary market for these stocks may be less liquid, which could adversely impact the Fund’s value. Growth funds involve increased risks, in part, because the value of the underlying securities is based on future expectations that may or may not be met.
The Fund can invest a significant percentage of assets in foreign securities and the value of the fund shares can be adversely affected by changes in currency exchange rates, political, and economic developments. In emerging markets these risks can be significant. The Fund is subject to currency risk, which is the risk that fluctuations in exchange rates between the US dollar and foreign currencies may cause the value of a Fund’s investments to decline. Fund shares should be viewed as a long-term investment.
2
FUND AND MANAGER REVIEW
Loomis Sayles Small Cap Value Fund

Joseph Gatz, CFA
Manager since January 2000

Daniel Thelen, CFA
Manager since April 2000
PORTFOLIO REVIEW
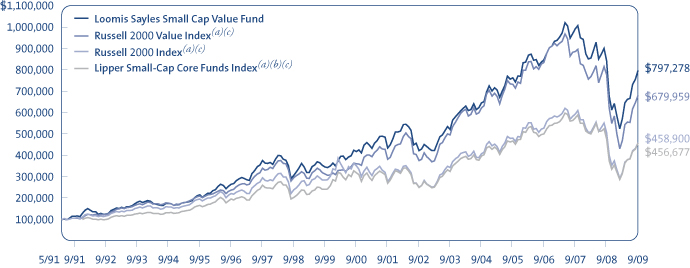
The Fund outperformed its Benchmark, the Russell 2000 Value Index, for the fiscal year ended September 30, 2009, primarily due to strong stock selection in the financial services sector.
The Fund’s higher quality orientation proved to be fairly defensive during the dramatic stock market selloff late in 2008 and early in 2009, and stock selection was favorable. Our cautious view on the fundamentals of bank stocks, which we underweighted, and our significant weighting in non-credit-sensitive financial data service companies, resulted in solid relative performance in financial services. PHH Corp., a provider of outsourced mortgage and fleet management services, was the Fund’s top contributor for the year. Twelve months ago, the stock was severely depressed due to PHH’s dependence on the capital markets to fund its business. As financing concerns slowly lifted, the high-quality, lower-risk nature of PHH’s business showed through. Three consecutive positive earnings surprises and a management change driven by activist shareholders also inspired investors.
Our holdings in consumer stocks were heavily weighted toward less-economically sensitive business services and media companies, which held up reasonably well versus the retail, apparel and restaurant segments.
Consumer staples, technology, materials and processing detracted slightly, but no individual sector had a large negative impact on the Fund’s relative performance. In the consumer staples sector, Spartan Stores, a Midwest grocery retailer, was among the largest detractors, declining on concerns about reduced economic activity in key states. The technology and materials sectors performed exceptionally well during the market rally. Overall, our stock selection in technology lagged, but an above-average weighting helped, while our underweight in materials detracted while our stock selection was positive.
As the market rebounded from its low in March of 2009, leadership was concentrated among the smallest market cap, higher-risk stocks. These stocks were the hardest hit during the market downturn, but they were among the first to reverse course on early signs of an economic bottom. The low-quality nature of the rally resulted in our portfolio being somewhat out of phase with the market. Nevertheless, several changes we made, including the addition of attractively valued basic materials, technology and industrial stocks in the spring of 2009, helped the Fund maintain its lead on the index.
OUTLOOK
As the economic clouds parted, investors have grown more confident, risk appetites have improved, and the market has risen dramatically. Much of what had been oversold has recovered, and valuation levels seem reasonable relative to current economic conditions. We believe continued economic improvement will support higher prices, but the recovery pace and pattern is apt to be bumpy. We believe determining appropriate valuations will be instrumental, while a focus on individual stock selection is likely to be especially important in this market environment.
FUND FACTS
Symbol | Institutional: LSSCX;
Retail: LSCRX; Admin: LSVAX
Objective | Long-term capital growth from investments in common stocks or other equity securities
Strategy | Invests at least 80% of its net assets (plus any borrowings made for investment purposes) in equity securities of companies with market capitalizations that fall within the capitalization range of the Russell 2000 Index or is $3 billion or less at the time of investment. Unlike the Index, the Fund may invest in companies of any size.
Fund Inception Date | 5/13/91
Class Inception Date | Institutional: 5/13/91
Retail: 12/31/96
Admin: 1/2/98
Total Net Assets | $967.9 million
3
AVERAGE ANNUAL TOTAL RETURNS
Periods Ended September 30, 2009
| | | | | | | | | | |
| 1 Year | | | 5 Years | | | 10 Years | | | Since Fund
Inception(a)(b) | |
Loomis Sayles Small Cap Value: Institutional | |
| -5.42 | % | | 4.29 | % | | 8.70 | % | | 11.95 | % |
Loomis Sayles Small Cap Value: Retail | |
| -5.66 | | | 4.03 | | | 8.44 | | | 11.76 | |
Loomis Sayles Small Cap Value: Admin | |
| -5.93 | | | 3.75 | | | 8.15 | | | 11.41 | |
Russell 2000 Value Index(c) | |
| -12.61 | | | 1.78 | | | 8.05 | | | 10.97 | |
Russell 2000 Index(c) | |
| -9.55 | | | 2.41 | | | 4.88 | | | 8.63 | |
Lipper Small-Cap Core Funds Index(c) | |
| -4.09 | | | 2.86 | | | 6.61 | | | N/A | |
| | | | | | | | |
Gross expense ratio (before reductions and reimbursements)* |
| Institutional: 0.90% | | Retail: 1.27% | | Admin: 1.69% |
Net expense ratio (after reductions and reimbursements)* |
| Institutional: 0.90% | | Retail: 1.15% | | Admin: 1.41% |
* As stated in the most recent prospectus
CUMULATIVE PERFORMANCE
Inception to September 30, 2009(d)(e)
Data quoted reflects past performance and cannot guarantee future results. Average annual total returns assume reinvestment of dividends and capital gains distributions. Investment return and principal value will fluctuate so that shares, when redeemed, may be worth more or less than their original cost. For performance current to the most recent month end, please visit www.loomissayles.com. Current performance may be higher or lower than quoted.
Returns do not reflect the taxes that a shareholder would pay on fund distributions or the redemption of shares. Periods of less than one year are not annualized. Performance data reflects certain fee reductions and reimbursements, if any, without which performance would be lower.
(a) Performance shown for periods prior to the inception date of the Retail Class (12/31/96) and Admin Class (1/02/98) represents the performance of the Institutional Class of shares during the periods shown, adjusted to reflect current levels of 12b-1 fees payable by the respective Classes. Since index performance data is not available coincident with the Fund’s inception date, the beginning value of the index is the value as of the month end closest to the Fund’s inception date. (b) The Lipper Small-Cap Core Funds Index performance data is not available prior to January 1, 1992. (c) See page 5 for a description of the Indices. (d) Cumulative performance is shown for the Institutional Class of Shares. Performance of the Retail and Admin Classes would be lower due to higher fees and expenses. (e) The mountain chart is based on the initial investment minimum of $100,000 for the Institutional Class.
WHAT YOU SHOULD KNOW
Value stocks may fall out of favor with investors and underperform the overall equity market during any given period. Small- and mid-cap stocks may be more volatile than larger, more established companies. The secondary market for these stocks may be less liquid, which could adversely impact the Fund’s value.
The Fund can invest a significant percentage of assets in foreign securities and the value of the fund shares can be adversely affected by changes in currency exchange rates, political, and economic developments. In emerging markets these risks can be significant. The Fund is subject to currency risk, which is the risk that fluctuations in exchange rates between the US dollar and foreign currencies may cause the value of a Fund’s investments to decline. Fund shares should be viewed as a long-term investment.
4
ADDITIONAL INFORMATION
Index Definitions
Indexes are unmanaged and do not have expenses that affect results, unlike mutual funds. Index returns are adjusted for the reinvestment of capital gain distributions and income dividends. It is not possible to invest directly in an index.
Lipper Small-Cap Core Funds Index is an equally weighted index of typically the 30 largest mutual funds within the small-cap core funds investment objective.
Lipper Small-Cap Growth Funds Index is an equally weighted index of typically the 30 largest mutual funds within the small-cap growth funds investment objective.
Source: Lipper, Inc.
Russell 2000 Growth Index is an index comprised of those Russell 2000 companies with higher price-to-book ratios and higher forecasted growth values.
Russell 2000 Index is an index comprised of the 2,000 smallest companies in the Russell 3000 Index (a broad market index), representing approximately 10% of the Russell 3000 total market capitalization.
Russell 2000 Value Index is an index comprised of those Russell 2000 companies with lower price-to-book ratios and lower forecasted growth values.
Proxy Voting Information
A description of the Funds’ proxy voting policies and procedures is available without charge, upon request, (i) by calling Loomis Sayles at 800-633-3330; (ii) on the Funds’ website, www.loomissayles.com, and (iii) on the SEC’s website, www.sec.gov. Information about how the Funds voted proxies relating to portfolio securities during the 12 months ended June 30, 2009 is available on (i) the Funds’ website and (ii) the SEC’s website.
Quarterly Portfolio Schedules
The Funds file a complete schedule of portfolio holdings with the SEC for the first and third quarters of each fiscal year on Form N-Q. The Funds’ Forms N-Q are available on the SEC’s website at www.sec.gov and may be reviewed and copied at the SEC’s Public Reference Room in Washington, DC. Information on the operation of the Public Reference Room may be obtained by calling 800-SEC-0330.
UNDERSTANDING YOUR FUND’S EXPENSES
As a mutual fund shareholder you incur two types of costs: (1) transaction costs, including redemption fees and certain exchange fees; and (2) ongoing costs, including management fees, distribution and/or service fees (12b-1 fees), and other Fund expenses. These costs are described in more detail in the Funds’ prospectus. The examples below are intended to help you understand the ongoing costs of investing in the Funds and help you compare these with the ongoing costs of investing in other mutual funds.
The first line in the table of each Fund shows the actual amount of Fund expenses you would have paid on a $1,000 investment in the Fund from April 1, 2009 through September 30, 2009. It also shows how much a $1,000 investment would be worth at the close of the period, assuming actual fund returns and expenses. To estimate the expenses you paid over the period, simply divide your account value by $1,000 (for example $8,600 account value divided by $1,000 = 8.6) and multiply the result by the number in the Expenses Paid During the Period column as shown below for your class.
The second line in the table of each Fund provides information about hypothetical account values and hypothetical expenses based on the Fund’s actual expense ratios and an assumed rate of return of 5% per year before expenses, which is not the Fund’s actual return. The hypothetical account values and expenses may not be used to estimate the actual ending account balance or expenses you paid on your investment for the period. You may use this information to compare the ongoing costs of investing in the Funds and other funds. To do so, compare this 5% hypothetical example with the 5% hypothetical examples that appear in the shareholder reports of other funds.
5
Please note that the expenses shown reflect ongoing costs only, and do not include any transaction costs. Therefore, the second line in the table is useful in comparing ongoing costs only, and will not help you determine the relative costs of owning different funds. If transaction costs were included, total costs would be higher.
Loomis Sayles Small Cap Growth Fund
| | | | | | |
Institutional Class | | Beginning
Account Value
4/1/2009 | | Ending
Account Value
9/30/2009 | | Expenses Paid
During Period*
4/1/2009 – 9/30/2009 |
Actual | | $1,000.00 | | $1,323.40 | | $5.82 |
Hypothetical (5% return before expenses) | | $1,000.00 | | $1,020.05 | | $5.06 |
| | | |
Retail Class | | | | | | |
Actual | | $1,000.00 | | $1,321.90 | | $7.28 |
Hypothetical (5% return before expenses) | | $1,000.00 | | $1,018.80 | | $6.33 |
* Expenses are equal to the Fund’s annualized expense ratio (after fee reduction/reimbursement): 1.00%, and 1.25% for Institutional and Retail Class, respectively, multiplied by the average account value over the period multiplied by the number of days in the most recent fiscal half-year, divided by 365 (to reflect the half-year period). |
Loomis Sayles Small Cap Value Fund
| | | | | | |
Institutional Class | | Beginning
Account Value
4/1/2009 | | Ending
Account Value
9/30/2009 | | Expenses Paid
During Period*
4/1/2009 – 9/30/2009 |
Actual | | $1,000.00 | | $1,396.90 | | $5.41 |
Hypothetical (5% return before expenses) | | $1,000.00 | | $1,020.56 | | $4.56 |
| | | |
Retail Class | | | | | | |
Actual | | $1,000.00 | | $1,395.40 | | $6.91 |
Hypothetical (5% return before expenses) | | $1,000.00 | | $1,019.30 | | $5.82 |
| | | |
Admin Class | | | | | | |
Actual | | $1,000.00 | | $1,392.70 | | $8.40 |
Hypothetical (5% return before expenses) | | $1,000.00 | | $1,018.05 | | $7.08 |
* Expenses are equal to the Fund’s annualized expense ratio (after fee reduction/reimbursement): 0.90%, 1.15% and 1.40% for Institutional, Retail and Admin Class, respectively, multiplied by the average account value over the period, multiplied by the number of days in the most recent fiscal half-year, divided by 365 (to reflect the half-year period). |
6
BOARD APPROVAL OF THE EXISTING ADVISORY AGREEMENTS
The Board of Trustees, including the Independent Trustees, considers matters bearing on each Fund’s advisory agreement (collectively, the “Agreements”) at most of its meetings throughout the year. Each year, usually in the spring, the Contract Review and Governance Committee of the Board meets to review the Agreements to determine whether to recommend that the full Board approve the continuation of the Agreements, typically for an additional one-year period. After the Committee has made its recommendation, the full Board, including the Independent Trustees, determines whether to approve the continuation of the Agreements.
In connection with these meetings, the Trustees receive materials that the Funds’ investment adviser (the “Adviser”) believes to be reasonably necessary for the Trustees to evaluate the Agreements. These materials generally include, among other items, (i) information on the investment performance of the Funds and the performance of peer groups of funds and the Funds’ performance benchmarks, (ii) information on the Funds’ advisory fees, and other expenses, including information comparing the Funds’ expenses to those of peer groups of funds and information about applicable expense caps and fee “breakpoints,” (iii) sales and redemption data in respect of the Funds, (iv) information about the profitability of the Agreements to the Funds’ Adviser and (v) information obtained through the completion of a questionnaire by the Adviser (the Trustees are consulted as to the information requested through that questionnaire). The Board of Trustees, including the Independent Trustees, also consider other matters such as (i) the Adviser’s financial results and financial condition, (ii) each Fund’s investment objective and strategies and the size, education and experience of the Adviser’s respective investment staffs and their use of technology, external research and trading cost measurement tools, (iii) arrangements in respect of the distribution of the Funds’ shares and the related costs, (iv) the procedures employed to determine the value of the Funds’ assets, (v) the allocation of the Funds’ brokerage, if any, including, if applicable, allocations to brokers affiliated with the Adviser and the use of “soft” commission dollars to pay Fund expenses and to pay for research and other similar services, (vi) the resources devoted to, and the record of compliance with, the Funds’ investment policies and restrictions, policies on personal securities transactions and other compliance policies, (vii) information about amounts invested by the Funds’ portfolio managers in the Funds or in similar accounts that they manage and (viii) the general economic outlook with particular emphasis on the mutual fund industry. Throughout the process, the Trustees are afforded the opportunity to ask questions of and request additional materials from the Adviser.
In addition to the materials requested by the Trustees in connection with their annual consideration of the continuation of the Agreements, the Trustees receive materials in advance of each regular quarterly meeting of the Board of Trustees that provide detailed information about the Funds’ investment performance and the fees charged to the Funds for advisory and other services. This information generally includes, among other things, an internal performance rating for each Fund based on agreed-upon criteria, graphs showing each Fund’s performance and fee differentials against each Fund’s peer group of funds, performance ratings provided by a third-party, total return information for various periods, and third-party performance rankings for various periods comparing a Fund against its peer group. The portfolio management team for each Fund or other representatives of the Adviser make periodic presentations to the Contract Review and Governance Committee and/or the full Board of Trustees, and Funds identified as presenting possible performance concerns may be subject to more frequent board presentations and reviews. In addition, each quarter the Trustees are provided with detailed statistical information about each Fund’s portfolio.
The Board of Trustees most recently approved the continuation of the Agreements at their meeting held in June, 2009. The Agreements were continued for a one-year period for the Funds. In considering whether to approve the continuation of the Agreements, the Board of Trustees, including the Independent Trustees, did not identify any single factor as determinative. Individual Trustees may have evaluated the information presented differently from one another, giving different weights to various factors. Matters considered by the Trustees, including the Independent Trustees, in connection with their approval of the Agreements included the factors listed below.
The nature, extent and quality of the services provided to the Funds under the Agreements. The Trustees considered the nature, extent and quality of the services provided by the Adviser and its affiliates to the Funds and the resources dedicated to the Funds by the Adviser and its affiliates, including recent or planned investments by the Adviser in additional personnel or other resources. They considered the need for the Adviser to offer competitive compensation in order to attract and retain capable personnel. They also considered the administrative services provided by Natixis Advisors and its affiliates to the Funds.
For each Fund, the Trustees also considered the benefits to shareholders of investing in a mutual fund that is part of a family of funds that offers shareholders the right to exchange shares of one type of fund for shares of another type of fund, and provides a variety of fund and shareholder services.
After reviewing these and related factors, the Trustees concluded, within the context of their overall conclusions regarding each of the Agreements, that the nature, extent and quality of services provided supported the renewal of the Agreements.
Investment performance of the Funds and the Adviser. As noted above, the Trustees received information about the performance of the Funds over various time periods, including information which compared the performance of the Funds to the performance of peer
7
groups of funds and the Funds’ respective performance benchmarks. In addition, the Trustees also reviewed data prepared by an independent third party which analyzed the performance of the Funds using a variety of performance metrics, including metrics which also measured the performance of the Funds on a risk adjusted basis.
With respect to each Fund, the Board concluded that the Fund’s performance or other relevant factors supported the renewal of the Agreement relating to that Fund.
The Trustees also considered the Adviser’s performance and reputation generally, the Funds’ performance as a fund family generally (as noted by certain financial publications), and the historical responsiveness of the Adviser to Trustee concerns about performance and the willingness of the Adviser to take steps intended to improve performance.
After reviewing these and related factors, the Trustees concluded, within the context of their overall conclusions regarding each of the Agreements, that the performance of the Funds and the Adviser supported the renewal of the Agreements.
The costs of the services to be provided and profits to be realized by the Adviser and its affiliates from their respective relationships with the Funds. The Trustees considered the fees charged to the Funds for advisory services as well as the total expense levels of the Funds. This information included comparisons (provided both by management and also by an independent third party) of the Funds’ advisory fees and total expense levels to those of their peer groups and information about the advisory fees charged by the Adviser to comparable accounts. In considering the fees charged to comparable accounts, the Trustees considered, among other things, management’s representations about the differences between managing mutual funds as compared to other types of accounts, including the additional resources required to effectively manage and the greater regulatory costs associated with the management of mutual fund assets. In evaluating each Fund’s advisory fee, the Trustees also took into account the demands, complexity and quality of the investment management of such Fund. The Trustees considered that over the past several years, management had made recommendations regarding the institution of expense caps. They noted that all of the Loomis Sayles Funds in this report have expense caps in place, and they considered the amounts waived or reimbursed by the Adviser under these caps.
The Trustees also considered the compensation directly or indirectly received by the Adviser and its affiliates from their relationships with the Funds. The Trustees reviewed information provided by management as to the profitability of the Adviser and its affiliates’ relationships with the Funds, and information about the allocation of expenses used to calculate profitability. They also reviewed information provided by management about the effect of distribution costs and changes in asset levels on Adviser profitability, including information regarding resources spent on distribution activities. When reviewing profitability, the Trustees also considered information about court cases in which adviser profitability was an issue, the performance of the relevant Funds, the expense levels of the Funds, and whether the Adviser had implemented breakpoints and/or expense caps with respect to such Funds.
After reviewing these and related factors, the Trustees concluded, within the context of their overall conclusions regarding each of the Agreements, that the advisory fee charged to each of the Funds were fair and reasonable, and that the costs of these services generally and the related profitability of the Adviser and its affiliates in respect of their relationships with the Funds supported the renewal of the Agreements.
Economies of Scale. The Trustees considered the existence of any economies of scale in the provision of services by the Adviser and whether those economies are shared with the Funds through breakpoints in their investment advisory fees or other means, such as expense waivers or caps. The Trustees noted that although each Fund’s management fee was not subject to breakpoints, each Fund’s management fee was below the median fee for a peer group of funds and that each of the Funds was subject to an expense cap. In considering these issues, the Trustees also took note of the costs of the services provided (both on an absolute and a relative basis) and the profitability to the Adviser and its affiliates of their relationships with the Funds, as discussed above.
After reviewing these and related factors, the Trustees considered, within the context of their overall conclusions regarding each of the Agreements, that the extent to which economies of scale were shared with the Funds supported the renewal of the Agreements.
The Trustees also considered other factors, which included but were not limited to the following:
| • | | the effect of recent market and economic turmoil on the performance, asset levels and expense ratios of each Fund. |
| • | | whether each Fund has operated in accordance with its investment objective and the Fund’s record of compliance with its investment restrictions, and the compliance programs of the Funds and the Adviser. They also considered the compliance-related resources the Adviser and its affiliates were providing to the Funds. |
| • | | the nature, quality, cost and extent of administrative and shareholder services performed by the Adviser and its affiliates, both under the Agreements and under separate agreements covering administrative services. |
| • | | so-called “fallout benefits” to the Adviser, such as the engagement of affiliates of the Adviser to provide distribution, administrative and brokerage services to the Funds, and the benefits of research made available to the Adviser by reason of brokerage commissions |
8
| | generated by the Funds’ securities transactions. The Trustees also considered the fact that Natixis Advisors’ parent company benefits from the retention of an affiliated Adviser. The Trustees considered the possible conflicts of interest associated with these fallout and other benefits, and the reporting, disclosure and other processes in place to disclose and monitor such possible conflicts of interest. |
| • | | the Trustees’ review and discussion of the Funds’ advisory arrangements in prior years, and management’s record of responding to Trustee concerns raised during the year and in prior years. |
Based on their evaluation of all factors that they deemed to be material, including those factors described above, and assisted by the advice of independent counsel, the Trustees, including the Independent Trustees, concluded that each of the existing Agreements should be continued through June 30, 2010.
9
PORTFOLIO OF INVESTMENTS – as of September 30, 2009
Loomis Sayles Small Cap Growth Fund
| | | | | | | |
| | | | | Shares | | Value (†) |
| | | | | | | |
| | | |
| COMMON STOCKS – 97.4% of Net Assets | | | | | | | |
| | | |
| Aerospace & Defense – 2.0% | | | | | | | |
Applied Signal Technology, Inc. | | | | 49,537 | | $ | 1,152,726 |
Hexcel Corp.(b) | | | | 105,827 | | | 1,210,661 |
| | | | | | | |
| | | | | | | 2,363,387 |
| | | | | | | |
| Biotechnology – 4.8% | | | | | | | |
Alexion Pharmaceuticals, Inc.(b) | | | | 24,335 | | | 1,083,881 |
AMAG Pharmaceuticals, Inc.(b) | | | | 18,395 | | | 803,494 |
Incyte Corp. Ltd.(b) | | | | 134,691 | | | 909,164 |
Isis Pharmaceuticals, Inc.(b) | | | | 48,621 | | | 708,408 |
Onyx Pharmaceuticals, Inc.(b) | | | | 26,280 | | | 787,612 |
Regeneron Pharmaceuticals, Inc.(b) | | | | 38,595 | | | 744,883 |
Theravance, Inc.(b) | | | | 49,374 | | | 722,835 |
| | | | | | | |
| | | | | | | 5,760,277 |
| | | | | | | |
| Building Products – 0.6% | | | | | | | |
Trex Company, Inc.(b) | | | | 43,079 | | | 784,038 |
| | | | | | | |
| Capital Markets – 4.0% | | | | | | | |
Evercore Partners, Inc., Class A | | | | 39,517 | | | 1,154,687 |
Greenhill & Co., Inc. | | | | 15,206 | | | 1,362,153 |
Penson Worldwide, Inc.(b) | | | | 101,355 | | | 987,198 |
Stifel Financial Corp.(b) | | | | 24,809 | | | 1,362,014 |
| | | | | | | |
| | | | | | | 4,866,052 |
| | | | | | | |
| Commercial Banks – 0.9% | | | | | | | |
Signature Bank(b) | | | | 39,300 | | | 1,139,700 |
| | | | | | | |
| Commercial Services & Supplies – 2.7% | | | | | | | |
EnerNOC, Inc.(b) | | | | 33,665 | | | 1,116,331 |
Tetra Tech, Inc.(b) | | | | 34,066 | | | 903,771 |
Waste Connections, Inc.(b) | | | | 41,807 | | | 1,206,550 |
| | | | | | | |
| | | | | | | 3,226,652 |
| | | | | | | |
| Communications Equipment – 6.1% | | | | | | | |
Brocade Communications Systems, Inc.(b) | | | | 136,465 | | | 1,072,615 |
Ciena Corp.(b) | | | | 76,816 | | | 1,250,565 |
DG FastChannel, Inc.(b) | | | | 57,594 | | | 1,206,018 |
F5 Networks, Inc.(b) | | | | 30,599 | | | 1,212,638 |
Harris Stratex Networks, Inc., Class A(b) | | | | 133,587 | | | 935,109 |
Starent Networks Corp.(b) | | | | 24,485 | | | 622,409 |
Tellabs, Inc.(b) | | | | 152,621 | | | 1,056,137 |
| | | | | | | |
| | | | | | | 7,355,491 |
| | | | | | | |
| Construction & Engineering – 3.2% | | | | | | | |
Dycom Industries, Inc.(b) | | | | 48,292 | | | 593,992 |
MasTec, Inc.(b) | | | | 88,794 | | | 1,078,847 |
Northwest Pipe Co.(b) | | | | 32,778 | | | 1,099,046 |
Orion Marine Group, Inc.(b) | | | | 53,846 | | | 1,105,997 |
| | | | | | | |
| | | | | | | 3,877,882 |
| | | | | | | |
| Diversified Consumer Services – 2.6% | | | | | | | |
Grand Canyon Education, Inc.(b) | | | | 54,021 | | | 963,194 |
Lincoln Educational Services Corp.(b) | | | | 43,145 | | | 987,158 |
New Oriental Education & Technology Group, Inc., Sponsored ADR(b) | | | | 15,413 | | | 1,239,976 |
| | | | | | | |
| | | | | | | 3,190,328 |
| | | | | | | |
See accompanying notes to financial statements.
10
PORTFOLIO OF INVESTMENTS – as of September 30, 2009
Loomis Sayles Small Cap Growth Fund – continued
| | | | | | | |
| | | | | Shares | | Value (†) |
| | | | | | | |
| | | |
| COMMON STOCKS – continued | | | | | | | |
| | | |
| Diversified Financial Services – 1.1% | | | | | | | |
MSCI, Inc.(b) | | | | 43,457 | | $ | 1,287,196 |
| | | | | | | |
| Diversified Telecommunication Services – 0.7% | | | | | | | |
Neutral Tandem, Inc.(b) | | | | 39,069 | | | 889,210 |
| | | | | | | |
| Electric Utilities – 0.9% | | | | | | | |
ITC Holdings Corp. | | | | 23,444 | | | 1,065,530 |
| | | | | | | |
| Electronic Equipment Instruments & Components – 1.7% | | | | | | | |
Cogent, Inc.(b) | | | | 75,903 | | | 766,620 |
IPG Photonics Corp.(b) | | | | 84,502 | | | 1,284,431 |
| | | | | | | |
| | | | | | | 2,051,051 |
| | | | | | | |
| Energy Equipment & Services – 1.8% | | | | | | | |
Oceaneering International, Inc.(b) | | | | 22,494 | | | 1,276,535 |
Tesco Corp.(b) | | | | 118,041 | | | 941,967 |
| | | | | | | |
| | | | | | | 2,218,502 |
| | | | | | | |
| Food Products – 1.0% | | | | | | | |
Diamond Foods, Inc. | | | | 36,383 | | | 1,154,069 |
| | | | | | | |
| Health Care Equipment & Supplies – 5.7% | | | | | | | |
DexCom, Inc.(b) | | | | 111,199 | | | 881,808 |
Electro-Optical Sciences, Inc.(b) | | | | 83,497 | | | 799,901 |
ev3, Inc.(b) | | | | 98,341 | | | 1,210,578 |
Insulet Corp.(b) | | | | 70,731 | | | 794,309 |
Masimo Corp.(b) | | | | 27,525 | | | 721,155 |
ResMed, Inc.(b) | | | | 27,301 | | | 1,234,005 |
Volcano Corp.(b) | | | | 71,493 | | | 1,202,513 |
| | | | | | | |
| | | | | | | 6,844,269 |
| | | | | | | |
| Health Care Providers & Services – 3.9% | | | | | | | |
Bio-Reference Labs, Inc.(b) | | | | 30,245 | | | 1,040,428 |
Catalyst Health Solutions, Inc.(b) | | | | 39,449 | | | 1,149,939 |
Genoptix, Inc.(b) | | | | 31,013 | | | 1,078,632 |
IPC The Hospitalist Co.(b) | | | | 47,249 | | | 1,485,981 |
| | | | | | | |
| | | | | | | 4,754,980 |
| | | | | | | |
| Health Care Technology – 4.6% | | | | | | | |
athenahealth, Inc.(b) | | | | 33,504 | | | 1,285,548 |
MedAssets, Inc.(b) | | | | 87,426 | | | 1,973,205 |
Phase Forward, Inc.(b) | | | | 69,545 | | | 976,412 |
SXC Health Solutions Corp.(b) | | | | 29,522 | | | 1,381,334 |
| | | | | | | |
| | | | | | | 5,616,499 |
| | | | | | | |
| Hotels, Restaurants & Leisure – 3.4% | | | | | | | |
Bally Technologies, Inc.(b) | | | | 22,083 | | | 847,325 |
BJ’s Restaurants, Inc.(b) | | | | 66,567 | | | 997,839 |
Buffalo Wild Wings, Inc.(b) | | | | 26,996 | | | 1,123,304 |
Panera Bread Co., Class A(b) | | | | 21,618 | | | 1,188,990 |
| | | | | | | |
| | | | | | | 4,157,458 |
| | | | | | | |
| Household Durables – 0.7% | | | | | | | |
Tempur-Pedic International, Inc.(b) | | | | 41,834 | | | 792,336 |
| | | | | | | |
| Internet Software & Services – 2.9% | | | | | | | |
Constant Contact, Inc.(b) | | | | 55,782 | | | 1,073,804 |
DealerTrack Holdings, Inc.(b) | | | | 64,691 | | | 1,223,307 |
GSI Commerce, Inc.(b) | | | | 65,172 | | | 1,258,471 |
| | | | | | | |
| | | | | | | 3,555,582 |
| | | | | | | |
See accompanying notes to financial statements.
11
| | | | | | | |
| | | | | Shares | | Value (†) |
| | | | | | | |
| | | |
| COMMON STOCKS – continued | | | | | | | |
| | | |
| IT Services – 1.0% | | | | | | | |
CyberSource Corp.(b) | | | | 72,744 | | $ | 1,212,642 |
| | | | | | | |
| Machinery – 2.4% | | | | | | | |
Bucyrus International, Inc. | | | | 37,170 | | | 1,323,995 |
Energy Recovery, Inc.(b) | | | | 113,226 | | �� | 658,975 |
Wabtec Corp. | | | | 24,156 | | | 906,575 |
| | | | | | | |
| | | | | | | 2,889,545 |
| | | | | | | |
| Media – 0.8% | | | | | | | |
Imax Corp.(b) | | | | 109,125 | | | 1,026,866 |
| | | | | | | |
| Oil, Gas & Consumable Fuels – 3.6% | | | | | | | |
Arena Resources, Inc.(b) | | | | 34,249 | | | 1,215,840 |
Comstock Resources, Inc.(b) | | | | 40,734 | | | 1,632,619 |
Concho Resources, Inc.(b) | | | | 39,901 | | | 1,449,204 |
| | | | | | | |
| | | | | | | 4,297,663 |
| | | | | | | |
| Pharmaceuticals – 2.8% | | | | | | | |
Cypress Bioscience, Inc.(b) | | | | 89,420 | | | 730,561 |
Eurand NV(b) | | | | 61,004 | | | 923,601 |
Inspire Pharmaceuticals, Inc.(b) | | | | 132,042 | | | 689,259 |
Nektar Therapeutics(b) | | | | 107,520 | | | 1,047,245 |
| | | | | | | |
| | | | | | | 3,390,666 |
| | | | | | | |
| Professional Services – 3.4% | | | | | | | |
ICF International, Inc.(b) | | | | 49,755 | | | 1,508,572 |
IHS, Inc., Class A(b) | | | | 26,827 | | | 1,371,664 |
Monster Worldwide, Inc.(b) | | | | 69,059 | | | 1,207,151 |
| | | | | | | |
| | | | | | | 4,087,387 |
| | | | | | | |
| Semiconductors & Semiconductor Equipment – 8.0% | | | | | | | |
Cavium Network, Inc.(b) | | | | 51,068 | | | 1,096,430 |
Cymer, Inc.(b) | | | | 27,488 | | | 1,068,184 |
Hittite Microwave Corp.(b) | | | | 29,990 | | | 1,103,032 |
Lam Research Corp.(b) | | | | 39,276 | | | 1,341,668 |
Netlogic Microsystems, Inc.(b) | | | | 26,610 | | | 1,197,450 |
Power Integrations, Inc. | | | | 31,450 | | | 1,048,229 |
Silicon Laboratories, Inc.(b) | | | | 30,373 | | | 1,408,092 |
Varian Semiconductor Equipment Associates, Inc.(b) | | | | 42,555 | | | 1,397,506 |
| | | | | | | |
| | | | | | | 9,660,591 |
| | | | | | | |
| Software – 10.4% | | | | | | | |
ArcSight, Inc.(b) | | | | 26,049 | | | 627,000 |
Ariba, Inc.(b) | | | | 106,804 | | | 1,238,927 |
Blackboard, Inc.(b) | | | | 37,436 | | | 1,414,332 |
Concur Technologies, Inc.(b) | | | | 30,254 | | | 1,202,899 |
DemandTec, Inc.(b) | | | | 99,033 | | | 874,461 |
Informatica Corp.(b) | | | | 71,552 | | | 1,615,644 |
Nice Systems Ltd., ADR(b) | | | | 36,344 | | | 1,106,311 |
Sourcefire, Inc.(b) | | | | 31,449 | | | 675,210 |
Tyler Technologies, Inc.(b) | | | | 71,400 | | | 1,220,226 |
Ultimate Software Group, Inc.(The)(b) | | | | 44,226 | | | 1,270,171 |
VanceInfo Technologies, Inc., ADR(b) | | | | 70,084 | | | 1,362,433 |
| | | | | | | |
| | | | | | | 12,607,614 |
| | | | | | | |
See accompanying notes to financial statements.
12
PORTFOLIO OF INVESTMENTS – as of September 30, 2009
Loomis Sayles Small Cap Growth Fund – continued
| | | | | | | | |
| | | | | Shares | | Value (†) |
| | | | | | | | |
| | | |
| COMMON STOCKS – continued | | | | | | | | |
| | | |
| Specialty Retail – 5.5% | | | | | | | | |
DSW, Inc., Class A(b) | | | | | 79,768 | | $ | 1,273,895 |
hhgregg, Inc.(b) | | | | | 50,874 | | | 861,806 |
Hibbett Sports, Inc.(b) | | | | | 48,253 | | | 879,652 |
Lumber Liquidators, Inc.(b) | | | | | 60,874 | | | 1,320,357 |
Monro Muffler Brake, Inc. | | | | | 38,606 | | | 1,227,285 |
Ulta Salon, Cosmetics & Fragrance, Inc.(b) | | | | | 65,485 | | | 1,081,157 |
| | | | | | | | |
| | | | | | | | 6,644,152 |
| | | | | | | | |
| Textiles, Apparel & Luxury Goods – 4.2% | | | | | | | | |
Fuqi International, Inc.(b) | | | | | 28,478 | | | 833,836 |
Lululemon Athletica, Inc.(b) | | | | | 37,268 | | | 847,847 |
Phillips-Van Heusen Corp. | | | | | 33,081 | | | 1,415,536 |
Under Armour, Inc., Class A(b) | | | | | 44,737 | | | 1,245,030 |
Volcom, Inc.(b) | | | | | 43,410 | | | 715,397 |
| | | | | | | | |
| | | | | | | | 5,057,646 |
| | | | | | | | |
| | | |
| TOTAL COMMON STOCKS | | | | | | | | |
(Identified Cost $98,475,238) | | | | | | | | 117,825,261 |
| | | | | | | | |
| | | |
| | | | | Principal Amount | | |
| | | |
| SHORT-TERM INVESTMENTS – 1.5% | | | | | | | | |
| Tri-Party Repurchase Agreement with Fixed Income Clearing Corporation, dated 9/30/09 at 0.000% to be repurchased at $1,818,320 on 10/01/09 collateralized by $1,840,000 Federal Home Loan Bank, 3.030% due 5/05/14 valued at $1,856,100 including accrued interest (Note 2f of Notes to Financial Statements) (Identified Cost $1,818,320) | | | | $ | 1,818,320 | | | 1,818,320 |
| | | | | | | | |
| | | |
| TOTAL INVESTMENTS – 98.9% | | | | | | | | |
(Identified Cost $100,293,558)(a) | | | | | | | | 119,643,581 |
Other assets less liabilities—1.1% | | | | | | | | 1,391,350 |
| | | | | | | | |
| | | |
| NET ASSETS – 100.0% | | | | | | | $ | 121,034,931 |
| | | | | | | | |
| | |
(†) See Note 2a of Notes to Financial Statements. | | | | | | |
(a) Federal Tax Information: | | | | | | |
At September 30, 2009, the net unrealized appreciation on investments based on a cost of $101,035,882 for federal income tax purposes was as follows: | | | |
Aggregate gross unrealized appreciation for all investments in which there is an excess of value over tax cost | | $ | 21,141,029 |
Aggregate gross unrealized depreciation for all investments in which there is an excess of tax cost over value | | | (2,533,330) |
| | | | | | | | |
Net unrealized appreciation | | $ | 18,607,699 |
| | | | | | | | |
| (b) | Non-income producing security. |
| ADR | An American Depositary Receipt (ADR) is a certificate issued by a custodian bank representing the right to receive securities of the foreign issuer described. The values of ADRs are significantly influenced by trading on exchanges not located in the United States. |
See accompanying notes to financial statements.
13
INDUSTRY SUMMARY AT SEPTEMBER 30, 2009 (Unaudited)
| | | |
Software | | 10.4 | % |
Semiconductors & Semiconductor Equipment | | 8.0 | |
Communications Equipment | | 6.1 | |
Health Care Equipment & Supplies | | 5.7 | |
Specialty Retail | | 5.5 | |
Biotechnology | | 4.8 | |
Health Care Technology | | 4.6 | |
Textiles, Apparel & Luxury Goods | | 4.2 | |
Capital Markets | | 4.0 | |
Health Care Providers & Services | | 3.9 | |
Oil, Gas & Consumable Fuels | | 3.6 | |
Hotels, Restaurants & Leisure | | 3.4 | |
Professional Services | | 3.4 | |
Construction & Engineering | | 3.2 | |
Internet Software & Services | | 2.9 | |
Pharmaceuticals | | 2.8 | |
Commercial Services & Supplies | | 2.7 | |
Diversified Consumer Services | | 2.6 | |
Machinery | | 2.4 | |
Aerospace & Defense | | 2.0 | |
Other Investments, less than 2% each | | 11.2 | |
Short-Term Investments | | 1.5 | |
| | | |
Total Investments | | 98.9 | |
Other assets less liabilities | | 1.1 | |
| | | |
Net Assets | | 100.0 | % |
| | | |
See accompanying notes to financial statements.
14
PORTFOLIO OF INVESTMENTS – as of September 30, 2009
Loomis Sayles Small Cap Value Fund
| | | | | | | |
| | | | | Shares | | Value (†) |
| | | | | | | |
| | | |
| COMMON STOCKS – 95.4% of Net Assets | | | | | | | |
| | | |
| Aerospace & Defense – 1.1% | | | | | | | |
Ducommun, Inc. | | | | 209,460 | | $ | 3,960,889 |
Teledyne Technologies, Inc.(b) | | | | 195,386 | | | 7,031,942 |
| | | | | | | |
| | | | | | | 10,992,831 |
| | | | | | | |
| Air Freight & Logistics – 0.8% | | | | | | | |
Atlas Air Worldwide Holdings, Inc.(b) | | | | 236,556 | | | 7,562,695 |
| | | | | | | |
| Auto Components – 0.5% | | | | | | | |
Goodyear Tire & Rubber Co. (The)(b) | | | | 298,466 | | | 5,082,876 |
| | | | | | | |
| Building Products – 0.8% | | | | | | | |
Armstrong World Industries, Inc.(b) | | | | 220,314 | | | 7,592,020 |
| | | | | | | |
| Capital Markets – 2.9% | | | | | | | |
Fifth Street Finance Corp. | | | | 349,872 | | | 3,824,101 |
Investment Technology Group, Inc.(b) | | | | 217,478 | | | 6,071,986 |
JMP Group, Inc. | | | | 161,713 | | | 1,562,148 |
Legg Mason, Inc. | | | | 160,379 | | | 4,976,560 |
Stifel Financial Corp.(b) | | | | 214,727 | | | 11,788,512 |
| | | | | | | |
| | | | | | | 28,223,307 |
| | | | | | | |
| Chemicals – 3.0% | | | | | | | |
Calgon Carbon Corp.(b) | | | | 270,934 | | | 4,017,951 |
Ferro Corp. | | | | 613,965 | | | 5,464,288 |
Koppers Holdings, Inc. | | | | 195,239 | | | 5,788,836 |
LSB Industries, Inc.(b) | | | | 187,459 | | | 2,918,737 |
Minerals Technologies, Inc. | | | | 42,169 | | | 2,005,558 |
Olin Corp. | | | | 244,931 | | | 4,271,597 |
RPM International, Inc. | | | | 243,744 | | | 4,506,827 |
| | | | | | | |
| | | | | | | 28,973,794 |
| | | | | | | |
| Commercial Banks – 5.8% | | | | | | | |
Bank of the Ozarks, Inc. | | | | 246,487 | | | 6,539,300 |
First Horizon National Corp.(b) | | | | 417,991 | | | 5,530,027 |
Glacier Bancorp, Inc. | | | | 228,082 | | | 3,407,545 |
Hancock Holding Co. | | | | 85,415 | | | 3,209,042 |
IBERIABANK Corp. | | | | 188,834 | | | 8,603,277 |
Metro Bancorp, Inc.(b) | | | | 119,404 | | | 1,453,147 |
Prosperity Bancshares, Inc. | | | | 228,423 | | | 7,946,836 |
Signature Bank(b) | | | | 292,081 | | | 8,470,349 |
Southwest Bancorp, Inc. | | | | 261,402 | | | 3,670,084 |
Sterling Bancshares, Inc. | | | | 941,772 | | | 6,884,353 |
| | | | | | | |
| | | | | | | 55,713,960 |
| | | | | | | |
| Commercial Services & Supplies – 5.5% | | | | | | | |
ABM Industries, Inc. | | | | 391,160 | | | 8,230,006 |
American Ecology Corp. | | | | 150,555 | | | 2,815,378 |
Brink’s Co. (The) | | | | 181,717 | | | 4,890,004 |
McGrath Rentcorp | | | | 147,833 | | | 3,144,408 |
Rollins, Inc. | | | | 833,861 | | | 15,718,280 |
Standard Parking Corp.(b) | | | | 497,373 | | | 8,699,054 |
Team, Inc.(b) | | | | 164,327 | | | 2,785,343 |
Waste Connections, Inc.(b) | | | | 248,909 | | | 7,183,514 |
| | | | | | | |
| | | | | | | 53,465,987 |
| | | | | | | |
See accompanying notes to financial statements.
15
| | | | | | | |
| | | | | Shares | | Value (†) |
| | | | | | | |
| | | |
| COMMON STOCKS – continued | | | | | | | |
| | | |
| Communications Equipment – 3.5% | | | | | | | |
ADC Telecommunications, Inc.(b) | | | | 447,285 | | $ | 3,730,357 |
ADTRAN, Inc. | | | | 236,180 | | | 5,798,219 |
Anaren, Inc.(b) | | | | 169,713 | | | 2,885,121 |
Avocent Corp.(b) | | | | 234,036 | | | 4,743,910 |
Brocade Communications Systems, Inc.(b) | | | | 336,187 | | | 2,642,430 |
CommScope, Inc.(b) | | | | 198,099 | | | 5,929,103 |
Harris Stratex Networks, Inc., Class A(b) | | | | 369,589 | | | 2,587,123 |
Tekelec(b) | | | | 343,013 | | | 5,635,703 |
| | | | | | | |
| | | | | | | 33,951,966 |
| | | | | | | |
| Computers & Peripherals – 0.3% | | | | | | | |
Intevac, Inc.(b) | | | | 197,385 | | | 2,652,854 |
| | | | | | | |
| Construction & Engineering – 0.4% | | | | | | | |
MYR Group, Inc.(b) | | | | 173,109 | | | 3,650,869 |
| | | | | | | |
| Construction Materials – 0.4% | | | | | | | |
Eagle Materials, Inc. | | | | 126,011 | | | 3,601,394 |
| | | | | | | |
| Consumer Finance – 0.9% | | | | | | | |
Dollar Financial Corp.(b) | | | | 519,036 | | | 8,314,957 |
| | | | | | | |
| Containers & Packaging – 1.2% | | | | | | | |
Myers Industries, Inc. | | | | 209,271 | | | 2,253,849 |
Rock-Tenn Co., Class A | | | | 191,835 | | | 9,037,347 |
| | | | | | | |
| | | | | | | 11,291,196 |
| | | | | | | |
| Distributors – 0.2% | | | | | | | |
Core-Mark Holding Co., Inc.(b) | | | | 61,813 | | | 1,767,852 |
| | | | | | | |
| Diversified Consumer Services – 0.4% | | | | | | | |
Hillenbrand, Inc. | | | | 215,015 | | | 4,379,856 |
| | | | | | | |
| Diversified Financial Services – 1.1% | | | | | | | |
PHH Corp.(b) | | | | 520,467 | | | 10,326,065 |
| | | | | | | |
| Electric Utilities – 2.7% | | | | | | | |
ALLETE, Inc. | | | | 242,848 | | | 8,152,407 |
ITC Holdings Corp. | | | | 147,590 | | | 6,707,965 |
Portland General Electric Co. | | | | 211,598 | | | 4,172,713 |
UIL Holdings Corp. | | | | 257,628 | | | 6,798,803 |
| | | | | | | |
| | | | | | | 25,831,888 |
| | | | | | | |
| Electrical Equipment – 1.9% | | | | | | | |
Baldor Electric Co. | | | | 146,966 | | | 4,018,051 |
Encore Wire Corp. | | | | 163,553 | | | 3,653,774 |
GrafTech International Ltd.(b) | | | | 257,042 | | | 3,778,517 |
II-VI, Inc.(b) | | | | 272,341 | | | 6,928,355 |
| | | | | | | |
| | | | | | | 18,378,697 |
| | | | | | | |
| Electronic Equipment Instruments & Components – 1.3% | | | | | | | |
Littelfuse, Inc.(b) | | | | 137,304 | | | 3,602,857 |
Methode Electronics, Inc. | | | | 270,494 | | | 2,345,183 |
TTM Technologies, Inc.(b) | | | | 321,945 | | | 3,692,709 |
Vishay Intertechnology, Inc.(b) | | | | 412,997 | | | 3,262,676 |
| | | | | | | |
| | | | | | | 12,903,425 |
| | | | | | | |
See accompanying notes to financial statements.
16
PORTFOLIO OF INVESTMENTS – as of September 30, 2009
Loomis Sayles Small Cap Value Fund – continued
| | | | | | | |
| | | | | Shares | | Value (†) |
| | | | | | | |
| | | |
| COMMON STOCKS – continued | | | | | | | |
| | | |
| Energy Equipment & Services – 2.1% | | | | | | | |
Hornbeck Offshore Services, Inc.(b) | | | | 182,127 | | $ | 5,019,420 |
Lufkin Industries, Inc. | | | | 58,027 | | | 3,085,876 |
Oceaneering International, Inc.(b) | | | | 158,835 | | | 9,013,886 |
Seahawk Drilling, Inc.(b) | | | | 106,646 | | | 3,315,624 |
| | | | | | | |
| | | | | | | 20,434,806 |
| | | | | | | |
| Food & Staples Retailing – 0.5% | | | | | | | |
Spartan Stores, Inc. | | | | 359,274 | | | 5,076,542 |
| | | | | | | |
| Food Products – 2.5% | | | | | | | |
Darling International, Inc.(b) | | | | 506,580 | | | 3,723,363 |
Flowers Foods, Inc. | | | | 231,281 | | | 6,080,377 |
J & J Snack Foods Corp. | | | | 201,646 | | | 8,709,091 |
Ralcorp Holdings, Inc.(b) | | | | 99,353 | | | 5,809,170 |
| | | | | | | |
| | | | | | | 24,322,001 |
| | | | | | | |
| Gas Utilities – 1.1% | | | | | | | |
UGI Corp. | | | | 424,507 | | | 10,638,145 |
| | | | | | | |
| Health Care Equipment & Supplies – 1.7% | | | | | | | |
Medical Action Industries, Inc.(b) | | | | 261,297 | | | 3,153,855 |
Teleflex, Inc. | | | | 156,254 | | | 7,548,630 |
West Pharmaceutical Services, Inc. | | | | 144,562 | | | 5,870,663 |
| | | | | | | |
| | | | | | | 16,573,148 |
| | | | | | | |
| Health Care Providers & Services – 1.4% | | | | | | | |
CorVel Corp.(b) | | | | 93,798 | | | 2,663,863 |
MEDNAX, Inc.(b) | | | | 119,792 | | | 6,578,977 |
MWI Veterinary Supply, Inc.(b) | | | | 109,983 | | | 4,393,821 |
| | | | | | | |
| | | | | | | 13,636,661 |
| | | | | | | |
| Hotels, Restaurants & Leisure – 2.4% | | | | | | | |
Bob Evans Farms, Inc. | | | | 181,897 | | | 5,285,927 |
California Pizza Kitchen, Inc.(b) | | | | 251,170 | | | 3,923,276 |
Dover Downs Gaming & Entertainment, Inc. | | | | 301,983 | | | 1,721,303 |
Isle of Capri Casinos, Inc.(b) | | | | 347,414 | | | 4,096,011 |
Penn National Gaming, Inc.(b) | | | | 122,555 | | | 3,389,871 |
Wyndham Worldwide Corp. | | | | 286,963 | | | 4,683,236 |
| | | | | | | |
| | | | | | | 23,099,624 |
| | | | | | | |
| Household Durables – 1.3% | | | | | | | |
Jarden Corp. | | | | 197,326 | | | 5,538,941 |
Leggett & Platt, Inc. | | | | 374,547 | | | 7,266,212 |
| | | | | | | |
| | | | | | | 12,805,153 |
| | | | | | | |
| Industrial Conglomerates – 0.3% | | | | | | | |
Raven Industries, Inc. | | | | 123,702 | | | 3,306,554 |
| | | | | | | |
| Insurance – 6.5% | | | | | | | |
American Physicians Capital, Inc. | | | | 107,020 | | | 3,083,246 |
Aspen Insurance Holdings Ltd. | | | | 256,449 | | | 6,788,205 |
Hanover Insurance Group, Inc. (The) | | | | 134,037 | | | 5,539,749 |
HCC Insurance Holdings, Inc. | | | | 334,373 | | | 9,145,102 |
Navigators Group, Inc.(b) | | | | 116,894 | | | 6,429,170 |
ProAssurance Corp.(b) | | | | 102,409 | | | 5,344,726 |
See accompanying notes to financial statements.
17
| | | | | | | |
| | | | | Shares | | Value (†) |
| | | | | | | |
| | | |
| COMMON STOCKS – continued | | | | | | | |
| | | |
| Insurance – continued | | | | | | | |
Reinsurance Group of America, Inc. | | | | 139,456 | | $ | 6,219,738 |
RLI Corp. | | | | 113,569 | | | 5,994,172 |
W.R. Berkley Corp. | | | | 272,454 | | | 6,887,637 |
Zenith National Insurance Corp. | | | | 235,235 | | | 7,268,761 |
| | | | | | | |
| | | | | | | 62,700,506 |
| | | | | | | |
| Internet & Catalog Retail – 0.7% | | | | | | | |
HSN, Inc.(b) | | | | 434,171 | | | 7,068,304 |
| | | | | | | |
| Internet Software & Services – 0.3% | | | | | | | |
United Online, Inc. | | | | 395,892 | | | 3,182,972 |
| | | | | | | |
| IT Services – 3.5% | | | | | | | |
Broadridge Financial Solutions, Inc. | | | | 465,213 | | | 9,350,781 |
Global Payments, Inc. | | | | 124,931 | | | 5,834,278 |
Lender Processing Services, Inc. | | | | 217,332 | | | 8,295,563 |
SRA International, Inc., Class A(b) | | | | 200,139 | | | 4,321,001 |
Wright Express Corp.(b) | | | | 214,667 | | | 6,334,823 |
| | | | | | | |
| | | | | | | 34,136,446 |
| | | | | | | |
| Life Sciences Tools & Services – 0.6% | | | | | | | |
Mettler-Toledo International, Inc.(b) | | | | 61,157 | | | 5,540,213 |
| | | | | | | |
| Machinery – 4.3% | | | | | | | |
Actuant Corp., Class A | | | | 476,590 | | | 7,654,036 |
Albany International Corp., Class A | | | | 342,706 | | | 6,648,496 |
Altra Holdings, Inc.(b) | | | | 333,302 | | | 3,729,649 |
Colfax Corp.(b) | | | | 165,357 | | | 1,757,745 |
Dynamic Materials Corp. | | | | 183,577 | | | 3,664,197 |
John Bean Technologies Corp. | | | | 370,402 | | | 6,730,204 |
Middleby Corp. (The)(b) | | | | 36,509 | | | 2,008,360 |
Tennant Co. | | | | 103,930 | | | 3,020,206 |
Wabtec Corp. | | | | 169,822 | | | 6,373,420 |
| | | | | | | |
| | | | | | | 41,586,313 |
| | | | | | | |
| Marine – 0.2% | | | | | | | |
Kirby Corp.(b) | | | | 63,554 | | | 2,340,058 |
| | | | | | | |
| Media – 3.4% | | | | | | | |
Alloy, Inc.(b) | | | | 244,628 | | | 1,656,131 |
Arbitron, Inc. | | | | 192,310 | | | 3,992,356 |
Dolan Media Co.(b) | | | | 293,924 | | | 3,524,149 |
John Wiley & Sons, Inc. Class A | | | | 249,879 | | | 8,690,792 |
Live Nation, Inc.(b) | | | | 922,972 | | | 7,559,141 |
Scholastic Corp. | | | | 293,584 | | | 7,145,834 |
| | | | | | | |
| | | | | | | 32,568,403 |
| | | | | | | |
| Metals & Mining – 1.3% | | | | | | | |
Horsehead Holding Corp.(b) | | | | 356,270 | | | 4,175,484 |
Reliance Steel & Aluminum Co. | | | | 190,083 | | | 8,089,933 |
| | | | | | | |
| | | | | | | 12,265,417 |
| | | | | | | |
| Multi-Utilities & Unregulated Power – 0.5% | | | | | | | |
NorthWestern Corp. | | | | 193,268 | | | 4,721,537 |
| | | | | | | |
See accompanying notes to financial statements.
18
PORTFOLIO OF INVESTMENTS – as of September 30, 2009
Loomis Sayles Small Cap Value Fund – continued
| | | | | | | |
| | | | | Shares | | Value (†) |
| | | | | | | |
| | | |
| COMMON STOCKS – continued | | | | | | | |
| | | |
| Oil, Gas & Consumable Fuels – 3.6% | | | | | | | |
Arena Resources, Inc.(b) | | | | 169,513 | | $ | 6,017,712 |
Berry Petroleum Co., Class A | | | | 187,881 | | | 5,031,453 |
Comstock Resources, Inc.(b) | | | | 196,822 | | | 7,888,626 |
Mariner Energy, Inc.(b) | | | | 360,308 | | | 5,109,167 |
Penn Virginia Corp. | | | | 485,007 | | | 11,111,510 |
| | | | | | | |
| | | | | | | 35,158,468 |
| | | | | | | |
| Paper & Forest Products – 0.6% | | | | | | | |
Clearwater Paper Corp.(b) | | | | 80,429 | | | 3,324,130 |
Deltic Timber Corp. | | | | 45,984 | | | 2,104,688 |
| | | | | | | |
| | | | | | | 5,428,818 |
| | | | | | | |
| Personal Products – 0.5% | | | | | | | |
Alberto-Culver Co. | | | | 182,486 | | | 5,051,212 |
| | | | | | | |
| Pharmaceuticals – 2.3% | | | | | | | |
Endo Pharmaceuticals Holdings, Inc.(b) | | | | 270,162 | | | 6,113,766 |
Obagi Medical Products, Inc.(b) | | | | 385,567 | | | 4,472,577 |
Perrigo Co. | | | | 358,879 | | | 12,198,297 |
| | | | | | | |
| | | | | | | 22,784,640 |
| | | | | | | |
| Real Estate Management & Development – 1.0% | | | | | | | |
Forestar Group, Inc.(b) | | | | 548,186 | | | 9,417,836 |
| | | | | | | |
| REITs – 4.7% | | | | | | | |
American Campus Communities, Inc. | | | | 363,085 | | | 9,748,832 |
Capstead Mortgage Corp. | | | | 673,066 | | | 9,362,348 |
Chimera Investment Corp. | | | | 1,535,216 | | | 5,864,525 |
Digital Realty Trust, Inc. | | | | 174,840 | | | 7,991,937 |
National Retail Properties, Inc. | | | | 219,320 | | | 4,708,800 |
Potlatch Corp. | | | | 268,691 | | | 7,644,259 |
| | | | | | | |
| | | | | | | 45,320,701 |
| | | | | | | |
| Road & Rail – 1.1% | | | | | | | |
Con-way, Inc. | | | | 101,024 | | | 3,871,240 |
Genesee & Wyoming, Inc., Class A(b) | | | | 187,345 | | | 5,680,300 |
Saia, Inc.(b) | | | | 75,742 | | | 1,217,931 |
| | | | | | | |
| | | | | | | 10,769,471 |
| | | | | | | |
| Semiconductors & Semiconductor Equipment – 3.8% | | | | | | | |
Applied Micro Circuits Corp.(b) | | | | 203,481 | | | 2,032,775 |
Atmel Corp.(b) | | | | 902,712 | | | 3,782,363 |
Cohu, Inc. | | | | 251,428 | | | 3,409,364 |
Entegris, Inc.(b) | | | | 1,061,734 | | | 5,255,584 |
ON Semiconductor Corp.(b) | | | | 740,740 | | | 6,111,105 |
Semtech Corp.(b) | | | | 229,275 | | | 3,899,968 |
Teradyne, Inc.(b) | | | | 584,253 | | | 5,404,340 |
TriQuint Semiconductor, Inc.(b) | | | | 942,042 | | | 7,272,564 |
| | | | | | | |
| | | | | | | 37,168,063 |
| | | | | | | |
| Software – 2.2% | | | | | | | |
Informatica Corp.(b) | | | | 132,523 | | | 2,992,369 |
MicroStrategy, Inc., Class A(b) | | | | 43,617 | | | 3,120,360 |
Progress Software Corp.(b) | | | | 156,761 | | | 3,550,637 |
See accompanying notes to financial statements.
19
| | | | | | | | |
| | | | | Shares | | Value (†) |
| | | | | | | | |
| | | |
| COMMON STOCKS – continued | | | | | | | | |
| | | |
| Software – continued | | | | | | | | |
Quest Software, Inc.(b) | | | | | 272,667 | | $ | 4,594,439 |
Sybase, Inc.(b) | | | | | 174,940 | | | 6,805,166 |
| | | | | | | | |
| | | | | | | | 21,062,971 |
| | | | | | | | |
| | | |
| Specialty Retail – 2.3% | | | | | | | | |
Genesco, Inc.(b) | | | | | 166,373 | | | 4,004,598 |
Jo-Ann Stores, Inc.(b) | | | | | 200,926 | | | 5,390,845 |
Sally Beauty Holdings, Inc.(b) | | | | | 1,127,717 | | | 8,018,068 |
Sonic Automotive, Inc., Class A | | | | | 471,078 | | | 4,946,319 |
| | | | | | | | |
| | | | | | | | 22,359,830 |
| | | | | | | | |
| Textiles, Apparel & Luxury Goods – 2.7% | | | | | | | | |
Carter’s, Inc.(b) | | | | | 388,247 | | | 10,366,195 |
FGX International Holdings Ltd.(b) | | | | | 275,446 | | | 3,842,472 |
Fossil, Inc.(b) | | | | | 248,694 | | | 7,075,344 |
Movado Group, Inc. | | | | | 320,326 | | | 4,654,337 |
| | | | | | | | |
| | | | | | | | 25,938,348 |
| | | | | | | | |
| Thrifts & Mortgage Finance – 0.9% | | | | | | | | |
Washington Federal, Inc. | | | | | 286,005 | | | 4,822,044 |
Westfield Financial, Inc. | | | | | 407,901 | | | 3,454,922 |
| | | | | | | | |
| | | | | | | | 8,276,966 |
| | | | | | | | |
| Water Utilities – 0.4% | | | | | | | | |
Middlesex Water Co. | | | | | 272,189 | | | 4,104,610 |
| | | | | | | | |
| | | |
| TOTAL COMMON STOCKS | | | | | | | | |
(Identified Cost $821,166,230) | | | | | | | | 923,503,226 |
| | | | | | | | |
| | | |
| | | | | Principal Amount | | |
| | | |
| SHORT-TERM INVESTMENTS – 4.0% | | | | | | | | |
| Tri-Party Repurchase Agreement with Fixed Income Clearing Corporation, dated 9/30/2009 at 0.000% to be repurchased at $38,153,199 on 10/01/2009 collateralized by $38,725,000 Federal National Mortgage Association, 3.000% due 1/13/2014 with a value of $38,918,625 including accrued interest (Note 2f of Notes to Financial Statements) (Identified Cost $38,153,198) | | | | $ | 38,153,198 | | | 38,153,198 |
| | | | | | | | |
| | | |
| TOTAL INVESTMENTS – 99.4% | | | | | | | | |
(Identified Cost $859,319,428)(a) | | | | | | | | 961,656,424 |
Other assets less liabilities—0.6% | | | | | | | | 6,245,617 |
| | | | | | | | |
| | | |
| NET ASSETS – 100.0% | | | | | | | $ | 967,902,041 |
| | | | | | | | |
| |
(†) See Note 2a of Notes to Financial Statements. | | | |
(a) Federal Tax Information:
At September 30, 2009, the net unrealized appreciation on investments based on a cost of $868,593,394 for federal income tax purposes was as follows: | | | |
Aggregate gross unrealized appreciation for all investments in which there is an excess of value over tax cost | | $ | 136,082,101 |
Aggregate gross unrealized depreciation for all investments in which there is an excess of tax cost over value | | | (43,019,071) |
| | | | | | | | |
Net unrealized appreciation | | $ | 93,063,030 |
| | | | | | | | |
| (b) | Non-income producing security. |
| REITs | Real Estate Investment Trusts |
See accompanying notes to financial statements.
20
PORTFOLIO OF INVESTMENTS – as of September 30, 2009
Loomis Sayles Small Cap Value Fund – continued
INDUSTRY SUMMARY AT SEPTEMBER 30, 2009 (Unaudited)
| | | |
Insurance | | 6.5 | % |
Commercial Banks | | 5.8 | |
Commercial Services & Supplies | | 5.5 | |
REITs | | 4.7 | |
Machinery | | 4.3 | |
Semiconductors & Semiconductor Equipment | | 3.8 | |
Oil, Gas & Consumable Fuels | | 3.6 | |
IT Services | | 3.5 | |
Communications Equipment | | 3.5 | |
Media | | 3.4 | |
Chemicals | | 3.0 | |
Capital Markets | | 2.9 | |
Textiles, Apparel & Luxury Goods | | 2.7 | |
Electric Utilities | | 2.7 | |
Food Products | | 2.5 | |
Hotels, Restaurants & Leisure | | 2.4 | |
Pharmaceuticals | | 2.3 | |
Specialty Retail | | 2.3 | |
Software | | 2.2 | |
Energy Equipment & Services | | 2.1 | |
Other Investments, less than 2% each | | 25.7 | |
Short-Term Investments | | 4.0 | |
| | | |
Total Investments | | 99.4 | |
Other assets less liabilities | | 0.6 | |
| | | |
Net Assets | | 100.0 | % |
| | | |
See accompanying notes to financial statements.
21
STATEMENTS OF ASSETS AND LIABILITIES
September 30, 2009
| | | | | | | | |
| | | Small Cap
Growth Fund | | | Small Cap
Value Fund | |
| | | | | | | | |
Assets | | | | | | | | |
Investments at cost | | $ | 100,293,558 | | | $ | 859,319,428 | |
Net unrealized appreciation | | | 19,350,023 | | | | 102,336,996 | |
| | | | | | | | |
Investments at value | | | 119,643,581 | | | | 961,656,424 | |
Receivable for Fund shares sold | | | 223,084 | | | | 923,560 | |
Receivable for securities sold | | | 3,006,329 | | | | 9,038,272 | |
Dividends and interest receivable | | | — | | | | 1,397,261 | |
Receivable from investment adviser (Note 5) | | | 7,976 | | | | 14,259 | |
| | | | | | | | |
Total Assets | | | 122,880,970 | | | | 973,029,776 | |
| | | | | | | | |
| | |
| Liabilities | | | | | | | | |
Payable for securities purchased | | | 1,588,658 | | | | 3,865,585 | |
Payable for Fund shares redeemed | | | 88,698 | | | | 416,831 | |
Management fees payable (Note 5) | | | 73,145 | | | | 584,910 | |
Administrative fees payable (Note 5) | | | 4,787 | | | | 38,275 | |
Deferred Trustees’ fees (Note 5) | | | 46,961 | | | | 110,532 | |
Service and distribution fees payable (Note 5) | | | 519 | | | | 3,693 | |
Other accounts payable and accrued expenses | | | 43,271 | | | | 107,909 | |
| | | | | | | | |
Total Liabilities | | | 1,846,039 | | | | 5,127,735 | |
| | | | | | | | |
Net Assets | | $ | 121,034,931 | | | $ | 967,902,041 | |
| | | | | | | | |
Net Assets consist of: | | | | | | | | |
Paid-in capital | | $ | 341,683,551 | | | $ | 1,072,244,798 | |
Accumulated net investment income (loss)/Undistributed net investment income | | | (46,961 | ) | | | 1,177,091 | |
Accumulated net realized loss on investments | | | (239,951,682 | ) | | | (207,856,844 | ) |
Net unrealized appreciation on investments | | | 19,350,023 | | | | 102,336,996 | |
| | | | | | | | |
Net Assets | | $ | 121,034,931 | | | $ | 967,902,041 | |
| | | | | | | | |
| | |
| Net Asset Value and Offering Price | | | | | | | | |
Institutional Class | | | | | | | | |
Net assets | | $ | 45,556,734 | | | $ | 506,323,696 | |
| | | | | | | | |
Shares of beneficial interest | | | 3,934,994 | | | | 24,506,094 | |
| | | | | | | | |
Net asset value, offering and redemption price per share | | $ | 11.58 | | | $ | 20.66 | |
| | | | | | | | |
Retail Class | | | | | | | | |
Net assets | | $ | 75,478,197 | | | $ | 387,383,082 | |
| | | | | | | | |
Shares of beneficial interest | | | 6,731,158 | | | | 18,927,367 | |
| | | | | | | | |
Net asset value, offering and redemption price per share | | $ | 11.21 | | | $ | 20.47 | |
| | | | | | | | |
Admin Class | | | | | | | | |
Net assets | | $ | — | | | $ | 74,195,263 | |
| | | | | | | | |
Shares of beneficial interest | | | — | | | | 3,688,760 | |
| | | | | | | | |
Net asset value, offering and redemption price per share | | $ | — | | | $ | 20.11 | |
| | | | | | | | |
See accompanying notes to financial statements.
22
STATEMENTS OF OPERATIONS
For the Year Ended September 30, 2009
| | | | | | | | |
| | | Small Cap
Growth Fund | | | Small Cap
Value Fund | |
| | | | | | | | |
Investment Income | | | | | | | | |
Dividends | | $ | 295,838 | | | $ | 11,236,026 | |
Interest | | | 2,346 | | | | 21,623 | |
Securities lending income (Note 2) | | | 7,998 | | | | 49,006 | |
| | | | | | | | |
| | | 306,182 | | | | 11,306,655 | |
| | | | | | | | |
| | |
| Expenses | | | | | | | | |
Management fees (Note 5) | | | 713,999 | | | | 5,985,483 | |
Distribution fees—Retail Class (Note 5) | | | 148,197 | | | | 820,762 | |
Service and distribution fees—Admin Class (Note 5) | | | — | | | | 298,932 | |
Trustees’ fees and expenses (Note 5) | | | 8,260 | | | | 14,692 | |
Administrative fees (Note 5) | | | 47,922 | | | | 402,025 | |
Custodian fees and expenses | | | 23,264 | | | | 38,599 | |
Transfer agent fees and expenses—Institutional Class (Note 5) | | | 20,269 | | | | 350,319 | |
Transfer agent fees and expenses—Retail Class (Note 5) | | | 132,724 | | | | 677,633 | |
Transfer agent fees and expenses—Admin Class (Note 5) | | | — | | | | 250,517 | |
Audit and tax services fees | | | 39,839 | | | | 68,062 | |
Registration fees | | | 42,142 | | | | 91,928 | |
Shareholder reporting expenses | | | 20,466 | | | | 151,299 | |
Legal fees | | | 3,439 | | | | 29,518 | |
Miscellaneous expenses | | | 10,376 | | | | 43,289 | |
| | | | | | | | |
Total expenses | | | 1,210,897 | | | | 9,223,058 | |
Less fee reduction and/or expense reimbursement (Note 5) | | | (110,702 | ) | | | (920,783 | ) |
| | | | | | | | |
Net expenses | | | 1,100,195 | | | | 8,302,275 | |
| | | | | | | | |
Net investment income (loss) | | | (794,013 | ) | | | 3,004,380 | |
| | | | | | | | |
| | |
| Net Realized and Unrealized Gain (Loss) on Investments | | | | | | | | |
Net Realized Loss on: | | | | | | | | |
Investments | | | (34,962,361 | ) | | | (157,922,333 | ) |
| Net Change in Unrealized Appreciation (Depreciation) on: | | | | | | | | |
Investments | | | 21,890,105 | | | | 76,497,968 | |
| | | | | | | | |
Net realized and unrealized loss on investments | | | (13,072,256 | ) | | | (81,424,365 | ) |
| | | | | | | | |
| | |
| Net Decrease in Net Assets Resulting from Operations | | $ | (13,866,269 | ) | | $ | (78,419,985 | ) |
| | | | | | | | |
See accompanying notes to financial statements.
23
STATEMENTS OF CHANGES IN NET ASSETS
Small Cap Growth Fund
| | | | | | | | |
| | | Year Ended
September 30, 2009 | | | Year Ended
September 30, 2008 | |
From Operations: | | | | | | | | |
Net investment loss | | $ | (794,013 | ) | | $ | (584,280 | ) |
Net realized loss on investments | | | (34,962,361 | ) | | | (6,171,517 | ) |
Net change in unrealized appreciation (depreciation) on investments | | | 21,890,105 | | | | (10,322,096 | ) |
| | | | | | | | |
Net decrease in net assets resulting from operations | | | (13,866,269 | ) | | | (17,077,893 | ) |
| | | | | | | | |
From Distributions to Shareholders: | | | | | | | | |
Net Investment Income: | | | | | | | | |
Institutional Class | | | — | | | | — | |
Retail Class | | | — | | | | — | |
Capital Gains: | | | | | | | | |
Institutional Class | | | — | | | | — | |
Retail Class | | | — | | | | — | |
| | | | | | | | |
Total distributions | | | — | | | | — | |
| | | | | | | | |
Increase in Net Assets Derived from Capital Share Transactions (Note 9) | | | 10,464,100 | | | | 92,473,941 | |
| | | | | | | | |
Redemption Fees: | | | | | | | | |
Institutional Class | | | — | | | | 11,629 | |
Retail Class | | | — | | | | 17,229 | |
| | | | | | | | |
Total redemption fees | | | — | | | | 28,858 | |
| | | | | | | | |
Net increase (decrease) in net assets | | | (3,402,169 | ) | | | 75,424,906 | |
Net Assets | | | | | | | | |
Beginning of year | | | 124,437,100 | | | | 49,012,194 | |
| | | | | | | | |
End of year | | $ | 121,034,931 | | | $ | 124,437,100 | |
| | | | | | | | |
Accumulated Net Investment Loss | | $ | (46,961 | ) | | $ | (40,103 | ) |
| | | | | | | | |
See accompanying notes to financial statements.
24
STATEMENTS OF CHANGES IN NET ASSETS
Small Cap Value Fund
| | | | | | | | |
| | | Year Ended
September 30, 2009 | | | Year Ended
September 30, 2008 | |
From Operations: | | | | | | | | |
Net investment income | | $ | 3,004,380 | | | $ | 3,447,311 | |
Net realized loss on investments | | | (157,922,333 | ) | | | (37,271,375 | ) |
Net change in unrealized appreciation (depreciation) on investments | | | 76,497,968 | | | | (141,209,963 | ) |
| | | | | | | | |
Net decrease in net assets resulting from operations | | | (78,419,985 | ) | | | (175,034,027 | ) |
| | | | | | | | |
From Distributions to Shareholders: | | | | | | | | |
Net Investment Income: | | | | | | | | |
Institutional Class | | | (2,585,541 | ) | | | (1,132,960 | ) |
Retail Class | | | (1,071,277 | ) | | | — | |
Admin Class | | | (9,660 | ) | | | — | |
Capital Gains: | | | | | | | | |
Institutional Class | | | (167,987 | ) | | | (51,944,175 | ) |
Retail Class | | | (141,335 | ) | | | (47,065,282 | ) |
Admin Class | | | (24,687 | ) | | | (8,031,853 | ) |
| | | | | | | | |
Total distributions | | | (4,000,487 | ) | | | (108,174,270 | ) |
| | | | | | | | |
Increase (Decrease) in Net Assets Derived from Capital Share Transactions (Note 9) | | | (45,368,424 | ) | | | 302,201,210 | |
| | | | | | | | |
Redemption Fees: | | | | | | | | |
Institutional Class | | | 21,500 | | | | 20,568 | |
Retail Class | | | 17,487 | | | | 18,348 | |
Admin Class | | | 3,123 | | | | 3,084 | |
| | | | | | | | |
Total redemption fees | | | 42,110 | | | | 42,000 | |
| | | | | | | | |
Net increase (decrease) in net assets | | | (127,746,786 | ) | | | 19,034,913 | |
Net Assets | | | | | | | | |
Beginning of year | | | 1,095,648,827 | | | | 1,076,613,914 | |
| | | | | | | | |
End of year | | $ | 967,902,041 | | | $ | 1,095,648,827 | |
| | | | | | | | |
Undistributed Net Investment Income | | $ | 1,177,091 | | | $ | 1,842,018 | |
| | | | | | | | |
See accompanying notes to financial statements.
25
THIS PAGE INTENTIONALLY LEFT BLANK
26
FINANCIAL HIGHLIGHTS
For a share outstanding throughout each period.
| | | | | | | | | | | | | | | | | | | | | | | | | | | | | |
| | | | | Income (Loss) from Investment Operations: | | | | | Less Distributions: | |
| | | Net asset
value,
beginning of
the period | | Net
investment
income
(loss)(a)(b) | | | Net realized
and unrealized
gain (loss) | | | Total from
investment
operations | | | | | Dividends
from
net investment
income | | | Distributions
from net
realized
capital gains | | | Total
distributions | |
| Small Cap Growth Fund | | | | | | | | | | | | | | | | | | | | | | | |
| | | | | | | |
| Institutional Class | | | | | | | | | | | | | | | | | | | | | | | | | | |
9/30/2009 | | $ | 13.07 | | $ | (0.07 | ) | | $ | (1.42 | ) | | $ | (1.49 | ) | | | | $ | — | | | $ | — | | | $ | — | |
9/30/2008 | | | 15.87 | | | (0.07 | ) | | | (2.73 | ) | | | (2.80 | ) | | | | | — | | | | — | | | | — | |
9/30/2007 | | | 12.00 | | | (0.06 | )(g) | | | 3.93 | | | | 3.87 | | | | | | — | | | | — | | | | — | |
9/30/2006 | | | 11.08 | | | (0.08 | ) | | | 0.99 | | | | 0.91 | | | | | | — | | | | — | | | | — | |
9/30/2005 | | | 8.96 | | | (0.08 | ) | | | 2.20 | | | | 2.12 | | | | | | — | | | | — | | | | — | |
| | | | | | | |
| Retail Class | | | | | | | | | | | | | | | | | | | | | | | | | | |
9/30/2009 | | | 12.69 | | | (0.09 | ) | | | (1.39 | ) | | | (1.48 | ) | | | | | — | | | | — | | | | — | |
9/30/2008 | | | 15.45 | | | (0.10 | ) | | | (2.66 | ) | | | (2.76 | ) | | | | | — | | | | — | | | | — | |
9/30/2007 | | | 11.71 | | | (0.09 | )(g) | | | 3.83 | | | | 3.74 | | | | | | — | | | | — | | | | — | |
9/30/2006 | | | 10.84 | | | (0.11 | ) | | | 0.97 | | | | 0.86 | | | | | | — | | | | — | | | | — | |
9/30/2005 | | | 8.78 | | | (0.11 | ) | | | 2.17 | | | | 2.06 | | | | | | — | | | | — | | | | — | |
| | | | | | |
| Small Cap Value Fund | | | | | | | | | | | | | | | | | | | | | | | |
| | | | | | | |
| Institutional Class | | | | | | | | | | | | | | | | | | | | | | | | | | |
9/30/2009 | | $ | 22.01 | | $ | 0.09 | | | $ | (1.32 | ) | | $ | (1.23 | ) | | | | $ | (0.11 | ) | | $ | (0.01 | ) | | $ | (0.12 | ) |
9/30/2008 | | | 28.77 | | | 0.11 | (h) | | | (4.03 | ) | | | (3.92 | ) | | | | | (0.06 | ) | | | (2.78 | ) | | | (2.84 | ) |
9/30/2007 | | | 27.69 | | | 0.12 | (g)(i) | | | 4.29 | | | | 4.41 | | | | | | (0.17 | ) | | | (3.16 | ) | | | (3.33 | ) |
9/30/2006 | | | 27.43 | | | 0.13 | | | | 2.70 | | | | 2.83 | | | | | | (0.15 | ) | | | (2.42 | ) | | | (2.57 | ) |
9/30/2005 | | | 25.75 | | | 0.13 | | | | 4.22 | | | | 4.35 | | | | | | (0.02 | ) | | | (2.65 | ) | | | (2.67 | ) |
| | | | | | | |
| Retail Class | | | | | | | | | | | | | | | | | | | | | | | | | | |
9/30/2009 | | | 21.79 | | | 0.04 | | | | (1.30 | ) | | | (1.26 | ) | | | | | (0.05 | ) | | | (0.01 | ) | | | (0.06 | ) |
9/30/2008 | | | 28.52 | | | 0.05 | (h) | | | (4.00 | ) | | | (3.95 | ) | | | | | — | | | | (2.78 | ) | | | (2.78 | ) |
9/30/2007 | | | 27.46 | | | 0.04 | (g)(i) | | | 4.28 | | | | 4.32 | | | | | | (0.10 | ) | | | (3.16 | ) | | | (3.26 | ) |
9/30/2006 | | | 27.23 | | | 0.06 | | | | 2.67 | | | | 2.73 | | | | | | (0.08 | ) | | | (2.42 | ) | | | (2.50 | ) |
9/30/2005 | | | 25.62 | | | 0.06 | | | | 4.20 | | | | 4.26 | | | | | | — | | | | (2.65 | ) | | | (2.65 | ) |
| | | | | | | |
| Admin Class | | | | | | | | | | | | | | | | | | | | | | | | | | |
9/30/2009 | | | 21.40 | | | 0.00 | | | | (1.28 | ) | | | (1.28 | ) | | | | | (0.00 | ) | | | (0.01 | ) | | | (0.01 | ) |
9/30/2008 | | | 28.13 | | | (0.01 | )(h) | | | (3.94 | ) | | | (3.95 | ) | | | | | — | | | | (2.78 | ) | | | (2.78 | ) |
9/30/2007 | | | 27.14 | | | (0.03 | )(g)(i) | | | 4.22 | | | | 4.19 | | | | | | (0.04 | ) | | | (3.16 | ) | | | (3.20 | ) |
9/30/2006 | | | 26.94 | | | (0.01 | ) | | | 2.65 | | | | 2.64 | | | | | | (0.02 | ) | | | (2.42 | ) | | | (2.44 | ) |
9/30/2005 | | | 25.43 | | | (0.00 | ) | | | 4.16 | | | | 4.16 | | | | | | — | | | | (2.65 | ) | | | (2.65 | ) |
(a) Per share net investment income (loss) has been calculated using the average shares outstanding during the period.
(b) Amount rounds to less than $0.01 per share, if applicable.
(c) Effective June 1, 2009, redemption fees were eliminated.
(d) Had certain expenses not been reduced during the period, if applicable, total returns would have been lower. Periods less than one year, if applicable, are not annualized.
(e) Computed on an annualized basis for periods less than one year, if applicable.
(f) The investment adviser and/or administrator agreed to reimburse a portion of the Fund’s expenses and/or reduce its fees during the period. Without this reimbursement/fee reduction, if applicable, expenses would have been higher.
(g) Includes a non-recurring payment of $0.01 per share and $0.00 per share for Small Cap Growth Fund and Small Cap Value Fund, respectively.
(h) Includes a non-recurring dividend of $0.02 per share.
(i) Includes a non-recurring dividend of $0.05 per share.
(j) Includes fee/expense recovery of 0.02%.
See accompanying notes to financial statements.
27
| | | | | | | | | | | | | | | | | | | | | |
| | | | | | | | | | Ratio to Average Net Assets: | | | |
Redemption
fees(b)(c) | | Net asset
value,
end of
the period | | Total
return (%)(d) | | | Net assets,
end of
the period
(000’s) | | Net
expenses (%)(e)(f) | | | Gross
expenses (%)(e) | | | Net
investment
income (loss) (%)(e) | | | Portfolio
turnover
rate (%) |
| | | | | | | | | | | | | | | | | | | | | |
| | | | | | | |
| | | | | | | | | | | | | | | | | | | | | |
| $ | — | | $ | 11.58 | | (11.40 | ) | | $ | 45,557 | | 1.00 | | | 1.01 | | | (0.68 | ) | | 107 |
| | 0.00 | | | 13.07 | | (17.64 | ) | | | 44,540 | | 1.00 | | | 1.01 | | | (0.47 | ) | | 92 |
| | 0.00 | | | 15.87 | | 32.25 | | | | 28,088 | | 1.00 | | | 1.23 | | | (0.47 | ) | | 83 |
| | 0.01 | | | 12.00 | | 8.30 | | | | 20,414 | | 1.00 | | | 1.38 | | | (0.69 | ) | | 100 |
| | 0.00 | | | 11.08 | | 23.66 | | | | 15,785 | | 1.00 | | | 1.70 | | | (0.85 | ) | | 227 |
| | | | | | | |
| | | | | | | | | | | | | | | | | | | | | |
| | — | | | 11.21 | | (11.66 | ) | | | 75,478 | | 1.25 | | | 1.43 | | | (0.93 | ) | | 107 |
| | 0.00 | | | 12.69 | | (17.86 | ) | | | 79,897 | | 1.25 | | | 1.42 | | | (0.70 | ) | | 92 |
| | 0.00 | | | 15.45 | | 31.94 | | | | 20,924 | | 1.25 | | | 1.50 | | | (0.66 | ) | | 83 |
| | 0.01 | | | 11.71 | | 8.03 | | | | 2,981 | | 1.25 | | | 1.92 | | | (0.94 | ) | | 100 |
| | 0.00 | | | 10.84 | | 23.46 | | | | 3,592 | | 1.25 | | | 1.87 | | | (1.14 | ) | | 227 |
| | | | | | | |
| | | | | | | | | | | | | | | | | | | | | |
| | | | | | | |
| | | | | | | | | | | | | | | | | | | | | |
| $ | 0.00 | | $ | 20.66 | | (5.42 | ) | | $ | 506,324 | | 0.90 | | | 0.94 | | | 0.52 | | | 55 |
| | 0.00 | | | 22.01 | | (15.02 | ) | | | 553,268 | | 0.89 | | | 0.89 | | | 0.47 | | | 61 |
| | 0.00 | | | 28.77 | | 17.02 | | | | 534,776 | | 0.89 | | | 0.89 | | | 0.43 | | | 57 |
| | 0.00 | | | 27.69 | | 11.17 | | | | 442,714 | | 0.89 | (j) | | 0.89 | (j) | | 0.47 | | | 62 |
| | 0.00 | | | 27.43 | | 17.99 | | | | 403,110 | | 0.90 | | | 0.93 | | | 0.48 | | | 59 |
| | | | | | | |
| | | | | | | | | | | | | | | | | | | | | |
| | 0.00 | | | 20.47 | | (5.66 | ) | | | 387,383 | | 1.15 | | | 1.31 | | | 0.26 | | | 55 |
| | 0.00 | | | 21.79 | | (15.21 | ) | | | 464,525 | | 1.15 | | | 1.27 | | | 0.21 | | | 61 |
| | 0.00 | | | 28.52 | | 16.74 | | | | 465,055 | | 1.15 | | | 1.24 | | | 0.15 | | | 57 |
| | 0.00 | | | 27.46 | | 10.87 | | | | 291,690 | | 1.15 | | | 1.20 | | | 0.21 | | | 62 |
| | 0.00 | | | 27.23 | | 17.69 | | | | 235,948 | | 1.15 | | | 1.20 | | | 0.24 | | | 59 |
| | | | | | | |
| | | | | | | | | | | | | | | | | | | | | |
| | 0.00 | | | 20.11 | | (5.93 | ) | | | 74,195 | | 1.40 | | | 1.77 | | | 0.02 | | | 55 |
| | 0.00 | | | 21.40 | | (15.44 | ) | | | 77,855 | | 1.40 | | | 1.68 | | | (0.04 | ) | | 61 |
| | 0.00 | | | 28.13 | | 16.41 | | | | 76,783 | | 1.40 | | | 1.56 | | | (0.10 | ) | | 57 |
| | 0.00 | | | 27.14 | | 10.59 | | | | 64,367 | | 1.40 | | | 1.46 | | | (0.04 | ) | | 62 |
| | 0.00 | | | 26.94 | | 17.40 | | | | 67,505 | | 1.40 | | | 1.43 | | | (0.01 | ) | | 59 |
See accompanying notes to financial statements.
28
NOTES TO FINANCIAL STATEMENTS
September 30, 2009
1. Organization. Loomis Sayles Funds I and Loomis Sayles Funds II (the “Trusts” and each a “Trust”) are each organized as a Massachusetts business trust. Each Trust is registered under the Investment Company Act of 1940, as amended (the “1940 Act”), as an open-end management investment company. Each Declaration of Trust permits the Board of Trustees to authorize the issuance of an unlimited number of shares of the Trusts in multiple series. The financial statements for certain funds of the Trusts are presented in separate reports. The following funds (individually, a “Fund” and collectively, the “Funds”) are included in this report:
Loomis Sayles Funds I:
Loomis Sayles Small Cap Value Fund (the “Small Cap Value Fund”)
Loomis Sayles Funds II:
Loomis Sayles Small Cap Growth Fund (the “Small Cap Growth Fund”)
Each Fund offers Institutional Class Shares and Retail Class Shares. In addition, Small Cap Value Fund offers Admin Class Shares.
Most expenses of the Trusts can be directly attributed to a Fund. Expenses which cannot be directly attributed to a Fund are generally apportioned based on the relative net assets of each of the Funds in the Trusts. Expenses of a Fund are borne pro rata by the holders of each class of shares, except that each class bears expenses unique to that class (including the Rule 12b-1 service and distribution fees and transfer agent fees applicable to such class). In addition, each class votes as a class only with respect to its own Rule 12b-1 Plan. Shares of each class would receive their pro rata share of the net assets of a Fund if the Fund were liquidated. The Trustees approve separate dividends from net investment income on each class of shares.
2. Significant Accounting Policies. The following is a summary of significant accounting policies consistently followed by each Fund in the preparation of its financial statements. The Funds’ financial statements are prepared in accordance with accounting principles generally accepted in the United States of America which require the use of management estimates that affect the reported amounts and disclosures in the financial statements. Actual results could differ from those estimates. Management has evaluated the events and transactions that have occurred through November 23, 2009, the date the financial statements were issued, and noted no items requiring recognition in the financial statements or additional disclosure in the Notes to Financial Statements.
a. Valuation. Equity securities, including closed-end investment companies and exchange-traded funds, for which market quotations are readily available are valued at market value, as reported by pricing services recommended by the investment adviser and approved by the Board of Trustees. Such pricing services generally use the security’s last sale price on the exchange or market where the security is primarily traded or, if there is no reported sale during the day, the closing bid price. Securities traded on the NASDAQ Global Select Market, NASDAQ Global Market and NASDAQ Capital Market are valued at the NASDAQ Official Closing Price (“NOCP”), or if lacking a NOCP, at the most recent bid quotation on the applicable NASDAQ Market. Debt securities (other than short-term obligations purchased with an original or remaining maturity of sixty days or less) are generally valued on the basis of evaluated bids furnished to the Funds by a pricing service recommended by the investment adviser and approved by the Board of Trustees, which service determines valuations for normal, institutional-size trading units of such securities using market information, transactions for comparable securities and various relationships between securities which are generally recognized by institutional traders. Broker-dealer bid quotations may also be used to value debt and equity securities where a pricing service does not price a security or where a pricing service does not provide a reliable price for the security. In instances where broker-dealer bid quotations are not available, certain securities held by the Funds may be valued on the basis of a price provided by a principal market maker. Forward foreign currency contracts are valued utilizing interpolated prices determined from information provided by an independent pricing service. Short-term obligations purchased with an original or remaining maturity of sixty days or less are valued at amortized cost, which approximates market value. Securities for which market quotations are not readily available are valued at fair value as determined in good faith by the Funds’ investment adviser using consistently applied procedures under the general supervision of the Board of Trustees. Investments in other open-end investment companies are valued at their net asset value each day.
The Funds may hold securities traded in foreign markets. Foreign securities are valued at the market price in the foreign market. However, if events occurring after the close of the foreign market (but before the close of regular trading on the New York Stock Exchange) are believed to materially affect the value of those securities, such securities are fair valued pursuant to procedures approved by the Board of Trustees. When fair valuing securities, the Funds may, among other things, use modeling tools or other processes that may take into account factors such as securities market activity and/or significant events that occur after the close of the foreign market and before the Funds calculate their net asset values.
29
b. Security Transactions and Related Investment Income. Security transactions are accounted for on trade date. Dividend income is recorded on ex-dividend date, or in the case of certain foreign securities, as soon as a Fund is notified, and interest income is recorded on an accrual basis. Interest income is increased by the accretion of discount and decreased by the amortization of premium. Distributions received from investments in securities that represent a return of capital or capital gain are recorded as reduction of cost of investments or as a realized gain, respectively. The calendar year-end amounts of ordinary income, capital gains, and return of capital included in distributions received from the Funds’ investments in real estate investment trusts (“REITs”) are reported to the Funds after the end of the fiscal year; accordingly, the Funds estimate these amounts for accounting purposes until the characterization of REIT distributions is reported to the Funds after the end of the fiscal year. Estimates are based on the most recent REIT distribution information available. Investment income is recorded net of foreign taxes withheld when applicable. In determining net gain or loss on securities sold, the cost of securities has been determined on an identified cost basis. Investment income, non-class specific expenses and realized and unrealized gains and losses are allocated on a pro rata basis to each class based on the relative net assets of each class to the total net assets of the Fund.
c. Foreign Currency Translation. The books and records of the Funds are maintained in U.S. dollars. The value of securities, currencies and other assets and liabilities denominated in currencies other than U.S. dollars are translated into U.S. dollars based upon foreign exchange rates prevailing at the end of the period. Purchases and sales of investment securities, income and expenses are translated on the respective dates of such transactions.
Since the values of investment securities are presented at the foreign exchange rates prevailing at the end of the period, it is not practical to isolate that portion of the results of operations arising from changes in exchange rates from fluctuations which arise due to changes in market prices of investment securities. Such changes are included with the net realized and unrealized gain or loss on investments.
Net realized foreign exchange gains or losses arise from sales of foreign currency, currency gains or losses realized between the trade and settlement dates on securities transactions and the difference between the amounts of dividends, interest and foreign withholding taxes recorded on the Funds’ books and the U.S. dollar equivalent of the amounts actually received or paid. Net unrealized foreign exchange gains and losses arise from changes in the value of assets and liabilities, other than investment securities, at the end of the fiscal period, resulting from changes in exchange rates.
Each Fund may use foreign currency exchange contracts to facilitate transactions in foreign-denominated investments. Losses may arise from changes in the value of the foreign currency or if the counterparties do not perform under the contracts’ terms.
d. Federal and Foreign Income Taxes. Each Trust treats each Fund as a separate entity for federal income tax purposes. Each Fund intends to meet the requirements of the Internal Revenue Code applicable to regulated investment companies, and to distribute to its shareholders substantially all of its net investment income and any net realized capital gains at least annually. Management has performed an analysis of each Fund’s tax positions for the open tax years as of September 30, 2009 and has concluded that no provisions for income tax are required. The Funds’ federal tax returns for the prior three fiscal years remain subject to examination by the Internal Revenue Service. Management is not aware of any events that are reasonably possible to occur in the next twelve months that would result in the amounts of any unrecognized tax benefits significantly increasing or decreasing for the Funds. However, management’s conclusions regarding tax positions taken may be subject to review and adjustment at a later date based on factors including, but not limited to, new tax laws and accounting regulations and interpretations thereof.
A Fund may be subject to foreign taxes on income and gains on investments that are accrued based upon the Fund’s understanding of the tax rules and regulations that exist in the countries in which the Fund invests. Foreign governments may also impose taxes or other payments on investments with respect to foreign securities. Such taxes are accrued as applicable.
e. Dividends and Distributions to Shareholders. Dividends and distributions are recorded on ex-dividend date. The timing and characterization of certain income and capital gain distributions are determined annually in accordance with federal tax regulations, which may differ from accounting principles generally accepted in the United States of America. Permanent differences are primarily due to differing treatments for book and tax purposes for items such as distribution redesignation and net operating losses. Permanent book and tax basis differences relating to shareholder distributions will result in reclassifications to capital accounts. Temporary differences between book and tax distributable earnings are primarily due to securities lending collateral gain/loss adjustment, deferred Trustees’ fees and wash sales. Distributions from net investment income and short-term capital gains are considered to be distributed from ordinary income for tax purposes.
30
NOTES TO FINANCIAL STATEMENTS – continued
September 30, 2009
The tax characterization of distributions is determined on an annual basis. The tax character of distributions paid to shareholders during the years ended September 30, 2009 and 2008 were as follows:
| | | | | | | | | | | | | | | | | | |
| | | 2009 Distributions Paid From: | | 2008 Distributions Paid From: |
Fund | | Ordinary
Income | | Long-Term
Capital Gains | | Total | | Ordinary
Income | | Long-Term
Capital Gains | | Total |
Small Cap Growth Fund | | $ | — | | $ | — | | $ | — | | $ | — | | $ | — | | $ | — |
Small Cap Value Fund | | | 3,669,309 | | | 331,178 | | | 4,000,487 | | | 16,873,484 | | | 91,300,786 | | | 108,174,270 |
Differences between these amounts and those reported in the Statements of Changes in Net Assets, if any, are primarily attributable to different book and tax treatment for short-term capital gains.
As of September 30, 2009, the components of distributable earnings on a tax basis were as follows:
| | | | | | | | |
| | | Small Cap
Growth Fund | | | Small Cap
Value Fund | |
Undistributed ordinary income | | $ | — | | | $ | 1,287,623 | |
Undistributed long-term capital gains | | | — | | | | — | |
| | | | | | | | |
Total undistributed earnings | | | — | | | | 1,287,623 | |
| | | | | | | | |
Capital loss carryforward: | | | | | | | | |
Expires September 30, 2010 | | | (138,314,515 | ) | | | — | |
Expires September 30, 2011 | | | (59,283,040 | ) | | | — | |
Expires September 30, 2017 | | | (14,995,800 | ) | | | (88,137,321 | ) |
| | | | | | | | |
Total capital loss carryforward | | | (212,593,355 | ) | | | (88,137,321 | ) |
Deferred net capital losses (post-October 2008) | | | (26,616,006 | ) | | | (110,445,559 | ) |
Unrealized appreciation (depreciation) | | | 18,607,699 | | | | 93,063,030 | |
| | | | | | | | |
Total accumulated earnings (losses) | | $ | (220,601,662 | ) | | $ | (104,232,227 | ) |
| | | | | | | | |
f. Repurchase Agreements. It is each Fund’s policy that the market value of the collateral for repurchase agreements be at least equal to 102% of the repurchase price, including interest. The repurchase agreements are tri-party arrangements whereby the collateral is held in a segregated account for the benefit of the Fund and on behalf of the counterparty. Repurchase agreements could involve certain risks in the event of default or insolvency of the counterparty including possible delays or restrictions upon a Fund’s ability to dispose of the underlying securities.
g. Securities Lending. The Funds have entered into an agreement with State Street Bank and Trust Company (“State Street Bank”), as agent of the Funds, to lend securities to certain designated borrowers. The loans are collateralized with cash or securities in an amount equal to at least 105% or 102% of the market value (including accrued interest) of the loaned international or domestic securities, respectively, when the loan is initiated. Thereafter, the value of the collateral must remain at least 102% of the market value (including accrued interest) of loaned securities for U.S. equities and U.S. corporate debt; at least 105% of the market value (including accrued interest) of loaned securities for non-U.S. equities; and at least 100% of the market value (including accrued interest) of loaned securities for U.S. government securities, sovereign debt issued by non-U.S. governments and non-U.S. corporate debt. In the event that the market value of the collateral falls below the required percentages described above, the borrower will deliver additional collateral on the next business day. As with other extensions of credit, the Funds bear the risk of loss with respect to the investment of the collateral. The Funds invest cash collateral in short-term investments, a portion of the income from which is remitted to the borrowers and the remainder allocated between the Funds and State Street Bank as lending agent.
As of September 30, 2009, there were no securities on loan.
h. Indemnifications. Under the Trusts’ organizational documents, their officers and Trustees are indemnified against certain liabilities arising out of the performance of their duties to the Funds. Additionally, in the normal course of business, the Funds enter into contracts with service providers that contain general indemnification clauses. The Funds’ maximum exposure under these arrangements is unknown as this would involve future claims that may be made against the Funds that have not yet occurred. However, based on experience, the Funds expect the risk of loss to be remote.
31
3. Fair Value Measurements. Effective October 1, 2008, the Funds adopted accounting standards related to fair value measurements and disclosures which establish a hierarchy in which various inputs are used in determining the value of each Fund’s assets or liabilities. These inputs are summarized in the three broad levels listed below:
| | • | | Level 1—quoted prices in active markets for identical assets or liabilities; |
| | • | | Level 2—prices determined using other significant inputs that are observable either directly, or indirectly through corroboration with observable market data (which could include quoted prices for similar assets or liabilities, interest rates, credit risk, etc.); |
| | • | | Level 3—prices determined using significant unobservable inputs for situations where quoted prices or observable inputs are unavailable such as when there is little or no market activity for an asset or liability (unobservable inputs reflect each Fund’s own assumptions in determining the fair value of assets or liabilities and would be based on the best information available). |
The inputs or methodology used for valuing securities are not necessarily an indication of the risk associated with investing in those securities.
The following is a summary of the inputs used to value the Funds’ investments as of September 30, 2009, at value:
Small Cap Growth Fund
Asset Valuation Inputs
| | | | | | | | | | | | |
Description | | Level 1 | | Level 2 | | Level 3 | | Total |
Common Stocks(a) | | $ | 117,825,261 | | $ | — | | $ | — | | $ | 117,825,261 |
Short-Term Investments | | | 1,818,320 | | | — | | | — | | | 1,818,320 |
| | | | | | | | | | | | |
Total | | $ | 119,643,581 | | $ | — | | $ | — | | $ | 119,643,581 |
| | | | | | | | | | | | |
(a) Major categories of the Fund’s investments are included in the Portfolio of Investments.
Small Cap Value Fund
Asset Valuation Inputs
| | | | | | | | | | | | |
Description | | Level 1 | | Level 2 | | Level 3 | | Total |
Common Stocks(a) | | $ | 923,503,226 | | $ | — | | $ | — | | $ | 923,503,226 |
Short-Term Investments | | | 38,153,198 | | | — | | | — | | | 38,153,198 |
| | | | | | | | | | | | |
Total | | $ | 961,656,424 | | $ | — | | $ | — | | $ | 961,656,424 |
| | | | | | | | | | | | |
(a) Major categories of the Fund’s investments are included in the Portfolio of Investments.
4. Purchases and Sales of Securities. For the year ended September 30, 2009, purchases and sales of securities (excluding short-term investments) were as follows:
| | | | | | |
Fund | | Purchases | | Sales |
Small Cap Growth Fund | | $ | 111,737,304 | | $ | 102,415,951 |
Small Cap Value Fund | | | 440,690,957 | | | 505,156,733 |
5. Management Fees and Other Transactions with Affiliates.
a. Management Fees. Loomis, Sayles & Company, L.P. (“Loomis Sayles”) serves as investment adviser to each Fund. Under the terms of the management agreements, each Fund pays a management fee at the following annual rates, calculated daily and payable monthly, based on each Fund’s average daily net assets:
| | |
Fund | | Percentage of
Average Daily
Net Assets |
Small Cap Growth Fund | | 0.75% |
Small Cap Value Fund | | 0.75% |
Loomis Sayles has given binding undertakings to the Funds to reduce management fees and/or reimburse certain expenses associated with the Funds to limit their operating expenses, exclusive of acquired fund fees and expenses, brokerage expenses, interest expense, taxes and extraordinary expenses. These undertakings are in effect until January 31, 2010 and will be reevaluated
32
NOTES TO FINANCIAL STATEMENTS – continued
September 30, 2009
on an annual basis. For the year ended September 30, 2009, the expense limits as a percentage of average daily net assets under the expense limitation agreements were as follows:
| | | | | | |
| | | Expense Limit as a Percentage of
Average Daily Net Assets |
Fund | | Institutional Class | | Retail Class | | Admin Class |
Small Cap Growth Fund | | 1.00% | | 1.25% | | — |
Small Cap Value Fund | | 0.90% | | 1.15% | | 1.40% |
Loomis Sayles shall be permitted to recover expenses it has borne under the expense limitation agreement (whether through reduction of its management fees or otherwise) on a class by class basis in later periods to the extent the expenses of a class fall below a class’ expense limits, provided, however, that a class is not obligated to pay such reduced fees/expenses more than one year after the end of the fiscal year in which the fee/expense was reduced.
For the year ended September 30, 2009, the management fees for each Fund were as follows:
| | | | | |
Fund | | Management
Fee | | Percentage of
Average Daily
Net Assets |
Small Cap Growth Fund | | $ | 713,999 | | 0.75% |
Small Cap Value Fund | | | 5,985,483 | | 0.75% |
For the year ended September 30, 2009, expenses have been reimbursed as follows:
| | | | | | | | | | | | |
| | | Reimbursement1 |
Fund | | Institutional Class | | Retail Class | | Admin Class | | Total |
Small Cap Growth Fund | | $ | 4,255 | | $ | 106,447 | | $ | — | | $ | 110,702 |
Small Cap Value Fund | | | 167,311 | | | 529,638 | | | 223,834 | | | 920,783 |
1 Expense reimbursements are subject to possible recovery until September 30, 2010.
There were no expenses recovered during the year ended September 30, 2009 as permitted under the expense limitation agreement.
Certain officers and employees of Loomis Sayles are also officers or Trustees of the Trust. Loomis Sayles’ general partner is indirectly owned by Natixis Global Asset Management, L.P. (“Natixis US”), which is part of Natixis Global Asset Management, an international asset management group based in Paris, France.
b. Administrative Fees. Natixis Asset Management Advisors, L.P. (“Natixis Advisors”) provides certain administrative services for the Funds and contracts with State Street Bank to serve as sub-administrator. Natixis Advisors is a wholly-owned subsidiary of Natixis US. Pursuant to an agreement among Natixis Funds Trust I, Natixis Funds Trust II, Natixis Funds Trust III, Natixis Funds Trust IV, Natixis Cash Management Trust, Gateway Trust (“Natixis Funds Trusts”), Loomis Sayles Funds I, Loomis Sayles Funds II (“Loomis Sayles Funds Trusts”), Hansberger International Series and Natixis Advisors, each Fund pays Natixis Advisors monthly its pro rata portion of fees equal to an annual rate of 0.0575% of the first $15 billion of the average daily net assets of the Natixis Funds Trusts, Loomis Sayles Funds Trusts and the Hansberger International Series, 0.0500% of the next $15 billion, 0.0425% of the next $30 billion and 0.0375% of such assets in excess of $60 billion, subject to an annual aggregate minimum fee for the Natixis Funds Trusts, Loomis Sayles Funds Trusts and the Hansberger International Series of $10 million, which is reevaluated on an annual basis. New funds are subject to a fee for the first twelve months of operations of $75,000 plus $12,500 per class and an additional $75,000 if managed by multiple subadvisors.
For the year ended September 30, 2009, each Fund paid the following for administrative fees to Natixis Advisors:
| | | |
Fund | | Administrative
Fees |
Small Cap Growth Fund | | $ | 47,922 |
Small Cap Value Fund | | | 402,025 |
c. Service and Distribution Fees. Natixis Distributors, L.P. (“Natixis Distributors”), a wholly owned subsidiary of Natixis US, has entered into a distribution agreement with the Trusts. Pursuant to this agreement, Natixis Distributors serves as principal underwriter of each Fund.
33
Pursuant to Rule 12b-1 under the 1940 Act, the Small Cap Growth Fund and the Small Cap Value Fund have adopted a Distribution Plan relating to their Retail Class shares (the “Retail Class Plans”) and the Small Cap Value Fund has adopted a separate Distribution Plan relating to its Admin Class shares (the “Admin Class Plan”).
Under the respective Retail Class and Admin Class Plans, each Fund pays Natixis Distributors a monthly distribution fee at an annual rate not to exceed 0.25% of the average daily net assets attributable to the Fund’s Retail Class and Admin Class Shares, as reimbursement for expenses incurred by Natixis Distributors in providing personal services to investors in Retail Class and Admin Class Shares and/or maintenance of shareholder accounts. In addition, the Admin Class shares of the Small Cap Value Fund may pay an administrative service fee, at an annual rate not to exceed 0.25% of the average daily net assets attributable to Admin Class shares, to securities dealers or financial intermediaries for providing personal service and account maintenance for their customers who hold such shares.
For the year ended September 30, 2009, the Funds paid the following service and distribution fees:
| | | | | | | | | |
| | | Service Fees | | Distribution Fees |
Fund | | Admin
Class | | Retail
Class | | Admin
Class |
Small Cap Growth Fund | | $ | — | | $ | 148,197 | | $ | — |
Small Cap Value Fund | | | 149,466 | | | 820,762 | | | 149,466 |
d. Sub-Transfer Agent Fees. Natixis Distributors has entered into agreements with financial intermediaries to provide certain recordkeeping, processing, shareholder communications and other services to customers of the intermediaries and has agreed to compensate the intermediaries for providing those services. Certain services would be provided by the Funds if the shares of those customers were registered directly with the Funds’ transfer agent. Accordingly, the Funds agreed to pay a portion of the intermediary fees attributable to shares of the Fund held by the intermediaries (which generally is a percentage of the value of shares held) not exceeding what the Funds would have paid its transfer agent had each customer’s shares been registered directly with the transfer agent instead of held through the intermediaries. Natixis Distributors pays the remainder of the fees.
For the year ended September 30, 2009, the Funds paid the following sub-transfer agent fees, which are reflected in transfer agent fees and expenses in the Statements of Operations:
| | | | | | | | | |
| | | Sub-Transfer Agent Fees |
Fund | | Institutional
Class | | Retail
Class | | Admin
Class |
Small Cap Growth Fund | | $ | 17,234 | | $ | 47,223 | | $ | — |
Small Cap Value Fund | | | 299,213 | | | 626,381 | | | 246,077 |
e. Trustees Fees and Expenses. The Funds do not pay any compensation directly to their officers or Trustees who are directors, officers or employees of Natixis Advisors, Natixis Distributors, Natixis US, or their affiliates. The Chairperson of the Board receives a retainer fee at the annual rate of $200,000. The Chairperson does not receive any meeting attendance fees for Board of Trustees meetings or committee meetings that she attends. Each Independent Trustee (other than the Chairperson) receives, in the aggregate, a retainer fee at the annual rate of $65,000. Each Independent Trustee also receives a meeting attendance fee of $7,500 for each meeting of the Board of Trustees that he or she attends in person and $3,750 for each meeting of the Board of Trustees that he or she attends telephonically. In addition, each committee chair receives an additional retainer fee at the annual rate of $10,000. Each Contract Review and Governance Committee member is compensated $5,000 for each Committee meeting that he or she attends in person and $2,500 for each meeting that he or she attends telephonically. Each Audit Committee member is compensated $6,250 for each Committee meeting that he or she attends in person and $3,125 for each meeting that he or she attends telephonically. These fees are allocated among the funds in the Natixis Funds Trusts, Loomis Sayles Funds Trusts and the Hansberger International Series based on a formula that takes into account, among other factors, the relative net assets of each Fund. Trustees are reimbursed for travel expenses in connection with attendance at meetings.
A deferred compensation plan (the “Plan”) is available to the Trustees on a voluntary basis. Deferred amounts remain in the Funds until distributed in accordance with the provisions of the Plan. The value of a participating Trustee’s deferral account is based on theoretical investments of deferred amounts, on the normal payment dates, in certain funds of the Natixis Funds Trusts, Loomis Sayles Funds Trusts and Hansberger International Series as designated by the participating Trustees. Changes in the value of participants’ deferral accounts are allocated pro rata among the funds in the Natixis Funds Trusts, Loomis Sayles Funds Trusts, and Hansberger International Series, and are normally reflected as Trustees’ fees and expenses in the Statements of Operations.
34
NOTES TO FINANCIAL STATEMENTS – continued
September 30, 2009
The portions of the accrued obligations allocated to the Funds under the Plan are reflected as Deferred Trustees’ fees on the Statements of Assets and Liabilities.
f. Redemption Fees. Effective June 1, 2009, the redemption fee imposed on Small Cap Growth Fund and Small Cap Value Fund was eliminated. Prior to June 1, 2009, shareholders of Small Cap Growth Fund and Small Cap Value Fund were charged a 2% redemption fee if they redeemed, including redeeming by exchange within 60 days of acquisition (including acquisition by exchange). The redemption fee was deducted from the shareholder’s redemption or exchange proceeds and was paid to the Fund. These fees were accounted for as an addition to paid-in capital and are presented on the Statements of Changes in Net Assets.
6. Line of Credit. Each Fund, together with certain other funds of Natixis Funds Trusts, Loomis Sayles Funds Trusts and the Hansberger International Series, participates in a $200,000,000 committed unsecured line of credit provided by State Street Bank, with an individual limit of $125,000,000 for each Fund that participates in the line of credit. Interest is charged to each participating fund based on its borrowings at a rate per annum equal to the greater of the Federal Funds rate or overnight LIBOR, plus 0.75%. In addition, a commitment fee of 0.125% per annum, payable at the end of each calendar quarter, is accrued and apportioned among the participating funds based on their average daily unused portion of the line of credit.
Prior to March 11, 2009, each Fund, together with certain other funds of Natixis Funds Trusts, Loomis Sayles Funds Trusts and Hansberger International Series, participated in a $200,000,000 committed unsecured line of credit provided by State Street Bank, with an individual limit of $125,000,000 for each Fund that participated in the line of credit. Interest was charged to each participating fund based on its borrowings at a rate per annum equal to the Federal Funds rate plus 0.50%. In addition, a commitment fee of 0.09% per annum, payable at the end of each calendar quarter, was accrued and apportioned among the participating funds based on their average daily unused portion of the line of credit.
For the year ended September 30, 2009, the Funds had no borrowings under these agreements.
7. Brokerage Commission Recapture. Each Fund has entered into agreements with certain brokers whereby the brokers will rebate a portion of brokerage commissions. All amounts rebated by the brokers are returned to the Funds under such agreements and are included in realized gains in the Statements of Operations. For the year ended September 30, 2009, amounts rebated under these agreements were as follows:
| | | |
Fund | | Rebates |
Small Cap Growth Fund | | $ | 21,646 |
Small Cap Value Fund | | | 82,819 |
8. Shareholders. At September 30, 2009, the Loomis Sayles Funded Pension Plan and the Loomis Sayles Employees’ Profit Sharing Retirement Plan held Institutional Class shares of beneficial interest in the Funds as follows:
| | | | |
Fund | | Pension Plan | | Profit Sharing
Retirement Plan |
Small Cap Growth Fund | | 368,786 | | 363,748 |
Small Cap Value Fund | | 362,408 | | 754,730 |
35
9. Capital Shares. Each Fund may issue an unlimited number of shares of beneficial interest, without par value. Transactions in capital shares were as follows:
| | | | | | | | | | | | | | |
| | | Small Cap Growth Fund | |
| | |
| | | Year Ended September 30, 2009 | | | Year Ended September 30, 2008 | |
| | | | |
| Institutional Class | | Shares | | | Amount | | | Shares | | | Amount | |
Issued from the sale of shares | | 1,974,319 | | | $ | 19,253,187 | | | 2,094,507 | | | $ | 30,602,699 | |
Issued in connection with the reinvestment of distributions | | — | | | | — | | | — | | | | — | |
Redeemed | | (1,447,130 | ) | | | (13,740,063 | ) | | (456,742 | ) | | | (6,441,388 | ) |
| | | | | | | | | | | | | | |
Net change | | 527,189 | | | $ | 5,513,124 | | | 1,637,765 | | | $ | 24,161,311 | |
| | | | | | | | | | | | | | |
| | | | |
| Retail Class | | Shares | | | Amount | | | Shares | | | Amount | |
Issued from the sale of shares | | 3,127,117 | | | $ | 30,016,606 | | | 6,898,095 | | | $ | 94,809,730 | |
Issued in connection with the reinvestment of distributions | | — | | | | — | | | — | | | | — | |
Redeemed | | (2,692,237 | ) | | | (25,065,630 | ) | | (1,956,386 | ) | | | (26,497,100 | ) |
| | | | | | | | | | | | | | |
Net change | | 434,880 | | | $ | 4,950,976 | | | 4,941,709 | | | $ | 68,312,630 | |
| | | | | | | | | | | | | | |
Increase (decrease) from capital share transactions | | 962,069 | | | $ | 10,464,100 | | | 6,579,474 | | | $ | 92,473,941 | |
| | | | | | | | | | | | | | |
| |
| | | Small Cap Value Fund | |
| | |
| | | Year Ended September 30, 2009 | | | Year Ended September 30, 2008 | |
| | | | |
| Institutional Class | | Shares | | | Amount | | | Shares | | | Amount | |
Issued from the sale of shares | | 5,487,523 | | | $ | 94,433,600 | | | 9,681,674 | | | $ | 228,728,526 | |
Issued in connection with the reinvestment of distributions | | 156,833 | | | | 2,488,947 | | | 1,942,239 | | | | 49,352,283 | |
Redeemed | | (6,270,554 | ) | | | (105,527,302 | ) | | (5,076,716 | ) | | | (120,789,687 | ) |
| | | | | | | | | | | | | | |
Net change | | (626,198 | ) | | $ | (8,604,755 | ) | | 6,547,197 | | | $ | 157,291,122 | |
| | | | | | | | | | | | | | |
| | | | |
| Retail Class | | Shares | | | Amount | | | Shares | | | Amount | |
Issued from the sale of shares | | 4,033,997 | | | $ | 70,124,577 | | | 10,268,147 | | | $ | 242,357,595 | |
Issued in connection with the reinvestment of distributions | | 76,628 | | | | 1,206,896 | | | 1,850,508 | | | | 46,632,804 | |
Redeemed | | (6,502,104 | ) | | | (108,566,266 | ) | | (7,108,230 | ) | | | (166,486,060 | ) |
| | | | | | | | | | | | | | |
Net change | | (2,391,479 | ) | | $ | (37,234,793 | ) | | 5,010,425 | | | $ | 122,504,339 | |
| | | | | | | | | | | | | | |
| | | | |
| Admin Class | | Shares | | | Amount | | | Shares | | | Amount | |
Issued from the sale of shares | | 1,211,062 | | | $ | 19,455,331 | | | 2,168,929 | | | $ | 51,105,918 | |
Issued in connection with the reinvestment of distributions | | 1,691 | | | | 26,231 | | | 271,955 | | | | 6,747,215 | |
Redeemed | | (1,162,021 | ) | | | (19,010,438 | ) | | (1,532,487 | ) | | | (35,447,384 | ) |
| | | | | | | | | | | | | | |
Net change | | 50,732 | | | $ | 471,124 | | | 908,397 | | | $ | 22,405,749 | |
| | | | | | | | | | | | | | |
Increase (decrease) from capital share transactions | | (2,966,945 | ) | | $ | (45,368,424 | ) | | 12,466,019 | | | $ | 302,201,210 | |
| | | | | | | | | | | | | | |
36
REPORT OF INDEPENDENT REGISTERED PUBLIC ACCOUNTING FIRM
To the Trustees of Loomis Sayles Funds I and Loomis Sayles Funds II and Shareholders of Loomis Sayles Small Cap Value Fund and Loomis Sayles Small Cap Growth Fund:
In our opinion, the accompanying statements of assets and liabilities, including the portfolios of investments, and the related statements of operations and of changes in net assets and the financial highlights present fairly, in all material respects, the financial position of the Loomis Sayles Small Cap Value Fund, a series of Loomis Sayles Funds I and the Loomis Sayles Small Cap Growth Fund, a series of Loomis Sayles Funds II (collectively, the “Funds”), at September 30, 2009, and the results of each of their operations, the changes in each of their net assets and the financial highlights for each of the periods indicated, in conformity with accounting principles generally accepted in the United States of America. These financial statements and financial highlights (hereafter referred to as “financial statements”) are the responsibility of the Funds’ management; our responsibility is to express an opinion on these financial statements based on our audits. We conducted our audits of these financial statements in accordance with the standards of the Public Company Accounting Oversight Board (United States). Those standards require that we plan and perform the audits to obtain reasonable assurance about whether the financial statements are free of material misstatement. An audit includes examining, on a test basis, evidence supporting the amounts and disclosures in the financial statements, assessing the accounting principles used and significant estimates made by management, and evaluating the overall financial statement presentation. We believe that our audits, which included confirmation of securities at September 30, 2009 by correspondence with the custodian and brokers, provide a reasonable basis for our opinion.
PricewaterhouseCoopers LLP
Boston, Massachusetts
November 23, 2009
37
2009 U.S. TAX DISTRIBUTION INFORMATION TO SHAREHOLDERS (Unaudited)
Corporate Dividends Received Deduction. For the fiscal year ended September 30, 2009, a percentage of dividends distributed by the Funds listed below qualify for the dividends received deduction for corporate shareholders. These percentages are as follows:
| | |
Fund | | Qualifying Percentage |
| Small Cap Value | | 100% |
Capital Gains Distributions. Pursuant to Internal Revenue Section 852(b), the following Funds paid distributions, which have been designated as capital gains distributions for the fiscal year ended September 30, 2009, unless subsequently determined to be different.
| | |
Fund | | Amount |
| Small Cap Value | | $331,178 |
Qualified Dividend Income. For the fiscal year ended September 30, 2009, the Funds below will designate up to the maximum amount allowable pursuant to the Internal Revenue Code as qualified dividend income eligible for reduced tax rates. These lower rates range from 0% to 15% depending on an individual’s tax bracket. If the Funds pay a distribution during calendar year 2009, complete information will be reported in conjunction with Form 1099-DIV.
38
TRUSTEE AND OFFICER INFORMATION
The tables below provide certain information regarding the Trustees and officers of Loomis Sayles Funds I and Loomis Sayles Funds II (the “Trusts”). Unless otherwise indicated, the address of all persons below is 399 Boylston Street, Boston, MA 02116. The Trusts’ Statements of Additional Information include additional information about the Trustees of the Trusts and are available by calling Loomis Sayles at 800-633-3330.
| | | | | | |
| Name and Year of Birth | | Position(s)
Held with
the Trusts, Length
of Time Served and
Term of Office* | | Principal Occupation(s) During Past 5 Years** | | Number of Portfolios in Fund
Complex Overseen*** and
Other Directorships Held |
| | | |
Independent Trustees | | | | | | |
Graham T. Allison, Jr.
(1940) | | Trustee Since 2003 Contract Review and Governance Committee Member | | Douglas Dillon Professor and Director of the Belfer Center for Science and International Affairs, John F. Kennedy School of Government, Harvard University | | 39 Director, Taubman Centers, Inc. (real estate investment trust) |
| | | |
Charles D. Baker (1956) | | Trustee Since 2005 Contract Review and Governance Committee Member | | Formerly, President and Chief Executive Officer, Harvard Pilgrim Health Care (health plan) | | 39 None |
| | | |
Edward A. Benjamin
(1938) | | Trustee Since 2002 Chairman of the Contract Review and Governance Committee | | Retired | | 39 None |
| | | |
Daniel M. Cain (1945) | | Trustee Since 2003 Chairman of the Audit Committee | | Chairman (formerly, President and Chief Executive Officer), Cain Brothers & Company, Incorporated (investment banking) | | 39 Director, Sheridan Healthcare Inc. (physician practice management) |
| | | |
Kenneth A. Drucker (1945) | | Trustee Since 2008 Audit Committee Member | | Formerly, Treasurer, Sequa Corp. (manufacturing) | | 39 None |
| | | |
Wendell J. Knox**** (1948) | | Trustee Since 2009 Contract Review and Governance Committee Member | | Director (formerly, President and Chief Executive Officer) of Abt Associates Inc. (research and consulting) | | 39 Director, Eastern Bank (commercial bank); Director, The Hanover Insurance Group (property and casualty insurance) |
| | | |
Sandra O. Moose (1942) | | Chairperson of the Board of Trustees since November 2005 Trustee Since 2003 Ex officio member of the Audit Committee and Contract Review and Governance Committee | | President, Strategic Advisory Services (management consulting); formerly, Senior Vice President and Director, The Boston Consulting Group, Inc. (management consulting) | | 39 Director, Verizon Communications; Director, AES Corporation (international power company) |
39
| | | | | | |
| Name and Year of Birth | | Position(s)
Held with
the Trusts, Length
of Time Served and
Term of Office* | | Principal Occupation(s) During Past 5 Years** | | Number of Portfolios in Fund
Complex Overseen*** and
Other Directorships Held |
Cynthia L. Walker (1956) | | Trustee Since 2005 Audit Committee Member | | Deputy Dean for Finance and Administration, Yale University School of Medicine; formerly, Executive Dean for Administration, Harvard Medical School; and formerly, Dean for Finance and Chief Financial Officer, Harvard Medical School | | 39 None |
| | | |
Interested Trustees | | | | | | |
Robert J. Blanding1 (1947) 555 California Street San Francisco, CA 94104 | | Trustee Since 2002 President and Chief Executive Officer of Loomis Sayles Funds I since 2002 Chief Executive Officer of Loomis Sayles Funds II since 2002 | | President, Chairman, Director and Chief Executive Officer, Loomis, Sayles & Company, L.P. | | 39 None |
| | | |
John T. Hailer2 (1960) | | Trustee Since 2003 | | President and Chief Executive Officer-U.S. and Asia, Natixis Global Asset Management, L.P.; formerly, President and Chief Executive Officer, Natixis Distribution Corporation, Natixis Asset Management Advisors, L.P., Natixis Distributors, L.P. and Natixis Global Associates, Inc. | | 39 None |
| * | Each Trustee serves until retirement, resignation or removal from the Board of Trustees. The current retirement age is 72. The position of Chairperson of the Board is appointed for a two-year term. Ms. Moose was appointed to serve an additional two-year term as the Chairperson of the Board of Trustees on September 14, 2007. |
| ** | Each person listed above, except as noted, holds the same position(s) with the Natixis Funds Trust I, Natixis Funds Trust II, Natixis Funds Trust III, Natixis Funds Trust IV, Gateway Trust and the Natixis Cash Management Trust (collectively, the “Natixis Funds Trusts”), Loomis Sayles Funds I and Loomis Sayles Funds II (collectively, the “Loomis Sayles Funds Trusts”), and Hansberger International Series. Previous positions during the past five years with Natixis Distributors, L.P. (the “Distributor”), Natixis Asset Management Advisors, L.P. (“Natixis Advisors”), or Loomis, Sayles & Company, L.P. (“Loomis Sayles”) are omitted if not materially different from a Trustee’s or officer’s current position with such entity. |
| *** | The Trustees of the Trusts serve as trustees of a fund complex that includes all series of the Natixis Funds Trusts, the Loomis Sayles Funds Trusts and Hansberger International Series (collectively, the “Fund Complex”). |
| **** | Mr. Knox was appointed as trustee effective July 1, 2009. |
| 1 | Mr. Blanding is deemed an “interested person” of the Trusts because he holds the following positions with an affiliated person of the Trusts: President, Chairman, Director and Chief Executive Officer of Loomis Sayles. |
| 2 | Mr. Hailer is deemed an “interested person” of the Trusts because he holds the following positions with an affiliated person of the Trusts: President and Chief Executive Officer-U.S. and Asia, Natixis Global Asset Management, L.P. |
40
| | | | | | |
| Name and Year of Birth | | Position(s)
Held with the Trusts | | Term of Office* and
Length of Time Served | | Principal Occupation During
Past 5 Years** |
|
Officers of the Trusts |
Coleen Downs Dinneen (1960) | | Secretary, Clerk and Chief Legal Officer | | Since September 2004 | | Executive Vice President, General Counsel, Secretary and Clerk (formerly, Senior Vice President, Deputy General Counsel, Assistant Secretary and Assistant Clerk), Natixis Distribution Corporation, Natixis Asset Management Advisors, L.P. and Natixis Distributors, L.P. |
Daniel J. Fuss (1933) One Financial Center Boston, MA 02111 | | Executive Vice President | | Since June 2003 | | Vice Chairman and Director, Loomis, Sayles & Company, L.P. |
| | | |
David Giunta (1965) | | President of Loomis Sayles Funds II and Executive Vice President of Loomis Sayles Funds I | | Since March 2008 | | President and Chief Executive Officer, Natixis Distribution Corporation, Natixis Asset Management Advisors, L.P. and Natixis Distributors, L.P.; formerly, President, Fidelity Charitable Gift Fund; and formerly, Senior Vice President, Fidelity Brokerage Company |
| | | |
Russell L. Kane (1969) | | Chief Compliance Officer, Assistant Secretary and Anti-Money Laundering Officer | | Chief Compliance Officer since May 2006; Assistant Secretary since June 2004; and Anti-Money Laundering Officer since April 2007 | | Chief Compliance Officer for Mutual Funds, Senior Vice President, Deputy General Counsel, Assistant Secretary and Assistant Clerk, Natixis Distribution Corporation, Natixis Asset Management Advisors, L.P. and Natixis Distributors, L.P. |
| | | |
Michael C. Kardok (1959) | | Treasurer, Principal Financial and Accounting Officer | | Since October 2004 | | Senior Vice President, Natixis Asset Management Advisors, L.P. and Natixis Distributors, L.P. |
| * | Each officer of the Trusts serves for an indefinite term in accordance with the Trusts’ current By-laws until the date his or her successor is elected and qualified, or until he or she sooner dies, retires, is removed or becomes disqualified. |
| ** | Each person listed above, except as noted, holds the same position(s) with the Fund Complex. Mr. Fuss is not an officer of the Natixis Funds Trusts or the Hansberger International Series. Previous positions during the past five years with the Distributor, Natixis Advisors or Loomis Sayles are omitted if not materially different from a Trustee’s or officer’s current position with such entity. |
41

Loomis Sayles Bond Fund
Loomis Sayles Fixed Income Fund
Loomis Sayles Global Bond Fund
Loomis Sayles Inflation Protected Securities Fund
Loomis Sayles Institutional High Income Fund
Loomis Sayles Intermediate Duration Fixed Income Fund
Loomis Sayles Investment Grade Fixed Income Fund
ANNUAL REPORT
SEPTEMBER 30, 2009
FUND AND MANAGER REVIEW
Loomis Sayles Bond Fund
| | |
 Daniel Fuss, CFA, CIC Manager since May 1991 | | 
Matthew Eagan, CFA Associate Manager since February 2007 |

Kathleen Gaffney, CFA Manager since October 1997 | | 
Elaine Stokes Associate Manager since February 2007 |
PORTFOLIO REVIEW
The Fund substantially outperformed its Benchmark, the Barclays Capital U.S. Government/Credit Bond Index, for the fiscal year ended September 30, 2009 due primarily to strong performance from corporate credits and non-US-dollar denominated investments.
Bond markets rallied in recent quarters, reversing the losses sustained in 2008, when the widespread financial crisis seized up credit markets and dried up liquidity. As government efforts to stimulate the economy took hold and economic and credit-market conditions slowly improved, risk appetites returned briskly, pushing corporate spreads from their historically wide levels of December 2008 back down to levels seen prior to the September 2008 bankruptcy of Lehman Brothers. The aggressive spread tightening bolstered performance across all major spread sectors within the Fund.
Within the investment grade credit sector, our overweight to BBB-rated cyclical industrial names dominated the performance lineup. Investment grade financials also performed well, as surviving banks and financial firms rebounded following a period of sharp decline and consolidation. Select utility names in the natural gas and electric industries also added modestly to results.
The high-yield segment experienced similar performance patterns. Our high yield financials, including CC-rated consumer finance, diversified finance and banking issues, gained the most from the resurgent demand for risk assets. High yield industrials also posted impressive gains, supported by issues in the auto, home construction, telecom (wireless) and pharmaceutical industries.
In the non-US-dollar segment, currencies of commodity-rich countries rallied on growth expectations. The most notable performance occurred among investments denominated in the Norwegian krone, New Zealand dollar, Australian dollar and Brazilian real.
High yield securities in the electric utilities sector were among the few weak areas in the Fund. From a quality perspective, the B- and CCC-quality groups detracted from relative performance, primarily due to certain securities within the auto, technology and supermarket industries.
OUTLOOK
Looking ahead, we continue to believe there is selective value in corporate bonds. Despite their recent tightening, spreads remain wide relative to long-term averages. A vast majority of the spread tightening that has taken place this year is due to the re-emergence of liquidity in the markets. Over the long term, further spread tightening from these levels will most likely be generated by an improvement in global and US economic fundamentals. Our view is that maintaining specific risk in the portfolio will present the best opportunity for long-term performance. The global “risk-on” trade has
FUND FACTS
Symbol | Institutional: LSBDX;
Retail: LSBRX; Admin: LBFAX
Objective | High total investment return through a combination of current income and capital appreciation
Strategy | Invests primarily in investment-grade fixed-income securities, although it may invest up to 35% of assets in lower-rated fixed-income securities and up to 20% of its assets in preferred stocks. The Fund may invest any portion of its assets in Canadian securities and up to 20% of assets in other foreign securities, including emerging markets securities.
Fund Inception Date | 5/16/91
Class Inception Date Institutional: 5/16/91; Retail: 12/31/96; Admin: 1/2/98
Total Net Assets | $18,728.4 million
1
weakened the US dollar, and we expect this may continue. Currencies from developed and emerging markets may offer more long-term upside potential, particularly the European peripheral currencies and Asian currencies tied to China and its global-growth story.
AVERAGE ANNUAL TOTAL RETURNS
Periods Ended September 30, 2009
| | | | | | | | | | |
| 1 Year | | | 5 Years | | | 10 Years | | | Since Fund
Inception(a) | |
Loomis Sayles Bond: Institutional | |
| 19.84 | % | | 6.49 | % | | 8.79 | % | | 10.16 | % |
Loomis Sayles Bond: Retail(c) | |
| 19.46 | | | 6.19 | | | 8.50 | | | 9.88 | |
Loomis Sayles Bond: Admin(c) | |
| 19.21 | | | 5.91 | | | 8.21 | | | 9.41 | |
Barclays Capital U.S. Government/Credit Bond Index(d) | |
| 11.46 | | | 4.92 | | | 6.32 | | | 6.95 | |
Lipper BBB-Rated Funds Index(d) | |
| 14.69 | | | 4.04 | | | 5.59 | | | 6.60 | |
| | | | | | |
Gross expense ratio (before reductions and reimbursements)* | |
| Institutional: 0.64% | | Retail: 0.94 | % | | Admin: 1.24 | % |
Net expense ratio (after reductions and reimbursements)* | |
| Institutional: 0.64% | | Retail: 0.94 | % | | Admin: 1.20 | % |
* As stated in the most recent prospectus
CUMULATIVE PERFORMANCE(e)
Inception to September 30, 2009(b)
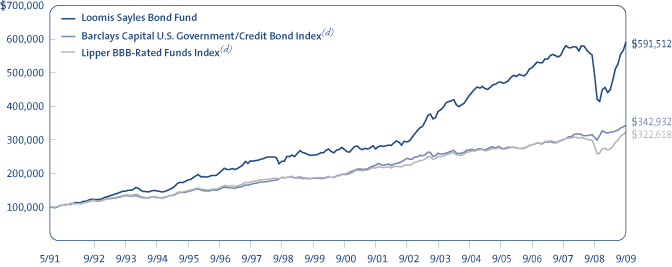
Data quoted reflects past performance and cannot guarantee future results. Average annual total returns assume reinvestment of dividends and capital gains distributions. Investment return and principal value will fluctuate so that shares, when redeemed, may be worth more or less than their original cost. For performance current to the most recent month-end, please visit www.loomissayles.com. Current performance may be higher or lower than quoted.
Returns do not reflect the taxes that a shareholder would pay on Fund distributions or the redemption of shares. Periods of less than one year are not annualized. Performance data reflects certain fee reductions and reimbursements, if any, without which performance would be lower.
(a) Inception dates of the Institutional, Retail and Admin Classes of shares are May 16, 1991, December 31, 1996 and January 2, 1998, respectively. (b) The mountain chart is based on the initial minimum investment of $100,000 for the Institutional Class. (c) Performance shown for periods prior to the inception date of the Retail Class and the Admin Class represents the performance of the Institutional Class during the periods shown, adjusted to reflect the current levels of 12b-1 fees payable by the respective classes of shares. (d) See page 15 for a description of the indices. Index performance data is not available coincident with the Fund’s inception date; the beginning value of the index is the value as of the month end closest to the Fund’s inception date. (e) Cumulative performance is shown for the Institutional Class of shares. Performance of the Retail and Admin Classes would be lower, due to higher fees.
WHAT YOU SHOULD KNOW
The Fund can invest a significant percentage of assets in debt securities that are rated below investment grade and the value of fund shares can be adversely affected by changes in economic conditions or other circumstances. Lower rated debt securities have speculative characteristics and may be subject to greater price volatility than higher rated investments. In addition, the secondary market for these securities may lack liquidity. Fund shares should be viewed as a long-term investment. Securities issued by US government agencies are not insured by and may not be guaranteed by the US government. The Fund can invest a significant percentage of assets in foreign securities and the value of fund shares can be adversely affected by changes in currency exchange rates, political, and economic developments. In emerging markets these risks can be significant. The Fund is subject to currency risk, which is the risk that fluctuations in exchange rates between the US dollar and foreign currencies may cause the value of the Fund’s investments to decline. Accordingly, the purchase of fund shares should be viewed as a long-term investment.
2
FUND AND MANAGER REVIEW
Loomis Sayles Fixed Income Fund
| | |
Daniel Fuss, CFA, CIC Manager since January 1995 | |
Matthew Eagan, CFA Associate Manager since
February 2007 |
Kathleen Gaffney, CFA Associate Manager since February 2007 | |
Elaine Stokes Associate Manager since February 2007 |
PORTFOLIO REVIEW
The Fund substantially outperformed its Benchmark, the Barclays Capital U.S. Government/Credit Bond Index, for the fiscal year ended September 30, 2009 primarily due to security selection and sector allocation.
The bond markets rallied in the second half of the reporting period, reversing losses sustained late in 2008, when widespread financial crises seized up credit markets and dried up liquidity. As government efforts to stimulate the economy took hold and economic conditions slowly improved, investors’ risk appetites returned briskly, pushing corporate spreads from their historic wide levels of December 2008 back to levels seen prior to the September 2008 bankruptcy of Lehman Brothers.
Our allocation to investment grade industrials fared well, as the appearance of several promising economic “green shoots” fueled a broad-based rally in the corporate sector led by BBB-rated, higher-beta names. In particular, the bonds we selected in the telecommunications, cyclical industrials and technology sectors led performance within the investment grade industrials space. In the high yield corporate sector, the acquisition of new funding led to a rebound among financials. In addition, the credit arms of several US automakers, which benefited from government support, were positive movers in the sector.
The market’s return to riskier assets helped performance among our non-US-dollar-denominated issues. A surge in the price of industrial materials benefitted commodity currencies, namely the Norwegian krone, Brazilian real, and New Zealand dollar, while expectations of growth in China helped buoy the Indonesian rupiah and Singapore dollar. In addition, convertible issues rallied throughout much of 2009, as investors sought opportunities among biotech and pharmaceutical issuers.
On the negative side, a longer-than-Benchmark duration stance concentrated in long-term, investment grade corporate securities detracted from returns, as the yield curve continued to steepen for most of the fiscal year. In addition, investment-grade and high yield utilities lagged due to concerns about consumer demand and depressed natural gas prices. Despite an extended rally throughout much of 2009, bank loans were unable to recover completely from losses sustained in the second half of 2008.
OUTLOOK
Looking ahead, we continue to believe there is select value in corporate bonds. Despite their recent tightening, spreads remain wide relative to long-term averages. A vast majority of the spread tightening that has taken place this year is due to the re-emergence of liquidity in the markets. Over the long term, further spread tightening from these levels will most likely be generated by an improvement in global and US economic fundamentals. Our view is that
FUND FACTS
Symbol | LSFIX
Objective | High total investment return through a combination of current income and capital appreciation
Strategy | Invests primarily in fixed-income securities, may invest up to 35% of its assets in lower-rated fixed-income securities and up to 20% of its assets in preferred stocks. The Fund may invest any portion of its assets in Canadian securities and up to 20% of assets in other foreign securities, including emerging markets securities.
Fund Inception Date | 1/17/95
Fund Registration Date | 3/7/97
Total Net Assets | $762.0 million
3
maintaining specific risk in the portfolio will present the best opportunity for long-term performance.
The global “risk-on” trade has weakened the US dollar, and we expect this may continue. Currencies from developed and emerging markets may offer more long-term upside potential, particularly the European peripheral currencies and Asian currencies tied to China and its global-growth story.
AVERAGE ANNUAL TOTAL RETURNS
Periods Ended September 30, 2009
| | | | | | | | | | | | | |
| 1 Year | | | 5 Years | | | 10 Years | | | Since
Registration(a) | | | Since Fund
Inception(a) | |
Loomis Sayles Fixed Income: Institutional | |
| 19.55 | % | | 7.44 | % | | 9.31 | % | | 8.70 | % | | 10.01 | % |
Barclays Capital U.S. Government/Credit Bond Index(b) | |
| 11.46 | | | 4.92 | | | 6.32 | | | 6.36 | | | 6.80 | |
Lipper BBB-Rated Funds Index(b) | |
| 14.69 | | | 4.04 | | | 5.59 | | | 5.53 | | | 6.30 | |
| | | | |
Gross expense ratio (before reductions and reimbursements)* |
| Institutional: 0.58% | | | | |
Net expense ratio (after reductions and reimbursements)* |
| Institutional: 0.58% | | | | |
* As stated in the most recent prospectus
CUMULATIVE PERFORMANCE
Registration to September 30, 2009(c)
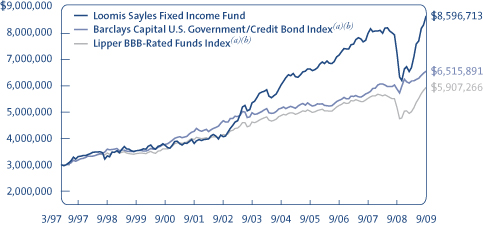
Inception to September 30, 2009(c)
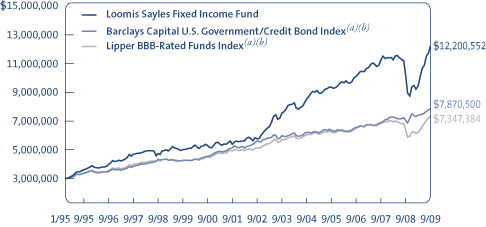
Data quoted reflects past performance and cannot guarantee future results. Average annual total returns assume reinvestment of dividends and capital gains distributions. Investment return and principal value will fluctuate so that shares, when redeemed, may be worth more or less than their original cost. For performance current to the most recent month end, please visit www.loomissayles.com. Current performance may be higher or lower than quoted.
Returns do not reflect the taxes that a shareholder would pay on Fund distributions or the redemption of shares. Periods of less than one year are not annualized. Performance data reflects certain fee reductions and reimbursements, if any, without which performance would be lower.
(a) Shares of the Fund were registered for offer and sale under the Securities Act of 1933 on March 7, 1997. In accordance with regulations, performance information is provided for the period beginning on March 7, 1997 (“Registration”). Performance from inception is also provided for the convenience of our long-term shareholders. Since index performance data is not available coincident with the Fund’s inception and registration dates, comparative performance is presented from the month end closest to the Fund’s inception and registration dates. (b) See page 15 for a description of the indices. (c) The mountain chart is based on the Fund’s minimum initial investment of $3,000,000.
WHAT YOU SHOULD KNOW
The Fund can invest a significant percentage of assets in debt securities that are rated below investment grade and the value of fund shares can be adversely affected by changes in economic conditions or other circumstances. Lower rated debt securities have speculative characteristics and may be subject to greater price volatility than higher rated investments. In addition, the secondary market for these securities may lack liquidity. Fund shares should be viewed as a long-term investment. Securities issued by US government agencies are not insured by and may not be guaranteed by the US government. The Fund can invest a significant percentage of assets in foreign securities and the value of fund shares can be adversely affected by changes in currency exchange rates, political, and economic developments. In emerging markets these risks can be significant. The Fund is subject to currency risk, which is the risk that fluctuations in exchange rates between the US dollar and foreign currencies may cause the value of the Fund’s investments to decline. Accordingly, the purchase of fund shares should be viewed as a long-term investment.
4
FUND AND MANAGER REVIEW
Loomis Sayles Global Bond Fund

Ken Buntrock, CFA, CIC
Manager since September 2000

David Rolley, CFA
Manager since September 2000

Lynda Schweitzer, CFA
Manager since February 2007
PORTFOLIO REVIEW
The Fund outperformed its Benchmark, the Barclays Capital Global Aggregate Bond Index, for the fiscal year ended September 30, 2009 primarily due to strong security selection coupled with the Fund’s relative overweight in the corporate sector.
Global bonds struggled in the first half of the reporting period, as the credit crisis deepened and investors’ flight to safety accelerated. The global recession, illiquid capital markets and depleted investor confidence caused corporate spreads to widen to record levels early in the fiscal year. The worst performing bonds—and the greatest detractors to Fund performance—included those issued by banks, brokers and finance companies, which struggled as worries about the global banking system weighed on investors. Sentiment changed sharply in the second half of the fiscal year. Signs that the worldwide economy and financial system were on the mend, combined with investors’ desire for yield, helped spark a turnaround in the global bond market. Risk aversion subsided, and credit spreads tightened to pre-financial crisis levels.
Within the corporate sector, the Fund’s overweight positions in the US, UK and European corporate bond markets drove the Fund’s outperformance. In addition, the Fund’s exposure to the high yield and emerging markets sectors was a positive contributor to relative and absolute performance, as improved investor risk appetites and strong liquidity led to higher returns.
From a currency perspective, the Fund’s overweight positions in the Norwegian krone and Australian dollar also aided performance, due to investors’ willingness to take on risk and bid up currencies that showed increasing global growth prospects. While Scandinavian currencies enhanced the Fund’s overall performance, our small exposure to the Icelandic krona detracted from returns. In addition, the Fund’s underweight in the Japanese yen detracted from performance, as the yen strengthened against the US dollar during the period.
OUTLOOK
We expect the US economy to stage a weak recovery, hindered by high unemployment and sluggish consumer and investment spending. Therefore, we have reduced the Fund’s credit spread positions and increased its exposure to non-US dollar currencies. We are maintaining our bias to reduce dollar duration in anticipation of higher yields next year, but we are in no hurry to implement that strategy.
FUND FACTS
Symbol | Institutional: LSGBX;
Retail: LSGLX
Objective | High total investment return through a combination of high current income and capital appreciation
Strategy | Invests primarily in investment grade fixed-income securities worldwide, although it may invest up to 20% of assets in lower-rated fixed-income securities.
Fund Inception Date | 5/10/91
Class Inception Date Institutional: 5/10/91; Retail: 12/31/96
Total Net Assets | $1,951.2 million
5
AVERAGE ANNUAL TOTAL RETURNS
Periods Ended September 30, 2009
| | | | | | | | | | |
| 1 Year | | | 5 Years | | | 10 Years | | | Since
Inception(a) | |
Loomis Sayles Global Bond: Institutional | |
| 19.19 | % | | 5.95 | % | | 7.68 | % | | 8.31 | % |
Loomis Sayles Global Bond: Retail(b) | |
| 18.81 | | | 5.65 | | | 7.40 | | | 8.11 | |
Barclays Capital Global Aggregate Bond Index(c) | |
| 13.51 | | | 6.11 | | | 6.41 | | | 7.16 | |
Lipper Global Income Funds Index(c) | |
| 12.77 | | | 5.00 | | | 5.82 | | | 6.13 | |
| | | | | |
Gross expense ratio (before reductions and reimbursements)* |
| Institutional: 0.64% | | Retail: 1.00 | % | | |
Net expense ratio (after reductions and reimbursements)* |
| Institutional: 0.64% | | Retail: 1.00 | % | | |
* As stated in the most recent prospectus
CUMULATIVE PERFORMANCE(d)
Inception to September 30, 2009(e)
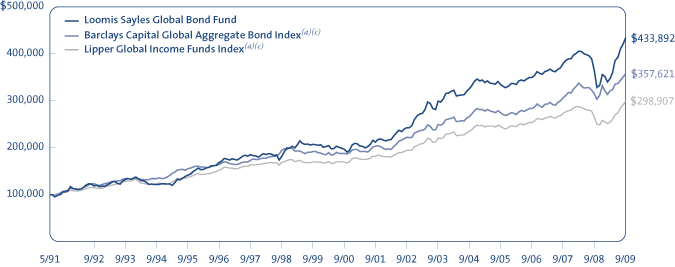
Data quoted reflects past performance and cannot guarantee future results. Average annual total returns assume reinvestment of dividends and capital gains distributions. Investment return and principal value will fluctuate so that shares, when redeemed, may be worth more or less than their original cost. For performance current to the most recent month-end, please visit www.loomissayles.com. Current performance may be higher or lower than quoted.
Returns do not reflect the taxes that a shareholder would pay on Fund distributions or the redemption of shares. Periods of less than one year are not annualized. Performance data reflects certain fee reductions and reimbursements, if any, without which performance would be lower.
(a) Since index performance data is not available coincident with the Fund’s inception date, the beginning value of the index is the value as of the month end closest to the Fund’s inception date. (b) Performance shown for periods prior to the inception date of the Retail Class (12/31/96) represents the performance of the Institutional Class during the periods shown, adjusted to reflect the current levels of 12b-1 fees payable by the respective Classes of shares. (c) See page 15 for a description of the indices. (d) Cumulative performance is shown for the Institutional Class. Performance of the Retail Class would be lower due to higher fees. (e) The mountain chart is based on the Institutional Class minimum initial investment of $100,000.
WHAT YOU SHOULD KNOW
The Fund can invest a significant percentage of assets in debt securities that are rated below investment grade and the value of fund shares can be adversely affected by changes in economic conditions or other circumstances. Lower rated debt securities have speculative characteristics and may be subject to greater price volatility than higher rated investments. In addition, the secondary market for these securities may lack liquidity. Fund shares should be viewed as a long-term investment. Securities issued by US government agencies are not insured by and may not be guaranteed by the US government. The Fund can invest a significant percentage of assets in foreign securities and the value of fund shares can be adversely affected by changes in currency exchange rates, political, and economic developments. In emerging markets these risks can be significant. The Fund is subject to currency risk, which is the risk that fluctuations in exchange rates between the US dollar and foreign currencies may cause the value of the Fund’s investments to decline. Accordingly, the purchase of fund shares should be viewed as a long-term investment.
6
FUND AND MANAGER REVIEW
Loomis Sayles Inflation Protected Securities Fund

John Hyll
Manager since January 2003

Cliff Rowe, CFA
Manager since January 2003
PORTFOLIO REVIEW
The Fund outperformed its Benchmark, the Barclays Capital U.S. TIPS Index, for the fiscal year ended September 30, 2009 primarily due to our sector allocation and duration positioning. During the year, the nominal yield on 10-year Treasury inflation-protected securities (TIPS) decreased to 3.31% as of September 30, 2009, from 3.83% on September 30, 2008. The yield on five-year TIPS decreased to 2.32% at the end of September 2009 from 2.98% at the end of September 2008. The real and nominal Treasury yield curves steepened during the year, as the Federal Reserve Board cut rates and then held them steady in a range between 0.00% and 0.25% for the balance of the fiscal year.
TIPS struggled in the first half of the reporting period, when inflation concerns took a back seat to the global financial crisis and the market’s desire for nominal Treasurys. However, TIPS rebounded in the second half, as improving liquidity, government support and increased risk appetites encouraged investors to move back into the market. At the sector level, the Fund’s allocation to TIPS (83% of the Fund at the end of the fiscal year) proved to be the largest positive contributor to performance.
Overall, the Fund’s non-TIPS exposure also contributed favorably to performance. In particular, the rally among corporate issues in the second half of the fiscal year led to significant spread tightening. A renewed interest in risk helped generate better returns among lower-quality securities. The Fund’s high yield and investment grade industrials performed well, with securities in the financials sector posting particularly strong results. In addition, our duration strategy, which we concentrated in long term TIPS and investment grade corporate bonds, bolstered performance as investors sought yield in the second half of the fiscal year.
Our non-US dollar holdings were performance laggards for the fiscal year, primarily due to the impact of the global recession. Specifically, securities denominated in the Singapore dollar and Mexican peso generated the poorest results.
OUTLOOK
Although inflation remains relatively tame near term, the longer-term outlook suggests inflation may increase, due to the considerable amount of government stimulus in the system and the massive expansion of the Federal Reserve Board’s balance sheet. In this environment, we believe TIPS continue to offer good value.
We still see attractive opportunities among corporate bonds and in select currencies. Despite their recent tightening, spreads remain wide relative to their long term averages and we think they still have room to narrow. Near term, investors searching for yield will likely drive the spread tightening, but we believe an improving economy should be the driving force over the longer term. High yield corporate bonds may also be among the top performers, due to declining default rates and improved market access.
FUND FACTS
Symbol | LSGSX
Objective | High total investment return through a combination of current income and capital appreciation
Strategy | Invests primarily in inflation-protected securities with emphasis on debt securities issued by the US Treasury
Fund Inception Date | 5/20/91
Total Net Assets | $14.0 million
7
AVERAGE ANNUAL TOTAL RETURNS
Periods Ended September 30, 2009
| | | | | | | | | | |
| 1 Year | | | 5 Years | | | 10 Years | | | Since
Inception(a) | |
Loomis Sayles Inflation Protected Securities: Institutional | |
| 7.21 | % | | 3.88 | % | | 5.98 | % | | 7.24 | % |
Barclays Capital U.S. TIPS Index(b) | |
| 5.67 | | | 4.79 | | | 7.51 | | | N/A | |
Lipper Treasury Inflation Protected Securities Funds Index(b) | |
| 5.21 | | | 4.14 | | | N/A | | | N/A | |
| | | | |
Gross expense ratio (before reductions and reimbursements)* |
| Institutional: 0.95% | | | | |
Net expense ratio (after reductions and reimbursements)* |
| Institutional: 0.40% | | | | |
* As stated in the most recent prospectus
CUMULATIVE PERFORMANCE
Inception to September 30, 2009(c)
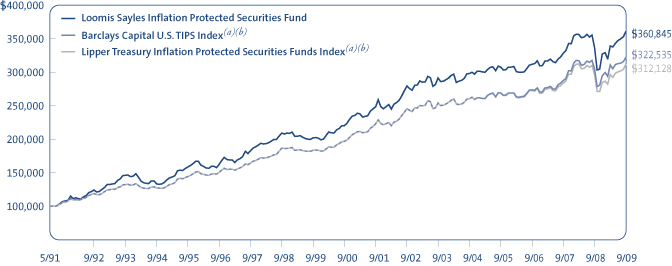
Data quoted reflects past performance and cannot guarantee future results. Average annual total returns assume reinvestment of dividends and capital gains distributions. Investment return and principal value will fluctuate so that shares, when redeemed, may be worth more or less than their original cost. For performance current to the most recent month end, please visit www.loomissayles.com. Current performance may be higher or lower than quoted.
For illustrative purposes, the chart above reflects the growth of a hypothetical investment of $100,000 in the Fund, since its inception. The chart above also reflects the growth of a hypothetical investment in the former primary benchmark of the Fund, the Barclays Capital U.S. Government Bond Index (the “Former Benchmark”), compared to the performance of the Fund from the Fund’s inception date through December 31, 2004. On December 15, 2004, in connection with a change of the Fund’s investment objective, the Fund changed its primary benchmark to the Barclays Capital U.S. TIPS Index (the “New Benchmark”). Since index performance data is not available coincident with the date of the Fund’s strategy change, comparative data for the Fund’s New Benchmark begins on December 31, 2004. The chart above reflects the growth of a hypothetical investment in the New Benchmark, compared to the performance of the Fund, from December 31, 2004, through September 30, 2009. The chart above also compares the performance of the Fund to the Lipper Treasury Inflation Protected Securities Funds Index from December 31, 2004 through September 30, 2009. The performance of the New Benchmark and of the Lipper Treasury Inflation Protected Securities Funds Index was linked to the performance of the Former Benchmark as of December 31, 2004.
Returns do not reflect the taxes that a shareholder would pay on fund distributions or the redemption of shares. Periods of less than one year are not annualized. Performance data reflects certain fee reductions and reimbursements, if any, without which performance would be lower.
(a) Since index performance data is not available coincident with the Fund’s inception date, comparative performance is presented from the month end closest to the Fund’s inception date. (b) See page 15 for a description of the indices. Return data is not available for the Barclays Capital U.S. TIPS Index prior to March 1, 1997. Similarly, return data is not available for the Lipper Treasury Inflation Protected Securities Funds Index prior to July 1, 2003. (c) The mountain chart is based on the Fund’s minimum initial investment of $100,000.
WHAT YOU SHOULD KNOW
Securities issued by US government agencies are not insured by and may not be guaranteed by the US government. The Fund can invest a significant percentage of assets in foreign securities and the value of fund shares can be adversely affected by changes in currency exchange rates, political, and economic developments. In emerging markets these risks can be significant. The Fund is subject to currency risk, which is the risk that fluctuations in exchange rates between the US dollar and foreign currencies may cause the value of the Fund’s investments to decline. Accordingly, the purchase of fund shares should be viewed as a long-term investment.
Effective December 15, 2004, the Fund’s name and investment strategy changed. The Fund’s strategy emphasizes inflation-protected debt securities issued by the US Treasury (TIPS). The principal value of the types of securities are periodically adjusted according to the rate of inflation and repayment of the original bonds is guaranteed by the US government.
8
FUND AND MANAGER REVIEW
Loomis Sayles Institutional High Income Fund
| | |
Daniel Fuss, CFA, CIC Manager since June 1996 | |
Matthew Eagan, CFA Associate Manager since
February 2007 |
Kathleen Gaffney, CFA Associate Manager since February 2007 | |
Elaine Stokes Associate Manager since February 2007 |
PORTFOLIO REVIEW
The Fund underperformed its Benchmark, the Barclays Capital U.S. Corporate High-Yield Bond Index, for the fiscal year ended September 30, 2009 largely due to an underweight in lower-quality securities, which generally outperformed higher-rated credits for the period.
In the first half of the period, the lack of liquidity significantly affected valuations across the credit spectrum. Fears of a systemic meltdown drove dramatic volatility in the high yield market, as the credit crisis sent investors toward Treasurys and other high-quality assets. High yield bonds and highly leveraged loans did not perform well in this environment and significantly detracted from the Fund’s returns. However, in the second half of the reporting period, risk assets staged a sharp turnaround on renewed investor optimism, a return of market liquidity and a desire for higher yield. An influx of new capital into the credit markets and new issue activity, coupled with the government’s monetary policy efforts, assisted in creating one of the largest technical high yield rallies on record. Securities with B credit ratings and non-rated convertibles were the strongest performers during the period, in the Fund.
Overall, the Fund’s overweight to investment grade credit handicapped relative performance, because the high yield sector was the top-performing fixed-income asset class. Specifically, the Fund’s underweight in high yield financials represented the largest detractor to performance. This sector reaped the benefits of the market’s capital inflows and new issuance in the second half of the period. In addition, our specific US-dollar and non-US-dollar-denominated holdings in the finance and banking industries posted poor relative performance.
The Fund’s high yield industrials contributed the most to performance for the period. In addition, consumer non-cyclicals—specifically, pharmaceuticals and health care credits—performed particularly well due to merger-and-acquisition discussions and the current debate over universal health insurance. Our holdings in the communication industry also contributed positively, while out-of-Benchmark positions in convertibles and investment grade financials enhanced results.
OUTLOOK
Looking ahead, we continue to believe there is select value in corporate bonds. Despite their recent tightening, spreads remain wide relative to long-term averages. A vast majority of the spread tightening that has taken place this year is due to the re-emergence of liquidity in the markets. Over the long term, further spread tightening from these levels will most likely be generated by an improvement in global and US economic fundamentals. Our view is that
FUND FACTS
Symbol | LSHIX
Objective | High total investment return through a combination of current income and capital appreciation
Strategy | Invests in primarily lower-rated fixed-income securities and other securities that are expected to produce a relatively high level of income, (including income-producing preferred and common stocks).
The Fund may invest any portion of its assets in Canadian securities and up to 50% of assets in other foreign securities, including emerging markets securities.
Fund Inception Date | 6/5/96
Fund Registration Date | 3/7/97
Total Net Assets | $458.5 million
9
maintaining specific risk in the portfolio will present the best opportunity for long term performance.
The global “risk-on” trade has weakened the US dollar, and we expect this may continue. Currencies from developed and emerging markets may offer more long-term upside potential, particularly the European peripheral currencies and Asian currencies tied to China and its global-growth story.
AVERAGE ANNUAL TOTAL RETURNS
Periods Ended September 30, 2009
| | | | | | | | | | | | | |
| 1 Year | | | 5 Years | | | 10 Years | | | Since
Registration(a) | | | Since
Inception(a) | |
Loomis Sayles Institutional High Income: Institutional | |
| 20.82 | % | | 8.31 | % | | 9.00 | % | | 7.72 | % | | 7.85 | % |
Barclays Capital U.S. Corporate High-Yield Bond Index(b) | |
| 22.34 | | | 6.13 | | | 6.25 | | | 5.94 | | | 6.45 | |
Lipper High Current Yield Funds Index(b) | |
| 12.14 | | | 4.06 | | | 3.81 | | | 3.98 | | | 4.59 | |
| | | | |
Gross expense ratio (before reductions and reimbursements)* |
| Institutional: 0.74% | | | | |
Net expense ratio (after reductions and reimbursements)* |
| Institutional: 0.74% | | | | |
* As stated in the most recent prospectus
CUMULATIVE PERFORMANCE
Registration to September 30, 2009(c)
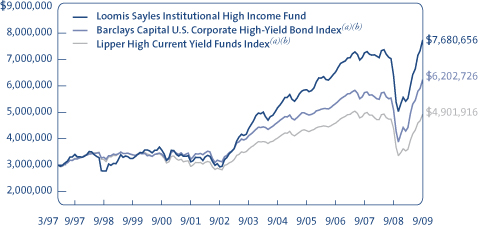
Inception to September 30, 2009(c)
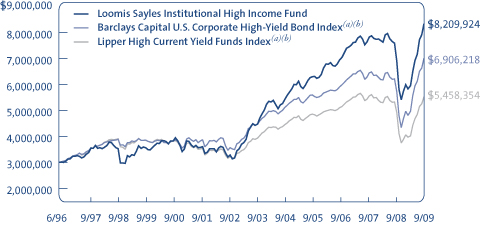
Data quoted reflects past performance and cannot guarantee future results. Average annual total returns assume reinvestment of dividends and capital gains distributions. Investment return and principal value will fluctuate so that shares, when redeemed, may be worth more or less than their original cost. For performance current to the most recent month end, please visit www.loomissayles.com. Current performance may be higher or lower than quoted.
Returns do not reflect the taxes that a shareholder would pay on Fund distributions or the redemption of shares. Periods of less than one year are not annualized. Performance data reflects certain fee reductions and reimbursements, if any, without which performance would be lower.
(a) Shares of the Fund were registered for offer and sale under the Securities Act of 1933 on March 7, 1997. In accordance with regulations, performance information is provided for the period beginning on March 7, 1997 (“Registration”). Performance from inception is also provided for the convenience of our long-term shareholders. Since index performance data is not available coincident with the Fund’s inception and registration dates, comparative performance is presented from the month end closest to the Fund’s inception and registration dates. (b) See page 15 for a description of the indices. (c) The mountain chart is based on the Fund’s minimum initial investment of $3,000,000.
WHAT YOU SHOULD KNOW
The Fund can invest a significant percentage of assets in debt securities that are rated below investment grade and the value of fund shares can be adversely affected by changes in economic conditions or other circumstances. Lower rated debt securities have speculative characteristics and may be subject to greater price volatility than higher rated investments. In addition, the secondary market for these securities may lack liquidity. Fund shares should be viewed as a long-term investment. Securities issued by US government agencies are not insured by and may not be guaranteed by the US government. The Fund can invest a significant percentage of assets in foreign securities and the value of fund shares can be adversely affected by changes in currency exchange rates, political, and economic developments. In emerging markets these risks can be significant. The Fund is subject to currency risk, which is the risk that fluctuations in exchange rates between the US dollar and foreign currencies may cause the value of the Fund’s investments to decline. Accordingly, the purchase of fund shares should be viewed as a long-term investment.
10
FUND AND MANAGER REVIEW
Loomis Sayles Intermediate Duration Fixed Income Fund

Neil Burke
Manager since December 2005
Cliff Rowe, CFA
Manager since December 2005

Richard Raczkowski
Manager since December 2005
PORTFOLIO REVIEW
The Fund outperformed its Benchmark, the Barclays Capital U.S. Intermediate Government/Credit Bond Index, for the fiscal year ended September 30, 2009 primarily due to strong security selection combined with an overweight to corporate securities and an underweight to US Treasurys.
Risk aversion and a massive flight to quality characterized the first half of the period, inflating US Treasury prices and pushing Treasury yields to historic lows. The investment climate reversed course in the second half of the fiscal year, when a market wide technical rally offset losses incurred in the prior six months. In particular, corporate debt posted robust returns, as the risk aversion diminished and liquidity improved. In this environment, our underweight to US Treasury securities helped relative performance.
The Fund’s allocation to investment grade industrials boosted performance, as the appearance of several promising economic “green shoots” in early 2009 fueled a broad-based rally in the corporate space, led by higher beta names with BBB credit ratings. Investor demand for yield largely outpaced supply, which caused spreads to tighten. Our telecommunication and cyclical industrial holdings drove performance, followed by select technology names.
The reopening of the new issue market helped high yield financials rebound from the lows they touched in the second half of 2008. Our high yield industrials contributed positively to performance, as investors returned to risk assets and pursued higher yields.
Volatility and continued concerns about rising defaults led to lagging performance for our securitized holdings through the first half of the period. Nevertheless, beginning in early 2009, these securities rebounded significantly, as the federal government expanded its support of the securitized market and risk appetites and liquidity returned to the market. Along with our securitized assets, our small position in the Singapore dollar detracted from performance.
OUTLOOK
As we wait for the economic recovery to stabilize, we believe the Fund is well positioned. We expect market volatility to remain elevated throughout the remainder of the year, which we believe should provide additional investment opportunities. Going forward, we believe active management and prudent security selection will drive returns.
FUND FACTS
Symbol | LSDIX
Objective | Above-average total return through a combination of current income and capital appreciation
Strategy | Invests only in investment-grade fixed-income securities. The Fund’s weighted average duration generally is two to five years
Fund Inception Date | 1/28/98
Total Net Assets | $28.0 million
11
AVERAGE ANNUAL TOTAL RETURNS
Periods Ended September 30, 2009
| | | | | | | | | | |
| 1 Year | | | 5 Years | | | 10 Years | | | Since
Inception(a) | |
Loomis Sayles Intermediate Duration Fixed Income Fund: Institutional | |
| 16.99 | % | | 5.15 | % | | 6.05 | % | | 5.65 | % |
Barclays Capital U.S. Intermediate Government/Credit Bond Index(b) | |
| 10.01 | | | 4.68 | | | 5.90 | | | 5.68 | |
Lipper Intermediate Investment Grade Debt Funds Index(b) | |
| 12.36 | | | 4.13 | | | 5.57 | | | 5.25 | |
| | | | | | |
Gross expense ratio (before reductions and reimbursements)* |
| Institutional: 0.59% | | | | | | |
Net expense ratio (after reductions and reimbursements)* |
| Institutional 0.40% | | | | | | |
* As stated in the most recent prospectus
CUMULATIVE PERFORMANCE
Inception to September 30, 2009(c)
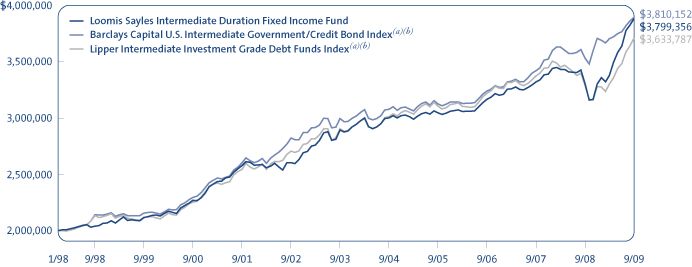
Data quoted reflects past performance and cannot guarantee future results. Average annual total returns assume reinvestment of dividends and capital gains distributions. Investment return and principal value will fluctuate so that shares, when redeemed, may be worth more or less than their original cost. For performance current to the most recent month-end, please visit www.loomissayles.com. Current performance may be higher or lower than quoted.
Returns do not reflect the taxes that a shareholder would pay on fund distributions or the redemption of shares. Periods of less than one year are not annualized. Performance data reflects certain fee reductions and reimbursements, if any, without which performance would be lower.
(a) Since index performance data is not available coincident with the Fund’s inception date, comparative performance is presented from the month end closest to the Fund’s inception date. (b) See page 15 for a description of the indices. (c) The mountain chart is based on the Fund’s minimum initial investment of $2,000,000.
WHAT YOU SHOULD KNOW
If the credit rating of a security held by the Fund falls below investment grade, the Fund may continue to hold it if Loomis Sayles believes the investment is appropriate. The secondary market for securities that fall below investment grade may lack liquidity and such securities may incur greater risk of default, which may adversely affect the value of the Fund. Foreign countries may have different accounting standards than those of the US. Securities issued by US government agencies are not insured by and may not be guaranteed by the US government. The Fund can invest a significant percentage of assets in foreign securities and the value of fund shares can be adversely affected by changes in currency exchange rates, political, and economic developments. In emerging markets these risks can be significant. The Fund is subject to currency risk, which is the risk that fluctuations in exchange rates between the US dollar and foreign currencies may cause the value of the Fund’s investments to decline. The Fund can invest a significant percentage of assets in debt securities that are rated below investment grade and the value of fund shares can be adversely affected by changes in economic conditions or other circumstances. Lower rated debt securities have speculative characteristics and may be subject to greater price volatility than higher rated investments. In addition, the secondary market for these securities may lack liquidity. Accordingly, the purchase of fund shares should be viewed as a long-term investment.
12
FUND AND MANAGER REVIEW
Loomis Sayles Investment Grade Fixed Income Fund
| | |
Daniel Fuss, CFA, CIC Manager since July 1994 | |
Matthew Eagan, CFA Associate Manager
since September 2006 |
Kathleen Gaffney, CFA Associate Manager since
September 2006 | |
Elaine Stokes Associate Manager since
September 2006 |
PORTFOLIO REVIEW
The Fund outperformed its Benchmark, the Barclays Capital U.S. Government/Credit Bond Index, for the fiscal year ended September 30, 2009 primarily due to security selection within the corporate credit segment and to sector allocation and exposure within specific securitized markets.
Risk aversion and a massive flight to quality characterized the first half of the period, inflating US Treasury prices and pushing Treasury yields to historic lows. The market climate reversed course in the second half of the fiscal year, when a market-wide technical rally offset losses incurred in the prior six months. In particular, corporate debt posted robust returns, as the risk-aversion trade slowed and liquidity improved. In this environment, our underweight to US Treasury and agency securities helped relative performance.
Investment grade credit was the leading contributor to Fund performance during the year, led primarily by industrials. Prudent security selection among high-beta telecommunication, consumer cyclical and non-cyclical, and transportation names drove performance. In addition, exposure within the financial sector, combined with strong security selection, enhanced performance as continued government support for the sector helped returns. Within the securitized markets, our position in commercial mortgage-backed securities (CMBS) boosted performance. CMBS rallied on increased support from the federal government’s Term Asset-Backed Loan Facility (TALF) and Public-Private Investment Program (PPIP).
Out-of-Benchmark allocations to non-US-dollar-denominated securities weighed slightly on performance, as currency volatility forced mixed returns. Issues denominated in the Mexican peso, Canadian dollar, and Indonesian rupiah fared the worst. In addition, the Fund realized lagging results from asset-backed and residential mortgage-backed securities, where security selection drove down results.
OUTLOOK
Looking ahead, we continue to believe there is select value in corporate bonds. Despite their recent tightening, spreads remain wide relative to long-term averages. A vast majority of the spread tightening that has taken place this year is due to the re-emergence of liquidity in the markets. Over the long term, further spread tightening from these levels will most likely be generated by an improvement in global and US economic fundamentals. Our view is that maintaining specific risk in the portfolio will present the best opportunity for long term performance.
The global “risk-on” trade has weakened the US dollar, and we expect this may continue. Currencies from developed and emerging markets may offer more long-term upside potential, particularly the European peripheral currencies and Asian currencies tied to China and its global-growth story.
FUND FACTS
Symbol | LSIGX
Objective | Above-average total investment return through a combination of current income and capital appreciation
Strategy | Invests in primarily investment-grade fixed-income securities, although it may invest up to 10% of its assets in lower rated fixed-income securities and up to 10% of its assets in preferred stocks. The Fund may invest any portion of its assets in securities of Canadian issuers and up to 20% of assets in securities of other foreign issuers, including emerging markets.
Fund Inception Date | 7/1/94
Fund Registration Date | 3/7/97
Total Net Assets | $525.5 million
13
AVERAGE ANNUAL TOTAL RETURNS
Periods Ended September 30, 2009
| | | | | | | | | | | | | |
| 1 Year | | | 5 Years | | | 10 Years | | | Since
Registration(a) | | | Since
Inception(a) | |
Loomis Sayles Investment Grade Fixed Income: Institutional | |
| 19.35 | % | | 7.04 | % | | 9.62 | % | | 8.77 | % | | 9.83 | % |
Barclays Capital U.S. Government/Credit Bond Index(b) | |
| 11.46 | | | 4.92 | | | 6.32 | | | 6.36 | | | 6.72 | |
Lipper BBB-Rated Funds Index(b) | | | | |
| 14.69 | | | 4.04 | | | 5.59 | | | 5.53 | | | 6.20 | |
| | | | | | |
Gross expense ratio (before reductions and reimbursements)* |
| Institutional: 0.50% | | | | | | |
Net expense ratio (after reductions and reimbursements)* |
| Institutional 0.50% | | | | | | |
* As stated in the most recent prospectus
CUMULATIVE PERFORMANCE
Registration to September 30, 2009(c)
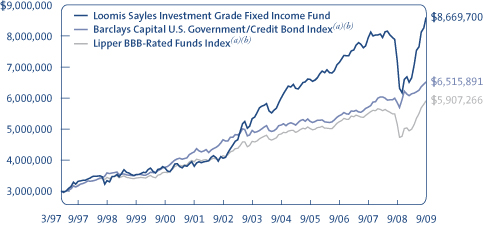
Inception to September 30, 2009(c)
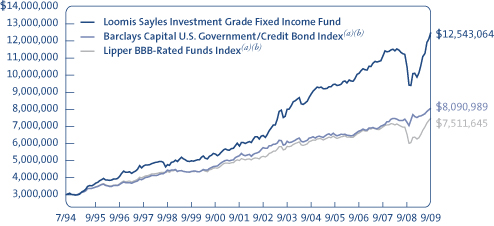
Data quoted reflects past performance and cannot guarantee future results. Average annual total returns assume reinvestment of dividends and capital gains distributions. Investment return and principal value will fluctuate so that shares, when redeemed, may be worth more or less than their original cost. For performance current to the most recent month end, please visit www.loomissayles.com. Current performance may be higher or lower than quoted.
Returns do not reflect the taxes that a shareholder would pay on Fund distributions or the redemption of shares. Periods of less than one year are not annualized. Performance data reflects certain fee reductions and reimbursements, if any, without which performance would be lower.
(a) Shares of the Fund were registered for offer and sale under the Securities Act of 1933 on March 7, 1997. In accordance with regulations, performance information is provided for the period beginning on March 7, 1997 (“Registration”). Performance from inception is also provided for the convenience of our long-term shareholders. Since index performance data is not available coincident with the Fund’s inception and registration dates, comparative performance is presented from the month end closest to the Fund’s inception and registration dates. (b) See page 15 for a description of the indices. (c) The mountain chart is based on the Fund’s minimum initial investment of $3,000,000.
WHAT YOU SHOULD KNOW
The Fund can invest a significant percentage of assets in debt securities that are rated below investment grade and the value of fund shares can be adversely affected by changes in economic conditions or other circumstances. Lower rated debt securities have speculative characteristics and may be subject to greater price volatility than higher rated investments. In addition, the secondary market for these securities may lack liquidity. Fund shares should be viewed as a long-term investment. Securities issued by US government agencies are not insured by and may not be guaranteed by the US government. The Fund can invest a significant percentage of assets in foreign securities and the value of fund shares can be adversely affected by changes in currency exchange rates, political, and economic developments. In emerging markets these risks can be significant. The Fund is subject to currency risk, which is the risk that fluctuations in exchange rates between the US dollar and foreign currencies may cause the value of the Fund’s investments to decline. The Fund can invest a significant percentage of assets in debt securities that are rated below investment grade and the value of fund shares can be adversely affected by changes in economic conditions or other circumstances. Lower rated debt securities have speculative characteristics and may be subject to greater price volatility than higher rated investments. In addition, the secondary market for these securities may lack liquidity. Accordingly, the purchase of fund shares should be viewed as a long-term investment.
14
ADDITIONAL INFORMATION
Index Definitions
Indexes are unmanaged and do not have expenses that affect results, unlike mutual funds. Index returns are adjusted for the reinvestment of capital gain distributions and income dividends. It is not possible to invest directly in an index.
Lipper BBB-Rated Funds Index is an equally weighted index of typically the 30 largest mutual funds within the corporate debt funds BBB-rated investment objective.
Lipper Global Income Funds Index is an equally weighted index of typically the 30 largest mutual funds within the global income funds investment objective.
Lipper High Current Yield Funds Index is an equally weighted unmanaged index of typically the 30 largest mutual funds within the high current yield funds investment objective.
Lipper Intermediate Investment Grade Debt Funds Index is an equally weighted unmanaged index of the 30 largest mutual funds within the intermediate investment grade debt funds investment objective.
Lipper Treasury Inflation Protected Securities Funds Index is an equally weighted index of typically the 30 largest mutual funds within the treasury inflation protected securities funds investment objective.
Source: Lipper, Inc.
Barclays Capital U.S. Government/Credit Bond Index includes treasuries (public obligations of the US Treasury that have remaining maturities of more than one year) and agencies (publicly issued debt of US Government agencies, quasi-federal corporations, and corporate or foreign debt guaranteed by the US Government) as well as other publicly issued investment grade corporate and foreign debentures that meet specified maturity, liquidity, and quality requirements.
Barclays Capital U.S. Intermediate Government/Credit Bond Index includes securities which have a remaining maturity of 1-10 years and includes Treasuries (public obligations of the US Treasury that have remaining maturities of more than one year) and agencies (publicly issued debt of US Government agencies, quasi-federal corporations, and corporate or foreign debt guaranteed by the US Government), as well as other publicly issued investment grade corporate and non-corporate debentures that meet specified maturity, liquidity, and quality requirements.
Barclays Capital Global Aggregate Bond Index covers the most liquid portion of the global investment grade fixed-rate bond market, including government, credit and collateralized securities.
Barclays Capital U.S. Corporate High-Yield Bond Index covers the universe of fixed rate, non-investment grade debt. Pay-in-kind bonds, Eurobonds, and debt issues from countries designated as emerging markets (e.g., Argentina, Brazil, Venezuela, etc.) are excluded, but Canadian and global bonds (SEC registered) of issuers in non-emerging market countries are included. Original issue zeroes, step-up coupon structures, and 144As are also included.
Barclays Capital U.S. TIPS Index measures the performance of the inflation protected securities issued by the US Treasury.
Proxy Voting Information
A description of the Funds’ proxy voting policies and procedures is available without charge, upon request, (i) by calling Loomis Sayles at 800-633-3330; (ii) on the Funds’ website, www.loomissayles.com, and (iii) on the SEC’s website, www.sec.gov. Information about how the Funds voted proxies relating to portfolio securities during the 12 months ended June 30, 2009 is available on (i) the Funds’ website and (ii) the SEC’s website.
Quarterly Portfolio Schedules
The Funds file a complete schedule of portfolio holdings with the SEC for the first and third quarters of each fiscal year on Form N-Q. The Funds’ Forms N-Q are available on the SEC’s website at www.sec.gov and may be reviewed and copied at the SEC’s Public Reference Room in Washington, DC. Information on the operation of the Public Reference Room may be obtained by calling 1-800-SEC-0330.
UNDERSTANDING YOUR FUND’S EXPENSES
As a mutual fund shareholder you incur two types of costs: (1) transaction costs, and (2) ongoing costs, including management fees, distribution and/or service fees (12b-1 fees), and other Fund expenses. These costs are described in more detail in each Fund’s prospectus. The examples below are intended to help you understand the ongoing costs of investing in the Funds and help you compare these with the ongoing costs of investing in other mutual funds.
The first line in the table for each Class of Fund shares shows the actual amount of Fund expenses you would have paid on a $1,000 investment in the Fund from April 1, 2009 through September 30, 2009. It also shows how much a $1,000 investment would be worth at the close of the period, assuming actual Fund returns and expenses. To estimate the expenses you paid over the period, simply divide your account value by $1,000 (for example $8,600 account value divided by $1,000 = 8.6) and multiply the result by the number in the Expenses Paid During Period column as shown below for your Class.
The second line in the table for each Class of Fund shares provides information about hypothetical account values and hypothetical expenses based on the Fund’s actual expense ratios and an assumed rate of return of 5% per year before expenses, which is not the Fund’s actual return. The hypothetical account values and expenses may not be used to estimate the actual ending account balance or expenses you paid on your investment for the period. You may use this information to compare the ongoing costs of investing in the Fund and other funds. To do so, compare this 5% hypothetical example with the 5% hypothetical examples that appear in the shareholder reports of the other funds.
15
Loomis Sayles Bond Fund
| | | | | | |
Institutional Class | | Beginning
Account Value
4/1/2009 | | Ending
Account Value
9/30/2009 | | Expenses Paid
During Period*
4/1/2009 – 9/30/2009 |
Actual | | $1,000.00 | | $1,316.80 | | $3.72 |
Hypothetical (5% return before expenses) | | $1,000.00 | | $1,021.86 | | $3.24 |
| | | |
Retail Class | | | | | | |
Actual | | $1,000.00 | | $1,313.80 | | $5.51 |
Hypothetical (5% return before expenses) | | $1,000.00 | | $1,020.31 | | $4.81 |
| | | |
Admin Class | | | | | | |
Actual | | $1,000.00 | | $1,311.80 | | $6.95 |
Hypothetical (5% return before expenses) | | $1,000.00 | | $1,019.05 | | $6.07 |
* Expenses are equal to the Fund’s annualized expense ratio (after fee reduction/reimbursement): 0.64%, 0.95% and 1.20% for Institutional, Retail and Admin Class, respectively, multiplied by the average account value over the period, multiplied by the number of days in the most recent fiscal half-year, divided by 365 (to reflect the half-year period). |
Loomis Sayles Fixed Income Fund
| | | | | | |
Institutional Class | | Beginning
Account Value
4/1/2009 | | Ending
Account Value
9/30/2009 | | Expenses Paid
During Period*
4/1/2009 – 9/30/2009 |
Actual | | $1,000.00 | | $1,292.70 | | $3.33 |
Hypothetical (5% return before expenses) | | $1,000.00 | | $1,022.16 | | $2.94 |
* Expenses are equal to the Fund’s annualized expense ratio: 0.58%, multiplied by the average account value over the period, multiplied by the number of days in the most recent fiscal half-year, divided by 365 (to reflect the half-year period). |
Loomis Sayles Global Bond Fund
| | | | | | |
Institutional Class | | Beginning
Account Value
4/1/2009 | | Ending
Account Value
9/30/2009 | | Expenses Paid
During Period*
4/1/2009 – 9/30/2009 |
Actual | | $1,000.00 | | $1,250.90 | | $3.78 |
Hypothetical (5% return before expenses) | | $1,000.00 | | $1,021.71 | | $3.40 |
| | | |
Retail Class | | | | | | |
Actual | | $1,000.00 | | $1,249.50 | | $5.64 |
Hypothetical (5% return before expenses) | | $1,000.00 | | $1,020.05 | | $5.06 |
* Expenses are equal to the Fund’s annualized expense ratio (after fee reduction/reimbursement): 0.67%, and 1.00%, for the Institutional and Retail Class, respectively, multiplied by the average account value over the period, multiplied by the number of days in the most recent fiscal half-year, divided by 365 (to reflect the half-year period). |
Loomis Sayles Inflation Protected Securities Fund
| | | | | | |
Institutional Class | | Beginning
Account Value
4/1/2009 | | Ending
Account Value
9/30/2009 | | Expenses Paid
During Period*
4/1/2009 – 9/30/2009 |
Actual | | $1,000.00 | | $1,063.60 | | $2.07 |
Hypothetical (5% return before expenses) | | $1,000.00 | | $1,023.06 | | $2.03 |
* Expenses are equal to the Fund’s annualized expense ratio (after fee reduction/reimbursement): 0.40%, multiplied by the average account value over the period, multiplied by the number of days in the most recent fiscal half-year, divided by 365 (to reflect the half-year period). |
Loomis Sayles Institutional High Income Fund
| | | | | | |
Institutional Class | | Beginning
Account Value
4/1/2009 | | Ending
Account Value
9/30/2009 | | Expenses Paid
During Period*
4/1/2009 – 9/30/2009 |
Actual | | $1,000.00 | | $1,396.20 | | $4.26 |
Hypothetical (5% return before expenses) | | $1,000.00 | | $1,021.51 | | $3.60 |
* Expenses are equal to the Fund’s annualized expense ratio: 0.71%, multiplied by the average account value over the period, multiplied by the number of days in the most recent fiscal half-year, divided by 365 (to reflect the half-year period). |
16
Loomis Sayles Intermediate Duration Fixed Income Fund
| | | | | | |
Institutional Class | | Beginning
Account Value
4/1/2009 | | Ending
Account Value
9/30/2009 | | Expenses Paid
During Period*
4/1/2009 – 9/30/2009 |
Actual | | $1,000.00 | | $1,144.70 | | $2.15 |
Hypothetical (5% return before expenses) | | $1,000.00 | | $1,023.06 | | $2.03 |
* Expenses are equal to the Fund’s annualized expense ratio (after fee reduction/reimbursement): 0.40%, multiplied by the average account value over the period, multiplied by the number of days in the most recent fiscal half-year, divided by 365 (to reflect the half-year period). |
Loomis Sayles Investment Grade Fixed Income Fund
| | | | | | |
Institutional Class | | Beginning
Account Value
4/1/2009 | | Ending
Account Value
9/30/2009 | | Expenses Paid
During Period*
4/1/2009 – 9/30/2009 |
Actual | | $1,000.00 | | $1,234.90 | | $2.75 |
Hypothetical (5% return before expenses) | | $1,000.00 | | $1,022.61 | | $2.48 |
* Expenses are equal to the Fund’s annualized expense ratio: 0.49%, multiplied by the average account value over the period, multiplied by the number of days in the most recent fiscal half-year, divided by 365 (to reflect the half-year period). |
17
BOARD APPROVAL OF THE EXISTING ADVISORY AGREEMENTS
The Board of Trustees, including the Independent Trustees, considers matters bearing on each Fund’s advisory agreement (collectively, the “Agreements”) at most of its meetings throughout the year. Each year, usually in the spring, the Contract Review and Governance Committee of the Board meets to review the Agreements to determine whether to recommend that the full Board approve the continuation of the Agreements, typically for an additional one-year period. After the Committee has made its recommendation, the full Board, including the Independent Trustees, determines whether to approve the continuation of the Agreements.
In connection with these meetings, the Trustees receive materials that the Funds’ investment adviser (the “Adviser”) believes to be reasonably necessary for the Trustees to evaluate the Agreements. These materials generally include, among other items, (i) information on the investment performance of the Funds and the performance of peer groups of funds and the Funds’ performance benchmarks, (ii) information on the Funds’ advisory fees and other expenses, including information comparing the Funds’ expenses to those of peer groups of funds and information about any applicable expense caps and fee “breakpoints,” (iii) sales and redemption data in respect of the Funds, (iv) information about the profitability of the Agreements to the Funds’ Adviser and (v) information obtained through the completion of a questionnaire by the Adviser (the Trustees are consulted as to the information requested through that questionnaire). The Board of Trustees, including the Independent Trustees, also consider other matters such as (i) the Adviser’s financial results and financial condition, (ii) each Fund’s investment objective and strategies and the size, education and experience of the Adviser’s investment staff and its use of technology, external research and trading cost measurement tools, (iii) arrangements in respect of the distribution of the Funds’ shares and the related costs, (iv) the procedures employed to determine the value of the Funds’ assets, (v) the allocation of the Funds’ brokerage, if any, including, if applicable, allocations to brokers affiliated with the Adviser and the use of “soft” commission dollars to pay Fund expenses and to pay for research and other similar services, (vi) the resources devoted to, and the record of compliance with, the Funds’ investment policies and restrictions, policies on personal securities transactions and other compliance policies, (vii) information about amounts invested by the Funds’ portfolio managers in the Funds or in similar accounts that they manage and (viii) the general economic outlook with particular emphasis on the mutual fund industry. Throughout the process, the Trustees are afforded the opportunity to ask questions of and request additional materials from the Adviser.
In addition to the materials requested by the Trustees in connection with their annual consideration of the continuation of the Agreements, the Trustees receive materials in advance of each regular quarterly meeting of the Board of Trustees that provide detailed information about each Fund’s investment performance and the fees charged to the Funds for advisory and other services. This information generally includes, among other things, an internal performance rating for each Fund based on agreed-upon criteria, graphs showing each Fund’s performance and fee differentials against each Fund’s peer group of funds, performance ratings provided by a third-party, total return information for various periods, and third-party performance rankings for various periods comparing a Fund against its peer group. The portfolio management team for each Fund or other representatives of the Adviser make periodic presentations to the Contract Review and Governance Committee and/or the full Board of Trustees, and Funds identified as presenting possible performance concerns may be subject to more frequent board presentations and reviews. In addition, each quarter the Trustees are provided with detailed statistical information about each Fund’s portfolio.
The Board of Trustees most recently approved the continuation of the Agreements at their meeting held in June 2009. The Agreements were continued for a one-year period for the Funds. In considering whether to approve the continuation of the Agreements, the Board of Trustees, including the Independent Trustees, did not identify any single factor as determinative. Individual Trustees may have evaluated the information presented differently from one another, giving different weights to various factors. Matters considered by the Trustees, including the Independent Trustees, in connection with their approval of the Agreements included the factors listed below.
The nature, extent and quality of the services provided to the Funds under the Agreements. The Trustees considered the nature, extent and quality of the services provided by the Adviser and its affiliates to the Funds and the resources dedicated to the Funds by the Adviser and its affiliates, including recent or planned investments by the Adviser in additional personnel or other resources. They considered the need for the Adviser to offer competitive compensation in order to attract and retain capable personnel.
The Trustees considered not only the advisory services provided by the Adviser to the Funds, but also considered the administrative services provided by Natixis Advisors and its affiliates to the Funds.
For each Fund, the Trustees also considered the benefits to shareholders of investing in a mutual fund that is part of a family of funds that offers shareholders the right to exchange shares of one type of fund for shares of another type of fund, and provides a variety of fund and shareholder services.
After reviewing these and related factors, the Trustees concluded, within the context of their overall conclusions regarding each of the Agreements, that the nature, extent and quality of services provided supported the renewal of the Agreements.
18
Investment performance of the Funds and the Adviser. As noted above, the Trustees received information about the performance of the Funds over various time periods, including information which compared the performance of the Funds to the performance of peer groups of funds and the Funds’ respective performance benchmarks. In addition, the Trustees also reviewed data prepared by an independent third party which analyzed the performance of the Funds using a variety of performance metrics, including metrics which also measured the performance of the Funds on a risk adjusted basis.
With respect to each Fund, the Board concluded that the Fund’s performance or other relevant factors supported the renewal of the Agreement relating to that Fund. In the case of each Fund that had performance that lagged that of a relevant peer group for certain (although not necessarily all) periods, the Board concluded that other factors relevant to performance supported renewal of the Funds’ Agreements. These factors included one or more of the following: (1) that the underperformance was attributable, to a significant extent, to investment decisions (such as security selection or sector allocation) by the Fund’s Adviser that were reasonable and consistent with the Funds’ investment objective and policies, (2) that the Fund’s performance, although lagging in certain recent periods, was strong over the longer term and (3) that the Fund’s more recent performance was competitive when compared to relevant performance benchmarks.
The Trustees also considered the Adviser’s performance and reputation generally, the Funds’ performance as a fund family generally (as noted by certain financial publications), and the historical responsiveness of the Adviser to Trustee concerns about performance and the willingness of the Adviser to take steps intended to improve performance.
After reviewing these and related factors, the Trustees concluded, within the context of their overall conclusions regarding each of the Agreements, that the performance of the Funds and the Adviser supported the renewal of the Agreements.
The costs of the services to be provided and profits to be realized by the Adviser and its affiliates from their respective relationships with the Funds. The Trustees considered the fees charged to the Funds for advisory services as well as the total expense levels of the Funds. This information included comparisons (provided both by management and also by an independent third party) of the Funds’ advisory fees and total expense levels to those of their peer groups and information about the advisory fees charged by the Adviser to comparable accounts. In considering the fees charged to comparable accounts, the Trustees considered, among other things, management’s representations about the differences between managing mutual funds as compared to other types of accounts, including the additional resources required to effectively manage and the greater regulatory costs associated with the management of mutual fund assets. In evaluating each Fund’s advisory fee, the Trustees also took into account the demands, complexity and quality of the investment management of such Fund. The Trustees considered that over the past several years, management had made recommendations regarding reductions in advisory fee rates, implementation of advisory fee breakpoints and the institution of advisory fee waivers and expense caps for various Funds in the Fund family. They noted that all of the Loomis Sayles Funds in this report have expense caps in place, and they considered the amounts waived or reimbursed by the Adviser under these caps. The Trustees noted that while the Loomis Sayles Global Bond Fund’s advisory fee was above the median of a peer group of funds, the Fund had not yet reached asset levels at which recently added breakpoints would have an impact on fees and the Fund’s total expense ratio was below the median for its peer group of funds. The Trustees also considered the compensation directly or indirectly received by the Adviser and its affiliates from their relationships with the Funds. The Trustees reviewed information provided by management as to the profitability of the Adviser and its affiliates’ relationships with the Funds, and information about the allocation of expenses used to calculate profitability. They also reviewed information provided by management about the effect of distribution costs and changes in asset levels on Adviser profitability, including information regarding resources spent on distribution activities. When reviewing profitability, the Trustees also considered information about court cases in which adviser profitability was an issue, the performance of the relevant Funds, the expense levels of the Funds, and whether the Adviser had implemented breakpoints and/or expense caps with respect to such Funds. The Trustees also noted management’s history of proposing additional advisory fee breakpoints as the Loomis Sayles Bond Fund grew to substantially larger scale.
After reviewing these and related factors, the Trustees concluded, within the context of their overall conclusions regarding each of the Agreements, that the advisory fee charged to each of the Funds was fair and reasonable, and that the costs of these services generally and the related profitability of the Adviser and its affiliates in respect of their relationships with the Funds supported the renewal of the Agreements.
Economies of Scale. The Trustees considered the existence of any economies of scale in the provision of services by the Adviser and whether those economies are shared with the Funds through breakpoints in their investment advisory fees or other means, such as expense waivers or caps. The Trustees noted that two of the Loomis Sayles Funds in this report had breakpoints in their advisory fees and that each of the Funds was subject to an expense cap. In addition, for Loomis Sayles Bond Fund, the Trustees considered the additional breakpoints implemented in December 2007 and, for the Loomis Sayles Bond Fund and the Loomis Sayles Fixed Income Fund, the Trustees considered the effects of recent market volatility on the Funds’ assets and its possible effect on the Funds’ future profitability. In considering these issues, the Trustees also took note of the costs of the services provided (both on an absolute and a relative basis) and the profitability to the Adviser and its affiliates of their relationships with the Funds, as discussed above.
19
After reviewing these and related factors, the Trustees considered, within the context of their overall conclusions regarding each of the Agreements, that the extent to which economies of scale were shared with the Funds supported the renewal of the Agreements.
The Trustees also considered other factors, which included but were not limited to the following:
| • | | the effect of recent market and economic turmoil on the performance, asset levels and expense ratios of each Fund. |
| • | | whether each Fund has operated in accordance with its investment objective and the Fund’s record of compliance with its investment restrictions, and the compliance programs of the Funds and the Adviser. They also considered the compliance-related resources the Adviser and its affiliates were providing to the Funds. |
| • | | the nature, quality, cost and extent of administrative and shareholder services performed by the Adviser and its affiliates, both under the Agreements and under separate agreements covering administrative services. |
| • | | so-called “fallout benefits” to the Adviser, such as the engagement of affiliates of the Adviser to provide distribution, administrative and brokerage services to the Funds, and the benefits of research made available to the Adviser by reason of brokerage commissions generated by the Funds’ securities transactions. The Trustees also considered the fact that Natixis Advisors’ parent company benefits from the retention of affiliated Adviser. The Trustees considered the possible conflicts of interest associated with these fallout and other benefits, and the reporting, disclosure and other processes in place to disclose and monitor such possible conflicts of interest. |
| • | | the Trustees’ review and discussion of the Funds’ advisory arrangements in prior years, and management’s record of responding to Trustee concerns raised during the year and in prior years. |
Based on their evaluation of all factors that they deemed to be material, including those factors described above, and assisted by the advice of independent counsel, the Trustees, including the Independent Trustees, concluded that each of the existing Agreements should be continued through June 30, 2010.
20
PORTFOLIO OF INVESTMENTS – as of September 30, 2009
Loomis Sayles Bond Fund
| | | | | | | | |
| | | | | Principal Amount (‡) | | Value (†) |
| | | | | | | | |
| BONDS AND NOTES – 90.6% of Net Assets | | | | | | | | |
| | | |
| NON-CONVERTIBLE BONDS – 85.1% | | | | | | | | |
| | | |
| ABS Credit Card – 0.6% | | | | | | | | |
Citibank Credit Card Issuance Trust, Series 2008-C6, Class C6, 6.300%, 6/20/2014 | | | | $ | 113,710,000 | | $ | 117,629,254 |
MBNA Credit Card Master Note Trust, Series 03A5, 4.150%, 9/19/2012 | | EUR | | | 300,000 | | | 441,367 |
| | | | | | | | |
| | | | | | | | 118,070,621 |
| | | | | | | | |
| Aerospace & Defense – 0.1% | | | | | | | | |
Bombardier, Inc., 6.300%, 5/01/2014, 144A | | | | | 1,590,000 | | | 1,534,350 |
Bombardier, Inc., 6.750%, 5/01/2012, 144A | | | | | 200,000 | | | 201,000 |
Bombardier, Inc., 7.350%, 12/22/2026 | | CAD | | | 6,785,000 | | | 5,695,369 |
Bombardier, Inc., 7.450%, 5/01/2034, 144A | | | | | 13,464,000 | | | 11,747,340 |
| | | | | | | | |
| | | | | | | | 19,178,059 |
| | | | | | | | |
| Airlines – 1.4% | | | | | | | | |
American Airlines, Inc., Pass Through Trust, Series 1999-1, Class B, 7.324%, 4/15/2011 | | | | | 1,255,000 | | | 1,251,862 |
American Airlines, Inc., Pass Through Trust, Series 2009-1A, 10.375%, 7/02/2019 | | | | | 3,425,000 | | | 3,621,698 |
American Airlines, Inc., Pass Through Trust, Series 93A6, 8.040%, 9/16/2011 | | | | | 978,168 | | | 641,923 |
Continental Airlines, Inc., 9.000%, 7/08/2016 | | | | | 25,437,000 | | | 26,934,222 |
Continental Airlines, Inc., Series 1996-A, Class B, 6.940%, 4/15/2015 | | | | | 254,073 | | | 238,829 |
Continental Airlines, Inc., Series 1997-1, Class A, 7.461%, 10/01/2016 | | | | | 10,306,381 | | | 9,610,701 |
Continental Airlines, Inc., Series 1997-4, Class B, 6.900%, 7/02/2018 | | | | | 3,687,200 | | | 3,244,736 |
Continental Airlines, Inc., Series 1998-1, Class B, 6.748%, 9/15/2018 | | | | | 5,448,217 | | | 4,685,467 |
Continental Airlines, Inc., Series 1999-1, Class B, 6.795%, 2/02/2020 | | | | | 12,755,121 | | | 11,033,179 |
Continental Airlines, Inc., Series 1999-2, Class B, 7.566%, 9/15/2021 | | | | | 3,283,355 | | | 2,856,519 |
Continental Airlines, Inc., Series 2000-1, Class A-1, 8.048%, 11/01/2020 | | | | | 966,935 | | | 918,588 |
Continental Airlines, Inc., Series 2000-2, Class A-1, 7.707%, 10/02/2022 | | | | | 2,516,053 | | | 2,339,929 |
Continental Airlines, Inc., Series 2000-2, Class B, 8.307%, 10/02/2019 | | | | | 7,235,643 | | | 6,367,366 |
Continental Airlines, Inc., Series 2001-1, Class A-1, 6.703%, 12/15/2022 | | | | | 2,658,938 | | | 2,455,822 |
Continental Airlines, Inc., Series 2001-1, Class B, 7.373%, 6/15/2017 | | | | | 3,441,951 | | | 2,856,820 |
Continental Airlines, Inc., Series 2007-1, Class A, 5.983%, 4/19/2022 | | | | | 17,701,000 | | | 16,727,445 |
Continental Airlines, Inc., Series 2007-1, Class B, 6.903%, 4/19/2022 | | | | | 23,877,000 | | | 20,534,220 |
Delta Air Lines, Inc., 9.500%, 9/15/2014, 144A | | | | | 3,145,000 | | | 3,145,000 |
Delta Air Lines, Inc., Series 2007-1, Class A, 6.821%, 2/10/2024 | | | | | 3,228,298 | | | 2,986,176 |
Delta Air Lines, Inc., Series 2007-1, Class B, 8.021%, 2/10/2024 | | | | | 5,271,533 | | | 4,164,511 |
See accompanying notes to financial statements.
21
| | | | | | | | |
| | | | | Principal Amount (‡) | | Value (†) |
| | | | | | | | |
| BONDS AND NOTES – continued | | | | | | | | |
| | | |
| Airlines – continued | | | | | | | | |
Delta Air Lines, Inc., Series 2007-1, Class C, 8.954%, 8/10/2014 | | | | $ | 39,864,034 | | $ | 32,469,256 |
Northwest Airlines, Inc., Series 2007-1, Class B, 8.028%, 11/01/2017 | | | | | 34,841,931 | | | 25,849,577 |
Qantas Airways Ltd., 5.125%, 6/20/2013, 144A | | | | | 2,000,000 | | | 1,999,650 |
Qantas Airways Ltd., 6.050%, 4/15/2016, 144A | | | | | 44,235,000 | | | 43,501,672 |
United Air Lines, Inc., Series 2007-1, Class A,
6.636%, 1/02/2024 | | | | | 25,004,599 | | | 20,753,817 |
| | | | | | | | |
| | | | | | | | 251,188,985 |
| | | | | | | | |
| Automotive – 2.9% | | | | | | | | |
Cummins, Inc., 6.750%, 2/15/2027 | | | | | 2,547,000 | | | 2,250,651 |
Cummins, Inc., 7.125%, 3/01/2028 | | | | | 3,000,000 | | | 2,842,500 |
FCE Bank PLC, EMTN, 4.625%, 10/25/2010 | | NOK | | | 4,570,000 | | | 727,896 |
FCE Bank PLC, EMTN, 7.125%, 1/16/2012 | | EUR | | | 9,800,000 | | | 13,623,779 |
FCE Bank PLC, EMTN, 7.125%, 1/15/2013 | | EUR | | | 6,550,000 | | | 8,866,066 |
FCE Bank PLC, EMTN, 7.875%, 2/15/2011 | | GBP | | | 8,550,000 | | | 13,390,909 |
Ford Motor Co., 6.375%, 2/01/2029 | | | | | 1,195,000 | | | 860,400 |
Ford Motor Co., 6.500%, 8/01/2018 | | | | | 2,240,000 | | | 1,783,600 |
Ford Motor Co., 6.625%, 2/15/2028 | | | | | 500,000 | | | 360,000 |
Ford Motor Co., 6.625%, 10/01/2028 | | | | | 62,435,000 | | | 44,953,200 |
Ford Motor Co., 7.125%, 11/15/2025 | | | | | 1,960,000 | | | 1,470,000 |
Ford Motor Co., 7.450%, 7/16/2031 | | | | | 114,780,000 | | | 92,971,800 |
Ford Motor Co., 7.500%, 8/01/2026 | | | | | 795,000 | | | 580,350 |
Ford Motor Credit Co. LLC, 7.000%, 10/01/2013 | | | | | 13,765,000 | | | 12,920,022 |
Ford Motor Credit Co. LLC, 7.250%, 10/25/2011 | | | | | 31,140,000 | | | 30,243,448 |
Ford Motor Credit Co. LLC, 7.500%, 8/01/2012 | | | | | 8,785,000 | | | 8,435,067 |
Ford Motor Credit Co. LLC, 7.875%, 6/15/2010 | | | | | 1,320,000 | | | 1,325,784 |
Ford Motor Credit Co. LLC, 8.000%, 6/01/2014 | | | | | 70,695,000 | | | 67,937,683 |
Ford Motor Credit Co. LLC, 8.000%, 12/15/2016 | | | | | 19,570,000 | | | 18,156,381 |
Ford Motor Credit Co. LLC, 8.625%, 11/01/2010 | | | | | 29,945,000 | | | 30,292,063 |
Ford Motor Credit Co. LLC, 8.700%, 10/01/2014 | | | | | 152,395,000 | | | 149,278,675 |
Ford Motor Credit Co. LLC, 9.750%, 9/15/2010 | | | | | 2,150,000 | | | 2,197,061 |
Ford Motor Credit Co. LLC, EMTN, 4.875%, 1/15/2010 | | EUR | | | 12,200,000 | | | 17,718,961 |
Goodyear Tire & Rubber Co. (The), 7.000%, 3/15/2028 | | | | | 6,041,000 | | | 5,255,670 |
Goodyear Tire & Rubber Co. (The), 10.500%, 5/15/2016 | | | | | 14,150,000 | | | 15,352,750 |
| | | | | | | | |
| | | | | | | | 543,794,716 |
| | | | | | | | |
| Banking – 6.7% | | | | | | | | |
AgriBank FCB, 9.125%, 7/15/2019(c) | | | | | 100,540,000 | | | 108,735,418 |
Associates Corp. of North America, 6.950%, 11/01/2018 | | | | | 33,073,000 | | | 32,357,697 |
BAC Capital Trust VI, 5.625%, 3/08/2035 | | | | | 35,170,000 | | | 27,270,466 |
Bank of America Corp., 5.750%, 12/01/2017 | | | | | 18,695,000 | | | 18,660,919 |
Bank of America Corp., 6.000%, 9/01/2017 | | | | | 7,290,000 | | | 7,375,534 |
Barclays Financial LLC, 4.060%, 9/16/2010, 144A | | KRW | | | 38,510,000,000 | | | 32,997,832 |
Barclays Financial LLC, 4.160%, 2/22/2010, 144A | | THB | | | 2,824,000,000 | | | 85,751,212 |
Barclays Financial LLC, 4.460%, 9/23/2010, 144A | | KRW | | | 48,070,000,000 | | | 41,336,324 |
Barclays Financial LLC, EMTN, 4.100%, 3/22/2010, 144A | | THB | | | 247,000,000 | | | 7,515,720 |
See accompanying notes to financial statements.
22
PORTFOLIO OF INVESTMENTS – as of September 30, 2009
Loomis Sayles Bond Fund – continued
| | | | | | | | |
| | | | | Principal Amount (‡) | | Value (†) |
| | | | | | | | |
| BONDS AND NOTES – continued | | | | | | | | |
| | | |
| Banking – continued | | | | | | | | |
Bear Stearns Cos., Inc. (The), 4.650%, 7/02/2018 | | | | $ | 3,260,000 | | $ | 3,110,829 |
Bear Stearns Cos., Inc. (The), 5.300%, 10/30/2015 | | | | | 1,445,000 | | | 1,525,728 |
Bear Stearns Cos., Inc. (The), 6.400%, 10/02/2017 | | | | | 3,160,000 | | | 3,437,666 |
Bear Stearns Cos., Inc. (The), 7.250%, 2/01/2018 | | | | | 18,135,000 | | | 20,710,932 |
BNP Paribas SA, EMTN, Zero Coupon, 6/13/2011, 144A | | IDR | | | 274,980,870,000 | | | 23,995,744 |
Capital One Financial Corp., 6.150%, 9/01/2016 | | | | | 3,223,000 | | | 3,164,967 |
Citigroup, Inc., 5.000%, 9/15/2014 | | | | | 66,710,000 | | | 63,480,235 |
Citigroup, Inc., 5.850%, 12/11/2034 | | | | | 4,495,000 | | | 3,858,319 |
Citigroup, Inc., 5.875%, 2/22/2033 | | | | | 30,435,000 | | | 25,225,411 |
Citigroup, Inc., 5.875%, 5/29/2037 | | | | | 6,180,000 | | | 5,388,361 |
Citigroup, Inc., 6.000%, 10/31/2033 | | | | | 15,880,000 | | | 13,288,813 |
Citigroup, Inc., 6.125%, 5/15/2018 | | | | | 43,650,000 | | | 42,979,667 |
Citigroup, Inc., 6.125%, 8/25/2036 | | | | | 2,625,000 | | | 2,252,780 |
Citigroup, Inc., 6.375%, 8/12/2014 | | | | | 72,120,000 | | | 74,564,147 |
Citigroup, Inc., MTN, 5.500%, 10/15/2014 | | | | | 87,000,000 | | | 86,874,285 |
Goldman Sachs Group, Inc. (The), 6.150%, 4/01/2018 | | | | | 4,065,000 | | | 4,276,026 |
Goldman Sachs Group, Inc. (The), 6.750%, 10/01/2037 | | | | | 55,075,000 | | | 56,839,107 |
ICICI Bank Ltd., (fixed rate to 4/30/2017, variable rate thereafter), 6.375%, 4/30/2022, 144A | | | | | 12,345,000 | | | 10,098,346 |
JPMorgan Chase & Co., EMTN, Zero Coupon, 3/28/2011 | | IDR | | | 748,342,518,000 | | | 67,230,813 |
JPMorgan Chase & Co., Zero Coupon, 3/28/2011, 144A | | IDR | | | 250,225,920,000 | | | 22,480,203 |
JPMorgan Chase & Co., Zero Coupon, 4/12/2012, 144A | | IDR | | | 599,419,948,660 | | | 48,493,167 |
JPMorgan Chase & Co., Zero Coupon, 5/17/2010, 144A | | BRL | | | 241,667,000 | | | 128,472,556 |
JPMorgan Chase London, EMTN, Zero Coupon, 10/21/2010, 144A | | IDR | | | 153,708,294,250 | | | 14,612,228 |
Kreditanstalt fuer Wiederaufbau, EMTN, 10.750%, 2/01/2010 | | ISK | | | 95,000,000 | | | 623,936 |
Merrill Lynch & Co., Inc., 6.110%, 1/29/2037 | | | | | 6,110,000 | | | 5,811,575 |
Merrill Lynch & Co., Inc., 10.710%, 3/08/2017 | | BRL | | | 100,400,000 | | | 55,362,813 |
Merrill Lynch & Co., Inc., EMTN, 4.625%, 9/14/2018 | | EUR | | | 4,887,000 | | | 6,182,545 |
Merrill Lynch & Co., Inc., MTN, 6.875%, 4/25/2018 | | | | | 8,660,000 | | | 9,107,696 |
Merrill Lynch & Co., Inc., Series C, MTN, 6.050%, 6/01/2034 | | | | | 3,600,000 | | | 3,361,504 |
Merrill Lynch & Co., Inc., Series C, MTN, 6.400%, 8/28/2017 | | | | | 3,605,000 | | | 3,651,014 |
Morgan Stanley, 4.750%, 4/01/2014 | | | | | 38,951,000 | | | 38,663,542 |
Morgan Stanley, 7.300%, 5/13/2019 | | | | | 9,600,000 | | | 10,562,630 |
Morgan Stanley, GMTN, 5.125%, 11/30/2015 | | GBP | | | 7,500,000 | | | 11,799,259 |
Morgan Stanley, Series F, GMTN, 6.625%, 4/01/2018 | | | | | 11,700,000 | | | 12,371,849 |
Morgan Stanley, Series F, MTN, 5.550%, 4/27/2017 | | | | | 4,400,000 | | | 4,383,315 |
Morgan Stanley, Series F, MTN, 5.950%, 12/28/2017 | | | | | 7,795,000 | | | 7,936,432 |
| | | | | | | | |
| | | | | | | | 1,258,179,562 |
| | | | | | | | |
See accompanying notes to financial statements.
23
| | | | | | | | |
| | | | | Principal Amount (‡) | | Value (†) |
| | | | | | | | |
| BONDS AND NOTES – continued | | | | | | | | |
| | | |
| Brokerage – 0.0% | | | | | | | | |
Jefferies Group, Inc., 8.500%, 7/15/2019 | | | | $ | 5,915,000 | | $ | 6,260,247 |
| | | | | | | | |
| Building Materials – 0.8% | | | | | | | | |
Masco Corp., 0.600%, 3/12/2010(b) | | | | | 9,360,000 | | | 9,211,317 |
Masco Corp., 4.800%, 6/15/2015 | | | | | 4,805,000 | | | 4,409,448 |
Masco Corp., 5.850%, 3/15/2017 | | | | | 3,285,000 | | | 3,029,581 |
Masco Corp., 6.125%, 10/03/2016 | | | | | 19,873,000 | | | 18,837,398 |
Masco Corp., 6.500%, 8/15/2032 | | | | | 2,650,000 | | | 2,144,160 |
Owens Corning, Inc., 6.500%, 12/01/2016 | | | | | 26,195,000 | | | 25,558,252 |
Owens Corning, Inc., 7.000%, 12/01/2036 | | | | | 51,180,000 | | | 41,936,073 |
USG Corp., 6.300%, 11/15/2016 | | | | | 35,370,000 | | | 30,064,500 |
USG Corp., 9.500%, 1/15/2018 | | | | | 17,605,000 | | | 16,988,825 |
| | | | | | | | |
| | | | | | | | 152,179,554 |
| | | | | | | | |
| Chemicals – 0.7% | | | | | | | | |
Borden, Inc., 7.875%, 2/15/2023 | | | | | 30,054,000 | | | 16,830,240 |
Borden, Inc., 8.375%, 4/15/2016 | | | | | 2,886,000 | | | 1,904,760 |
Borden, Inc., 9.200%, 3/15/2021 | | | | | 11,305,000 | | | 7,009,100 |
Chevron Phillips Chemical Co. LLC, 8.250%, 6/15/2019, 144A | | | | | 51,205,000 | | | 61,840,944 |
Hercules, Inc., 6.500%, 6/30/2029 | | | | | 19,619,000 | | | 10,913,069 |
Hexion US Finance Corp./Hexion Nova Scotia Finance ULC, 9.750%, 11/15/2014 | | | | | 2,450,000 | | | 2,107,000 |
Methanex Corp., 6.000%, 8/15/2015 | | | | | 10,565,000 | | | 8,977,323 |
Mosaic Global Holdings, Inc., 7.300%, 1/15/2028 | | | | | 9,415,000 | | | 9,416,309 |
Mosaic Global Holdings, Inc., 7.375%, 8/01/2018 | | | | | 9,095,000 | | | 9,805,920 |
| | | | | | | | |
| | | | | | | | 128,804,665 |
| | | | | | | | |
| Construction Machinery – 0.7% | | | | | | | | |
Case New Holland, Inc., 7.750%, 9/01/2013, 144A | | | | | 72,540,000 | | | 72,177,300 |
Caterpillar Financial Services Corp., MTN,
6.125%, 2/17/2014 | | | | | 12,240,000 | | | 13,418,920 |
Joy Global, Inc., 6.625%, 11/15/2036 | | | | | 1,975,000 | | | 1,840,252 |
RSC Equipment Rental, Inc., 9.500%, 12/01/2014 | | | | | 2,345,000 | | | 2,262,925 |
Toro Co., 6.625%, 5/01/2037(c) | | | | | 27,030,000 | | | 21,546,991 |
United Rentals North America, Inc.,
7.000%, 2/15/2014 | | | | | 26,139,000 | | | 22,740,930 |
United Rentals North America, Inc.,
7.750%, 11/15/2013 | | | | | 2,335,000 | | | 2,101,500 |
| | | | | | | | |
| | | | | | | | 136,088,818 |
| | | | | | | | |
| Consumer Cyclical Services – 0.8% | | | | | | | | |
Western Union Co. (The), 6.200%, 11/17/2036 | | | | | 154,180,000 | | | 154,772,360 |
| | | | | | | | |
| Consumer Products – 0.2% | | | | | | | | |
Snap-on, Inc., 6.700%, 3/01/2019 | | | | | 7,210,000 | | | 7,955,233 |
Whirlpool Corp., MTN, 8.000%, 5/01/2012 | | | | | 14,465,000 | | | 15,613,550 |
Whirlpool Corp., MTN, 8.600%, 5/01/2014 | | | | | 8,680,000 | | | 9,709,665 |
| | | | | | | | |
| | | | | | | | 33,278,448 |
| | | | | | | | |
| Distributors – 0.0% | | | | | | | | |
EQT Corp., 8.125%, 6/01/2019 | | | | | 1,775,000 | | | 2,025,932 |
ONEOK, Inc., 6.000%, 6/15/2035 | | | | | 3,805,000 | | | 3,756,022 |
| | | | | | | | |
| | | | | | | | 5,781,954 |
| | | | | | | | |
See accompanying notes to financial statements.
24
PORTFOLIO OF INVESTMENTS – as of September 30, 2009
Loomis Sayles Bond Fund – continued
| | | | | | | | |
| | | | | Principal Amount (‡) | | Value (†) |
| | | | | | | | |
| BONDS AND NOTES – continued | | | | | | | | |
| | | |
| Diversified Manufacturing – 0.7% | | | | | | | | |
Textron Financial Corp., 5.400%, 4/28/2013 | | | | $ | 1,435,000 | | $ | 1,409,024 |
Textron Financial Corp., Series E, MTN, 5.125%, 8/15/2014 | | | | | 550,000 | | | 512,143 |
Textron, Inc., 3.875%, 3/11/2013 | | EUR | | | 14,050,000 | | | 18,984,536 |
Textron, Inc., 5.600%, 12/01/2017 | | | | | 5,940,000 | | | 5,531,007 |
Textron, Inc., 6.200%, 3/15/2015 | | | | | 45,180,000 | | | 45,358,868 |
Textron, Inc., 7.250%, 10/01/2019 | | | | | 30,490,000 | | | 30,896,676 |
Textron, Inc., EMTN, 6.625%, 4/07/2020 | | GBP | | | 23,088,000 | | | 30,625,436 |
| | | | | | | | |
| | | | | | | | 133,317,690 |
| | | | | | | | |
| Electric – 2.8% | | | | | | | | |
AES Corp. (The), 7.750%, 3/01/2014 | | | | | 4,875,000 | | | 4,911,563 |
AES Corp. (The), 8.375%, 3/01/2011(c) | | GBP | | | 2,090,000 | | | 3,373,538 |
AES Ironwood LLC, 8.857%, 11/30/2025 | | | | | 13,169,381 | | | 12,082,907 |
AES Red Oak LLC, Series A, 8.540%, 11/30/2019 | | | | | 1,606,999 | | | 1,514,596 |
Bruce Mansfield Unit, 6.850%, 6/01/2034(c) | | | | | 95,219,290 | | | 92,989,254 |
CE Generation LLC, 7.416%, 12/15/2018 | | | | | 5,129,078 | | | 4,986,135 |
Cleveland Electric Illuminating Co. (The), 5.950%, 12/15/2036 | | | | | 64,200,000 | | | 62,104,512 |
Commonwealth Edison Co.,
4.750%, 12/01/2011(c) | | | | | 201,000 | | | 200,696 |
Dynegy Holdings, Inc., 7.125%, 5/15/2018 | | | | | 5,295,000 | | | 4,077,150 |
Dynegy Holdings, Inc., 7.625%, 10/15/2026 | | | | | 11,835,000 | | | 8,106,975 |
Dynegy Holdings, Inc., 7.750%, 6/01/2019 | | | | | 1,504,000 | | | 1,282,160 |
Dynegy Holdings, Inc., 8.375%, 5/01/2016 | | | | | 2,000,000 | | | 1,870,000 |
Edison Mission Energy, 7.625%, 5/15/2027 | | | | | 23,200,000 | | | 16,588,000 |
Empresa Nacional de Electricidad SA (Endesa-Chile), 7.875%, 2/01/2027 | | | | | 11,581,000 | | | 12,836,438 |
Enersis SA, 7.400%, 12/01/2016 | | | | | 4,250,000 | | | 4,746,145 |
Illinois Power Co., 6.250%, 4/01/2018 | | | | | 3,105,000 | | | 3,335,478 |
ITC Holdings Corp., 5.875%, 9/30/2016, 144A | | | | | 25,460,000 | | | 25,994,074 |
ITC Holdings Corp., 6.375%, 9/30/2036, 144A | | | | | 37,955,000 | | | 36,201,897 |
NGC Corp. Capital Trust I, Series B, 8.316%, 6/01/2027 | | | | | 23,775,000 | | | 10,698,750 |
NiSource Finance Corp., 5.400%, 7/15/2014 | | | | | 2,230,000 | | | 2,266,166 |
NiSource Finance Corp., 6.400%, 3/15/2018 | | | | | 57,010,000 | | | 56,903,733 |
NiSource Finance Corp., 6.800%, 1/15/2019 | | | | | 1,235,000 | | | 1,264,412 |
Power Receivables Finance LLC, 6.290%, 1/01/2012, 144A | | | | | 1,389,880 | | | 1,418,914 |
Quezon Power Philippines Co., 8.860%, 6/15/2017 | | | | | 5,473,125 | | | 5,117,372 |
Salton Sea Funding Corp., Series E, 8.300%, 5/30/2011 | | | | | 1,302,006 | | | 1,366,312 |
Salton Sea Funding Corp., Series F, 7.475%, 11/30/2018 | | | | | 213,027 | | | 230,904 |
Southern California Edison Co., 7.625%, 1/15/2010 | | | | | 2,000,000 | | | 2,037,568 |
SP Powerassets Ltd., EMTN, 3.730%, 10/22/2010 | | SGD | | | 1,000,000 | | | 721,673 |
Toledo Edison Co., 6.150%, 5/15/2037 | | | | | 13,195,000 | | | 13,771,925 |
TXU Corp., Series P, 5.550%, 11/15/2014 | | | | | 62,501,000 | | | 42,653,620 |
TXU Corp., Series Q, 6.500%, 11/15/2024 | | | | | 139,736,000 | | | 64,630,695 |
TXU Corp., Series R, 6.550%, 11/15/2034 | | | | | 8,271,000 | | | 3,720,395 |
White Pine Hydro LLC, 6.310%, 7/10/2017(c) | | | | | 9,175,000 | | | 7,912,731 |
White Pine Hydro LLC, 6.960%, 7/10/2037(c) | | | | | 14,695,000 | | | 10,722,765 |
White Pine Hydro Portfolio LLC, 7.260%, 7/20/2015(c) | | | | | 5,000,000 | | | 4,403,665 |
| | | | | | | | |
| | | | | | | | 527,043,118 |
| | | | | | | | |
See accompanying notes to financial statements.
25
| | | | | | | | |
| | | | | Principal Amount (‡) | | Value (†) |
| | | | | | | | |
| BONDS AND NOTES – continued | | | | | | | | |
| | | |
| Entertainment – 0.2% | | | | | | | | |
Time Warner, Inc., 6.625%, 5/15/2029 | | | | $ | 15,000 | | $ | 15,391 |
Time Warner, Inc., 7.625%, 4/15/2031 | | | | | 10,000 | | | 11,208 |
Viacom, Inc., Class B, 6.875%, 4/30/2036 | | | | | 37,871,000 | | | 40,006,735 |
| | | | | | | | |
| | | | | | | | 40,033,334 |
| | | | | | | | |
| Financial Other – 0.2% | | | | | | | | |
National Life Insurance Co.,
10.500%, 9/15/2039, 144A | | | | | 38,476,000 | | | 39,184,728 |
| | | | | | | | |
| Food & Beverage – 1.0% | | | | | | | | |
Anheuser-Busch Cos., Inc.,
5.375%, 11/15/2014, 144A | | | | | 71,140,000 | | | 75,905,669 |
Anheuser-Busch Cos., Inc., 6.450%, 9/01/2037 | | | | | 55,000 | | | 59,910 |
Anheuser-Busch Cos., Inc., 6.500%, 5/01/2042 | | | | | 15,000 | | | 16,226 |
ARAMARK Corp., 5.000%, 6/01/2012 | | | | | 2,115,000 | | | 1,998,675 |
Corn Products International, Inc., 6.625%, 4/15/2037 | | | | | 31,590,000 | | | 31,889,473 |
Kraft Foods, Inc., 6.500%, 8/11/2017 | | | | | 11,947,000 | | | 12,923,643 |
Kraft Foods, Inc., 6.500%, 11/01/2031 | | | | | 14,990,000 | | | 15,599,628 |
Kraft Foods, Inc., 7.000%, 8/11/2037 | | | | | 32,845,000 | | | 36,588,049 |
Sara Lee Corp., 6.125%, 11/01/2032 | | | | | 18,615,000 | | | 18,949,419 |
| | | | | | | | |
| | | | | | | | 193,930,692 |
| | | | | | | | |
| Government Owned – No Guarantee – 0.1% | | | | | | |
DP World Ltd., 6.850%, 7/02/2037, 144A | | | | | 24,685,000 | | | 21,710,186 |
| | | | | | | | |
| Government Sponsored – 0.3% | | | | | | | | |
Queensland Treasury Corp.,
7.125%, 9/18/2017, 144A | | NZD | | | 84,345,000 | | | 62,876,545 |
| | | | | | | | |
| Health Insurance – 1.3% | | | | | | | | |
CIGNA Corp., 6.150%, 11/15/2036 | | | | | 20,530,000 | | | 18,192,660 |
CIGNA Corp., 6.350%, 3/15/2018 | | | | | 2,500,000 | | | 2,506,790 |
Unum Group, 7.125%, 9/30/2016 | | | | | 9,965,000 | | | 10,082,547 |
WellPoint, Inc., 6.375%, 6/15/2037 | | | | | 191,190,000 | | | 207,627,369 |
| | | | | | | | |
| | | | | | | | 238,409,366 |
| | | | | | | | |
| Healthcare – 3.5% | | | | | | | | |
Boston Scientific Corp., 5.450%, 6/15/2014 | | | | | 3,725,000 | | | 3,734,313 |
Boston Scientific Corp., 6.400%, 6/15/2016 | | | | | 14,330,000 | | | 14,527,038 |
Boston Scientific Corp., 7.000%, 11/15/2035 | | | | | 22,142,000 | | | 20,287,608 |
HCA, Inc., 5.750%, 3/15/2014 | | | | | 13,400,000 | | | 11,825,500 |
HCA, Inc., 6.250%, 2/15/2013 | | | | | 7,800,000 | | | 7,449,000 |
HCA, Inc., 6.300%, 10/01/2012 | | | | | 2,500,000 | | | 2,400,000 |
HCA, Inc., 6.375%, 1/15/2015 | | | | | 17,380,000 | | | 15,468,200 |
HCA, Inc., 6.500%, 2/15/2016 | | | | | 63,735,000 | | | 56,564,812 |
HCA, Inc., 6.750%, 7/15/2013 | | | | | 3,045,000 | | | 2,915,588 |
HCA, Inc., 7.050%, 12/01/2027 | | | | | 26,685,000 | | | 20,238,464 |
HCA, Inc., 7.190%, 11/15/2015 | | | | | 20,005,000 | | | 18,529,491 |
HCA, Inc., 7.500%, 12/15/2023 | | | | | 25,974,000 | | | 20,967,979 |
HCA, Inc., 7.500%, 11/06/2033 | | | | | 19,870,000 | | | 15,374,949 |
HCA, Inc., 7.690%, 6/15/2025 | | | | | 65,788,000 | | | 53,423,474 |
HCA, Inc., 8.360%, 4/15/2024 | | | | | 41,434,000 | | | 33,716,420 |
HCA, Inc., MTN, 7.580%, 9/15/2025 | | | | | 18,303,000 | | | 14,807,877 |
HCA, Inc., MTN, 7.750%, 7/15/2036 | | | | | 11,606,000 | | | 9,096,725 |
See accompanying notes to financial statements.
26
PORTFOLIO OF INVESTMENTS – as of September 30, 2009
Loomis Sayles Bond Fund – continued
| | | | | | | | |
| | | | | Principal Amount (‡) | | Value (†) |
| | | | | | | | |
| | | |
| BONDS AND NOTES – continued | | | | | | | | |
| | | |
| Healthcare – continued | | | | | | | | |
Hospira, Inc., 6.050%, 3/30/2017 | | | | $ | 15,175,000 | | $ | 15,890,881 |
Medco Health Solutions, Inc., 7.125%, 3/15/2018 | | | | | 250,270,000 | | | 283,580,436 |
Owens & Minor, Inc., 6.350%, 4/15/2016(c) | | | | | 4,710,000 | | | 4,246,616 |
Tenet Healthcare Corp., 6.875%, 11/15/2031 | | | | | 30,578,000 | | | 23,850,840 |
Tenet Healthcare Corp., 7.375%, 2/01/2013 | | | | | 2,236,000 | | | 2,213,640 |
Tenet Healthcare Corp., 9.250%, 2/01/2015 | | | | | 560,000 | | | 584,500 |
| | | | | | | | |
| | | | | | | | 651,694,351 |
| | | | | | | | |
| Home Construction – 1.5% | | | | | | | | |
Centex Corp., 5.250%, 6/15/2015 | | | | | 5,180,000 | | | 5,115,250 |
D.R. Horton, Inc., 5.250%, 2/15/2015 | | | | | 70,965,000 | | | 66,174,862 |
D.R. Horton, Inc., 5.625%, 9/15/2014 | | | | | 7,235,000 | | | 6,981,775 |
D.R. Horton, Inc., 5.625%, 1/15/2016 | | | | | 26,345,000 | | | 24,632,575 |
D.R. Horton, Inc., 6.500%, 4/15/2016 | | | | | 1,975,000 | | | 1,942,906 |
K. Hovnanian Enterprises, Inc., 6.250%, 1/15/2015 | | | | | 6,430,000 | | | 4,886,800 |
K. Hovnanian Enterprises, Inc., 6.250%, 1/15/2016 | | | | | 19,270,000 | | | 14,452,500 |
K. Hovnanian Enterprises, Inc., 6.375%, 12/15/2014 | | | | | 6,249,000 | | | 4,749,240 |
K. Hovnanian Enterprises, Inc., 6.500%, 1/15/2014 | | | | | 4,050,000 | | | 3,159,000 |
K. Hovnanian Enterprises, Inc., 7.500%, 5/15/2016 | | | | | 1,650,000 | | | 1,254,000 |
K. Hovnanian Enterprises, Inc., 7.750%, 5/15/2013 | | | | | 2,865,000 | | | 2,206,050 |
K. Hovnanian Enterprises, Inc., 8.875%, 4/01/2012 | | | | | 1,690,000 | | | 1,419,600 |
KB Home, 5.875%, 1/15/2015 | | | | | 895,000 | | | 843,538 |
Lennar Corp., Series B, 5.125%, 10/01/2010 | | | | | 3,495,000 | | | 3,486,263 |
Lennar Corp., Series B, 5.500%, 9/01/2014 | | | | | 22,940,000 | | | 21,448,900 |
Lennar Corp., Series B, 5.600%, 5/31/2015 | | | | | 9,282,000 | | | 8,562,645 |
Lennar Corp., Series B, 6.500%, 4/15/2016 | | | | | 40,845,000 | | | 38,394,300 |
Pulte Homes, Inc., 5.200%, 2/15/2015 | | | | | 6,800,000 | | | 6,460,000 |
Pulte Homes, Inc., 6.000%, 2/15/2035 | | | | | 63,855,000 | | | 48,210,525 |
Pulte Homes, Inc., 6.375%, 5/15/2033 | | | | | 17,240,000 | | | 13,274,800 |
Toll Brothers Finance Corp., 5.150%, 5/15/2015 | | | | | 8,100,000 | | | 7,788,992 |
Toll Corp., 8.250%, 12/01/2011 | | | | | 1,850,000 | | | 1,887,000 |
| | | | | | | | |
| | | | | | | | 287,331,521 |
| | | | | | | | |
| Independent Energy – 1.3% | | | | | | | | |
Anadarko Petroleum Corp., 6.450%, 9/15/2036 | | | | | 80,585,000 | | | 83,203,448 |
Chesapeake Energy Corp., 6.250%, 1/15/2017 | | EUR | | | 5,925,000 | | | 7,976,715 |
Chesapeake Energy Corp., 6.500%, 8/15/2017 | | | | | 2,615,000 | | | 2,399,263 |
Chesapeake Energy Corp., 6.875%, 11/15/2020 | | | | | 13,805,000 | | | 12,286,450 |
Connacher Oil & Gas Ltd., 10.250%, 12/15/2015, 144A | | | | | 20,226,000 | | | 16,484,190 |
Connacher Oil & Gas Ltd., 11.750%, 7/15/2014, 144A | | | | | 3,640,000 | | | 3,876,600 |
Penn Virginia Corp., 10.375%, 6/15/2016 | | | | | 2,500,000 | | | 2,700,000 |
Pioneer Natural Resources Co., 5.875%, 7/15/2016 | | | | | 10,275,000 | | | 9,497,018 |
Pioneer Natural Resources Co., 6.875%, 5/01/2018 | | | | | 2,125,000 | | | 2,027,915 |
Pioneer Natural Resources Co., 7.200%, 1/15/2028 | | | | | 8,782,000 | | | 7,622,091 |
Questar Market Resources, Inc., 6.800%, 4/01/2018 | | | | | 51,955,000 | | | 53,263,850 |
Talisman Energy, Inc., 5.850%, 2/01/2037 | | | | | 12,190,000 | | | 11,724,891 |
Talisman Energy, Inc., 6.250%, 2/01/2038 | | | | | 32,560,000 | | | 33,215,596 |
| | | | | | | | |
| | | | | | | | 246,278,027 |
| | | | | | | | |
See accompanying notes to financial statements.
27
| | | | | | | | |
| | | | | Principal Amount (‡) | | Value (†) |
| | | | | | | | |
| | | |
| BONDS AND NOTES – continued | | | | | | | | |
| | | |
| Industrial Other – 0.1% | | | | | | | | |
Great Lakes Dredge & Dock Corp., 7.750%, 12/15/2013 | | | | $ | 3,590,000 | | $ | 3,522,687 |
Ranhill Labuan Ltd., 12.500%, 10/26/2011, 144A | | | | | 26,410,000 | | | 21,128,000 |
| | | | | | | | |
| | | | | | | | 24,650,687 |
| | | | | | | | |
| Integrated Energy – 0.0% | | | | | | | | |
PF Export Receivables Master Trust, Series A, 6.436%, 6/01/2015, 144A | | | | | 1,391,973 | | | 1,447,652 |
| | | | | | | | |
| Life Insurance – 0.4% | | | | | | | | |
American International Group, Inc., MTN, 5.450%, 5/18/2017 | | | | | 3,655,000 | | | 2,649,473 |
American International Group, Inc., Series G, MTN, 5.600%, 10/18/2016 | | | | | 3,245,000 | | | 2,380,996 |
American International Group, Inc., Series G, MTN, 5.850%, 1/16/2018 | | | | | 20,540,000 | | | 14,871,124 |
MetLife, Inc., 10.750%, 8/01/2069 | | | | | 12,020,000 | | | 14,484,100 |
Mutual of Omaha Insurance Co., 6.800%, 6/15/2036, 144A | | | | | 57,985,000 | | | 47,436,369 |
| | | | | | | | |
| | | | | | | | 81,822,062 |
| | | | | | | | |
| Local Authorities – 0.8% | | | | | | | | |
Ontario Hydro, Zero Coupon, 11/27/2020 | | CAD | | | 1,507,000 | | | 832,513 |
Province of Alberta, 5.930%, 9/16/2016 | | CAD | | | 16,293,535 | | | 17,011,081 |
Province of British Columbia, 5.750%, 1/09/2012 | | CAD | | | 730,000 | | | 742,498 |
Province of Ontario, 4.400%, 12/02/2011 | | CAD | | | 760,000 | | | 750,971 |
Queensland Treasury Corp., Series 11G, 6.000%, 6/14/2011 | | AUD | | | 60,000 | | | 54,110 |
Virginia Tobacco Settlement Financing Corp., Series A-1, 6.706%, 6/01/2046(c) | | | | | 178,970,000 | | | 127,832,902 |
| | | | | | | | |
| | | | | | | | 147,224,075 |
| | | | | | | | |
| Media Cable – 2.3% | | | | | | | | |
Comcast Corp., 5.650%, 6/15/2035 | | | | | 68,300,000 | | | 66,057,643 |
Comcast Corp., 6.450%, 3/15/2037 | | | | | 21,450,000 | | | 22,713,169 |
Comcast Corp., 6.500%, 11/15/2035 | | | | | 23,100,000 | | | 24,615,060 |
Comcast Corp., 6.950%, 8/15/2037 | | | | | 192,208,000 | | | 214,535,266 |
CSC Holdings, Inc., 7.875%, 2/15/2018 | | | | | 1,550,000 | | | 1,581,000 |
CSC Holdings, Inc., 8.500%, 4/15/2014, 144A | | | | | 15,000,000 | | | 15,750,000 |
Shaw Communications, Inc., 5.650%, 10/01/2019 | | CAD | | | 37,585,000 | | | 35,650,723 |
Shaw Communications, Inc., 5.700%, 3/02/2017 | | CAD | | | 12,775,000 | | | 12,447,705 |
Shaw Communications, Inc., 7.500%, 11/20/2013 | | CAD | | | 275,000 | | | 292,594 |
Time Warner Cable, Inc., 6.750%, 7/01/2018 | | | | | 26,541,000 | | | 29,321,435 |
Virgin Media Finance PLC, 9.125%, 8/15/2016 | | | | | 1,700,000 | | | 1,746,750 |
Virgin Media Finance PLC, 9.750%, 4/15/2014 | | GBP | | | 6,605,000 | | | 10,925,242 |
| | | | | | | | |
| | | | | | | | 435,636,587 |
| | | | | | | | |
| Media Non-Cable – 0.5% | | | | | | | | |
News America, Inc., 6.150%, 3/01/2037 | | | | | 54,025,000 | | | 52,860,599 |
News America, Inc., 6.200%, 12/15/2034 | | | | | 17,785,000 | | | 17,498,252 |
News America, Inc., 6.400%, 12/15/2035 | | | | | 29,275,000 | | | 29,531,976 |
R.H. Donnelley Corp., Series A-1, 6.875%, 1/15/2013(d) | | | | | 4,713,000 | | | 270,998 |
See accompanying notes to financial statements.
28
PORTFOLIO OF INVESTMENTS – as of September 30, 2009
Loomis Sayles Bond Fund – continued
| | | | | | | | | |
| | | | | Principal Amount (‡) | | | Value (†) |
| | | | | | | | | |
| | | |
| BONDS AND NOTES – continued | | | | | | | | | |
| | | |
| Media Non-Cable – continued | | | | | | | | | |
R.H. Donnelley Corp., Series A-2, 6.875%, 1/15/2013(d) | | | | $ | 2,840,000 | | | $ | 163,300 |
R.H. Donnelley Corp., Series A-3, 8.875%, 1/15/2016(d) | | | | | 927,000 | | | | 53,303 |
R.H. Donnelley Corp., Series A-4, 8.875%, 10/15/2017(d) | | | | | 3,564,000 | | | | 204,930 |
| | | | | | | | | |
| | | | | | | | | 100,583,358 |
| | | | | | | | | |
| Metals & Mining – 0.8% | | | | | | | | | |
Alcoa, Inc., 5.550%, 2/01/2017 | | | | | 650,000 | | | | 630,983 |
Alcoa, Inc., 5.720%, 2/23/2019 | | | | | 11,557,000 | | | | 10,462,182 |
Alcoa, Inc., 5.870%, 2/23/2022 | | | | | 4,935,000 | | | | 4,278,596 |
Alcoa, Inc., 6.750%, 1/15/2028 | | | | | 6,490,000 | | | | 5,660,656 |
Algoma Acquisition Corp., 9.875%, 6/15/2015, 144A | | | | | 13,180,000 | | | | 11,071,200 |
ArcelorMittal, 6.125%, 6/01/2018 | | | | | 90,000 | | | | 88,664 |
ArcelorMittal USA Partnership, 9.750%, 4/01/2014 | | | | | 15,477,000 | | | | 16,212,157 |
Newmont Mining Corp., 5.875%, 4/01/2035 | | | | | 4,736,000 | | | | 4,637,974 |
Rio Tinto Alcan, Inc., 5.750%, 6/01/2035 | | | | | 1,840,000 | | | | 1,773,000 |
Rio Tinto Finance (USA) Ltd., 8.950%, 5/01/2014 | | | | | 34,779,000 | | | | 41,045,724 |
Teck Resources Ltd., 10.250%, 5/15/2016 | | | | | 1,730,000 | | | | 1,954,900 |
Teck Resources Ltd., 10.750%, 5/15/2019 | | | | | 1,000,000 | | | | 1,162,500 |
United States Steel Corp., 6.050%, 6/01/2017 | | | | | 11,175,000 | | | | 10,437,361 |
United States Steel Corp., 6.650%, 6/01/2037 | | | | | 9,625,000 | | | | 7,850,516 |
United States Steel Corp., 7.000%, 2/01/2018 | | | | | 23,520,000 | | | | 22,587,949 |
| | | | | | | | | |
| | | | | | | | | 139,854,362 |
| | | | | | | | | |
| Mortgage Related – 0.0% | | | | | | | | | |
FHLMC, 5.000%, 12/01/2031 | | | | | 291,616 | | | | 303,242 |
| | | | | | | | | |
| Non-Captive Consumer – 3.1% | | | | | | | | | |
American General Finance Corp., Series J, MTN, 6.900%, 12/15/2017 | | | | | 322,970,000 | | | | 225,879,081 |
Residential Capital LLC, 8.375%, 6/30/2010 | | | | | 5,000 | | | | 3,725 |
SLM Corp., 6.000%, 12/15/2043 | | | | | 150,125 | (††) | | | 2,120,891 |
SLM Corp., EMTN, 4.750%, 3/17/2014 | | EUR | | | 9,200,000 | | | | 9,895,166 |
SLM Corp., MTN, 5.050%, 11/14/2014 | | | | | 27,310,000 | | | | 20,075,390 |
SLM Corp., MTN, 5.125%, 8/27/2012 | | | | | 2,665,000 | | | | 2,280,371 |
SLM Corp., Series A, MTN, 4.500%, 7/26/2010 | | | | | 10,300,000 | | | | 10,008,139 |
SLM Corp., Series A, MTN, 5.000%, 10/01/2013 | | | | | 73,175,000 | | | | 58,251,617 |
SLM Corp., Series A, MTN, 5.000%, 4/15/2015 | | | | | 53,696,000 | | | | 40,009,588 |
SLM Corp., Series A, MTN, 5.000%, 6/15/2018 | | | | | 22,998,000 | | | | 14,422,621 |
SLM Corp., Series A, MTN, 5.375%, 1/15/2013 | | | | | 28,262,000 | | | | 23,563,668 |
SLM Corp., Series A, MTN, 5.375%, 5/15/2014 | | | | | 32,635,000 | | | | 24,978,111 |
SLM Corp., Series A, MTN, 5.400%, 10/25/2011 | | | | | 1,785,000 | | | | 1,647,055 |
SLM Corp., Series A, MTN, 5.625%, 8/01/2033 | | | | | 38,535,000 | | | | 24,185,838 |
SLM Corp., Series A, MTN, 6.500%, 6/15/2010(c)(e) | | NZD | | | 8,020,000 | | | | 5,428,994 |
SLM Corp., Series A, MTN, 8.450%, 6/15/2018 | | | | | 140,870,000 | | | | 112,343,825 |
| | | | | | | | | |
| | | | | | | | | 575,094,080 |
| | | | | | | | | |
| Non-Captive Diversified – 5.7% | | | | | | | | | |
CIT Group, Inc., 4.750%, 12/15/2010 | | | | | 130,000 | | | | 89,807 |
CIT Group, Inc., 5.400%, 2/13/2012 | | | | | 962,000 | | | | 631,387 |
See accompanying notes to financial statements.
29
| | | | | | | | |
| | | | | Principal Amount (‡) | | Value (†) |
| | | | | | | | |
| | | |
| BONDS AND NOTES – continued | | | | | | | | |
| | | |
| Non-Captive Diversified – continued | | | | | | | | |
CIT Group, Inc., 5.400%, 1/30/2016 | | | | $ | 476,000 | | $ | 300,073 |
CIT Group, Inc., 5.500%, 12/01/2014 | | GBP | | | 29,029,000 | | | 27,371,712 |
CIT Group, Inc., 5.600%, 4/27/2011 | | | | | 7,206,000 | | | 4,906,558 |
CIT Group, Inc., 5.800%, 10/01/2036 | | | | | 5,017,000 | | | 3,008,645 |
CIT Group, Inc., 5.850%, 9/15/2016 | | | | | 10,000 | | | 6,302 |
CIT Group, Inc., EMTN, 3.800%, 11/14/2012 | | EUR | | | 21,270,000 | | | 19,453,395 |
CIT Group, Inc., EMTN, 4.650%, 9/19/2016 | | EUR | | | 21,250,000 | | | 17,880,295 |
CIT Group, Inc., EMTN, 5.000%, 5/13/2014 | | EUR | | | 6,450,000 | | | 5,568,774 |
CIT Group, Inc., EMTN, 5.500%, 12/20/2016 | | GBP | | | 16,050,000 | | | 14,620,687 |
CIT Group, Inc., GMTN, 4.250%, 2/01/2010 | | | | | 85,000 | | | 61,282 |
CIT Group, Inc., GMTN, 4.250%, 9/22/2011 | | EUR | | | 25,450,000 | | | 23,648,817 |
CIT Group, Inc., GMTN, 5.000%, 2/13/2014 | | | | | 5,817,000 | | | 3,715,772 |
CIT Group, Inc., GMTN, 5.000%, 2/01/2015 | | | | | 476,000 | | | 304,859 |
CIT Group, Inc., MTN, 4.250%, 3/17/2015 | | EUR | | | 29,370,000 | | | 24,927,564 |
CIT Group, Inc., MTN, 5.125%, 9/30/2014 | | | | | 4,107,000 | | | 2,631,014 |
CIT Group, Inc., Series A, GMTN, 6.000%, 4/01/2036 | | | | | 165,000 | | | 95,327 |
CIT Group, Inc., Series A, MTN, 5.650%, 2/13/2017 | | | | | 807,000 | | | 504,624 |
CIT Group, Inc., Series A, MTN, 7.625%, 11/30/2012 | | | | | 105,438,000 | | | 68,672,929 |
GATX Corp., 8.750%, 5/15/2014 | | | | | 18,850,000 | | | 21,211,057 |
General Electric Capital Australia Funding, EMTN, 8.000%, 2/13/2012 | | AUD | | | 44,525,000 | | | 40,409,365 |
General Electric Capital Corp., Series A, EMTN, 6.750%, 9/26/2016 | | NZD | | | 89,985,000 | | | 62,345,698 |
General Electric Capital Corp., Series A, GMTN, 2.960%, 5/18/2012 | | SGD | | | 15,000,000 | | | 10,120,615 |
General Electric Capital Corp., Series A, GMTN, 3.485%, 3/08/2012 | | SGD | | | 150,000,000 | | | 102,998,616 |
General Electric Capital Corp., Series A, GMTN, 7.625%, 12/10/2014 | | NZD | | | 3,500,000 | | | 2,564,031 |
General Electric Capital Corp., Series A, MTN, 0.809%, 5/13/2024(b) | | | | | 22,590,000 | | | 15,754,899 |
General Electric Capital Corp., Series A, MTN, 6.500%, 9/28/2015 | | NZD | | | 266,643,000 | | | 184,139,262 |
General Motors Acceptance Corp. of Canada Ltd., 7.125%, 9/13/2011 | | AUD | | | 4,950,000 | | | 4,017,538 |
GMAC, Inc., 5.375%, 6/06/2011, 144A | | | | | 61,815,000 | | | 57,024,337 |
GMAC, Inc., 5.750%, 9/27/2010, 144A | | | | | 7,263,000 | | | 7,008,795 |
GMAC, Inc., 6.000%, 12/15/2011, 144A | | | | | 52,305,000 | | | 48,382,125 |
GMAC, Inc., 6.625%, 12/17/2010, 144A | | | | | 464,000 | | | 445,440 |
GMAC, Inc., 6.625%, 5/15/2012, 144A | | | | | 20,461,000 | | | 18,824,120 |
GMAC, Inc., 6.750%, 12/01/2014, 144A | | | | | 30,190,000 | | | 25,661,500 |
GMAC, Inc., 6.875%, 9/15/2011, 144A | | | | | 5,664,000 | | | 5,352,480 |
GMAC, Inc., 6.875%, 8/28/2012, 144A | | | | | 4,229,000 | | | 3,890,680 |
GMAC, Inc., 6.875%, 8/28/2012 | | | | | 10,000 | | | 9,113 |
GMAC, Inc., 7.000%, 2/01/2012, 144A | | | | | 10,637,000 | | | 9,892,410 |
GMAC, Inc., 7.250%, 3/02/2011, 144A | | | | | 25,000 | | | 24,063 |
GMAC, Inc., 7.500%, 12/31/2013, 144A | | | | | 23,588,000 | | | 20,639,500 |
GMAC, Inc., 8.000%, 12/31/2018, 144A | | | | | 44,981,000 | | | 33,960,655 |
GMAC, Inc., 8.000%, 11/01/2031, 144A | | | | | 35,442,000 | | | 28,530,810 |
See accompanying notes to financial statements.
30
PORTFOLIO OF INVESTMENTS – as of September 30, 2009
Loomis Sayles Bond Fund – continued
| | | | | | | | |
| | | | | Principal Amount (‡) | | Value (†) |
| | | | | | | | |
| | | |
| BONDS AND NOTES – continued | | | | | | | | |
| | | |
| Non-Captive Diversified – continued | | | | | | | | |
International Lease Finance Corp., Series R, MTN, 5.625%, 9/15/2010 | | | | $ | 120,000 | | $ | 114,513 |
iStar Financial, Inc., 5.150%, 3/01/2012 | | | | | 52,875,000 | | | 31,460,625 |
iStar Financial, Inc., 5.375%, 4/15/2010 | | | | | 6,905,000 | | | 6,361,231 |
iStar Financial, Inc., 5.500%, 6/15/2012 | | | | | 3,865,000 | | | 2,357,650 |
iStar Financial, Inc., 5.650%, 9/15/2011 | | | | | 30,335,000 | | | 20,931,150 |
iStar Financial, Inc., 5.800%, 3/15/2011 | | | | | 5,305,000 | | | 3,766,550 |
iStar Financial, Inc., 5.850%, 3/15/2017 | | | | | 6,565,000 | | | 3,430,212 |
iStar Financial, Inc., 5.875%, 3/15/2016 | | | | | 11,605,000 | | | 6,382,750 |
iStar Financial, Inc., 6.050%, 4/15/2015 | | | | | 5,655,000 | | | 2,954,738 |
iStar Financial, Inc., 8.625%, 6/01/2013 | | | | | 46,795,000 | | | 29,480,850 |
iStar Financial, Inc., Series B, 5.125%, 4/01/2011 | | | | | 2,330,000 | | | 1,584,400 |
iStar Financial, Inc., Series B, 5.700%, 3/01/2014 | | | | | 7,645,000 | | | 4,128,300 |
iStar Financial, Inc., Series B, 5.950%, 10/15/2013 | | | | | 60,205,000 | | | 34,316,850 |
| | | | | | | | |
| | | | | | | | 1,068,876,751 |
| | | | | | | | |
| Oil Field Services – 2.3% | | | | | | | | |
Nabors Industries, Inc., 6.150%, 2/15/2018 | | | | | 15,693,000 | | | 15,732,170 |
Nabors Industries, Inc., 9.250%, 1/15/2019 | | | | | 184,360,000 | | | 219,095,636 |
North American Energy Partners, Inc., 8.750%, 12/01/2011 | | | | | 12,685,000 | | | 12,431,300 |
Rowan Cos., Inc., 7.875%, 8/01/2019 | | | | | 4,692,000 | | | 5,044,745 |
Weatherford International Ltd., 6.500%, 8/01/2036 | | | | | 25,600,000 | | | 26,088,678 |
Weatherford International Ltd., 6.800%, 6/15/2037 | | | | | 4,250,000 | | | 4,468,679 |
Weatherford International Ltd., 7.000%, 3/15/2038 | | | | | 13,670,000 | | | 14,737,258 |
Weatherford International Ltd., 9.625%, 3/01/2019 | | | | | 102,288,000 | | | 128,047,085 |
| | | | | | | | |
| | | | | | | | 425,645,551 |
| | | | | | | | |
| Packaging – 0.2% | | | | | | | | |
OI European Group BV, 6.875%, 3/31/2017, 144A | | EUR | | | 3,450,000 | | | 4,897,097 |
Owens Brockway Glass Container, Inc., 6.750%, 12/01/2014 | | EUR | | | 2,500,000 | | | 3,621,789 |
Owens-Illinois, Inc., 7.800%, 5/15/2018 | | | | | 18,644,000 | | | 18,690,610 |
| | | | | | | | |
| | | | | | | | 27,209,496 |
| | | | | | | | |
| Paper – 2.5% | | | | | | | | |
Georgia-Pacific LLC, 7.250%, 6/01/2028 | | | | | 26,262,000 | | | 23,373,180 |
Georgia-Pacific LLC, 7.375%, 12/01/2025 | | | | | 31,317,000 | | | 28,185,300 |
Georgia-Pacific LLC, 7.700%, 6/15/2015 | | | | | 470,000 | | | 474,700 |
Georgia-Pacific LLC, 7.750%, 11/15/2029 | | | | | 80,840,000 | | | 74,372,800 |
Georgia-Pacific LLC, 8.000%, 1/15/2024 | | | | | 21,749,000 | | | 21,531,510 |
Georgia-Pacific LLC, 8.875%, 5/15/2031 | | | | | 27,237,000 | | | 27,509,370 |
International Paper Co., 7.950%, 6/15/2018 | | | | | 216,710,000 | | | 234,904,538 |
International Paper Co., 8.700%, 6/15/2038 | | | | | 10,392,000 | | | 11,520,072 |
Jefferson Smurfit Corp.,
7.500%, 6/01/2013(d) | | | | | 5,540,000 | | | 3,926,475 |
Smurfit-Stone Container Enterprises, Inc., 8.000%, 3/15/2017(d) | | | | | 1,115,000 | | | 791,650 |
Stone Container Finance,
7.375%, 7/15/2014(d) | | | | | 90,000 | | | 73,800 |
Westvaco Corp., 7.950%, 2/15/2031 | | | | | 24,586,000 | | | 24,079,110 |
Westvaco Corp., 8.200%, 1/15/2030 | | | | | 25,389,000 | | | 24,903,182 |
| | | | | | | | |
| | | | | | | | 475,645,687 |
| | | | | | | | |
See accompanying notes to financial statements.
31
| | | | | | | | |
| | | | | Principal Amount (‡) | | Value (†) |
| | | | | | | | |
| | | |
| BONDS AND NOTES – continued | | | | | | | | |
| | | |
| Pharmaceuticals – 0.7% | | | | | | | | |
Elan Financial PLC, 7.750%, 11/15/2011 | | | | $ | 72,911,000 | | $ | 74,278,081 |
Elan Financial PLC, 8.875%, 12/01/2013 | | | | | 58,330,000 | | | 58,767,475 |
| | | | | | | | |
| | | | | | | | 133,045,556 |
| | | | | | | | |
| Pipelines – 2.2% | | | | | | | | |
DCP Midstream LP, 6.450%, 11/03/2036, 144A | | | | | 27,325,000 | | | 24,749,100 |
El Paso Corp., 6.950%, 6/01/2028 | | | | | 12,209,000 | | | 10,156,130 |
El Paso Corp., 7.420%, 2/15/2037 | | | | | 2,045,000 | | | 1,756,266 |
El Paso Corp., GMTN, 7.750%, 1/15/2032 | | | | | 1,500,000 | | | 1,374,297 |
El Paso Corp., GMTN, 7.800%, 8/01/2031 | | | | | 1,000,000 | | | 917,119 |
Energy Transfer Partners LP, 6.125%, 2/15/2017 | | | | | 7,325,000 | | | 7,624,937 |
Energy Transfer Partners LP, 6.625%, 10/15/2036 | | | | | 11,435,000 | | | 11,868,707 |
Enterprise Products Operating LLP, 6.300%, 9/15/2017 | | | | | 25,030,000 | | | 26,959,387 |
Florida Gas Transmission Co., 7.900%, 5/15/2019, 144A | | | | | 7,500,000 | | | 8,946,892 |
Kinder Morgan Energy Partners LP, 5.800%, 3/15/2035 | | | | | 843,000 | | | 794,946 |
Maritimes & Northeast Pipeline LLC, 7.500%, 5/31/2014, 144A(c) | | | | | 60,360,000 | | | 63,485,441 |
NGPL PipeCo LLC, 7.119%, 12/15/2017, 144A | | | | | 116,405,000 | | | 130,245,671 |
ONEOK Partners LP, 6.650%, 10/01/2036 | | | | | 9,450,000 | | | 10,069,674 |
Plains All American Pipeline LP, 6.125%, 1/15/2017 | | | | | 28,845,000 | | | 29,939,466 |
Plains All American Pipeline LP, 6.650%, 1/15/2037 | | | | | 62,130,000 | | | 65,440,659 |
Transportadora de Gas del Sur SA, 7.875%, 5/14/2017, 144A | | | | | 250,000 | | | 215,000 |
Williams Cos., Inc. (The), 7.500%, 1/15/2031 | | | | | 6,655,000 | | | 6,797,297 |
| | | | | | | | |
| | | | | | | | 401,340,989 |
| | | | | | | | |
| Property & Casualty Insurance – 0.9% | | | | | | | | |
Allstate Corp., 5.950%, 4/01/2036 | | | | | 7,790,000 | | | 8,264,528 |
Marsh & McLennan Cos., Inc., 5.375%, 7/15/2014 | | | | | 46,320,000 | | | 48,203,232 |
Marsh & McLennan Cos., Inc., 5.750%, 9/15/2015 | | | | | 34,729,000 | | | 36,621,939 |
Marsh & McLennan Cos., Inc., 5.875%, 8/01/2033 | | | | | 51,522,000 | | | 47,350,470 |
Marsh & McLennan Cos., Inc., 9.250%, 4/15/2019 | | | | | 2,660,000 | | | 3,333,352 |
MBIA Insurance Corp., (fixed rate to 1/15/2013, variable rate thereafter), 14.000%, 1/15/2033, 144A | | | | | 8,600,000 | | | 3,784,000 |
White Mountains RE Group, 6.375%, 3/20/2017, 144A | | | | | 75,000 | | | 67,052 |
Willis North America, Inc., 6.200%, 3/28/2017 | | | | | 12,000,000 | | | 11,746,608 |
XL Capital Ltd., 6.250%, 5/15/2027 | | | | | 6,575,000 | | | 5,813,207 |
XL Capital Ltd., 6.375%, 11/15/2024 | | | | | 2,110,000 | | | 1,703,852 |
| | | | | | | | |
| | | | | | | | 166,888,240 |
| | | | | | | | |
| Railroads – 0.4% | | | | | | | | |
Canadian Pacific Railway Co., 5.750%, 3/15/2033 | | | | | 3,830,000 | | | 3,687,340 |
Canadian Pacific Railway Co., 5.950%, 5/15/2037 | | | | | 24,475,000 | | | 24,149,825 |
CSX Corp., MTN, 6.000%, 10/01/2036 | | | | | 31,895,000 | | | 32,892,229 |
Missouri Pacific Railroad Co.,
5.000%, 1/01/2045(c) | | | | | 7,944,000 | | | 5,401,920 |
Missouri Pacific Railroad Co., Series A,
4.750%, 1/01/2020(c) | | | | | 63,300 | | | 55,863 |
| | | | | | | | |
| | | | | | | | 66,187,177 |
| | | | | | | | |
| Refining – 0.0% | | | | | | | | |
Valero Energy Corp., 6.625%, 6/15/2037 | | | | | 1,782,000 | | | 1,591,453 |
| | | | | | | | |
See accompanying notes to financial statements.
32
PORTFOLIO OF INVESTMENTS – as of September 30, 2009
Loomis Sayles Bond Fund – continued
| | | | | | | | |
| | | | | Principal Amount (‡) | | Value (†) |
| | | | | | | | |
| | | |
| BONDS AND NOTES – continued | | | | | | | | |
| | | |
| REITs – 1.2% | | | | | | | | |
Camden Property Trust, 5.000%, 6/15/2015 | | | | $ | 2,565,000 | | $ | 2,441,123 |
Camden Property Trust, 5.700%, 5/15/2017 | | | | | 40,075,000 | | | 37,916,881 |
Duke Realty LP, 5.950%, 2/15/2017 | | | | | 5,720,000 | | | 5,272,530 |
ERP Operating LP, 5.125%, 3/15/2016 | | | | | 4,680,000 | | | 4,566,618 |
ERP Operating LP, 5.375%, 8/01/2016 | | | | | 3,000,000 | | | 2,956,077 |
First Industrial LP, 5.950%, 5/15/2017 | | | | | 7,750,000 | | | 5,279,920 |
Highwoods Properties, Inc., 5.850%, 3/15/2017 | | | | | 57,890,000 | | | 50,985,691 |
Highwoods Properties, Inc., 7.500%, 4/15/2018 | | | | | 5,640,000 | | | 5,397,097 |
ProLogis, 5.625%, 11/15/2015 | | | | | 5,957,000 | | | 5,413,191 |
ProLogis, 5.625%, 11/15/2016 | | | | | 2,155,000 | | | 1,933,613 |
ProLogis, 5.750%, 4/01/2016 | | | | | 2,750,000 | | | 2,459,817 |
ProLogis, 6.625%, 5/15/2018 | | | | | 1,377,000 | | | 1,271,511 |
Simon Property Group LP, 5.250%, 12/01/2016 | | | | | 4,505,000 | | | 4,440,583 |
Simon Property Group LP, 5.750%, 12/01/2015 | | | | | 9,032,000 | | | 9,238,941 |
Simon Property Group LP, 5.875%, 3/01/2017 | | | | | 3,145,000 | | | 3,207,293 |
Simon Property Group LP, 6.100%, 5/01/2016 | | | | | 2,325,000 | | | 2,389,516 |
Simon Property Group LP, 6.125%, 5/30/2018 | | | | | 1,690,000 | | | 1,702,802 |
Simon Property Group LP, 10.350%, 4/01/2019 | | | | | 10,965,000 | | | 13,645,416 |
WEA Finance LLC/WT Finance Australia Pty Ltd., 6.750%, 9/02/2019, 144A | | | | | 68,360,000 | | | 69,146,072 |
| | | | | | | | |
| | | | | | | | 229,664,692 |
| | | | | | | | |
| Restaurants – 0.0% | | | | | | | | |
McDonald’s Corp., EMTN, 3.628%, 10/10/2010 | | SGD | | | 3,750,000 | | | 2,708,034 |
| | | | | | | | |
| Retailers – 2.4% | | | | | | | | |
Dillard’s, Inc., 6.625%, 1/15/2018 | | | | | 1,920,000 | | | 1,459,200 |
Dillard’s, Inc., 7.000%, 12/01/2028 | | | | | 4,680,000 | | | 3,112,200 |
Dillard’s, Inc., 7.130%, 8/01/2018 | | | | | 1,740,000 | | | 1,352,850 |
Dillard’s, Inc., 7.750%, 7/15/2026 | | | | | 7,182,000 | | | 5,063,310 |
Dillard’s, Inc., 7.750%, 5/15/2027 | | | | | 1,000,000 | | | 700,000 |
Foot Locker, Inc., 8.500%, 1/15/2022 | | | | | 14,269,000 | | | 13,484,205 |
Home Depot, Inc. (The), 5.875%, 12/16/2036 | | | | | 170,350,000 | | | 165,274,592 |
J.C. Penney Corp., Inc., 5.750%, 2/15/2018 | | | | | 5,160,000 | | | 4,798,800 |
J.C. Penney Corp., Inc., 6.375%, 10/15/2036 | | | | | 98,218,000 | | | 81,029,850 |
J.C. Penney Corp., Inc., 7.125%, 11/15/2023 | | | | | 2,798,000 | | | 2,574,160 |
J.C. Penney Corp., Inc., 7.400%, 4/01/2037 | | | | | 4,655,000 | | | 4,142,950 |
J.C. Penney Corp., Inc., 7.625%, 3/01/2097 | | | | | 5,580,000 | | | 4,464,000 |
Lowe’s Cos., Inc., 6.650%, 9/15/2037 | | | | | 18,685,000 | | | 21,703,599 |
Macy’s Retail Holdings, Inc., 6.375%, 3/15/2037 | | | | | 36,772,000 | | | 28,970,600 |
Macy’s Retail Holdings, Inc., 6.790%, 7/15/2027 | | | | | 14,133,000 | | | 10,302,801 |
Macy’s Retail Holdings, Inc., 6.900%, 4/01/2029 | | | | | 2,098,000 | | | 1,655,039 |
Macy’s Retail Holdings, Inc., 8.875%, 7/15/2015 | | | | | 1,485,000 | | | 1,549,152 |
Marks & Spencer PLC, 7.125%, 12/01/2037, 144A | | | | | 9,245,000 | | | 8,636,559 |
Target Corp., 7.000%, 1/15/2038 | | | | | 34,586,000 | | | 40,478,624 |
Toys R Us, Inc., 7.375%, 10/15/2018 | | | | | 39,965,000 | | | 34,769,550 |
Toys R Us, Inc., 7.875%, 4/15/2013 | | | | | 11,255,000 | | | 10,804,800 |
| | | | | | | | |
| | | | | | | | 446,326,841 |
| | | | | | | | |
| Sovereigns – 4.5% | | | | | | | | |
Indonesia Treasury Bond, 9.500%, 7/15/2023 | | IDR | | | 10,000,000,000 | | | 956,470 |
Indonesia Treasury Bond, 10.250%, 7/15/2027 | | IDR | | | 25,000,000,000 | | | 2,476,596 |
See accompanying notes to financial statements.
33
| | | | | | | | |
| | | | | Principal Amount (‡) | | | Value (†) |
| | | | | | | | |
| | | |
| BONDS AND NOTES – continued | | | | | | | | |
| | | |
| Sovereigns – continued | | | | | | | | |
Indonesia Treasury Bond, Series FR43, 10.250%, 7/15/2022 | | IDR | | 145,156,000,000 | | | $ | 14,800,700 |
Indonesia Treasury Bond, Series FR44, 10.000%, 9/15/2024 | | IDR | | 498,832,000,000 | | | | 48,942,361 |
Indonesia Treasury Bond, Series ZC3, Zero Coupon, 11/20/2012 | | IDR | | 378,003,000,000 | | | | 30,095,922 |
Mexican Fixed Rate Bonds, Series M-10, 7.250%, 12/15/2016 | | MXN | | 5,258,000 | (†††) | | | 37,901,076 |
Mexican Fixed Rate Bonds, Series M-20, 8.000%, 12/07/2023 | | MXN | | 28,585,700 | (†††) | | | 207,684,207 |
Mexican Fixed Rate Bonds, Series MI-10, 9.000%, 12/20/2012 | | MXN | | 4,557,000 | (†††) | | | 35,988,044 |
New South Wales Treasury Corp.,
Series 10RG, 7.000%, 12/01/2010 | | AUD | | 110,620,000 | | | | 100,528,327 |
New South Wales Treasury Corp.,
Series 12RG, 6.000%, 5/01/2012 | | AUD | | 15,305,000 | | | | 13,767,803 |
New South Wales Treasury Corp.,
Series 17RG, 5.500%, 3/01/2017 | | AUD | | 95,840,000 | | | | 82,799,087 |
Republic of Brazil, 10.250%, 1/10/2028 | | BRL | | 98,690,000 | | | | 53,478,438 |
Republic of Brazil, 12.500%, 1/05/2016 | | BRL | | 17,305,000 | | | | 10,730,155 |
Republic of Brazil, 12.500%, 1/05/2022 | | BRL | | 114,735,000 | | | | 71,239,840 |
Republic of Iceland, Zero Coupon, 11/16/2009 | | ISK | | 2,025,000,000 | | | | 12,944,061 |
Republic of Iceland, 7.000%, 3/17/2010 | | ISK | | 4,024,483,000 | | | | 25,946,231 |
Republic of Iceland, 7.250%, 5/17/2013 | | ISK | | 4,616,100,000 | | | | 29,587,712 |
Republic of Iceland, 8.000%, 7/22/2011 | | ISK | | 2,470,000,000 | | | | 16,133,722 |
Republic of Iceland, 13.750%, 12/10/2010 | | ISK | | 4,656,063,000 | | | | 32,262,011 |
Republic of Venezuela, 7.000%, 3/16/2015 | | EUR | | 5,980,000 | | | | 7,389,023 |
United Mexican States, Series A, MTN, 6.050%, 1/11/2040 | | | | 44,000 | | | | 43,890 |
| | | | | | | | |
| | | | | | | | 835,695,676 |
| | | | | | | | |
| Supermarkets – 0.8% | | | | | | | | |
American Stores Co., 7.900%, 5/01/2017 | | | | 3,000,000 | | | | 2,820,000 |
American Stores Co., Series B, MTN, 7.100%, 3/20/2028 | | | | 13,145,000 | | | | 10,384,550 |
New Albertson’s, Inc., 7.450%, 8/01/2029 | | | | 100,590,000 | | | | 86,507,400 |
New Albertson’s, Inc., 7.750%, 6/15/2026 | | | | 20,550,000 | | | | 18,289,500 |
New Albertson’s, Inc., 8.000%, 5/01/2031 | | | | 9,715,000 | | | | 8,719,213 |
New Albertson’s, Inc., 8.700%, 5/01/2030 | | | | 2,995,000 | | | | 2,725,450 |
New Albertson’s, Inc., Series C, MTN, 6.625%, 6/01/2028 | | | | 17,575,000 | | | | 13,576,687 |
| | | | | | | | |
| | | | | | | | 143,022,800 |
| | | | | | | | |
| Supranational – 2.7% | | | | | | | | |
Eurofima, EMTN, 11.000%, 2/05/2010 | | ISK | | 290,000,000 | | | | 1,895,739 |
European Investment Bank, Zero Coupon, 3/10/2021 | | AUD | | 149,830,000 | | | | 66,970,585 |
European Investment Bank,
11.250%, 2/14/2013 | | BRL | | 11,505,000 | | | | 6,803,900 |
European Investment Bank, EMTN, Zero Coupon, 4/24/2013, 144A | | IDR | | 615,006,960,000 | | | | 45,293,529 |
European Investment Bank, EMTN, 4.600%, 1/30/2037, 144A | | CAD | | 200,000,000 | | | | 164,535,563 |
See accompanying notes to financial statements.
34
PORTFOLIO OF INVESTMENTS – as of September 30, 2009
Loomis Sayles Bond Fund – continued
| | | | | | | |
| | | | | Principal Amount (‡) | | Value (†) |
| | | | | | | |
| | | |
| BONDS AND NOTES – continued | | | | | | | |
| | | |
| Supranational – continued | | | | | | | |
European Investment Bank, EMTN, 7.000%, 1/18/2012 | | NZD | | 16,500,000 | | $ | 12,478,261 |
Inter-American Development Bank, EMTN, Zero Coupon, 5/20/2013 | | IDR | | 345,270,000,000 | | | 24,620,805 |
Inter-American Development Bank, EMTN,
6.000%, 12/15/2017 | | NZD | | 185,840,000 | | | 133,628,475 |
International Bank for Reconstruction & Development, 1.430%, 3/05/2014 | | SGD | | 40,000,000 | | | 27,287,914 |
International Bank for Reconstruction & Development, 9.500%, 5/27/2010 | | ISK | | 2,126,200,000 | | | 13,863,921 |
| | | | | | | |
| | | | | | | 497,378,692 |
| | | | | | | |
| Technology – 2.3% | | | | | | | |
Agilent Technologies, Inc., 6.500%, 11/01/2017 | | | | 65,276,000 | | | 67,928,817 |
Alcatel-Lucent USA, Inc., 6.450%, 3/15/2029 | | | | 67,787,000 | | | 51,602,854 |
Alcatel-Lucent USA, Inc., 6.500%, 1/15/2028 | | | | 3,916,000 | | | 2,981,055 |
Alcatel-Lucent, EMTN, 6.375%, 4/07/2014 | | EUR | | 1,000,000 | | | 1,390,181 |
Amkor Technology, Inc., 7.750%, 5/15/2013 | | | | 11,495,000 | | | 11,495,000 |
Arrow Electronics, Inc., 6.875%, 7/01/2013 | | | | 12,960,000 | | | 14,001,997 |
Arrow Electronics, Inc., 6.875%, 6/01/2018 | | | | 2,630,000 | | | 2,799,759 |
Avnet, Inc., 5.875%, 3/15/2014 | | | | 36,145,000 | | | 37,579,848 |
Avnet, Inc., 6.000%, 9/01/2015 | | | | 50,915,000 | | | 52,420,047 |
Avnet, Inc., 6.625%, 9/15/2016 | | | | 15,245,000 | | | 16,020,345 |
Corning, Inc., 5.900%, 3/15/2014 | | | | 9,330,000 | | | 9,958,917 |
Corning, Inc., 6.200%, 3/15/2016 | | | | 5,155,000 | | | 5,268,513 |
Corning, Inc., 6.850%, 3/01/2029 | | | | 10,821,000 | | | 11,042,192 |
Corning, Inc., 7.250%, 8/15/2036 | | | | 5,645,000 | | | 5,955,898 |
Eastman Kodak Co., 7.250%, 11/15/2013 | | | | 2,900,000 | | | 2,378,000 |
Equifax, Inc., 7.000%, 7/01/2037 | | | | 15,578,000 | | | 15,304,544 |
Freescale Semiconductor, Inc., 10.125%, 12/15/2016 | | | | 6,016,000 | | | 4,000,640 |
Motorola, Inc., 5.220%, 10/01/2097 | | | | 13,780,000 | | | 7,566,157 |
Motorola, Inc., 6.000%, 11/15/2017 | | | | 929,000 | | | 889,907 |
Motorola, Inc., 6.500%, 9/01/2025 | | | | 12,730,000 | | | 10,757,932 |
Motorola, Inc., 6.500%, 11/15/2028 | | | | 30,375,000 | | | 25,053,634 |
Motorola, Inc., 6.625%, 11/15/2037 | | | | 26,630,000 | | | 22,302,625 |
Motorola, Inc., 7.500%, 5/15/2025 | | | | 250,000 | | | 225,000 |
Nortel Networks Capital Corp.,
7.875%, 6/15/2026(d) | | | | 12,015,000 | | | 6,728,400 |
Nortel Networks Corp., 1.750%, 4/15/2012(d) | | | | 1,045,000 | | | 574,750 |
Nortel Networks Ltd., 6.875%, 9/01/2023(d) | | | | 18,622,000 | | | 5,214,160 |
Samsung Electronics Co. Ltd., 7.700%, 10/01/2027, 144A | | | | 4,807,000 | | | 5,332,501 |
Xerox Capital Trust I, 8.000%, 2/01/2027 | | | | 30,075,000 | | | 29,398,312 |
Xerox Corp., 5.500%, 5/15/2012 | | | | 7,110,000 | | | 7,455,269 |
Xerox Corp., 6.350%, 5/15/2018 | | | | 820,000 | | | 852,477 |
Xerox Corp., MTN, 7.200%, 4/01/2016 | | | | 615,000 | | | 667,605 |
| | | | | | | |
| | | | | | | 435,147,336 |
| | | | | | | |
| Tobacco – 1.3% | | | | | | | |
Altria Group, Inc., 8.500%, 11/10/2013 | | | | 30,725,000 | | | 35,636,084 |
Altria Group, Inc., 9.250%, 8/06/2019 | | | | 84,840,000 | | | 103,670,747 |
See accompanying notes to financial statements.
35
| | | | | | | | |
| | | | | Principal Amount (‡) | | Value (†) |
| | | | | | | | |
| | | |
| BONDS AND NOTES – continued | | | | | | | | |
| | | |
| Tobacco – continued | | | | | | | | |
Altria Group, Inc., 9.700%, 11/10/2018 | | | | $ | 1,450,000 | | $ | 1,800,983 |
Reynolds American, Inc., 6.750%, 6/15/2017 | | | | | 71,085,000 | | | 73,897,051 |
Reynolds American, Inc., 7.250%, 6/15/2037 | | | | | 17,990,000 | | | 17,817,602 |
| | | | | | | | |
| | | | | | | | 232,822,467 |
| | | | | | | | |
| Transportation Services – 0.5% | | | | | | | | |
APL Ltd., 8.000%, 1/15/2024(c) | | | | | 20,469,000 | | | 16,733,407 |
Atlas Air, Inc., Series 1999-1, Class A-1, 7.200%, 7/02/2020 | | | | | 12,608,412 | | | 9,834,561 |
Atlas Air, Inc., Series 1999-1A,
6.880%, 1/02/2011 | | | | | 957,340 | | | 880,753 |
Atlas Air, Inc., Series 1999-1B,
7.630%, 7/02/2016 | | | | | 16,330,639 | | | 12,247,979 |
Atlas Air, Inc., Series 1999-1C, 8.770%, 7/02/2012(f) | | | | | 15,689,997 | | | 10,982,998 |
Atlas Air, Inc., Series 2000-1, Class B, 9.057%, 7/02/2017 | | | | | 8,554,310 | | | 7,613,336 |
Atlas Air, Inc., Series 2000-1, Class C, 9.702%, 7/02/2011(f) | | | | | 201,720 | | | 141,204 |
Atlas Air, Inc., Series B, 7.680%, 1/02/2014 | | | | | 36,416,286 | | | 30,953,843 |
Atlas Air, Inc., Series C, 8.010%, 1/02/2010(f) | | | | | 6,552,024 | | | 4,586,417 |
Erac USA Finance Co., 7.000%, 10/15/2037, 144A | | | | | 2,675,000 | | | 2,504,094 |
| | | | | | | | |
| | | | | | | | 96,478,592 |
| | | | | | | | |
| Treasuries – 13.0% | | | | | | | | |
Canadian Government, 2.000%, 9/01/2012 | | CAD | | | 552,140,000 | | | 517,102,974 |
Canadian Government, 2.750%, 12/01/2010 | | CAD | | | 245,000 | | | 234,405 |
Canadian Government, 3.500%, 6/01/2013 | | CAD | | | 132,245,000 | | | 129,218,799 |
Canadian Government, 3.750%, 6/01/2012 | | CAD | | | 412,215,000 | | | 405,169,248 |
Canadian Government, 3.750%, 6/01/2019 | | CAD | | | 246,645,000 | | | 238,706,470 |
Canadian Government, 4.250%, 6/01/2018 | | CAD | | | 297,760,000 | | | 301,075,088 |
Canadian Government, 5.250%, 6/01/2012 | | CAD | | | 431,800,000 | | | 440,148,443 |
New Zealand Government, 6.000%, 12/15/2017 | | NZD | | | 33,000,000 | | | 24,403,391 |
Norwegian Government, 4.250%, 5/19/2017 | | NOK | | | 668,075,000 | | | 117,592,350 |
Norwegian Government, 5.000%, 5/15/2015 | | NOK | | | 319,620,000 | | | 58,804,026 |
Norwegian Government, 6.000%, 5/16/2011 | | NOK | | | 530,990,000 | | | 96,600,264 |
Norwegian Government, 6.500%, 5/15/2013 | | NOK | | | 379,945,000 | | | 72,456,612 |
U.S. Treasury Note, 3.125%, 5/15/2019 | | | | | 40,000,000 | | | 39,359,360 |
| | | | | | | | |
| | | | | | | | 2,440,871,430 |
| | | | | | | | |
| Wireless – 1.5% | | | | | | | | |
ALLTEL Corp., 6.800%, 5/01/2029 | | | | | 13,027,000 | | | 14,298,097 |
ALLTEL Corp., 7.875%, 7/01/2032 | | | | | 39,916,000 | | | 49,137,394 |
Nextel Communications, Inc., Series D, 7.375%, 8/01/2015 | | | | | 38,644,000 | | | 34,682,990 |
Nextel Communications, Inc., Series E, 6.875%, 10/31/2013 | | | | | 20,563,000 | | | 19,072,182 |
Nextel Communications, Inc., Series F, 5.950%, 3/15/2014 | | | | | 57,512,000 | | | 50,898,120 |
Rogers Wireless, Inc., 6.375%, 3/01/2014 | | | | | 1,895,000 | | | 2,091,959 |
Rogers Wireless, Inc., 7.625%, 12/15/2011 | | CAD | | | 6,990,000 | | | 7,215,046 |
Sprint Capital Corp., 6.875%, 11/15/2028 | | | | | 29,984,000 | | | 25,036,640 |
Sprint Capital Corp., 6.900%, 5/01/2019 | | | | | 23,845,000 | | | 21,341,275 |
Sprint Capital Corp., 8.750%, 3/15/2032 | | | | | 8,390,000 | | | 7,928,550 |
Sprint Nextel Corp., 6.000%, 12/01/2016 | �� | | | | 15,252,000 | | | 13,612,410 |
See accompanying notes to financial statements.
36
PORTFOLIO OF INVESTMENTS – as of September 30, 2009
Loomis Sayles Bond Fund – continued
| | | | | | | | |
| | | | | Principal Amount (‡) | | Value (†) |
| | | | | | | | |
| | | |
| BONDS AND NOTES – continued | | | | | | | | |
| | | |
| Wireless – continued | | | | | | | | |
True Move Co. Ltd., 10.375%, 8/01/2014, 144A | | | | $ | 400,000 | | $ | 374,000 |
True Move Co. Ltd., 10.750%, 12/16/2013, 144A | | | | | 37,210,000 | | | 35,721,600 |
| | | | | | | | |
| | | | | | | | 281,410,263 |
| | | | | | | | |
| Wirelines – 4.2% | | | | | | | | |
AT&T Corp., 6.500%, 3/15/2029 | | | | | 27,859,000 | | | 28,958,093 |
AT&T, Inc., 6.450%, 6/15/2034 | | | | | 35,000 | | | 36,876 |
AT&T, Inc., 6.500%, 9/01/2037 | | | | | 121,425,000 | | | 130,472,013 |
Axtel SAB de CV, 9.000%, 9/22/2019, 144A | | | | | 8,395,000 | | | 8,520,925 |
Bell Canada, MTN, 6.550%, 5/01/2029, 144A | | CAD | | | 5,790,000 | | | 5,324,648 |
Bell Canada, MTN, 7.300%, 2/23/2032 | | CAD | | | 12,705,000 | | | 12,696,931 |
Bell Canada, Series M-17, 6.100%, 3/16/2035 | | CAD | | | 45,835,000 | | | 39,978,960 |
BellSouth Corp., 6.550%, 6/15/2034 | | | | | 1,525,000 | | | 1,632,352 |
BellSouth Telecommunications, Inc., 7.000%, 12/01/2095 | | | | | 3,940,000 | | | 3,912,168 |
Embarq Corp., 7.995%, 6/01/2036 | | | | | 8,735,000 | | | 9,126,450 |
Frontier Communications Corp., 9.000%, 8/15/2031 | | | | | 730,000 | | | 715,400 |
GTE Corp., 6.940%, 4/15/2028 | | | | | 17,975,000 | | | 19,326,504 |
Hawaiian Telcom Communications, Inc., Series B, 12.500%, 5/01/2015(d) | | | | | 640,000 | | | 800 |
Koninklijke (Royal) KPN NV, EMTN, 5.750%, 3/18/2016 | | GBP | | | 1,600,000 | | | 2,677,300 |
Koninklijke (Royal) KPN NV, GMTN, 4.000%, 6/22/2015 | | EUR | | | 2,750,000 | | | 4,047,912 |
Level 3 Financing, Inc., 8.750%, 2/15/2017 | | | | | 43,605,000 | | | 36,192,150 |
Level 3 Financing, Inc., 9.250%, 11/01/2014 | | | | | 17,580,000 | | | 15,492,375 |
New England Telephone & Telegraph, 7.875%, 11/15/2029 | | | | | 2,905,000 | | | 3,296,580 |
Qwest Capital Funding, Inc., 6.500%, 11/15/2018 | | | | | 30,365,000 | | | 24,975,213 |
Qwest Capital Funding, Inc., 6.875%, 7/15/2028 | | | | | 64,147,000 | | | 48,430,985 |
Qwest Capital Funding, Inc., 7.625%, 8/03/2021 | | | | | 15,925,000 | | | 13,456,625 |
Qwest Capital Funding, Inc., 7.750%, 2/15/2031 | | | | | 40,420,000 | | | 32,234,950 |
Qwest Corp., 6.875%, 9/15/2033 | | | | | 40,555,000 | | | 32,849,550 |
Qwest Corp., 7.200%, 11/10/2026 | | | | | 1,505,000 | | | 1,256,675 |
Qwest Corp., 7.250%, 9/15/2025 | | | | | 10,620,000 | | | 9,159,750 |
Qwest Corp., 7.500%, 6/15/2023 | | | | | 2,890,000 | | | 2,629,900 |
Telecom Italia Capital SA, 6.000%, 9/30/2034 | | | | | 39,844,000 | | | 38,842,680 |
Telecom Italia Capital SA, 6.375%, 11/15/2033 | | | | | 26,495,000 | | | 27,072,379 |
Telefonica Emisiones SAU, 5.877%, 7/15/2019 | | | | | 10,330,000 | | | 11,223,710 |
Telefonica Emisiones SAU, 7.045%, 6/20/2036 | | | | | 71,169,000 | | | 84,221,822 |
Telus Corp., 4.950%, 3/15/2017 | | CAD | | | 45,415,000 | | | 43,397,592 |
Verizon Communications, Inc., 5.850%, 9/15/2035 | | | | | 62,131,000 | | | 62,550,881 |
Verizon Maryland, Inc., 5.125%, 6/15/2033 | | | | | 10,305,000 | | | 8,769,153 |
Verizon New York, Inc., Series B, 7.375%, 4/01/2032 | | | | | 10,310,000 | | | 11,304,956 |
Verizon Pennsylvania, Inc., 6.000%, 12/01/2028 | | | | | 7,860,000 | | | 7,327,210 |
| | | | | | | | |
| | | | | | | | 782,112,468 |
| | | | | | | | |
| | | |
| TOTAL NON-CONVERTIBLE BONDS | | | | | | | | |
(Identified Cost $15,700,415,275) | | | | | | | | 15,946,073,843 |
| | | | | | | | |
See accompanying notes to financial statements.
37
| | | | | | | | |
| | | | | Principal Amount (‡) | | Value (†) |
| | | | | | | | |
| | | |
| BONDS AND NOTES – continued | | | | | | | | |
| | | |
| CONVERTIBLE BONDS – 5.0% | | | | | | | | |
| | | |
| Airlines – 0.0% | | | | | | | | |
AMR Corp., 6.250%, 10/15/2014 | | | | $ | 4,145,000 | | $ | 4,378,156 |
| | | | | | | | |
| Diversified Manufacturing – 0.0% | | | | | | | | |
Trinity Industries, Inc., 3.875%, 6/01/2036 | | | | | 5,245,000 | | | 3,868,188 |
| | | | | | | | |
| Electric – 0.0% | | | | | | | | |
CMS Energy Corp., 5.500%, 6/15/2029 | | | | | 1,000,000 | | | 1,143,750 |
| | | | | | | | |
| Healthcare – 0.2% | | | | | | | | |
Affymetrix, Inc., 3.500%, 1/15/2038 | | | | | 18,449,000 | | | 14,851,445 |
Hologic, Inc., (Step to Zero Coupon on
12/15/2013), 2.000%, 12/15/2037(g) | | | | | 14,176,000 | | | 11,588,880 |
Life Technologies Corp., 1.500%, 2/15/2024 | | | | | 14,480,000 | | | 15,819,400 |
LifePoint Hospitals, Inc., 3.250%, 8/15/2025 | | | | | 285,000 | | | 249,375 |
LifePoint Hospitals, Inc., 3.500%, 5/15/2014 | | | | | 370,000 | | | 314,037 |
Omnicare, Inc., 3.250%, 12/15/2035 | | | | | 1,294,000 | | | 993,145 |
| | | | | | | | |
| | | | | | | | 43,816,282 |
| | | | | | | | |
| Independent Energy – 0.0% | | | | | | | | |
Penn Virginia Corp., 4.500%, 11/15/2012 | | | | | 3,130,000 | | | 2,817,000 |
| | | | | | | | |
| Industrial Other – 0.1% | | | | | | | | |
Incyte Corp., 3.500%, 2/15/2011 | | | | | 24,646,000 | | | 24,029,850 |
| | | | | | | | |
| Life Insurance – 0.0% | | | | | | | | |
MetLife, Inc., 6.400%, 12/15/2036 | | | | | 1,500,000 | | | 1,267,500 |
| | | | | | | | |
| Lodging – 0.2% | | | | | | | | |
Host Hotels & Resorts, Inc., 2.625%, 4/15/2027, 144A | | | | | 32,045,000 | | | 29,441,344 |
| | | | | | | | |
| Media Non-Cable – 0.0% | | | | | | | | |
Liberty Media LLC, 3.500%, 1/15/2031 | | | | | 10,184,386 | | | 6,250,667 |
| | | | | | | | |
| Metals & Mining – 0.2% | | | | | | | | |
ArcelorMittal, 5.000%, 5/15/2014 | | | | | 3,100,000 | | | 4,475,625 |
Steel Dynamics, Inc., 5.125%, 6/15/2014 | | | | | 1,255,000 | | | 1,480,900 |
United States Steel Corp., 4.000%, 5/15/2014 | | | | | 16,535,000 | | | 26,290,650 |
| | | | | | | | |
| | | | | | | | 32,247,175 |
| | | | | | | | |
| Non-Captive Diversified – 0.2% |
iStar Financial, Inc., 1.097%, 10/01/2012(b) | | | | | 60,585,000 | | | 30,292,500 |
| | | | | | | | |
| Oil Field Services – 0.1% | | | | | | | | |
Transocean, Inc., 1.500%, 12/15/2037 | | | | | 2,015,000 | | | 1,944,475 |
Transocean, Inc., Series C, 1.500%, 12/15/2037 | | | | | 11,525,000 | | | 10,977,563 |
| | | | | | | | |
| | | | | | | | 12,922,038 |
| | | | | | | | |
| Pharmaceuticals – 0.7% | | | | | | | | |
Human Genome Sciences, Inc., 2.250%, 10/15/2011 | | | | | 940,000 | | | 1,300,725 |
Human Genome Sciences, Inc., 2.250%, 8/15/2012 | | | | | 51,585,000 | | | 64,287,806 |
Kendle International, Inc., 3.375%, 7/15/2012 | | | | | 1,615,000 | | | 1,425,237 |
Nektar Therapeutics, 3.250%, 9/28/2012 | | | | | 26,120,000 | | | 23,703,900 |
Valeant Pharmaceuticals International, 4.000%, 11/15/2013 | | | | | 34,079,000 | | | 36,677,524 |
| | | | | | | | |
| | | | | | | | 127,395,192 |
| | | | | | | | |
See accompanying notes to financial statements.
38
PORTFOLIO OF INVESTMENTS – as of September 30, 2009
Loomis Sayles Bond Fund – continued
| | | | | | | | |
| | | | | Principal Amount (‡) | | Value (†) |
| | | | | | | | |
| | | |
| BONDS AND NOTES – continued | | | | | | | | |
| | | |
| REITs – 0.1% | | | | | | | | |
ProLogis, 1.875%, 11/15/2037 | | | | $ | 9,525,000 | | $ | 8,131,969 |
ProLogis, 2.250%, 4/01/2037 | | | | | 8,740,000 | | | 7,876,925 |
| | | | | | | | |
| | | | | | | | 16,008,894 |
| | | | | | | | |
| Technology – 2.4% | | | | | | | | |
Advanced Micro Devices, Inc., 5.750%, 8/15/2012 | | | | | 19,910,000 | | | 16,699,512 |
Alcatel-Lucent USA, Inc., Series B,
2.875%, 6/15/2025 | | | | | 1,630,000 | | | 1,361,050 |
Ciena Corp., 0.250%, 5/01/2013 | | | | | 330,000 | | | 263,588 |
Ciena Corp., 0.875%, 6/15/2017 | | | | | 13,350,000 | | | 9,194,812 |
Intel Corp., 2.950%, 12/15/2035 | | | | | 3,031,000 | | | 2,705,168 |
Intel Corp., 3.250%, 8/01/2039, 144A | | | | | 343,275,000 | | | 366,875,156 |
Kulicke & Soffa Industries, Inc.,
0.875%, 6/01/2012 | | | | | 10,025,000 | | | 8,207,969 |
Kulicke & Soffa Industries, Inc.,
1.000%, 6/30/2010 | | | | | 5,915,000 | | | 5,611,856 |
Maxtor Corp., 5.750%, 3/01/2012(c) | | | | | 8,415,000 | | | 7,657,650 |
Nortel Networks Corp., 2.125%, 4/15/2014(d) | | | | | 49,636,000 | | | 27,299,800 |
Richardson Electronics Ltd., 7.750%, 12/15/2011 | | | | | 395,000 | | | 351,550 |
| | | | | | | | |
| | | | | | | | 446,228,111 |
| | | | | | | | |
| Textile – 0.0% | | | | | | | | |
Dixie Yarns, Inc., 7.000%, 5/15/2012 | | | | | 123,000 | | | 100,860 |
| | | | | | | | |
| Wireless – 0.1% | | | | | | | | |
NII Holdings, Inc., 3.125%, 6/15/2012 | | | | | 21,974,000 | | | 19,199,783 |
| | | | | | | | |
| Wirelines – 0.7% | | | | | | | | |
Level 3 Communications, Inc.,
3.500%, 6/15/2012 | | | | | 48,075,000 | | | 38,219,625 |
Level 3 Communications, Inc.,
5.250%, 12/15/2011 | | | | | 20,240,000 | | | 18,013,600 |
Level 3 Communications, Inc., 7.000%, 3/15/2015, 144A(c) | | | | | 64,473,000 | | | 68,341,380 |
Level 3 Communications, Inc.,
10.000%, 5/01/2011 | | | | | 3,655,000 | | | 3,609,312 |
Qwest Communications International, Inc., 3.500%, 11/15/2025 | | | | | 700,000 | | | 706,125 |
| | | | | | | | |
| | | | | | | | 128,890,042 |
| | | | | | | | |
| |
| TOTAL CONVERTIBLE BONDS | | | |
(Identified Cost $905,436,510) | | | | | | | | 930,297,332 |
| | | | | | | | |
| | | |
| MUNICIPALS – 0.5% | | | | | | | | |
| | | |
| California – 0.3% | | | | | | | | |
San Jose California Redevelopment Agency Tax Allocation (Merged Area Redevelopment), 3.750%, 8/01/2028, Series C | | | | | 5,425,000 | | | 4,540,128 |
San Jose California Redevelopment Agency Tax Allocation (Merged Area), 3.750%, 8/01/2028, Series C, (Registered), (MBIA insured) | | | | | 2,165,000 | | | 1,922,260 |
State of California, 4.500%, 8/01/2027 (AMBAC insured) | | | | | 7,340,000 | | | 7,146,371 |
State of California, 4.500%, 10/01/2029 | | | | | 20,455,000 | | | 19,469,683 |
State of California, 4.500%, 8/01/2030 (AMBAC insured) | | | | | 5,945,000 | | | 5,629,023 |
State of California, 4.500%, 8/01/2030 | | | | | 5,140,000 | | | 4,866,809 |
State of California (Various Purpose), 3.250%, 12/01/2027 (MBIA insured) | | | | | 3,805,000 | | | 3,099,515 |
State of California (Various Purpose), 4.500%, 12/01/2033 (AMBAC insured) | | | | | 17,945,000 | | | 16,378,043 |
| | | | | | | | |
| | | | | | | | 63,051,832 |
| | | | | | | | |
See accompanying notes to financial statements.
39
| | | | | | | | |
| | | | | Principal Amount (‡) | | Value (†) |
| | | | | | | | |
| | | |
| BONDS AND NOTES – continued | | | | | | | | |
| | | |
| Illinois – 0.0% | | | | | | | | |
Chicago O’Hare International Airport, 4.500%, 1/01/2038, Series A (FSA insured) | | | | $ | 2,440,000 | | $ | 2,420,553 |
| | | | | | | | |
| Michigan – 0.1% | | | | | | | | |
Michigan Tobacco Settlement Finance Authority, 7.309%, 6/01/2034(c) | | | | | 21,265,000 | | | 17,000,517 |
| | | | | | | | |
| Nebraska – 0.1% | | | | | | | | |
Omaha Public Power District, 4.500%, 2/01/2034, Series AA (FGIC insured) | | | | | 8,840,000 | | | 8,998,590 |
| | | | | | | | |
| Ohio – 0.0% | | | | | | | | |
Buckeye Tobacco Settlement Financing Authority, Series A-2, 5.875%, 6/01/2047(c) | | | | | 10,390,000 | | | 8,428,368 |
| | | | | | | | |
| | | |
| Wisconsin – 0.0% | | | | | | | | |
Wisconsin Housing & Economic Development Authority, 4.900%, 11/01/2035, Series E | | | | | 1,185,000 | | | 1,185,533 |
| | | | | | | | |
| | | |
| TOTAL MUNICIPALS | | | | | | | | |
(Identified Cost $103,299,933) | | | | | | | | 101,085,393 |
| | | | | | | | |
| | | |
| TOTAL BONDS AND NOTES | | | | | | | | |
(Identified Cost $16,709,151,718) | | | | | | | | 16,977,456,568 |
| | | | | | | | |
| | | |
| BANK LOANS – 0.7% | | | | | | | | |
| | | |
| Airlines – 0.1% | | | | | | | | |
Delta Airlines, Inc., Secured Term Loan, 9/27/2013(h) | | | | | 8,395,000 | | | 8,332,037 |
| | | | | | | | |
| Media Non-Cable – 0.1% | | | | | | | | |
Idearc, Inc., Term Loan B, 6.250%, 11/17/2014(d)(i) | | | | | 42,409,833 | | | 17,935,967 |
Tribune Co., Term Loan X, 5.000%, 6/04/2009(d)(i)(l) | | | | | 4,666,005 | | | 2,265,952 |
| | | | | | | | |
| | | | | | | | 20,201,919 |
| | | | | | | | |
| Oil Field Services – 0.1% | | | | | | | | |
ATP Oil & Gas Corp., Tranche B-1 Term Loan, 8.500%, 7/15/2014(i) | | | | | 18,898,426 | | | 17,320,407 |
ATP Oil & Gas Corp., Tranche B-2 Term Loan, 9.000%, 1/15/2011(i) | | | | | 4,980,625 | | | 4,564,743 |
Dresser, Inc., Second Lien Term Loan, 5.994%, 5/04/2015(i) | | | | | 3,515,000 | | | 3,040,475 |
Dresser, Inc., Term Loan, 2.679%, 5/04/2014(i) | | | | | 1,734,381 | | | 1,621,646 |
| | | | | | | | |
| | | | | | | | 26,547,271 |
| | | | | | | | |
| Retailers – 0.0% | | | | | | | | |
Harbor Freight Tools USA, Inc., Tranche C Term Loan, 9.750%, 2/12/2013(i) | | | | | 2,214,193 | | | 2,225,264 |
| | | | | | | | |
| Technology – 0.2% | | | | | | | | |
Nuance Communications, Inc., Incremental Term Loan, 2.250%, 3/29/2013(i) | | | | | 9,666,368 | | | 9,234,282 |
Nuance Communications, Inc., Term Loan, 2.250%, 3/31/2013(i) | | | | | 773,985 | | | 739,387 |
Sungard Data Systems, Inc., Tranche A, 2.004%, 2/28/2014(i) | | | | | 632,314 | | | 591,056 |
Sungard Data Systems, Inc., Tranche B, 4.079%, 2/26/2016(i) | | | | | 17,522,673 | | | 17,058,322 |
| | | | | | | | |
| | | | | | | | 27,623,047 |
| | | | | | | | |
See accompanying notes to financial statements.
40
PORTFOLIO OF INVESTMENTS – as of September 30, 2009
Loomis Sayles Bond Fund – continued
| | | | | | | | |
| | | | | Principal Amount (‡) | | Value (†) |
| | | | | | | | |
| | | |
| BANK LOANS – continued | | | | | | | | |
| | | |
| Wirelines – 0.2% | | | | | | | | |
Fairpoint Communications, Inc., Initial Term Loan A, 4.750%, 3/31/2014(i) | | | | $ | 5,859,871 | | $ | 4,409,553 |
Fairpoint Communications, Inc., Initial Term Loan B, 5.000%, 3/31/2015(i) | | | | | 14,804,671 | | | 11,126,599 |
Fairpoint Communications, Inc., Initial Term Loan B, 3/31/2015(h) | | | | | 2,935,000 | | | 2,205,829 |
Hawaiian Telcom Communications, Inc., Tranche C Term Loan, 4.750%, 6/01/2014(i)(j) | | | | | 24,159,627 | | | 14,906,490 |
Level 3 Financing, Inc., Tranche A Term Loan, 2.683%, 3/13/2014(i) | | | | | 7,875,000 | | | 6,959,531 |
| | | | | | | | |
| | | | | | | | 39,608,002 |
| | | | | | | | |
| | | |
| TOTAL BANK LOANS | | | | | | | | |
(Identified Cost $140,593,428) | | | | | | | | 124,537,540 |
| | | | | | | | |
| | | |
| | | | | Shares | | |
| | | |
| PREFERRED STOCKS – 1.4% | | | | | | | | |
| | | |
| CONVERTIBLE PREFERRED STOCKS – 0.9% | | | | | | | | |
| | | |
| Automotive – 0.3% | | | | | | | | |
Ford Motor Co. Capital Trust II, 6.500% | | | | | 1,957,111 | | | 58,948,183 |
| | | | | | | | |
| | | |
| Capital Markets – 0.1% | | | | | | | | |
Newell Financial Trust I, 5.250% | | | | | 266,041 | | | 9,411,200 |
| | | | | | | | |
| Commercial Banks – 0.0% | | | | | | | | |
Wells Fargo & Co., Series L, Class A, 7.500% | | | | | 8,193 | | | 7,316,349 |
| | | | | | | | |
| Diversified Financial Services – 0.1% | | | | | | | | |
CIT Group, Inc., 8.750% | | | | | 5,360 | | | 33,178 |
Sovereign Capital Trust IV, 4.375% | | | | | 249,632 | | | 7,551,368 |
| | | | | | | | |
| | | | | | | | 7,584,546 |
| | | | | | | | |
| Electric Utilities – 0.1% | | | | | | | | |
AES Trust III, 6.750% | | | | | 346,577 | | | 15,271,049 |
CMS Energy Trust I, 7.750%(c)(e) | | | | | 208,375 | | | 7,293,125 |
| | | | | | | | |
| | | | | | | | 22,564,174 |
| | | | | | | | |
| Hotels, Restaurants & Leisure – 0.0% | | | | | | | | |
Six Flags, Inc., 7.250%(f) | | | | | 1 | | | 1 |
| | | | | | | | |
| Machinery – 0.0% | | | | | | | | |
United Rentals Trust, 6.500% | | | | | 206,396 | | | 5,134,101 |
| | | | | | | | |
| Oil, Gas & Consumable Fuels – 0.1% | | | | | | | | |
Chesapeake Energy Corp., 4.500% | | | | | 87,351 | | | 7,276,338 |
El Paso Energy Capital Trust I, 4.750% | | | | | 189,879 | | | 6,349,079 |
Williams Cos., Inc., 5.500% | | | | | 25,000 | | | 2,082,813 |
| | | | | | | | |
| | | | | | | | 15,708,230 |
| | | | | | | | |
| REITs – 0.0% | | | | | | | | |
FelCor Lodging Trust, Inc., Series A, 7.800% | | | | | 53,600 | | | 616,400 |
| | | | | | | | |
| Semiconductors & Semiconductor Equipment – 0.2% | | | | | | | | |
Lucent Technologies Capital Trust, 7.750% | | | | | 44,266 | | | 33,863,490 |
| | | | | | | | |
| | | |
| TOTAL CONVERTIBLE PREFERRED STOCKS | | | | | | | | |
(Identified Cost $185,857,294) | | | | | | | | 161,146,674 |
| | | | | | | | |
See accompanying notes to financial statements.
41
| | | | | | | |
| | | | | Shares | | Value (†) |
| | | | | | | |
| | | |
| NON-CONVERTIBLE PREFERRED STOCKS – 0.5% | | | | | | | |
| | | |
| Diversified Financial Services – 0.3% | | | | | | | |
Bank of America Corp., 6.375% | | | | 53,000 | | $ | 951,350 |
Bank of America Corp., Series L, 7.250% | | | | 21,799 | | | 18,529,150 |
CIT Group, Inc., Series A, 6.350% | | | | 352,663 | | | 899,291 |
Preferred Blocker, Inc., 7.000%, 144A | | | | 52,843 | | | 30,729,858 |
| | | | | | | |
| | | | | | | 51,109,649 |
| | | | | | | |
| Electric Utilities – 0.0% | | | | | | | |
Connecticut Light & Power Co., 1.900% | | | | 2,925 | | | 92,412 |
Entergy Arkansas, Inc., 4.320% | | | | 100 | | | 6,875 |
Entergy Mississippi, Inc., 4.360% | | | | 5,000 | | | 350,157 |
Entergy New Orleans, Inc., 4.360% | | | | 665 | | | 46,134 |
Entergy New Orleans, Inc., 4.750% | | | | 200 | | | 14,431 |
MDU Resources Group, Inc., 5.100% | | | | 1,091 | | | 107,293 |
Public Service Company of Oklahoma, 4.000% | | | | 360 | | | 25,594 |
Southern California Edison Co., 4.780% | | | | 50,100 | | | 1,007,010 |
Xcel Energy, Inc., 3.600% | | | | 1,100 | | | 68,222 |
| | | | | | | |
| | | | | | | 1,718,128 |
| | | | | | | |
| Thrifts & Mortgage Finance – 0.2% | | | | | | | |
Countrywide Capital IV, 6.750% | | | | 534,725 | | | 10,785,403 |
Federal Home Loan Mortgage Corp., 5.000%(f)(k) | | | | 104,800 | | | 277,720 |
Federal Home Loan Mortgage Corp., 5.570%(f)(k) | | | | 2,451,457 | | | 3,922,331 |
Federal Home Loan Mortgage Corp., 5.660%(f)(k) | | | | 624,479 | | | 1,030,390 |
Federal Home Loan Mortgage Corp., 5.700%(f)(k) | | | | 171,050 | | | 439,598 |
Federal Home Loan Mortgage Corp., 5.790%(f)(k) | | | | 399,250 | | | 1,062,005 |
Federal Home Loan Mortgage Corp., 5.810%(f)(k) | | | | 115,450 | | | 315,178 |
Federal Home Loan Mortgage Corp., 5.900%(f)(k) | | | | 310,023 | | | 527,039 |
Federal Home Loan Mortgage Corp., 6.000%(f)(k) | | | | 134,800 | | | 397,660 |
Federal Home Loan Mortgage Corp., 6.420%(f)(k) | | | | 125,980 | | | 377,940 |
Federal Home Loan Mortgage Corp., 6.550%(f)(k) | | | | 541,540 | | | 985,603 |
Federal Home Loan Mortgage Corp., (fixed rate to 12/31/2012, variable rate thereafter), 8.375%(f)(k) | | | | 5,366,843 | | | 9,713,986 |
Federal National Mortgage Association, 4.750%(f)(k) | | | | 270,954 | | | 690,933 |
Federal National Mortgage Association, 5.125%(f)(k) | | | | 204,700 | | | 544,502 |
Federal National Mortgage Association, 5.375%(f)(k) | | | | 146,350 | | | 415,634 |
Federal National Mortgage Association, 5.810%(f)(k) | | | | 79,850 | | | 222,782 |
Federal National Mortgage Association, 6.750%(f)(k) | | | | 123,143 | | | 193,335 |
Federal National Mortgage Association, 8.250%(f)(k) | | | | 250,000 | | | 395,000 |
Federal National Mortgage Association, (fixed rate to 12/13/2010, variable rate thereafter), 8.250%(f)(k) | | | | 9,415,246 | | | 15,158,546 |
| | | | | | | |
| | | | | | | 47,455,585 |
| | | | | | | |
| | | |
| TOTAL NON-CONVERTIBLE PREFERRED STOCKS | | | | | | | |
(Identified Cost $443,178,524) | | | | | | | 100,283,362 |
| | | | | | | |
| | | |
| TOTAL PREFERRED STOCKS | | | | | | | |
(Identified Cost $629,035,818) | | | | | | | 261,430,036 |
| | | | | | | |
See accompanying notes to financial statements.
42
PORTFOLIO OF INVESTMENTS – as of September 30, 2009
Loomis Sayles Bond Fund – continued
| | | | | | | |
| | | | | Shares | | Value (†) |
| | | | | | | |
| COMMON STOCKS – 0.7% | | | | | | | |
| | | |
| Biotechnology – 0.3% | | | | | | | |
EPIX Pharmaceuticals, Inc.(f) | | | | 2,414,358 | | $ | 33,801 |
EPIX Pharmaceuticals, Inc., Contingent Value Rights(f) | | | | 7,122 | | | — |
Vertex Pharmaceuticals, Inc.(f) | | | | 1,409,794 | | | 53,431,193 |
| | | | | | | |
| | | | | | | 53,464,994 |
| | | | | | | |
| Containers & Packaging – 0.1% | | | | | | | |
Owens-Illinois, Inc.(f) | | | | 645,508 | | | 23,819,245 |
| | | | | | | |
| | | |
| Electronic Equipment Instruments & Components – 0.1% | | | | | | | |
Corning, Inc. | | | | 630,490 | | | 9,652,802 |
| | | | | | | |
| Oil, Gas & Consumable Fuels – 0.1% | | | | | | | |
Chesapeake Energy Corp. | | | | 1,026,979 | | | 29,166,204 |
| | | | | | | |
| Thrifts & Mortgage Finance – 0.1% | | | | | | | |
Federal Home Loan Mortgage Corp.(f)(k) | | | | 6,751,988 | | | 12,153,578 |
| | | | | | | |
| | | |
| TOTAL COMMON STOCKS | | | | | | | |
(Identified Cost $186,398,096) | | | | | | | 128,256,823 |
| | | | | | | |
| | | |
CLOSED END INVESTMENT
COMPANIES – 0.2% | | | | | | | |
BlackRock Senior High Income Fund, Inc. | | | | 191,806 | | | 657,894 |
Dreyfus High Yield Strategies Fund | | | | 1,033,274 | | | 3,668,123 |
DWS High Income Trust | | | | 88,954 | | | 730,312 |
Highland Credit Strategies Fund | | | | 860,000 | | | 5,461,000 |
Morgan Stanley Emerging Markets Debt Fund, Inc. | | | | 356,954 | | | 3,416,050 |
Van Kampen High Income Trust II | | | | 28,322 | | | 391,693 |
Western Asset High Income Opportunity Fund, Inc. | | | | 2,217,450 | | | 12,905,559 |
Western Asset Managed High Income Fund, Inc. | | | | 1,218,442 | | | 7,359,390 |
| | | | | | | |
| | | |
| TOTAL CLOSED END INVESTMENT COMPANIES | | | | | | | |
(Identified Cost $44,128,614) | | | | | | | 34,590,021 |
| | | | | | | |
| | | |
| EXCHANGE TRADED FUNDS – 0.5% | | | | | | | |
iShares iBoxx $ High Yield Corporate Bond Fund | | | | 588,799 | | | 50,842,794 |
SPDR Barclays Capital High Yield Bond | | | | 1,096,133 | | | 42,190,159 |
| | | | | | | |
| | | |
| TOTAL EXCHANGE TRADED FUNDS | | | | | | | |
(Identified Cost $84,443,248) | | | | | | | 93,032,953 |
| | | | | | | |
| | | |
| WARRANTS – 0.0% | | | | | | | |
| | | |
| PHARMACEUTICALS – 0.0% | | | | | | | |
Valeant Pharmaceuticals International, Expiration 08/16/2010(e)(f)
(Identified Cost $0) | | | | 862,648 | | | — |
| | | | | | | |
See accompanying notes to financial statements.
43
| | | | | | | | |
| | | | | Principal Amount (‡) | | Value (†) |
| | | |
| SHORT-TERM INVESTMENTS – 5.6% | | | | | | | | |
| Repurchase Agreement with State Street Corporation dated 9/30/2009 at 0.000%, to be repurchased at $168,803 on 10/01/2009 collateralized by $175,000 U.S. Treasury Bill, due 11/05/2009 valued at $174,993 including accrued interest (Note 2i of Notes to Financial Statements) | | | | $ | 168,803 | | $ | 168,803 |
| Tri-Party Repurchase Agreement with Fixed Income Clearing Corporation, dated 9/30/2009 at 0.000%, to be repurchased at $1,044,208,939 on 10/01/2009 collateralized by $94,885,000 Federal Home Loan Mortgage Corp., 5.625% due 11/23/2035 valued at $99,164,314; $175,750,000 Federal Home Loan Mortgage Corp., 3.030% due 5/05/2014 valued at $177,287,813; $150,000,000 Federal National Mortgage Association, 5.000% due 4/15/2015 valued at $169,440,000; $12,010,000 Federal National Mortgage Association, 5.450% due 10/18/2021 valued at $13,421,175; $50,000,000 Federal National Mortgage Association, 3.300% due 7/30/2014 valued at $50,687,500; $98,370,000 Federal Home Loan Mortgage Corp., 2.350% due 8/27/2012 valued at $99,353,700; $410,650,000 Federal Home Loan Mortgage Corp., 2.100% due 9/24/2012 valued at $410,650,000; $45,120,000 Federal Home Loan Mortgage Corp. Discount Note, due 12/31/2009 valued at $45,097,440 including accrued interest (Note 2i of Notes to Financial Statements) | | | | | 1,044,208,939 | | | 1,044,208,939 |
| | | | | | | | |
| | | |
| TOTAL SHORT-TERM INVESTMENTS | | | | | | | | |
(Identified Cost $1,044,377,742) | | | | | | | | 1,044,377,742 |
| | | | | | | | |
| | | |
| TOTAL INVESTMENTS – 99.7% | | | | | | | | |
(Identified Cost $18,838,128,664)(a) | | | | | | | | 18,663,681,683 |
Other assets less liabilities—0.3% | | | | | | | | 64,759,635 |
| | | | | | | | |
| | | |
| NET ASSETS – 100.0% | | | | | | | $ | 18,728,441,318 |
| | | | | | | | |
| | | | | | | |
(‡) Principal amount stated in U.S. dollars unless otherwise noted. | | | |
(†) See Note 2a of Notes to Financial Statements. | | | |
(††) Amount shown represents units. One unit represents a principal amount of 25. | | | |
(†††) Amount shown represents units. One unit represents a principal amount of 100. | | | |
(a) Federal Tax Information: At September 30, 2009, the net unrealized depreciation on investments based on a cost of $18,921,788,496 for federal income tax purposes was as follows: | | | |
Aggregate gross unrealized appreciation for all investments in which there is an excess of value over tax cost | | $ | 1,172,869,690 |
Aggregate gross unrealized depreciation for all investments in which there is an excess of tax cost over value | | | (1,430,976,503) |
| | | | | | | |
Net unrealized depreciation | | $ | (258,106,813) |
| | | | | | | |
| (b) | Variable rate security. Rate as of September 30, 2009 is disclosed. |
| (c) | Illiquid security. At September 30, 2009, the value of these securities amounted to $581,791,241 or 3.1% of net assets. |
| (d) | The issuer is in default with respect to interest and/or principal payments. Income is not being accrued. |
| (e) | Fair valued security by the Fund’s investment adviser. At September 30, 2009 the value of these securities amounted to $12,722,119 or 0.1% of net assets. |
| (f) | Non-income producing security. |
| (g) | Step Bond: Coupon is a fixed rate for an initial period then resets at a specified date and rate. |
| (h) | All or a portion of this security has not settled. Contract rates are not determined and do not take effect until settlement date. |
| (i) | Variable rate security. Rate shown represents the weighted average rate at September 30, 2009. |
| (j) | All or a portion of interest payment is paid-in-kind. |
| (k) | Future dividend payments have been eliminated as the issuer has been placed in conservatorship. |
See accompanying notes to financial statements.
44
PORTFOLIO OF INVESTMENTS – as of September 30, 2009
Loomis Sayles Bond Fund – continued
| (l) | Issuer has filed for bankruptcy. |
| 144A | Securities exempt from registration under Rule 144A of the Securities Act of 1933. These securities may be resold in transactions exempt from registration, normally to qualified institutional buyers. At September 30, 2009, the total value of these securities amounted to $2,329,191,009 or 12.4% of net assets. |
| ABS | Asset-Backed Securities |
| AMBAC | American Municipal Bond Assurance Corp. |
| EMTN | Euro Medium Term Note |
| FGIC | Financial Guaranty Insurance Company |
| FHLMC | Federal Home Loan Mortgage Corp. |
| FSA | Financial Security Assurance, Inc. |
| GMTN | Global Medium Term Note |
| MBIA | Municipal Bond Investor Assurance Corp. |
| REITs | Real Estate Investment Trusts |
Key to Abbreviations: AUD: Australian Dollar; BRL: Brazilian Real; CAD: Canadian Dollar; EUR: Euro; GBP: British Pound; IDR: Indonesian Rupiah; ISK: Icelandic Krona; KRW: South Korean Won; MXN: Mexican Peso; NOK: Norwegian Krone; NZD: New Zealand Dollar; SGD: Singapore Dollar; THB: Thai Baht
INDUSTRY SUMMARY AT SEPTEMBER 30, 2009 (Unaudited)
| | | |
Treasuries | | 13.0 | % |
Banking | | 6.7 | |
Non-Captive Diversified | | 5.9 | |
Wirelines | | 5.1 | |
Technology | | 4.9 | |
Sovereigns | | 4.5 | |
Healthcare | | 3.7 | |
Automotive | | 3.2 | |
Non-Captive Consumer | | 3.1 | |
Electric | | 2.8 | |
Supranational | | 2.7 | |
Paper | | 2.5 | |
Oil Field Services | | 2.5 | |
Retailers | | 2.4 | |
Media Cable | | 2.3 | |
Pipelines | | 2.2 | |
Other Investments, less than 2% each | | 26.6 | |
Short-Term Investments | | 5.6 | |
| | | |
Total Investments | | 99.7 | |
Other assets less liabilities | | 0.3 | |
| | | |
Net Assets | | 100.0 | % |
| | | |
CURRENCY EXPOSURE AT SEPTEMBER 30, 2009 AS A PERCENTAGE OF NET ASSETS (Unaudited)
| | | |
United States Dollar | | 71.7 | % |
Canadian Dollar | | 12.8 | |
New Zealand Dollar | | 2.6 | |
Other, less than 2% each | | 12.6 | |
| | | |
Total Investments | | 99.7 | |
Other assets less liabilities | | 0.3 | |
| | | |
Net Assets | | 100.0 | % |
| | | |
See accompanying notes to financial statements.
45
PORTFOLIO OF INVESTMENTS – as of September 30, 2009
Loomis Sayles Fixed Income Fund
| | | | | | | | |
| | | | | Principal Amount (‡) | | Value (†) |
| | | | | | | | |
| | | |
| BONDS AND NOTES – 93.1% of Net Assets | | | | | | | | |
| | | |
| NON-CONVERTIBLE BONDS – 88.6% | | | | | | | | |
| | | |
| ABS Credit Card – 0.6% | | | | | | | | |
Citibank Credit Card Issuance Trust, Series 2008-C6, Class C6, 6.300%, 6/20/2014 | | | | $ | 4,265,000 | | $ | 4,412,002 |
| | | | | | | | |
| ABS Other – 0.1% | | | | | | | | |
Community Program Loan Trust, Series 1987-A, Class A5, 4.500%, 4/01/2029 | | | | | 725,000 | | | 653,350 |
| | | | | | | | |
| Aerospace & Defense – 0.0% | | | | | | | | |
Bombardier, Inc., 7.450%, 5/01/2034, 144A | | | | | 175,000 | | | 152,688 |
| | | | | | | | |
| Airlines – 0.6% | | | | | | | | |
American Airlines, Inc., Pass Through Trust, Series 1999-1, Class B, 7.324%, 4/15/2011 | | | | | 250,000 | | | 249,375 |
American Airlines, Inc., Pass Through Trust, Series 2009-1A, 10.375%, 7/02/2019 | | | | | 995,000 | | | 1,052,143 |
American Airlines, Inc., Pass Through Trust, Series 93A6, 8.040%, 9/16/2011 | | | | | 15,049 | | | 9,876 |
Continental Airlines, Inc., Series 2000-2, Class B, 8.307%, 10/02/2019 | | | | | 117,989 | | | 103,830 |
Continental Airlines, Inc., Series 2001-1, Class B, 7.373%, 6/15/2017 | | | | | 186,834 | | | 155,072 |
Continental Airlines, Inc., Series 971A, 7.461%, 10/01/2016 | | | | | 429,072 | | | 400,110 |
Delta Air Lines, Inc., 9.500%, 9/15/2014, 144A | | | | | 610,000 | | | 610,000 |
Delta Air Lines, Inc., Series 2007-1, Class C, 8.954%, 8/10/2014 | | | | | 1,680,127 | | | 1,368,463 |
United Air Lines, Inc., Series 2007-1, Class A, 6.636%, 10/02/2024 | | | | | 1,178,775 | | | 978,383 |
| | | | | | | | |
| | | | | | | | 4,927,252 |
| | | | | | | | |
| Automotive – 3.1% | | | | | | | | |
Cummins, Inc., 7.125%, 3/01/2028 | | | | | 2,400,000 | | | 2,274,000 |
FCE Bank PLC, EMTN, 4.625%, 10/25/2010 | | NOK | | | 50,000 | | | 7,964 |
FCE Bank PLC, EMTN, 7.125%, 1/16/2012 | | EUR | | | 300,000 | | | 417,054 |
FCE Bank PLC, EMTN, 7.125%, 1/15/2013 | | EUR | | | 200,000 | | | 270,720 |
FCE Bank PLC, EMTN, 7.875%, 2/15/2011 | | GBP | | | 300,000 | | | 469,857 |
Ford Motor Co., 6.375%, 2/01/2029 | | | | | 730,000 | | | 525,600 |
Ford Motor Co., 6.500%, 8/01/2018 | | | | | 50,000 | | | 39,813 |
Ford Motor Co., 6.625%, 10/01/2028 | | | | | 2,435,000 | | | 1,753,200 |
Ford Motor Co., 7.125%, 11/15/2025 | | | | | 595,000 | | | 446,250 |
Ford Motor Co., 7.450%, 7/16/2031 | | | | | 5,065,000 | | | 4,102,650 |
Ford Motor Credit Co. LLC, 7.000%, 10/01/2013 | | | | | 230,000 | | | 215,881 |
Ford Motor Credit Co. LLC, 7.250%, 10/25/2011 | | | | | 140,000 | | | 135,969 |
Ford Motor Credit Co. LLC, 7.500%, 8/01/2012 | | | | | 1,355,000 | | | 1,301,026 |
Ford Motor Credit Co. LLC, 7.875%, 6/15/2010 | | | | | 500,000 | | | 502,191 |
Ford Motor Credit Co. LLC, 8.000%, 6/01/2014 | | | | | 10,915,000 | | | 10,489,282 |
Ford Motor Credit Co. LLC, 8.000%, 12/15/2016 | | | | | 565,000 | | | 524,188 |
Goodyear Tire & Rubber Co. (The), 7.000%, 3/15/2028 | | | | | 375,000 | | | 326,250 |
| | | | | | | | |
| | | | | | | | 23,801,895 |
| | | | | | | | |
| Banking – 7.3% | | | | | | | | |
AgriBank FCB, 9.125%, 7/15/2019(b) | | | | | 4,330,000 | | | 4,682,956 |
Associates Corp. of North America, 6.950%, 11/01/2018 | | | | | 1,710,000 | | | 1,673,016 |
See accompanying notes to financial statements.
46
PORTFOLIO OF INVESTMENTS – as of September 30, 2009
Loomis Sayles Fixed Income Fund – continued
| | | | | | | | |
| | | | | Principal Amount (‡) | | Value (†) |
| | | | | | | | |
| | | |
| BONDS AND NOTES – continued | | | | | | | | |
| | | |
| Banking – continued | | | | | | | | |
BAC Capital Trust VI, 5.625%, 3/08/2035 | | | | $ | 2,385,000 | | $ | 1,849,305 |
Bank of America Corp., 4.850%, 11/15/2014 | | | | | 500,000 | | | 494,148 |
Barclays Financial LLC, 4.060%, 9/16/2010, 144A | | KRW | | | 2,340,000,000 | | | 2,005,062 |
Barclays Financial LLC, 4.160%, 2/22/2010, 144A | | THB | | | 175,000,000 | | | 5,313,903 |
Barclays Financial LLC, EMTN, 4.100%, 3/22/2010, 144A | | THB | | | 45,000,000 | | | 1,369,261 |
BNP Paribas SA, EMTN, Zero Coupon, 6/13/2011, 144A | | IDR | | | 18,710,000,000 | | | 1,632,697 |
Citigroup, Inc., 5.000%, 9/15/2014 | | | | | 6,020,000 | | | 5,728,542 |
Citigroup, Inc., 5.850%, 12/11/2034 | | | | | 415,000 | | | 356,219 |
Citigroup, Inc., 5.875%, 2/22/2033 | | | | | 2,795,000 | | | 2,316,577 |
Citigroup, Inc., 5.875%, 5/29/2037 | | | | | 570,000 | | | 496,985 |
Citigroup, Inc., 6.000%, 10/31/2033 | | | | | 1,460,000 | | | 1,221,767 |
Citigroup, Inc., 6.125%, 8/25/2036 | | | | | 225,000 | | | 193,095 |
Goldman Sachs Group, Inc. (The), 6.150%, 4/01/2018 | | | | | 1,955,000 | | | 2,056,490 |
Goldman Sachs Group, Inc. (The), 6.750%, 10/01/2037 | | | | | 1,470,000 | | | 1,517,086 |
JPMorgan Chase & Co., EMTN, Zero Coupon, 3/28/2011 | | IDR | | | 24,502,029,000 | | | 2,201,253 |
JPMorgan Chase & Co., Zero Coupon, 3/28/2011, 144A | | IDR | | | 17,920,000,000 | | | 1,609,926 |
JPMorgan Chase & Co., Zero Coupon, 4/12/2012, 144A | | IDR | | | 21,194,634,240 | | | 1,714,649 |
JPMorgan Chase & Co., Zero Coupon, 5/17/2010, 144A | | BRL | | | 16,585,000 | | | 8,816,749 |
JPMorgan Chase London, EMTN, Zero Coupon, 10/21/2010, 144A | | IDR | | | 18,824,303,000 | | | 1,789,526 |
Merrill Lynch & Co., Inc., 6.110%, 1/29/2037 | | | | | 600,000 | | | 570,695 |
Merrill Lynch & Co., Inc., EMTN, 4.625%, 9/14/2018 | | EUR | | | 1,000,000 | | | 1,265,100 |
Merrill Lynch & Co., Inc., Series C, MTN, 6.050%, 6/01/2034 | | | | | 300,000 | | | 280,125 |
Morgan Stanley, 4.750%, 4/01/2014 | | | | | 1,795,000 | | | 1,781,753 |
Morgan Stanley, EMTN, 5.450%, 1/09/2017 | | | | | 370,000 | | | 370,517 |
Morgan Stanley, GMTN, 5.125%, 11/30/2015 | | GBP | | | 350,000 | | | 550,632 |
Morgan Stanley, Series F, MTN, 5.550%, 4/27/2017 | | | | | 800,000 | | | 796,966 |
Morgan Stanley, Series F, MTN, 5.950%, 12/28/2017 | | | �� | | 625,000 | | | 636,340 |
| | | | | | | | |
| | | | | | | | 55,291,340 |
| | | | | | | | |
| Building Materials – 1.2% | | | | | | | | |
Masco Corp., 0.600%, 3/12/2010(c) | | | | | 1,675,000 | | | 1,648,393 |
Masco Corp., 4.800%, 6/15/2015 | | | | | 860,000 | | | 789,204 |
Masco Corp., 5.850%, 3/15/2017 | | | | | 240,000 | | | 221,339 |
Masco Corp., 6.125%, 10/03/2016 | | | | | 2,600,000 | | | 2,464,511 |
Masco Corp., 6.500%, 8/15/2032 | | | | | 305,000 | | | 246,781 |
Owens Corning, Inc., 6.500%, 12/01/2016 | | | | | 805,000 | | | 785,432 |
Owens Corning, Inc., 7.000%, 12/01/2036 | | | | | 2,050,000 | | | 1,679,737 |
USG Corp., 6.300%, 11/15/2016 | | | | | 1,680,000 | | | 1,428,000 |
| | | | | | | | |
| | | | | | | | 9,263,397 |
| | | | | | | | |
See accompanying notes to financial statements.
47
| | | | | | | | |
| | | | | Principal Amount (‡) | | Value (†) |
| | | | | | | | |
| | | |
| BONDS AND NOTES – continued | | | | | | | | |
| | | |
| Chemicals – 1.8% | | | | | | | | |
Borden, Inc., 7.875%, 2/15/2023 | | | | $ | 5,240,000 | | $ | 2,934,400 |
Borden, Inc., 8.375%, 4/15/2016 | | | | | 55,000 | | | 36,300 |
Borden, Inc., 9.200%, 3/15/2021 | | | | | 905,000 | | | 561,100 |
Chevron Phillips Chemical Co. LLC, 8.250%, 6/15/2019, 144A | | | | | 3,440,000 | | | 4,154,533 |
Cytec Industries, Inc., 8.950%, 7/01/2017 | | | | | 2,500,000 | | | 2,763,467 |
ICI Wilmington, Inc., 5.625%, 12/01/2013 | | | | | 115,000 | | | 117,788 |
Lubrizol Corp., 5.500%, 10/01/2014 | | | | | 365,000 | | | 391,917 |
Lubrizol Corp., 6.500%, 10/01/2034 | | | | | 1,170,000 | | | 1,221,918 |
Methanex Corp., 6.000%, 8/15/2015 | | | | | 1,565,000 | | | 1,329,817 |
| | | | | | | | |
| | | | | | | | 13,511,240 |
| | | | | | | | |
Commercial Mortgage-Backed
Securities – 0.1% | | | | | | | | |
GS Mortgage Securities Corp. II, Series 2005-GG4, Class A4A, 4.751%, 7/10/2039 | | | | | 95,000 | | | 89,062 |
Merrill Lynch/Countrywide Commercial Mortgage Trust, Series 2007-6, Class A4, 5.485%, 3/12/2051 | | | | | 1,000,000 | | | 778,704 |
| | | | | | | | |
| | | | | | | | 867,766 |
| | | | | | | | |
| Construction Machinery – 0.1% | | | | | | | | |
Caterpillar Financial Services Corp., MTN, 6.125%, 2/17/2014 | | | | | 110,000 | | | 120,595 |
Toro Co., 6.625%, 5/01/2037(b) | | | | | 965,000 | | | 769,251 |
United Rentals North America, Inc., 7.000%, 2/15/2014 | | | | | 55,000 | | | 47,850 |
| | | | | | | | |
| | | | | | | | 937,696 |
| | | | | | | | |
| Distributors – 0.1% | | | | | | | | |
ONEOK, Inc., 6.000%, 6/15/2035 | | | | | 1,000,000 | | | 987,128 |
| | | | | | | | |
| Diversified Manufacturing – 0.4% | | | | | | | | |
Textron, Inc., 6.200%, 3/15/2015 | | | | | 1,910,000 | | | 1,917,562 |
Textron, Inc., 7.250%, 10/01/2019 | | | | | 1,290,000 | | | 1,307,206 |
| | | | | | | | |
| | | | | | | | 3,224,768 |
| | | | | | | | |
| Electric – 3.4% | | | | | | | | |
AES Corp. (The), 7.750%, 3/01/2014 | | | | | 730,000 | | | 735,475 |
Bruce Mansfield Unit, 6.850%, 6/01/2034(b) | | | | | 4,219,957 | | | 4,121,126 |
Dynegy Holdings, Inc., 7.125%, 5/15/2018 | | | | | 380,000 | | | 292,600 |
Dynegy Holdings, Inc., 7.625%, 10/15/2026 | | | | | 810,000 | | | 554,850 |
Empresa Nacional de Electricidad SA (Endesa-Chile), 7.875%, 2/01/2027 | | | | | 1,589,000 | | | 1,761,256 |
Enersis SA, 7.375%, 1/15/2014 | | | | | 275,000 | | | 303,403 |
Enersis SA, 7.400%, 12/01/2016 | | | | | 4,000,000 | | | 4,466,960 |
Mackinaw Power LLC, 6.296%, 10/31/2023, 144A | | | | | 3,863,356 | | | 3,651,297 |
NGC Corp. Capital Trust I, Series B, 8.316%, 6/01/2027 | | | | | 695,000 | | | 312,750 |
NiSource Finance Corp., 5.250%, 9/15/2017 | | | | | 250,000 | | | 234,909 |
NiSource Finance Corp., 6.150%, 3/01/2013 | | | | | 850,000 | | | 890,095 |
NiSource Finance Corp., 6.400%, 3/15/2018 | | | | | 2,855,000 | | | 2,849,678 |
Power Receivables Finance LLC, 6.290%, 1/01/2012, 144A | | | | | 583,166 | | | 595,349 |
Quezon Power Philippines Co., 8.860%, 6/15/2017 | | | | | 1,264,900 | | | 1,182,682 |
TXU Corp., Series P, 5.550%, 11/15/2014 | | | | | 765,000 | | | 522,072 |
TXU Corp., Series Q, 6.500%, 11/15/2024 | | | | | 1,515,000 | | | 700,718 |
TXU Corp., Series R, 6.550%, 11/15/2034 | | | | | 1,275,000 | | | 573,510 |
White Pine Hydro LLC, 6.310%, 7/10/2017(b) | | | | | 450,000 | | | 388,090 |
See accompanying notes to financial statements.
48
PORTFOLIO OF INVESTMENTS – as of September 30, 2009
Loomis Sayles Fixed Income Fund – continued
| | | | | | | | |
| | | | | Principal Amount (‡) | | Value (†) |
| | | | | | | | |
| | | |
| BONDS AND NOTES – continued | | | | | | | | |
| | | |
| Electric – continued | | | | | | | | |
White Pine Hydro LLC, 6.960%, 7/10/2037(b) | | | | $ | 670,000 | | $ | 488,891 |
White Pine Hydro Portfolio LLC,
7.260%, 7/20/2015(b) | | | | | 1,280,000 | | | 1,127,338 |
| | | | | | | | |
| | | | | | | | 25,753,049 |
| | | | | | | | |
| Entertainment – 1.4% | | | | | | | | |
Time Warner, Inc., 6.625%, 5/15/2029 | | | | | 2,065,000 | | | 2,118,872 |
Time Warner, Inc., 6.950%, 1/15/2028 | | | | | 875,000 | | | 922,517 |
Time Warner, Inc., 7.625%, 4/15/2031 | | | | | 730,000 | | | 818,140 |
Time Warner, Inc., 7.700%, 5/01/2032 | | | | | 1,155,000 | | | 1,306,059 |
Viacom, Inc., Class B, 6.875%, 4/30/2036 | | | | | 4,880,000 | | | 5,155,207 |
| | | | | | | | |
| | | | | | | | 10,320,795 |
| | | | | | | | |
| Food & Beverage – 1.0% | | | | | | | | |
Anheuser-Busch Cos., Inc., 5.375%, 11/15/2014, 144A | | | | | 5,730,000 | | | 6,113,853 |
Corn Products International, Inc., 6.625%, 4/15/2037 | | | | | 1,540,000 | | | 1,554,599 |
Sara Lee Corp., 6.125%, 11/01/2032 | | | | | 295,000 | | | 300,300 |
| | | | | | | | |
| | | | | | | | 7,968,752 |
| | | | | | | | |
| Government Owned – No Guarantee – 0.2% | | | | | | | | |
DP World Ltd., 6.850%, 7/02/2037, 144A | | | | | 2,000,000 | | | 1,758,978 |
| | | | | | | | |
| Health Insurance – 0.3% | | | | | | | | |
CIGNA Corp., 6.350%, 3/15/2018 | | | | | 2,000,000 | | | 2,005,432 |
| | | | | | | | |
| Healthcare – 2.5% | | | | | | | | |
Boston Scientific Corp., 5.450%, 6/15/2014 | | | | | 290,000 | | | 290,725 |
Boston Scientific Corp., 6.400%, 6/15/2016 | | | | | 860,000 | | | 871,825 |
Boston Scientific Corp., 7.000%, 11/15/2035 | | | | | 860,000 | | | 787,975 |
HCA, Inc., 5.750%, 3/15/2014 | | | | | 455,000 | | | 401,538 |
HCA, Inc., 6.250%, 2/15/2013 | | | | | 2,345,000 | | | 2,239,475 |
HCA, Inc., 6.375%, 1/15/2015 | | | | | 410,000 | | | 364,900 |
HCA, Inc., 6.500%, 2/15/2016 | | | | | 610,000 | | | 541,375 |
HCA, Inc., 6.750%, 7/15/2013 | | | | | 115,000 | | | 110,113 |
HCA, Inc., 7.050%, 12/01/2027 | | | | | 3,545,000 | | | 2,688,603 |
HCA, Inc., 7.190%, 11/15/2015 | | | | | 820,000 | | | 759,519 |
HCA, Inc., 7.500%, 12/15/2023 | | | | | 1,475,000 | | | 1,190,720 |
HCA, Inc., 7.500%, 11/06/2033 | | | | | 1,440,000 | | | 1,114,239 |
HCA, Inc., 7.690%, 6/15/2025 | | | | | 2,660,000 | | | 2,160,066 |
HCA, Inc., 8.360%, 4/15/2024 | | | | | 2,220,000 | | | 1,806,498 |
HCA, Inc., MTN, 7.580%, 9/15/2025 | | | | | 2,930,000 | | | 2,370,490 |
HCA, Inc., MTN, 7.750%, 7/15/2036 | | | | | 430,000 | | | 337,032 |
Owens & Minor, Inc., 6.350%, 4/15/2016(b) | | | | | 320,000 | | | 288,517 |
Tenet Healthcare Corp., 6.875%, 11/15/2031 | | | | | 1,075,000 | | | 838,500 |
Tenet Healthcare Corp., 7.375%, 2/01/2013 | | | | | 85,000 | | | 84,150 |
| | | | | | | | |
| | | | | | | | 19,246,260 |
| | | | | | | | |
| Home Construction – 1.1% | | | | | | | | |
K. Hovnanian Enterprises, Inc., 6.250%, 1/15/2016 | | | | | 115,000 | | | 86,250 |
K. Hovnanian Enterprises, Inc., 6.375%, 12/15/2014 | | | | | 155,000 | | | 117,800 |
K. Hovnanian Enterprises, Inc., 6.500%, 1/15/2014 | | | | | 115,000 | | | 89,700 |
Lennar Corp., Series B, 5.600%, 5/31/2015 | | | | | 1,700,000 | | | 1,568,250 |
Pulte Homes, Inc., 5.200%, 2/15/2015 | | | | | 1,305,000 | | | 1,239,750 |
Pulte Homes, Inc., 6.000%, 2/15/2035 | | | | | 3,920,000 | | | 2,959,600 |
Pulte Homes, Inc., 6.375%, 5/15/2033 | | | | | 1,960,000 | | | 1,509,200 |
Toll Brothers Finance Corp., 5.150%, 5/15/2015 | | | | | 565,000 | | | 543,306 |
| | | | | | | | |
| | | | | | | | 8,113,856 |
| | | | | | | | |
See accompanying notes to financial statements.
49
| | | | | | | | |
| | | | | Principal Amount (‡) | | Value (†) |
| | | | | | | | |
| | | |
| BONDS AND NOTES – continued | | | | | | | | |
| | | |
| Independent Energy – 2.2% | | | | | | | | |
Anadarko Petroleum Corp., 5.950%, 9/15/2016 | | | | $ | 3,230,000 | | $ | 3,422,376 |
Anadarko Petroleum Corp., 6.450%, 9/15/2036 | | | | | 2,845,000 | | | 2,937,443 |
Chesapeake Energy Corp., 6.500%, 8/15/2017 | | | | | 380,000 | | | 348,650 |
Chesapeake Energy Corp., 6.875%, 1/15/2016 | | | | | 200,000 | | | 189,500 |
Chesapeake Energy Corp., 6.875%, 11/15/2020 | | | | | 900,000 | | | 801,000 |
Connacher Oil & Gas Ltd., 10.250%, 12/15/2015, 144A | | | | | 792,000 | | | 645,480 |
Connacher Oil & Gas Ltd., 11.750%, 7/15/2014, 144A | | | | | 525,000 | | | 559,125 |
Penn Virginia Corp., 10.375%, 6/15/2016 | | | | | 500,000 | | | 540,000 |
Pioneer Natural Resources Co., 5.875%, 7/15/2016 | | | | | 435,000 | | | 402,063 |
Pioneer Natural Resources Co., 7.200%, 1/15/2028 | | | | | 1,465,000 | | | 1,271,506 |
Questar Market Resources, Inc., 6.800%, 4/01/2018 | | | | | 3,820,000 | | | 3,916,233 |
Talisman Energy, Inc., 5.850%, 2/01/2037 | | | | | 550,000 | | | 529,015 |
Talisman Energy, Inc., 6.250%, 2/01/2038 | | | | | 1,485,000 | | | 1,514,900 |
| | | | | | | | |
| | | | | | | | 17,077,291 |
| | | | | | | | |
| Industrial Other – 0.2% | | | | | | | | |
Ranhill Labuan Ltd., 12.500%, 10/26/2011, 144A | | | | | 1,575,000 | | | 1,260,000 |
| | | | | | | | |
| Integrated Energy – 0.2% | | | | | | | | |
PF Export Receivables Master Trust, Series A, 6.436%, 6/01/2015, 144A | | | | | 1,159,977 | | | 1,206,376 |
| | | | | | | | |
| Life Insurance – 0.7% | | | | | | | | |
Hartford Life Insurance Co.,
0.100%, 9/15/2011(c) | | | | | 500,000 | | | 450,000 |
MetLife, Inc., 10.750%, 8/01/2039 | | | | | 3,385,000 | | | 4,078,925 |
Protective Life Secured Trust, Zero Coupon, 9/10/2014(c) | | | | | 1,000,000 | | | 809,730 |
| | | | | | | | |
| | | | | | | | 5,338,655 |
| | | | | | | | |
| Local Authorities – 4.9% | | | | | | | | |
Province of Alberta, 5.930%, 9/16/2016 | | CAD | | | 821,399 | | | 857,572 |
Province of British Columbia, Zero Coupon, 8/23/2013 | | CAD | | | 11,700,000 | | | 9,778,431 |
Province of Ontario, Canada, 4.200%, 3/08/2018 | | CAD | | | 19,825,000 | | | 19,227,463 |
Queensland Treasury Corp., Series 11G, 6.000%, 6/14/2011 | | AUD | | | 2,150,000 | | | 1,938,953 |
Virginia Tobacco Settlement Financing Corp., Series A-1, 6.706%, 6/01/2046(b) | | | | | 7,725,000 | | | 5,517,736 |
| | | | | | | | |
| | | | | | | | 37,320,155 |
| | | | | | | | |
| Lodging – 0.0% | | | | | | | | |
Host Marriott LP, Series O, 6.375%, 3/15/2015 | | | | | 150,000 | | | 142,125 |
| | | | | | | | |
| Media Cable – 3.6% | | | | | | | | |
Comcast Corp., 5.650%, 6/15/2035 | | | | | 2,550,000 | | | 2,466,281 |
Comcast Corp., 6.450%, 3/15/2037 | | | | | 1,070,000 | | | 1,133,011 |
Comcast Corp., 6.500%, 11/15/2035 | | | | | 3,240,000 | | | 3,452,502 |
Comcast Corp., 6.950%, 8/15/2037 | | | | | 7,695,000 | | | 8,588,866 |
CSC Holdings, Inc., 6.750%, 4/15/2012 | | | | | 200,000 | | | 206,000 |
CSC Holdings, Inc., 7.625%, 4/01/2011 | | | | | 50,000 | | | 51,875 |
CSC Holdings, Inc., 7.875%, 2/15/2018 | | | | | 170,000 | | | 173,400 |
CSC Holdings, Inc., 8.500%, 4/15/2014, 144A | | | | | 1,000,000 | | | 1,050,000 |
TCI Communications, Inc., 7.875%, 2/15/2026 | | | | | 550,000 | | | 643,804 |
See accompanying notes to financial statements.
50
PORTFOLIO OF INVESTMENTS – as of September 30, 2009
Loomis Sayles Fixed Income Fund – continued
| | | | | | | | | |
| | | | | Principal Amount (‡) | | | Value (†) |
| | | | | | | | | |
| | | |
| BONDS AND NOTES – continued | | | | | | | | | |
| | | |
| Media Cable – continued | | | | | | | | | |
Time Warner Cable, Inc., 6.550%, 5/01/2037 | | | | $ | 1,500,000 | | | $ | 1,593,834 |
Time Warner Cable, Inc., 6.750%, 7/01/2018 | | | | | 6,500,000 | | | | 7,180,940 |
Virgin Media Finance PLC, 9.125%, 8/15/2016 | | | | | 400,000 | | | | 411,000 |
Virgin Media Finance PLC, 9.750%, 4/15/2014 | | GBP | | | 250,000 | | | | 413,522 |
| | | | | | | | | |
| | | | | | | | | 27,365,035 |
| | | | | | | | | |
| Media Non-Cable – 0.4% | | | | | | | | | |
News America, Inc., 6.150%, 3/01/2037 | | | | | 2,630,000 | | | | 2,573,316 |
News America, Inc., 6.200%, 12/15/2034 | | | | | 795,000 | | | | 782,182 |
| | | | | | | | | |
| | | | | | | | | 3,355,498 |
| | | | | | | | | |
| Metals & Mining – 1.2% | | | | | | | | | |
Alcoa, Inc., 5.720%, 2/23/2019 | | | | | 1,500,000 | | | | 1,357,902 |
Alcoa, Inc., 5.870%, 2/23/2022 | | | | | 300,000 | | | | 260,097 |
Rio Tinto Finance (USA) Ltd., 8.950%, 5/01/2014 | | | | | 6,203,000 | | | | 7,320,700 |
| | | | | | | | | |
| | | | | | | | | 8,938,699 |
| | | | | | | | | |
| Non-Captive Consumer – 1.7% | | | | | | | | | |
SLM Corp., 6.000%, 12/15/2043 | | | | | 31,725 | (††) | | | 448,195 |
SLM Corp., MTN, 5.125%, 8/27/2012 | | | | | 560,000 | | | | 479,177 |
SLM Corp., Series A, MTN, 4.500%, 7/26/2010 | | | | | 930,000 | | | | 903,647 |
SLM Corp., Series A, MTN, 5.000%, 10/01/2013 | | | | | 1,665,000 | | | | 1,325,438 |
SLM Corp., Series A, MTN, 5.000%, 4/15/2015 | | | | | 200,000 | | | | 149,023 |
SLM Corp., Series A, MTN, 5.000%, 6/15/2018 | | | | | 145,000 | | | | 90,933 |
SLM Corp., Series A, MTN, 5.375%, 1/15/2013 | | | | | 2,920,000 | | | | 2,434,573 |
SLM Corp., Series A, MTN, 5.375%, 5/15/2014 | | | | | 235,000 | | | | 179,864 |
SLM Corp., Series A, MTN, 5.400%, 10/25/2011 | | | | | 405,000 | | | | 373,702 |
SLM Corp., Series A, MTN, 8.450%, 6/15/2018 | | | | | 7,986,000 | | | | 6,368,835 |
| | | | | | | | | |
| | | | | | | | | 12,753,387 |
| | | | | | | | | |
| Non-Captive Diversified – 3.5% | | | | | | | | | |
CIT Group, Inc., 4.750%, 12/15/2010 | | | | | 135,000 | | | | 93,261 |
CIT Group, Inc., 5.050%, 9/15/2014 | | | | | 500,000 | | | | 250,188 |
CIT Group, Inc., 5.400%, 2/13/2012 | | | | | 64,000 | | | | 42,005 |
CIT Group, Inc., 5.400%, 1/30/2016 | | | | | 108,000 | | | | 68,084 |
CIT Group, Inc., 5.500%, 12/01/2014 | | GBP | | | 800,000 | | | | 754,327 |
CIT Group, Inc., 5.600%, 4/27/2011 | | | | | 432,000 | | | | 294,148 |
CIT Group, Inc., 5.800%, 10/01/2036 | | | | | 561,000 | | | | 336,426 |
CIT Group, Inc., 5.850%, 9/15/2016 | | | | | 10,000 | | | | 6,302 |
CIT Group, Inc., EMTN, 3.800%, 11/14/2012 | | EUR | | | 750,000 | | | | 685,945 |
CIT Group, Inc., EMTN, 4.650%, 9/19/2016 | | EUR | | | 1,150,000 | | | | 967,640 |
CIT Group, Inc., EMTN, 5.000%, 5/13/2014 | | EUR | | | 550,000 | | | | 474,857 |
CIT Group, Inc., EMTN, 5.500%, 12/20/2016 | | GBP | | | 600,000 | | | | 546,568 |
CIT Group, Inc., GMTN, 4.250%, 2/01/2010 | | | | | 85,000 | | | | 61,282 |
CIT Group, Inc., GMTN, 4.250%, 9/22/2011 | | EUR | | | 400,000 | | | | 371,691 |
CIT Group, Inc., GMTN, 5.000%, 2/13/2014 | | | | | 673,000 | | | | 429,898 |
CIT Group, Inc., GMTN, 5.000%, 2/01/2015 | | | | | 263,000 | | | | 168,441 |
CIT Group, Inc., MTN, 4.250%, 3/17/2015 | | EUR | | | 1,000,000 | | | | 848,742 |
CIT Group, Inc., MTN, 5.125%, 9/30/2014 | | | | | 762,000 | | | | 488,150 |
CIT Group, Inc., Series A, GMTN, 6.000%, 4/01/2036 | | | | | 265,000 | | | | 153,101 |
CIT Group, Inc., Series A, MTN, 5.650%, 2/13/2017 | | | | | 250,000 | | | | 156,327 |
General Electric Capital Australia Funding, EMTN, 8.000%, 2/13/2012 | | AUD | | | 830,000 | | | | 753,280 |
See accompanying notes to financial statements.
51
| | | | | | | | |
| | | | | Principal Amount (‡) | | Value (†) |
| | | | | | | | |
| | | |
| BONDS AND NOTES – continued | | | | | | | | |
| | | |
| Non-Captive Diversified – continued | | | | | | | | |
General Electric Capital Corp., 5.625%, 5/01/2018 | | | | $ | 35,000 | | $ | 34,832 |
General Electric Capital Corp., MTN, 5.875%, 1/14/2038 | | | | | 170,000 | | | 155,904 |
General Electric Capital Corp., Series A, EMTN, 6.750%, 9/26/2016 | | NZD | | | 1,345,000 | | | 931,877 |
General Electric Capital Corp., Series A, GMTN, 7.625%, 12/10/2014 | | NZD | | | 2,500,000 | | | 1,831,450 |
General Electric Capital Corp., Series A, MTN, 4.875%, 3/04/2015 | | | | | 1,145,000 | | | 1,180,135 |
General Electric Capital Corp., Series A, MTN, 6.500%, 9/28/2015 | | NZD | | | 9,210,000 | | | 6,360,274 |
GMAC, Inc., 5.375%, 6/06/2011, 144A | | | | | 2,268,000 | | | 2,092,230 |
GMAC, Inc., 5.750%, 9/27/2010, 144A | | | | | 309,000 | | | 298,185 |
GMAC, Inc., 6.000%, 12/15/2011, 144A | | | | | 1,305,000 | | | 1,207,125 |
GMAC, Inc., 6.875%, 8/28/2012, 144A | | | | | 224,000 | | | 206,080 |
GMAC, Inc., 7.000%, 2/01/2012, 144A | | | | | 253,000 | | | 235,290 |
GMAC, Inc., 7.500%, 12/31/2013, 144A | | | | | 682,000 | | | 596,750 |
GMAC, Inc., 8.000%, 12/31/2018, 144A | | | | | 1,460,000 | | | 1,102,300 |
GMAC, Inc., 8.000%, 11/01/2031, 144A | | | | | 181,000 | | | 145,705 |
iStar Financial, Inc., 5.500%, 6/15/2012 | | | | | 85,000 | | | 51,850 |
iStar Financial, Inc., 5.650%, 9/15/2011 | | | | | 135,000 | | | 93,150 |
iStar Financial, Inc., 5.875%, 3/15/2016 | | | | | 30,000 | | | 16,500 |
iStar Financial, Inc., 6.050%, 4/15/2015 | | | | | 30,000 | | | 15,675 |
iStar Financial, Inc., 8.625%, 6/01/2013 | | | | | 2,495,000 | | | 1,571,850 |
iStar Financial, Inc., Series B, 5.700%, 3/01/2014 | | | | | 95,000 | | | 51,300 |
iStar Financial, Inc., Series B, 5.950%, 10/15/2013 | | | | | 1,245,000 | | | 709,650 |
| | | | | | | | |
| | | | | | | | 26,838,775 |
| | | | | | | | |
| Oil Field Services – 0.1% | | | | | | | | |
North American Energy Partners, Inc., 8.750%, 12/01/2011 | | | | | 1,000,000 | | | 980,000 |
| | | | | | | | |
| Packaging – 0.3% | | | | | | | | |
Owens-Illinois, Inc., 7.800%, 5/15/2018 | | | | | 2,000,000 | | | 2,005,000 |
| | | | | | | | |
| Paper – 1.8% | | | | | | | | |
Georgia-Pacific LLC, 7.250%, 6/01/2028 | | | | | 2,000,000 | | | 1,780,000 |
Georgia-Pacific LLC, 7.375%, 12/01/2025 | | | | | 2,868,000 | | | 2,581,200 |
Georgia-Pacific LLC, 7.750%, 11/15/2029 | | | | | 6,005,000 | | | 5,524,600 |
Georgia-Pacific LLC, 8.000%, 1/15/2024 | | | | | 132,000 | | | 130,680 |
Jefferson Smurfit Corp.,
7.500%, 6/01/2013(d) | | | | | 335,000 | | | 237,431 |
Westvaco Corp., 7.950%, 2/15/2031 | | | | | 1,045,000 | | | 1,023,455 |
Westvaco Corp., 8.200%, 1/15/2030 | | | | | 1,080,000 | | | 1,059,334 |
Weyerhaeuser Co., 7.375%, 3/15/2032 | | | | | 1,565,000 | | | 1,386,246 |
| | | | | | | | |
| | | | | | | | 13,722,946 |
| | | | | | | | |
| Pharmaceuticals – 0.6% | | | | | | | | |
Elan Financial PLC, 7.750%, 11/15/2011 | | | | | 4,235,000 | | | 4,314,406 |
Elan Financial PLC, 8.875%, 12/01/2013 | | | | | 335,000 | | | 337,513 |
| | | | | | | | |
| | | | | | | | 4,651,919 |
| | | | | | | | |
| Pipelines – 1.8% | | | | | | | | |
DCP Midstream LP, 6.450%, 11/03/2036, 144A | | | | | 1,740,000 | | | 1,575,972 |
El Paso Corp., 6.950%, 6/01/2028 | | | | | 925,000 | | | 769,467 |
El Paso Corp., 12.000%, 12/12/2013 | | | | | 2,195,000 | | | 2,502,300 |
El Paso Corp., GMTN, 7.800%, 8/01/2031 | | | | | 250,000 | | | 229,280 |
See accompanying notes to financial statements.
52
PORTFOLIO OF INVESTMENTS – as of September 30, 2009
Loomis Sayles Fixed Income Fund – continued
| | | | | | | | |
| | | | | Principal Amount (‡) | | Value (†) |
| | | | | | | | |
| | | |
| BONDS AND NOTES – continued | | | | | | | | |
| | | |
| Pipelines – continued | | | | | | | | |
Enterprise Products Operating LLP, 6.300%, 9/15/2017 | | | | $ | 1,550,000 | | $ | 1,669,478 |
Florida Gas Transmission Co., 7.900%, 5/15/2019, 144A | | | | | 300,000 | | | 357,876 |
Plains All American Pipeline LP, 6.125%, 1/15/2017 | | | | | 1,785,000 | | | 1,852,728 |
Plains All American Pipeline LP, 6.650%, 1/15/2037 | | | | | 3,850,000 | | | 4,055,151 |
Williams Cos., Inc. (The), 7.500%, 1/15/2031 | | | | | 1,000,000 | | | 1,021,382 |
| | | | | | | | |
| | | | | | | | 14,033,634 |
| | | | | | | | |
| Property & Casualty Insurance – 1.5% | | | | | | | | |
Allstate Corp., 5.950%, 4/01/2036 | | | | | 540,000 | | | 572,894 |
Axis Capital Holdings Ltd., 5.750%, 12/01/2014 | | | | | 80,000 | | | 80,988 |
Marsh & McLennan Cos., Inc., 5.375%, 7/15/2014 | | | | | 1,190,000 | | | 1,238,382 |
Marsh & McLennan Cos., Inc., 5.750%, 9/15/2015 | | | | | 775,000 | | | 817,242 |
Marsh & McLennan Cos., Inc., 5.875%, 8/01/2033 | | | | | 180,000 | | | 165,426 |
Marsh & McLennan Cos., Inc., 9.250%, 4/15/2019 | | | | | 4,570,000 | | | 5,726,850 |
MBIA Insurance Corp., (fixed rate to 1/15/2013, variable rate thereafter), 14.000%, 1/15/2033, 144A | | | | | 1,545,000 | | | 679,800 |
White Mountains RE Group, 6.375%, 3/20/2017, 144A | | | | | 2,140,000 | | | 1,913,203 |
| | | | | | | | |
| | | | | | | | 11,194,785 |
| | | | | | | | |
| Railroads – 0.2% | | | | | | | | |
CSX Corp., MTN, 6.000%, 10/01/2036 | | | | | 1,219,000 | | | 1,257,113 |
Missouri Pacific Railroad Co., 5.000%, 1/01/2045(b) | | | | | 500,000 | | | 340,000 |
| | | | | | | | |
| | | | | | | | 1,597,113 |
| | | | | | | | |
| REITs – 1.9% | | | | | | | | |
Camden Property Trust, 5.700%, 5/15/2017 | | | | | 1,495,000 | | | 1,414,491 |
Duke Realty LP, 5.950%, 2/15/2017 | | | | | 210,000 | | | 193,572 |
ERP Operating LP, 5.125%, 3/15/2016 | | | | | 70,000 | | | 68,304 |
Highwoods Properties, Inc., 5.850%, 3/15/2017 | | | | | 3,485,000 | | | 3,069,358 |
Highwoods Properties, Inc., 7.500%, 4/15/2018 | | | | | 475,000 | | | 454,543 |
ProLogis, 5.625%, 11/15/2015 | | | | | 100,000 | | | 90,871 |
ProLogis, 5.750%, 4/01/2016 | | | | | 80,000 | | | 71,558 |
Realty Income Corp., 6.750%, 8/15/2019 | | | | | 1,000,000 | | | 973,983 |
Simon Property Group LP, 5.250%, 12/01/2016 | | | | | 1,125,000 | | | 1,108,914 |
Simon Property Group LP, 5.300%, 5/30/2013 | | | | | 685,000 | | | 700,332 |
Simon Property Group LP, 5.750%, 12/01/2015 | | | | | 350,000 | | | 358,019 |
Simon Property Group LP, 5.875%, 3/01/2017 | | | | | 200,000 | | | 203,961 |
Simon Property Group LP, 6.100%, 5/01/2016 | | | | | 290,000 | | | 298,047 |
Simon Property Group LP, 10.350%, 4/01/2019 | | | | | 2,030,000 | | | 2,526,238 |
WEA Finance LLC/WT Finance Australia Pty Ltd., 6.750%, 9/02/2019, 144A | | | | | 2,960,000 | | | 2,994,037 |
| | | | | | | | |
| | | | | | | | 14,526,228 |
| | | | | | | | |
| Restaurants – 0.1% | | | | | | | | |
McDonald’s Corp., EMTN, 3.628%, 10/10/2010 | | SGD | | | 1,000,000 | | | 722,142 |
| | | | | | | | |
| Retailers – 1.8% | | | | | | | | |
Dillard’s, Inc., 7.750%, 7/15/2026 | | | | | 1,025,000 | | | 722,625 |
Foot Locker, Inc., 8.500%, 1/15/2022 | | | | | 1,100,000 | | | 1,039,500 |
See accompanying notes to financial statements.
53
| | | | | | | | | |
| | | | | Principal Amount (‡) | | | Value (†) |
| | | | | | | | | |
| | | |
| BONDS AND NOTES – continued | | | | | | | | | |
| | | |
| Retailers – continued | | | | | | | | | |
Home Depot, Inc. (The), 5.875%, 12/16/2036 | | | | $ | 6,693,000 | | | $ | 6,493,589 |
J.C. Penney Corp., Inc., 6.375%, 10/15/2036 | | | | | 2,110,000 | | | | 1,740,750 |
J.C. Penney Corp., Inc., 7.125%, 11/15/2023 | | | | | 575,000 | | | | 529,000 |
Toys R Us, Inc., 7.375%, 10/15/2018 | | | | | 3,240,000 | | | | 2,818,800 |
Toys R Us, Inc., 7.875%, 4/15/2013 | | | | | 750,000 | | | | 720,000 |
| | | | | | | | | |
| | | | | | | | | 14,064,264 |
| | | | | | | | | |
| Sovereigns – 4.6% | | | | | | | | | |
Indonesia Treasury Bond, Series FR43, 10.250%, 7/15/2022 | | IDR | | | 2,915,000,000 | | | | 297,225 |
Indonesia Treasury Bond, Series FR44, 10.000%, 9/15/2024 | | IDR | | | 33,387,000,000 | | | | 3,275,729 |
Indonesia Treasury Bond, Series ZC3, Zero Coupon, 11/20/2012 | | IDR | | | 7,590,000,000 | | | | 604,302 |
Mexican Fixed Rate Bonds, Series M-10, 7.250%, 12/15/2016 | | MXN | | | 578,000 | (†††) | | | 4,166,379 |
Mexican Fixed Rate Bonds, Series M-10, 8.000%, 12/17/2015 | | MXN | | | 125,000 | (†††) | | | 942,802 |
Mexican Fixed Rate Bonds, Series M-20, 8.000%, 12/07/2023 | | MXN | | | 305,000 | (†††) | | | 2,215,922 |
Mexican Fixed Rate Bonds, Series MI-10, 9.000%, 12/20/2012 | | MXN | | | 501,000 | (†††) | | | 3,956,553 |
New South Wales Treasury Corp., Series 10RG, 7.000%, 12/01/2010 | | AUD | | | 3,240,000 | | | | 2,944,420 |
New South Wales Treasury Corp., Series 12RG, 6.000%, 5/01/2012 | | AUD | | | 845,000 | | | | 760,130 |
New South Wales Treasury Corp., Series 17RG, 5.500%, 3/01/2017 | | AUD | | | 4,280,000 | | | | 3,697,622 |
Republic of Brazil, 10.250%, 1/10/2028 | | BRL | | | 14,885,000 | | | | 8,065,929 |
Republic of Brazil, 12.500%, 1/05/2022 | | BRL | | | 625,000 | | | | 388,067 |
Republic of Iceland, Zero Coupon, 11/16/2009 | | ISK | | | 88,000,000 | | | | 562,508 |
Republic of Iceland, 7.000%, 3/17/2010 | | ISK | | | 21,715,000 | | | | 139,999 |
Republic of Iceland, 7.250%, 5/17/2013 | | ISK | | | 212,600,000 | | | | 1,362,698 |
Republic of Iceland, 8.000%, 7/22/2011 | | ISK | | | 113,800,000 | | | | 743,327 |
Republic of Iceland, 13.750%, 12/10/2010 | | ISK | | | 92,900,000 | | | | 643,707 |
| | | | | | | | | |
| | | | | | | | | 34,767,319 |
| | | | | | | | | |
| Supermarkets – 1.1% | | | | | | | | | |
American Stores Co., 8.000%, 6/01/2026 | | | | | 25,000 | | | | 22,500 |
New Albertson’s, Inc., 7.450%, 8/01/2029 | | | | | 6,515,000 | | | | 5,602,900 |
New Albertson’s, Inc., 7.750%, 6/15/2026 | | | | | 1,470,000 | | | | 1,308,300 |
New Albertson’s, Inc., 8.000%, 5/01/2031 | | | | | 565,000 | | | | 507,088 |
New Albertson’s, Inc., 8.700%, 5/01/2030 | | | | | 5,000 | | | | 4,550 |
New Albertson’s, Inc., Series C, MTN, 6.625%, 6/01/2028 | | | | | 1,745,000 | | | | 1,348,012 |
| | | | | | | | | |
| | | | | | | | | 8,793,350 |
| | | | | | | | | |
| Supranational – 4.2% | | | | | | | | | |
Eurofima, EMTN, 11.000%, 2/05/2010 | | ISK | | | 20,000,000 | | | | 130,741 |
European Investment Bank, EMTN, 4.600%, 1/30/2037, 144A | | CAD | | | 6,000,000 | | | | 4,936,067 |
Inter-American Development Bank, EMTN, 6.000%, 12/15/2017 | | NZD | | | 19,735,000 | | | | 14,190,476 |
International Bank for Reconstruction & Development, 1.430%, 3/05/2014 | | SGD | | | 17,000,000 | | | | 11,597,363 |
See accompanying notes to financial statements.
54
PORTFOLIO OF INVESTMENTS – as of September 30, 2009
Loomis Sayles Fixed Income Fund – continued
| | | | | | | |
| | | | | Principal Amount (‡) | | Value (†) |
| | | | | | | |
| | | |
| BONDS AND NOTES – continued | | | | | | | |
| | | |
| Supranational – continued | | | | | | | |
International Bank for Reconstruction & Development, 9.500%, 5/27/2010 | | ISK | | 210,000,000 | | $ | 1,369,308 |
| | | | | | | |
| | | | | | | 32,223,955 |
| | | | | | | |
| Technology – 2.2% | | | | | | | |
Agilent Technologies, Inc., 6.500%, 11/01/2017 | | | | 5,215,000 | | | 5,426,938 |
Alcatel-Lucent USA, Inc., 6.450%, 3/15/2029 | | | | 250,000 | | | 190,313 |
Amkor Technology, Inc., 7.750%, 5/15/2013 | | | | 530,000 | | | 530,000 |
Arrow Electronics, Inc., 6.875%, 7/01/2013 | | | | 2,850,000 | | | 3,079,143 |
Avnet, Inc., 6.000%, 9/01/2015 | | | | 1,645,000 | | | 1,693,626 |
Avnet, Inc., 6.625%, 9/15/2016 | | | | 130,000 | | | 136,612 |
Corning, Inc., 6.200%, 3/15/2016 | | | | 250,000 | | | 255,505 |
Corning, Inc., 6.850%, 3/01/2029 | | | | 450,000 | | | 459,198 |
Corning, Inc., 7.250%, 8/15/2036 | | | | 1,175,000 | | | 1,239,713 |
Motorola, Inc., 5.220%, 10/01/2097 | | | | 515,000 | | | 282,770 |
Motorola, Inc., 6.500%, 11/15/2028 | | | | 815,000 | | | 672,221 |
Motorola, Inc., 6.625%, 11/15/2037 | | | | 995,000 | | | 833,312 |
Nortel Networks Capital Corp., 7.875%, 6/15/2026(d) | | | | 150,000 | | | 84,000 |
Nortel Networks Ltd., 6.875%, 9/01/2023(d) | | | | 1,325,000 | | | 371,000 |
Samsung Electronics Co. Ltd., 7.700%, 10/01/2027, 144A | | | | 1,100,100 | | | 1,220,363 |
| | | | | | | |
| | | | | | | 16,474,714 |
| | | | | | | |
| Tobacco – 1.6% | | | | | | | |
Altria Group, Inc., 9.250%, 8/06/2019 | | | | 6,465,000 | | | 7,899,945 |
Reynolds American, Inc., 6.750%, 6/15/2017 | | | | 3,320,000 | | | 3,451,336 |
Reynolds American, Inc., 7.250%, 6/15/2037 | | | | 810,000 | | | 802,238 |
| | | | | | | |
| | | | | | | 12,153,519 |
| | | | | | | |
| Transportation Services – 0.6% | | | | | | | |
APL Ltd., 8.000%, 1/15/2024(b) | | | | 2,500,000 | | | 2,043,750 |
Atlas Air, Inc., Series 1999-1B, 7.630%, 7/02/2016 | | | | 1,192,308 | | | 894,231 |
Atlas Air, Inc., Series 2000-1, Class B, 9.057%, 7/02/2017 | | | | 364,292 | | | 324,220 |
Atlas Air, Inc., Series B, 7.680%, 1/02/2014 | | | | 1,368,416 | | | 1,163,153 |
| | | | | | | |
| | | | | | | 4,425,354 |
| | | | | | | |
| Treasuries – 15.3% | | | | | | | |
Canadian Government, 2.000%, 9/01/2012 | | CAD | | 18,855,000 | | | 17,658,522 |
Canadian Government, 2.750%, 12/01/2010 | | CAD | | 12,760,000 | | | 12,208,197 |
Canadian Government, 3.750%, 9/01/2011 | | CAD | | 18,145,000 | | | 17,738,256 |
Canadian Government, 3.750%, 6/01/2012 | | CAD | | 14,255,000 | | | 14,011,348 |
Canadian Government, 3.750%, 6/01/2019 | | CAD | | 7,385,000 | | | 7,147,306 |
Canadian Government, 4.250%, 6/01/2018 | | CAD | | 9,615,000 | | | 9,722,048 |
Canadian Government, 5.250%, 6/01/2012 | | CAD | | 22,355,000 | | | 22,787,213 |
Norwegian Government, 4.250%, 5/19/2017 | | NOK | | 56,415,000 | | | 9,929,982 |
Norwegian Government, 5.000%, 5/15/2015 | | NOK | | 9,425,000 | | | 1,734,021 |
Norwegian Government, 6.000%, 5/16/2011 | | NOK | | 11,705,000 | | | 2,129,430 |
Norwegian Government, 6.500%, 5/15/2013 | | NOK | | 8,410,000 | | | 1,603,811 |
| | | | | | | |
| | | | | | | 116,670,134 |
| | | | | | | |
| Wireless – 1.3% | | | | | | | |
ALLTEL Corp., 6.800%, 5/01/2029 | | | | 150,000 | | | 164,636 |
Nextel Communications, Inc., Series D, 7.375%, 8/01/2015 | | | | 4,585,000 | | | 4,115,037 |
See accompanying notes to financial statements.
55
| | | | | | | | |
| | | | | Principal Amount (‡) | | Value (†) |
| | | | | | | | |
| | | |
| BONDS AND NOTES – continued | | | | | | | | |
| | | |
| Wireless – continued | | | | | | | | |
Nextel Communications, Inc., Series E, 6.875%, 10/31/2013 | | | | $ | 745,000 | | $ | 690,988 |
Nextel Communications, Inc., Series F, 5.950%, 3/15/2014 | | | | | 1,745,000 | | | 1,544,325 |
Rogers Cable, Inc., 5.500%, 3/15/2014 | | | | | 150,000 | | | 160,588 |
Sprint Capital Corp., 6.875%, 11/15/2028 | | | | | 1,262,000 | | | 1,053,770 |
Sprint Capital Corp., 6.900%, 5/01/2019 | | | | | 870,000 | | | 778,650 |
Sprint Capital Corp., 8.750%, 3/15/2032 | | | | | 300,000 | | | 283,500 |
Sprint Nextel Corp., 6.000%, 12/01/2016 | | | | | 898,000 | | | 801,465 |
| | | | | | | | |
| | | | | | | | 9,592,959 |
| | | | | | | | |
| Wirelines – 3.7% | | | | | | | | |
AT&T Corp., 6.500%, 3/15/2029 | | | | | 355,000 | | | 369,005 |
AT&T, Inc., 6.500%, 9/01/2037 | | | | | 5,335,000 | | | 5,732,495 |
Axtel SAB de CV, 9.000%, 9/22/2019, 144A | | | | | 355,000 | | | 360,325 |
Bell Canada, MTN, 6.550%, 5/01/2029, 144A | | CAD | | | 195,000 | | | 179,328 |
Bell Canada, MTN, 7.300%, 2/23/2032 | | CAD | | | 690,000 | | | 689,562 |
Bell Canada, Series M-17, 6.100%, 3/16/2035 | | CAD | | | 600,000 | | | 523,342 |
Embarq Corp., 7.082%, 6/01/2016 | | | | | 235,000 | | | 255,341 |
Embarq Corp., 7.995%, 6/01/2036 | | | | | 200,000 | | | 208,963 |
GTE Corp., 6.940%, 4/15/2028 | | | | | 350,000 | | | 376,316 |
Hawaiian Telcom Communications, Inc., Series B, 12.500%, 5/01/2015(d) | | | | | 75,000 | | | 94 |
Level 3 Financing, Inc., 9.250%, 11/01/2014 | | | | | 500,000 | | | 440,625 |
Qwest Capital Funding, Inc., 6.500%, 11/15/2018 | | | | | 3,305,000 | | | 2,718,362 |
Qwest Capital Funding, Inc., 6.875%, 7/15/2028 | | | | | 7,205,000 | | | 5,439,775 |
Qwest Capital Funding, Inc., 7.625%, 8/03/2021 | | | | | 350,000 | | | 295,750 |
Qwest Capital Funding, Inc., 7.750%, 2/15/2031 | | | | | 775,000 | | | 618,063 |
Qwest Corp., 6.875%, 9/15/2033 | | | | | 790,000 | | | 639,900 |
Qwest Corp., 7.200%, 11/10/2026 | | | | | 1,780,000 | | | 1,486,300 |
Qwest Corp., 7.250%, 9/15/2025 | | | | | 1,220,000 | | | 1,052,250 |
Telecom Italia Capital SA, 6.000%, 9/30/2034 | | | | | 1,330,000 | | | 1,296,576 |
Telecom Italia Capital SA, 6.375%, 11/15/2033 | | | | | 1,320,000 | | | 1,348,765 |
Telefonica Emisiones SAU, 5.877%, 7/15/2019 | | | | | 30,000 | | | 32,595 |
Telefonica Emisiones SAU, 7.045%, 6/20/2036 | | | | | 209,000 | | | 247,332 |
Verizon Communications, Inc., 5.850%, 9/15/2035 | | | | | 3,520,000 | | | 3,543,788 |
| | | | | | | | |
| | | | | | | | 27,854,852 |
| | | | | | | | |
| | | |
| TOTAL NON-CONVERTIBLE BONDS | | | | | | | | |
(Identified Cost $647,779,407) | | | | | | | | 675,247,827 |
| | | | | | | | |
| | | |
| CONVERTIBLE BONDS – 4.3% | | | | | | | | |
| | | |
| Airlines – 0.1% | | | | | | | | |
AMR Corp., 6.250%, 10/15/2014 | | | | | 860,000 | | | 908,375 |
| | | | | | | | |
| Construction Machinery – 0.0% | | | | | | | | |
United Rentals North America, Inc., 1.875%, 10/15/2023 | | | | | 50,000 | | | 47,250 |
| | | | | | | | |
| Electric – 0.1% | | | | | | | | |
CMS Energy Corp., 5.500%, 6/15/2029 | | | | | 500,000 | | | 571,875 |
| | | | | | | | |
| Healthcare – 0.1% | | | | | | | | |
Affymetrix, Inc., 3.500%, 1/15/2038 | | | | | 604,000 | | | 486,220 |
| | | | | | | | |
See accompanying notes to financial statements.
56
PORTFOLIO OF INVESTMENTS – as of September 30, 2009
Loomis Sayles Fixed Income Fund – continued
| | | | | | | | |
| | | | | Principal Amount (‡) | | Value (†) |
| | | |
| BONDS AND NOTES – continued | | | | | | | | |
| | | | | | | | |
| | | |
| Industrial Other – 0.2% | | | | | | | | |
Incyte Corp., 3.500%, 2/15/2011 | | | | $ | 1,290,000 | | $ | 1,257,750 |
| | | | | | | | |
| Life Insurance – 0.1% | | | | | | | | |
MetLife, Inc., 6.400%, 12/15/2036 | | | | | 1,000,000 | | | 845,000 |
| | | | | | | | |
| Lodging – 0.2% | | | | | | | | |
Host Hotels & Resorts, Inc., 2.625%, 4/15/2027, 144A | | | | | 1,430,000 | | | 1,313,813 |
| | | | | | | | |
| Media Non-Cable – 0.0% | | | | | | | | |
Liberty Media LLC, 3.500%, 1/15/2031 | | | | | 452,456 | | | 277,695 |
| | | | | | | | |
| Metals & Mining – 0.5% | | | | | | | | |
ArcelorMittal, 5.000%, 5/15/2014 | | | | | 600,000 | | | 866,250 |
Steel Dynamics, Inc., 5.125%, 6/15/2014 | | | | | 235,000 | | | 277,300 |
United States Steel Corp., 4.000%, 5/15/2014 | | | | | 1,540,000 | | | 2,448,600 |
| | | | | | | | |
| | | | | | | | 3,592,150 |
| | | | | | | | |
| Non-Captive Diversified – 0.0% | | | |
iStar Financial, Inc., 1.097%, 10/01/2012(c) | | | | | 380,000 | | | 190,000 |
| | | | | | | | |
| Oil Field Services – 0.0% | | | |
Transocean, Inc., Series C, 1.500%, 12/15/2037 | | | | | 360,000 | | | 342,900 |
| | | | | | | | |
| Pharmaceuticals – 0.3% | | | |
Human Genome Sciences, Inc., 2.250%, 10/15/2011 | | | | | 175,000 | | | 242,156 |
Human Genome Sciences, Inc., 2.250%, 8/15/2012 | | | | | 205,000 | | | 255,481 |
Nektar Therapeutics, 3.250%, 9/28/2012 | | | | | 1,065,000 | | | 966,488 |
Valeant Pharmaceuticals International, 4.000%, 11/15/2013 | | | | | 1,095,000 | | | 1,178,494 |
| | | | | | | | |
| | | | | | | | 2,642,619 |
| | | | | | | | |
| Pipelines – 0.2% | | | | | | | | |
CenterPoint Energy Resources Corp., 6.000%, 3/15/2012 | | | | | 1,467,700 | | | 1,438,346 |
| | | | | | | | |
| REITs – 0.5% | | | | | | | | |
ProLogis, 1.875%, 11/15/2037 | | | | | 2,505,000 | | | 2,138,643 |
ProLogis, 2.250%, 4/01/2037 | | | | | 1,515,000 | | | 1,365,394 |
| | | | | | | | |
| | | | | | | | 3,504,037 |
| | | | | | | | |
| Technology – 1.5% | | | | | | | | |
Intel Corp., 2.950%, 12/15/2035 | | | | | 130,000 | | | 116,025 |
Intel Corp., 3.250%, 8/01/2039, 144A | | | | | 7,000,000 | | | 7,481,250 |
Kulicke & Soffa Industries, Inc., 0.875%, 6/01/2012 | | | | | 3,585,000 | | | 2,935,219 |
Kulicke & Soffa Industries, Inc., 1.000%, 6/30/2010 | | | | | 380,000 | | | 360,525 |
Maxtor Corp., 5.750%, 3/01/2012(b) | | | | | 363,000 | | | 330,330 |
Nortel Networks Corp., 2.125%, 4/15/2014(d) | | | | | 248,000 | | | 136,400 |
Richardson Electronics Ltd., 7.750%, 12/15/2011 | | | | | 263,000 | | | 234,070 |
| | | | | | | | |
| | | | | | | | 11,593,819 |
| | | | | | | | |
| Textile – 0.0% | | | | | | | | |
Dixie Yarns, Inc., 7.000%, 5/15/2012 | | | | | 63,000 | | | 51,660 |
| | | | | | | | |
| Wirelines – 0.5% | | | | | | | | |
Level 3 Communications, Inc., 7.000%, 3/15/2015, 144A(b) | | | | | 3,040,000 | | | 3,222,400 |
See accompanying notes to financial statements.
57
| | | | | | | | |
| | | | | Principal Amount (‡) | | Value (†) |
| | | | | | | | |
| | | |
| BONDS AND NOTES – continued | | | | | | | | |
| | | |
| Wirelines – continued | | | | | | | | |
Qwest Communications International, Inc., 3.500%, 11/15/2025 | | | | $ | 250,000 | | $ | 252,187 |
| | | | | | | | |
| | | | | | | | 3,474,587 |
| | | | | | | | |
| | | |
| TOTAL CONVERTIBLE BONDS | | | | | | | | |
(Identified Cost $29,897,654) | | | | | | | | 32,538,096 |
| | | | | | | | |
| | | |
| MUNICIPALS – 0.2% | | | | | | | | |
| | | |
| Michigan – 0.2% | | | | | | | | |
Michigan Tobacco Settlement Finance Authority, 7.309%, 6/01/2034(b) | | | | | | | | |
(Identified Cost $2,434,860) | | | | | 2,435,000 | | | 1,946,685 |
| | | | | | | | |
| | | |
| TOTAL BONDS AND NOTES | | | | | | | | |
(Identified Cost $680,111,921) | | | | | | | | 709,732,608 |
| | | | | | | | |
| | | |
| BANK LOANS – 0.3% | | | | | | | | |
| | | |
| Media Non-Cable – 0.1% | | | | | | | | |
Idearc, Inc., Term Loan B,
6.250%, 11/17/2014(d)(e) | | | | | 1,609,994 | | | 680,899 |
Tribune Co., Term Loan X,
5.000%, 6/04/2009(d)(e)(j) | | | | | 74,971 | | | 36,408 |
| | | | | | | | |
| | | | | | | | 717,307 |
| | | | | | | | |
| Technology – 0.1% | | | | | | | | |
Sungard Data Systems, Inc., Tranche A, 2.004%, 2/28/2014(e) | | | | | 27,823 | | | 26,007 |
Sungard Data Systems, Inc., Tranche B, 4.079%, 2/26/2016(e) | | | | | 771,017 | | | 750,585 |
| | | | | | | | |
| | | | | | | | 776,592 |
| | | | | | | | |
| Wirelines – 0.1% | | | | | | | | |
Hawaiian Telcom Communications, Inc., Tranche C Term Loan, 4.750%, 6/01/2014(e)(f) | | | | | 481,539 | | | 297,109 |
Level 3 Financing, Inc., Tranche A Term Loan, 2.683%, 3/13/2014(e) | | | | | 345,000 | | | 304,894 |
| | | | | | | | |
| | | | | | | | 602,003 |
| | | | | | | | |
| | | |
| TOTAL BANK LOANS | | | | | | | | |
(Identified Cost $2,839,101) | | | | | | | | 2,095,902 |
| | | | | | | | |
| | | |
| | | | | Shares | | |
| | | |
| PREFERRED STOCKS – 1.9% | | | | | | | | |
| | | |
CONVERTIBLE PREFERRED
STOCKS – 1.3% | | | | | | | | |
| | | |
| Automotive – 0.3% | | | | | | | | |
Ford Motor Co. Capital Trust II, 6.500% | | | | | 81,667 | | | 2,459,810 |
| | | | | | | | |
| Capital Markets – 0.1% | | | | | | | | |
Newell Financial Trust I, 5.250% | | | | | 25,075 | | | 887,028 |
| | | | | | | | |
| Diversified Financial Services – 0.2% | | | | | | | | |
Sovereign Capital Trust IV, 4.375% | | | | | 55,343 | | | 1,674,126 |
| | | | | | | | |
| Electric Utilities – 0.1% | | | | | | | | |
AES Trust III, 6.750% | | | | | 10,000 | | | 440,625 |
| | | | | | | | |
See accompanying notes to financial statements.
58
PORTFOLIO OF INVESTMENTS – as of September 30, 2009
Loomis Sayles Fixed Income Fund – continued
| | | | | | | |
| | | | | Shares | | Value (†) |
| | | �� | | | | |
| | | |
| PREFERRED STOCKS – continued | | | | | | | |
| | | |
| Machinery – 0.1% | | | | | | | |
United Rentals Trust, 6.500% | | | | 30,199 | | $ | 751,200 |
| | | | | | | |
| Oil, Gas & Consumable Fuels – 0.1% | | | | | | | |
Chesapeake Energy Corp., 4.500% | | | | 775 | | | 64,558 |
El Paso Energy Capital Trust I, 4.750% | | | | 20,200 | | | 675,437 |
| | | | | | | |
| | | | | | | 739,995 |
| | | | | | | |
| REITs – 0.0% | | | | | | | |
FelCor Lodging Trust, Inc., Series A, 7.800% | | | | 2,500 | | | 28,750 |
| | | | | | | |
| Semiconductors & Semiconductor Equipment – 0.4% | | | | | | | |
Lucent Technologies Capital Trust, 7.750% | | | | 3,715 | | | 2,841,975 |
| | | | | | | |
| | | |
| TOTAL CONVERTIBLE PREFERRED STOCKS | | | | | | | |
(Identified Cost $10,708,194) | | | | | | | 9,823,509 |
| | | | | | | |
| | | |
| NON-CONVERTIBLE PREFERRED STOCKS – 0.6% | | | | | | | |
| | | |
| Diversified Financial Services – 0.4% | | | | | | | |
Bank of America Corp., 6.375% | | | | 5,000 | | | 89,750 |
Bank of America Corp., Series L, 7.250% | | | | 2,844 | | | 2,417,400 |
Preferred Blocker, Inc., 7.000%, 144A | | | | 1,121 | | | 651,896 |
| | | | | | | |
| | | | | | | 3,159,046 |
| | | | | | | |
| Electric Utilities – 0.1% | | | | | | | |
Entergy New Orleans, Inc., 4.360% | | | | 90 | | | 6,244 |
Entergy New Orleans, Inc., 4.750% | | | | 2,876 | | | 207,522 |
MDU Resources Group, Inc., 5.100% | | | | 254 | | | 24,979 |
Public Service Electric & Gas Co., 4.180% | | | | 1,950 | | | 138,645 |
Union Electric Co., 4.500% | | | | 4,670 | | | 343,245 |
Xcel Energy, Inc., 4.110% | | | | 100 | | | 6,781 |
| | | | | | | |
| | | | | | | 727,416 |
| | | | | | | |
| Thrifts & Mortgage Finance – 0.1% | | | | | | | |
Countrywide Capital IV, 6.750% | | | | 20,975 | | | 423,066 |
Federal Home Loan Mortgage Corp., 5.000%(g)(h) | | | | 4,150 | | | 10,998 |
Federal Home Loan Mortgage Corp., 5.570%(g)(h) | | | | 63,750 | | | 102,000 |
Federal Home Loan Mortgage Corp., 5.660%(g)(h) | | | | 18,900 | | | 31,185 |
Federal Home Loan Mortgage Corp., 5.700%(g)(h) | | | | 6,550 | | | 16,833 |
Federal Home Loan Mortgage Corp., 5.790%(g)(h) | | | | 12,100 | | | 32,186 |
Federal Home Loan Mortgage Corp., 5.810%(g)(h) | | | | 4,250 | | | 11,602 |
Federal Home Loan Mortgage Corp., 5.900%(g)(h) | | | | 9,400 | | | 15,980 |
Federal Home Loan Mortgage Corp., 6.000%(g)(h) | | | | 5,350 | | | 15,782 |
Federal Home Loan Mortgage Corp., 6.420%(g)(h) | | | | 3,800 | | | 11,400 |
Federal Home Loan Mortgage Corp., 6.550%(g)(h) | | | | 24,825 | | | 45,181 |
Federal Home Loan Mortgage Corp., (fixed rate to 12/31/2012, variable rate thereafter), 8.375%(g)(h) | | | | 88,575 | | | 160,321 |
Federal National Mortgage Association, 4.750%(g)(h) | | | | 8,200 | | | 20,910 |
Federal National Mortgage Association, 5.125%(g)(h) | | | | 2,900 | | | 7,714 |
Federal National Mortgage Association, 5.375%(g)(h) | | | | 5,800 | | | 16,472 |
Federal National Mortgage Association, 5.810%(g)(h) | | | | 2,400 | | | 6,696 |
Federal National Mortgage Association, 6.750%(g)(h) | | | | 3,750 | | | 5,888 |
Federal National Mortgage Association, (fixed rate to 12/13/2010, variable rate thereafter), 8.250%(g)(h) | | | | 119,675 | | | 192,677 |
| | | | | | | |
| | | | | | | 1,126,891 |
| | | | | | | |
See accompanying notes to financial statements.
59
| | | | | | | | |
| | | | | Shares | | Value (†) |
| | | | | | | | |
| | | |
| PREFERRED STOCKS – continued | | | | | | | | |
| | | |
| TOTAL NON-CONVERTIBLE PREFERRED STOCKS | | | | | | | | |
(Identified Cost $9,015,791) | | | | | | | $ | 5,013,353 |
| | | | | | | | |
| | | |
| TOTAL PREFERRED STOCKS | | | | | | | | |
(Identified Cost $19,723,985) | | | | | | | | 14,836,862 |
| | | | | | | | |
| | | |
| COMMON STOCKS – 1.4% | | | | | | | | |
| | | |
| Biotechnology – 0.6% | | | | | | | | |
EPIX Pharmaceuticals, Inc.(h) | | | | | 84,750 | | | 1,186 |
EPIX Pharmaceuticals, Inc., Contingent Value Rights(h) | | | | | 250 | | | — |
Vertex Pharmaceuticals, Inc.(h) | | | | | 127,420 | | | 4,829,218 |
| | | | | | | | |
| | | | | | | | 4,830,404 |
| | | | | | | | |
| Containers & Packaging – 0.2% | | | | | | | | |
Owens-Illinois, Inc.(h) | | | | | 35,353 | | | 1,304,526 |
| | | | | | | | |
| Electronic Equipment Instruments & Components – 0.4% | | | | | | | | |
Corning, Inc. | | | | | 205,167 | | | 3,141,107 |
| | | | | | | | |
| Oil, Gas & Consumable Fuels – 0.2% | | | | | | | | |
Chesapeake Energy Corp. | | | | | 54,259 | | | 1,540,956 |
| | | | | | | | |
| | | |
| TOTAL COMMON STOCKS | | | | | | | | |
(Identified Cost $7,974,296) | | | | | | | | 10,816,993 |
| | | | | | | | |
| | | |
| WARRANTS – 0.0% | | | | | | | | |
| | | |
| Pharmaceuticals – 0.0% | | | | | | | | |
Valeant Pharmaceuticals International, Expiration 8/16/2010(h)(i) | | | | | | | | |
(Identified Cost $0) | | | | | 26,098 | | | — |
| | | | | | | | |
| | | |
| | | | | Principal Amount (‡) | | |
| | | |
| SHORT-TERM INVESTMENTS – 2.0% | | | | | | | | |
| Repurchase Agreement with State Street Corporation, dated 9/30/2009 at 0.000%, to be repurchased at $3,234 on 10/01/2009 collateralized by $5,000 U.S. Treasury Bill, due 11/05/2009 valued at $5,000 including accrued interest (Note 2i of Notes to Financial Statements) | | | | $ | 3,234 | | | 3,234 |
| Tri-Party Repurchase Agreement with Fixed Income Clearing Corporation, dated 9/30/2009 at 0.000% to be repurchased at $14,851,540, on 10/01/2009 collateralized by $15,075,000 Federal National Mortgage Association, 3.000% due 1/13/2014 valued at $15,150,375 including accrued interest (Note 2i of Notes to Financial Statements) | | | | | 14,851,540 | | | 14,851,540 |
| | | | | | | | |
| | | |
| TOTAL SHORT-TERM INVESTMENTS | | | | | | | | |
(Identified Cost $14,854,774) | | | | | | | | 14,854,774 |
| | | | | | | | |
| | | |
| TOTAL INVESTMENTS – 98.7% | | | | | | | | |
(Identified Cost $725,504,077)(a) | | | | | | | | 752,337,139 |
Other assets less liabilities—1.3% | | | | | | | | 9,618,289 |
| | | | | | | | |
| | | |
| NET ASSETS – 100.0% | | | | | | | $ | 761,955,428 |
| | | | | | | | |
See accompanying notes to financial statements.
60
PORTFOLIO OF INVESTMENTS – as of September 30, 2009
Loomis Sayles Fixed Income Fund – continued
| | | | | | | |
| |
(‡) Principal amount stated in U.S. dollars unless otherwise noted. | | | |
(†) See Note 2a of Notes to Financial Statements. | | | |
(††) Amount shown represents units. One unit represents a principal amount of 25. | | | |
(†††) Amount shown represents units. One unit represents a principal amount of 100. | | | |
(a) Federal Tax Information: | | | |
At September 30, 2009, the net unrealized appreciation on investments based on a cost of $727,725,604 for federal income tax purposes was as follows: | | | |
Aggregate gross unrealized appreciation for all investments in which there is an excess of value over tax cost | | $ | 59,239,589 |
Aggregate gross unrealized depreciation for all investments in which there is an excess of tax cost over value | | | (34,628,054) |
| | | | | | | |
Net unrealized appreciation | | $ | 24,611,535 |
| | | | | | | |
| (b) | Illiquid security. At September 30, 2009, the value of these securities amounted to $25,267,070 or 3.3% of net assets. |
| (c) | Variable rate security. Rate as of September 30, 2009 is disclosed. |
| (d) | The issuer is in default with respect to interest and/or principal payments. Income is not being accrued. |
| (e) | Variable rate security. Rate shown represents the weighted average rate at September 30, 2009. |
| (f) | All or a portion of interest payment is paid-in-kind. |
| (g) | Future dividend payments have been eliminated as the issuer has been placed in conservatorship. |
| (h) | Non-income producing security. |
| (i) | Fair valued security by the Fund’s investment adviser. At September 30, 2009 the value of this security amounted to $0 or 0.0% of net assets. |
| (j) | Issuer has filed for bankruptcy. |
| 144A | Securities exempt from registration under Rule 144A of the Securities Act of 1933. These securities may be resold in transactions exempt from registration, normally to qualified institutional buyers. At September 30, 2009, the total value of these securities amounted to $78,779,447 or 10.3% of net assets. |
| ABS | Asset-Backed Securities |
| EMTN | Euro Medium Term Note |
| GMTN | Global Medium Term Note |
| REITs | Real Estate Investment Trusts |
Key to Abbreviations: AUD: Australian Dollar; BRL: Brazilian Real; CAD: Canadian Dollar; EUR: Euro; GBP: British Pound; IDR: Indonesian Rupiah; ISK: Icelandic Krona; KRW: South Korean Won; MXN: Mexican Peso; NOK: Norwegian Krone; NZD: New Zealand Dollar; SGD: Singapore Dollar;
THB: Thai Baht
INDUSTRY SUMMARY AT SEPTEMBER 30, 2009 (Unaudited)
| | | |
Treasuries | | 15.3 | % |
Banking | | 7.3 | |
Local Authorities | | 4.9 | |
Sovereigns | | 4.6 | |
Wirelines | | 4.3 | |
Supranational | | 4.2 | |
Technology | | 3.8 | |
Media Cable | | 3.6 | |
Non-Captive Diversified | | 3.5 | |
Electric | | 3.5 | |
Automotive | | 3.4 | |
Healthcare | | 2.6 | |
REITs | | 2.4 | |
Independent Energy | | 2.2 | |
Pipelines | | 2.0 | |
Other Investments, less than 2% each | | 29.1 | |
Short-Term Investments | | 2.0 | |
| | | |
Total Investments | | 98.7 | |
Other assets less liabilities | | 1.3 | |
| | | |
Net Assets | | 100.0 | % |
| | | |
See accompanying notes to financial statements.
61
CURRENCY EXPOSURE AT SEPTEMBER 30, 2009 AS A PERCENTAGE OF NET ASSETS (Unaudited)
| | | |
United States Dollar | | 64.4 | % |
Canadian Dollar | | 18.0 | |
New Zealand Dollar | | 3.1 | |
Brazilian Real | | 2.3 | |
Norwegian Krone | | 2.0 | |
Other, less than 2% each | | 8.9 | |
| | | |
Total Investments | | 98.7 | |
Other assets less liabilities | | 1.3 | |
| | | |
Net Assets | | 100.0 | % |
| | | |
See accompanying notes to financial statements.
62
PORTFOLIO OF INVESTMENTS – as of September 30, 2009
Loomis Sayles Global Bond Fund
| | | | | | | | |
| | | | | Principal Amount (‡) | | Value (†) |
| | | | | | | | |
| | | |
| BONDS AND NOTES – 94.6% of Net Assets | | | | | | | | |
| | | |
| NON-CONVERTIBLE BONDS – 94.4% | | | | | | | | |
| | | |
| Argentina – 0.4% | | | �� | | | | | |
Transportadora de Gas del Sur SA, 7.875%, 5/14/2017, 144A | | | | $ | 8,320,000 | | $ | 7,155,200 |
| | | | | | | | |
| Australia – 0.8% | | | | | | | | |
New South Wales Treasury Corp., Series 10RG, 7.000%, 12/01/2010 | | AUD | | | 16,675,000 | | | 15,153,768 |
New South Wales Treasury Corp., Series 17RG, 5.500%, 3/01/2017 | | AUD | | | 445,000 | | | 384,449 |
| | | | | | | | |
| | | | | | | | 15,538,217 |
| | | | | | | | |
| Austria – 1.1% | | | | | | | | |
Oesterreichische Kontrollbank AG, 1.800%, 3/22/2010 | | JPY | | | 1,944,000,000 | | | 21,731,284 |
| | | | | | | | |
| Belgium – 3.0% | | | | | | | | |
Anheuser-Busch InBev NV, 6.500%, 6/23/2017 | | GBP | | | 3,750,000 | | | 6,467,478 |
Kingdom of Belgium, 5.500%, 9/28/2017 | | EUR | | | 31,055,000 | | | 52,022,365 |
| | | | | | | | |
| | | | | | | | 58,489,843 |
| | | | | | | | |
| Bermuda – 0.8% | | | | | | | | |
Ingersoll-Rand Global Holding Co. Ltd., 6.875%, 8/15/2018 | | | | | 1,375,000 | | | 1,475,177 |
Noble Group Ltd., 8.500%, 5/30/2013, 144A | | | | | 4,805,000 | | | 5,201,413 |
Qtel International Finance Ltd., 7.875%, 6/10/2019, 144A | | | | | 2,300,000 | | | 2,629,454 |
White Mountains RE Group, 6.375%, 3/20/2017, 144A | | | | | 6,905,000 | | | 6,173,208 |
| | | | | | | | |
| | | | | | | | 15,479,252 |
| | | | | | | | |
| Brazil – 1.1% | | | | | | | | |
Banco Nacional de Desenvolvimento Economico e Social, 6.500%, 6/10/2019, 144A | | | | | 7,000,000 | | | 7,437,500 |
ISA Capital Do Brasil SA, 7.875%, 1/30/2012, 144A | | | | | 1,100,000 | | | 1,155,000 |
Republic of Brazil, 10.250%, 1/10/2028 | | BRL | | | 17,750,000 | | | 9,618,424 |
Telemar Norte Leste SA, 9.500%, 4/23/2019, 144A | | | | | 3,200,000 | | | 3,824,000 |
| | | | | | | | |
| | | | | | | | 22,034,924 |
| | | | | | | | |
| Canada – 3.5% | | | | | | | | |
ArcelorMittal USA Partnership, 9.750%, 4/01/2014 | | | | | 1,000,000 | | | 1,047,500 |
Barrick Gold Corp., 6.950%, 4/01/2019 | | | | | 970,000 | | | 1,135,613 |
Bell Aliant Regional Communications, 5.410%, 9/26/2016 | | CAD | | | 4,440,000 | | | 4,292,905 |
Bell Canada, MTN, 5.000%, 2/15/2017 | | CAD | | | 1,240,000 | | | 1,181,095 |
Bell Canada, MTN, 6.550%, 5/01/2029, 144A | | CAD | | | 160,000 | | | 147,141 |
Bell Canada, MTN, 7.300%, 2/23/2032 | | CAD | | | 3,180,000 | | | 3,177,980 |
Bell Canada, Series M-17, 6.100%, 3/16/2035 | | CAD | | | 3,090,000 | | | 2,695,211 |
Canadian Government, 4.500%, 6/01/2015 | | CAD | | | 41,303,000 | | | 42,289,813 |
Canadian Pacific Railway Co., 5.750%, 3/15/2033 | | | | | 810,000 | | | 779,829 |
Canadian Pacific Railway Co., 5.950%, 5/15/2037 | | | | | 1,745,000 | | | 1,721,816 |
Province of Quebec, 1.600%, 5/09/2013 | | JPY | | | 766,000,000 | | | 8,308,111 |
See accompanying notes to financial statements.
63
| | | | | | | |
| | | | | Principal Amount (‡) | | Value (†) |
| | | | | | | |
| | | |
| BONDS AND NOTES – continued | | | | | | | |
| | | |
| Canada – continued | | | | | | | |
Shaw Communications, Inc., 6.500%, 6/02/2014 | | CAD | | 1,550,000 | | $ | 1,593,475 |
| | | | | | | |
| | | | | | | 68,370,489 |
| | | | | | | |
| Cayman Islands – 1.5% | | | | | | | |
CCL Finance Ltd., 9.500%, 8/15/2014, 144A | | | | 5,000,000 | | | 5,312,500 |
Marfrig Overseas Ltd., 9.625%, 11/16/2016, 144A | | | | 1,170,000 | | | 1,161,225 |
Petrobras International Finance Co., 5.875%, 3/01/2018 | | | | 15,600,000 | | | 16,180,851 |
Vale Overseas Ltd., 6.875%, 11/21/2036 | | | | 6,716,000 | | | 6,947,910 |
| | | | | | | |
| | | | | | | 29,602,486 |
| | | | | | | |
| Colombia – 0.5% | | | | | | | |
Ecopetrol SA, 7.625%, 7/23/2019, 144A | | | | 4,000,000 | | | 4,380,000 |
Empresas Publicas de Medellin ESP, 7.625%, 7/29/2019, 144A | | | | 4,500,000 | | | 4,871,250 |
| | | | | | | |
| | | | | | | 9,251,250 |
| | | | | | | |
| France – 3.4% | | | | | | | |
France Telecom SA, EMTN, 4.750%, 2/21/2017 | | EUR | | 4,010,000 | | | 6,128,863 |
Government of France, 5.000%, 10/25/2016 | | EUR | | 10,070,000 | | | 16,542,843 |
Lafarge SA, EMTN, 4.750%, 3/23/2020 | | EUR | | 3,435,000 | | | 4,427,382 |
Lafarge SA, EMTN, 5.375%, 6/26/2017 | | EUR | | 3,000,000 | | | 4,253,345 |
PPR SA, EMTN, 4.000%, 1/29/2013 | | EUR | | 1,735,000 | | | 2,536,702 |
Veolia Environnement, 6.000%, 6/01/2018 | | | | 5,245,000 | | | 5,643,803 |
Veolia Environnement, EMTN, 5.125%, 5/24/2022 | | EUR | | 4,070,000 | | | 5,944,985 |
Wendel, 4.375%, 8/09/2017 | | EUR | | 4,650,000 | | | 4,831,247 |
Wendel, 4.875%, 5/26/2016 | | EUR | | 10,250,000 | | | 11,624,478 |
WPP Finance SA, 5.250%, 1/30/2015 | | EUR | | 2,400,000 | | | 3,453,773 |
| | | | | | | |
| | | | | | | 65,387,421 |
| | | | | | | |
| Germany – 15.8% | | | | | | | |
Bertelsmann AG, EMTN, 3.625%, 10/06/2015 | | EUR | | 9,800,000 | | | 13,015,728 |
Bundesobligation, 4.000%, 10/11/2013 | | EUR | | 26,600,000 | | | 41,641,664 |
Bundesrepublik Deutschland, Series 06, 3.750%, 1/04/2017(b) | | EUR | | 33,340,000 | | | 51,493,352 |
Bundesrepublik Deutschland, Series 153, 4.250%, 7/04/2017 | | EUR | | 1,700,000 | | | 2,701,087 |
Kreditanstalt fuer Wiederaufbau, 1.350%, 1/20/2014 | | JPY | | 1,494,000,000 | | | 16,933,087 |
Kreditanstalt fuer Wiederaufbau, 2.500%, 10/11/2010 | | EUR | | 15,925,000 | | | 23,745,277 |
Kreditanstalt fuer Wiederaufbau, 2.600%, 6/20/2037 | | JPY | | 1,140,000,000 | | | 12,705,796 |
Kreditanstalt fuer Wiederaufbau, Series INTL, 1.850%, 9/20/2010 | | JPY | | 834,000,000 | | | 9,407,276 |
Muenchener Hypothekenbank eG, 5.000%, 1/16/2012 | | EUR | | 11,515,000 | | | 18,025,783 |
Republic of Germany, 3.750%, 7/04/2013 | | EUR | | 24,140,000 | | | 37,386,119 |
Republic of Germany, 4.000%, 4/13/2012 | | EUR | | 44,825,000 | | | 69,549,317 |
Republic of Germany, 4.000%, 1/04/2037 | | EUR | | 7,639,000 | | | 11,221,784 |
| | | | | | | |
| | | | | | | 307,826,270 |
| | | | | | | |
See accompanying notes to financial statements.
64
PORTFOLIO OF INVESTMENTS – as of September 30, 2009
Loomis Sayles Global Bond Fund – continued
| | | | | | | | |
| | | | | Principal Amount (‡) | | Value (†) |
| | | | | | | | |
| | | |
| BONDS AND NOTES – continued | | | | | | | | |
| | | |
| India – 1.2% | | | | | | | | |
Canara Bank Ltd., (fixed rate to 11/28/2016, variable rate thereafter), 6.365%, 11/28/2021 | | | | $ | 17,500,000 | | $ | 16,147,810 |
ICICI Bank Ltd., (fixed rate to 4/30/2017, variable rate thereafter), 6.375%, 4/30/2022, 144A | | | | | 7,940,000 | | | 6,495,007 |
| | | | | | | | |
| | | | | | | | 22,642,817 |
| | | | | | | | |
| Indonesia – 1.0% | | | | | | | | |
Indonesia Government International Bond, 7.750%, 1/17/2038, 144A | | | | | 13,355,000 | | | 14,757,275 |
Indonesia Government International Bond, 11.500%, 9/15/2019 | | IDR | | | 42,900,000,000 | | | 4,835,596 |
| | | | | | | | |
| | | | | | | | 19,592,871 |
| | | | | | | | |
| Ireland – 2.2% | | | | | | | | |
Depfa ACS Bank, EMTN, 1.650%, 12/20/2016 | | JPY | | | 4,140,000,000 | | | 37,391,951 |
Elan Corp. PLC, 8.750%, 10/15/2016, 144A | | | | | 4,200,000 | | | 4,139,625 |
Elan Financial PLC, 7.750%, 11/15/2011 | | | | | 60,000 | | | 61,125 |
Elan Financial PLC, 8.875%, 12/01/2013 | | | | | 920,000 | | | 926,900 |
| | | | | | | | |
| | | | | | | | 42,519,601 |
| | | | | | | | |
| Italy – 0.5% | | | | | | | | |
Finmeccanica SpA, EMTN, 4.875%, 3/24/2025 | | EUR | | | 4,850,000 | | | 6,707,788 |
Telecom Italia SpA, EMTN, 5.375%, 1/29/2019 | | EUR | | | 1,500,000 | | | 2,221,364 |
| | | | | | | | |
| | | | | | | | 8,929,152 |
| | | | | | | | |
| Japan – 4.2% | | | | | | | | |
Development Bank of Japan, 1.750%, 3/17/2017 | | JPY | | | 400,000,000 | | | 4,681,303 |
Japan Finance Organization for Municipal Enterprises, 1.350%, 11/26/2013 | | JPY | | | 1,000,000,000 | | | 11,452,359 |
Japan Finance Organization for Municipal Enterprises, 1.550%, 2/21/2012 | | JPY | | | 1,200,000,000 | | | 13,696,831 |
Japan Government, 1.300%, 3/20/2019 | | JPY | | | 1,536,000,000 | | | 17,263,380 |
Japan Government, 1.400%, 6/20/2011 | | JPY | | | 3,067,100,000 | | | 34,857,345 |
| | | | | | | | |
| | | | | | | | 81,951,218 |
| | | | | | | | |
| Korea – 1.7% | | | | | | | | |
Export-Import Bank of Korea, 5.875%, 1/14/2015 | | | | | 5,300,000 | | | 5,587,530 |
Export-Import Bank of Korea, 8.125%, 1/21/2014 | | | | | 5,000,000 | | | 5,727,410 |
Korea Hydro & Nuclear Power Co. Ltd., 6.250%, 6/17/2014, 144A | | | | | 7,000,000 | | | 7,446,145 |
SK Broadband Co. Ltd., 7.000%, 2/01/2012, 144A | | | | | 1,610,000 | | | 1,658,300 |
SK Telecom Co. Ltd., 6.625%, 7/20/2027, 144A | | | | | 11,600,000 | | | 12,294,504 |
| | | | | | | | |
| | | | | | | | 32,713,889 |
| | | | | | | | |
| Luxembourg – 0.8% | | | | | | | | |
ArcelorMittal, 5.375%, 6/01/2013 | | | | | 915,000 | | | 935,459 |
ArcelorMittal, 6.125%, 6/01/2018 | | | | | 10,000 | | | 9,852 |
ArcelorMittal, 9.850%, 6/01/2019 | | | | | 2,800,000 | | | 3,311,851 |
Telecom Italia Capital SA, 4.950%, 9/30/2014 | | | | | 3,990,000 | | | 4,128,784 |
Telecom Italia Capital SA, 5.250%, 10/01/2015 | | | | | 1,660,000 | | | 1,718,550 |
Telecom Italia Capital SA, 6.375%, 11/15/2033 | | | | | 1,910,000 | | | 1,951,623 |
Telecom Italia Finance SA, 7.750%, 1/24/2033 | | EUR | | | 2,770,000 | | | 4,548,406 |
| | | | | | | | |
| | | | | | | | 16,604,525 |
| | | | | | | | |
See accompanying notes to financial statements.
65
| | | | | | | | | |
| | | | | Principal Amount (‡) | | | Value (†) |
| | | | | | | | | |
| | | |
| BONDS AND NOTES – continued | | | | | | | | | |
| | | |
| Mexico – 1.7% | | | | | | | | | |
Axtel SAB de CV, 7.625%, 2/01/2017, 144A | | | | $ | 4,030,000 | | | $ | 3,868,800 |
Desarrolladora Homex SAB de CV, 7.500%, 9/28/2015 | | | | | 8,400,000 | | | | 8,253,000 |
Mexican Fixed Rate Bonds, Series M-10, 8.500%, 12/13/2018 | | MXN | | | 1,537,500 | (††) | | | 11,799,917 |
Mexican Fixed Rate Bonds, Series M-20, 8.000%, 12/07/2023 | | MXN | | | 1,373,000 | (††) | | | 9,975,282 |
| | | | | | | | | |
| | | | | | | | | 33,896,999 |
| | | | | | | | | |
| Netherlands – 2.7% | | | | | | | | | |
Kingdom of Netherlands, 5.500%, 1/15/2028 | | EUR | | | 12,995,000 | | | | 22,541,256 |
Koninklijke KPN NV, EMTN, 4.750%, 1/17/2017 | | EUR | | | 13,445,000 | | | | 20,054,449 |
Linde Finance BV, EMTN, 4.750%, 4/24/2017 | | EUR | | | 3,865,000 | | | | 5,863,645 |
Majapahit Holding BV, 7.250%, 6/28/2017, 144A | | | | | 3,440,000 | | | | 3,508,800 |
OI European Group BV, 6.875%, 3/31/2017, 144A | | EUR | | | 1,000,000 | | | | 1,419,449 |
| | | | | | | | | |
| | | | | | | | | 53,387,599 |
| | | | | | | | | |
| Norway – 3.6% | | | | | | | | | |
Norwegian Government, 4.250%, 5/19/2017 | | NOK | | | 40,055,000 | | | | 7,050,348 |
Norwegian Government, 5.000%, 5/15/2015 | | NOK | | | 60,020,000 | | | | 11,042,543 |
Norwegian Government, 6.000%, 5/16/2011 | | NOK | | | 61,705,000 | | | | 11,225,672 |
Norwegian Government, 6.500%, 5/15/2013 | | NOK | | | 211,560,000 | | | | 40,345,105 |
| | | | | | | | | |
| | | | | | | | | 69,663,668 |
| | | | | | | | | |
| Peru – 0.2% | | | | | | | | | |
Peruvian Government, 7.350%, 7/21/2025 | | | | | 3,900,000 | | | | 4,553,250 |
| | | | | | | | | |
| Singapore – 0.9% | | | | | | | | | |
Singapore Government, 2.250%, 7/01/2013 | | SGD | | | 24,355,000 | | | | 18,053,372 |
| | | | | | | | | |
| South Africa – 1.1% | | | | | | | | | |
Edcon Proprietary Ltd., 4.023%, 6/15/2014, 144A(c) | | EUR | | | 8,495,000 | | | | 8,888,272 |
Republic of South Africa, EMTN, 4.500%, 4/05/2016 | | EUR | | | 9,275,000 | | | | 13,233,247 |
| | | | | | | | | |
| | | | | | | | | 22,121,519 |
| | | | | | | | | |
| Supranational – 2.1% | | | | | | | | | |
Asia Development Bank, 2.350%, 6/21/2027 | | JPY | | | 1,700,000,000 | | | | 19,449,466 |
European Investment Bank, 1.400%, 6/20/2017 | | JPY | | | 1,339,300,000 | | | | 15,150,942 |
European Investment Bank, EMTN, Zero Coupon, 4/24/2013, 144A | | IDR | | | 90,681,660,000 | | | | 6,678,449 |
International Bank for Reconstruction & Development, 9.500%, 5/27/2010 | | ISK | | | 8,000,000 | | | | 52,164 |
| | | | | | | | | |
| | | | | | | | | 41,331,021 |
| | | | | | | | | |
| Sweden – 1.4% | | | | | | | | | |
Swedish Government, 5.500%, 10/08/2012 | | SEK | | | 176,475,000 | | | | 27,817,909 |
| | | | | | | | | |
| United Arab Emirates – 2.5% | | | | | | | | | |
Abu Dhabi National Energy Co., 7.250%, 8/01/2018, 144A | | | | | 15,695,000 | | | | 16,812,123 |
Dolphin Energy Ltd., 5.888%, 6/15/2019, 144A | | | | | 5,600,000 | | | | 5,670,000 |
DP World Ltd., 6.850%, 7/02/2037, 144A | | | | | 29,110,000 | | | | 25,601,925 |
| | | | | | | | | |
| | | | | | | | | 48,084,048 |
| | | | | | | | | |
See accompanying notes to financial statements.
66
PORTFOLIO OF INVESTMENTS – as of September 30, 2009
Loomis Sayles Global Bond Fund – continued
| | | | | | | | |
| | | | | Principal Amount (‡) | | Value (†) |
| | | | | | | | |
| | | |
| BONDS AND NOTES – continued | | | | | | | | |
| | | |
| United Kingdom – 5.4% | | | | | | | | |
Barclays Bank PLC, 6.050%, 12/04/2017, 144A | | | | $ | 500,000 | | $ | 503,183 |
British Sky Broadcasting Group PLC, 6.100%, 2/15/2018, 144A | | | | | 9,150,000 | | | 9,856,828 |
British Sky Broadcasting Group PLC, 9.500%, 11/15/2018, 144A | | | | | 1,000,000 | | | 1,279,479 |
British Sky Broadcasting Group PLC, Series EMTN, 6.000%, 5/21/2027 | | GBP | | | 950,000 | | | 1,540,258 |
BSKYB Finance UK PLC, 5.750%, 10/20/2017 | | GBP | | | 1,415,000 | | | 2,390,125 |
Lloyds TSB Group PLC, 5.875%, 7/08/2014 | | EUR | | | 1,235,000 | | | 1,845,488 |
Rexam PLC, 6.750%, 6/01/2013, 144A | | | | | 13,775,000 | | | 14,774,362 |
SABMiller PLC, 6.500%, 7/15/2018, 144A | | | | | 1,500,000 | | | 1,664,894 |
United Kingdom Treasury, 4.000%, 9/07/2016 | | GBP | | | 14,405,000 | | | 24,426,823 |
United Kingdom Treasury, 4.750%, 3/07/2020 | | GBP | | | 11,325,000 | | | 19,761,462 |
United Kingdom Treasury, 5.000%, 9/07/2014 | | GBP | | | 4,000,000 | | | 7,088,760 |
United Kingdom Treasury, 5.000%, 3/07/2025 | | GBP | | | 7,445,000 | | | 13,310,914 |
WPP PLC, 6.000%, 4/04/2017 | | GBP | | | 4,550,000 | | | 6,964,218 |
| | | | | | | | |
| | | | | | | | 105,406,794 |
| | | | | | | | |
| United States – 29.3% | | | | | | | | |
AES Corp. (The), 9.375%, 9/15/2010 | | | | | 3,000,000 | | | 3,090,000 |
Ahold Finance USA, Inc., EMTN, 6.500%, 3/14/2017 | | GBP | | | 6,055,000 | | | 10,257,414 |
American Express Co., 6.150%, 8/28/2017 | | | | | 995,000 | | | 1,045,143 |
American Express Issuance Trust, Series 2005-2, Class A, 0.313%, 8/15/2013(c) | | | | | 815,000 | | | 798,682 |
American Home Mortgage Investment Trust, series 2007-2, Class 12A1, 0.516%, 3/25/2037(c) | | | | | 313,510 | | | 132,537 |
American Stores Co., Series B, MTN, 7.100%, 3/20/2028 | | | | | 2,250,000 | | | 1,777,500 |
ARG Funding Corp., Series 2005-2A, Class A5, 0.406%, 5/20/2011, 144A(c) | | | | | 1,685,000 | | | 1,685,005 |
Avis Budget Rental Car Funding AESOP LLC, 5.680%, 2/20/2013, 144A | | | | | 10,200,000 | | | 10,199,344 |
Bank of America Corp., (fixed rate to 5/06/2014, variable rate thereafter), 4.750%, 5/06/2019 | | EUR | | | 175,000 | | | 226,049 |
Bank of America Credit Card Trust, Series 2006-B4, Class B4, 0.323%, 3/15/2012(c) | | | | | 1,500,000 | | | 1,498,987 |
Bank of America Credit Card Trust, Series 2007-B2, Class B2, 0.443%, 6/15/2016(c) | | | | | 1,265,000 | | | 1,121,753 |
Bear Stearns Commercial Mortgage Securities, Series 2006-PW13, Class A4, 5.540%, 9/11/2041 | | | | | 300,000 | | | 286,349 |
Bear Stearns Commercial Mortgage Securities, Series 2007-PW15, Class A4, 5.331%, 2/11/2044 | | | | | 200,000 | | | 180,035 |
Bear Stearns Commercial Mortgage Securities, Series 2007-PW16, Class A4, 5.719%, 6/11/2040(c) | | | | | 100,000 | | | 91,345 |
Capital One Auto Finance Trust, Series 2007-C, Class A4, 5.230%, 7/15/2014 | | | | | 385,000 | | | 376,540 |
Capital One Financial Corp., 6.150%, 9/01/2016 | | | | | 1,090,000 | | | 1,070,373 |
Capital One Multi-Asset Execution Trust, Series 2004-B7, Class B7, 1.469%, 8/17/2017(c) | | EUR | | | 4,150,000 | | | 3,693,148 |
Capital One Multi-Asset Execution Trust, Series 2005-A10, Class A, 0.323%, 9/15/2015(c) | | | | | 840,000 | | | 820,829 |
See accompanying notes to financial statements.
67
| | | | | | | | |
| | | | | Principal Amount (‡) | | Value (†) |
| | | | | | | | |
| | | |
| BONDS AND NOTES – continued | | | | | | | | |
| | | |
| United States – continued | | | | | | | | |
Cargill, Inc., 7.350%, 3/06/2019, 144A | | | | $ | 1,500,000 | | $ | 1,736,481 |
Chase Issuance Trust, Series 2007-B1, Class B1, 0.493%, 4/15/2019(c) | | | | | 1,000,000 | | | 857,302 |
Chesapeake Energy Corp., 6.500%, 8/15/2017 | | | | | 2,050,000 | | | 1,880,875 |
Chesapeake Energy Corp., 6.875%, 11/15/2020 | | | | | 5,700,000 | | | 5,073,000 |
Citi Credit Card Issuance Trust, Series 2001-A4, Class A4, 5.375%, 4/10/2013 | | EUR | | | 5,130,000 | | | 7,371,794 |
Citibank Credit Card Issuance Trust, Series 2005-C1, Class C1, 5.500%, 3/24/2017 | | | | | 100,000 | | | 97,099 |
Citigroup, Inc., 5.000%, 9/15/2014 | | | | | 16,365,000 | | | 15,572,689 |
Citigroup, Inc., 6.125%, 5/15/2018 | | | | | 1,500,000 | | | 1,476,964 |
Citigroup, Inc., 6.125%, 8/25/2036 | | | | | 1,500,000 | | | 1,287,303 |
Comcast Corp., 4.950%, 6/15/2016 | | | | | 6,300,000 | | | 6,443,980 |
Comcast Corp., 5.650%, 6/15/2035 | | | | | 444,000 | | | 429,423 |
Continental Airlines, Inc., Series 2000-2, Class B, 8.307%, 10/02/2019 | | | | | 1,595,794 | | | 1,404,299 |
Continental Airlines, Inc., Series 2001-1, Class B, 7.373%, 6/15/2017 | | | | | 526,292 | | | 436,823 |
Corning, Inc., 5.900%, 3/15/2014 | | | | | 1,675,000 | | | 1,787,908 |
Corning, Inc., 6.200%, 3/15/2016 | | | | | 3,670,000 | | | 3,750,813 |
Corning, Inc., 7.250%, 8/15/2036 | | | | | 740,000 | | | 780,756 |
Couche-Tard US/Finance, 7.500%, 12/15/2013 | | | | | 3,775,000 | | | 3,817,469 |
Credit Suisse Mortgage Capital Certificates, Series 2007-C4, Class A4, 5.809%, 9/15/2039(c) | | | | | 900,000 | | | 713,009 |
Credit Suisse Mortgage Capital Certificates, Series 2007-C5, Class A4, 5.695%, 9/15/2040 | | | | | 1,675,000 | | | 1,320,074 |
CSX Corp., 5.600%, 5/01/2017 | | | | | 859,000 | | | 900,674 |
CSX Corp., 6.250%, 3/15/2018 | | | | | 8,075,000 | | | 8,757,297 |
CSX Corp., MTN, 6.000%, 10/01/2036 | | | | | 5,554,000 | | | 5,727,651 |
Delta Air Lines, Inc., Series 2007-1, Class A, 6.821%, 2/10/2024 | | | | | 6,980,932 | | | 6,457,362 |
Delta Air Lines, Inc., Series 2007-1, Class B, 8.021%, 2/10/2024 | | | | | 1,853,823 | | | 1,464,520 |
Embarq Corp., 7.995%, 6/01/2036 | | | | | 6,047,000 | | | 6,317,990 |
Energy Transfer Partners LP, 6.625%, 10/15/2036 | | | | | 215,000 | | | 223,155 |
Energy Transfer Partners LP, 6.700%, 7/01/2018 | | | | | 9,230,000 | | | 9,876,995 |
Erac USA Finance Co., 6.375%, 10/15/2017, 144A | | | | | 7,181,000 | | | 7,209,372 |
Erac USA Finance Co., 6.700%, 6/01/2034, 144A | | | | | 120,000 | | | 106,538 |
Erac USA Finance Co., 7.000%, 10/15/2037, 144A | | | | | 7,530,000 | | | 7,048,908 |
Frontier Communications Corp., 6.250%, 1/15/2013 | | | | | 6,175,000 | | | 6,051,500 |
General Electric Capital Corp., EMTN, 1.000%, 3/21/2012 | | JPY | | | 888,000,000 | | | 9,646,629 |
General Electric Capital Corp., Series A, GMTN, 5.250%, 4/15/2013 | | | | | 230,000 | | | 230,555 |
Georgia-Pacific LLC, 7.250%, 6/01/2028 | | | | | 4,540,000 | | | 4,040,600 |
Georgia-Pacific LLC, 8.000%, 1/15/2024 | | | | | 180,000 | | | 178,200 |
Georgia-Pacific LLC, 8.875%, 5/15/2031 | | | | | 1,805,000 | | | 1,823,050 |
Goldman Sachs Group, Inc. (The), 1.201%, 5/23/2016(c) | | EUR | | | 5,800,000 | | | 7,584,430 |
See accompanying notes to financial statements.
68
PORTFOLIO OF INVESTMENTS – as of September 30, 2009
Loomis Sayles Global Bond Fund – continued
| | | | | | | | |
| | | | | Principal Amount (‡) | | Value (†) |
| | | | | | | | |
| | | |
| BONDS AND NOTES – continued | | | | | | | | |
| | | |
| United States – continued | | | | | | | | |
Goldman Sachs Group, Inc. (The), 6.750%, 10/01/2037 | | | | $ | 1,750,000 | | $ | 1,806,054 |
Goldman Sachs Group, Inc. (The), 6.875%, 1/18/2038 | | GBP | | | 4,655,000 | | | 7,403,834 |
Goldman Sachs Group, Inc. (The), 7.250%, 4/10/2028 | | GBP | | | 2,050,000 | | | 3,944,613 |
Greenwich Capital Commercial Funding Corp., Series 2005-GG5, Class A2, 5.117%, 4/10/2037 | | | | | 11,075,000 | | | 11,047,935 |
Greenwich Capital Commercial Funding Corp., Series 2007-GG11, Class A4, 5.736%, 12/10/2049 | | | | | 1,000,000 | | | 900,436 |
Greenwich Capital Commercial Funding Corp., Series 2007-GG9, Class A4, 5.444%, 3/10/2039 | | | | | 700,000 | | | 620,349 |
GTE Corp., 6.940%, 4/15/2028 | | | | | 355,000 | | | 381,692 |
HCA, Inc., 5.750%, 3/15/2014 | | | | | 765,000 | | | 675,113 |
HCA, Inc., 6.250%, 2/15/2013 | | | | | 500,000 | | | 477,500 |
HCA, Inc., 6.375%, 1/15/2015 | | | | | 1,205,000 | | | 1,072,450 |
HCA, Inc., 6.500%, 2/15/2016 | | | | | 2,440,000 | | | 2,165,500 |
HCA, Inc., 7.500%, 11/06/2033 | | | | | 525,000 | | | 406,233 |
HCA, Inc., 7.690%, 6/15/2025 | | | | | 635,000 | | | 515,655 |
HCA, Inc., 8.750%, 9/01/2010 | | | | | 1,500,000 | | | 1,522,500 |
HCA, Inc., MTN, 7.580%, 9/15/2025 | | | | | 624,000 | | | 504,842 |
HCA, Inc., MTN, 7.750%, 7/15/2036 | | | | | 165,000 | | | 129,326 |
Hilcorp Energy I LP, 7.750%, 11/01/2015, 144A | | | | | 5,680,000 | | | 5,367,600 |
Home Depot, Inc. (The), 5.875%, 12/16/2036 | | | | | 5,772,000 | | | 5,600,029 |
HSI Asset Securitization Corp. Trust, Series 2006-OPT4, Class 2A4, 0.496%, 3/25/2036(c) | | | | | 850,000 | | | 292,204 |
International Paper Co., 7.950%, 6/15/2018 | | | | | 7,630,000 | | | 8,270,600 |
JPMorgan Chase & Co., 5.150%, 10/01/2015 | | | | | 6,000,000 | | | 6,224,844 |
JPMorgan Chase Commercial Mortgage Securities Corp., Series 2007-LD11, Class A4, 5.818%, 6/15/2049(c) | | | | | 1,900,000 | | | 1,660,733 |
Kinder Morgan Energy Partners LP, 5.800%, 3/15/2035 | | | | | 120,000 | | | 113,160 |
Kinder Morgan Energy Partners LP, 5.950%, 2/15/2018 | | | | | 10,800,000 | | | 11,298,074 |
LB-UBS Commercial Mortgage Trust, Series 2006-C4, Class A4, 5.882%, 6/15/2038(c) | | | | | 300,000 | | | 284,055 |
Merrill Auto Trust Securitization, Series 2008-1, Class A4A, 6.150%, 4/15/2015 | | | | | 8,155,000 | | | 8,613,499 |
Merrill Lynch & Co., Inc., 6.110%, 1/29/2037 | | | | | 280,000 | | | 266,324 |
Merrill Lynch & Co., Inc., EMTN, 4.625%, 9/14/2018 | | EUR | | | 14,450,000 | | | 18,280,699 |
Merrill Lynch & Co., Inc., Series C, MTN, 5.000%, 1/15/2015 | | | | | 575,000 | | | 580,580 |
Merrill Lynch & Co., Inc., Series C, MTN, 6.400%, 8/28/2017 | | | | | 1,090,000 | | | 1,103,913 |
Merrill Lynch/Countrywide Commercial Mortgage Trust, Series 2006-1, Class A2, 5.439%, 2/12/2039 | | | | | 5,755,000 | | | 5,797,921 |
Merrill Lynch/Countrywide Commercial Mortgage Trust, Series 2007-6, Class A4, 5.485%, 3/12/2051 | | | | | 1,000,000 | | | 778,703 |
Morgan Stanley, 4.750%, 4/01/2014 | | | | | 6,665,000 | | | 6,615,812 |
See accompanying notes to financial statements.
69
| | | | | | | |
| | | | | Principal Amount (‡) | | Value (†) |
| | | | | | | |
| | | |
| BONDS AND NOTES – continued | | | | | | | |
| | | |
| United States – continued | | | | | | | |
Morgan Stanley, 5.375%, 11/14/2013 | | GBP | | 2,070,000 | | $ | 3,351,305 |
Morgan Stanley Capital I, Series 2006-HQ10, Class A4, 5.328%, 11/12/2041 | | | | 100,000 | | | 90,941 |
Morgan Stanley Capital I, Series 2007-T27, Class A4, 5.650%, 6/11/2042(c) | | | | 700,000 | | | 660,578 |
Morgan Stanley Capital I, Series 2008-T29, Class A4, 6.280%, 1/11/2043(c) | | | | 200,000 | | | 194,007 |
Motorola, Inc., 5.220%, 10/01/2097 | | | | 60,000 | | | 32,944 |
Motorola, Inc., 6.500%, 9/01/2025 | | | | 125,000 | | | 105,636 |
Motorola, Inc., 6.500%, 11/15/2028 | | | | 115,000 | | | 94,853 |
Motorola, Inc., 6.625%, 11/15/2037 | | | | 6,120,000 | | | 5,125,500 |
Nabors Industries, Inc., 6.150%, 2/15/2018 | | | | 6,360,000 | | | 6,375,875 |
Nabors Industries, Inc., 9.250%, 1/15/2019 | | | | 730,000 | | | 867,541 |
National Semiconductor Corp., 6.150%, 6/15/2012 | | | | 9,275,000 | | | 9,677,952 |
National Semiconductor Corp., 6.600%, 6/15/2017 | | | | 335,000 | | | 331,067 |
New Albertson’s, Inc., 7.450%, 8/01/2029 | | | | 5,689,000 | | | 4,892,540 |
New Albertson’s, Inc., 7.750%, 6/15/2026 | | | | 50,000 | | | 44,500 |
New Albertson’s, Inc., 8.000%, 5/01/2031 | | | | 1,000,000 | | | 897,500 |
New Albertson’s, Inc., Series C, MTN, 6.625%, 6/01/2028 | | | | 830,000 | | | 641,175 |
News America, Inc., 6.150%, 3/01/2037 | | | | 3,730,000 | | | 3,649,607 |
Nextel Communications, Inc., Series D, 7.375%, 8/01/2015 | | | | 5,525,000 | | | 4,958,687 |
Nextel Communications, Inc., Series F, 5.950%, 3/15/2014 | | | | 540,000 | | | 477,900 |
NGPL PipeCo LLC, 7.768%, 12/15/2037, 144A | | | | 1,740,000 | | | 2,112,129 |
NiSource Finance Corp., 6.400%, 3/15/2018 | | | | 6,105,000 | | | 6,093,620 |
Owens & Minor, Inc., 6.350%, 4/15/2016(d) | | | | 7,740,000 | | | 6,978,516 |
Owens Brockway Glass Container, Inc., 6.750%, 12/01/2014 | | EUR | | 2,170,000 | | | 3,143,713 |
Panhandle Eastern Pipeline Co., 7.000%, 6/15/2018 | | | | 1,515,000 | | | 1,685,828 |
Pemex Project Funding Master Trust, Series REGS, 6.625%, 4/04/2010 | | EUR | | 190,000 | | | 283,319 |
ProLogis, 6.625%, 5/15/2018 | | | | 15,685,000 | | | 14,483,404 |
Questar Market Resources, Inc., 6.800%, 3/01/2020 | | | | 4,495,000 | | | 4,626,276 |
Qwest Capital Funding, Inc., 6.500%, 11/15/2018 | | | | 855,000 | | | 703,238 |
Qwest Capital Funding, Inc., 6.875%, 7/15/2028 | | | | 365,000 | | | 275,575 |
Qwest Capital Funding, Inc., 7.750%, 2/15/2031 | | | | 3,410,000 | | | 2,719,475 |
Qwest Corp., 6.875%, 9/15/2033 | | | | 2,635,000 | | | 2,134,350 |
Qwest Corp., 7.200%, 11/10/2026 | | | | 100,000 | | | 83,500 |
Qwest Corp., 7.250%, 9/15/2025 | | | | 1,656,000 | | | 1,428,300 |
Qwest Corp., 7.250%, 10/15/2035 | | | | 5,165,000 | | | 4,157,825 |
Qwest Corp., 7.500%, 6/15/2023 | | | | 5,285,000 | | | 4,809,350 |
Reynolds American, Inc., 6.750%, 6/15/2017 | | | | 9,935,000 | | | 10,328,019 |
Sierra Receivables Funding Co., Series 2009-3A, Class A1, 7.620%, 7/20/2026, 144A | | | | 13,000,000 | | | 13,000,000 |
Simon Property Group LP, 5.750%, 12/01/2015 | | | | 15,000 | | | 15,344 |
Simon Property Group LP, 5.875%, 3/01/2017 | | | | 50,000 | | | 50,990 |
Simon Property Group LP, 6.125%, 5/30/2018 | | | | 5,240,000 | | | 5,279,693 |
See accompanying notes to financial statements.
70
PORTFOLIO OF INVESTMENTS – as of September 30, 2009
Loomis Sayles Global Bond Fund – continued
| | | | | | | | |
| | | | | Principal Amount (‡) | | Value (†) |
| | | | | | | | |
| | | |
| BONDS AND NOTES – continued | | | | | | | | |
| | | |
| United States – continued | | | | | | | | |
Simon Property Group LP, 10.350%, 4/01/2019 | | | | $ | 505,000 | | $ | 628,448 |
SLM Corp., Series A, MTN, 5.000%, 10/01/2013 | | | | | 6,610,000 | | | 5,261,950 |
Soundview Home Equity Loan Trust, Series 2006-OPT5, Class 2A3, 0.396%, 7/25/2036(c) | | | | | 1,075,000 | | | 639,015 |
Southern Natural Gas Co., 7.350%, 2/15/2031 | | | | | 70,000 | | | 75,547 |
Sprint Capital Corp., 6.900%, 5/01/2019 | | | | | 1,895,000 | | | 1,696,025 |
Sprint Capital Corp., 8.750%, 3/15/2032 | | | | | 655,000 | | | 618,975 |
Sprint Nextel Corp., 6.000%, 12/01/2016 | | | | | 100,000 | | | 89,250 |
Tennessee Gas Pipeline Co., 7.000%, 3/15/2027 | | | | | 170,000 | | | 180,636 |
Textron, Inc., 3.875%, 3/11/2013 | | EUR | | | 11,350,000 | | | 15,336,262 |
Time Warner, Inc., 6.625%, 5/15/2029 | | | | | 2,170,000 | | | 2,226,611 |
Time Warner, Inc., 6.950%, 1/15/2028 | | | | | 2,795,000 | | | 2,946,782 |
Time Warner, Inc., 7.625%, 4/15/2031 | | | | | 25,000 | | | 28,019 |
U.S. Treasury Note, 1.000%, 7/31/2011 | | | | | 27,905,000 | | | 27,984,585 |
U.S. Treasury Note, 1.500%, 12/31/2013 | | | | | 14,265,000 | | | 13,967,446 |
U.S. Treasury Note, 2.625%, 6/30/2014 | | | | | 44,295,000 | | | 45,083,983 |
Union Pacific Corp., 5.375%, 6/01/2033 | | | | | 1,198,000 | | | 1,213,192 |
Union Pacific Corp., 5.650%, 5/01/2017 | | | | | 4,190,000 | | | 4,452,830 |
UnitedHealth Group, Inc., 5.800%, 3/15/2036 | | | | | 2,715,000 | | | 2,632,850 |
UnitedHealth Group, Inc., 6.000%, 2/15/2018 | | | | | 10,293,000 | | | 10,816,358 |
UnitedHealth Group, Inc., 6.500%, 6/15/2037 | | | | | 1,750,000 | | | 1,818,861 |
Wachovia Bank Commercial Mortgage Trust, Series 2006-C29, Class A4, 5.308%, 11/15/2048 | | | | | 300,000 | | | 270,128 |
Wells Fargo & Co., 4.625%, 11/02/2035 | | GBP | | | 7,780,000 | | | 11,258,603 |
World Financial Network Credit Card Master Trust, Series 2008-A, Class M, 5.243%, 6/15/2014(c) | | | | | 2,000,000 | | | 1,915,100 |
| | | | | | | | |
| | | | | | | | 570,961,330 |
| | | | | | | | |
| | | |
| TOTAL NON-CONVERTIBLE BONDS | | | | | | | | |
(Identified Cost $1,741,809,258) | | | | | | | | 1,841,098,218 |
| | | | | | | | |
| | | |
| CONVERTIBLE BONDS – 0.2% | | | | | | | | |
| | | |
| United States – 0.2% | | | | | | | | |
ERP Operating LP, 3.850%, 8/15/2026 | | | | | 1,500,000 | | | 1,485,990 |
Hologic, Inc., (Step to Zero Coupon on 12/15/2013), 2.000%, 12/15/2037(e) | | | | | 3,820,000 | | | 3,122,850 |
| | | | | | | | |
| | | |
| TOTAL CONVERTIBLE BONDS | | | | | | | | |
(Identified Cost $4,022,749) | | | | | | | | 4,608,840 |
| | | | | | | | |
| | | |
| TOTAL BONDS AND NOTES | | | | | | | | |
(Identified Cost $1,745,832,007) | | | | | | | | 1,845,707,058 |
| | | | | | | | |
| | | |
| | | | | Shares | | |
| | | |
| PREFERRED STOCKS – 0.1% | | | | | | | | |
| | | |
| NON-CONVERTIBLE PREFERRED STOCKS – 0.1% | | | | | | | | |
| | | |
| United States – 0.1% | | | | | | | | |
Federal Home Loan Mortgage Corp., 5.000%(f)(g) | | | | | 1,000 | | | 2,650 |
See accompanying notes to financial statements.
71
| | | | | | | | |
| | | | | Shares | | Value (†) |
| | | | | | | | |
| | | |
| PREFERRED STOCKS – continued | | | | | | | | |
| | | |
| United States – continued | | | | | | | | |
Federal Home Loan Mortgage Corp., 5.570%(f)(g) | | | | | 33,383 | | $ | 53,413 |
Federal Home Loan Mortgage Corp., 5.660%(f)(g) | | | | | 5,433 | | | 8,964 |
Federal Home Loan Mortgage Corp., 6.420%(f)(g) | | | | | 2,889 | | | 8,667 |
Federal Home Loan Mortgage Corp., 6.550%(f)(g) | | | | | 1,755 | | | 3,194 |
Federal Home Loan Mortgage Corp., (fixed rate to 12/31/2012, variable rate thereafter), 8.375%(f)(g) | | | | | 552,117 | | | 999,332 |
Federal National Mortgage Association, 4.750%(f)(g) | | | | | 6,159 | | | 15,706 |
Federal National Mortgage Association, 5.125%(f)(g) | | | | | 650 | | | 1,729 |
Federal National Mortgage Association, 5.375%(f)(g) | | | | | 1,350 | | | 3,834 |
Federal National Mortgage Association, 6.750%(f)(g) | | | | | 2,802 | | | 4,399 |
Federal National Mortgage Association, (fixed rate to 12/13/2010, variable rate thereafter), 8.250%(f)(g) | | | | | 1,085,090 | | | 1,746,995 |
| | | | | | | | |
| | | |
| TOTAL NON-CONVERTIBLE PREFERRED STOCKS | | | | | | | | |
(Identified Cost $38,335,382) | | | | | | | | 2,848,883 |
| | | | | | | | |
| | | |
| TOTAL PREFERRED STOCKS | | | | | | | | |
(Identified Cost $38,335,382) | | | | | | | | 2,848,883 |
| | | | | | | | |
| | | |
| | | | | Principal Amount (‡) | | |
| | | |
| SHORT-TERM INVESTMENTS – 1.7% | | | | | | | | |
| Tri-Party Repurchase Agreement with Fixed Income Clearing Corporation dated 9/30/2009 at 0.000% to be repurchased at $32,640,617 on 10/01/2009 collateralized by $8,850,000 Federal Home Loan Mortgage Corp., 3.030% due 5/05/2014 valued at $8,927,438; $24,245,000 Federal National Mortgage Association, 3.000% due 1/13/2014 valued at $24,366,225 including accrued interest (Note 2i of Notes to Financial Statements) (Identified Cost $32,640,617) | | | | $ | 32,640,617 | | | 32,640,617 |
| | | | | | | | |
| | | |
| TOTAL INVESTMENTS – 96.4% | | | | | | | | |
(Identified Cost $1,816,808,006)(a) | | | | | | | | 1,881,196,558 |
Other Assets Less Liabilities—3.6% | | | | | | | | 70,009,889 |
| | | | | | | | |
| | | |
| NET ASSETS – 100.0% | | | | | | | $ | 1,951,206,447 |
| | | | | | | | |
(‡) Principal amount stated in U.S. dollars unless otherwise noted. | | | |
(†) See Note 2a of Notes to Financial Statements. | | | |
(††) Amount shown represents units. One unit represents a principal amount of 100. | | | |
(a) Federal Tax Information: At September 30, 2009, the net unrealized appreciation on investments based on a cost of $1,822,783,746 for federal income tax purposes was as follows: | | | |
Aggregate gross unrealized appreciation for all investments in which there is an excess of value over tax cost | | $ | 118,401,026 |
Aggregate gross unrealized depreciation for all investments in which there is an excess of tax cost over value | | | (59,988,214) |
| | | | | | | | |
Net unrealized appreciation | | $ | 58,412,812 |
| | | | | | | | |
| (b) | All or a portion of this security is held as collateral for open forward foreign currency contracts or open swap agreements. |
| (c) | Variable rate security. Rate as of September 30, 2009 is disclosed. |
| (d) | Illiquid security. At September 30, 2009, the value of this security amounted to $6,978,516 or 0.4% of net assets. |
| (e) | Step Bond: Coupon is a fixed rate for an initial period then resets at a specified date and rate. |
| (f) | Future dividend payments have been eliminated as the issuer has been placed in conservatorship. |
| (g) | Non-income producing security. |
| 144A | Securities exempt from registration under Rule 144A of the Securities Act of 1933. These securities may be resold in transactions exempt from registration, normally to qualified institutional buyers. At September 30, 2009, the total value of these securities amounted to $245,230,688 or 12.6% of net assets. |
See accompanying notes to financial statements.
72
PORTFOLIO OF INVESTMENTS – as of September 30, 2009
Loomis Sayles Global Bond Fund – continued
| EMTN | Euro Medium Term Note |
| GMTN | Global Medium Term Note |
Key to Abbreviations: AUD: Australian Dollar; BRL: Brazilian Real; CAD: Canadian Dollar; EUR: Euro; GBP: British Pound; IDR: Indonesian Rupiah; ISK: Icelandic Krona; JPY: Japanese Yen; MXN: Mexican Peso; NOK: Norwegian Krone; SEK: Swedish Krona; SGD: Singapore Dollar
At September 30, 2009, the Fund had the following open credit default swap agreement:
| | | | | | | | | | | | | | | | | | | |
Buy Protection | | | | | | | | | | | | | | | |
Counterparty | | Reference Obligation | | (Pay)/Receive
Fixed Rate | | Expiration
Date | | Notional
Value | | Unamortized
Up Front
Payment | | Market
Value | | Unrealized
Depreciation | |
Morgan Stanley | | CDX North America Investment Grade Index | | (1.00)% | | 6/20/2014 | | $ | 35,000,000 | | $ | 339,259 | | $ | 150,447 | | $ | (197,561 | )* |
| *Unrealized | depreciation includes fees payable of $8,749. |
At September 30, 2009, the Fund had the following open forward foreign currency contracts:
| | | | | | | | | | |
| Contract to Buy/Sell | | Delivery
Date | | Currency | | Units | | Value | | Unrealized Appreciation (Depreciation) |
Sell1 | | 12/14/2009 | | Japanese Yen | | 1,520,000,000 | | $16,941,201 | | $ (385,811) |
Buy1 | | 12/14/2009 | | South Korean Won | | 21,500,000,000 | | 18,230,647 | | 650,926 |
Buy2 | | 12/14/2009 | | South Korean Won | | 43,930,000,000 | | 37,249,877 | | 1,256,431 |
| | | | | | | | | | |
Total | | | | | | | | | | $1,521,546 |
| | | | | | | | | | |
| 2Counterparty | is Barclays Bank PLC. |
INDUSTRY SUMMARY AT SEPTEMBER 30, 2009 (Unaudited)
| | | |
Treasuries | | 34.1 | % |
Banking | | 8.8 | |
Government Guaranteed | | 4.8 | |
Sovereigns | | 4.7 | |
Wirelines | | 4.6 | |
Government Owned - No Guarantee | | 3.7 | |
Supranational | | 2.1 | |
Other Investments, less than 2% each | | 31.9 | |
Short-Term Investments | | 1.7 | |
| | | |
Total Investments | | 96.4 | |
Other assets less liabilities (including open Credit Default Swap Agreement & open Forward Foreign Currency Contracts) | | 3.6 | |
| | | |
Net Assets | | 100.0 | % |
| | | |
CURRENCY EXPOSURE AT SEPTEMBER 30, 2009 AS A PERCENTAGE OF NET ASSETS (Unaudited)
| | | |
United States Dollar | | 40.0 | % |
Euro | | 26.8 | |
Japanese Yen | | 12.0 | |
British Pound | | 6.0 | |
Norwegian Krone | | 3.6 | |
Canadian Dollar | | 2.8 | |
Other, less than 2% each | | 5.2 | |
| | | |
Total Investments | | 96.4 | |
Other assets less liabilities (including open Credit Default Swap Agreement & open Forward Foreign Currency Contracts) | | 3.6 | |
| | | |
Net Assets | | 100.0 | % |
| | | |
See accompanying notes to financial statements.
73
PORTFOLIO OF INVESTMENTS – as of September 30, 2009
Loomis Sayles Inflation Protected Securities Fund
| | | | | | | | | |
| | | | | Principal Amount (‡) | | | Value (†) |
| | | | | | | | | |
| |
| BONDS AND NOTES – 96.1% of Net Assets | | | | |
| | | |
| Banking – 1.1% | | | | | | | | | |
Goldman Sachs Group, Inc. (The), 6.125%, 2/15/2033 | | | | $ | 10,000 | | | $ | 10,692 |
Goldman Sachs Group, Inc. (The), 6.750%, 10/01/2037 | | | | | 145,000 | | | | 149,645 |
| | | | | | | | | |
| | | | | | | | | 160,337 |
| | | | | | | | | |
| Construction Machinery – 1.1% | | | | | | | | | |
Joy Global, Inc., 6.625%, 11/15/2036 | | | | | 165,000 | | | | 153,743 |
| | | | | | | | | |
| Food & Beverage – 0.8% | | | | | | | | | |
Bottling Group LLC, 5.125%, 1/15/2019 | | | | | 40,000 | | | | 42,626 |
Dean Foods Co., 6.900%, 10/15/2017 | | | | | 75,000 | | | | 70,500 |
| | | | | | | | | |
| | | | | | | | | 113,126 |
| | | | | | | | | |
| Independent Energy – 0.2% | | | | | | | | | |
Chesapeake Energy Corp., 6.500%, 8/15/2017 | | | | | 35,000 | | | | 32,113 |
| | | | | | | | | |
| Lodging – 0.3% | | | | | | | | | |
Royal Caribbean Cruises Ltd., 7.500%, 10/15/2027 | | | | | 50,000 | | | | 39,000 |
| | | | | | | | | |
| Metals & Mining – 0.8% | | | | | | | | | |
Alcoa, Inc., 5.950%, 2/01/2037 | | | | | 85,000 | | | | 71,487 |
United States Steel Corp., 6.650%, 6/01/2037 | | | | | 55,000 | | | | 44,860 |
| | | | | | | | | |
| | | | | | | | | 116,347 |
| | | | | | | | | |
| Paper – 0.5% | | | | | | | | | |
Georgia-Pacific LLC, 7.700%, 6/15/2015 | | | | | 70,000 | | | | 70,700 |
| | | | | | | | | |
| Pipelines – 0.2% | | | | | | | | | |
Colorado Interstate Gas Co., 5.950%, 3/15/2015 | | | | | 3,000 | | | | 3,153 |
Southern Natural Gas Co., 7.350%, 2/15/2031 | | | | | 30,000 | | | | 32,377 |
| | | | | | | | | |
| | | | | | | | | 35,530 |
| | | | | | | | | |
| Retailers – 0.8% | | | | | | | | | |
CVS Caremark Corp., 6.125%, 9/15/2039 | | | | | 105,000 | | | | 106,808 |
| | | | | | | | | |
| Sovereigns – 0.8% | | | | | | | | | |
Mexican Fixed Rate Bonds, Series M-10, 8.000%, 12/17/2015 | | MXN | | | 15,000 | (††) | | | 113,136 |
| | | | | | | | | |
| Technology – 1.3% | | | | | | | | | |
Agilent Technologies, Inc., 6.500%, 11/01/2017 | | | | | 105,000 | | | | 109,267 |
Alcatel-Lucent USA, Inc., 6.450%, 3/15/2029 | | | | | 90,000 | | | | 68,512 |
Alcatel-Lucent USA, Inc., 6.500%, 1/15/2028 | | | | | 15,000 | | | | 11,419 |
| | | | | | | | | |
| | | | | | | | | 189,198 |
| | | | | | | | | |
| Textile – 0.1% | | | | | | | | | |
Jones Apparel Group, Inc., 6.125%, 11/15/2034 | | | | | 10,000 | | | | 7,400 |
| | | | | | | | | |
| Tobacco – 1.3% | | | | | | | | | |
Altria Group, Inc., 9.950%, 11/10/2038 | | | | | 130,000 | | | | 176,747 |
| | | | | | | | | |
| U.S. Treasuries – 82.9% | | | | | | | | | |
U.S. Treasury Inflation Indexed Bond, 1.375%, 7/15/2018 | | | | | 274,645 | | | | 271,899 |
U.S. Treasury Inflation Indexed Bond, 1.625%, 1/15/2018 | | | | | 863,520 | | | | 872,155 |
See accompanying notes to financial statements.
74
PORTFOLIO OF INVESTMENTS – as of September 30, 2009
Loomis Sayles Inflation Protected Securities Fund – continued
| | | | | | | | |
| | | | | Principal Amount (‡) | | Value (†) |
| | | | | | | | |
| | | |
| BONDS AND NOTES – continued | | | | | | | | |
| | | |
| U.S. Treasuries – continued | | | | | | | | |
U.S. Treasury Inflation Indexed Bond, 1.750%, 1/15/2028 | | | | $ | 231,300 | | $ | 221,614 |
U.S. Treasury Inflation Indexed Bond, 2.000%, 1/15/2026 | | | | | 146,484 | | | 146,164 |
U.S. Treasury Inflation Indexed Bond, 2.125%, 1/15/2019 | | | | | 190,587 | | | 200,117 |
U.S. Treasury Inflation Indexed Bond, 2.375%, 1/15/2017 | | | | | 865,015 | | | 920,430 |
U.S. Treasury Inflation Indexed Bond, 2.375%, 1/15/2025 | | | | | 645,529 | | | 676,798 |
U.S. Treasury Inflation Indexed Bond, 2.500%, 7/15/2016 | | | | | 261,270 | | | 280,049 |
U.S. Treasury Inflation Indexed Bond, 3.375%, 4/15/2032 | | | | | 1,431,706 | | | 1,767,710 |
U.S. Treasury Inflation Indexed Note, 0.625%, 4/15/2013 | | | | | 198,687 | | | 198,253 |
U.S. Treasury Inflation Indexed Note, 1.625%, 1/15/2015 | | | | | 541,382 | | | 551,533 |
U.S. Treasury Inflation Indexed Note, 1.875%, 7/15/2013 | | | | | 685,965 | | | 708,688 |
U.S. Treasury Inflation Indexed Note, 1.875%, 7/15/2015 | | | | | 476,100 | | | 491,871 |
U.S. Treasury Inflation Indexed Note, 2.000%, 1/15/2014 | | | | | 635,219 | | | 657,849 |
U.S. Treasury Inflation Indexed Note, 2.000%, 7/15/2014 | | | | | 645,529 | | | 670,947 |
U.S. Treasury Inflation Indexed Note, 2.000%, 1/15/2016 | | | | | 808,377 | | | 838,691 |
U.S. Treasury Inflation Indexed Note, 2.375%, 1/15/2027 | | | | | 357,753 | | | 375,977 |
U.S. Treasury Inflation Indexed Note, 2.625%, 7/15/2017 | | | | | 1,018,328 | | | 1,105,522 |
U.S. Treasury Inflation Indexed Note, 3.000%, 7/15/2012 | | | | | 586,917 | | | 623,966 |
| | | | | | | | |
| | | | | | | | 11,580,233 |
| | | | | | | | |
| Wireless – 0.9% | | | | | | | | |
ALLTEL Corp., 7.875%, 7/01/2032 | | | | | 20,000 | | | 24,620 |
Nextel Communications, Inc., Series D, 7.375%, 8/01/2015 | | | | | 20,000 | | | 17,950 |
Nextel Communications, Inc., Series E, 6.875%, 10/31/2013 | | | | | 5,000 | | | 4,638 |
Nextel Communications, Inc., Series F, 5.950%, 3/15/2014 | | | | | 10,000 | | | 8,850 |
Sprint Capital Corp., 6.875%, 11/15/2028 | | | | | 85,000 | | | 70,975 |
| | | | | | | | |
| | | | | | | | 127,033 |
| | | | | | | | |
| Wirelines – 3.0% | | | | | | | | |
AT&T Corp., 8.000%, 11/15/2031 | | | | | 80,000 | | | 99,683 |
Bell Canada, MTN, 5.000%, 2/15/2017 | | CAD | | | 30,000 | | | 28,575 |
Bell Canada, MTN, 6.550%, 5/01/2029, 144A | | CAD | | | 5,000 | | | 4,598 |
Bell Canada, MTN, 7.300%, 2/23/2032 | | CAD | | | 15,000 | | | 14,991 |
Bell Canada, Series M-17, 6.100%, 3/16/2035 | | CAD | | | 35,000 | | | 30,528 |
See accompanying notes to financial statements.
75
| | | | | | | | |
| | | | | Principal Amount (‡) | | Value (†) |
| | | | | | | | |
| | | |
| BONDS AND NOTES – continued | | | | | | | | |
| | | |
| Wirelines – continued | | | | | | | | |
BellSouth Telecommunications, Inc., 7.000%, 12/01/2095 | | | | $ | 70,000 | | $ | 69,506 |
Embarq Corp., 7.995%, 6/01/2036 | | | | | 165,000 | | | 172,394 |
| | | | | | | | |
| | | | | | | | 420,275 |
| | | | | | | | |
| | | |
| TOTAL BONDS AND NOTES | | | | | | | | |
(Identified Cost $13,222,438) | | | | | | | | 13,441,726 |
| | | | | | | | |
| | | |
| | | | | Shares | | |
| | | |
| PREFERRED STOCKS – 0.1% | | | | | | | | |
| | |
| NON-CONVERTIBLE PREFERRED STOCKS – 0.1% | | | | | | |
| | | |
| Thrifts & Mortgage Finance – 0.1% | | | | | | | | |
Federal Home Loan Mortgage Corp., (fixed rate to 12/31/2012, variable rate thereafter), 8.375%(b)(c) | | | | | 1,160 | | | 2,100 |
Federal National Mortgage Association, (fixed rate to 12/13/2010, variable rate thereafter), 8.250%(b)(c) | | | | | 3,500 | | | 5,635 |
| | | | | | | | |
| | | |
| TOTAL NON-CONVERTIBLE PREFERRED STOCKS | | | | | | | | |
(Identified Cost $116,500) | | | | | | | | 7,735 |
| | | | | | | | |
| | | |
| TOTAL PREFERRED STOCKS | | | | | | | | |
(Identified Cost $116,500) | | | | | | | | 7,735 |
| | | | | | | | |
| | | | | Principal Amount (‡) | | |
| | | |
| SHORT-TERM INVESTMENTS – 3.4% | | | | | | | | |
| Tri-Party Repurchase Agreement with Fixed Income Clearing Corporation, dated 9/30/2009 at 0.000% to be repurchased at $476,954 on 10/01/2009 collateralized by $485,000 Federal Home Loan Bank, 2.900% due 7/02/2013 valued at $489,244 including accrued interest (Note 2i of Notes to Financial Statements) | | | | | | | | |
(Identified Cost $476,954) | | | | $ | 476,954 | | | 476,954 |
| | | | | | | | |
| | | |
| TOTAL INVESTMENTS – 99.6% | | | | | | | | |
(Identified Cost $13,815,892)(a) | | | | | | | | 13,926,415 |
Other assets less liabilities—0.4% | | | | | | | | 49,574 |
| | | | | | | | |
| | | |
| NET ASSETS – 100.0% | | | | | | | $ | 13,975,989 |
| | | | | | | | |
(‡) Principal amount stated in U.S. dollars unless otherwise noted. | | | |
(†) See Note 2a of Notes to Financial Statements. | | | |
(††) Amount shown represents units. One unit represents a principal amount of 100. | | | |
(a) Federal Tax Information: | | | | | | | | |
At September 30, 2009, the net unrealized appreciation on investments based on a cost of $13,935,595 for federal income tax purposes was as follows: | | | |
Aggregate gross unrealized appreciation for all investments in which there is an excess of value over tax cost | | $ | 251,801 |
Aggregate gross unrealized depreciation for all investments in which there is an excess of tax cost over value | | | (260,981) |
| | | | | | | | |
Net unrealized depreciation | | $ | (9,180) |
| | | | | | | | |
| (b) | Future dividend payments have been eliminated as the issuer has been placed in conservatorship. |
| (c) | Non-income producing security. |
| 144A | Securities exempt from registration under Rule 144A of the Securities Act of 1933. This security may be resold in transactions exempt from registration, normally to qualified institutional buyers. At September 30, 2009, the total value of this security amounted to $4,598 or 0.0% of net assets. |
Key to Abbreviations: CAD: Canadian Dollar; MXN: Mexican Peso
See accompanying notes to financial statements.
76
PORTFOLIO OF INVESTMENTS – as of September 30, 2009
Loomis Sayles Inflation Protected Securities Fund – continued
At September 30, 2009, the Fund had the following open forward foreign currency contracts:
| | | | | | | | | | |
| Contract to Buy/Sell | | Delivery
Date | | Currency | | Units | | Value | | Unrealized Appreciation
(Depreciation) |
Buy1 | | 10/30/2009 | | Singapore Dollar | | 400,000 | | $283,898 | | $7,566 |
Sell1 | | 10/30/2009 | | Singapore Dollar | | 400,000 | | 283,898 | | (6,332) |
| | | | | | | | | | |
Total | | | | | | | | | | $1,234 |
| | | | | | | | | | |
| 1Counterparty | is Barclays Bank PLC. |
INDUSTRY SUMMARY AT SEPTEMBER 30, 2009 (Unaudited)
| | | |
U.S. Treasuries | | 82.9 | % |
Wirelines | | 3.0 | |
Other Investments, less than 2% each | | 10.3 | |
Short-Term Investments | | 3.4 | |
| | | |
Total Investments | | 99.6 | |
Other assets less liabilities (including open Forward Foreign Currency Contracts) | | 0.4 | |
| | | |
Net Assets | | 100.0 | % |
| | | |
See accompanying notes to financial statements.
77
PORTFOLIO OF INVESTMENTS – as of September 30, 2009
Loomis Sayles Institutional High Income Fund
| | | | | | | | |
| | | | | Principal Amount (‡) | | Value (†) |
| | | | | | | | |
| | | |
| BONDS AND NOTES – 87.5% of Net Assets | | | | | | | | |
| | | |
| NON-CONVERTIBLE BONDS – 73.6% | | | | | | | | |
| | | |
| ABS Home Equity – 0.4% | | | | | | | | |
Soundview Home Equity Loan Trust, Series 2006-OPT5, Class 2A3, 0.396%, 7/25/2036(b) | | | | $ | 3,000,000 | | $ | 1,783,298 |
| | | | | | | | |
| Aerospace & Defense – 0.5% | | | | | | | | |
Bombardier, Inc., 7.350%, 12/22/2026 | | CAD | | | 600,000 | | | 503,644 |
Bombardier, Inc., 7.450%, 5/01/2034, 144A | | | | | 2,075,000 | | | 1,810,437 |
| | | | | | | | |
| | | | | | | | 2,314,081 |
| | | | | | | | |
| Airlines – 0.6% | | | | | | | | |
American Airlines, Inc., Pass Through Trust, Series 93A6, 8.040%, 9/16/2011 | | | | | 15,049 | | | 9,876 |
Continental Airlines, Inc., Series 2000-2, Class A-1, 7.707%, 10/02/2022 | | | | | 359,719 | | | 334,539 |
Continental Airlines, Inc., Series 2000-2, Class B, 8.307%, 10/02/2019 | | | | | 318,569 | | | 280,341 |
Continental Airlines, Inc., Series 2001-1, Class B, 7.373%, 6/15/2017 | | | | | 165,782 | | | 137,599 |
Delta Air Lines, Inc., 9.500%, 9/15/2014, 144A | | | | | 1,435,000 | | | 1,435,000 |
Delta Air Lines, Inc., Series 2007-1, Class B, 8.021%, 2/10/2024 | | | | | 439,294 | | | 347,042 |
Delta Air Lines, Inc., Series 2007-1, Class C, 8.954%, 8/10/2014 | | | | | 519,627 | | | 423,236 |
| | | | | | | | |
| | | | | | | | 2,967,633 |
| | | | | | | | |
| Automotive – 4.4% | | | | | | | | |
Cummins, Inc., 7.125%, 3/01/2028 | | | | | 350,000 | | | 331,625 |
FCE Bank PLC, EMTN, 4.625%, 10/25/2010 | | NOK | | | 150,000 | | | 23,891 |
FCE Bank PLC, EMTN, 7.125%, 1/16/2012 | | EUR | | | 150,000 | | | 208,527 |
FCE Bank PLC, EMTN, 7.875%, 2/15/2011 | | GBP | | | 2,200,000 | | | 3,445,614 |
Ford Motor Co., 6.500%, 8/01/2018 | | | | | 20,000 | | | 15,925 |
Ford Motor Co., 6.625%, 2/15/2028 | | | | | 30,000 | | | 21,600 |
Ford Motor Co., 6.625%, 10/01/2028 | | | | | 1,510,000 | | | 1,087,200 |
Ford Motor Co., 7.125%, 11/15/2025 | | | | | 190,000 | | | 142,500 |
Ford Motor Co., 7.450%, 7/16/2031 | | | | | 1,685,000 | | | 1,364,850 |
Ford Motor Co., 7.500%, 8/01/2026 | | | | | 30,000 | | | 21,900 |
Ford Motor Credit Co. LLC, 7.250%, 10/25/2011 | | | | | 560,000 | | | 543,877 |
Ford Motor Credit Co. LLC, 7.500%, 8/01/2012 | | | | | 555,000 | | | 532,893 |
Ford Motor Credit Co. LLC, 8.000%, 6/01/2014 | | | | | 4,445,000 | | | 4,271,632 |
Ford Motor Credit Co. LLC, 8.000%, 12/15/2016 | | | | | 940,000 | | | 872,100 |
Ford Motor Credit Co. LLC, 8.625%, 11/01/2010 | | | | | 70,000 | | | 70,811 |
Ford Motor Credit Co. LLC, 8.700%, 10/01/2014 | | | | | 1,250,000 | | | 1,224,439 |
Ford Motor Credit Co. LLC, 9.750%, 9/15/2010 | | | | | 155,000 | | | 158,393 |
Ford Motor Credit Co. LLC, EMTN, 4.875%, 1/15/2010 | | EUR | | | 130,000 | | | 188,809 |
Goodyear Tire & Rubber Co. (The), 7.000%, 3/15/2028 | | | | | 2,090,000 | | | 1,818,300 |
Goodyear Tire & Rubber Co. (The), 7.857%, 8/15/2011 | | | | | 135,000 | | | 137,700 |
Goodyear Tire & Rubber Co. (The), 9.000%, 7/01/2015 | | | | | 633,000 | | | 656,737 |
Goodyear Tire & Rubber Co. (The), 10.500%, 5/15/2016 | | | | | 2,690,000 | | | 2,918,650 |
| | | | | | | | |
| | | | | | | | 20,057,973 |
| | | | | | | | |
See accompanying notes to financial statements.
78
PORTFOLIO OF INVESTMENTS – as of September 30, 2009
Loomis Sayles Institutional High Income Fund – continued
| | | | | | | |
| | | | | Principal Amount (‡) | | Value (†) |
| | | | | | | |
| | | |
| BONDS AND NOTES – continued | | | | | | | |
| | | |
| Banking – 4.7% | | | | | | | |
Barclays Financial LLC, 4.160%, 2/22/2010, 144A | | THB | | 50,000,000 | | $ | 1,518,258 |
Barclays Financial LLC, EMTN, 4.100%, 3/22/2010, 144A | | THB | | 11,000,000 | | | 334,708 |
Bear Stearns Cos., Inc. (The), 4.650%, 7/02/2018 | | | | 20,000 | | | 19,085 |
Bear Stearns Cos., Inc. (The), 6.400%, 10/02/2017 | | | | 5,000 | | | 5,439 |
BNP Paribas SA, EMTN, Zero Coupon, 6/13/2011, 144A | | IDR | | 10,477,600,000 | | | 914,310 |
Citigroup, Inc., 5.000%, 9/15/2014 | | | | 7,630,000 | | | 7,260,594 |
Citigroup, Inc., 5.875%, 2/22/2033 | | | | 3,883,000 | | | 3,218,343 |
Citigroup, Inc., 6.000%, 10/31/2033 | | | | 575,000 | | | 481,176 |
JPMorgan Chase & Co., EMTN, Zero Coupon, 3/28/2011 | | IDR | | 18,504,768,000 | | | 1,662,461 |
JPMorgan Chase & Co., Zero Coupon, 3/28/2011, 144A | | IDR | | 5,376,000,000 | | | 482,978 |
JPMorgan Chase & Co., Zero Coupon, 5/17/2010, 144A | | BRL | | 2,200,000 | | | 1,169,542 |
JPMorgan Chase London, EMTN, Zero Coupon, 10/21/2010, 144A | | IDR | | 9,533,078,500 | | | 906,259 |
Merrill Lynch & Co., Inc., 6.110%, 1/29/2037 | | | | 400,000 | | | 380,463 |
Merrill Lynch & Co., Inc., 7.750%, 5/14/2038 | | | | 2,800,000 | | | 3,155,373 |
Merrill Lynch & Co., Inc., Series C, MTN, 6.050%, 6/01/2034 | | | | 300,000 | | | 280,125 |
| | | | | | | |
| | | | | | | 21,789,114 |
| | | | | | | |
| Building Materials – 2.0% | | | | | | | |
Masco Corp., 4.800%, 6/15/2015 | | | | 555,000 | | | 509,312 |
Masco Corp., 5.850%, 3/15/2017 | | | | 440,000 | | | 405,789 |
Masco Corp., 6.125%, 10/03/2016 | | | | 750,000 | | | 710,917 |
Masco Corp., 6.500%, 8/15/2032 | | | | 670,000 | | | 542,108 |
Owens Corning, Inc., 7.000%, 12/01/2036 | | | | 1,225,000 | | | 1,003,745 |
Owens Corning, Inc., 9.000%, 6/15/2019 | | | | 2,760,000 | | | 2,964,265 |
USG Corp., 6.300%, 11/15/2016 | | | | 2,795,000 | | | 2,375,750 |
USG Corp., 9.500%, 1/15/2018 | | | | 475,000 | | | 458,375 |
| | | | | | | |
| | | | | | | 8,970,261 |
| | | | | | | |
| Chemicals – 1.8% | | | | | | | |
Borden, Inc., 7.875%, 2/15/2023 | | | | 1,824,000 | | | 1,021,440 |
Borden, Inc., 9.200%, 3/15/2021 | | | | 2,641,000 | | | 1,637,420 |
Hercules, Inc., 6.500%, 6/30/2029 | | | | 2,558,000 | | | 1,422,888 |
Hexion US Finance Corp./Hexion Nova Scotia Finance ULC, 9.750%, 11/15/2014 | | | | 2,500,000 | | | 2,150,000 |
Mosaic Global Holdings, Inc., 7.300%, 1/15/2028 | | | | 1,405,000 | | | 1,405,195 |
Mosaic Global Holdings, Inc., 7.375%, 8/01/2018 | | | | 400,000 | | | 431,266 |
| | | | | | | |
| | | | | | | 8,068,209 |
| | | | | | | |
| Commercial Mortgage-Backed Securities – 0.2% | | | | | |
Credit Suisse Mortgage Capital Certificates, Series 2007-C5, Class A4, 5.695%, 9/15/2040 | | | | 555,000 | | | 437,398 |
JPMorgan Chase Commercial Mortgage Securities Corp., Series 2007-LD11, Class A4, 5.818%, 6/15/2049(b) | | | | 415,000 | | | 362,739 |
JPMorgan Chase Commercial Mortgage Securities Corp., Series 2007-LDPX, Class A3, 5.420%, 1/15/2049 | | | | 205,000 | | | 172,804 |
| | | | | | | |
| | | | | | | 972,941 |
| | | | | | | |
See accompanying notes to financial statements.
79
| | | | | | | | |
| | | | | Principal Amount (‡) | | Value (†) |
| | | | | | | | |
| | | |
| BONDS AND NOTES – continued | | | | | | | | |
| | | |
| Construction Machinery – 1.6% | | | | | | | | |
Case New Holland, Inc., 7.750%, 9/01/2013, 144A | | | | $ | 2,500,000 | | $ | 2,487,500 |
RSC Equipment Rental, Inc., 9.500%, 12/01/2014 | | | | | 295,000 | | | 284,675 |
Terex Corp., 8.000%, 11/15/2017 | | | | | 585,000 | | | 536,738 |
United Rentals North America, Inc., 7.000%, 2/15/2014 | | | | | 3,285,000 | | | 2,857,950 |
United Rentals North America, Inc., 7.750%, 11/15/2013 | | | | | 295,000 | | | 265,500 |
United Rentals North America, Inc., 10.875%, 6/15/2016, 144A | | | | | 965,000 | | | 1,032,550 |
| | | | | | | | |
| | | | | | | | 7,464,913 |
| | | | | | | | |
| Consumer Products – 0.2% | | | | | | | | |
Acco Brands Corp., 7.625%, 8/15/2015 | | | | | 650,000 | | | 539,500 |
Acco Brands Corp., 10.625%, 3/15/2015, 144A | | | | | 425,000 | | | 444,125 |
| | | | | | | | |
| | | | | | | | 983,625 |
| | | | | | | | |
| Diversified Manufacturing – 0.6% | | | | | | | | |
Textron, Inc., 5.600%, 12/01/2017 | | | | | 3,215,000 | | | 2,993,634 |
| | | | | | | | |
| Electric – 2.9% | | | | | | | | |
AES Corp. (The), 7.750%, 3/01/2014 | | | | | 1,185,000 | | | 1,193,887 |
AES Corp. (The), 7.750%, 10/15/2015 | | | | | 645,000 | | | 648,225 |
AES Ironwood LLC, 8.857%, 11/30/2025 | | | | | 332,830 | | | 305,371 |
Dynegy Holdings, Inc., 7.125%, 5/15/2018 | | | | | 100,000 | | | 77,000 |
Dynegy Holdings, Inc., 7.625%, 10/15/2026 | | | | | 490,000 | | | 335,650 |
Dynegy Holdings, Inc., 7.750%, 6/01/2019 | | | | | 1,250,000 | | | 1,065,625 |
Dynegy Holdings, Inc., 8.375%, 5/01/2016 | | | | | 250,000 | | | 233,750 |
Midwest Generation LLC, Series B, 8.560%, 1/02/2016 | | | | | 379,834 | | | 385,532 |
NGC Corp. Capital Trust I, Series B, 8.316%, 6/01/2027 | | | | | 1,685,000 | | | 758,250 |
NiSource Finance Corp., 5.250%, 9/15/2017 | | | | | 894,000 | | | 840,035 |
NRG Energy, Inc., 7.375%, 2/01/2016 | | | | | 575,000 | | | 556,313 |
NRG Energy, Inc., 8.500%, 6/15/2019 | | | | | 180,000 | | | 180,225 |
Quezon Power Philippines Co., 8.860%, 6/15/2017 | | | | | 781,875 | | | 731,053 |
RRI Energy, Inc., 7.875%, 6/15/2017 | | | | | 1,025,000 | | | 1,000,656 |
Salton Sea Funding Corp., Series F, 7.475%, 11/30/2018 | | | | | 824,620 | | | 893,822 |
Texas Competitive Electric Holdings Co. LLC, Series A, 10.250%, 11/01/2015 | | | | | 2,090,000 | | | 1,504,800 |
TXU Corp., Series P, 5.550%, 11/15/2014 | | | | | 920,000 | | | 627,851 |
TXU Corp., Series Q, 6.500%, 11/15/2024 | | | | | 1,515,000 | | | 700,718 |
TXU Corp., Series R, 6.550%, 11/15/2034 | | | | | 420,000 | | | 188,921 |
White Pine Hydro Portfolio LLC, 7.260%, 7/20/2015(c) | | | | | 1,000,000 | | | 880,733 |
| | | | | | | | |
| | | | | | | | 13,108,417 |
| | | | | | | | |
| Food & Beverage – 0.5% | | | | | | | | |
ARAMARK Corp., 5.000%, 6/01/2012 | | | | | 475,000 | | | 448,875 |
Chiquita Brands International, Inc., 7.500%, 11/01/2014 | | | | | 940,000 | | | 935,300 |
Sara Lee Corp., 6.125%, 11/01/2032 | | | | | 690,000 | | | 702,396 |
Smithfield Foods, Inc., 7.750%, 7/01/2017 | | | | | 255,000 | | | 209,737 |
| | | | | | | | |
| | | | | | | | 2,296,308 |
| | | | | | | | |
| Government Owned – No Guarantee – 0.0% | | | | | | | | |
DP World Ltd., 6.850%, 7/02/2037, 144A | | | | | 200,000 | | | 175,898 |
| | | | | | | | |
See accompanying notes to financial statements.
80
PORTFOLIO OF INVESTMENTS – as of September 30, 2009
Loomis Sayles Institutional High Income Fund – continued
| | | | | | | | |
| | | | | Principal Amount (‡) | | Value (†) |
| | | | | | | | |
| | | |
| BONDS AND NOTES – continued | | | | | | | | |
| | | |
| Healthcare – 4.1% | | | | | | | | |
HCA, Inc., 5.750%, 3/15/2014 | | | | $ | 410,000 | | $ | 361,825 |
HCA, Inc., 6.250%, 2/15/2013 | | | | | 30,000 | | | 28,650 |
HCA, Inc., 6.300%, 10/01/2012 | | | | | 625,000 | | | 600,000 |
HCA, Inc., 6.375%, 1/15/2015 | | | | | 560,000 | | | 498,400 |
HCA, Inc., 6.500%, 2/15/2016 | | | | | 550,000 | | | 488,125 |
HCA, Inc., 6.750%, 7/15/2013 | | | | | 20,000 | | | 19,150 |
HCA, Inc., 7.050%, 12/01/2027 | | | | | 1,000,000 | | | 758,421 |
HCA, Inc., 7.190%, 11/15/2015 | | | | | 965,000 | | | 893,825 |
HCA, Inc., 7.500%, 12/15/2023 | | | | | 865,000 | | | 698,287 |
HCA, Inc., 7.500%, 11/06/2033 | | | | | 4,200,000 | | | 3,249,863 |
HCA, Inc., 7.690%, 6/15/2025 | | | | | 1,370,000 | | | 1,112,515 |
HCA, Inc., 8.360%, 4/15/2024 | | | | | 375,000 | | | 305,152 |
HCA, Inc., 9.125%, 11/15/2014 | | | | | 3,000,000 | | | 3,097,500 |
HCA, Inc., MTN, 7.580%, 9/15/2025 | | | | | 560,000 | | | 453,063 |
HCA, Inc., MTN, 7.750%, 7/15/2036 | | | | | 1,520,000 | | | 1,191,368 |
Tenet Healthcare Corp., 6.875%, 11/15/2031 | | | | | 5,839,000 | | | 4,554,420 |
Tenet Healthcare Corp., 9.250%, 2/01/2015 | | | | | 300,000 | | | 313,125 |
| | | | | | | | |
| | | | | | | | 18,623,689 |
| | | | | | | | |
| Home Construction – 1.2% | | | | | | | | |
K. Hovnanian Enterprises, Inc., 6.250%, 1/15/2015 | | | | | 185,000 | | | 140,600 |
K. Hovnanian Enterprises, Inc., 6.250%, 1/15/2016 | | | | | 1,068,000 | | | 801,000 |
K. Hovnanian Enterprises, Inc., 6.375%, 12/15/2014 | | | | | 425,000 | | | 323,000 |
K. Hovnanian Enterprises, Inc., 6.500%, 1/15/2014 | | | | | 272,000 | | | 212,160 |
K. Hovnanian Enterprises, Inc., 7.500%, 5/15/2016 | | | | | 755,000 | | | 573,800 |
K. Hovnanian Enterprises, Inc., 7.750%, 5/15/2013 | | | | | 10,000 | | | 7,700 |
KB Home, 7.250%, 6/15/2018 | | | | | 1,260,000 | | | 1,228,500 |
Lennar Corp., Series B, 5.500%, 9/01/2014 | | | | | 95,000 | | | 88,825 |
Lennar Corp., Series B, 5.600%, 5/31/2015 | | | | | 2,000,000 | | | 1,845,000 |
Pulte Homes, Inc., 6.000%, 2/15/2035 | | | | | 400,000 | | | 302,000 |
| | | | | | | | |
| | | | | | | | 5,522,585 |
| | | | | | | | |
| Independent Energy – 1.4% | | | | | | | | |
Chesapeake Energy Corp., 6.250%, 1/15/2017 | | EUR | | | 250,000 | | | 336,570 |
Chesapeake Energy Corp., 6.500%, 8/15/2017 | | | | | 1,110,000 | | | 1,018,425 |
Chesapeake Energy Corp., 6.875%, 11/15/2020 | | | | | 1,415,000 | | | 1,259,350 |
Connacher Oil and Gas Ltd., 10.250%, 12/15/2015, 144A | | | | | 704,000 | | | 573,760 |
Hilcorp Energy I LP, 7.750%, 11/01/2015, 144A | | | | | 985,000 | | | 930,825 |
Pioneer Natural Resources Co., 5.875%, 7/15/2016 | | | | | 335,000 | | | 309,635 |
Pioneer Natural Resources Co., 6.875%, 5/01/2018 | | | | | 910,000 | | | 868,425 |
Pioneer Natural Resources Co., 7.200%, 1/15/2028 | | | | | 920,000 | | | 798,488 |
Swift Energy Co., 7.125%, 6/01/2017 | | | | | 415,000 | | | 361,050 |
| | | | | | | | |
| | | | | | | | 6,456,528 |
| | | | | | | | |
| Industrial Other – 0.1% | | | | | | | | |
Great Lakes Dredge & Dock Corp., 7.750%, 12/15/2013 | | | | | 300,000 | | | 294,375 |
| | | | | | | | |
| Life Insurance – 0.5% | | | | | | | | |
MetLife, Inc., 10.750%, 8/01/2069 | | | | | 1,810,000 | | | 2,181,050 |
| | | | | | | | |
See accompanying notes to financial statements.
81
| | | | | | | |
| | | | | Principal Amount (‡) | | Value (†) |
| | | | | | | |
| | | |
| BONDS AND NOTES – continued | | | | | | | |
| | | |
| Local Authorities – 2.6% | | | | | | | |
Province of Ontario, Canada, 4.200%, 3/08/2018 | | CAD | | 12,200,000 | | $ | 11,832,285 |
| | | | | | | |
| Lodging – 0.3% | | | | | | | |
Felcor Lodging LP, 9.000%, 6/01/2011 | | | | 715,000 | | | 717,681 |
Starwood Hotels & Resorts Worldwide, Inc., 7.875%, 5/01/2012 | | | | 500,000 | | | 518,750 |
| | | | | | | |
| | | | | | | 1,236,431 |
| | | | | | | |
| Media Cable – 0.1% | | | | | | | |
Virgin Media Finance PLC, 9.125%, 8/15/2016 | | | | 685,000 | | | 703,838 |
| | | | | | | |
| Media Non-Cable – 0.0% | | | | | | | |
R.H. Donnelley Corp., Series A-2, 6.875%, 1/15/2013(d) | | | | 510,000 | | | 29,325 |
R.H. Donnelley Corp., Series A-4, 8.875%, 10/15/2017(d) | | | | 1,460,000 | | | 83,950 |
| | | | | | | |
| | | | | | | 113,275 |
| | | | | | | |
| Metals & Mining – 3.5% | | | | | | | |
Alcoa, Inc., 5.720%, 2/23/2019 | | | | 1,700,000 | | | 1,538,956 |
Algoma Acquisition Corp., 9.875%, 6/15/2015, 144A | | | | 1,245,000 | | | 1,045,800 |
ArcelorMittal, 9.850%, 6/01/2019 | | | | 575,000 | | | 680,112 |
ArcelorMittal USA Partnership, 9.750%, 4/01/2014 | | | | 255,000 | | | 267,113 |
Ryerson, Inc., 12.000%, 11/01/2015 | | | | 775,000 | | | 736,250 |
Steel Dynamics, Inc., 6.750%, 4/01/2015 | | | | 750,000 | | | 718,125 |
Steel Dynamics, Inc., 7.375%, 11/01/2012 | | | | 295,000 | | | 297,950 |
Teck Resources Ltd., 10.250%, 5/15/2016 | | | | 1,195,000 | | | 1,350,350 |
Teck Resources Ltd., 10.750%, 5/15/2019 | | | | 1,145,000 | | | 1,331,062 |
United States Steel Corp., 6.050%, 6/01/2017 | | | | 4,740,000 | | | 4,427,122 |
United States Steel Corp., 6.650%, 6/01/2037 | | | | 2,020,000 | | | 1,647,589 |
United States Steel Corp., 7.000%, 2/01/2018 | | | | 2,035,000 | | | 1,954,357 |
| | | | | | | |
| | | | | | | 15,994,786 |
| | | | | | | |
| Non-Captive Consumer – 1.3% | | | | | | | |
American General Finance Corp., MTN, 5.750%, 9/15/2016 | | | | 700,000 | | | 485,959 |
SLM Corp., Series A, MTN, 5.000%, 4/15/2015 | | | | 750,000 | | | 558,835 |
SLM Corp., Series A, MTN, 5.000%, 6/15/2018 | | | | 115,000 | | | 72,119 |
SLM Corp., Series A, MTN, 6.500%, 6/15/2010(c)(e) | | NZD | | 4,720,000 | | | 3,195,119 |
SLM Corp., Series A, MTN, 8.450%, 6/15/2018 | | | | 2,020,000 | | | 1,610,950 |
| | | | | | | |
| | | | | | | 5,922,982 |
| | | | | | | |
| Non-Captive Diversified – 3.3% | | | | | | | |
CIT Group, Inc., 4.750%, 12/15/2010 | | | | 205,000 | | | 141,618 |
CIT Group, Inc., 5.400%, 2/13/2012 | | | | 46,000 | | | 30,191 |
CIT Group, Inc., 5.400%, 1/30/2016 | | | | 88,000 | | | 55,476 |
CIT Group, Inc., 5.800%, 10/01/2036 | | | | 200,000 | | | 119,938 |
CIT Group, Inc., 5.850%, 9/15/2016 | | | | 16,000 | | | 10,084 |
CIT Group, Inc., EMTN, 3.800%, 11/14/2012 | | EUR | | 300,000 | | | 274,378 |
CIT Group, Inc., EMTN, 4.650%, 9/19/2016 | | EUR | | 1,050,000 | | | 883,497 |
CIT Group, Inc., EMTN, 5.000%, 5/13/2014 | | EUR | | 200,000 | | | 172,675 |
CIT Group, Inc., EMTN, 5.500%, 12/20/2016 | | GBP | | 300,000 | | | 273,284 |
CIT Group, Inc., GMTN, 4.250%, 2/01/2010 | | | | 130,000 | | | 93,726 |
See accompanying notes to financial statements.
82
PORTFOLIO OF INVESTMENTS – as of September 30, 2009
Loomis Sayles Institutional High Income Fund – continued
| | | | | | | |
| | | | | Principal Amount (‡) | | Value (†) |
| | | | | | | |
| | | |
| BONDS AND NOTES – continued | | | | | | | |
| | | |
| Non-Captive Diversified – continued | | | | | | | |
CIT Group, Inc., GMTN, 4.250%, 9/22/2011 | | EUR | | 1,750,000 | | $ | 1,626,147 |
CIT Group, Inc., GMTN, 5.000%, 2/13/2014 | | | | 64,000 | | | 40,882 |
CIT Group, Inc., GMTN, 5.000%, 2/01/2015 | | | | 130,000 | | | 83,260 |
CIT Group, Inc., MTN, 4.250%, 3/17/2015 | | EUR | | 1,260,000 | | | 1,069,415 |
CIT Group, Inc., MTN, 5.125%, 9/30/2014 | | | | 26,000 | | | 16,656 |
CIT Group, Inc., Series A, GMTN, 6.000%, 4/01/2036 | | | | 22,000 | | | 12,710 |
CIT Group, Inc., Series A, MTN, 5.650%, 2/13/2017 | | | | 141,000 | | | 88,168 |
General Electric Capital Corp., 5.625%, 5/01/2018 | | | | 10,000 | | | 9,952 |
General Electric Capital Corp., MTN, 5.875%, 1/14/2038 | | | | 60,000 | | | 55,025 |
General Electric Capital Corp., Series A, EMTN, 6.750%, 9/26/2016 | | NZD | | 250,000 | | | 173,211 |
General Electric Capital Corp., Series A, MTN, 6.500%, 9/28/2015 | | NZD | | 3,035,000 | | | 2,095,921 |
GMAC, Inc., 5.375%, 6/06/2011, 144A | | | | 442,000 | | | 407,745 |
GMAC, Inc., 6.000%, 4/01/2011, 144A | | | | 201,000 | | | 188,437 |
GMAC, Inc., 6.000%, 12/15/2011, 144A | | | | 937,000 | | | 866,725 |
GMAC, Inc., 6.625%, 12/17/2010, 144A | | | | 23,000 | | | 22,080 |
GMAC, Inc., 6.625%, 5/15/2012, 144A | | | | 47,000 | | | 43,240 |
GMAC, Inc., 6.750%, 12/01/2014, 144A | | | | 149,000 | | | 126,650 |
GMAC, Inc., 6.875%, 9/15/2011, 144A | | | | 53,000 | | | 50,085 |
GMAC, Inc., 6.875%, 8/28/2012, 144A | | | | 94,000 | | | 86,480 |
GMAC, Inc., 7.000%, 2/01/2012, 144A | | | | 110,000 | | | 102,300 |
GMAC, Inc., 7.500%, 12/31/2013, 144A | | | | 314,000 | | | 274,750 |
GMAC, Inc., 8.000%, 12/31/2018, 144A | | | | 585,000 | | | 441,675 |
GMAC, Inc., 8.000%, 11/01/2031, 144A | | | | 208,000 | | | 167,440 |
International Lease Finance Corp., 4.750%, 1/13/2012 | | | | 375,000 | | | 318,058 |
International Lease Finance Corp., 5.000%, 4/15/2010 | | | | 550,000 | | | 534,145 |
International Lease Finance Corp., 5.000%, 9/15/2012 | | | | 455,000 | | | 365,043 |
International Lease Finance Corp., 5.125%, 11/01/2010 | | | | 1,245,000 | | | 1,165,792 |
International Lease Finance Corp., Series Q, MTN, 5.250%, 1/10/2013 | | | | 320,000 | | | 257,909 |
International Lease Finance Corp., Series R, MTN, 5.625%, 9/15/2010 | | | | 250,000 | | | 238,569 |
International Lease Finance Corp., Series R, MTN, 6.625%, 11/15/2013 | | | | 820,000 | | | 650,193 |
iStar Financial, Inc., 5.500%, 6/15/2012 | | | | 65,000 | | | 39,650 |
iStar Financial, Inc., 5.650%, 9/15/2011 | | | | 100,000 | | | 69,000 |
iStar Financial, Inc., 5.875%, 3/15/2016 | | | | 20,000 | | | 11,000 |
iStar Financial, Inc., 6.050%, 4/15/2015 | | | | 20,000 | | | 10,450 |
iStar Financial, Inc., 8.625%, 6/01/2013 | | | | 1,770,000 | | | 1,115,100 |
iStar Financial, Inc., Series B, 5.700%, 3/01/2014 | | | | 70,000 | | | 37,800 |
iStar Financial, Inc., Series B, 5.950%, 10/15/2013 | | | | 565,000 | | | 322,050 |
| | | | | | | |
| | | | | | | 15,238,580 |
| | | | | | | |
| Oil Field Services – 0.2% | | | | | | | |
Complete Production Services, Inc., 8.000%, 12/15/2016 | | | | 560,000 | | | 509,600 |
See accompanying notes to financial statements.
83
| | | | | | | | |
| | | | | Principal Amount (‡) | | Value (†) |
| | | | | | | | |
| | | |
| BONDS AND NOTES – continued | | | | | | | | |
| | | |
| Oil Field Services – continued | | | | | | | | |
North American Energy Partners, Inc., 8.750%, 12/01/2011 | | | | $ | 545,000 | | $ | 534,100 |
| | | | | | | | |
| | | | | | | | 1,043,700 |
| | | | | | | | |
| Packaging – 0.3% | | | | | | | | |
Owens-Illinois, Inc., 7.800%, 5/15/2018 | | | | | 1,555,000 | | | 1,558,888 |
| | | | | | | | |
| Paper – 6.2% | | | | | | | | |
Georgia-Pacific LLC, 7.250%, 6/01/2028 | | | | | 1,240,000 | | | 1,103,600 |
Georgia-Pacific LLC, 7.750%, 11/15/2029 | | | | | 3,620,000 | | | 3,330,400 |
Georgia-Pacific LLC, 8.000%, 1/15/2024 | | | | | 1,270,000 | | | 1,257,300 |
Georgia-Pacific LLC, 8.875%, 5/15/2031 | | | | | 4,890,000 | | | 4,938,900 |
International Paper Co., 7.950%, 6/15/2018 | | | | | 3,645,000 | | | 3,951,027 |
International Paper Co., 8.700%, 6/15/2038 | | | | | 3,759,000 | | | 4,167,047 |
International Paper Co., 9.375%, 5/15/2019 | | | | | 2,490,000 | | | 2,915,531 |
Jefferson Smurfit Corp., 7.500%, 6/01/2013(d) | | | | | 515,000 | | | 365,006 |
Smurfit-Stone Container Enterprises, Inc., 8.000%, 3/15/2017(d) | | | | | 2,800,000 | | | 1,988,000 |
Stone Container Finance, 7.375%, 7/15/2014(d) | | | | | 980,000 | | | 803,600 |
Westvaco Corp., 7.950%, 2/15/2031 | | | | | 650,000 | | | 636,599 |
Westvaco Corp., 8.200%, 1/15/2030 | | | | | 2,380,000 | | | 2,334,459 |
Weyerhaeuser Co., 7.375%, 3/15/2032 | | | | | 845,000 | | | 748,484 |
| | | | | | | | |
| | | | | | | | 28,539,953 |
| | | | | | | | |
| Pharmaceuticals – 2.0% | | | | | | | | |
Elan Financial PLC, 7.750%, 11/15/2011 | | | | | 5,195,000 | | | 5,292,406 |
Elan Financial PLC, 8.875%, 12/01/2013 | | | | | 1,810,000 | | | 1,823,575 |
Valeant Pharmaceuticals International, 8.375%, 6/15/2016, 144A | | | | | 1,890,000 | | | 1,918,350 |
| | | | | | | | |
| | | | | | | | 9,034,331 |
| | | | | | | | |
| Pipelines – 2.5% | | | | | | | | |
El Paso Corp., 6.950%, 6/01/2028 | | | | | 1,430,000 | | | 1,189,554 |
El Paso Corp., 7.420%, 2/15/2037 | | | | | 1,055,000 | | | 906,045 |
El Paso Corp., 12.000%, 12/12/2013 | | | | | 1,000,000 | | | 1,140,000 |
El Paso Corp., GMTN, 7.750%, 1/15/2032 | | | | | 2,210,000 | | | 2,024,798 |
El Paso Corp., GMTN, 7.800%, 8/01/2031 | | | | | 550,000 | | | 504,415 |
El Paso Corp., GMTN, 8.050%, 10/15/2030 | | | | | 1,105,000 | | | 1,021,329 |
Kinder Morgan Finance Co., 5.700%, 1/05/2016 | | | | | 345,000 | | | 328,613 |
Transportadora de Gas del Sur SA, 7.875%, 5/14/2017, 144A | | | | | 250,000 | | | 215,000 |
Williams Cos., Inc. (The), 7.500%, 1/15/2031 | | | | | 3,345,000 | | | 3,416,523 |
Williams Cos., Inc. (The), 7.750%, 6/15/2031 | | | | | 70,000 | | | 73,400 |
Williams Cos., Inc. (The), 8.750%, 3/15/2032 | | | | | 430,000 | | | 493,108 |
| | | | | | | | |
| | | | | | | | 11,312,785 |
| | | | | | | | |
| Property & Casualty Insurance – 0.7% | | | | | | | | |
Marsh & McLennan Cos., Inc., 5.875%, 8/01/2033 | | | | | 3,410,000 | | | 3,133,906 |
MBIA Insurance Corp., (fixed rate to 1/15/2013, variable rate thereafter), 14.000%, 1/15/2033, 144A | | | | | 690,000 | | | 303,600 |
| | | | | | | | |
| | | | | | | | 3,437,506 |
| | | | | | | | |
| Railroads – 0.1% | | | | | | | | |
Missouri Pacific Railroad Co., 5.000%, 1/01/2045(c) | | | | | 314,000 | | | 213,520 |
See accompanying notes to financial statements.
84
PORTFOLIO OF INVESTMENTS – as of September 30, 2009
Loomis Sayles Institutional High Income Fund – continued
| | | | | | | | | |
| | | | | Principal Amount (‡) | | | Value (†) |
| | | | | | | | | |
| | | |
| BONDS AND NOTES – continued | | | | | | | | | |
| | | |
| Railroads – continued | | | | | | | | | |
Missouri Pacific Railroad Co., Series A, 4.750%, 1/01/2020(c) | | | | $ | 30,000 | | | $ | 26,475 |
| | | | | | | | | |
| | | | | | | | | 239,995 |
| | | | | | | | | |
| REITs – 1.4% | | | | | | | | | |
Colonial Realty LP, 6.250%, 6/15/2014 | | | | | 575,000 | | | | 548,645 |
Highwoods Properties, Inc., 5.850%, 3/15/2017 | | | | | 470,000 | | | | 413,945 |
ProLogis, 5.500%, 4/01/2012 | | | | | 1,385,000 | | | | 1,368,514 |
ProLogis, 5.625%, 11/15/2015 | | | | | 100,000 | | | | 90,871 |
ProLogis, 5.625%, 11/15/2016 | | | | | 1,090,000 | | | | 978,022 |
ProLogis, 6.625%, 5/15/2018 | | | | | 1,935,000 | | | | 1,786,764 |
Simon Property Group LP, 5.250%, 12/01/2016 | | | | | 500,000 | | | | 492,850 |
Simon Property Group LP, 5.875%, 3/01/2017 | | | | | 550,000 | | | | 560,894 |
| | | | | | | | | |
| | | | | | | | | 6,240,505 |
| | | | | | | | | |
| Retailers – 3.4% | | | | | | | | | |
Dillard’s, Inc., 6.625%, 1/15/2018 | | | | | 500,000 | | | | 380,000 |
Dillard’s, Inc., 7.000%, 12/01/2028 | | | | | 450,000 | | | | 299,250 |
Dillard’s, Inc., 7.130%, 8/01/2018 | | | | | 750,000 | | | | 583,125 |
Dillard’s, Inc., 7.750%, 7/15/2026 | | | | | 1,500,000 | | | | 1,057,500 |
Foot Locker, Inc., 8.500%, 1/15/2022 | | | | | 1,679,000 | | | | 1,586,655 |
Macy’s Retail Holdings, Inc., 5.900%, 12/01/2016 | | | | | 1,405,000 | | | | 1,287,250 |
Macy’s Retail Holdings, Inc., 6.375%, 3/15/2037 | | | | | 3,653,000 | | | | 2,877,994 |
Macy’s Retail Holdings, Inc., 7.000%, 2/15/2028 | | | | | 295,000 | | | | 232,743 |
Macy’s Retail Holdings, Inc., 8.875%, 7/15/2015 | | | | | 2,365,000 | | | | 2,467,168 |
Toys R Us, Inc., 7.375%, 10/15/2018 | | | | | 5,185,000 | | | | 4,510,950 |
Toys R Us, Inc., 7.875%, 4/15/2013 | | | | | 197,000 | | | | 189,120 |
| | | | | | | | | |
| | | | | | | | | 15,471,755 |
| | | | | | | | | |
| Sovereigns – 2.9% | | | | | | | | | |
Indonesia Government International Bond, 6.625%, 2/17/2037, 144A | | | | | 3,132,000 | | | | 3,085,020 |
Indonesia Government International Bond, 7.750%, 1/17/2038, 144A | | | | | 650,000 | | | | 718,250 |
Indonesia Treasury Bond, Series FR43, 10.250%, 7/15/2022 | | IDR | | | 1,881,000,000 | | | | 191,795 |
Indonesia Treasury Bond, Series FR44, 10.000%, 9/15/2024 | | IDR | | | 24,214,000,000 | | | | 2,375,730 |
Indonesia Treasury Bond, Series ZC3, Zero Coupon, 11/20/2012 | | IDR | | | 4,897,000,000 | | | | 389,890 |
Mexican Fixed Rate Bonds, Series M-10, 7.250%, 12/15/2016 | | MXN | | | 208,681 | (††) | | | 1,504,229 |
Mexican Fixed Rate Bonds, Series M-20, 8.000%, 12/07/2023 | | MXN | | | 95,000 | (††) | | | 690,205 |
Mexican Fixed Rate Bonds, Series MI-10, 9.000%, 12/20/2012 | | MXN | | | 180,000 | (††) | | | 1,421,516 |
Republic of Brazil, 10.250%, 1/10/2028 | | BRL | | | 4,170,000 | | | | 2,259,652 |
Republic of Iceland, Zero Coupon, 11/16/2009 | | ISK | | | 20,000,000 | | | | 127,843 |
Republic of Iceland, 7.000%, 3/17/2010 | | ISK | | | 18,085,000 | | | | 116,596 |
Republic of Iceland, 7.250%, 5/17/2013 | | ISK | | | 49,000,000 | | | | 314,074 |
Republic of Iceland, 8.000%, 7/22/2011 | | ISK | | | 26,100,000 | | | | 170,482 |
United Mexican States, Series A, MTN, 6.050%, 1/11/2040 | | | | | 112,000 | | | | 111,720 |
| | | | | | | | | |
| | | | | | | | | 13,477,002 |
| | | | | | | | | |
See accompanying notes to financial statements.
85
| | | | | | | | |
| | | | | Principal Amount (‡) | | Value (†) |
| | | | | | | | |
| | | |
| BONDS AND NOTES – continued | | | | | | | | |
| | | |
| Supermarkets – 0.8% | | | | | | | | |
American Stores Co., 8.000%, 6/01/2026 | | | | $ | 110,000 | | $ | 99,000 |
American Stores Co., Series B, MTN, 7.100%, 3/20/2028 | | | | | 1,865,000 | | | 1,473,350 |
New Albertson’s, Inc., 7.450%, 8/01/2029 | | | | | 1,525,000 | | | 1,311,500 |
New Albertson’s, Inc., 8.000%, 5/01/2031 | | | | | 480,000 | | | 430,800 |
New Albertson’s, Inc., 8.700%, 5/01/2030 | | | | | 180,000 | | | 163,800 |
New Albertson’s, Inc., Series C, MTN, 6.625%, 6/01/2028 | | | | | 240,000 | | | 185,400 |
| | | | | | | | |
| | | | | | | | 3,663,850 |
| | | | | | | | |
| Supranational – 0.2% | | | | | | | | |
European Investment Bank, EMTN, Zero Coupon, 4/24/2013, 144A | | IDR | | | 1,639,380,000 | | | 120,736 |
Inter-American Development Bank, EMTN, Zero Coupon, 5/20/2013 | | IDR | | | 8,600,000,000 | | | 613,256 |
International Bank for Reconstruction & Development, 9.500%, 5/27/2010 | | ISK | | | 42,500,000 | | | 277,122 |
| | | | | | | | |
| | | | | | | | 1,011,114 |
| | | | | | | | |
| Technology – 4.6% | | | | | | | | |
Affiliated Computer Services, Inc., 5.200%, 6/01/2015 | | | | | 496,000 | | | 487,320 |
Agilent Technologies, Inc., 6.500%, 11/01/2017 | | | | | 1,560,000 | | | 1,623,398 |
Alcatel-Lucent USA, Inc., 6.450%, 3/15/2029 | | | | | 6,580,000 | | | 5,009,025 |
Alcatel-Lucent USA, Inc., 6.500%, 1/15/2028 | | | | | 3,055,000 | | | 2,325,619 |
Amkor Technology, Inc., 7.750%, 5/15/2013 | | | | | 2,685,000 | | | 2,685,000 |
Amkor Technology, Inc., 9.250%, 6/01/2016 | | | | | 480,000 | | | 494,400 |
Corning, Inc., 6.850%, 3/01/2029 | | | | | 801,000 | | | 817,373 |
Eastman Kodak Co., 7.250%, 11/15/2013 | | | | | 765,000 | | | 627,300 |
Freescale Semiconductor, Inc., 10.125%, 12/15/2016 | | | | | 210,000 | | | 139,650 |
Motorola, Inc., 5.220%, 10/01/2097 | | | | | 80,000 | | | 43,926 |
Motorola, Inc., 6.500%, 9/01/2025 | | | | | 190,000 | | | 160,566 |
Motorola, Inc., 6.500%, 11/15/2028 | | | | | 700,000 | | | 577,368 |
Motorola, Inc., 6.625%, 11/15/2037 | | | | | 70,000 | | | 58,625 |
Nortel Networks Capital Corp., 7.875%, 6/15/2026(d) | | | | | 2,275,000 | | | 1,274,000 |
Nortel Networks Ltd., 6.875%, 9/01/2023(d) | | | | | 1,000,000 | | | 280,000 |
Seagate Technology International, 10.000%, 5/01/2014, 144A | | | | | 4,030,000 | | | 4,402,775 |
| | | | | | | | |
| | | | | | | | 21,006,345 |
| | | | | | | | |
| Textile – 0.1% | | | | | | | | |
Jones Apparel Group, Inc., 6.125%, 11/15/2034 | | | | | 890,000 | | | 658,600 |
| | | | | | | | |
| Transportation Services – 1.2% | | | | | | | | |
APL Ltd., 8.000%, 1/15/2024(c) | | | | | 2,685,000 | | | 2,194,987 |
Atlas Air, Inc., Series 1999-1B, 7.630%, 7/02/2016 | | | | | 357,692 | | | 268,269 |
Atlas Air, Inc., Series 1999-1C, 8.770%, 7/02/2012(f) | | | | | 399,542 | | | 279,679 |
Atlas Air, Inc., Series 2000-1, Class C, 9.702%, 7/02/2011(f) | | | | | 40,344 | | | 28,241 |
Atlas Air, Inc., Series B, 7.680%, 1/02/2014 | | | | | 2,013,527 | | | 1,711,498 |
Atlas Air, Inc., Series C, 8.010%, 1/02/2010(f) | | | | | 289,324 | | | 202,527 |
See accompanying notes to financial statements.
86
PORTFOLIO OF INVESTMENTS – as of September 30, 2009
Loomis Sayles Institutional High Income Fund – continued
| | | | | | | | |
| | | | | Principal Amount (‡) | | Value (†) |
| | | | | | | | |
| | | |
| BONDS AND NOTES – continued | | | | | | | | |
| | | |
| Textile – continued | | | | | | | | |
Erac USA Finance Co., 5.600%, 5/01/2015, 144A | | | | $ | 700,000 | | $ | 686,389 |
| | | | | | | | |
| | | | | | | | 5,371,590 |
| | | | | | | | |
| Treasuries – 1.8% | | | | | | | | |
Canadian Government, 2.000%, 9/01/2012 | | CAD | | | 8,615,000 | | | 8,068,320 |
| | | | | | | | |
| Wireless – 1.8% | | | | | | | | |
Nextel Communications, Inc., Series D, 7.375%, 8/01/2015 | | | | | 1,995,000 | | | 1,790,512 |
Nextel Communications, Inc., Series E, 6.875%, 10/31/2013 | | | | | 765,000 | | | 709,538 |
Nextel Communications, Inc., Series F, 5.950%, 3/15/2014 | | | | | 805,000 | | | 712,425 |
Sprint Capital Corp., 6.875%, 11/15/2028 | | | | | 1,525,000 | | | 1,273,375 |
Sprint Capital Corp., 6.900%, 5/01/2019 | | | | | 615,000 | | | 550,425 |
Sprint Capital Corp., 8.750%, 3/15/2032 | | | | | 215,000 | | | 203,175 |
True Move Co. Ltd., 10.375%, 8/01/2014, 144A | | | | | 400,000 | | | 374,000 |
True Move Co. Ltd., 10.750%, 12/16/2013, 144A | | | | | 2,765,000 | | | 2,654,400 |
| | | | | | | | |
| | | | | | | | 8,267,850 |
| | | | | | | | |
| Wirelines – 4.6% | | | | | | | | |
Axtel SAB de CV, 9.000%, 9/22/2019, 144A | | | | | 410,000 | | | 416,150 |
FairPoint Communications, Inc.,
13.125%, 4/02/2018(f) | | | | | 5,334,157 | | | 653,434 |
Frontier Communications Corp., 7.875%, 1/15/2027 | | | | | 3,180,000 | | | 2,901,750 |
Frontier Communications Corp., 9.000%, 8/15/2031 | | | | | 2,330,000 | | | 2,283,400 |
Hawaiian Telcom Communications, Inc., Series B, 12.500%, 5/01/2015(d) | | | | | 50,000 | | | 63 |
Level 3 Financing, Inc., 8.750%, 2/15/2017 | | | | | 590,000 | | | 489,700 |
Level 3 Financing, Inc., 9.250%, 11/01/2014 | | | | | 1,675,000 | | | 1,476,094 |
Qwest Capital Funding, Inc., 6.500%, 11/15/2018 | | | | | 1,439,000 | | | 1,183,577 |
Qwest Capital Funding, Inc., 6.875%, 7/15/2028 | | | | | 800,000 | | | 604,000 |
Qwest Capital Funding, Inc., 7.625%, 8/03/2021 | | | | | 1,385,000 | | | 1,170,325 |
Qwest Capital Funding, Inc., 7.750%, 2/15/2031 | | | | | 5,332,000 | | | 4,252,270 |
Qwest Corp., 6.500%, 6/01/2017 | | | | | 210,000 | | | 197,400 |
Qwest Corp., 6.875%, 9/15/2033 | | | | | 1,936,000 | | | 1,568,160 |
Qwest Corp., 7.200%, 11/10/2026 | | | | | 1,500,000 | | | 1,252,500 |
Qwest Corp., 7.250%, 9/15/2025 | | | | | 645,000 | | | 556,312 |
Qwest Corp., 7.250%, 10/15/2035 | | | | | 1,407,000 | | | 1,132,635 |
Qwest Corp., 7.500%, 6/15/2023 | | | | | 985,000 | | | 896,350 |
| | | | | | | | |
| | | | | | | | 21,034,120 |
| | | | | | | | |
| | | |
| TOTAL NON-CONVERTIBLE BONDS | | | | | | | | |
(Identified Cost $310,749,295) | | | | | | | | 337,504,918 |
| | | | | | | | |
| | | |
| CONVERTIBLE BONDS – 13.9% | | | | | | | | |
| | | |
| Airlines – 0.1% | | | | | | | | |
AMR Corp., 6.250%, 10/15/2014 | | | | | 510,000 | | | 538,688 |
| | | | | | | | |
| Construction Machinery – 0.0% | | | | | | | | |
United Rentals North America, Inc., 1.875%, 10/15/2023 | | | | | 40,000 | | | 37,800 |
| | | | | | | | |
See accompanying notes to financial statements.
87
| | | | | | | | |
| | | | | Principal Amount (‡) | | Value (†) |
| | | | | | | | |
| | | |
| BONDS AND NOTES – continued | | | | | | | | |
| | | |
| Diversified Manufacturing – 0.0% | | | | | | | | |
Trinity Industries, Inc., 3.875%, 6/01/2036 | | | | $ | 255,000 | | $ | 188,063 |
| | | | | | | | |
| Electric – 0.1% | | | | | | | | |
CMS Energy Corp., 5.500%, 6/15/2029 | | | | | 250,000 | | | 285,938 |
| | | | | | | | |
| Healthcare – 2.1% | | | | | | | | |
Affymetrix, Inc., 3.500%, 1/15/2038 | | | | | 1,216,000 | | | 978,880 |
Health Management Associates, Inc., 3.750%, 5/01/2028, 144A | | | | | 3,325,000 | | | 3,329,156 |
Hologic, Inc., (Step to Zero Coupon on 12/15/2013), 2.000%, 12/15/2037(g) | | | | | 2,000,000 | | | 1,635,000 |
LifePoint Hospitals, Inc., 3.250%, 8/15/2025 | | | | | 345,000 | | | 301,875 |
LifePoint Hospitals, Inc., 3.500%, 5/15/2014 | | | | | 455,000 | | | 386,181 |
Omnicare, Inc., 3.250%, 12/15/2035 | | | | | 3,658,000 | | | 2,807,515 |
| | | | | | | | |
| | | | | | | | 9,438,607 |
| | | | | | | | |
| Independent Energy – 0.7% | | | | | | | | |
Chesapeake Energy Corp., 2.250%, 12/15/2038 | | | | | 3,885,000 | | | 2,904,037 |
Penn Virginia Corp., 4.500%, 11/15/2012 | | | | | 120,000 | | | 108,000 |
| | | | | | | | |
| | | | | | | | 3,012,037 |
| | | | | | | | |
| Industrial Other – 0.2% | | | | | | | | |
Incyte Corp., 3.500%, 2/15/2011 | | | | | 1,100,000 | | | 1,072,500 |
| | | | | | | | |
| Lodging – 0.5% | | | | | | | | |
Host Hotels & Resorts, Inc., 2.625%, 4/15/2027, 144A | | | | | 2,514,000 | | | 2,309,737 |
| | | | | | | | |
| Media Non-Cable – 0.0% | | | | | | | | |
Liberty Media LLC, 3.500%, 1/15/2031 | | | | | 61,699 | | | 37,868 |
| | | | | | | | |
| Metals & Mining – 1.4% | | | | | | | | |
ArcelorMittal, 5.000%, 5/15/2014 | | | | | 1,000,000 | | | 1,443,750 |
Steel Dynamics, Inc., 5.125%, 6/15/2014 | | | | | 1,250,000 | | | 1,475,000 |
United States Steel Corp., 4.000%, 5/15/2014 | | | | | 2,280,000 | | | 3,625,200 |
| | | | | | | | |
| | | | | | | | 6,543,950 |
| | | | | | | | |
| Oil Field Services – 0.2% | | | | | | | | |
Transocean, Inc., Series B, 1.500%, 12/15/2037 | | | | | 1,120,000 | | | 1,080,800 |
| | | | | | | | |
| Pharmaceuticals – 2.8% | | | | | | | | |
Human Genome Sciences, Inc., 2.250%, 10/15/2011 | | | | | 2,215,000 | | | 3,065,006 |
Human Genome Sciences, Inc., 2.250%, 8/15/2012 | | | | | 3,325,000 | | | 4,143,781 |
Kendle International, Inc., 3.375%, 7/15/2012 | | | | | 2,715,000 | | | 2,395,988 |
Nektar Therapeutics, 3.250%, 9/28/2012 | | | | | 1,995,000 | | | 1,810,463 |
Valeant Pharmaceuticals International, 4.000%, 11/15/2013 | | | | | 1,165,000 | | | 1,253,831 |
| | | | | | | | |
| | | | | | | | 12,669,069 |
| | | | | | | | |
| Technology – 4.4% | | | | | | | | |
Advanced Micro Devices, Inc., 5.750%, 8/15/2012 | | | | | 2,635,000 | | | 2,210,106 |
Advanced Micro Devices, Inc., 6.000%, 5/01/2015 | | | | | 1,960,000 | | | 1,467,550 |
Alcatel-Lucent USA, Inc., Series B, 2.875%, 6/15/2025 | | | | | 1,835,000 | | | 1,532,225 |
Ciena Corp., 0.250%, 5/01/2013 | | | | | 540,000 | | | 431,325 |
Ciena Corp., 0.875%, 6/15/2017 | | | | | 2,355,000 | | | 1,622,006 |
Intel Corp., 3.250%, 8/01/2039, 144A | | | | | 5,750,000 | | | 6,145,312 |
Kulicke & Soffa Industries, Inc., 0.875%, 6/01/2012 | | | | | 3,020,000 | | | 2,472,625 |
See accompanying notes to financial statements.
88
PORTFOLIO OF INVESTMENTS – as of September 30, 2009
Loomis Sayles Institutional High Income Fund – continued
| | | | | | | | |
| | | | | Principal Amount (‡) | | Value (†) |
| | | | | | | | |
| | | |
| BONDS AND NOTES – continued | | | | | | | | |
| | | |
| Technology – continued | | | | | | | | |
Kulicke & Soffa Industries, Inc., 1.000%, 6/30/2010 | | | | $ | 490,000 | | $ | 464,888 |
Maxtor Corp., 5.750%, 3/01/2012(c) | | | | | 1,324,000 | | | 1,204,840 |
Nortel Networks Corp., 2.125%, 4/15/2014(d) | | | | | 795,000 | | | 437,250 |
Richardson Electronics Ltd., 7.750%, 12/15/2011 | | | | | 132,000 | | | 117,480 |
Teradyne, Inc., 4.500%, 3/15/2014 | | | | | 1,050,000 | | | 1,967,438 |
| | | | | | | | |
| | | | | | | | 20,073,045 |
| | | | | | | | |
| Textile – 0.0% | | | | | | | | |
Dixie Yarns, Inc., 7.000%, 5/15/2012 | | | | | 16,000 | | | 13,120 |
| | | | | | | | |
| Wireless – 0.3% | | | | | | | | |
NII Holdings, Inc., 2.750%, 8/15/2025 | | | | | 255,000 | | | 250,219 |
NII Holdings, Inc., 3.125%, 6/15/2012 | | | | | 1,155,000 | | | 1,009,181 |
| | | | | | | | |
| | | | | | | | 1,259,400 |
| | | | | | | | |
| Wirelines – 1.1% | | | | | | | | |
Level 3 Communications, Inc., 3.500%, 6/15/2012 | | | | | 1,955,000 | | | 1,554,225 |
Level 3 Communications, Inc., 5.250%, 12/15/2011 | | | | | 590,000 | | | 525,100 |
Level 3 Communications, Inc., 7.000%, 3/15/2015, 144A(c) | | | | | 2,210,000 | | | 2,342,600 |
Level 3 Communications, Inc., 10.000%, 5/01/2011 | | | | | 805,000 | | | 794,937 |
| | | | | | | | |
| | | | | | | | 5,216,862 |
| | | | | | | | |
| | | |
| TOTAL CONVERTIBLE BONDS | | | | | | | | |
(Identified Cost $52,269,947) | | | | | | | | 63,777,484 |
| | | | | | | | |
| | | |
TOTAL BONDS AND NOTES
| | | | | | | | |
(Identified Cost $363,019,242) | | | | | | | | 401,282,402 |
| | | | | | | | |
| | | |
| BANK LOANS – 0.6% | | | | | | | | |
| | | |
| Airlines – 0.0% | | | | | | | | |
Delta Airlines, Inc., Secured Term Loan,
9/27/2013(h) | | | | | 205,000 | | | 203,462 |
| | | | | | | | |
| Media Non-Cable – 0.1% | | | | | | | | |
Idearc, Inc., Term Loan B, 6.250%,
11/17/2014(d)(i) | | | | | 510,970 | | | 216,100 |
Tribune Co., Term Loan X, 5.000%,
6/04/2009(d)(i)(l) | | | | | 25,600 | | | 12,432 |
| | | | | | | | |
| | | | | | | | 228,532 |
| | | | | | | | |
| Paper – 0.3% | | | | | | | | |
Smurfit-Stone Container Enterprises, Inc., CAD Revolver, 2.993%, 11/01/2009(i) | | | | | 213,344 | | | 206,487 |
Smurfit-Stone Container Enterprises, Inc., Offering-CL Deposit, 4.500%, 11/01/2010(i) | | | | | 129,110 | | | 124,960 |
Smurfit-Stone Container Enterprises, Inc., Revolver, 2.847%, 11/02/2009(i) | | | | | 643,242 | | | 622,569 |
Smurfit-Stone Container Enterprises, Inc., Tranche B Term Loan, 2.570%, 11/01/2011(i) | | | | | 146,930 | | | 142,208 |
Smurfit-Stone Container Enterprises, Inc., Tranche C Term Loan, 2.570%, 11/01/2011(i) | | | | | 276,940 | | | 268,039 |
Smurfit-Stone Container Enterprises, Inc., Tranche C1 Term Loan, 2.570%, 11/01/2011(i) | | | | | 83,731 | | | 81,040 |
| | | | | | | | |
| | | | | | | | 1,445,303 |
| | | | | | | | |
See accompanying notes to financial statements.
89
| | | | | | | | |
| | | | | Principal Amount (‡) | | Value (†) |
| | | | | | | | |
| | | |
| BONDS AND NOTES – continued | | | | | | | | |
| | | |
| Technology – 0.1% | | | | | | | | |
Sungard Data Systems, Inc., Tranche A, 2.004%, 2/28/2014(i) | | | | $ | 10,887 | | $ | 10,177 |
Sungard Data Systems, Inc., Tranche B, 4.079%, 2/26/2016(i) | | | | | 301,702 | | | 293,707 |
| | | | | | | | |
| | | | | | | | 303,884 |
| | | | | | | | |
| Wirelines – 0.1% | | | | | | | | |
Fairpoint Communications, Inc., Initial Term Loan A, 4.750%, 3/31/2014(i) | | | | | 80,000 | | | 60,200 |
Fairpoint Communications, Inc., Initial Term Loan B, 3/31/2015(h) | | | | | 80,000 | | | 60,125 |
Fairpoint Communications, Inc., Initial Term Loan B, 5.000%, 3/31/2015(i) | | | | | 80,000 | | | 60,125 |
Hawaiian Telcom Communications, Inc., Tranche C Term Loan, 4.750%, 6/01/2014(i)(j) | | | | | 157,134 | | | 96,951 |
Level 3 Financing, Inc., Tranche A Term Loan, 2.683%, 3/13/2014(i) | | | | | 70,000 | | | 61,863 |
| | | | | | | | |
| | | | | | | | 339,264 |
| | | | | | | | |
| | | |
| TOTAL BANK LOANS | | | | | | | | |
(Identified Cost $2,714,557) | | | | | | | | 2,520,445 |
| | | | | | | | |
| | | |
| | | | | Shares | | |
| | | |
| COMMON STOCKS – 2.3% | | | | | | | | |
| | | |
| Biotechnology – 1.4% | | | | | | | | |
EPIX Pharmaceuticals, Inc.(f) | | | | | 77,970 | | | 1,092 |
EPIX Pharmaceuticals, Inc., Contingent Value Rights(f) | | | | | 230 | | | — |
Vertex Pharmaceuticals, Inc.(f) | | | | | 165,617 | | | 6,276,884 |
| | | | | | | | |
| | | | | | | | 6,277,976 |
| | | | | | | | |
| Containers & Packaging – 0.3% | | | | | | | | |
Owens-Illinois, Inc.(f) | | | | | 40,621 | | | 1,498,915 |
| | | | | | | | |
| Electronic Equipment Instruments & Components – 0.3% | | | | | | | | |
Corning, Inc. | | | | | 69,766 | | | 1,068,118 |
| | | | | | | | |
| Food Products – 0.0% | | | | | | | | |
ConAgra Foods, Inc. | | | | | 3,100 | | | 67,208 |
| | | | | | | | |
| Household Durables – 0.0% | | | | | | | | |
KB Home | | | | | 6,775 | | | 112,533 |
| | | | | | | | |
| Oil, Gas & Consumable Fuels – 0.0% | | | | | | | | |
Chesapeake Energy Corp. | | | | | 2,846 | | | 80,826 |
| | | | | | | | |
| Pharmaceuticals – 0.2% | | | | | | | | |
Bristol-Myers Squibb Co. | | | | | 43,200 | | | 972,864 |
| | | | | | | | |
| REITs – 0.1% | | | | | | | | |
Apartment Investment & Management Co. | | | | | 6,185 | | | 91,229 |
Associated Estates Realty Corp. | | | | | 32,565 | | | 313,275 |
Developers Diversified Realty Corp. | | | | | 7,868 | | | 72,700 |
| | | | | | | | |
| | | | | | | | 477,204 |
| | | | | | | | |
| | | |
| TOTAL COMMON STOCKS | | | | | | | | |
(Identified Cost $5,532,578) | | | | | | | | 10,555,644 |
| | | | | | | | |
See accompanying notes to financial statements.
90
PORTFOLIO OF INVESTMENTS – as of September 30, 2009
Loomis Sayles Institutional High Income Fund – continued
| | | | | | | |
| | | | | Shares | | Value (†) |
| | | | | | | |
| | | |
| PREFERRED STOCKS – 1.5% | | | | | | | |
| | | |
| CONVERTIBLE PREFERRED STOCKS – 0.8% | | | | | | | |
| | | |
| Automotive – 0.2% | | | | | | | |
Ford Motor Co. Capital Trust II, 6.500% | | | | 32,158 | | $ | 968,599 |
| | | | | | | |
| Commercial Banks – 0.0% | | | | | | | |
Wells Fargo & Co., Series L, Class A, 7.500% | | | | 138 | | | 123,234 |
| | | | | | | |
| Diversified Financial Services – 0.1% | | | | | | | |
CIT Group, Inc., 8.750% | | | | 12,005 | | | 74,311 |
Sovereign Capital Trust IV, 4.375% | | | | 14,200 | | | 429,550 |
| | | | | | | |
| | | | | | | 503,861 |
| | | | | | | |
| Electric Utilities – 0.2% | | | | | | | |
AES Trust III, 6.750% | | | | 17,119 | | | 754,306 |
CMS Energy Trust I, 7.750%(c)(e) | | | | 4,150 | | | 145,250 |
| | | | | | | |
| | | | | | | 899,556 |
| | | | | | | |
| Hotels, Restaurants & Leisure – 0.0% | | | | | | | |
Six Flags, Inc., 7.250%(f) | | | | 9 | | | 4 |
| | | | | | | |
| Machinery – 0.1% | | | | | | | |
United Rentals Trust, 6.500% | | | | 14,328 | | | 356,409 |
| | | | | | | |
| Oil, Gas & Consumable Fuels – 0.0% | | | | | | | |
El Paso Energy Capital Trust I, 4.750% | | | | 5,700 | | | 190,594 |
| | | | | | | |
| REITs – 0.0% | | | | | | | |
FelCor Lodging Trust, Inc., Series A, 7.800% | | | | 1,100 | | | 12,650 |
| | | | | | | |
| Semiconductors & Semiconductor Equipment – 0.2% | | | | | | | |
Lucent Technologies Capital Trust, 7.750% | | | | 1,150 | | | 879,750 |
| | | | | | | |
| | | |
| TOTAL CONVERTIBLE PREFERRED STOCKS | | | | | | | |
(Identified Cost $4,402,031) | | | | | | | 3,934,657 |
| | | | | | | |
| | | |
| NON-CONVERTIBLE PREFERRED STOCKS – 0.7% | | | | | | | |
| | | |
| Diversified Financial Services – 0.1% | | | | | | | |
Bank of America Corp., 6.375%, | | | | 18,000 | | | 323,100 |
Preferred Blocker, Inc., 7.000%, 144A | | | | 448 | | | 260,526 |
| | | | | | | |
| | | | | | | 583,626 |
| | | | | | | |
| Thrifts & Mortgage Finance – 0.6% | | | | | | | |
Countrywide Capital IV, 6.750% | | | | 7,075 | | | 142,703 |
Federal Home Loan Mortgage Corp., 5.000%(f)(k) | | | | 1,350 | | | 3,578 |
Federal Home Loan Mortgage Corp., 5.570%(f)(k) | | | | 31,000 | | | 49,600 |
Federal Home Loan Mortgage Corp., 5.660%(f)(k) | | | | 986,100 | | | 1,627,065 |
Federal Home Loan Mortgage Corp., 5.700%(f)(k) | | | | 2,200 | | | 5,654 |
Federal Home Loan Mortgage Corp., 5.790%(f)(k) | | | | 7,100 | | | 18,886 |
Federal Home Loan Mortgage Corp., 5.810%(f)(k) | | | | 1,600 | | | 4,368 |
Federal Home Loan Mortgage Corp., 5.900%(f)(k) | | | | 4,700 | | | 7,990 |
Federal Home Loan Mortgage Corp., 6.000%(f)(k) | | | | 1,700 | | | 5,015 |
Federal Home Loan Mortgage Corp., 6.420%(f)(k) | | | | 151,250 | | | 453,750 |
Federal Home Loan Mortgage Corp., 6.550%(f)(k) | | | | 4,150 | | | 7,553 |
Federal Home Loan Mortgage Corp., (fixed rate to 12/31/2012, variable rate thereafter), 8.375%,(f)(k) | | | | 28,100 | | | 50,861 |
See accompanying notes to financial statements.
91
| | | | | | | |
| | | | | Shares | | Value (†) |
| | | | | | | |
| | | |
| PREFERRED STOCKS – continued | | | | | | | |
| | | |
| Thrifts & Mortgage Finance – continued | | | | | | | |
Federal National Mortgage Association, 4.750%(f)(k) | | | | 4,850 | | $ | 12,367 |
Federal National Mortgage Association, 5.125%(f)(k) | | | | 900 | | | 2,394 |
Federal National Mortgage Association, 5.375%(f)(k) | | | | 1,850 | | | 5,254 |
Federal National Mortgage Association, 5.810%(f)(k) | | | | 1,400 | | | 3,906 |
Federal National Mortgage Association, 6.750%(f)(k) | | | | 2,200 | | | 3,454 |
Federal National Mortgage Association, (fixed rate to 12/13/2010, variable rate thereafter), 8.250%(f)(k) | | | | 73,150 | | | 117,771 |
| | | | | | | |
| | | | | | | 2,522,169 |
| | | | | | | |
| | | |
| TOTAL NON-CONVERTIBLE PREFERRED STOCKS | | | | | | | |
(Identified Cost $3,078,150) | | | | | | | 3,105,795 |
| | | | | | | |
| | | |
| TOTAL PREFERRED STOCKS | | | | | | | |
(Identified Cost $7,480,181) | | | | | | | 7,040,452 |
| | | | | | | |
| | | |
CLOSED END INVESTMENT
COMPANIES – 0.4% | | | | | | | |
BlackRock Senior High Income Fund, Inc. | | | | 14,183 | | | 48,647 |
Dreyfus High Yield Strategies Fund | | | | 78,008 | | | 276,928 |
DWS High Income Trust | | | | 11,261 | | | 92,453 |
Highland Credit Strategies Fund | | | | 31,505 | | | 200,057 |
Van Kampen High Income Trust II | | | | 8,400 | | | 116,172 |
Western Asset Managed High Income Fund, Inc. | | | | 197,293 | | | 1,191,650 |
| | | | | | | |
| | | |
| TOTAL CLOSED END INVESTMENT COMPANIES | | | | | | | |
(Identified Cost $2,266,291) | | | | | | | 1,925,907 |
| | | | | | | |
| | | |
| EXCHANGE TRADED FUNDS – 3.2% | | | | | | | |
iShares iBoxx $ High Yield Corporate Bond Fund | | | | 79,406 | | | 6,856,708 |
SPDR Barclays Capital High Yield Bond | | | | 195,666 | | | 7,531,184 |
| | | | | | | |
| | | |
| TOTAL EXCHANGE TRADED FUNDS | | | | | | | |
(Identified Cost $13,545,018) | | | | | | | 14,387,892 |
| | | | | | | |
| | | |
| WARRANTS – 0.0% | | | | | | | |
| | | |
| Pharmaceuticals – 0.0% | | | | | | | |
Valeant Pharmaceuticals International, Expiration 8/16/2010(e)(f) | | | | | | | |
(Identified Cost $0) | | | | 31,159 | | | — |
| | | | | | | |
See accompanying notes to financial statements.
92
PORTFOLIO OF INVESTMENTS – as of September 30, 2009
Loomis Sayles Institutional High Income Fund – continued
| | | | | | | | |
| | | | | Principal Amount (‡) | | Value (†) |
| | | | | | | | |
| | | |
| SHORT-TERM INVESTMENTS – 3.7% | | | | | | | | |
| Repurchase Agreement with State Street Corporation, dated 9/30/2009 at 0.000% to be repurchased at $2,627 on 10/01/2009 collateralized by $5,000 U.S. Treasury Bill, due 11/05/2009 with a value of $5,000 including accrued interest (Note 2i of Notes to Financial Statements) | | | | $ | 2,627 | | $ | 2,627 |
| Tri-Party Repurchase Agreement with Fixed Income Clearing Corporation, dated 9/30/2009 at 0.000% to be repurchased at $16,905,236 on 10/01/2009 collateralized by $17,255,000 Federal Home Loan Mortgage Corp. Discount Note, due 12/31/2009 with a value of $17,246,373 including accrued interest (Note 2i of Notes to Financial Statements) | | | | | 16,905,236 | | | 16,905,236 |
| | | | | | | | |
| | | |
| TOTAL SHORT-TERM INVESTMENTS | | | | | | | | |
(Identified Cost $16,907,863) | | | | | | | | 16,907,863 |
| | | | | | | | |
| | | |
| TOTAL INVESTMENTS – 99.2% | | | | | | | | |
(Identified Cost $411,465,730)(a) | | | | | | | | 454,620,605 |
Other assets less liabilities—0.8% | | | | | | | | 3,895,394 |
| | | | | | | | |
| | | |
| NET ASSETS – 100.0% | | | | | | | $ | 458,515,999 |
| | | | | | | | |
|
(‡) Principal amount stated in U.S. dollars unless otherwise noted. |
(†) See Note 2a of Notes to Financial Statements. |
(††) Amount shown represents units. One unit represents a principal amount of 100. |
(a) Federal Tax Information: | | | |
At September 30, 2009, the net unrealized appreciation on investments based on a cost of $412,206,096 for federal income tax purposes was as follows: | | | |
Aggregate gross unrealized appreciation for all investments in which there is an excess of value over tax cost | | $ | 61,003,557 |
Aggregate gross unrealized depreciation for all investments in which there is an excess of tax cost over value | | | (18,589,048) |
| | | | | | | | |
Net unrealized appreciation | | $ | 42,414,509 |
| | | | | | | | |
| (b) | Variable rate security. Rate as of September 30, 2009 is disclosed. |
| (c) | Illiquid security. At September 30, 2009, the value of these securities amounted to $10,203,524 or 2.2% of net assets. |
| (d) | The issuer is in default with respect to interest and/or principal payments. Income is not being accrued. |
| (e) | Fair valued security by the Fund’s investment adviser. At September 30, 2009 the value of these securities amounted to $3,340,369 or 0.7% of net assets. |
| (f) | Non-income producing security. |
| (g) | Step Bond: Coupon is a fixed rate for an initial period then resets at a specified date and rate. |
| (h) | All or a portion of this security has not settled. Contract rates are not determined and do not take effect until settlement date. |
| (i) | Variable rate security. Rate shown represents the weighted average rate at September 30, 2009. |
| (j) | All or portion of interest payment is paid-in-kind. |
| (k) | Future dividend payments have been eliminated as the issuer has been placed in conservatorship. |
| (l) | Issuer has filed for bankruptcy. |
| 144A | Securities exempt from registration under Rule 144A of the Securities Act of 1933. These securities may be resold in transactions exempt from registration, normally to qualified institutional buyers. At September 30, 2009, the total value of these securities amounted to $47,321,558 or 10.3% of net assets. |
| ABS | Asset-Backed Securities |
| EMTN | Euro Medium Term Note |
| GMTN | Global Medium Term Note |
| REITs | Real Estate Investment Trusts |
Key to Abbreviations: BRL: Brazilian Real; CAD: Canadian Dollar; EUR: Euro; GBP: British Pound; IDR: Indonesian Rupiah; ISK: Icelandic Krona; MXN: Mexican Peso; NOK: Norwegian Krone; NZD: New Zealand Dollar; THB: Thai Baht
See accompanying notes to financial statements.
93
INDUSTRY SUMMARY AT SEPTEMBER 30, 2009 (Unaudited)
| | | |
Technology | | 9.1 | % |
Paper | | 6.5 | |
Healthcare | | 6.2 | |
Wirelines | | 5.8 | |
Pharmaceuticals | | 5.0 | |
Metals & Mining | | 4.9 | |
Banking | | 4.7 | |
Automotive | | 4.6 | |
Retailers | | 3.4 | |
Non-Captive Diversified | | 3.3 | |
Exchange Traded Funds | | 3.2 | |
Electric | | 3.0 | |
Sovereigns | | 2.9 | |
Local Authorities | | 2.6 | |
Pipelines | | 2.5 | |
Wireless | | 2.1 | |
Independent Energy | | 2.1 | |
Building Materials | | 2.0 | |
Other Investments, less than 2% each | | 21.6 | |
Short-Term Investments | | 3.7 | |
| | | |
Total Investments | | 99.2 | |
Other assets less liabilities | | 0.8 | |
| | | |
Net Assets | | 100.0 | % |
| | | |
| | | |
See accompanying notes to financial statements.
94
PORTFOLIO OF INVESTMENTS – as of September 30, 2009
Loomis Sayles Intermediate Duration Fixed Income Fund
| | | | | | | | |
| | | | | Principal Amount | | Value (†) |
| | | | | | | | |
| | | |
| BONDS AND NOTES – 92.5% of Net Assets | | | | | | | | |
| | | |
| ABS Car Loan – 0.1% | | | | | | | | |
Americredit Automobile Receivables Trust, Series 2004-DF, Class A4, 3.430%, 7/06/2011 | | | | $ | 27,434 | | $ | 27,633 |
| | | | | | | | |
| ABS Credit Card – 4.5% | | | | | | | | |
BA Credit Card Trust, Series 2008-A5, Class A5, 1.443%, 12/16/2013(b) | | | | | 260,000 | | | 261,640 |
Capital One Multi-Asset Execution Trust, Series 2004-A4, Class A4, 0.463%, 3/15/2017(b) | | | | | 60,000 | | | 57,570 |
Chase Issuance Trust, Series 2007-A16, Class A16, 0.599%, 6/16/2014(b) | | | | | 315,000 | | | 311,867 |
Citibank Credit Card Issuance Trust, Series 2008-C6, Class C6, 6.300%, 6/20/2014 | | | | | 255,000 | | | 263,789 |
Discover Card Master Trust I, Series 2007-3, Class A2, 0.293%, 10/16/2014(b) | | | | | 150,000 | | | 145,993 |
MBNA Credit Card Master Note Trust, Series 2004-A3, Class A3, 0.503%, 8/16/2021(b) | | | | | 140,000 | | | 127,350 |
MBNA Credit Card Master Note Trust, Series 2004-B1, Class B1, 4.450%, 8/15/2016 | | | | | 110,000 | | | 106,685 |
| | | | | | | | |
| | | | | | | | 1,274,894 |
| | | | | | | | |
| ABS Home Equity – 0.8% | | | | | | | | |
Countrywide Asset-Backed Certificates, Series 2004-S1, Class A3, 4.615%, 2/25/2035 | | | | | 125,500 | | | 94,363 |
Countrywide Asset-Backed Certificates, Series 2006-S1, Class A2, 5.549%, 8/25/2021 | | | | | 173,764 | | | 92,043 |
GSAMP Trust, Series 2005-WMC3, Class A2B, 0.486%, 12/25/2035(b) | | | | | 61,731 | | | 38,995 |
| | | | | | | | |
| | | | | | | | 225,401 |
| | | | | | | | |
| Aerospace & Defense – 0.6% | | | | | | | | |
General Dynamics Corp., 5.250%, 2/01/2014 | | | | | 155,000 | | | 169,889 |
| | | | | | | | |
| Automotive – 0.8% | | | | | | | | |
Ford Motor Credit Co. LLC, 7.000%, 10/01/2013 | | | | | 235,000 | | | 220,574 |
| | | | | | | | |
| Banking – 10.7% | | | | | | | | |
American Express Co., 5.500%, 9/12/2016 | | | | | 85,000 | | | 84,268 |
American Express Co., 6.150%, 8/28/2017 | | | | | 120,000 | | | 126,047 |
Bank of America Corp., 5.650%, 5/01/2018 | | | | | 205,000 | | | 202,415 |
Bank One Corp., 5.900%, 11/15/2011 | | | | | 5,000 | | | 5,346 |
Barclays Bank PLC, 5.200%, 7/10/2014 | | | | | 125,000 | | | 132,040 |
Bear Stearns Cos., Inc. (The), 5.350%, 2/01/2012 | | | | | 130,000 | | | 138,098 |
Bear Stearns Cos., Inc. (The), 7.250%, 2/01/2018 | | | | | 280,000 | | | 319,772 |
Citigroup, Inc., 5.300%, 10/17/2012 | | | | | 325,000 | | | 335,319 |
Credit Suisse NY, 6.000%, 2/15/2018 | | | | | 110,000 | | | 115,165 |
Goldman Sachs Group, Inc. (The), 6.150%, 4/01/2018 | | | | | 355,000 | | | 373,429 |
Merrill Lynch & Co., Inc., 5.450%, 2/05/2013 | | | | | 350,000 | | | 362,922 |
Morgan Stanley, 5.300%, 3/01/2013 | | | | | 400,000 | | | 419,133 |
Wachovia Corp., 5.300%, 10/15/2011 | | | | | 45,000 | | | 47,677 |
Wells Fargo & Co., 5.250%, 10/23/2012 | | | | | 305,000 | | | 325,415 |
| | | | | | | | |
| | | | | | | | 2,987,046 |
| | | | | | | | |
See accompanying notes to financial statements.
95
| | | | | | | | |
| | | | | Principal Amount | | Value (†) |
| | | | | | | | |
| | | |
| BONDS AND NOTES – continued | | | | | | | | |
| | | |
| Collateralized Mortgage Obligations – 1.7% | | | | | | | | |
Countrywide Alternative Loan Trust, Series 2006-J5, Class 4A1, 6.006%, 7/25/2021(b) | | | | $ | 236,310 | | $ | 168,962 |
Federal Home Loan Mortgage Corp., 5.000%, 8/15/2024 | | | | | 298,093 | | | 309,672 |
| | | | | | | | |
| | | | | | | | 478,634 |
| | | | | | | | |
| Commercial Mortgage-Backed Securities – 11.5% | | | | | | | | |
Banc of America Commercial Mortgage, Inc., Series 2006-2, Class A4, 5.739%, 5/10/2045(b) | | | | | 205,000 | | | 197,075 |
Banc of America Commercial Mortgage, Inc., Series 2007-2, Class A2, 5.634%, 4/10/2049 | | | | | 490,000 | | | 486,426 |
Bear Stearns Commercial Mortgage Securities, Series 2007-PW16, Class A4, 5.719%, 6/11/2040(b) | | | | | 250,000 | | | 228,363 |
Citigroup Commercial Mortgage Trust, Series 2006-C5, Class A4, 5.431%, 10/15/2049 | | | | | 45,000 | | | 40,667 |
Commercial Mortgage Pass Through Certificates, Series 2007-C9, Class A4, 5.816%, 12/10/2049(b) | | | | | 140,000 | | | 126,156 |
Greenwich Capital Commercial Funding Corp., Series 2006-GG7, Class A4, 5.918%, 7/10/2038(b) | | | | | 165,000 | | | 150,958 |
Greenwich Capital Commercial Funding Corp., Series 2007-GG11, Class A4, 5.736%, 12/10/2049 | | | | | 50,000 | | | 45,022 |
GS Mortgage Securities Corp. II, Series 2006-GG8, Class A2, 5.479%, 11/10/2039 | | | | | 410,000 | | | 408,117 |
JPMorgan Chase Commercial Mortgage Securities Corp., Series 2006-LDP7, Class A2, 5.861%, 4/15/2045(b) | | | | | 375,000 | | | 380,578 |
JPMorgan Chase Commercial Mortgage Securities Corp., Series 2007-CB19, Class A4, 5.746%, 2/12/2049(b) | | | | | 85,000 | | | 72,759 |
LB-UBS Commercial Mortgage Trust, Series 2005-C3, Class A3, 4.647%, 7/15/2030 | | | | | 230,000 | | | 230,352 |
Merrill Lynch/Countrywide Commercial Mortgage Trust, Series 2006-1, Class A4, 5.420%, 2/12/2039(b) | | | | | 320,000 | | | 292,083 |
Merrill Lynch/Countrywide Commercial Mortgage Trust, Series 2006-2, Class A4, 5.909%, 6/12/2046(b) | | | | | 210,000 | | | 197,540 |
Morgan Stanley Capital I, Series 2006-T23, Series A2, 5.741%, 8/12/2041(b) | | | | | 205,000 | | | 207,317 |
Morgan Stanley Capital I, Series 2007-HQ13, Class A3, 5.569%, 12/15/2044 | | | | | 70,000 | | | 57,768 |
Morgan Stanley Capital I, Series 2007-T27, Class A4, 5.650%, 6/11/2042(b) | | | | | 100,000 | | | 94,368 |
| | | | | | | | |
| | | | | | | | 3,215,549 |
| | | | | | | | |
| Construction Machinery – 0.7% | | | | | | | | |
Caterpillar Financial Services Corp., MTN, 6.125%, 2/17/2014 | | | | | 90,000 | | | 98,668 |
John Deere Capital Corp., MTN, 4.500%, 4/03/2013 | | | | | 90,000 | | | 95,154 |
| | | | | | | | |
| | | | | | | | 193,822 |
| | | | | | | | |
| Consumer Products – 0.8% | | | | | | | | |
Hasbro, Inc., 6.125%, 5/15/2014 | | | | | 50,000 | | | 54,387 |
Koninklijke (Royal) Philips Electronics NV, 4.625%, 3/11/2013 | | | | | 175,000 | | | 184,384 |
| | | | | | | | |
| | | | | | | | 238,771 |
| | | | | | | | |
See accompanying notes to financial statements.
96
PORTFOLIO OF INVESTMENTS – as of September 30, 2009
Loomis Sayles Intermediate Duration Fixed Income Fund – continued
| | | | | | | | |
| | | | | Principal Amount | | Value (†) |
| | | | | | | | |
| | | |
| BONDS AND NOTES – continued | | | | | | | | |
| | | |
| Distributors – 0.4% | | | | | | | | |
EQT Corp., 8.125%, 6/01/2019 | | | | $ | 40,000 | | $ | 45,655 |
Sempra Energy, 6.500%, 6/01/2016 | | | | | 70,000 | | | 77,381 |
| | | | | | | | |
| | | | | | | | 123,036 |
| | | | | | | | |
| Diversified Manufacturing – 0.2% | | | | | | | | |
Tyco International Finance SA, 4.125%, 10/15/2014 | | | | | 65,000 | | | 64,775 |
| | | | | | | | |
| Electric – 3.7% | | | | | | | | |
Carolina Power & Light Co., 6.500%, 7/15/2012 | | | | | 5,000 | | | 5,528 |
Consolidated Edison Co. of NY, Inc., 7.125%, 12/01/2018 | | | | | 125,000 | | | 148,265 |
Duke Energy Corp., 5.625%, 11/30/2012 | | | | | 150,000 | | | 165,634 |
Nisource Finance Corp., 7.875%, 11/15/2010 | | | | | 145,000 | | | 152,542 |
Pacific Gas & Electric Co., 6.250%, 12/01/2013 | | | | | 135,000 | | | 151,622 |
Southern California Edison Co., 5.750%, 3/15/2014 | | | | | 165,000 | | | 182,876 |
Virginia Electric and Power Co., 5.100%, 11/30/2012 | | | | | 205,000 | | | 222,126 |
| | | | | | | | |
| | | | | | | | 1,028,593 |
| | | | | | | | |
| Entertainment – 2.1% | | | | | | | | |
Time Warner, Inc., 5.875%, 11/15/2016 | | | | | 165,000 | | | 174,969 |
Time Warner, Inc., 6.500%, 11/15/2036 | | | | | 45,000 | | | 46,046 |
Viacom, Inc., Class B, 6.875%, 4/30/2036 | | | | | 205,000 | | | 216,561 |
Walt Disney Co., 5.700%, 7/15/2011 | | | | | 145,000 | | | 155,215 |
| | | | | | | | |
| | | | | | | | 592,791 |
| | | | | | | | |
| Environmental – 0.2% | | | | | | | | |
Waste Management, Inc., 6.375%, 3/11/2015 | | | | | 40,000 | | | 44,260 |
| | | | | | | | |
| Food & Beverage – 3.4% | | | | | | | | |
Anheuser-Busch Cos., Inc., 6.450%, 9/01/2037 | | | | | 200,000 | | | 217,854 |
Bunge Ltd. Finance Corp., 8.500%, 6/15/2019 | | | | | 45,000 | | | 51,877 |
General Mills, Inc., 5.650%, 9/10/2012 | | | | | 225,000 | | | 245,558 |
HJ Heinz Finance Co., 6.000%, 3/15/2012 | | | | | 100,000 | | | 108,310 |
Kellogg Co., 5.125%, 12/03/2012 | | | | | 175,000 | | | 189,963 |
Kraft Foods, Inc., 6.750%, 2/19/2014 | | | | | 130,000 | | | 145,030 |
| | | | | | | | |
| | | | | | | | 958,592 |
| | | | | | | | |
| Government Owned – No Guarantee – 0.6% | | | | | | | | |
Federal National Mortgage Association, 5.375%, 6/12/2017 | | | | | 150,000 | | | 169,454 |
| | | | | | | | |
| Health Insurance – 1.2% | | | | | | | | |
UnitedHealth Group, Inc., 4.875%, 2/15/2013 | | | | | 180,000 | | | 187,087 |
WellPoint, Inc., 5.250%, 1/15/2016 | | | | | 100,000 | | | 101,977 |
WellPoint, Inc., 6.000%, 2/15/2014 | | | | | 35,000 | | | 37,672 |
| | | | | | | | |
| | | | | | | | 326,736 |
| | | | | | | | |
| Healthcare – 1.9% | | | | | | | | |
Express Scripts, Inc., 6.250%, 6/15/2014 | | | | | 20,000 | | | 21,979 |
Hospira, Inc., 5.550%, 3/30/2012 | | | | | 250,000 | | | 265,291 |
McKesson Corp., 6.500%, 2/15/2014 | | | | | 45,000 | | | 49,327 |
Medco Health Solutions, Inc., 6.125%, 3/15/2013 | | | | | 170,000 | | | 184,064 |
| | | | | | | | |
| | | | | | | | 520,661 |
| | | | | | | | |
See accompanying notes to financial statements.
97
| | | | | | | | |
| | | | | Principal Amount | | Value (†) |
| | | | | | | | |
| | | |
| BONDS AND NOTES – continued | | | | | | | | |
| | | |
| Hybrid ARMs – 1.8% | | | | | | | | |
FHLMC, 4.428%, 1/01/2035(b)(d) | | | | $ | 208,537 | | $ | 212,382 |
Indymac Index Mortgage Loan Trust, Series 2006-AR25, Class 3A1, 5.922%, 9/25/2036(b) | | | | | 509,768 | | | 294,207 |
| | | | | | | | |
| | | | | | | | 506,589 |
| | | | | | | | |
| Independent Energy – 1.8% | | | | | | | | |
Devon Energy Corp., 5.625%, 1/15/2014 | | | | | 125,000 | | | 134,381 |
EnCana Corp., 6.500%, 5/15/2019 | | | | | 80,000 | | | 88,812 |
Talisman Energy, Inc., 5.850%, 2/01/2037 | | | | | 15,000 | | | 14,428 |
Talisman Energy, Inc., 6.250%, 2/01/2038 | | | | | 55,000 | | | 56,107 |
Talisman Energy, Inc., 7.750%, 6/01/2019 | | | | | 25,000 | | | 29,396 |
XTO Energy, Inc., 4.900%, 2/01/2014 | | | | | 5,000 | | | 5,187 |
XTO Energy, Inc., 5.750%, 12/15/2013 | | | | | 170,000 | | | 183,620 |
| | | | | | | | |
| | | | | | | | 511,931 |
| | | | | | | | |
| Integrated Energy – 1.5% | | | | | | | | |
BP Capital Markets PLC, 3.875%, 3/10/2015 | | | | | 190,000 | | | 196,282 |
ConocoPhillips, 5.750%, 2/01/2019 | | | | | 130,000 | | | 141,632 |
Hess Corp., 7.000%, 2/15/2014 | | | | | 35,000 | | | 39,058 |
Marathon Oil Corp., 6.500%, 2/15/2014 | | | | | 35,000 | | | 38,541 |
| | | | | | | | |
| | | | | | | | 415,513 |
| | | | | | | | |
| Media Cable – 2.1% | | | | | | | | |
Comcast Corp., 4.950%, 6/15/2016 | | | | | 160,000 | | | 163,657 |
Cox Communications, Inc., 4.625%, 1/15/2010 | | | | | 5,000 | | | 5,046 |
Cox Communications, Inc., 5.450%, 12/15/2014 | | | | | 215,000 | | | 230,958 |
Time Warner Cable, Inc., 6.200%, 7/01/2013 | | | | | 170,000 | | | 185,197 |
| | | | | | | | |
| | | | | | | | 584,858 |
| | | | | | | | |
| Media Non-Cable – 1.2% | | | | | | | | |
Reed Elsevier Capital, Inc., 7.750%, 1/15/2014 | | | | | 125,000 | | | 142,093 |
Thomson Reuters Corp., 5.950%, 7/15/2013 | | | | | 175,000 | | | 192,118 |
| | | | | | | | |
| | | | | | | | 334,211 |
| | | | | | | | |
| Metals & Mining – 1.8% | | | | | | | | |
ArcelorMittal, 9.850%, 6/01/2019 | | | | | 135,000 | | | 159,678 |
United States Steel Corp., 6.050%, 6/01/2017 | | | | | 175,000 | | | 163,449 |
Vale Overseas Ltd., 6.250%, 1/23/2017 | | | | | 165,000 | | | 176,648 |
| | | | | | | | |
| | | | | | | | 499,775 |
| | | | | | | | |
| Mortgage Related – 4.2% | | | | | | | | |
FHLMC, 4.500%, 12/01/2019 | | | | | 12,518 | | | 13,177 |
FHLMC, 5.500%, 3/01/2013 | | | | | 6,491 | | | 6,930 |
FHLMC, 6.000%, 11/01/2012 | | | | | 10,654 | | | 11,221 |
FHLMC, 6.500%, 1/01/2024 | | | | | 3,553 | | | 3,830 |
FHLMC, 8.000%, 7/01/2025 | | | | | 367 | | | 416 |
FNMA, 5.500%, with various maturities from 2017 to 2020(c) | | | | | 1,043,787 | | | 1,117,045 |
FNMA, 6.000%, 9/01/2021 | | | | | 6,684 | | | 7,141 |
FNMA, 7.500%, 6/01/2016 | | | | | 2,036 | | | 2,216 |
FNMA, 8.000%, 6/01/2015 | | | | | 2,855 | | | 3,101 |
GNMA, 6.500%, 12/15/2023 | | | | | 9,151 | | | 9,731 |
See accompanying notes to financial statements.
98
PORTFOLIO OF INVESTMENTS – as of September 30, 2009
Loomis Sayles Intermediate Duration Fixed Income Fund – continued
| | | | | | | | |
| | | | | Principal Amount | | Value (†) |
| | | | | | | | |
| | | |
| BONDS AND NOTES – continued | | | | | | | | |
| | | |
| Mortgage Related – continued | | | | | | | | |
GNMA, 8.500%, 9/15/2022 | | | | $ | 1,880 | | $ | 2,146 |
GNMA, 9.500%, 1/15/2019 | | | | | 6,361 | | | 7,153 |
| | | | | | | | |
| | | | | | | | 1,184,107 |
| | | | | | | | |
| Non-Captive Consumer – 0.7% | | | | | | | | |
HSBC Finance Corp., 4.750%, 4/15/2010 | | | | | 205,000 | | | 207,964 |
| | | | | | | | |
| Non-Captive Diversified – 2.3% | | | | | | | | |
General Electric Capital Corp., MTN, 5.875%, 1/14/2038 | | | | | 20,000 | | | 18,342 |
General Electric Capital Corp., Series A, MTN, 4.875%, 3/04/2015 | | | | | 515,000 | | | 530,803 |
iStar Financial, Inc., 5.150%, 3/01/2012 | | | | | 170,000 | | | 101,150 |
| | | | | | | | |
| | | | | | | | 650,295 |
| | | | | | | | |
| Oil Field Services – 0.4% | | | | | | | | |
Halliburton Co., 6.150%, 9/15/2019 | | | | | 110,000 | | | 123,388 |
| | | | | | | | |
| Pharmaceuticals – 0.6% | | | | | | | | |
Eli Lilly & Co., 4.200%, 3/06/2014 | | | | | 155,000 | | | 164,460 |
Schering-Plough Corp., 5.550%, 12/01/2013 | | | | | 5,000 | | | 5,474 |
| | | | | | | | |
| | | | | | | | 169,934 |
| | | | | | | | |
| Pipelines – 2.0% | | | | | | | | |
Energy Transfer Partners LP, 6.000%, 7/01/2013 | | | | | 170,000 | | | 180,164 |
Kinder Morgan Energy Partners LP, 5.000%, 12/15/2013 | | | | | 185,000 | | | 193,377 |
Spectra Energy Capital LLC, 5.668%, 8/15/2014 | | | | | 175,000 | | | 185,747 |
| | | | | | | | |
| | | | | | | | 559,288 |
| | | | | | | | |
| Property & Casualty Insurance – 0.1% | | | | | | | | |
Willis North America, Inc., 7.000%, 9/29/2019 | | | | | 15,000 | | | 15,423 |
| | | | | | | | |
| Railroads – 1.4% | | | | | | | | |
Burlington Northern Santa Fe Corp., 7.000%, 2/01/2014 | | | | | 175,000 | | | 200,114 |
CSX Corp., 6.150%, 5/01/2037 | | | | | 30,000 | | | 31,778 |
Union Pacific Corp., 5.750%, 11/15/2017 | | | | | 160,000 | | | 171,521 |
| | | | | | | | |
| | | | | | | | 403,413 |
| | | | | | | | |
| Refining – 0.5% | | | | | | | | |
Valero Energy Corp., 9.375%, 3/15/2019 | | | | | 125,000 | | | 145,659 |
| | | | | | | | |
| REITs – 2.6% | | | | | | | | |
Colonial Realty LP, 4.800%, 4/01/2011 | | | | | 36,000 | | | 34,947 |
ERP Operating LP, 6.625%, 3/15/2012 | | | | | 165,000 | | | 174,390 |
Federal Realty Investment Trust, 5.400%, 12/01/2013 | | | | | 105,000 | | | 102,108 |
ProLogis, 5.500%, 4/01/2012 | | | | | 255,000 | | | 251,965 |
Simon Property Group LP, 5.300%, 5/30/2013 | | | | | 170,000 | | | 173,805 |
| | | | | | | | |
| | | | | | | | 737,215 |
| | | | | | | | |
| Retailers – 1.1% | | | | | | | | |
CVS Caremark Corp., 5.750%, 6/01/2017 | | | | | 160,000 | | | 171,281 |
Macy’s Retail Holdings, Inc., 5.350%, 3/15/2012 | | | | | 130,000 | | | 126,540 |
| | | | | | | | |
| | | | | | | | 297,821 |
| | | | | | | | |
See accompanying notes to financial statements.
99
| | | | | | | | |
| | | | | Principal Amount | | Value (†) |
| | | | | | | | |
| | | |
| BONDS AND NOTES – continued | | | | | | | | |
| | | |
| Supermarkets – 0.6% | | | | | | | | |
Kroger Co., 6.200%, 6/15/2012 | | | | $ | 50,000 | | $ | 54,587 |
Kroger Co., 6.400%, 8/15/2017 | | | | | 35,000 | | | 38,726 |
Kroger Co., 6.750%, 4/15/2012 | | | | | 65,000 | | | 71,488 |
| | | | | | | | |
| | | | | | | | 164,801 |
| | | | | | | | |
| Technology – 4.0% | | | | | | | | |
Agilent Technologies, Inc., 6.500%, 11/01/2017 | | | | | 120,000 | | | 124,877 |
Corning, Inc., 6.200%, 3/15/2016 | | | | | 45,000 | | | 45,991 |
Equifax, Inc., 7.000%, 7/01/2037 | | | | | 65,000 | | | 63,859 |
IBM International Group Capital, 5.050%, 10/22/2012 | | | | | 230,000 | | | 250,311 |
National Semiconductor Corp., 6.600%, 6/15/2017 | | | | | 175,000 | | | 172,945 |
Oracle Corp., 4.950%, 4/15/2013 | | | | | 170,000 | | | 183,993 |
Pitney Bowes, Inc., 5.250%, 1/15/2037 | | | | | 95,000 | | | 98,098 |
Xerox Corp., 6.400%, 3/15/2016 | | | | | 170,000 | | | 178,116 |
| | | | | | | | |
| | | | | | | | 1,118,190 |
| | | | | | | | |
| Tobacco – 1.3% | | | | | | | | |
Altria Group, Inc., 9.700%, 11/10/2018 | | | | | 115,000 | | | 142,837 |
Philip Morris International, Inc., 6.875%, 3/17/2014 | | | | | 185,000 | | | 211,337 |
| | | | | | | | |
| | | | | | | | 354,174 |
| | | | | | | | |
| Treasuries – 9.5% | | | | | | | | |
U.S. Treasury Inflation Indexed Bond, 1.375%, 7/15/2018 | | | | | 599,226 | | | 593,234 |
U.S. Treasury Inflation Indexed Bond, 1.625%, 1/15/2018 | | | | | 298,120 | | | 301,101 |
U.S. Treasury Note, 1.125%, 6/30/2011 | | | | | 1,150,000 | | | 1,156,648 |
U.S. Treasury Note, 2.750%, 2/15/2019 | | | | | 55,000 | | | 52,486 |
U.S. Treasury Note, 4.250%, 8/15/2014 | | | | | 140,000 | | | 153,038 |
U.S. Treasury Note, 4.500%, 2/15/2016 | | | | | 70,000 | | | 77,235 |
U.S. Treasury Note, 4.750%, 8/15/2017(d) | | | | | 45,000 | | | 50,143 |
U.S. Treasury Note, 4.875%, 7/31/2011 | | | | | 250,000 | | | 268,330 |
| | | | | | | | |
| | | | | | | | 2,652,215 |
| | | | | | | | |
| Wireless – 1.2% | | | | | | | | |
Nextel Communications, Inc., Series F, 5.950%, 3/15/2014 | | | | | 5,000 | | | 4,425 |
Sprint Nextel Corp., 6.000%, 12/01/2016 | | | | | 170,000 | | | 151,725 |
Vodafone Group PLC, 5.350%, 2/27/2012 | | | | | 175,000 | | | 187,425 |
| | | | | | | | |
| | | | | | | | 343,575 |
| | | | | | | | |
| Wirelines – 3.9% | | | | | | | | |
AT&T, Inc., 5.100%, 9/15/2014 | | | | | 180,000 | | | 194,070 |
Embarq Corp., 7.995%, 6/01/2036 | | | | | 155,000 | | | 161,946 |
Qwest Corp., 6.875%, 9/15/2033 | | | | | 260,000 | | | 210,600 |
Telecom Italia Capital SA, 4.950%, 9/30/2014 | | | | | 185,000 | | | 191,435 |
Telefonica Emisiones SAU, 4.949%, 1/15/2015 | | | | | 125,000 | | | 132,601 |
Verizon Communications, Inc., 6.350%, 4/01/2019 | | | | | 175,000 | | | 193,247 |
| | | | | | | | |
| | | | | | | | 1,083,899 |
| | | | | | | | |
| | | |
| TOTAL BONDS AND NOTES | | | | | | | | |
(Identified Cost $24,995,897) | | | | | | | | 25,925,349 |
| | | | | | | | |
See accompanying notes to financial statements.
100
PORTFOLIO OF INVESTMENTS – as of September 30, 2009
Loomis Sayles Intermediate Duration Fixed Income Fund – continued
| | | | | | | | |
| | | | | Principal Amount | | Value (†) |
| | | | | | | | |
| | | |
| SHORT-TERM INVESTMENTS – 7.0% | | | | | | | | |
| Tri-Party Repurchase Agreement with Fixed Income Clearing Corporation, dated 9/30/2009 at 0.000% to be repurchased at $1,127,253 on 10/01/2009 collateralized by $1,140,000 Federal Home Loan Bank, 2.900% due 7/02/2013 valued at $1,149,975 including accrued interest (Note 2i of Notes to Financial Statements) | | | | $ | 1,127,253 | | $ | 1,127,253 |
| U.S. Treasury Bill, Zero Coupon, 11/27/2009 | | | | | 840,000 | | | 839,927 |
| | | | | | | | |
| | | |
| TOTAL SHORT-TERM INVESTMENTS | | | | | | | | |
(Identified Cost $1,967,196) | | | | | | | | 1,967,180 |
| | | | | | | | |
| | | |
| TOTAL INVESTMENTS – 99.5% | | | | | | | | |
(Identified Cost $26,963,093)(a) | | | | | | | | 27,892,529 |
Other assets less liabilities—0.5% | | | | | | | | 134,800 |
| | | | | | | | |
| | | |
| NET ASSETS – 100.0% | | | | | | | $ | 28,027,329 |
| | | | | | | | |
| |
(†) See Note 2a of Notes to Financial Statements. | | | |
(a) Federal Tax Information: At September 30, 2009, the net unrealized appreciation on investments based on a cost of $26,981,458 for federal income tax purposes was as follows: | | | |
Aggregate gross unrealized appreciation for all investments in which there is an excess of value over tax cost | | $ | 1,496,016 |
Aggregate gross unrealized depreciation for all investments in which there is an excess of tax cost over value | | | (584,945) |
| | | | | | | | |
Net unrealized appreciation | | $ | 911,071 |
| | | | | | | | |
| (b) | Variable rate security. Rate as of September 30, 2009 is disclosed. |
| (c) | The Fund’s investment in mortgage related securities of the Federal Home Loan Mortgage Corporation, Federal National Mortgage Association and Government National Mortgage Association are interests in separate pools of mortgages. All separate investments in securities of each issuer which have the same coupon rate have been aggregated for the purpose of presentation in the Portfolio of Investments. |
| (d) | All or a portion of this security is held as collateral for open futures contracts. |
| ABS | Asset-Backed Securities |
| ARMs | Adjustable Rate Mortgages |
| FHLMC | Federal Home Loan Mortgage Corp. |
| FNMA | Federal National Mortgage Association |
| GNMA | Government National Mortgage Association |
| REITs | Real Estate Investment Trusts |
At September 30, 2009, open futures contracts purchased were as follows:
| | | | | | | | | | |
Futures | | Expiration
Date | | Contracts | | Notional
Value | | Unrealized
Appreciation |
10 Year U.S. Treasury Note | | 12/21/2009 | | 13 | | $ | 1,538,266 | | $ | 21,914 |
See accompanying notes to financial statements.
101
INDUSTRY SUMMARY AT SEPTEMBER 30, 2009 (Unaudited)
| | | |
Commercial Mortgage-Backed Securities | | 11.5 | % |
Banking | | 10.7 | |
Treasuries | | 9.5 | |
ABS Credit Card | | 4.5 | |
Mortgage Related | | 4.2 | |
Technology | | 4.0 | |
Wirelines | | 3.9 | |
Electric | | 3.7 | |
Food & Beverage | | 3.4 | |
REITs | | 2.6 | |
Non-Captive Diversified | | 2.3 | |
Entertainment | | 2.1 | |
Media Cable | | 2.1 | |
Pipelines | | 2.0 | |
Other Investments, less than 2% each | | 26.0 | |
Short-Term Investments | | 7.0 | |
| | | |
Total Investments | | 99.5 | |
Other assets less liabilities (including open Futures Contracts) | | 0.5 | |
| | | |
Net Assets | | 100.0 | % |
| | | |
See accompanying notes to financial statements.
102
PORTFOLIO OF INVESTMENTS – as of September 30, 2009
Loomis Sayles Investment Grade Fixed Income Fund
| | | | | | | | |
| | | | | Principal Amount (‡) | | Value (†) |
| | | | | | | | |
| | |
| BONDS AND NOTES – 92.9% of Net Assets | | | | | | |
| | | |
| NON-CONVERTIBLE BONDS – 91.5% | | | | | | | | |
| | | |
| ABS Car Loan – 0.9% | | | | | | | | |
ARG Funding Corp., Series 2005-2A, Class A5, 0.406%, 5/20/2011, 144A(b) | | | | $ | 4,645,000 | | $ | 4,645,012 |
| | | | | | | | |
| ABS Credit Card – 0.1% | | | | | | | | |
World Financial Network Credit Card, Series 2008-B, Class M, 7.800%, 10/15/2013 | | | | | 732,000 | | | 730,287 |
| | | | | | | | |
| ABS Home Equity – 0.0% | | | | | | | | |
Countrywide Asset-Backed Certificates, Series 2006-S1, Class A2, 5.549%, 8/25/2021 | | | | | 201,312 | | | 106,635 |
Countrywide Asset-Backed Certificates, Series 2006-S3, Class A3, 6.287%, 6/25/2021 | | | | | 414,324 | | | 123,102 |
| | | | | | | | |
| | | | | | | | 229,737 |
| | | | | | | | |
| ABS Other – 0.9% | | | | | | | | |
Community Program Loan Trust, Series 1987-A, Class A5, 4.500%, 4/01/2029 | | | | | 2,500,000 | | | 2,252,931 |
Sierra Receivables Funding Co., Series 2009-3A, Class A1, 7.620%, 7/20/2026, 144A | | | | | 2,345,000 | | | 2,345,000 |
| | | | | | | | |
| | | | | | | | 4,597,931 |
| | | | | | | | |
| Aerospace & Defense – 0.0% | | | | | | | | |
Boeing Capital Corp., 6.500%, 2/15/2012 | | | | | 165,000 | | | 181,711 |
| | | | | | | | |
| Airlines – 2.2% | | | | | | | | |
American Airlines, Inc., Pass Through Trust, Series 2009-1A, 10.375%, 7/02/2019 | | | | | 670,000 | | | 708,478 |
Continental Airlines, Inc., 9.000%, 7/08/2016 | | | | | 5,000,000 | | | 5,294,300 |
Continental Airlines, Inc., Series 2000-2, Class A-1, 7.707%, 10/02/2022 | | | | | 359,719 | | | 334,539 |
Delta Air Lines, Inc., Series 2007-1, Class B, 8.021%, 2/10/2024 | | | | | 2,148,150 | | | 1,697,038 |
Qantas Airways Ltd., 6.050%, 4/15/2016, 144A | | | | | 3,455,000 | | | 3,397,723 |
| | | | | | | | |
| | | | | | | | 11,432,078 |
| | | | | | | | |
| Automotive – 0.6% | | | | | | | | |
Cummins, Inc., 5.650%, 3/01/2098 | | | | | 1,295,000 | | | 785,094 |
Ford Motor Co., 6.375%, 2/01/2029 | | | | | 2,665,000 | | | 1,918,800 |
Ford Motor Credit Co. LLC, 8.000%, 12/15/2016 | | | | | 300,000 | | | 278,330 |
| | | | | | | | |
| | | | | | | | 2,982,224 |
| | | | | | | | |
| Banking – 7.3% | | | | | | | | |
Associates Corp. of North America, 6.950%, 11/01/2018 | | | | | 1,120,000 | | | 1,095,777 |
BAC Capital Trust VI, 5.625%, 3/08/2035 | | | | | 1,045,000 | | | 810,283 |
Bank of America Corp., 5.420%, 3/15/2017 | | | | | 230,000 | | | 219,755 |
Barclays Financial LLC, 4.060%, 9/16/2010, 144A | | KRW | | | 940,000,000 | | | 805,452 |
Barclays Financial LLC, 4.160%, 2/22/2010, 144A | | THB | | | 70,000,000 | | | 2,125,561 |
Barclays Financial LLC, 4.460%, 9/23/2010, 144A | | KRW | | | 1,950,000,000 | | | 1,676,843 |
Barclays Financial LLC, EMTN, 4.100%, 3/22/2010, 144A | | THB | | | 17,000,000 | | | 517,276 |
Bear Stearns Co., Inc. (The), 5.550%, 1/22/2017 | | | | | 230,000 | | | 232,581 |
BNP Paribas SA, EMTN, Zero Coupon, 6/13/2011, 144A | | IDR | | | 7,484,000,000 | | | 653,079 |
Citibank NA, 15.000%, 7/02/2010, 144A | | BRL | | | 4,000,000 | | | 2,352,088 |
See accompanying notes to financial statements.
103
| | | | | | | | |
| | | | | Principal Amount (‡) | | Value (†) |
| | | | | | | | |
| | | |
| BONDS AND NOTES – continued | | | | | | | | |
| | | |
| Banking – continued | | | | | | | | |
Citigroup, Inc., 5.850%, 12/11/2034 | | | | $ | 270,000 | | $ | 231,757 |
Citigroup, Inc., 5.875%, 5/29/2037 | | | | | 370,000 | | | 322,604 |
Citigroup, Inc., 6.125%, 8/25/2036 | | | | | 145,000 | | | 124,439 |
Goldman Sachs Group, Inc. (The), 6.150%, 4/01/2018 | | | | | 870,000 | | | 915,164 |
Goldman Sachs Group, Inc. (The), 6.750%, 10/01/2037 | | | | | 2,420,000 | | | 2,497,515 |
JPMorgan Chase & Co., EMTN, Zero Coupon, 3/28/2011 | | IDR | | | 8,972,574,000 | | | 806,093 |
JPMorgan Chase & Co., Zero Coupon, 3/28/2011, 144A | | IDR | | | 5,376,000,000 | | | 482,978 |
JPMorgan Chase & Co., Zero Coupon, 5/17/2010, 144A | | BRL | | | 8,035,000 | | | 4,271,485 |
JPMorgan Chase London, EMTN, Zero Coupon, 10/21/2010, 144A | | IDR | | | 9,533,078,500 | | | 906,259 |
JPMorgan Chase & Co., 4.750%, 5/01/2013 | | | | | 60,000 | | | 63,522 |
Merrill Lynch & Co., Inc., 6.110%, 1/29/2037 | | | | | 2,870,000 | | | 2,729,823 |
Merrill Lynch & Co., Inc., Series C, MTN, 5.000%, 1/15/2015 | | | | | 235,000 | | | 237,281 |
Merrill Lynch & Co., Inc., Series C, MTN, 6.050%, 6/01/2034 | | | | | 1,700,000 | | | 1,587,377 |
Morgan Stanley, 4.750%, 4/01/2014 | | | | | 3,550,000 | | | 3,523,801 |
Morgan Stanley, 5.375%, 10/15/2015 | | | | | 1,300,000 | | | 1,341,900 |
Morgan Stanley, EMTN, 5.450%, 1/09/2017 | | | | | 260,000 | | | 260,363 |
Morgan Stanley, Series F, MTN, 5.550%, 4/27/2017 | | | | | 1,100,000 | | | 1,095,829 |
Morgan Stanley, Series F, MTN, 5.950%, 12/28/2017 | | | | | 695,000 | | | 707,610 |
National City Bank of Indiana, 4.250%, 7/01/2018 | | | | | 420,000 | | | 369,250 |
Standard Chartered Bank, 6.400%, 9/26/2017, 144A | | | | | 300,000 | | | 312,153 |
Standard Chartered PLC, 5.500%, 11/18/2014, 144A | | | | | 4,500,000 | | | 4,809,474 |
Washington Mutual Finance Corp., 6.875%, 5/15/2011 | | | | | 135,000 | | | 140,703 |
| | | | | | | | |
| | | | | | | | 38,226,075 |
| | | | | | | | |
| Brokerage – 0.7% | | | | | | | | |
Jefferies Group, Inc., 8.500%, 7/15/2019 | | | | | 3,450,000 | | | 3,651,370 |
| | | | | | | | |
| Building Materials – 1.2% | | | | | | | | |
Masco Corp., 0.600%, 3/12/2010(b) | | | | | 1,085,000 | | | 1,067,765 |
Masco Corp., 4.800%, 6/15/2015 | | | | | 555,000 | | | 509,312 |
Masco Corp., 5.850%, 3/15/2017 | | | | | 655,000 | | | 604,072 |
Masco Corp., 6.125%, 10/03/2016 | | | | | 1,695,000 | | | 1,606,672 |
Masco Corp., 6.500%, 8/15/2032 | | | | | 200,000 | | | 161,823 |
Masco Corp., 7.750%, 8/01/2029 | | | | | 375,000 | | | 339,056 |
Owens Corning, Inc., 6.500%, 12/01/2016 | | | | | 815,000 | | | 795,189 |
Owens Corning, Inc., 7.000%, 12/01/2036 | | | | | 1,400,000 | | | 1,147,137 |
| | | | | | | | |
| | | | | | | | 6,231,026 |
| | | | | | | | |
| Chemicals – 2.1% | | | | | | | | |
Chevron Phillips Chemical Co. LLC, 8.250%, 6/15/2019, 144A | | | | | 4,450,000 | | | 5,374,323 |
Lubrizol Corp., 6.500%, 10/01/2034 | | | | | 2,255,000 | | | 2,355,063 |
See accompanying notes to financial statements.
104
PORTFOLIO OF INVESTMENTS – as of September 30, 2009
Loomis Sayles Investment Grade Fixed Income Fund – continued
| | | | | | | | |
| | | | | Principal Amount (‡) | | Value (†) |
| | | | | | | | |
| | | |
| BONDS AND NOTES – continued | | | | | | | | |
| | | |
| Chemicals – continued | | | | | | | | |
Methanex Corp., 6.000%, 8/15/2015 | | | | $ | 980,000 | | $ | 832,729 |
PPG Industries, Inc., 6.650%, 3/15/2018 | | | | | 2,410,000 | | | 2,627,536 |
| | | | | | | | |
| | | | | | | | 11,189,651 |
| | | | | | | | |
| Collateralized Mortgage Obligations – 0.2% | | | | | | | | |
CS First Boston Mortgage Securities Corp., Series 2005-7, Class 3A1, 5.000%, 8/25/2020 | | | | | 291,159 | | | 249,943 |
Federal Home Loan Mortgage Corp., Series 2912, Class EH, 5.500%, 1/15/2035 | | | | | 675,000 | | | 715,922 |
| | | | | | | | |
| | | | | | | | 965,865 |
| | | | | | | | |
| Commercial Mortgage-Backed Securities – 4.4% | | | | | | |
Banc of America Commercial Mortgage, Inc., Series 2005-6, Class A4, 5.179%, 9/10/2047(b) | | | | | 160,000 | | | 155,663 |
Banc of America Commercial Mortgage, Inc., Series 2006-1, Class A2, 5.334%, 9/10/2045 | | | | | 220,000 | | | 222,382 |
Bear Stearns Commercial Mortgage Securities, Series 2005-PW10, Class A2, 5.270%, 12/11/2040 | | | | | 280,000 | | | 280,498 |
Bear Stearns Commercial Mortgage Securities, Series 2006-PW13, Class A4, 5.540%, 9/11/2041 | | | | | 600,000 | | | 572,697 |
Bear Stearns Commercial Mortgage Securities, Series 2006-T24, Class A4, 5.537%, 10/12/2041 | | | | | 360,000 | | | 343,228 |
Bear Stearns Commercial Mortgage Securities, Series 2007-PW15, Class A4, 5.331%, 2/11/2044 | | | | | 600,000 | | | 540,106 |
Bear Stearns Commercial Mortgage Securities, Series 2007-PW16, Class A4, 5.719%, 6/11/2040(b) | | | 407,000 | | | 371,775 |
Citigroup/Deutsche Bank Commercial Mortgage Trust, Series 2006-CD2, Class A2, 5.408%, 1/15/2046 | | | | | 155,000 | | | 156,036 |
Commercial Mortgage Pass Through Certificates, Series 2006-C7, Class A4, 5.768%, 6/10/2046(b) | | | | | 480,000 | | | 459,176 |
Credit Suisse Mortgage Capital Certificates, Series 2007-C3, Class A4, 5.723%, 6/15/2039(b) | | | | | 3,525,000 | | | 2,782,857 |
Credit Suisse Mortgage Capital Certificates, Series 2007-C4, Class A4, 5.809%, 9/15/2039(b) | | | | | 2,030,000 | | | 1,608,232 |
Credit Suisse Mortgage Capital Certificates, Series 2007-C5, Class A4, 5.695%, 9/15/2040 | | | | | 685,000 | | | 539,851 |
Greenwich Capital Commercial Funding Corp., Series 2005-GG5, Class A2, 5.117%, 4/10/2037 | | | | | 485,000 | | | 483,815 |
Greenwich Capital Commercial Funding Corp., Series 2007-GG11, Class A4, 5.736%, 12/10/2049 | | | | | 1,500,000 | | | 1,350,654 |
Greenwich Capital Commercial Funding Corp., Series 2007-GG9, Class A4, 5.444%, 3/10/2039 | | | | | 1,003,000 | | | 888,872 |
GS Mortgage Securities Corp. II, Series 2005-GG4, Class A4A, 4.751%, 7/10/2039 | | | | | 805,000 | | | 754,685 |
GS Mortgage Securities Corp. II, Series 2006-GG8, Class A4, 5.560%, 11/10/2039 | | | | | 350,000 | | | 307,597 |
JPMorgan Chase Commercial Mortgage Securities Corp., Series 2006-LDP6, Class A4, 5.475%, 4/15/2043 | | | | | 1,180,000 | | | 1,104,026 |
JPMorgan Chase Commercial Mortgage Securities Corp., Series 2006-LDP7, Class A4, 5.875%, 4/15/2045(b) | | | | | 1,100,000 | | | 1,022,960 |
JPMorgan Chase Commercial Mortgage Securities Corp., Series 2007-LD11, Class A4, 5.818%, 6/15/2049(b) | | | | | 4,055,000 | | | 3,544,355 |
JPMorgan Chase Commercial Mortgage Securities Corp., Series 2007-LDPX, Class A3, 5.420%, 1/15/2049 | | | | | 1,405,000 | | | 1,184,343 |
See accompanying notes to financial statements.
105
| | | | | | | | |
| | | | | Principal Amount (‡) | | Value (†) |
| | | | | | | | |
| | | |
| BONDS AND NOTES – continued | | | | | | | | |
| | |
Commercial Mortgage-Backed
Securities – continued | | | | | | |
LB-UBS Commercial Mortgage Trust, Series 2005-C3, Class A5, 4.739%, 7/15/2030 | | | | $ | 480,000 | | $ | 462,347 |
LB-UBS Commercial Mortgage Trust, Series 2006-C4, Class A4,
5.882%, 6/15/2038(b) | | | | | 380,000 | | | 359,803 |
LB-UBS Commercial Mortgage Trust, Series 2006-C6, Class A4, 5.372%, 9/15/2039 | | | | | 390,000 | | | 355,162 |
LB-UBS Commercial Mortgage Trust, Series 2007-C2, Class A2, 5.303%, 2/15/2040 | | | | | 915,000 | | | 905,268 |
Merrill Lynch/Countrywide Commercial Mortgage Trust, Series 2006-1, Class A2, 5.439%, 2/12/2039 | | | | | 335,000 | | | 337,498 |
Merrill Lynch/Countrywide Commercial Mortgage Trust, Series 2006-2, Class A4, 5.909%, 6/12/2046(b) | | | | | 235,000 | | | 221,057 |
Morgan Stanley Capital I, Series 2005-HQ6, Class A4A, 4.989%, 8/13/2042 | | | | | 350,000 | | | 340,584 |
Morgan Stanley Capital I, Series 2005-T19, Class A4A, 4.890%, 6/12/2047 | | | | | 425,000 | | | 418,000 |
Morgan Stanley Capital I, Series 2006-HQ10, Class A4, 5.328%, 11/12/2041 | | | | | 300,000 | | | 272,822 |
Morgan Stanley Capital I, Series 2008-T29, Class A4, 6.280%, 1/11/2043(b) | | | | | 800,000 | | | 776,030 |
Wachovia Bank Commercial Mortgage Trust, Series 2006-C29, Class A4, 5.308%, 11/15/2048 | | | | | 200,000 | | | 180,085 |
| | | | | | | | |
| | | | | | | | 23,302,464 |
| | | | | | | | |
| Construction Machinery – 0.1% | | | | | | | | |
Caterpillar Financial Services Corp., MTN, 6.125%, 2/17/2014 | | | | | 270,000 | | | 296,006 |
| | | | | | | | |
| Consumer Cyclical Services – 1.6% | | | | | | | | |
Western Union Co. (The), 5.930%, 10/01/2016 | | | | | 3,965,000 | | | 4,296,549 |
Western Union Co. (The), 6.500%, 2/26/2014 | | | | | 4,000,000 | | | 4,368,600 |
| | | | | | | | |
| | | | | | | | 8,665,149 |
| | | | | | | | |
| Consumer Products – 0.7% | | | | | | | | |
Hasbro, Inc., 6.600%, 7/15/2028 | | | | | 605,000 | | | 575,605 |
Koninklijke (Royal) Philips Electronics N.V., 6.875%, 3/11/2038 | | | | | 1,945,000 | | | 2,274,240 |
Snap-on, Inc., 6.700%, 3/01/2019 | | | | | 780,000 | | | 860,621 |
| | | | | | | | |
| | | | | | | | 3,710,466 |
| | | | | | | | |
| Distributors – 1.1% | | | | | | | | |
EQT Corp., 8.125%, 6/01/2019 | | | | | 3,000,000 | | | 3,424,110 |
Equitable Resources, Inc., 6.500%, 4/01/2018 | | | | | 2,150,000 | | | 2,197,885 |
| | | | | | | | |
| | | | | | | | 5,621,995 |
| | | | | | | | |
| Diversified Manufacturing – 0.8% | | | | | | | | |
Ingersoll-Rand Global Holding Co. Ltd.,
6.875%, 8/15/2018 | | | | | 545,000 | | | 584,706 |
Textron, Inc., 3.875%, 3/11/2013 | | EUR | | | 700,000 | | | 945,849 |
Textron, Inc., 6.200%, 3/15/2015 | | | | | 1,275,000 | | | 1,280,048 |
Textron, Inc., 7.250%, 10/01/2019 | | | | | 860,000 | | | 871,471 |
Textron, Inc., EMTN, 6.625%, 4/07/2020 | | GBP | | | 540,000 | | | 716,291 |
| | | | | | | | |
| | | | | | | | 4,398,365 |
| | | | | | | | |
See accompanying notes to financial statements.
106
PORTFOLIO OF INVESTMENTS – as of September 30, 2009
Loomis Sayles Investment Grade Fixed Income Fund – continued
| | | | | | | | |
| | | | | Principal Amount (‡) | | Value (†) |
| | | | | | | | |
| | | |
| BONDS AND NOTES – continued | | | | | | | | |
| | | |
| Electric – 2.6% | | | | | | | | |
AmerenEnergy Generating Co., Series H, 7.000%, 4/15/2018 | | | | $ | 2,800,000 | | $ | 2,834,081 |
Baltimore Gas & Electric Co., 5.200%, 6/15/2033 | | | | | 500,000 | | | 452,698 |
Bruce Mansfield Unit, 6.850%, 6/01/2034(c) | | | | | 1,537,235 | | | 1,501,233 |
Cleveland Electric Illuminating Co. (The), 5.700%, 4/01/2017 | | | | | 1,185,000 | | | 1,246,932 |
Cleveland Electric Illuminating Co. (The), 5.950%, 12/15/2036 | | | | | 960,000 | | | 928,665 |
Commonwealth Edison Co., 4.700%, 4/15/2015 | | | | | 555,000 | | | 579,125 |
Commonwealth Edison Co., 4.750%, 12/01/2011(c) | | | | | 31,000 | | | 30,953 |
Empresa Nacional de Electricidad SA (Endesa-Chile), 7.875%, 2/01/2027 | | | | | 1,000,000 | | | 1,108,405 |
Illinois Power Co., 6.250%, 4/01/2018 | | | | | 3,385,000 | | | 3,636,262 |
NiSource Finance Corp., 6.150%, 3/01/2013 | | | | | 195,000 | | | 204,198 |
NiSource Finance Corp., 6.400%, 3/15/2018 | | | | | 1,255,000 | | | 1,252,661 |
| | | | | | | | |
| | | | | | | | 13,775,213 |
| | | | | | | | |
| Entertainment – 0.6% | | | | | | | | |
Time Warner, Inc., 6.625%, 5/15/2029 | | | | | 870,000 | | | 892,697 |
Time Warner, Inc., 6.950%, 1/15/2028 | | | | | 375,000 | | | 395,364 |
Time Warner, Inc., 7.625%, 4/15/2031 | | | | | 245,000 | | | 274,581 |
Time Warner, Inc., 7.700%, 5/01/2032 | | | | | 160,000 | | | 180,926 |
Viacom, Inc., Class B, 6.875%, 4/30/2036 | | | | | 1,325,000 | | | 1,399,723 |
| | | | | | | | |
| | | | | | | | 3,143,291 |
| | | | | | | | |
| Financial Other – 0.5% | | | | | | | | |
National Life Insurance Co., 10.500%, 9/15/2039, 144A | | | | | 2,500,000 | | | 2,546,050 |
| | | | | | | | |
| Food & Beverage – 1.6% | | | | | | | | |
Anheuser-Busch Cos., Inc., 5.375%, 11/15/2014, 144A | | | | | 2,955,000 | | | 3,152,956 |
Anheuser-Busch Cos., Inc., 5.950%, 1/15/2033 | | | | | 995,000 | | | 1,017,678 |
Anheuser-Busch Cos., Inc., 6.450%, 9/01/2037 | | | | | 1,270,000 | | | 1,383,373 |
Cia Brasileira de Bebidas, 8.750%, 9/15/2013 | | | | | 1,025,000 | | | 1,199,250 |
Corn Products International, Inc., 6.625%, 4/15/2037 | | | | | 500,000 | | | 504,740 |
Kraft Foods, Inc., 6.250%, 6/01/2012 | | | | | 210,000 | | | 228,362 |
Kraft Foods, Inc., 6.500%, 11/01/2031 | | | | | 960,000 | | | 999,042 |
| | | | | | | | |
| | | | | | | | 8,485,401 |
| | | | | | | | |
| Government Owned – No Guarantee – 1.2% | | | | | | | | |
Abu Dhabi National Energy Co., 7.250%, 8/01/2018, 144A | | | | | 2,565,000 | | | 2,747,569 |
DP World Ltd., 6.850%, 7/02/2037, 144A | | | | | 3,800,000 | | | 3,342,058 |
| | | | | | | | |
| | | | | | | | 6,089,627 |
| | | | | | | | |
| Health Insurance – 0.5% | | | | | | | | |
CIGNA Corp., 6.350%, 3/15/2018 | | | | | 2,515,000 | | | 2,521,831 |
CIGNA Corp., 7.875%, 5/15/2027 | | | | | 20,000 | | | 19,314 |
CIGNA Corp., 8.500%, 5/01/2019 | | | | | 45,000 | | | 51,645 |
| | | | | | | | |
| | | | | | | | 2,592,790 |
| | | | | | | | |
| Healthcare – 1.0% | | | | | | | | |
Covidien International Finance SA, 6.000%, 10/15/2017 | | | | | 900,000 | | | 998,482 |
Express Scripts, Inc., 6.250%, 6/15/2014 | | | | | 1,115,000 | | | 1,225,324 |
Express Scripts, Inc., 7.250%, 6/15/2019 | | | | | 670,000 | | | 786,882 |
HCA, Inc., 5.750%, 3/15/2014 | | | | | 1,020,000 | | | 900,150 |
HCA, Inc., 6.250%, 2/15/2013 | | | | | 195,000 | | | 186,225 |
See accompanying notes to financial statements.
107
| | | | | | | | |
| | | | | Principal Amount (‡) | | Value (†) |
| | | | | | | | |
| | | |
| BONDS AND NOTES – continued | | | | | | | | |
| | | |
| Healthcare – continued | | | | | | | | |
HCA, Inc., 6.375%, 1/15/2015 | | | | $ | 95,000 | | $ | 84,550 |
HCA, Inc., 6.500%, 2/15/2016 | | | | | 55,000 | | | 48,813 |
HCA, Inc., 6.750%, 7/15/2013 | | | | | 30,000 | | | 28,725 |
HCA, Inc., 7.050%, 12/01/2027 | | | | | 100,000 | | | 75,842 |
HCA, Inc., 7.190%, 11/15/2015 | | | | | 190,000 | | | 175,986 |
HCA, Inc., 7.500%, 12/15/2023 | | | | | 75,000 | | | 60,545 |
HCA, Inc., 7.690%, 6/15/2025 | | | | | 175,000 | | | 142,110 |
HCA, Inc., 8.360%, 4/15/2024 | | | | | 305,000 | | | 248,190 |
HCA, Inc., MTN, 7.580%, 9/15/2025 | | | | | 10,000 | | | 8,090 |
HCA, Inc., MTN, 7.750%, 7/15/2036 | | | | | 305,000 | | | 239,057 |
| | | | | | | | |
| | | | | | | | 5,208,971 |
| | | | | | | | |
| Home Construction – 1.7% | | | | | | | | |
Centex Corp., 5.250%, 6/15/2015 | | | | | 380,000 | | | 375,250 |
Lennar Corp., Series B, 5.600%, 5/31/2015 | | | | | 1,250,000 | | | 1,153,125 |
Lennar Corp., Series B, 6.500%, 4/15/2016 | | | | | 770,000 | | | 723,800 |
Pulte Homes, Inc., 5.200%, 2/15/2015 | | | | | 1,265,000 | | | 1,201,750 |
Pulte Homes, Inc., 6.000%, 2/15/2035 | | | | | 3,340,000 | | | 2,521,700 |
Pulte Homes, Inc., 6.375%, 5/15/2033 | | | | | 1,455,000 | | | 1,120,350 |
Toll Brothers Finance Corp., 5.150%, 5/15/2015 | | | | | 1,725,000 | | | 1,658,767 |
| | | | | | | | |
| | | | | | | | 8,754,742 |
| | | | | | | | |
| Hybrid ARMs – 0.2% | | | | | | | | |
FNMA, 5.723%, 9/01/2036(b) | | | | | 304,985 | | | 320,915 |
FNMA, 6.026%, 2/01/2037(b) | | | | | 345,942 | | | 367,865 |
Morgan Stanley Mortgage Loan Trust, Series 2005-3AR, Class 5A, 5.585%, 7/25/2035(b) | | | | | 378,035 | | | 299,319 |
Wells Fargo Mortgage Backed Securities Trust, Series 2005-AR16, Class 3A2, 4.113%, 10/25/2035(b) | | | | | 249,008 | | | 224,099 |
| | | | | | | | |
| | | | | | | | 1,212,198 |
| | | | | | | | |
| Independent Energy – 1.2% | | | | | | | | |
Anadarko Petroleum Corp., 5.950%, 9/15/2016 | | | | | 1,260,000 | | | 1,335,044 |
Anadarko Petroleum Corp., 6.450%, 9/15/2036 | | | | | 1,320,000 | | | 1,362,891 |
Questar Market Resources, Inc., 6.050%, 9/01/2016 | | | | | 125,000 | | | 125,879 |
Questar Market Resources, Inc., 6.800%, 4/01/2018 | | | | | 3,365,000 | | | 3,449,771 |
Talisman Energy, Inc., 5.850%, 2/01/2037 | | | | | 15,000 | | | 14,428 |
| | | | | | | | |
| | | | | | | | 6,288,013 |
| | | | | | | | |
| Local Authorities – 1.5% | | | | | | | | |
Manitoba (Province of), GMTN, 6.375%, 9/01/2015 | | NZD | | | 4,635,000 | | | 3,301,119 |
Province of Alberta, 5.930%, 9/16/2016 | | CAD | | | 369,972 | | | 386,265 |
Quebec Province, Series QC, 6.750%, 11/09/2015 | | NZD | | | 1,185,000 | | | 862,344 |
Queensland Treasury Corp., Series 11G, 6.000%, 6/14/2011 | | AUD | | | 1,735,000 | | | 1,564,690 |
Virginia Tobacco Settlement Financing Corp., Series A-1, 6.706%, 6/01/2046(c) | | | | | 2,815,000 | | | 2,010,670 |
| | | | | | | | |
| | | | | | | | 8,125,088 |
| | | | | | | | |
| Media Cable – 1.7% | | | | | | | | |
Comcast Corp., 5.650%, 6/15/2035 | | | | | 2,005,000 | | | 1,939,174 |
See accompanying notes to financial statements.
108
PORTFOLIO OF INVESTMENTS – as of September 30, 2009
Loomis Sayles Investment Grade Fixed Income Fund – continued
| | | | | | | | |
| | | | | Principal Amount (‡) | | Value (†) |
| | | | | | | | |
| | | |
| BONDS AND NOTES – continued | | | | | | | | |
| | | |
| Media Cable – continued | | | | | | | | |
Comcast Corp., 6.450%, 3/15/2037 | | | | $ | 500,000 | | $ | 529,444 |
Comcast Corp., 6.500%, 11/15/2035 | | | | | 1,570,000 | | | 1,672,972 |
Comcast Corp., 6.950%, 8/15/2037 | | | | | 1,925,000 | | | 2,148,612 |
Time Warner Cable, Inc., 6.750%, 7/01/2018 | | | | | 2,500,000 | | | 2,761,900 |
| | | | | | | | |
| | | | | | | | 9,052,102 |
| | | | | | | | |
| Media Non-Cable – 0.6% | | | | | | | | |
News America Holdings, 8.150%, 10/17/2036 | | | | | 240,000 | | | 265,145 |
News America, Inc., 6.200%, 12/15/2034 | | | | | 950,000 | | | 934,683 |
News America, Inc., 6.400%, 12/15/2035 | | | | | 1,980,000 | | | 1,997,381 |
| | | | | | | | |
| | | | | | | | 3,197,209 |
| | | | | | | | |
| Metals & Mining – 0.7% | | | | | | | | |
ArcelorMittal, 9.850%, 6/01/2019 | | | | | 700,000 | | | 827,963 |
ArcelorMittal USA Partnership, 9.750%, 4/01/2014 | | | | | 140,000 | | | 146,650 |
Rio Tinto Finance (USA) Ltd., 8.950%, 5/01/2014 | | | | | 2,232,000 | | | 2,634,177 |
Teck Cominco Ltd., 7.000%, 9/15/2012 | | | | | 100,000 | | | 102,750 |
| | | | | | | | |
| | | | | | | | 3,711,540 |
| | | | | | | | |
| Mortgage Related – 1.7% | | | | | | | | |
Federal National Mortgage Association, 7.000%, 4/25/2020 | | | | | 36,551 | | | 39,961 |
FHLMC, 4.000%, 7/01/2019 | | | | | 269,639 | | | 280,454 |
FHLMC, 4.500%, 4/01/2019 | | | | | 543,019 | | | 571,585 |
FHLMC, 5.000%, 5/01/2034 | | | | | 163,811 | | | 170,182 |
FHLMC, 5.500%, with various maturities from 2033 to 2037(g) | | | | | 844,124 | | | 886,961 |
FHLMC, 6.000%, with various maturities from 2020 to 2035(g) | | | | | 524,655 | | | 559,133 |
FHLMC, 10.000%, with various maturities to
2018(g) | | | | | 5,217 | | | 5,851 |
FNMA, 4.000%, 1/01/2020 | | | | | 158,522 | | | 164,880 |
FNMA, 4.500%, with various maturities to 2035(g) | | | | | 551,676 | | | 562,177 |
FNMA, 5.000%, with various maturities from 2018 to 2035(g) | | | | | 1,656,739 | | | 1,725,392 |
FNMA, 5.500%, with various maturities from 2016 to 2036(g) | | | | | 2,379,165 | | | 2,502,495 |
FNMA, 6.000%, with various maturities from 2018 to 2033(g) | | | | | 820,389 | | | 875,991 |
FNMA, 6.500%, with various maturities from 2011 to 2033(g) | | | | | 322,350 | | | 347,355 |
GNMA, 6.500%, 2/20/2028 | | | | | 113,777 | | | 122,959 |
GNMA, 7.000%, 11/20/2025 | | | | | 5,016 | | | 5,481 |
GNMA, 10.000%, with various maturities to 2018(g) | | | | | 66,943 | | | 74,750 |
| | | | | | | | |
| | | | | | | | 8,895,607 |
| | | | | | | | |
| Non-Captive Consumer – 1.0% | | | | | | | | |
American General Finance Corp., Series H, MTN, 5.375%, 10/01/2012 | | | | | 45,000 | | | 34,780 |
American General Finance Corp., Series J, MTN, 6.900%, 12/15/2017 | | | | | 2,815,000 | | | 1,968,758 |
HSBC Finance Corp., 8.000%, 7/15/2010 | | | | | 205,000 | | | 214,336 |
SLM Corp., Series A, MTN, 5.000%, 4/15/2015 | | | | | 70,000 | | | 52,158 |
SLM Corp., Series A, MTN, 5.375%, 1/15/2013 | | | | | 680,000 | | | 566,955 |
See accompanying notes to financial statements.
109
| | | | | | | |
| | | | | Principal Amount (‡) | | Value (†) |
| | | | | | | |
| | | |
| BONDS AND NOTES – continued | | | | | | | |
| | | |
| Non-Captive Consumer – continued | | | | | | | |
SLM Corp., Series A, MTN,
6.500%, 6/15/2010(c)(d) | | NZD | | 970,000 | | $ | 656,624 |
SLM Corp., Series A, MTN, 8.450%, 6/15/2018 | | | | 2,385,000 | | | 1,902,038 |
| | | | | | | |
| | | | | | | 5,395,649 |
| | | | | | | |
| Non-Captive Diversified – 2.4% | | | | | | | |
CIT Group, Inc., 5.400%, 2/13/2012 | | | | 75,000 | | | 49,224 |
CIT Group, Inc., 5.400%, 1/30/2016 | | | | 19,000 | | | 11,978 |
CIT Group, Inc., 5.800%, 7/28/2011 | | | | 240,000 | | | 163,230 |
CIT Group, Inc., 5.800%, 10/01/2036 | | | | 185,000 | | | 110,943 |
CIT Group, Inc., 5.850%, 9/15/2016 | | | | 5,000 | | | 3,151 |
CIT Group, Inc., EMTN, 4.650%, 9/19/2016 | | EUR | | 350,000 | | | 294,499 |
CIT Group, Inc., GMTN, 5.000%, 2/13/2014 | | | | 102,000 | | | 65,155 |
CIT Group, Inc., GMTN, 5.000%, 2/01/2015 | | | | 17,000 | | | 10,888 |
CIT Group, Inc., MTN, 5.125%, 9/30/2014 | | | | 155,000 | | | 99,296 |
CIT Group, Inc., Series A, GMTN, 6.000%, 4/01/2036 | | | | 280,000 | | | 161,767 |
GATX Corp., 4.750%, 10/01/2012 | | | | 2,100,000 | | | 2,112,762 |
General Electric Capital Australia Funding, EMTN, 8.000%, 2/13/2012 | | AUD | | 670,000 | | | 608,069 |
General Electric Capital Corp., 5.625%, 5/01/2018 | | | | 65,000 | | | 64,688 |
General Electric Capital Corp., MTN, 5.875%, 1/14/2038 | | | | 300,000 | | | 275,124 |
General Electric Capital Corp., Series A, EMTN, 6.750%, 9/26/2016 | | NZD | | 470,000 | | | 325,637 |
General Electric Capital Corp., Series A, GMTN, 7.625%, 12/10/2014 | | NZD | | 1,405,000 | | | 1,029,275 |
General Electric Capital Corp., Series A, MTN, 0.809%, 5/13/2024(b) | | | | 655,000 | | | 456,815 |
General Electric Capital Corp., Series A, MTN, 4.875%, 3/04/2015 | | | | 2,230,000 | | | 2,298,430 |
General Electric Capital Corp., Series A, MTN, 6.500%, 9/28/2015 | | NZD | | 5,650,000 | | | 3,901,797 |
GMAC, Inc., 6.000%, 12/15/2011, 144A | | | | 763,000 | | | 705,775 |
GMAC, Inc., 7.500%, 12/31/2013, 144A | | | | 41,000 | | | 35,875 |
GMAC, Inc., 8.000%, 12/31/2018, 144A | | | | 97,000 | | | 73,235 |
| | | | | | | |
| | | | | | | 12,857,613 |
| | | | | | | |
| Oil Field Services – 0.3% | | | | | | | |
Rowan Cos., Inc., 7.875%, 8/01/2019 | | | | 1,090,000 | | | 1,171,946 |
Weatherford International Ltd., 6.500%, 8/01/2036 | | | | 235,000 | | | 239,486 |
Weatherford International Ltd., 6.800%, 6/15/2037 | | | | 105,000 | | | 110,403 |
| | | | | | | |
| | | | | | | 1,521,835 |
| | | | | | | |
| Paper – 0.9% | | | | | | | |
Georgia-Pacific LLC, 7.250%, 6/01/2028 | | | | 1,500,000 | | | 1,335,000 |
International Paper Co., 5.250%, 4/01/2016 | | | | 1,530,000 | | | 1,530,753 |
International Paper Co., 8.700%, 6/15/2038 | | | | 1,440,000 | | | 1,596,315 |
Westvaco Corp., 8.200%, 1/15/2030 | | | | 200,000 | | | 196,173 |
| | | | | | | |
| | | | | | | 4,658,241 |
| | | | | | | |
| Pharmaceuticals – 1.4% | | | | | | | |
Elan Financial PLC, 7.750%, 11/15/2011 | | | | 60,000 | | | 61,125 |
See accompanying notes to financial statements.
110
PORTFOLIO OF INVESTMENTS – as of September 30, 2009
Loomis Sayles Investment Grade Fixed Income Fund – continued
| | | | | | | | |
| | | | | Principal Amount (‡) | | Value (†) |
| | | | | | | | |
| | | |
| BONDS AND NOTES – continued | | | | | | | | |
| | | |
| Pharmaceuticals – continued | | | | | | | | |
Elan Financial PLC, 8.875%, 12/01/2013 | | | | $ | 170,000 | | $ | 171,275 |
Roche Holdings, Inc., 5.000%, 3/01/2014, 144A | | | | | 6,500,000 | | | 7,026,994 |
| | | | | | | | |
| | | | | | | | 7,259,394 |
| | | | | | | | |
| Pipelines – 3.9% | | | | | | | | |
CenterPoint Energy Resources Corp., 6.250%, 2/01/2037 | | | | | 335,000 | | | 322,297 |
DCP Midstream LP, 6.450%, 11/03/2036, 144A | | | | | 635,000 | | | 575,139 |
El Paso Corp., 6.950%, 6/01/2028 | | | | | 350,000 | | | 291,150 |
Enterprise Products Operating LLP, 6.300%, 9/15/2017 | | | | | 680,000 | | | 732,416 |
Florida Gas Transmission Co., 7.900%, 5/15/2019, 144A | | | | | 200,000 | | | 238,584 |
Kinder Morgan Energy Partners LP, 5.125%, 11/15/2014 | | | | | 145,000 | | | 150,665 |
Kinder Morgan Energy Partners LP, 5.950%, 2/15/2018 | | | | | 5,300,000 | | | 5,544,425 |
Maritimes & Northeast Pipeline LLC, 7.500%, 5/31/2014, 144A(c) | | | | | 4,000,000 | | | 4,207,120 |
NGPL PipeCo LLC, 6.514%, 12/15/2012, 144A | | | | | 3,630,000 | | | 3,982,484 |
NGPL PipeCo LLC, 7.119%, 12/15/2017, 144A | | | | | 965,000 | | | 1,079,740 |
Panhandle Eastern Pipeline Co., 8.125%, 6/01/2019 | | | | | 2,000,000 | | | 2,330,356 |
Southern Natural Gas Co., 5.900%, 4/01/2017, 144A | | | | | 810,000 | | | 834,218 |
Spectra Energy Capital LLC, 5.500%, 3/01/2014 | | | | | 230,000 | | | 240,116 |
| | | | | | | | |
| | | | | | | | 20,528,710 |
| | | | | | | | |
| Property & Casualty Insurance – 1.5% | | | | | | | | |
Allstate Corp., 5.950%, 4/01/2036 | | | | | 470,000 | | | 498,630 |
Marsh & McLennan Cos., Inc., 5.375%, 7/15/2014 | | | | | 65,000 | | | 67,643 |
Marsh & McLennan Cos., Inc., 5.750%, 9/15/2015 | | | | | 1,842,000 | | | 1,942,400 |
Marsh & McLennan Cos., Inc., 5.875%, 8/01/2033 | | | | | 2,465,000 | | | 2,265,419 |
Marsh & McLennan Cos., Inc., 9.250%, 4/15/2019 | | | | | 1,390,000 | | | 1,741,864 |
MBIA Insurance Corp., (fixed rate to 1/15/2013, variable rate thereafter), 14.000%, 1/15/2033, 144A | | | | | 60,000 | | | 26,400 |
Progressive Corp., 7.000%, 10/01/2013 | | | | | 150,000 | | | 163,210 |
Willis North America, Inc., 6.200%, 3/28/2017 | | | | | 225,000 | | | 220,249 |
Willis North America, Inc., 7.000%, 9/29/2019 | | | | | 805,000 | | | 827,716 |
| | | | | | | | |
| | | | | | | | 7,753,531 |
| | | | | | | | |
| Railroads – 1.0% | | | | | | | | |
Canadian Pacific Railway Co., 5.950%, 5/15/2037 | | | | | 215,000 | | | 212,143 |
Canadian Pacific Railway Co., 7.250%, 5/15/2019 | | | | | 2,500,000 | | | 2,900,270 |
Canadian Pacific Railway Ltd., MTN, 4.900%, 6/15/2010, 144A | | CAD | | | 1,000,000 | | | 956,475 |
CSX Corp., 6.250%, 3/15/2018 | | | | | 670,000 | | | 726,612 |
CSX Corp., MTN, 6.000%, 10/01/2036 | | | | | 162,000 | | | 167,065 |
See accompanying notes to financial statements.
111
| | | | | | | | | |
| | | | | Principal Amount (‡) | | | Value (†) |
| | | | | | | | | |
| | | |
| BONDS AND NOTES – continued | | | | | | | | | |
| | | |
| Railroads – continued | | | | | | | | | |
Missouri Pacific Railroad Co., 5.000%, 1/01/2045(c) | | | | $ | 190,000 | | | $ | 129,200 |
| | | | | | | | | |
| | | | | | | | | 5,091,765 |
| | | | | | | | | |
| Refining – 0.8% | | | | | | | | | |
Valero Energy Corp., 9.375%, 3/15/2019 | | | | | 3,500,000 | | | | 4,078,459 |
| | | | | | | | | |
| REITs – 1.9% | | | | | | | | | |
Camden Property Trust, 5.000%, 6/15/2015 | | | | | 85,000 | | | | 80,895 |
Camden Property Trust, 5.700%, 5/15/2017 | | | | | 640,000 | | | | 605,535 |
Colonial Realty LP, 4.800%, 4/01/2011 | | | | | 531,000 | | | | 515,468 |
Duke Realty LP, 5.950%, 2/15/2017 | | | | | 90,000 | | | | 82,959 |
Equity One, Inc., 6.000%, 9/15/2017 | | | | | 1,000,000 | | | | 895,313 |
ERP Operating LP, 5.125%, 3/15/2016 | | | | | 30,000 | | | | 29,273 |
ERP Operating LP, 5.750%, 6/15/2017 | | | | | 180,000 | | | | 178,295 |
Federal Realty Investment Trust, 5.650%, 6/01/2016 | | | | | 1,350,000 | | | | 1,283,234 |
Highwoods Properties, Inc., 5.850%, 3/15/2017 | | | | | 80,000 | | | | 70,459 |
Highwoods Properties, Inc., 7.500%, 4/15/2018 | | | | | 1,075,000 | | | | 1,028,702 |
ProLogis, 5.625%, 11/15/2015 | | | | | 40,000 | | | | 36,348 |
ProLogis, 5.750%, 4/01/2016 | | | | | 35,000 | | | | 31,307 |
Realty Income Corp., 6.750%, 8/15/2019 | | | | | 500,000 | | | | 486,992 |
Simon Property Group LP, 5.250%, 12/01/2016 | | | | | 155,000 | | | | 152,784 |
Simon Property Group LP, 5.300%, 5/30/2013 | | | | | 1,200,000 | | | | 1,226,858 |
Simon Property Group LP, 5.750%, 12/01/2015 | | | | | 475,000 | | | | 485,883 |
Simon Property Group LP, 5.875%, 3/01/2017 | | | | | 740,000 | | | | 754,657 |
Simon Property Group LP, 6.100%, 5/01/2016 | | | | | 360,000 | | | | 369,990 |
Simon Property Group LP, 6.350%, 8/28/2012 | | | | | 250,000 | | | | 265,508 |
Simon Property Group LP, 10.350%, 4/01/2019 | | | | | 1,300,000 | | | | 1,617,788 |
| | | | | | | | | |
| | | | | | | | | 10,198,248 |
| | | | | | | | | |
| Restaurants – 0.1% | | | | | | | | | |
Darden Restaurants, Inc., 6.000%, 8/15/2035 | | | | | 610,000 | | | | 552,960 |
| | | | | | | | | |
| Retailers – 1.4% | | | | | | | | | |
Home Depot, Inc. (The), 5.875%, 12/16/2036 | | | | | 3,305,000 | | | | 3,206,531 |
J.C. Penney Corp., Inc., 6.375%, 10/15/2036 | | | | | 230,000 | | | | 189,750 |
Macy’s Retail Holdings, Inc., 5.350%, 3/15/2012 | | | | | 355,000 | | | | 345,551 |
Macy’s Retail Holdings, Inc., 5.875%, 1/15/2013 | | | | | 980,000 | | | | 951,524 |
Macy’s Retail Holdings, Inc., 6.375%, 3/15/2037 | | | | | 3,465,000 | | | | 2,729,880 |
| | | | | | | | | |
| | | | | | | | | 7,423,236 |
| | | | | | | | | |
| Sovereigns – 2.5% | | | | | | | | | |
Mexican Fixed Rate Bonds, Series M-10, 7.250%, 12/15/2016 | | MXN | | | 262,000 | (††) | | | 1,888,566 |
Mexican Fixed Rate Bonds, Series M-20, 8.000%, 12/07/2023 | | MXN | | | 140,000 | (††) | | | 1,017,145 |
Mexican Fixed Rate Bonds, Series MI-10, 9.000%, 12/20/2012 | | MXN | | | 227,000 | (††) | | | 1,792,689 |
New South Wales Treasury Corp., Series 10RG, 7.000%, 12/01/2010 | | AUD | | | 2,625,000 | | | | 2,385,526 |
New South Wales Treasury Corp., Series 12RG, 6.000%, 5/01/2012 | | AUD | | | 685,000 | | | | 616,200 |
New South Wales Treasury Corp., Series 17RG, 5.500%, 3/01/2017 | | AUD | | | 4,000,000 | | | | 3,455,722 |
See accompanying notes to financial statements.
112
PORTFOLIO OF INVESTMENTS – as of September 30, 2009
Loomis Sayles Investment Grade Fixed Income Fund – continued
| | | | | | | |
| | | | | Principal Amount (‡) | | Value (†) |
| | | | | | | |
| | | |
| BONDS AND NOTES – continued | | | | | | | |
| | | |
| Sovereigns – continued | | | | | | | |
Republic of Iceland, Zero Coupon, 11/16/2009 | | ISK | | 56,700,000 | | $ | 362,434 |
Republic of Iceland, 7.000%, 3/17/2010 | | ISK | | 99,510,000 | | | 641,551 |
Republic of Iceland, 7.250%, 5/17/2013 | | ISK | | 101,800,000 | | | 652,505 |
Republic of Iceland, 8.000%, 7/22/2011 | | ISK | | 54,600,000 | | | 356,640 |
| | | | | | | |
| | | | | | | 13,168,978 |
| | | | | | | |
| Supranational – 1.5% | | | | | | | |
European Investment Bank, EMTN, 4.600%, 1/30/2037, 144A | | CAD | | 1,900,000 | | | 1,563,088 |
Inter-American Development Bank, EMTN, Zero Coupon, 9/23/2013 | | IDR | | 45,300,000,000 | | | 3,113,584 |
Inter-American Development Bank, EMTN, 6.000%, 12/15/2017 | | NZD | | 4,375,000 | | | 3,145,849 |
| | | | | | | |
| | | | | | | 7,822,521 |
| | | | | | | |
| Technology – 2.9% | | | | | | | |
Avnet, Inc., 6.000%, 9/01/2015 | | | | 1,970,000 | | | 2,028,233 |
Avnet, Inc., 6.625%, 9/15/2016 | | | | 270,000 | | | 283,732 |
Corning, Inc., 6.750%, 9/15/2013 | | | | 1,250,000 | | | 1,361,835 |
Corning, Inc., 6.850%, 3/01/2029 | | | | 210,000 | | | 214,293 |
Corning, Inc., 7.000%, 5/15/2024 | | | | 810,000 | | | 872,419 |
Corning, Inc., 7.250%, 8/15/2036 | | | | 3,565,000 | | | 3,761,342 |
Dun & Bradstreet Corp., 6.000%, 4/01/2013 | | | | 1,970,000 | | | 2,041,746 |
International Business Machines Corp., 4.750%, 11/29/2012 | | | | 795,000 | | | 859,900 |
Intuit, Inc., 5.750%, 3/15/2017 | | | | 635,000 | | | 664,053 |
KLA-Tencor Corp., 6.900%, 5/01/2018 | | | | 1,370,000 | | | 1,432,016 |
Motorola, Inc., 5.220%, 10/01/2097 | | | | 1,000,000 | | | 549,068 |
Motorola, Inc., 6.500%, 9/01/2025 | | | | 190,000 | | | 160,566 |
Samsung Electronics Co. Ltd., 7.700%, 10/01/2027, 144A | | | | 475,000 | | | 526,927 |
Tyco Electronics Group SA, 6.550%, 10/01/2017 | | | | 360,000 | | | 376,855 |
| | | | | | | |
| | | | | | | 15,132,985 |
| | | | | | | |
| Tobacco – 1.2% | | | | | | | |
Altria Group, Inc., 9.250%, 8/06/2019 | | | | 4,190,000 | | | 5,119,996 |
Reynolds American, Inc., 6.750%, 6/15/2017 | | | | 735,000 | | | 764,076 |
Reynolds American, Inc., 7.250%, 6/15/2037 | | | | 195,000 | | | 193,131 |
| | | | | | | |
| | | | | | | 6,077,203 |
| | | | | | | |
| Transportation Services – 2.2% | | | | | | | |
APL Ltd., 8.000%, 1/15/2024(c) | | | | 100,000 | | | 81,750 |
Atlas Air, Inc., Series B, 7.680%, 1/02/2014 | | | | 3,127,808 | | | 2,658,637 |
Erac USA Finance Co., 6.700%, 6/01/2034, 144A | | | | 945,000 | | | 838,986 |
Erac USA Finance Co., 7.000%, 10/15/2037, 144A | | | | 8,661,000 | | | 8,107,649 |
| | | | | | | |
| | | | | | | 11,687,022 |
| | | | | | | |
| Treasuries – 16.1% | | | | | | | |
Canadian Government, 2.000%, 9/01/2012 | | CAD | | 4,070,000 | | | 3,811,731 |
Canadian Government, 2.750%, 12/01/2010 | | CAD | | 5,410,000 | | | 5,176,046 |
Canadian Government, 3.750%, 9/01/2011 | | CAD | | 2,000,000 | | | 1,955,168 |
Canadian Government, 3.750%, 6/01/2012 | | CAD | | 9,485,000 | | | 9,322,878 |
Canadian Government, 3.750%, 6/01/2019 | | CAD | | 31,580,000 | | | 30,563,564 |
Canadian Government, 4.000%, 6/01/2016 | | CAD | | 1,000,000 | | | 1,000,168 |
See accompanying notes to financial statements.
113
| | | | | | | |
| | | | | Principal Amount (‡) | | Value (†) |
| | | | | | | |
| | | |
| BONDS AND NOTES – continued | | | | | | | |
| | | |
| Treasuries – continued | | | | | | | |
Canadian Government, 5.250%, 6/01/2012 | | CAD | | 16,420,000 | | $ | 16,737,465 |
Norwegian Government, 4.250%, 5/19/2017 | | NOK | | 23,620,000 | | | 4,157,514 |
Norwegian Government, 6.500%, 5/15/2013 | | NOK | | 50,000,000 | | | 9,535,145 |
U.S. Treasury Note, 3.125%, 5/15/2019 | | | | 2,000,000 | | | 1,967,968 |
U.S. Treasury Note, 4.250%, 11/15/2013 | | | | 330,000 | | | 360,396 |
| | | | | | | |
| | | | | | | 84,588,043 |
| | | | | | | |
| Wireless – 0.4% | | | | | | | |
ALLTEL Corp., 7.875%, 7/01/2032 | | | | 705,000 | | | 867,869 |
Nextel Communications, Inc., Series D, 7.375%, 8/01/2015 | | | | 60,000 | | | 53,850 |
Nextel Communications, Inc., Series E, 6.875%, 10/31/2013 | | | | 165,000 | | | 153,038 |
Nextel Communications, Inc., Series F, 5.950%, 3/15/2014 | | | | 510,000 | | | 451,350 |
Sprint Capital Corp., 6.875%, 11/15/2028 | | | | 234,000 | | | 195,390 |
Sprint Nextel Corp., 6.000%, 12/01/2016 | | | | 366,000 | | | 326,655 |
| | | | | | | |
| | | | | | | 2,048,152 |
| | | | | | | |
| Wirelines – 5.9% | | | | | | | |
AT&T Corp., 6.500%, 3/15/2029 | | | | 1,310,000 | | | 1,361,682 |
AT&T, Inc., 6.150%, 9/15/2034 | | | | 1,785,000 | | | 1,824,229 |
AT&T, Inc., 6.500%, 9/01/2037 | | | | 780,000 | | | 838,115 |
BellSouth Corp., 6.000%, 11/15/2034 | | | | 530,000 | | | 536,927 |
BellSouth Corp., 6.550%, 6/15/2034 | | | | 105,000 | | | 112,391 |
BellSouth Telecommunications, Inc., 5.850%, 11/15/2045 | | | | 2,000,000 | | | 1,807,200 |
Deutsche Telekom International Finance BV, 6.000%, 7/08/2019 | | | | 8,170,000 | | | 8,755,617 |
GTE Corp., 6.940%, 4/15/2028 | | | | 205,000 | | | 220,414 |
New England Telephone & Telegraph, 7.875%, 11/15/2029 | | | | 2,170,000 | | | 2,462,505 |
Qwest Capital Funding, Inc., 6.500%, 11/15/2018 | | | | 500,000 | | | 411,250 |
Telecom Italia Capital SA, 6.000%, 9/30/2034 | | | | 1,880,000 | | | 1,832,754 |
Telefonica Emisiones SAU, 5.877%, 7/15/2019 | | | | 290,000 | | | 315,090 |
Telefonica Emisiones SAU, 6.421%, 6/20/2016 | | | | 185,000 | | | 207,767 |
Telefonica Emisiones SAU, 7.045%, 6/20/2036 | | | | 3,136,000 | | | 3,711,161 |
Verizon Communications, Inc., 5.850%, 9/15/2035 | | | | 3,290,000 | | | 3,312,234 |
Verizon Maryland, Inc., 5.125%, 6/15/2033 | | | | 290,000 | | | 246,779 |
Verizon New England, Inc., Series C, 4.750%, 10/01/2013 | | | | 1,000,000 | | | 1,039,733 |
Verizon New York, Inc., Series B, 7.375%, 4/01/2032 | | | | 915,000 | | | 1,003,301 |
Verizon Pennsylvania, Inc., 6.000%, 12/01/2028 | | | | 695,000 | | | 647,889 |
Verizon Virginia, Inc., Series A, 4.625%, 3/15/2013 | | | | 505,000 | | | 524,606 |
| | | | | | | |
| | | | | | | 31,171,644 |
| | | | | | | |
| | | |
| TOTAL NON-CONVERTIBLE BONDS | | | | | | | |
(Identified Cost $440,681,414) | | | | | | | 481,151,443 |
| | | | | | | |
See accompanying notes to financial statements.
114
PORTFOLIO OF INVESTMENTS – as of September 30, 2009
Loomis Sayles Investment Grade Fixed Income Fund – continued
| | | | | | | | |
| | | | | Principal Amount (‡) | | Value (†) |
| | | | | | | | |
| | | |
| BONDS AND NOTES – continued | | | | | | | | |
| | | |
| CONVERTIBLE BONDS – 1.1% | | | | | | | | |
| | | |
| Oil Field Services – 0.1% | | | | | | | | |
Transocean, Inc., Series C, 1.500%, 12/15/2037 | | | | $ | 240,000 | | $ | 228,600 |
| | | | | | | | |
| REITs – 0.0% | | | | | | | | |
ERP Operating LP, 3.850%, 8/15/2026 | | | | | 180,000 | | | 178,319 |
| | | | | | | | |
| Technology – 1.0% | | | | | | | | |
Intel Corp., 2.950%, 12/15/2035 | | | | | 90,000 | | | 80,325 |
Intel Corp., 3.250%, 8/01/2039, 144A | | | | | 4,700,000 | | | 5,023,125 |
Maxtor Corp., 5.750%, 3/01/2012(c) | | | | | 48,000 | | | 43,680 |
Richardson Electronics Ltd., 7.750%, 12/15/2011 | | | | | 44,000 | | | 39,160 |
| | | | | | | | |
| | | | | | | | 5,186,290 |
| | | | | | | | |
| | | |
| TOTAL CONVERTIBLE BONDS | | | | | | | | |
(Identified Cost $5,244,324) | | | | | | | | 5,593,209 |
| | | | | | | | |
| | | |
| MUNICIPALS – 0.3% | | | | | | | | |
| | | |
| Michigan – 0.2% | | | | | | | | |
Michigan Tobacco Settlement Finance Authority, 7.309%, 6/01/2034(c) | | | | | 1,065,000 | | | 851,425 |
| | | | | | | | |
| Ohio – 0.1% | | | | | | | | |
Buckeye Tobacco Settlement Financing Authority, Series A-2, 5.875%, 6/01/2047(c) | | | | | 750,000 | | | 608,400 |
| | | | | | | | |
| | | |
| TOTAL MUNICIPALS | | | | | | | | |
(Identified Cost $1,793,330) | | | | | | | | 1,459,825 |
| | | | | | | | |
| | | |
| TOTAL BONDS AND NOTES | | | | | | | | |
(Identified Cost $447,719,068) | | | | | | | | 488,204,477 |
| | | | | | | | |
| | | |
| | | | | Shares | | |
| | | |
| PREFERRED STOCKS – 0.7% | | | | | | | | |
| | | |
| NON-CONVERTIBLE PREFERRED STOCKS – 0.3% | | | | | | | | |
| | | |
| Diversified Financial Services – 0.1% | | | | | | | | |
Bank of America Corp., Series L, 7.250% | | | | | 940 | | | 799,000 |
CIT Group, Inc., Series A, 6.350% | | | | | 5,441 | | | 13,875 |
Preferred Blocker, Inc., 7.000%, 144A | | | | | 161 | | | 93,626 |
| | | | | | | | |
| | | | | | | | 906,501 |
| | | | | | | | |
| Electric Utilities – 0.1% | | | | | | | | |
Connecticut Light & Power Co., 2.200% | | | | | 263 | | | 9,172 |
MDU Resources Group, Inc., 5.100% | | | | | 254 | | | 24,980 |
Public Service Electric & Gas Co., 4.080% | | | | | 400 | | | 28,800 |
San Diego Gas & Electric Co., 4.500% | | | | | 100 | | | 1,592 |
Union Electric Co., 4.500% | | | | | 3,160 | | | 232,260 |
| | | | | | | | |
| | | | | | | | 296,804 |
| | | | | | | | |
| Thrifts & Mortgage Finance – 0.1% | | | | | | | | |
Federal Home Loan Mortgage Corp., 5.000%(e)(f) | | | | | 1,850 | | | 4,902 |
Federal Home Loan Mortgage Corp., 5.570%(e)(f) | | | | | 28,450 | | | 45,520 |
Federal Home Loan Mortgage Corp., 5.660%(e)(f) | | | | | 8,500 | | | 14,025 |
Federal Home Loan Mortgage Corp., 5.700%(e)(f) | | | | | 2,900 | | | 7,453 |
See accompanying notes to financial statements.
115
| | | | | | | | |
| | | | | Shares | | Value (†) |
| | | | | | | | |
| | | |
| PREFERRED STOCKS – continued | | | | | | | | |
| | | |
| Thrifts & Mortgage Finance – continued | | | | | | | | |
Federal Home Loan Mortgage Corp., 5.790%(e)(f) | | | | | 5,400 | | $ | 14,364 |
Federal Home Loan Mortgage Corp., 5.810%(e)(f) | | | | | 1,900 | | | 5,187 |
Federal Home Loan Mortgage Corp., 5.900%(e)(f) | | | | | 4,200 | | | 7,140 |
Federal Home Loan Mortgage Corp., 6.000%(e)(f) | | | | | 2,400 | | | 7,080 |
Federal Home Loan Mortgage Corp., 6.420%(e)(f) | | | | | 1,700 | | | 5,100 |
Federal Home Loan Mortgage Corp., 6.550%(e)(f) | | | | | 11,075 | | | 20,156 |
Federal Home Loan Mortgage Corp., (fixed rate to 12/31/2012, variable rate thereafter),
8.375%(e)(f) | | | | | 39,400 | | | 71,314 |
Federal National Mortgage Association,
4.750%(e)(f) | | | | | 3,650 | | | 9,307 |
Federal National Mortgage Association,
5.125%(e)(f) | | | | | 1,300 | | | 3,458 |
Federal National Mortgage Association,
5.375%(e)(f) | | | | | 2,600 | | | 7,384 |
Federal National Mortgage Association,
5.810%(e)(f) | | | | | 1,050 | | | 2,930 |
Federal National Mortgage Association,
6.750%(e)(f) | | | | | 1,650 | | | 2,591 |
Federal National Mortgage Association, (fixed rate to 12/13/2010, variable rate thereafter),
8.250%(e)(f) | | | | | 53,575 | | | 86,256 |
| | | | | | | | |
| | | | | | | | 314,167 |
| | | | | | | | |
| | | |
| TOTAL NON-CONVERTIBLE PREFERRED STOCKS | | | | | | | | |
(Identified Cost $3,621,023) | | | | | | | | 1,517,472 |
| | | | | | | | |
| | | |
CONVERTIBLE PREFERRED
STOCKS – 0.4% | | | | | | | | |
| | | |
| Capital Markets – 0.2% | | | | | | | | |
Newell Financial Trust I, 5.250% | | | | | 33,050 | | | 1,169,143 |
| | | | | | | | |
| Diversified Financial Services – 0.2% | | | | | | | | |
Sovereign Capital Trust IV, 4.375% | | | | | 25,000 | | | 756,250 |
| | | | | | | | |
| | | |
| TOTAL CONVERTIBLE PREFERRED STOCKS | | | | | | | | |
(Identified Cost $1,794,828) | | | | | | | | 1,925,393 |
| | | | | | | | |
| | | |
| TOTAL PREFERRED STOCKS | | | | | | | | |
(Identified Cost $5,415,851) | | | | | | | | 3,442,865 |
| | | | | | | | |
| | | |
| COMMON STOCKS – 0.1% | | | | | | | | |
| | | |
| Biotechnology – 0.1% | | | | | | | | |
Vertex Pharmaceuticals, Inc.(f)
(Identified Cost $302,522) | | | | | 13,708 | | | 519,533 |
| | | | | | | | |
| | | |
| | | | | | Principal Amount (‡) | | | |
| | | |
| SHORT-TERM INVESTMENTS – 4.0% | | | | | | | | |
Tri-Party Repurchase Agreement with Fixed Income Clearing Corporation, dated 9/30/2009 at 0.000% to be repurchased at $21,231,984 on 10/01/2009 collateralized by $21,550,000 Federal National Mortgage Association, 3.000% due 1/13/2014 with a value of $21,657,750 including accrued interest (Note 2i of Notes to Financial Statements) (Identified Cost $21,231,984) | | | | $ | 21,231,984 | | | 21,231,984 |
| | | | | | | | |
| | | |
| TOTAL INVESTMENTS – 97.7% | | | | | | | | |
(Identified Cost $474,669,425)(a) | | | | | | | | 513,398,859 |
Other assets less liabilities—2.3% | | | | | | | | 12,105,106 |
| | | | | | | | |
| | | |
| NET ASSETS – 100.0% | | | | | | | $ | 525,503,965 |
| | | | | | | | |
See accompanying notes to financial statements.
116
PORTFOLIO OF INVESTMENTS – as of September 30, 2009
Loomis Sayles Investment Grade Fixed Income Fund – continued
| | | | | | | |
(‡) Principal amount stated in U.S. dollars unless otherwise noted. | | | | | | | |
(†) See Note 2a of Notes to Financial Statements. | | | | | | | |
(††) Amount shown represents units. One unit represents a principal amount of 100. | | | |
(a) Federal Tax Information: | | | |
At September 30, 2009, the net unrealized appreciation on investments based on a cost of $475,592,646 for federal income tax purposes was as follows: | | | |
Aggregate gross unrealized appreciation for all investments in which there is an excess of value over tax cost | | $ | 48,956,001 |
Aggregate gross unrealized depreciation for all investments in which there is an excess of tax cost over value | | | (11,149,788) |
| | | | | | | |
Net unrealized appreciation | | $ | 37,806,213 |
| | | | | | | |
| (b) | Variable rate security. Rate as of September 30, 2009 is disclosed. |
| (c) | Illiquid security. At September 30, 2009, the value of these securities amounted to $10,121,055 or 1.9% of net assets. |
| (d) | Fair valued security by the Fund’s investment adviser. At September 30, 2009 the value of this security amounted to $656,624 or 0.1% of net assets. |
| (e) | Future dividend payments have been eliminated as the issuer has been placed in conservatorship. |
| (f) | Non-income producing security. |
| (g) | The Fund’s investment in mortgage related securities of the Federal Home Loan Mortgage Corporation, Federal National Mortgage Association and Government National Mortgage Association are interests in separate pools of mortgages. All separate investments in securities of each issuer which have the same coupon rate have been aggregated for the purpose of presentation in the Portfolio of Investments. |
| 144A | Securities exempt from registration under Rule 144A of the Securities Act of 1933. These securities may be resold in transactions exempt from registration, normally to qualified institutional buyers. At September 30, 2009, the total value of these securities amounted to $82,358,779 or 15.7% of net assets. |
| ABS | Asset-Backed Securities |
| ARMs | Adjustable-Rate Mortgages |
| EMTN | Euro Medium Term Note |
| FHLMC | Federal Home Loan Mortgage Corp. |
| FNMA | Federal National Mortgage Association |
| GMTN | Global Medium Term Note |
| GNMA | Government National Mortgage Association |
| REITs | Real Estate Investment Trusts |
Key to Abbreviations: AUD: Australian Dollar; BRL: Brazilian Real; CAD: Canadian Dollar; EUR: Euro; GBP: British Pound; IDR: Indonesian Rupiah; ISK: Icelandic Krona; KRW: South Korean Won; MXN: Mexican Peso; NOK: Norwegian Krone; NZD: New Zealand Dollar; THB: Thai Baht
INDUSTRY SUMMARY AT SEPTEMBER 30, 2009 (Unaudited)
| | | |
Treasuries | | 16.1 | % |
Banking | | 7.3 | |
Wirelines | | 5.9 | |
Commercial Mortgage-Backed Securities | | 4.4 | |
Pipelines | | 3.9 | |
Technology | | 3.9 | |
Electric | | 2.6 | |
Sovereigns | | 2.5 | |
Non-Captive Diversified | | 2.4 | |
Transportation Services | | 2.2 | |
Airlines | | 2.2 | |
Chemicals | | 2.1 | |
Other Investments, less than 2% each | | 38.2 | |
Short-Term Investments | | 4.0 | |
| | | |
Total Investments | | 97.7 | |
Other assets less liabilities | | 2.3 | |
| | | |
Net Assets | | 100.0 | % |
| | | |
See accompanying notes to financial statements.
117
CURRENCY EXPOSURE AT SEPTEMBER 30, 2009 AS A PERCENTAGE OF NET ASSETS (Unaudited)
| | | |
United States Dollar | | 72.3 | % |
Canadian Dollar | | 13.6 | |
Norwegian Krone | | 2.6 | |
New Zealand Dollar | | 2.5 | |
Other, less than 2% each | | 6.7 | |
| | | |
Total Investments | | 97.7 | |
Other assets less liabilities | | 2.3 | |
| | | |
Net Assets | | 100.0 | % |
| | | |
See accompanying notes to financial statements.
118
STATEMENTS OF ASSETS AND LIABILITIES
September 30, 2009
| | | | | | | | |
| | | Bond Fund | | | Fixed Income
Fund | |
| | | | | | | | |
Assets | | | | | | | | |
Investments at cost | | $ | 18,838,128,664 | | | $ | 725,504,077 | |
Net unrealized appreciation (depreciation) | | | (174,446,981 | ) | | | 26,833,062 | |
| | | | | | | | |
Investments at value | | | 18,663,681,683 | | | | 752,337,139 | |
Cash | | | 53,019 | | | | 42 | |
Cash collateral received for open swap agreements (Note 2) | | | — | | | | — | |
Foreign currency at value (identified cost $9,919,686, $368,610, $38,389,137, $0, $101,249, $0 and $142,753) | | | 10,081,329 | | | | 377,666 | |
Receivable for Fund shares sold | | | 65,178,045 | | | | 21,825 | |
Receivable for securities sold | | | 48,363,217 | | | | 808,018 | |
Collateral received on open forward foreign currency contracts (Note 2) | | | — | | | | — | |
Swap agreements, at value (Note 2) | | | — | | | | — | |
Unrealized appreciation on forward foreign currency contracts (Note 2) | | | — | | | | — | |
Dividends and interest receivable | | | 277,469,962 | | | | 11,163,113 | |
Tax reclaims receivable | | | 58,437 | | | | 5,255 | |
Receivable from investment adviser (Note 6) | | | — | | | | — | |
Receivable from broker—variation margin on open futures contracts | | | — | | | | — | |
| | | | | | | | |
Total Assets | | | 19,064,885,692 | | | | 764,713,058 | |
| | | | | | | | |
| Liabilities | | | | | | | | |
Payable for securities purchased | | | 176,427,196 | | | | — | |
Payable for Fund shares redeemed | | | 148,776,925 | | | | 2,264,477 | |
Foreign taxes payable (Note 2) | | | 550,806 | | | | 21,191 | |
Fees payable on swap agreements (Note 2) | | | — | | | | — | |
Unrealized depreciation on forward foreign currency contracts (Note 2) | | | — | | | | — | |
Due to brokers (Note 2) | | | — | | | | — | |
Management fees payable (Note 6) | | | 7,894,858 | | | | 315,356 | |
Administrative fees payable (Note 6) | | | 740,029 | | | | 30,959 | |
Deferred Trustees’ fees (Note 6) | | | 634,661 | | | | 83,773 | |
Service and distribution fees payable (Note 6) | | | 55,401 | | | | — | |
Other accounts payable and accrued expenses | | | 1,364,498 | | | | 41,874 | |
| | | | | | | | |
Total Liabilities | | | 336,444,374 | | | | 2,757,630 | |
| | | | | | | | |
Net Assets | | $ | 18,728,441,318 | | | $ | 761,955,428 | |
| | | | | | | | |
Net Assets consist of: | | | | | | | | |
Paid-in capital | | $ | 19,771,586,084 | | | $ | 726,142,272 | |
Undistributed net investment income (Distributions in excess of net investment income) | | | (6,357,321 | ) | | | 30,934,158 | |
Accumulated net realized loss on investments, futures contracts, swap agreements and foreign currency transactions | | | (865,529,058 | ) | | | (22,057,304 | ) |
Net unrealized appreciation (depreciation) on investments, futures contracts, swap agreements and foreign currency translations | | | (171,258,387 | ) | | | 26,936,302 | |
| | | | | | | | |
Net Assets | | $ | 18,728,441,318 | | | $ | 761,955,428 | |
| | | | | | | | |
| Net Asset Value and Offering Price | | | | | | | | |
Institutional Class | | | | | | | | |
Net assets | | $ | 10,855,818,358 | | | $ | 761,955,428 | |
| | | | | | | | |
Shares of beneficial interest | | | 835,926,807 | | | | 58,884,779 | |
| | | | | | | | |
Net asset value, offering and redemption price per share | | $ | 12.99 | | | $ | 12.94 | |
| | | | | | | | |
Retail Class | | | | | | | | |
Net assets | | $ | 7,646,590,529 | | | $ | — | |
| | | | | | | | |
Shares of beneficial interest | | | 590,832,800 | | | | — | |
| | | | | | | | |
Net asset value, offering and redemption price per share | | $ | 12.94 | | | $ | — | |
| | | | | | | | |
Admin Class | | | | | | | | |
Net assets | | $ | 226,032,431 | | | $ | — | |
| | | | | | | | |
Shares of beneficial interest | | | 17,504,047 | | | | — | |
| | | | | | | | |
Net asset value, offering and redemption price per share | | $ | 12.91 | | | $ | — | |
| | | | | | | | |
See accompanying notes to financial statements.
119
| | | | | | | | | | | | | | | | | | |
Global
Bond Fund | | | Inflation Protected
Securities Fund | | | Institutional
High Income Fund | | | Intermediate Duration
Fixed Income Fund | | | Investment Grade
Fixed Income Fund | |
| | | | | | | | | | | | | | | | | | |
| | | | | | | | | | | | | | | | | | |
| $ | 1,816,808,006 | | | $ | 13,815,892 | | | $ | 411,465,730 | | | $ | 26,963,093 | | | $ | 474,669,425 | |
| | 64,388,552 | | | | 110,523 | | | | 43,154,875 | | | | 929,436 | | | | 38,729,434 | |
| | 1,881,196,558 | | | | 13,926,415 | | | | 454,620,605 | | | | 27,892,529 | | | | 513,398,859 | |
| | — | | | | — | | | | 465 | | | | — | | | | — | |
| | 20,000 | | | | — | | | | — | | | | — | | | | — | |
|
38,851,363 |
| | | — | | | | 103,378 | | | | — | | | | 144,070 | |
| | 8,299,962 | | | | — | | | | 750,000 | | | | — | | | | 3,750,000 | |
| | 56,126,471 | | | | — | | | | — | | | | — | | | | 1,627,150 | |
| | 285,975 | | | | — | | | | — | | | | — | | | | — | |
| | 150,447 | | | | — | | | | — | | | | — | | | | — | |
| | 1,907,357 | | | | 7,566 | | | | — | | | | — | | | | — | |
| | 29,000,335 | | | | 105,722 | | | | 7,397,076 | | | | 261,821 | | | | 7,215,385 | |
| | 32,747 | | | | — | | | | 11,805 | | | | 57 | | | | 1,145 | |
| | — | | | | 12,955 | | | | — | | | | 9,351 | | | | — | |
| | — | | | | — | | | | — | | | | 406 | | | | — | |
| | 2,015,871,215 | | | | 14,052,658 | | | | 462,883,329 | | | | 28,164,164 | | | | 526,136,609 | |
| | | | | | | | | | | | | | | | | | |
| | 61,789,545 | | | | — | | | | 3,623,470 | | | | 64,774 | | | | 286,067 | |
| | 857,342 | | | | 245 | | | | 400,503 | | | | — | | | | 45,834 | |
| | 75 | | | | — | | | | 6,375 | | | | — | | | | 13,667 | |
| | 8,749 | | | | — | | | | — | | | | — | | | | — | |
| | 385,811 | | | | 6,332 | | | | — | | | | — | | | | — | |
| | 305,975 | | | | — | | | | — | | | | — | | | | — | |
| | 922,619 | | | | 2,844 | | | | 218,523 | | | | 5,690 | | | | 169,100 | |
| | 76,974 | | | | 558 | | | | 17,873 | | | | 1,117 | | | | 20,750 | |
| | 146,565 | | | | 40,802 | | | | 52,861 | | | | 43,352 | | | | 59,585 | |
| | 6,255 | | | | — | | | | — | | | | — | | | | — | |
| | 164,858 | | | | 25,888 | | | | 47,725 | | | | 21,902 | | | | 37,641 | |
| | 64,664,768 | | | | 76,669 | | | | 4,367,330 | | | | 136,835 | | | | 632,644 | |
| $ | 1,951,206,447 | | | $ | 13,975,989 | | | $ | 458,515,999 | | | $ | 28,027,329 | | | $ | 525,503,965 | |
| | | | | | | | | | | | | | | | | | |
| $ | 1,986,821,460 | | | $ | 14,668,622 | | | $ | 404,382,796 | | | $ | 28,347,692 | | | $ | 489,048,597 | |
|
2,356,778 |
| | | (36,427 | ) | | | 21,476,408 | | | | 62,444 | | | | (187,459 | ) |
| (104,865,533 | ) | | | (767,930 | ) | | | (10,503,557 | ) | | | (1,334,157 | ) | | | (2,145,732 | ) |
|
66,893,742 |
| | | 111,724 | | | | 43,160,352 | | | | 951,350 | | | | 38,788,559 | |
| $ | 1,951,206,447 | | | $ | 13,975,989 | | | $ | 458,515,999 | | | $ | 28,027,329 | | | $ | 525,503,965 | |
| | | | | | | | | | | | | | | | | | |
| | | | | | | | | | | | | | | | | | |
| $ | 1,032,464,744 | | | $ | 13,975,989 | | | $ | 458,515,999 | | | $ | 28,027,329 | | | $ | 525,503,965 | |
| | 64,162,707 | | | | 1,335,516 | | | | 61,968,955 | | | | 2,817,514 | | | | 42,399,042 | |
| $ | 16.09 | | | $ | 10.46 | | | $ | 7.40 | | | $ | 9.95 | | | $ | 12.39 | |
| | | | | | | | | | | | | | | | | | |
| $ | 918,741,703 | | | $ | — | | | $ | — | | | $ | — | | | $ | — | |
| | 57,582,683 | | | | — | | | | — | | | | — | | | | — | |
| $ | 15.96 | | | $ | — | | | $ | — | | | $ | — | | | $ | — | |
| | | | | | | | | | | | | | | | | | |
| $ | — | | | $ | — | | | $ | — | | | $ | — | | | $ | — | |
| | — | | | | — | | | | — | | | | — | | | | — | |
| $ | — | | | $ | — | | | $ | — | | | $ | — | | | $ | — | |
See accompanying notes to financial statements.
120
STATEMENTS OF OPERATIONS
For the Year Ended September 30, 2009
| | | | | | | | |
| | | Bond Fund | | | Fixed Income
Fund | |
| | | | | | | | |
Investment Income | | | | | | | | |
Dividends | | $ | 23,088,904 | | | $ | 1,149,269 | |
Interest | | | 1,170,458,663 | | | | 47,757,817 | |
Securities lending income (Note 2) | | | 160,023 | | | | 2,341 | |
Less net foreign taxes withheld | | | (1,238,540 | ) | | | (66,443 | ) |
| | | | | | | | |
| | | 1,192,469,050 | | | | 48,842,984 | |
| | | | | | | | |
| | |
| Expenses | | | | | | | | |
Management fees (Note 6) | | | 74,251,774 | | | | 3,172,675 | |
Distribution fees—Retail Class (Note 6) | | | 15,247,110 | | | | — | |
Service and distribution fees—Admin Class (Note 6) | | | 938,058 | | | | — | |
Trustees’ fees and expenses (Note 6) | | | 189,340 | | | | 14,340 | |
Administrative fees (Note 6) | | | 7,173,026 | | | | 319,229 | |
Custodian fees and expenses | | | 705,844 | | | | 60,185 | |
Transfer agent fees and expenses—Institutional Class (Note 6) | | | 3,832,773 | | | | 3,401 | |
Transfer agent fees and expenses—Retail Class (Note 6) | | | 6,411,580 | | | | — | |
Transfer agent fees and expenses—Admin Class (Note 6) | | | 282,767 | | | | — | |
Audit and tax services fees | | | 63,238 | | | | 44,389 | |
Registration fees | | | 581,449 | | | | 35,570 | |
Shareholder reporting expenses | | | 1,679,813 | | | | 3,364 | |
Legal fees | | | 520,294 | | | | 23,297 | |
Miscellaneous expenses | | | 532,290 | | | | 26,602 | |
| | | | | | | | |
Total expenses | | | 112,409,356 | | | | 3,703,052 | |
Less fee reduction and/or expense reimbursement (Note 6) | | | (452,739 | ) | | | — | |
| | | | | | | | |
Net expenses | | | 111,956,617 | | | | 3,703,052 | |
| | | | | | | | |
Net investment income | | | 1,080,512,433 | | | | 45,139,932 | |
| | | | | | | | |
| | |
| Net Realized And Unrealized Gain (Loss) on Investments, Futures Contracts, Swap Agreements and Foreign Currency Transactions | | | | | | | | |
Net Realized Gain (Loss) on: | | | | | | | | |
Investments | | | (1,016,814,908 | ) | | | (22,433,805 | ) |
Futures contracts | | | — | | | | — | |
Swap agreements | | | — | | | | — | |
Foreign currency transactions | | | 6,480,934 | | | | (614,680 | ) |
| | |
| Net Change in Unrealized Appreciation (Depreciation) on: | | | | | | | | |
Investments | | | 2,900,473,485 | | | | 107,524,741 | |
Futures contracts | | | — | | | | — | |
Swap agreements | | | — | | | | — | |
Foreign currency translations | | | 13,127,016 | | | | 321,701 | |
| | | | | | | | |
| Net realized and unrealized gain on investments, futures contracts, swap agreements and foreign currency transactions | | | 1,903,266,527 | | | | 84,797,957 | |
| | | | | | | | |
| | |
| Net Increase in Net Assets Resulting from Operations | | $ | 2,983,778,960 | | | $ | 129,937,889 | |
| | | | | | | | |
| (a) | Includes income reductions resulting from principal deflation adjustments during the period in the amount of $193,706. See Note 2b of Notes to Financial Statements. |
See accompanying notes to financial statements.
121
| | | | | | | | | | | | | | | | | | |
Global Bond
Fund | | | Inflation Protected
Securities Fund | | | Institutional
High Income Fund | | | Intermediate Duration
Fixed Income Fund | | | Investment Grade
Fixed Income Fund | |
| | | | | | | | | | | | | | | | | | |
| | | | | | | | | | | | | | | | | | |
| $ | 1,214,902 | | | $ | — | | | $ | 1,030,230 | | | $ | — | | | $ | 235,370 | |
| | 90,041,177 | | | | 170,607 | (a) | | | 28,760,913 | | | | 1,512,502 | | | | 24,594,298 | |
| | 13,763 | | | | 1,297 | | | | 3,940 | | | | 1,975 | | | | 2,633 | |
| | (86,683 | ) | | | — | | | | (4,956 | ) | | | (146 | ) | | | (16,658 | ) |
| | 91,183,159 | | | | 171,904 | | | | 29,790,127 | | | | 1,514,331 | | | | 24,815,643 | |
| | | | |
| | | | | | | | | | | | | | | | | | |
| | 9,365,171 | | | | 33,599 | | | | 1,742,448 | | | | 67,166 | | | | 1,504,442 | |
| | 2,014,894 | | | | — | | | | — | | | | — | | | | — | |
| | — | | | | — | | | | — | | | | — | | | | — | |
| | 23,748 | | | | 9,034 | | | | 12,196 | | | | 8,338 | | | | 13,362 | |
| | 843,474 | | | | 6,779 | | | | 145,571 | | | | 13,546 | | | | 188,759 | |
| | 147,997 | | | | 17,291 | | | | 74,661 | | | | 20,194 | | | | 38,825 | |
| | 254,198 | | | | 7,638 | | | | 7,241 | | | | 1,783 | | | | 2,538 | |
| | 943,685 | | | | — | | | | — | | | | — | | | | — | |
| | — | | | | — | | | | — | | | | — | | | | — | |
| | 48,320 | | | | 39,501 | | | | 42,254 | | | | 39,320 | | | | 40,976 | |
| | 112,419 | | | | 29,949 | | | | 34,553 | | | | 24,958 | | | | 35,165 | |
| | 168,122 | | | | 1,199 | | | | 6,190 | | | | 1,446 | | | | 2,607 | |
| | 63,237 | | | | 512 | | | | 9,963 | | | | 1,025 | | | | 13,223 | |
| | 80,295 | | | | 4,221 | | | | 11,894 | | | | 4,771 | | | | 14,729 | |
| | 14,065,560 | | | | 149,723 | | | | 2,086,971 | | | | 182,547 | | | | 1,854,626 | |
| | (129,637 | ) | | | (95,963 | ) | | | — | | | | (75,081 | ) | | | — | |
| | 13,935,923 | | | | 53,760 | | | | 2,086,971 | | | | 107,466 | | | | 1,854,626 | |
| | 77,247,236 | | | | 118,144 | | | | 27,703,156 | | | | 1,406,865 | | | | 22,961,017 | |
| | | | |
| | | | | | | | | | | | | | | | | | |
| | (73,320,770 | ) | | | (487,904 | ) | | | (10,648,155 | ) | | | (249,792 | ) | | | (3,496,319 | ) |
| | 321,385 | | | | (14,917 | ) | | | — | | | | (21,697 | ) | | | — | |
| | (72,892 | ) | | | — | | | | — | | | | — | | | | — | |
| | (19,381,159 | ) | | | (11,458 | ) | | | (118,058 | ) | | | (180 | ) | | | (24,222 | ) |
| | | | |
| | | | | | | | | | | | | | | | | | |
| | 257,651,329 | | | | 1,233,361 | | | | 78,652,365 | | | | 2,813,640 | | | | 69,370,621 | |
| | (235,349 | ) | | | — | | | | — | | | | 30,649 | | | | — | |
| | (197,561 | ) | | | — | | | | — | | | | — | | | | — | |
| | 11,688,270 | | | | 1,444 | | | | 59,084 | | | | 13 | | | | 201,519 | |
| | | | |
|
176,453,253 |
| | | 720,526 | | | | 67,945,236 | | | | 2,572,633 | | | | 66,051,599 | |
| | | | |
| $ | 253,700,489 | | | $ | 838,670 | | | $ | 95,648,392 | | | $ | 3,979,498 | | | $ | 89,012,616 | |
See accompanying notes to financial statements.
122
STATEMENTS OF CHANGES IN NET ASSETS
Bond Fund
| | | | | | | | |
| | | Year Ended
September 30, 2009 | | | Year Ended
September 30, 2008 | |
From Operations: | | | | | | | | |
Net investment income | | $ | 1,080,512,433 | | | $ | 1,109,707,513 | |
Net realized gain (loss) on investments and foreign currency transactions | | | (1,010,333,974 | ) | | | 299,760,675 | |
Net change in unrealized appreciation (depreciation) on investments and foreign currency translations | | | 2,913,600,501 | | | | (3,781,876,874 | ) |
| | | | | | | | |
Net increase (decrease) in net assets resulting from operations | | | 2,983,778,960 | | | | (2,372,408,686 | ) |
| | | | | | | | |
From Distributions to Shareholders: | | | | | | | | |
Net Investment Income: | | | | | | | | |
Institutional Class | | | (619,050,919 | ) | | | (618,954,427 | ) |
Retail Class | | | (461,177,153 | ) | | | (540,831,022 | ) |
Admin Class | | | (13,908,985 | ) | | | (15,164,699 | ) |
Capital Gains: | | | | | | | | |
Institutional Class | | | (64,404,701 | ) | | | — | |
Retail Class | | | (54,894,455 | ) | | | — | |
Admin Class | | | (1,827,140 | ) | | | — | |
| | | | | | | | |
Total distributions | | | (1,215,263,353 | ) | | | (1,174,950,148 | ) |
| | | | | | | | |
Increase in Net Assets Derived from Capital Share Transactions (Note 9) | | | 2,269,216,544 | | | | 3,895,007,552 | |
| | | | | | | | |
Redemption Fees: | | | | | | | | |
Institutional Class | | | — | | | | 423,395 | |
Retail Class | | | — | | | | 381,530 | |
Admin Class | | | — | | | | 11,120 | |
| | | | | | | | |
Total redemption fees | | | — | | | | 816,045 | |
| | | | | | | | |
Net increase in net assets | | | 4,037,732,151 | | | | 348,464,763 | |
Net Assets | | | | | | | | |
Beginning of year | | | 14,690,709,167 | | | | 14,342,244,404 | |
| | | | | | | | |
End of year | | $ | 18,728,441,318 | | | $ | 14,690,709,167 | |
| | | | | | | | |
Undistributed Net Investment Income (Distributions in Excess of Net Investment Income) | | $ | (6,357,321 | ) | | $ | 162,371,028 | |
| | | | | | | | |
Fixed Income Fund
| | | | | | | | |
| | | Year Ended
September 30, 2009 | | | Year Ended
September 30, 2008 | |
From Operations: | | | | | | | | |
Net investment income | | $ | 45,139,932 | | | $ | 41,194,607 | |
Net realized gain (loss) on investments and foreign currency transactions | | | (23,048,485 | ) | | | 15,081,715 | |
Net change in unrealized appreciation (depreciation) on investments and foreign currency translations | | | 107,846,442 | | | | (123,121,599 | ) |
| | | | | | | | |
Net increase (decrease) in net assets resulting from operations | | | 129,937,889 | | | | (66,845,277 | ) |
| | | | | | | | |
From Distributions to Shareholders: | | | | | | | | |
Net Investment Income: | | | | | | | | |
Institutional Class | | | (44,598,886 | ) | | | (43,626,372 | ) |
Capital Gains: | | | | | | | | |
Institutional Class | | | (12,700,279 | ) | | | (643,688 | ) |
| | | | | | | | |
Total distributions | | | (57,299,165 | ) | | | (44,270,060 | ) |
| | | | | | | | |
Increase in Net Assets Derived from Capital Share Transactions (Note 9) | | | 64,830,887 | | | | 130,500,717 | |
| | | | | | | | |
Net increase in net assets | | | 137,469,611 | | | | 19,385,380 | |
Net Assets | | | | | | | | |
Beginning of year | | | 624,485,817 | | | | 605,100,437 | |
| | | | | | | | |
End of year | | $ | 761,955,428 | | | $ | 624,485,817 | |
| | | | | | | | |
Undistributed Net Investment Income | | $ | 30,934,158 | | | $ | 33,192,023 | |
| | | | | | | | |
See accompanying notes to financial statements.
123
Global Bond Fund
| | | | | | | | |
| | | Year Ended
September 30, 2009 | | | Year Ended
September 30, 2008 | |
From Operations: | | | | | | | | |
Net investment income | | $ | 77,247,236 | | | $ | 98,323,123 | |
Net realized gain (loss) on investments, futures contracts, swap agreements and foreign currency transactions | | | (92,453,436 | ) | | | 37,132,573 | |
Net change in unrealized appreciation (depreciation) on investments, futures contracts, foreign currency translations and swap agreements | | | 268,906,689 | | | | (255,358,439 | ) |
| | | | | | | | |
Net increase (decrease) in net assets resulting from operations | | | 253,700,489 | | | | (119,902,743 | ) |
| | | | | | | | |
From Distributions to Shareholders: | | | | | | | | |
Net Investment Income: | | | | | | | | |
Institutional Class | | | (55,958,395 | ) | | | (61,946,579 | ) |
Retail Class | | | (50,692,695 | ) | | | (52,697,573 | ) |
Capital Gains: | | | | | | | | |
Institutional Class | | | — | | | | — | |
Retail Class | | | — | | | | — | |
| | | | | | | | |
Total distributions | | | (106,651,090 | ) | | | (114,644,152 | ) |
| | | | | | | | |
Increase (Decrease) in Net Assets Derived from Capital Share Transactions (Note 9) | | | (426,483,756 | ) | | | 594,419,506 | |
| | | | | | | | |
Redemption Fees: | | | | | | | | |
Institutional Class | | | — | | | | 77,878 | |
Retail Class | | | — | | | | 69,167 | |
| | | | | | | | |
Total redemption fees | | | — | | | | 147,045 | |
| | | | | | | | |
Net increase (decrease) in net assets | | | (279,434,357 | ) | | | 360,019,656 | |
Net Assets | | | | | | | | |
Beginning of year | | | 2,230,640,804 | | | | 1,870,621,148 | |
| | | | | | | | |
End of year | | $ | 1,951,206,447 | | | $ | 2,230,640,804 | |
| | | | | | | | |
Undistributed Net Investment Income | | $ | 2,356,778 | | | $ | 43,914,862 | |
| | | | | | | | |
Inflation Protected Securities Fund
| | | | | | | | |
| | | Year Ended
September 30, 2009 | | | Year Ended
September 30, 2008 | |
From Operations: | | | | | | | | |
Net investment income | | $ | 118,144 | | | $ | 1,075,804 | |
Net realized gain (loss) on investments, futures contracts and foreign currency transactions | | | (514,279 | ) | | | 118,138 | |
Net change in unrealized appreciation (depreciation) on investments and foreign currency translations | | | 1,234,805 | | | | (953,298 | ) |
| | | | | | | | |
Net increase in net assets resulting from operations | | | 838,670 | | | | 240,644 | |
| | | | | | | | |
From Distributions to Shareholders: | | | | | | | | |
Net Investment Income: | | | | | | | | |
Institutional Class | | | (145,315 | ) | | | (1,129,818 | ) |
Capital Gains: | | | | | | | | |
Institutional Class | | | — | | | | — | |
| | | | | | | | |
Total distributions | | | (145,315 | ) | | | (1,129,818 | ) |
| | | | | | | | |
Increase (Decrease) in Net Assets Derived from Capital Share Transactions (Note 9) | | | (2,750,472 | ) | | | 3,454,672 | |
| | | | | | | | |
Net increase (decrease) in net assets | | | (2,057,117 | ) | | | 2,565,498 | |
Net Assets | | | | | | | | |
Beginning of year | | | 16,033,106 | | | | 13,467,608 | |
| | | | | | | | |
End of year | | $ | 13,975,989 | | | $ | 16,033,106 | |
| | | | | | | | |
Undistributed Net Investment Income (Distributions in Excess of Net Investment Income) | | $ | (36,427 | ) | | $ | 29,211 | |
| | | | | | | | |
See accompanying notes to financial statements.
124
STATEMENTS OF CHANGES IN NET ASSETS – continued
Institutional High Income Fund
| | | | | | | | |
| | | Year Ended
September 30, 2009 | | | Year Ended
September 30, 2008 | |
From Operations: | | | | | | | | |
Net investment income | | $ | 27,703,156 | | | $ | 16,406,305 | |
Net realized gain (loss) on investments and foreign currency transactions | | | (10,766,213 | ) | | | 3,305,382 | |
Net change in unrealized appreciation (depreciation) on investments and foreign currency translations | | | 78,711,449 | | | | (48,410,556 | ) |
| | | | | | | | |
Net increase (decrease) in net assets resulting from operations | | | 95,648,392 | | | | (28,698,869 | ) |
| | | | | | | | |
From Distributions to Shareholders: | | | | | | | | |
Net Investment Income: | | | | | | | | |
Institutional Class | | | (17,646,157 | ) | | | (12,543,920 | ) |
Capital Gains: | | | | | | | | |
Institutional Class | | | (3,337,874 | ) | | | (3,556,542 | ) |
| | | | | | | | |
Total distributions | | | (20,984,031 | ) | | | (16,100,462 | ) |
| | | | | | | | |
Increase in Net Assets Derived from Capital Share Transactions (Note 9) | | | 169,650,687 | | | | 71,431,847 | |
| | | | | | | | |
Net increase in net assets | | | 244,315,048 | | | | 26,632,516 | |
Net Assets | | | | | | | | |
Beginning of year | | | 214,200,951 | | | | 187,568,435 | |
| | | | | | | | |
End of year | | $ | 458,515,999 | | | $ | 214,200,951 | |
| | | | | | | | |
Undistributed Net Investment Income | | $ | 21,476,408 | | | $ | 11,730,719 | |
| | | | | | | | |
Intermediate Duration Fixed Income Fund
| | | | | | | | |
| | | Year Ended
September 30, 2009 | | | Year Ended
September 30, 2008 | |
From Operations: | | | | | | | | |
Net investment income | | $ | 1,406,865 | | | $ | 1,710,957 | |
Net realized loss on investments, futures contracts and foreign currency transactions | | | (271,669 | ) | | | (209,781 | ) |
Net change in unrealized appreciation (depreciation) on investments, futures contracts and foreign currency translations | | | 2,844,302 | | | | (1,630,849 | ) |
| | | | | | | | |
Net increase (decrease) in net assets resulting from operations | | | 3,979,498 | | | | (129,673 | ) |
| | | | | | | | |
From Distributions to Shareholders: | | | | | | | | |
Net Investment Income: | | | | | | | | |
Institutional Class | | | (1,361,910 | ) | | | (1,768,089 | ) |
Capital Gains: | | | | | | | | |
Institutional Class | | | — | | | | — | |
| | | | | | | | |
Total distributions | | | (1,361,910 | ) | | | (1,768,089 | ) |
| | | | | | | | |
Increase (Decrease) in Net Assets Derived from Capital Share Transactions (Note 9) | | | (7,338,103 | ) | | | 3,200,454 | |
| | | | | | | | |
Net increase (decrease) in net assets | | | (4,720,515 | ) | | | 1,302,692 | |
Net Assets | | | | | | | | |
Beginning of year | | | 32,747,844 | | | | 31,445,152 | |
| | | | | | | | |
End of year | | $ | 28,027,329 | | | $ | 32,747,844 | |
| | | | | | | | |
Undistributed Net Investment Income | | $ | 62,444 | | | $ | 6,401 | |
| | | | | | | | |
See accompanying notes to financial statements.
125
Investment Grade Fixed Income Fund
| | | | | | | | |
| | | Year Ended
September 30, 2009 | | | Year Ended
September 30, 2008 | |
From Operations: | | | | | | | | |
Net investment income | | $ | 22,961,017 | | | $ | 16,556,515 | |
Net realized gain (loss) on investments and foreign currency transactions | | | (3,520,541 | ) | | | 8,215,732 | |
Net change in unrealized appreciation (depreciation) on investments and foreign currency translations | | | 69,572,140 | | | | (43,421,522 | ) |
| | | | | | | | |
Net increase (decrease) in net assets resulting from operations | | | 89,012,616 | | | | (18,649,275 | ) |
| | | | | | | | |
From Distributions to Shareholders: | | | | | | | | |
Net Investment Income: | | | | | | | | |
Institutional Class | | | (25,648,228 | ) | | | (19,088,772 | ) |
Capital Gains: | | | | | | | | |
Institutional Class | | | (3,479,011 | ) | | | — | |
| | | | | | | | |
Total distributions | | | (29,127,239 | ) | | | (19,088,772 | ) |
| | | | | | | | |
Increase in Net Assets Derived from Capital Share Transactions (Note 9) | | | 187,755,770 | | | | 53,860,153 | |
| | | | | | | | |
Net increase in net assets | | | 247,641,147 | | | | 16,122,106 | |
Net Assets | | | | | | | | |
Beginning of year | | | 277,862,818 | | | | 261,740,712 | |
| | | | | | | | |
End of year | | $ | 525,503,965 | | | $ | 277,862,818 | |
| | | | | | | | |
Undistributed Net Investment Income (Distributions in Excess of Net Investment Income) | | $ | (187,459 | ) | | $ | 4,075,614 | |
| | | | | | | | |
See accompanying notes to financial statements.
126
FINANCIAL HIGHLIGHTS
For a share outstanding throughout each period.
| | | | | | | | | | | | | | | | | | | | | | | | | | | | |
| | | | | Income (Loss) from Investment Operations: | | | | | Less Distributions: | |
| | | Net asset
value,
beginning
of the period | | Net
investment
income(a) | | Net realized
and unrealized
gain (loss) | | | Total from
investment
operations | | | | | Dividends
from
net investment
income | | | Distributions
from net
realized
capital gains | | | Total
distributions | |
| Bond Fund | | | | | | | | | | | | | | | | | | | | | | | | | |
| | | | | | | |
| Institutional Class | | | | | | | | | | | | | | | | | | | | | | | | | |
9/30/2009 | | $ | 11.89 | | $ | 0.85 | | $ | 1.23 | | | $ | 2.08 | | | | | $ | (0.87 | ) | | $ | (0.11 | ) | | $ | (0.98 | ) |
9/30/2008 | | | 14.71 | | | 0.96 | | | (2.77 | ) | | | (1.81 | ) | | | | | (1.01 | ) | | | — | | | | (1.01 | ) |
9/30/2007 | | | 14.13 | | | 0.83 | | | 0.58 | | | | 1.41 | | | | | | (0.83 | ) | | | — | | | | (0.83 | ) |
9/30/2006 | | | 13.81 | | | 0.72 | | | 0.47 | | | | 1.19 | | | | | | (0.87 | ) | | | — | | | | (0.87 | ) |
9/30/2005 | | | 13.46 | | | 0.67 | | | 0.57 | | | | 1.24 | | | | | | (0.89 | ) | | | — | | | | (0.89 | ) |
| | | | | | | |
| Retail Class | | | | | | | | | | | | | | | | | | | | | | | | | |
9/30/2009 | | $ | 11.85 | | $ | 0.82 | | $ | 1.22 | | | $ | 2.04 | | | | | $ | (0.84 | ) | | $ | (0.11 | ) | | $ | (0.95 | ) |
9/30/2008 | | | 14.67 | | | 0.92 | | | (2.77 | ) | | | (1.85 | ) | | | | | (0.97 | ) | | | — | | | | (0.97 | ) |
9/30/2007 | | | 14.10 | | | 0.79 | | | 0.57 | | | | 1.36 | | | | | | (0.79 | ) | | | — | | | | (0.79 | ) |
9/30/2006 | | | 13.78 | | | 0.69 | | | 0.47 | | | | 1.16 | | | | | | (0.84 | ) | | | — | | | | (0.84 | ) |
9/30/2005 | | | 13.44 | | | 0.64 | | | 0.57 | | | | 1.21 | | | | | | (0.87 | ) | | | — | | | | (0.87 | ) |
| | | | | | | |
| Admin Class | | | | | | | | | | | | | | | | | | | | | | | | | |
9/30/2009 | | $ | 11.82 | | $ | 0.79 | | $ | 1.22 | | | $ | 2.01 | | | | | $ | (0.81 | ) | | $ | (0.11 | ) | | $ | (0.92 | ) |
9/30/2008 | | | 14.64 | | | 0.88 | | | (2.76 | ) | | | (1.88 | ) | | | | | (0.94 | ) | | | — | | | | (0.94 | ) |
9/30/2007 | | | 14.07 | | | 0.75 | | | 0.58 | | | | 1.33 | | | | | | (0.76 | ) | | | — | | | | (0.76 | ) |
9/30/2006 | | | 13.75 | | | 0.65 | | | 0.48 | | | | 1.13 | | | | | | (0.81 | ) | | | — | | | | (0.81 | ) |
9/30/2005 | | | 13.42 | | | 0.60 | | | 0.56 | | | | 1.16 | | | | | | (0.83 | ) | | | — | | | | (0.83 | ) |
(a) Per share net investment income has been calculated using the average shares outstanding during the period.
(b) Amount rounds to less than $0.01 per share, if applicable.
(c) Effective June 2, 2008, redemption fees were eliminated.
(d) Had certain expenses not been reduced during the period, if applicable, total returns would have been lower. Periods less than one year, if applicable, are not annualized.
(e) The investment adviser and/or administrator agreed to reimburse a portion of the Fund’s expenses and/or reduce its fees during the period. Without this reimbursement/fee reduction, if applicable, expenses would have been higher.
(f) Computed on an annualized basis for periods less than one year, if applicable.
(g) Effective July 1, 2007, the Fund decreased its net expense limitations to 0.70%, 0.95% and 1.20% from 0.75%, 1.00% and 1.25% for the Institutional Class, Retail Class and Admin Class, respectively.
(h) Includes fee/expense recovery of 0.02%.
(i) Includes fee/expense recovery of less than 0.01%.
See accompanying notes to financial statements.
127
| | | | | | | | | | | | | | | | | | | | |
| | | | | | | | | | Ratios to Average Net Assets: | | |
Redemption
fees(b)(c) | | Net asset
value,
end of
the period | | Total
return (%)(d) | | | Net assets,
end of
the period
(000’s) | | Net
expenses (%)(e)(f) | | | Gross
expenses (%)(f) | | | Net
investment
income (%)(f) | | Portfolio
turnover
rate (%) |
| | | | | | | | | | | | | | | | | | | | |
| | | | | | | |
| | | | | | | | | | | | | | | | | | | | |
| $ | — | | $ | 12.99 | | 19.84 | | | $ | 10,855,818 | | 0.65 | | | 0.65 | | | 7.69 | | 39 |
| | 0.00 | | | 11.89 | | (13.14 | ) | | | 7,616,621 | | 0.64 | | | 0.64 | | | 6.78 | | 26 |
| | 0.00 | | | 14.71 | | 10.28 | | | | 7,716,061 | | 0.67 | (g) | | 0.67 | | | 5.75 | | 20 |
| | 0.00 | | | 14.13 | | 9.00 | | | | 4,742,622 | | 0.75 | (h) | | 0.75 | (h) | | 5.20 | | 26 |
| | 0.00 | | | 13.81 | | 9.46 | | | | 3,303,997 | | 0.75 | | | 0.79 | | | 4.91 | | 22 |
| | | | | | | |
| | | | | | | | | | | | | | | | | | | | |
| $ | — | | $ | 12.94 | | 19.46 | | | $ | 7,646,591 | | 0.95 | | | 0.96 | | | 7.44 | | 39 |
| | 0.00 | | | 11.85 | | (13.44 | ) | | | 6,863,594 | | 0.94 | (i) | | 0.94 | (i) | | 6.49 | | 26 |
| | 0.00 | | | 14.67 | | 9.93 | | | | 6,432,333 | | 0.97 | (g) | | 0.97 | | | 5.49 | | 20 |
| | 0.00 | | | 14.10 | | 8.79 | | | | 2,232,632 | | 1.00 | | | 1.01 | | | 4.99 | | 26 |
| | 0.00 | | | 13.78 | | 9.19 | | | | 707,394 | | 1.00 | | | 1.05 | | | 4.64 | | 22 |
| | | | | | | |
| | | | | | | | | | | | | | | | | | | | |
| $ | — | | $ | 12.91 | | 19.21 | | | $ | 226,032 | | 1.20 | | | 1.25 | | | 7.22 | | 39 |
| | 0.00 | | | 11.82 | | (13.69 | ) | | | 210,494 | | 1.20 | | | 1.24 | | | 6.23 | | 26 |
| | 0.00 | | | 14.64 | | 9.66 | | | | 193,850 | | 1.23 | (g)(i) | | 1.23 | (i) | | 5.20 | | 20 |
| | 0.00 | | | 14.07 | | 8.51 | | | | 106,941 | | 1.25 | | | 1.29 | | | 4.71 | | 26 |
| | 0.00 | | | 13.75 | | 8.86 | | | | 64,263 | | 1.25 | | | 1.31 | | | 4.39 | | 22 |
See accompanying notes to financial statements.
128
FINANCIAL HIGHLIGHTS – continued
For a share outstanding throughout each period.
| | | | | | | | | | | | | | | | | | | | | | | | | | | | |
| | | | | Income (Loss) from Investment Operations: | | | | | Less Distributions: | |
| | | Net asset
value,
beginning
of the period | | Net
investment
income(a) | | Net realized
and unrealized
gain (loss) | | | Total from
investment
operations | | | | | Dividends
from
net investment
income | | | Distributions
from net
realized
capital gains | | | Total
distributions | |
| Fixed Income Fund | | | | | | | | | | | | | | | | | | | | | | | | | |
| | | | | | | |
| Institutional Class | | | | | | | | | | | | | | | | | | | | | | | | | |
9/30/2009 | | $ | 12.15 | | $ | 0.78 | | $ | 1.15 | | | $ | 1.93 | | | | | $ | (0.89 | ) | | $ | (0.25 | ) | | $ | (1.14 | ) |
9/30/2008 | | | 14.49 | | | 0.88 | | | (2.14 | ) | | | (1.26 | ) | | | | | (1.06 | ) | | | (0.02 | ) | | | (1.08 | ) |
9/30/2007 | | | 13.89 | | | 0.83 | | | 0.67 | | | | 1.50 | | | | | | (0.90 | ) | | | — | | | | (0.90 | ) |
9/30/2006 | | | 13.88 | | | 0.74 | | | 0.30 | | | | 1.04 | | | | | | (1.03 | ) | | | — | | | | (1.03 | ) |
9/30/2005 | | | 13.93 | | | 0.75 | | | 0.58 | | | | 1.33 | | | | | | (1.38 | ) | | | — | | | | (1.38 | ) |
| | | | | | | |
| Global Bond Fund | | | | | | | | | | | | | | | | | | | | | | | | | |
| | | | | | | |
| Institutional Class | | | | | | | | | | | | | | | | | | | | | | | | | |
9/30/2009 | | $ | 14.42 | | $ | 0.67 | | $ | 1.89 | | | $ | 2.56 | | | | | $ | (0.89 | ) | | $ | — | | | $ | (0.89 | ) |
9/30/2008 | | | 15.83 | | | 0.70 | | | (1.30 | ) | | | (0.60 | ) | | | | | (0.81 | ) | | | — | | | | (0.81 | ) |
9/30/2007 | | | 15.43 | | | 0.60 | | | 0.70 | | | | 1.30 | | | | | | (0.90 | ) | | | — | | | | (0.90 | ) |
9/30/2006 | | | 15.57 | | | 0.48 | | | 0.16 | | | | 0.64 | | | | | | (0.70 | ) | | | (0.08 | ) | | | (0.78 | ) |
9/30/2005 | | | 15.59 | | | 0.44 | | | 0.05 | | | | 0.49 | | | | | | (0.46 | ) | | | (0.05 | ) | | | (0.51 | ) |
| | | | | | | |
| Retail Class | | | | | | | | | | | | | | | | | | | | | | | | | |
9/30/2009 | | $ | 14.31 | | $ | 0.62 | | $ | 1.88 | | | $ | 2.50 | | | | | $ | (0.85 | ) | | $ | — | | | $ | (0.85 | ) |
9/30/2008 | | | 15.71 | | | 0.64 | | | (1.29 | ) | | | (0.65 | ) | | | | | (0.75 | ) | | | — | | | | (0.75 | ) |
9/30/2007 | | | 15.29 | | | 0.54 | | | 0.70 | | | | 1.24 | | | | | | (0.82 | ) | | | — | | | | (0.82 | ) |
9/30/2006 | | | 15.43 | | | 0.44 | | | 0.15 | | | | 0.59 | | | | | | (0.65 | ) | | | (0.08 | ) | | | (0.73 | ) |
9/30/2005 | | | 15.46 | | | 0.40 | | | 0.05 | | | | 0.45 | | | | | | (0.43 | ) | | | (0.05 | ) | | | (0.48 | ) |
(a) Per share net investment income has been calculated using the average shares outstanding during the period.
(b) Amount rounds to less than $0.01 per share, if applicable.
(c) Had certain expenses not been reduced during the period, if applicable, total returns would have been lower. Periods less than one year, if applicable, are not annualized.
(d) The investment adviser and/or administrator agreed to reimburse a portion of the Fund’s expenses and/or reduce its fees during the period. Without this reimbursement/fee reduction, if applicable, expenses would have been higher.
(e) Computed on an annualized basis for periods less than one year, if applicable.
(f) Includes fee/expense recovery of less than 0.01% and 0.03% for Fixed Income Fund and Global Bond Fund, respectively.
(g) Effective June 2, 2008, redemption fees were eliminated.
(h) Includes fee/expense recovery of 0.02%.
See accompanying notes to financial statements.
129
| | | | | | | | | | | | | | | | | | | | | |
| | | | | | | | | | | Ratios to Average Net Assets: | | |
Redemption
fees(b) | | | Net asset
value,
end of
the period | | Total
return (%)(c) | | | Net assets,
end of
the period
(000’s) | | Net
expenses (%)(d)(e) | | | Gross
expenses (%)(e) | | | Net
investment
income (%)(e) | | Portfolio
turnover
rate (%) |
| | | | | | | | | | | | | | | | | | | | | |
| | | | | | | |
| | | | | | | | | | | | | | | | | | | | | |
| $ | — | | | $ | 12.94 | | 19.55 | | | $ | 761,955 | | 0.58 | | | 0.58 | | | 7.11 | | 29 |
| | — | | | | 12.15 | | (9.42 | ) | | | 624,486 | | 0.58 | | | 0.58 | | | 6.43 | | 30 |
| | — | | | | 14.49 | | 11.31 | | | | 605,100 | | 0.60 | | | 0.60 | | | 5.96 | | 22 |
| | — | | | | 13.89 | | 8.06 | | | | 456,011 | | 0.60 | (f) | | 0.60 | (f) | | 5.48 | | 40 |
| | — | | | | 13.88 | | 9.90 | | | | 444,552 | | 0.65 | | | 0.65 | | | 5.47 | | 34 |
| | | | | | | |
| | | | | | | | | | | | | | | | | | | | | |
| | | | | | | |
| | | | | | | | | | | | | | | | | | | | | |
| $ | — | | | $ | 16.09 | | 19.19 | | | $ | 1,032,465 | | 0.68 | | | 0.68 | | | 4.76 | | 75 |
| | 0.00 | (g) | | | 14.42 | | (4.14 | ) | | | 1,157,175 | | 0.64 | | | 0.64 | | | 4.36 | | 60 |
| | 0.00 | | | | 15.83 | | 8.70 | | | | 996,046 | | 0.68 | | | 0.68 | | | 3.84 | | 95 |
| | 0.00 | | | | 15.43 | | 4.32 | | | | 643,991 | | 0.74 | (f) | | 0.74 | (f) | | 3.21 | | 77 |
| | 0.00 | | | | 15.57 | | 3.05 | | | | 553,704 | | 0.75 | | | 0.80 | | | 2.75 | | 63 |
| | | | | | | |
| | | | | | | | | | | | | | | | | | | | | |
| $ | — | | | $ | 15.96 | | 18.81 | | | $ | 918,742 | | 1.00 | | | 1.02 | | | 4.46 | | 75 |
| | 0.00 | (g) | | | 14.31 | | (4.45 | ) | | | 1,073,466 | | 1.00 | (h) | | 1.00 | (h) | | 4.02 | | 60 |
| | 0.00 | | | | 15.71 | | 8.36 | | | | 874,575 | | 1.00 | | | 1.04 | | | 3.53 | | 95 |
| | 0.00 | | | | 15.29 | | 4.03 | | | | 540,697 | | 1.00 | | | 1.09 | | | 2.93 | | 77 |
| | 0.00 | | | | 15.43 | | 2.84 | | | | 699,498 | | 1.00 | | | 1.09 | | | 2.57 | | 63 |
See accompanying notes to financial statements.
130
FINANCIAL HIGHLIGHTS – continued
For a share outstanding throughout each period.
| | | | | | | | | | | | | | | | | | | | | | | | | | | | | |
| | | | | Income (Loss) from Investment Operations: | | | | | Less Distributions: | |
| | | Net asset
value,
beginning
of the period | | Net
investment
income(a) | | | Net realized
and unrealized
gain (loss) | | | Total from
investment
operations | | | | | Dividends
from
net investment
income | | | Distributions
from net
realized
capital gains | | | Total
distributions | |
| Inflation Protected Securities Fund | | | | | | | | | | | | | | | | | | | |
| | | | | | | |
| Institutional Class | | | | | | | | | | | | | | | | | | | | | | | | | | |
9/30/2009 | | $ | 9.86 | | $ | 0.09 | (e) | | $ | 0.61 | | | $ | 0.70 | | | | | $ | (0.10 | ) | | $ | — | | | $ | (0.10 | ) |
9/30/2008 | | | 10.31 | | | 0.73 | | | | (0.43 | ) | | | 0.30 | | | | | | (0.75 | ) | | | — | | | | (0.75 | ) |
9/30/2007 | | | 10.30 | | | 0.47 | | | | 0.03 | | | | 0.50 | | | | | | (0.49 | ) | | | — | | | | (0.49 | ) |
9/30/2006 | | | 10.84 | | | 0.52 | | | | (0.38 | ) | | | 0.14 | | | | | | (0.63 | ) | | | (0.05 | ) | | | (0.68 | ) |
9/30/2005 | | | 11.02 | | | 0.42 | | | | (0.08 | ) | | | 0.34 | | | | | | (0.52 | ) | | | — | | | | (0.52 | ) |
| | | | | |
| Institutional High Income Fund | | | | | | | | | | | | | | | | | | | |
| | | | | | | |
| Institutional Class | | | | | | | | | | | | | | | | | | | | | | | | | | |
9/30/2009 | | $ | 6.87 | | $ | 0.57 | | | $ | 0.54 | | | $ | 1.11 | | | | | $ | (0.49 | ) | | $ | (0.09 | ) | | $ | (0.58 | ) |
9/30/2008 | | | 8.45 | | | 0.60 | | | | (1.52 | ) | | | (0.92 | ) | | | | | (0.51 | ) | | | (0.15 | ) | | | (0.66 | ) |
9/30/2007 | | | 8.11 | | | 0.55 | | | | 0.30 | | | | 0.85 | | | | | | (0.51 | ) | | | — | | | | (0.51 | ) |
9/30/2006 | | | 7.80 | | | 0.50 | | | | 0.34 | | | | 0.84 | | | | | | (0.53 | ) | | | — | | | | (0.53 | ) |
9/30/2005 | | | 7.50 | | | 0.55 | | | | 0.39 | | | | 0.94 | | | | | | (0.64 | ) | | | — | | | | (0.64 | ) |
| | | | | |
| Intermediate Duration Fixed Income Fund | | | | | | | | | | | | | | | | | | | |
| | | | | | | |
| Institutional Class | | | | | | | | | | | | | | | | | | | | | | | | | | |
9/30/2009 | | $ | 8.95 | | $ | 0.48 | | | $ | 0.98 | | | $ | 1.46 | | | | | $ | (0.46 | ) | | $ | — | | | $ | (0.46 | ) |
9/30/2008 | | | 9.47 | | | 0.47 | | | | (0.50 | ) | | | (0.03 | ) | | | | | (0.49 | ) | | | — | | | | (0.49 | ) |
9/30/2007 | | | 9.50 | | | 0.45 | | | | (0.01 | ) | | | 0.44 | | | | | | (0.47 | ) | | | — | | | | (0.47 | ) |
9/30/2006 | | | 9.60 | | | 0.42 | | | | (0.07 | ) | | | 0.35 | | | | | | (0.45 | ) | | | — | | | | (0.45 | ) |
9/30/2005 | | | 9.92 | | | 0.40 | | | | (0.25 | ) | | | 0.15 | | | | | | (0.45 | ) | | | (0.02 | ) | | | (0.47 | ) |
| | | | | |
| Investment Grade Fixed Income Fund | | | | | | | | | | | | | | | | | | | |
| | | | | | | |
| Institutional Class | | | | | | | | | | | | | | | | | | | | | | | | | | |
9/30/2009 | | $ | 11.36 | | $ | 0.67 | | | $ | 1.31 | | | $ | 1.98 | | | | | $ | (0.81 | ) | | $ | (0.14 | ) | | $ | (0.95 | ) |
9/30/2008 | | | 12.96 | | | 0.76 | | | | (1.47 | ) | | | (0.71 | ) | | | | | (0.89 | ) | | | — | | | | (0.89 | ) |
9/30/2007 | | | 12.63 | | | 0.70 | | | | 0.53 | | | | 1.23 | | | | | | (0.90 | ) | | | — | | | | (0.90 | ) |
9/30/2006 | | | 13.28 | | | 0.60 | | | | 0.22 | | | | 0.82 | | | | | | (0.92 | ) | | | (0.55 | ) | | | (1.47 | ) |
9/30/2005 | | | 13.54 | | | 0.57 | | | | 0.27 | | | | 0.84 | | | | | | (0.83 | ) | | | (0.27 | ) | | | (1.10 | ) |
(a) Per share net investment income has been calculated using the average shares outstanding during the period.
(b) Had certain expenses not been reduced during the period, if applicable, total returns would have been lower. Periods less than one year, if applicable, are not annualized.
(c) The investment adviser and/or administrator agreed to reimburse a portion of the Fund’s expenses and/or reduce its fees during the period. Without this reimbursement/fee reduction, if applicable, expenses would have been higher.
(d) Computed on an annualized basis for periods less than one year, if applicable.
(e) Includes income reductions resulting from principal deflation adjustments during the period in the amount of $0.14 per share and 1.44% of average net assets. See Note 2b of Notes to Financial Statements.
(f) Effective July 1, 2005, the Intermediate Duration Fixed Income Fund and the Inflation Protected Securities Fund decreased their net expense limitations to 0.40% and 0.45%, respectively, from 0.45% and 0.50%, respectively.
(g) Includes fee/expense recovery of 0.01%.
(h) Includes fee/expense recovery of less than 0.01%.
See accompanying notes to financial statements.
131
| | | | | | | | | | | | | | | | | | |
| | | | | | | | Ratios to Average Net Assets: | | | |
Net asset
value,
end of
the period | | Total
return (%)(b) | | | Net assets,
end of
the period
(000’s) | | Net
expenses (%)(c)(d) | | | Gross
expenses (%)(d) | | | Net
investment
income (%)(d) | | | Portfolio
turnover
rate (%) |
| | | | | | | | | | | | | | | | | | |
| | | | | | |
| | | | | | | | | | | | | | | | | | |
| $ | 10.46 | | 7.21 | | | $ | 13,976 | | 0.40 | | | 1.11 | | | 0.88 | (e) | | 12 |
| | 9.86 | | 2.64 | | | | 16,033 | | 0.40 | | | 0.95 | | | 6.85 | | | 22 |
| | 10.31 | | 5.05 | | | | 13,468 | | 0.40 | | | 1.28 | | | 4.60 | | | 26 |
| | 10.30 | | 1.48 | | | | 9,053 | | 0.40 | | | 1.69 | | | 4.96 | | | 41 |
| | 10.84 | | 3.12 | | | | 9,298 | | 0.49 | (f) | | 1.54 | | | 3.81 | | | 141 |
| | | | | | |
| | | | | | | | | | | | | | | | | | |
| | | | | | |
| | | | | | | | | | | | | | | | | | |
| $ | 7.40 | | 20.82 | | | $ | 458,516 | | 0.72 | | | 0.72 | | | 9.54 | | | 37 |
| | 6.87 | | (11.70 | ) | | | 214,201 | | 0.72 | | | 0.72 | | | 7.70 | | | 35 |
| | 8.45 | | 10.81 | | | | 187,568 | | 0.75 | (g) | | 0.75 | (g) | | 6.60 | | | 31 |
| | 8.11 | | 11.56 | | | | 141,318 | | 0.75 | | | 0.79 | | | 6.40 | | | 23 |
| | 7.80 | | 12.99 | | | | 110,533 | | 0.75 | | | 0.82 | | | 7.24 | | | 22 |
| | | | | | |
| | | | | | | | | | | | | | | | | | |
| | | | | | |
| | | | | | | | | | | | | | | | | | |
| $ | 9.95 | | 16.99 | | | $ | 28,027 | | 0.40 | | | 0.68 | | | 5.24 | | | 52 |
| | 8.95 | | (0.46 | ) | | | 32,748 | | 0.40 | | | 0.59 | | | 5.00 | | | 65 |
| | 9.47 | | 4.76 | | | | 31,445 | | 0.40 | | | 0.61 | | | 4.71 | | | 87 |
| | 9.50 | | 3.82 | | | | 41,851 | | 0.40 | | | 0.62 | | | 4.48 | | | 62 |
| | 9.60 | | 1.50 | | | | 40,628 | | 0.44 | (f) | | 0.68 | | | 4.10 | | | 50 |
| | | | | | |
| | | | | | | | | | | | | | | | | | |
| | | | | | |
| | | | | | | | | | | | | | | | | | |
| $ | 12.39 | | 19.35 | | | $ | 525,504 | | 0.49 | | | 0.49 | | | 6.10 | | | 22 |
| | 11.36 | | (6.00 | ) | | | 277,863 | | 0.50 | | | 0.50 | | | 5.98 | | | 32 |
| | 12.96 | | 10.19 | | | | 261,741 | | 0.53 | | | 0.53 | | | 5.52 | | | 23 |
| | 12.63 | | 6.81 | | | | 173,549 | | 0.55 | (h) | | 0.55 | (h) | | 4.79 | | | 50 |
| | 13.28 | | 6.42 | | | | 186,749 | | 0.55 | | | 0.58 | | | 4.28 | | | 42 |
See accompanying notes to financial statements.
132
NOTES TO FINANCIAL STATEMENTS
September 30, 2009
1. Organization. Loomis Sayles Funds I (the “Trust”) is organized as a Massachusetts business trust. The Trust is registered under the Investment Company Act of 1940, as amended (the “1940 Act”) as an open-end management investment company. The Declaration of Trust permits the Board of Trustees to authorize the issuance of an unlimited number of shares of the Trust in multiple series. Shares of certain funds in the Trust were first registered under the Securities Act of 1933 (the “1933 Act”) effective March 7, 1997 (subsequent to their commencement of investment operations). The financial statements for certain funds of the Trust are presented in separate reports. The following funds (individually, a “Fund” and collectively, the “Funds”) are included in this report:
Loomis Sayles Bond Fund (the “Bond Fund”)
Loomis Sayles Fixed Income Fund (the “Fixed Income Fund”)
Loomis Sayles Global Bond Fund (the “Global Bond Fund”)
Loomis Sayles Inflation Protected Securities Fund (the “Inflation Protected Securities Fund”)
Loomis Sayles Institutional High Income Fund (the “Institutional High Income Fund”)
Loomis Sayles Intermediate Duration Fixed Income Fund (the “Intermediate Duration Fixed Income Fund”)
Loomis Sayles Investment Grade Fixed Income Fund (the “Investment Grade Fixed Income Fund”)
Each Fund offers Institutional Class Shares. Bond Fund and Global Bond Fund also offer Retail Class Shares. In addition, Bond Fund offers Admin Class Shares.
Most expenses of the Trust can be directly attributed to a Fund. Expenses which cannot be directly attributed to a Fund are generally apportioned based on the relative net assets of each of the Funds in the Trust. Expenses of a Fund are borne pro rata by the holders of each class of shares, except that each class bears expenses unique to that class (including the Rule 12b-1 service and distribution fees and transfer agent fees applicable to such class). In addition, each class votes as a class only with respect to its own Rule 12b-1 Plan. Shares of each class would receive their pro rata share of the net assets of a Fund if the Fund were liquidated. The Trustees approve separate dividends from net investment income on each class of shares.
2. Significant Accounting Policies. The following is a summary of significant accounting policies consistently followed by each Fund in the preparation of its financial statements. The Funds�� financial statements are prepared in accordance with accounting principles generally accepted in the United States of America which require the use of management estimates that affect the reported amounts and disclosures in the financial statements. Actual results could differ from those estimates. Management has evaluated the events and transactions that have occurred through November 23, 2009, the date the financial statements were issued, and noted no items requiring recognition in the financial statements or additional disclosure in the Notes to Financial Statements.
a. Valuation. Debt securities (other than short-term obligations purchased with an original or remaining maturity of sixty days or less) are generally valued on the basis of evaluated bids furnished to the Funds by a pricing service recommended by the investment adviser and approved by the Board of Trustees, which service determines valuations for normal, institutional size-trading units of such securities using market information, transactions for comparable securities and various relationships between securities which are generally recognized by institutional traders. Equity securities, including closed-end investment companies and exchange traded funds, for which market quotations are readily available are valued at market value, as reported by pricing services recommended by the investment adviser and approved by the Board of Trustees. Such pricing services generally use the security’s last sale price on the exchange or market where the security is primarily traded or, if there is no reported sale during the day, the closing bid price. Securities traded on the NASDAQ Global Select Market, NASDAQ Global Market and NASDAQ Capital Market are valued at the NASDAQ Official Closing Price (“NOCP”), or if lacking a NOCP, at the most recent bid quotation on the applicable NASDAQ Market. Broker-dealer bid quotations may also be used to value debt and equity securities where a pricing service does not price a security or where a pricing service does not provide a reliable price for the security. In instances where broker-dealer bid quotations are not available, certain securities held by the Funds may be valued on the basis of a price provided by a principal market maker. Forward foreign currency contracts are valued utilizing interpolated prices determined from information provided by an independent pricing service. Futures contracts are valued at their most recent settlement price. Credit default swaps are valued based on prices supplied by a pricing service, if available, or quotations obtained from broker-dealers. Short-term obligations purchased with an original or remaining maturity of sixty days or less are valued at amortized cost, which approximates market value. Securities for which market quotations are not readily available are valued at fair value as determined in good faith by the Funds’ investment adviser using consistently applied procedures under the general supervision of the Board of Trustees. Investments in other open-end investment companies are valued at their net asset value each day.
133
The Funds may hold securities traded in foreign markets. Foreign securities are valued at the market price in the foreign market. However, if events occurring after the close of the foreign market (but before the close of regular trading on the New York Stock Exchange) are believed to materially affect the value of those securities, such securities are fair valued pursuant to procedures approved by the Board of Trustees. When fair valuing securities, the Funds may, among other things, use modeling tools or other processes that may take into account factors such as securities market activity and/or significant events that occur after the close of the foreign market and before the Funds calculate their net asset values.
b. Security Transactions and Related Investment Income. Security transactions are accounted for on trade date. Dividend income is recorded on ex-dividend date, or in the case of certain foreign securities, as soon as a Fund is notified, and interest income is recorded on an accrual basis. Interest income is increased by the accretion of discount and decreased by the amortization of premium. Periodic principal adjustments for inflation-protected securities are recorded to interest income. Negative principal adjustments (in the event of deflation) are recorded as reductions of interest income to the extent of interest income earned. The amount by which negative principal adjustments exceed interest income earned or positive principal adjustments on a cumulative basis, is recorded as an increase to the cost basis of the security. Distributions received from investments in securities that represent a return of capital or capital gain are recorded as a reduction of cost of investments or as a realized gain, respectively. The calendar year-end amounts of ordinary income, capital gains, and return of capital included in distributions received from the Funds’ investments in real estate investment trusts (“REITs”) are reported to the Funds after the end of the fiscal year; accordingly, the Funds estimate these amounts for accounting purposes until the characterization of REIT distributions is reported to the Funds after the end of the fiscal year. Estimates are based on the most recent REIT distribution information available. Investment income is recorded net of foreign taxes withheld when applicable. In determining net gain or loss on securities sold, the cost of securities has been determined on an identified cost basis. Investment income, non-class specific expenses and realized and unrealized gains and losses are allocated on a pro rata basis to each class based on the relative net assets of each class to the total net assets of the Fund.
c. Foreign Currency Translation. The books and records of the Funds are maintained in U.S. dollars. The value of securities, currencies and other assets and liabilities denominated in currencies other than U.S. dollars are translated into U.S. dollars based upon foreign exchange rates prevailing at the end of the period. Purchases and sales of investment securities, income and expenses are translated on the respective dates of such transactions.
Since the values of investment securities are presented at the foreign exchange rates prevailing at the end of the period, it is not practical to isolate that portion of the results of operations arising from changes in exchange rates from fluctuations which arise due to changes in market prices of investment securities. Such changes are included with the net realized and unrealized gain or loss on investments.
Net realized foreign exchange gains or losses arise from sales of foreign currency, currency gains or losses realized between the trade and settlement dates on securities transactions and the difference between the amounts of dividends, interest and foreign withholding taxes recorded on the Funds’ books and the U.S. dollar equivalent of the amounts actually received or paid. Net unrealized foreign exchange gains and losses arise from changes in the value of assets and liabilities, other than investment securities, at the end of the fiscal period, resulting from changes in exchange rates.
Certain Funds may use foreign currency exchange contracts to facilitate transactions in foreign-denominated investments. Losses may arise from changes in the value of the foreign currency or if the counterparties do not perform under the contracts’ terms.
d. Forward Foreign Currency Contracts. Each Fund that may invest in foreign investments may enter into forward foreign currency contracts. Contracts to buy generally are used to acquire exposure to foreign currencies, while contracts to sell generally are used to hedge a Fund’s investments against currency fluctuation. Also, a contract to buy or sell may offset a previous contract. These contracts involve market risk in excess of the unrealized gain or loss reflected in the Funds’ Statements of Assets and Liabilities. The U.S. dollar value of the currencies a Fund has committed to buy or sell represents the aggregate exposure to each currency the Fund has acquired or hedged through currency contracts outstanding at period end. Gains or losses are recorded for financial statement purposes as unrealized until settlement date. Risks may arise upon entering into these contracts from the potential inability of counterparties to meet the terms of their contracts and from unanticipated movements in the value of a foreign currency relative to the U.S. dollar. Certain contracts require the movement of cash or securities to or from the counterparty as collateral for the Funds’ or counterparty’s net obligations under the contracts.
e. Futures Contracts. The Funds may enter into futures contracts. Futures contracts are agreements between two parties to buy and sell a particular commodity, instrument or index (e.g., an interest-bearing security) for a specified price on a specified future date.
134
NOTES TO FINANCIAL STATEMENTS – continued
September 30, 2009
When a Fund enters into a futures contract, it is required to deposit with (or for the benefit of) its broker as “initial margin” an amount of cash or liquid securities. As the value of the contract changes, the value of the futures contract position increases or declines. Subsequent payments, known as “variation margin”, are made or received by a Fund, depending on the price fluctuations in the fair value of the contract and the value of the collateral held. The aggregate principal amounts of the contracts are not recorded in the financial statements. Fluctuations in the value of the contracts are recorded in the Statements of Assets and Liabilities as an asset (liability) and in the Statements of Operations as unrealized appreciation (depreciation) until the contracts are closed, when they are recorded as realized gains (losses). Realized gain or loss on a futures position is equal to the difference between the value of the contract at the time it was opened and the value at the time it was closed, minus brokerage commissions. When a Fund enters into a futures contract certain risks may arise such as illiquidity in the futures market, which may limit a Fund’s ability to close out a futures contract prior to settlement date, and unanticipated movements in the value of securities or interest rates.
Futures contracts are exchange-traded. Exchange-traded futures have standardized contracts and are settled through a clearing house with fulfillment guaranteed by the credit of the exchange. Therefore, counterparty credit risks to the Funds are limited.
f. Swap Agreements. Each Fund may enter into credit default swaps. A credit default swap is an agreement between two parties (the “protection buyer” and “protection seller”) to exchange the credit risk of an issuer (“reference obligation”) for a specified time period. The reference obligation may be one or more debt securities or an index of such securities. The Funds may be either the protection buyer or the protection seller. The protection buyer is obligated to pay the protection seller a stream of payments (“fees”) over the term of the contract, provided that no credit event, such as a default or a downgrade in credit rating, occurs on the reference obligation. If a credit event occurs, the protection seller must pay the protection buyer the agreed upon notional value (“par value”) of the reference obligation in exchange for the reference obligation (or may pay the difference between the par value and market value of the reference obligation). The Funds may also make upfront payments as the protection buyer or receive upfront payments as the protection seller.
The notional amounts of credit default swaps are not recorded in the financial statements. Credit default swaps are marked-to-market daily. Fluctuations in the value of credit default swaps are recorded in the Statement of Operations as change in unrealized appreciation (depreciation) on swap agreements. Fees are accrued in accordance with the terms of the agreement and are recorded in the Statement of Operations as realized gain or loss when received or paid. Upfront fees received or paid by the Funds are amortized or accreted over the term of the agreement and recorded as realized gain or loss. Payments made or received by the Funds as a result of a credit event or termination of the agreement are recorded as realized gain or loss.
Credit default swaps are privately negotiated and traded between counterparties and, as such, are subject to the risk that a party to the agreement will not be able to meet its obligations. Counterparty risk is managed through the posting of collateral and, as a result, the risk of loss to a Fund from counterparty default should be limited to the extent a Fund is undercollateralized. In addition to collateral requirements, the Funds also require counterparties to meet minimum credit quality requirements. The Funds cover their net obligations under outstanding credit default swaps by segregating liquid assets in the form of collateral.
g. Federal and Foreign Income Taxes. The Trust treats each Fund as a separate entity for federal income tax purposes. Each Fund intends to meet the requirements of the Internal Revenue Code applicable to regulated investment companies, and to distribute to its shareholders substantially all of its net investment income and any net realized capital gains at least annually. Management has performed an analysis of each Fund’s tax positions for the open tax years as of September 30, 2009 and has concluded that no provisions for income tax are required. The Funds’ federal tax returns for the prior three fiscal years remain subject to examination by the Internal Revenue Service. Management is not aware of any events that are reasonably possible to occur in the next twelve months that would result in the amounts of any unrecognized tax benefits significantly increasing or decreasing for the Funds. However, management’s conclusions regarding tax positions taken may be subject to review and adjustment at a later date based on factors including, but not limited to, new tax laws and accounting regulations and interpretations thereof.
A Fund may be subject to foreign taxes on income and gains on investments that are accrued based upon the Fund’s understanding of the tax rules and regulations that exist in the countries in which the Fund invests. Foreign governments may also impose taxes or other payments on investments with respect to foreign securities. Such taxes are accrued as applicable, and are reflected as foreign taxes payable on the Statements of Assets and Liabilities.
h. Dividends and Distributions to Shareholders. Dividends and distributions are recorded on ex-dividend date. The timing and characterization of certain income and capital gain distributions are determined annually in accordance with federal tax regulations, which may differ from accounting principles generally accepted in the United States of America. Permanent differences are primarily due to differing treatments for book and tax purposes for items such as foreign currency transactions, defaulted bond adjustments, discount adjustments on inflation-protected securities, paydown gains and losses, premium
135
amortization accruals, dividend redesignations, return of capital and capital gain distributions from REITs. Permanent book and tax basis differences relating to shareholder distributions will result in reclassifications to capital accounts. Temporary differences between book and tax distributable earnings are primarily due to deferred Trustees’ fees, wash sales, premium amortization accruals, securities lending collateral gain/loss adjustments, forward contracts mark to market, futures contracts mark to market, defaulted bond interest, REIT basis adjustments and adjustments to inflation-protected securities. Distributions from net investment income and short-term capital gains are considered to be distributed from ordinary income for tax purposes.
The tax characterization of distributions is determined on an annual basis. The tax character of distributions paid to shareholders during the years ended September 30, 2009 and 2008 was as follows:
| | | | | | | | | | | | | | | | | | |
| | | 2009 Distributions Paid From: | | 2008 Distributions Paid From: |
Fund | | Ordinary
Income | | Long-Term
Capital Gains | | Total | | Ordinary
Income | | Long-Term
Capital Gains | | Total |
Bond Fund | | $ | 1,098,166,549 | | $ | 117,096,804 | | $ | 1,215,263,353 | | $ | 1,174,950,148 | | $ | — | | $ | 1,174,950,148 |
Fixed Income Fund | | | 48,541,199 | | | 8,757,966 | | | 57,299,165 | | | 43,626,372 | | | 643,688 | | | 44,270,060 |
Global Bond Fund | | | 106,651,090 | | | — | | | 106,651,090 | | | 114,644,152 | | | — | | | 114,644,152 |
Inflation Protected Securities Fund | | | 145,315 | | | — | | | 145,315 | | | 1,129,818 | | | — | | | 1,129,818 |
Institutional High Income Fund | | | 19,751,808 | | | 1,232,223 | | | 20,984,031 | | | 12,782,158 | | | 3,318,304 | | | 16,100,462 |
Intermediate Duration Fixed Income Fund | | | 1,361,910 | | | — | | | 1,361,910 | | | 1,768,089 | | | — | | | 1,768,089 |
Investment Grade Fixed Income Fund | | | 26,583,130 | | | 2,544,109 | | | 29,127,239 | | | 19,088,772 | | | — | | | 19,088,772 |
Differences between these amounts and those reported in the Statements of Changes in Net Assets, if any, are primarily attributable to different book and tax treatment for short-term capital gains.
As of September 30, 2009, the components of distributable earnings on a tax basis were as follows:
| | | | | | | | | | | | | | | | | | | | | | | | | | | | |
| | | Bond Fund | | | Fixed
Income Fund | | | Global
Bond Fund | | | Inflation
Protected
Securities
Fund | | | Institutional
High Income
Fund | | | Intermediate
Duration Fixed
Income Fund | | | Investment
Grade Fixed
Income
Fund | |
Undistributed ordinary income | | $ | 2,524,586 | | | $ | 30,724,883 | | | $ | 4,024,889 | | | $ | 5,668 | | | $ | 21,907,730 | | | $ | 105,795 | | | $ | — | |
Undistributed long-term capital gains | | | — | | | | — | | | | — | | | | — | | | | 12,256 | | | | — | | | | — | |
| | | | | | | | | | | | | | | | | | | | | | | | | | | | |
Total undistributed earnings | | | 2,524,586 | | | | 30,724,883 | | | | 4,024,889 | | | | 5,668 | | | | 21,919,986 | | | | 105,795 | | | | — | |
Capital loss carryforward: | | | | | | | | | | | | | | | | | | | | | | | | | | | | |
Expires September 30, 2013 | | | — | | | | — | | | | — | | | | — | | | | — | | | | (3,797 | ) | | | — | |
Expires September 30, 2014 | | | — | | | | — | | | | (1,046,616 | ) | | | (19,853 | ) | | | — | | | | (186,919 | ) | | | — | |
Expires September 30, 2015 | | | — | | | | — | | | | (5,497,643 | ) | | | (155,005 | ) | | | — | | | | (326,220 | ) | | | — | |
Expires September 30, 2016 | | | — | | | | — | | | | (3,309,847 | ) | | | — | | | | — | | | | (222,423 | ) | | | — | |
Expires September 30, 2017 | | | (73,277,381 | ) | | | (129,506 | ) | | | (21,329,772 | ) | | | (110,122 | ) | | | — | | | | (460,684 | ) | | | — | |
| | | | | | | | | | | | | | | | | | | | | | | | | | | | |
Total capital loss carryforward | | | (73,277,381 | ) | | | (129,506 | ) | | | (31,183,878 | ) | | | (284,980 | ) | | | — | | | | (1,200,043 | ) | | | — | |
Deferred net capital losses (post-October 2008) | | | (708,591,846 | ) | | | (19,706,451 | ) | | | (67,714,661 | ) | | | (364,539 | ) | | | (9,779,704 | ) | | | (93,838 | ) | | | (1,345,945 | ) |
Unrealized appreciation (depreciation) | | | (254,918,218 | ) | | | 24,715,132 | | | | 59,405,201 | | | | (7,979 | ) | | | 42,420,104 | | | | 911,072 | | | | 37,865,621 | |
| | | | | | | | | | | | | | | | | | | | | | | | | | | | |
Total accumulated earnings (losses) | | $ | (1,034,262,859 | ) | | $ | 35,604,058 | | | $ | (35,468,449 | ) | | $ | (651,830 | ) | | $ | 54,560,386 | | | $ | (277,014 | ) | | $ | 36,519,676 | |
| | | | | | | | | | | | | | | | | | | | | | | | | | | | |
i. Repurchase Agreements. It is each Fund’s policy that the market value of the collateral for repurchase agreements be at least equal to 100% of the repurchase price, including interest. Certain repurchase agreements are tri-party arrangements whereby the collateral is held in a segregated account for the benefit of the Fund and on behalf of the counterparty. It is each Fund’s policy, regarding tri-party arrangements, that the market value of the collateral be at least equal to 102% of the repurchase price, including interest. Repurchase agreements could involve certain risks in the event of default or insolvency of the counterparty including possible delays or restrictions upon a Fund’s ability to dispose of the underlying securities.
136
NOTES TO FINANCIAL STATEMENTS – continued
September 30, 2009
j. Delayed Delivery Commitments. Purchases of when-issued or delayed delivery instruments may have a similar effect on a Fund’s net asset value as if the Fund had created a degree of leverage in its portfolio. The price of the underlying instruments and the date when they will be paid for are fixed at the time the transaction is negotiated. If a Fund enters into such a transaction, collateral consisting of liquid securities or cash and cash equivalents will be maintained in an amount at least equal to the commitment with the custodian and/ or broker. Losses may arise due to changes in the market value of the underlying instruments or if the counterparty does not perform under the contract.
k. Securities Lending. The Funds have entered into an agreement with State Street Bank and Trust Company (“State Street Bank”), as agent of the Funds, to lend securities to certain designated borrowers. The loans are collateralized with cash or securities in an amount equal to at least 105% or 102% of the market value (including accrued interest) of the loaned international or domestic securities, respectively, when the loan is initiated. Thereafter, the value of the collateral must remain at least 102% of the market value (including accrued interest) of loaned securities for U.S. equities and U.S. corporate debt; at least 105% of the market value (including accrued interest) of loaned securities for non-U.S. equities; and at least 100% of the market value (including accrued interest) of loaned securities for U.S. government securities, sovereign debt issued by non-U.S. governments and non-U.S. corporate debt. In the event that the market value of the collateral falls below the required percentages described above, the borrower will deliver additional collateral on the next business day. As with other extensions of credit, the Funds bear the risk of loss with respect to the investment of the collateral. The Funds invest cash collateral in short-term investments, a portion of the income from which is remitted to the borrowers and the remainder allocated between the Funds and State Street Bank as lending agent.
As of September 30, 2009, there were no securities on loan.
l. Indemnifications. Under the Trust’s organizational documents, its officers and Trustees are indemnified against certain liabilities arising out of the performance of their duties to the Funds. Additionally, in the normal course of business, the Funds enter into contracts with service providers that contain general indemnification clauses. The Funds’ maximum exposure under these arrangements is unknown as this would involve future claims that may be made against the Funds that have not yet occurred. However, based on experience, the Funds expect the risk of loss to be remote.
m. Due to/from Brokers. Transactions and positions in forward foreign currency contracts and credit default swaps are primarily maintained, cleared and held by registered U.S. broker/dealers pursuant to customer agreements between the Fund and the various broker/dealers. Due to/from brokers’ balances in the Statement of Assets and Liabilities represent cash and/or securities received or paid as collateral for forward foreign currency contracts and/or credit default swaps. In certain circumstances the Fund’s use of cash and/or securities held at brokers is restricted by regulation or broker mandated limits.
3. Fair Value Measurements. Effective October 1, 2008, the Funds adopted accounting standards related to fair value measurements and disclosures which establish a hierarchy for which various inputs are used in determining the value of each Fund’s assets or liabilities. These inputs are summarized in the three broad levels listed below:
| • | | Level 1—quoted prices in active markets for identical assets or liabilities; |
| • | | Level 2—prices determined using other significant inputs that are observable either directly, or indirectly through corroboration with observable market data (which could include quoted prices for similar assets or liabilities, interest rates, credit risk, etc.); |
| • | | Level 3—prices determined using significant unobservable inputs for situations where quoted prices or observable inputs are unavailable such as when there is little or no market activity for an asset or liability (unobservable inputs reflect each Fund’s own assumptions in determining the fair value of assets or liabilities and would be based on the best information available). |
The inputs or methodology used for valuing securities are not necessarily an indication of the risk associated with investing in those securities.
137
The following is a summary of the inputs used to value the Funds’ investments as of September 30, 2009, at value:
Bond Fund
Asset Valuation Inputs
| | | | | | | | | | | | |
Description | | Level 1 | | Level 2 | | Level 3 | | Total |
Bonds and Notes | | | | | | | | | | | | |
Non-Convertible Bonds | | | | | | | | | | | | |
ABS Credit Card | | $ | — | | $ | 118,070,621 | | $ | — | | $ | 118,070,621 |
Aerospace & Defense | | | — | | | 19,178,059 | | | — | | | 19,178,059 |
Airlines | | | — | | | 247,024,474 | | | 4,164,511 | | | 251,188,985 |
Automotive | | | — | | | 540,224,320 | | | 3,570,396 | | | 543,794,716 |
Banking | | | — | | | 1,258,179,562 | | | — | | | 1,258,179,562 |
Brokerage | | | — | | | 6,260,247 | | | — | | | 6,260,247 |
Building Materials | | | — | | | 152,179,554 | | | — | | | 152,179,554 |
Chemicals | | | — | | | 103,060,565 | | | 25,744,100 | | | 128,804,665 |
Construction Machinery | | | — | | | 136,088,818 | | | — | | | 136,088,818 |
Consumer Cyclical Services | | | — | | | 154,772,360 | | | — | | | 154,772,360 |
Consumer Products | | | — | | | 33,278,448 | | | — | | | 33,278,448 |
Distributors | | | — | | | 5,781,954 | | | — | | | 5,781,954 |
Diversified Manufacturing | | | — | | | 102,692,254 | | | 30,625,436 | | | 133,317,690 |
Electric | | | — | | | 527,043,118 | | | — | | | 527,043,118 |
Entertainment | | | — | | | 40,033,334 | | | — | | | 40,033,334 |
Financial Other | | | — | | | 39,184,728 | | | — | | | 39,184,728 |
Food & Beverage | | | — | | | 193,930,692 | | | — | | | 193,930,692 |
Government Owned—No Guarantee | | | — | | | 21,710,186 | | | — | | | 21,710,186 |
Government Sponsored | | | — | | | 62,876,545 | | | — | | | 62,876,545 |
Health Insurance | | | — | | | 238,409,366 | | | — | | | 238,409,366 |
Healthcare | | | — | | | 651,694,351 | | | — | | | 651,694,351 |
Home Construction | | | — | | | 287,331,521 | | | — | | | 287,331,521 |
Independent Energy | | | — | | | 246,278,027 | | | — | | | 246,278,027 |
Industrial Other | | | — | | | 24,650,687 | | | — | | | 24,650,687 |
Integrated Energy | | | — | | | — | | | 1,447,652 | | | 1,447,652 |
Life Insurance | | | — | | | 81,822,062 | | | — | | | 81,822,062 |
Local Authorities | | | — | | | 147,224,075 | | | — | | | 147,224,075 |
Media Cable | | | — | | | 435,636,587 | | | — | | | 435,636,587 |
Media Non-Cable | | | — | | | 100,583,358 | | | — | | | 100,583,358 |
Metals & Mining | | | — | | | 139,854,362 | | | — | | | 139,854,362 |
Mortgage Related | | | — | | | 303,242 | | | — | | | 303,242 |
Non-Captive Consumer | | | — | | | 569,665,086 | | | 5,428,994 | | | 575,094,080 |
Non-Captive Diversified | | | — | | | 1,064,859,213 | | | 4,017,538 | | | 1,068,876,751 |
Oil Field Services | | | — | | | 425,645,551 | | | — | | | 425,645,551 |
Packaging | | | — | | | 27,209,496 | | | — | | | 27,209,496 |
Paper | | | — | | | 475,645,687 | | | — | | | 475,645,687 |
Pharmaceuticals | | | — | | | 133,045,556 | | | — | | | 133,045,556 |
Pipelines | | | — | | | 401,340,989 | | | — | | | 401,340,989 |
Property & Casualty Insurance | | | — | | | 166,888,240 | | | — | | | 166,888,240 |
Railroads | | | — | | | 66,187,177 | | | — | | | 66,187,177 |
Refining | | | — | | | 1,591,453 | | | — | | | 1,591,453 |
REITs | | | — | | | 229,664,692 | | | — | | | 229,664,692 |
Restaurants | | | — | | | 2,708,034 | | | — | | | 2,708,034 |
Retailers | | | — | | | 446,326,841 | | | — | | | 446,326,841 |
Sovereigns | | | — | | | 835,695,676 | | | — | | | 835,695,676 |
138
NOTES TO FINANCIAL STATEMENTS – continued
September 30, 2009
Bond Fund
Asset Valuation Inputs – continued
| | | | | | | | | | | | |
Description | | Level 1 | | Level 2 | | Level 3 | | Total |
Bonds and Notes – continued | | | | | | | | | | | | |
Non-Convertible Bonds – continued | | | | | | | | | | | | |
Supermarkets | | $ | — | | $ | 143,022,800 | | $ | — | | $ | 143,022,800 |
Supranational | | | — | | | 452,085,163 | | | 45,293,529 | | | 497,378,692 |
Technology | | | — | | | 434,922,336 | | | 225,000 | | | 435,147,336 |
Tobacco | | | — | | | 232,822,467 | | | — | | | 232,822,467 |
Transportation Services | | | — | | | 96,478,592 | | | — | | | 96,478,592 |
Treasuries | | | — | | | 2,440,871,430 | | | — | | | 2,440,871,430 |
Wireless | | | — | | | 281,410,263 | | | — | | | 281,410,263 |
Wirelines | | | — | | | 782,112,468 | | | — | | | 782,112,468 |
| | | | | | | | | | | | |
Total Non-Convertible Bonds | | | — | | | 15,825,556,687 | | | 120,517,156 | | | 15,946,073,843 |
| | | | | | | | | | | | |
Convertible Bonds | | | | | | | | | | | | |
Airlines | | | — | | | 4,378,156 | | | — | | | 4,378,156 |
Diversified Manufacturing | | | — | | | 3,868,188 | | | — | | | 3,868,188 |
Electric | | | — | | | 1,143,750 | | | — | | | 1,143,750 |
Healthcare | | | — | | | 43,816,282 | | | — | | | 43,816,282 |
Independent Energy | | | — | | | 2,817,000 | | | — | | | 2,817,000 |
Industrial Other | | | — | | | 24,029,850 | | | — | | | 24,029,850 |
Life Insurance | | | — | | | 1,267,500 | | | — | | | 1,267,500 |
Lodging | | | — | | | 29,441,344 | | | — | | | 29,441,344 |
Media Non-Cable | | | — | | | 6,250,667 | | | — | | | 6,250,667 |
Metals & Mining | | | — | | | 32,247,175 | | | — | | | 32,247,175 |
Non-Captive Diversified | | | — | | | 30,292,500 | | | — | | | 30,292,500 |
Oil Field Services | | | — | | | 12,922,038 | | | — | | | 12,922,038 |
Pharmaceuticals | | | — | | | 127,395,192 | | | — | | | 127,395,192 |
REITs | | | — | | | 16,008,894 | | | — | | | 16,008,894 |
Technology | | | — | | | 438,570,461 | | | 7,657,650 | | | 446,228,111 |
Textile | | | — | | | 100,860 | | | — | | | 100,860 |
Wireless | | | — | | | 19,199,783 | | | — | | | 19,199,783 |
Wirelines | | | — | | | 60,548,662 | | | 68,341,380 | | | 128,890,042 |
| | | | | | | | | | | | |
Total Convertible Bonds | | | — | | | 854,298,302 | | | 75,999,030 | | | 930,297,332 |
| | | | | | | | | | | | |
Municipals(a) | | | — | | | 101,085,393 | | | — | | | 101,085,393 |
| | | | | | | | | | | | |
Total Bonds and Notes | | | — | | | 16,780,940,382 | | | 196,516,186 | | | 16,977,456,568 |
| | | | | | | | | | | | |
Bank Loans(a) | | | — | | | 124,537,540 | | | — | | | 124,537,540 |
| | | | | | | | | | | | |
Preferred Stocks | | | | | | | | | | | | |
Convertible Preferred Stocks | | | | | | | | | | | | |
Automotive | | | 58,948,183 | | | — | | | — | | | 58,948,183 |
Capital Markets | | | — | | | 9,411,200 | | | — | | | 9,411,200 |
Commercial Banks | | | 7,316,349 | | | — | | | — | | | 7,316,349 |
Diversified Financial Services | | | — | | | 7,584,546 | | | — | | | 7,584,546 |
Electric Utilities | | | — | | | 15,271,049 | | | 7,293,125 | | | 22,564,174 |
Hotels, Restaurants & Leisure | | | 1 | | | — | | | — | | | 1 |
Machinery | | | — | | | 5,134,101 | | | — | | | 5,134,101 |
Oil, Gas & Consumable Fuels | | | 7,276,338 | | | 8,431,892 | | | — | | | 15,708,230 |
REITs | | | — | | | — | | | 616,400 | | | 616,400 |
Semiconductors & Semiconductor Equipment | | | — | | | 33,863,490 | | | — | | | 33,863,490 |
| | | | | | | | | | | | |
Total Convertible Preferred Stocks | | | 73,540,871 | | | 79,696,278 | | | 7,909,525 | | | 161,146,674 |
| | | | | | | | | | | | |
139
Bond Fund
Asset Valuation Inputs – continued
| | | | | | | | | | | | |
Description | | Level 1 | | Level 2 | | Level 3 | | Total |
Preferred Stocks – continued | | | | | | | | | | | | |
Non-Convertible Preferred Stocks | | | | | | | | | | | | |
Diversified Financial Services | | $ | 1,850,641 | | $ | 49,259,008 | | $ | — | | $ | 51,109,649 |
Electric Utilities | | | 1,075,232 | | | 642,896 | | | — | | | 1,718,128 |
Thrifts & Mortgage Finance | | | 25,436,676 | | | 22,018,909 | | | — | | | 47,455,585 |
| | | | | | | | | | | | |
Total Non-Convertible Preferred Stocks | | | 28,362,549 | | | 71,920,813 | | | — | | | 100,283,362 |
| | | | | | | | | | | | |
Total Preferred Stocks | | | 101,903,420 | | | 151,617,091 | | | 7,909,525 | | | 261,430,036 |
| | | | | | | | | | | | |
Common Stocks(a) | | | 128,256,823 | | | — | | | — | | | 128,256,823 |
Closed End Investment Companies | | | 34,590,021 | | | — | | | — | | | 34,590,021 |
Exchange Traded Funds | | | 93,032,953 | | | — | | | — | | | 93,032,953 |
Short-Term Investments | | | 1,044,377,742 | | | — | | | — | | | 1,044,377,742 |
| | | | | | | | | | | | |
Total | | $ | 1,402,160,959 | | $ | 17,057,095,013 | | $ | 204,425,711 | | $ | 18,663,681,683 |
| | | | | | | | | | | | |
(a) Major categories of the Fund’s investments are included in the Portfolio of Investments.
Fixed Income Fund
Asset Valuation Inputs
| | | | | | | | | | | | |
Description | | Level 1 | | Level 2 | | Level 3 | | Total |
Bonds and Notes | | | | | | | | | | | | |
Non-Convertible Bonds | | | | | | | | | | | | |
ABS Credit Card | | $ | — | | $ | 4,412,002 | | $ | — | | $ | 4,412,002 |
ABS Other | | | — | | | 653,350 | | | — | | | 653,350 |
Aerospace & Defense | | | — | | | 152,688 | | | — | | | 152,688 |
Airlines | | | — | | | 4,927,252 | | | — | | | 4,927,252 |
Automotive | | | — | | | 21,519,931 | | | 2,281,964 | | | 23,801,895 |
Banking | | | — | | | 55,291,340 | | | — | | | 55,291,340 |
Building Materials | | | — | | | 9,263,397 | | | — | | | 9,263,397 |
Chemicals | | | — | | | 9,979,440 | | | 3,531,800 | | | 13,511,240 |
Commercial Mortgage-Backed Securities | | | — | | | 867,766 | | | — | | | 867,766 |
Construction Machinery | | | — | | | 937,696 | | | — | | | 937,696 |
Distributors | | | — | | | 987,128 | | | — | | | 987,128 |
Diversified Manufacturing | | | — | | | 3,224,768 | | | — | | | 3,224,768 |
Electric | | | — | | | 25,753,049 | | | — | | | 25,753,049 |
Entertainment | | | — | | | 10,320,795 | | | — | | | 10,320,795 |
Food & Beverage | | | — | | | 7,968,752 | | | — | | | 7,968,752 |
Government Owned—No Guarantee | | | — | | | 1,758,978 | | | — | | | 1,758,978 |
Health Insurance | | | — | | | 2,005,432 | | | — | | | 2,005,432 |
Healthcare | | | — | | | 19,246,260 | | | — | | | 19,246,260 |
Home Construction | | | — | | | 8,113,856 | | | — | | | 8,113,856 |
Independent Energy | | | — | | | 17,077,291 | | | — | | | 17,077,291 |
Industrial Other | | | — | | | 1,260,000 | | | — | | | 1,260,000 |
Integrated Energy | | | — | | | — | | | 1,206,376 | | | 1,206,376 |
Life Insurance | | | — | | | 4,888,655 | | | 450,000 | | | 5,338,655 |
Local Authorities | | | — | | | 37,320,155 | | | — | | | 37,320,155 |
Lodging | | | — | | | 142,125 | | | — | | | 142,125 |
Media Cable | | | — | | | 27,365,035 | | | — | | | 27,365,035 |
Media Non-Cable | | | — | | | 3,355,498 | | | — | | | 3,355,498 |
Metals & Mining | | | — | | | 8,938,699 | | | — | | | 8,938,699 |
140
NOTES TO FINANCIAL STATEMENTS – continued
September 30, 2009
Fixed Income Fund
Asset Valuation Inputs – continued
| | | | | | | | | | | | |
Description | | Level 1 | | Level 2 | | Level 3 | | Total |
Bonds and Notes – continued | | | | | | | | | | | | |
Non-Convertible Bonds – continued | | | | | | | | | | | | |
Non-Captive Consumer | | $ | — | | $ | 12,753,387 | | $ | — | | $ | 12,753,387 |
Non-Captive Diversified | | | — | | | 26,588,587 | | | 250,188 | | | 26,838,775 |
Oil Field Services | | | — | | | 980,000 | | | — | | | 980,000 |
Packaging | | | — | | | 2,005,000 | | | — | | | 2,005,000 |
Paper | | | — | | | 13,722,946 | | | — | | | 13,722,946 |
Pharmaceuticals | | | — | | | 4,651,919 | | | — | | | 4,651,919 |
Pipelines | | | — | | | 14,033,634 | | | — | | | 14,033,634 |
Property & Casualty Insurance | | | — | | | 11,194,785 | | | — | | | 11,194,785 |
Railroads | | | — | | | 1,597,113 | | | — | | | 1,597,113 |
REITs | | | — | | | 14,526,228 | | | — | | | 14,526,228 |
Restaurants | | | — | | | 722,142 | | | — | | | 722,142 |
Retailers | | | — | | | 14,064,264 | | | — | | | 14,064,264 |
Sovereigns | | | — | | | 34,767,319 | | | — | | | 34,767,319 |
Supermarkets | | | — | | | 8,793,350 | | | — | | | 8,793,350 |
Supranational | | | — | | | 32,223,955 | | | — | | | 32,223,955 |
Technology | | | — | | | 16,474,714 | | | — | | | 16,474,714 |
Tobacco | | | — | | | 12,153,519 | | | — | | | 12,153,519 |
Transportation Services | | | — | | | 4,425,354 | | | — | | | 4,425,354 |
Treasuries | | | — | | | 116,670,134 | | | — | | | 116,670,134 |
Wireless | | | — | | | 9,592,959 | | | — | | | 9,592,959 |
Wirelines | | | — | | | 27,854,852 | | | — | | | 27,854,852 |
| | | | | | | | | | | | |
Total Non-Convertible Bonds | | | — | | | 667,527,499 | | | 7,720,328 | | | 675,247,827 |
| | | | | | | | | | | | |
Convertible Bonds | | | | | | | | | | | | |
Airlines | | | — | | | 908,375 | | | — | | | 908,375 |
Construction Machinery | | | — | | | 47,250 | | | — | | | 47,250 |
Electric | | | — | | | 571,875 | | | — | | | 571,875 |
Healthcare | | | — | | | 486,220 | | | — | | | 486,220 |
Industrial Other | | | — | | | 1,257,750 | | | — | | | 1,257,750 |
Life Insurance | | | — | | | 845,000 | | | — | | | 845,000 |
Lodging | | | — | | | 1,313,813 | | | — | | | 1,313,813 |
Media Non-Cable | | | — | | | 277,695 | | | — | | | 277,695 |
Metals & Mining | | | — | | | 3,592,150 | | | — | | | 3,592,150 |
Non-Captive Diversified | | | — | | | 190,000 | | | — | | | 190,000 |
Oil Field Services | | | — | | | 342,900 | | | — | | | 342,900 |
Pharmaceuticals | | | — | | | 2,642,619 | | | — | | | 2,642,619 |
Pipelines | | | — | | | 1,438,346 | | | — | | | 1,438,346 |
REITs | | | — | | | 3,504,037 | | | — | | | 3,504,037 |
Technology | | | — | | | 11,263,489 | | | 330,330 | | | 11,593,819 |
Textile | | | — | | | 51,660 | | | — | | | 51,660 |
Wirelines | | | — | | | 252,187 | | | 3,222,400 | | | 3,474,587 |
| | | | | | | | | | | | |
Total Convertible Bonds | | | — | | | 28,985,366 | | | 3,552,730 | | | 32,538,096 |
| | | | | | | | | | | | |
Municipals(a) | | | — | | | 1,946,685 | | | — | | | 1,946,685 |
| | | | | | | | | | | | |
Total Bonds and Notes | | | — | | | 698,459,550 | | | 11,273,058 | | | 709,732,608 |
| | | | | | | | | | | | |
Bank Loans(a) | | | — | | | 2,095,902 | | | — | | | 2,095,902 |
| | | | | | | | | | | | |
141
Fixed Income Fund
Asset Valuation Inputs – continued
| | | | | | | | | | | | |
Description | | Level 1 | | Level 2 | | Level 3 | | Total |
Preferred Stocks | | | | | | | | | | | | |
Convertible Preferred Stocks | | | | | | | | | | | | |
Automotive | | $ | 2,459,810 | | $ | — | | $ | — | | $ | 2,459,810 |
Capital Markets | | | — | | | 887,028 | | | — | | | 887,028 |
Diversified Financial Services | | | — | | | 1,674,126 | | | — | | | 1,674,126 |
Electric Utilities | | | — | | | 440,625 | | | — | | | 440,625 |
Machinery | | | — | | | 751,200 | | | — | | | 751,200 |
Oil, Gas & Consumable Fuels | | | 64,558 | | | 675,437 | | | — | | | 739,995 |
REITs | | | — | | | — | | | 28,750 | | | 28,750 |
Semiconductors & Semiconductor Equipment | | | — | | | 2,841,975 | | | — | | | 2,841,975 |
| | | | | | | | | | | | |
Total Convertible Preferred Stocks | | | 2,524,368 | | | 7,270,391 | | | 28,750 | | | 9,823,509 |
| | | | | | | | | | | | |
Non-Convertible Preferred Stocks | | | | | | | | | | | | |
Diversified Financial Services | | | 89,750 | | | 3,069,296 | | | — | | | 3,159,046 |
Electric Utilities | | | 488,671 | | | 238,745 | | | — | | | 727,416 |
Thrifts & Mortgage Finance | | | 739,868 | | | 387,023 | | | — | | | 1,126,891 |
| | | | | | | | | | | | |
Total Non-Convertible Preferred Stocks | | | 1,318,289 | | | 3,695,064 | | | — | | | 5,013,353 |
| | | | | | | | | | | | |
Total Preferred Stocks | | | 3,842,657 | | | 10,965,455 | | | 28,750 | | | 14,836,862 |
| | | | | | | | | | | | |
Common Stocks(a) | | | 10,816,993 | | | — | | | — | | | 10,816,993 |
Short-Term Investments | | | 14,854,774 | | | — | | | — | | | 14,854,774 |
| | | | | | | | | | | | |
Total | | $ | 29,514,424 | | $ | 711,520,907 | | $ | 11,301,808 | | $ | 752,337,139 |
| | | | | | | | | | | | |
(a) Major categories of the Fund’s investments are included in the Portfolio of Investments.
Global Bond Fund
Asset Valuation Inputs
| | | | | | | | | | | | |
Description | | Level 1 | | Level 2 | | Level 3 | | Total |
Bonds and Notes | | | | | | | | | | | | |
Non-Convertible Bonds | | | | | | | | | | | | |
Argentina | | $ | — | | $ | 7,155,200 | | $ | — | | $ | 7,155,200 |
Australia | | | — | | | 15,538,217 | | | — | | | 15,538,217 |
Austria | | | — | | | 21,731,284 | | | — | | | 21,731,284 |
Belgium | | | — | | | 58,489,843 | | | — | | | 58,489,843 |
Bermuda | | | — | | | 15,479,252 | | | — | | | 15,479,252 |
Brazil | | | — | | | 22,034,924 | | | — | | | 22,034,924 |
Canada | | | — | | | 68,370,489 | | | — | | | 68,370,489 |
Cayman Islands | | | — | | | 29,602,486 | | | — | | | 29,602,486 |
Colombia | | | — | | | 9,251,250 | | | — | | | 9,251,250 |
France | | | — | | | 65,387,421 | | | — | | | 65,387,421 |
Germany | | | — | | | 307,826,270 | | | — | | | 307,826,270 |
India | | | — | | | 22,642,817 | | | — | | | 22,642,817 |
Indonesia | | | — | | | 19,592,871 | | | — | | | 19,592,871 |
Ireland | | | — | | | 38,379,976 | | | 4,139,625 | | | 42,519,601 |
Italy | | | — | | | 8,929,152 | | | — | | | 8,929,152 |
Japan | | | — | | | 81,951,218 | | | — | | | 81,951,218 |
Korea | | | — | | | 32,713,889 | | | — | | | 32,713,889 |
Luxembourg | | | — | | | 16,604,525 | | | — | | | 16,604,525 |
142
NOTES TO FINANCIAL STATEMENTS – continued
September 30, 2009
Global Bond Fund
Asset Valuation Inputs – continued
| | | | | | | | | | | | |
Description | | Level 1 | | Level 2 | | Level 3 | | Total |
Bonds and Notes – continued | | | | | | | | | | | | |
Non-Convertible Bonds – continued | | | | | | | | | | | | |
Mexico | | $ | — | | $ | 33,896,999 | | $ | — | | $ | 33,896,999 |
Netherlands | | | — | | | 53,387,599 | | | — | | | 53,387,599 |
Norway | | | — | | | 69,663,668 | | | — | | | 69,663,668 |
Peru | | | — | | | 4,553,250 | | | — | | | 4,553,250 |
Singapore | | | — | | | 18,053,372 | | | — | | | 18,053,372 |
South Africa | | | — | | | 22,121,519 | | | — | | | 22,121,519 |
Supranational | | | — | | | 34,652,572 | | | 6,678,449 | | | 41,331,021 |
Sweden | | | — | | | 27,817,909 | | | — | | | 27,817,909 |
United Arab Emirates | | | — | | | 48,084,048 | | | — | | | 48,084,048 |
United Kingdom | | | — | | | 105,406,794 | | | — | | | 105,406,794 |
United States | | | — | | | 556,496,810 | | | 14,464,520 | | | 570,961,330 |
| | | | | | | | | | | | |
Total Non-Convertible Bonds | | | — | | | 1,815,815,624 | | | 25,282,594 | | | 1,841,098,218 |
| | | | | | | | | | | | |
Convertible Bonds(a) | | | — | | | 4,608,840 | | | — | | | 4,608,840 |
| | | | | | | | | | | | |
Total Bonds and Notes | | | — | | | 1,820,424,464 | | | 25,282,594 | | | 1,845,707,058 |
| | | | | | | | | | | | |
Preferred Stocks(a) | | | 1,036,317 | | | 1,812,566 | | | — | | | 2,848,883 |
Short-Term Investments | | | 32,640,617 | | | — | | | — | | | 32,640,617 |
| | | | | | | | | | | | |
Total Investments | | | 33,676,934 | | | 1,822,237,030 | | | 25,282,594 | | | 1,881,196,558 |
| | | | | | | | | | | | |
Credit Default Swap Agreement | | | — | | | 150,447 | | | — | | | 150,447 |
Forward Foreign Currency Contracts (unrealized appreciation) | | | — | | | 1,907,357 | | | — | | | 1,907,357 |
| | | | | | | | | | | | |
Total | | $ | 33,676,934 | | $ | 1,824,294,834 | | $ | 25,282,594 | | $ | 1,883,254,362 |
| | | | | | | | | | | | |
(a) Major categories of the Fund’s investments are included in the Portfolio of Investments.
Liability Valuation Inputs
| | | | | | | | | | | | |
Description | | Level 1 | | Level 2 | | Level 3 | | Total |
Forward Foreign Currency Contracts (unrealized depreciation) | | $ | — | | $ | (385,811) | | $ | — | | $ | (385,811) |
| | | | | | | | | | | | |
Inflation Protected Securities Fund
Asset Valuation Inputs
| | | | | | | | | | | | |
Description | | Level 1 | | Level 2 | | Level 3 | | Total |
Bonds and Notes(a) | | $ | — | | $ | 13,441,726 | | $ | — | | $ | 13,441,726 |
Preferred Stocks | | | | | | | | | | | | |
Non-Convertible Preferred Stocks | | | | | | | | | | | | |
Thrifts & Mortgage Finance | | | 2,100 | | | 5,635 | | | — | | | 7,735 |
Short-Term Investments | | | 476,954 | | | — | | | — | | | 476,954 |
| | | | | | | | | | | | |
Total Investments | | | 479,054 | | | 13,447,361 | | | — | | | 13,926,415 |
| | | | | | | | | | | | |
Forward Foreign Currency Contracts (unrealized appreciation) | | | — | | | 7,566 | | | — | | | 7,566 |
| | | | | | | | | | | | |
Total | | $ | 479,054 | | $ | 13,454,927 | | $ | — | | $ | 13,933,981 |
| | | | | | | | | | | | |
(a) Major categories of the Fund’s investments are included in the Portfolio of Investments.
143
Inflation Protected Securities Fund
Liability Valuation Inputs
| | | | | | | | | | | | |
Description | | Level 1 | | Level 2 | | Level 3 | | Total |
Forward Foreign Currency Contracts (unrealized depreciation) | | $ | — | | $ | (6,332) | | $ | — | | $ | (6,332) |
| | | | | | | | | | | | |
Institutional High Income Fund
Asset Valuation Inputs
| | | | | | | | | | | | |
Description | | Level 1 | | Level 2 | | Level 3 | | Total |
Bonds and Notes | | | | | | | | | | | | |
Non-Convertible Bonds | | | | | | | | | | | | |
ABS Home Equity | | $ | — | | $ | 1,783,298 | | $ | — | | $ | 1,783,298 |
Aerospace & Defense | | | — | | | 2,314,081 | | | — | | | 2,314,081 |
Airlines | | | — | | | 2,620,591 | | | 347,042 | | | 2,967,633 |
Automotive | | | — | | | 19,702,457 | | | 355,516 | | | 20,057,973 |
Banking | | | — | | | 21,789,114 | | | — | | | 21,789,114 |
Building Materials | | | — | | | 8,970,261 | | | — | | | 8,970,261 |
Chemicals | | | — | | | 5,409,349 | | | 2,658,860 | | | 8,068,209 |
Commercial Mortgage-Backed Securities | | | — | | | 972,941 | | | — | | | 972,941 |
Construction Machinery | | | — | | | 7,464,913 | | | — | | | 7,464,913 |
Consumer Products | | | — | | | 983,625 | | | — | | | 983,625 |
Diversified Manufacturing | | | — | | | 2,993,634 | | | — | | | 2,993,634 |
Electric | | | — | | | 13,108,417 | | | — | | | 13,108,417 |
Food & Beverage | | | — | | | 2,296,308 | | | — | | | 2,296,308 |
Government Owned—No Guarantee | | | — | | | 175,898 | | | — | | | 175,898 |
Healthcare | | | — | | | 18,623,689 | | | — | | | 18,623,689 |
Home Construction | | | — | | | 5,522,585 | | | — | | | 5,522,585 |
Independent Energy | | | — | | | 6,456,528 | | | — | | | 6,456,528 |
Industrial Other | | | — | | | 294,375 | | | — | | | 294,375 |
Life Insurance | | | — | | | 2,181,050 | | | — | | | 2,181,050 |
Local Authorities | | | — | | | 11,832,285 | | | — | | | 11,832,285 |
Lodging | | | — | | | 1,236,431 | | | — | | | 1,236,431 |
Media Cable | | | — | | | 703,838 | | | — | | | 703,838 |
Media Non-Cable | | | — | | | 113,275 | | | — | | | 113,275 |
Metals & Mining | | | — | | | 15,994,786 | | | — | | | 15,994,786 |
Non-Captive Consumer | | | — | | | 2,727,863 | | | 3,195,119 | | | 5,922,982 |
Non-Captive Diversified | | | — | | | 15,238,580 | | | — | | | 15,238,580 |
Oil Field Services | | | — | | | 1,043,700 | | | — | | | 1,043,700 |
Packaging | | | — | | | 1,558,888 | | | — | | | 1,558,888 |
Paper | | | — | | | 28,539,953 | | | — | | | 28,539,953 |
Pharmaceuticals | | | — | | | 9,034,331 | | | — | | | 9,034,331 |
Pipelines | | | — | | | 11,312,785 | | | — | | | 11,312,785 |
Property & Casualty Insurance | | | — | | | 3,437,506 | | | — | | | 3,437,506 |
Railroads | | | — | | | 239,995 | | | — | | | 239,995 |
REITs | | | — | | | 6,240,505 | | | — | | | 6,240,505 |
Retailers | | | — | | | 15,471,755 | | | — | | | 15,471,755 |
Sovereigns | | | — | | | 13,477,002 | | | — | | | 13,477,002 |
Supermarkets | | | — | | | 3,663,850 | | | — | | | 3,663,850 |
Supranational | | | — | | | 890,378 | | | 120,736 | | | 1,011,114 |
Technology | | | — | | | 21,006,345 | | | — | | | 21,006,345 |
Textile | | | — | | | 658,600 | | | — | | | 658,600 |
144
NOTES TO FINANCIAL STATEMENTS – continued
September 30, 2009
Institutional High Income Fund
Asset Valuation Inputs – continued
| | | | | | | | | | | | |
Description | | Level 1 | | Level 2 | | Level 3 | | Total |
Bonds and Notes – continued | | | | | | | | | | | | |
Non-Convertible Bonds – continued | | | | | | | | | | | | |
Transportation Services | | $ | — | | $ | 5,371,590 | | $ | — | | $ | 5,371,590 |
Treasuries | | | — | | | 8,068,320 | | | — | | | 8,068,320 |
Wireless | | | — | | | 8,267,850 | | | — | | | 8,267,850 |
Wirelines | | | — | | | 21,034,120 | | | — | | | 21,034,120 |
| | | | | | | | | | | | |
Total Non-Convertible Bonds | | | — | | | 330,827,645 | | | 6,677,273 | | | 337,504,918 |
| | | | | | | | | | | | |
Convertible Bonds | | | | | | | | | | | | |
Airlines | | | — | | | 538,688 | | | — | | | 538,688 |
Construction Machinery | | | — | | | 37,800 | | | — | | | 37,800 |
Diversified Manufacturing | | | — | | | 188,063 | | | — | | | 188,063 |
Electric | | | — | | | 285,938 | | | — | | | 285,938 |
Healthcare | | | — | | | 9,438,607 | | | — | | | 9,438,607 |
Independent Energy | | | — | | | 3,012,037 | | | — | | | 3,012,037 |
Industrial Other | | | — | | | 1,072,500 | | | — | | | 1,072,500 |
Lodging | | | — | | | 2,309,737 | | | — | | | 2,309,737 |
Media Non-Cable | | | — | | | 37,868 | | | — | | | 37,868 |
Metals & Mining | | | — | | | 6,543,950 | | | — | | | 6,543,950 |
Oil Field Services | | | — | | | 1,080,800 | | | — | | | 1,080,800 |
Pharmaceuticals | | | — | | | 12,669,069 | | | — | | | 12,669,069 |
Technology | | | — | | | 18,868,205 | | | 1,204,840 | | | 20,073,045 |
Textile | | | — | | | 13,120 | | | — | | | 13,120 |
Wireless | | | — | | | 1,259,400 | | | — | | | 1,259,400 |
Wirelines | | | — | | | 2,874,262 | | | 2,342,600 | | | 5,216,862 |
| | | | | | | | | | | | |
Total Convertible Bonds | | | — | | | 60,230,044 | | | 3,547,440 | | | 63,777,484 |
| | | | | | | | | | | | |
Total Bonds and Notes | | | — | | | 391,057,689 | | | 10,224,713 | | | 401,282,402 |
| | | | | | | | | | | | |
Bank Loans(a) | | | — | | | 2,520,445 | | | — | | | 2,520,445 |
| | | | | | | | | | | | |
Common Stocks(a) | | | 10,555,644 | | | — | | | — | | | 10,555,644 |
| | | | | | | | | | | | |
Preferred Stocks | | | | | | | | | | | | |
Convertible Preferred Stocks | | | | | | | | | | | | |
Automotive | | | 968,599 | | | — | | | — | | | 968,599 |
Commercial Banks | | | 123,234 | | | — | | | — | | | 123,234 |
Diversified Financial Services | | | — | | | 503,861 | | | — | | | 503,861 |
Electric Utilities | | | — | | | 754,306 | | | 145,250 | | | 899,556 |
Hotels, Restaurants & Leisure | | | 4 | | | — | | | — | | | 4 |
Machinery | | | — | | | 356,409 | | | — | | | 356,409 |
Oil, Gas & Consumable Fuels | | | — | | | 190,594 | | | — | | | 190,594 |
REITs | | | — | | | — | | | 12,650 | | | 12,650 |
Semiconductors & Semiconductor Equipment | | | — | | | 879,750 | | | — | | | 879,750 |
| | | | | | | | | | | | |
Total Convertible Preferred Stocks | | | 1,091,837 | | | 2,684,920 | | | 157,900 | | | 3,934,657 |
| | | | | | | | | | | | |
Non-Convertible Preferred Stocks | | | | | | | | | | | | |
Diversified Financial Services | | | 323,100 | | | 260,526 | | | — | | | 583,626 |
Thrifts & Mortgage Finance | | | 712,190 | | | 1,809,979 | | | — | | | 2,522,169 |
| | | | | | | | | | | | |
Total Non-Convertible Preferred Stocks | | | 1,035,290 | | | 2,070,505 | | | — | | | 3,105,795 |
| | | | | | | | | | | | |
Total Preferred Stocks | | | 2,127,127 | | | 4,755,425 | | | 157,900 | | | 7,040,452 |
| | | | | | | | | | | | |
145
Institutional High Income Fund
Asset Valuation Inputs – continued
| | | | | | | | | | | | |
Description | | Level 1 | | Level 2 | | Level 3 | | Total |
Closed End Investment Companies | | $ | 1,925,907 | | $ | — | | $ | — | | $ | 1,925,907 |
Exchange Traded Funds | | | 14,387,892 | | | — | | | — | | | 14,387,892 |
Short-Term Investments | | | 16,907,863 | | | — | | | — | | | 16,907,863 |
| | | | | | | | | | | | |
Total | | $ | 45,904,433 | | $ | 398,333,559 | | $ | 10,382,613 | | $ | 454,620,605 |
| | | | | | | | | | | | |
(a) Major categories of the Fund’s investments are included in the Portfolio of Investments.
Intermediate Duration Fixed Income Fund
Asset Valuation Inputs
| | | | | | | | | | | | |
Description | | Level 1 | | Level 2 | | Level 3 | | Total |
Bonds and Notes | | | | | | | | | | | | |
ABS Car Loan | | $ | — | | $ | 27,633 | | $ | — | | $ | 27,633 |
ABS Credit Card | | | — | | | 1,274,894 | | | — | | | 1,274,894 |
ABS Home Equity | | | — | | | 133,358 | | | 92,043 | | | 225,401 |
Aerospace & Defense | | | — | | | 169,889 | | | — | | | 169,889 |
Automotive | | | — | | | 220,574 | | | — | | | 220,574 |
Banking | | | — | | | 2,987,046 | | | — | | | 2,987,046 |
Collateralized Mortgage Obligations | | | — | | | 478,634 | | | — | | | 478,634 |
Commercial Mortgage-Backed Securities | | | — | | | 3,215,549 | | | — | | | 3,215,549 |
Construction Machinery | | | — | | | 193,822 | | | — | | | 193,822 |
Consumer Products | | | — | | | 238,771 | | | — | | | 238,771 |
Distributors | | | — | | | 123,036 | | | — | | | 123,036 |
Diversified Manufacturing | | | — | | | 64,775 | | | — | | | 64,775 |
Electric | | | — | | | 1,028,593 | | | — | | | 1,028,593 |
Entertainment | | | — | | | 592,791 | | | — | | | 592,791 |
Environmental | | | — | | | 44,260 | | | — | | | 44,260 |
Food & Beverage | | | — | | | 958,592 | | | — | | | 958,592 |
Government Owned—No Guarantee | | | — | | | 169,454 | | | — | | | 169,454 |
Health Insurance | | | — | | | 326,736 | | | — | | | 326,736 |
Healthcare | | | — | | | 520,661 | | | — | | | 520,661 |
Hybrid ARMs | | | — | | | 506,589 | | | — | | | 506,589 |
Independent Energy | | | — | | | 511,931 | | | — | | | 511,931 |
Integrated Energy | | | — | | | 415,513 | | | — | | | 415,513 |
Media Cable | | | — | | | 584,858 | | | — | | | 584,858 |
Media Non-Cable | | | — | | | 334,211 | | | — | | | 334,211 |
Metals & Mining | | | — | | | 499,775 | | | — | | | 499,775 |
Mortgage Related | | | — | | | 1,184,107 | | | — | | | 1,184,107 |
Non-Captive Consumer | | | — | | | 207,964 | | | — | | | 207,964 |
Non-Captive Diversified | | | — | | | 650,295 | | | — | | | 650,295 |
Oil Field Services | | | — | | | 123,388 | | | — | | | 123,388 |
Pharmaceuticals | | | — | | | 169,934 | | | — | | | 169,934 |
Pipelines | | | — | | | 559,288 | | | — | | | 559,288 |
Property & Casualty Insurance | | | — | | | 15,423 | | | — | | | 15,423 |
Railroads | | | — | | | 403,413 | | | — | | | 403,413 |
Refining | | | — | | | 145,659 | | | — | | | 145,659 |
REITs | | | — | | | 737,215 | | | — | | | 737,215 |
Retailers | | | — | | | 297,821 | | | — | | | 297,821 |
Supermarkets | | | — | | | 164,801 | | | — | | | 164,801 |
146
NOTES TO FINANCIAL STATEMENTS – continued
September 30, 2009
Intermediate Duration Fixed Income Fund
Asset Valuation Inputs – continued
| | | | | | | | | | | | |
Description | | Level 1 | | Level 2 | | Level 3 | | Total |
Bonds and Notes – continued | | | | | | | | | | | | |
Technology | | $ | — | | $ | 1,118,190 | | $ | — | | $ | 1,118,190 |
Tobacco | | | — | | | 354,174 | | | — | | | 354,174 |
Treasuries | | | — | | | 2,652,215 | | | — | | | 2,652,215 |
Wireless | | | — | | | 343,575 | | | — | | | 343,575 |
Wirelines | | | — | | | 1,083,899 | | | — | | | 1,083,899 |
| | | | | | | | | | | | |
Total Bonds and Notes | | | — | | | 25,833,306 | | | 92,043 | | | 25,925,349 |
| | | | | | | | | | | | |
Short-Term Investments | | | 1,127,253 | | | 839,927 | | | — | | | 1,967,180 |
| | | | | | | | | | | | |
Total Investments | | | 1,127,253 | | | 26,673,233 | | | 92,043 | | | 27,892,529 |
| | | | | | | | | | | | |
Futures Contracts (unrealized appreciation) | | | 21,914 | | | — | | | — | | | 21,914 |
| | | | | | | | | | | | |
Total | | $ | 1,149,167 | | $ | 26,673,233 | | $ | 92,043 | | $ | 27,914,443 |
| | | | | | | | | | | | |
Investment Grade Fixed Income Fund
Asset Valuation Inputs
| | | | | | | | | | | | |
Description | | Level 1 | | Level 2 | | Level 3 | | Total |
Bonds and Notes | | | | | | | | | | | | |
Non-Convertible Bonds | | | | | | | | | | | | |
ABS Car Loan | | $ | — | | $ | 4,645,012 | | $ | — | | $ | 4,645,012 |
ABS Credit Card | | | — | | | 730,287 | | | — | | | 730,287 |
ABS Home Equity | | | — | | | 123,102 | | | 106,635 | | | 229,737 |
ABS Other | | | — | | | 2,252,931 | | | 2,345,000 | | | 4,597,931 |
Aerospace & Defense | | | — | | | 181,711 | | | — | | | 181,711 |
Airlines | | | — | | | 9,735,040 | | | 1,697,038 | | | 11,432,078 |
Automotive | | | — | | | 2,982,224 | | | — | | | 2,982,224 |
Banking | | | — | | | 38,226,075 | | | — | | | 38,226,075 |
Brokerage | | | — | | | 3,651,370 | | | — | | | 3,651,370 |
Building Materials | | | — | | | 6,231,026 | | | — | | | 6,231,026 |
Chemicals | | | — | | | 11,189,651 | | | — | | | 11,189,651 |
Collateralized Mortgage Obligations | | | — | | | 965,865 | | | — | | | 965,865 |
Commercial Mortgage-Backed Securities | | | — | | | 23,302,464 | | | — | | | 23,302,464 |
Construction Machinery | | | — | | | 296,006 | | | — | | | 296,006 |
Consumer Cyclical Services | | | — | | | 8,665,149 | | | — | | | 8,665,149 |
Consumer Products | | | — | | | 3,710,466 | | | — | | | 3,710,466 |
Distributors | | | — | | | 5,621,995 | | | — | | | 5,621,995 |
Diversified Manufacturing | | | — | | | 3,682,074 | | | 716,291 | | | 4,398,365 |
Electric | | | — | | | 13,775,213 | | | — | | | 13,775,213 |
Entertainment | | | — | | | 3,143,291 | | | — | | | 3,143,291 |
Financial Other | | | — | | | 2,546,050 | | | — | | | 2,546,050 |
Food & Beverage | | | — | | | 8,485,401 | | | — | | | 8,485,401 |
Government Owned—No Guarantee | | | — | | | 6,089,627 | | | — | | | 6,089,627 |
Health Insurance | | | — | | | 2,592,790 | | | — | | | 2,592,790 |
Healthcare | | | — | | | 5,208,971 | | | — | | | 5,208,971 |
Home Construction | | | — | | | 8,754,742 | | | — | | | 8,754,742 |
Hybrid ARMs | | | — | | | 1,212,198 | | | — | | | 1,212,198 |
Independent Energy | | | — | | | 6,288,013 | | | — | | | 6,288,013 |
Local Authorities | | | — | | | 8,125,088 | | | — | | | 8,125,088 |
147
Investment Grade Fixed Income Fund
Asset Valuation Inputs – continued
| | | | | | | | | | | | |
Description | | Level 1 | | Level 2 | | Level 3 | | Total |
Bonds and Notes – continued | | | | | | | | | | | | |
Non-Convertible Bonds – continued | | | | | | | | | | | | |
Media Cable | | $ | — | | $ | 9,052,102 | | $ | — | | $ | 9,052,102 |
Media Non-Cable | | | — | | | 3,197,209 | | | — | | | 3,197,209 |
Metals & Mining | | | — | | | 3,711,540 | | | — | | | 3,711,540 |
Mortgage Related | | | — | | | 8,895,607 | | | — | | | 8,895,607 |
Non-Captive Consumer | | | — | | | 4,739,025 | | | 656,624 | | | 5,395,649 |
Non-Captive Diversified | | | — | | | 12,857,613 | | | — | | | 12,857,613 |
Oil Field Services | | | — | | | 1,521,835 | | | — | | | 1,521,835 |
Paper | | | — | | | 4,658,241 | | | — | | | 4,658,241 |
Pharmaceuticals | | | — | | | 7,259,394 | | | — | | | 7,259,394 |
Pipelines | | | — | | | 20,528,710 | | | — | | | 20,528,710 |
Property & Casualty Insurance | | | — | | | 7,753,531 | | | — | | | 7,753,531 |
Railroads | | | — | | | 5,091,765 | | | — | | | 5,091,765 |
Refining | | | — | | | 4,078,459 | | | — | | | 4,078,459 |
REITs | | | — | | | 10,198,248 | | | — | | | 10,198,248 |
Restaurants | | | — | | | 552,960 | | | — | | | 552,960 |
Retailers | | | — | | | 7,423,236 | | | — | | | 7,423,236 |
Sovereigns | | | — | | | 13,168,978 | | | — | | | 13,168,978 |
Supranational | | | — | | | 7,822,521 | | | — | | | 7,822,521 |
Technology | | | — | | | 15,132,985 | | | — | | | 15,132,985 |
Tobacco | | | — | | | 6,077,203 | | | — | | | 6,077,203 |
Transportation Services | | | — | | | 11,687,022 | | | — | | | 11,687,022 |
Treasuries | | | — | | | 84,588,043 | | | — | | | 84,588,043 |
Wireless | | | — | | | 2,048,152 | | | — | | | 2,048,152 |
Wirelines | | | — | | | 31,171,644 | | | — | | | 31,171,644 |
| | | | | | | | | | | | |
Total Non-Convertible Bonds | | | — | | | 475,629,855 | | | 5,521,588 | | | 481,151,443 |
| | | | | | | | | | | | |
Convertible Bonds | | | | | | | | | | | | |
Oil Field Services | | | — | | | 228,600 | | | — | | | 228,600 |
REITs | | | — | | | 178,319 | | | — | | | 178,319 |
Technology | | | — | | | 5,142,610 | | | 43,680 | | | 5,186,290 |
| | | | | | | | | | | | |
Total Convertible Bonds | | | — | | | 5,549,529 | | | 43,680 | | | 5,593,209 |
| | | | | | | | | | | | |
Municipals(a) | | | — | | | 1,459,825 | | | — | | | 1,459,825 |
| | | | | | | | | | | | |
Total Bonds and Notes | | | — | | | 482,639,209 | | | 5,565,268 | | | 488,204,477 |
| | | | | | | | | | | | |
Preferred Stocks | | | | | | | | | | | | |
Non-Convertible Preferred Stocks | | | | | | | | | | | | |
Diversified Financial Services | | | 13,875 | | | 892,626 | | | — | | | 906,501 |
Electric Utilities | | | 262,652 | | | 34,152 | | | — | | | 296,804 |
Thrifts & Mortgage Finance | | | 141,070 | | | 173,097 | | | — | | | 314,167 |
| | | | | | | | | | | | |
Total Non-Convertible Preferred Stocks | | | 417,597 | | | 1,099,875 | | | — | | | 1,517,472 |
| | | | | | | | | | | | |
Convertible Preferred Stocks(a) | | | — | | | 1,925,393 | | | — | | | 1,925,393 |
| | | | | | | | | | | | |
Total Preferred Stocks | | | 417,597 | | | 3,025,268 | | | — | | | 3,442,865 |
| | | | | | | | | | | | |
Common Stocks(a) | | | 519,533 | | | — | | | — | | | 519,533 |
Short-Term Investments | | | 21,231,984 | | | — | | | — | | | 21,231,984 |
| | | | | | | | | | | | |
Total | | $ | 22,169,114 | | $ | 485,664,477 | | $ | 5,565,268 | | $ | 513,398,859 |
| | | | | | | | | | | | |
(a) Major categories of the Fund’s investments are included in the Portfolio of Investments.
148
NOTES TO FINANCIAL STATEMENTS – continued
September 30, 2009
The following is a reconciliation of Level 3 investments for which significant unobservable inputs were used to determine fair value as of September 30, 2009:
Bond Fund
Asset Valuation Inputs
| | | | | | | | | | | | | | | | | | | | | | | | | |
Investments in Securities | | Balance as of
September 30,
2008 | | Accrued
Discounts
(Premiums) | | Realized
Gain (Loss) | | | Change in
Unrealized
Appreciation
(Depreciation) | | | Net
Purchases
(Sales) | | | Net
Transfers
in/(out)
Level 3 | | | Balance as of
September 30,
2009 |
Bonds and Notes | | | | | | | | | | | | | | | | | | | | | | | | | |
Non-Convertible Bonds | | | | | | | | | | | | | | | | | | | | | | | | | |
Airlines | | $ | 22,961,700 | | $ | — | | $ | 77,148 | | | $ | 5,737,962 | | | $ | (2,675,242 | ) | | $ | (21,937,057 | ) | | $ | 4,164,511 |
Automotive | | | — | | | 11,780 | | | — | | | | (40,881 | ) | | | 728,590 | | | | 2,870,907 | | | | 3,570,396 |
Banking | | | 81,049,502 | | | 2,613,619 | | | (49,585,182 | ) | | | 33,714,778 | | | | (12,429,904 | ) | | | (55,362,813 | ) | | | — |
Chemicals | | | 13,144,730 | | | 268,993 | | | — | | | | 3,066,365 | | | | 19,501 | | | | 9,244,511 | | | | 25,744,100 |
Diversified Manufacturing | | | — | | | 145,612 | | | — | | | | 2,385,928 | | | | 28,093,896 | | | | — | | | | 30,625,436 |
Independent Energy | | | 6,923,210 | | | 79,366 | | | — | | | | 974,139 | | | | — | | | | (7,976,715 | ) | | | — |
Industrial Other | | | 12,676,800 | | | — | | | — | | | | 8,451,200 | | | | — | | | | (21,128,000 | ) | | | — |
Integrated Energy | | | 1,683,067 | | | — | | | — | | | | 6,658 | | | | (242,073 | ) | | | — | | | | 1,447,652 |
Life Insurance | | | 13,579,037 | | | — | | | 1,952,757 | | | | 9,445,306 | | | | (24,977,100 | ) | | | — | | | | — |
Media Non-Cable | | | 6,027,275 | | | 283,697 | | | (12,274,987 | ) | | | 9,210,028 | | | | (3,246,013 | ) | | | — | | | | — |
Non-Captive Consumer | | | 11,577,735 | | | 647,998 | | | — | | | | 3,098,427 | | | | — | | | | (9,895,166 | ) | | | 5,428,994 |
Non-Captive Diversified | | | 22,929,550 | | | 50,445 | | | — | | | | 6,563,028 | | | | 3,955,365 | | | | (29,480,850 | ) | | | 4,017,538 |
Property & Casualty Insurance | | | 5,172,800 | | | 4,178 | | | (306,929 | ) | | | (492,549 | ) | | | (593,500 | ) | | | (3,784,000 | ) | | | — |
Supranational | | | 59,712,065 | | | — | | | — | | | | 10,202,270 | | | | — | | | | (24,620,806 | ) | | | 45,293,529 |
Technology | | | 12,664,200 | | | 85,370 | | | (9,246 | ) | | | (765,840 | ) | | | 193,075 | | | | (11,942,559 | ) | | | 225,000 |
Wireless | | | 24,894,800 | | | 63,477 | | | — | | | | 10,333,573 | | | | 429,750 | | | | (35,721,600 | ) | | | — |
Convertible Bonds | | | | | | | | | | | | | | | | | | | | | | | | | |
Healthcare | | | 3,561,000 | | | 36,830 | | | — | | | | 2,137,243 | | | | (5,735,073 | ) | | | — | | | | — |
Technology | | | — | | | 189,157 | | | 86,447 | | | | (275,594 | ) | | | (1,052,000 | ) | | | 8,709,640 | | | | 7,657,650 |
Transportation Services | | | 535,780 | | | 6,960 | | | 42,110 | | | | 17,150 | | | | (602,000 | ) | | | — | | | | — |
Wirelines | | | — | | | 49,002 | | | — | | | | 5,108,838 | | | | 63,183,540 | | | | — | | | | 68,341,380 |
Preferred Stocks | | | | | | | | | | | | | | | | | | | | | | | | | |
Convertible Preferred Stocks | | | | | | | | | | | | | | | | | | | | | | | | | |
Electric Utilities | | | 8,295,000 | | | — | | | — | | | | (1,036,875 | ) | | | 35,000 | | | | — | | | | 7,293,125 |
REITs | | | — | | | — | | | — | | | | (40,200 | ) | | | — | | | | 656,600 | | | | 616,400 |
Semiconductors & Semiconductor Equipment | | | 20,542,641 | | | — | | | — | | | | 13,307,787 | | | | 13,062 | | | | (33,863,490 | ) | | | — |
| | | | | | | | | | | | | | | | | | | | | | | | | |
Total | | $ | 327,930,892 | | $ | 4,536,484 | | $ | (60,017,882 | ) | | $ | 121,108,741 | | | $ | 45,098,874 | | | $ | (234,231,398 | ) | | $ | 204,425,711 |
| | | | | | | | | | | | | | | | | | | | | | | | | |
149
Fixed Income Fund
Asset Valuation Inputs
| | | | | | | | | | | | | | | | | | | | | | | | | |
Investments in Securities | | Balance as of
September 30,
2008 | | Accrued
Discounts
(Premiums) | | Realized
Gain (Loss) | | | Change in
Unrealized
Appreciation
(Depreciation) | | | Net
Purchases
(Sales) | | | Net
Transfers
in/(out)
Level 3 | | | Balance as of
September 30,
2009 |
Bonds and Notes | | | | | | | | | | | | | | | | | | | | | | | | | |
Non-Convertible Bonds | | | | | | | | | | | | | | | | | | | | | | | | | |
Automotive | | $ | — | | $ | 9,470 | | $ | — | | | $ | (32,203 | ) | | $ | 7,971 | | | $ | 2,296,726 | | | $ | 2,281,964 |
Banking | | | 2,149,000 | | | 133,614 | | | (2,422,739 | ) | | | 752,125 | | | | (612,000 | ) | | | — | | | | — |
Chemicals | | | — | | | 27,040 | | | — | | | | 623,160 | | | | — | | | | 2,881,600 | | | | 3,531,800 |
Industrial Other | | | 756,000 | | | — | | | — | | | | 504,000 | | | | — | | | | (1,260,000 | ) | | | — |
Integrated Energy | | | 1,402,556 | | | — | | | 1,388 | | | | 4,159 | | | | (201,727 | ) | | | — | | | | 1,206,376 |
Life Insurance | | | 6,011,553 | | | 4,139 | | | 858,091 | | | | 4,140,092 | | | | (11,051,160 | ) | | | 487,285 | | | | 450,000 |
Media Non-Cable | | | 14,500 | | | 927 | | | (23,552 | ) | | | 16,050 | | | | (7,925 | ) | | | — | | | | — |
Non-Captive Diversified | | | 1,222,550 | | | 5,173 | | | — | | | | 424,746 | | | | — | | | | (1,402,281 | ) | | | 250,188 |
Property & Casualty Insurance | | | 818,850 | | | 475 | | | — | | | | (139,525 | ) | | | — | | | | (679,800 | ) | | | — |
Technology | | | 596,000 | | | 3,037 | | | — | | | | (144,036 | ) | | | — | | | | (455,001 | ) | | | — |
Convertible Bonds | | | | | | | | | | | | | | | | | | | | | | | | | |
Healthcare | | | 125,000 | | | 1,423 | | | — | | | | 68,853 | | | | (195,276 | ) | | | — | | | | — |
Technology | | | — | | | 7,273 | | | 4,356 | | | | (11,659 | ) | | | (45,000 | ) | | | 375,360 | | | | 330,330 |
Wirelines | | | — | | | 2,310 | | | — | | | | 240,890 | | | | 2,979,200 | | | | — | | | | 3,222,400 |
Preferred Stocks | | | | | | | | | | | | | | | | | | | | | | | | | |
Convertible Preferred Stocks | | | | | | | | | | | | | | | | | | | | | | | | | |
REITs | | | — | | | — | | | — | | | | (1,875 | ) | | | — | | | | 30,625 | | | | 28,750 |
Semiconductors & Semiconductor Equipment | | | 1,726,175 | | | — | | | — | | | | 1,115,800 | | | | — | | | | (2,841,975 | ) | | | — |
| | | | | | | | | | | | | | | | | | | | | | | | | |
Total | | $ | 14,822,184 | | $ | 194,881 | | $ | (1,582,456 | ) | | $ | 7,560,577 | | | $ | (9,125,917 | ) | | $ | (567,461 | ) | | $ | 11,301,808 |
| | | | | | | | | | | | | | | | | | | | | | | | | |
Global Bond Fund
Asset Valuation Inputs
| | | | | | | | | | | | | | | | | | | | | | | | | |
Investments in Securities | | Balance as of
September 30,
2008 | | Accrued
Discounts
(Premiums) | | Realized
Gain (Loss) | | | Change in
Unrealized
Appreciation
(Depreciation) | | | Net
Purchases
(Sales) | | | Net
Transfers
in/(out)
Level 3 | | | Balance as of
September 30,
2009 |
Bonds and Notes | | | | | | | | | | | | | | | | | | | | | | | | | |
Non-Convertible Bonds | | | | | | | | | | | | | | | | | | | | | | | | | |
Colombia | | $ | 1,301,615 | | $ | — | | $ | (313,811 | ) | | $ | 358,522 | | | $ | (1,346,326 | ) | | $ | — | | | $ | — |
Hong Kong | | | 13,771,814 | | | 2,242 | | | 634,428 | | | | 133,888 | | | | (14,542,372 | ) | | | — | | | | — |
Ireland | | | — | | | — | | | — | | | | (6,195 | ) | | | 4,145,820 | | | | — | | | | 4,139,625 |
Korea | | | 10,136,165 | | | 3,615 | | | — | | | | 1,764,536 | | | | 390,188 | | | | (12,294,504 | ) | | | — |
Supranational | | | 5,742,851 | | | 495,673 | | | — | | | | 439,925 | | | | — | | | | — | | | | 6,678,449 |
United States | | | 17,179,851 | | | 103,162 | | | 755,436 | | | | 5,623,289 | | | | (10,573,121 | ) | | | 1,375,903 | | | | 14,464,520 |
| | | | | | | | | | | | | | | | | | | | | | | | | �� |
Total | | $ | 48,132,296 | | $ | 604,692 | | $ | 1,076,053 | | | $ | 8,313,965 | | | $ | (21,925,811 | ) | | $ | (10,918,601 | ) | | $ | 25,282,594 |
| | | | | | | | | | | | | | | | | | | | | | | | | |
150
NOTES TO FINANCIAL STATEMENTS – continued
September 30, 2009
Institutional High Income Fund
Asset Valuation Inputs
| | | | | | | | | | | | | | | | | | | | | | | | | |
Investments in Securities | | Balance as of
September 30,
2008 | | Accrued
Discounts
(Premiums) | | Realized
Gain (Loss) | | | Change in
Unrealized
Appreciation
(Depreciation) | | | Net
Purchases
(Sales) | | | Net
Transfers
in/(out)
Level 3 | | | Balance as of
September 30,
2009 |
Bonds and Notes | | | | | | | | | | | | | | | | | | | | | | | | | |
Non-Convertible Bonds | | | | | | | | | | | | | | | | | | | | | | | | | |
Airlines | | $ | — | | $ | — | | $ | 6,429 | | | $ | 54,751 | | | $ | (40,181 | ) | | $ | 326,043 | | | $ | 347,042 |
Automotive | | | — | | | 1,008 | | | — | | | | (4,344 | ) | | | 23,913 | | | | 334,939 | | | | 355,516 |
Banking | | | 1,180,000 | | | 69,795 | | | (1,308,436 | ) | | | 382,641 | | | | (324,000 | ) | | | — | | | | — |
Chemicals | | | 1,167,810 | | | 42,092 | | | — | | | | 262,267 | | | | 450,039 | | | | 736,652 | | | | 2,658,860 |
Media Non-Cable | | | 694,600 | | | 32,021 | | | (1,300,501 | ) | | | 937,880 | | | | (364,000 | ) | | | — | | | | — |
Non-Captive Consumer | | | 2,621,462 | | | 47,461 | | | — | | | | 526,196 | | | | — | | | | — | | | | 3,195,119 |
Non-Captive Diversified | | | 867,300 | | | 1,875 | | | — | | | | 245,925 | | | | — | | | | (1,115,100 | ) | | | — |
Property & Casualty Insurance | | | 365,700 | | | 309 | | | — | | | | (62,409 | ) | | | — | | | | (303,600 | ) | | | — |
Supranational | | | 517,186 | | | 50,695 | | | — | | | | 55,497 | | | | 110,614 | | | | (613,256 | ) | | | 120,736 |
Technology | | | 1,403,200 | | | 5,668 | | | (268 | ) | | | 146,975 | | | | (1,575 | ) | | | (1,554,000 | ) | | | — |
Wireless | | | 408,000 | | | 20,822 | | | — | | | | 479,572 | | | | 1,746,006 | | | | (2,654,400 | ) | | | — |
Convertible Bonds | | | | | | | | | | | | | | | | | | | | | | | | | |
Healthcare | | | 115,000 | | | 1,185 | | | — | | | | 69,182 | | | | (185,367 | ) | | | — | | | | — |
Technology | | | — | | | 55,961 | | | 20,904 | | | | (76,905 | ) | | | (165,000 | ) | | | 1,369,880 | | | | 1,204,840 |
Wirelines | | | — | | | 1,680 | | | — | | | | 175,120 | | | | 2,165,800 | | | | — | | | | 2,342,600 |
Preferred Stocks | | | | | | | | | | | | | | | | | | | | | | | | | |
Convertible Preferred Stocks | | | | | | | | | | | | | | | | | | | | | | | | | |
Electric Utilities | | | 166,000 | | | — | | | — | | | | (20,750 | ) | | | — | | | | — | | | | 145,250 |
REITs | | | — | | | — | | | — | | | | (825 | ) | | | — | | | | 13,475 | | | | 12,650 |
Semiconductors & Semiconductor Equipment | | | 534,348 | | | — | | | — | | | | 345,402 | | | | — | | | | (879,750 | ) | | | — |
| | | | | | | | | | | | | | | | | | | | | | | | | |
Total | | $ | 10,040,606 | | $ | 330,572 | | $ | (2,581,872 | ) | | $ | 3,516,175 | | | $ | 3,416,249 | | | $ | (4,339,117 | ) | | $ | 10,382,613 |
| | | | | | | | | | | | | | | | | | | | | | | | | |
Intermediate Duration Fixed Income Fund
Asset Valuation Inputs
| | | | | | | | | | | | | | | | | | | | | | | | | |
Investments in Securities | | Balance as of
September 30,
2008 | | Accrued
Discounts
(Premiums) | | Realized
Gain (Loss) | | | Change in
Unrealized
Appreciation
(Depreciation) | | | Net
Purchases
(Sales) | | | Net
Transfers
in/(out)
Level 3 | | | Balance as of
September 30,
2009 |
Bonds and Notes | | | | | | | | | | | | | | | | | | | | | | | | | |
ABS Home Equity | | $ | 96,943 | | $ | — | | $ | 2 | | | $ | (49,029 | ) | | $ | (117,837 | ) | | $ | 161,964 | | | $ | 92,043 |
Banking | | | 290,591 | | | 133 | | | (37,995 | ) | | | 55,194 | | | | (105,508 | ) | | | (202,415 | ) | | | — |
| | | | | | | | | | | | | | | | | | | | | | | | | |
Total | | $ | 387,534 | | $ | 133 | | $ | (37,993) | | | $ | 6,165 | | | $ | (223,345) | | | $ | (40,451) | | | $ | 92,043 |
| | | | | | | | | | | | | | | | | | | | | | | | | |
151
Investment Grade Fixed Income Fund
Asset Valuation Inputs
| | | | | | | | | | | | | | | | | | | | | | | | | |
Investments in Securities | | Balance as of
September 30,
2008 | | Accrued
Discounts
(Premiums) | | Realized
Gain (Loss) | | | Change in
Unrealized
Appreciation
(Depreciation) | | | Net
Purchases
(Sales) | | | Net
Transfers
in/(out)
Level 3 | | | Balance as of
September 30,
2009 |
Bonds and Notes | | | | | | | | | | | | | | | | | | | | | | | | | |
Non-Convertible Bonds | | | | | | | | | | | | | | | | | | | | | | | | | |
ABS Home Equity | | $ | 506,960 | | $ | — | | $ | (282,443 | ) | | $ | 74,184 | | | $ | (365,927 | ) | | $ | 173,861 | | | $ | 106,635 |
ABS Other | | | — | | | — | | | — | | | | 301 | | | | 2,344,699 | | | | — | | | | 2,345,000 |
Airlines | | | — | | | — | | | — | | | | 299,172 | | | | (196,486 | ) | | | 1,594,352 | | | | 1,697,038 |
Collateralized Mortgage Obligations | | | 272,176 | | | — | | | (83,652 | ) | | | 53,367 | | | | (241,891 | ) | | | — | | | | — |
Diversified Manufacturing | | | — | | | 4,031 | | | — | | | | 83,130 | | | | 629,130 | | | | — | | | | 716,291 |
Media Non-Cable | | | 90,000 | | | 133 | | | (207,190 | ) | | | 158,932 | | | | (41,875 | ) | | | — | | | | — |
Non-Captive Consumer | | | 538,733 | | | 552 | | | — | | | | 117,339 | | | | — | | | | — | | | | 656,624 |
Property & Casualty Insurance | | | 31,800 | | | 33 | | | — | | | | (5,433 | ) | | | — | | | | (26,400 | ) | | | — |
Supranational | | | 2,741,058 | | | 267,498 | | | — | | | | 105,028 | | | | — | | | | (3,113,584 | ) | | | — |
Convertible Bonds | | | | | | | | | | | | | | | | | | | | | | | | | |
Technology | | | — | | | 2,131 | | | 899 | | | | (3,030 | ) | | | (6,000 | ) | | | 49,680 | | | | 43,680 |
| | | | | | | | | | | | | | | | | | | | | | | | | |
Total | | $ | 4,180,727 | | $ | 274,378 | | $ | (572,386 | ) | | $ | 882,990 | | | $ | 2,121,650 | | | $ | (1,322,091 | ) | | $ | 5,565,268 |
| | | | | | | | | | | | | | | | | | | | | | | | | |
4. Derivatives. Effective April 1, 2009, the Funds adopted accounting standards related to derivative instruments and hedging activities which require enhanced disclosures. Derivative instruments are defined as financial instruments whose value and performance are based on the value and performance of another security or financial instrument. Derivative instruments that the Funds currently use include forward foreign currency contracts, futures contracts and swaps (including credit default swaps).
The Funds are subject to the risk that changes in foreign currency exchange rates will have an unfavorable effect on the value of Fund assets denominated in foreign currencies. The Funds may enter into forward foreign currency contracts for hedging purposes to protect the value of the Funds’ holdings of foreign securities. The Funds may also use forward foreign currency contracts to gain exposure to foreign currencies, regardless of whether securities denominated in such currencies are held in the funds. Global Bond Fund and Inflation Protected Securities Fund engaged in forward foreign currency contract transactions during the year ended September 30, 2009.
The Funds are subject to the risk that changes in interest rates will affect the value of the Funds’ investments in fixed income securities. The Funds will be subject to increased interest rate risk to the extent that they invest in fixed-income securities with longer maturities or durations, as compared to investing in fixed-income securities with shorter maturities or durations. The Funds may use futures contracts to manage the Funds’ duration in order to control interest rate risk without having to buy or sell portfolio securities. Global Bond Fund, Inflation Protected Securities Fund, and Intermediate Duration Fixed Income Fund engaged in futures contract transactions during the year ended September 30, 2009.
The Funds are subject to the risk that companies in which the Funds invest will fail financially or otherwise be unwilling or unable to meet their obligations to the Funds. The Funds may use credit default swaps to reduce their credit exposure to issuers of bonds they hold without having to sell the bonds. As a protection buyer, the Funds have the ability to hedge the downside risk of an issuer or group of issuers. As a protection seller, the Funds have the ability to gain exposure to an issuer or group of issuers whose bonds are unavailable or in short supply in the cash bond market, as well as realize additional income in the form of the fees paid by the protection buyer. Global Bond Fund engaged in credit default swap transactions during the year ended September 30, 2009.
152
NOTES TO FINANCIAL STATEMENTS – continued
September 30, 2009
The following is a summary of derivative instruments for Global Bond Fund as of September 30, 2009:
| | | | |
Asset Derivatives | | Forwards | | Swaps |
Foreign exchange contracts | | $1,907,357 | | $ — |
Credit contracts | | — | | 150,447 |
| | |
Statement of Assets and Liabilities Location | | Unrealized appreciation on forward foreign currency contracts | | Swap agreements, at value |
| | |
Liability Derivatives | | Forwards |
Foreign exchange contracts | | $(385,811) |
| |
Statement of Assets and Liabilities Location | | Unrealized depreciation on forward foreign currency contracts |
Transactions in derivative instruments during the period from April 1, 2009 to September 30, 2009 were as follows:
| | | | |
Realized Gain (Loss) | | Forwards | | Swaps |
Foreign exchange contracts | | $2,116,293 | | $ — |
Credit contracts | | — | | (72,892) |
| | |
Statement of Operations Location | | Net realized gain (loss) on foreign currency transactions | | Net realized gain (loss) on swap agreements |
| | | | |
Change in Unrealized
Appreciation (Depreciation) | | Forwards | | Swaps |
Foreign exchange contracts | | $(503,516) | | $ — |
Credit contracts | | — | | (197,561) |
| | |
Statement of Operations Location | | Net change in unrealized appreciation/(depreciation) on foreign currency translations | | Net change in unrealized appreciation/(depreciation) on swap agreements |
The following is a summary of derivative instruments for Inflation Protected Securities Fund as of September 30, 2009:
| | |
Asset Derivatives | | Forwards |
Foreign exchange contracts | | $7,566 |
| |
Statement of Assets and Liabilities Location | | Unrealized appreciation on forward foreign currency contracts |
| | |
Liability Derivatives | | Forwards |
Foreign exchange contracts | | $(6,332) |
| |
Statement of Assets and Liabilities Location | | Unrealized depreciation on forward foreign currency contracts |
Transactions in derivative instruments during the period from April 1, 2009 to September 30, 2009 were as follows:
| | | | |
Realized Gain (Loss) | | Forwards | | Futures |
Foreign exchange contracts | | $(11,723) | | $ — |
Interest rate contracts | | — | | (14,917) |
| | |
Statement of Operations Location | | Net realized gain (loss) on foreign currency transactions | | Net realized gain (loss) on futures contracts |
153
| | |
Change in Unrealized
Appreciation (Depreciation) | | Forwards |
Foreign exchange contracts | | $(1,995) |
| |
Statement of Operations Location | | Net change in unrealized appreciation/(depreciation) on foreign currency translations |
The following is a summary of derivative instruments for Intermediate Duration Fixed Income Fund as of September 30, 2009:
| | |
Assets Derivatives | | Futures |
Interest rate contracts | | $21,914 |
| |
Statement of Assets and Liabilities Location | | Cumulative appreciation/depreciation on futures contracts is reflected above. Only the current day’s variation margin is reported within the Statements of Assets and Liabilities |
Transactions in derivative instruments during the period from April 1, 2009 to September 30, 2009 were as follows:
| | |
Realized Gain (Loss) | | Futures |
Interest rate contracts | | $(13,650) |
| |
Statement of Operations Location | | Net realized gain (loss) on futures contracts |
| | |
Change in Unrealized
Appreciation (Depreciation) | | Futures |
Interest rate contracts | | $5,015 |
| |
Statement of Operations Location | | Net change in unrealized appreciation/(depreciation) on futures contracts |
Volume of derivative activity for Global Bond Fund, Inflation Protected Securities Fund and Intermediate Duration Fixed Income Fund, based on month-end notional amounts outstanding during the period April 1, 2009 to September 30, 2009, were as follows:
| | | | |
Global Bond Fund | | Percentage of
Net Assets Forwards | | Percentage of
Net Assets Swaps |
Average Notional Amount Outstanding | | 2.72% | | 1.01% |
Highest Notional Amount Outstanding | | 5.24% | | 1.91% |
Lowest Notional Amount Outstanding | | 1.79% | | 0.00% |
Notional Amount Outstanding as of September 30, 2009 | | 3.71% | | 1.79% |
| | | | |
Inflation Protected Securities Fund | | Percentage of
Net Assets Forwards | | Percentage of
Net Assets Futures |
Average Notional Amount Outstanding | | 1.36% | | 1.31% |
Highest Notional Amount Outstanding | | 2.11% | | 7.88% |
Lowest Notional Amount Outstanding | | 0.00% | | 0.00% |
Notional Amount Outstanding as of September 30, 2009 | | 0.00% | | 0.00% |
154
NOTES TO FINANCIAL STATEMENTS – continued
September 30, 2009
| | |
Intermediate Duration Fixed Income Fund | | Percentage of
Net Assets Futures |
Average Notional Amount Outstanding | | 4.93% |
Highest Notional Amount Outstanding | | 5.60% |
Lowest Notional Amount Outstanding | | 1.78% |
Notional Amount Outstanding as of September 30, 2009 | | 5.49% |
Notional amounts outstanding are at absolute value and are determined, when applicable, by netting notional amounts of contracts to buy and sell the same underlying instrument.
5. Purchases and Sales of Securities. For the year ended September 30, 2009, purchases and sales of securities (excluding short-term investments and including paydowns) were as follows:
| | | | | | | | | | | | |
| | | U.S. Government/Agency Securities | | Other Securities |
Fund | | Purchases | | Sales | | Purchases | | Sales |
Bond Fund | | $ | 374,262,594 | | $ | 472,880,137 | | $ | 6,530,834,306 | | $ | 4,884,950,090 |
Fixed Income Fund | | | 18,329,555 | | | 18,451,478 | | | 252,253,925 | | | 153,270,830 |
Global Bond Fund | | | 207,601,293 | | | 312,528,720 | | | 998,879,350 | | | 1,357,071,340 |
Inflation Protected Securities Fund | | | 1,074,434 | | | 3,661,233 | | | 468,223 | | | 711,343 |
Institutional High Income Fund | | | 16,583,886 | | | 16,497,183 | | | 269,902,966 | | | 82,465,700 |
Intermediate Duration Fixed Income Fund | | | 4,928,388 | | | 10,793,829 | | | 8,681,526 | | | 10,031,984 |
Investment Grade Fixed Income Fund | | | 1,906,478 | | | 2,361,533 | | | 244,673,278 | | | 76,817,074 |
6. Management Fees and Other Transactions with Affiliates.
a. Management Fees. Loomis, Sayles & Company, L.P. (“Loomis Sayles”) serves as investment adviser to each Fund. Separate management agreements for each Fund in effect for the year ended September 30, 2009, provided for fees at the following annual percentage rates of each Fund’s average daily net assets:
| | | | | | | | | | |
| | | Percentage of Average Daily Net Assets |
Fund | | First
$1 billion | | Next
$1 billion | | Next
$1 billion | | Next
$12 billion | | Over
$15 billion |
Bond Fund | | 0.60% | | 0.60% | | 0.60% | | 0.50% | | 0.49% |
Fixed Income Fund | | 0.50% | | 0.50% | | 0.50% | | 0.50% | | 0.50% |
Global Bond Fund | | 0.60% | | 0.50% | | 0.48% | | 0.48% | | 0.48% |
Inflation Protected Securities Fund | | 0.25% | | 0.25% | | 0.25% | | 0.25% | | 0.25% |
Institutional High Income Fund | | 0.60% | | 0.60% | | 0.60% | | 0.60% | | 0.60% |
Intermediate Duration Fixed Income Fund | | 0.25% | | 0.25% | | 0.25% | | 0.25% | | 0.25% |
Investment Grade Fixed Income Fund | | 0.40% | | 0.40% | | 0.40% | | 0.40% | | 0.40% |
Loomis Sayles has given binding undertakings to the Funds to reduce management fees and/or reimburse certain expenses associated with the Funds to limit their operating expenses, exclusive of acquired fund fees and expenses, brokerage expenses, interest expense, taxes and extraordinary expense. These undertakings are in effect until January 31, 2010 and will be reevaluated on an annual basis. For the year ended September 30, 2009, the expense limits as a percentage of average daily net assets under the expense limitation agreements were as follows:
| | | | | | |
| | | Expense Limit as a Percentage of
Average Daily Net Assets |
Fund | | Institutional Class | | Retail Class | | Admin Class |
Bond Fund | | 0.70% | | 0.95% | | 1.20% |
Fixed Income Fund | | 0.65% | | — | | — |
Global Bond Fund | | 0.75% | | 1.00% | | — |
Inflation Protected Securities Fund | | 0.40% | | — | | — |
Institutional High Income Fund | | 0.75% | | — | | — |
Intermediate Duration Fixed Income Fund | | 0.40% | | — | | — |
Investment Grade Fixed Income Fund | | 0.55% | | — | | — |
155
Loomis Sayles shall be permitted to recover expenses it has borne under the expense limitation agreement (whether through reduction of its management fees or otherwise) on a class by class basis in later periods to the extent the expenses of a class fall below a class’ expense limits, provided, however, that a class is not obligated to pay such reduced fees/expenses more than one year after the end of the fiscal year in which the fee/expense was reduced.
For the year ended September 30, 2009, the management fees for each Fund were as follows:
| | | | | |
Fund | | Management
Fee | | Percentage of
Average Daily Net Assets |
Bond Fund | | $ | 74,251,774 | | 0.52% |
Fixed Income Fund | | | 3,172,675 | | 0.50% |
Global Bond Fund | | | 9,365,171 | | 0.56% |
Inflation Protected Securities Fund | | | 33,599 | | 0.25% |
Institutional High Income Fund | | | 1,742,448 | | 0.60% |
Intermediate Duration Fixed Income Fund | | | 67,166 | | 0.25% |
Investment Grade Fixed Income Fund | | | 1,504,442 | | 0.40% |
For the year ended September 30, 2009, expenses have been reimbursed as follows:
| | | | | | | | | | | | |
| | | Reimbursement1 |
Fund | | Institutional Class | | Retail Class | | Admin Class | | Total |
Bond Fund | | $ | — | | $ | 356,045 | | $ | 96,694 | | $ | 452,739 |
Fixed Income Fund | | | — | | | — | | | — | | | — |
Global Bond Fund | | | — | | | 129,637 | | | — | | | 129,637 |
Inflation Protected Securities Fund | | | 95,963 | | | — | | | — | | | 95,963 |
Institutional High Income Fund | | | — | | | — | | | — | | | — |
Intermediate Duration Fixed Income | | | 75,081 | | | — | | | — | | | 75,081 |
Investment Grade Fixed Income Fund | | | — | | | — | | | — | | | — |
1Expense reimbursements are subject to possible recovery until September 30, 2010.
There were no expenses recovered during the year ended September 30, 2009 as permitted under the expense limitation agreement.
Certain officers and employees of Loomis Sayles are also officers or Trustees of the Trust. Loomis Sayles’ general partner is indirectly owned by Natixis Global Asset Management, L.P. (“Natixis US”), which is part of Natixis Global Asset Management, an international asset management group based in Paris, France.
b. Administrative Fees. Natixis Asset Management Advisors, L.P. (“Natixis Advisors”) provides certain administrative services for the Funds and contracts with State Street Bank to serve as sub-administrator. Natixis Advisors is a wholly-owned subsidiary of Natixis US. Pursuant to an agreement among Natixis Funds Trust I, Natixis Funds Trust II, Natixis Funds Trust III, Natixis Funds Trust IV, Natixis Cash Management Trust, Gateway Trust (“Natixis Funds Trusts”), Loomis Sayles Funds I, Loomis Sayles Funds II (“Loomis Sayles Funds Trusts”), Hansberger International Series and Natixis Advisors, each Fund pays Natixis Advisors monthly its pro rata portion of fees equal to an annual rate of 0.0575% of the first $15 billion of the average daily net assets of the Natixis Funds Trusts, Loomis Sayles Funds Trusts and the Hansberger International Series, 0.0500% of the next $15 billion, 0.0425% of the next $30 billion and 0.0375% of such assets in excess of $60 billion, subject to an annual aggregate minimum fee for the Natixis Funds Trusts, Loomis Sayles Funds Trusts and the Hansberger International Series of $10 million, which is reevaluated on an annual basis. New funds are subject to a fee for the first twelve months of operations of $75,000 plus $12,500 per class and an additional $75,000 if managed by multiple subadvisors.
156
NOTES TO FINANCIAL STATEMENTS – continued
September 30, 2009
For the year ended September 30, 2009, each Fund paid the following for administrative fees to Natixis Advisors:
| | | |
Fund | | Administrative
Fees |
Bond Fund | | $ | 7,173,026 |
Fixed Income Fund | | | 319,229 |
Global Bond Fund | | | 843,474 |
Inflation Protected Securities Fund | | | 6,779 |
Institutional High Income Fund | | | 145,571 |
Intermediate Duration Fixed Income Fund | | | 13,546 |
Investment Grade Fixed Income Fund | | | 188,759 |
c. Service and Distribution Fees. Natixis Distributors, L.P. (“Natixis Distributors”), a wholly owned subsidiary of Natixis US, has entered into a distribution agreement with the Trust. Pursuant to this agreement, Natixis Distributors serves as principal underwriter of each fund.
Pursuant to Rule 12b-1 under the 1940 Act, Bond Fund and Global Bond Fund have adopted a Distribution Plan relating to each Fund’s Retail Class shares (the “Retail Class Plans”) and Bond Fund has adopted a separate Distribution Plan relating to its Admin Class shares (the “Admin Class Plan”).
Under the respective Retail Class and Admin Class Plans, each Fund pays Natixis Distributors a monthly distribution fee at an annual rate not to exceed 0.25% of the average daily net assets attributable to the Fund’s Retail Class and Admin Class Shares, as reimbursement for expenses incurred by Natixis Distributors in providing personal services to investors in Retail Class and Admin Class Shares and/or maintenance of shareholder accounts. In addition, the Admin Class shares of the Bond Fund may pay an administrative service fee at an annual rate not to exceed 0.25% of the average daily net assets attributable to Admin Class shares to securities dealers or financial intermediaries for providing personal service and account maintenance for their customers who hold such shares.
For the year ended September 30, 2009, the Funds paid the following service and distribution fees:
| | | | | | | | | | | | |
| | | Service Fees | | Distribution Fees |
Fund | | Admin Class | | Retail Class | | Admin Class | | Retail Class |
Bond Fund | | $ | 469,029 | | $ | — | | $ | 469,029 | | $ | 15,247,110 |
Global Bond Fund | | | — | | | — | | | — | | | 2,014,894 |
d. Sub-Transfer Agent Fees. Natixis Distributors has entered into agreements with financial intermediaries to provide certain recordkeeping, processing, shareholder communications and other services to customers of the intermediaries and has agreed to compensate the intermediaries for providing those services. Certain services would be provided by the Funds if the shares of those customers were registered directly with the Funds’ transfer agent. Accordingly, the Funds agreed to pay a portion of the intermediary fees attributable to shares of the Fund held by the intermediaries (which generally is a percentage of the value of shares held) not exceeding what the Funds would have paid its transfer agent had each customer’s shares been registered directly with the transfer agent instead of held through the intermediaries. Natixis Distributors pays the remainder of the fees.
For the year ended September 30, 2009, the Funds paid the following sub-transfer agent fees, which are reflected in transfer agent fees and expenses in the Statements of Operations.
| | | | | | | | | |
| | | Sub-Transfer Agent Fees |
Fund | | Institutional
Class | | Retail
Class | | Admin
Class |
Bond Fund | | $ | 3,635,283 | | $ | 5,463,928 | | $ | 282,009 |
Fixed Income Fund | | | — | | | — | | | — |
Global Bond Fund | | | 232,257 | | | 852,635 | | | — |
Inflation Protected Securities Fund | | | 5,178 | | | — | | | — |
Institutional High Income Fund | | | 4,668 | | | — | | | — |
Intermediate Duration Fixed Income Fund | | | 450 | | | — | | | — |
Investment Grade Fixed Income Fund | | | — | | | — | | | — |
157
e. Trustees Fees and Expenses. The Funds do not pay any compensation directly to their officers or Trustees who are directors, officers or employees of Natixis Advisors, Natixis Distributors, Natixis US, or their affiliates. The Chairperson of the Board receives a retainer fee at the annual rate of $200,000. The Chairperson does not receive any meeting attendance fees for Board of Trustees meetings or committee meetings that she attends. Each Independent Trustee (other than the Chairperson) receives, in the aggregate, a retainer fee at the annual rate of $65,000. Each Independent Trustee also receives a meeting attendance fee of $7,500 for each meeting of the Board of Trustees that he or she attends in person and $3,750 for each meeting of the Board of Trustees that he or she attends telephonically. In addition, each committee chair receives an additional retainer fee at the annual rate of $10,000. Each Contract Review and Governance Committee member is compensated $5,000 for each Committee meeting that he or she attends in person and $2,500 for each meeting that he or she attends telephonically. Each Audit Committee member is compensated $6,250 for each Committee meeting that he or she attends in person and $3,125 for each meeting that he or she attends telephonically. These fees are allocated among the funds in the Natixis Funds Trusts, Loomis Sayles Funds Trusts and the Hansberger International Series based on a formula that takes into account, among other factors, the relative net assets of each Fund. Trustees are reimbursed for travel expenses in connection with attendance at meetings.
A deferred compensation plan (the “Plan”) is available to the Trustees on a voluntary basis. Deferred amounts remain in the Funds until distributed in accordance with the provisions of the Plan. The value of a participating Trustee’s deferral account is based on theoretical investments of deferred amounts, on the normal payment dates, in certain funds of the Natixis Funds Trusts, Loomis Sayles Funds Trusts and Hansberger International Series as designated by the participating Trustees. Changes in the value of participants’ deferral accounts are allocated pro rata among the funds in the Natixis Funds Trusts, Loomis Sayles Funds Trusts, and Hansberger International Series, and are normally reflected as Trustees’ fees and expenses in the Statements of Operations. The portions of the accrued obligations allocated to the Funds under the Plan are reflected as Deferred Trustees’ fees on the Statements of Assets and Liabilities.
f. Interfund Transactions. A Fund may purchase a security from, or sell a security to, an affiliated fund provided the affiliation is due solely to having a common investment adviser, common officers, or common Trustees. For the year ended September 30, 2009, the Global Bond Fund purchased securities from an affiliated fund in compliance with Rule 17a-7 of the 1940 Act in the amount of $9,053,410.
7. Line of Credit. Each Fund, together with certain other funds of Natixis Funds Trusts, Loomis Sayles Funds Trusts and the Hansberger International Series, participates in a $200,000,000 committed unsecured line of credit provided by State Street Bank, with an individual limit of $125,000,000 for each fund that participates in the line of credit. Interest is charged to each participating fund based on its borrowings at a rate per annum equal to the greater of the Federal Funds rate or overnight LIBOR, plus 0.75%. In addition, a commitment fee of 0.125% per annum, payable at the end of each calendar quarter, is accrued and apportioned among the participating funds based on their average daily unused portion of the line of credit.
Prior to March 11, 2009, each Fund, together with certain other funds of Natixis Funds Trusts, Loomis Sayles Funds Trusts and Hansberger International Series, participated in a $200,000,000 committed unsecured line of credit provided by State Street Bank, with an individual limit of $125,000,000 for each fund that participated in the line of credit. Interest was charged to each participating fund based on its borrowings at a rate per annum equal to the Federal Funds rate plus 0.50%. In addition, a commitment fee of 0.09% per annum, payable at the end of each calendar quarter, was accrued and apportioned among the participating funds based on their average daily unused portion of the line of credit.
For the year ended September 30, 2009, the Funds had no borrowings under these agreements.
8. Shareholders. At September 30, 2009, Loomis Sayles Distributors, L.P. and Loomis Sayles Trust Co. LLC owned 249,638 shares, equal to 18.7% of Inflation Protected Securities Fund’s shares outstanding. At September 30, 2009, the Loomis Sayles Funded Pension Plan and Trust (“Pension Plan”) and the Loomis Sayles Employees’ Profit Sharing Retirement Plan held shares of beneficial interest in the Funds as follows:
| | | | |
Fund | | Pension Plan | | Profit Sharing
Retirement Plan |
Bond Fund | | 934,787 | | 2,137,488 |
Fixed Income Fund | | — | | — |
Global Bond Fund | | — | | 409,600 |
Inflation Protected Securities Fund | | — | | 204,342 |
Institutional High Income Fund | | — | | 1,147,868 |
Intermediate Duration Fixed Income Fund | | — | | 48,027 |
Investment Grade Fixed Income Fund | | — | | — |
158
NOTES TO FINANCIAL STATEMENTS – continued
September 30, 2009
At September 30, 2009, three shareholders individually owned more than 5% of the Fixed Income Fund’s total outstanding shares, representing in aggregate, 17.4% of the Fund; one shareholder individually owned more than 5% of the Global Bond Fund’s total outstanding shares, representing 9.4% of the Fund; two shareholders individually owned more than 5% of the Inflation Protected Securities Fund’s total outstanding shares, representing in aggregate, 18.7% of the Fund; two shareholders individually owned more than 5% of the Institutional High Income Fund’s total outstanding shares, representing in aggregate, 13.4% of the Fund; four shareholders individually owned more than 5% of the Intermediate Duration Fixed Income Fund’s total outstanding shares, representing in aggregate, 88.0% of the Fund; and five shareholders individually owned more than 5% of the Investment Grade Fixed Income Fund’s total outstanding shares, representing in aggregate, 35.1% of the Fund.
9. Capital Shares. Each Fund may issue an unlimited number of shares of beneficial interest, without par value. Transactions in capital shares were as follows:
| | | | | | | | | | | | | | |
| | | Bond Fund | |
| | |
| | | Year Ended September 30, 2009 | | | Year Ended September 30, 2008 | |
| | | | |
| Institutional Class | | Shares | | | Amount | | | Shares | | | Amount | |
Issued from the sale of shares | | 447,762,869 | | | $ | 4,881,257,039 | | | 251,570,447 | | | $ | 3,582,639,853 | |
Issued in connection with the reinvestment of distributions | | 54,809,548 | | | | 585,511,507 | | | 38,067,200 | | | | 533,833,567 | |
Issued from subscriptions-in-kind* | | 2,661,512 | | | | 27,012,678 | | | — | | | | — | |
Redeemed | | (310,096,324 | ) | | | (3,370,767,748 | ) | | (173,399,411 | ) | | | (2,388,845,785 | ) |
| | | | | | | | | | | | | | |
Net change | | 195,137,605 | | | $ | 2,123,013,476 | | | 116,238,236 | | | $ | 1,727,627,635 | |
| | | | | | | | | | | | | | |
* Issued in exchange for portfolio securities contributed to the Fund in-kind by shareholders on February 11, 2009 and March 6, 2009. Contributions included $8,628,801 of securities and $120,933 in receivables on February 11, 2009, and $17,854,274 of securities and $408,670 in receivables on March 6, 2009. These securities contributed on both dates were part of a portfolio that was previously managed by Loomis Sayles.
| | | | | | | | | | | | | | |
| | | | |
| Retail Class | | Shares | | | Amount | | | Shares | | | Amount | |
Issued from the sale of shares | | 262,029,984 | | | $ | 2,844,963,241 | | | 289,365,734 | | | $ | 4,136,823,680 | |
Issued in connection with the reinvestment of distributions | | 45,692,554 | | | | 482,421,382 | | | 36,275,158 | | | | 506,995,862 | |
Redeemed | | (296,153,704 | ) | | | (3,178,299,099 | ) | | (184,939,337 | ) | | | (2,542,156,728 | ) |
| | | | | | | | | | | | | | |
Net change | | 11,568,834 | | | $ | 149,085,524 | | | 140,701,555 | | | $ | 2,101,662,814 | |
| | | | | | | | | | | | | | |
| | | | |
| Admin Class | | Shares | | | Amount | | | Shares | | | Amount | |
Issued from the sale of shares | | 6,268,750 | | | $ | 68,449,514 | | | 9,933,305 | | | $ | 141,062,361 | |
Issued in connection with the reinvestment of distributions | | 1,328,590 | | | | 13,943,089 | | | 936,366 | | | | 13,050,988 | |
Redeemed | | (7,894,921 | ) | | | (85,275,059 | ) | | (6,310,368 | ) | | | (88,396,246 | ) |
| | | | | | | | | | | | | | |
Net change | | (297,581 | ) | | $ | (2,882,456 | ) | | 4,559,303 | | | $ | 65,717,103 | |
| | | | | | | | | | | | | | |
Increase (decrease) from capital share transactions | | 206,408,858 | | | $ | 2,269,216,544 | | | 261,499,094 | | | $ | 3,895,007,552 | |
| | | | | | | | | | | | | | |
159
| | | | | | | | | | | | | | |
| | | Fixed Income Fund | |
| | |
| | | Year Ended September 30, 2009 | | | Year Ended September 30, 2008 | |
| | | | |
| Institutional Class | | Shares | | | Amount | | | Shares | | | Amount | |
Issued from the sale of shares | | 12,051,705 | | | $ | 127,636,419 | | | 20,684,018 | | | $ | 285,477,865 | |
Issued in connection with the reinvestment of distributions | | 5,247,998 | | | | 48,963,816 | | | 3,076,075 | | | | 41,096,367 | |
Redeemed | | (9,798,873 | ) | | | (111,769,348 | ) | | (14,148,613 | ) | | | (196,073,515 | ) |
| | | | | | | | | | | | | | |
Increase (decrease) from capital share transactions | | 7,500,830 | | | $ | 64,830,887 | | | 9,611,480 | | | $ | 130,500,717 | |
| | | | | | | | | | | | | | |
| |
| | | Global Bond Fund | |
| | |
| | | Year Ended September 30, 2009 | | | Year Ended September 30, 2008 | |
| | | | |
| Institutional Class | | Shares | | | Amount | | | Shares | | | Amount | |
Issued from the sale of shares | | 19,335,028 | | | $ | 274,432,928 | | | 35,619,497 | | | $ | 570,769,864 | |
Issued in connection with the reinvestment of distributions | | 3,749,367 | | | | 50,235,682 | | | 3,416,152 | | | | 54,204,619 | |
Issued from subscriptions-in-kind* | | 6,336,840 | | | | 91,884,176 | | | — | | | | — | |
Redeemed | | (45,498,904 | ) | | | (622,417,697 | ) | | (21,704,761 | ) | | | (345,126,532 | ) |
| | | | | | | | | | | | | | |
Net change | | (16,077,669 | ) | | $ | (205,864,911 | ) | | 17,330,888 | | | $ | 279,847,951 | |
| | | | | | | | | | | | | | |
* Issued in exchange for portfolio securities contributed to the Fund in-kind by shareholders on June 11, 2009. Contributions included $90,341,115 of securities and $1,543,061 in receivables. These securities contributed were part of a portfolio that was previously managed by Loomis Sayles.
| | | | | | | | | | | | | | |
| | | | |
| Retail Class | | Shares | | | Amount | | | Shares | | | Amount | |
Issued from the sale of shares | | 19,906,248 | | | $ | 283,551,918 | | | 41,004,039 | | | $ | 653,696,591 | |
Issued in connection with the reinvestment of distributions | | 3,660,217 | | | | 48,438,738 | | | 3,149,153 | | | | 49,533,904 | |
Redeemed | | (41,022,745 | ) | | | (552,609,501 | ) | | (24,777,028 | ) | | | (388,658,940 | ) |
| | | | | | | | | | | | | | |
Net change | | (17,456,280 | ) | | $ | (220,618,845 | ) | | 19,376,164 | | | $ | 314,571,555 | |
| | | | | | | | | | | | | | |
Increase (decrease) from capital share transactions | | (33,533,949 | ) | | $ | (426,483,756 | ) | | 36,707,052 | | | $ | 594,419,506 | |
| | | | | | | | | | | | | | |
| |
| | | Inflation Protected Securities Fund | |
| | |
| | | Year Ended September 30, 2009 | | | Year Ended September 30, 2008 | |
| | | | |
| Institutional Class | | Shares | | | Amount | | | Shares | | | Amount | |
Issued from the sale of shares | | 390,294 | | | $ | 3,782,304 | | | 644,995 | | | $ | 6,931,326 | |
Issued in connection with the reinvestment of distributions | | 12,682 | | | | 124,583 | | | 89,564 | | | | 936,772 | |
Redeemed | | (693,739 | ) | | | (6,657,359 | ) | | (414,633 | ) | | | (4,413,426 | ) |
| | | | | | | | | | | | | | |
Increase (decrease) from capital share transactions | | (290,763 | ) | | $ | (2,750,472 | ) | | 319,926 | | | $ | 3,454,672 | |
| | | | | | | | | | | | | | |
160
NOTES TO FINANCIAL STATEMENTS – continued
September 30, 2009
| | | | | | | | | | | | | | |
| | | Institutional High Income Fund | |
| | |
| | | Year Ended September 30, 2009 | | | Year Ended September 30, 2008 | |
| | | | |
| Institutional Class | | Shares | | | Amount | | | Shares | | | Amount | |
Issued from the sale of shares | | 39,568,017 | | | $ | 226,395,012 | | | 13,115,043 | | | $ | 104,688,742 | |
Issued in connection with the reinvestment of distributions | | 3,472,385 | | | | 16,528,551 | | | 1,889,032 | | | | 14,526,657 | |
Redeemed | | (12,239,881 | ) | | | (73,272,876 | ) | | (6,046,047 | ) | | | (47,783,552 | ) |
| | | | | | | | | | | | | | |
Increase (decrease) from capital share transactions | | 30,800,521 | | | $ | 169,650,687 | | | 8,958,028 | | | $ | 71,431,847 | |
| | | | | | | | | | | | | | |
| |
| | | Intermediate Duration Fixed Income Fund | |
| | |
| | | Year Ended September 30, 2009 | | | Year Ended September 30, 2008 | |
| | | | |
| Institutional Class | | Shares | | | Amount | | | Shares | | | Amount | |
Issued from the sale of shares | | 100,635 | | | $ | 921,405 | | | 464,596 | | | $ | 4,429,364 | |
Issued in connection with the reinvestment of distributions | | 127,709 | | | | 1,149,588 | | | 128,620 | | | | 1,209,983 | |
Redeemed | | (1,067,803 | ) | | | (9,409,096 | ) | | (257,694 | ) | | | (2,438,893 | ) |
| | | | | | | | | | | | | | |
Increase (decrease) from capital share transactions | | (839,459 | ) | | $ | (7,338,103 | ) | | 335,522 | | | $ | 3,200,454 | |
| | | | | | | | | | | | | | |
| |
| | | Investment Grade Fixed Income Fund | |
| | |
| | | Year Ended September 30, 2009 | | | Year Ended September 30, 2008 | |
| | | | |
| Institutional Class | | Shares | | | Amount | | | Shares | | | Amount | |
Issued from the sale of shares | | 20,294,294 | | | $ | 215,850,024 | | | 7,579,953 | | | $ | 95,580,515 | |
Issued in connection with the reinvestment of distributions | | 2,114,771 | | | | 22,338,478 | | | 1,021,690 | | | | 12,868,000 | |
Redeemed | | (4,465,866 | ) | | | (50,432,732 | ) | | (4,336,110 | ) | | | (54,588,362 | ) |
| | | | | | | | | | | | | | |
Increase (decrease) from capital share transactions | | 17,943,199 | | | $ | 187,755,770 | | | 4,265,533 | | | $ | 53,860,153 | |
| | | | | | | | | | | | | | |
10. Concentration of Risk. Each Fund may purchase investments of foreign issuers. Investing in securities of foreign issuers involves special risks and considerations not typically associated with investing in U.S. companies and securities of the U.S. government. These risks include revaluation of currencies and the risk of expropriation. Moreover, the markets for securities of many foreign issuers may be less liquid and the prices of such securities may be more volatile than those of comparable U.S. companies and the U.S. government.
161
REPORT OF INDEPENDENT REGISTERED PUBLIC ACCOUNTING FIRM
To the Trustees of Loomis Sayles Funds I and Shareholders of Loomis Sayles Bond Fund, Loomis Sayles Fixed Income Fund, Loomis Sayles Global Bond Fund, Loomis Sayles Inflation Protected Securities Fund, Loomis Sayles Institutional High Income Fund, Loomis Sayles Intermediate Duration Fixed Income Fund and Loomis Sayles Investment Grade Fixed Income Fund:
In our opinion, the accompanying statements of assets and liabilities, including the portfolios of investments, and the related statements of operations and of changes in net assets and the financial highlights present fairly, in all material respects, the financial position of the Loomis Sayles Bond Fund, Loomis Sayles Fixed Income Fund, Loomis Sayles Global Bond Fund, Loomis Sayles Inflation Protected Securities Fund, Loomis Sayles Institutional High Income Fund, Loomis Sayles Intermediate Duration Fixed Income Fund and Loomis Sayles Investment Grade Fixed Income Fund, each a series of Loomis Sayles Funds I (collectively, the “Funds”), at September 30, 2009, and the results of each of their operations, the changes in each of their net assets and the financial highlights for each of the periods indicated, in conformity with accounting principles generally accepted in the United States of America. These financial statements and financial highlights (hereafter referred to as “financial statements”) are the responsibility of the Funds’ management; our responsibility is to express an opinion on these financial statements based on our audits. We conducted our audits of these financial statements in accordance with the standards of the Public Company Accounting Oversight Board (United States). Those standards require that we plan and perform the audits to obtain reasonable assurance about whether the financial statements are free of material misstatement. An audit includes examining, on a test basis, evidence supporting the amounts and disclosures in the financial statements, assessing the accounting principles used and significant estimates made by management, and evaluating the overall financial statement presentation. We believe that our audits, which included confirmation of securities at September 30, 2009 by correspondence with the custodian and brokers, provide a reasonable basis for our opinion.
PricewaterhouseCoopers LLP
Boston, Massachusetts
November 23, 2009
162
2009 U.S. TAX DISTRIBUTION INFORMATION TO SHAREHOLDERS (Unaudited)
Corporate Dividends Received Deduction. For the fiscal year ended September 30, 2009, a percentage of dividends distributed by the Funds listed below qualify for the dividends received deduction for corporate shareholders. These percentages are as follows:
| | |
Fund | | Qualifying Percentage |
Bond | | 2.49% |
Fixed Income | | 2.02% |
Global Bond | | 1.13% |
Inflation Protected Securities | | 0.28% |
Institutional High Income | | 2.58% |
Investment Grade Fixed Income | | 1.04% |
Capital Gains Distributions. Pursuant to Internal Revenue Section 852(b), the following Funds paid distributions, which have been designated as capital gains distributions for the fiscal year ended September 30, 2009, unless subsequently determined to be different.
| | | |
Fund | | Amount |
Bond | | $ | 117,096,804 |
Fixed Income | | | 8,757,966 |
Institutional High Income | | | 1,232,223 |
Investment Grade Fixed Income | | | 2,544,109 |
Qualified Dividend Income. For the fiscal year ended September 30, 2009, the Funds below will designate up to the maximum amount allowable pursuant to the Internal Revenue Code as qualified dividend income eligible for reduced tax rates. These lower rates range from 0% to 15% depending on an individual’s tax bracket. If the Funds pay a distribution during calendar year 2009, complete information will be reported in conjunction with Form 1099-DIV.
| | |
Fund | | |
Bond | | |
Fixed Income | | |
Global Bond | | |
Institutional High Income | | |
Investment Grade Fixed Income | | |
163
TRUSTEE AND OFFICER INFORMATION
The tables below provide certain information regarding the Trustees and officers of Loomis Sayles Funds I (the “Trust”). Unless otherwise indicated, the address of all persons below is 399 Boylston Street, Boston, MA 02116. The Trust’s Statements of Additional Information include additional information about the Trustees of the Trust and are available by calling Loomis Sayles at 800-633-3330.
| | | | | | |
| Name and Year of Birth | | Position(s)
Held with
the Trusts, Length
of Time Served and
Term of Office* | | Principal Occupation(s)
During Past 5 Years** | | Number of Portfolios in Fund
Complex Overseen*** and
Other Directorships Held |
| | |
Independent Trustees | | | | |
Graham T. Allison, Jr. (1940) | | Trustee Since 2003 Contract Review and Governance Committee Member | | Douglas Dillon Professor and Director of the Belfer Center for Science and International Affairs, John F. Kennedy School of Government, Harvard University | | 39 Director, Taubman Centers, Inc. (real estate investment trust) |
| | | |
Charles D. Baker (1956) | | Trustee Since 2005 Contract Review and Governance Committee Member | | Formerly, President and Chief Executive Officer, Harvard Pilgrim Health Care (health plan) | | 39 None |
| | | |
Edward A. Benjamin (1938) | | Trustee Since 2002 Chairman of the Contract Review and Governance Committee | | Retired | | 39 None |
| | | |
Daniel M. Cain (1945) | | Trustee Since 2003 Chairman of the Audit Committee | | Chairman (formerly, President and Chief Executive Officer), Cain Brothers & Company, Incorporated (investment banking) | | 39 Director, Sheridan Healthcare Inc. (physician practice management) |
| | | |
Kenneth A. Drucker (1945) | | Trustee Since 2008 Audit Committee Member | | Formerly, Treasurer, Sequa Corp. (manufacturing) | | 39 None |
| | | |
Wendell J. Knox**** (1948) | | Trustee Since 2009 Contract Review and Governance Committee Member | | Director (formerly, President and Chief Executive Officer) of Abt Associates Inc. (research and consulting) | | 39 Director, Eastern Bank (commercial bank); Director, The Hanover Insurance Group (property and casualty insurance) |
| | | |
Sandra O. Moose (1942) | | Chairperson of the Board of Trustees since November 2005
Trustee Since 2003 Ex officio member of the Audit Committee and Contract Review and Governance Committee | | President, Strategic Advisory Services (management consulting); formerly, Senior Vice President and Director, The Boston Consulting Group, Inc. (management consulting) | | 39 Director, Verizon Communications; Director, AES Corporation (international power company) |
| | | |
Cynthia L. Walker (1956) | | Trustee Since 2005 Audit Committee Member | | Deputy Dean for Finance and Administration, Yale University School of Medicine; formerly, Executive Dean for Administration, Harvard Medical School; and formerly, Dean for Finance and Chief Financial Officer, Harvard Medical School | | 39 None |
164
| | | | | | |
| Name and Year of Birth | | Position(s)
Held with
the Trusts, Length
of Time Served and
Term of Office* | | Principal Occupation(s)
During Past 5 Years** | | Number of Portfolios in Fund
Complex Overseen*** and
Other Directorships Held |
| | | |
Interested Trustees | | | | | | |
Robert J. Blanding1 (1947) 555 California Street San Francisco, CA 94104 | | Trustee Since 2002 President and Chief Executive Officer since 2002 | | President, Chairman, Director and Chief Executive Officer, Loomis, Sayles & Company, L.P. | | 39 None |
| | | |
John T. Hailer2 (1960) | | Trustee Since 2003 | | President and Chief Executive Officer-U.S. and Asia, Natixis Global Asset Management, L.P.; formerly, President and Chief Executive Officer, Natixis Distribution Corporation, Natixis Asset Management Advisors, L.P., Natixis Distributors, L.P. and Natixis Global Associates, Inc. | | 39 None |
| * | Each Trustee serves until retirement, resignation or removal from the Board of Trustees. The current retirement age is 72. The position of Chairperson of the Board is appointed for a two-year term. Ms. Moose was appointed to serve an additional two-year term as the Chairperson of the Board of Trustees on September 14, 2007. |
| ** | Each person listed above, except as noted, holds the same position(s) with the Natixis Funds Trust I, Natixis Funds Trust II, Natixis Funds Trust III, Natixis Funds Trust IV, Gateway Trust and the Natixis Cash Management Trust (collectively, the “Natixis Funds Trusts”), Loomis Sayles Funds I and Loomis Sayles Funds II (collectively, the “Loomis Sayles Funds Trusts”), and Hansberger International Series. Previous positions during the past five years with Natixis Distributors, L.P. (the “Distributor”), Natixis Asset Management Advisors, L.P. (“Natixis Advisors”), or Loomis, Sayles & Company, L.P. (“Loomis Sayles”) are omitted if not materially different from a Trustee’s or officer’s current position with such entity. |
| *** | The Trustees of the Trusts serve as trustees of a fund complex that includes all series of the Natixis Funds Trusts, the Loomis Sayles Funds Trusts and Hansberger International Series (collectively, the “Fund Complex”). |
| **** | Mr. Knox was appointed as trustee effective July 1, 2009. |
| 1 | Mr. Blanding is deemed an “interested person” of the Trusts because he holds the following positions with an affiliated person of the Trusts: President, Chairman, Director and Chief Executive Officer of Loomis Sayles. |
| 2 | Mr. Hailer is deemed an “interested person” of the Trusts because he holds the following positions with an affiliated person of the Trusts: President and Chief Executive Officer-U.S. and Asia, Natixis Global Asset Management, L.P. |
165
| | | | | | |
| Name and Year of Birth | | Position(s)
Held with
the Trusts | | Term of Office* and
Length of Time Served | | Principal Occupation
During Past 5 Years** |
|
Officers of the Trust |
Coleen Downs Dinneen (1960) | | Secretary, Clerk and Chief Legal Officer | | Since September 2004 | | Executive Vice President, General Counsel, Secretary and Clerk (formerly, Senior Vice President, Deputy General Counsel, Assistant Secretary and Assistant Clerk), Natixis Distribution Corporation, Natixis Asset Management Advisors, L.P. and Natixis Distributors, L.P. |
| | | |
Daniel J. Fuss (1933) One Financial Center Boston, MA 02111 | | Executive Vice President | | Since June 2003 | | Vice Chairman and Director, Loomis, Sayles & Company, L.P. |
| | | |
David Giunta (1965) | | Executive Vice President | | Since March 2008 | | President and Chief Executive Officer, Natixis Distribution Corporation, Natixis Asset Management Advisors, L.P. and Natixis Distributors, L.P.; formerly, President, Fidelity Charitable Gift Fund; and formerly, Senior Vice President, Fidelity Brokerage Company |
| | | |
Russell L. Kane (1969) | | Chief Compliance Officer, Assistant Secretary and Anti-Money Laundering Officer | | Chief Compliance Officer since May 2006; Assistant Secretary since June 2004; and Anti-Money Laundering Officer since April 2007 | | Chief Compliance Officer for Mutual Funds, Senior Vice President, Deputy General Counsel, Assistant Secretary and Assistant Clerk, Natixis Distribution Corporation, Natixis Asset Management Advisors, L.P. and Natixis Distributors, L.P. |
| | | |
Michael C. Kardok (1959) | | Treasurer, Principal Financial and Accounting Officer | | Since October 2004 | | Senior Vice President, Natixis Asset Management Advisors, L.P. and Natixis Distributors, L.P. |
| * | Each officer of the Trusts serves for an indefinite term in accordance with the Trusts’ current By-laws until the date his or her successor is elected and qualified, or until he or she sooner dies, retires, is removed or becomes disqualified. |
| ** | Each person listed above, except as noted, holds the same position(s) with the Fund Complex. Mr. Fuss is not an officer of the Natixis Funds Trusts or the Hansberger International Series. Previous positions during the past five years with the Distributor, Natixis Advisors or Loomis Sayles are omitted if not materially different from a Trustee’s or officer’s current position with such entity. |
166

Loomis Sayles High Income Opportunities Fund
Loomis Sayles Securitized Asset Fund
ANNUAL REPORT
SEPTEMBER 30, 2009
FUND AND MANAGER REVIEW
Loomis Sayles High Income Opportunities Fund

Matthew Eagan, CFA
Manager Since April 2004

Kathleen Gaffney, CFA
Manager Since April 2004

Dan Fuss, CFA, CIC
Manager Since April 2004

Elaine Stokes
Manager Since April 2004
KEY FUND FACTS
Symbol | LSIOX
Objective | High current income. Capital appreciation is the Fund’s secondary objective.
Strategy | Invests substantially all of its assets, and may invest up to 100% of its assets, in high income securities. High income securities are fixed-income securities that Loomis Sayles believes have the potential to generate relatively high levels of current income.
Fund Inception Date | 4/12/04
Total Net Assets | $71.7 million
PORTFOLIO REVIEW
The Fund outperformed its Benchmark, the Barclays Capital U.S. Corporate High-Yield Bond Index, for the fiscal year ended September 30, 2009, primarily due to security selection within the high yield sector and our out-of-Benchmark exposure to investment grade credit, convertible bonds, and non-agency residential mortgage-backed securities (RMBS).
Following the Lehman Brothers bankruptcy in September 2008, the financial crisis culminated with high yield spreads widening to historic levels. In early 2009, government programs and investor demand for risk contributed to a rally within the high yield sector. The Fund was well positioned to take advantage of the subsequent compression in spreads. In particular, the Fund’s specific credit exposure among B-rated securities outperformed the Benchmark.
The return of liquidity to the markets during the second half of the reporting period dramatically lowered the default expectations for high yield securities. Companies regained the ability to refinance upcoming debt maturities through the capital markets. These improved conditions were partly responsible for the strong performance from our high yield industrial issuers, notably those in the communication and consumer non-cyclical sectors.
Like the high yield sector, investment grade credit and convertible bonds benefited from resumed investor risk appetites in the second half of the period. Government programs continued to support the mortgage-related sector, which benefited our exposure to non-agency RMBS.
Similarly, enhanced liquidity provided by the government’s Temporary Loan Guarantee Program worked in conjunction with the technical rally to drive returns in the financials sector. However, our underweight to high yield financials and investment grade banking names dragged down the Fund’s relative performance. In addition, our underweight to bonds with CC and C credit ratings weighed on performance because bonds with the lowest quality ratings were best performers in the Index. The re-opening of the primary market has tempered default expectations, yet little has changed fundamentally regarding the credit quality of most of these companies. We continue to believe the majority of defaults will come from the lower-rated segments and we are maintaining our underweight position.
OUTLOOK
Looking ahead, we continue to believe there is select value in corporate bonds. Despite their recent tightening, spreads remain wide relative to long-term averages. A vast majority of the spread tightening that has taken place this
1
year is due to the re-emergence of liquidity in the markets. Over the long term, further spread tightening from these levels will most likely be generated by an improvement in global and US economic fundamentals. Our view is that maintaining specific risk in the portfolio will present the best opportunity for long-term performance.
The global “risk-on” trade has weakened the US dollar, and we expect this may continue. Currencies from developed and emerging markets may offer more long-term upside potential, particularly the European peripheral currencies and Asian currencies tied to China and its global-growth story.
AVERAGE ANNUAL TOTAL RETURNS
Periods Ended September 30, 2009
| | | | | | | |
| 1 Year | | | 5 Years | | | Since
Inception(a) | |
|
Loomis Sayles High Income Opportunities Fund | |
| 23.06 | % | | 6.06 | % | | 6.64 | % |
|
Barclays Capital U.S. Corporate High-Yield Bond Index(b) | |
| 22.34 | | | 6.13 | | | 6.29 | |
|
Lipper High Current Yield Funds Index(b) | |
| 12.14 | | | 4.06 | | | 4.33 | |
|
Expense Ratio(c) | |
| Institutional Class: 0.00% | | | | |
CUMULATIVE PERFORMANCE
Inception to September 30, 2009
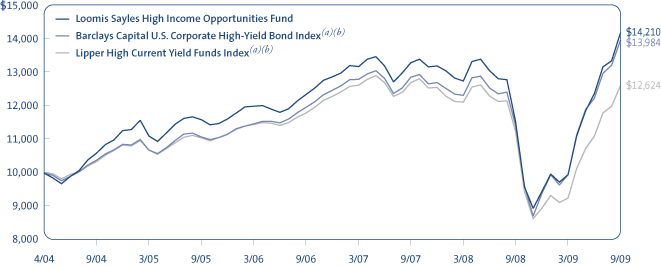
Data quoted reflects past performance and cannot guarantee future results. Total returns assume reinvestment of dividends and capital gains distributions. Investment return and principal value will fluctuate so that shares, when redeemed, may be worth more or less than their original cost. For performance current to the most recent month end, please visit www.loomissayles.com. Current performance may be higher or lower than quoted.
Returns do not reflect the taxes that a shareholder would pay on fund distributions or the redemption of shares. Periods of less than one year are not annualized.
(a) Since Index performance data is not available coincident with the Fund’s inception date, the beginning value of the index is the value of the month-end closest to the Fund’s inception date. (b) See page 5 for a description of the Indices. (c) The amount shown under Expense Ratio is 0.00% to reflect the fact that the Fund does not pay any advisory, administration or distribution and service fees, and that Loomis Sayles has agreed to pay certain expenses of the Fund.
WHAT YOU SHOULD KNOW
High yield securities are subject to a high degree of market and credit risk. The secondary market for these securities may lack liquidity, which may adversely affect the value of the Fund. Securities issued by US government agencies are not insured by and may not be guaranteed by the US government.
Because the fund can invest a significant percentage of assets in foreign securities, the value of the fund shares can be adversely affected by changes in currency exchange rates, political, and economic developments. In emerging markets these risks can be significant. The fund is subject to currency risk, which is the risk that fluctuations in exchange rates between the US dollar and foreign currencies may cause the value of a fund’s investments to decline. Funds that invest in securities denominated in, or receive revenues in, foreign currency are subject to currency risk. Accordingly, the purchase of fund shares should be viewed as a long-term investment.
Because the fund can invest a significant percentage of assets in debt securities that are rated below investment grade, the value of fund shares can be adversely affected by changes in economic conditions or other circumstances. These events could reduce or eliminate the capacity of issuers of these securities to make principal and interest payments. Lower-rated debt securities have speculative characteristics because of the credit risk of their issuers and may be subject to greater price volatility than higher-rated investments. In addition, the secondary market for these securities may lack liquidity which, in turn, may adversely affect the value of these securities and that of the fund. Accordingly, the purchase of fund shares should be viewed as a long-term investment.
2
FUND AND MANAGER REVIEW
Loomis Sayles Securitized Asset Fund

Clifton Rowe, CFA
Manager since March 2006

Fan Hu, CFA
Manager since April 2006
KEY FUND FACTS
Symbol | LSSAX
Objective | High current income consistent with capital preservation.
Strategy | Invest at least 80% of its net assets (plus any borrowings made for investment purposes) in a diversified portfolio of securitized assets, such as mortgage-backed and other asset-backed securities.
Fund Inception Date | 3/2/06
Total Net Assets | $290.5 million
PORTFOLIO REVIEW
For the fiscal year ended September 30, 2009, the Fund outperformed its Benchmark, the Barclays Capital U.S. Securitized Bond Index, due to its holdings in sectors offering strong credit quality and significant yield advantage, such as commercial mortgage-backed securities (CMBS) and asset-backed securities (ABS). Overall, we modestly reduced our positions in ABS and CMBS, but we still maintained a significant overweight.
Residential mortgage-backed securities (RMBS) and CMBS issued by non-Government-Sponsored Entities (non-GSEs) were among the best performers. Unlike GSE securities, non-GSEs do not benefit from implied government support and had suffered in previous periods.
These sectors had become significantly undervalued in prior periods, due to growing concerns about real estate and mortgages. However, beginning in the second quarter of 2009 and continuing into the third quarter, investors recognized the compelling values available among these relatively high-quality securities. This was partly a result of government-related efforts aimed at improving liquidity. Investor risk preferences shifted away from safety and toward these opportunities, which led to a sharp rebound among securities that were not backed by GSEs. The combination of rising prices and a significant yield advantage led to strong performance.
The Fund’s holdings in mortgage-backed securities (MBS) issued by GSEs underperformed during the period. Although this sector performed well during the first half of the period, it lagged as investor risk appetites increased during the second half. In addition, the declining interest rate environment caused our shorter-maturity securities to underperform longer-term securities.
OUTLOOK
We expect fundamental weakness to persist for some time in the mortgage and consumer loan markets, but we believe the securities we are buying are well protected from credit risk and offer compelling value. In particular, our recent purchases contain significant credit enhancements designed to absorb credit losses and protect senior securities.
We believe the first interest rate hike from the Federal Reserve Board will occur later than the market currently expects. Therefore, we do not expect any significant near-term changes in the interest rate environment. We expect our mortgage positions to benefit from stable interest rates, and we will continue to look for opportunities to take advantage of the steep yield curve, focusing on income rather than price appreciation. In the intermediate term, we expect a gradual rise in interest rates.
3
AVERAGE ANNUAL TOTAL RETURNS
Periods Ended September 30, 2009
| | | | | | | |
| 1 Year | | | 3 Years | | | Since
Inception(a) | |
|
Loomis Sayles Securitized Asset Fund | |
| 12.97 | % | | 6.04 | % | | 5.99 | % |
|
Barclays Capital U.S. Securitized Bond Index(b) | |
| 9.45 | | | 6.60 | | | 6.33 | |
|
Lipper U.S. Mortgage Funds Index(b) | |
| 9.57 | | | 5.49 | | | 5.38 | |
|
Expense Ratio(c) | |
| Institutional Class: 0.00% | | | | |
CUMULATIVE PERFORMANCE
Inception to September 30, 2009
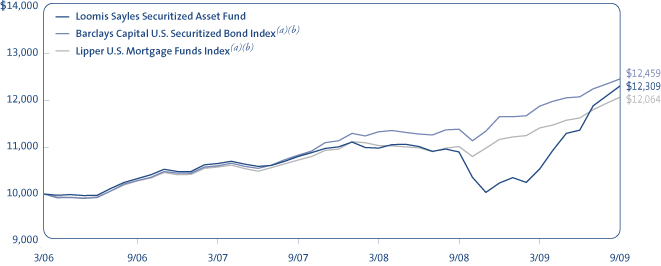
Data quoted reflects past performance and cannot guarantee future results. Total returns assume reinvestment of dividends and capital gains distributions. Investment return and principal value will fluctuate so that shares, when redeemed, may be worth more or less than their original cost. For performance current to the most recent month end, please visit www.loomissayles.com. Current performance may be higher or lower than quoted.
Returns do not reflect the taxes that a shareholder would pay on fund distributions or the redemption of shares. Periods of less than one year are not annualized.
(a) Since Index performance data is not available coincident with the Fund’s inception date, the beginning value of the index is the value of the month-end closest to the Fund’s inception date. (b) See page 5 for a description of the Indices. (c) The amount shown under Expense Ratio is 0.00% to reflect the fact that the Fund does not pay any advisory, administration or distribution and service fees, and that Loomis Sayles has agreed to pay certain expenses of the Fund.
WHAT YOU SHOULD KNOW
High yield securities are subject to a high degree of market and credit risk. The secondary market for these securities may lack liquidity, which may adversely affect the value of the Fund. Securities issued by US government agencies are not insured by and may not be guaranteed by the US government.
4
ADDITIONAL INFORMATION
Index Definitions
Lipper High Current Yield Funds Index is an equally weighted, unmanaged index of typically the 30 largest mutual funds within the high current yield funds investment objective.
Lipper U.S. Mortgage Funds Index is an equally weighted, unmanaged index of typically the 30 largest mutual funds within the U.S. mortgage funds investment objective.
Source: Lipper, Inc.
Barclays Capital U.S. Corporate High-Yield Bond Index covers the universe of fixed rate, non-investment grade debt. Pay-in-kind (PIK) bonds, Eurobonds, and debt issues from countries designated as emerging markets (e.g., Argentina, Brazil, Venezuela, etc.) are excluded, but Canadian and global bonds (SEC registered) of issuers in non-emerging market countries are included. Original issue zeroes, step-up coupon structures, and 144As are also included.
Barclays Capital U.S. Securitized Bond Index is an unmanaged index of asset-backed securities, collateralized mortgage-backed securities (ERISA eligible) and fixed rate mortgage-backed securities.
Returns are adjusted for the reinvestment of capital gains distributions and income dividends. Indices are unmanaged and do not have expenses that affect results, unlike most mutual funds. It is not possible to invest directly in an index.
Proxy Voting Information
A description of the Funds’ proxy voting policies and procedures is available without charge, upon request, (i) by calling Loomis Sayles at 800-633-3330; (ii) on the Funds’ website, www.loomissayles.com, and (iii) on the Securities and Exchange Commission’s (“SEC’s”) website at www.sec.gov. Information about how the Funds voted proxies relating to portfolio securities during the 12-month period ended June 30, 2009 is available on (i) the Funds’ website and (ii) the SEC’s website.
Quarterly Portfolio Schedules
The Funds file a complete schedule of portfolio holdings with the SEC for the first and third quarters of each fiscal year on Form N-Q. The Funds’ Forms N-Q are available on the SEC’s website at www.sec.gov and may be reviewed and copied at the SEC’s Public Reference Room in Washington, DC. Information on the operation of the Public Reference Room may be obtained by calling 800-SEC-0330.
UNDERSTANDING FUND EXPENSES
Typically, mutual fund shareholders incur two types of costs: (1) transaction costs; and (2) ongoing costs, including management fees, distribution fees (12b-1 fees), and other fund expenses. However, the Funds are unlike other mutual funds; they do not charge any fees or expenses.
You should be aware that shares in the Funds are available only to institutional investment advisory clients of Loomis, Sayles & Company, L.P. (“Loomis Sayles”) and Natixis Asset Management Advisors, L.P. (“Natixis Advisors”) and to participants in “wrap fee” programs sponsored by broker dealers and investment advisers that may be affiliated or unaffiliated with the Funds, Loomis Sayles or Natixis Advisors. The institutional investment advisory clients of Loomis Sayles and Natixis Advisors pay Loomis Sayles or Natixis Advisors a fee for their investment advisory services, while participants in “wrap fee” programs pay a “wrap fee” to the program’s sponsor. The “wrap fee” program sponsors, in turn, pay a fee to Natixis Advisors. “Wrap fee” program participants should read carefully the wrap fee brochure provided to them by their program’s sponsor and the fees paid by such sponsor to Natixis Advisors. Shareholders pay no additional fees or expenses to purchase shares of the Funds. However, shareholders will indirectly pay a proportionate share of those costs, such as brokerage commissions, taxes and extraordinary expenses, that are borne by the Funds through a reduction in each Fund’s net asset value.
The first line in each Fund’s table below shows the actual amount of Fund expenses ($0) you would have paid on a $1,000 investment in the Fund from April 1, 2009 through September 30, 2009. It also shows how much a $1,000 investment would be worth at the close of the period, assuming actual Fund returns and expenses.
The second line in each Fund’s table provides information about hypothetical account values and hypothetical expenses based on the Fund’s actual expense ratio (0%) and an assumed rate of return of 5% per year before expenses, which is not the Fund’s actual return. The hypothetical account values and expenses may not be used to estimate the actual ending account balance or expenses you paid on your investment for the period. You may use this information to compare the ongoing costs of investing in the Funds and other funds. To do so, compare this 5% hypothetical example with the 5% hypothetical examples that appear in the shareholder reports of the other funds.
Loomis Sayles High Income Opportunities Fund
| | | | | | |
Institutional Class | | Beginning
Account Value
4/1/2009 | | Ending
Account Value
9/30/2009 | | Expenses Paid
During Period*
4/1/2009 – 9/30/2009 |
Actual | | $1,000.00 | | $1,428.90 | | $0.00 |
Hypothetical (5% return before expenses) | | $1,000.00 | | $1,025.07 | | $0.00 |
* Expenses are equal to the Fund’s annualized expense ratio: 0.00%, multiplied by the average account value over the period, multiplied by the number of days in the most recent fiscal half year, divided by 365 (to reflect the half-year period). |
Loomis Sayles Securitized Asset Fund
| | | | | | |
Institutional Class | | Beginning
Account Value
4/1/2009 | | Ending
Account Value
9/30/2009 | | Expenses Paid
During Period*
4/1/2009 – 9/30/2009 |
Actual | | $1,000.00 | | $1,168.40 | | $0.00 |
Hypothetical (5% return before expenses) | | $1,000.00 | | $1,025.07 | | $0.00 |
* Expenses are equal to the Fund’s annualized expense ratio: 0.00%, multiplied by the average account value over the period, multiplied by the number of days in the most recent fiscal half-year, divided by 365 (to reflect the half-year period). |
5
BOARD APPROVAL OF THE EXISTING ADVISORY AGREEMENTS
The Board of Trustees, including the Independent Trustees, considers matters bearing on each Fund’s advisory agreement (collectively, the “Agreements”) at most of its meetings throughout the year. Each year, usually in the spring, the Contract Review and Governance Committee of the Board meets to review the Agreements to determine whether to recommend that the full Board approve the continuation of the Agreements, typically for an additional one-year period. After the Committee has made its recommendation, the full Board, including the Independent Trustees, determines whether to approve the continuation of the Agreements.
In connection with these meetings, the Trustees receive materials that the Funds’ investment adviser (the “Adviser”) believes to be reasonably necessary for the Trustees to evaluate the Agreements. These materials generally include, among other items, (i) information on the investment performance of the Funds and the performance of peer groups of funds and the Funds’ performance benchmarks, (ii) information on the Funds’ advisory fees, if any, and other expenses, including information comparing the Funds’ expenses to those of peer groups of funds and information about any applicable expense caps and fee “breakpoints,” (iii) sales and redemption data in respect of the Funds, (iv) information about the profitability of the Agreements to the Funds’ the “Adviser” and (v) information obtained through the completion of a questionnaire by the Adviser (the Trustees are consulted as to the information requested through that questionnaire). The Board of Trustees, including the Independent Trustees, also consider other matters such as (i) the Adviser’s financial results and financial condition, (ii) each Fund’s investment objective and strategies and the size, education and experience of the Adviser’s respective investment staffs and their use of technology, external research and trading cost measurement tools, (iii) arrangements in respect of the distribution of the Funds’ shares and the related costs, (iv) the procedures employed to determine the value of the Funds’ assets, (v) the allocation of the Funds’ brokerage, if any, including, if applicable, allocations to brokers affiliated with the Adviser and the use of “soft” commission dollars to pay Fund expenses and to pay for research and other similar services, (vi) the resources devoted to, and the record of compliance with, the Funds’ investment policies and restrictions, policies on personal securities transactions and other compliance policies, (vii) information about amounts invested by the Funds’ portfolio managers in the Funds or in similar accounts that they manage and (viii) the general economic outlook with particular emphasis on the mutual fund industry. Throughout the process, the Trustees are afforded the opportunity to ask questions of and request additional materials from the Adviser.
In addition to the materials requested by the Trustees in connection with their annual consideration of the continuation of the Agreements, the Trustees receive materials in advance of each regular quarterly meeting of the Board of Trustees that provide detailed information about the Funds’ investment performance. This information generally includes, among other things, an internal performance rating for each Fund based on agreed-upon criteria, graphs showing each Fund’s performance and fee differentials against each Fund’s peer group of funds, performance ratings provided by a third-party, total return information for various periods, and third-party performance rankings for various periods comparing a Fund against its peer group. The portfolio management team for each Fund or other representatives of the Adviser make periodic presentations to the Contract Review and Governance Committee and/or the full Board of Trustees, and Funds identified as presenting possible performance concerns may be subject to more frequent board presentations and reviews. In addition, each quarter the Trustees are provided with detailed statistical information about each Fund’s portfolio.
The Board of Trustees most recently approved the continuation of the Agreements at their meeting held in June 2009. The Agreements were continued for a one-year period for both Funds. In considering whether to approve the continuation of the Agreements, the Board of Trustees, including the Independent Trustees, did not identify any single factor as determinative. Individual Trustees may have evaluated the information presented differently from one another, giving different weights to various factors. Matters considered by the Trustees, including the Independent Trustees, in connection with their approval of the Agreements included the factors listed below.
The nature, extent and quality of the services provided to the Funds under the Agreements. The Trustees considered the nature, extent and quality of the services provided by the Adviser and its affiliates to the Funds and the resources dedicated to the Funds by the Adviser and its affiliates, including recent or planned investments by the Adviser in additional personnel or other resources. They considered the need for the Adviser to offer competitive compensation in order to attract and retain capable personnel. They also considered the administrative services provided by Natixis Advisors and its affiliates to the Funds.
The Trustees also considered the benefits to shareholders of the variety of fund and shareholder services offered.
After reviewing these and related factors, the Trustees concluded, within the context of their overall conclusions regarding each of the Agreements, that the nature, extent and quality of services provided supported the renewal of the Agreements.
Investment performance of the Funds and the Adviser. As noted above, the Trustees received information about the performance of the Funds over various time periods, including information which compared the performance of the Funds to the performance of peer groups of funds and the Funds’ respective performance benchmarks. In addition, the Trustees also reviewed data prepared by an independent third party which analyzed the performance of the Funds using a variety of performance metrics, including metrics which also measured the performance of the Funds on a risk adjusted basis.
6
Each Fund had performance that lagged that of a relevant peer group for certain (although not necessarily all) periods. The Board concluded that other factors relevant to performance supported renewal of the Agreement. These factors included the following: (1) that the underperformance was attributable, to a significant extent, to investment decisions (such as security selection or sector allocation) by the Funds’ Adviser that were reasonable and consistent with the Funds’ investment objective and policies and (2) that the Funds’ more recent performance was competitive when compared to relevant performance benchmarks or peer groups.
The Trustees also considered the Adviser’s performance and reputation generally, the Funds’ performance as a fund family generally (as noted by certain financial publications), and the historical responsiveness of the Adviser to Trustee concerns about performance and the willingness of the Adviser to take steps intended to improve performance.
After reviewing these and related factors, the Trustees concluded, within the context of their overall conclusions regarding each of the Agreements, that the performance of the Funds and the Adviser supported the renewal of the Agreements.
The costs of the services to be provided and profits to be realized by the Adviser and its affiliates from their respective relationships with the Funds. Under the terms of the Agreements, the Adviser does not charge the Funds an investment advisory fee or any other fee for services or for bearing expenses. The Trustees considered that, although the Funds do not compensate the Adviser directly for services under the Agreements, the Adviser will typically receive an advisory fee from its advisory clients who have invested in the Funds or from the sponsors of “wrap programs,” who in turn charge the programs’ participants. The Trustees also took into account the demands, complexity and quality of the investment management of the Funds. Because the Funds do not charge an advisory fee, the Trustees did not consider the profitability of the Adviser’s relationship to the Funds.
After reviewing these and related factors, the Trustees concluded, within the context of their overall conclusions regarding each of the Agreements, that the advisory fee, of 0%, charged to each of the Funds was fair and reasonable and supported the renewal of the Agreements.
Economies of Scale. The Trustees noted that because the Adviser bears most of the Funds’ expenses, economies of scale were not relevant to these Funds.
The Trustees also considered other factors, which included but were not limited to the following:
| • | | the effect of recent market and economic turmoil on the performance, asset levels and expense ratios of each Fund. |
| • | | whether each Fund has operated in accordance with its investment objective and the Fund’s record of compliance with its investment restrictions, and the compliance programs of the Funds and the Adviser. They also considered the compliance-related resources the Adviser and its affiliates were providing to the Funds. |
| • | | the nature, quality, cost and extent of administrative and shareholder services performed by the Adviser and its affiliates, both under the Agreements and under separate agreements covering administrative services. |
| • | | so-called “fallout benefits” to the Adviser, such as the financial and other benefits to the Adviser from being able to offer the Funds to its advisory clients and investors in certain “wrap” programs and engagement of affiliates of the Adviser to provide distribution, administrative and brokerage services to the Funds, and the benefits of research made available to the Adviser by reason of brokerage commissions generated by the Funds’ securities transactions. The Trustees considered the possible conflicts of interest associated with these fallout and other benefits, and the reporting, disclosure and other processes in place to disclose and monitor such possible conflicts of interest. |
| • | | the Trustees’ review and discussion of the Funds’ advisory arrangements in prior years, and management’s record of responding to Trustee concerns raised during the year and in prior years. |
Based on their evaluation of all factors that they deemed to be material, including those factors described above, and assisted by the advice of independent counsel, the Trustees, including the Independent Trustees, concluded that each of the existing Agreements should be continued through June 30, 2010.
7
PORTFOLIO OF INVESTMENTS – as of September 30, 2009
Loomis Sayles High Income Opportunities Fund
| | | | | | | | |
| | | | | Principal Amount | | Value (†) |
| | | | | | | | |
| | | |
| BONDS AND NOTES – 95.0% of Net Assets | | | | | | | | |
| | | |
| NON-CONVERTIBLE BONDS – 89.0% | | | | | | | | |
| | | |
| ABS Car Loan – 0.5% | | | | | | | | |
Capital One Auto Finance Trust, Series 2006-C, Class A4,
0.273%, 5/15/2013(b) | | | | $ | 170,000 | | $ | 166,764 |
Capital One Auto Finance Trust, Series 2007-C, Class A4,
5.230%, 7/15/2014 | | | | | 185,000 | | | 180,935 |
| | | | | | | | |
| | | | | | | | 347,699 |
| | | | | | | | |
| ABS Home Equity – 0.7% | | | | | | | | |
Bear Stearns Alt-A Trust, Series 2005-5, Class 1A1,
0.466%, 7/25/2035(b) | | | | | 114,281 | | | 75,353 |
Long Beach Mortgage Loan Trust, Series 2006-WL2, Class 2A3, 0.446%, 1/25/2036(b) | | | | | 232,749 | | | 155,501 |
Morgan Stanley Mortgage Loan Trust, Series 2007-15AR, Class 2A1, 6.107%, 11/25/2037(b) | | | | | 231,771 | | | 142,114 |
Residential Asset Mortgage Products, Inc., Series 2006-RZ3, Class A2, 0.406%, 8/25/2036(b) | | | | | 188,570 | | | 149,117 |
| | | | | | | | |
| | | | | | | | 522,085 |
| | | | | | | | |
| Aerospace & Defense – 1.3% | | | | | | | | |
Bombardier, Inc., 6.300%, 5/01/2014, 144A | | | | | 200,000 | | | 193,000 |
Bombardier, Inc., 7.450%, 5/01/2034, 144A | | | | | 885,000 | | | 772,163 |
| | | | | | | | |
| | | | | | | | 965,163 |
| | | | | | | | |
| Airlines – 2.7% | | | | | | | | |
American Airlines, Inc., Pass Through Trust, Series 93A6, 8.040%, 9/16/2011 | | | | | 48,908 | | | 32,096 |
Continental Airlines, Inc., Series 1997-4B,
6.900%, 7/02/2018 | | | | | 67,358 | | | 59,275 |
Continental Airlines, Inc., Series 1998-1, Class B,
6.748%, 9/15/2018 | | | | | 158,701 | | | 136,483 |
Continental Airlines, Inc., Series 1999-1B,
6.795%, 2/02/2020 | | | | | 146,669 | | | 126,868 |
Continental Airlines, Inc., Series 2000-2, Class B,
8.307%, 10/02/2019 | | | | | 14,749 | | | 12,979 |
Continental Airlines, Inc., Series 2001-1, Class B,
7.373%, 6/15/2017 | | | | | 68,418 | | | 56,787 |
Continental Airlines, Inc., Series 971A,
7.461%, 10/01/2016 | | | | | 166,307 | | | 155,081 |
Delta Air Lines, Inc., 9.500%, 9/15/2014, 144A | | | | | 220,000 | | | 220,000 |
Delta Air Lines, Inc., Series 2007-1, Class A,
6.821%, 2/10/2024 | | | | | 218,838 | | | 202,425 |
Delta Air Lines, Inc., Series 2007-1, Class B,
8.021%, 2/10/2024 | | | | | 676,513 | | | 534,446 |
Northwest Airlines, Inc., Series 07-1, Class B,
8.028%, 11/01/2017 | | | | | 508,023 | | | 376,908 |
| | | | | | | | |
| | | | | | | | 1,913,348 |
| | | | | | | | |
| Automotive – 3.6% | | | | | | | | |
Cummins, Inc., 6.750%, 2/15/2027 | | | | | 139,000 | | | 122,827 |
Ford Motor Co., 6.625%, 2/15/2028 | | | | | 165,000 | | | 118,800 |
Ford Motor Co., 7.125%, 11/15/2025 | | | | | 35,000 | | | 26,250 |
Ford Motor Co., 7.500%, 8/01/2026 | | | | | 110,000 | | | 80,300 |
Ford Motor Credit Co. LLC, 7.000%, 10/01/2013 | | | | | 1,040,000 | | | 976,159 |
See accompanying notes to financial statements.
8
PORTFOLIO OF INVESTMENTS – as of September 30, 2009
Loomis Sayles High Income Opportunities Fund – continued
| | | | | | | | |
| | | | | Principal Amount | | Value (†) |
| | | | | | | | |
| | | |
| BONDS AND NOTES – continued | | | | | | | | |
| | | |
| Automotive – continued | | | | | | | | |
Ford Motor Credit Co. LLC, 7.250%, 10/25/2011 | | | | $ | 370,000 | | $ | 359,347 |
Ford Motor Credit Co. LLC, 8.000%, 12/15/2016 | | | | | 225,000 | | | 208,747 |
Goodyear Tire & Rubber Co. (The), 7.000%, 3/15/2028 | | | | | 320,000 | | | 278,400 |
Goodyear Tire & Rubber Co. (The), 10.500%, 5/15/2016 | | | | | 125,000 | | | 135,625 |
Tenneco, Inc., Series B, 10.250%, 7/15/2013 | | | | | 70,000 | | | 72,800 |
TRW Automotive, Inc., 7.250%, 3/15/2017, 144A | | | | | 200,000 | | | 176,000 |
| | | | | | | | |
| | | | | | | | 2,555,255 |
| | | | | | | | |
| Banking – 0.8% | | | | | | | | |
Citigroup, Inc., 5.875%, 2/22/2033 | | | | | 125,000 | | | 103,604 |
Citigroup, Inc., 6.000%, 10/31/2033 | | | | | 570,000 | | | 476,991 |
| | | | | | | | |
| | | | | | | | 580,595 |
| | | | | | | | |
| Building Materials – 1.1% | | | | | | | | |
Masco Corp., 4.800%, 6/15/2015 | | | | | 110,000 | | | 100,945 |
Masco Corp., 6.500%, 8/15/2032 | | | | | 155,000 | | | 125,413 |
Owens Corning, Inc., 6.500%, 12/01/2016 | | | | | 85,000 | | | 82,934 |
Owens Corning, Inc., 7.000%, 12/01/2036 | | | | | 130,000 | | | 106,520 |
Texas Industries, Inc., 7.250%, 7/15/2013 | | | | | 70,000 | | | 67,200 |
USG Corp., 6.300%, 11/15/2016 | | | | | 365,000 | | | 310,250 |
| | | | | | | | |
| | | | | | | | 793,262 |
| | | | | | | | |
| Chemicals – 1.9% | | | | | | | | |
Ashland, Inc., 9.125%, 6/01/2017, 144A | | | | | 290,000 | | | 310,300 |
Hercules, Inc., 6.500%, 6/30/2029 | | | | | 675,000 | | | 375,469 |
Methanex Corp., 6.000%, 8/15/2015 | | | | | 150,000 | | | 127,458 |
Mosaic Global Holdings, Inc., 7.300%, 1/15/2028 | | | | | 235,000 | | | 235,033 |
Mosaic Global Holdings, Inc., 7.375%, 8/01/2018 | | | | | 275,000 | | | 296,496 |
| | | | | | | | |
| | | | | | | | 1,344,756 |
| | | | | | | | |
| Collateralized Mortgage Obligations – 1.3% | | | | | | | | |
Adjustable Rate Mortgage Trust, Series 2007-1, Class 5A1, 0.396%, 3/25/2037(b) | | | | | 247,173 | | | 113,733 |
Bear Stearns Alt-A Trust, Series 2007-1, Class 1A1,
0.406%, 1/25/2047(b) | | | | | 608,605 | | | 329,928 |
Lehman Mortgage Trust, Series 2006-6, Class 5A1,
0.746%, 12/25/2036(b) | | | | | 244,286 | | | 176,017 |
Residential Accredit Loans, Inc., Series 2006-QA9, Class A1, 0.426%, 11/25/2036(b) | | | | | 465,109 | | | 234,869 |
Structured Adjustable Rate Mortgage Loan Trust, Series 2007-7, Class 1A1, 0.546%, 8/25/2037(b) | | | | | 100,912 | | | 56,128 |
| | | | | | | | |
| | | | | | | | 910,675 |
| | | | | | | | |
| Commercial Mortgage-Backed Securities – 2.5% | | | | | | | | |
Banc of America Alternative Loan Trust, Series 2005-10, Class 1CB1, 0.646%, 11/25/2035(b) | | | | | 87,150 | | | 57,083 |
Banc of America Commercial Mortgage, Inc., Series 2007-2, Class A4, 5.689%, 4/10/2049(b) | | | | | 50,000 | | | 43,054 |
Bear Stearns Commercial Mortgage Securities, Series 2007-PW15, Class A4, 5.331%, 2/11/2044 | | | | | 100,000 | | | 90,018 |
Bear Stearns Commercial Mortgage Securities, Series 2007-PW16, Class A4, 5.719%, 6/11/2040(b) | | | | | 25,000 | | | 22,836 |
Citigroup Commercial Mortgage Trust, Series 2006-C5, Class A4, 5.431%, 10/15/2049 | | | | | 50,000 | | | 45,186 |
See accompanying notes to financial statements.
9
| | | | | | | | |
| | | | | Principal Amount | | Value (†) |
| | | | | | | | |
| | | |
| BONDS AND NOTES – continued | | | | | | | | |
| | | |
| Commercial Mortgage-Backed Securities – continued | | | | | | | | |
Credit Suisse Mortgage Capital Certificates, Series 2007-C4, Class A4, 5.809%, 9/15/2039(b) | | | | $ | 100,000 | | $ | 79,223 |
Greenwich Capital Commercial Funding Corp., Series 2007-GG11, Class A4, 5.736%, 12/10/2049 | | | | | 300,000 | | | 270,131 |
Greenwich Capital Commercial Funding Corp., Series 2007-GG9, Class A4, 5.444%, 3/10/2039 | | | | | 375,000 | | | 332,330 |
JPMorgan Chase Commercial Mortgage Securities Corp., Series 2007-LD11, Class A4, 5.818%, 6/15/2049(b) | | | | | 450,000 | | | 393,332 |
JPMorgan Chase Commercial Mortgage Securities Corp., Series 2007-LDPX, Class A3, 5.420%, 1/15/2049 | | | | | 100,000 | | | 84,295 |
LB-UBS Commercial Mortgage Trust, Series 2006-C4, Class A4, 5.882%, 6/15/2038(b) | | | | | 100,000 | | | 94,685 |
Morgan Stanley Capital I, Series 2008-T29, Class A4, 6.280%, 1/11/2043(b) | | | | | 275,000 | | | 266,760 |
| | | | | | | | |
| | | | | | | | 1,778,933 |
| | | | | | | | |
| Construction Machinery – 0.5% | | | | | | | | |
United Rentals North America, Inc., 7.000%, 2/15/2014 | | | | | 400,000 | | | 348,000 |
| | | | | | | | |
| Consumer Cyclical Services – 0.2% | | | | | | | | |
Kar Holdings, Inc., 10.000%, 5/01/2015 | | | | | 165,000 | | | 165,825 |
| | | | | | | | |
| Consumer Products – 0.0% | | | | | | | | |
Jostens IH Corp., 7.625%, 10/01/2012 | | | | | 25,000 | | | 25,031 |
| | | | | | | | |
| Electric – 7.2% | | | | | | | | |
AES Corp. (The), 8.000%, 10/15/2017 | | | | | 20,000 | | | 20,125 |
AES Corp. (The), 8.000%, 6/01/2020 | | | | | 325,000 | | | 322,562 |
CE Generation LLC, 7.416%, 12/15/2018 | | | | | 57,825 | | | 56,213 |
Dynegy Holdings, Inc., 7.125%, 5/15/2018 | | | | | 195,000 | | | 150,150 |
Dynegy Holdings, Inc., 7.500%, 6/01/2015 | | | | | 100,000 | | | 92,500 |
Dynegy Holdings, Inc., 7.625%, 10/15/2026 | | | | | 325,000 | | | 222,625 |
Dynegy Holdings, Inc., 7.750%, 6/01/2019 | | | | | 350,000 | | | 298,375 |
Dynegy Holdings, Inc., 8.375%, 5/01/2016 | | | | | 280,000 | | | 261,800 |
Dynegy Roseton/Danskammer Pass Through Trust, Series A, 7.270%, 11/08/2010 | | | | | 258,943 | | | 257,001 |
Edison Mission Energy, 7.625%, 5/15/2027 | | | | | 525,000 | | | 375,375 |
NGC Corp. Capital Trust I, Series B, 8.316%, 6/01/2027 | | | | | 460,000 | | | 207,000 |
NRG Energy, Inc., 7.375%, 2/01/2016 | | | | | 330,000 | | | 319,275 |
NRG Energy, Inc., 7.375%, 1/15/2017 | | | | | 460,000 | | | 445,050 |
NRG Energy, Inc., 8.500%, 6/15/2019 | | | | | 140,000 | | | 140,175 |
NSG Holdings LLC, 7.750%, 12/15/2025, 144A | | | | | 355,000 | | | 317,725 |
RRI Energy, Inc., 7.875%, 6/15/2017 | | | | | 345,000 | | | 336,806 |
TXU Corp., Series P, 5.550%, 11/15/2014 | | | | | 160,000 | | | 109,192 |
TXU Corp., Series Q, 6.500%, 11/15/2024 | | | | | 1,415,000 | | | 654,466 |
TXU Corp., Series R, 6.550%, 11/15/2034 | | | | | 515,000 | | | 231,653 |
White Pine Hydro Portfolio LLC, 7.260%, 7/20/2015(c) | | | | | 365,000 | | | 321,468 |
| | | | | | | | |
| | | | | | | | 5,139,536 |
| | | | | | | | |
| Food & Beverage – 2.3% | | | | | | | | |
ARAMARK Corp., 5.000%, 6/01/2012 | | | | | 950,000 | | | 897,750 |
CCL Finance Ltd., 9.500%, 8/15/2014, 144A | | | | | 200,000 | | | 212,500 |
Marfrig Overseas Ltd., 9.625%, 11/16/2016, 144A | | | | | 110,000 | | | 109,175 |
Tyson Foods, Inc., 7.850%, 4/01/2016 | | | | | 400,000 | | | 408,000 |
| | | | | | | | |
| | | | | | | | 1,627,425 |
| | | | | | | | |
See accompanying notes to financial statements.
10
PORTFOLIO OF INVESTMENTS – as of September 30, 2009
Loomis Sayles High Income Opportunities Fund – continued
| | | | | | | | |
| | | | | Principal Amount | | Value (†) |
| | | | | | | | |
| | | |
| BONDS AND NOTES – continued | | | | | | | | |
| | | |
| Gaming – 0.8% | | | | | | | | |
MGM MIRAGE, 10.375%, 5/15/2014, 144A | | | | $ | 165,000 | | $ | 176,138 |
MGM MIRAGE, 11.125%, 11/15/2017, 144A | | | | | 355,000 | | | 387,837 |
| | | | | | | | |
| | | | | | | | 563,975 |
| | | | | | | | |
| Healthcare – 5.1% | | | | | | | | |
Boston Scientific Corp., 7.000%, 11/15/2035 | | | | | 250,000 | | | 229,062 |
CHS/Community Health Systems, Inc., 8.875%, 7/15/2015 | | | | | 295,000 | | | 302,375 |
DASA Finance Corp., 8.750%, 5/29/2018, 144A | | | | | 200,000 | | | 212,000 |
HCA, Inc., 5.750%, 3/15/2014 | | | | | 15,000 | | | 13,237 |
HCA, Inc., 6.375%, 1/15/2015 | | | | | 510,000 | | | 453,900 |
HCA, Inc., 6.500%, 2/15/2016 | | | | | 720,000 | | | 639,000 |
HCA, Inc., 7.050%, 12/01/2027 | | | | | 430,000 | | | 326,121 |
HCA, Inc., 7.500%, 12/15/2023 | | | | | 30,000 | | | 24,218 |
HCA, Inc., 7.500%, 11/06/2033 | | | | | 840,000 | | | 649,973 |
HCA, Inc., 7.690%, 6/15/2025 | | | | | 160,000 | | | 129,929 |
HCA, Inc., 8.360%, 4/15/2024 | | | | | 40,000 | | | 32,550 |
HCA, Inc., MTN, 7.580%, 9/15/2025 | | | | | 200,000 | | | 161,808 |
HCA, Inc., MTN, 7.750%, 7/15/2036 | | | | | 20,000 | | | 15,676 |
Tenet Healthcare Corp., 6.875%, 11/15/2031 | | | | | 590,000 | | | 460,200 |
| | | | | | | | |
| | | | | | | | 3,650,049 |
| | | | | | | | |
| Home Construction – 3.7% | | | | | | | | |
Corporacion GEO SAB de CV, 8.875%, 9/25/2014, 144A | | | | | 175,000 | | | 183,750 |
D.R. Horton, Inc., 5.625%, 9/15/2014 | | | | | 65,000 | | | 62,725 |
Desarrolladora Homex SAB de CV, 7.500%, 9/28/2015 | | | | | 1,030,000 | | | 1,011,975 |
KB Home, 5.750%, 2/01/2014 | | | | | 90,000 | | | 86,400 |
KB Home, 5.875%, 1/15/2015 | | | | | 390,000 | | | 367,575 |
KB Home, 6.250%, 6/15/2015 | | | | | 265,000 | | | 253,075 |
KB Home, 7.250%, 6/15/2018 | | | | | 290,000 | | | 282,750 |
Pulte Homes, Inc., 6.000%, 2/15/2035 | | | | | 475,000 | | | 358,625 |
Pulte Homes, Inc., 6.375%, 5/15/2033 | | | | | 100,000 | | | 77,000 |
| | | | | | | | |
| | | | | | | | 2,683,875 |
| | | | | | | | |
| Independent Energy – 6.0% | | | | | | | | |
Encore Acquisition Co., 6.000%, 7/15/2015 | | | | | 275,000 | | | 248,875 |
Encore Acquisition Co., 7.250%, 12/01/2017 | | | | | 115,000 | | | 106,950 |
Forest Oil Corp., 7.250%, 6/15/2019 | | | | | 715,000 | | | 668,525 |
Hilcorp Energy I LP, 7.750%, 11/01/2015, 144A | | | | | 595,000 | | | 562,275 |
Hilcorp Energy I LP, 9.000%, 6/01/2016, 144A | | | | | 185,000 | | | 183,612 |
PetroHawk Energy Corp., 7.875%, 6/01/2015 | | | | | 300,000 | | | 295,500 |
PetroHawk Energy Corp., 9.125%, 7/15/2013 | | | | | 15,000 | | | 15,413 |
Pioneer Natural Resources Co., 5.875%, 7/15/2016 | | | | | 20,000 | | | 18,486 |
Pioneer Natural Resources Co., 6.875%, 5/01/2018 | | | | | 260,000 | | | 248,121 |
Pioneer Natural Resources Co., 7.200%, 1/15/2028 | | | | | 1,640,000 | | | 1,423,392 |
Swift Energy Co., 7.125%, 6/01/2017 | | | | | 620,000 | | | 539,400 |
Swift Energy Co., 7.625%, 7/15/2011 | | | | | 20,000 | | | 19,900 |
| | | | | | | | |
| | | | | | | | 4,330,449 |
| | | | | | | | |
| Industrial Other – 1.1% | | | | | | | | |
Baldor Electric Co., 8.625%, 2/15/2017 | | | | | 325,000 | | | 328,250 |
Chart Industries, Inc., 9.125%, 10/15/2015 | | | | | 305,000 | | | 305,000 |
Ranhill Labuan Ltd., 12.500%, 10/26/2011, 144A | | | | | 155,000 | | | 124,000 |
| | | | | | | | |
| | | | | | | | 757,250 |
| | | | | | | | |
See accompanying notes to financial statements.
11
| | | | | | | | |
| | | | | Principal Amount | | Value (†) |
| | | | | | | | |
| | | |
| BONDS AND NOTES – continued | | | | | | | | |
| | | |
| Lodging – 0.5% | | | | | | | | |
Felcor Lodging LP, 10.000%, 10/01/2014, 144A | | | | $ | 55,000 | | $ | 53,213 |
Host Marriott LP, Series O, 6.375%, 3/15/2015 | | | | | 50,000 | | | 47,375 |
Royal Caribbean Cruises Ltd., 7.250%, 6/15/2016 | | | | | 315,000 | | | 291,375 |
| | | | | | | | |
| | | | | | | | 391,963 |
| | | | | | | | |
| Media Cable – 4.0% | | | | | | | | |
Charter Communications Operating LLC/CAP,
10.000%, 4/30/2012, 144A | | | | | 170,000 | | | 172,975 |
CSC Holdings, Inc., 7.625%, 7/15/2018 | | | | | 1,260,000 | | | 1,278,900 |
CSC Holdings, Inc., 7.875%, 2/15/2018 | | | | | 310,000 | | | 316,200 |
Virgin Media Finance PLC, 8.750%, 4/15/2014 | | | | | 870,000 | | | 887,400 |
Virgin Media Finance PLC, 9.125%, 8/15/2016 | | | | | 175,000 | | | 179,812 |
| | | | | | | | |
| | | | | | | | 2,835,287 |
| | | | | | | | |
| Media Non-Cable – 0.9% | | | | | | | | |
Intelsat Corp., 6.875%, 1/15/2028 | | | | | 235,000 | | | 195,050 |
Intelsat Subsidiary Holding Co., 8.500%, 1/15/2013 | | | | | 405,000 | | | 410,062 |
R.H. Donnelley Corp., Series A-1, 6.875%, 1/15/2013(d) | | | | | 405,000 | | | 23,288 |
R.H. Donnelley Corp., Series A-2, 6.875%, 1/15/2013(d) | | | | | 340,000 | | | 19,550 |
R.H. Donnelley Corp., Series A-4, 8.875%, 10/15/2017(d) | | | | | 160,000 | | | 9,200 |
| | | | | | | | |
| | | | | | | | 657,150 |
| | | | | | | | |
| Metals & Mining – 1.0% | | | | | | | | |
International Steel Group, Inc., 6.500%, 4/15/2014 | | | | | 100,000 | | | 105,101 |
Steel Dynamics, Inc., 6.750%, 4/01/2015 | | | | | 130,000 | | | 124,475 |
Steel Dynamics, Inc., 7.375%, 11/01/2012 | | | | | 160,000 | | | 161,600 |
United States Steel Corp., 6.050%, 6/01/2017 | | | | | 80,000 | | | 74,719 |
United States Steel Corp., 6.650%, 6/01/2037 | | | | | 275,000 | | | 224,300 |
| | | | | | | | |
| | | | | | | | 690,195 |
| | | | | | | | |
| Non-Captive Consumer – 2.8% | | | | | | | | |
SLM Corp., MTN, 5.050%, 11/14/2014 | | | | | 60,000 | | | 44,106 |
SLM Corp., Series A, MTN, 5.000%, 10/01/2013 | | | | | 55,000 | | | 43,783 |
SLM Corp., Series A, MTN, 5.000%, 6/15/2018 | | | | | 65,000 | | | 40,763 |
SLM Corp., Series A, MTN, 5.375%, 1/15/2013 | | | | | 470,000 | | | 391,866 |
SLM Corp., Series A, MTN, 5.375%, 5/15/2014 | | | | | 70,000 | | | 53,576 |
SLM Corp., Series A, MTN, 5.625%, 8/01/2033 | | | | | 850,000 | | | 533,488 |
SLM Corp., Series A, MTN, 8.450%, 6/15/2018 | | | | | 1,135,000 | | | 905,163 |
| | | | | | | | |
| | | | | | | | 2,012,745 |
| | | | | | | | |
| Non-Captive Diversified – 3.6% | | | | | | | | |
GMAC, Inc., 6.000%, 12/15/2011, 144A | | | | | 316,000 | | | 292,300 |
GMAC, Inc., 6.625%, 5/15/2012, 144A | | | | | 539,000 | | | 495,880 |
GMAC, Inc., 6.750%, 12/01/2014, 144A | | | | | 620,000 | | | 527,000 |
GMAC, Inc., 6.875%, 9/15/2011, 144A | | | | | 110,000 | | | 103,950 |
GMAC, Inc., 6.875%, 8/28/2012, 144A | | | | | 41,000 | | | 37,720 |
GMAC, Inc., 7.000%, 2/01/2012, 144A | | | | | 63,000 | | | 58,590 |
GMAC, Inc., 7.250%, 3/02/2011, 144A | | | | | 63,000 | | | 60,638 |
GMAC, Inc., 8.000%, 11/01/2031, 144A | | | | | 141,000 | | | 113,505 |
International Lease Finance Corp., Series Q, MTN,
5.250%, 1/10/2013 | | | | | 330,000 | | | 265,969 |
International Lease Finance Corp., Series R, MTN,
5.650%, 6/01/2014 | | | | | 185,000 | | | 141,993 |
International Lease Finance Corp., Series R, MTN,
6.625%, 11/15/2013 | | | | | 340,000 | | | 269,592 |
See accompanying notes to financial statements.
12
PORTFOLIO OF INVESTMENTS – as of September 30, 2009
Loomis Sayles High Income Opportunities Fund – continued
| | | | | | | | |
| | | | | Principal Amount | | Value (†) |
| | | | | | | | |
| | | |
| BONDS AND NOTES – continued | | | | | | | | |
| | | |
| Non-Captive Diversified – continued | | | | | | | | |
iStar Financial, Inc., 5.150%, 3/01/2012 | | | | $ | 130,000 | | $ | 77,350 |
iStar Financial, Inc., 5.650%, 9/15/2011 | | | | | 45,000 | | | 31,050 |
iStar Financial, Inc., 5.800%, 3/15/2011 | | | | | 20,000 | | | 14,200 |
iStar Financial, Inc., Series B, 5.950%, 10/15/2013 | | | | | 190,000 | | | 108,300 |
| | | | | | | | |
| | | | | | | | 2,598,037 |
| | | | | | | | |
| Oil Field Services – 1.6% | | | | | | | | |
Basic Energy Services, Inc., 7.125%, 4/15/2016 | | | | | 680,000 | | | 533,800 |
Complete Production Services, Inc., 8.000%, 12/15/2016 | | | | | 35,000 | | | 31,850 |
North American Energy Partners, Inc., 8.750%, 12/01/2011 | | | | | 620,000 | | | 607,600 |
| | | | | | | | |
| | | | | | | | 1,173,250 |
| | | | | | | | |
| Paper – 3.3% | | | | | | | | |
Georgia-Pacific LLC, 7.250%, 6/01/2028 | | | | | 215,000 | | | 191,350 |
Georgia-Pacific LLC, 7.375%, 12/01/2025 | | | | | 495,000 | | | 445,500 |
Georgia-Pacific LLC, 7.700%, 6/15/2015 | | | | | 125,000 | | | 126,250 |
Georgia-Pacific LLC, 7.750%, 11/15/2029 | | | | | 525,000 | | | 483,000 |
Georgia-Pacific LLC, 8.000%, 1/15/2024 | | | | | 260,000 | | | 257,400 |
Georgia-Pacific LLC, 8.875%, 5/15/2031 | | | | | 225,000 | | | 227,250 |
Westvaco Corp., 7.950%, 2/15/2031 | | | | | 190,000 | | | 186,083 |
Westvaco Corp., 8.200%, 1/15/2030 | | | | | 455,000 | | | 446,293 |
| | | | | | | | |
| | | | | | | | 2,363,126 |
| | | | | | | | |
| Pharmaceuticals – 2.2% | | | | | | | | |
Elan Financial PLC, 7.750%, 11/15/2011 | | | | | 800,000 | | | 815,000 |
Elan Financial PLC, 8.875%, 12/01/2013 | | | | | 770,000 | | | 775,775 |
| | | | | | | | |
| | | | | | | | 1,590,775 |
| | | | | | | | |
| Refining – 0.8% | | | | | | | | |
Petroplus Finance Ltd., 6.750%, 5/01/2014, 144A | | | | | 500,000 | | | 468,125 |
Petroplus Finance Ltd., 7.000%, 5/01/2017, 144A | | | | | 75,000 | | | 68,250 |
| | | | | | | | |
| | | | | | | | 536,375 |
| | | | | | | | |
| Retailers – 3.1% | | | | | | | | |
Dillard’s, Inc., 6.625%, 1/15/2018 | | | | | 155,000 | | | 117,800 |
Dillard’s, Inc., 7.000%, 12/01/2028 | | | | | 480,000 | | | 319,200 |
Dillard’s, Inc., 7.130%, 8/01/2018 | | | | | 175,000 | | | 136,062 |
Dillard’s, Inc., 7.875%, 1/01/2023 | | | | | 75,000 | | | 54,750 |
Foot Locker, Inc., 8.500%, 1/15/2022 | | | | | 280,000 | | | 264,600 |
J.C. Penney Corp., Inc., 6.375%, 10/15/2036 | | | | | 40,000 | | | 33,000 |
Macy’s Retail Holdings, Inc., 5.900%, 12/01/2016 | | | | | 45,000 | | | 41,229 |
Macy’s Retail Holdings, Inc., 6.375%, 3/15/2037 | | | | | 60,000 | | | 47,271 |
Macy’s Retail Holdings, Inc., 6.790%, 7/15/2027 | | | | | 180,000 | | | 131,218 |
Macy’s Retail Holdings, Inc., 6.900%, 4/01/2029 | | | | | 300,000 | | | 236,659 |
Toys R Us, Inc., 7.375%, 10/15/2018 | | | | | 985,000 | | | 856,950 |
| | | | | | | | |
| | | | | | | | 2,238,739 |
| | | | | | | | |
| Supermarkets – 2.3% | | | | | | | | |
American Stores Co., 8.000%, 6/01/2026 | | | | | 70,000 | | | 63,000 |
New Albertson’s, Inc., 7.450%, 8/01/2029 | | | | | 1,075,000 | | | 924,500 |
New Albertson’s, Inc., 7.750%, 6/15/2026 | | | | | 220,000 | | | 195,800 |
New Albertson’s, Inc., 8.000%, 5/01/2031 | | | | | 30,000 | | | 26,925 |
New Albertson’s, Inc., Series C, MTN, 6.625%, 6/01/2028 | | | | | 605,000 | | | 467,362 |
| | | | | | | | |
| | | | | | | | 1,677,587 |
| | | | | | | | |
See accompanying notes to financial statements.
13
| | | | | | | | |
| | | | | Principal Amount | | Value (†) |
| | | | | | | | |
| | | |
| BONDS AND NOTES – continued | | | | | | | | |
| | | |
| Technology – 6.3% | | | | | | | | |
Activant Solutions, Inc., 9.500%, 5/01/2016 | | | | $ | 90,000 | | $ | 80,550 |
Alcatel-Lucent USA, Inc., 6.450%, 3/15/2029 | | | | | 3,020,000 | | | 2,298,975 |
Alcatel-Lucent USA, Inc., 6.500%, 1/15/2028 | | | | | 290,000 | | | 220,763 |
Amkor Technology, Inc., 7.750%, 5/15/2013 | | | | | 305,000 | | | 305,000 |
Amkor Technology, Inc., 9.250%, 6/01/2016 | | | | | 60,000 | | | 61,800 |
Motorola, Inc., 6.500%, 9/01/2025 | | | | | 165,000 | | | 139,439 |
Motorola, Inc., 7.500%, 5/15/2025 | | | | | 125,000 | | | 112,500 |
Nortel Networks Capital Corp., 7.875%, 6/15/2026(d) | | | | | 860,000 | | | 481,600 |
Nortel Networks Ltd., 6.875%, 9/01/2023(d) | | | | | 125,000 | | | 35,000 |
Seagate Technology HDD Holdings, 6.800%, 10/01/2016 | | | | | 750,000 | | | 688,125 |
Xerox Capital Trust I, 8.000%, 2/01/2027 | | | | | 90,000 | | | 87,975 |
| | | | | | | | |
| | | | | | | | 4,511,727 |
| | | | | | | | |
| Textile – 0.4% | | | | | | | | |
Jones Apparel Group, Inc., 6.125%, 11/15/2034 | | | | | 425,000 | | | 314,500 |
| | | | | | | | |
| Transportation Services – 0.8% | | | | | | | | |
APL Ltd., 8.000%, 1/15/2024(c) | | | | | 185,000 | | | 151,237 |
Atlas Air, Inc., Series B, 7.680%, 1/02/2014 | | | | | 31,278 | | | 26,586 |
Atlas Air, Inc., Series C, 8.010%, 1/02/2010(e) | | | | | 347,188 | | | 243,032 |
Overseas Shipholding Group, 7.500%, 2/15/2024 | | | | | 155,000 | | | 129,813 |
| | | | | | | | |
| | | | | | | | 550,668 |
| | | | | | | | |
| Wireless – 3.0% | | | | | | | | |
Nextel Communications, Inc., Series D, 7.375%, 8/01/2015 | | | | | 170,000 | | | 152,575 |
Nextel Communications, Inc., Series E, 6.875%, 10/31/2013 | | | | | 40,000 | | | 37,100 |
Nextel Communications, Inc., Series F, 5.950%, 3/15/2014 | | | | | 520,000 | | | 460,200 |
NII Capital Corp., 10.000%, 8/15/2016, 144A | | | | | 760,000 | | | 790,400 |
Sprint Capital Corp., 6.875%, 11/15/2028 | | | | | 311,000 | | | 259,685 |
Sprint Nextel Corp., 6.000%, 12/01/2016 | | | | | 502,000 | | | 448,035 |
| | | | | | | | |
| | | | | | | | 2,147,995 |
| | | | | | | | |
| Wirelines – 9.1% | | | | | | | | |
Axtel SAB de CV, 7.625%, 2/01/2017, 144A | | | | | 765,000 | | | 734,400 |
Cincinnati Bell Telephone Co., 6.300%, 12/01/2028 | | | | | 185,000 | | | 137,825 |
Cincinnati Bell, Inc., 7.000%, 2/15/2015 | | | | | 285,000 | | | 276,450 |
Cincinnati Bell, Inc., 8.375%, 1/15/2014 | | | | | 515,000 | | | 517,575 |
FairPoint Communications, Inc., 13.125%, 4/02/2018(e) | | | | | 257,785 | | | 31,579 |
Frontier Communications Corp., 7.000%, 11/01/2025 | | | | | 15,000 | | | 12,787 |
Frontier Communications Corp., 7.125%, 3/15/2019 | | | | | 80,000 | | | 75,400 |
Frontier Communications Corp., 7.450%, 7/01/2035 | | | | | 325,000 | | | 260,000 |
Frontier Communications Corp., 7.875%, 1/15/2027 | | | | | 805,000 | | | 734,562 |
Global Crossing Ltd., 12.000%, 9/15/2015, 144A | | | | | 500,000 | | | 525,000 |
Level 3 Financing, Inc., 8.750%, 2/15/2017 | | | | | 790,000 | | | 655,700 |
Level 3 Financing, Inc., 9.250%, 11/01/2014 | | | | | 835,000 | | | 735,844 |
Qwest Capital Funding, Inc., 6.500%, 11/15/2018 | | | | | 1,030,000 | | | 847,175 |
Qwest Capital Funding, Inc., 6.875%, 7/15/2028 | | | | | 480,000 | | | 362,400 |
Qwest Capital Funding, Inc., 7.625%, 8/03/2021 | | | | | 315,000 | | | 266,175 |
Qwest Capital Funding, Inc., 7.750%, 2/15/2031 | | | | | 280,000 | | | 223,300 |
Qwest Corp., 6.875%, 9/15/2033 | | | | | 190,000 | | | 153,900 |
Qwest Corp., 7.250%, 9/15/2025 | | | | | 10,000 | | | 8,625 |
| | | | | | | | |
| | | | | | | | 6,558,697 |
| | | | | | | | |
| | | |
| TOTAL NON-CONVERTIBLE BONDS | | | | | | | | |
(Identified Cost $67,593,024) | | | | | | | | 63,852,002 |
| | | | | | | | |
See accompanying notes to financial statements.
14
PORTFOLIO OF INVESTMENTS – as of September 30, 2009
Loomis Sayles High Income Opportunities Fund – continued
| | | | | | | | |
| | | | | Principal Amount | | Value (†) |
| | | | | | | | |
| | | |
| BONDS AND NOTES – continued | | | | | | | | |
| | | |
| CONVERTIBLE BONDS – 6.0% | | | | | | | | |
| | | |
| Diversified Manufacturing – 0.1% | | | | | | | | |
Trinity Industries, Inc., 3.875%, 6/01/2036 | | | | $ | 60,000 | | $ | 44,250 |
| | | | | | | | |
| Electric – 0.5% | | | | | | | | |
CMS Energy Corp., 5.500%, 6/15/2029 | | | | | 330,000 | | | 377,438 |
| | | | | | | | |
| | | |
| Healthcare – 1.0% | | | | | | | | |
Affymetrix, Inc., 3.500%, 1/15/2038 | | | | | 480,000 | | | 386,400 |
Hologic, Inc., (Step to Zero Coupon on 12/15/2013), 2.000%, 12/15/2037(f) | | | | | 400,000 | | | 327,000 |
| | | | | | | | |
| | | | | | | | 713,400 |
| | | | | | | | |
| Industrial Other – 0.2% | | | | | | | | |
Incyte Corp., 3.500%, 2/15/2011 | | | | | 165,000 | | | 160,875 |
| | | | | | | | |
| Lodging – 0.6% | | | | | | | | |
Host Hotels & Resorts, Inc., 2.625%, 4/15/2027, 144A | | | | | 435,000 | | | 399,656 |
| | | | | | | | |
| Media Non-Cable – 0.1% | | | | | | | | |
Liberty Media LLC, 3.500%, 1/15/2031 | | | | | 152,190 | | | 93,407 |
| | | | | | | | |
| Non-Captive Diversified – 0.0% | | | | | | | | |
iStar Financial, Inc., 1.097%, 10/01/2012(b) | | | | | 5,000 | | | 2,500 |
| | | | | | | | |
| Pharmaceuticals – 0.6% | | | | | | | | |
Human Genome Sciences, Inc., 2.250%, 8/15/2012 | | | | | 325,000 | | | 405,031 |
| | | | | | | | |
| REITs – 0.3% | | | | | | | | |
ProLogis, 1.875%, 11/15/2037 | | | | | 145,000 | | | 123,794 |
ProLogis, 2.250%, 4/01/2037 | | | | | 145,000 | | | 130,681 |
| | | | | | | | |
| | | | | | | | 254,475 |
| | | | | | | | |
| Technology – 1.1% | | | | | | | | |
Ciena Corp., 0.250%, 5/01/2013 | | | | | 5,000 | | | 3,994 |
Ciena Corp., 0.875%, 6/15/2017 | | | | | 210,000 | | | 144,637 |
Intel Corp., 3.250%, 8/01/2039, 144A | | | | | 440,000 | | | 470,250 |
Kulicke & Soffa Industries, Inc., 1.000%, 6/30/2010 | | | | | 45,000 | | | 42,694 |
Maxtor Corp., 5.750%, 3/01/2012(c) | | | | | 109,000 | | | 99,190 |
| | | | | | | | |
| | | | | | | | 760,765 |
| | | | | | | | |
| Wirelines – 1.5% | | | | | | | | |
Level 3 Communications, Inc., 7.000%, 3/15/2015, 144A(c) | | | | | 1,014,000 | | | 1,074,840 |
| | | | | | | | |
| | | |
| TOTAL CONVERTIBLE BONDS | | | | | | | | |
(Identified Cost $3,986,843) | | | | | | | | 4,286,637 |
| | | | | | | | |
| | | |
| TOTAL BONDS AND NOTES | | | | | | | | |
(Identified Cost $71,579,867) | | | | | | | | 68,138,639 |
| | | | | | | | |
| | | |
| BANK LOANS – 0.2% | | | | | | | | |
| | | |
| Food & Beverage – 0.0% | | | | | | | | |
Dole Food Co., Inc., Credit Link Deposit,
7.495%, 4/12/2013(g) | | | | | 2,041 | | | 2,063 |
Dole Food Co., Inc., Tranche B Term Loan,
8.000%, 4/12/2013(g) | | | | | 1,311 | | | 1,325 |
See accompanying notes to financial statements.
15
| | | | | | | | |
| | | | | Principal Amount | | Value (†) |
| | | | | | | | |
| | | |
| BONDS AND NOTES – continued | | | | | | | | |
| | | |
| Food & Beverage – continued | | | | | | | | |
Dole Food Co., Inc., Tranche C Term Loan,
8.000%, 4/12/2013(g) | | | | $ | 6,429 | | $ | 6,499 |
| | | | | | | | |
| | | | | | | | 9,887 |
| | | | | | | | |
| Media Non-Cable – 0.1% | | | | | | | | |
Tribune Co., Term Loan X, 5.000%, 6/04/2009(d)(g)(j) | | | | | 181,970 | | | 88,370 |
| | | | | | | | |
| Wirelines – 0.1% | | | | | | | | |
Hawaiian Telcom Communications, Inc., Tranche C Term Loan, 4.750%, 6/01/2014(g)(h) | | | | | 60,826 | | | 37,529 |
| | | | | | | | |
| | | |
| TOTAL BANK LOANS | | | | | | | | |
(Identified Cost $240,121) | | | | | | | | 135,786 |
| | | | | | �� | | |
| | | |
| | | | | | Shares | | | |
| | | |
| PREFERRED STOCKS – 1.9% | | | | | | | | |
| | | |
| Automotive – 0.3% | | | | | | | | |
Ford Motor Co. Capital Trust II, 6.500% | | | | | 6,225 | | | 187,497 |
| | | | | | | | |
| Capital Markets – 0.3% | | | | | | | | |
Newell Financial Trust I, 5.250% | | | | | 5,724 | | | 202,487 |
| | | | | | | | |
| Diversified Financial Services – 0.3% | | | | | | | | |
Preferred Blocker, Inc., 7.000%, 144A | | | | | 428 | | | 248,895 |
| | | | | | | | |
| Electric Utilities – 0.5% | | | | | | | | |
AES Trust III, 6.750% | | | | | 7,975 | | | 351,398 |
| | | | | | | | |
| Hotels, Restaurants & Leisure – 0.0% | | | | | | | | |
Six Flags, Inc., 7.250%(e) | | | | | 2 | | | 1 |
| | | | | | | | |
| Oil, Gas & Consumable Fuels – 0.4% | | | | | | | | |
El Paso Energy Capital Trust I, 4.750% | | | | | 8,050 | | | 269,172 |
| | | | | | | | |
| Thrifts & Mortgage Finance – 0.1% | | | | | | | | |
Federal Home Loan Mortgage Corp., 5.000%(e)(i) | | | | | 500 | | | 1,325 |
Federal Home Loan Mortgage Corp., 5.570%(e)(i) | | | | | 7,750 | | | 12,400 |
Federal Home Loan Mortgage Corp., 5.660%(e)(i) | | | | | 2,300 | | | 3,795 |
Federal Home Loan Mortgage Corp., 5.700%(e)(i) | | | | | 800 | | | 2,056 |
Federal Home Loan Mortgage Corp., 5.790%(e)(i) | | | | | 1,450 | | | 3,857 |
Federal Home Loan Mortgage Corp., 5.810%(e)(i) | | | | | 550 | | | 1,502 |
Federal Home Loan Mortgage Corp., 5.900%(e)(i) | | | | | 1,100 | | | 1,870 |
Federal Home Loan Mortgage Corp., 6.000%(e)(i) | | | | | 650 | | | 1,917 |
Federal Home Loan Mortgage Corp., 6.420%(e)(i) | | | | | 450 | | | 1,350 |
Federal Home Loan Mortgage Corp., 6.550%(e)(i) | | | | | 1,550 | | | 2,821 |
Federal Home Loan Mortgage Corp., (fixed rate to 12/31/2012, variable rate thereafter), 8.375%(e)(i) | | | | | 9,450 | | | 17,104 |
Federal National Mortgage Association, 4.750%(e)(i) | | | | | 1,000 | | | 2,550 |
Federal National Mortgage Association, 5.125%(e)(i) | | | | | 350 | | | 931 |
Federal National Mortgage Association, 5.375%(e)(i) | | | | | 700 | | | 1,988 |
Federal National Mortgage Association, 5.810%(e)(i) | | | | | 300 | | | 837 |
Federal National Mortgage Association, 6.750%(e)(i) | | | | | 450 | | | 707 |
Federal National Mortgage Association, (fixed rate to 12/13/2010, variable rate thereafter), 8.250%(e)(i) | | | | | 14,200 | | | 22,862 |
| | | | | | | | |
| | | | | | | | 79,872 |
| | | | | | | | |
| TOTAL PREFERRED STOCKS | | | | | | | | |
(Identified Cost $1,768,628) | | | | | | | | 1,339,322 |
| | | | | | | | |
See accompanying notes to financial statements.
16
PORTFOLIO OF INVESTMENTS – as of September 30, 2009
Loomis Sayles High Income Opportunities Fund – continued
| | | | | | | | | |
| | | | | Shares | | Value (†) | |
| | | |
| COMMON STOCKS – 0.4% | | | | | | | | | |
| | | |
| Biotechnology – 0.0% | | | | | | | | | |
EPIX Pharmaceuticals, Inc.(e) | | | | | 15,255 | | $ | 214 | |
EPIX Pharmaceuticals, Inc., Contingent Value Rights(e) | | | | | 45 | | | — | |
| | | | | | | | | |
| | | | | | | | 214 | |
| | | | | | | | | |
| Oil, Gas & Consumable Fuels – 0.4% | | | | | | | | | |
Chesapeake Energy Corp. | | | | | 9,278 | | | 263,495 | |
| | | | | | | | | |
| | | |
| TOTAL COMMON STOCKS | | | | | | | | | |
(Identified Cost $358,883) | | | | | | | | 263,709 | |
| | | | | | | | | |
| | | |
| | | | | | Principal Amount | | | | |
| | | | | | | | | |
| | | |
| SHORT-TERM INVESTMENTS – 0.7% | | | | | | | | | |
| Repurchase Agreement with State Street Corporation, dated 9/30/2009 at 0.000% to be repurchased at $158 on 10/01/2009 collateralized by $5,000 U.S. Treasury Bill, due 11/05/2009 valued at $5,000 including accrued interest (Note 2h of Notes to Financial Statements) | | | | $ | 158 | | | 158 | |
| Tri-Party Repurchase Agreement with Fixed Income Clearing Corporation, dated 9/30/2009 at 0.000% to be repurchased at $541,613 on 10/01/2009 collateralized by $550,000 Federal Home Loan Bank, 2.900% due 7/02/2013 valued at $554,813 including accrued interest (Note 2h of Notes to Financial Statements) | | | | | 541,613 | | | 541,613 | |
| | | | | | | | | |
| | | |
| TOTAL SHORT-TERM INVESTMENTS | | | | | | | | | |
(Identified Cost $541,771) | | | | | | | | 541,771 | |
| | | | | | | | | |
| | | |
| TOTAL INVESTMENTS – 98.2% | | | | | | | | | |
(Identified Cost $74,489,270)(a) | | | | | | | | 70,419,227 | |
Other assets less liabilities—1.8% | | | | | | | | 1,290,292 | |
| | | | | | | | | |
| | | |
| NET ASSETS – 100.0% | | | | | | | $ | 71,709,519 | |
| | | | | | | | | |
| |
(†) See Note 2a of Notes to Financial Statements. (a) Federal Tax Information: | | | | |
At September 30, 2009, the net unrealized depreciation on investments based on a cost of $75,074,217 for federal income tax purposes was as follows: | | | | |
Aggregate gross unrealized appreciation for all investments in which there is an excess of value over tax cost | | $ | 3,286,179 | |
Aggregate gross unrealized depreciation for all investments in which there is an excess of tax cost over value | | | (7,941,169 | ) |
| | | | | | | | | |
Net unrealized depreciation | | $ | (4,654,990 | ) |
| | | | | | | | | |
| (b) | Variable rate security. Rate as of September 30, 2009 is disclosed. |
| (c) | Illiquid security. At September 30, 2009, the value of these securities amounted to $1,646,735 or 2.3% of net assets. |
| (d) | The issuer is in default with respect to interest and/or principal payments. Income is not being accrued. |
| (e) | Non-income producing security. |
| (f) | Step Bond: Coupon is a fixed rate for an initial period then resets at a specified date and rate. |
| (g) | Variable rate security. Rate shown represents the weighted average rate at September 30, 2009. |
| (h) | All or a portion of interest payment is paid-in-kind. |
| (i) | Future dividend payments have been eliminated as the issuer has been placed in conservatorship. |
| (j) | Issuer has filed for bankruptcy. |
| 144A | Securities exempt from registration under Rule 144A of the Securities Act of 1933. These securities may be resold in transactions exempt from registration, normally to qualified institutional buyers. At September 30, 2009, the total value of these securities amounted to $10,836,062 or 15.1% of net assets. |
| ABS | Asset-Backed Securities |
| REITs | Real Estate Investment Trusts |
See accompanying notes to financial statements.
17
INDUSTRY SUMMARY AT SEPTEMPER 30, 2009 (Unaudited)
| | | |
Wirelines | | 10.7 | % |
Electric | | 7.7 | |
Technology | | 7.4 | |
Healthcare | | 6.1 | |
Independent Energy | | 6.0 | |
Media Cable | | 4.0 | |
Automotive | | 3.9 | |
Home Construction | | 3.7 | |
Non-Captive Diversified | | 3.6 | |
Paper | | 3.3 | |
Retailers | | 3.1 | |
Wireless | | 3.0 | |
Non-Captive Consumer | | 2.8 | |
Pharmaceuticals | | 2.8 | |
Airlines | | 2.7 | |
Commercial Mortgage-Backed Securities | | 2.5 | |
Supermarkets | | 2.3 | |
Food & Beverage | | 2.3 | |
Other Investments, less than 2% each | | 19.6 | |
Short-Term Investments | | 0.7 | |
| | | |
Total Investments | | 98.2 | |
Other assets less liabilities | | 1.8 | |
| | | |
Net Assets | | 100.0 | % |
| | | |
See accompanying notes to financial statements.
18
PORTFOLIO OF INVESTMENTS – as of September 30, 2009
Loomis Sayles Securitized Asset Fund
| | | | | | | | |
| | | | | Principal Amount | | Value (†) |
| | | | | | | | |
| | | |
| BONDS AND NOTES – 129.4% of Net Assets | | | | | | | | |
| | | |
| ABS Car Loan – 3.5% | | | | | | | | |
ARG Funding Corp., Series 2005-2A, Class A5, 0.406%, 5/20/2011, 144A(b) | | | | $ | 1,700,000 | | $ | 1,700,005 |
Avis Budget Rental Car Funding AESOP LLC, Series 2009-1A, Class A, 9.310%, 10/20/2013, 144A | | | | | 2,800,000 | | | 2,946,403 |
Capital Auto Receivables Asset Trust, Series 2008-1, Class A2B, 0.943%, 9/15/2010(b) | | | | | 263,894 | | | 263,943 |
Capital One Auto Finance Trust, Series 2006-C, Class A4, 0.273%, 5/15/2013(b) | | | | | 845,000 | | | 828,917 |
Capital One Auto Finance Trust, Series 2007-C, Class A4, 5.230%, 7/15/2014 | | | | | 800,000 | | | 782,420 |
Daimler Chrysler Auto Trust, Series 2008-B, Class A4A, 5.320%, 11/10/2014 | | | | | 1,135,000 | | | 1,184,254 |
Merrill Auto Trust Securitization Asset, Series 2008-1, Class B, 6.750%, 4/15/2015 | | | | | 1,305,000 | | | 1,204,113 |
Nissan Auto Receivables Owner Trust, Series 2008-B, Class A3, 4.460%, 4/16/2012 | | | | | 1,330,000 | | | 1,374,878 |
| | | | | | | | |
| | | | | | | | 10,284,933 |
| | | | | | | | |
| ABS Credit Card – 7.5% | | | | | | | | |
Capital One Multi-Asset Execution Trust, Series 2004-A4, Class A4, 0.463%, 3/15/2017(b) | | | | | 1,895,000 | | | 1,818,262 |
Capital One Multi-Asset Execution Trust, Series 2007-A5, Class A5, 0.283%, 7/15/2020(b) | | | | | 2,140,000 | | | 1,943,577 |
Chase Issuance Trust, Series 2007-B1, Class B1, 0.493%, 4/15/2019(b) | | | | | 2,300,000 | | | 1,971,795 |
Chase Issuance Trust, Series 2007-C1, Class C1, 0.703%, 4/15/2019(b) | | | | | 1,750,000 | | | 1,464,218 |
Citibank Credit Card Issuance Trust, Series 2005-C2, Class C2, 0.716%, 3/24/2017(b) | | | | | 1,150,000 | | | 981,410 |
Citibank Credit Card Issuance Trust, Series 2006-C4, Class C4, 0.474%, 1/09/2012(b) | | | | | 300,000 | | | 296,988 |
Citibank Credit Card Issuance Trust, Series 2007-A8, Class A8, 5.650%, 9/20/2019 | | | | | 4,215,000 | | | 4,646,979 |
Citibank Credit Card Issuance Trust, Series 2008-C6, Class C6, 6.300%, 6/20/2014 | | | | | 1,895,000 | | | 1,960,315 |
Discover Card Master Trust, Series 2007-A1, Class A1, 5.650%, 3/16/2020 | | | | | 3,305,000 | | | 3,567,858 |
GE Capital Credit Card Master Note Trust, Series 2007-2, Class B, 0.423%, 3/15/2015(b) | | | | | 1,335,000 | | | 1,142,799 |
MBNA Credit Card Master Note Trust, Series 2004-A3, Class A3, 0.503%, 8/16/2021(b) | | | | | 1,490,000 | | | 1,355,366 |
World Financial Network Credit Card Master Trust, Series 2008-A, Class M, 5.243%, 6/15/2014(b) | | | | | 706,000 | | | 676,031 |
| | | | | | | | |
| | | | | | | | 21,825,598 |
| | | | | | | | |
| ABS Home Equity – 3.7% | | | | | | | | |
Bear Stearns Asset Backed Securities Trust, Series 2006-HE3, Class A3, 0.526%, 4/25/2036(b) | | | | | 2,228,800 | | | 290,413 |
Bear Stearns Asset Backed Securities Trust, Series 2007-HE5, Class 1A2, 0.426%, 6/25/2047(b) | | | | | 2,495,000 | | | 748,500 |
Citigroup Mortgage Loan Trust, Inc., Series 2007-WFH1, Class A2, 0.346%, 1/25/2037(b) | | | | | 1,765,092 | | | 1,560,125 |
See accompanying notes to financial statements.
19
| | | | | | | | |
| | | | | Principal Amount | | Value (†) |
| | | | | | | | |
| | | |
| BONDS AND NOTES – continued | | | | | | | | |
| | | |
| ABS Home Equity – continued | | | | | | | | |
Countrywide Asset-Backed Certificates, Series 2004-S1, Class A3, 4.615%, 2/25/2035 | | | | $ | 924,984 | | $ | 695,488 |
Countrywide Asset-Backed Certificates, Series 2006-BC4, Class 2A2, 0.406%, 11/25/2036(b) | | | | | 2,835,000 | | | 1,438,618 |
Countrywide Asset-Backed Certificates, Series 2006-S1, Class A2, 5.549%, 8/25/2021 | | | | | 385,671 | | | 204,290 |
Countrywide Asset-Backed Certificates, Series 2006-S3, Class A1, 0.356%, 6/25/2021(b) | | | | | 1,711,921 | | | 858,015 |
Countrywide Asset-Backed Certificates, Series 2006-S3, Class A3, 6.287%, 6/25/2021 | | | | | 814,990 | | | 242,146 |
Countrywide Asset-Backed Certificates, Series 2006-S7, Class A3, 5.712%, 11/25/2035 | | | | | 2,139,557 | | | 251,612 |
GSAMP Trust, Series 2005-WMC3, Class A2B, 0.486%, 12/25/2035(b) | | | | | 1,543,262 | | | 974,886 |
Ownit Mortgage Loan Asset-Backed Certificates, Series 2005-2, Class M3, 0.716%, 3/25/2036(b) | | | | | 1,000,000 | | | 775,034 |
Residential Asset Mortgage Products, Inc., Series 2004-RZ1, Class AI5, 4.070%, 7/25/2032 | | | | | 26,150 | | | 25,973 |
Soundview Home Equity Loan Trust, Series 2006-OPT5, Class 2A3, 0.396%, 7/25/2036(b) | | | | | 2,685,000 | | | 1,596,052 |
Soundview Home Equity Loan Trust, Series 2006-WF2, Class A2C, 0.386%, 12/25/2036(b) | | | | | 1,750,000 | | | 1,063,535 |
| | | | | | | | |
| | | | | | | | 10,724,687 |
| | | | | | | | |
| ABS Other – 1.8% | | | | | | | | |
CIT Equipment Collateral, Series 2008-VT1, Class A3, 6.590%, 12/22/2014 | | | | | 3,020,000 | | | 3,083,097 |
Sierra Receivables Funding Co., Series 2009-1A, Class A1, 9.790%, 12/22/2025, 144A | | | | | 508,997 | | | 510,554 |
Sierra Receivables Funding Co., Series 2009-3A, Class A1, 7.620%, 7/20/2026, 144A | | | | | 1,570,000 | | | 1,570,000 |
| | | | | | | | |
| | | | | | | | 5,163,651 |
| | | | | | | | |
| Collateralized Mortgage Obligations – 9.2% | | | | | | | | |
Countrywide Alternative Loan Trust, Series 2006-15CB, Class A1, 6.500%, 6/25/2036 | | | | | 1,200,455 | | | 742,782 |
Countrywide Alternative Loan Trust, Series 2006-J5, Class 4A1, 6.006%, 7/25/2021(b) | | | | | 1,189,892 | | | 850,773 |
CS First Boston Mortgage Securities Corp., Series 2005-7, Class 3A1, 5.000%, 8/25/2020 | | | | | 282,425 | | | 242,444 |
Federal Home Loan Mortgage Corp., Series 2613, Class HI, 5.500%, 2/15/2033(g) | | | | | 26,716 | | | 1 |
Federal Home Loan Mortgage Corp., Series 2912, Class EH, 5.500%, 1/15/2035(c) | | | | | 2,797,000 | | | 2,966,569 |
Federal National Mortgage Association, Series 2003-26, Class OI, 5.500%, 11/25/2032(c)(g) | | | | | 16,021,301 | | | 1,718,352 |
Federal National Mortgage Association, Series 2004-2, Class QK, 4.000%, 9/25/2017(c) | | | | | 10,000,000 | | | 10,429,377 |
First Horizon Alternative Mortgage Securities, Series 2006-AA3, Class A1, 6.267%, 6/25/2036(b) | | | | | 5,237,485 | | | 3,045,024 |
Residential Accredit Loans, Inc., Series 2006-QS13, Class 2A1, 5.750%, 9/25/2021 | | | | | 568,020 | | | 377,733 |
Residential Accredit Loans, Inc., Series 2006-QS18, Class 3A3, 5.750%, 12/25/2021 | | | | | 2,325,581 | | | 2,011,628 |
See accompanying notes to financial statements.
20
PORTFOLIO OF INVESTMENTS – as of September 30, 2009
Loomis Sayles Securitized Asset Fund – continued
| | | | | | | | |
| | | | | Principal Amount | | Value (†) |
| | | | | | | | |
| | | |
| BONDS AND NOTES – continued | | | | | | | | |
| | | |
| Collateralized Mortgage Obligations – continued | | | | | | | | |
Residential Accredit Loans, Inc., Series 2006-QS6, Class 2A1, 6.000%, 6/25/2021 | | | | $ | 125,153 | | $ | 101,999 |
Washington Mutual Mortgage Pass Through Certificates, Series 2007-HY6, Class 2A1, 5.669%, 6/25/2037(b) | | | | | 6,654,006 | | | 4,360,177 |
| | | | | | | | |
| | | | | | | | 26,846,859 |
| | | | | | | | |
| | | |
| Commercial Mortgage-Backed Securities – 27.9% | | | | | | | | |
Banc of America Commercial Mortgage, Inc., Series 2005-6, Class A2, 5.165%, 9/10/2047 | | | | | 120,000 | | | 121,243 |
Banc of America Commercial Mortgage, Inc., Series 2005-6, Class A4, 5.179%, 9/10/2047(b) | | | | | 189,000 | | | 183,877 |
Banc of America Commercial Mortgage, Inc., Series 2006-2, Class A4, 5.739%, 5/10/2045(b) | | | | | 350,000 | | | 336,470 |
Banc of America Commercial Mortgage, Inc., Series 2006-4, Class A2, 5.522%, 7/10/2046 | | | | | 460,000 | | | 465,883 |
Banc of America Commercial Mortgage, Inc., Series 2007-2, Class A2, 5.634%, 4/10/2049 | | | | | 5,375,000 | | | 5,335,801 |
Bank of America-First Union NB Commercial Mortgage, Series 2001-3, Class A2, 5.464%, 4/11/2037 | | | | | 430,000 | | | 448,057 |
Bear Stearns Commercial Mortgage Securities, Series 2001-TOP2, Class A2, 6.480%, 2/15/2035 | | | | | 175,000 | | | 181,493 |
Bear Stearns Commercial Mortgage Securities, Series 2005-T18, Class A2, 4.556%, 2/13/2042 | | | | | 171,000 | | | 171,138 |
Bear Stearns Commercial Mortgage Securities, Series 2007-PW15, Class A4, 5.331%, 2/11/2044 | | | | | 225,000 | | | 202,540 |
Bear Stearns Commercial Mortgage Securities, Series 2007-PW16, Class A4, 5.719%, 6/11/2040(b) | | | | | 1,200,000 | | | 1,096,142 |
Citigroup/Deutsche Bank Commercial Mortgage Trust, Series 2006-CD3, Class A5, 5.617%, 10/15/2048 | | | | | 5,000,000 | | | 4,614,674 |
Commercial Mortgage Pass Through Certificates, Series 2006-C7, Class A4, 5.768%, 6/10/2046(b) | | | | | 250,000 | | | 239,154 |
Credit Suisse Mortgage Capital Certificates, Series 2006-C3, Class A3, 5.826%, 6/15/2038(b) | | | | | 3,585,000 | | | 3,040,580 |
Credit Suisse Mortgage Capital Certificates, Series 2007-C3, Class A4, 5.723%, 6/15/2039(b) | | | | | 2,342,000 | | | 1,848,922 |
Credit Suisse Mortgage Capital Certificates, Series 2008-C1, Class A3, 6.216%, 2/15/2041(b) | | | | | 1,508,000 | | | 1,235,015 |
Greenwich Capital Commercial Funding Corp., Series 2007-GG9, Class A4, 5.444%, 3/10/2039 | | | | | 5,000,000 | | | 4,431,067 |
GS Mortgage Securities Corp. II, Series 2004-GG2, Class A6, 5.396%, 8/10/2038 | | | | | 125,000 | | | 121,160 |
GS Mortgage Securities Corp. II, Series 2005-GG4, Class A2, 4.475%, 7/10/2039 | | | | | 1,130,000 | | | 1,124,384 |
GS Mortgage Securities Corp. II, Series 2005-GG4, Class A4A, 4.751%, 7/10/2039 | | | | | 4,515,000 | | | 4,232,799 |
GS Mortgage Securities Corp. II, Series 2006-GG6, Class A2, 5.506%, 4/10/2038 | | | | | 500,000 | | | 503,455 |
GS Mortgage Securities Corp. II, Series 2006-GG6, Class A4, 5.553%, 4/10/2038 | | | | | 1,190,000 | | | 1,074,717 |
GS Mortgage Securities Corp. II, Series 2006-GG8, Class A2, 5.479%, 11/10/2039 | | | | | 4,449,000 | | | 4,428,563 |
JPMorgan Chase Commercial Mortgage Securities Corp., Series 2001-CIBC, Class A3, 6.260%, 3/15/2033 | | | | | 170,370 | | | 175,876 |
See accompanying notes to financial statements.
21
| | | | | | | | |
| | | | | Principal Amount | | Value (†) |
| | | | | | | | |
| | | |
| BONDS AND NOTES – continued | | | | | | | | |
| | | |
| Commercial Mortgage-Backed Securities – continued | | | | | | | | |
JPMorgan Chase Commercial Mortgage Securities Corp., Series 2005-LDP5, Class A4, 5.179%, 12/15/2044(b) | | | | $ | 4,420,000 | | $ | 4,331,151 |
JPMorgan Chase Commercial Mortgage Securities Corp., Series 2006-LDP7, Class A2, 5.861%, 4/15/2045(b) | | | | | 1,065,000 | | | 1,080,840 |
JPMorgan Chase Commercial Mortgage Securities Corp., Series 2007-LDPX, Class A3, 5.420%, 1/15/2049 | | | | | 4,085,000 | | | 3,443,445 |
LB-UBS Commercial Mortgage Trust, Series 2005-C3, Class A3, 4.647%, 7/15/2030 | | | | | 275,000 | | | 275,421 |
LB-UBS Commercial Mortgage Trust, Series 2006-C3, Class A4, 5.661%, 3/15/2039 | | | | | 2,440,000 | | | 2,286,214 |
LB-UBS Commercial Mortgage Trust, Series 2007-C2, Class A2, 5.303%, 2/15/2040 | | | | | 4,260,000 | | | 4,214,690 |
Merrill Lynch Mortgage Trust, Series 2006-C1, Class A2, 5.611%, 5/12/2039(b) | | | | | 1,000,000 | | | 1,011,729 |
Merrill Lynch/Countrywide Commercial Mortgage Trust, Series 2006-1, Class A2, 5.439%, 2/12/2039 | | | | | 4,895,000 | | | 4,931,507 |
Merrill Lynch/Countrywide Commercial Mortgage Trust, Series 2006-1, Class A4, 5.420%, 2/12/2039(b) | | | | | 1,000,000 | | | 912,760 |
Merrill Lynch/Countrywide Commercial Mortgage Trust, Series 2006-2, Class A4, 5.909%, 6/12/2046(b) | | | | | 250,000 | | | 235,167 |
Merrill Lynch/Countrywide Commercial Mortgage Trust, Series 2006-3, Class A4, 5.414%, 7/12/2046 | | | | | 1,000,000 | | | 893,938 |
Morgan Stanley Capital I, Series 2005-HQ6, Class A4A, 4.989%, 8/13/2042 | | | | | 5,280,000 | | | 5,137,947 |
Morgan Stanley Capital I, Series 2005-HQ7, Class A4, 5.207%, 11/14/2042(b) | | | | | 5,965,000 | | | 5,979,209 |
Morgan Stanley Capital I, Series 2005-T19, Class A4A, 4.890%, 6/12/2047 | | | | | 1,267,000 | | | 1,246,133 |
Morgan Stanley Capital I, Series 2006-HQ10, Class A4, 5.328%, 11/12/2041 | | | | | 5,000,000 | | | 4,547,030 |
Morgan Stanley Capital I, Series 2006-T23, Series A2, 5.741%, 8/12/2041(b) | | | | | 555,000 | | | 561,272 |
Morgan Stanley Capital I, Series 2007-IQ14, Class A4, 5.692%, 4/15/2049 | | | | | 2,305,000 | | | 1,885,273 |
Wachovia Bank Commercial Mortgage Trust, Series 2005-C16, Class A2, 4.380%, 10/15/2041 | | | | | 46,118 | | | 46,175 |
Wachovia Bank Commercial Mortgage Trust, Series 2006-C23, Class A4, 5.418%, 1/15/2045 | | | | | 2,600,000 | | | 2,367,049 |
| | | | | | | | |
| | | | | | | | 80,999,960 |
| | | | | | | | |
| Hybrid ARMs – 12.5% | | | | | | | | |
Countrywide Home Loans, Series 2004-HYB5, Class 6A2, 3.607%, 4/20/2035(b) | | | | | 594,372 | | | 136,111 |
FHLMC, 4.428%, 1/01/2035(b)(c) | | | | | 303,059 | | | 308,647 |
FHLMC, 5.950%, 2/01/2037(b)(c) | | | | | 8,017,543 | | | 8,458,632 |
FHLMC, 5.980%, 11/01/2036(b)(c) | | | | | 4,989,551 | | | 5,245,265 |
FNMA, 5.723%, 9/01/2036(b)(c) | | | | | 2,965,752 | | | 3,120,661 |
FNMA, 6.026%, 2/01/2037(b)(c) | | | | | 6,647,586 | | | 7,068,843 |
Indymac Index Mortgage Loan Trust, Series 2006-AR25, Class 3A1, 5.922%, 9/25/2036(b) | | | | | 6,277,825 | | | 3,623,178 |
See accompanying notes to financial statements.
22
PORTFOLIO OF INVESTMENTS – as of September 30, 2009
Loomis Sayles Securitized Asset Fund – continued
| | | | | | | | |
| | | | | Principal Amount | | Value (†) |
| | | | | | | | |
| | | |
| BONDS AND NOTES – continued | | | | | | | | |
| | | |
| Hybrid ARMs – continued | | | | | | | | |
JPMorgan Mortgage Trust, Series 2006-A7, Class 1A3, 4.552%, 1/25/2037(b) | | | | $ | 207,655 | | $ | 193,669 |
Morgan Stanley Mortgage Loan Trust, Series 2005-3AR, Class 5A, 5.585%, 7/25/2035(b) | | | | | 934,183 | | | 739,664 |
Washington Mutual Mortgage Pass Through Certificates, Series 2007-HY2, Class 2A2, 6.417%, 11/25/2036(b) | | | | | 10,173,115 | | | 6,661,454 |
Wells Fargo Mortgage Backed Securities Trust, Series 2005-AR16, Class 3A2, 4.113%, 10/25/2035(b) | | | | | 688,167 | | | 619,327 |
| | | | | | | | |
| | | | | | | | 36,175,451 |
| | | | | | | | |
| Mortgage Related – 63.3% | | | | | | | | |
FHLMC, 5.000%, with various maturities from 2035 to 2036(c)(e) | | | | | 2,093,772 | | | 2,171,067 |
FHLMC, 5.500%, 5/01/2035(c) | | | | | 390,699 | | | 410,437 |
FHLMC, 6.000%, with various maturities from 2036 to 2037(c)(e) | | | | | 21,559,461 | | | 22,812,422 |
FHLMC, 6.500%, 1/01/2038(c) | | | | | 155,730 | | | 166,215 |
FHLMC (TBA), 5.000%, 2/01/2019(d) | | | | | 14,880,000 | | | 15,614,700 |
FNMA, 4.500%, 10/01/2035(c) | | | | | 716,388 | | | 729,298 |
FNMA, 5.500%, with various maturities from 2034 to 2038(c)(e) | | | | | 18,723,567 | | | 19,657,348 |
FNMA, 6.000%, with various maturities from 2034 to 2037(c)(e) | | | | | 11,888,275 | | | 12,578,850 |
FNMA, 7.000%, 12/01/2037(c) | | | | | 151,235 | | | 165,202 |
FNMA (TBA), 5.000%, 4/01/2035(d) | | | | | 33,900,000 | | | 35,012,327 |
FNMA (TBA), 6.500%, 4/01/2035(d) | | | | | 12,000,000 | | | 12,825,000 |
GNMA, 4.500%, 3/15/2039(c) | | | | | 22,711,764 | | | 23,095,025 |
GNMA, 5.500%, with various maturities from 2033 to 2036(c)(e) | | | | | 1,998,984 | | | 2,105,199 |
GNMA, 6.000%, 6/15/2036(c) | | | | | 145,315 | | | 153,852 |
GNMA, 6.500%, 9/15/2036(c) | | | | | 591,600 | | | 629,611 |
GNMA (TBA), 5.500%, 6/01/2036(d) | | | | | 34,000,000 | | | 35,668,108 |
| | | | | | | | |
| | | | | | | | 183,794,661 |
| | | | | | | | |
| | | |
| TOTAL BONDS AND NOTES | | | | | | | | |
(Identified Cost $388,504,480) | | | | | | | | 375,815,800 |
| | | | | | | | |
See accompanying notes to financial statements.
23
| | | | | | | | |
| | | | | Principal Amount | | Value (†) |
| | | | | | | | |
| | | |
| SHORT-TERM INVESTMENTS – 3.8% | | | | | | | | |
| Federal National Mortgage Association Discount Notes, 0.520%, 4/01/2010(c)(f) | | | | $ | 1,000,000 | | $ | 999,141 |
| Tri-Party Repurchase Agreement with Fixed Income Clearing Corporation, dated 9/30/2009 at 0.000% to be repurchased at $10,010,755 on 10/01/2009 collateralized by $10,165,000 Federal National Mortgage Association, 3.000% due 1/13/2014 valued at $10,215,825 including accrued interest (Note 2h of Notes to Financial Statements) | | | | | 10,010,755 | | | 10,010,755 |
| | | | | | | | |
| | | |
| TOTAL SHORT-TERM INVESTMENTS | | | | | | | | |
(Identified Cost $11,008,117) | | | | | | | | 11,009,896 |
| | | | | | | | |
| | | |
| TOTAL INVESTMENTS – 133.2% | | | | | | | | |
(Identified Cost $399,512,597)(a) | | | | | | | | 386,825,696 |
Other assets less liabilities—(33.2)% | | | | | | | | (96,357,658) |
| | | | | | | | |
| | | |
| NET ASSETS – 100.0% | | | | | | | $ | 290,468,038 |
| | | | | | | | |
| |
(†) See Note 2a of Notes to Financial Statements. | | | |
(a) Federal Tax Information: | | | |
At September 30, 2009, the net unrealized depreciation on investments based on a cost of $399,515,359 for federal income tax purposes was as follows: | | | |
Aggregate gross unrealized appreciation for all investments in which there is an excess of value over tax cost | | $ | 10,556,873 |
Aggregate gross unrealized depreciation for all investments in which there is an excess of tax cost over value | | | (23,246,536) |
| | | |
Net unrealized depreciation | | $ | (12,689,663) |
| | | |
| (b) | Variable rate security. Rate as of September 30, 2009 is disclosed. |
| (c) | All or a portion of this security has been segregated to cover requirements on TBA obligations and future contracts. |
| (d) | Delayed delivery. (See Note 2i of Notes to Financial Statements). |
| (e) | The Fund’s investment in mortgage related securities of the Federal Home Loan Mortgage Corporation, Federal National Mortgage Association and Government National Mortgage Association are interests in separate pools of mortgages. All separate investments in securities of each issuer which have the same coupon rate have been aggregated for the purpose of presentation in the Portfolio of Investments. |
| (f) | Rate represents discount rate at time of purchase. |
| (g) | Security represents right to receive monthly interest payments on an underlying pool of mortgages. Principal shown is the outstanding par amount of the pool held as of the end of the period. |
| 144A | Securities exempt from registration under Rule 144A of the Securities Act of 1933. These securities may be resold in transactions exempt from registration, normally to qualified institutional buyers. At September 30, 2009, the total value of these securities amounted to $6,726,962 or 2.3% of net assets. |
| ABS | Asset-Backed Securities |
| ARM | Adjustable Rate Mortgage |
| FHLMC | Federal Home Loan Mortgage Corp. |
| FNMA | Federal National Mortgage Association |
| GNMA | Government National Mortgage Association |
At September 30, 2009, open futures contracts sold were as follows:
| | | | | | | | | | | |
| Futures | | Expiration
Date | | Contracts | | Notional
Value | | Unrealized
Depreciation | |
5 Year U.S. Treasury Note | | 12/31/2009 | | 155 | | $ | 17,994,531 | | $ | (215,831 | ) |
10 Year U.S. Treasury Note | | 12/21/2009 | | 50 | | | 5,916,406 | | | (84,857 | ) |
| | | | | | | | | | | |
Total | | | | | | | | | $ | (300,688 | ) |
| | | | | | | | | | | |
See accompanying notes to financial statements.
24
PORTFOLIO OF INVESTMENTS – as of September 30, 2009
Loomis Sayles Securitized Asset Fund – continued
INDUSTRY SUMMARY AT SEPTEMBER 30, 2009 (Unaudited)
| | | |
Mortgage Related | | 63.3 | % |
Commercial Mortgage-Backed Securities | | 27.9 | |
Hybrid ARMs | | 12.5 | |
Collateralized Mortgage Obligations | | 9.2 | |
ABS Credit Card | | 7.5 | |
ABS Home Equity | | 3.7 | |
ABS Car Loan | | 3.5 | |
ABS Other | | 1.8 | |
Short-Term Investments | | 3.8 | |
| | | |
Total Investments | | 133.2 | |
Other assets less liabilities (including open futures contracts) | | (33.2 | ) |
| | | |
Net Assets | | 100.0 | % |
| | | |
See accompanying notes to financial statements.
25
STATEMENTS OF ASSETS AND LIABILITIES
September 30, 2009
| | | | | | | | |
| | | High Income
Opportunities
Fund | | | Securitized
Asset Fund | |
| | | | | | | | |
Assets | | | | | | | | |
Investments at cost | | $ | 74,489,270 | | | $ | 399,512,597 | |
Net unrealized depreciation | | | (4,070,043 | ) | | | (12,686,901 | ) |
| | | | | | | | |
Investments at value | | | 70,419,227 | | | | 386,825,696 | |
Cash | | | 29 | | | | — | |
Receivable for Fund shares sold | | | 44,497 | | | | 809,366 | |
Dividends and interest receivable | | | 1,422,886 | | | | 1,748,592 | |
Due from broker | | | 1,931 | | | | — | |
| | | | | | | | |
Total Assets | | | 71,888,570 | | | | 389,383,654 | |
| | | | | | | | |
| | |
| Liabilities | | | | | | | | |
Payable for securities purchased | | | 74,238 | | | | — | |
Payable for delayed delivery securities purchased (Note 2) | | | — | | | | 98,672,526 | |
Payable for Fund shares redeemed | | | 104,813 | | | | 218,520 | |
Payable to broker—variation margin on open futures contracts | | | — | | | | 24,570 | |
| | | | | | | | |
Total Liabilities | | | 179,051 | | | | 98,915,616 | |
| | | | | | | | |
Net Assets | | $ | 71,709,519 | | | $ | 290,468,038 | |
| | | | | | | | |
Net Assets consist of: | | | | | | | | |
Paid-in capital | | $ | 83,042,024 | | | $ | 299,238,897 | |
Undistributed net investment income | | | 572,318 | | | | 1,668,897 | |
Accumulated net realized gain (loss) on investments and futures contracts | | | (7,834,780 | ) | | | 2,547,833 | |
Net unrealized depreciation on investments and futures contracts | | | (4,070,043 | ) | | | (12,987,589 | ) |
| | | | | | | | |
Net Assets | | $ | 71,709,519 | | | $ | 290,468,038 | |
| | | | | | | | |
| | |
| Net Asset Value and Offering Price | | | | | | | | |
Institutional Class | | | | | | | | |
Net assets | | $ | 71,709,519 | | | $ | 290,468,038 | |
| | | | | | | | |
Shares of beneficial interest | | | 7,909,391 | | | | 28,594,032 | |
| | | | | | | | |
Net asset value, offering and redemption price per share | | $ | 9.07 | | | $ | 10.16 | |
| | | | | | | | |
See accompanying notes to financial statements.
26
STATEMENTS OF OPERATIONS
For the Year Ended September 30, 2009
| | | | | | | | |
| | | High Income
Opportunities Fund | | | Securitized
Asset Fund | |
| | | | | | | | |
Investment Income | | | | | | | | |
Dividends | | $ | 85,376 | | | $ | — | |
Interest | | | 6,445,199 | | | | 15,843,704 | |
Securities lending income (Note 2) | | | 392 | | | | — | |
| | | | | | | | |
Net investment income | | | 6,530,967 | | | | 15,843,704 | |
| | | | | | | | |
| | |
| Net Realized and Unrealized Gain (Loss) on Investments and Futures Contracts | | | | | | | | |
Net Realized Gain (Loss) on: | | | | | | | | |
Investments | | | (7,702,420 | ) | | | 11,433,497 | |
Futures contracts | | | — | | | | (3,205,075 | ) |
| | |
| Net Change in Unrealized Appreciation (Depreciation) on: | | | | | | | | |
Investments | | | 15,284,070 | | | | 5,854,678 | |
Futures contracts | | | — | | | | (510,563 | ) |
| | | | | | | | |
Net realized and unrealized gain on investments and futures contracts | | | 7,581,650 | | | | 13,572,537 | |
| | | | | | | | |
| | |
| Net Increase in Net Assets Resulting from Operations | | $ | 14,112,617 | | | $ | 29,416,241 | |
| | | | | | | | |
See accompanying notes to financial statements.
27
STATEMENTS OF CHANGES IN NET ASSETS
High Income Opportunities Fund
| | | | | | | | |
| | | Year Ended
September 30, 2009 | | | Year Ended
September 30, 2008 | |
From Operations: | | | | | | | | |
Net investment income | | $ | 6,530,967 | | | $ | 6,881,020 | |
Net realized gain (loss) on investments | | | (7,702,420 | ) | | | 17,115 | |
Net change in unrealized appreciation (depreciation) on investments | | | 15,284,070 | | | | (18,349,158 | ) |
| | | | | | | | |
Net increase (decrease) in net assets resulting from operations | | | 14,112,617 | | | | (11,451,023 | ) |
| | | | | | | | |
From Distributions to Shareholders: | | | | | | | | |
Net Investment Income: | | | | | | | | |
Institutional Class | | | (6,616,136 | ) | | | (6,813,880 | ) |
Capital Gains: | | | | | | | | |
Institutional Class | | | (85,819 | ) | | | (543,232 | ) |
| | | | | | | | |
Total distributions | | | (6,701,955 | ) | | | (7,357,112 | ) |
| | | | | | | | |
Decrease in Net Assets Derived from Capital Share Transactions (Note 9) | | | (651,439 | ) | | | (314,836 | ) |
| | | | | | | | |
Net increase (decrease) in net assets | | | 6,759,223 | | | | (19,122,971 | ) |
Net Assets | | | | | | | | |
Beginning of year | | | 64,950,296 | | | | 84,073,267 | |
| | | | | | | | |
End of year | | $ | 71,709,519 | | | $ | 64,950,296 | |
| | | | | | | | |
Undistributed Net Investment Income | | $ | 572,318 | | | $ | 629,102 | |
| | | | | | | | |
Securitized Asset Fund
| | | | | | | | |
| | | Year Ended
September 30, 2009 | | | Year Ended
September 30, 2008 | |
From Operations: | | | | | | | | |
Net investment income | | $ | 15,843,704 | | | $ | 20,385,139 | |
Net realized gain on investments and futures contracts | | | 8,228,422 | | | | 145,330 | |
Net change in unrealized appreciation (depreciation) on investments and futures contracts | | | 5,344,115 | | | | (17,675,141 | ) |
| | | | | | | | |
Net increase in net assets resulting from operations | | | 29,416,241 | | | | 2,855,328 | |
| | | | | | | | |
From Distributions to Shareholders: | | | | | | | | |
Net Investment Income: | | | | | | | | |
Institutional Class | | | (18,247,123 | ) | | | (20,848,572 | ) |
Capital Gains: | | | | | | | | |
Institutional Class | | | (1,038,001 | ) | | | — | |
| | | | | | | | |
Total distributions | | | (19,285,124 | ) | | | (20,848,572 | ) |
| | | | | | | | |
Increase (Decrease) in Net Assets Derived from Capital Share Transactions (Note 9) | | | (101,717,022 | ) | | | 52,893,796 | |
| | | | | | | | |
Net increase (decrease) in net assets | | | (91,585,905 | ) | | | 34,900,552 | |
Net Assets | | | | | | | | |
Beginning of year | | | 382,053,943 | | | | 347,153,391 | |
| | | | | | | | |
End of year | | $ | 290,468,038 | | | $ | 382,053,943 | |
| | | | | | | | |
Undistributed Net Investment Income | | $ | 1,668,897 | | | $ | 2,141,622 | |
| | | | | | | | |
See accompanying notes to financial statements.
28
FINANCIAL HIGHLIGHTS
For a share outstanding throughout each period.
| | | | | | | | | | | | | | | | | | | | | | | | |
| | | | | Income (Loss) from Investment Operations: | | | | | Less Distributions: | |
| | | Net asset
value,
beginning
of the period | | Net
investment
income(a) | | Net realized
and unrealized
gain (loss) | | | Total from
investment
operations | | | | | Dividends
from
net investment
income | | | Distributions
from net
realized
capital gains(b) | |
| High Income Opportunities Fund | |
| | | | | | | |
| Institutional Class | | | | | | | | | | | | | | | | | | | | | | | | |
9/30/2009 | | $ | 8.26 | | $ | 0.79 | | $ | 0.84 | | | $ | 1.63 | | | | | $ | (0.81 | ) | | $ | (0.01 | ) |
9/30/2008 | | | 10.42 | | | 0.82 | | | (2.09 | ) | | | (1.27 | ) | | | | | (0.82 | ) | | | (0.07 | ) |
9/30/2007 | | | 10.39 | | | 0.77 | | | 0.01 | (f) | | | 0.78 | | | | | | (0.75 | ) | | | (0.00 | ) |
9/30/2006 | | | 10.50 | | | 0.76 | | | (0.10 | ) | | | 0.66 | | | | | | (0.73 | ) | | | (0.04 | ) |
9/30/2005 | | | 10.32 | | | 0.78 | | | 0.17 | | | | 0.95 | | | | | | (0.77 | ) | | | — | |
| | | | | | |
| Securitized Asset Fund | | | | | | | | | | | | | | | | | | | | | |
| | | | | | | |
| Institutional Class | | | | | | | | | | | | | | | | | | | | | | | | |
9/30/2009 | | $ | 9.60 | | $ | 0.50 | | $ | 0.66 | | | $ | 1.16 | | | | | $ | (0.57 | ) | | $ | (0.03 | ) |
9/30/2008 | | | 10.07 | | | 0.55 | | | (0.45 | ) | | | 0.10 | | | | | | (0.57 | ) | | | — | |
9/30/2007 | | | 10.13 | | | 0.55 | | | (0.10 | ) | | | 0.45 | | | | | | (0.51 | ) | | | (0.00 | ) |
9/30/2006(g) | | | 10.00 | | | 0.30 | | | 0.02 | | | | 0.32 | | | | | | (0.19 | ) | | | — | |
| (a) | | Per share net investment income has been calculated using the average shares outstanding during the period. | |
| (b) | | Amount rounds to less than $0.01 per share, if applicable. | |
| (c) | | Periods less than one year, if applicable, are not annualized. | |
| (d) | | Loomis Sayles has agreed to pay, without reimbursement from the Fund, all expenses associated with the operations of the Fund. | |
| (e) | | Computed on an annualized basis for periods less than one year, if applicable. | |
| | (f) | | The amount shown for a share outstanding does not correspond with the aggregate realized and unrealized gain (loss) on investments for the period due to the timing of sales and redemptions of fund shares in relation to fluctuating market values of investments of the Fund. | |
| (g) | | For the period March 2, 2006 (commencement of operations) through September 30, 2006. | |
See accompanying notes to financial statements.
29
| | | | | | | | | | | | | | | | | | | |
| | | | | | | | | | | Ratios to Average Net Assets: | | |
Total
distributions | | | Net asset
value,
end of
the period | | Total
return (%)(c) | | | Net assets,
end of
the period
(000’s) | | Net
expenses (%)(d) | | Gross
expenses (%)(d) | | Net
investment
income (%)(e) | | Portfolio
turnover
rate (%) |
| | | | | | | | | | | | | | | | | | | |
| | | | | | | |
| | | | | | | | | | | | | | | | | | | |
| $ | (0.82 | ) | | $ | 9.07 | | 23.06 | | | $ | 71,710 | | — | | — | | 10.86 | | 34 |
| | (0.89 | ) | | | 8.26 | | (13.24 | ) | | | 64,950 | | — | | — | | 8.47 | | 24 |
| | (0.75 | ) | | | 10.42 | | 7.68 | | | | 84,073 | | — | | — | | 7.35 | | 29 |
| | (0.77 | ) | | | 10.39 | | 6.64 | | | | 42,847 | | — | | — | | 7.36 | | 26 |
| | (0.77 | ) | | | 10.50 | | 9.45 | | | | 13,115 | | — | | — | | 7.40 | | 22 |
| | | | | | | |
| | | | | | | | | | | | | | | | | | | |
| | | | | | | |
| | | | | | | | | | | | | | | | | | | |
| $ | (0.60 | ) | | $ | 10.16 | | 12.97 | | | $ | 290,468 | | — | | — | | 5.42 | | 390 |
| | (0.57 | ) | | | 9.60 | | 0.92 | | | | 382,054 | | — | | — | | 5.55 | | 430 |
| | (0.51 | ) | | | 10.07 | | 4.58 | | | | 347,153 | | — | | — | | 5.43 | | 73 |
| | (0.19 | ) | | | 10.13 | | 3.28 | | | | 70,993 | | — | | — | | 3.02 | | 55 |
See accompanying notes to financial statements.
30
NOTES TO FINANCIAL STATEMENTS
September 30, 2009
1. Organization. Loomis Sayles Funds I (the “Trust”) is organized as a Massachusetts business trust. The Trust is registered under the Investment Company Act of 1940, as amended (the “1940 Act”), as an open-end management investment company. The Declaration of Trust permits the Board of Trustees to authorize the issuance of an unlimited number of shares of the Trust in multiple series. The financial statements for certain funds of the Trust are presented in separate reports. The following funds (individually, a “Fund” and collectively, the “Funds”) are included in this report:
Loomis Sayles High Income Opportunities Fund (the “High Income Opportunities Fund”)
Loomis Sayles Securitized Asset Fund (the “Securitized Asset Fund”)
Each Fund offers Institutional Class Shares. The Funds’ shares are offered exclusively to investors in “wrap fee” programs approved by Natixis Asset Management Advisors, L.P. (“Natixis Advisors”) and/or Loomis, Sayles & Company, L.P. (“Loomis Sayles”) and to institutional advisory clients of Natixis Advisors or Loomis Sayles that, in each case, meet the Funds’ policies as established by Loomis Sayles.
2. Significant Accounting Policies. The following is a summary of significant accounting policies consistently followed by each Fund in the preparation of its financial statements. Each Fund’s financial statements are prepared in accordance with accounting principles generally accepted in the United States of America which require the use of management estimates that affect the reported amounts and disclosures in the financial statements. Actual results could differ from those estimates. Management has evaluated the events and transactions that have occurred through November 23, 2009, the date the financial statements were issued, and noted no items requiring recognition in the financial statements or additional disclosure in the Notes to Financial Statements.
a. Valuation. Debt securities (other than short-term obligations purchased with an original or remaining maturity of sixty days or less) are generally valued on the basis of evaluated bids furnished to the Funds by a pricing service recommended by the investment adviser and approved by the Board of Trustees, which service determines valuations for normal, institutional size-trading units of such securities using market information, transactions for comparable securities and various relationships between securities which are generally recognized by institutional traders. Equity securities, including closed-end investment companies and exchange traded funds, for which market quotations are readily available are valued at market value, as reported by pricing services recommended by the investment adviser and approved by the Board of Trustees. Such pricing services generally use the security’s last sale price on the exchange or market where the security is primarily traded or, if there is no reported sale during the day, the closing bid price. Securities traded on the NASDAQ Global Select Market, NASDAQ Global Market and NASDAQ Capital Markets are valued at the NASDAQ Official Closing Price (“NOCP”), or if lacking a NOCP, at the most recent bid quotation on the applicable NASDAQ Market. Broker-dealer bid quotations may also be used to value debt and equity securities where a pricing service does not price a security or where a pricing service does not provide a reliable price for the security. In instances where broker-dealer bid quotations are not available, certain securities held by the Funds may be valued on the basis of a price provided by a principal market maker. Forward foreign currency contracts are valued utilizing interpolated prices determined from information provided by an independent pricing service. Futures contracts are valued at their most recent settlement price. Short-term obligations purchased with an original or remaining maturity of sixty days or less are valued at amortized cost, which approximates market value. Securities for which market quotations are not readily available are valued at fair value as determined in good faith by the Funds’ investment adviser using consistently applied procedures under the general supervision of the Board of Trustees. Investments in other open-end investment companies are valued at their net asset value each day.
The High Income Opportunities Fund may hold securities traded in foreign markets. Foreign securities are valued at the market price in the foreign market. However, if events occurring after the close of the foreign market (but before the close of regular trading on the New York Stock Exchange) are believed to materially affect the value of those securities, such securities are fair valued pursuant to procedures approved by the Board of Trustees. When fair valuing securities, the Fund may, among other things, use modeling tools or other processes that may take into account factors such as securities market activity and/or significant events that occur after the close of the foreign market and before the Fund calculates its net asset value.
b. Security Transactions and Related Investment Income. Security transactions are accounted for on trade date. Dividend income is recorded on ex-dividend date, or in the case of certain foreign securities, as soon as a Fund is notified, and interest income is recorded on an accrual basis. Interest income is increased by the accretion of discount and decreased by the amortization of premium. Investment income is recorded net of foreign taxes withheld when applicable. In determining net gain or loss on securities sold, the cost of securities has been determined on an identified cost basis.
31
c. Foreign Currency Translation. The books and records of the Funds are maintained in U.S. dollars. The value of securities, currencies and other assets and liabilities denominated in currencies other than U.S. dollars are translated into U.S. dollars based upon foreign exchange rates prevailing at the end of the period. Purchases and sales of investment securities, income and expenses are translated on the respective dates of such transactions.
Since the values of investment securities are presented at the foreign exchange rates prevailing at the end of the period, it is not practical to isolate that portion of the results of operations arising from changes in exchange rates from fluctuations which arise due to changes in market prices of investment securities. Such changes are included with the net realized and unrealized gain or loss on investments.
Net realized foreign exchange gains or losses arise from sales of foreign currency, currency gains or losses realized between the trade and settlement dates on securities transactions and the difference between the amounts of dividends, interest and foreign withholding taxes recorded on the High Income Opportunities Fund’s books and the U.S. dollar equivalent of the amounts actually received or paid. Net unrealized foreign exchange gains and losses arise from changes in the value of assets and liabilities, other than investment securities, at the end of the fiscal period, resulting from changes in exchange rates.
The High Income Opportunities Fund may use foreign currency exchange contracts to facilitate transactions in foreign denominated investments. Losses may arise from changes in the value of the foreign currency or if the counterparties do not perform under the contracts’ terms.
d. Forward Foreign Currency Contracts. The High Income Opportunities Fund may enter into forward foreign currency contracts. Contracts to buy generally are used to acquire exposure to foreign currencies, while contracts to sell generally are used to hedge a Fund’s investments against currency fluctuation. Also, a contract to buy or sell can offset a previous contract. These contracts involve market risk in excess of the unrealized gain or loss reflected in the Fund’s Statements of Assets and Liabilities. The U.S. dollar value of the currencies the Fund has committed to buy or sell represents the aggregate exposure to each currency the Fund has acquired or hedged through currency contracts outstanding at period end. Gains or losses are recorded for financial statement purposes as unrealized until settlement date. Risks may arise upon entering into these contracts from the potential inability of counterparties to meet the terms of their contracts and from unanticipated movements in the value of a foreign currency relative to the U.S. dollar. At September 30, 2009, there were no open forward foreign currency contracts.
e. Futures Contracts. The Funds may enter into futures contracts. Futures contracts are agreements between two parties to buy and sell a particular commodity, instrument or index (e.g., an interest-bearing security) for a specified price on a specified future date.
When a Fund enters into a futures contract, it is required to deposit with (or for the benefit of) its broker as “initial margin” an amount of cash or short-term high-quality securities (such as U.S. Treasury bills or high-quality tax-exempt bonds acceptable to the broker). As the value of the contract changes, the value of the futures contract position increases or declines. Subsequent payments, known as “variation margin”, are made or received by a Fund, depending on the price fluctuations in the fair value of the contract and the value of the collateral held. The aggregate principal amounts of the contracts are not recorded in the financial statements. Fluctuations in the value of the contracts are recorded in the Statement of Assets and Liabilities as an asset (liability) and in the Statement of Operations as unrealized appreciation (depreciation) until the contracts are closed, when they are recorded as realized gains (losses). Realized gain or loss on a futures position is equal to the difference between the value of the contract at the time it was opened and the value at the time it was closed, minus brokerage commissions. When a Fund enters into a futures contract, certain risks may arise, such as illiquidity in the futures market, which may limit a Fund’s ability to close out a futures contract prior to settlement date, and unanticipated movements in the value of securities or interest rates.
Futures contracts are exchange-traded. Exchange-traded futures have standardized contracts and are settled through a clearing house with fulfillment guaranteed by the credit of the exchange. Therefore, counterparty credit risks to the Funds are limited.
f. Federal and Foreign Income Taxes. The Trust treats each Fund as a separate entity for federal income tax purposes. Each Fund intends to meet the requirements of the Internal Revenue Code applicable to regulated investment companies, and to distribute to its shareholders substantially all of its net investment income and any net realized capital gains at least annually. Management has performed an analysis each Fund’s tax positions for the open tax years as of September 30, 2009 and has concluded that no provisions for income tax are required. The Funds’ federal tax returns for the prior three fiscal years remain subject to examination by the Internal Revenue Service. Management is not aware of any events that are reasonably possible to occur in the next twelve months that would result in the amounts of any unrecognized tax benefits significantly increasing or decreasing for the Funds. However, management’s conclusions regarding tax positions taken may be subject to review and adjustment at a later date based on factors including, but not limited to, new tax laws and accounting regulations and interpretations thereof.
32
NOTES TO FINANCIAL STATEMENTS – continued
September 30, 2009
The High Income Opportunities Fund may be subject to foreign taxes on income and gains on investments that are accrued based upon the Fund’s understanding of the tax rules and regulations that exist in the countries in which the Fund invests. Foreign governments may also impose taxes or other payments on investments with respect to foreign securities. Such taxes are accrued as applicable.
g. Dividends and Distributions to Shareholders. Dividends and distributions are recorded on ex-dividend date. The timing and characterization of certain income and capital gain distributions are determined annually in accordance with federal tax regulations, which may differ from accounting principles generally accepted in the United States of America. Permanent differences are primarily due to differing treatments for book and tax purposes for items such as premium amortization, defaulted bonds, distribution redesignations and paydown gains and losses. Permanent book and tax basis differences relating to shareholder distributions will result in reclassifications to capital accounts. Temporary differences between book and tax distributable earnings are primarily due to defaulted bond income accruals, premium amortization accruals, securities lending collateral gain/loss adjustments, wash sales and futures contracts marked to market. Distributions from net investment income and short-term capital gains are considered to be distributed from ordinary income for tax purposes.
The tax characterization of distributions is determined on an annual basis. The tax character of distributions paid to shareholders during the years ended September 30, 2009 and 2008 were as follows:
| | | | | | | | | | | | | | | | | | |
| | | 2009 Distributions Paid From: | | 2008 Distributions Paid From: |
Fund | | Ordinary
Income | | Long-Term
Capital Gains | | Total | | Ordinary
Income | | Long-Term
Capital Gains | | Total |
High Income Opportunities Fund | | $ | 6,616,163 | | $ | 85,792 | | $ | 6,701,955 | | $ | 7,183,035 | | $ | 174,077 | | $ | 7,357,112 |
Securitized Asset Fund | | | 19,285,124 | | | — | | | 19,285,124 | | | 20,848,572 | | | — | | | 20,848,572 |
Differences between these amounts and those reported in the Statements of Changes in Net Assets, if any, are primarily attributable to different book and tax treatment for short-term capital gains.
As of September 30, 2009, the components of distributable earnings on a tax basis were as follows:
| | | | | | | | |
| | | High Income
Opportunities Fund | | | Securitized
Asset Fund | |
Undistributed ordinary income | | $ | 691,197 | | | $ | 6,388,925 | |
Undistributed long-term capital gains | | | — | | | | — | |
| | | | | | | | |
Total undistributed earnings | | | 691,197 | | | | 6,388,925 | |
Capital loss carryforward: | | | | | | | | |
Expires September 30, 2017 | | | (811,815 | ) | | | — | |
Deferred net capital losses (post-October 2008) | | | (6,438,019 | ) | | | (2,470,121 | ) |
Unrealized appreciation (depreciation) | | | (4,654,990 | ) | | | (12,689,663 | ) |
| | | | | | | | |
Total accumulated earnings | | $ | (11,213,627 | ) | | $ | (8,770,859 | ) |
| | | | | | | | |
h. Repurchase Agreements. It is each Fund’s policy that the market value of the collateral for repurchase agreements be at least equal to 100% of the repurchase price, including interest. Certain repurchase agreements are tri-party arrangements whereby the collateral is held in a segregated account for the benefit of the Fund and on behalf of the counterparty. It is each Fund’s policy, regarding tri-party arrangements, that the market value of the collateral be at least equal to 102% of the repurchase price, including interest. Repurchase agreements could involve certain risks in the event of default or insolvency of the counterparty including possible delays or restrictions upon a Fund’s ability to dispose of the underlying securities.
i. Delayed Delivery Commitments. Purchases of when-issued or delayed delivery instruments (identified in the Portfolio of Investments as TBA investments) may have a similar effect on a Fund’s net asset value as if the Fund had created a degree of leverage in its portfolio. The price of the underlying instruments and the date when they will be paid for are fixed at the time the transaction is negotiated. If a Fund enters into such a transaction, collateral consisting of liquid securities or cash and cash equivalents will be maintained in an amount at least equal to the commitment with the custodian and/or broker. Losses may arise due to changes in the market value of the underlying instruments or if the counterparty does not perform under the contract.
33
j. Securities Lending. The Funds have entered into an agreement with State Street Bank and Trust Company (“State Street Bank”), as agent of the Funds, to lend securities to certain designated borrowers. The loans are collateralized with cash or securities in an amount equal to at least 105% or 102% of the market value (including accrued interest) of the loaned international or domestic securities, respectively, when the loan is initiated. Thereafter, the value of the collateral must remain at least 102% of the market value (including accrued interest) of loaned securities for U.S. equities and U.S. corporate debt; at least 105% of the market value (including accrued interest) of loaned securities for non-U.S. equities; and at least 100% of the market value (including accrued interest) of loaned securities for U.S. government securities, sovereign debt issued by non-U.S. governments and non-U.S. corporate debt. In the event that the market value of the collateral falls below the required percentages described above, the borrower will deliver additional collateral on the next business day. As with other extensions of credit, the Funds bear the risk of loss with respect to the investment of the collateral. The Funds invest cash collateral in short-term investments, a portion of the income from which is remitted to the borrowers and the remainder allocated between the Funds and State Street Bank as lending agent.
As of September 30, 2009, there were no securities on loan.
k. Indemnifications. Under the Trust’s organizational documents, its officers and Trustees are indemnified against certain liabilities arising out of the performance of their duties to the Funds. Additionally, in the normal course of business, the Funds enter into contracts with service providers that contain general indemnification clauses. The Funds’ maximum exposure under these arrangements is unknown as this would involve future claims that may be made against the Funds that have not yet occurred. However, based on experience, the Funds expect the risk of loss to be remote.
3. Fair Value Measurements. Effective October 1, 2008, the Funds adopted accounting standards related to fair value measurements and disclosures which establish a hierarchy for which various inputs are used in determining the value of each Fund’s assets or liabilities. These inputs are summarized in the three broad levels listed below:
| | • | | Level 1—quoted prices in active markets for identical assets or liabilities; |
| | • | | Level 2—prices determined using other significant inputs that are observable either directly, or indirectly through corroboration with observable market data (which could include quoted prices for similar assets or liabilities, interest rates, credit risk, etc.); |
| | • | | Level 3—prices determined using significant unobservable inputs for situations where quoted prices or observable inputs are unavailable such as when there is little or no market activity for an asset or liability (unobservable inputs reflect each Fund’s own assumptions in determining the fair value of assets or liabilities and would be based on the best information available). |
The inputs or methodology used for valuing securities are not necessarily an indication of the risk associated with investing in those securities.
The following is a summary of the inputs used to value the Funds’ investments as of September 30, 2009, at value:
High Income Opportunities Fund
Asset Valuation Inputs
| | | | | | | | | | | | |
Description | | Level 1 | | Level 2 | | Level 3 | | Total |
Bonds and Notes | | | | | | | | | | | | |
Non-Convertible Bonds | | | | | | | | | | | | |
ABS Car Loan | | $ | — | | $ | 347,699 | | $ | — | | $ | 347,699 |
ABS Home Equity | | | — | | | 522,085 | | | — | | | 522,085 |
Aerospace & Defense | | | — | | | 965,163 | | | — | | | 965,163 |
Airlines | | | — | | | 1,378,902 | | | 534,446 | | | 1,913,348 |
Automotive | | | — | | | 2,555,255 | | | — | | | 2,555,255 |
Banking | | | — | | | 580,595 | | | — | | | 580,595 |
Building Materials | | | — | | | 793,262 | | | — | | | 793,262 |
Chemicals | | | — | | | 1,344,756 | | | — | | | 1,344,756 |
Collateralized Mortgage Obligations | | | — | | | 910,675 | | | — | | | 910,675 |
Commercial Mortgage-Backed Securities | | | — | | | 1,721,850 | | | 57,083 | | | 1,778,933 |
34
NOTES TO FINANCIAL STATEMENTS – continued
September 30, 2009
High Income Opportunities Fund
Asset Valuation Inputs – continued
| | | | | | | | | | | | |
Description | | Level 1 | | Level 2 | | Level 3 | | Total |
Bonds and Notes – continued | | | | | | | | | | | | |
Non-Convertible Bonds – continued | | | | | | | | | | | | |
Construction Machinery | | $ | — | | $ | 348,000 | | $ | — | | $ | 348,000 |
Consumer Cyclical Services | | | — | | | 165,825 | | | — | | | 165,825 |
Consumer Products | | | — | | | 25,031 | | | — | | | 25,031 |
Electric | | | — | | | 4,882,535 | | | 257,001 | | | 5,139,536 |
Food & Beverage | | | — | | | 1,627,425 | | | — | | | 1,627,425 |
Gaming | | | — | | | 563,975 | | | — | | | 563,975 |
Healthcare | | | — | | | 3,650,049 | | | — | | | 3,650,049 |
Home Construction | | | — | | | 2,683,875 | | | — | | | 2,683,875 |
Independent Energy | | | — | | | 4,330,449 | | | — | | | 4,330,449 |
Industrial Other | | | — | | | 757,250 | | | — | | | 757,250 |
Lodging | | | — | | | 391,963 | | | — | | | 391,963 |
Media Cable | | | — | | | 2,835,287 | | | — | | | 2,835,287 |
Media Non-Cable | | | — | | | 657,150 | | | — | | | 657,150 |
Metals & Mining | | | — | | | 690,195 | | | — | | | 690,195 |
Non-Captive Consumer | | | — | | | 2,012,745 | | | — | | | 2,012,745 |
Non-Captive Diversified | | | — | | | 2,598,037 | | | — | | | 2,598,037 |
Oil Field Services | | | — | | | 1,173,250 | | | — | | | 1,173,250 |
Paper | | | — | | | 2,363,126 | | | — | | | 2,363,126 |
Pharmaceuticals | | | — | | | 1,590,775 | | | — | | | 1,590,775 |
Refining | | | — | | | 536,375 | | | — | | | 536,375 |
Retailers | | | — | | | 2,238,739 | | | — | | | 2,238,739 |
Supermarkets | | | — | | | 1,677,587 | | | — | | | 1,677,587 |
Technology | | | — | | | 4,399,227 | | | 112,500 | | | 4,511,727 |
Textile | | | — | | | 314,500 | | | — | | | 314,500 |
Transportation Services | | | — | | | 550,668 | | | — | | | 550,668 |
Wireless | | | — | | | 2,147,995 | | | — | | | 2,147,995 |
Wirelines | | | — | | | 6,558,697 | | | — | | | 6,558,697 |
| | | | | | | | | | | | |
Total Non-Convertible Bonds | | | — | | | 62,890,972 | | | 961,030 | | | 63,852,002 |
| | | | | | | | | | | | |
Convertible Bonds | | | | | | | | | | | | |
Diversified Manufacturing | | | — | | | 44,250 | | | — | | | 44,250 |
Electric | | | — | | | 377,438 | | | — | | | 377,438 |
Healthcare | | | — | | | 713,400 | | | — | | | 713,400 |
Industrial Other | | | — | | | 160,875 | | | — | | | 160,875 |
Lodging | | | — | | | 399,656 | | | — | | | 399,656 |
Media Non-Cable | | | — | | | 93,407 | | | — | | | 93,407 |
Non-Captive Diversified | | | — | | | 2,500 | | | — | | | 2,500 |
Pharmaceuticals | | | — | | | 405,031 | | | — | | | 405,031 |
REITs | | | — | | | 254,475 | | | — | | | 254,475 |
Technology | | | — | | | 661,575 | | | 99,190 | | | 760,765 |
Wirelines | | | — | | | — | | | 1,074,840 | | | 1,074,840 |
| | | | | | | | | | | | |
Total Convertible Bonds | | | — | | | 3,112,607 | | | 1,174,030 | | | 4,286,637 |
| | | | | | | | | | | | |
Total Bonds and Notes | | | — | | | 66,003,579 | | | 2,135,060 | | | 68,138,639 |
| | | | | | | | | | | | |
Bank Loans(a) | | | — | | | 135,786 | | | — | | | 135,786 |
| | | | | | | | | | | | |
35
| | | | | | | | | | | | |
Description | | Level 1 | | Level 2 | | Level 3 | | Total |
Preferred Stocks | | | | | | | | | | | | |
Automotive | | $ | 187,497 | | $ | — | | $ | — | | $ | 187,497 |
Capital Markets | | | — | | | 202,487 | | | — | | | 202,487 |
Diversified Financial Services | | | — | | | 248,895 | | | — | | | 248,895 |
Electric Utilities | | | — | | | 351,398 | | | — | | | 351,398 |
Hotels, Restaurants & Leisure | | | 1 | | | — | | | — | | | 1 |
Oil, Gas & Consumable Fuels | | | — | | | 269,172 | | | — | | | 269,172 |
Thrifts & Mortgage Finance | | | 36,124 | | | 43,748 | | | — | | | 79,872 |
| | | | | | | | | | | | |
Total Preferred Stocks | | | 223,622 | | | 1,115,700 | | | — | | | 1,339,322 |
| | | | | | | | | | | | |
Common Stocks(a) | | | 263,709 | | | — | | | — | | | 263,709 |
Short-Term Investments | | | 541,771 | | | — | | | — | | | 541,771 |
| | | | | | | | | | | | |
Total | | $ | 1,029,102 | | $ | 67,255,065 | | $ | 2,135,060 | | $ | 70,419,227 |
| | | | | | | | | | | | |
| (a) | Major categories of the Fund’s investments are included in the Portfolio of Investments. |
Securitized Asset Fund
Asset Valuation Inputs
| | | | | | | | | | | | |
Description | | Level 1 | | Level 2 | | Level 3 | | Total |
Bonds and Notes | | | | | | | | | | | | |
ABS Car Loan | | $ | — | | $ | 10,284,933 | | $ | — | | $ | 10,284,933 |
ABS Credit Card | | | — | | | 21,825,598 | | | — | | | 21,825,598 |
ABS Home Equity | | | — | | | 8,371,857 | | | 2,352,830 | | | 10,724,687 |
ABS Other | | | — | | | 3,593,651 | | | 1,570,000 | | | 5,163,651 |
Collateralized Mortgage Obligations | | | — | | | 26,846,858 | | | 1 | | | 26,846,859 |
Commercial Mortgage-Backed Securities | | | — | | | 80,999,960 | | | — | | | 80,999,960 |
Hybrid ARMs | | | — | | | 36,039,340 | | | 136,111 | | | 36,175,451 |
Mortgage Related | | | — | | | 183,794,661 | | | — | | | 183,794,661 |
| | | | | | | | | | | | |
Total Bonds and Notes | | | — | | | 371,756,858 | | | 4,058,942 | | | 375,815,800 |
| | | | | | | | | | | | |
Short-Term Investments | | | 10,010,755 | | | 999,141 | | | — | | | 11,009,896 |
| | | | | | | | | | | | |
Total | | $ | 10,010,755 | | $ | 372,755,999 | | $ | 4,058,942 | | $ | 386,825,696 |
| | | | | | | | | | | | |
Liability Valuation Inputs
| | | | | | | | | | | | | | |
Description | | Level 1 | | | Level 2 | | Level 3 | | Total | |
Futures contracts (unrealized depreciation) | | $ | (300,688 | ) | | $ | — | | $ | — | | $ | (300,688 | ) |
| | | | | | | | | | | | | | |
36
High Income Opportunities Fund
Asset Valuation Inputs – continued
NOTES TO FINANCIAL STATEMENTS – continued
September 30, 2009
The following is a reconciliation of Level 3 investments for which significant unobservable inputs were used to determine fair value as of September 30, 2009:
High Income Opportunities Fund
Asset Valuation Inputs
| | | | | | | | | | | | | | | | | | | | | | | | | |
Investments in Securities | | Balance as of
September 30,
2008 | | Accrued
Discounts
(Premiums) | | Realized
Gain
(Loss) | | | Change in
Unrealized
Appreciation
(Depreciation) | | | Net
Purchases
(Sales) | | | Net
Transfers
in/(out)
Level 3 | | | Balance as of
September 30,
2009 |
Bonds and Notes | | | | | | | | | | | | | | | | | | | | | | | | | |
Non-Convertible Bonds | | | | | | | | | | | | | | | | | | | | | | | | | |
Airlines | | $ | 334,800 | | $ | — | | $ | — | | | $ | 168,303 | | | $ | (93,856 | ) | | $ | 125,199 | | | $ | 534,446 |
Chemicals | | | 452,250 | | | 2,328 | | | — | | | | (79,109 | ) | | | — | | | | (375,469 | ) | | | — |
Commercial Mortgage-Backed Securities | | | — | | | — | | | 489 | | | | — | | | | 56,594 | | | | — | | | | 57,083 |
Electric | | | — | | | — | | | — | | | | 7,121 | | | | 249,880 | | | | — | | | | 257,001 |
Industrial Other | | | 74,400 | | | — | | | — | | | | 49,600 | | | | — | | | | (124,000 | ) | | | — |
Media Non-Cable | | | 140,100 | | | 6,308 | | | (294,513 | ) | | | 222,743 | | | | (74,638 | ) | | | — | | | | — |
Technology | | | 428,400 | | | 2,444 | | | — | | | | 113,256 | | | | 85,000 | | | | (516,600 | ) | | | 112,500 |
Convertible Bonds | | | | | | | | | | | | | | | | | | | | | | | | | |
Healthcare | | | 22,500 | | | 272 | | | — | | | | 11,504 | | | | (34,276 | ) | | | — | | | | — |
Technology | | | — | | | 1,614 | | | 901 | | | | (2,485 | ) | | | (14,000 | ) | | | 113,160 | | | | 99,190 |
Wirelines | | | — | | | 771 | | | — | | | | 80,349 | | | | 993,720 | | | | — | | | | 1,074,840 |
| | | | | | | | | | | | | | | | | | | | | | | | | |
Total | | $ | 1,452,450 | | $ | 13,737 | | $ | (293,123 | ) | | $ | 571,282 | | | $ | 1,168,424 | | | $ | (777,710 | ) | | $ | 2,135,060 |
| | | | | | | | | | | | | | | | | | | | | | | | | |
Securitized Asset Fund
Asset Valuation Inputs
| | | | | | | | | | | | | | | | | | | | | | | | | |
Investments in Securities | | Balance as of
September 30,
2008 | | Accrued
Discounts
(Premiums) | | Realized
Gain
(Loss) | | | Change in
Unrealized
Appreciation
(Depreciation) | | | Net
Purchases
(Sales) | | | Net
Transfers
in/(out)
Level 3 | | | Balance as of
September 30,
2009 |
Bonds and Notes | | | | | | | | | | | | | | | | | | | | | | | | | |
Non-Convertible Bonds | | | | | | | | | | | | | | | | | | | | | | | | | |
ABS Credit Card | | $ | 1,574,048 | | $ | — | | $ | (125,967 | ) | | $ | 353,719 | | | $ | (1,801,800 | ) | | $ | — | | | $ | — |
ABS Home Equity | | | 2,250,010 | | | — | | | (129,997 | ) | | | (2,374,299 | ) | | | 419,410 | | | | 2,187,706 | | | | 2,352,830 |
ABS Other | | | — | | | — | | | — | | | | 202 | | | | 1,569,798 | | | | — | | | | 1,570,000 |
Collateralized Mortgage Obligations | | | 3,431,418 | | | — | | | (252,851 | ) | | | 293,094 | | | | (717,251 | ) | | | (2,754,409 | ) | | | 1 |
Hybrid ARMs | | | — | | | — | | | 153 | | | | (300,116 | ) | | | (89,138 | ) | | | 525,212 | | | | 136,111 |
| | | | | | | | | | | | | | | | | | | | | | | | | |
Total | | $ | 7,255,476 | | $ | — | | $ | (508,662 | ) | | $ | (2,027,400 | ) | | $ | (618,981 | ) | | $ | (41,491 | ) | | $ | 4,058,942 |
| | | | | | | | | | | | | | | | | | | | | | | | | |
4. Derivatives. Effective April 1, 2009, the Funds adopted accounting standards related to derivative instruments and hedging activities which require enhanced disclosures. Derivative instruments are defined as financial instruments whose value and performance are based on the value and performance of another security or financial instrument. Derivative instruments that the Funds may use include futures contracts.
The Funds are subject to the risk that changes in interest rates will affect the value of the Funds’ investments in fixed income securities. The Funds will be subject to increased interest rate risk to the extent that they invest in fixed-income securities with longer maturities or durations, as compared to investing in fixed-income securities with shorter maturities or durations. The Funds may use futures contracts to manage the Funds’ duration in order to control interest rate risk without having to buy or sell portfolio securities. Securitized Asset Fund engaged in futures contract transactions during the year ended September 30, 2009.
37
The following is a summary of derivative instruments for Securitized Asset Fund, as of September 30, 2009:
| | |
Liability Derivatives | | Futures |
Interest rate contracts | | $(300,688) |
Statement of Assets and Liabilities Location | | Cumulative appreciation/depreciation on futures contracts is reflected above. Only the current day’s variation margin is reported within the Statements of Assets and Liabilities |
Transactions in derivative instruments during the period from April 1, 2009 to September 30, 2009, were as follows:
| | |
Realized Gain (Loss) | | Futures |
Interest rate contracts | | $(90,798) |
Statement of Operations Location | | Net realized gain (loss) on futures contracts |
| |
Change in Unrealized Appreciation
(Depreciation) | | Futures |
Interest rate contracts | | $291,641 |
Statement of Operations Location | | Net change in unrealized appreciation/ depreciation on futures contracts |
Volume of derivative activity for Securitized Asset Fund, based on month-end notional amounts outstanding during the period from April 1, 2009 to September 30, 2009, were as follows:
| | |
Securitized Asset Fund | | Percentage of
Net Assets
Futures |
Average Notional Amount Outstanding | | 8.41% |
Highest Notional Amount Outstanding | | 8.79% |
Lowest Notional Amount Outstanding | | 8.17% |
Notional Amount Outstanding as of September 30, 2009 | | 8.23% |
Notional amounts outstanding are at absolute value and are determined, when applicable, by netting notional amounts of contracts to buy and sell the same underlying instrument.
5. Purchases and Sales of Securities. For the year ended September 30, 2009, purchases and sales of securities (excluding short-term investments and including paydowns) were as follows:
| | | | | | | | | | | | |
| | | U.S. Government/Agency Securities | | Other Securities |
Fund | | Purchases | | Sales | | Purchases | | Sales |
High Income Opportunities Fund | | $ | — | | $ | — | | $ | 19,860,024 | | $ | 24,654,109 |
Securitized Asset Fund | | | 1,612,670,675 | | | 1,773,353,320 | | | 5,121,191 | | | 59,047,010 |
6. Management Fees and Other Transactions with Affiliates.
a. Management Fees. Loomis Sayles has agreed to pay, without reimbursement from the Funds or the Trust, the following expenses of the Funds: compensation to Trustees of the Trust who are not “interested persons” (as defined in the 1940 Act) of the Trust; registration, filing and other fees in connection with requirements of regulatory authorities; the charges and expenses of any entity appointed by the Funds for custodial, paying agent, shareholder servicing and plan agent services; charges and expenses of the independent registered public accounting firm retained by the Funds; charges and expenses of any transfer agents and registrars appointed by the Funds; any cost of certificates representing shares of the Funds; legal fees and expenses in connection with the day-to-day affairs of the Funds, including registering and qualifying its shares with Federal and State regulatory authorities; expenses of meetings of shareholders and Trustees of the Trust; the costs of services, including services of counsel, required in connection with the preparation of the Funds’ registration statements and prospectuses, including amendments and revisions thereto, annual, semi-annual and other periodic reports of the Funds, and notices and proxy solicitation material furnished to shareholders of the Funds or regulatory authorities, and any costs of printing or mailing these items; and the Funds’ expenses of bookkeeping, accounting and financial reporting, including related clerical expenses.
38
NOTES TO FINANCIAL STATEMENTS – continued
September 30, 2009
Loomis Sayles serves as investment adviser to each Fund. Under the terms of each management agreement, Loomis Sayles does not charge the Funds an investment advisory fee, also known as a management fee, or any other fee for those services or for bearing those expenses. Although the Funds do not compensate Loomis Sayles directly for services under the advisory agreement, Loomis Sayles will typically receive an advisory fee from the sponsors of “wrap programs,” who in turn charge the programs’ participants.
Certain officers and employees of Loomis Sayles are also officers or Trustees of the Trust. Loomis Sayles’ general partner is indirectly owned by Natixis Global Asset Management, L.P. (“Natixis US”), which is part of Natixis Global Asset Management, an international asset management group based in Paris, France.
b. Administrative Fees. Natixis Advisors provides certain administrative services for the Funds and contracts with State Street Bank to serve as sub-administrator. Natixis Advisors is a wholly-owned subsidiary of Natixis US. Loomis Sayles has agreed to pay, without reimbursement from the Trust or Funds, fees to Natixis Advisors for services to the Funds.
c. Service and Distribution Fees. The Trust has entered into a distribution agreement with Natixis Distributors, L.P. (“Natixis Distributors”), a wholly-owned subsidiary of Natixis US. Pursuant to this agreement, Natixis Distributors serves as principal underwriter of the Funds. Natixis Distributors currently is not paid a fee for serving as distributor for the Funds. Loomis Sayles has agreed to reimburse Natixis Distributors to the extent that Natixis Distributors incurs expenses in connection with any redemption of Fund shares.
d. Trustees Fees and Expenses. The Funds do not pay any compensation directly to their officers or Trustees who are directors, officers or employees of Natixis Advisors, Natixis Distributors, Natixis US, or their affiliates. The Chairperson of the Board receives a retainer fee at the annual rate of $200,000. The Chairperson does not receive any meeting attendance fees for Board of Trustees meetings or committee meetings that she attends. Each Independent Trustee (other than the Chairperson) receives, in the aggregate, a retainer fee at the annual rate of $65,000. Each Independent Trustee also receives a meeting attendance fee of $7,500 for each meeting of the Board of Trustees that he or she attends in person and $3,750 for each meeting of the Board of Trustees that he or she attends telephonically. In addition, each committee chair receives an additional retainer fee at the annual rate of $10,000. Each Contract Review and Governance Committee member is compensated $5,000 for each Committee meeting that he or she attends in person and $2,500 for each meeting that he or she attends telephonically. Each Audit Committee member is compensated $6,250 for each Committee meeting that he or she attends in person and $3,125 for each meeting that he or she attends telephonically. These fees are allocated among the funds in Natixis Funds Trust I, Natixis Funds Trust II, Natixis Funds Trust III, Natixis Funds Trust IV, Natixis Cash Management Trust, Gateway Trust (“Natixis Funds Trusts”), Loomis Sayles Funds I, Loomis Sayles Funds II (“Loomis Sayles Funds Trusts”) and the Hansberger International Series based on a formula that takes into account, among other factors, the relative net assets of each Fund. Trustees are reimbursed for travel expenses in connection with attendance at meetings. Loomis Sayles has agreed to pay the pro rata portion of Trustees fees and expenses for each Fund, without reimbursement from the Trust or Funds.
7. Line of Credit. Each Fund, together with certain other funds of Natixis Funds Trusts, Loomis Sayles Funds Trusts and the Hansberger International Series, participates in a $200,000,000 committed unsecured line of credit provided by State Street Bank, with an individual limit of $125,000,000 for each fund that participates in the line of credit. Interest is charged to each participating fund based on its borrowings at a rate per annum equal to the greater of the Federal Funds rate or overnight LIBOR, plus 0.75%. In addition, a commitment fee of 0.125% per annum, payable at the end of each calendar quarter, is accrued and apportioned among the participating funds based on their average daily unused portion of the line of credit.
Prior to March 11, 2009, each Fund, together with certain other funds of Natixis Funds Trusts, Loomis Sayles Funds Trusts and Hansberger International Series, participated in a $200,000,000 committed unsecured line of credit provided by State Street Bank, with an individual limit of $125,000,000 for each fund that participated in the line of credit. Interest was charged to each participating fund based on its borrowings at a rate per annum equal to the Federal Funds rate plus 0.50%. In addition, a commitment fee of 0.09% per annum, payable at the end of each calendar quarter, was accrued and apportioned among the participating funds based on their average daily unused portion of the line of credit.
For the year ended September 30, 2009, the Funds had no borrowings under these agreements.
8. Shareholders. At September 30, 2009, five shareholders individually owned more than 5% of the High Income Opportunities Fund’s total outstanding shares, representing in aggregate, 49.41% of the Fund.
39
9. Capital Shares. Each Fund may issue an unlimited number of shares of beneficial interest, without par value. Transactions in capital shares were as follows:
| | | | | | | | | | | | | | |
| | | High Income Opportunities Fund | |
| | |
| | | Year Ended September 30, 2009 | | | Year Ended September 30, 2008 | |
| | | | |
| | | Shares | | | Amount | | | Shares | | | Amount | |
Issued from the sale of shares | | 2,086,936 | | | $ | 14,390,117 | | | 1,980,419 | | | $ | 19,260,155 | |
Issued in connection with the reinvestment of distributions | | 644,493 | | | | 4,654,487 | | | 380,809 | | | | 3,709,039 | |
Redeemed | | (2,683,261 | ) | | | (19,696,043 | ) | | (2,571,913 | ) | | | (23,284,030 | ) |
| | | | | | | | | | | | | | |
Increase (decrease) from capital share transactions | | 48,168 | | | $ | (651,439 | ) | | (210,685 | ) | | $ | (314,836 | ) |
| | | | | | | | | | | | | | |
| |
| | | Securitized Asset Fund | |
| | |
| | | Year Ended September 30, 2009 | | | Year Ended September 30, 2008 | |
| | | | |
| | | Shares | | | Amount | | | Shares | | | Amount | |
Issued from the sale of shares | | 8,990,651 | | | $ | 82,673,361 | | | 14,774,496 | | | $ | 146,455,592 | |
Issued in connection with the reinvestment of distributions | | 97,452 | | | | 860,439 | | | 20,764 | | | | 205,641 | |
Redeemed | | (20,298,880 | ) | | | (185,250,822 | ) | | (9,456,660 | ) | | | (93,767,437 | ) |
| | | | | | | | | | | | | | |
Increase (decrease) from capital share transactions | | (11,210,777 | ) | | $ | (101,717,022 | ) | | 5,338,600 | | | $ | 52,893,796 | |
| | | | | | | | | | | | | | |
40
REPORT OF INDEPENDENT REGISTERED PUBLIC ACCOUNTING FIRM
To the Trustees of Loomis Sayles Funds I and Shareholders of Loomis Sayles High Income Opportunities Fund
and Loomis Sayles Securitized Asset Fund:
In our opinion, the accompanying statements of assets and liabilities, including the portfolios of investments, and the related statements of operations and of changes in net assets and the financial highlights present fairly, in all material respects, the financial position of the Loomis Sayles High Income Opportunities Fund and Loomis Sayles Securitized Asset Fund, each a series of Loomis Sayles Funds I (collectively, the “Funds”), at September 30, 2009, and the results of each of their operations, the changes in each of their net assets and the financial highlights for each of the periods indicated, in conformity with accounting principles generally accepted in the United States of America. These financial statements and financial highlights (hereafter referred to as “financial statements”) are the responsibility of the Funds’ management; our responsibility is to express an opinion on these financial statements based on our audits. We conducted our audits of these financial statements in accordance with the standards of the Public Company Accounting Oversight Board (United States). Those standards require that we plan and perform the audits to obtain reasonable assurance about whether the financial statements are free of material misstatement. An audit includes examining, on a test basis, evidence supporting the amounts and disclosures in the financial statements, assessing the accounting principles used and significant estimates made by management, and evaluating the overall financial statement presentation. We believe that our audits, which included confirmation of securities at September 30, 2009 by correspondence with the custodian and brokers, provide a reasonable basis for our opinion.
PricewaterhouseCoopers LLP
Boston, Massachusetts
November 23, 2009
41
2009 U.S. TAX DISTRIBUTION INFORMATION TO SHAREHOLDERS (Unaudited)
Corporate Dividends Received Deduction. For the fiscal year ended September 30, 2009, a percentage of dividends distributed by the Fund listed below qualify for the dividends received deduction for corporate shareholders. These percentages are as follows:
| | |
Fund | | Qualifying Percentage |
High Income Opportunities | | 1.25% |
Capital Gains Distributions. Pursuant to Internal Revenue Section 852(b), the following Fund paid distributions, which have been designated as capital gains distributions for the fiscal year ended September 30, 2009, unless subsequently determined to be different.
| | | |
Fund | | Amount |
High Income Opportunities | | $ | 85,792 |
Qualified Dividend Income. For the fiscal year ended September 30, 2009, the Fund below will designate up to the maximum amount allowable pursuant to the Internal Revenue Code as qualified dividend income eligible for reduced tax rates. These lower rates range from 0% to 15% depending on an individual’s tax bracket. If the Fund pays a distribution during calendar year 2009, complete information will be reported in conjunction with Form 1099-DIV.
| | |
Fund | | |
High Income Opportunities | | |
42
TRUSTEE AND OFFICER INFORMATION
The tables below provide certain information regarding the Trustees and officers of Loomis Sayles Funds I (the “Trust”). Unless otherwise indicated, the address of all persons below is 399 Boylston Street, Boston, MA 02116. The Trust’s Statements of Additional Information include additional information about the Trustees of the Trust and are available by calling Loomis Sayles Funds at 800-633-3330.
| | | | | | |
| Name and Year of Birth | | Position(s)
Held with
the Trust, Length
of Time Served and
Term of Office* | | Principal Occupation(s)
During Past 5 Years** | | Number of Portfolios in Fund
Complex Overseen*** and
Other Directorships Held |
| | | |
Independent Trustees | | | | | | |
Graham T. Allison, Jr. (1940) | | Trustee Since 2003 Contract Review and Governance Committee Member | | Douglas Dillon Professor and Director of the Belfer Center for Science and International Affairs, John F. Kennedy School of Government, Harvard University | | 39 Director, Taubman Centers, Inc. (real estate investment trust) |
| | | |
Charles D. Baker (1956) | | Trustee Since 2005 Contract Review and Governance Committee Member | | Formerly, President and Chief Executive Officer, Harvard Pilgrim Health Care (health plan) | | 39 None |
| | | |
Edward A. Benjamin (1938) | | Trustee Since 2002 Chairman of the Contract Review and Governance Committee | | Retired | | 39 None |
| | | |
Daniel M. Cain (1945) | | Trustee Since 2003 Chairman of the Audit Committee | | Chairman (formerly, President and Chief Executive Officer) of Cain Brothers & Company, Incorporated (investment banking) | | 39 Director, Sheridan Healthcare Inc. (physician practice management) |
| | | |
Kenneth A. Drucker (1945) | | Trustee Since 2008 Audit Committee Member | | Formerly, Treasurer, Sequa Corp. (manufacturing) | | 39 None |
| | | |
Wendell J. Knox**** (1948) | | Trustee Since 2009 Contract Review and Governance Committee Member | | Director (formerly, President and Chief Executive Officer) of Abt Associates Inc. (research and consulting) | | 39 Director, Eastern Bank (commercial bank); Director, The Hanover Insurance Group (property and casualty insurance) |
| | | |
Sandra O. Moose (1942) | | Chairperson of the Board of Trustees since November 2005 Trustee Since 2003 Ex officio member of the Audit Committee and Contract Review and Governance Committee | | President, Strategic Advisory Services (management consulting); formerly, Senior Vice President and Director, The Boston Consulting Group, Inc. (management consulting) | | 39 Director, Verizon Communications; Director, AES Corporation (international power company) |
| | | |
Cynthia L. Walker (1956) | | Trustee Since 2005 Audit Committee Member | | Deputy Dean for Finance and Administration, Yale University School of Medicine; formerly, Executive Dean for Administration, Harvard Medical School; and formerly, Dean for Finance and Chief Financial Officer, Harvard Medical School | | 39 None |
43
| | | | | | |
| Name and Year of Birth | | Position(s)
Held with
the Trust, Length
of Time Served and
Term of Office* | | Principal Occupation(s)
During Past 5 Years** | | Number of Portfolios in Fund
Complex Overseen*** and
Other Directorships Held |
| | | |
Interested Trustees | | | | | | |
Robert J. Blanding1 (1947) 555 California Street San Francisco, CA 94104 | | Trustee Since 2002 President and Chief Executive Officer since 2002 | | President, Chairman, Director and Chief Executive Officer, Loomis, Sayles & Company, L.P. | | 39 None |
| | | |
John T. Hailer2 (1960) | | Trustee Since 2003 | | President and Chief Executive Officer-U.S. and Asia, Natixis Global Asset Management, L.P.; formerly, President and Chief Executive Officer, Natixis Distribution Corporation, Natixis Asset Management Advisors, L.P., Natixis Distributors, L.P. and Natixis Global Associates, Inc. | | 39 None |
| * | Each Trustee serves until retirement, resignation or removal from the Board of Trustees. The current retirement age is 72. The position of Chairperson of the Board is appointed for a two-year term. Ms. Moose was appointed to serve an additional two-year term as the Chairperson of the Board of Trustees on September 14, 2007. |
| ** | Each person listed above, except as noted, holds the same position(s) with the Natixis Funds Trust I, Natixis Funds Trust II, Natixis Funds Trust III, Natixis Funds Trust IV, Gateway Trust and the Natixis Cash Management Trust (collectively, the “Natixis Funds Trusts”), Loomis Sayles Funds I and Loomis Sayles Funds II (collectively, the “Loomis Sayles Funds Trusts”), and Hansberger International Series. Previous positions during the past five years with Natixis Distributors, L.P. (the “Distributor”), Natixis Asset Management Advisors, L.P. (“Natixis Advisors”), or Loomis, Sayles & Company, L.P. (“Loomis Sayles”) are omitted if not materially different from a Trustee’s or officer’s current position with such entity. |
| *** | The Trustees of the Trust serve as trustees of a fund complex that includes all series of the Natixis Funds Trusts, the Loomis Sayles Funds Trusts and Hansberger International Series (collectively, the “Fund Complex”). |
| **** | Mr. Knox was appointed as trustee effective July 1, 2009. |
| 1 | Mr. Blanding is deemed an “interested person” of the Trust because he holds the following positions with an affiliated person of the Trust: President, Chairman, Director and Chief Executive Officer of Loomis Sayles. |
| 2 | Mr. Hailer is deemed an “interested person” of the Trust because he holds the following positions with an affiliated person of the Trust: President and Chief Executive Officer-U.S. and Asia, Natixis Global Asset Management, L.P. |
| | | | | | |
| Name and Year of Birth | | Position(s)
Held with
the Trust | | Term of Office* and
Length of Time Served | | Principal Occupation During
Past 5 Years** |
| | | |
Officers of the Trust | | | | | | |
Coleen Downs Dinneen (1960) | | Secretary, Clerk and Chief Legal Officer | | Since September 2004 | | Executive Vice President, General Counsel, Secretary and Clerk (formerly, Senior Vice President, Deputy General Counsel, Assistant Secretary and Assistant Clerk), Natixis Distribution Corporation, Natixis Asset Management Advisors, L.P. and Natixis Distributors, L.P. |
| | | |
Daniel J. Fuss (1933) One Financial Center Boston, MA 02111 | | Executive Vice President | | Since June 2003 | | Vice Chairman and Director, Loomis, Sayles & Company, L.P. |
| | | |
David Giunta (1965) | | Executive Vice President | | Since March 2008 | | President and Chief Executive Officer, Natixis Distribution Corporation, Natixis Asset Management Advisors, L.P. and Natixis Distributors, L.P.; formerly, President, Fidelity Charitable Gift Fund; and formerly, Senior Vice President, Fidelity Brokerage Company |
44
| | | | | | |
| Name and Year of Birth | | Position(s)
Held with
the Trust | | Term of Office* and
Length of Time Served | | Principal Occupation During
Past 5 Years** |
Russell L. Kane (1969) | | Chief Compliance Officer, Assistant Secretary and Anti-Money Laundering Officer | | Chief Compliance Officer since May 2006; Assistant Secretary since June 2004; and Anti-Money Laundering Officer since April 2007 | | Chief Compliance Officer for Mutual Funds, Senior Vice President, Deputy General Counsel, Assistant Secretary and Assistant Clerk, Natixis Distribution Corporation, Natixis Asset Management Advisors, L.P. and Natixis Distributors, L.P. |
| | | |
Michael C. Kardok (1959) | | Treasurer, Principal Financial and Accounting Officer | | Since October 2004 | | Senior Vice President, Natixis Asset Management Advisors, L.P. and Natixis Distributors, L.P. |
| * | Each officer of the Trust serves for an indefinite term in accordance with the Trust’s current By-laws until the date his or her successor is elected and qualified, or until he or she sooner dies, retires, is removed or becomes disqualified. |
| ** | Each person listed above, except as noted, holds the same position(s) with the Fund Complex. Mr. Fuss is not an officer of the Natixis Funds Trusts or the Hansberger International Series. Previous positions during the past five years with the Distributor, Natixis Advisors or Loomis Sayles are omitted if not materially different from a Trustee’s or officer’s current position with such entity. |
45
The Registrant has adopted a code of ethics that applies to the Registrant’s principal executive officer, principal financial officer and persons performing similar functions.
| Item 3. | Audit Committee Financial Expert. |
The Board of Trustees of the Registrant has established an audit committee. Ms. Cynthia L. Walker, Mr. Daniel M. Cain and Mr. Kenneth A. Drucker are members of the audit committee and have been designated as “audit committee financial experts” by the Board of Trustees. Each of these individuals is also an Independent Trustee of the Registrant.
| Item 4. | Principal Accountant Fees and Services. |
Fees billed by the Principal Accountant for services rendered to the Registrant.
The table below sets forth fees billed by the principal accountant, PricewaterhouseCoopers LLP, for the past two fiscal years for professional services rendered in connection with a) the audit of the Registrant’s annual financial statements and services provided in connection with regulatory filings; b) audit-related services (including services that are reasonably related to the performance of the audit of the Registrant’s financial statements and but not reported under “Audit Fees”); c) tax compliance, tax advice and tax planning and d) all other fees billed for professional services rendered by the principal accountant to the Registrant, other than the services reported as a part of (a) through (c) of this Item.
| | | | | | | | | | | | | | | | | | | | | | | | |
| | | Audit fees | | Audit-related fees1 | | Tax fees2 | | All other fees |
| | | 2008 | | 2009 | | 2008 | | 2009 | | 2008 | | 2009 | | 2008 | | 2009 |
Loomis Sayles Funds I | | $ | 352,741 | | $ | 352,882 | | $ | 17,960 | | $ | 4,741 | | $ | 112,821 | | $ | 96,509 | | $ | — | | $ | — |
| 1. | Audit-related fees consist of: |
2008 - performance of agreed-upon procedures related to the Registrant’s deferred compensation plan and services related to the implementation of a new accounting standard.
2009 - performance of agreed-upon procedures related to the Registrant’s deferred compensation plan.
2008 - review of year-end shareholder reporting and the Registrant’s tax returns.
2009 - review of Registrant’s tax returns and consulting services with respect to new security types.
Aggregate fees billed to the Registrant for non-audit services during 2008 and 2009 were $130,781 and $101,250, respectively.
Fees billed by the Principal Accountant for services rendered to the Adviser and Control Affiliates.
The following table sets forth the non-audit services provided by the Registrant’s principal accountant to Loomis, Sayles & Company, L.P. and entities controlling, controlled by or under common control with Loomis, Sayles & Company, L.P. that provide ongoing services to the Registrant (“Control Affiliates”) for the last two fiscal years.
| | | | | | | | | | | | | | | | | | |
| | | Audit-related fees | | Tax fees | | All other fees |
| | | 2008 | | 2009 | | 2008 | | 2009 | | 2008 | | 2009 |
Control Affiliates | | $ | 12,000 | | $ | 12,000 | | $ | — | | $ | 6,500 | | $ | — | | $ | — |
Aggregate fees billed to Control Affiliates for non-audit services during 2008 and 2009 were $12,000 and $18,500, respectively.
None of the audit-related, tax and other services provided by the Registrant’s principal accountant were approved by the Audit Committee pursuant to paragraph (c)(7)(i)(C) of Rule 2-01 of Regulation S-X.
Audit Committee Pre Approval Policies.
Annually, the Registrant’s Audit Committee reviews the audit, audit-related, tax and other non-audit services together with the projected fees, for services proposed to be rendered to the Trust and/or other entities for which pre-approval is required during the upcoming year. Any subsequent revisions to already pre-approved services or fees (including fee increases) and requests for pre-approval of new services would be presented for consideration quarterly as needed.
If, in the opinion of management, a proposed engagement by the Registrant’s independent accountants needs to commence before the next regularly scheduled Audit Committee meeting, any member of the Audit Committee who is an independent Board member is authorized to pre-approve the engagement, but only for engagements to provide audit, audit related and tax services. This approval is subject to review of the full Audit Committee at its next quarterly meeting. All other engagements require the approval of all the members of the Audit Committee.
| Item 5. | Audit Committee of Listed Registrants. |
Not applicable.
| Item 6. | Schedule of Investments. |
Included as part of the Report to Shareholders filed as Item 1 herewith.
| Item 7. | Disclosure of Proxy Voting Policies and Procedures for Closed-End Management Investment Companies. |
Not applicable.
| Item 8. | Portfolio Managers of Closed-End Management Investment Companies |
Not applicable.
| Item 9. | Purchases of Equity Securities by Closed-End Management Investment Companies and Affiliated Purchasers. |
Not applicable.
| Item 10. | Submission of Matters to a Vote of Securities Holders. |
There were no material changes to the procedures by which shareholders may recommend nominees to the Registrant’s Board of Trustees.
| Item 11. | Controls and Procedures. |
The Registrant’s principal executive officer and principal financial officer have concluded that the Registrant’s disclosure controls and procedures are sufficient to ensure that information required to be disclosed by the Registrant in this Form N-CSR was recorded, processed, summarized and reported within the time periods specified in the Securities and Exchange Commission’s rules and forms, based upon such officers’ evaluation of these controls and procedures as of a date within 90 days of the filing date of the report.
There were no changes in the Registrant’s internal control over financial reporting that occurred during the Registrant’s last fiscal quarter of the period covered by the report that has materially affected, or is reasonably likely to materially affect, the Registrant’s internal control over financial reporting.
| | | | |
| (a) | | (1) | | Code of Ethics required by Item 2 hereof, filed herewith as Exhibit (a)(1). |
| | |
| (a) | | (2) | | Certifications of Principal Executive Officer and Principal Financial Officer pursuant to Rule 30a-2(a) under the Investment Company Act of 1940 (17 CFR 270.30a-2(a)), filed herewith as Exhibits (a)(2)(1) and (a)(2)(2), respectively. |
| | |
| (a) | | (3) | | Not applicable. |
| | |
| (b) | | | | Certification of Principal Executive Officer and Principal Financial Officer pursuant to Section 906 of Sarbanes-Oxley Act of 2002 are filed herewith as Exhibit (b). |
SIGNATURES
Pursuant to the requirements of the Securities Exchange Act of 1934 and the Investment Company Act of 1940, the Registrant has duly caused this report to be signed on its behalf by the undersigned, thereunto duly authorized.
| | |
| Loomis Sayles Funds I |
| |
| By: | | /s/ ROBERT J. BLANDING |
| Name: | | Robert J. Blanding |
| Title: | | President and Chief Executive Officer |
| Date: | | November 23, 2009 |
Pursuant to the requirements of the Securities Exchange Act of 1934 and the Investment Company Act of 1940, this report has been signed by the following persons on behalf of the Registrant and in the capacities and on the dates indicated.
| | |
| By: | | /s/ ROBERT J. BLANDING |
| Name: | | Robert J. Blanding |
| Title: | | President and Chief Executive Officer |
| Date: | | November 23, 2009 |
| |
| By: | | /s/ MICHAEL C. KARDOK |
| Name: | | Michael C. Kardok |
| Title: | | Treasurer |
| Date: | | November 23, 2009 |