UNITED STATES
SECURITIES AND EXCHANGE COMMISSION
Washington, D.C. 20549
FORM N-CSR
CERTIFIED SHAREHOLDER REPORT OF REGISTERED
MANAGEMENT INVESTMENT COMPANIES
Investment Company Act file number: 811-08282
Loomis Sayles Funds I
(Exact name of Registrant as specified in charter)
|
| 399 Boylston Street, Boston, Massachusetts 02116 |
| (Address of principal executive offices) (Zip code) |
Russell L. Kane, Esq.
NGAM Distribution, L.P.
399 Boylston Street
Boston, Massachusetts 02116
(Name and address of agent for service)
Registrant’s telephone number, including area code: (617) 449-2822
Date of fiscal year end: September 30
Date of reporting period: September 30, 2016
| Item 1. | Reports to Stockholders. |
The Registrant’s annual report transmitted to shareholders pursuant to Rule 30e-1 under the Investment Company Act of 1940 is as follows:

Loomis Sayles Small Cap Growth Fund
Loomis Sayles Small Cap Value Fund
Loomis Sayles Small/Mid Cap Growth Fund
Annual Report
September 30, 2016
LOOMIS SAYLES SMALL CAP GROWTH FUND
| | | | |
| Managers | | Symbols | | |
| Mark F. Burns, CFA® | | Institutional Class | | LSSIX |
| John J. Slavik, CFA® | | Retail Class | | LCGRX |
| | Class N | | LSSNX |
Investment Objective
The Fund’s investment objective is long-term capital growth from investments in common stocks or other equity securities.
Market Conditions
Overall, U.S. equity markets were generally strong for the 12-month period, benefiting from the robust performance off the market bottom in February 2016 and following the two-day Brexit vote-inspired selloff in June. Within the small-cap segment of the market, the smallest companies and the lowest-quality companies (as measured by return on equity) were the strongest performers in the February market rebound. The third quarter of 2016 was a particularly challenging market environment for the fund, as the highest beta (high risk/high reward potential) names significantly outperformed the lowest beta names. Among small-cap stocks, value stocks significantly outperformed growth stocks.
Performance Results
For the 12 months ended September 30, 2016, Institutional Class shares of Loomis Sayles Small Cap Growth Fund returned 6.92%. The fund underperformed its benchmark, the Russell 2000® Growth Index, which returned 12.12%.
Explanation of Fund Performance
Stock selection in the information technology, industrials and healthcare sectors primarily accounted for the fund’s underperformance. Given the fund’s strategy, the market environment during the third quarter of 2016 created a significant headwind.
In terms of individual holdings, the top contributor to fund performance was financials company MarketAxess Holdings. The company continued to steadily gain market share in electronic bond trading, and its earnings grew. In addition, the company remains significantly underpenetrated in the fixed-income market, its biggest market opportunity. In 2016, MarketAxess launched electronic trading for municipal bonds, a market no other firm has been able to penetrate electronically. Following two years of increased investments, MarketAxess is now leveraging those efforts and generating robust incremental margins.
Wix.com, a website development company for small and medium businesses, also was a top-performing holding. The company demonstrated consistently strong revenue growth by converting free users to paid subscribers and retaining their business. The mid-year release of its Artificial Design Intelligence (ADI) platform generated a lot of excitement as an even easier and more intuitive way to create a website, and it’s positioned to aid
1 |
conversion in the future. Another top contributor was technology company Intersil, which announced it was being acquired by Rensas, a Japanese semiconductor company.
A position in Demandware, a software service provider that powers e-commerce for large brands and retailers, was a main detractor. The company was a multi-year holding for the fund, but in late 2015 it experienced slowing revenue due to lower same-store sales growth among existing customers. A sharp selloff in software-as-a-service companies in February 2016 triggered our stop loss, and we sold the position.
In addition, a position in Advisory Board Company, a research and software tools company serving the healthcare and education markets, was a primary detractor. A deceleration of growth in the healthcare segment and a delay in the integration of an education acquisition caused the stock to decline, triggering our stop-loss, and we sold the position.
A position in Restoration Hardware Holdings, a rapidly growing home furnishings retail chain, also weighed on fund performance. The company reported disappointing fourth-quarter 2015 earnings due to elevated promotions and supply chain issues. Furthermore, the company changed its pricing strategy, which created uncertainty about future demand trends. The stock price downturn triggered our stop-loss, and we exited the position.
Outlook
As we look forward, we continue to be focused on the underlying business trends of our existing holdings and potential new additions to ensure revenue and earnings growth trends can remain intact, if not improve.
Slow growth continues to be the name of the game for the U.S. economy. U.S. stocks, particularly small-caps, have had quite a strong run since the market bottom in February, and they may need to take a pause in the near term. Volatility remains subdued; however, macro events that lie ahead, including the U.S. election and the Federal Reserve’s actions, may lead to increasing levels of volatility. Earnings growth may continue to be elusive, with potential for positive trends not all that far off. While the outlook may not be terribly clear, we will not attempt to alter our process.
| 2
LOOMIS SAYLES SMALL CAP GROWTH FUND
Hypothetical Growth of $100,000 Investment in Institutional Class Shares
September 30, 2006 through September 30, 20162

Top Ten Holdings as of September 30, 2016
| | | | | | |
| | | Security Name | | % of
Net Assets | |
| 1 | | Ultimate Software Group, Inc. (The) | | | 1.63% | |
| 2 | | Guidewire Software, Inc. | | | 1.56% | |
| 3 | | MarketAxess Holdings, Inc. | | | 1.53% | |
| 4 | | Bright Horizons Family Solutions, Inc. | | | 1.47% | |
| 5 | | Euronet Worldwide, Inc. | | | 1.44% | |
| 6 | | MKS Instruments, Inc. | | | 1.42% | |
| 7 | | Monolithic Power Systems, Inc. | | | 1.40% | |
| 8 | | WageWorks, Inc. | | | 1.39% | |
| 9 | | Granite Construction, Inc. | | | 1.34% | |
| 10 | | Cynosure, Inc., Class A | | | 1.32% | |
The portfolio is actively managed and holdings are subject to change. There is no guarantee the Fund continues to invest in the securities referenced. The holdings listed exclude any temporary cash investments.
3 |
Average Annual Total Returns — September 30, 20162
| | | | | | | | | | | | | | | | | | | | | | | | |
| | | | | | |
| | | | | | | | | | | | | | | Expense Ratios3 | |
| | | 1 year | | | 5 years | | | 10 years | | | Life of Class N | | | Gross | | | Net | |
| | | | | | | |
Institutional Class
(Inception 12/31/96) | | | 6.92 | % | | | 14.33 | % | | | 9.38 | % | | | — | % | | | 0.94 | % | | | 0.94 | % |
| | | | | | | |
Retail Class
(Inception 12/31/96) | | | 6.61 | | | | 13.99 | | | | 9.09 | | | | — | | | | 1.19 | | | | 1.19 | |
| | | | | | | |
Class N
(Inception 2/1/13) | | | 7.05 | | | | — | | | | — | | | | 10.88 | | | | 0.83 | | | | 0.83 | |
| | | | | | | |
| Comparative Performance | | | | | | | | | | | | | | | | | | | | | | | | |
| Russell 2000® Growth Index1 | | | 12.12 | | | | 16.15 | | | | 8.29 | | | | 11.53 | | | | | | | | | |
Performance data shown represents past performance and is no guarantee of, and not necessarily indicative of, future results. Total return and value will vary, and you may have a gain or loss when shares are sold. Current performance may be lower or higher than quoted. For most recent month-end performance, visit loomissayles.com. Performance for other share classes will be greater or less than shown based on differences in fees and sales charges. You may not invest directly in an index. Performance for periods less than one year is cumulative, not annualized. Returns reflect changes in share price and reinvestment of dividends and capital gains, if any. The table(s) do not reflect taxes shareholders might owe on any fund distributions or when they redeem their shares.
| 1 | | Russell 2000® Growth Index is an unmanaged index that measures the performance of the small-cap growth segment of the U.S. equity universe. It includes those Russell 2000® companies with higher price-to-book ratios and forecasted growth values. |
| 2 | | Fund performance has been increased by fee waivers and/or expense reimbursements, if any, without which performance would have been lower. |
| 3 | | As of the most recent prospectus, the investment advisor has contractually agreed to waive fees and/or reimburse expenses (with certain exceptions) once the expense cap of the Fund has been exceeded. This arrangement is set to expire on 1/31/17. When an expense cap has not been exceeded, the Fund may have similar expense ratios. |
| 4
LOOMIS SAYLES SMALL CAP VALUE FUND
| | | | |
| Managers | | Symbols | | |
| Joseph R. Gatz, CFA® | | Institutional Class | | LSSCX |
| Jeffrey Schwartz, CFA® | | Retail Class | | LSCRX |
| | Admin Class | | LSVAX |
| | Class N | | LSCNX |
Investment Objective
The Fund’s investment objective is long-term capital growth from investments in common stocks or other equity securities.
Market Conditions
Stocks generally experienced a sharp downturn from early December through mid-February due to weaker global economic trends, a sharp downturn in oil prices and fears of a premature rate hike from the Federal Reserve (the Fed). Markets recovered steadily off their mid-February lows as global economic fears abated, the Fed delayed further interest rate increases and commodity prices rebounded. Overall, there were significant changes in market leadership during the 12-month period. Growth stock and price momentum leadership in late 2015 gave way to outperformance from higher dividend-yielding utilities and REITs in early 2016. In the final three months of the period, investors showed greater risk tolerance, and small-cap stocks advanced well ahead of large-caps. Technology, healthcare and commodity-sensitive materials stocks outperformed during the final three months, while utilities and REITs lagged. Overall, small-cap stocks generally outperformed large-cap stocks for the entire 12-month period, and small-cap value stocks outperformed small-cap growth stocks.
Performance Results
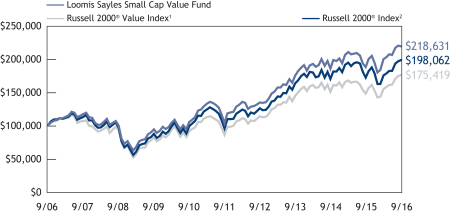
For the 12 months ended September 30, 2016, Institutional Class shares of Loomis Sayles Small Cap Value Fund returned 16.75%. The fund underperformed its benchmark, the Russell 2000® Value Index, which returned 18.81%.
Explanation of Fund Performance
Portfolio strategy was consistent with our long-standing approach, employing our broad resources and rigorous research to identify individual companies and securities we believe are inefficiently priced. The fund’s relative performance was strong during the first half of the 12-month period, largely due to stock selection in the consumer discretionary, real estate investment trust (REIT), healthcare and consumer staples sectors. As markets accelerated higher during the second half of the period, fund returns were strong but lagged the index. Stock selection metrics deteriorated as markets strengthened and investors favored higher risk positions. Selection was weakest in market-leading sectors such as technology and materials, and among REITs.
5 |
The fund’s industrials and information technology sectors made the largest positive absolute contributions to performance for the 12-month period. The industrials sector outperformed the benchmark, and our overweight allocation and security selection within the sector led to outperformance relative to the benchmark’s industrial holdings. Information technology was among the strongest-performing sectors in the benchmark for the year, contributing to our favorable absolute return.
The top individual stock contributor was John Bean Technologies, a leading provider of food processing equipment and airport-related equipment. The company reported strong earnings and raised guidance throughout the year, as global demand for food processing equipment remained strong, profit margins steadily improved, and strategic acquisitions expanded the company’s addressable market.
U.S. Silica Holdings also was a main contributor. Our initial investment in the company, which is a leading provider of silica used in energy, industrial and specialty markets, was well timed, near the bottom point of the energy sector selloff in early 2016. We believe the company is well positioned for further recovery in the oilfield services industry. We also believe two recent acquisitions further strengthen the company’s market position and reach.
Littelfuse, a manufacturer of components and circuit protection devices for use in the automotive, electronics and general industrial markets, was a leading contributor. The company reported improving revenue, margin expansion and solid earnings growth throughout the period. The company announced two larger product line acquisitions, which we believe should contribute positively to future results.
All portfolio sectors generated a positive return during the period, but the contributions from materials and utilities were small, and had smaller weightings within the portfolio.
Although technology sector performance was strong in the benchmark, our technology holdings lagged the sector, contributing to the fund’s relative underperformance. In particular, VeriFone Systems and Zebra Technologies generated disappointing performance, offsetting a strong contribution from Advanced Energy Industries.
The materials sector was the strongest-performing sector in the benchmark, rebounding substantially off the February market bottom. Many of the most commodity-sensitive, highly levered materials companies led the rebound, and our stock selection in the sector lagged.
Sector allocation detracted from relative performance. While modest overweights in the outperforming technology and industrials sectors aided fund performance, underweights in utilities and REITs, both of which outperformed the benchmark, detracted from fund performance. Given the highly regulated nature of utilities and the tax-advantaged mandate for REITs to return nearly all free cash flow to shareholders via dividends, we typically find fewer opportunities within these sectors that meet our specific strategy and investment criteria. An overweight allocation in the consumer discretionary sector also detracted from fund performance.
| 6
LOOMIS SAYLES SMALL CAP VALUE FUND
In terms of individual holdings, Libbey Inc. and Metaldyne Performance Group were the primary detractors for the period. Libbey, a manufacturer of glass tableware for the restaurant and retail industries, generates about 40% of revenues outside the U.S. and was hurt by the translation effect of a stronger U.S. dollar relative to other local currencies where its products are sold. The company also experienced increased competition in certain markets during the third quarter of 2015. The company lowered financial guidance as a result of these two factors. During the second quarter of 2016, we eliminated the holding on a thesis break; Libbey’s new CEO, hired in January, announced his intention to redefine Libbey as a consumer products company rather than an industrial manufacturer.
Metaldyne Performance Group is an automotive supplier focused on casting and forging complex metal parts primarily used for power-train and safety-critical components of the vehicle. We reduced our position in the stock near its all-time high during the quarter ending December 31, 2015. In January, we were surprised when management issued a cautious outlook for 2016 despite broader strength in the automotive markets, and we eliminated the position.
Outlook
With major U.S. equity indices at or very close to record highs, the bull market remains intact. However, it is now the second-longest bull market since the 1930s. Bull markets do not die of old age; typically, they struggle when intervening macroeconomic events such as rising inflation cause central banks to tighten monetary policy for an extended period. Currently, we believe the Fed may raise interest rates by 25 basis points by year-end, but all signs point to a very slow, deliberate tightening cycle. These measured expectations have helped prolong the business cycle and hence the rally in stock prices. If we are right that equity earnings are poised to move back to a growth mode later this year and in 2017, we think balanced equity performance across the market cap spectrum and across growth and value styles could result.
7 |
Hypothetical Growth of $100,000 Investment in Institutional Class Shares
September 30, 2006 through September 30, 20163
See notes to chart on page 9.
Top Ten Holdings as of September 30, 2016
| | | | | | |
| | | Security Name | | % of
Net
Assets | |
| 1 | | Littelfuse, Inc. | | | 1.54% | |
| 2 | | Retail Opportunity Investments Corp. | | | 1.35% | |
| 3 | | Cathay General Bancorp | | | 1.34% | |
| 4 | | Post Holdings, Inc. | | | 1.30% | |
| 5 | | KAR Auction Services, Inc. | | | 1.25% | |
| 6 | | Wintrust Financial Corp. | | | 1.22% | |
| 7 | | ALLETE, Inc. | | | 1.16% | |
| 8 | | First Financial Bancorp | | | 1.14% | |
| 9 | | Signature Bank | | | 1.14% | |
| 10 | | IBERIABANK Corp. | | | 1.13% | |
The portfolio is actively managed and holdings are subject to change. There is no guarantee the Fund continues to invest in the securities referenced. The holdings listed exclude any temporary cash investments.
| 8
LOOMIS SAYLES SMALL CAP VALUE FUND
Average Annual Total Returns — September 30, 20163
| | | | | | | | | | | | | | | | | | | | | | | | |
| | | | | | |
| | | | | | | | | | | | | | | Expense Ratios4 | |
| | | 1 year | | | 5 years | | | 10 years | | | Life of Class N | | | Gross | | | Net | |
| | | | | | | |
| Institutional Class (Inception 5/13/91) | | | 16.75 | % | | | 16.29 | % | | | 8.14 | % | | | — | % | | | 0.99 | % | | | 0.97 | % |
Retail Class
(Inception 12/31/96) | | | 16.47 | | | | 15.99 | | | | 7.87 | | | | — | | | | 1.24 | | | | 1.22 | |
Admin Class
(Inception 1/2/98) | | | 16.19 | | | | 15.71 | | | | 7.59 | | | | — | | | | 1.47 | | | | 1.45 | |
Class N
(Inception 2/1/13) | | | 16.84 | | | | — | | | | — | | | | 11.04 | | | | 0.90 | | | | 0.90 | |
| | | |
| Comparative Performance | | | | | | | | | |
| Russell 2000® Value Index1 | | | 18.81 | | | | 15.45 | | | | 5.78 | | | | 9.63 | | | | | | | | | |
| Russell 2000® Index2 | | | 15.47 | | | | 15.82 | | | | 7.07 | | | | 10.60 | | | | | | | | | |
Performance data shown represents past performance and is no guarantee of, and not necessarily indicative of, future results. Total return and value will vary, and you may have a gain or loss when shares are sold. Current performance may be lower or higher than quoted. For most recent month-end performance, visit loomissayles.com. Performance for other share classes will be greater or less than shown based on differences in fees and sales charges. You may not invest directly in an index. Performance for periods less than one year is cumulative, not annualized. Returns reflect changes in share price and reinvestment of dividends and capital gains, if any. The table(s) do not reflect taxes shareholders might owe on any fund distributions or when they redeem their shares.
| 1 | | Russell 2000® Value Index is an unmanaged index that measures the performance of the small-cap value segment of the U.S. equity universe. It includes those Russell 2000® companies with lower price-to-book ratios and lower forecasted growth values. |
| 2 | | Russell 2000® Index is an unmanaged index that measures the performance of the small-cap segment of the U.S. equity universe. |
| 3 | | Fund performance has been increased by fee waivers and/or expense reimbursements, if any, without which performance would have been lower. |
| 4 | | As of the most recent prospectus, the investment advisor has contractually agreed to waive fees and/or reimburse expenses (with certain exceptions) once the expense cap of the Fund has been exceeded. This arrangement is set to expire on 1/31/17. When an expense cap has not been exceeded, the Fund may have similar expense ratios. |
9 |
LOOMIS SAYLES SMALL/MID CAP GROWTH FUND
| | | | |
| Managers | | Symbols | | |
| Mark F. Burns, CFA® | | Institutional Class | | LSMIX |
| John J. Slavik, CFA® | | | | |
Investment Objective
The Fund’s investment objective is long-term capital growth from investments in common stocks or other equity securities.
Market Conditions
U.S. equity markets were generally strong for the 12-month period, benefitting from the robust performance off the market bottom in February 2016 and following the two-day Brexit vote-inspired selloff in June. Within the small/mid-cap segment of the market, the smallest companies and the lowest-quality companies (as measured by return on equity) were the strongest performers in the February market rebound. The third quarter of 2016 was a particularly challenging market environment for the fund, as the highest beta (high risk/high reward potential) names significantly outperformed the lowest beta names. Among small/mid-cap stocks, value stocks significantly outperformed growth stocks.
Performance Results
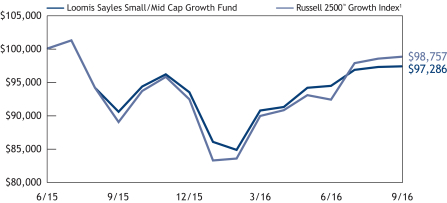
For the 12 months ended September 30, 2016, Institutional Class shares of Loomis Sayles Small/Mid Cap Growth Fund returned 7.51%. The Fund underperformed its benchmark, the Russell 2500™ Growth Index, which returned 11.02%.
Explanation of Fund Performance
Stock selection in the information technology and consumer discretionary sectors and an underweight position in the materials sector primarily accounted for the fund’s underperformance. Given the fund’s strategy, the market environment during the third quarter of 2016 created a significant headwind.
In terms of individual holdings, the top contributor to fund performance was financials company MarketAxess Holdings. The company continued to steadily gain market share in electronic bond trading, and its earnings grew. In addition, the company remains significantly underpenetrated in the fixed-income trading market, its biggest market opportunity. In 2016, MarketAxess launched electronic trading for municipal bonds, a market no other firm has been able to penetrate electronically. Following two years of increased investments, MarketAxess is now leveraging those efforts and generating robust incremental margins.
In addition, a position in Parsley Energy, an energy exploration company with a compelling acreage position in the Permian Basin, was a top contributor. The company’s prudent management team has kept leverage low and effectively managed the business through the commodity price downturn in 2015. We believe valuation remains reasonable
| 10
LOOMIS SAYLES SMALL/MID CAP GROWTH FUND
relative to current production. The business continues to generate positive cash, and we believe it is well positioned to continue to expand its asset base and production levels for the foreseeable future, all while generating positive cash flow and maintaining low leverage.
Drew Industries, a leading provider of components to the RV industry, also was a main contributor. The stock advanced due to several factors, including favorable industry trends, growing revenues, diversification of the business and strong incremental margin performance given the high fixed-cost nature of the business.
A position in Virtusa, an information technology services and consulting company, was a main detractor. After several years of demonstrating above-industry growth and improving margins, the company acquired another technology services company with low growth and poor profitability. Despite the potential value of the combined entity, results have been disappointing, and we exited the position.
SPS Commerce, a provider of cloud-based supply chain management software, was a primary detractor. The stock declined after SPS reported its sales force contracted in the fourth quarter of 2015 due to a competitive hiring environment and a poorly structured compensation plan. The selloff was brief, and the stock recovered quickly, but the decline triggered our stop-loss and we did not benefit during the recovery. We repurchased the stock.
Palo Alto Networks, a networking security company, also detracted from performance. After a strong upward move in the stock during 2014 and the first half of 2015, elevated expectations and difficult comparisons created concerns about slowing revenue growth. These concerns were exacerbated by industry data showing a firewall spending surge in 2015 that was unlikely to repeat in 2016. The elevated valuation and high share turnover led us to sell the stock, especially given the volatile market conditions at the time of the sale in late January 2016.
Outlook
As we look forward, we continue to be focused on the underlying business trends of our existing holdings and potential new additions to ensure that revenue and earnings growth trends can remain intact, if not improve.
Slow growth continues to be the name of the game for the U.S. economy. U.S. stocks, particularly small-caps, have had quite a strong run since the market bottom in February, and they may need to take a pause in the near term. Volatility remains subdued; however, macro events that lie ahead, including the U.S. election and the Fed’s actions, may lead to increasing levels of volatility. Earnings growth may continue to be elusive, with potential for positive trends not all that far off. While the outlook may not be terribly clear, we will not attempt to alter our process.
11 |
Hypothetical Growth of $100,000 Investment in Institutional Class Shares
June 30, 2015 (inception) through September 30, 20162
See notes to chart on page 13.
Top Ten Holdings as of September 30, 2016
| | | | | | |
| | | Security Name | | % of
Net
Assets | |
| 1 | | WellCare Health Plans, Inc. | | | 1.98% | |
| 2 | | TransDigm Group, Inc. | | | 1.91% | |
| 3 | | Ultimate Software Group, Inc. (The) | | | 1.73% | |
| 4 | | Acuity Brands, Inc. | | | 1.72% | |
| 5 | | Guidewire Software, Inc. | | | 1.65% | |
| 6 | | Nord Anglia Education, Inc. | | | 1.59% | |
| 7 | | B/E Aerospace, Inc. | | | 1.57% | |
| 8 | | Vail Resorts, Inc. | | | 1.53% | |
| 9 | | Blackbaud, Inc. | | | 1.51% | |
| 10 | | Cantel Medical Corp. | | | 1.51% | |
The portfolio is actively managed and holdings are subject to change. There is no guarantee the Fund continues to invest in the securities referenced. The holdings listed exclude any temporary cash investments.
| 12
LOOMIS SAYLES SMALL/MID CAP GROWTH FUND
Average Annual Total Returns — September 30, 20162
| | | | | | | | | | | | | | | | |
| | | | |
| | | | | | | | | Expense Ratios3 | |
| | | 1 year | | | Life of
Fund | | | Gross | | | Net | |
| | | | | |
| Institutional Class (Inception 6/30/15) | | | 7.51 | % | | | -2.16 | % | | | 2.84 | % | | | 0.85 | % |
| | | | | |
| Comparative Performance | | | | | | | | | | | | | | | | |
| Russell 2500TM Growth Index1 | | | 11.02 | | | | -0.99 | | | | | | | | | |
Performance data shown represents past performance and is no guarantee of, and not necessarily indicative of, future results. Total return and value will vary, and you may have a gain or loss when shares are sold. Current performance may be lower or higher than quoted. For most recent month-end performance, visit loomissayles.com. Performance for other share classes will be greater or less than shown based on differences in fees and sales charges. You may not invest directly in an index. Performance for periods less than one year is cumulative, not annualized. Returns reflect changes in share price and reinvestment of dividends and capital gains, if any. The table(s) do not reflect taxes shareholders might owe on any fund distributions or when they redeem their shares.
| 1 | | Russell 2500TM Growth Index is an unmanaged index that measures the performance of the small-to-mid-cap growth segment of the U.S. equity universe. It includes those Russell 2500TM companies with higher price-to-book ratios and higher forecasted growth values. |
| 2 | | Fund performance has been increased by fee waivers and/or expense reimbursements, if any, without which performance would have been lower. |
| 3 | | As of the most recent prospectus, the investment advisor has contractually agreed to waive fees and/or reimburse expenses (with certain exceptions) once the expense cap of the Fund has been exceeded. This arrangement is set to expire on 1/31/17. When an expense cap has not been exceeded, the Fund may have similar expense ratios. |
1623917.2.1
13 |
ADDITIONAL INFORMATION
The views expressed in this report reflect those of the portfolio managers as of the dates indicated. The managers’ views are subject to change at any time without notice based on changes in market or other conditions. References to specific securities or industries should not be regarded as investment advice. Because the Funds are actively managed, there is no assurance that they will continue to invest in the securities or industries mentioned.
All investing involves risk, including the risk of loss. There is no assurance that any investment will meet its performance objectives or that losses will be avoided.
Additional Index Information
This document may contain references to third party copyrights, indexes, and trademarks, each of which is the property of its respective owner. Such owner is not affiliated with Natixis Global Asset Management or any of its related or affiliated companies (collectively “NGAM”) and does not sponsor, endorse or participate in the provision of any NGAM services, funds or other financial products.
The index information contained herein is derived from third parties and is provided on an “as is” basis. The user of this information assumes the entire risk of use of this information. Each of the third party entities involved in compiling, computing or creating index information disclaims all warranties (including, without limitation, any warranties of originality, accuracy, completeness, timeliness, non-infringement, merchantability and fitness for a particular purpose) with respect to such information.
Proxy Voting Information
A description of the Funds’ proxy voting policies and procedures is available without charge upon request, by calling Loomis Sayles at 800-633-3330; on the Funds’ website, at www.loomissayles.com, and on the Securities and Exchange Commission’s (SEC’s) website at www.sec.gov. Information about how the Funds voted proxies relating to portfolio securities during the most recent 12-month period ended June 30 is available on the Funds’ website and the SEC’s website.
Quarterly Portfolio Schedules
The Funds file a complete schedule of portfolio holdings with the SEC for the first and third quarters of each fiscal year on Form N-Q. The Funds’ Forms N-Q are available on the SEC’s website at www.sec.gov and may be reviewed and copied at the SEC’s Public Reference Room in Washington, DC. Information on the operation of the Public Reference Room may be obtained by calling 800-SEC-0330.
UNDERSTANDING YOUR FUND’S EXPENSES
As a mutual fund shareholder you incur two types of costs: (1) transaction costs and (2) ongoing costs, including management fees, distribution and/or service fees (12b-1 fees), and other fund expenses. Certain exemptions may apply. These costs are described in more detail in the Funds’ prospectus. The following examples are intended to help you understand the ongoing costs of investing in the Funds and help you compare these with the ongoing costs of investing in other mutual funds.
| 14
The first line in the table of each Fund shows the actual amount of Fund expenses you would have paid on a $1,000 investment in the Fund from April 1, 2016 through September 30, 2016. To estimate the expenses you paid over the period, simply divide your account value by $1,000 (for example $8,600 account value divided by $1,000 = 8.6) and multiply the result by the number in the Expenses Paid During Period column as shown below for your class.
The second line in the table of each Fund provides information about hypothetical account values and hypothetical expenses based on the Fund’s actual expense ratios and an assumed rate of return of 5% per year before expenses, which is not the Fund’s actual return. The hypothetical account values and expenses may not be used to estimate the actual ending account balance or expenses you paid on your investment for the period. You may use this information to compare the ongoing costs of investing in the Funds to other funds. To do so, compare this 5% hypothetical example with the 5% hypothetical examples that appear in the shareholder reports of other funds.
Please note that the expenses shown reflect ongoing costs only, and do not include any transaction costs. Therefore, the second line in the table is useful in comparing ongoing costs only, and will not help you determine the relative costs of owning different funds. If transaction costs were included, total costs would be higher.
Loomis Sayles Small Cap Growth Fund
| | | | | | | | | | | | |
| Institutional Class | | Beginning
Account Value
4/1/2016 | | | Ending
Account Value
9/30/2016 | | | Expenses Paid
During Period*
4/1/2016 – 9/30/2016 | |
Actual | | | $1,000.00 | | | | $1,085.80 | | | | $4.90 | |
Hypothetical (5% return before expenses) | | | $1,000.00 | | | | $1,020.30 | | | | $4.75 | |
| | | |
Retail Class | | | | | | | | | |
Actual | | | $1,000.00 | | | | $1,084.20 | | | | $6.20 | |
Hypothetical (5% return before expenses) | | | $1,000.00 | | | | $1,019.05 | | | | $6.01 | |
| | | |
Class N | | | | | | | | | |
Actual | | | $1,000.00 | | | | $1,086.00 | | | | $4.33 | |
Hypothetical (5% return before expenses) | | | $1,000.00 | | | | $1,020.85 | | | | $4.19 | |
* Expenses are equal to the Fund’s annualized expense ratio: 0.94%, 1.19% and 0.83% for Institutional Class, Retail Class and Class N, respectively, multiplied by the average account value over the period, multiplied by the number of days in the most recent fiscal half-year (183), divided by 366 (to reflect the half-year period). | |
15 |
Loomis Sayles Small Cap Value Fund
| | | | | | | | | | | | |
Institutional Class | | Beginning
Account Value
4/1/2016 | | | Ending
Account Value
9/30/2016 | | | Expenses Paid
During Period*
4/1/2016 – 9/30/2016 | |
Actual | | | $1,000.00 | | | | $1,095.30 | | | | $4.71 | |
Hypothetical (5% return before expenses) | | | $1,000.00 | | | | $1,020.50 | | | | $4.55 | |
| | | |
Retail Class | | | | | | | | | |
Actual | | | $1,000.00 | | | | $1,094.20 | | | | $6.02 | |
Hypothetical (5% return before expenses) | | | $1,000.00 | | | | $1,019.25 | | | | $5.81 | |
| | | |
Admin Class | | | | | | | | | |
Actual | | | $1,000.00 | | | | $1,092.70 | | | | $7.32 | |
Hypothetical (5% return before expenses) | | | $1,000.00 | | | | $1,018.00 | | | | $7.06 | |
| | | |
Class N | | | | | | | | | |
Actual | | | $1,000.00 | | | | $1,095.90 | | | | $4.35 | |
Hypothetical (5% return before expenses) | | | $1,000.00 | | | | $1,020.85 | | | | $4.19 | |
* Expenses are equal to the Fund’s annualized expense ratio (after waiver/reimbursement): 0.90%, 1.15%, 1.40% and 0.83% for Institutional Class, Retail Class, Admin Class and Class N, respectively, multiplied by the average account value over the period, multiplied by the number of days in the most recent fiscal half-year (183), divided by 366 (to reflect the half-year period). | |
Loomis Sayles Small/Mid Cap Growth Fund
| | | | | | | | | | | | |
Institutional Class | | Beginning
Account Value
4/1/2016 | | | Ending
Account Value
9/30/2016 | | | Expenses Paid
During Period*
4/1/2016 – 9/30/2016 | |
Actual | | | $1,000.00 | | | | $1,072.80 | | | | $4.40 | |
Hypothetical (5% return before expenses) | | | $1,000.00 | | | | $1,020.75 | | | | $4.29 | |
* Expenses are equal to the Fund’s annualized expense ratio (after waiver/reimbursement) of 0.85%, multiplied by the average account value over the period, multiplied by the number of days in the most recent fiscal half-year (183), divided by 366 (to reflect the half-year period). | |
| 16
BOARD APPROVAL OF THE EXISTING ADVISORY AGREEMENTS
The Board of Trustees of the Trusts (the “Board”), including the Independent Trustees, considers matters bearing on each Fund’s advisory agreement (collectively, the “Agreements”) at most of its meetings throughout the year. Each year, usually in the spring, the Contract Review Committee of the Board meets to review the Agreements to determine whether to recommend that the full Board approve the continuation of the Agreements, typically for an additional one-year period. After the Committee has made its recommendation, the full Board, including the Independent Trustees, determines whether to approve the continuation of the Agreements. The Loomis Sayles Small/Mid Cap Growth Fund was not included in the most recent annual review as the Fund’s initial board-approved advisory agreement is in effect until July 1, 2017.
In connection with these meetings, the Trustees receive materials that the Funds’ investment adviser (the “Adviser”) believes to be reasonably necessary for the Trustees to evaluate the Agreements. These materials generally include, among other items, (i) information on the investment performance of the Funds and the performance of peer groups and categories of funds and the Funds’ performance benchmarks, (ii) information on the Funds’ advisory fees and other expenses, including information comparing the Funds’ expenses to the fees charged to institutional accounts with similar strategies managed by the Adviser, if any, and to those of peer groups of funds and information about applicable expense caps and/or fee “breakpoints,” (iii) sales and redemption data in respect of the Funds, (iv) information about the profitability of the Agreements to the Adviser and (v) information obtained through the completion by the Adviser of a questionnaire distributed on behalf of the Trustees. The Board, including the Independent Trustees, also considers other matters such as (i) the Adviser’s financial results and/or financial condition, (ii) each Fund’s investment objective and strategies and the size, education and experience of the Adviser’s investment staff and its use of technology, external research and trading cost measurement tools, (iii) arrangements in respect of the distribution of the Funds’ shares and the related costs, (iv) the procedures employed to determine the value of the Funds’ assets, (v) the allocation of the Funds’ brokerage, if any, including, if applicable, allocations to brokers affiliated with the Adviser and the use of “soft” commission dollars to pay Fund expenses and to pay for research and other similar services, (vi) the resources devoted to, and the record of compliance with, the Funds’ investment policies and restrictions, policies on personal securities transactions and other compliance policies, (vii) information about amounts invested by the Funds’ portfolio managers in the Funds or in similar accounts that they manage and (viii) the general economic outlook with particular emphasis on the mutual fund industry. Throughout the process, the Trustees are afforded the opportunity to ask questions of and request additional materials from the Adviser.
In addition to the materials requested by the Trustees in connection with their annual consideration of the continuation of the Agreements, the Trustees receive materials in advance of each regular quarterly meeting of the Board that provide detailed information about the Funds’ investment performance and the fees charged to the Funds for advisory
17 |
and other services. This information generally includes, among other things, an internal performance rating for each Fund based on agreed-upon criteria, graphs showing each Fund’s performance and fee differentials against each Fund’s peer group/category, performance ratings provided by a third-party, total return information for various periods, and third-party performance rankings for various periods comparing a Fund against similarly categorized funds. The portfolio management team for each Fund or other representatives of the Adviser make periodic presentations to the Contract Review Committee and/or the full Board, and Funds identified as presenting possible performance concerns may be subject to more frequent board presentations and reviews. In addition, each quarter the Trustees are provided with detailed statistical information about each Fund’s portfolio. The Trustees also receive periodic updates between meetings.
The Board most recently approved the continuation of the Agreements at its meeting held in June 2016. The Agreements were continued for a one-year period for the Funds. In considering whether to approve the continuation of the Agreements, the Board, including the Independent Trustees, did not identify any single factor as determinative. Individual Trustees may have evaluated the information presented differently from one another, giving different weights to various factors. Matters considered by the Trustees, including the Independent Trustees, in connection with their approval of the Agreements included, but were not limited to, the factors listed below.
The nature, extent and quality of the services provided to the Funds under the Agreements. The Trustees considered the nature, extent and quality of the services provided by the Adviser and its affiliates to the Funds and the resources dedicated to the Funds by the Adviser and its affiliates.
The Trustees considered not only the advisory services provided by the Adviser to the Funds, but also the monitoring and oversight services provided by NGAM Advisors, L.P. (“NGAM Advisors”). They also considered the administrative services provided by NGAM Advisors and its affiliates to the Funds. For each Fund, the Trustees also considered the benefits to shareholders of investing in a mutual fund that is part of a family of funds that offers shareholders the right to exchange shares of one type of fund for shares of another type of fund, and provides a variety of fund and shareholder services.
After reviewing these and related factors, the Trustees concluded, within the context of their overall conclusions regarding each of the Agreements, that the nature, extent and quality of services provided supported the renewal of the Agreements.
Investment performance of the Funds and the Adviser. As noted above, the Trustees received information about the performance of the Funds over various time periods, including information that compared the performance of the Funds to the performance of peer groups and categories of funds and the Funds’ respective performance benchmarks. In addition, the Trustees also reviewed data prepared by an independent third party that analyzed the performance of the Funds using a variety of performance metrics, including metrics that also measured the performance of the Funds on a risk adjusted basis.
With respect to each Fund, the Board concluded that the Fund’s performance or other relevant factors supported the renewal of the Agreement relating to that Fund. In the case
| 18
of the Loomis Sayles Small Cap Value Fund, the performance of which lagged that of a relevant peer group median and/or category median of funds for certain (although not necessarily all) periods , the Board concluded that other factors relevant to performance supported renewal of the relevant Agreement. These factors included one or more of the following: (1) that the underperformance was attributable, to a significant extent, to investment decisions by the Adviser that were reasonable and consistent with the Fund’s investment objective and policies ; (2) that the Fund’s more recent performance was competitive when compared to relevant performance benchmarks or peer groups; and (3) that the Fund’s long-term performance was competitive when compared to relevant performance benchmarks or peer groups.
The Trustees also considered the Adviser’s performance and reputation generally, the performance of the fund family generally, and the historical responsiveness of the Adviser to Trustee concerns about performance and the willingness of the Adviser to take steps intended to improve performance.
After reviewing these and related factors, the Trustees concluded, within the context of their overall conclusions regarding each of the Agreements, that the performance of the Funds and the Adviser supported the renewal of the Agreements.
The costs of the services to be provided and profits to be realized by the Adviser and its affiliates from their respective relationships with the Funds. The Trustees considered the fees charged to the Funds for advisory services as well as the total expense levels of the Funds. This information included comparisons (provided both by management and also by an independent third party) of the Funds’ advisory fees and total expense levels to those of their peer groups and information about the advisory fees charged by the Adviser to comparable accounts (such as institutional separate accounts), as well as information about differences in such fees and the reasons for any such differences. In considering the fees charged to comparable accounts, the Trustees considered, among other things, management’s representations about the differences between managing mutual funds as compared to other types of accounts, including the additional resources required to effectively manage mutual fund assets and the greater regulatory costs associated with the management of such assets. In evaluating each Fund’s advisory fee, the Trustees also took into account the demands, complexity and quality of the investment management of such Fund and the need for the Adviser to offer competitive compensation and the potential need to expend additional resources to the extent the Funds grow in size. The Trustees considered that over the past several years, management had made recommendations regarding reductions in advisory fee rates, implementation of advisory fee breakpoints and the institution of advisory fee waivers and expense caps for various funds in the fund family. They noted that both of the Funds in this report have expense caps in place, and they considered the amounts waived or reimbursed by the Adviser for the Loomis Sayles Small Cap Value Fund. The Trustees also considered that the Loomis Sayles Small Cap Growth Fund’s current expenses are below the cap.
The Trustees also considered the compensation directly or indirectly received by the Adviser and its affiliates from their relationships with the Funds. The Trustees reviewed information provided by management as to the profitability of the Adviser and its
19 |
affiliates’ relationships with the Funds, and information about the allocation of expenses used to calculate profitability. They also reviewed information provided by management about the effect of distribution costs and changes in asset levels on Adviser profitability, including information regarding resources spent on distribution activities. When reviewing profitability, the Trustees also considered information about court cases in which adviser compensation or profitability were issues, the performance of the relevant Funds, the expense levels of the Funds, and whether the Adviser had implemented breakpoints and/or expense caps with respect to such Funds.
After reviewing these and related factors, the Trustees concluded, within the context of their overall conclusions regarding each of the Agreements, that the advisory fee charged to each of the Funds was fair and reasonable, and that the costs of these services generally and the related profitability of the Adviser and its affiliates in respect of their relationships with the Funds supported the renewal of the Agreements.
Economies of Scale. The Trustees considered the existence of any economies of scale in the provision of services by the Adviser and whether those economies are shared with the Funds through breakpoints in their investment advisory fees or other means, such as expense waivers or caps. The Trustees also discussed with management the factors considered with respect to the implementation of breakpoints in investment advisory fees or expense waivers or caps for certain funds. Management explained that a number of factors are taken into account in considering the implementation of breakpoints or an expense cap for a fund, including, among other things, factors such as a fund’s assets, the projected growth of a fund, projected profitability and a fund’s fees and performance. With respect to economies of scale, the Trustees noted that although neither Fund’s management fee was subject to breakpoints, each Fund’s management fee and overall net expense ratio was at or below the median fee for a peer group of funds and that each Fund was subject to an expense cap or waiver. In considering these issues, the Trustees also took note of the costs of the services provided (both on an absolute and a relative basis) and the profitability to the Adviser and its affiliates of their relationships with the Funds, as discussed above.
After reviewing these and related factors, the Trustees concluded, within the context of their overall conclusions regarding each of the Agreements, that the extent to which economies of scale were shared with the Funds supported the renewal of the Agreements.
The Trustees also considered other factors, which included but were not limited to the following:
| • | | the effect of recent market and economic events on the performance, asset levels and expense ratios of each Fund. |
| • | | whether each Fund has operated in accordance with its investment objective and the Fund’s record of compliance with its investment restrictions, and the compliance programs of the Funds and the Adviser. They also considered the compliance-related resources the Adviser and its affiliates were providing to the Funds. |
| 20
| • | | the nature, quality, cost and extent of administrative and shareholder services performed by the Adviser and its affiliates, both under the Agreements and under separate agreements covering administrative services. |
| • | | so-called “fallout benefits” to the Adviser, such as the engagement of affiliates of the Adviser to provide distribution, administrative and brokerage services to the Funds, and the benefits of research made available to the Adviser by reason of brokerage commissions (if any) generated by the Funds’ securities transactions. The Trustees also considered the benefits to the parent company of NGAM Advisors from the retention of the Adviser. The Trustees considered the possible conflicts of interest associated with these fallout and other benefits, and the reporting, disclosure and other processes in place to disclose and monitor such possible conflicts of interest. |
| • | | the Trustees’ review and discussion of the Funds’ advisory arrangements in prior years, and management’s record of responding to Trustee concerns raised during the year and in prior years. |
Based on their evaluation of all factors that they deemed to be material, including those factors described above, and assisted by the advice of independent counsel, the Trustees, including the Independent Trustees, concluded that each of the existing Agreements should be continued through June 30, 2017.
21 |
Portfolio of Investments – as of September 30, 2016
Loomis Sayles Small Cap Growth Fund
| | | | | | | | |
| Shares | | | Description | | Value (†) | |
|
| | Common Stocks – 96.8% of Net Assets | |
| |
| | | | Aerospace & Defense – 1.0% | |
| | 262,976 | | | Hexcel Corp. | | $ | 11,649,837 | |
| | | | | | | | |
| | | | Auto Components – 1.7% | |
| | 176,397 | | | Dorman Products, Inc.(b) | | | 11,271,768 | |
| | 82,866 | | | Drew Industries, Inc. | | | 8,122,526 | |
| | | | | | | | |
| | | | | | | 19,394,294 | |
| | | | | | | | |
| | | | Banks – 4.2% | | | | |
| | 238,013 | | | Chemical Financial Corp. | | | 10,503,514 | |
| | 234,695 | | | Pinnacle Financial Partners, Inc. | | | 12,692,305 | |
| | 291,177 | | | PrivateBancorp, Inc. | | | 13,370,848 | |
| | 314,876 | | | Renasant Corp. | | | 10,589,280 | |
| | | | | | | | |
| | | | | | | 47,155,947 | |
| | | | | | | | |
| | | | Biotechnology – 2.5% | | | | |
| | 311,716 | | | Genomic Health, Inc.(b) | | | 9,014,827 | |
| | 632,176 | | | Ironwood Pharmaceuticals, Inc.(b) | | | 10,038,955 | |
| | 492,458 | | | Lexicon Pharmaceuticals, Inc.(b) | | | 8,898,716 | |
| | | | | | | | |
| | | | | | | 27,952,498 | |
| | | | | | | | |
| | | | Building Products – 2.2% | | | | |
| | 278,380 | | | Apogee Enterprises, Inc. | | | 12,440,802 | |
| | 216,763 | | | Trex Co., Inc.(b) | | | 12,728,324 | |
| | | | | | | | |
| | | | | | | 25,169,126 | |
| | | | | | | | |
| | | | Capital Markets – 2.5% | | | | |
| | 362,036 | | | Financial Engines, Inc. | | | 10,756,090 | |
| | 104,116 | | | MarketAxess Holdings, Inc. | | | 17,240,568 | |
| | | | | | | | |
| | | | | | | 27,996,658 | |
| | | | | | | | |
| | | | Commercial Services & Supplies – 1.5% | | | | |
| | 372,069 | | | Healthcare Services Group, Inc. | | | 14,726,491 | |
| | 47,349 | | | Team, Inc.(b) | | | 1,548,786 | |
| | | | | | | | |
| | | | | | | 16,275,277 | |
| | | | | | | | |
| | | | Construction & Engineering – 2.2% | | | | |
| | 303,105 | | | Granite Construction, Inc. | | | 15,076,443 | |
| | 475,474 | | | Primoris Services Corp. | | | 9,794,764 | |
| | | | | | | | |
| | | | | | | 24,871,207 | |
| | | | | | | | |
| | | | Distributors – 1.3% | | | | |
| | 149,143 | | | Pool Corp. | | | 14,096,996 | |
| | | | | | | | |
| | | | Diversified Consumer Services – 3.7% | |
| | 247,256 | | | Bright Horizons Family Solutions, Inc.(b) | | | 16,538,954 | |
| | 292,362 | | | Grand Canyon Education, Inc.(b) | | | 11,808,501 | |
| | 602,657 | | | Nord Anglia Education, Inc.(b) | | | 13,125,869 | |
| | | | | | | | |
| | | | | | | 41,473,324 | |
| | | | | | | | |
See accompanying notes to financial statements.
| 22
Portfolio of Investments – as of September 30, 2016
Loomis Sayles Small Cap Growth Fund – continued
| | | | | | | | |
| Shares | | | Description | | Value (†) | |
|
| | Common Stocks – continued | |
| | |
| | | | Diversified Telecommunication Services – 2.3% | | | | |
| | 342,998 | | | Cogent Communications Holdings, Inc. | | $ | 12,625,756 | |
| | 1,245,759 | | | ORBCOMM, Inc.(b) | | | 12,769,030 | |
| | | | | | | | |
| | | | | | | 25,394,786 | |
| | | | | | | | |
| | | | Electrical Equipment – 1.0% | | | | |
| | 307,766 | | | Generac Holdings, Inc.(b) | | | 11,171,906 | |
| | | | | | | | |
| | | | Electronic Equipment, Instruments & Components – 1.8% | | | | |
| | 131,843 | | | IPG Photonics Corp.(b) | | | 10,857,271 | |
| | 316,456 | | | Orbotech Ltd.(b) | | | 9,370,262 | |
| | | | | | | | |
| | | | | | | 20,227,533 | |
| | | | | | | | |
| | | | Energy Equipment & Services – 0.7% | | | | |
| | 145,035 | | | Dril-Quip, Inc.(b) | | | 8,084,251 | |
| | | | | | | | |
| | | | Food Products – 2.0% | | | | |
| | 713,013 | | | Amplify Snack Brands, Inc.(b) | | | 11,550,810 | |
| | 327,515 | | | Snyder’s-Lance, Inc. | | | 10,997,954 | |
| | | | | | | | |
| | | | | | | 22,548,764 | |
| | | | | | | | |
| | | | Health Care Equipment & Supplies – 8.2% | | | | |
| | 292,046 | | | Cynosure, Inc., Class A(b) | | | 14,876,823 | |
| | 225,532 | | | Inogen, Inc.(b) | | | 13,509,367 | |
| | 338,574 | | | Insulet Corp.(b) | | | 13,861,220 | |
| | 168,892 | | | Integra LifeSciences Holdings Corp.(b) | | | 13,942,035 | |
| | 83,557 | | | Merit Medical Systems, Inc.(b) | | | 2,029,599 | |
| | 215,262 | | | Neogen Corp.(b) | | | 12,041,756 | |
| | 91,601 | | | Nevro Corp.(b) | | | 9,562,228 | |
| | 512,681 | | | Wright Medical Group NV(b) | | | 12,576,065 | |
| | | | | | | | |
| | | | | | | 92,399,093 | |
| | | | | | | | |
| | | | Health Care Providers & Services – 4.6% | | | | |
| | 193,934 | | | Acadia Healthcare Co., Inc.(b) | | | 9,609,430 | |
| | 358,086 | | | AMN Healthcare Services, Inc.(b) | | | 11,412,201 | |
| | 151,750 | | | Amsurg Corp.(b) | | | 10,174,837 | |
| | 413,304 | | | Ensign Group, Inc. (The) | | | 8,319,810 | |
| | 317,404 | | | HealthEquity, Inc.(b) | | | 12,013,741 | |
| | | | | | | | |
| | | | | | | 51,530,019 | |
| | | | | | | | |
| | | | Health Care Technology – 3.0% | | | | |
| | 320,168 | | | Evolent Health, Inc., Class A(b) | | | 7,882,536 | |
| | 257,841 | | | Medidata Solutions, Inc.(b) | | | 14,377,214 | |
| | 280,118 | | | Press Ganey Holdings, Inc.(b) | | | 11,316,767 | |
| | | | | | | | |
| | | | | | | 33,576,517 | |
| | | | | | | | |
| | | | Hotels, Restaurants & Leisure – 3.6% | | | | |
| | 348,528 | | | Chuy’s Holdings, Inc.(b) | | | 9,737,872 | |
See accompanying notes to financial statements.
23 |
Portfolio of Investments – as of September 30, 2016
Loomis Sayles Small Cap Growth Fund – continued
| | | | | | | | |
| Shares | | | Description | | Value (†) | |
|
| | Common Stocks – continued | |
| | |
| | | | Hotels, Restaurants & Leisure – continued | | | | |
| | 157,359 | | | Popeyes Louisiana Kitchen, Inc.(b) | | $ | 8,362,057 | |
| | 206,889 | | | Texas Roadhouse, Inc. | | | 8,074,878 | |
| | 93,451 | | | Vail Resorts, Inc. | | | 14,660,593 | |
| | | | | | | | |
| | | | | | | 40,835,400 | |
| | | | | | | | |
| | | | Household Durables – 2.4% | | | | |
| | 209,575 | | | Installed Building Products, Inc.(b) | | | 7,517,455 | |
| | 221,898 | | | iRobot Corp.(b) | | | 9,759,074 | |
| | 131,843 | | | Universal Electronics, Inc.(b) | | | 9,817,030 | |
| | | | | | | | |
| | | | | | | 27,093,559 | |
| | | | | | | | |
| | | | Internet & Direct Marketing Retail – 0.6% | | | | |
| | 178,292 | | | Wayfair, Inc., Class A(b) | | | 7,019,356 | |
| | | | | | | | |
| | | | Internet Software & Services – 7.1% | |
| | 287,859 | | | 2U, Inc.(b) | | | 11,022,121 | |
| | 210,523 | | | Benefitfocus, Inc.(b) | | | 8,404,078 | |
| | 293,468 | | | Criteo S.A., Sponsored ADR(b) | | | 10,303,661 | |
| | 146,773 | | | Envestnet, Inc.(b) | | | 5,349,876 | |
| | 147,563 | | | LogMeIn, Inc. | | | 13,338,220 | |
| | 448,852 | | | Q2 Holdings, Inc.(b) | | | 12,864,098 | |
| | 426,752 | | | Quotient Technology, Inc.(b) | | | 5,680,069 | |
| | 309,346 | | | Wix.com Ltd.(b) | | | 13,434,897 | |
| | | | | | | | |
| | | | | | | 80,397,020 | |
| | | | | | | | |
| | | | IT Services – 4.3% | | | | |
| | 128,762 | | | EPAM Systems, Inc.(b) | | | 8,924,494 | |
| | 198,831 | | | Euronet Worldwide, Inc.(b) | | | 16,270,341 | |
| | 208,785 | | | ExlService Holdings, Inc.(b) | | | 10,405,844 | |
| | 368,514 | | | InterXion Holding NV(b) | | | 13,347,577 | |
| | | | | | | | |
| | | | | | | 48,948,256 | |
| | | | | | | | |
| | | | Life Sciences Tools & Services – 2.8% | | | | |
| | 318,668 | | | Accelerate Diagnostics, Inc.(b) | | | 8,686,890 | |
| | 234,221 | | | INC Research Holdings, Inc., Class A(b) | | | 10,441,572 | |
| | 227,823 | | | PRA Health Sciences, Inc.(b) | | | 12,874,278 | |
| | | | | | | | |
| | | | | | | 32,002,740 | |
| | | | | | | | |
| | | | Machinery – 3.0% | | | | |
| | 177,266 | | | Astec Industries, Inc. | | | 10,612,915 | |
| | 98,191 | | | Middleby Corp. (The)(b) | | | 12,138,372 | |
| | 146,536 | | | RBC Bearings, Inc.(b) | | | 11,207,073 | |
| | | | | | | | |
| | | | | | | 33,958,360 | |
| | | | | | | | |
| | | | Oil, Gas & Consumable Fuels – 2.1% | | | | |
| | 132,870 | | | Diamondback Energy, Inc.(b) | | | 12,827,270 | |
See accompanying notes to financial statements.
| 24
Portfolio of Investments – as of September 30, 2016
Loomis Sayles Small Cap Growth Fund – continued
| | | | | | | | |
| Shares | | | Description | | Value (†) | |
|
| | Common Stocks – continued | |
| | |
| | | | Oil, Gas & Consumable Fuels – continued | | | | |
| | 160,676 | | | PDC Energy, Inc.(b) | | $ | 10,774,932 | |
| | | | | | | | |
| | | | | | | 23,602,202 | |
| | | | | | | | |
| | | | Pharmaceuticals – 2.8% | | | | |
| | 199,147 | | | Dermira, Inc.(b) | | | 6,735,152 | |
| | 193,697 | | | Medicines Co. (The)(b) | | | 7,310,125 | |
| | 424,996 | | | Nektar Therapeutics(b) | | | 7,301,431 | |
| | 414,963 | | | Supernus Pharmaceuticals, Inc.(b) | | | 10,262,035 | |
| | | | | | | | |
| | | | | | | 31,608,743 | |
| | | | | | | | |
| | | | Professional Services – 1.4% | | | | |
| | 257,525 | | | WageWorks, Inc.(b) | | | 15,685,848 | |
| | | | | | | | |
| | | | Real Estate Management & Development – 0.5% | |
| | 212,814 | | | HFF, Inc., Class A | | | 5,892,820 | |
| | | | | | | | |
| | | | Semiconductors & Semiconductor Equipment – 6.3% | |
| | 324,987 | | | Inphi Corp.(b) | | | 14,140,184 | |
| | 511,733 | | | Intersil Corp. | | | 11,222,305 | |
| | 322,459 | | | MKS Instruments, Inc. | | | 16,035,886 | |
| | 196,698 | | | Monolithic Power Systems, Inc. | | | 15,834,189 | |
| | 230,667 | | | Silicon Laboratories, Inc.(b) | | | 13,563,220 | |
| | | | | | | | |
| | | | | | | 70,795,784 | |
| | | | | | | | |
| | | | Software – 7.5% | | | | |
| | 207,679 | | | Blackbaud, Inc. | | | 13,777,425 | |
| | 604,947 | | | Callidus Software, Inc.(b) | | | 11,100,778 | |
| | 190,695 | | | FleetMatics Group PLC(b) | | | 11,437,886 | |
| | 293,784 | | | Guidewire Software, Inc.(b) | | | 17,621,164 | |
| | 508,731 | | | RingCentral, Inc., Class A(b) | | | 12,036,576 | |
| | 89,896 | | | Ultimate Software Group, Inc. (The)(b) | | | 18,373,843 | |
| | | | | | | | |
| | | | | | | 84,347,672 | |
| | | | | | | | |
| | | | Specialty Retail – 1.7% | |
| | 149,775 | | | Monro Muffler Brake, Inc. | | | 9,161,737 | |
| | 624,854 | | | Tile Shop Holdings, Inc.(b) | | | 10,341,333 | |
| | | | | | | | |
| | | | | | | 19,503,070 | |
| | | | | | | | |
| | | | Textiles, Apparel & Luxury Goods – 1.7% | |
| | 163,678 | | | Columbia Sportswear Co. | | | 9,287,090 | |
| | 297,339 | | | Steven Madden Ltd.(b) | | | 10,276,036 | |
| | | | | | | | |
| | | | | | | 19,563,126 | |
| | | | | | | | |
| | | | Thrifts & Mortgage Finance – 1.0% | |
| | 435,344 | | | Essent Group Ltd.(b) | | | 11,584,504 | |
| | | | | | | | |
| | | | Trading Companies & Distributors – 1.6% | |
| | 230,983 | | | Beacon Roofing Supply, Inc.(b) | | | 9,717,455 | |
See accompanying notes to financial statements.
25 |
Portfolio of Investments – as of September 30, 2016
Loomis Sayles Small Cap Growth Fund – continued
| | | | | | | | |
| Shares | | | Description | | Value (†) | |
|
| | Common Stocks – continued | |
| |
| | | | Trading Companies & Distributors – continued | |
| | 227,823 | | | SiteOne Landscape Supply, Inc.(b) | | $ | 8,185,680 | |
| | | | | | | | |
| | | | | | | 17,903,135 | |
| | | | | | | | |
| | |
| | | | Total Common Stocks
(Identified Cost $879,197,130) | | | 1,091,709,628 | |
| | | | | | | | |
| | |
| Principal
Amount |
| | | | | | |
|
| | Short-Term Investments – 3.0% | |
| $ | 34,249,644 | | | Tri-Party Repurchase Agreement with Fixed Income Clearing Corporation, dated 9/30/2016 at 0.030% to be repurchased at $34,249,730 on 10/03/2016 collateralized by $34,550,000 U.S. Treasury Note, 1.500% due 3/31/2023 valued at $34,938,688 including accrued interest (Note 2 of Notes to Financial Statements)(Identified Cost $34,249,644) | | | 34,249,644 | |
| | | | | | | | |
| | |
| | | | Total Investments – 99.8%
(Identified Cost $913,446,774)(a) | | | 1,125,959,272 | |
| | | | Other assets less liabilities—0.2% | | | 1,826,692 | |
| | | | | | | | |
| | | | Net Assets – 100.0% | | $ | 1,127,785,964 | |
| | | | | | | | |
| |
| | (†) | | | See Note 2 of Notes to Financial Statements. | |
| | (a) | | | Federal Tax Information: | |
| | | | At September 30, 2016, the net unrealized appreciation on investments based on a cost of $913,910,875 for federal income tax purposes was as follows: | |
| | | | Aggregate gross unrealized appreciation for all investments in which there is an excess of value over tax cost | | $ | 225,493,195 | |
| | | | Aggregate gross unrealized depreciation for all investments in which there is an excess of tax cost over value | | | (13,444,798 | ) |
| | | | | | | | |
| | | | Net unrealized appreciation | | $ | 212,048,397 | |
| | | | | | | | |
| | (b) | | | Non-income producing security. | |
| |
| | ADR | | | An American Depositary Receipt is a certificate issued by a custodian bank representing the right to receive securities of the foreign issuer described. The values of ADRs may be significantly influenced by trading on exchanges not located in the United States. | |
See accompanying notes to financial statements.
| 26
Portfolio of Investments – as of September 30, 2016
Loomis Sayles Small Cap Growth Fund – continued
Industry Summary at September 30, 2016
| | | | |
Health Care Equipment & Supplies | | | 8.2 | % |
Software | | | 7.5 | |
Internet Software & Services | | | 7.1 | |
Semiconductors & Semiconductor Equipment | | | 6.3 | |
Health Care Providers & Services | | | 4.6 | |
IT Services | | | 4.3 | |
Banks | | | 4.2 | |
Diversified Consumer Services | | | 3.7 | |
Hotels, Restaurants & Leisure | | | 3.6 | |
Machinery | | | 3.0 | |
Health Care Technology | | | 3.0 | |
Life Sciences Tools & Services | | | 2.8 | |
Pharmaceuticals | | | 2.8 | |
Capital Markets | | | 2.5 | |
Biotechnology | | | 2.5 | |
Household Durables | | | 2.4 | |
Diversified Telecommunication Services | | | 2.3 | |
Building Products | | | 2.2 | |
Construction & Engineering | | | 2.2 | |
Oil, Gas & Consumable Fuels | | | 2.1 | |
Food Products | | | 2.0 | |
Other Investments, less than 2% each | | | 17.5 | |
Short-Term Investments | | | 3.0 | |
| | | | |
Total Investments | | | 99.8 | |
Other assets less liabilities | | | 0.2 | |
| | | | |
Net Assets | | | 100.0 | % |
| | | | |
See accompanying notes to financial statements.
27 |
Portfolio of Investments – as of September 30, 2016
Loomis Sayles Small Cap Value Fund
| | | | | | | | |
| Shares | | | Description | | Value (†) | |
|
| | Common Stocks – 98.2% of Net Assets | |
| |
| | | | Aerospace & Defense – 2.1% | |
| | 258,206 | | | Aerojet Rocketdyne Holdings, Inc.(b) | | $ | 4,539,261 | |
| | 257,814 | | | BWX Technologies, Inc. | | | 9,892,323 | |
| | 272,965 | | | DigitalGlobe, Inc.(b) | | | 7,506,538 | |
| | | | | | | | |
| | | | | | | 21,938,122 | |
| | | | | | | | |
| | | | Auto Components – 1.9% | |
| | 136,200 | | | Cooper Tire & Rubber Co. | | | 5,178,324 | |
| | 183,745 | | | Fox Factory Holding Corp.(b) | | | 4,220,623 | |
| | 311,349 | | | Horizon Global Corp.(b) | | | 6,205,185 | |
| | 63,951 | | | Tenneco, Inc.(b) | | | 3,726,425 | |
| | | | | | | | |
| | | | | | | 19,330,557 | |
| | | | | | | | |
| | | | Banks – 17.1% | |
| | 420,939 | | | BancorpSouth, Inc. | | | 9,765,785 | |
| | 160,341 | | | Bank of the Ozarks, Inc. | | | 6,157,094 | |
| | 258,326 | | | Bryn Mawr Bank Corp. | | | 8,263,849 | |
| | 450,864 | | | Cathay General Bancorp | | | 13,877,594 | |
| | 217,763 | | | Chemical Financial Corp. | | | 9,609,881 | |
| | 533,038 | | | CVB Financial Corp. | | | 9,386,799 | |
| | 541,604 | | | First Financial Bancorp | | | 11,828,631 | |
| | 193,155 | | | First Financial Bankshares, Inc. | | | 7,038,568 | |
| | 411,049 | | | Home BancShares, Inc. | | | 8,553,930 | |
| | 173,656 | | | IBERIABANK Corp. | | | 11,655,791 | |
| | 168,106 | | | LegacyTexas Financial Group, Inc. | | | 5,317,193 | |
| | 247,775 | | | PacWest Bancorp | | | 10,632,025 | |
| | 177,536 | | | Pinnacle Financial Partners, Inc. | | | 9,601,147 | |
| | 284,947 | | | Popular, Inc. | | | 10,890,674 | |
| | 156,062 | | | Prosperity Bancshares, Inc. | | | 8,566,243 | |
| | 99,750 | | | Signature Bank(b) | | | 11,815,387 | |
| | 123,418 | | | Texas Capital Bancshares, Inc.(b) | | | 6,778,117 | |
| | 255,353 | | | Triumph Bancorp, Inc.(b) | | | 5,066,204 | |
| | 226,625 | | | Wintrust Financial Corp. | | | 12,593,551 | |
| | | | | | | | |
| | | | | | | 177,398,463 | |
| | | | | | | | |
| | | | Beverages – 0.9% | |
| | 664,437 | | | Cott Corp. | | | 9,468,227 | |
| | | | | | | | |
| | | | Building Products – 2.4% | |
| | 87,946 | | | Apogee Enterprises, Inc. | | | 3,930,307 | |
| | 153,765 | | | Armstrong World Industries, Inc.(b) | | | 6,353,570 | |
| | 70,344 | | | Gibraltar Industries, Inc.(b) | | | 2,613,279 | |
| | 111,434 | | | Masonite International Corp.(b) | | | 6,927,852 | |
| | 74,254 | | | Patrick Industries, Inc.(b) | | | 4,597,808 | |
| | | | | | | | |
| | | | | | | 24,422,816 | |
| | | | | | | | |
See accompanying notes to financial statements.
| 28
Portfolio of Investments – as of September 30, 2016
Loomis Sayles Small Cap Value Fund – continued
| | | | | | | | |
| Shares | | | Description | | Value (†) | |
|
| | Common Stocks – continued | |
| |
| | | | Capital Markets – 1.0% | |
| | 20,114 | | | MarketAxess Holdings, Inc. | | $ | 3,330,677 | |
| | 191,907 | | | Stifel Financial Corp.(b) | | | 7,378,824 | |
| | | | | | | | |
| | | | | | | 10,709,501 | |
| | | | | | | | |
| | | | Chemicals – 1.4% | |
| | 120,054 | | | Cabot Corp. | | | 6,292,030 | |
| | 118,130 | | | Minerals Technologies, Inc. | | | 8,350,610 | |
| | | | | | | | |
| | | | | | | 14,642,640 | |
| | | | | | | | |
| | | | Commercial Services & Supplies – 4.3% | |
| | 94,019 | | | Clean Harbors, Inc.(b) | | | 4,511,032 | |
| | 300,147 | | | KAR Auction Services, Inc. | | | 12,954,345 | |
| | 294,782 | | | Kimball International, Inc. | | | 3,814,479 | |
| | 102,095 | | | Knoll, Inc. | | | 2,332,871 | |
| | 327,274 | | | R.R. Donnelley & Sons Co. | | | 5,144,747 | |
| | 238,745 | | | Viad Corp. | | | 8,802,528 | |
| | 290,843 | | | West Corp. | | | 6,421,813 | |
| | | | | | | | |
| | | | | | | 43,981,815 | |
| | | | | | | | |
| | | | Communications Equipment – 1.8% | |
| | 243,219 | | | ARRIS International PLC(b) | | | 6,890,394 | |
| | 337,076 | | | Calix, Inc.(b) | | | 2,477,509 | |
| | 343,605 | | | Digi International, Inc.(b) | | | 3,917,097 | |
| | 709,626 | | | Viavi Solutions, Inc.(b) | | | 5,244,136 | |
| | | | | | | | |
| | | | | | | 18,529,136 | |
| | | | | | | | |
| | | | Construction & Engineering – 1.6% | |
| | 110,895 | | | Argan, Inc. | | | 6,563,875 | |
| | 170,800 | | | MYR Group, Inc.(b) | | | 5,141,080 | |
| | 183,611 | | | Quanta Services, Inc.(b) | | | 5,139,272 | |
| | | | | | | | |
| | | | | | | 16,844,227 | |
| | | | | | | | |
| | | | Construction Materials – 0.8% | |
| | 221,752 | | | Summit Materials, Inc., Class A(b) | | | 4,113,500 | |
| | 94,184 | | | U.S. Concrete, Inc.(b) | | | 4,338,586 | |
| | | | | | | | |
| | | | | | | 8,452,086 | |
| | | | | | | | |
| | | | Consumer Finance – 0.5% | |
| | 145,279 | | | PRA Group, Inc.(b) | | | 5,017,937 | |
| | | | | | | | |
| | | | Distributors – 0.8% | |
| | 219,700 | | | Core-Mark Holding Co., Inc. | | | 7,865,260 | |
| | | | | | | | |
| | | | Diversified Consumer Services – 0.4% | |
| | 277,662 | | | Houghton Mifflin Harcourt Co.(b) | | | 3,723,447 | |
| | | | | | | | |
| | | | Diversified Financial Services – 0.7% | |
| | 577,201 | | | FNFV Group(b) | | | 7,203,468 | |
| | | | | | | | |
See accompanying notes to financial statements.
29 |
Portfolio of Investments – as of September 30, 2016
Loomis Sayles Small Cap Value Fund – continued
| | | | | | | | |
| Shares | | | Description | | Value (†) | |
|
| | Common Stocks – continued | |
| |
| | | | Electric Utilities – 1.2% | |
| | 200,898 | | | ALLETE, Inc. | | $ | 11,977,539 | |
| | | | | | | | |
| | | | Electrical Equipment – 1.1% | |
| | 45,465 | | | AZZ, Inc. | | | 2,967,501 | |
| | 341,965 | | | Babcock & Wilcox Enterprises, Inc.(b) | | | 5,642,422 | |
| | 34,846 | | | EnerSys | | | 2,410,995 | |
| | | | | | | | |
| | | | | | | 11,020,918 | |
| | | | | | | | |
| | | | Electronic Equipment, Instruments & Components – 5.0% | |
| | 107,123 | | | Belden, Inc. | | | 7,390,416 | |
| | 260,384 | | | II-VI, Inc.(b) | | | 6,335,143 | |
| | 83,204 | | | Kimball Electronics, Inc.(b) | | | 1,153,207 | |
| | 123,871 | | | Littelfuse, Inc. | | | 15,955,823 | |
| | 213,702 | | | Methode Electronics, Inc. | | | 7,473,159 | |
| | 110,650 | | | Rogers Corp.(b) | | | 6,758,502 | |
| | 146,249 | | | VeriFone Systems, Inc.(b) | | | 2,301,959 | |
| | 312,576 | | | Vishay Intertechnology, Inc. | | | 4,404,196 | |
| | | | | | | | |
| | | | | | | 51,772,405 | |
| | | | | | | | |
| | | | Energy Equipment & Services – 2.4% | |
| | 150,461 | | | Bristow Group, Inc. | | | 2,109,463 | |
| | 240,094 | | | Natural Gas Services Group, Inc.(b) | | | 5,903,912 | |
| | 326,184 | | | RPC, Inc.(b) | | | 5,479,891 | |
| | 240,166 | | | U.S. Silica Holdings, Inc. | | | 11,182,129 | |
| | | | | | | | |
| | | | | | | 24,675,395 | |
| | | | | | | | |
| | | | Food & Staples Retailing – 0.8% | |
| | 276,400 | | | SpartanNash Co. | | | 7,993,488 | |
| | | | | | | | |
| | | | Food Products – 2.0% | |
| | 311,985 | | | Darling Ingredients, Inc.(b) | | | 4,214,917 | |
| | 27,071 | | | J&J Snack Foods Corp. | | | 3,224,697 | |
| | 173,768 | | | Post Holdings, Inc.(b) | | | 13,409,677 | |
| | | | | | | | |
| | | | | | | 20,849,291 | |
| | | | | | | | |
| | | | Health Care Equipment & Supplies – 1.8% | |
| | 71,870 | | | Cynosure, Inc., Class A(b) | | | 3,661,058 | |
| | 210,698 | | | Halyard Health, Inc.(b) | | | 7,302,793 | |
| | 162,457 | | | SurModics, Inc.(b) | | | 4,888,331 | |
| | 14,621 | | | Teleflex, Inc. | | | 2,457,059 | |
| | | | | | | | |
| | | | | | | 18,309,241 | |
| | | | | | | | |
| | | | Health Care Providers & Services – 1.2% | |
| | 263,440 | | | PharMerica Corp.(b) | | | 7,394,761 | |
| | 44,442 | | | WellCare Health Plans, Inc.(b) | | | 5,203,714 | |
| | | | | | | | |
| | | | | | | 12,598,475 | |
| | | | | | | | |
See accompanying notes to financial statements.
| 30
Portfolio of Investments – as of September 30, 2016
Loomis Sayles Small Cap Value Fund – continued
| | | | | | | | |
| Shares | | | Description | | Value (†) | |
|
| | Common Stocks – continued | |
| |
| | | | Hotels, Restaurants & Leisure – 3.9% | |
| | 328,250 | | | Carrols Restaurant Group, Inc.(b) | | $ | 4,336,182 | |
| | 76,273 | | | Churchill Downs, Inc. | | | 11,162,554 | |
| | 24,829 | | | Cracker Barrel Old Country Store, Inc. | | | 3,282,890 | |
| | 84,048 | | | Del Frisco’s Restaurant Group, Inc.(b) | | | 1,132,127 | |
| | 142,945 | | | J. Alexander’s Holdings, Inc.(b) | | | 1,448,033 | |
| | 130,415 | | | Marriott Vacations Worldwide Corp. | | | 9,562,028 | |
| | 175,805 | | | Six Flags Entertainment Corp. | | | 9,424,906 | |
| | | | | | | | |
| | | | | | | 40,348,720 | |
| | | | | | | | |
| | | | Household Durables – 0.7% | |
| | 88,268 | | | Helen of Troy Ltd.(b) | | | 7,606,054 | |
| | | | | | | | |
| | | | Household Products – 0.4% | |
| | 295,958 | | | HRG Group, Inc.(b) | | | 4,646,541 | |
| | | | | | | | |
| | | | Industrial Conglomerates – 0.7% | |
| | 318,788 | | | Raven Industries, Inc. | | | 7,341,688 | |
| | | | | | | | |
| | | | Insurance – 3.6% | |
| | 125,076 | | | Atlas Financial Holdings, Inc.(b) | | | 1,972,448 | |
| | 371,538 | | | Employers Holdings, Inc. | | | 11,082,979 | |
| | 123,428 | | | First American Financial Corp. | | | 4,848,252 | |
| | 172,223 | | | ProAssurance Corp. | | | 9,038,263 | |
| | 96,732 | | | Reinsurance Group of America, Inc., Class A | | | 10,441,252 | |
| | | | | | | | |
| | | | | | | 37,383,194 | |
| | | | | | | | |
| | | | Internet & Direct Marketing Retail – 1.5% | |
| | 519,741 | | | 1-800-Flowers.com, Inc., Class A(b) | | | 4,766,025 | |
| | 81,135 | | | HSN, Inc. | | | 3,229,173 | |
| | 201,375 | | | Liberty Ventures, Series A(b) | | | 8,028,821 | |
| | | | | | | | |
| | | | | | | 16,024,019 | |
| | | | | | | | |
| | | | Internet Software & Services – 0.9% | |
| | 20,137 | | | CommerceHub, Inc., Series A(b) | | | 318,164 | |
| | 176,033 | | | CommerceHub, Inc., Series C(b) | | | 2,800,685 | |
| | 92,993 | | | IAC/InterActiveCorp | | | 5,809,273 | |
| | | | | | | | |
| | | | | | | 8,928,122 | |
| | | | | | | | |
| | | | IT Services – 5.1% | |
| | 305,516 | | | Booz Allen Hamilton Holding Corp. | | | 9,657,361 | |
| | 118,302 | | | CSG Systems International, Inc. | | | 4,889,421 | |
| | 90,390 | | | DST Systems, Inc. | | | 10,658,789 | |
| | 136,906 | | | Euronet Worldwide, Inc.(b) | | | 11,203,018 | |
| | 323,807 | | | Perficient, Inc.(b) | | | 6,524,711 | |
| | 94,412 | | | WEX, Inc.(b) | | | 10,204,993 | |
| | | | | | | | |
| | | | | | | 53,138,293 | |
| | | | | | | | |
See accompanying notes to financial statements.
31 |
Portfolio of Investments – as of September 30, 2016
Loomis Sayles Small Cap Value Fund – continued
| | | | | | | | |
| Shares | | | Description | | Value (†) | |
|
| | Common Stocks – continued | |
| |
| | | | Life Sciences Tools & Services – 1.4% | |
| | 336,621 | | | Albany Molecular Research, Inc.(b) | | $ | 5,557,612 | |
| | 308,530 | | | VWR Corp.(b) | | | 8,749,911 | |
| | | | | | | | |
| | | | | | | 14,307,523 | |
| | | | | | | | |
| | | | Machinery – 3.7% | |
| | 72,415 | | | Alamo Group, Inc. | | | 4,771,424 | |
| | 170,875 | | | Albany International Corp., Class A | | | 7,241,683 | |
| | 90,233 | | | Altra Industrial Motion Corp. | | | 2,614,050 | |
| | 143,397 | | | John Bean Technologies Corp. | | | 10,116,658 | |
| | 136,715 | | | RBC Bearings, Inc.(b) | | | 10,455,963 | |
| | 30,804 | | | Standex International Corp. | | | 2,860,768 | |
| | | | | | | | |
| | | | | | | 38,060,546 | |
| | | | | | | | |
| | | | Marine – 0.5% | |
| | 78,077 | | | Kirby Corp.(b) | | | 4,853,266 | |
| | | | | | | | |
| | | | Media – 2.7% | |
| | 482,936 | | | E.W. Scripps Co. (The), Class A(b) | | | 7,678,683 | |
| | 133,851 | | | John Wiley & Sons, Inc., Class A | | | 6,908,050 | |
| | 522,374 | | | National CineMedia, Inc. | | | 7,689,345 | |
| | 348,210 | | | New Media Investment Group, Inc. | | | 5,397,255 | |
| | | | | | | | |
| | | | | | | 27,673,333 | |
| | | | | | | | |
| | | | Metals & Mining – 0.9% | |
| | 507,316 | | | Ferroglobe PLC | | | 4,581,063 | |
| | 135,487 | | | Haynes International, Inc. | | | 5,027,923 | |
| | | | | | | | |
| | | | | | | 9,608,986 | |
| | | | | | | | |
| | | | Multi-Utilities – 1.0% | |
| | 180,993 | | | NorthWestern Corp. | | | 10,412,527 | |
| | | | | | | | |
| | | | Oil, Gas & Consumable Fuels – 1.3% | |
| | 340,418 | | | QEP Resources, Inc. | | | 6,648,364 | |
| | 997,011 | | | Synergy Resources Corp.(b) | | | 6,909,286 | |
| | | | | | | | |
| | | | | | | 13,557,650 | |
| | | | | | | | |
| | | | Pharmaceuticals – 0.9% | |
| | 139,559 | | | Akorn, Inc.(b) | | | 3,804,378 | |
| | 208,513 | | | Catalent, Inc.(b) | | | 5,387,976 | |
| | | | | | | | |
| | | | | | | 9,192,354 | |
| | | | | | | | |
| | | | Professional Services – 1.3% | |
| | 112,479 | | | FTI Consulting, Inc.(b) | | | 5,012,064 | |
| | 57,421 | | | Insperity, Inc. | | | 4,171,062 | |
| | 204,386 | | | Korn/Ferry International | | | 4,292,106 | |
| | | | | | | | |
| | | | | | | 13,475,232 | |
| | | | | | | | |
See accompanying notes to financial statements.
| 32
Portfolio of Investments – as of September 30, 2016
Loomis Sayles Small Cap Value Fund – continued
| | | | | | | | |
| Shares | | | Description | | Value (†) | |
|
| | Common Stocks – continued | |
| |
| | | | REITs – Apartments – 1.9% | |
| | 179,360 | | | American Campus Communities, Inc. | | $ | 9,124,043 | |
| | 114,710 | | | Mid-America Apartment Communities, Inc. | | | 10,781,593 | |
| | | | | | | | |
| | | | | | | 19,905,636 | |
| | | | | | | | |
| | | | REITs – Health Care – 0.4% | |
| | 171,646 | | | Sabra Healthcare REIT, Inc. | | | 4,322,046 | |
| | | | | | | | |
| | | | REITs – Hotels – 0.5% | |
| | 283,562 | | | Hersha Hospitality Trust | | | 5,109,787 | |
| | | | | | | | |
| | | | REITs – Shopping Centers – 1.3% | |
| | 634,041 | | | Retail Opportunity Investments Corp. | | | 13,923,540 | |
| | | | | | | | |
| | | | REITs – Single Tenant – 0.8% | |
| | 159,592 | | | National Retail Properties, Inc. | | | 8,115,253 | |
| | | | | | | | |
| | | | REITs – Storage – 1.5% | |
| | 351,530 | | | CubeSmart | | | 9,582,708 | |
| | 72,288 | | | Life Storage, Inc. | | | 6,429,295 | |
| | | | | | | | |
| | | | | | | 16,012,003 | |
| | | | | | | | |
| | | | Road & Rail – 1.7% | |
| | 104,752 | | | Avis Budget Group, Inc.(b) | | | 3,583,566 | |
| | 94,380 | | | Genesee & Wyoming, Inc., Class A(b) | | | 6,507,501 | |
| | 108,812 | | | Old Dominion Freight Line, Inc.(b) | | | 7,465,591 | |
| | | | | | | | |
| | | | | | | 17,556,658 | |
| | | | | | | | |
| | | | Semiconductors & Semiconductor Equipment – 2.0% | |
| | 192,205 | | | Advanced Energy Industries, Inc.(b) | | | 9,095,141 | |
| | 132,532 | | | Semtech Corp.(b) | | | 3,675,112 | |
| | 367,420 | | | Teradyne, Inc. | | | 7,928,924 | |
| | | | | | | | |
| | | | | | | 20,699,177 | |
| | | | | | | | |
| | | | Software – 1.4% | |
| | 219,255 | | | Synchronoss Technologies, Inc.(b) | | | 9,028,921 | |
| | 146,376 | | | Verint Systems, Inc.(b) | | | 5,508,129 | |
| | | | | | | | |
| | | | | | | 14,537,050 | |
| | | | | | | | |
| | | | Specialty Retail – 1.8% | |
| | 270,309 | | | Barnes & Noble, Inc. | | | 3,054,492 | |
| | 145,400 | | | Genesco, Inc.(b) | | | 7,918,484 | |
| | 857,886 | | | Office Depot, Inc. | | | 3,062,653 | |
| | 161,351 | | | Sally Beauty Holdings, Inc.(b) | | | 4,143,493 | |
| | | | | | | | |
| | | | | | | 18,179,122 | |
| | | | | | | | |
| | | | Thrifts & Mortgage Finance – 0.5% | |
| | 131,644 | | | Federal Agricultural Mortgage Corp., Class C | | | 5,199,938 | |
| | | | | | | | |
See accompanying notes to financial statements.
33 |
Portfolio of Investments – as of September 30, 2016
Loomis Sayles Small Cap Value Fund – continued
| | | | | | | | |
| Shares | | | Description | | Value (†) | |
|
| | Common Stocks – continued | |
| |
| | | | Transportation Infrastructure – 0.7% | |
| | 83,303 | | | Macquarie Infrastructure Corp. | | $ | 6,934,142 | |
| | | | | | | | |
| | |
| | | | Total Common Stocks
(Identified Cost $716,953,373) | | | 1,015,776,854 | |
| | | | | | | | |
|
| | Closed-End Investment Companies – 0.6% | |
| | 462,007 | | | Hercules Capital, Inc.
(Identified Cost $6,009,463) | | | 6,264,815 | |
| | | | | | | | |
| | |
| Principal
Amount |
| | | | | | |
|
| | Short-Term Investments – 1.5% | |
| $ | 16,131,843 | | | Tri-Party Repurchase Agreement with Fixed Income Clearing Corporation, dated 9/30/2016 at 0.030% to be repurchased at $16,131,883 on 10/03/2016 collateralized by $15,255,000 U.S. Treasury Note, 2.500% due 8/15/2023 valued at $16,456,331 including accrued interest (Note 2 of Notes to Financial Statements) (Identified Cost $16,131,843) | | | 16,131,843 | |
| | | | | | | | |
| | |
| | | | Total Investments – 100.3%
(Identified Cost $739,094,679)(a) | | | 1,038,173,512 | |
| | | | Other assets less liabilities—(0.3)% | | | (3,431,431 | ) |
| | | | | | | | |
| | | | Net Assets – 100.0% | | $ | 1,034,742,081 | |
| | | | | | | | |
| |
| | (†) | | | See Note 2 of Notes to Financial Statements. | |
| | (a) | | | Federal Tax Information: | |
| | | | At September 30, 2016, the net unrealized appreciation on investments based on a cost of $736,517,809 for federal income tax purposes was as follows: | |
| | | | Aggregate gross unrealized appreciation for all investments in which there is an excess of value over tax cost | | $ | 329,934,005 | |
| | | | Aggregate gross unrealized depreciation for all investments in which there is an excess of tax cost over value | | | (28,278,302 | ) |
| | | | | | | | |
| | | | Net unrealized appreciation | | $ | 301,655,703 | |
| | | | | | | | |
| | (b) | | | Non-income producing security. | |
| |
| | REITs | | | Real Estate Investment Trusts | |
See accompanying notes to financial statements.
| 34
Portfolio of Investments – as of September 30, 2016
Loomis Sayles Small Cap Value Fund – continued
Industry Summary at September 30, 2016
| | | | |
Banks | | | 17.1 | % |
IT Services | | | 5.1 | |
Electronic Equipment, Instruments & Components | | | 5.0 | |
Commercial Services & Supplies | | | 4.3 | |
Hotels, Restaurants & Leisure | | | 3.9 | |
Machinery | | | 3.7 | |
Insurance | | | 3.6 | |
Media | | | 2.7 | |
Energy Equipment & Services | | | 2.4 | |
Building Products | | | 2.4 | |
Aerospace & Defense | | | 2.1 | |
Food Products | | | 2.0 | |
Semiconductors & Semiconductor Equipment | | | 2.0 | |
Other Investments, less than 2% each | | | 42.5 | |
Short-Term Investments | | | 1.5 | |
| | | | |
Total Investments | | | 100.3 | |
Other assets less liabilities | | | (0.3 | ) |
| | | | |
Net Assets | | | 100.0 | % |
| | | | |
See accompanying notes to financial statements.
35 |
Portfolio of Investments – as of September 30, 2016
Loomis Sayles Small/Mid Cap Growth Fund
| | | | | | | | |
| Shares | | | Description | | Value (†) | |
|
| | Common Stocks – 97.2% of Net Assets | |
| |
| | | | Aerospace & Defense – 4.7% | |
| | 3,649 | | | B/E Aerospace, Inc. | | $ | 188,508 | |
| | 3,327 | | | Hexcel Corp. | | | 147,386 | |
| | 793 | | | TransDigm Group, Inc.(b) | | | 229,272 | |
| | | | | | | | |
| | | | | | | 565,166 | |
| | | | | | | | |
| | | | Air Freight & Logistics – 1.0% | |
| | 3,282 | | | XPO Logistics, Inc.(b) | | | 120,351 | |
| | | | | | | | |
| | | | Auto Components – 1.0% | |
| | 1,189 | | | Drew Industries, Inc. | | | 116,546 | |
| | | | | | | | |
| | | | Banks – 4.5% | |
| | 3,807 | | | Columbia Banking System, Inc. | | | 124,565 | |
| | 2,259 | | | First Republic Bank | | | 174,192 | |
| | 4,149 | | | Home BancShares, Inc. | | | 86,341 | |
| | 4,147 | | | Western Alliance Bancorp(b) | | | 155,678 | |
| | | | | | | | |
| | | | | | | 540,776 | |
| | | | | | | | |
| | | | Biotechnology – 2.2% | |
| | 10,554 | | | Ironwood Pharmaceuticals, Inc.(b) | | | 167,597 | |
| | 1,845 | | | Neurocrine Biosciences, Inc.(b) | | | 93,431 | |
| | | | | | | | |
| | | | | | | 261,028 | |
| | | | | | | | |
| | | | Capital Markets – 4.9% | |
| | 2,267 | | | CBOE Holdings, Inc. | | | 147,015 | |
| | 1,074 | | | MarketAxess Holdings, Inc. | | | 177,844 | |
| | 1,565 | | | MSCI, Inc. | | | 131,366 | |
| | 2,815 | | | SEI Investments Co. | | | 128,392 | |
| | | | | | | | |
| | | | | | | 584,617 | |
| | | | | | | | |
| | | | Commercial Services & Supplies – 4.2% | |
| | 4,363 | | | Healthcare Services Group, Inc. | | | 172,688 | |
| | 3,797 | | | KAR Auction Services, Inc. | | | 163,878 | |
| | 4,878 | | | Ritchie Bros. Auctioneers, Inc. | | | 171,071 | |
| | | | | | | | |
| | | | | | | 507,637 | |
| | | | | | | | |
| | | | Construction Materials – 0.8% | |
| | 5,686 | | | Headwaters, Inc.(b) | | | 96,207 | |
| | | | | | | | |
| | | | Diversified Consumer Services – 4.4% | |
| | 2,692 | | | Bright Horizons Family Solutions, Inc.(b) | | | 180,068 | |
| | 3,718 | | | Grand Canyon Education, Inc.(b) | | | 150,170 | |
| | 8,723 | | | Nord Anglia Education, Inc.(b) | | | 189,987 | |
| | | | | | | | |
| | | | | | | 520,225 | |
| | | | | | | | |
| | | | Diversified Telecommunication Services – 1.4% | |
| | 4,636 | | | Cogent Communications Holdings, Inc. | | | 170,651 | |
| | | | | | | | |
See accompanying notes to financial statements.
| 36
Portfolio of Investments – as of September 30, 2016
Loomis Sayles Small/Mid Cap Growth Fund – continued
| | | | | | | | |
| Shares | | | Description | | Value (†) | |
|
| | Common Stocks – continued | |
| |
| | | | Electrical Equipment – 3.8% | |
| | 780 | | | Acuity Brands, Inc. | | $ | 206,388 | |
| | 4,141 | | | Generac Holdings, Inc.(b) | | | 150,319 | |
| | 2,467 | | | Sensata Technologies Holding NV(b) | | | 95,670 | |
| | | | | | | | |
| | | | | | | 452,377 | |
| | | | | | | | |
| | | | Electronic Equipment, Instruments & Components – 4.1% | |
| | 1,463 | | | Coherent, Inc.(b) | | | 161,720 | |
| | 5,421 | | | National Instruments Corp. | | | 153,956 | |
| | 6,069 | | | Trimble Navigation Ltd.(b) | | | 173,331 | |
| | | | | | | | |
| | | | | | | 489,007 | |
| | | | | | | | |
| | | | Energy Equipment & Services – 0.8% | |
| | 1,789 | | | Dril-Quip, Inc.(b) | | | 99,719 | |
| | | | | | | | |
| | | | Food & Staples Retailing – 1.2% | |
| | 1,158 | | | Casey’s General Stores, Inc. | | | 139,134 | |
| | | | | | | | |
| | | | Health Care Equipment & Supplies – 7.6% | |
| | 1,878 | | | Align Technology, Inc.(b) | | | 176,062 | |
| | 2,314 | | | Cantel Medical Corp. | | | 180,446 | |
| | 1,713 | | | DexCom, Inc.(b) | | | 150,162 | |
| | 1,789 | | | STERIS PLC | | | 130,776 | |
| | 1,747 | | | West Pharmaceutical Services, Inc. | | | 130,151 | |
| | 5,907 | | | Wright Medical Group NV(b) | | | 144,899 | |
| | | | | | | | |
| | | | | | | 912,496 | |
| | | | | | | | |
| | | | Health Care Providers & Services – 6.9% | |
| | 2,329 | | | Acadia Healthcare Co., Inc.(b) | | | 115,402 | |
| | 2,203 | | | MEDNAX, Inc.(b) | | | 145,949 | |
| | 3,263 | | | Surgical Care Affiliates, Inc.(b) | | | 159,104 | |
| | 2,423 | | | VCA, Inc.(b) | | | 169,561 | |
| | 2,025 | | | WellCare Health Plans, Inc.(b) | | | 237,107 | |
| | | | | | | | |
| | | | | | | 827,123 | |
| | | | | | | | |
| | | | Health Care Technology – 2.4% | |
| | 1,151 | | | athenahealth, Inc.(b) | | | 145,164 | |
| | 5,179 | | | HealthStream, Inc.(b) | | | 142,940 | |
| | | | | | | | |
| | | | | | | 288,104 | |
| | | | | | | | |
| | | | Hotels, Restaurants & Leisure – 4.7% | |
| | 1,875 | | | Dunkin’ Brands Group, Inc. | | | 97,650 | |
| | 469 | | | Panera Bread Co., Class A(b) | | | 91,324 | |
| | 2,050 | | | Six Flags Entertainment Corp. | | | 109,901 | |
| | 2,001 | | | Texas Roadhouse, Inc. | | | 78,099 | |
| | 1,164 | | | Vail Resorts, Inc. | | | 182,608 | |
| | | | | | | | |
| | | | | | | 559,582 | |
| | | | | | | | |
See accompanying notes to financial statements.
37 |
Portfolio of Investments – as of September 30, 2016
Loomis Sayles Small/Mid Cap Growth Fund – continued
| | | | | | | | |
| Shares | | | Description | | Value (†) | |
|
| | Common Stocks – continued | |
| |
| | | | Internet Software & Services – 4.4% | |
| | 812 | | | CoStar Group, Inc.(b) | | $ | 175,822 | |
| | 4,449 | | | GTT Communications, Inc.(b) | | | 104,685 | |
| | 1,375 | | | j2 Global, Inc. | | | 91,589 | |
| | 2,173 | | | SPS Commerce, Inc.(b) | | | 159,520 | |
| | | | | | | | |
| | | | | | | 531,616 | |
| | | | | | | | |
| | | | IT Services – 5.8% | |
| | 2,360 | | | Black Knight Financial Services, Inc., Class A(b) | | | 96,524 | |
| | 5,230 | | | Booz Allen Hamilton Holding Corp. | | | 165,320 | |
| | 1,972 | | | Broadridge Financial Solutions, Inc. | | | 133,682 | |
| | 2,911 | | | ExlService Holdings, Inc.(b) | | | 145,084 | |
| | 1,748 | | | Gartner, Inc.(b) | | | 154,611 | |
| | | | | | | | |
| | | | | | | 695,221 | |
| | | | | | | | |
| | | | Leisure Products – 1.0% | |
| | 2,553 | | | Brunswick Corp. | | | 124,535 | |
| | | | | | | | |
| | | | Life Sciences Tools & Services – 1.4% | |
| | 2,189 | | | ICON PLC(b) | | | 169,363 | |
| | | | | | | | |
| | | | Machinery – 3.4% | |
| | 1,331 | | | Middleby Corp. (The)(b) | | | 164,538 | |
| | 3,190 | | | Sun Hydraulics Corp. | | | 102,941 | |
| | 2,902 | | | Toro Co. (The) | | | 135,930 | |
| | | | | | | | |
| | | | | | | 403,409 | |
| | | | | | | | |
| | | | Oil, Gas & Consumable Fuels – 2.4% | |
| | 1,524 | | | Diamondback Energy, Inc.(b) | | | 147,127 | |
| | 4,121 | | | Parsley Energy, Inc., Class A(b) | | | 138,095 | |
| | | | | | | | |
| | | | | | | 285,222 | |
| | | | | | | | |
| | | | Pharmaceuticals – 1.7% | |
| | 915 | | | Jazz Pharmaceuticals PLC(b) | | | 111,154 | |
| | 5,572 | | | Nektar Therapeutics(b) | | | 95,727 | |
| | | | | | | | |
| | | | | | | 206,881 | |
| | | | | | | | |
| | | | Professional Services – 1.3% | |
| | 4,389 | | | TransUnion(b) | | | 151,420 | |
| | | | | | | | |
| | | | Real Estate Management & Development – 1.1% | |
| | 2,792 | | | First Service Corp. | | | 130,331 | |
| | | | | | | | |
| | | | Semiconductors & Semiconductor Equipment – 3.8% | |
| | 2,957 | | | Advanced Energy Industries, Inc.(b) | | | 139,925 | |
| | 3,555 | | | MACOM Technology Solutions Holdings, Inc.(b) | | | 150,519 | |
| | 2,804 | | | Silicon Laboratories, Inc.(b) | | | 164,875 | |
| | | | | | | | |
| | | | | | | 455,319 | |
| | | | | | | | |
See accompanying notes to financial statements.
| 38
Portfolio of Investments – as of September 30, 2016
Loomis Sayles Small/Mid Cap Growth Fund – continued
| | | | | | | | |
| Shares | | | Description | | Value (†) | |
|
| | Common Stocks – continued | |
| |
| | | | Software – 8.5% | |
| | 2,733 | | | Blackbaud, Inc. | | $ | 181,307 | |
| | 8,299 | | | Callidus Software, Inc.(b) | | | 152,287 | |
| | 3,288 | | | Guidewire Software, Inc.(b) | | | 197,214 | |
| | 2,163 | | | HubSpot, Inc.(b) | | | 124,632 | |
| | 3,573 | | | Paylocity Holding Corp.(b) | | | 158,856 | |
| | 1,014 | | | Ultimate Software Group, Inc. (The)(b) | | | 207,251 | |
| | | | | | | | |
| | | | | | | 1,021,547 | |
| | | | | | | | |
| | | | Textiles, Apparel & Luxury Goods – 1.8% | |
| | 1,023 | | | Carter’s, Inc. | | | 88,705 | |
| | 2,245 | | | Columbia Sportswear Co. | | | 127,381 | |
| | | | | | | | |
| | | | | | | 216,086 | |
| | | | | | | | |
| | |
| | | | Total Common Stocks
(Identified Cost $10,581,090) | | | 11,641,696 | |
| | | | | | | | |
| | |
| Principal
Amount |
| | | | | | |
|
| | Short-Term Investments – 3.2% | |
| $ | 377,396 | | | Tri-Party Repurchase Agreement with Fixed Income Clearing Corporation, dated 9/30/2016 at 0.030% to be repurchased at $377,397 on 10/03/2016 collateralized by $360,000 U.S. Treasury Note, 2.500% due 8/15/2023 valued at $388,350 including accrued interest (Note 2 of Notes to Financial Statements)
(Identified Cost $377,396) | | | 377,396 | |
| | | | | | | | |
| | |
| | | | Total Investments – 100.4%
(Identified Cost $10,958,486)(a) | | | 12,019,092 | |
| | | | Other assets less liabilities—(0.4)% | | | (44,669 | ) |
| | | | | | | | |
| | | | Net Assets – 100.0% | | $ | 11,974,423 | |
| | | | | | | | |
| |
| | (†) | | | See Note 2 of Notes to Financial Statements. | |
| | (a) | | | Federal Tax Information: | |
| | | | At September 30, 2016, the net unrealized appreciation on investments based on a cost of $10,969,667 for federal income tax purposes was as follows: | |
| | | | Aggregate gross unrealized appreciation for all investments in which there is an excess of value over tax cost | | $ | 1,342,238 | |
| | | | Aggregate gross unrealized depreciation for all investments in which there is an excess of tax cost over value | | | (292,813 | ) |
| | | | | | | | |
| | | | Net unrealized appreciation | | $ | 1,049,425 | |
| | | | | | | | |
| | (b) | | | Non-income producing security. | |
See accompanying notes to financial statements.
39 |
Portfolio of Investments – as of September 30, 2016
Loomis Sayles Small/Mid Cap Growth Fund – continued
Industry Summary at September 30, 2016
| | | | |
Software | | | 8.5 | % |
Health Care Equipment & Supplies | | | 7.6 | |
Health Care Providers & Services | | | 6.9 | |
IT Services | | | 5.8 | |
Capital Markets | | | 4.9 | |
Aerospace & Defense | | | 4.7 | |
Hotels, Restaurants & Leisure | | | 4.7 | |
Banks | | | 4.5 | |
Internet Software & Services | | | 4.4 | |
Diversified Consumer Services | | | 4.4 | |
Commercial Services & Supplies | | | 4.2 | |
Electronic Equipment, Instruments & Components | | | 4.1 | |
Semiconductors & Semiconductor Equipment | | | 3.8 | |
Electrical Equipment | | | 3.8 | |
Machinery | | | 3.4 | |
Health Care Technology | | | 2.4 | |
Oil, Gas & Consumable Fuels | | | 2.4 | |
Biotechnology | | | 2.2 | |
Other Investments, less than 2% each | | | 14.5 | |
Short-Term Investments | | | 3.2 | |
| | | | |
Total Investments | | | 100.4 | |
Other assets less liabilities | | | (0.4 | ) |
| | | | |
Net Assets | | | 100.0 | % |
| | | | |
See accompanying notes to financial statements.
| 40
Statements of Assets and Liabilities
September 30, 2016
| | | | | | | | | | | | |
| | | Small Cap
Growth Fund | | | Small Cap
Value Fund | | | Small/Mid Cap
Growth Fund | |
ASSETS | |
Investments at cost | | $ | 913,446,774 | | | $ | 739,094,679 | | | $ | 10,958,486 | |
Net unrealized appreciation | | | 212,512,498 | | | | 299,078,833 | | | | 1,060,606 | |
| | | | | | | | | | | | |
Investments at value | | | 1,125,959,272 | | | | 1,038,173,512 | | | | 12,019,092 | |
Receivable for Fund shares sold | | | 724,010 | | | | 797,729 | | | | — | |
Receivable for securities sold | | | 11,619,181 | | | | 1,604,528 | | | | 165,957 | |
Dividends and interest receivable | | | 147,145 | | | | 867,040 | | | | 2,710 | |
Prepaid expenses (Note 7) | | | 4,579 | | | | 4,305 | | | | 46 | |
| | | | | | | | | | | | |
TOTAL ASSETS | | | 1,138,454,187 | | | | 1,041,447,114 | | | | 12,187,805 | |
| | | | | | | | | | | | |
LIABILITIES | |
Payable for securities purchased | | | 9,298,708 | | | | 5,151,716 | | | | 156,270 | |
Payable for Fund shares redeemed | | | 377,481 | | | | 587,391 | | | | — | |
Management fees payable (Note 5) | | | 715,707 | | | | 627,098 | | | | 2,077 | |
Deferred Trustees’ fees (Note 5) | | | 130,620 | | | | 188,569 | | | | 10,813 | |
Administrative fees payable (Note 5) | | | 41,030 | | | | 38,375 | | | | 420 | |
Payable to distributor (Note 5d) | | | 12,612 | | | | 9,121 | | | | 2 | |
Other accounts payable and accrued expenses | | | 92,065 | | | | 102,763 | | | | 43,800 | |
| | | | | | | | | | | | |
TOTAL LIABILITIES | | | 10,668,223 | | | | 6,705,033 | | | | 213,382 | |
| | | | | | | | | | | | |
NET ASSETS | | $ | 1,127,785,964 | | | $ | 1,034,742,081 | | | $ | 11,974,423 | |
| | | | | | | | | | | | |
NET ASSETS CONSIST OF: | |
Paid-in capital | | $ | 926,304,494 | | | $ | 660,464,310 | | | $ | 12,045,001 | |
Accumulated net investment loss/Undistributed net investment income | | | (3,237,689 | ) | | | 1,498,395 | | | | (18,730 | ) |
Accumulated net realized gain (loss) on investments | | | (7,793,339 | ) | | | 73,700,543 | | | | (1,112,454 | ) |
Net unrealized appreciation on investments | | | 212,512,498 | | | | 299,078,833 | | | | 1,060,606 | |
| | | | | | | | | | | | |
NET ASSETS | | $ | 1,127,785,964 | | | $ | 1,034,742,081 | | | $ | 11,974,423 | |
| | | | | | | | | | | | |
|
COMPUTATION OF NET ASSET VALUE AND OFFERING PRICE: | |
Institutional Class: | |
Net assets | | $ | 812,383,250 | | | $ | 654,501,090 | | | $ | 11,974,423 | |
| | | | | | | | | | | | |
Shares of beneficial interest | | | 36,871,468 | | | | 19,376,303 | | | | 1,230,336 | |
| | | | | | | | | | | | |
Net asset value, offering and redemption price per share | | $ | 22.03 | | | $ | 33.78 | | | $ | 9.73 | |
| | | | | | | | | | | | |
Retail Class: | |
Net assets | | $ | 118,669,524 | | | $ | 267,935,621 | | | $ | — | |
| | | | | | | | | | | | |
Shares of beneficial interest | | | 5,758,957 | | | | 8,039,271 | | | | — | |
| | | | | | | | | | | | |
Net asset value, offering and redemption price per share | | $ | 20.61 | | | $ | 33.33 | | | $ | — | |
| | | | | | | | | | | | |
Admin Class shares: | |
Net assets | | $ | — | | | $ | 43,973,326 | | | $ | — | |
| | | | | | | | | | | | |
Shares of beneficial interest | | | — | | | | 1,360,994 | | | | — | |
| | | | | | | | | | | | |
Net asset value, offering and redemption price per share | | $ | — | | | $ | 32.31 | | | $ | — | |
| | | | | | | | | | | | |
Class N shares: | |
Net assets | | $ | 196,733,190 | | | $ | 68,332,044 | | | $ | — | |
| | | | | | | | | | | | |
Shares of beneficial interest | | | 8,897,292 | | | | 2,021,274 | | | | — | |
| | | | | | | | | | | | |
Net asset value, offering and redemption price per share | | $ | 22.11 | | | $ | 33.81 | | | $ | — | |
| | | | | | | | | | | | |
See accompanying notes to financial statements.
41 |
Statements of Operations
For the Year Ended September 30, 2016
| | | | | | | | | | | | |
| | | Small Cap
Growth Fund | | | Small Cap
Value Fund | | | Small/Mid Cap
Growth Fund | |
INVESTMENT INCOME | |
Dividends | | $ | 5,917,987 | | | $ | 14,895,029 | | | $ | 67,845 | |
Interest | | | 13,581 | | | | 3,844 | | | | 116 | |
Less net foreign taxes withheld | | | — | | | | (45,206 | ) | | | (462 | ) |
| | | | | | | | | | | | |
| | | 5,931,568 | | | | 14,853,667 | | | | 67,499 | |
| | | | | | | | | | | | |
Expenses | | | | | | | | | | | | |
Management fees (Note 5) | | | 8,333,969 | | | | 7,820,966 | | | | 80,170 | |
Service and distribution fees (Note 5) | | | 345,619 | | | | 911,866 | | | | — | |
Administrative fees (Note 5) | | | 489,740 | | | | 459,609 | | | | 4,714 | |
Trustees’ fees and expenses (Note 5) | | | 47,185 | | | | 49,153 | | | | 18,656 | |
Transfer agent fees and expenses (Notes 5 and 6) | | | 1,133,186 | | | | 1,019,882 | | | | 1,559 | |
Audit and tax services fees | | | 41,061 | | | | 41,937 | | | | 42,280 | |
Custodian fees and expenses | | | 40,491 | | | | 29,392 | | | | 6,353 | |
Legal fees | | | 18,635 | | | | 17,055 | | | | 183 | |
Registration fees | | | 97,416 | | | | 84,402 | | | | 18,777 | |
Shareholder reporting expenses | | | 71,115 | | | | 76,323 | | | | 1,215 | |
Miscellaneous expenses (Note 7) | | | 36,182 | | | | 35,811 | | | | 12,910 | |
| | | | | | | | | | | | |
Total expenses | | | 10,654,599 | | | | 10,546,396 | | | | 186,817 | |
Less waiver and/or expense reimbursement (Note 5) | | | — | | | | (283,441 | ) | | | (95,958 | ) |
| | | | | | | | | | | | |
Net expenses | | | 10,654,599 | | | | 10,262,955 | | | | 90,859 | |
| | | | | | | | | | | | |
Net investment income (loss) | | | (4,723,031 | ) | | | 4,590,712 | | | | (23,360 | ) |
| | | | | | | | | | | | |
| | | |
NET REALIZED AND UNREALIZED GAIN (LOSS) ON INVESTMENTS | | | | | | | | | | | | |
Net realized gain (loss) on: | | | | | | | | | | | | |
Investments | | | (7,969,145 | ) | | | 95,614,322 | | | | (943,201 | ) |
Net change in unrealized appreciation (depreciation) on: | | | | | | | | | | | | |
Investments | | | 88,312,376 | | | | 60,726,807 | | | | 1,835,053 | |
| | | | | | | | | | | | |
Net realized and unrealized gain on investments | | | 80,343,231 | | | | 156,341,129 | | | | 891,852 | |
| | | | | | | | | | | | |
| | | |
NET INCREASE IN NET ASSETS RESULTING FROM OPERATIONS | | $ | 75,620,200 | | | $ | 160,931,841 | | | $ | 868,492 | |
| | | | | | | | | | | | |
See accompanying notes to financial statements.
| 42
Statements of Changes in Net Assets
| | | | | | | | | | | | | | | | |
| | | Small Cap Growth Fund | | | Small Cap Value Fund | |
| | | Year Ended
September 30,
2016 | | | Year Ended
September 30,
2015 | | | Year Ended
September 30,
2016 | | | Year Ended
September 30,
2015 | |
FROM OPERATIONS: | |
Net investment income (loss) | | $ | (4,723,031 | ) | | $ | (6,768,383 | ) | | $ | 4,590,712 | | | $ | 7,744,624 | |
Net realized gain (loss) on investments | | | (7,969,145 | ) | | | 96,389,671 | | | | 95,614,322 | | | | 106,149,654 | |
Net change in unrealized appreciation (depreciation) on investments | | | 88,312,376 | | | | (39,045,091 | ) | | | 60,726,807 | | | | (93,246,609 | ) |
| | | | | | | | | | | | | | | | |
Net increase in net assets resulting from operations | | | 75,620,200 | | | | 50,576,197 | | | | 160,931,841 | | | | 20,647,669 | |
| | | | | | | | | | | | | | | | |
FROM DISTRIBUTIONS TO SHAREHOLDERS: | | | | | | | | | | | | | | | | |
Net investment income | | | | | | | | | | | | | | | | |
Institutional Class | | | — | | | | — | | | | (4,437,216 | ) | | | (4,236,276 | ) |
Retail Class | | | — | | | | — | | | | (1,004,613 | ) | | | (1,054,845 | ) |
Admin Class | | | — | | | | — | | | | (29,796 | ) | | | (1,677 | ) |
Class N | | | — | | | | — | | | | (305,471 | ) | | | (44,634 | ) |
Net realized capital gains | | | | | | | | | | | | | | | | |
Institutional Class | | | (60,491,317 | ) | | | (121,284,863 | ) | | | (64,722,294 | ) | | | (93,076,570 | ) |
Retail Class | | | (11,886,045 | ) | | | (25,100,168 | ) | | | (27,186,960 | ) | | | (45,284,938 | ) |
Admin Class | | | — | | | | — | | | | (4,490,438 | ) | | | (7,970,136 | ) |
Class N | | | (13,284,984 | ) | | | (2,724,416 | ) | | | (3,940,507 | ) | | | (870,050 | ) |
| | | | | | | | | | | | | | | | |
Total distributions | | | (85,662,346 | ) | | | (149,109,447 | ) | | | (106,117,295 | ) | | | (152,539,126 | ) |
| | | | | | | | | | | | | | | | |
NET INCREASE (DECREASE) IN NET ASSETS FROM CAPITAL SHARE TRANSACTIONS (NOTE 10) | | | 11,449,327 | | | | 182,307,468 | | | | (76,857,263 | ) | | | 34,718,995 | |
| | | | | | | | | | | | | | | | |
Net increase (decrease) in net assets | | | 1,407,181 | | | | 83,774,218 | | | | (22,042,717 | ) | | | (97,172,462 | ) |
NET ASSETS | |
Beginning of the year | | | 1,126,378,783 | | | | 1,042,604,565 | | | | 1,056,784,798 | | | | 1,153,957,260 | |
| | | | | | | | | | | | | | | | |
End of the year | | $ | 1,127,785,964 | | | $ | 1,126,378,783 | | | $ | 1,034,742,081 | | | $ | 1,056,784,798 | |
| | | | | | | | | | | | | | | | |
ACCUMULATED NET INVESTMENT LOSS/UNDISTRIBUTED NET INVESTMENT INCOME | | $ | (3,237,689 | ) | | $ | (5,262,820 | ) | | $ | 1,498,395 | | | $ | 3,993,205 | |
| | | | | | | | | | | | | | | | |
See accompanying notes to financial statements.
43 |
Statements of Changes in Net Assets – continued
| | | | | | | | |
| | | Small/Mid Cap Growth Fund | |
| | | Year Ended
September 30,
2016 | | | Period Ended
September 30,
2015(a) | |
FROM OPERATIONS: | |
Net investment loss | | $ | (23,360 | ) | | $ | (13,202 | ) |
Net realized loss on investments | | | (943,201 | ) | | | (169,253 | ) |
Net change in unrealized appreciation (depreciation) on investments | | | 1,835,053 | | | | (774,447 | ) |
| | | | | | | | |
Net increase (decrease) in net assets resulting from operations | | | 868,492 | | | | (956,902 | ) |
| | | | | | | | |
NET INCREASE IN NET ASSETS FROM CAPITAL SHARE TRANSACTIONS (NOTE 10) | | | 1,863,761 | | | | 10,199,072 | |
| | | | | | | | |
Net increase in net assets | | | 2,732,253 | | | | 9,242,170 | |
|
NET ASSETS | |
Beginning of the year | | | 9,242,170 | | | | — | |
| | | | | | | | |
End of the year | | $ | 11,974,423 | | | $ | 9,242,170 | |
| | | | | | | | |
ACCUMULATED NET INVESTMENT LOSS | | $ | (18,730 | ) | | $ | (1,922 | ) |
| | | | | | | | |
| (a) | From commencement of operations on June 30, 2015 through September 30, 2015. |
See accompanying notes to financial statements.
| 44
Financial Highlights
For a share outstanding throughout each period.
| | | | | | | | | | | | | | | | | | | | | | | | |
| | | Small Cap Growth Fund—Institutional Class | | | | |
| | | Year Ended
September 30,
2016 | | | Year Ended
September 30,
2015 | | | Year Ended
September 30,
2014 | | | Year Ended
September 30,
2013 | | | Year Ended
September 30,
2012 | | | | |
Net asset value, beginning of the period | | $ | 22.22 | | | $ | 24.27 | | | $ | 26.35 | | | $ | 19.17 | | | $ | 15.06 | | | | | |
| | | | |
INCOME (LOSS) FROM INVESTMENT OPERATIONS: | | | | | | | | | | | | | | | | | | | | | | | | |
Net investment loss(a) | | | (0.09 | ) | | | (0.14 | ) | | | (0.16 | )(b) | | | (0.15 | )(c) | | | (0.14 | ) | | | | |
Net realized and unrealized gain (loss) | | | 1.59 | | | | 1.63 | | | | (0.09 | ) | | | 7.33 | | | | 4.25 | | | | | |
| | | | |
Total from Investment Operations | | | 1.50 | | | | 1.49 | | | | (0.25 | ) | | | 7.18 | | | | 4.11 | | | | | |
| | | | |
LESS DISTRIBUTIONS FROM: | | | | | | | | | | | | | | | | | | | | | | | | |
Net investment income | | | — | | | | — | | | | — | | | | — | | | | — | | | | | |
Net realized capital gains | | | (1.69 | ) | | | (3.54 | ) | | | (1.83 | ) | | | — | | | | — | | | | | |
| | | | |
Total Distributions | | | (1.69 | ) | | | (3.54 | ) | | | (1.83 | ) | | | — | | | | — | | | | | |
| | | | |
Net asset value, end of the period | | $ | 22.03 | | | $ | 22.22 | | | $ | 24.27 | | | $ | 26.35 | | | $ | 19.17 | | | | | |
| | | | |
Total return | | | 6.92 | % | | | 5.78 | % | | | (1.31 | )%(b) | | | 37.45 | %(c) | | | 27.29 | % | | | | |
RATIOS TO AVERAGE NET ASSETS: | | | | | | | | | | | | | | | | | | | | | | | | |
Net assets, end of the period (000’s) | | $ | 812,383 | | | $ | 800,883 | | | $ | 852,131 | | | $ | 914,000 | | | $ | 599,469 | | | | | |
Net expenses | | | 0.95 | % | | | 0.94 | % | | | 0.94 | % | | | 0.94 | % | | | 0.95 | % | | | | |
Gross expenses | | | 0.95 | % | | | 0.94 | % | | | 0.94 | % | | | 0.94 | % | | | 0.95 | % | | | | |
Net investment loss | | | (0.41 | )% | | | (0.57 | )% | | | (0.63 | )%(b) | | | (0.70 | )%(c) | | | (0.79 | )% | | | | |
Portfolio turnover rate | | | 56 | % | | | 78 | % | | | 63 | % | | | 56 | % | | | 77 | % | | | | |
| (a) | Per share net investment loss has been calculated using the average shares outstanding during the period. |
| (b) | Includes a non-recurring dividend. Without this dividend, net investment loss per share would have been $(0.17), total return would have been (1.35)% and the ratio of net investment loss to average net assets would have been (0.66)%. |
| (c) | Includes non-recurring dividends. Without these dividends, net investment loss per share would have been $(0.16), total return would have been 37.40% and the ratio of net investment loss to average net assets would have been (0.75)%. |
See accompanying notes to financial statements.
45 |
Financial Highlights – continued
For a share outstanding throughout each period.
| | | | | | | | | | | | | | | | | | | | | | | | |
| | | Small Cap Growth Fund—Retail Class | |
| | | Year Ended
September 30,
2016 | | | Year Ended
September 30,
2015 | | | Year Ended
September 30,
2014 | | | Year Ended
September 30,
2013 | | | Year Ended
September 30,
2012 | | | | |
Net asset value, beginning of the period | | $ | 20.93 | | | $ | 23.10 | | | $ | 25.23 | | | $ | 18.41 | | | $ | 14.52 | | | | | |
| | | | |
INCOME (LOSS) FROM INVESTMENT OPERATIONS: | | | | | | | | | | | | | | | | | | | | | | | | |
Net investment loss(a) | | | (0.13 | ) | | | (0.19 | ) | | | (0.22 | )(b) | | | (0.20 | )(c) | | | (0.19 | ) | | | | |
Net realized and unrealized gain (loss) | | | 1.50 | | | | 1.56 | | | | (0.08 | ) | | | 7.02 | | | | 4.08 | | | | | |
| | | | |
Total from Investment Operations | | | 1.37 | | | | 1.37 | | | | (0.30 | ) | | | 6.82 | | | | 3.89 | | | | | |
| | | | |
LESS DISTRIBUTIONS FROM: | | | | | | | | | | | | | | | | | | | | | | | | |
Net investment income | | | — | | | | — | | | | — | | | | — | | | | — | | | | | |
Net realized capital gains | | | (1.69 | ) | | | (3.54 | ) | | | (1.83 | ) | | | — | | | | — | | | | | |
| | | | |
Total Distributions | | | (1.69 | ) | | | (3.54 | ) | | | (1.83 | ) | | | — | | | | — | | | | | |
| | | | |
Net asset value, end of the period | | $ | 20.61 | | | $ | 20.93 | | | $ | 23.10 | | | $ | 25.23 | | | $ | 18.41 | | | | | |
| | | | |
Total return | | | 6.61 | % | | | 5.58 | % | | | (1.58 | )%(b) | | | 37.05 | %(c) | | | 26.79 | %(d) | | | | |
RATIOS TO AVERAGE NET ASSETS: | | | | | | | | | | | | | | | | | | | | | | | | |
Net assets, end of the period (000’s) | | $ | 118,670 | | | $ | 162,906 | | | $ | 175,393 | | | $ | 211,724 | | | $ | 229,822 | | | | | |
Net expenses | | | 1.20 | % | | | 1.19 | % | | | 1.21 | % | | | 1.25 | %(e) | | | 1.25 | %(f) | | | | |
Gross expenses | | | 1.20 | % | | | 1.19 | % | | | 1.21 | % | | | 1.25 | %(e) | | | 1.28 | % | | | | |
Net investment loss | | | (0.66 | )% | | | (0.82 | )% | | | (0.90 | )%(b) | | | (0.99 | )%(c) | | | (1.09 | )% | | | | |
Portfolio turnover rate | | | 56 | % | | | 78 | % | | | 63 | % | | | 56 | % | | | 77 | % | | | | |
| (a) | Per share net investment loss has been calculated using the average shares outstanding during the period. |
| (b) | Includes a non-recurring dividend. Without this dividend, net investment loss per share would have been $(0.23), total return would have been (1.58)% and the ratio of net investment loss to average net assets would have been (0.93)%. |
| (c) | Includes non-recurring dividends. Without these dividends, net investment loss per share would have been $(0.21), total return would have been 36.99% and the ratio of net investment loss to average net assets would have been (1.05)%. |
| (d) | Had certain expenses not been waived/reimbursed during the period, total returns would have been lower. |
| (e) | Includes fee/expense recovery of 0.01%. |
| (f) | The investment adviser agreed to waive its fees and/or reimburse a portion of the Fund’s expenses during the period. Without this waiver/reimbursement, expenses would have been higher. |
See accompanying notes to financial statements.
| 46
Financial Highlights – continued
For a share outstanding throughout each period.
| | | | | | | | | | | | | | | | | | | | |
| | | Small Cap Growth Fund—Class N | |
| | | Year Ended
September 30,
2016 | | | Year Ended
September 30,
2015 | | | Year Ended
September 30,
2014 | | | Period Ended
September 30,
2013* | | | | |
Net asset value, beginning of the period | | $ | 22.27 | | | $ | 24.29 | | | $ | 26.36 | | | $ | 20.22 | | | | | |
| | | | |
INCOME (LOSS) FROM INVESTMENT OPERATIONS: | | | | | | | | | | | | | | | | | | | | |
Net investment loss(a) | | | (0.06 | ) | | | (0.12 | ) | | | (0.14 | )(b) | | | (0.11 | ) | | | | |
Net realized and unrealized gain (loss) | | | 1.59 | | | | 1.64 | | | | (0.10 | ) | | | 6.25 | | | | | |
| | | | |
Total from Investment Operations | | | 1.53 | | | | 1.52 | | | | (0.24 | ) | | | 6.14 | | | | | |
| | | | |
LESS DISTRIBUTIONS FROM: | | | | | | | | | | | | | | | | | | | | |
Net investment income | | | — | | | | — | | | | — | | | | — | | | | | |
Net realized capital gains | | | (1.69 | ) | | | (3.54 | ) | | | (1.83 | ) | | | — | | | | | |
| | | | |
Total Distributions | | | (1.69 | ) | | | (3.54 | ) | | | (1.83 | ) | | | — | | | | | |
| | | | |
Net asset value, end of the period | | $ | 22.11 | | | $ | 22.27 | | | $ | 24.29 | | | $ | 26.36 | | | | | |
| | | | |
Total return | | | 7.05 | % | | | 5.92 | % | | | (1.27 | )%(b) | | | 30.37 | %(c) | | | | |
RATIOS TO AVERAGE NET ASSETS: | | | | | | | | | | | | | | | | | | | | |
Net assets, end of the period (000’s) | | $ | 196,733 | | | $ | 162,591 | | | $ | 15,080 | | | $ | 7,580 | | | | | |
Net expenses | | | 0.83 | % | | | 0.83 | % | | | 0.83 | % | | | 0.83 | %(d) | | | | |
Gross expenses | | | 0.83 | % | | | 0.83 | % | | | 0.83 | % | | | 0.83 | %(d) | | | | |
Net investment loss | | | (0.29 | )% | | | (0.51 | )% | | | (0.53 | )%(b) | | | (0.63 | )%(d) | | | | |
Portfolio turnover rate | | | 56 | % | | | 78 | % | | | 63 | % | | | 56 | % | | | | |
| * | From commencement of Class operations on February 1, 2013 through September 30, 2013. |
| (a) | Per share net investment loss has been calculated using the average shares outstanding during the period. |
| (b) | Includes a non-recurring dividend. Without this dividend, net investment loss per share would have been $(0.14), total return would have been (1.31)% and the ratio of net investment loss to average net assets would have been (0.56)%. |
| (c) | Periods less than one year are not annualized. |
| (d) | Computed on an annualized basis for periods less than one year. |
See accompanying notes to financial statements.
47 |
Financial Highlights – continued
For a share outstanding throughout each period.
| | | | | | | | | | | | | | | | | | | | | | | | |
| | | Small Cap Value Fund—Institutional Class | | | | |
| | | Year Ended
September 30,
2016 | | | Year Ended
September 30,
2015 | | | Year Ended
September 30,
2014 | | | Year Ended
September 30,
2013 | | | Year Ended
September 30,
2012 | | | | |
Net asset value, beginning of the period | | $ | 32.19 | | | $ | 36.40 | | | $ | 37.42 | | | $ | 29.14 | | | $ | 22.36 | | | | | |
| | | | |
INCOME (LOSS) FROM INVESTMENT OPERATIONS: | | | | | | | | | | | | | | | | | | | | | | | | |
Net investment income(a) | | | 0.17 | | | | 0.27 | | | | 0.20 | | | | 0.20 | | | | 0.21 | | | | | |
Net realized and unrealized gain (loss) | | | 4.82 | | | | 0.49 | | | | 2.18 | | | | 8.41 | | | | 6.62 | | | | | |
| | | | |
Total from Investment Operations | | | 4.99 | | | | 0.76 | | | | 2.38 | | | | 8.61 | | | | 6.83 | | | | | |
| | | | |
LESS DISTRIBUTIONS FROM: | | | | | | | | | | | | | | | | | | | | | | | | |
Net investment income | | | (0.22 | ) | | | (0.22 | ) | | | (0.10 | ) | | | (0.30 | ) | | | (0.05 | ) | | | | |
Net realized capital gains | | | (3.18 | ) | | | (4.75 | ) | | | (3.30 | ) | | | (0.03 | ) | | | — | | | | | |
| | | | |
Total Distributions | | | (3.40 | ) | | | (4.97 | ) | | | (3.40 | ) | | | (0.33 | ) | | | (0.05 | ) | | | | |
| | | | |
Net asset value, end of the period | | $ | 33.78 | | | $ | 32.19 | | | $ | 36.40 | | | $ | 37.42 | | | $ | 29.14 | | | | | |
| | | | |
Total return | | | 16.75 | %(b) | | | 1.20 | %(b) | | | 6.17 | %(b) | | | 29.82 | %(b) | | | 30.59 | % | | | | |
RATIOS TO AVERAGE NET ASSETS: | | | | | | | | | | | | | | | | | | | | | | | | |
Net assets, end of the period (000’s) | | $ | 654,501 | | | $ | 666,107 | | | $ | 730,901 | | | $ | 733,512 | | | $ | 572,776 | | | | | |
Net expenses | | | 0.90 | %(c) | | | 0.90 | %(c) | | | 0.90 | %(c) | | | 0.90 | %(c) | | | 0.90 | %(d) | | | | |
Gross expenses | | | 0.93 | % | | | 0.92 | % | | | 0.91 | % | | | 0.91 | % | | | 0.90 | %(d) | | | | |
Net investment income | | | 0.52 | % | | | 0.75 | % | | | 0.53 | % | | | 0.61 | % | | | 0.76 | % | | | | |
Portfolio turnover rate | | | 22 | % | | | 22 | % | | | 23 | % | | | 22 | % | | | 19 | % | | | | |
| (a) | Per share net investment income has been calculated using the average shares outstanding during the period. |
| (b) | Had certain expenses not been waived/reimbursed during the period, total returns would have been lower. |
| (c) | The investment adviser agreed to waive its fees and/or reimburse a portion of the Fund’s expenses during the period. Without this waiver/reimbursement, expenses would have been higher. |
| (d) | Includes fee/expense recovery of less than 0.01%. |
See accompanying notes to financial statements.
| 48
Financial Highlights – continued
For a share outstanding throughout each period.
| | | | | | | | | | | | | | | | | | | | | | | | |
| | | Small Cap Value Fund—Retail Class | | | | |
| | | Year Ended
September 30,
2016 | | | Year Ended
September 30,
2015 | | | Year Ended
September 30,
2014 | | | Year Ended
September 30,
2013 | | | Year Ended
September 30,
2012 | | | | |
Net asset value, beginning of the period | | $ | 31.78 | | | $ | 35.98 | | | $ | 37.03 | | | $ | 28.84 | | | $ | 22.14 | | | | | |
| | | | |
INCOME (LOSS) FROM INVESTMENT OPERATIONS: | | | | | | | | | | | | | | | | | | | | | | | | |
Net investment income(a) | | | 0.08 | | | | 0.18 | | | | 0.10 | | | | 0.12 | | | | 0.13 | | | | | |
Net realized and unrealized gain (loss) | | | 4.77 | | | | 0.48 | | | | 2.16 | | | | 8.32 | | | | 6.57 | | | | | |
| | | | |
Total from Investment Operations | | | 4.85 | | | | 0.66 | | | | 2.26 | | | | 8.44 | | | | 6.70 | | | | | |
| | | | |
LESS DISTRIBUTIONS FROM: | | | | | | | | | | | | | | | | | | | | | | | | |
Net investment income | | | (0.12 | ) | | | (0.11 | ) | | | (0.01 | ) | | | (0.22 | ) | | | — | | | | | |
Net realized capital gains | | | (3.18 | ) | | | (4.75 | ) | | | (3.30 | ) | | | (0.03 | ) | | | — | | | | | |
| | | | |
Total Distributions | | | (3.30 | ) | | | (4.86 | ) | | | (3.31 | ) | | | (0.25 | ) | | | — | | | | | |
| | | | |
Net asset value, end of the period | | $ | 33.33 | | | $ | 31.78 | | | $ | 35.98 | | | $ | 37.03 | | | $ | 28.84 | | | | | |
| | | | |
Total return(b) | | | 16.47 | % | | | 0.94 | % | | | 5.90 | % | | | 29.48 | % | | | 30.26 | % | | | | |
RATIOS TO AVERAGE NET ASSETS: | | | | | | | | | | | | | | | | | | | | | | | | |
Net assets, end of the period (000’s) | | $ | 267,936 | | | $ | 306,360 | | | $ | 358,698 | | | $ | 403,475 | | | $ | 343,480 | | | | | |
Net expenses(c) | | | 1.15 | % | | | 1.15 | % | | | 1.15 | % | | | 1.15 | % | | | 1.15 | % | | | | |
Gross expenses | | | 1.18 | % | | | 1.17 | % | | | 1.20 | % | | | 1.22 | % | | | 1.22 | % | | | | |
Net investment income | | | 0.27 | % | | | 0.50 | % | | | 0.28 | % | | | 0.37 | % | | | 0.49 | % | | | | |
Portfolio turnover rate | | | 22 | % | | | 22 | % | | | 23 | % | | | 22 | % | | | 19 | % | | | | |
| (a) | Per share net investment income has been calculated using the average shares outstanding during the period. |
| (b) | Had certain expenses not been waived/reimbursed during the period, total returns would have been lower. |
| (c) | The investment adviser agreed to waive its fees and/or reimburse a portion of the Fund’s expenses during the period. Without this waiver/reimbursement, expenses would have been higher. |
See accompanying notes to financial statements.
49 |
Financial Highlights – continued
For a share outstanding throughout each period.
| | | | | | | | | | | | | | | | | | | | | | | | |
| | | Small Cap Value Fund—Admin Class | |
| | | Year Ended
September 30,
2016 | | | Year Ended
September 30,
2015 | | | Year Ended
September 30,
2014 | | | Year Ended
September 30,
2013 | | | Year Ended
September 30,
2012 | | | | |
Net asset value, beginning of the period | | $ | 30.88 | | | $ | 35.06 | | | $ | 36.24 | | | $ | 28.22 | | | $ | 21.72 | | | | | |
| | | | |
INCOME (LOSS) FROM INVESTMENT OPERATIONS: | | | | | | | | | | | | | | | | | | | | | | | | |
Net investment income(a) | | | 0.01 | | | | 0.09 | | | | 0.01 | | | | 0.04 | | | | 0.06 | | | | | |
Net realized and unrealized gain (loss) | | | 4.62 | | | | 0.48 | | | | 2.11 | | | | 8.15 | | | | 6.44 | | | | | |
| | | | |
Total from Investment Operations | | | 4.63 | | | | 0.57 | | | | 2.12 | | | | 8.19 | | | | 6.50 | | | | | |
| | | | |
LESS DISTRIBUTIONS FROM: | | | | | | | | | | | | | | | | | | | | | | | | |
Net investment income | | | (0.02 | ) | | | (0.00 | )(b) | | | — | | | | (0.14 | ) | | | — | | | | | |
Net realized capital gains | | | (3.18 | ) | | | (4.75 | ) | | | (3.30 | ) | | | (0.03 | ) | | | — | | | | | |
| | | | |
Total Distributions | | | (3.20 | ) | | | (4.75 | ) | | | (3.30 | ) | | | (0.17 | ) | | | — | | | | | |
| | | | |
Net asset value, end of the period | | $ | 32.31 | | | $ | 30.88 | | | $ | 35.06 | | | $ | 36.24 | | | $ | 28.22 | | | | | |
| | | | |
Total return(c) | | | 16.19 | % | | | 0.71 | % | | | 5.63 | % | | | 29.17 | % | | | 29.93 | % | | | | |
RATIOS TO AVERAGE NET ASSETS: | | | | | | | | | | | | | | | | | | | | | | | | |
Net assets, end of the period (000’s) | | $ | 43,973 | | | $ | 45,762 | | | $ | 61,791 | | | $ | 74,892 | | | $ | 67,853 | | | | | |
Net expenses(d) | | | 1.39 | %(e) | | | 1.38 | %(f) | | | 1.40 | % | | | 1.40 | % | | | 1.40 | % | | | | |
Gross expenses | | | 1.42 | %(e) | | | 1.40 | %(f) | | | 1.51 | % | | | 1.52 | % | | | 1.52 | % | | | | |
Net investment income | | | 0.03 | % | | | 0.28 | % | | | 0.02 | % | | | 0.11 | % | | | 0.24 | % | | | | |
Portfolio turnover rate | | | 22 | % | | | 22 | % | | | 23 | % | | | 22 | % | | | 19 | % | | | | |
| (a) | Per share net investment income has been calculated using the average shares outstanding during the period. |
| (b) | Amount rounds to less than $0.01 per share. |
| (c) | Had certain expenses not been waived/reimbursed during the period, total returns would have been lower. |
| (d) | The investment adviser agreed to waive its fees and/or reimburse a portion of the Fund’s expenses during the period. Without this waiver/reimbursement, expenses would have been higher. |
| (e) | Includes refund of prior year service fee of 0.01%. See Note 5b of Notes to Financial Statements. |
| (f) | Includes refund of prior year service fee of 0.02%. |
See accompanying notes to financial statements.
| 50
Financial Highlights – continued
For a share outstanding throughout each period.
| | | | | | | | | | | | | | | | | | | | |
| | | Small Cap Value Fund—Class N | |
| | | Year Ended
September 30,
2016 | | | Year Ended
September 30,
2015 | | | Year Ended
September 30,
2014 | | | Period Ended
September 30,
2013* | | | | |
Net asset value, beginning of the period | | $ | 32.22 | | | $ | 36.44 | | | $ | 37.44 | | | $ | 32.08 | | | | | |
| | | | |
INCOME (LOSS) FROM INVESTMENT OPERATIONS: | | | | | | | | | | | | | | | | | | | | |
Net investment income(a) | | | 0.19 | | | | 0.27 | | | | 0.23 | | | | 0.06 | | | | | |
Net realized and unrealized gain (loss) | | | 4.83 | | | | 0.50 | | | | 2.18 | | | | 5.30 | | | | | |
| | | | |
Total from Investment Operations | | | 5.02 | | | | 0.77 | | | | 2.41 | | | | 5.36 | | | | | |
| | | | |
LESS DISTRIBUTIONS FROM: | | | | | | | | | | | | | | | | | | | | |
Net investment income | | | (0.25 | ) | | | (0.24 | ) | | | (0.11 | ) | | | — | | | | | |
Net realized capital gains | | | (3.18 | ) | | | (4.75 | ) | | | (3.30 | ) | | | — | | | | | |
| | | | |
Total Distributions | | | (3.43 | ) | | | (4.99 | ) | | | (3.41 | ) | | | — | | | | | |
| | | | |
Net asset value, end of the period | | $ | 33.81 | | | $ | 32.22 | | | $ | 36.44 | | | $ | 37.44 | | | | | |
| | | | |
Total return | | | 16.84 | % | | | 1.25 | % | | | 6.25 | %(b) | | | 16.71 | %(b)(c) | | | | |
RATIOS TO AVERAGE NET ASSETS: | | | | | | | | | | | | | | | | | | | | |
Net assets, end of the period (000’s) | | $ | 68,332 | | | $ | 38,555 | | | $ | 2,568 | | | $ | 1 | | | | | |
Net expenses | | | 0.83 | % | | | 0.83 | %(d) | | | 0.85 | %(e) | | | 0.85 | %(e)(f) | | | | |
Gross expenses | | | 0.83 | % | | | 0.83 | %(d) | | | 0.89 | % | | | 14.45 | %(f) | | | | |
Net investment income | | | 0.61 | % | | | 0.76 | % | | | 0.60 | % | | | 0.27 | %(f) | | | | |
Portfolio turnover rate | | | 22 | % | | | 22 | % | | | 23 | % | | | 22 | % | | | | |
| * | From commencement of Class operations on February 1, 2013 through September 30, 2013. |
| (a) | Per share net investment income has been calculated using the average shares outstanding during the period. |
| (b) | Had certain expenses not been waived/reimbursed during the period, total returns would have been lower. |
| (c) | Periods less than one year are not annualized. |
| (d) | Includes fee/expense recovery of less than 0.01%. |
| (e) | The investment adviser agreed to waive its fees and/or reimburse a portion of the Fund’s expenses during the period. Without this waiver/reimbursement, expenses would have been higher. |
| (f) | Computed on an annualized basis for periods less than one year. |
See accompanying notes to financial statements.
51 |
Financial Highlights – continued
For a share outstanding throughout each period.
| | | | | | | | | | | | |
| | | Small/Mid Cap Growth Fund—
Institutional Class | |
| | | Year Ended
September 30,
2016 | | | Period Ended
September 30,
2015* | | | | |
Net asset value, beginning of the period | | $ | 9.05 | | | $ | 10.00 | | | | | |
| | | | |
INCOME (LOSS) FROM INVESTMENT OPERATIONS: | | | | | | | | | | | | |
Net investment loss(a) | | | (0.02 | ) | | | (0.01 | ) | | | | |
Net realized and unrealized gain (loss) | | | 0.70 | | | | (0.94 | ) | | | | |
| | | | |
Total from Investment Operations | | | 0.68 | | | | (0.95 | ) | | | | |
| | | | |
LESS DISTRIBUTIONS FROM: | | | | | | | | | | | | |
Net investment income | | | — | | | | — | | | | | |
Net realized capital gains | | | — | | | | — | | | | | |
| | | | |
Total Distributions | | | — | | | | — | | | | | |
| | | | |
Net asset value, end of the period | | $ | 9.73 | | | $ | 9.05 | | | | | |
| | | | |
Total return(b) | | | 7.51 | % | | | (9.50 | )%(c) | | | | |
RATIOS TO AVERAGE NET ASSETS: | | | | | | | | | | | | |
Net assets, end of the period (000’s) | | $ | 11,974 | | | $ | 9,242 | | | | | |
Net expenses(d) | | | 0.85 | % | | | 0.85 | %(e) | | | | |
Gross expenses | | | 1.75 | % | | | 2.65 | %(e) | | | | |
Net investment loss | | | (0.22 | )% | | | (0.53 | )%(e) | | | | |
Portfolio turnover rate | | | 53 | % | | | 14 | % | | | | |
| * | From commencement of operations on June 30, 2015 through September 30, 2015. |
| (a) | Per share net investment loss has been calculated using the average shares outstanding during the period. |
| (b) | Had certain expenses not been waived/reimbursed during the period, total returns would have been lower. |
| (c) | Periods less than one year are not annualized. |
| (d) | The investment adviser agreed to waive its fees and/or reimburse a portion of the Fund’s expenses during the period. Without this waiver/reimbursement, expenses would have been higher. |
| (e) | Computed on an annualized basis for periods less than one year. |
See accompanying notes to financial statements.
| 52
Notes to Financial Statements
September 30, 2016
1. Organization. Loomis Sayles Funds I and Loomis Sayles Funds II (the “Trusts” and each a “Trust”) are each organized as a Massachusetts business trust. Each Trust is registered under the Investment Company Act of 1940, as amended (the “1940 Act”), as an open-end management investment company. Each Declaration of Trust permits the Board of Trustees to authorize the issuance of an unlimited number of shares of the Trust in multiple series. The financial statements for certain funds of the Trusts are presented in separate reports. The following funds (individually, a “Fund” and collectively, the “Funds”) are included in this report:
Loomis Sayles Funds I:
Loomis Sayles Small Cap Value Fund (the “Small Cap Value Fund”)
Loomis Sayles Funds II:
Loomis Sayles Small Cap Growth Fund (the “Small Cap Growth Fund”)
Loomis Sayles Small/Mid Cap Growth Fund (the “Small/Mid Cap Growth Fund”)
Each Fund is a diversified investment company.
Small Cap Growth Fund and Small Cap Value Fund were closed to new investors effective September 14, 2012 and September 15, 2008, respectively. Small Cap Growth Fund and Small Cap Value Fund continue to offer Institutional Class, Retail Class and Class N shares to existing investors and Small Cap Value Fund continues to offer Admin Class shares to existing investors.
Each share class is sold without a sales charge. Retail Class and Admin Class shares pay a Rule 12b-1 fee. Class N shares are offered with no initial minimum investment to certain retirement plans held in an omnibus fashion and fund of funds that are distributed by NGAM Distribution, L.P. (“NGAM Distribution”) and with an initial minimum investment of $1,000,000 to other categories of investors. Institutional Class shares are intended for institutional investors with a minimum initial investment of $100,000 for Small Cap Growth Fund and Small Cap Value Fund and $1,000,000 for Small/Mid Cap Growth Fund, though some categories of investors are exempted from the minimum investment amount as outlined in the Fund’s prospectus. Admin Class shares are offered exclusively through intermediaries.
Most expenses can be directly attributed to a Fund. Expenses which cannot be directly attributed to a Fund are generally apportioned based on the relative net assets of each of the funds in Natixis Funds Trust I, Natixis Funds Trust II, Natixis Funds Trust IV, Gateway Trust (“Natixis Funds Trusts”), Loomis Sayles Funds I and Loomis Sayles Funds II (“Loomis Sayles Funds Trusts”). Expenses of a Fund are borne pro rata by the holders of each class of shares, except that each class bears expenses unique to that class (such as the Rule 12b-1 fees applicable to Retail Class and Admin Class), and transfer agent fees for Small Cap Value Fund and Small Cap Growth Fund are borne collectively for Institutional Class, Retail Class and Admin Class, and individually for Class N. In addition, each class votes as a class only with respect to its own Rule 12b-1 Plan. Shares of
53 |
Notes to Financial Statements – continued
September 30, 2016
each class would receive their pro rata share of the net assets of a Fund if the Fund were liquidated. The Trustees approve separate distributions from net investment income on each class of shares.
2. Significant Accounting Policies. The following is a summary of significant accounting policies consistently followed by each Fund in the preparation of its financial statements. The Funds’ financial statements follow the accounting and reporting guidelines provided for investment companies and are prepared in accordance with accounting principles generally accepted in the United States of America which require the use of management estimates that affect the reported amounts and disclosures in the financial statements. Actual results could differ from those estimates. Management has evaluated the events and transactions subsequent to year-end through the date the financial statements were issued and has determined that there were no material events that would require disclosure in the Funds’ financial statements.
a. Valuation. Fund securities and other investments are valued at market value based on market quotations obtained or determined by independent pricing services recommended by the adviser and approved by the Board of Trustees. Fund securities and other investments for which market quotations are not readily available are valued at fair value as determined in good faith by the adviser pursuant to procedures approved by the Board of Trustees, as described below. Market value is determined as follows:
Listed equity securities (including shares of closed-end investment companies and exchange-traded funds) are valued at the last sale price quoted on the exchange where they are traded most extensively or, if there is no reported sale during the day, the closing bid quotation as reported by an independent pricing service. Securities traded on the NASDAQ Global Select Market, NASDAQ Global Market and NASDAQ Capital Market are valued at the NASDAQ Official Closing Price (“NOCP”), or if lacking an NOCP, at the most recent bid quotations on the applicable NASDAQ Market. Unlisted equity securities (except unlisted preferred equity securities) are valued at the last sale price quoted in the market where they are traded most extensively or, if there is no reported sale during the day, the closing bid quotation as reported by an independent pricing service. If there is no last sale price or closing bid quotation available, unlisted equity securities will be valued using evaluated bids furnished by an independent pricing service, if available. In some foreign markets, an official close price and a last sale price may be available from the foreign exchange or market. In those cases, the official close price is used. Debt securities and unlisted preferred equity securities are valued based on evaluated bids furnished to the Fund by an independent pricing service or bid prices obtained from broker-dealers. Broker-dealer bid prices may be used to value debt and unlisted equity securities where an independent pricing service is unable to price a security or where an independent pricing service does not provide a reliable price for the security.
Fund securities and other investments for which market quotations are not readily available are valued at fair value as determined in good faith by the adviser pursuant to
| 54
Notes to Financial Statements – continued
September 30, 2016
procedures approved by the Board of Trustees. The Funds may also value securities and other investments at fair value in other circumstances such as when extraordinary events occur after the close of a foreign market but prior to the close of the New York Stock Exchange (“NYSE”). This may include situations relating to a single issuer (such as a declaration of bankruptcy or a delisting of the issuer’s security from the primary market on which it has traded) as well as events affecting the securities markets in general (such as market disruptions or closings and significant fluctuations in U.S. and/or foreign markets). When fair valuing its securities or other investments, the Funds may, among other things, use modeling tools or other processes that may take into account factors such as securities or other market activity and/or significant events that occur after the close of the foreign market and before the time the Fund’s net asset value (“NAV”) is calculated. Fair value pricing may require subjective determinations about the value of a security, and fair values used to determine a Fund’s NAV may differ from quoted or published prices, or from prices that are used by others, for the same securities. In addition, the use of fair value pricing may not always result in adjustments to the prices of securities held by a Fund.
b. Investment Transactions and Related Investment Income. Investment transactions are accounted for on a trade date plus one day basis for daily NAV calculation. However, for financial reporting purposes, investment transactions are reported on trade date. Dividend income is recorded on ex-dividend date, or in the case of certain foreign securities, as soon as a Fund is notified, and interest income is recorded on an accrual basis. Interest income is increased by the accretion of discount and decreased by the amortization of premium, if applicable. Distributions received from investments in securities that represent a return of capital or capital gain are recorded as a reduction of cost of investments or as a realized gain, respectively. The calendar year-end amounts of ordinary income, capital gains and return of capital included in distributions received from the Funds’ investments in real estate investment trusts (“REITs”) are reported to the Funds after the end of the fiscal year; accordingly, the Funds estimate these amounts for accounting purposes until the characterization of REIT distributions is reported to the Funds after the end of the fiscal year. Estimates are based on the most recent REIT distribution information available. In determining net gain or loss on securities sold, the cost of securities has been determined on an identified cost basis. Investment income, non-class specific expenses and realized and unrealized gains and losses are allocated on a pro rata basis to each class based on the relative net assets of each class to the total net assets of the Fund.
c. Foreign Currency Translation. The books and records of the Funds are maintained in U.S. dollars. The values of securities, currencies and other assets and liabilities denominated in currencies other than U.S. dollars are translated into U.S. dollars based upon foreign exchange rates prevailing at the end of the period. Purchases and sales of investment securities, income and expenses are translated into U.S. dollars on the respective dates of such transactions.
55 |
Notes to Financial Statements – continued
September 30, 2016
Net realized foreign exchange gains or losses arise from sales of foreign currency, changes in exchange rates between the trade and settlement dates on securities transactions and the difference between the amounts of dividends, interest and foreign withholding taxes recorded on the Fund’s books and the U.S. dollar equivalent of the amounts actually received or paid. Net unrealized foreign exchange gains or losses arise from changes in the value of assets and liabilities, other than investment securities, as of the end of the fiscal period, resulting from changes in exchange rates.
The values of investment securities are presented at the foreign exchange rates prevailing at the end of the period for financial reporting purposes. Net realized and unrealized gains or losses on investments reported in the Statements of Operations reflect gains or losses resulting from changes in exchange rates and fluctuations which arise due to changes in market prices of investment securities.
The Funds may use foreign currency exchange contracts to facilitate transactions in foreign-denominated investments. Losses may arise from changes in the value of the foreign currency or if the counterparties do not perform under the contracts’ terms.
d. Federal and Foreign Income Taxes. The Trusts treat each Fund as a separate entity for federal income tax purposes. Each Fund intends to meet the requirements of the Internal Revenue Code of 1986, as amended, applicable to regulated investment companies, and to distribute to its shareholders substantially all of its net investment income and any net realized capital gains at least annually. Management has performed an analysis of each Fund’s tax positions for the open tax years as of September 30, 2016 and has concluded that no provisions for income tax are required. The Funds’ federal tax returns for the prior three fiscal years, where applicable, remain subject to examination by the Internal Revenue Service. Management is not aware of any events that are reasonably possible to occur in the next twelve months that would result in the amounts of any unrecognized tax benefits significantly increasing or decreasing for the Funds. However, management’s conclusions regarding tax positions taken may be subject to review and adjustment at a later date based on factors including, but not limited to, new tax laws and accounting regulations and interpretations thereof.
A Fund may be subject to foreign withholding taxes on investment income and taxes on capital gains on investments that are accrued and paid based upon the Fund’s understanding of the tax rules and regulations that exist in the countries in which the Fund invests. Foreign withholding taxes on dividend and interest income are reflected on the Statements of Operations as a reduction of investment income, net of amounts eligible to be reclaimed. Dividends and interest receivable on the Statements of Assets and Liabilities are net of foreign withholding taxes. Foreign withholding taxes where reclaims have been or will be filed are reflected on the Statements of Assets and Liabilities as tax reclaims receivable. Capital gains taxes paid are included in net realized gain (loss) on investments in the Statements of Operations. Accrued but unpaid capital gains taxes are reflected as foreign taxes payable on the Statements of Assets and Liabilities, if applicable, and reduce unrealized gains on investments. In the event that realized gains on investments
| 56
Notes to Financial Statements – continued
September 30, 2016
are subsequently offset by realized losses, taxes paid on realized gains may be returned to a Fund. Such amounts, if applicable, are reflected as foreign tax rebates receivable on the Statements of Assets and Liabilities and are recorded as a realized gain when received.
e. Dividends and Distributions to Shareholders. Dividends and distributions are recorded on ex-dividend date. The timing and characterization of certain income and capital gain distributions are determined in accordance with federal tax regulations, which may differ from accounting principles generally accepted in the United States of America. Permanent differences are primarily due to differing treatments for book and tax purposes of items such as capital gain and return of capital distributions received, distribution re-designations, redemptions-in-kind and net operating losses. Permanent book and tax basis differences relating to shareholder distributions will result in reclassifications to capital accounts reported on the Statements of Assets and Liabilities. Temporary differences between book and tax distributable earnings are primarily due to return of capital distributions received, deferred Trustees’ fees and wash sales. Amounts of income and capital gain available to be distributed on a tax basis are determined annually, and at other times during the Funds’ fiscal year as may be necessary to avoid knowingly declaring and paying a return of capital distribution. Distributions from net investment income and short-term capital gains are considered to be distributed from ordinary income for tax purposes.
The tax characterization of distributions is determined on an annual basis. The tax character of distributions paid to shareholders during the years ended September 30, 2016 and 2015 were as follows:
| | | | | | | | | | | | | | | | | | | | | | | | |
| | | 2016 Distributions Paid From: | | | 2015 Distributions Paid From: | |
Fund | | Ordinary
Income | | | Long-Term
Capital Gains | | | Total | | | Ordinary
Income | | | Long-Term
Capital Gains | | | Total | |
Small Cap Growth Fund | | $ | — | | | $ | 85,662,346 | | | $ | 85,662,346 | | | $ | — | | | $ | 149,109,447 | | | $ | 149,109,447 | |
Small Cap Value Fund | | | 7,118,205 | | | | 98,999,090 | | | | 106,117,295 | | | | 10,451,269 | | | | 142,087,857 | | | | 152,539,126 | |
Small/Mid Cap Growth Fund | | | — | | | | — | | | | — | | | | — | | | | — | | | | — | |
Differences between these amounts and those reported in the Statements of Changes in Net Assets are primarily attributable to different book and tax treatment for short-term capital gains.
57 |
Notes to Financial Statements – continued
September 30, 2016
As of September 30, 2016, the components of distributable earnings on a tax basis were as follows:
| | | | | | | | | | | | |
| | | Small Cap
Growth Fund | | | Small Cap
Value Fund | | | Small/Mid Cap
Growth Fund | |
Undistributed ordinary income | | $ | — | | | $ | 1,686,964 | | | $ | — | |
Undistributed long-term capital gains | | | — | | | | 71,123,673 | | | | — | |
| | | | | | | | | | | | |
Total undistributed earnings | | | — | | | | 72,810,637 | | | | — | |
| | | | | | | | | | | | |
Capital loss carryforward: | | | | | | | | | | | | |
Short-term: | |
No expiration date | | | (7,329,238 | ) | | | — | | | | (1,072,253 | ) |
Long-term: | |
No expiration date | | | — | | | | — | | | | (29,020 | ) |
| | | | | | | | | | | | |
Total capital loss carryforward | | | (7,329,238 | ) | | | — | | | | (1,101,273 | ) |
| | | | | | | | | | | | |
Late-year ordinary and post-October capital loss deferrals* | | | (3,107,069 | ) | | | — | | | | (7,917 | ) |
| | | | | | | | | | | | |
Unrealized appreciation | | | 212,048,397 | | | | 301,655,703 | | | | 1,049,425 | |
| | | | | | | | | | | | |
Total accumulated earnings (losses) | | $ | 201,612,090 | | | $ | 374,466,340 | | | $ | (59,765 | ) |
| | | | | | | | | | | | |
* Under current tax law, capital losses, foreign currency losses, and losses on passive foreign investment companies and contingent payment debt instruments after October 31 or December 31, as applicable, may be deferred and treated as occurring on the first day of the following taxable year.
f. Repurchase Agreements. Each Fund may enter into repurchase agreements, under the terms of a Master Repurchase Agreement, under which each Fund acquires securities as collateral and agrees to resell the securities at an agreed upon time and at an agreed upon price. It is each Fund’s policy that the market value of the collateral for repurchase agreements be at least equal to 102% of the repurchase price, including interest. Certain repurchase agreements are tri-party arrangements whereby the collateral is held in a segregated account for the benefit of the Fund and on behalf of the counterparty. Repurchase agreements could involve certain risks in the event of default or insolvency of the counterparty, including possible delays or restrictions upon a Fund’s ability to dispose of the underlying securities. As of September 30, 2016, each Fund, as applicable, had investments in repurchase agreements for which the value of the related collateral exceeded the value of the repurchase agreement. The gross value of repurchase agreements is included in the Statements of Assets and Liabilities for financial reporting purposes.
g. Securities Lending. The Funds have entered into an agreement with State Street Bank and Trust Company (“State Street Bank”), as agent of the Funds, to lend securities to certain designated borrowers. The loans are collateralized with cash or securities in an amount equal to at least 105% or 102% of the market value (including accrued interest) of the loaned international or domestic securities, respectively, when the loan is initiated. Thereafter, the value of the collateral must remain at least 102% of the market value (including accrued interest) of loaned securities for U.S. equities and U.S. corporate debt;
| 58
Notes to Financial Statements – continued
September 30, 2016
at least 105% of the market value (including accrued interest) of loaned securities for non-U.S. equities; and at least 100% of the market value (including accrued interest) of loaned securities for U.S. Government securities, sovereign debt issued by non-U.S. Governments and non-U.S. corporate debt. In the event that the market value of the collateral falls below the required percentages described above, the borrower will deliver additional collateral on the next business day. As with other extensions of credit, the Funds may bear the risk of loss with respect to the investment of the collateral. The Funds invest cash collateral in short-term investments, a portion of the income from which is remitted to the borrowers and the remainder allocated between the Funds and State Street Bank as lending agent.
For the year ended September 30, 2016, none of the Funds had loaned securities under this agreement.
h. Indemnifications. Under the Trusts’ organizational documents, their officers and Trustees are indemnified against certain liabilities arising out of the performance of their duties to the Funds. Additionally, in the normal course of business, the Funds enter into contracts with service providers that contain general indemnification clauses. The Funds’ maximum exposure under these arrangements is unknown as this would involve future claims that may be made against the Funds that have not yet occurred. However, based on experience, the Funds expect the risk of loss to be remote.
3. Fair Value Measurements. In accordance with accounting standards related to fair value measurements and disclosures, the Funds have categorized the inputs utilized in determining the value of each Fund’s assets or liabilities. These inputs are summarized in the three broad levels listed below:
| | • | | Level 1—quoted prices in active markets for identical assets or liabilities; |
| | • | | Level 2—prices determined using other significant inputs that are observable either directly, or indirectly through corroboration with observable market data (which could include quoted prices for similar assets or liabilities, interest rates, credit risk, etc.); and |
| | • | | Level 3—prices determined using significant unobservable inputs when quoted prices or observable inputs are unavailable such as when there is little or no market activity for an asset or liability (unobservable inputs reflect each Fund’s own assumptions in determining the fair value of assets or liabilities and would be based on the best information available). |
The inputs or methodology used for valuing securities are not necessarily an indication of the risk associated with investing in those securities.
59 |
Notes to Financial Statements – continued
September 30, 2016
The following is a summary of the inputs used to value the Funds’ investments as of September 30, 2016, at value:
Small Cap Growth Fund
Asset Valuation Inputs
| | | | | | | | | | | | | | | | |
Description | | Level 1 | | | Level 2 | | | Level 3 | | | Total | |
Common Stocks(a) | | $ | 1,091,709,628 | | | $ | — | | | $ | — | | | $ | 1,091,709,628 | |
Short-Term Investments | | | — | | | | 34,249,644 | | | | — | | | | 34,249,644 | |
| | | | | | | | | | | | | | | | |
Total | | $ | 1,091,709,628 | | | $ | 34,249,644 | | | $ | — | | | $ | 1,125,959,272 | |
| | | | | | | | | | | | | | | | |
(a) Details of the major categories of the Fund’s investments are reflected within the Portfolio of Investments.
For the year ended September 30, 2016, there were no transfers among Levels 1, 2 and 3.
Small Cap Value Fund
Asset Valuation Inputs
| | | | | | | | | | | | | | | | |
Description | | Level 1 | | | Level 2 | | | Level 3 | | | Total | |
Common Stocks(a) | | $ | 1,015,776,854 | | | $ | — | | | $ | — | | | $ | 1,015,776,854 | |
Closed-End Investment Companies | | | 6,264,815 | | | | — | | | | — | | | | 6,264,815 | |
Short-Term Investments | | | — | | | | 16,131,843 | | | | — | | | | 16,131,843 | |
| | | | | | | | | | | | | | | | |
Total | | $ | 1,022,041,669 | | | $ | 16,131,843 | | | $ | — | | | $ | 1,038,173,512 | |
| | | | | | | | | | | | | | | | |
(a) Details of the major categories of the Fund’s investments are reflected within the Portfolio of Investments.
For the year ended September 30, 2016, there were no transfers among Levels 1, 2 and 3
Small/Mid Cap Growth Fund
Asset Valuation Inputs
| | | | | | | | | | | | | | | | |
Description | | Level 1 | | | Level 2 | | | Level 3 | | | Total | |
Common Stocks(a) | | $ | 11,641,696 | | | $ | — | | | $ | — | | | $ | 11,641,696 | |
Short-Term Investments | | | — | | | | 377,396 | | | | — | | | | 377,396 | |
| | | | |
Total | | $ | 11,641,696 | | | $ | 377,396 | | | $ | — | | | $ | 12,019,092 | |
| | | | |
(a) Details of the major categories of the Fund’s investments are reflected within the Portfolio of Investments.
For the year ended September 30, 2016, there were no transfers among Levels 1, 2 and 3
4. Purchases and Sales of Securities. For the year ended September 30, 2016, purchases and sales of securities (excluding short-term investments) were as follows:
| | | | | | | | |
Fund | | Purchases | | | Sales | |
Small Cap Growth Fund | | $ | 610,941,721 | | | $ | 689,757,477 | |
Small Cap Value Fund | | | 223,175,132 | | | | 344,150,766 | |
Small/Mid Cap Growth Fund | | | 7,418,989 | | | | 5,506,452 | |
| 60
Notes to Financial Statements – continued
September 30, 2016
5. Management Fees and Other Transactions with Affiliates.
a. Management Fees. Loomis, Sayles & Company, L.P. (“Loomis Sayles”) serves as investment adviser to each Fund. Under the terms of the management agreements, each Fund pays a management fee at the following annual rates, calculated daily and payable monthly, based on each Fund’s average daily net assets:
| | |
Fund | | Percentage of
Average Daily Net Assets |
Small Cap Growth Fund | | 0.75% |
Small Cap Value Fund | | 0.75% |
Small/Mid Cap Growth Fund | | 0.75% |
Loomis Sayles has given binding undertakings to the Funds to waive management fees and/or reimburse certain expenses to limit the Funds’ operating expenses, exclusive of acquired fund fees and expenses, brokerage expenses, interest expense, taxes, organizational and extraordinary expenses such as litigation and indemnification expenses. These undertakings are in effect until January 31, 2017, may be terminated before then only with the consent of the Funds’ Board of Trustees and are reevaluated on an annual basis. Management fees payable, as reflected on the Statements of Assets and Liabilities, is net of waivers and/or expense reimbursements, if any, pursuant to these undertakings. Waivers/reimbursements that exceed management fees payable are reflected on the Statements of Assets and Liabilities as receivable from investment adviser.
For the year ended September 30, 2016, the expense limits as a percentage of average daily net assets under the expense limitation agreements were as follows:
| | | | | | | | |
| | | Expense Limit as a Percentage of
Average Daily Net Assets |
Fund | | Institutional Class | | Retail Class | | Admin Class | | Class N |
Small Cap Growth Fund | | 1.00% | | 1.25% | | — | | 0.95% |
Small Cap Value Fund | | 0.90% | | 1.15% | | 1.40% | | 0.85% |
Small/Mid Cap Growth Fund | | 0.85% | | — | | — | | — |
Loomis Sayles shall be permitted to recover expenses it has borne under the expense limitation agreements (whether through waiver of its management fees or otherwise) on a class by class basis in later periods to the extent the annual operating expenses of a class fall below a class’ expense limits, provided, however, that a class is not obligated to pay such waived/reimbursed fees or expenses more than one year after the end of the fiscal year in which the fees or expenses were waived/reimbursed.
61 |
Notes to Financial Statements – continued
September 30, 2016
For the year ended September 30, 2016, the management fees for each Fund were as follows:
| | | | | | | | | | | | | | | | |
Fund | | Gross
Management
Fees | | | Waivers of
Management
Fees1 | | | Net
Management
Fees | | | Percentage of
Average Daily Net Assets |
| | | | | Gross | | Net |
Small Cap Growth Fund | | $ | 8,333,969 | | | $ | — | | | $ | 8,333,969 | | | 0.75% | | 0.75% |
Small Cap Value Fund | | | 7,820,966 | | | | — | | | | 7,820,966 | | | 0.75% | | 0.75% |
Small/Mid Cap Growth Fund | | | 80,170 | | | | 80,170 | | | | — | | | 0.75% | | — |
For the year ended September 30, 2016, class-specific expenses have been reimbursed as follows:
| | | | | | | | | | | | | | | | | | | | |
| | | Reimbursement1 | |
Fund | | Institutional
Class | | | Retail
Class | | | Admin
Class | | | Class N | | | Total | |
Small Cap Value Fund | | $ | 192,869 | | | $ | 77,883 | | | $ | 12,689 | | | $ | — | | | $ | 283,441 | |
In addition, the investment adviser reimbursed expenses of Small/Mid Cap Growth Fund in the amount of $15,788 for the year ended September 30, 20161.
1 Waivers/expense reimbursements are subject to possible recovery until September 30, 2017.
Certain officers and employees of Loomis Sayles are also officers or Trustees of the Trusts. Loomis Sayles’ general partner is indirectly owned by Natixis Global Asset Management, L.P. (“Natixis US”), which is part of Natixis Global Asset Management, an international asset management group based in Paris, France.
b. Service and Distribution Fees. NGAM Distribution, which is a wholly-owned subsidiary of Natixis US, has entered into a distribution agreement with the Trusts. Pursuant to this agreement, NGAM Distribution serves as principal underwriter of the Funds of the Trusts.
Pursuant to Rule 12b-1 under the 1940 Act, Small Cap Growth Fund and Small Cap Value Fund have adopted a Distribution Plan relating to each Fund’s Retail Class shares (the “Retail Class Plans”) and Small Cap Value Fund has adopted a Distribution Plan relating to its Admin Class shares (the “Admin Class Plan”).
Under the Retail Class Plans, each Fund pays NGAM Distribution a monthly distribution fee at an annual rate not to exceed 0.25% of the average daily net assets attributable to the Fund’s Retail Class shares, as compensation for services provided by NGAM Distribution in connection with the marketing or sale of Retail Class shares or for payments made by NGAM Distribution to securities dealers or other financial intermediaries as commissions, asset-based sales charges or other compensation with respect to the sale of Retail Class shares, or for providing personal services to investors and/or the maintenance of shareholder accounts.
| 62
Notes to Financial Statements – continued
September 30, 2016
Under the Admin Class Plan, Small Cap Value Fund pays NGAM Distribution a monthly distribution fee at an annual rate not to exceed 0.25% of the average daily net assets attributable to the Fund’s Admin Class shares, as compensation for services provided by NGAM Distribution in connection with the marketing or sale of Admin Class shares or for payments made by NGAM Distribution to securities dealers or other financial intermediaries as commissions, asset-based sales charges or other compensation with respect to the sale of Admin Class shares, or for providing personal services to investors and/or the maintenance of shareholder accounts.
In addition, the Admin Class shares of Small Cap Value Fund may pay NGAM Distribution an administrative service fee, at an annual rate not to exceed 0.25% of the average daily net assets attributable to Admin Class shares. These fees are subsequently paid to securities dealers or financial intermediaries for providing personal services and/or account maintenance for their customers who hold such shares.
For the year ended September 30, 2016, the service and distribution fees for each Fund were as follows:
| | | | | | | | | | | | |
| | | Service Fees | | | Distribution Fees | |
Fund | | Admin Class | | | Retail Class | | | Admin Class | |
Small Cap Growth Fund | | $ | — | | | $ | 345,619 | | | $ | — | |
Small Cap Value Fund | | | 109,390 | | | | 690,696 | | | | 111,780 | |
For the year ended September 30, 2016, NGAM Distribution refunded Small Cap Value Fund $2,389 of prior year Admin Class service fees paid to NGAM Distribution in excess of amounts subsequently paid to securities dealers or financial intermediaries. Service and distribution fees on the Statements of Operations have been reduced by this amount.
c. Administrative Fees. NGAM Advisors, L.P. (“NGAM Advisors”) provides certain administrative services for the Funds and contracts with State Street Bank to serve as sub-administrator. NGAM Advisors is a wholly-owned subsidiary of Natixis US. Pursuant to an agreement among Natixis Funds Trusts, Loomis Sayles Funds Trusts and NGAM Advisors, each Fund pays NGAM Advisors monthly its pro rata portion of fees equal to an annual rate of 0.0575% of the first $15 billion of the average daily net assets of the Natixis Funds Trusts and Loomis Sayles Funds Trusts, 0.0500% of the next $15 billion, 0.0400% of the next $30 billion, 0.0350% of the next $30 billion and 0.0325% of such assets in excess of $90 billion, subject to an annual aggregate minimum fee for the Natixis Funds Trusts and Loomis Sayles Funds Trusts of $10 million, which is reevaluated on an annual basis.
63 |
Notes to Financial Statements – continued
September 30, 2016
For the year ended September 30, 2016, the administrative fees for each Fund were as follows:
| | | | |
Fund | | Administrative
Fees | |
Small Cap Growth Fund | | $ | 489,740 | |
Small Cap Value Fund | | | 459,609 | |
Small/Mid Cap Growth Fund | | | 4,714 | |
d. Sub-Transfer Agent Fees. NGAM Distribution has entered into agreements, which include servicing agreements, with financial intermediaries that provide recordkeeping, processing, shareholder communications and other services to customers of the intermediaries that hold positions in the Funds and has agreed to compensate the intermediaries for providing those services. Intermediaries transact with the Funds primarily through the use of omnibus accounts on behalf of their customers who hold positions in the Funds. These services would have been provided by the Funds’ transfer agent and other service providers if the shareholders’ accounts were maintained directly at the Funds’ transfer agent. Accordingly, the Funds have agreed to reimburse NGAM Distribution for all or a portion of the servicing fees paid to these intermediaries. The reimbursement amounts (sub-transfer agent fees) paid to NGAM Distribution are subject to a current per-account equivalent fee limit approved by the Funds’ Board of Trustees, which is based on fees for similar services paid to the Funds’ transfer agent and other service providers. Class N shares do not bear such expenses.
For the year ended September 30, 2016, the sub-transfer agent fees (which are reflected in transfer agent fees and expenses in the Statements of Operations) for each Fund were as follows:
| | | | |
Fund | | Sub-Transfer
Agent Fees | |
Small Cap Growth Fund | | $ | 1,109,571 | |
Small Cap Value Fund | | | 982,142 | |
Small/Mid Cap Growth Fund | | | 143 | |
As of September 30, 2016, the Funds owe NGAM Distribution the following reimbursements for sub-transfer agent fees (which are reflected in the Statements of Assets and Liabilities as payable to distributor):
| | | | |
Fund | | Reimbursements
of Sub-Transfer
Agent Fees | |
Small Cap Growth Fund | | $ | 12,612 | |
Small Cap Value Fund | | | 9,121 | |
Small/Mid Cap Growth Fund | | | 2 | |
Sub-transfer agent fees attributable to Institutional Class, Retail Class and Admin Class are allocated on a pro rata basis to each class based on the relative net assets of each class to the total net assets of those classes.
| 64
Notes to Financial Statements – continued
September 30, 2016
e. Trustees Fees and Expenses. The Trusts do not pay any compensation directly to their officers or Trustees who are directors, officers or employees of NGAM Advisors, NGAM Distribution, Natixis US or their affiliates. The Chairperson of the Board of Trustees receives a retainer fee at the annual rate of $325,000. The Chairperson does not receive any meeting attendance fees for Board of Trustees meetings or committee meetings that she attends. Each Independent Trustee (other than the Chairperson) receives, in the aggregate, a retainer fee at the annual rate of $155,000. Each Independent Trustee also receives a meeting attendance fee of $10,000 for each meeting of the Board of Trustees that he or she attends in person and $5,000 for each meeting of the Board of Trustees that he or she attends telephonically. In addition, the chairperson of the Contract Review Committee and the chairperson of the Audit Committee each receive an additional retainer fee at the annual rate of $17,500. The chairperson of the Governance Committee receives an additional retainer fee at the annual rate of $10,000. Each Contract Review Committee member is compensated $6,000 for each Committee meeting that he or she attends in person and $3,000 for each meeting that he or she attends telephonically. Each Audit Committee member is compensated $6,000 for each Committee meeting that he or she attends in person and $3,000 for each meeting that he or she attends telephonically. These fees are allocated among the funds in the Natixis Funds Trusts and Loomis Sayles Funds Trusts based on a formula that takes into account, among other factors, the relative net assets of each fund. Trustees are reimbursed for travel expenses in connection with attendance at meetings.
Prior to January 1, 2016, the Chairperson of the Board received a retainer fee at the annual rate of $300,000 and each Independent Trustee (other than the Chairperson) received, in the aggregate, a retainer fee at the annual rate of $130,000. The chairperson of the Governance Committee received an additional retainer fee at the annual rate of $5,000. All other Trustee fees remained unchanged.
A deferred compensation plan (the “Plan”) is available to the Trustees on a voluntary basis. Deferred amounts remain in the Funds until distributed in accordance with the provisions of the Plan. The value of a participating Trustee’s deferral account is based on theoretical investments of deferred amounts, on the normal payment dates, in certain funds of the Natixis Funds Trusts and Loomis Sayles Funds Trusts as designated by the participating Trustees. Changes in the value of participants’ deferral accounts are allocated pro rata among the funds in the Natixis Funds Trusts and Loomis Sayles Funds Trusts, and are normally reflected as Trustees’ fees and expenses in the Statements of Operations. The portions of the accrued obligations allocated to the Funds under the Plan are reflected as Deferred Trustees’ fees in the Statements of Assets and Liabilities.
65 |
Notes to Financial Statements – continued
September 30, 2016
f. Affiliated Ownership. As of September 30, 2016, Loomis Sayles Funded Pension Plan and Trust (“Pension Plan”), Loomis Sayles Employees’ Profit Sharing Retirement Plan (“Retirement Plan”), and Natixis US held shares of the Funds representing the following percentages of the Fund’s net assets:
| | | | | | | | |
Fund | | Pension Plan | | Retirement
Plan | | Natixis US | | Total Affiliated
Ownership |
Small Cap Growth Fund | | 0.94% | | 1.32% | | — | | 2.26% |
Small Cap Value Fund | | 1.72% | | 2.59% | | — | | 4.31% |
Small/Mid Cap Growth | | — | | 8.91% | | 81.26% | | 90.17% |
Investment activities of affiliated shareholders could have material impacts on the Funds.
6. Class-Specific Transfer Agent Fees and Expenses. For the year ended September 30, 2016, the Funds incurred the following class-specific transfer agent fees and expenses (including sub-transfer agent fees, where applicable):
| | | | | | | | | | | | | | | | |
| | | Transfer Agent Fees and Expenses | |
Fund | | Institutional
Class | | | Retail
Class | | | Admin
Class | | | Class N | |
Small Cap Growth Fund | | $ | 963,724 | | | $ | 168,639 | | | $ | — | | | $ | 823 | |
Small Cap Value Fund | | | 690,093 | | | | 283,417 | | | | 45,896 | | | | 476 | |
Small/Mid Cap Growth Fund | | | 1,559 | | | | — | | | | — | | | | — | |
Transfer agent fees and expenses attributable to Institutional Class, Retail Class and Admin Class are allocated on a pro rata basis to each class based on relative net assets of each class to the total net assets of those classes. Transfer agent fees and expenses attributable to Class N are allocated to Class N.
7. Line of Credit. Effective April 14, 2016, the Fund, together with certain other funds of Natixis Funds Trusts and Loomis Sayles Funds Trusts, entered into a 364-day, $400,000,000 syndicated, committed, unsecured line of credit with Citibank, N.A. to be used for temporary or emergency purposes only. Any one Fund may borrow up to the full $400,000,000 under the line of credit (as long as all borrowings by all Funds in the aggregate do not exceed the $400,000,000 limit at any time) subject to each Fund’s investment restrictions. Interest is charged to the Funds at a rate equal to the greater of the eurodollar or the federal funds rate plus 1.00%. In addition, a commitment fee of 0.10% per annum, payable on the last business day of each month, is accrued and apportioned among the participating funds based on their average daily unused portion of the line of credit. The Funds paid an arrangement fee, an upfront fee, and other fees in connection with the new line of credit agreement, which are being amortized over a period of 364 days and are reflected as miscellaneous expenses on the Statements of Operations. The unamortized balance is reflected as prepaid expenses on the Statements of Assets and Liabilities.
Prior to April 14, 2016 each Fund, together with certain other funds of Natixis Funds Trusts and Loomis Sayles Funds Trusts, participated in a $150,000,000 committed
| 66
Notes to Financial Statements – continued
September 30, 2016
unsecured line of credit provided by State Street Bank. Any one Fund was able to borrow up to the full $150,000,000 under the line of credit (as long as all borrowings by all Funds in the aggregate do not exceed the $150,000,000 limit at any time). Interest was charged to each participating Fund based on its borrowings at a rate per annum equal to the greater of the Federal Funds rate or overnight LIBOR, plus 1.25%. In addition, a commitment fee of 0.15% per annum, payable at the end of each calendar quarter, was accrued and apportioned among the participating funds based on their average daily unused portion of the line of credit.
For the year ended September 30, 2016, none of the Funds had borrowings under these agreements.
8. Brokerage Commission Recapture. Each Fund has entered into agreements with certain brokers whereby the brokers will rebate a portion of brokerage commissions. All amounts rebated by the brokers are returned to the Funds under such agreements and are included in realized gains on investments in the Statements of Operations. For the year ended September 30, 2016, amounts rebated under these agreements were as follows:
| | | | |
Fund | | Rebates | |
Small Cap Growth Fund | | $ | 75,395 | |
Small Cap Value Fund | | | 49,751 | |
Small/Mid Cap Growth Fund | | | 629 | |
9. Concentration of Ownership. From time to time, a Fund may have a concentration of one or more accounts constituting a significant percentage of shares outstanding. Investment activities by holders of such accounts could have material impacts on the Funds. As of September 30, 2016, based on management’s evaluation of the shareholder account base, the Funds had accounts representing controlling ownership of more than 5% of the Fund’s total outstanding shares. The number of such accounts, based on accounts that represent more than 5% of an individual class of shares, and the aggregate percentage of net assets represented by such holdings were as follows:
| | | | | | | | |
Fund | | Number of 5%
Non-Affiliated
Account Holders | | Percentage of
Non-Affiliated
Ownership | | Percentage of
Affiliated Ownership
(Note 5) | | Total
Percentage of
Ownership |
Small Cap Growth Fund | | 2 | | 31.74% | | — | | 31.74% |
Small Cap Value Fund | | 2 | | 19.29% | | — | | 19.29% |
Small/Mid Cap Growth | | — | | — | | 90.17% | | 90.17% |
Omnibus shareholder accounts for which NGAM Advisors understands that the intermediary has discretion over the underlying shareholder accounts or investment models where a shareholder account may be invested for a non-discretionary customer are included in the table above. For other omnibus accounts, the Funds do not have information on the individual shareholder accounts underlying the omnibus accounts; therefore, there could be other 5% shareholders in addition to those disclosed in the table above.
67 |
Notes to Financial Statements – continued
September 30, 2016
10. Capital Shares. Each Fund may issue an unlimited number of shares of beneficial interest, without par value. Transactions in capital shares were as follows:
| | | | | | | | | | | | | | | | |
| | | Small Cap Growth Fund | |
| | | Year Ended
September 30, 2016 | | | Year Ended
September 30, 2015 | |
| Institutional Class | | Shares | | | Amount | | | Shares | | | Amount | |
Issued from the sale of shares | | | 7,447,055 | | | $ | 155,701,856 | | | | 7,265,268 | | | $ | 175,813,770 | |
Issued in connection with the reinvestment of distributions | | | 2,716,857 | | | | 58,412,420 | | | | 5,134,319 | | | | 117,062,465 | |
Redeemed | | | (9,612,542 | ) | | | (201,629,117 | ) | | | (11,470,816 | ) | | | (274,541,353 | ) |
Subscription in-kind (Note 11) | | | 277,161 | | | | 5,698,438 | | | | — | | | | — | |
| | | | | | | | | | | | | | | | |
Net change | | | 828,531 | | | $ | 18,183,597 | | | | 928,771 | | | $ | 18,334,882 | |
| | | | | | | | | | | | | | | | |
| Retail Class | | | | | | | | | | | | |
Issued from the sale of shares | | | 935,456 | | | $ | 18,282,313 | | | | 1,423,680 | | | $ | 32,677,891 | |
Issued in connection with the reinvestment of distributions | | | 588,964 | | | | 11,867,620 | | | | 1,163,810 | | | | 25,045,197 | |
Redeemed | | | (3,547,121 | ) | | | (71,211,754 | ) | | | (2,397,388 | ) | | | (53,969,398 | ) |
| | | | | | | | | | | | | | | | |
Net change | | | (2,022,701 | ) | | $ | (41,061,821 | ) | | | 190,102 | | | $ | 3,753,690 | |
| | | | | | | | | | | | | | | | |
| Class N | | | | | | | | | | | | |
Issued from the sale of shares | | | 3,494,879 | | | $ | 74,656,476 | | | | 6,907,906 | | | $ | 165,784,056 | |
Issued in connection with the reinvestment of distributions | | | 616,186 | | | | 13,284,984 | | | | 119,335 | | | | 2,724,416 | |
Redeemed | | | (2,515,389 | ) | | | (53,613,909 | ) | | | (346,462 | ) | | | (8,289,576 | ) |
| | | | | | | | | | | | | | | | |
Net change | | | 1,595,676 | | | $ | 34,327,551 | | | | 6,680,779 | | | $ | 160,218,896 | |
| | | | | | | | | | | | | | | | |
Increase (decrease) from capital share transactions | | | 401,506 | | | $ | 11,449,327 | | | | 7,799,652 | | | $ | 182,307,468 | |
| | | | | | | | | | | | | | | | |
| |
| | | Small Cap Value Fund | |
| | | Year Ended
September 30, 2016 | | | Year Ended
September 30, 2015 | |
| Institutional Class | | Shares | | | Amount | | | Shares | | | Amount | |
Issued from the sale of shares | | | 3,109,829 | | | $ | 98,123,134 | | | | 3,379,231 | | | $ | 118,476,722 | |
Issued in connection with the reinvestment of distributions | | | 2,210,358 | | | | 66,708,596 | | | | 2,730,775 | | | | 93,993,275 | |
Redeemed | | | (5,042,901 | ) | | | (158,011,519 | ) | | | (5,495,573 | ) | | | (195,820,490 | ) |
Redeemed in-kind (Note 11) | | | (1,595,784 | ) | | | (52,325,759 | ) | | | — | | | | — | |
| | | | | | | | | | | | | | | | |
Net change | | | (1,318,498 | ) | | $ | (45,505,548 | ) | | | 614,433 | | | $ | 16,649,507 | |
| | | | | | | | | | | | | | | | |
| 68
Notes to Financial Statements – continued
September 30, 2016
10. Capital Shares – continued.
| | | | | | | | | | | | | | | | |
| | | Small Cap Value Fund – continued | |
| | | Year Ended
September 30, 2016 | | | Year Ended
September 30, 2015 | |
| Retail Class | | Shares | | | Amount | | | Shares | | | Amount | |
Issued from the sale of shares | | | 609,197 | | | $ | 18,890,158 | | | | 931,124 | | | $ | 32,655,794 | |
Issued in connection with the reinvestment of distributions | | | 943,438 | | | | 28,142,755 | | | | 1,357,910 | | | | 46,236,825 | |
Redeemed | | | (3,153,621 | ) | | | (100,205,101 | ) | | | (2,618,373 | ) | | | (91,431,051 | ) |
| | | | | | | | | | | | | | | | |
Net change | | | (1,600,986 | ) | | $ | (53,172,188 | ) | | | (329,339 | ) | | $ | (12,538,432 | ) |
| | | | | | | | | | | | | | | | |
| Admin Class | | | | | | | | | | | | |
Issued from the sale of shares | | | 341,303 | | | $ | 10,091,067 | | | | 314,600 | | | $ | 10,633,628 | |
Issued in connection with the reinvestment of distributions | | | 111,997 | | | | 3,244,570 | | | | 179,802 | | | | 5,960,432 | |
Redeemed | | | (574,173 | ) | | | (17,370,719 | ) | | | (774,906 | ) | | | (26,217,314 | ) |
| | | | | | | | | | | | | | | | |
Net change | | | (120,873 | ) | | $ | (4,035,082 | ) | | | (280,504 | ) | | $ | (9,623,254 | ) |
| | | | | | | | | | | | | | | | |
| Class N | | | | | | | | | | | | |
Issued from the sale of shares | | | 945,571 | | | $ | 29,754,154 | | | | 1,179,383 | | | $ | 42,095,614 | |
Issued in connection with the reinvestment of distributions | | | 140,642 | | | | 4,245,978 | | | | 26,566 | | | | 914,684 | |
Redeemed | | | (261,689 | ) | | | (8,144,577 | ) | | | (79,684 | ) | | | (2,779,124 | ) |
| | | | | | | | | | | | | | | | |
Net change | | | 824,524 | | | $ | 25,855,555 | | | | 1,126,265 | | | $ | 40,231,174 | |
| | | | | | | | | | | | | | | | |
Increase (decrease) from capital share transactions | | | (2,215,833 | ) | | $ | (76,857,263 | ) | | | 1,130,855 | | | $ | 34,718,995 | |
| | | | | | | | | | | | | | | | |
| | | | | | | | | | | | | | | | |
| | | Small/Mid Cap Growth Fund | |
| | | Year Ended
September 30, 2016 | | | Period Ended
September 30, 2015(a) | |
| Institutional Class | | Shares | | | Amount | | | Shares | | | Amount | |
Issued from the sale of shares | | | 214,933 | | | $ | 1,914,485 | | | | 1,020,804 | | | $ | 10,199,072 | |
Redeemed | | | (5,401 | ) | | | (50,724 | ) | | | — | | | | — | |
| | | | | | | | | | | | | | | | |
Net change | | | 209,532 | | | $ | 1,863,761 | | | | 1,020,804 | | | $ | 10,199,072 | |
| | | | | | | | | | | | | | | | |
Increase (decrease) from capital share transactions | | | 209,532 | | | $ | 1,863,761 | | | | 1,020,804 | | | $ | 10,199,072 | |
| | | | | | | | | | | | | | | | |
(a) From commencement of operations on June 30, 2015 through September 30, 2015.
11. Redemption/Subscription In-Kind. In certain circumstances, a Fund may distribute portfolio securities rather than cash as payment for redemption of Fund shares (redemption in-kind). For financial reporting purposes, the Fund will recognize a gain on in-kind redemptions to the extent the value of the distributed securities on the date of
69 |
Notes to Financial Statements – continued
September 30, 2016
redemption exceeds the cost of those securities; the Fund will recognize a loss if the cost exceeds value. Gains and losses realized on redemptions in-kind are not recognized for tax purposes, and are re-classified from realized gain (loss) to paid-in-capital. Small Cap Value Fund realized a gain of $16,627,849 on redemptions in-kind during the the year ended September 30, 2016. This amount is included in realized gain (loss) on the Statements of Operations. A Fund may also receive securities in lieu of cash as payment for Fund shares. During the year ended September 30, 2016, Small Cap Growth Fund received equity securities valued at $5,698,438 as payment for Fund shares.
| 70
Report of Independent Registered Public Accounting Firm
To the Trustees of Loomis Sayles Funds Trust I and Loomis Sayles Funds Trust II and Shareholders of Loomis Sayles Small Cap Growth Fund, Loomis Sayles Small Cap Value Fund and Loomis Sayles Small/Mid Cap Growth Fund:
In our opinion, the accompanying statements of assets and liabilities, including the portfolios of investments, and the related statements of operations and of changes in net assets and the financial highlights present fairly, in all material respects, the financial position of the Loomis Sayles Small Cap Growth Fund, a series of Loomis Sayles Funds Trust II, Loomis Sayles Small Cap Value Fund, a series of Loomis Sayles Funds Trust I, and Loomis Sayles Small/Mid Cap Growth Fund, a series of Loomis Sayles Funds Trust II (collectively, the “Funds”) at September 30, 2016, and the results of each of their operations, the changes in each of their net assets and the financial highlights for each of the periods indicated, in conformity with accounting principles generally accepted in the United States of America. These financial statements and financial highlights (hereafter referred to as “financial statements”) are the responsibility of the Funds’ management. Our responsibility is to express an opinion on these financial statements based on our audits. We conducted our audits of these financial statements in accordance with the standards of the Public Company Accounting Oversight Board (United States). Those standards require that we plan and perform the audit to obtain reasonable assurance about whether the financial statements are free of material misstatement. An audit includes examining, on a test basis, evidence supporting the amounts and disclosures in the financial statements, assessing the accounting principles used and significant estimates made by management, and evaluating the overall financial statement presentation. We believe that our audits, which included confirmation of securities at September 30, 2016 by correspondence with the custodian and brokers, provide a reasonable basis for our opinion expressed above.
PricewaterhouseCoopers LLP
Boston, Massachusetts
November 21, 2016
71 |
2016 U.S. Tax Distribution Information to Shareholders (Unaudited)
Corporate Dividends Received Deduction. For the fiscal year ended September 30, 2016, a percentage of dividends distributed by the Fund listed below qualifies for the dividends received deduction for corporate shareholders. This percentage is as follows:
| | | | |
Fund | | Qualifying Percentage | |
| Small Cap Value | | | 100.00% | |
Capital Gains Distributions. Pursuant to Internal Revenue Section 852(b), the following Funds paid distributions, which have been designated as capital gains distributions for the fiscal year ended September 30, 2016, unless subsequently determined to be different.
| | | | |
Fund | | Amount | |
Small Cap Growth | | $ | 85,662,346 | |
Small Cap Value | | | 98,999,090 | |
Qualified Dividend Income. For the fiscal year ended September 30, 2016, the Fund below will designate up to the maximum amount allowable pursuant to the Internal Revenue Code as qualified dividend income eligible for reduced tax rates. These lower rates range from 0% to 20% depending on an individual’s tax bracket. If the Fund pays a distribution during calendar year 2016, complete information will be reported in conjunction with Form 1099-DIV.
| 72
Trustee and Officer Information
The tables below provide certain information regarding the trustees and officers of Loomis Sayles Funds I and Loomis Sayles Funds II (the “Trusts”). Unless otherwise indicated, the address of all persons below is 399 Boylston Street, Boston, MA 02116. The Funds’ Statement(s) of Additional Information include additional information about the trustees of the Trusts and are available by calling 800-633-3330.
| | | | | | | | |
| Name and Year of Birth | | Position(s) Held
with the Trust(s),
Length of Time
Served and
Term of Office1 | | Principal
Occupation(s)
During Past 5 Years | | Number of
Portfolios in
Fund Complex
Overseen2 and
Other
Directorships Held
During Past 5 Years | | Experience,
Qualifications,
Attributes, Skills
for Board
Membership |
| | | |
| INDEPENDENT TRUSTEES | | | | | | |
| | | | |
Kenneth A. Drucker
(1945) | | Trustee since 2008 Chairperson of the Audit Committee and Governance Committee Member | | Retired | | 44
None | | Significant experience on the Board and on the boards of other business organizations (including at investment companies); executive experience (including as treasurer of an aerospace, automotive, and metal manufacturing corporation) |
| | | | |
Edmond J. English
(1953) | | Trustee since 2013 Audit Committee Member | | Chief Executive Officer of Bob’s Discount Furniture (retail) | | 44
Director, Burlington Stores, Inc. (retail); Formerly, Director, BJ’s Wholesale Club (retail) | | Experience on the Board and significant experience on the boards of other business organizations (including retail companies and a bank); executive experience (including at a retail company) |
| | | | |
Richard A. Goglia
(1951) | | Trustee since 2015 Audit Committee Member | | Retired; formerly Vice President and Treasurer of Raytheon Company (defense) | | 44 None | | Experience on the Board and executive experience (including his role as vice president and treasurer of a defense company and experience at a financial services company) |
73 |
Trustee and Officer Information – continued
| | | | | | | | |
| Name and Year of Birth | | Position(s) Held
with the Trust(s),
Length of Time
Served and
Term of Office1 | | Principal
Occupation(s)
During Past 5 Years | | Number of
Portfolios in
Fund Complex
Overseen2 and
Other
Directorships Held
During Past 5 Years | | Experience,
Qualifications,
Attributes, Skills
for Board
Membership |
| | |
| INDEPENDENT TRUSTEES – continued | | | | |
| | | | |
Wendell J. Knox
(1948) | | Trustee since 2009 Contract Review Committee Member and Governance Committee Member | | Director of Abt Associates Inc. (research and consulting) | | 44
Director, Eastern Bank (bank); Director, The Hanover Insurance Group (property and casualty insurance) | | Significant experience on the Board and on the boards of other business organizations (including at a bank and at a property and casualty insurance firm); executive experience (including roles as president and chief executive officer of a research and consulting company) |
| | | | |
Martin T. Meehan
(1956) | | Trustee since 2012 Contract Review Committee Member | | President, University of Massachusetts; formerly, Chancellor and faculty member, University of Massachusetts Lowell | | 44
None | | Experience on the Board and on the boards of other business organizations; experience as President of the University of Massachusetts; government experience (including as a member of the U.S. House of Representatives); academic experience |
| 74
Trustee and Officer Information – continued
| | | | | | | | |
| Name and Year of Birth | | Position(s) Held
with the Trust(s),
Length of Time
Served and
Term of Office1 | | Principal
Occupation(s)
During Past 5 Years | | Number of
Portfolios in
Fund Complex
Overseen2 and
Other
Directorships Held
During Past 5 Years | | Experience,
Qualifications,
Attributes, Skills
for Board
Membership |
| | |
| INDEPENDENT TRUSTEES – continued | | | | |
| | | | |
Sandra O. Moose
(1942) | | Chairperson of the Board of Trustees since November 2005 Trustee since 2003 Ex Officio member of the Audit Committee, the Contract Review Committee and the Governance Committee | | President, Strategic Advisory Services (management consulting) | | 44
Formerly, Director, AES Corporation (international power company); formerly, Director, Verizon Communications (telecommunications company) | | Significant experience on the Board and on the boards of other business organizations (including at a telecommunications company, an international power company and a specialty chemicals corporation); executive experience (including at a management consulting company) |
| | | | |
James P. Palermo
(1955) | | Trustee since 2016 Contract Review Committee Member | | Founding Partner, Breton Capital Management, LLC (private equity); formerly, Chief Executive Officer of Global Client Management of The Bank of New York Mellon Corporation | | 44
None | | Experience on the Board; financial services industry and executive experience (including roles as chief executive officer of client management and asset servicing for a banking and financial services company) |
| | | | |
Erik R. Sirri
(1958) | | Trustee since 2009 Audit Committee Member | | Professor of Finance at Babson College | | 44
None | | Significant experience on the Board; experience as Director of the Division of Trading and Markets at the Securities and Exchange Commission; academic experience; training as an economist |
75 |
Trustee and Officer Information – continued
| | | | | | | | |
| Name and Year of Birth | | Position(s) Held
with the Trust(s),
Length of Time
Served and
Term of Office1 | | Principal
Occupation(s)
During Past 5 Years | | Number of
Portfolios in
Fund Complex
Overseen2 and
Other
Directorships Held
During Past 5 Years | | Experience,
Qualifications,
Attributes, Skills
for Board
Membership |
| | |
| INDEPENDENT TRUSTEES – continued | | | | |
| | | | |
Peter J. Smail
(1952) | | Trustee since 2009 Chairperson of the Contract Review Committee and Governance Committee Member | | Retired | | 44
None | | Significant experience on the Board; mutual fund industry and executive experience (including roles as president and chief executive officer for an investment adviser) |
| | | | |
Cynthia L. Walker
(1956) | | Trustee since 2005 Chairperson of the Governance Committee and Contract Review Committee Member | | Deputy Dean for Finance and Administration, Yale University School of Medicine | | 44
None | | Significant experience on the Board; executive experience in a variety of academic organizations (including roles as dean for finance and administration) |
| | |
| INTERESTED TRUSTEES | | | | |
| | | | |
Kevin P. Charleston3 (1965) One Financial Center Boston, MA 02111 | | Trustee since 2015 President and Chief Executive Officer of Loomis Sayles Funds I since 2015 | | President, Chief Executive Officer and Director; formerly, Chief Financial Officer, Loomis, Sayles & Company, L.P. | | 44
None | | Experience on the Board; continuing service as President, Chief Executive Officer and Director of Loomis, Sayles & Company, L.P. |
| | | | |
David L. Giunta4 (1965) | | Trustee since 2011 President since 2008 and Chief Executive Officer since 2015 of Loomis Sayles Funds II and Executive Vice President of Loomis Sayles Funds I since 2008 | | President and Chief Executive Officer, NGAM Distribution Corporation, NGAM Advisors, L.P. and NGAM Distribution, L.P. | | 44
None | | Significant experience on the Board; continuing experience as President and Chief Executive Officer of NGAM Advisors, L.P. |
| 76
Trustee and Officer Information – continued
| | | | | | | | |
| Name and Year of Birth | | Position(s) Held
with the Trust(s),
Length of Time
Served and
Term of Office1 | | Principal
Occupation(s)
During Past 5 Years | | Number of
Portfolios in
Fund Complex
Overseen2 and
Other
Directorships Held
During Past 5 Years | | Experience,
Qualifications,
Attributes, Skills
for Board
Membership |
| | |
| INTERESTED TRUSTEES – continued | | | | |
| | | | |
John T. Hailer5
(1960) | | Trustee since 2003 | | President and Chief Executive Officer –U.S. and Asia, Natixis Global Asset Management, L.P. | | 44
None | | Significant experience on the Board; continuing experience as President and Chief Executive Officer – U.S. and Asia, Natixis Global Asset Management, L.P. |
| 1 | Each trustee serves until retirement, resignation or removal from the Board. The current retirement age is 75. The position of Chairperson of the Board is appointed for a three-year term. Ms. Moose was appointed to serve an additional three-year term as the Chairperson of the Board on December 13, 2013. |
| 2 | The trustees of the Trusts serve as trustees of a fund complex that includes all series of the Natixis Funds Trust I, Natixis Funds Trust II, Natixis Funds Trust IV and Gateway Trust (collectively, the “Natixis Funds Trusts”), Loomis Sayles Funds I and Loomis Sayles Funds II (collectively, the “Loomis Sayles Funds Trusts”) and Natixis ETF Trust (collectively, the “Fund Complex”). |
| 3 | Mr. Charleston is deemed an “interested person” of the Trusts because he holds the following positions with an affiliated person of the Trusts: President and Chief Executive Officer of Loomis, Sayles & Company, L.P. |
| 4 | Mr. Giunta is deemed an “interested person” of the Trusts because he holds the following positions with an affiliated person of the Trusts: President and Chief Executive Officer of NGAM Distribution Corporation, NGAM Advisors, L.P. and NGAM Distribution, L.P. |
| 5 | Mr. Hailer is deemed an “interested person” of the Trusts because he holds the following positions with an affiliated person of the Trusts: President and Chief Executive Officer – U.S. and Asia, Natixis Global Asset Management, L.P. |
77 |
Trustee and Officer Information – continued
| | | | | | |
| Name and Year of Birth | | Position(s) Held with
the Trust(s) | | Term of Office1 and
Length of Time Served | | Principal Occupation(s)
During Past 5 Years2 |
| | |
| OFFICERS OF THE TRUST | | | | |
| | | |
Daniel J. Fuss
(1933) One Financial Center Boston, MA 02111 | | Executive Vice President | | Since June 2003 | | Vice Chairman and Director, Loomis, Sayles & Company, L.P. |
| | | |
Russell L. Kane
(1969) | | Secretary, Clerk and Chief Legal Officer | | Since July 2016 | | Executive Vice President, General Counsel, Secretary and Clerk, NGAM Distribution Corporation, NGAM Advisors, L.P. and NGAM Distribution, L.P.; formerly, Chief Compliance Officer for Mutual Funds, Senior Vice President, Deputy General Counsel, Assistant Secretary and Assistant Clerk, NGAM Distribution Corporation, NGAM Advisors, L.P. and NGAM Distribution, L.P. |
| | | |
Michael C. Kardok
(1959) | | Treasurer, Principal Financial and Accounting Officer | | Since October 2004 | | Senior Vice President, NGAM Advisors, L.P. and NGAM Distribution, L.P. |
| | | |
Rosa Licea-Mailloux
(1976) | | Chief Compliance Officer, Assistant Secretary and Anti-Money Laundering Officer | | Since July 2016 | | Mutual Funds Chief Compliance Officer, Senior Vice President, Deputy General Counsel, Assistant Secretary and Assistant Clerk, NGAM Distribution Corporation, NGAM Advisors, L.P. and NGAM Distribution, L.P.; formerly, Associate General Counsel, NGAM Distribution, L.P. |
| 1 | Each officer of the Trust serves for an indefinite term in accordance with the Trust’s current by-laws until the date his or her successor is elected and qualified, or until he or she sooner dies, retires, is removed or becomes disqualified. |
| 2 | Each person listed above, except as noted, holds the same position(s) with the Fund Complex. Mr. Fuss is not an officer of the Natixis Funds Trusts or the Natixis ETF Trust. Previous positions during the past five years with NGAM Distribution, L.P., NGAM Advisors, L.P. or Loomis, Sayles & Company, L.P. are omitted, if not materially different from a trustee’s or officer’s current position with such entity. |
| 78

Loomis Sayles Fixed Income Fund
Loomis Sayles Global Bond Fund
Loomis Sayles Inflation Protected Securities Fund
Loomis Sayles Institutional High Income Fund
Loomis Sayles Investment Grade Fixed Income Fund
Annual Report
September 30, 2016
LOOMIS SAYLES FIXED INCOME FUND
| | | | |
| Managers | | Symbol | | |
| Matthew J. Eagan, CFA® | | Institutional Class | | LSFIX |
| Daniel J. Fuss, CFA®, CIC | | | | |
| Brian P. Kennedy | | | | |
| Elaine M. Stokes | | | | |
Investment Objective
The Fund’s investment objective is high total investment return through a combination of current income and capital appreciation.
Market Conditions
In the beginning of the period, the Federal Reserve (Fed) raised interest rates for the first time since June 2006. This led to modest losses within investment-grade markets and added to an already challenging environment for high yield. After oil prices bottomed in mid-February, capital returned to markets and riskier assets rebounded strongly. Volatility spiked temporarily in June following the U.K. referendum vote to leave the European Union (EU), but conditions were generally calm for the remainder of the period. Fixed-income markets finished the period on a positive note and added to full-year gains.
After declining through mid-February, U.S. high yield became a sought-after asset. The sector rewarded investors by producing strong and steady gains with minimal volatility. Spreads (the difference in yield between non-Treasury and Treasury securities of similar maturity) are trading inside the long-term average, but remain above the lows of 2014. Lower-quality credits and cyclical sectors outperformed during the period as the search for yield presses onward.
Investment-grade corporate bonds also performed well during the one-year period, bouncing back from the lows experienced during the fourth quarter of 2015. The sector’s longer duration (price sensitivity to interest rate changes) was a positive tailwind as longer-maturity yields declined. Overall returns were positive across all sectors, with cyclical sectors and energy performing well during the second half of the period.
For roughly the first half of the period, the U.S. dollar continued to strengthen against most major global currencies. But the Fed struck a more dovish tone early in 2016, and this contributed to a pause in the dollar bull market. A more stable dollar supported currencies – particularly those in the emerging markets – that suffered during the dollar’s ascent. The recovery in oil prices also helped ease the strain on commodity-related currencies.
Performance Results
For the 12 months ended September 30, 2016, Institutional Class shares of Loomis Sayles Fixed Income Fund returned 9.72%. The fund outperformed its benchmark, the Bloomberg Barclays U.S. Government/Credit Bond Index, which returned 5.86%.
Explanation of Fund Performance
In general, our out-of-benchmark allocation to high yield credit drove the fund’s outperformance. In particular, a significant allocation to high yield industrials contributed to results. The stabilization and recovery of oil prices in the second half of the period led to strong returns for the sector, and our selected basic industry and capital goods names drove fund performance. We also held an out-of-benchmark position in common stocks, where name-specific exposure to the technology sector aided absolute and relative performance. Elsewhere, convertible securities were notable contributors to relative performance, particularly our selections within the technology sector. In addition, an allocation to non-U.S.-dollar-denominated securities added value. New Zealand dollar-denominated holdings were the largest contributors in the space. Though non-USD positions contributed positively to performance overall, U.S. dollar appreciation relative to foreign currencies challenged some of the fund’s non-USD holdings during the period. During the period the amount of income available to be distributed by the fund was reduced to reflect the realization of currency losses from certain bond sales and maturities.
Meanwhile, our shorter-than-benchmark duration detracted from results as interest rates declined over the period. Our cash and reserve positions lagged other sectors and hindered relative performance. Within the investment-grade corporate sector, strong results in financials largely offset weak performance from utility and industrial names. Among high yield corporate securities, a small position in utilities detracted from performance as investors favored riskier high yield sectors.
Outlook
Our outlook for the U.S. and global economies remains positive, with expectations for better growth momentum through the end of the year. In the U.S., we expect steady gains in employment, increased bank lending and stronger consumer confidence to support GDP growth. The global economy is facing more headwinds but should experience modestly stronger growth next year, led by a healthier U.S. economy and still-accommodative global central bank policies.
Inflation expectations remain low. However, U.S. inflation is showing signs of acceleration and recent economic data have been favorable. We think the Fed is likely to raise rates in December if market conditions remain stable.
1 |
Oil prices are likely to be range-bound over the short term as elevated supply should be countered by OPEC’s expected production cut in November. We remain constructive on intermediate- to longer-term oil prices and expect that supply and demand will adjust.
We expect low global yields to continue supporting flows into U.S. credit, but at a more modest pace. In this environment, we intend to maintain a yield cushion in our portfolios through exposure to corporate bonds. Credit fundamentals have been stable, reflecting a slowly improving U.S. economy. However, downside risks – including slowing profit growth, rising leverage and free cash flow approaching peak levels – are increasing as we move further into the late stage of the credit cycle.1 Despite these risks, we believe the current phase of the credit cycle can continue for some time, and we do not expect a significant increase in corporate defaults in 2017.
Within credit, we favor the investment-grade financials, technology and energy sectors. We are also biased to higher-quality high yield. Convertible bonds continue to look attractive, and our focus has shifted from equity-sensitive convertibles to more balanced and credit-sensitive issues. We believe these securities offer yield and upside potential with more limited downside risk.
The Fed’s slow and cautious approach has helped keep the U.S. dollar range-bound against major currencies. Over the long term, improving global growth and further stability in commodities could support non-U.S.-dollar-denominated bonds. We are beginning to see more divergence in emerging market country fundamentals and political backdrops, which could expand potential relative value opportunities. We intend to maintain our current positions, which we believe represent long-term value, but are cautious on further exposure until we get better clarity on some of these evolving macro trends.
Risks include growing geopolitical risks, a prolonged period of low economic growth, declining corporate profit expectations and a shift to downturn in the U.S. credit cycle. Looking ahead, we remain focused on careful security selection using fundamental credit analysis. We intend to build on our key investment themes of yield and diversification, using our reserve allocation during periods of extreme short-term market dislocation to potentially add long-term value.
Since early 2015, ordinary income distributions for certain Loomis Sayles-managed fixed-income funds have been reduced, primarily due to the impact of foreign currency losses. Fund officers have analyzed the fund’s current portfolio of investments, schedule of maturities and the corresponding amounts of unrealized currency losses that may become realized in the fiscal year ending on September 30, 2017. Based on this analysis, fund officers believe that realized currency losses may have a less significant impact on this fund’s distributions in the 2017 fiscal year. As a result, the distribution amount may improve going forward. This analysis is based on certain assumptions, including but not limited to the level of foreign currency exchange rates, security prices, interest rates and the net asset level of the fund. Changes to these assumptions could impact the analysis and the amounts of future fund distributions.
| 1 | | A credit cycle is a cyclical pattern that follows credit availability and corporate health. |
Hypothetical Growth of $3,000,000 Investment in Institutional Class Shares
September 30, 2006 through September 30, 20162
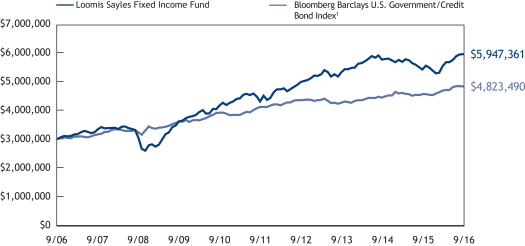
See notes to chart on page 3.
| 2
LOOMIS SAYLES FIXED INCOME FUND
Average Annual Total Returns — September 30, 20162
| | | | | | | | | | | | | | | | | | | | |
| | | | | |
| | | | | | | | | | | | Expense Ratios3 | |
| | | 1 year | | | 5 years | | | 10 years | | | Gross | | | Net | |
| | | | | | |
| Institutional Class (Inception 1/17/95) | | | 9.72 | % | | | 6.71 | % | | | 7.08 | % | | | 0.57 | % | | | 0.57 | % |
| | | | | | |
| Comparative Performance | | | | | | | | | | | | | | | | | | | | |
| Bloomberg Barclays U.S. Government/Credit Bond Index1 | | | 5.86 | | | | 3.24 | | | | 4.86 | | | | | | | | | |
Performance data shown represents past performance and is no guarantee of, and not necessarily indicative of, future results. Total return and value will vary, and you may have a gain or loss when shares are sold. Current performance may be lower or higher than quoted. For most recent month-end performance, visit loomissayles.com. Performance for other share classes will be greater or less than shown based on differences in fees and sales charges. You may not invest directly in an index. Performance for periods less than one year is cumulative, not annualized. Returns reflect changes in share price and reinvestment of dividends and capital gains, if any. The table(s) do not reflect taxes shareholders might owe on any fund distributions or when they redeem their shares.
| 1 | | Bloomberg Barclays U.S. Government/Credit Bond Index is an unmanaged index that includes U.S. Treasuries, government-related issues, and investment-grade U.S. corporate securities. |
| 2 | | Fund performance has been increased by fee waivers and/or expense reimbursements, if any, without which performance would have been lower. |
| 3 | | As of the most recent prospectus, the investment advisor has contractually agreed to waive fees and/or reimburse expenses (with certain exceptions) once the expense cap of the Fund has been exceeded. This arrangement is set to expire on 1/31/17. When an expense cap has not been exceeded, the Fund may have similar expense ratios. |
3 |
LOOMIS SAYLES GLOBAL BOND FUND
| | | | |
| Managers | | Symbols | | |
| Kenneth M. Buntrock, CFA®, CIC | | Institutional Class | | LSGBX |
| David W. Rolley, CFA® | | Retail Class | | LSGLX |
| Lynda L. Schweitzer, CFA® | | Class N | | LSGNX |
| Scott M. Service, CFA® | | | | |
Investment Objective
The Fund’s investment objective is high total investment return through a combination of high current income and capital appreciation.
Market Conditions
Commodity prices and investor sentiment bottomed in February 2016, after falling since the middle of 2015. Central bank policy generally helped fuel a global fixed-income and credit market rally from there, subject only to temporary bouts of volatility. After widening briefly after the late-June Brexit vote in the U.K., credit spreads (the difference in yield between non-Treasury and Treasury securities of similar maturity) tightened through the rest of the summer. As investors sought higher-yielding assets, credit generally outperformed government bonds, and high yield bonds outperformed their investment-grade counterparts. The Bank of England’s (BoE’s) announcement that it was expanding its quantitative easing (QE) program to include corporate bond purchases beginning in September provided additional support to credit markets.
Major central banks remained accommodative, which supported market sentiment. The BoE, European Central Bank (ECB) and Bank of Japan (BoJ) announced continued QE. The Federal Reserve (the Fed) cautiously looked for another opportunity to hike rates after a 25 basis point move in December 2015, all while maintaining support for the U.S. market.
Government bond yields ended the period lower due to central bank policies and muted inflation outlooks. A flight to quality in early 2016 sent yields lower, and another bout of risk aversion emerged in the weeks surrounding the Brexit referendum. Major government benchmark yields bottomed in July – August 2016 and traded higher or flat through the end of September.
The U.S. dollar bull market that persisted in 2014 and 2015 subsided over the reporting period. Certain idiosyncratic events put pressure on the British pound and the euro during the second half of the period. Meanwhile, the Japanese yen was a beneficiary of periodic risk aversion and global yield convergence and was among the stronger currencies versus the U.S. dollar. The yen also strengthened on mounting evidence that the BoJ may be increasingly limited in its ability to expand monetary policy further.
Performance Results
For the 12 months ended September 30, 2016, Institutional Class shares of Loomis Sayles Global Bond Fund returned 9.80%. The fund outperformed its benchmark, the Bloomberg Barclays Global Aggregate Bond Index, which returned 8.83%.
Explanation of Fund Performance
An overweight position in corporate credit drove the fund’s positive relative performance for the period. We used market weakness in late 2015 and early 2016 to selectively add to beaten-down yet reasonably sound credits. This strategy helped provide an additional boost to returns when market sentiment improved in February 2016, leading to solid outperformance from corporate bonds compared with government issues.
Within the corporate credit sector, holdings from the energy, communications, capital goods and consumer sectors performed well. Our credit exposure included modest positions in high yield issuers that posted strong relative returns versus their higher-quality peers. In addition, select hard currency quasi-government issues from emerging markets, particularly in Latin America, rebounded during the second half of the period to add value. Meanwhile, our exposure to the banking sector aided performance. Global banks have been forced to navigate a challenging business environment stemming from low interest rates, regulatory and Brexit uncertainty and an upcoming referendum in Italy. For the most part, we believe these are factors for equity investors to consider, because weak growth and soft earnings in the near term are not expected to reverse past improvements in capitalization and liquidity at the largest and strongest banks we favor. Our banking sector performance benefited from issuer and capital structure selection, including among recovering U.K. banks.
U.S. dollar appreciation relative to foreign currencies challenged some of the fund’s non-U.S.-dollar-denominated holdings during the period. During the period the Fund’s distributions were reduced to reflect the realization of currency losses from certain bond sales and maturities. An underweight allocation to the Japanese yen weighed on fund performance, as the yen appreciated versus the U.S. dollar for most of the year. The yen was the strongest developed market currency by a wide margin, but overall we found little value in Japanese yields and maintained an underweight to the local bond market. An overweight position in the Mexican peso also hindered relative performance. Despite the currency’s attractive valuation and the recovery in oil prices, geopolitical and trade balance concerns persisted. Elsewhere, modest positions in car loans and other asset-backed securities weighed on results, as these positions did not keep pace with longer duration (greater price sensitivity to interest rate changes) securities or higher-risk segments of the market.
Outlook
We expect central banks in the Eurozone, England and Japan to continue their expansionary monetary policies to spur growth, even though the benefits may be waning. Fiscal policy responses may be the next step. We believe the U.S. economy remains on sure footing, and we expect the Fed to raise rates in December 2016. The Fed is likely to take a moderate approach to rate hikes heading into 2017, as growth and inflation forecasts remain benign.
| 4
LOOMIS SAYLES GLOBAL BOND FUND
Since early 2015, monthly or quarterly ordinary income distributions for certain Loomis Sayles-managed fixed-income funds have been below historic averages. This is primarily due to the impact of foreign currency losses. Fund officers have analyzed the fund’s current portfolio of investments, schedule of maturities and the corresponding amounts of unrealized currency losses that may become realized in the fiscal year ending on September 30, 2017. Based on this analysis, fund officers believe that realized currency losses may have a less significant impact on this fund’s distributions in the 2017 fiscal year. As a result, the distribution amount may improve going forward. This analysis is based on certain assumptions, including but not limited to the level of foreign currency exchange rates, security prices, interest rates and the net asset level of the fund. Changes to these assumptions could impact the analysis and the amounts of future fund distributions.
The U.S. presidential election in November may add to global uncertainty and trigger volatility heading into year-end. Europe is also facing challenges, with the migrant crisis fraying EU cohesion and the risk of political instability and EU referendum contagion spreading across the Eurozone. The upcoming Italy reform referendum could lead to risk aversion and broad selloffs in peripheral government debt and bank corporate bonds.
As investors search for yield in an extremely low-yielding environment, we believe corporate bonds – including lower-quality bonds – can continue to attract significant inflows.
OPEC has indicated it may cut oil production at its November meeting, which may cause oil prices to appreciate modestly. However, we believe there is a ceiling to oil price appreciation, because rising prices may attract additional production to the market. Ultimately, we anticipate prices will remain fairly range bound at approximately $45 to $50 per barrel into 2017.
Hypothetical Growth of $100,000 Investment in Institutional Class Shares
September 30, 2006 through September 30, 20162

Average Annual Total Returns — September 30, 20162
| | | | | | | | | | | | | | | | | | | | | | | | |
| | | | | | |
| | | | | | | | | | | | Life of
Class N | | | Expense Ratios3 | |
| | | 1 year | | | 5 years | | | 10 years | | | | Gross | | | Net | |
| Institutional Class (Inception 5/10/91) | | | 9.80 | % | | | 2.49 | % | | | 4.52 | % | | | — | % | | | 0.78 | % | | | 0.75 | % |
| | | | | | | |
| Retail Class (Inception 12/31/96) | | | 9.51 | | | | 2.24 | | | | 4.23 | | | | — | | | | 1.03 | | | | 1.00 | |
| | | | | | | |
| Class N (Inception 2/1/13) | | | 9.93 | | | | — | | | | — | | | | 1.04 | | | | 0.63 | | | | 0.63 | |
| | | | | | | |
| Comparative Performance | | | | | | | | | | | | | | | | | | | | | | | | |
| Bloomberg Barclays Global Aggregate Bond Index1 | | | 8.83 | | | | 1.74 | | | | 4.26 | | | | 1.42 | | | | | | | | | |
Performance data shown represents past performance and is no guarantee of, and not necessarily indicative of, future results. Total return and value will vary, and you may have a gain or loss when shares are sold. Current performance may be lower or higher than quoted. For most recent month-end performance, visit loomissayles.com. Performance for other share classes will be greater or less than shown based on differences in fees and sales charges. You may not invest directly in an index. Performance for periods less than one year is cumulative, not annualized. Returns reflect changes in share price and reinvestment of dividends and capital gains, if any. The table(s) do not reflect taxes shareholders might owe on any fund distributions or when they redeem their shares.
| 1 | | Bloomberg Barclays Global Aggregate Bond Index is an unmanaged index that provides a broad-based measure of the global investment-grade fixed-rate debt markets. |
| 2 | | Fund performance has been increased by fee waivers and/or expense reimbursements, if any, without which performance would have been lower. |
| 3 | | As of the most recent prospectus, the investment advisor has contractually agreed to waive fees and/or reimburse expenses (with certain exceptions) once the expense cap of the Fund has been exceeded. This arrangement is set to expire on 1/31/17. When an expense cap has not been exceeded, the Fund may have similar expense ratios. |
5 |
LOOMIS SAYLES INFLATION PROTECTED SECURITIES FUND
| | | | |
| Managers | | Symbols | | |
| Elaine Kan, CFA® | | Institutional Class | | LSGSX |
| Kevin P. Kearns | | Retail Class | | LIPRX |
| Maura T. Murphy, CFA® | | | | |
Investment Objective
The Fund’s investment objective is high total investment return through a combination of current income and capital appreciation.
Market Conditions
Growth in headline inflation remained low, largely due to the continued strength of the U.S. dollar, which translated to lower import prices. Also, the energy component of the Consumer Price Index (CPI) continued to significantly drag down 12-month inflation.
In December 2015, the Federal Reserve (the Fed) raised interest rates for the first time since June 2006. This led to modest short-term losses within investment-grade markets and added to an already challenging environment for high yield. After oil prices bottomed in mid-February, capital returned to markets, and riskier assets rebounded strongly. Volatility spiked temporarily in June, following the UK referendum vote to leave the European Union (Brexit), but conditions were generally calm for the remainder of the period. Fixed-income markets ended September with gains for the 12-month period.
In early 2016, the Federal Reserve projected it would implement four rate hikes during the year. Yet, as of September 30, the Fed made no rate hikes, and financial markets anticipated only one 25 basis point hike before year-end. The Fed consistently lowered its economic projections throughout 2016, which removed some of the upward pressure on U.S. Treasury yields.
Performance Results
For the 12 months ended September 30, 2016, Institutional Class shares of Loomis Sayles Inflation Protected Securities Fund returned 6.00%. The fund underperformed its benchmark, the Bloomberg Barclays U.S. Treasury Inflation Protected Securities (TIPS) Index, which returned 6.58%.
Explanation of Fund Performance
We used swaptions (options on interest rate swaps) to neutralize the duration (price sensitivity to interest rate changes) effect from our longer-maturity TIPS positions, which detracted from performance. In addition, we used futures to manage the portfolio’s duration, which had a negative impact on relative performance.
Overall, breakeven inflation rates (the yield difference between nominal Treasuries and TIPS of the same maturity) advanced during the period, which benefited TIPS. The fund’s TIPS allocation was the largest contributor to absolute and relative performance. Specifically, within the TIPS allocation, our exposure to longer-dated securities contributed to performance on an absolute basis. Overall, the portfolio’s yield curve (a curve that shows the relationship among bond yields across the maturity spectrum) positioning within the sector aided results. A flattening yield curve and a slightly longer duration versus the benchmark had a positive effect on fund performance.
Outlook
We believe the U.S. economy will continue to grow in 2016. In particular, we expect low interest rates and energy prices, solid payroll growth, falling unemployment, rising home prices, improving mortgage delinquency rates and declining housing vacancy rates to support growth. Given this constructive view on the U.S. economy, we expect the U.S. dollar to remain relatively strong versus other currencies. However, we expect the pace of the dollar’s appreciation to slow. We also expect the Fed to gradually tighten monetary policy. Geopolitical risks and slowing global growth may counterbalance any positive U.S. economic developments, resulting in a flight-to-quality rally for U.S. Treasuries.
We believe inflation in the U.S. will gradually normalize in 2017. Factors such as wages, medical costs and housing are already beginning to rise. Relatively low energy prices have kept inflation tame, but recent upward moves in oil prices have started to change investor outlooks. Globally, we still expect deflation fears to persist due to broader growth challenges.
| 6
LOOMIS SAYLES INFLATION PROTECTED SECURITIES FUND
Hypothetical Growth of $100,000 Investment in Institutional Class Shares
September 30, 2006 through September 30, 20163
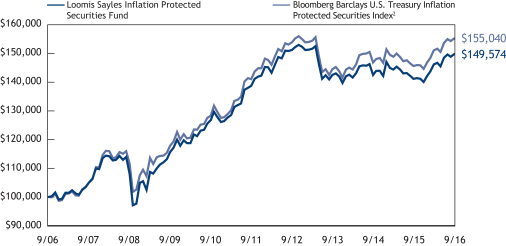
Average Annual Total Returns — September 30, 20163
| | | | | | | | | | | | | | | | | | | | |
| | | | | |
| | | | | | | | | | | | Expense Ratios4 | |
| | | 1 year | | | 5 years | | | 10 years | | | Gross | | | Net | |
| Institutional Class (Inception 5/20/91) | | | 6.00 | % | | | 1.54 | % | | | 4.11 | % | | | 0.80 | % | | | 0.40 | % |
| | | | | | |
| Retail Class (Inception 5/28/10)1 | | | 5.47 | | | | 1.23 | | | | 3.81 | | | | 1.03 | | | | 0.65 | |
| Comparative Performance | | | | | | | | | | | | | | | | | | | | |
| Bloomberg Barclays U.S. Treasury Inflation Protected Securities Index2 | | | 6.58 | | | | 1.93 | | | | 4.48 | | | | | | | | | |
Performance data shown represents past performance and is no guarantee of, and not necessarily indicative of, future results. Total return and value will vary, and you may have a gain or loss when shares are sold. Current performance may be lower or higher than quoted. For most recent month-end performance, visit loomissayles.com. Performance for other share classes will be greater or less than shown based on differences in fees and sales charges. You may not invest directly in an index. Performance for periods less than one year is cumulative, not annualized. Returns reflect changes in share price and reinvestment of dividends and capital gains, if any. The table(s) do not reflect taxes shareholders might owe on any fund distributions or when they redeem their shares.
| 1 | | Prior to inception of Retail Class (5/28/10), performance is that of Institutional Class, restated to reflect the higher net expenses of Retail Class. |
| 2 | | Bloomberg Barclays U.S. Treasury Inflation Protected Securities Index is an unmanaged index that tracks inflation protected securities issued by the U.S. Treasury. |
| 3 | | Fund performance has been increased by fee waivers and/or expense reimbursements, if any, without which performance would have been lower. |
| 4 | | As of the most recent prospectus, the investment advisor has contractually agreed to waive fees and/or reimburse expenses (with certain exceptions) once the expense cap of the Fund has been exceeded. This arrangement is set to expire on 1/31/17. When an expense cap has not been exceeded, the Fund may have similar expense ratios. |
7 |
LOOMIS SAYLES INSTITUTIONAL HIGH INCOME FUND
| | | | |
| Managers | | Symbol | | |
| Matthew J. Eagan, CFA® | | Institutional Class | | LSHIX |
| Daniel J. Fuss, CFA®, CIC | | | | |
| Elaine M. Stokes | | | | |
Investment Objective
The Fund’s investment objective is high total investment return through a combination of current income and capital appreciation.
Market Conditions
In the beginning of the period, the Federal Reserve (Fed) raised interest rates for the first time since June 2006. This led to modest losses within investment-grade markets and added to an already challenging environment for high yield. After oil prices bottomed in mid-February, capital returned to markets and riskier assets rebounded strongly. Volatility spiked temporarily in June following the U.K. referendum vote to leave the European Union (EU), but conditions were generally calm for the remainder of the period. Fixed-income markets finished the period on a positive note and added to full-year gains.
After declining through mid-February, U.S. high yield became a sought-after asset. The sector rewarded investors by producing strong and steady gains with minimal volatility. Spreads (the difference in yield between non-Treasury and Treasury securities of similar maturity) are trading inside the long-term average, but remain above the lows of 2014. Lower-quality credits and cyclical sectors outperformed during the period as the search for yield presses onward.
Investment-grade corporate bonds also performed well during the one-year period, bouncing back from the lows experienced during the fourth quarter of 2015. The sector’s longer duration (price sensitivity to interest rate changes) was a positive tailwind as longer-maturity yields declined. Overall returns were positive across all sectors, with cyclical sectors and energy performing well during the second half of the period.
For roughly the first half of the period, the U.S. dollar continued to strengthen against most major global currencies. But the Fed struck a more dovish tone early in 2016, and this contributed to a pause in the dollar bull market. A more stable dollar supported currencies – particularly those in the emerging markets – that suffered during the dollar’s ascent. The recovery in oil prices also helped ease the strain on commodity-related currencies.
Performance Results
For the 12 months ended September 30, 2016, Institutional Class shares of Loomis Sayles Institutional High Income Fund returned 12.53%. The fund underperformed its benchmark, the Bloomberg Barclays U.S. Corporate High-Yield Bond Index, which returned 12.73%.
Explanation of Fund Performance
Industrial securities in the high yield and investment-grade corporate sectors were top contributors to the fund’s relative return, largely due to security selection among energy holdings. High yield utilities and financials also aided relative return. Elsewhere, out-of-benchmark positions in common stocks and convertibles contributed to the fund’s performance. Common stocks benefited from positioning in the technology sector, while technology and communication names in the convertible space aided performance. In addition, Yankee (U.S.-dollar-denominated bonds issued by a non-U.S. entity) government-related securities lifted results.
Out-of-benchmark exposure to non-U.S.-dollar-denominated holdings weighed on relative performance. In particular, securities denominated in the Mexican peso detracted, as the peso hit an all-time low versus the U.S. dollar in mid-September. U.S. dollar appreciation relative to foreign currencies challenged some of the fund’s non-USD holdings during the period. During the period the amount of income available to be distributed by the fund was reduced to reflect the realization of currency losses from certain bond sales and maturities. In addition, a selected communication name in the fund’s convertible allocation posted positive absolute performance but weighed on relative results. Our allocation to U.S. Treasuries also detracted from performance. We continued to hold short-maturity Treasuries for cash reserve purposes.
Outlook
Our outlook for the U.S. and global economies remains positive, with expectations for better growth momentum through the end of the year. In the U.S., we expect steady gains in employment, increased bank lending and stronger consumer confidence to support GDP growth. The global economy is facing more headwinds but should experience modestly stronger growth next year, led by a healthier U.S. economy and still-accommodative global central bank policies.
Inflation expectations remain low. However, U.S. inflation is showing signs of acceleration and recent economic data have been favorable. We think the Fed is likely to raise rates in December if market conditions remain stable.
Oil prices are likely to be range-bound over the short term as elevated supply should be countered by OPEC’s expected production cut in November. We remain constructive on intermediate- to longer-term oil prices and expect that supply and demand will adjust.
| 8
LOOMIS SAYLES INSTITUTIONAL HIGH INCOME FUND
We expect low global yields to continue supporting flows into U.S. credit, but at a more modest pace. In this environment, we intend to maintain a yield cushion in our portfolios through exposure to corporate bonds. Credit fundamentals have been stable, reflecting a slowly improving U.S. economy. However, downside risks – including slowing profit growth, rising leverage and free cash flow approaching peak levels – are increasing as we move further into the late stage of the credit cycle.1 Despite these risks, we believe the current phase of the credit cycle can continue for some time, and we do not expect a significant increase in corporate defaults in 2017.
Within credit, we favor the investment-grade financials, technology and energy sectors. We are also biased to higher-quality high yield. Convertible bonds continue to look attractive, and our focus has shifted from equity-sensitive convertibles to more balanced and credit-sensitive issues. We believe these securities offer yield and upside potential with more limited downside risk.
The Fed’s slow and cautious approach has helped keep the U.S. dollar range-bound against major currencies. Over the long term, improving global growth and further stability in commodities could support non-U.S.-dollar-denominated bonds. We are beginning to see more divergence in emerging market country fundamentals and political backdrops, which could expand potential relative value opportunities. We intend to maintain our current positions, which we believe represent long-term value, but are cautious on further exposure until we get better clarity on some of these evolving macro trends.
Risks include growing geopolitical risks, a prolonged period of low economic growth, declining corporate profit expectations and a shift to downturn in the U.S. credit cycle. Looking ahead, we remain focused on careful security selection using fundamental credit analysis. We intend to build on our key investment themes of yield and diversification, using our reserve allocation during periods of extreme short-term market dislocation to potentially add long-term value.
Since early 2015, ordinary income distributions for certain Loomis Sayles-managed fixed-income funds have been reduced, primarily due to the impact of foreign currency losses. Fund officers have analyzed the fund’s current portfolio of investments, schedule of maturities and the corresponding amounts of unrealized currency losses that may become realized in the fiscal year ending on September 30, 2017. Based on this analysis, fund officers believe that realized currency losses may have a less significant impact on this fund’s distributions in the 2017 fiscal year. As a result, the distribution amount may improve going forward. This analysis is based on certain assumptions, including but not limited to the level of foreign currency exchange rates, security prices, interest rates and the net asset level of the fund. Changes to these assumptions could impact the analysis and the amounts of future fund distributions.
| 1 | | A credit cycle is a cyclical pattern that follows credit availability and corporate health. |
Hypothetical Growth of $3,000,000 Investment in Institutional Class Shares
September 30, 2006 through September 30, 20162

9 |
Average Annual Total Returns — September 30, 20162
| | | | | | | | | | | | | | | | | | | | |
| | | | | |
| | | | | | | | | | | | Expense Ratios3 | |
| | | 1 year | | | 5 years | | | 10 years | | | Gross | | | Net | |
| | | | | | |
| Institutional Class (Inception 6/5/96) | | | 12.53 | % | | | 9.14 | % | | | 7.87 | % | | | 0.68 | % | | | 0.68 | % |
| | | | | | |
| Comparative Performance | | | | | | | | | | | | | | | | | | | | |
| Bloomberg Barclays U.S. Corporate High-Yield Bond Index1 | | | 12.73 | | | | 8.34 | | | | 7.71 | | | | | | | | | |
Performance data shown represents past performance and is no guarantee of, and not necessarily indicative of, future results. Total return and value will vary, and you may have a gain or loss when shares are sold. Current performance may be lower or higher than quoted. For most recent month-end performance, visit loomissayles.com. Performance for other share classes will be greater or less than shown based on differences in fees and sales charges. You may not invest directly in an index. Performance for periods less than one year is cumulative, not annualized. Returns reflect changes in share price and reinvestment of dividends and capital gains, if any. The table(s) do not reflect taxes shareholders might owe on any fund distributions or when they redeem their shares.
| 1 | | Bloomberg Barclays U.S. Corporate High-Yield Bond Index is an unmanaged index that covers the U.S.-dollar denominated, non-investment grade, fixed-rate, taxable corporate bond market. |
| 2 | | Fund performance has been increased by fee waivers and/or expense reimbursements, if any, without which performance would have been lower. |
| 3 | | As of the most recent prospectus, the investment advisor has contractually agreed to waive fees and/or reimburse expenses (with certain exceptions) once the expense cap of the Fund has been exceeded. This arrangement is set to expire on 1/31/17. When an expense cap has not been exceeded, the Fund may have similar expense ratios. |
| 10
LOOMIS SAYLES INVESTMENT GRADE FIXED INCOME FUND
| | | | |
| Managers | | Symbols | | |
| Matthew J. Eagan, CFA® | | Institutional Class | | LSIGX |
| Daniel J. Fuss, CFA®, CIC | | | | |
| Brian P. Kennedy | | | | |
| Elaine M. Stokes | | | | |
Investment Objective
The Fund’s investment objective is above-average total investment return through a combination of current income and capital appreciation.
Market Conditions
In the beginning of the period, the Federal Reserve (Fed) raised interest rates for the first time since June 2006. This led to modest losses within investment-grade markets and added to an already challenging environment for high yield. After oil prices bottomed in mid-February, capital returned to markets and riskier assets rebounded strongly. Volatility spiked temporarily in June following the U.K. referendum vote to leave the European Union (EU), but conditions were generally calm for the remainder of the period. Fixed-income markets finished the period on a positive note and added to full-year gains.
After declining through mid-February, U.S. high yield became a sought-after asset. The sector rewarded investors by producing strong and steady gains with minimal volatility. Spreads (the difference in yield between non-Treasury and Treasury securities of similar maturity) are trading inside the long-term average, but remain above the lows of 2014. Lower-quality credits and cyclical sectors outperformed during the period as the search for yield presses onward.
Investment-grade corporate bonds also performed well during the one-year period, bouncing back from the lows experienced during the fourth quarter of 2015. The sector’s longer duration (price sensitivity to interest rate changes) was a positive tailwind as longer-maturity yields declined. Overall returns were positive across all sectors, with cyclical sectors and energy performing well during the second half of the period.
For roughly the first half of the period, the U.S. dollar continued to strengthen against most major global currencies. But the Fed struck a more dovish tone early in 2016, and this contributed to a pause in the dollar bull market. A more stable dollar supported currencies – particularly those in the emerging markets – that suffered during the dollar’s ascent. The recovery in oil prices also helped ease the strain on commodity-related currencies.
Performance Results
For the 12 months ended September 30, 2016, the Loomis Sayles Investment Grade Fixed Income Fund returned 8.27%. The fund outperformed its benchmark, the Bloomberg Barclays U.S. Government/Credit Bond Index, which returned 5.86%.
Explanation of Fund Performance
The fund’s outperformance was primarily due to out-of-benchmark allocations. In particular, convertible and equity holdings generated positive absolute and relative returns, driven by name-specific exposure in the technology sector. In addition, exposure to high yield industrials and financials helped buoy performance. Within the high yield industrials allocation, securities in the metals and mining and energy industries were among the largest contributors, appreciating in value along with commodity prices. Selected high yield finance companies also benefited results. The financial and industrial sectors were also top contributors in the investment-grade corporate allocation, as banking, energy, automotive and communications issues bolstered relative return.
The fund’s shorter-than-benchmark duration weighed on results as rates declined during the period. Overall, non-U.S.-dollar-denominated securities detracted from performance, as uneven economic outlooks and divergent monetary policies across the globe pressured most developed and emerging market currencies versus the U.S. dollar. In particular, fund holdings denominated in the Mexican peso lagged. In the wake of the U.K. Brexit vote in late June, growth expectations slowed in the U.K. and Europe, causing holdings denominated in the British pound and euro to depreciate in value and detract from performance. Our positioning in Canadian-dollar-denominated securities also weighed on results. During the period the Fund’s distributions were reduced to reflect the realization of currency losses from certain bond sales and maturities.
Outlook
Our outlook for the U.S. and global economies remains positive, with expectations for better growth momentum through the end of the year. In the U.S., we expect steady gains in employment, increased bank lending and stronger consumer confidence to support GDP growth. The global economy is facing more headwinds but should experience modestly stronger growth next year, led by a healthier U.S. economy and still-accommodative global central bank policies.
Inflation expectations remain low. However, U.S. inflation is showing signs of acceleration and recent economic data have been favorable. We think the Fed is likely to raise rates in December if market conditions remain stable.
Oil prices are likely to be range-bound over the short term as elevated supply should be countered by OPEC’s expected production cut in November. We remain constructive on intermediate- to longer-term oil prices and expect that supply and demand will adjust.
We expect low global yields to continue supporting flows into U.S. credit, but at a more modest pace. In this environment, we intend to maintain a yield cushion in our portfolios through exposure to corporate bonds. Credit fundamentals have been stable, reflecting a slowly improving U.S. economy. However, downside risks – including slowing profit growth, rising leverage and free cash flow approaching peak levels – are increasing as we move further into the late stage of the credit cycle.1 Despite these risks, we believe the current phase of the credit cycle can continue for some time, and we do not expect a significant increase in corporate defaults in 2017.
11 |
Within credit, we favor the investment-grade financials, technology and energy sectors. We are also biased to higher-quality high yield. Convertible bonds continue to look attractive, and our focus has shifted from equity-sensitive convertibles to more balanced and credit-sensitive issues. We believe these securities offer yield and upside potential with more limited downside risk.
The Fed’s slow and cautious approach has helped keep the U.S. dollar range-bound against major currencies. Over the long term, improving global growth and further stability in commodities could support non-U.S.-dollar-denominated bonds. We are beginning to see more divergence in emerging market country fundamentals and political backdrops, which could expand potential relative value opportunities. We intend to maintain our current positions, which we believe represent long-term value, but are cautious on further exposure until we get better clarity on some of these evolving macro trends.
Risks include growing geopolitical risks, a prolonged period of low economic growth, declining corporate profit expectations and a shift to downturn in the U.S. credit cycle. Looking ahead, we remain focused on careful security selection using fundamental credit analysis. We intend to build on our key investment themes of yield and diversification, using our reserve allocation during periods of extreme short-term market dislocation to potentially add long-term value.
Since early 2015, monthly or quarterly ordinary income distributions for certain Loomis Sayles-managed fixed-income funds have been below historic averages. This is primarily due to the impact of foreign currency losses. Fund officers have analyzed the fund’s current portfolio of investments, schedule of maturities and the corresponding amounts of unrealized currency losses that may become realized in the fiscal year ending on September 30, 2017. Based on this analysis, fund officers believe that realized currency losses may have a less significant impact on this fund’s distributions in the 2017 fiscal year. As a result, the distribution amount may improve going forward. This analysis is based on certain assumptions, including but not limited to the level of foreign currency exchange rates, security prices, interest rates and the net asset level of the fund. Changes to these assumptions could impact the analysis and the amounts of future fund distributions.
| 1 | | A credit cycle is a cyclical pattern that follows credit availability and corporate health. |
Hypothetical Growth of $3,000,000 Investment in Institutional Class Shares
September 30, 2016 through September 30, 20162
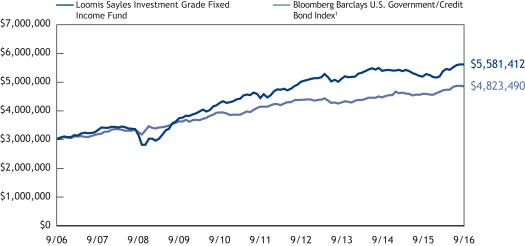
Average Annual Total Returns — September 30, 20162
| | | | | | | | | | | | | | | | | | | | |
| | | | | |
| | | | | | | | | | | | Expense Ratios3 | |
| | | 1 year | | | 5 years | | | 10 years | | | Gross | | | Net | |
| | | | | | |
| Institutional Class (Inception 7/1/94) | | | 8.27 | % | | | 4.81 | % | | | 6.41 | % | | | 0.48 | % | | | 0.48 | % |
| | | | | | |
| Comparative Performance | | | | | | | | | | | | | | | | | | | | |
| Bloomberg Barclays U.S. Government/Credit Bond Index1 | | | 5.86 | | | | 3.24 | | | | 4.86 | | | | | | | | | |
Performance data shown represents past performance and is no guarantee of, and not necessarily indicative of, future results. Total return and value will vary, and you may have a gain or loss when shares are sold. Current performance may be lower or higher than quoted. For most recent month-end performance, visit loomissayles.com. Performance for other share classes will be greater or less than shown based on differences in fees and sales charges. You may not invest directly in an index. Performance for periods less than one year is cumulative, not annualized. Returns reflect changes in share price and reinvestment of dividends and capital gains, if any. The table(s) do not reflect taxes shareholders might owe on any fund distributions or when they redeem their shares.
| 1 | | Bloomberg Barclays U.S. Government/Credit Bond Index is an unmanaged index that includes U.S. Treasuries, government-related issues, and investment grade U.S. corporate securities. |
| 2 | | Fund performance has been increased by fee waivers and/or expense reimbursements, if any, without which performance would have been lower. |
| 3 | | As of the most recent prospectus, the investment advisor has contractually agreed to waive fees and/or reimburse expenses (with certain exceptions) once the expense cap of the Fund has been exceeded. This arrangement is set to expire on 1/31/17. When an expense cap has not been exceeded, the Fund may have similar expense ratios. |
1637689.1.1
| 12
ADDITIONAL INFORMATION
The views expressed in this report reflect those of the portfolio managers as of the dates indicated. The managers’ views are subject to change at any time without notice based on changes in market or other conditions. References to specific securities or industries should not be regarded as investment advice. Because the Funds are actively managed, there is no assurance that they will continue to invest in the securities or industries mentioned.
All investing involves risk, including the risk of loss. There is no assurance that any investment will meet its performance objectives or that losses will be avoided.
Additional Index Information
This document may contain references to third party copyrights, indexes, and trademarks, each of which is the property of its respective owner. Such owner is not affiliated with Natixis Global Asset Management or any of its related or affiliated companies (collectively “NGAM”) and does not sponsor, endorse or participate in the provision of any NGAM services, funds or other financial products.
The index information contained herein is derived from third parties and is provided on an “as is” basis. The user of this information assumes the entire risk of use of this information. Each of the third party entities involved in compiling, computing or creating index information disclaims all warranties (including, without limitation, any warranties of originality, accuracy, completeness, timeliness, non-infringement, merchantability and fitness for a particular purpose) with respect to such information.
Proxy Voting Information
A description of the funds’ proxy voting policies and procedures is available without charge, upon request, by calling Loomis Sayles at 800-633-3330; on the Funds’ website at www.loomissayles.com, and on the Securities and Exchange Commission’s (“SEC’s”) website at www.sec.gov. Information about how the Funds voted proxies relating to portfolio securities during the most recent 12-month period ended June 30 is available on the Funds’ website and the SEC’s website.
Quarterly Portfolio Schedules
The Funds file a complete schedule of portfolio holdings with the SEC for the first and third quarters of each fiscal year on Form N-Q. The Funds’ Forms N-Q are available on the SEC’s website at www.sec.gov and may be reviewed and copied at the SEC’s Public Reference Room in Washington, DC. Information on the operation of the Public Reference Room may be obtained by calling 800-SEC-0330.
UNDERSTANDING YOUR FUND’S EXPENSES
As a mutual fund shareholder you incur two types of costs: (1) transaction costs, and (2) ongoing costs, including management fees, distribution fees (12b-1 fees), and other fund expenses. Certain exemptions may apply. These costs are described in more detail in each Fund’s prospectus. The following examples are intended to help you understand the ongoing costs of investing in the Funds and help you compare these with the ongoing costs of investing in other mutual funds.
The first line in the table for each class of Fund shares shows the actual amount of Fund expenses you would have paid on a $1,000 investment in the Fund from April 1, 2016 through September 30, 2016. To estimate the expenses you paid over the period, simply divide your account value by $1,000 (for example $8,600 account value divided by $1,000 = 8.60) and multiply the result by the number in the Expenses Paid During Period column as shown below for your class.
The second line in the table for each class of Fund shares provides information about hypothetical account values and hypothetical expenses based on the Fund’s actual expense ratios and an assumed rate of return of 5% per year before expenses, which is not the Fund’s actual return. The hypothetical account values and expenses may not be used to estimate the actual ending account balance or expenses you paid on your investment for the period. You may use this information to compare the ongoing costs of investing in the Fund to other funds. To do so, compare this 5% hypothetical example with the 5% hypothetical examples that appear in the shareholder reports of the other funds.
Please note that the expenses shown reflect ongoing costs only, and do not include any transaction costs. Therefore, the second line in the table is useful in comparing ongoing costs only, and will not help you determine the relative costs of owning different funds. If transaction costs were included, total costs would be higher.
Loomis Sayles Fixed Income Fund
| | | | | | | | | | | | |
Institutional Class | | Beginning
Account Value
4/1/2016 | | | Ending
Account Value
9/30/2016 | | | Expenses Paid
During Period*
4/1/2016 – 9/30/2016 | |
Actual | | | $1,000.00 | | | | $1,073.00 | | | | $2.95 | |
Hypothetical (5% return before expenses) | | | $1,000.00 | | | | $1,022.15 | | | | $2.88 | |
* Expenses are equal to the Fund’s annualized expense ratio of 0.57%, multiplied by the average account value over the period, multiplied by the number of days in the most recent fiscal half-year (183), divided by 366 (to reflect the half-year period). | |
13 |
Loomis Sayles Global Bond Fund
| | | | | | | | | | | | |
Institutional Class | | Beginning
Account Value
4/1/2016 | | | Ending
Account Value
9/30/2016 | | | Expenses Paid
During Period*
4/1/2016 – 9/30/2016 | |
Actual | | | $1,000.00 | | | | $1,053.70 | | | | $3.85 | |
Hypothetical (5% return before expenses) | | | $1,000.00 | | | | $1,021.25 | | | | $3.79 | |
| | | |
Retail Class | | | | | | | | | |
Actual | | | $1,000.00 | | | | $1,052.50 | | | | $5.13 | |
Hypothetical (5% return before expenses) | | | $1,000.00 | | | | $1,020.00 | | | | $5.05 | |
| | | |
Class N | | | | | | | | | |
Actual | | | $1,000.00 | | | | $1,054.30 | | | | $3.44 | |
Hypothetical (5% return before expenses) | | | $1,000.00 | | | | $1,021.65 | | | | $3.39 | |
* Expenses are equal to the Fund’s annualized expense ratio (after waiver/reimbursement): 0.75%, 1.00% and 0.67% for Institutional Class, Retail Class and Class N, respectively, multiplied by the average account value over the period, multiplied by the number of days in the most recent fiscal half-year (183), divided by 366 (to reflect the half-year period). | |
Loomis Sayles Inflation Protected Securities Fund
| | | | | | | | | | | | |
Institutional Class | | Beginning
Account Value
4/1/2016 | | | Ending
Account Value
9/30/2016 | | | Expenses Paid
During Period*
4/1/2016 – 9/30/2016 | |
Actual | | | $1,000.00 | | | | $1,024.00 | | | | $2.02 | |
Hypothetical (5% return before expenses) | | | $1,000.00 | | | | $1,023.00 | | | | $2.02 | |
| | | |
Retail Class | | | | | | | | | |
Actual | | | $1,000.00 | | | | $1,021.30 | | | | $3.28 | |
Hypothetical (5% return before expenses) | | | $1,000.00 | | | | $1,021.75 | | | | $3.29 | |
* Expenses are equal to the Fund’s annualized expense ratio (after waiver/reimbursement): 0.40% and 0.65% for Institutional and Retail Class, respectively, multiplied by the average account value over the period, multiplied by the number of days in the most recent fiscal half-year (183), divided by 366 (to reflect the half-year period). | |
Loomis Sayles Institutional High Income Fund
| | | | | | | | | | | | |
Institutional Class | | Beginning
Account Value
4/1/2016 | | | Ending
Account Value
9/30/2016 | | | Expenses Paid
During Period*
4/1/2016 – 9/30/2016 | |
Actual | | | $1,000.00 | | | | $1,135.00 | | | | $3.63 | |
Hypothetical (5% return before expenses) | | | $1,000.00 | | | | $1,021.60 | | | | $3.44 | |
* Expenses are equal to the Fund’s annualized expense ratio of 0.68%, multiplied by the average account value over the period, multiplied by the number of days in the most recent fiscal half-year (183), divided by 366 (to reflect the half-year period). | |
Loomis Sayles Investment Grade Fixed Income Fund
| | | | | | | | | | | | |
Institutional Class | | Beginning
Account Value
4/1/2016 | | | Ending
Account Value
9/30/2016 | | | Expenses Paid
During Period*
4/1/2016 – 9/30/2016 | |
Actual | | | $1,000.00 | | | | $1,043.30 | | | | $2.45 | |
Hypothetical (5% return before expenses) | | | $1,000.00 | | | | $1,022.60 | | | | $2.43 | |
* Expenses are equal to the Fund’s annualized expense ratio of 0.48%, multiplied by the average account value over the period, multiplied by the number of days in the most recent fiscal half-year (183), divided by 366 (to reflect the half-year period). | |
| 14
BOARD APPROVAL OF THE EXISTING ADVISORY AGREEMENTS
The Board of Trustees of the Trust (the “Board”), including the Independent Trustees, considers matters bearing on each Fund’s advisory agreement (collectively, the “Agreements”) at most of its meetings throughout the year. Each year, usually in the spring, the Contract Review Committee of the Board meets to review the Agreements to determine whether to recommend that the full Board approve the continuation of the Agreements, typically for an additional one-year period. After the Committee has made its recommendation, the full Board, including the Independent Trustees, determines whether to approve the continuation of the Agreements.
In connection with these meetings, the Trustees receive materials that the Funds’ investment adviser (the “Adviser”) believes to be reasonably necessary for the Trustees to evaluate the Agreements. These materials generally include, among other items, (i) information on the investment performance of the Funds and the performance of peer groups of funds and the Funds’ performance benchmarks, (ii) information on the Funds’ advisory fees and other expenses, including information comparing the Funds’ expenses to the fees charged to institutional accounts with similar strategies managed by the Adviser, if any, and to those of peer groups of funds and information about any applicable expense caps and/or fee “breakpoints,” (iii) sales and redemption data in respect of the Funds, (iv) information about the profitability of the Agreements to the Adviser and (v) information obtained through the completion by the Adviser of a questionnaire distributed on behalf of the Trustees. The Board, including the Independent Trustees, also considers other matters such as (i) the Adviser’s financial results and financial condition, (ii) each Fund’s investment objective and strategies and the size, education and experience of the Adviser’s investment staff and its use of technology, external research and trading cost measurement tools, (iii) arrangements in respect of the distribution of the Funds’ shares and the related costs, (iv) the procedures employed to determine the value of the Funds’ assets, (v) the allocation of the Funds’ brokerage, if any, including, if applicable, allocations to brokers affiliated with the Adviser and the use of “soft” commission dollars to pay Fund expenses and to pay for research and other similar services, (vi) the resources devoted to, and the record of compliance with, the Funds’ investment policies and restrictions, policies on personal securities transactions and other compliance policies, (vii) information about amounts invested by the Funds’ portfolio managers in the Funds or in similar accounts that they manage and (viii) the general economic outlook with particular emphasis on the mutual fund industry. Throughout the process, the Trustees are afforded the opportunity to ask questions of and request additional materials from the Adviser.
In addition to the materials requested by the Trustees in connection with their annual consideration of the continuation of the Agreements, the Trustees receive materials in advance of each regular quarterly meeting of the Board that provide detailed information about the Funds’ investment performance and the fees charged to the Funds for advisory and other services. This information generally includes, among other things, an internal performance rating for each Fund based on agreed-upon criteria, graphs showing each Fund’s performance and fee differentials against each Fund’s peer group/category of funds, performance ratings provided by a third-party, total return information for various periods, and third-party performance rankings for various periods comparing a Fund against similarly categorized funds. The portfolio management team for each Fund or other representatives of the Adviser make periodic presentations to the Contract Review Committee and/or the full Board, and Funds identified as presenting possible performance concerns may be subject to more frequent board presentations and reviews. In addition, each quarter the Trustees are provided with detailed statistical information about each Fund’s portfolio. The Trustees also receive periodic updates between meetings.
The Board most recently approved the continuation of the Agreements at its meeting held in June 2016. The Agreements were continued for a one-year period for the Funds. In considering whether to approve the continuation of the Agreements, the Board, including the Independent Trustees, did not identify any single factor as determinative. Individual Trustees may have evaluated the information presented differently from one another, giving different weights to various factors. Matters considered by the Trustees, including the Independent Trustees, in connection with their approval of the Agreements included, but were not limited to, the factors listed below.
The nature, extent and quality of the services provided to the Funds under the Agreements. The Trustees considered the nature, extent and quality of the services provided by the Adviser and its affiliates to the Funds and the resources dedicated to the Funds by the Adviser and its affiliates.
The Trustees considered not only the advisory services provided by the Adviser to the Funds, but also the monitoring and oversight services provided by NGAM Advisors, L.P. (“NGAM Advisors”). They also considered the administrative services provided by NGAM Advisors and its affiliates to the Funds.
For each Fund, the Trustees also considered the benefits to shareholders of investing in a mutual fund that is part of a family of funds that offers shareholders the right to exchange shares of one type of fund for shares of another type of fund, and provides a variety of fund and shareholder services.
After reviewing these and related factors, the Trustees concluded, within the context of their overall conclusions regarding each of the Agreements, that the nature, extent and quality of services provided supported the renewal of the Agreements.
Investment performance of the Funds and the Adviser. As noted above, the Trustees received information about the performance of the Funds over various time periods, including information that compared the performance of the Funds to the performance of peer groups and categories of funds and the Funds’ respective performance benchmarks. In addition, the Trustees also reviewed data prepared by an independent third party that analyzed the performance of the Funds using a variety of performance metrics, including metrics that also measured the performance of the Funds on a risk adjusted basis.
15 |
With respect to each Fund, the Board concluded that the Fund’s performance or other relevant factors supported the renewal of the Agreement relating to that Fund. In the case of each Fund that had performance that lagged that of a relevant peer group median and/or category median for certain (although not necessarily all) periods, the Board concluded that other factors relevant to performance supported renewal of the Agreement. These factors included one or more of the following: (1) that the underperformance was attributable, to a significant extent, to investment decisions by the Adviser that were reasonable and consistent with the Fund’s investment objective and policies; (2) that the Fund’s more recent performance was competitive when compared to relevant performance benchmarks and/or peer groups; (3) that the Fund’s performance, although lagging in certain periods, was stronger over the long term; or (4) that the Fund’s performance, although lagging the performance of its category for certain periods, was competitive when compared to relevant benchmarks or peer groups.
The Trustees also considered the Adviser’s performance and reputation generally, the Funds’ performance as a fund family generally, and the historical responsiveness of the Adviser to Trustee concerns about performance and the willingness of the Adviser to take steps intended to improve performance.
After reviewing these and related factors, the Trustees concluded, within the context of their overall conclusions regarding each of the Agreements, that the performance of the Funds and the Adviser supported the renewal of the Agreements.
The costs of the services to be provided and profits to be realized by the Adviser and its affiliates from their respective relationships with the Funds. The Trustees considered the fees charged to the Funds for advisory services as well as the total expense levels of the Funds. This information included comparisons (provided both by management and also by an independent third party) of the Funds’ advisory fees and total expense levels to those of their peer groups and information about the advisory fees charged by the Adviser to comparable accounts (such as institutional separate accounts), as well as information about differences in such fees and the reasons for any such differences. In considering the fees charged to comparable accounts, the Trustees considered, among other things, management’s representations about the differences between managing mutual funds as compared to other types of accounts, including the additional resources required to effectively manage mutual fund assets and the greater regulatory costs associated with the management of such assets. In evaluating each Fund’s advisory fee, the Trustees also took into account the demands, complexity and quality of the investment management of such Fund, as well as the need for the Adviser to offer competitive compensation and the potential need to expend additional resources to the extent the Funds grow in size. The Trustees considered that over the past several years, management had made recommendations regarding reductions in advisory fee rates, implementation of advisory fee breakpoints and the institution of advisory fee waivers and expense caps for various funds in the fund family. They noted that all of the Funds in this report have expense caps in place, and they considered the amounts waived or reimbursed by the Adviser under these caps. The Trustees also considered that some Funds’ current expenses are below the cap. The Trustees noted that the Loomis Sayles Institutional High Income Fund’s advisory fee was above the median of a peer group of funds. The Trustees considered the factors which management believed justified such relatively higher fees. These factors included: (1) that the Fund’s net expense ratio was below the median for its peer group; and (2) that the Fund’s investment discipline was capacity constrained.
The Trustees also considered the compensation directly or indirectly received by the Adviser and its affiliates from their relationships with the Funds. The Trustees reviewed information provided by management as to the profitability of the Adviser and its affiliates’ relationships with the Funds, and information about the allocation of expenses used to calculate profitability. They also reviewed information provided by management about the effect of distribution costs and changes in asset levels on Adviser profitability, including information regarding resources spent on distribution activities. When reviewing profitability, the Trustees also considered information about court cases in which adviser compensation or profitability were issues, the performance of the relevant Funds, the expense levels of the Funds, whether the Adviser had implemented breakpoints and/or expense caps with respect to such Funds and the overall profit margin of the Adviser compared to other investment managers.
After reviewing these and related factors, the Trustees concluded, within the context of their overall conclusions regarding each of the Agreements, that the advisory fee charged to each of the Funds was fair and reasonable, and that the costs of these services generally and the related profitability of the Adviser and its affiliates in respect of their relationships with the Funds supported the renewal of the Agreements.
Economies of Scale. The Trustees considered the existence of any economies of scale in the provision of services by the Adviser and whether those economies are shared with the Funds through breakpoints in their investment advisory fees or other means, such as expense waivers or caps. The Trustees also discussed with management the factors considered with respect to the implementation of breakpoints in investment advisory fees or expense waivers or caps for certain funds. Management explained that a number of factors are taken into account in considering the possible implementation of breakpoints or an expense cap for a fund, including, among other things, factors such as a fund’s assets, the projected growth of a fund, projected profitability and a fund’s fees and performance. With respect to economies of scale, the Trustees noted that each of the Funds was subject to an expense cap or waiver. In considering these issues, the Trustees also took note of the costs of the services provided (both on an absolute and a relative basis) and the profitability to the Adviser and its affiliates of their relationships with the Funds, as discussed above.
After reviewing these and related factors, the Trustees concluded, within the context of their overall conclusions regarding each of the Agreements, that the extent to which economies of scale were shared with the Funds supported the renewal of the Agreements.
| 16
The Trustees also considered other factors, which included but were not limited to the following:
| • | | the effect of recent market and economic events on the performance, asset levels and expense ratios of each Fund. |
| • | | whether each Fund has operated in accordance with its investment objective and the Fund’s record of compliance with its investment restrictions, and the compliance programs of the Funds and the Adviser. They also considered the compliance-related resources the Adviser and its affiliates were providing to the Funds. |
| • | | the nature, quality, cost and extent of administrative and shareholder services performed by the Adviser and its affiliates, both under the Agreements and under separate agreements covering administrative services. |
| • | | so-called “fallout benefits” to the Adviser, such as the engagement of affiliates of the Adviser to provide distribution, administrative and brokerage services to the Funds, and the benefits of research made available to the Adviser by reason of brokerage commissions (if any) generated by the Funds’ securities transactions. The Trustees also considered the benefits to the parent company of NGAM Advisors from the retention of the Adviser. The Trustees considered the possible conflicts of interest associated with these fallout and other benefits, and the reporting, disclosure and other processes in place to disclose and monitor such possible conflicts of interest. |
| • | | the Trustees’ review and discussion of the Funds’ advisory arrangements in prior years, and management’s record of responding to Trustee concerns raised during the year and in prior years. |
Based on their evaluation of all factors that they deemed to be material, including those factors described above, and assisted by the advice of independent counsel, the Trustees, including the Independent Trustees, concluded that each of the existing Agreements should be continued through June 30, 2017.
17 |
Portfolio of Investments – as of September 30, 2016
Loomis Sayles Fixed Income Fund
| | | | | | | | |
Principal
Amount (‡) | | | Description | | Value (†) | |
|
| | Bonds and Notes – 85.7% of Net Assets | |
|
| | Non-Convertible Bonds – 77.7% | |
| | |
| | | | ABS Other – 0.1% | | | | |
| $ | 1,038,440 | | | GCA2014 Holdings Ltd.,
Series 2014-1, Class C,
6.000%, 1/05/2030, 144A(b)(c) | | $ | 651,102 | |
| | 404,747 | | | GCA2014 Holdings Ltd.,
Series 2014-1, Class D,
7.500%, 1/05/2030, 144A(b)(c) | | | 116,648 | |
| | 1,855,000 | | | GCA2014 Holdings Ltd.,
Series 2014-1, Class E, Zero Coupon,
1/05/2030, 144A(b)(c)(d) | | | 25,970 | |
| | 855,918 | | | Global Container Assets Ltd.,
Series 2015-1A, Class B,
4.500%, 2/05/2030, 144A(c)(e) | | | 837,035 | |
| | | | | | | | |
| | | | | | | 1,630,755 | |
| | | | | | | | |
| | | | Aerospace & Defense – 2.3% | |
| | 11,120,000 | | | Bombardier, Inc.,
6.000%, 10/15/2022, 144A | | | 10,063,600 | |
| | 175,000 | | | Bombardier, Inc.,
7.450%, 5/01/2034, 144A | | | 149,844 | |
| | 600,000 | | | Meccanica Holdings USA, Inc.,
6.250%, 7/15/2019, 144A | | | 654,000 | |
| | 1,900,000 | | | Meccanica Holdings USA, Inc.,
6.250%, 1/15/2040, 144A | | | 1,862,000 | |
| | 1,700,000 | | | Meccanica Holdings USA, Inc.,
7.375%, 7/15/2039, 144A | | | 1,861,500 | |
| | 245,000 | | | Textron, Inc., 5.600%, 12/01/2017 | | | 256,035 | |
| | 6,855,000 | | | Textron, Inc., 5.950%, 9/21/2021 | | | 7,852,114 | |
| | 1,290,000 | | | Textron, Inc., 7.250%, 10/01/2019 | | | 1,477,998 | |
| | 1,468,000 | | | TransDigm, Inc., 6.500%, 7/15/2024 | | | 1,545,070 | |
| | 1,375,000 | | | TransDigm, Inc., 6.500%, 5/15/2025 | | | 1,431,719 | |
| | | | | | | | |
| | | | | | | 27,153,880 | |
| | | | | | | | |
| | | | Airlines – 3.7% | | | | |
| | 5,550,000 | | | Air Canada,
7.625%, 10/01/2019, 144A, (CAD) | | | 4,391,647 | |
| | 634,230 | | | Air Canada Pass Through Trust,
Series 2013-1, Class B,
5.375%, 11/15/2022, 144A | | | 653,257 | |
| | 13,360,000 | | | American Airlines Group, Inc.,
5.500%, 10/01/2019, 144A | | | 13,911,100 | |
| | 11,478,132 | | | American Airlines Pass Through Certificates, Series 2016-1, Class B,
5.250%, 7/15/2025 | | | 12,037,691 | |
| | 1,020,586 | | | American Airlines Pass Through Trust, Series 2013-1, Class A,
4.000%, 1/15/2027 | | | 1,085,465 | |
| | 332,066 | | | American Airlines Pass Through Trust, Series 2013-1, Class B,
5.625%, 1/15/2021, 144A | | | 346,547 | |
| | 779,483 | | | American Airlines Pass Through Trust, Series 2013-2, Class C,
6.000%, 1/15/2017, 144A | | | 786,685 | |
| | 196,515 | | | Continental Airlines Pass Through Certificates, Series 2012-2, Class B,
5.500%, 4/29/2022 | | | 205,450 | |
| | 1,745,000 | | | Continental Airlines Pass Through Certificates, Series 2012-3, Class C,
6.125%, 4/29/2018 | | | 1,823,525 | |
| | |
| | | | Airlines – continued | | | | |
| $ | 8,020 | | | Continental Airlines Pass Through Trust, Series 2000-2, Class B,
8.307%, 10/02/2019 | | $ | 8,339 | |
| | 191,384 | | | Continental Airlines Pass Through Trust, Series 2012-1, Class B,
6.250%, 10/11/2021 | | | 205,259 | |
| | 185,375 | | | Delta Air Lines Pass Through Trust, Series 2009-1, Series B,
9.750%, 6/17/2018 | | | 189,931 | |
| | 733,111 | | | UAL Pass Through Trust,
Series 2007-1, Class A,
6.636%, 1/02/2024 | | | 780,764 | |
| | 1,593,212 | | | United Airlines Pass Through Trust,
Series 2014-1, Class A,
4.000%, 10/11/2027 | | | 1,708,720 | |
| | 1,196,840 | | | US Airways Pass Through Trust,
Series 2011-1, Class A,
7.125%, 4/22/2025 | | | 1,427,232 | |
| | 807,439 | | | US Airways Pass Through Trust,
Series 2012-1A, Class A,
5.900%, 4/01/2026 | | | 928,555 | |
| | 429,060 | | | US Airways Pass Through Trust,
Series 2012-1B, Class B,
8.000%, 4/01/2021 | | | 475,185 | |
| | 1,974,733 | | | US Airways Pass Through Trust,
Series 2012-2A, Class A,
4.625%, 12/03/2026 | | | 2,152,459 | |
| | 299,129 | | | Virgin Australia Pass Through Trust,
Series 2013-1B,
6.000%, 4/23/2022, 144A | | | 303,616 | |
| | 448,044 | | | Virgin Australia Pass Through Trust,
Series 2013-1C,
7.125%, 10/23/2018, 144A | | | 453,644 | |
| | | | | | | | |
| | | | | | | 43,875,071 | |
| | | | | | | | |
| | | | Automotive – 3.4% | | | | |
| | 1,550,000 | | | Ford Motor Co., 6.375%, 2/01/2029 | | | 1,899,592 | |
| | 1,030,000 | | | Ford Motor Co., 6.500%, 8/01/2018 | | | 1,121,628 | |
| | 165,000 | | | Ford Motor Co., 6.625%, 2/15/2028 | | | 197,708 | |
| | 4,230,000 | | | Ford Motor Co., 6.625%, 10/01/2028 | | | 5,313,950 | |
| | 690,000 | | | Ford Motor Co., 7.125%, 11/15/2025 | | | 860,639 | |
| | 2,245,000 | | | Ford Motor Co., 7.400%, 11/01/2046 | | | 3,241,773 | |
| | 4,955,000 | | | Ford Motor Co., 7.450%, 7/16/2031 | | | 6,553,959 | |
| | 1,645,000 | | | Ford Motor Co., 7.500%, 8/01/2026 | | | 2,102,799 | |
| | 600,000 | | | Ford Motor Credit Co. LLC,
5.000%, 5/15/2018 | | | 629,792 | |
| | 9,685,000 | | | Ford Motor Credit Co. LLC, GMTN,
4.389%, 1/08/2026 | | | 10,332,413 | |
| | 495,000 | | | General Motors Co., 5.200%, 4/01/2045 | | | 514,889 | |
| | 830,000 | | | General Motors Co., 6.750%, 4/01/2046 | | | 1,040,551 | |
| | 2,175,000 | | | General Motors Financial Co., Inc.,
4.375%, 9/25/2021 | | | 2,323,009 | |
| | 2,865,000 | | | General Motors Financial Co., Inc.,
5.250%, 3/01/2026 | | | 3,146,584 | |
| | 375,000 | | | Goodyear Tire & Rubber Co. (The),
7.000%, 3/15/2028 | | | 409,687 | |
| | 515,000 | | | Midas Intermediate Holdco II LLC/Midas Intermediate Holdco II Finance, Inc.,
7.875%, 10/01/2022, 144A | | | 524,012 | |
| | | | | | | | |
| | | | | | | 40,212,985 | |
| | | | | | | | |
See accompanying notes to financial statements.
| 18
Portfolio of Investments – as of September 30, 2016
Loomis Sayles Fixed Income Fund – continued
| | | | | | | | |
Principal
Amount (‡) | | | Description | | Value (†) | |
|
| | Bonds and Notes – continued | |
| | |
| | | | Banking – 11.4% | | | | |
| $ | 6,735,000 | | | Ally Financial, Inc., 5.125%, 9/30/2024 | | $ | 7,139,100 | |
| | 1,146,000 | | | Ally Financial, Inc., 8.000%, 11/01/2031 | | | 1,412,445 | |
| | 1,900,000 | | | Bank of America Corp., 5.490%, 3/15/2019 | | | 2,052,842 | |
| | 1,060,000 | | | Bank of America Corp., 5.650%, 5/01/2018 | | | 1,124,413 | |
| | 5,600,000 | | | Bank of America Corp., 6.110%, 1/29/2037 | | | 6,844,303 | |
| | 1,000,000 | | | Bank of America Corp., EMTN,
4.625%, 9/14/2018, (EUR) | | | 1,217,729 | |
| | 1,700,000 | | | Bank of America Corp., MTN,
3.300%, 1/11/2023 | | | 1,759,786 | |
| | 2,247,000 | | | Bank of America Corp., Series L, MTN, 7.625%, 6/01/2019 | | | 2,578,677 | |
| | 14,790,000 | | | Bank of Nova Scotia,
2.462%, 3/14/2019, (CAD) | | | 11,576,547 | |
| | 1,300,000 | | | BNP Paribas S.A., (fixed rate to 10/23/2017, variable rate thereafter), 7.436%, (GBP)(f) | | | 1,781,881 | |
| | 2,150,000 | | | BNP Paribas S.A., (fixed rate to 4/13/2017, variable rate thereafter), 5.019%, (EUR)(f) | | | 2,463,505 | |
| | 1,000,000 | | | BNP Paribas S.A., (fixed rate to 6/25/2037, variable rate thereafter),
7.195%, 144A(f) | | | 1,125,000 | |
| | 3,340,000 | | | Citigroup, Inc.,
5.130%, 11/12/2019, (NZD) | | | 2,550,447 | |
| | 14,170,000 | | | Citigroup, Inc.,
6.250%, 6/29/2017, (NZD) | | | 10,548,421 | |
| | 200,000 | | | Citigroup, Inc., EMTN,
0.972%, 11/30/2017, (EUR)(g) | | | 224,686 | |
| | 6,560,000 | | | Goldman Sachs Group, Inc. (The),
3.550%, 2/12/2021, (CAD) | | | 5,291,502 | |
| | 4,145,000 | | | Goldman Sachs Group, Inc. (The),
6.750%, 10/01/2037 | | | 5,277,870 | |
| | 1,955,000 | | | Goldman Sachs Group, Inc.
(The), GMTN,
5.375%, 3/15/2020 | | | 2,164,846 | |
| | 6,100,000 | | | HBOS PLC, GMTN,
6.750%, 5/21/2018, 144A | | | 6,519,637 | |
| | 3,605,000 | | | JPMorgan Chase & Co.,
4.250%, 11/02/2018, (NZD) | | | 2,680,946 | |
| | 8,450,000 | | | Lloyds Banking Group PLC,
5.300%, 12/01/2045, 144A | | | 9,096,341 | |
| | 50,000 | | | Merrill Lynch & Co., Inc., EMTN,
0.247%, 9/14/2018, (EUR)(g) | | | 55,972 | |
| | 300,000 | | | Merrill Lynch & Co., Inc.,
Series C, MTN,
6.050%, 6/01/2034 | | | 353,625 | |
| | 5,125,000 | | | Morgan Stanley, 2.125%, 4/25/2018 | | | 5,168,076 | |
| | 1,360,000 | | | Morgan Stanley, 2.500%, 1/24/2019 | | | 1,385,784 | |
| | 2,120,000 | | | Morgan Stanley, 3.750%, 2/25/2023 | | | 2,251,635 | |
| | 300,000 | | | Morgan Stanley, 4.350%, 9/08/2026 | | | 320,281 | |
| | 2,780,000 | | | Morgan Stanley,
4.750%, 11/16/2018, (AUD) | | | 2,211,531 | |
| | 3,115,000 | | | Morgan Stanley, 5.750%, 1/25/2021 | | | 3,550,898 | |
| | 4,900,000 | | | Morgan Stanley,
8.000%, 5/09/2017, (AUD) | | | 3,866,943 | |
| | |
| | | | Banking – continued | | | | |
| | 50,000 | | | Morgan Stanley, EMTN,
5.750%, 2/14/2017, (GBP) | | | 65,930 | |
| | 13,040,000 | | | Morgan Stanley, MTN,
4.100%, 5/22/2023 | | | 13,786,683 | |
| | 900,000 | | | Morgan Stanley, Series F, MTN,
1.129%, 10/18/2016(g) | | | 900,123 | |
| | 3,950,000 | | | Morgan Stanley, Series MPLE,
3.125%, 8/05/2021, (CAD) | | | 3,144,434 | |
| | 185,000 | | | Royal Bank of Scotland Group PLC,
5.250%, (EUR)(f) | | | 196,597 | |
| | 2,500,000 | | | Royal Bank of Scotland Group PLC,
5.500%, (EUR)(f) | | | 2,665,848 | |
| | 1,920,000 | | | Royal Bank of Scotland Group PLC,
6.000%, 12/19/2023 | | | 2,001,059 | |
| | 2,300,000 | | | Royal Bank of Scotland Group PLC, (fixed rate to 9/30/2017, variable rate thereafter), 7.640%(f) | | | 2,231,000 | |
| | 50,000 | | | Royal Bank of Scotland PLC
(The), EMTN,
4.350%, 1/23/2017, (EUR) | | | 56,773 | |
| | 650,000 | | | Royal Bank of Scotland PLC
(The), EMTN,
6.934%, 4/09/2018, (EUR) | | | 792,368 | |
| | 1,225,000 | | | Societe Generale S.A., (fixed rate to 4/05/2017, variable rate thereafter),
5.922%, 144A(f) | | | 1,235,964 | |
| | 5,000,000 | | | Societe Generale S.A., MTN,
5.200%, 4/15/2021, 144A | | | 5,695,035 | |
| | | | | | | | |
| | | | | | | 137,367,483 | |
| | | | | | | | |
| | | | Brokerage – 1.4% | | | | |
| | 549,000 | | | Jefferies Finance LLC/JFIN Co-Issuer Corp., 6.875%, 4/15/2022, 144A | | | 510,570 | |
| | 2,890,000 | | | Jefferies Finance LLC/JFIN Co-Issuer Corp., 7.500%, 4/15/2021, 144A | | | 2,810,525 | |
| | 1,245,000 | | | Jefferies Group LLC, 5.125%, 4/13/2018 | | | 1,299,798 | |
| | 3,225,000 | | | Jefferies Group LLC, 5.125%, 1/20/2023 | | | 3,435,889 | |
| | 3,055,000 | | | Jefferies Group LLC, 6.250%, 1/15/2036 | | | 3,184,156 | |
| | 1,805,000 | | | Jefferies Group LLC, 6.450%, 6/08/2027 | | | 2,043,441 | |
| | 2,530,000 | | | Jefferies Group LLC, 6.875%, 4/15/2021 | | | 2,951,700 | |
| | | | | | | | |
| | | | | | | 16,236,079 | |
| | | | | | | | |
| | | | Building Materials – 0.8% | | | | |
| | 4,135,000 | | | Atrium Windows & Doors, Inc.,
7.750%, 5/01/2019, 144A | | | 3,716,331 | |
| | 800,000 | | | Masco Corp., 6.500%, 8/15/2032 | | | 880,000 | |
| | 1,410,000 | | | Masco Corp., 7.125%, 3/15/2020 | | | 1,621,500 | |
| | 815,000 | | | Masco Corp., 7.750%, 8/01/2029 | | | 973,925 | |
| | 2,050,000 | | | Owens Corning, 7.000%, 12/01/2036 | | | 2,587,883 | |
| | | | | | | | |
| | | | | | | 9,779,639 | |
| | | | | | | | |
| | | | Cable Satellite – 1.0% | | | | |
| | 665,000 | | | CCO Holdings LLC/CCO Holdings Capital Corp., 5.750%, 1/15/2024 | | | 706,563 | |
| | 3,035,000 | | | DISH DBS Corp., 5.000%, 3/15/2023 | | | 2,951,537 | |
| | 715,000 | | | DISH DBS Corp., 5.875%, 11/15/2024 | | | 706,063 | |
See accompanying notes to financial statements.
19 |
Portfolio of Investments – as of September 30, 2016
Loomis Sayles Fixed Income Fund – continued
| | | | | | | | |
Principal
Amount (‡) | | | Description | | Value (†) | |
|
| | Bonds and Notes – continued | |
| | |
| | | | Cable Satellite – continued | | | | |
| $ | 375,000 | | | Time Warner Cable LLC, 4.500%, 9/15/2042 | | $ | 357,847 | |
| | 1,500,000 | | | Time Warner Cable LLC, 6.550%, 5/01/2037 | | | 1,778,446 | |
| | 3,400,000 | | | UPC Holding BV,
6.375%, 9/15/2022, 144A, (EUR) | | | 4,048,551 | |
| | 800,000 | | | Virgin Media Finance PLC,
6.000%, 10/15/2024, 144A | | | 828,008 | |
| | | | | | | | |
| | | | | | | 11,377,015 | |
| | | | | | | | |
| | | | Chemicals – 2.4% | | | | |
| | 3,845,000 | | | Chemours Co. (The), 6.625%, 5/15/2023 | | | 3,748,875 | |
| | 710,000 | | | Chemours Co. (The), 7.000%, 5/15/2025 | | | 697,575 | |
| | 9,550,000 | | | Consolidated Energy Finance S.A.,
6.750%, 10/15/2019, 144A | | | 9,430,625 | |
| | 5,240,000 | | | Hexion, Inc.,
7.875%, 2/15/2023(b)(c) | | | 1,886,400 | |
| | 275,000 | | | Hexion, Inc., 8.875%, 2/01/2018 | | | 261,938 | |
| | 905,000 | | | Hexion, Inc.,
9.200%, 3/15/2021(b)(c) | | | 352,950 | |
| | 7,395,000 | | | Hexion, Inc./Hexion Nova Scotia Finance ULC, 9.000%, 11/15/2020 | | | 5,352,131 | |
| | 6,830,000 | | | INVISTA Finance LLC,
4.250%, 10/15/2019, 144A | | | 6,796,396 | |
| | 620,000 | | | Methanex Corp., 5.250%, 3/01/2022 | | | 640,387 | |
| | | | | | | | |
| | | | | | | 29,167,277 | |
| | | | | | | | |
| | | | Construction Machinery – 0.2% | |
| | 965,000 | | | Toro Co., 6.625%, 5/01/2037(c)(e) | | | 1,156,511 | |
| | 1,155,000 | | | United Rentals North America, Inc.,
7.625%, 4/15/2022 | | | 1,230,075 | |
| | | | | | | | |
| | | | | | | 2,386,586 | |
| | | | | | | | |
| | | | Consumer Products – 0.1% | | | | |
| | 880,000 | | | Avon Products, Inc.,
8.950%, 3/15/2043 | | | 719,400 | |
| | | | | | | | |
| | | | Diversified Manufacturing – 0.2% | |
| | 45,000 | | | General Electric Co., GMTN,
3.100%, 1/09/2023 | | | 47,806 | |
| | 2,390,000 | | | General Electric Co., Series A, GMTN,
5.500%, 2/01/2017, (NZD) | | | 1,753,850 | |
| | | | | | | | |
| | | | | | | 1,801,656 | |
| | | | | | | | |
| | | | Electric – 3.6% | | | | |
| | 2,385,000 | | | AES Corp. (The), 4.875%, 5/15/2023 | | | 2,420,775 | |
| | 180,000 | | | AES Corp. (The), 5.500%, 4/15/2025 | | | 185,175 | |
| | 2,240,831 | | | Alta Wind Holdings LLC,
7.000%, 6/30/2035, 144A | | | 2,292,626 | |
| | 2,957,287 | | | Bruce Mansfield Unit Pass Through Trust, 6.850%, 6/01/2034(c)(e) | | | 1,505,791 | |
| | 2,850,000 | | | DPL, Inc., 6.750%, 10/01/2019 | | | 2,956,875 | |
| | 4,120,000 | | | EDP Finance BV,
4.125%, 1/15/2020, 144A | | | 4,270,380 | |
| | 7,305,000 | | | EDP Finance BV,
4.900%, 10/01/2019, 144A | | | 7,763,827 | |
| | 5,455,000 | | | EDP Finance BV,
6.000%, 2/02/2018, 144A | | | 5,702,439 | |
| | |
| | | | Electric – continued | | | | |
| | 1,200,000 | | | EDP Finance BV, EMTN,
8.625%, 1/04/2024, (GBP) | | $ | 2,123,055 | |
| | 1,589,000 | | | Empresa Nacional de Electricidad S.A., 7.875%, 2/01/2027 | | | 1,974,549 | �� |
| | 3,800,000 | | | Enel Finance International NV,
6.000%, 10/07/2039, 144A | | | 4,595,386 | |
| | 100,000 | | | Enel Finance International NV,
6.800%, 9/15/2037, 144A | | | 132,094 | |
| | 750,000 | | | Enel Finance International NV, EMTN, 5.750%, 9/14/2040, (GBP) | | | 1,357,947 | |
| | 4,000,000 | | | Enersis Americas S.A., 7.400%, 12/01/2016 | | | 4,028,832 | |
| | 1,730,712 | | | Mackinaw Power LLC,
6.296%, 10/31/2023, 144A(c)(e) | | | 1,920,866 | |
| | | | | | | | |
| | | | | | | 43,230,617 | |
| | | | | | | | |
| | | | Finance Companies – 4.6% | | | | |
| | 300,000 | | | AGFC Capital Trust I, (fixed rate to 1/15/2017, variable rate thereafter),
6.000%, 1/15/2067, 144A | | | 150,000 | |
| | 1,680,000 | | | International Lease Finance Corp.,
4.625%, 4/15/2021 | | | 1,759,800 | |
| | 3,045,000 | | | International Lease Finance Corp.,
5.875%, 8/15/2022 | | | 3,376,144 | |
| | 4,695,000 | | | International Lease Finance Corp.,
6.250%, 5/15/2019 | | | 5,088,206 | |
| | 4,905,000 | | | International Lease Finance Corp.,
7.125%, 9/01/2018, 144A | | | 5,352,581 | |
| | 945,000 | | | iStar, Inc., 4.875%, 7/01/2018 | | | 949,725 | |
| | 225,000 | | | iStar, Inc., 5.850%, 3/15/2017 | | | 227,687 | |
| | 935,000 | | | iStar, Inc., 7.125%, 2/15/2018 | | | 974,738 | |
| | 1,525,000 | | | Ladder Capital Finance Holdings LLLP/Ladder Capital Finance Corp., 7.375%, 10/01/2017 | | | 1,536,437 | |
| | 3,903,000 | | | Navient Corp., 5.875%, 10/25/2024 | | | 3,551,730 | |
| | 5,900,000 | | | Navient Corp., MTN, 6.125%, 3/25/2024 | | | 5,494,375 | |
| | 2,167,000 | | | Navient LLC, 4.875%, 6/17/2019 | | | 2,158,874 | |
| | 4,668,000 | | | Navient LLC, 5.500%, 1/25/2023 | | | 4,282,890 | |
| | 31,725(††) | | | Navient LLC, 6.000%, 12/15/2043 | | | 728,882 | |
| | 726,000 | | | Navient LLC, MTN, 5.500%, 1/15/2019 | | | 736,890 | |
| | 145,000 | | | Navient LLC, Series A, MTN,
5.000%, 6/15/2018 | | | 145,000 | |
| | 5,185,000 | | | Navient LLC, Series A, MTN,
5.625%, 8/01/2033(c)(e) | | | 4,122,075 | |
| | 2,681,000 | | | Navient LLC, Series A, MTN,
8.450%, 6/15/2018 | | | 2,882,075 | |
| | 1,950,000 | | | Quicken Loans, Inc.,
5.750%, 5/01/2025, 144A | | | 1,935,375 | |
| | 1,225,000 | | | Springleaf Finance Corp.,
5.250%, 12/15/2019 | | | 1,251,031 | |
| | 3,770,000 | | | Springleaf Finance Corp., 6.000%, 6/01/2020 | | | 3,859,537 | |
| | 1,805,000 | | | Springleaf Finance Corp., 7.750%, 10/01/2021 | | | 1,892,994 | |
| | 725,000 | | | Springleaf Finance Corp., 8.250%, 10/01/2023 | | | 761,250 | |
| | 2,100,000 | | | Springleaf Finance Corp., Series J, MTN, 6.500%, 9/15/2017 | | | 2,173,500 | |
| | | | | | | | |
| | | | | | | 55,391,796 | |
| | | | | | | | |
See accompanying notes to financial statements.
| 20
Portfolio of Investments – as of September 30, 2016
Loomis Sayles Fixed Income Fund – continued
| | | | | | | | |
Principal
Amount (‡) | | | Description | | Value (†) | |
|
| | Bonds and Notes – continued | |
| | |
| | | | Food & Beverage – 0.4% | | | | |
| $ | 2,445,000 | | | Constellation Brands, Inc., 4.750%, 11/15/2024 | | $ | 2,646,712 | |
| | 1,995,000 | | | DS Services of America, Inc.,
10.000%, 9/01/2021, 144A | | | 2,224,425 | |
| | | | | | | | |
| | | | | | | 4,871,137 | |
| | | | | | | | |
| | | | Government Owned – No Guarantee – 0.3% | |
| | 1,715,000 | | | Pertamina Persero PT,
6.450%, 5/30/2044, 144A | | | 1,986,654 | |
| | 1,605,000 | | | Petrobras Global Finance BV,
4.375%, 5/20/2023 | | | 1,435,673 | |
| | 965,000 | | | Petrobras Global Finance BV,
5.625%, 5/20/2043 | | | 728,575 | |
| | | | | | | | |
| | | | | | | 4,150,902 | |
| | | | | | | | |
| | | | Healthcare – 2.7% | | | | |
| | 650,000 | | | BioScrip, Inc., 8.875%, 2/15/2021 | | | 607,750 | |
| | 425,000 | | | Boston Scientific Corp., 5.125%, 1/12/2017 | | | 429,444 | |
| | 610,000 | | | HCA, Inc., 5.875%, 3/15/2022 | | | 672,525 | |
| | 4,960,000 | | | HCA, Inc., 5.875%, 5/01/2023 | | | 5,282,400 | |
| | 2,932,000 | | | HCA, Inc., 7.050%, 12/01/2027 | | | 3,118,915 | |
| | 1,475,000 | | | HCA, Inc., 7.500%, 12/15/2023 | | | 1,635,406 | |
| | 1,440,000 | | | HCA, Inc., 7.500%, 11/06/2033 | | | 1,560,600 | |
| | 2,660,000 | | | HCA, Inc., 7.690%, 6/15/2025 | | | 2,989,601 | |
| | 2,220,000 | | | HCA, Inc., 8.360%, 4/15/2024 | | | 2,577,598 | |
| | 2,930,000 | | | HCA, Inc., MTN, 7.580%, 9/15/2025 | | | 3,303,575 | |
| | 430,000 | | | HCA, Inc., MTN, 7.750%, 7/15/2036 | | | 466,013 | |
| | 1,425,000 | | | Tenet Healthcare Corp., 4.375%, 10/01/2021 | | | 1,417,875 | |
| | 2,245,000 | | | Tenet Healthcare Corp., 4.500%, 4/01/2021 | | | 2,259,031 | |
| | 3,685,000 | | | Tenet Healthcare Corp., 5.000%, 3/01/2019 | | | 3,602,087 | |
| | 1,285,000 | | | Tenet Healthcare Corp., 6.750%, 6/15/2023 | | | 1,195,050 | |
| | 1,775,000 | | | Tenet Healthcare Corp., 6.875%, 11/15/2031 | | | 1,459,937 | |
| | | | | | | | |
| | | | | | | 32,577,807 | |
| | | | | | | | |
| | | | Home Construction – 0.9% | | | | |
| | 550,000 | | | Beazer Homes USA, Inc., 7.250%, 2/01/2023 | | | 547,250 | |
| | 270,000 | | | K. Hovnanian Enterprises, Inc.,
5.000%, 11/01/2021(c)(e) | | | 189,000 | |
| | 4,276,000 | | | K. Hovnanian Enterprises, Inc.,
8.000%, 11/01/2019, 144A | | | 2,586,980 | |
| | 835,000 | | | KB Home, 8.000%, 3/15/2020 | | | 929,981 | |
| | 3,920,000 | | | PulteGroup, Inc., 6.000%, 2/15/2035 | | | 3,959,200 | |
| | 3,020,000 | | | PulteGroup, Inc., 6.375%, 5/15/2033 | | | 3,145,835 | |
| | 15,000 | | | TRI Pointe Holdings, Inc./TRI Pointe Group, Inc., 5.875%, 6/15/2024 | | | 15,600 | |
| | | | | | | | |
| | | | | | | 11,373,846 | |
| | | | | | | | |
| | | | Independent Energy – 1.5% | | | | |
| | 242,000 | | | Anadarko Petroleum Corp.,
6.375%, 9/15/2017 | | | 252,295 | |
| | 644,000 | | | California Resources Corp.,
5.500%, 9/15/2021 | | | 341,320 | |
| | |
| | | | Independent Energy – continued | | | | |
| 86,000 | | | California Resources Corp.,
6.000%, 11/15/2024 | | | 41,065 | |
| | 3,105,000 | | | Chesapeake Energy Corp., 4.875%, 4/15/2022 | | | 2,615,962 | |
| | 335,000 | | | Chesapeake Energy Corp., 5.750%, 3/15/2023 | | | 284,750 | |
| | 1,135,000 | | | Chesapeake Energy Corp., 6.125%, 2/15/2021 | | | 1,041,363 | |
| | 720,000 | | | Chesapeake Energy Corp., 6.625%, 8/15/2020 | | | 677,700 | |
| | 995,000 | | | Chesapeake Energy Corp.,
6.875%, 11/15/2020 | | | 930,325 | |
| | 550,000 | | | Chesapeake Energy Corp.,
7.250%, 12/15/2018 | | | 558,250 | |
| | 980,000 | | | Continental Resources, Inc.,
3.800%, 6/01/2024 | | | 896,700 | |
| | 185,000 | | | Continental Resources, Inc.,
4.500%, 4/15/2023 | | | 177,600 | |
| | 5,955,000 | | | Newfield Exploration Co., 5.625%, 7/01/2024 | | | 6,103,875 | |
| | 345,000 | | | QEP Resources, Inc., 5.250%, 5/01/2023 | | | 339,825 | |
| | 690,000 | | | Rice Energy, Inc., 6.250%, 5/01/2022 | | | 712,425 | |
| | 1,600,000 | | | RSP Permian, Inc., 6.625%, 10/01/2022 | | | 1,676,000 | |
| | 1,221,000 | | | SM Energy Co., 6.125%, 11/15/2022 | | | 1,221,000 | |
| | 155,000 | | | Whiting Petroleum Corp.,
6.250%, 4/01/2023 | | | 141,438 | |
| | | | | | | | |
| | | | | | | 18,011,893 | |
| | | | | | | | |
| | | | Industrial Other – 0.2% | | | | |
| | 385,000 | | | AECOM, 5.750%, 10/15/2022 | | | 404,369 | |
| | 405,000 | | | AECOM, 5.875%, 10/15/2024 | | | 432,338 | |
| | 660,000 | | | Broadspectrum Ltd.,
8.375%, 5/15/2020, 144A | | | 702,900 | |
| | 1,150,000 | | | Cleaver-Brooks, Inc.,
8.750%, 12/15/2019, 144A | | | 1,204,625 | |
| | | | | | | | |
| | | | | | | 2,744,232 | |
| | | | | | | | |
| | | | Life Insurance – 1.6% | | | | |
| | 160,000 | | | American International Group, Inc.,
4.125%, 2/15/2024 | | | 172,403 | |
| | 130,000 | | | American International Group, Inc.,
4.875%, 6/01/2022 | | | 146,269 | |
| | 3,700,000 | | | AXA S.A., (fixed rate to 12/14/2036, variable rate thereafter), 6.379%, 144A(f) | | | 4,031,446 | |
| | 200,000 | | | AXA S.A., EMTN, (fixed rate to 4/16/2020, variable rate thereafter), 5.250%, 4/16/2040, (EUR) | | | 250,727 | |
| | 4,345,000 | | | Forethought Financial Group, Inc.,
8.625%, 4/15/2021, 144A(c)(e) | | | 4,995,707 | |
| | 790,000 | | | Genworth Holdings, Inc., 4.800%, 2/15/2024 | | | 649,775 | |
| | 1,940,000 | | | Genworth Holdings, Inc., 4.900%, 8/15/2023 | | | 1,615,050 | |
| | 840,000 | | | Genworth Holdings, Inc., 6.500%, 6/15/2034 | | | 684,600 | |
| | 2,270,000 | | | MetLife Capital Trust X,
9.250%, 4/08/2068, 144A | | | 3,265,849 | |
| | 1,115,000 | | | MetLife, Inc., 10.750%, 8/01/2069 | | | 1,786,899 | |
See accompanying notes to financial statements.
21 |
Portfolio of Investments – as of September 30, 2016
Loomis Sayles Fixed Income Fund – continued
| | | | | | | | |
Principal
Amount (‡) | | | Description | | Value (†) | |
|
| | Bonds and Notes – continued | |
| | |
| | | | Life Insurance – continued | | | | |
| $ | 1,165,000 | | | Penn Mutual Life Insurance Co. (The), 6.650%, 6/15/2034, 144A | | $ | 1,400,623 | |
| | | | | | | | |
| | | | | | | 18,999,348 | |
| | | | | | | | |
| | |
| | | | Local Authorities – 2.3% | | | | |
| | 830,000 | | | New South Wales Treasury Corp.,
3.500%, 3/20/2019, (AUD) | | | 662,790 | |
| | 9,640,000 | | | New South Wales Treasury Corp.,
6.000%, 2/01/2018, (AUD) | | | 7,793,803 | |
| | 4,280,000 | | | New South Wales Treasury Corp.,
Series 17RG,
5.500%, 3/01/2017, (AUD) | | | 3,325,848 | |
| | 19,825,000 | | | Province of Ontario Canada,
4.200%, 3/08/2018, (CAD) | | | 15,858,640 | |
| | | | | | | | |
| | | | | | | 27,641,081 | |
| | | | | | | | |
| | | | Media Entertainment – 0.7% | |
| | 24,000,000 | | | Grupo Televisa SAB, EMTN,
7.250%, 5/14/2043, (MXN) | | | 1,073,025 | |
| | 3,805,000 | | | iHeartCommunications, Inc.,
9.000%, 9/15/2022 | | | 2,768,137 | |
| | 500,000 | | | Outfront Media Capital LLC/Outfront Media Capital Corp., 5.250%, 2/15/2022 | | | 520,000 | |
| | 1,250,000 | | | Outfront Media Capital LLC/Outfront Media Capital Corp., 5.875%, 3/15/2025 | | | 1,312,500 | |
| | 2,475,000 | | | R.R. Donnelley & Sons Co.,
6.000%, 4/01/2024 | | | 2,456,438 | |
| | 120,000 | | | R.R. Donnelley & Sons Co.,
6.500%, 11/15/2023 | | | 120,900 | |
| | 306,000 | | | R.R. Donnelley & Sons Co.,
7.000%, 2/15/2022 | | | 317,475 | |
| | 295,000 | | | R.R. Donnelley & Sons Co.,
7.875%, 3/15/2021 | | | 322,288 | |
| | | | | | | | |
| | | | | | | 8,890,763 | |
| | | | | | | | |
| | | | Metals & Mining – 1.7% | | | | |
| | 2,602,232 | | | 1839688 Alberta ULC, PIK, 14.000%, 2/13/2020(b)(c)(h)(i) | | | 1,041 | |
| | 1,400,000 | | | Alcoa, Inc., 5.870%, 2/23/2022 | | | 1,505,000 | |
| | 400,000 | | | Alcoa, Inc., 5.900%, 2/01/2027 | | | 428,000 | |
| | 6,630,000 | | | ArcelorMittal, 7.750%, 3/01/2041 | | | 6,911,775 | |
| | 3,300,000 | | | ArcelorMittal, 8.000%, 10/15/2039 | | | 3,564,000 | |
| | 1,659,000 | | | Cliffs Natural Resources, Inc.,
8.000%, 9/30/2020, 144A | | | 1,625,820 | |
| | 2,015,000 | | | Essar Steel Algoma, Inc.,
9.500%, 11/15/2019, 144A(c)(e)(h) | | | 272,025 | |
| | 2,525,000 | | | First Quantum Minerals Ltd.,
7.250%, 5/15/2022, 144A | | | 2,234,625 | |
| | 1,400,000 | | | Rain CII Carbon LLC/CII Carbon Corp., 8.250%, 1/15/2021, 144A | | | 1,365,000 | |
| | 1,580,000 | | | United States Steel Corp., 6.650%, 6/01/2037 | | | 1,264,000 | |
| | 1,760,000 | | | United States Steel Corp., 7.500%, 3/15/2022 | | | 1,733,600 | |
| | | | | | | | |
| | | | | | | 20,904,886 | |
| | | | | | | | |
| | |
| | | | Midstream – 2.0% | | | | |
| 575,000 | | | DCP Midstream LLC,
6.450%, 11/03/2036, 144A | | | 559,188 | |
| | 250,000 | | | El Paso Corp., GMTN, 7.800%, 8/01/2031 | | | 304,670 | |
| | 3,000,000 | | | Enbridge Energy Partners LP,
5.875%, 10/15/2025 | | | 3,448,938 | �� |
| | 2,860,000 | | | Enbridge Energy Partners LP,
7.375%, 10/15/2045 | | | 3,616,441 | |
| | 1,410,000 | | | Enterprise Products Operating LLC,
6.300%, 9/15/2017 | | | 1,473,351 | |
| | 300,000 | | | Florida Gas Transmission Co.,
7.900%, 5/15/2019, 144A | | | 340,301 | |
| | 1,300,000 | | | IFM U.S. Colonial Pipeline 2 LLC,
6.450%, 5/01/2021, 144A | | | 1,467,680 | |
| | 95,000 | | | NGPL PipeCo LLC,
7.768%, 12/15/2037, 144A | | | 103,075 | |
| | 375,000 | | | ONEOK Partners LP, 4.900%, 3/15/2025 | | | 403,398 | |
| | 115,000 | | | ONEOK Partners LP, 6.200%, 9/15/2043 | | | 127,049 | |
| | 1,785,000 | | | Plains All American Pipeline LP,
6.125%, 1/15/2017 | | | 1,806,349 | |
| | 7,195,000 | | | Transcontinental Gas Pipe Line Co. LLC, 7.850%, 2/01/2026, 144A | | | 9,314,942 | |
| | 1,280,000 | | | Western Refining Logistics LP/WNRL Finance Corp.,
7.500%, 2/15/2023 | | | 1,312,000 | |
| | | | | | | | |
| | | | | | | 24,277,382 | |
| | | | | | | | |
| | | | Non-Agency Commercial Mortgage-Backed Securities – 0.4% | |
| | 530,000 | | | GS Mortgage Securities Trust, Series 2007-GG10, Class AM,
5.988%, 8/10/2045(g) | | | 510,139 | |
| | 926,171 | | | Institutional Mortgage Securities Canada, Inc., Series 2014-5A, Class A1, 2.003%, 7/12/2047, 144A, (CAD) | | | 700,373 | |
| | 1,000,000 | | | Merrill Lynch/Countrywide Commercial Mortgage Trust, Series 2007-6, Class A4,
5.485%, 3/12/2051(g) | | | 1,010,042 | |
| | 2,151,191 | | | Motel 6 Trust,
Series 2015-M6MZ, Class M,
8.230%, 2/05/2020, 144A(c)(e) | | | 2,165,308 | |
| | | | | | | | |
| | | | | | | 4,385,862 | |
| | | | | | | | |
| | | | Oil Field Services – 0.3% | | | | |
| | 6,230,000 | | | FTS International, Inc., 6.250%, 5/01/2022 | | | 2,382,975 | |
| | 3,050,000 | | | Paragon Offshore PLC,
6.750%, 7/15/2022, 144A(h) | | | 846,375 | |
| | 1,317,000 | | | Paragon Offshore PLC,
7.250%, 8/15/2024, 144A(h) | | | 365,467 | |
| | 775,000 | | | Sidewinder Drilling, Inc.,
9.750%, 11/15/2019, 144A | | | 50,375 | |
| | 400,000 | | | Transocean, Inc., 5.050%, 10/15/2022 | | | 313,500 | |
| | | | | | | | |
| | | | | | | 3,958,692 | |
| | | | | | | | |
See accompanying notes to financial statements.
| 22
Portfolio of Investments – as of September 30, 2016
Loomis Sayles Fixed Income Fund – continued
| | | | | | | | |
Principal
Amount (‡) | | | Description | | Value (†) | |
|
| | Bonds and Notes – continued | |
| | |
| | | | Packaging – 1.5% | | | | |
| $ | 3,550,000 | | | Beverage Packaging Holdings Luxembourg II S.A./Beverage Packaging Holdings II Issuer, Inc.,
5.625%, 12/15/2016, 144A | | $ | 3,541,480 | |
| | 11,450,000 | | | Owens-Brockway Glass Container, Inc., 5.375%, 1/15/2025, 144A | | | 11,908,000 | |
| | 1,910,000 | | | Sealed Air Corp.,
5.500%, 9/15/2025, 144A | | | 2,048,475 | |
| | | | | | | | |
| | | | | | | 17,497,955 | |
| | | | | | | | |
| | | | Paper – 1.1% | | | | |
| | 2,894,000 | | | Georgia-Pacific LLC, 7.375%, 12/01/2025 | | | 3,857,340 | |
| | 5,492,000 | | | Georgia-Pacific LLC, 7.750%, 11/15/2029 | | | 7,859,299 | |
| | 350,000 | | | WestRock MWV LLC, 7.950%, 2/15/2031 | | | 471,903 | |
| | 1,035,000 | | | WestRock MWV LLC, 8.200%, 1/15/2030 | | | 1,411,281 | |
| | | | | | | | |
| | | | | | | 13,599,823 | |
| | | | | | | | |
| | | | Property & Casualty Insurance – 0.8% | |
| | 1,630,000 | | | MBIA Insurance Corp.,
11.940%, 1/15/2033, 144A(d)(g) | | | 652,000 | |
| | 3,275,000 | | | Old Republic International Corp.,
4.875%, 10/01/2024 | | | 3,541,218 | |
| | 2,140,000 | | | Sirius International Group,
6.375%, 3/20/2017, 144A | | | 2,173,904 | |
| | 1,430,000 | | | XLIT Ltd., 6.250%, 5/15/2027 | | | 1,727,008 | |
| | 1,135,000 | | | XLIT Ltd., 6.375%, 11/15/2024 | | | 1,352,429 | |
| | | | | | | | |
| | | | | | | 9,446,559 | |
| | | | | | | | |
| | | | Railroads – 0.0% | | | | |
| | 500,000 | | | Missouri Pacific Railroad Co.,
5.000%, 1/01/2045(c)(e) | | | 488,897 | |
| | | | | | | | |
| | | | REITs – Apartments – 0.1% | | | | |
| | 1,495,000 | | | Camden Property Trust,
5.700%, 5/15/2017 | | | 1,533,022 | |
| | | | | | | | |
| | | | REITs – Office Property – 0.3% | | | | |
| | 475,000 | | | Highwoods Properties, Inc.,
7.500%, 4/15/2018 | | | 513,586 | |
| | 3,485,000 | | | Highwoods Realty LP,
5.850%, 3/15/2017 | | | 3,547,629 | |
| | | | | | | | |
| | | | | | | 4,061,215 | |
| | | | | | | | |
| | | | REITs – Single Tenant – 0.1% | |
| | 275,000 | | | Realty Income Corp., 5.750%, 1/15/2021 | | | 313,500 | |
| | 725,000 | | | Realty Income Corp., 6.750%, 8/15/2019 | | | 824,249 | |
| | | | | | | | |
| | | | | | | 1,137,749 | |
| | | | | | | | |
| | | | Restaurants – 0.1% | | | | |
| | 450,000 | | | Wagamama Finance PLC,
7.875%, 2/01/2020, 144A, (GBP) | | | 613,160 | |
| | | | | | | | |
| | | | Retailers – 0.6% | | | | |
| | 1,025,000 | | | Dillard’s, Inc., 7.750%, 7/15/2026 | | | 1,180,083 | |
| | 1,100,000 | | | Foot Locker, Inc., 8.500%, 1/15/2022 | | | 1,298,000 | |
| | |
| | | | Retailers – continued | | | | |
| 440,000 | | | GameStop Corp., 5.500%, 10/01/2019, 144A | | | 449,350 | |
| | 155,000 | | | J.C. Penney Corp., Inc., 5.650%, 6/01/2020 | | | 155,369 | |
| | 793,000 | | | J.C. Penney Corp., Inc., 6.375%, 10/15/2036 | | | 681,980 | |
| | 1,525,000 | | | J.C. Penney Corp., Inc., 8.125%, 10/01/2019 | | | 1,662,250 | |
| | 2,121,000 | | | TRU Taj LLC/TRU Taj Finance, Inc.,
12.000%, 8/15/2021, 144A | | | 2,136,907 | |
| | | | | | | | |
| | | | | | | 7,563,939 | |
| | | | | | | | |
| | | | Sovereigns – 0.4% | | | | |
| | 4,485,000 | | | Portugal Government International Bond, 5.125%, 10/15/2024, 144A | | | 4,467,383 | |
| | | | | | | | |
| | | | Supermarkets – 1.4% | | | | |
| | 760,000 | | | Albertson’s Cos. LLC/Safeway,
Inc./New Albertson’s, Inc./Albertson’s LLC, 6.625%, 6/15/2024, 144A | | | 790,400 | |
| | 7,670,000 | | | New Albertson’s, Inc., 7.450%, 8/01/2029 | | | 7,516,600 | |
| | 2,445,000 | | | New Albertson’s, Inc., 7.750%, 6/15/2026 | | | 2,435,831 | |
| | 3,780,000 | | | New Albertson’s, Inc., 8.000%, 5/01/2031 | | | 3,728,025 | |
| | 560,000 | | | New Albertson’s, Inc., 8.700%, 5/01/2030 | | | 568,400 | |
| | 2,105,000 | | | New Albertson’s, Inc., Series C, MTN, 6.625%, 6/01/2028 | | | 1,936,600 | |
| | | | | | | | |
| | | | | | | 16,975,856 | |
| | | | | | | | |
| | | | Supranational – 1.2% | | | | |
| | 19,735,000 | | | Inter-American Development Bank, EMTN, 6.000%, 12/15/2017, (NZD) | | | 14,971,905 | |
| | | | | | | | |
| | | | Technology – 1.5% | | | | |
| | 860,000 | | | Advanced Micro Devices, Inc.,
7.000%, 7/01/2024 | | | 844,950 | |
| | 2,415,000 | | | Alcatel-Lucent USA, Inc., 6.450%, 3/15/2029 | | | 2,671,594 | |
| | 80,000 | | | Alcatel-Lucent USA, Inc., 6.500%, 1/15/2028 | | | 87,200 | |
| | 2,950,000 | | | Amkor Technology, Inc., 6.375%, 10/01/2022 | | | 3,045,875 | |
| | 1,175,000 | | | Corning, Inc., 7.250%, 8/15/2036 | | | 1,456,464 | |
| | 2,095,000 | | | Hewlett Packard Enterprise Co.,
6.350%, 10/15/2045, 144A | | | 2,161,920 | |
| | 166,000 | | | Motorola Solutions, Inc.,
6.625%, 11/15/2037 | | | 171,958 | |
| | 694,800 | | | Samsung Electronics Co. Ltd.,
7.700%, 10/01/2027, 144A | | | 886,455 | |
| | 5,585,000 | | | Western Digital Corp.,
7.375%, 4/01/2023, 144A | | | 6,143,500 | |
| | | | | | | | |
| | | | | | | 17,469,916 | |
| | | | | | | | |
| | | | Transportation Services – 0.2% | |
| | 2,500,000 | | | APL Ltd., 8.000%, 1/15/2024(c)(e) | | | 1,650,000 | |
| | 241,523 | | | Atlas Air Pass Through Trust, Series 1998-1, Class B,
7.680%, 1/02/2018(b) | | | 245,749 | |
See accompanying notes to financial statements.
23 |
Portfolio of Investments – as of September 30, 2016
Loomis Sayles Fixed Income Fund – continued
| | | | | | | | |
Principal
Amount (‡) | | | Description | | Value (†) | |
|
| | Bonds and Notes – continued | |
| |
| | | | Transportation Services – continued | |
| $ | 143,070 | | | Atlas Air Pass Through Trust, Series 1999-1, Class B,
7.630%, 1/02/2018(b) | | $ | 143,070 | |
| | 134,589 | | | Atlas Air Pass Through Trust, Series 2000-1, Class B,
9.057%, 1/02/2018(b) | | | 136,608 | |
| | | | | | | | |
| | | | | | | 2,175,427 | |
| | | | | | | | |
| | | | Treasuries – 14.9% | | | | |
| | 29,780,000 | | | Canadian Government,
0.250%, 5/01/2017, (CAD) | | | 22,663,171 | |
| | 13,195,000 | | | Canadian Government,
0.750%, 9/01/2020, (CAD) | | | 10,127,850 | |
| | 10,950,000 | | | Canadian Government,
1.250%, 9/01/2018, (CAD) | | | 8,464,122 | |
| | 8,305,000 | | | Canadian Government,
1.750%, 9/01/2019, (CAD) | | | 6,554,110 | |
| | 264,630,000 | | | Iceland Government International Bond, 6.000%, 10/13/2016, (ISK) | | | 1,574,942 | |
| | 107,395,000 | | | Iceland Government International Bond, 7.250%, 10/26/2022, (ISK) | | | 706,378 | |
| | 271,710,000 | | | Iceland Government International Bond, 8.750%, 2/26/2019, (ISK) | | | 1,743,473 | |
| | 414,800(†††) | | | Mexican Fixed Rate Bonds, Series M, 5.000%, 6/15/2017, (MXN) | | | 2,140,582 | |
| | 424,300(†††) | | | Mexican Fixed Rate Bonds, Series M, 6.500%, 6/10/2021, (MXN) | | | 2,254,478 | |
| | 200,000(†††) | | | Mexican Fixed Rate Bonds, Series M, 7.750%, 5/29/2031, (MXN) | | | 1,166,764 | |
| | 595,000(†††) | | | Mexican Fixed Rate Bonds, Series M-20, 7.500%, 6/03/2027, (MXN) | | | 3,394,502 | |
| | 847,500(†††) | | | Mexican Fixed Rate Bonds, Series M-20, 8.000%, 12/07/2023, (MXN) | | | 4,913,833 | |
| | 150,000(†††) | | | Mexican Fixed Rate Bonds, Series M-20, 8.500%, 5/31/2029, (MXN) | | | 924,443 | |
| | 1,455,000(†††) | | | Mexican Fixed Rate Bonds, Series M-20, 10.000%, 12/05/2024, (MXN) | | | 9,479,691 | |
| | 21,085,000 | | | New Zealand Government Bond,
5.000%, 3/15/2019, (NZD) | | | 16,480,759 | |
| | 10,220,000 | | | Norway Government Bond,
3.750%, 5/25/2021, 144A, (NOK) | | | 1,443,425 | |
| | 63,235,000 | | | Norway Government Bond,
4.250%, 5/19/2017, 144A, (NOK) | | | 8,091,084 | |
| | 14,660,000 | | | Norway Government Bond,
4.500%, 5/22/2019, 144A, (NOK) | | | 2,013,242 | |
| | 10,150,000 | | | Republic of Brazil,
8.500%, 1/05/2024, (BRL) | | | 2,883,035 | |
| | 14,635,000 | | | Republic of Brazil,
10.250%, 1/10/2028, (BRL) | | | 4,567,601 | |
| | 12,000,000 | | | U.S. Treasury Note, 0.750%, 4/30/2018 | | | 12,001,404 | |
| | |
| | | | Treasuries – continued | | | | |
| 37,000,000 | | | U.S. Treasury Note, 0.750%, 8/31/2018 | | | 36,992,785 | |
| | 18,500,000 | | | U.S. Treasury Note, 0.875%, 5/31/2018 | | | 18,538,295 | |
| | | | | | | | |
| | | | | | | 179,119,969 | |
| | | | | | | | |
| | | | Wireless – 0.7% | | | | |
| | 72,400,000 | | | America Movil SAB de CV,
6.450%, 12/05/2022, (MXN) | | | 3,636,849 | |
| | 2,627,000 | | | Sprint Capital Corp., 6.875%, 11/15/2028 | | | 2,466,096 | |
| | 300,000 | | | Sprint Capital Corp., 8.750%, 3/15/2032 | | | 306,000 | |
| | 898,000 | | | Sprint Communications, Inc.,
6.000%, 12/01/2016 | | | 902,490 | |
| | 735,000 | | | Sprint Communications, Inc.,
6.000%, 11/15/2022 | | | 681,713 | |
| | 285,000 | | | Sprint Corp., 7.125%, 6/15/2024 | | | 277,875 | |
| | | | | | | | |
| | | | | | | 8,271,023 | |
| | | | | | | | |
| | | | Wirelines – 2.6% | | | | |
| | 195,000 | | | Bell Canada, MTN,
6.550%, 5/01/2029, 144A, (CAD) | | | 191,807 | |
| | 690,000 | | | Bell Canada, MTN,
7.300%, 2/23/2032, (CAD) | | | 732,858 | |
| | 210,000 | | | Bell Canada, Series M-17,
6.100%, 3/16/2035, (CAD) | | | 203,911 | |
| | 2,085,000 | | | Cincinnati Bell, Inc.,
7.000%, 7/15/2024, 144A | | | 2,137,125 | |
| | 990,000 | | | Consolidated Communications, Inc., 6.500%, 10/01/2022 | | | 960,300 | |
| | 200,000 | | | Embarq Corp., 7.995%, 6/01/2036 | | | 202,396 | |
| | 3,585,000 | | | Level 3 Communications, Inc.,
5.750%, 12/01/2022 | | | 3,746,325 | |
| | 55,000 | | | Level 3 Financing, Inc., 5.375%, 8/15/2022 | | | 57,475 | |
| | 900,000 | | | Portugal Telecom International Finance BV, EMTN,
4.500%, 6/16/2025, (EUR)(d) | | | 232,533 | |
| | 1,700,000 | | | Portugal Telecom International Finance BV, EMTN,
5.000%, 11/04/2019, (EUR)(d) | | | 439,230 | |
| | 7,205,000 | | | Qwest Capital Funding, Inc.,
6.875%, 7/15/2028 | | | 6,808,725 | |
| | 350,000 | | | Qwest Capital Funding, Inc.,
7.625%, 8/03/2021 | | | 360,500 | |
| | 775,000 | | | Qwest Capital Funding, Inc.,
7.750%, 2/15/2031 | | | 751,750 | |
| | 4,484,000 | | | Qwest Corp., 6.875%, 9/15/2033 | | | 4,470,091 | |
| | 1,220,000 | | | Qwest Corp., 7.250%, 9/15/2025 | | | 1,335,080 | |
| | 2,290,000 | | | Telecom Italia Capital S.A.,
6.000%, 9/30/2034 | | | 2,267,673 | |
| | 1,395,000 | | | Telecom Italia Capital S.A.,
6.375%, 11/15/2033 | | | 1,419,413 | |
| | 600,000 | | | Telecom Italia SpA, EMTN,
5.250%, 3/17/2055, (EUR) | | | 693,533 | |
| | 450,000 | | | Telefonica Emisiones SAU,
4.570%, 4/27/2023 | | | 500,463 | |
| | 300,000 | | | Telefonica Emisiones SAU, EMTN,
5.289%, 12/09/2022, (GBP) | | | 473,304 | |
| | 1,000,000 | | | Telefonica Emisiones SAU, EMTN,
5.375%, 2/02/2026, (GBP) | | | 1,660,380 | |
See accompanying notes to financial statements.
| 24
Portfolio of Investments – as of September 30, 2016
Loomis Sayles Fixed Income Fund – continued
| | | | | | | | |
Principal
Amount (‡) | | | Description | | Value (†) | |
|
| | Bonds and Notes – continued | |
| | |
| | | | Wirelines – continued | | | | |
| | 800,000 | | | Telefonica Emisiones SAU, EMTN,
5.445%, 10/08/2029, (GBP) | | $ | 1,397,799 | |
| | | | | | | | |
| | | | | | | 31,042,671 | |
| | | | | | | | |
| |
| | | | Total Non-Convertible Bonds | |
| | | | (Identified Cost $935,716,466) | | | 933,554,539 | |
| | | | | | | | |
| |
| | Convertible Bonds – 7.4% | | | | |
| | |
| | | | Building Materials – 0.4% | | | | |
| | 5,140,000 | | | KB Home, 1.375%, 2/01/2019 | | | 4,998,650 | |
| | | | | | | | |
| | | | Chemicals – 0.0% | | | | |
| | 332,000 | | | RPM International, Inc.,
2.250%, 12/15/2020 | | | 397,777 | |
| | | | | | | | |
| | | | Consumer Products – 0.0% | | | | |
| | 270,000 | | | Iconix Brand Group, Inc.,
1.500%, 3/15/2018 | | | 232,875 | |
| | | | | | | | |
| | | | Diversified Manufacturing – 0.1% | |
| | 510,000 | | | Trinity Industries, Inc., 3.875%, 6/01/2036 | | | 609,450 | |
| | | | | | | | |
| | | | Finance Companies – 0.3% | | | | |
| | 2,840,000 | | | Euronet Worldwide, Inc.,
1.500%, 10/01/2044 | | | 3,574,850 | |
| | | | | | | | |
| | | | Healthcare – 0.0% | | | | |
| | 210,000 | | | Hologic, Inc., (accretes to principal after 3/01/2018),
2.000%, 3/01/2042(j) | | | 286,125 | |
| | | | | | | | |
| | | | Leisure – 0.2% | | | | |
| | 2,800,000 | | | Rovi Corp., 0.500%, 3/01/2020 | | | 2,790,284 | |
| | | | | | | | |
| | | | Midstream – 0.2% | | | | |
| | 1,565,000 | | | Chesapeake Energy Corp.,
2.250%, 12/15/2038 | | | 1,457,406 | |
| | 463,000 | | | Chesapeake Energy Corp.,
2.500%, 5/15/2037 | | | 460,106 | |
| | | | | | | | |
| | | | | | | 1,917,512 | |
| | | | | | | | |
| | | | Pharmaceuticals – 0.1% | | | | |
| | 205,000 | | | BioMarin Pharmaceutical, Inc.,
0.750%, 10/15/2018 | | | 245,872 | |
| | 285,000 | | | BioMarin Pharmaceutical, Inc.,
1.500%, 10/15/2020 | | | 355,359 | |
| | | | | | | | |
| | | | | | | 601,231 | |
| | | | | | | | |
| | | | Property & Casualty Insurance – 1.9% | |
| | 550,000 | | | Jefferies Group LLC, 3.875%, 11/01/2029 | | | 557,563 | |
| | 18,045,000 | | | Old Republic International Corp.,
3.750%, 3/15/2018 | | | 21,665,278 | |
| | | | | | | | |
| | | | | | | 22,222,841 | |
| | | | | | | | |
| | | | Technology – 4.2% | | | | |
| | 535,000 | | | Brocade Communications Systems, Inc., 1.375%, 1/01/2020 | | | 527,978 | |
| | 9,090,000 | | | Ciena Corp., 0.875%, 6/15/2017 | | | 9,038,869 | |
| | 3,455,000 | | | Ciena Corp.,
3.750%, 10/15/2018, 144A | | | 4,370,575 | |
| | |
| | | | Technology – continued | | | | |
| 7,000,000 | | | Intel Corp., 3.250%, 8/01/2039 | | | 12,801,250 | |
| | 309,313 | | | Liberty Interactive LLC, 3.500%, 1/15/2031 | | | 287,719 | |
| | 9,900,000 | | | Micron Technology, Inc., Series G,
3.000%, 11/15/2043 | | | 8,798,625 | |
| | 9,404,000 | | | Nuance Communications, Inc.,
1.500%, 11/01/2035 | | | 8,822,128 | |
| | 4,095,000 | | | Priceline Group, Inc. (The),
0.900%, 9/15/2021 | | | 4,397,006 | |
| | 2,020,000 | | | Viavi Solutions, Inc., 0.625%, 8/15/2033 | | | 2,009,900 | |
| | | | | | | | |
| | | | | | | 51,054,050 | |
| | | | | | | | |
| | |
| | | | Total Convertible Bonds | | | | |
| | | | (Identified Cost $75,049,209) | | | 88,685,645 | |
| | | | | | | | |
| |
| | Municipals – 0.6% | | | | |
| | |
| | | | Michigan – 0.2% | | | | |
| | 2,135,000 | | | Michigan Tobacco Settlement Finance Authority Taxable Turbo, Series A, 7.309%, 6/01/2034 | | | 2,095,140 | |
| | | | | | | | |
| | | | Virginia – 0.4% | | | | |
| | 5,825,000 | | | Virginia Tobacco Settlement Financing Corp., Series A-1,
6.706%, 6/01/2046 | | | 5,002,976 | |
| | | | | | | | |
| | | | Total Municipals | | | | |
| | | | (Identified Cost $7,941,923) | | | 7,098,116 | |
| | | | | | | | |
| | |
| | | | Total Bonds and Notes | | | | |
| | | | (Identified Cost $1,018,707,598) | | | 1,029,338,300 | |
| | | | | | | | |
| |
| | Senior Loans – 0.6% | | | | |
| | |
| | | | Chemicals – 0.1% | | | | |
| | 1,042,689 | | | Emerald Performance Materials LLC, New 1st Lien Term Loan,
4.500%, 8/01/2021(g) | | | 1,048,559 | |
| | 463,910 | | | Emerald Performance Materials LLC, New 2nd Lien Term Loan,
7.750%, 8/01/2022(g) | | | 462,750 | |
| | | | | | | | |
| | | | | | | 1,511,309 | |
| | | | | | | | |
| | | | Media Entertainment – 0.0% | |
| | 43,685 | | | Dex Media, Inc., Term Loan,
11.000%, 7/29/2021(g) | | | 41,610 | |
| | | | | | | | |
| | | | Other Utility – 0.2% | | | | |
| | 1,188,151 | | | PowerTeam Services LLC, 1st Lien Term Loan,
4.250%, 5/06/2020(g) | | | 1,183,695 | |
| | 790,000 | | | PowerTeam Services LLC, 2nd Lien Term Loan,
8.250%, 11/06/2020(g) | | | 786,050 | |
| | | | | | | | |
| | | | | | | 1,969,745 | |
| | | | | | | | |
| | | | Supermarkets – 0.2% | | | | |
| | 2,511,735 | | | Supervalu, Inc., Refi Term Loan B,
5.500%, 3/21/2019(g) | | | 2,514,297 | |
| | | | | | | | |
See accompanying notes to financial statements.
25 |
Portfolio of Investments – as of September 30, 2016
Loomis Sayles Fixed Income Fund – continued
| | | | | | | | |
Principal
Amount (‡) | | | Description | | Value (†) | |
|
| | Senior Loans – continued | |
| | |
| | | | Wirelines – 0.1% | | | | |
| $ | 1,163,162 | | | Integra Telecom, Inc., 2nd Lien Term Loan, 9.750%, 2/12/2021(c)(e)(g) | | $ | 1,099,188 | |
| | | | | | | | |
| | |
| | | | Total Senior Loans | | | | |
| | | | (Identified Cost $7,242,223) | | | 7,136,149 | |
| | | | | | | | |
| | |
| | Shares | | | | | | | |
| |
| | Common Stocks – 7.3% | | | | |
| | |
| | | | Automobiles – 0.3% | | | | |
| | 341,305 | | | Ford Motor Co. | | | 4,119,551 | |
| | | | | | | | |
| | | | Chemicals – 0.1% | | | | |
| | 8,917 | | | PPG Industries, Inc. | | | 921,661 | |
| | | | | | | | |
| | | | Containers & Packaging – 0.1% | | | | |
| | 35,353 | | | Owens-Illinois, Inc.(d) | | | 650,142 | |
| | | | | | | | |
| | | | Diversified Telecommunication Services – 0.2% | |
| | 7,475 | | | Hawaiian Telcom Holdco, Inc.(d) | | | 167,365 | |
| | 17,222 | | | Level 3 Communications, Inc.(d) | | | 798,757 | |
| | 159,649 | | | Telefonica S.A., Sponsored ADR | | | 1,609,262 | |
| | | | | | | | |
| | | | | | | 2,575,384 | |
| | | | | | | | |
| | | | Electronic Equipment, Instruments & Components – 0.4% | |
| | 205,167 | | | Corning, Inc. | | | 4,852,200 | |
| | | | | | | | |
| | | | Energy Equipment & Services – 0.0% | |
| | 170,674 | | | Hercules Offshore, Inc.(d) | | | 295,266 | |
| | | | | | | | |
| | | | Household Durables – 0.1% | | | | |
| | 29,797 | | | Newell Brands, Inc. | | | 1,569,110 | |
| | | | | | | | |
| | | | Internet Software & Services – 0.0% | |
| | 6,787 | | | Dex Media, Inc.(b)(d) | | | 13,493 | |
| | | | | | | | |
| | | | Metals & Mining – 0.2% | | | | |
| | 359,067 | | | ArcelorMittal, (Registered)(d) | | | 2,168,765 | |
| | | | | | | | |
| | | | Multi-Utilities – 0.1% | | | | |
| | 20,449 | | | CMS Energy Corp. | | | 859,062 | |
| | | | | | | | |
| | | | Oil, Gas & Consumable Fuels – 0.6% | |
| | 54,259 | | | Chesapeake Energy Corp.(d) | | | 340,204 | |
| | 43,209 | | | Halcon Resources Corp.(d) | | | 405,300 | |
| | 172,008 | | | Repsol YPF S.A., Sponsored ADR | | | 2,347,909 | |
| | 70,051 | | | Royal Dutch Shell PLC, Sponsored ADR | | | 3,507,454 | |
| | | | | | | | |
| | | | | | | 6,600,867 | |
| | | | | | | | |
| | | | Pharmaceuticals – 0.7% | | | | |
| | 160,000 | | | Bristol-Myers Squibb Co. | | | 8,627,200 | |
| | | | | | | | |
| | | | REITs – Diversified – 0.2% | | | | |
| | 88,343 | | | Weyerhaeuser Co. | | | 2,821,675 | |
| | | | | | | | |
| | | | Semiconductors & Semiconductor Equipment – 4.1% | | | | |
| | 1,317,153 | | | Intel Corp. | | | 49,722,526 | |
| | | | | | | | |
| |
| | | | Trading Companies & Distributors – 0.2% | |
| | 23,272 | | | United Rentals, Inc.(d) | | $ | 1,826,619 | |
| | | | | | | | |
| | |
| | | | Total Common Stocks | | | | |
| | | | (Identified Cost $77,208,594) | | | 87,623,521 | |
| | | | | | | | |
| |
| | Preferred Stocks – 1.4% | | | | |
| |
| | Convertible Preferred Stocks – 1.3% | | | | |
| | |
| | | | Banking – 0.3% | | | | |
| | 2,844 | | | Bank of America Corp., Series L, 7.250% | | | 3,472,069 | |
| | | | | | | | |
| | | | Communications – 0.0% | | | | |
| | 2,083 | | | Cincinnati Bell, Inc., 6.750% | | | 104,483 | |
| | | | | | | | |
| | | | Electric – 0.2% | | | | |
| | 50,764 | | | AES Trust III, 6.750% | | | 2,588,964 | |
| | | | | | | | |
| | | | Energy – 0.4% | | | | |
| | 96,065 | | | El Paso Energy Capital Trust I, 4.750% | | | 4,803,250 | |
| | | | | | | | |
| | | | Metals & Mining – 0.2% | | | | |
| | 68,395 | | | Alcoa, Inc., Series 1, 5.375% | | | 2,235,833 | |
| | | | | | | | |
| | | | Midstream – 0.1% | | | | |
| | 10,213 | | | Chesapeake Energy Corp., 4.500%(d) | | | 464,487 | |
| | 12,055 | | | Chesapeake Energy Corp., 5.000%(d) | | | 516,858 | |
| | 660 | | | Chesapeake Energy Corp., Series A,
5.750%, 144A(d) | | | 343,613 | |
| | | | | | | | |
| | | | | | | 1,324,958 | |
| | | | | | | | |
| | | | REITs – Diversified – 0.0% | | | | |
| | 1,667 | | | Crown Castle International Corp., Series A, 4.500% | | | 188,404 | |
| | | | | | | | |
| | | | REITs – Health Care – 0.1% | | | | |
| | 7,400 | | | Welltower, Inc., 6.500% | | | 492,470 | |
| | | | | | | | |
| | | | REITs – Mortgage – 0.0% | | | | |
| | 3,106 | | | iStar, Inc., Series J, 4.500% | | | 151,977 | |
| | | | | | | | |
| | |
| | | | Total Convertible Preferred Stocks | | | | |
| | | | (Identified Cost $15,000,441) | | | 15,362,408 | |
| | | | | | | | |
| |
| | Non-Convertible Preferred Stocks – 0.1% | | | | |
| | |
| | | | Electric – 0.0% | | | | |
| | 90 | | | Entergy New Orleans, Inc., 4.360% | | | 9,354 | |
| | 2,876 | | | Entergy New Orleans, Inc., 4.750% | | | 294,161 | |
| | 4,670 | | | Union Electric Co., 4.500% | | | 472,137 | |
| | | | | | | | |
| | | | | | | 775,652 | |
| | | | | | | | |
| | | | Finance Companies – 0.1% | | | | |
| | 25,100 | | | SLM Corp., Series A, 6.970% | | | 1,290,391 | |
| | | | | | | | |
| | |
| | | | Total Non-Convertible Preferred Stocks | | | | |
| | | | (Identified Cost $1,514,082) | | | 2,066,043 | |
| | | | | | | | |
| | |
| | | | Total Preferred Stocks | | | | |
| | | | (Identified Cost $16,514,523) | | | 17,428,451 | |
| | | | | | | | |
See accompanying notes to financial statements.
| 26
Portfolio of Investments – as of September 30, 2016
Loomis Sayles Fixed Income Fund – continued
| | | | | | | | |
Shares | | | Description | | Value (†) | |
| |
| | Warrants – 0.0% | | | | |
| | 11,737 | | | Halcon Resources Corp.,
Expiration on 9/9/2020 at $14.04(b)(d) (Identified Cost $0) | | $ | 17,909 | |
| | | | | | | | |
| | |
| Principal
Amount (‡) |
| | | | | | |
| |
| | Short-Term Investments – 3.5% | | | | |
| $ | 41,480,034 | | | Tri-Party Repurchase Agreement with Fixed Income Clearing Corporation, dated 9/30/2016 at 0.030% to be repurchased at $41,480,138 on 10/03/2016 collateralized by $41,840,000 U.S. Treasury Note, 1.500% due 3/31/2023 valued at $42,310,700 including accrued interest (Note 2 of Notes to Financial Statements) (Identified Cost $41,480,034) | | | 41,480,034 | |
| | | | | | | | |
| | |
| | | | Total Investments – 98.5% | | | | |
| | | | (Identified Cost $1,161,152,972)(a) | | | 1,183,024,364 | |
| | | | Other assets less liabilities—1.5% | | | 18,484,341 | |
| | | | | | | | |
| | |
| | | | Net Assets – 100.0% | | $ | 1,201,508,705 | |
| | | | | | | | |
| |
| | (‡) | | | Principal Amount stated in U.S. dollars unless otherwise noted. | |
| | (†) | | | See Note 2 of Notes to Financial Statements. | |
| | (††) | | | Amount shown represents units. One unit represents a principal amount of 25. | |
| | (†††) | | | Amount shown represents units. One unit represents a principal amount of 100. | |
| | (a) | | | Federal Tax Information: | |
| | | | At September 30, 2016, the net unrealized appreciation on investments based on a cost of $1,170,412,238 for federal income tax purposes was as follows: | |
| | | | Aggregate gross unrealized appreciation for all investments in which there is an excess of value over tax cost | | $ | 107,780,339 | |
| | | | Aggregate gross unrealized depreciation for all investments in which there is an excess of tax cost over value | | | (95,168,213 | ) |
| | | | | | | | |
| | | | Net unrealized appreciation | | $ | 12,612,126 | |
| | | | | | | | |
| | (b) | | | Fair valued by the Fund’s adviser. At September 30, 2016, the value of these securities amounted to $3,590,940 or 0.3% of net assets. See Note 2 of Notes to Financial Statements. | |
| | (c) | | | Illiquid security. (Unaudited) | |
| | (d) | | | Non-income producing security. | |
| | (e) | | | Securities classified as fair valued pursuant to the Fund’s pricing policies and procedures. At September 30, 2016, the value of these securities amounted to $20,402,403 or 1.7% of net assets. See Note 2 of Notes to Financial Statements. | |
| | (f) | | | Perpetual bond with no specified maturity date. | |
| | (g) | | | Variable rate security. Rate as of September 30, 2016 is disclosed. | |
| | (h) | | | The issuer is in default with respect to interest and/or principal payments. Income is not being accrued. | |
| | (i) | | | Payment-in-kind security for which the issuer has the option at each interest payment date of making interest payments in cash or additional debt securities. | |
| | (j) | | | Coupon rate is a fixed rate for an initial period then resets at a specified date and rate. | |
| | 144A | | | All or a portion of these securities are exempt from registration under Rule 144A of the Securities Act of 1933. These securities may be resold in transactions exempt from registration, normally to qualified institutional buyers. At September 30, 2016, the value of Rule 144A holdings amounted to $223,894,332 or 18.6% of net assets. | |
| | ABS | | | Asset-Backed Securities | |
| | ADR | | | An American Depositary Receipt is a certificate issued by a custodian bank representing the right to receive securities of the foreign issuer described. The values of ADRs may be significantly influenced by trading on exchanges not located in the United States. | |
| | EMTN | | | Euro Medium Term Note | | | | |
| | GMTN | | | Global Medium Term Note | | | | |
| | MTN | | | Medium Term Note | | | | |
| | PIK | | | Payment-in-Kind | | | | |
| | REITs | | | Real Estate Investment Trusts | | | | |
| | |
| | AUD | | | Australian Dollar | | | | |
| | BRL | | | Brazilian Real | | | | |
| | CAD | | | Canadian Dollar | | | | |
| | EUR | | | Euro | | | | |
| | GBP | | | British Pound | | | | |
| | ISK | | | Icelandic Krona | | | | |
| | MXN | | | Mexican Peso | | | | |
| | NOK | | | Norwegian Krone | | | | |
| | NZD | | | New Zealand Dollar | | | | |
Industry Summary at September 30, 2016
| | | | |
Treasuries | | | 14.9 | % |
Banking | | | 11.7 | |
Technology | | | 5.7 | |
Finance Companies | | | 5.0 | |
Semiconductors & Semiconductor Equipment | | | 4.1 | |
Electric | | | 3.8 | |
Airlines | | | 3.7 | |
Automotive | | | 3.4 | |
Healthcare | | | 2.7 | |
Wirelines | | | 2.7 | |
Property & Casualty Insurance | | | 2.7 | |
Chemicals | | | 2.6 | |
Local Authorities | | | 2.3 | |
Midstream | | | 2.3 | |
Aerospace & Defense | | | 2.3 | |
Metals & Mining | | | 2.1 | |
Other Investments, less than 2% each | | | 23.0 | |
Short-Term Investments | | | 3.5 | |
| | | | |
Total Investments | | | 98.5 | |
Other assets less liabilities | | | 1.5 | |
| | | | |
Net Assets | | | 100.0 | % |
| | | | |
See accompanying notes to financial statements.
27 |
Portfolio of Investments – as of September 30, 2016
Loomis Sayles Global Bond Fund
| | | | | | | | |
Principal
Amount (‡) | | | Description | | Value (†) | |
|
| | Bonds and Notes – 95.3% of Net Assets | |
| | |
| | | | Australia – 3.5% | | | | |
| $ | 4,695,000 | | | Asciano Finance Ltd.,
4.625%, 9/23/2020, 144A(b) | | $ | 4,934,623 | |
| | 17,780,000 | | | Australia Government International Bond, Series 142, 4.250%, 4/21/2026, (AUD)(b) | | | 16,372,152 | |
| | 25,475,000 | | | Queensland Treasury Corp.,
Series 23, 4.250%, 7/21/2023,
144A, (AUD)(b) | | | 22,049,249 | |
| | | | | | | | |
| | | | | | | 43,356,024 | |
| | | | | | | | |
| | | | Barbados – 0.3% | | | | |
| | 987,500 | | | Global SC Finance II S.r.l., Series 2013-1A, Class A,
2.980%, 4/17/2028, 144A(b) | | | 955,562 | |
| | 2,859,167 | | | Global SC Finance II S.r.l., Series 2014-1A, Class A1,
3.190%, 7/17/2029, 144A(b) | | | 2,774,458 | |
| | | | | | | | |
| | | | | | | 3,730,020 | |
| | | | | | | | |
| | | | Belgium – 0.9% | | | | |
| | 2,530,000 | | | Anheuser-Busch InBev Finance, Inc.,
3.650%, 2/01/2026(b) | | | 2,717,220 | |
| | 470,000 | | | Anheuser-Busch InBev Finance, Inc.,
4.700%, 2/01/2036(b) | | | 540,393 | |
| | 3,720,000 | | | Anheuser-Busch InBev Finance, Inc.,
4.900%, 2/01/2046(b) | | | 4,425,986 | |
| | 2,150,000 | | | Solvay Finance (America) LLC,
3.400%, 12/03/2020, 144A(b) | | | 2,250,147 | |
| | 1,120,000 | | | Solvay Finance (America) LLC,
4.450%, 12/03/2025, 144A(b) | | | 1,220,894 | |
| | | | | | | | |
| | | | | | | 11,154,640 | |
| | | | | | | | |
| | | | Bermuda – 0.6% | | | | |
| | 1,720,000 | | | Cronos Containers Program I Ltd.,
3.270%, 11/18/2029, 144A(b) | | | 1,672,502 | |
| | 5,285,000 | | | Global Container Assets Ltd.,
Series 2013-1A, Class A2,
3.300%, 11/05/2028, 144A | | | 5,237,654 | |
| | | | | | | | |
| | | | | | | 6,910,156 | |
| | | | | | | | |
| | | | Brazil – 0.8% | | | | |
| | 4,775,000 | | | Embraer Netherlands Finance BV,
5.050%, 6/15/2025(b) | | | 4,798,875 | |
| | 1,275,000 | | | Petrobras Global Finance BV,
4.375%, 5/20/2023 | | | 1,140,487 | |
| | 1,910,000 | | | Petrobras Global Finance BV, EMTN, 6.250%, 12/14/2026, (GBP) | | | 2,298,018 | |
| | 7,000,000 | | | Republic of Brazil,
8.500%, 1/05/2024, (BRL) | | | 1,988,300 | |
| | | | | | | | |
| | | | | | | 10,225,680 | |
| | | | | | | | |
| | | | Canada – 2.3% | | | | |
| | 1,985,000 | | | Alimentation Couche-Tard, Inc.,
1.875%, 5/06/2026, (EUR)(b) | | | 2,389,053 | |
| | 7,610,000 | | | Canadian Government,
1.250%, 9/01/2018, (CAD)(b) | | | 5,882,371 | |
| | 4,399,000 | | | Canadian Government,
4.000%, 6/01/2041, (CAD)(b) | | | 4,937,563 | |
| | | | Canada – continued | | | | |
| | 3,379,103 | | | Institutional Mortgage Securities Canada, Inc., Series 2014-5A, Class A1,
2.003%, 7/12/2047, 144A, (CAD)(b) | | $ | 2,555,286 | |
| | 7,400,000 | | | Province of British Columbia,
4.300%, 6/18/2042, (CAD)(b) | | | 7,463,793 | |
| | 3,210,000 | | | Province of Manitoba Canada, MTN,
4.400%, 9/05/2025, (CAD)(b) | | | 2,941,397 | |
| | 2,610,000 | | | Province of Ontario Canada,
1.950%, 1/27/2023, (CAD)(b) | | | 2,047,894 | |
| | | | | | | | |
| | | | | | | 28,217,357 | |
| | | | | | | | |
| | | | Cayman Islands – 0.1% | | | | |
| | 1,418,961 | | | Resource Capital Corp. Ltd.,
Series 2014-CRE2, Class A,
1.580%, 4/15/2032, 144A(b)(c) | | | 1,403,621 | |
| | | | | | | | |
| | | | Chile – 0.6% | | | | |
| | 5,420,000 | | | CODELCO, Inc.,
4.500%, 9/16/2025, 144A(b) | | | 5,715,558 | |
| | 1,375,000 | | | Itau CorpBanca, 3.875%, 9/22/2019, 144A(b) | | | 1,435,156 | |
| | | | | | | | |
| | | | | | | 7,150,714 | |
| | | | | | | | |
| | | | Colombia – 0.3% | | | | |
| | 3,910,000 | | | Colombia Government International Bond, 5.000%, 6/15/2045(b) | | | 4,232,575 | |
| | | | | | | | |
| | | | Denmark – 1.0% | | | | |
| | 71,250,000 | | | Denmark Government Bond,
1.750%, 11/15/2025, (DKK)(b) | | | 12,465,896 | |
| | | | | | | | |
| | | | Finland – 0.3% | | | | |
| | 3,010,000 | | | Finland Government Bond,
1.500%, 4/15/2023, 144A, (EUR)(b) | | | 3,793,014 | |
| | | | | | | | |
| | | | France – 2.2% | | | | |
| | 1,490,000 | | | AXA S.A., 7.125%, 12/15/2020, (GBP)(b) | | | 2,368,191 | |
| | 2,600,000 | | | AXA S.A., EMTN, (fixed rate to 1/16/2034, variable rate thereafter), 5.625%, 1/16/2054, (GBP)(b) | | | 3,741,112 | |
| | 635,000 | | | BNP Paribas S.A.,
4.375%, 9/28/2025, 144A(b) | | | 650,267 | |
| | 4,585,000 | | | BNP Paribas S.A.,
4.375%, 5/12/2026, 144A(b) | | | 4,739,331 | |
| | 885,000 | | | BNP Paribas S.A., (fixed rate to 10/14/2022, variable rate thereafter),
2.625%, 10/14/2027, (EUR)(b) | | | 1,030,580 | |
| | 2,860,000 | | | BNP Paribas S.A., EMTN,
5.750%, 1/24/2022, (GBP)(b) | | | 4,366,846 | |
| | 4,125,000 | | | France Government Bond OAT,
3.000%, 4/25/2022, (EUR)(b) | | | 5,521,211 | |
| | 3,324,000 | | | Pernod Ricard S.A.,
4.450%, 1/15/2022, 144A(b) | | | 3,666,352 | |
| | 200,000 | | | Veolia Environnement S.A., (fixed rate to 4/16/2018, variable rate thereafter), 4.850% , (GBP)(d) | | | 267,346 | |
| | | | | | | | |
| | | | | | | 26,351,236 | |
| | | | | | | | |
See accompanying notes to financial statements.
| 28
Portfolio of Investments – as of September 30, 2016
Loomis Sayles Global Bond Fund – continued
| | | | | | | | |
Principal
Amount (‡) | | | Description | | Value (†) | |
|
| | Bonds and Notes – continued | |
| | |
| | | | Germany – 3.4% | | | | |
| | 6,500,000 | | | Allianz Finance II BV, EMTN, (fixed rate to 7/08/2021, variable rate thereafter),
5.750%, 7/08/2041, (EUR)(b) | | $ | 8,485,067 | |
| | 13,425,000 | | | Bundesrepublik Deutschland,
1.000%, 8/15/2025, (EUR)(b) | | | 16,800,542 | |
| | 1,215,000 | | | Bundesrepublik Deutschland,
4.250%, 7/04/2039, (EUR)(b) | | | 2,547,515 | |
| | 800,000 | | | Muenchener Rueckversicherungs AG, EMTN, (fixed rate to 5/26/2021, variable rate thereafter), 6.000%, 5/26/2041, (EUR)(b) | | | 1,071,079 | |
| | 1,110,000 | | | Schaeffler Finance BV,
2.500%, 5/15/2020, 144A, (EUR) | | | 1,271,856 | |
| | 1,770,000 | | | Schaeffler Finance BV,
3.250%, 5/15/2025, (EUR) | | | 2,148,389 | |
| | 4,797,000 | | | Unitymedia GmbH,
3.750%, 1/15/2027, (EUR) | | | 5,152,951 | |
| | 800,000 | | | Vonovia Finance BV, EMTN,
1.500%, 6/10/2026, (EUR) | | | 946,072 | |
| | 2,400,000 | | | ZF North America Capital, Inc.,
2.750%, 4/27/2023, (EUR) | | | 2,868,585 | |
| | | | | | | | |
| | | | | | | 41,292,056 | |
| | | | | | | | |
| | | | Hong Kong – 0.6% | | | | |
| | 3,450,000 | | | AIA Group Ltd.,
3.200%, 3/11/2025, 144A(b) | | | 3,520,777 | |
| | 3,285,000 | | | CK Hutchison International 16 Ltd.,
1.875%, 10/03/2021, 144A | | | 3,256,190 | |
| | | | | | | | |
| | | | | | | 6,776,967 | |
| | | | | | | | |
| | | | Indonesia – 1.0% | | | | |
| | 160,921,000,000 | | | Indonesia Treasury Bond,
7.875%, 4/15/2019, (IDR)(b) | | | 12,724,732 | |
| | | | | | | | |
| | | | Ireland – 1.9% | | | | |
| | 3,625,000 | | | AIB Mortgage Bank, EMTN,
4.875%, 6/29/2017, (EUR)(b) | | | 4,223,063 | |
| | 6,285,000 | | | Bank of Ireland Mortgage Bank, 1.875%, 5/13/2017, (EUR)(b) | | | 7,147,841 | |
| | 8,995,000 | | | Ireland Government Bond,
2.000%, 2/18/2045, (EUR)(b) | | | 12,156,353 | |
| | | | | | | | |
| | | | | | | 23,527,257 | |
| | | | | | | | |
| | | | Israel – 0.3% | | | | |
| | 3,215,000 | | | Teva Pharmaceutical Finance Netherlands III BV,
2.800%, 7/21/2023(b) | | | 3,223,250 | |
| | | | | | | | |
| | | | Italy – 5.1% | | | | |
| | 3,018,775 | | | Asti RMBS S.r.l., Series 1, Class A, 0.948%, 12/27/2060, (EUR)(b)(c) | | | 3,439,449 | |
| | |
| | | | Italy – continued | | | | |
| | 1,058,330 | | | Berica ABS S.r.l., Series 3, Class A, 0.748%, 6/30/2061, (EUR)(b)(c) | | $ | 1,205,275 | |
| | 1,100,886 | | | Berica Residential S.r.l., Series 8, Class A, 0.066%, 3/31/2048, (EUR)(b)(c) | | | 1,225,359 | |
| | 1,210,000 | | | Buzzi Unicem SpA,
2.125%, 4/28/2023, (EUR) | | | 1,378,704 | |
| | 1,424,039 | | | Claris Finance S.r.l., Series 2014-1, Class A1, 0.847%, 12/28/2061, (EUR)(b)(c) | | | 1,615,986 | |
| | 3,200,000 | | | Enel Finance International NV,
6.000%, 10/07/2039, 144A(b) | | | 3,869,798 | |
| | 1,660,000 | | | Enel SpA, EMTN,
5.750%, 6/22/2037, (GBP)(b) | | | 2,999,815 | |
| | 650,000 | | | Intesa Sanpaolo SpA,
5.017%, 6/26/2024, 144A | | | 593,168 | |
| | 1,645,000 | | | Intesa Sanpaolo SpA,
5.710%, 1/15/2026, 144A(b) | | | 1,550,036 | |
| | 870,000 | | | Intesa Sanpaolo SpA, EMTN,
3.928%, 9/15/2026, (EUR) | | | 985,144 | |
| | 4,800,000 | | | Italy Buoni Poliennali Del Tesoro, 1.250%, 12/01/2026, (EUR)(b) | | | 5,387,036 | |
| | 6,910,000 | | | Italy Buoni Poliennali Del Tesoro, 3.750%, 5/01/2021, (EUR)(b) | | | 8,998,148 | |
| | 6,585,000 | | | Italy Buoni Poliennali Del Tesoro, 5.000%, 3/01/2022, (EUR)(b) | | | 9,209,287 | |
| | 2,000,000 | | | Meccanica Holdings USA, Inc.,
7.375%, 7/15/2039, 144A | | | 2,190,000 | |
| | 4,751,000 | | | Republic of Italy,
6.875%, 9/27/2023(b) | | | 5,941,145 | |
| | 5,486,862 | | | Siviglia SPV S.r.l., Series 2012-1, Class A, 0.203%, 10/25/2055, (EUR)(b)(c) | | | 6,087,986 | |
| | 1,280,000 | | | Telecom Italia Capital S.A.,
6.000%, 9/30/2034 | | | 1,267,520 | |
| | 1,532,352 | | | Vela Home S.r.l., Series 4, Class A2, 0.044%, 10/25/2042, (EUR)(b)(c) | | | 1,707,171 | |
| | 1,838,496 | | | Voba N 3 S.r.l., Series 2011-3, Class A2, 0.702%, 11/23/2047, (EUR)(b)(c) | | | 2,083,720 | |
| | | | | | | | |
| | | | | | | 61,734,747 | |
| | | | | | | | |
| | | | Japan – 12.6% | | | | |
| | 423,074,000 | | | Japan Government CPI Linked Bond, Series 19,
0.100%, 9/10/2024, (JPY)(b) | | | 4,378,465 | |
| | 2,246,839,200 | | | Japan Government CPI Linked Bond, Series 20,
0.100%, 3/10/2025, (JPY)(b) | | | 23,286,171 | |
| | 448,992,693 | | | Japan Government CPI Linked Bond, Series 21,
0.100%, 3/10/2026, (JPY)(b) | | | 4,669,703 | |
| | 917,500,000 | | | Japan Government Ten Year Bond, 1.200%, 12/20/2020, (JPY)(b) | | | 9,606,946 | |
| | 2,549,800,000 | | | Japan Government Ten Year Bond, 1.300%, 3/20/2019, (JPY)(b) | | | 26,126,367 | |
See accompanying notes to financial statements.
29 |
Portfolio of Investments – as of September 30, 2016
Loomis Sayles Global Bond Fund – continued
| | | | | | | | |
Principal
Amount (‡) | | | Description | | Value (†) | |
|
| | Bonds and Notes – continued | |
| | |
| | | | Japan – continued | | | | |
| | 163,600,000 | | | Japan Government Ten Year Bond, 1.300%, 12/20/2019, (JPY)(b) | | $ | 1,695,145 | |
| | 575,000,000 | | | Japan Government Ten Year Bond, 1.300%, 3/20/2021, (JPY)(b) | | | 6,064,590 | |
| | 572,450,000 | | | Japan Government Thirty Year Bond, 1.700%, 12/20/2043, (JPY) | | | 7,471,628 | |
| | 1,688,950,000 | | | Japan Government Thirty Year Bond, 2.000%, 12/20/2033, (JPY)(b) | | | 21,661,298 | |
| | 1,083,100,000 | | | Japan Government Thirty Year Bond, Series 26,
2.400%, 3/20/2037, (JPY)(b) | | | 14,929,167 | |
| | 715,100,000 | | | Japan Government Twenty Year Bond, 1.500%, 6/20/2034, (JPY)(b) | | | 8,568,507 | |
| | 489,000,000 | | | Japan Government Twenty Year Bond, 2.100%, 12/20/2027, (JPY)(b) | | | 5,975,584 | |
| | 1,545,300,000 | | | Japan Government Twenty Year Bond, 2.100%, 12/20/2030, (JPY)(b) | | | 19,566,739 | |
| | | | | | | | |
| | | | | | | 154,000,310 | |
| | | | | | | | |
| | | | Korea – 0.6% | | | | |
| | 56,100,000 | | | Export-Import Bank of Korea,
3.000%, 5/22/2018, 144A, (NOK)(b) | | | 7,157,188 | |
| | | | | | | | |
| | | | Malaysia – 0.3% | | | | |
| | 16,625,000 | | | Malaysia Government Bond,
3.795%, 9/30/2022, (MYR)(b) | | | 4,092,391 | |
| | | | | | | | |
| | | | Mexico – 3.5% | | | | |
| | 1,835,000 | | | Cemex SAB de CV,
7.750%, 4/16/2026, 144A | | | 2,035,932 | |
| | 5,518,821(††) | | | Mexican Fixed Rate Bonds, Series M, 6.500%, 6/10/2021, (MXN)(b) | | | 29,323,733 | |
| | 933,492(††) | | | Mexican Fixed Rate Bonds,
Series M-20,
8.000%, 12/07/2023, (MXN)(b) | | | 5,412,417 | |
| | 2,080,000 | | | Mexichem SAB de CV,
5.875%, 9/17/2044, 144A(b) | | | 1,989,000 | |
| | 4,430,000 | | | Sigma Alimentos S.A. de CV,
4.125%, 5/02/2026, 144A(b) | | | 4,441,075 | |
| | | | | | | | |
| | | | | | | 43,202,157 | |
| | | | | | | | |
| | | | Morocco – 0.3% | | | | |
| | 2,475,000 | | | OCP S.A.,
4.500%, 10/22/2025, 144A | | | 2,508,214 | |
| | 1,015,000 | | | OCP S.A.,
6.875%, 4/25/2044, 144A | | | 1,149,912 | |
| | | | | | | | |
| | | | | | | 3,658,126 | |
| | | | | | | | |
| | | | Netherlands – 1.4% | | | | |
| | 5,960,000 | | | ABN Amro Bank NV,
4.750%, 7/28/2025, 144A(b) | | | 6,266,404 | |
| | |
| | | | Netherlands – continued | | | | |
| $ | 3,275,000 | | | AerCap Ireland Capital Ltd./AerCap Global Aviation Trust,
3.950%, 2/01/2022 | | $ | 3,356,875 | |
| | 3,717,000 | | | ING Bank NV, EMTN, (fixed rate to 2/25/2021, variable rate thereafter), 3.625%, 2/25/2026, (EUR)(b) | | | 4,543,517 | |
| | 3,295,000 | | | Ziggo Bond Finance BV,
6.000%, 1/15/2027, 144A | | | 3,278,525 | |
| | | | | | | | |
| | | | | | | 17,445,321 | |
| | | | | | | | |
| | | | Norway – 1.4% | | | | |
| | 130,265,000 | | | Norway Government Bond,
2.000%, 5/24/2023, 144A, (NOK)(b) | | | 17,307,944 | |
| | | | | | | | |
| | | | Poland – 1.2% | | | | |
| | 47,950,000 | | | Poland Government Bond,
3.250%, 7/25/2019, (PLN)(b) | | | 13,007,279 | |
| | 5,195,000 | | | Poland Government International Bond, Series 0421,
2.000%, 4/25/2021, (PLN)(b) | | | 1,345,447 | |
| | | | | | | | |
| | | | | | | 14,352,726 | |
| | | | | | | | |
| | | | Portugal – 0.7% | | | | |
| | 3,625,000 | | | EDP Finance BV,
4.125%, 1/15/2020, 144A | | | 3,757,312 | |
| | 550,000 | | | EDP Finance BV,
4.900%, 10/01/2019, 144A | | | 584,546 | |
| | 3,885,000 | | | EDP Finance BV, EMTN,
2.000%, 4/22/2025, (EUR)(b) | | | 4,413,310 | |
| | | | | | | | |
| | | | | | | 8,755,168 | |
| | | | | | | | |
| | | | Romania – 0.1% | | | | |
| | 1,010,000 | | | Romanian Government International Bond,
2.875%, 5/26/2028, 144A, (EUR) | | | 1,228,231 | |
| | | | | | | | |
| | | | Singapore – 0.2% | | | | |
| | 3,630,000 | | | Singapore Government Bond, 2.250%, 6/01/2021, (SGD)(b) | | | 2,774,633 | |
| | | | | | | | |
| | | | South Africa – 1.3% | | | | |
| | 2,515,000 | | | Myriad International Holdings BV,
5.500%, 7/21/2025 | | | 2,702,368 | |
| | 214,610,000 | | | South Africa Government International Bond, Series R213, 7.000%, 2/28/2031, (ZAR)(b) | | | 13,063,614 | |
| | | | | | | | |
| | | | | | | 15,765,982 | |
| | | | | | | | |
| | | | Spain – 2.1% | | | | |
| | 1,000,000 | | | Banco Bilbao Vizcaya Argentaria S.A., 3.500%, 12/05/2017, (EUR)(b) | | | 1,172,215 | |
| | 2,600,000 | | | Santander Issuances SAU,
5.179%, 11/19/2025(b) | | | 2,649,007 | |
| | 5,165,000 | | | Spain Government Bond,
4.200%, 1/31/2037, 144A, (EUR)(b) | | | 8,363,100 | |
| | 9,300,000 | | | Spain Government Bond,
5.850%, 1/31/2022, 144A, (EUR)(b) | | | 13,621,213 | |
| | | | | | | | |
| | | | | | | 25,805,535 | |
| | | | | | | | |
See accompanying notes to financial statements.
| 30
Portfolio of Investments – as of September 30, 2016
Loomis Sayles Global Bond Fund – continued
| | | | | | | | |
Principal
Amount (‡) | | | Description | | Value (†) | |
|
| | Bonds and Notes – continued | |
| | |
| | | | Supranationals – 1.2% | | | | |
| $ | 5,370,000 | | | Banque Quest Africaine de Developpement, 5.500%, 5/06/2021, 144A(b) | | $ | 5,711,962 | |
| | 67,150,000 | | | Nordic Investment Bank, GMTN,
1.375%, 7/15/2020, (NOK)(b) | | | 8,480,810 | |
| | | | | | | | |
| | | | | | | 14,192,772 | |
| | | | | | | | |
| | | | Switzerland – 0.4% | | | | |
| | 4,150,000 | | | Holcim U.S. Finance S.a.r.l. & Cie SCS, 5.150%, 9/12/2023, 144A(b) | | | 4,689,164 | |
| | | | | | | | |
| | | | United Arab Emirates – 0.1% | | | | |
| | 1,560,000 | | | DP World Ltd.,
3.250%, 5/18/2020, 144A | | | 1,608,750 | |
| | | | | | | | |
| | | | United Kingdom – 8.4% | | | | |
| | 569,179 | | | Auburn Securities PLC, Series 4, Class A2, 0.673%, 10/01/2041,
(GBP)(b)(c) | | | 723,596 | |
| | 5,440,000 | | | Aviva PLC, EMTN, (fixed rate to 7/05/2023, variable rate thereafter), 6.125%, 7/05/2043, (EUR)(b) | | | 7,102,986 | |
| | 900,000 | | | Barclays PLC, 4.375%, 9/11/2024(b) | | | 910,182 | |
| | 400,000 | | | Barclays PLC, 5.200%, 5/12/2026(b) | | | 411,979 | |
| | 675,000 | | | Barclays PLC, EMTN, (fixed rate to 11/11/2020, variable rate thereafter),
2.625%, 11/11/2025, (EUR)(b) | | | 735,083 | |
| | 730,891 | | | Clavis Securities PLC, Series 2006-1, Class A3B, 0.052%, 12/15/2031, (EUR)(b)(c) | | | 755,355 | |
| | 953,000 | | | Co-Operative Bank PLC,
4.750%, 11/11/2021, (GBP)(b) | | | 1,411,693 | |
| | 2,500,000 | | | Delphi Automotive PLC,
1.500%, 3/10/2025, (EUR)(b) | | | 2,907,649 | |
| | 399,183 | | | Eurosail PLC, Series 2007-1X, Class A3C, 0.539%, 3/13/2045,
(GBP)(c) | | | 498,287 | |
| | 193,327 | | | Eurosail PLC, Series 2007-2X, Class A3C, 0.529%, 3/13/2045,
(GBP)(c) | | | 238,311 | |
| | 2,240,000 | | | FCE Bank PLC, EMTN,
1.528%, 11/09/2020, (EUR)(b) | | | 2,629,033 | |
| | 184,827 | | | Great Hall Mortgages PLC, Series 2006-1, Class A2A,
0.529%, 6/18/2038, (GBP)(c) | | | 228,610 | |
| | 460,000 | | | HBOS PLC, EMTN, (fixed rate to 3/18/2025, variable rate thereafter), 4.500%, 3/18/2030, (EUR)(b) | | | 573,372 | |
| | 4,750,000 | | | HSBC Holdings PLC,
4.250%, 3/14/2024(b) | | | 4,899,592 | |
| | 855,000 | | | HSBC Holdings PLC,
4.250%, 8/18/2025(b) | | | 877,761 | |
| | 3,190,000 | | | HSBC Holdings PLC, EMTN,
5.750%, 12/20/2027, (GBP)(b) | | | 4,910,431 | |
| | 1,810,000 | | | Imperial Brands Finance PLC,
4.250%, 7/21/2025, 144A(b) | | | 1,980,142 | |
| | 4,105,000 | | | Lloyds Banking Group PLC,
4.650%, 3/24/2026(b) | | | 4,223,983 | |
| | |
| | | | United Kingdom – continued | | | | |
| $ | 420,000 | | | Noble Holding International Ltd.,
5.250%, 3/15/2042 | | $ | 237,300 | |
| | 200,000 | | | Noble Holding International Ltd.,
6.050%, 3/01/2041 | | | 118,000 | |
| | 305,000 | | | Noble Holding International Ltd.,
6.200%, 8/01/2040 | | | 179,950 | |
| | 1,004,027 | | | Precise Mortgage Funding,
Series 2014-1, Class A,
1.180%, 9/12/2047, (GBP)(b)(c) | | | 1,292,092 | |
| | 479,506 | | | Precise Mortgage Funding PLC, Series 2015-1, Class A,
1.330%, 3/12/2048, (GBP)(b)(c) | | | 617,523 | |
| | 680,281 | | | Residential Mortgage Securities PLC, Series 20X, Class A2A,
0.641%, 8/10/2038, (GBP)(b)(c) | | | 814,553 | |
| | 577,071 | | | Residential Mortgage Securities PLC, Series 21X, Class A3A,
0.789%, 11/12/2038, (GBP)(b)(c) | | | 699,158 | |
| | 576,460 | | | Residential Mortgage Securities PLC, Series 22X, Class A3A,
0.746%, 11/14/2039, (GBP)(b)(c) | | | 695,467 | |
| | 486,327 | | | Residential Mortgage Securities PLC, Series 28, Class A, 1.532%, 6/15/2046, (GBP)(c) | | | 629,546 | |
| | 730,327 | | | RMAC PLC, Series 2005-NS3X, Class A2C, 0.056%, 6/12/2043, (EUR)(b)(c) | | | 761,259 | |
| | 2,271,810 | | | RMAC PLC, Series 2005-NS4X, Class A3A, 0.721%, 12/12/2043, (GBP)(b)(c) | | | 2,715,476 | |
| | 217,865 | | | RMAC Securities No. 1 PLC,
Series 2007-NS1X, Class A2A,
0.530%, 6/12/2044, (GBP)(c) | | | 259,597 | |
| | 5,830,000 | | | Royal Bank of Scotland Group PLC,
5.125%, 5/28/2024(b) | | | 5,836,180 | |
| | 425,000 | | | Royal Bank of Scotland Group PLC, EMTN, (fixed rate to 3/25/2019, variable rate thereafter),
3.625%, 3/25/2024, (EUR) | | | 473,214 | |
| | 5,458,000 | | | Santander UK Group Holdings PLC,
4.750%, 9/15/2025, 144A(b) | | | 5,464,135 | |
| | 6,490,000 | | | Sky PLC, 3.750%, 9/16/2024, 144A(b) | | | 6,861,812 | |
| | 630,000 | | | Sky PLC, EMTN,
2.500%, 9/15/2026, (EUR) | | | 788,098 | |
| | 1,505,000 | | | Standard Chartered PLC, EMTN,
3.125%, 11/19/2024, (EUR)(b) | | | 1,768,158 | |
| | 3,090,000 | | | Standard Chartered PLC, EMTN,
5.125%, 6/06/2034, (GBP)(b) | | | 3,943,027 | |
| | 4,410,000 | | | Tesco PLC, EMTN,
5.000%, 3/24/2023, (GBP) | | | 6,256,617 | |
| | 1,290,000 | | | Towd Point Mortgage Funding PLC, Series 16-GR1A, Class B,
1.923%, 7/20/2046, 144A, (GBP)(b)(c) | | | 1,663,771 | |
| | 975,000 | | | United Kingdom Gilt,
2.000%, 9/07/2025, (GBP) | | | 1,410,075 | |
| | 3,385,000 | | | United Kingdom Gilt,
3.500%, 1/22/2045, (GBP)(b) | | | 6,402,453 | |
| | 1,435,000 | | | United Kingdom Gilt,
4.250%, 6/07/2032, (GBP)(b) | | | 2,676,075 | |
See accompanying notes to financial statements.
31 |
Portfolio of Investments – as of September 30, 2016
Loomis Sayles Global Bond Fund – continued
| | | | | | | | |
Principal
Amount (‡) | | | Description | | Value (†) | |
|
| | Bonds and Notes – continued | |
| | |
| | | | United Kingdom – continued | | | | |
| | 4,030,000 | | | United Kingdom Gilt,
4.500%, 9/07/2034, (GBP)(b) | | $ | 7,899,629 | |
| | 1,875,000 | | | Virgin Media Finance PLC,
4.500%, 1/15/2025, 144A, (EUR) | | | 2,080,731 | |
| | 1,530,000 | | | Virgin Media Secured Finance PLC,
4.875%, 1/15/2027, 144A, (GBP) | | | 1,990,545 | |
| | 1,245,000 | | | WPP Finance 2010,
5.625%, 11/15/2043(b) | | | 1,477,153 | |
| | | | | | | | |
| | | | | | | 102,029,639 | |
| | | | | | | | |
| | | | United States – 34.3% | | | | |
| | 67,620 | | | A10 Securitization LLC,
Series 2013-1, Class A,
2.400%, 11/15/2025, 144A | | | 67,607 | |
| | 1,333,258 | | | A10 Securitization LLC,
Series 2013-2, Class A,
2.620%, 11/15/2027, 144A(b) | | | 1,330,263 | |
| | 3,510,000 | | | Aetna, Inc., 3.200%, 6/15/2026(b) | | | 3,568,705 | |
| | 1,100,000 | | | Aetna, Inc., 4.375%, 6/15/2046(b) | | | 1,151,862 | |
| | 572,000 | | | Ally Financial, Inc.,
4.125%, 3/30/2020 | | | 582,010 | |
| | 4,745,000 | | | Ally Financial, Inc.,
4.125%, 2/13/2022 | | | 4,798,381 | |
| | 1,260,000 | | | Ally Financial, Inc.,
4.250%, 4/15/2021 | | | 1,283,625 | |
| | 2,757,668 | | | Alta Wind Holdings LLC,
7.000%, 6/30/2035, 144A | | | 2,821,409 | |
| | 2,285,000 | | | Anadarko Petroleum Corp.,
3.450%, 7/15/2024(b) | | | 2,253,929 | |
| | 2,745,000 | | | Anadarko Petroleum Corp.,
5.550%, 3/15/2026(b) | | | 3,101,957 | |
| | 2,130,000 | | | AT&T, Inc., 4.300%, 12/15/2042(b) | | | 2,100,915 | |
| | 2,350,000 | | | AT&T, Inc., 4.350%, 6/15/2045(b) | | | 2,314,875 | |
| | 2,120,000 | | | AT&T, Inc., 4.750%, 5/15/2046(b) | | | 2,218,485 | |
| | 295,000 | | | AT&T, Inc., 4.800%, 6/15/2044(b) | | | 309,668 | |
| | 3,140,000 | | | Aviation Capital Group Corp.,
4.875%, 10/01/2025, 144A(b) | | | 3,406,900 | |
| | 4,510,000 | | | Bank of America Corp.,
4.100%, 7/24/2023(b) | | | 4,875,675 | |
| | 3,860,000 | | | BLCP Hotel Trust,
Series 2014-CLRN, Class D,
3.024%, 8/15/2029, 144A(c) | | | 3,797,021 | |
| | 2,310,000 | | | BorgWarner, Inc.,
1.800%, 11/07/2022, (EUR)(b) | | | 2,773,832 | |
| | 1,785,000 | | | Brixmor Operating Partnership LP,
3.850%, 2/01/2025 | | | 1,815,140 | |
| | 1,660,000 | | | Brixmor Operating Partnership LP,
3.875%, 8/15/2022 | | | 1,740,090 | |
| | 1,455,000 | | | Celgene Corp.,
5.000%, 8/15/2045(b) | | | 1,638,209 | |
| | 4,196,176 | | | Centre Point Funding LLC,
Series 2012-2A, Class 1,
2.610%, 8/20/2021, 144A(b) | | | 4,163,477 | |
| | 1,520,000 | | | Citigroup, Inc.,
4.000%, 8/05/2024(b) | | | 1,593,702 | |
| | 2,930,000 | | | Citigroup, Inc., 4.090%, 6/09/2025, (CAD)(b) | | | 2,315,123 | |
| | 3,172,338 | | | Commercial Mortgage Pass Through Certificates, Series 2014-FL4, Class AR1, 2.225%, 5/13/2031, 144A(c)(e)(f) | | | 3,151,065 | |
| | |
| | | | United States – continued | | | | |
| $ | 2,570,000 | | | Commercial Mortgage Trust, Series 2013-GAM, Class A2, 3.367%, 2/10/2028, 144A(b) | | $ | 2,680,775 | |
| | 2,800,000 | | | Commercial Mortgage Trust, Series 2014-PAT, Class D, 2.677%, 8/13/2027, 144A(c) | | | 2,756,065 | |
| | 4,000,000 | | | Commercial Mortgage Trust, Series 2014-SAVA, Class B, 2.275%, 6/15/2034, 144A(b)(c) | | | 3,966,084 | |
| | 5,300,000 | | | Continental Airlines Pass Through Certificates, Series 2012-3, Class C, 6.125%, 4/29/2018 | | | 5,538,500 | |
| | 98,531 | | | Continental Airlines Pass Through Trust, Series 2000-2, Class B, 8.307%, 10/02/2019 | | | 102,439 | |
| | 2,560,000 | | | Continental Resources, Inc.,
3.800%, 6/01/2024 | | | 2,342,400 | |
| | 1,702,127 | | | Credit Suisse Mortgage Capital Certificates, Series 2009-13R, Class 3A1, 2.608%, 11/26/2036, 144A(c) | | | 1,670,619 | |
| | 1,885,000 | | | Credit Suisse Mortgage Trust,
Series 2010-RR1, Class 2B,
5.695%, 9/15/2040, 144A(b)(c) | | | 1,905,656 | |
| | 3,052,615 | | | Delta Air Lines Pass Through Trust,
Series 2015-1, Class B, 4.250%, 1/30/2025(b) | | | 3,157,076 | |
| | 2,105,000 | | | Devon Energy Corp., 5.850%, 12/15/2025(b) | | | 2,368,923 | |
| | 680,000 | | | Diamond Offshore Drilling, Inc.,
4.875%, 11/01/2043(b) | | | 471,876 | |
| | 2,690,000 | | | Discovery Communications LLC,
1.900%, 3/19/2027, (EUR) | | | 2,973,249 | |
| | 2,755,000 | | | Energy Transfer Partners LP,
5.150%, 3/15/2045 | | | 2,551,907 | |
| | 1,710,000 | | | Energy Transfer Partners LP,
6.125%, 12/15/2045 | | | 1,785,979 | |
| | 5,480,000 | | | FedEx Corp., 1.000%, 1/11/2023, (EUR)(b) | | | 6,341,372 | |
| | 1,103,355 | | | FNMA, 4.500%, 11/01/2043(b) | | | 1,219,591 | |
| | 21,440,000 | | | FNMA (TBA), 3.000%, 11/01/2046(g) | | | 22,232,540 | |
| | 16,230,000 | | | FNMA (TBA), 3.500%, 11/01/2046(g) | | | 17,105,215 | |
| | 9,185,000 | | | FNMA (TBA), 4.000%, 11/01/2046(g) | | | 9,853,065 | |
| | 3,450,000 | | | Ford Motor Credit Co. LLC,
3.664%, 9/08/2024(b) | | | 3,555,525 | |
| | 6,270,000 | | | Ford Motor Credit Co. LLC,
4.050%, 12/10/2018, (AUD)(b) | | | 4,918,698 | |
| | 5,508,000 | | | Ford Motor Credit Co. LLC,
4.375%, 8/06/2023(b) | | | 5,921,265 | |
| | 185,000 | | | Freeport-McMoRan, Inc.,
5.400%, 11/14/2034 | | | 153,550 | |
| | 915,000 | | | Freeport-McMoRan, Inc., 5.450%, 3/15/2043 | | | 734,288 | |
| | 50,000,000 | | | General Electric Co., EMTN,
4.208%, 12/06/2021, (SEK)(b) | | | 6,777,230 | |
| | 3,925,000 | | | General Motors Co., 5.200%, 4/01/2045 | | | 4,082,706 | |
See accompanying notes to financial statements.
| 32
Portfolio of Investments – as of September 30, 2016
Loomis Sayles Global Bond Fund – continued
| | | | | | | | |
Principal
Amount (‡) | | | Description | | Value (†) | |
|
| | Bonds and Notes – continued | |
| | |
| | | | United States – continued | | | | |
| $ | 3,100,000 | | | General Motors Financial Co., Inc.,
3.150%, 1/15/2020(b) | | $ | 3,158,785 | |
| | 3,900,000 | | | General Motors Financial Co., Inc.,
4.000%, 1/15/2025 | | | 3,936,839 | |
| | 2,330,000 | | | Gilead Sciences, Inc.,
4.150%, 3/01/2047 | | | 2,381,470 | |
| | 625,000 | | | Gilead Sciences, Inc.,
4.750%, 3/01/2046(b) | | | 698,470 | |
| | 1,234,167 | | | GNMA, 2.243%, 5/20/2064(b)(c) | | | 1,285,255 | |
| | 1,572,335 | | | GNMA, 2.534%, 11/20/2064(b)(c) | | | 1,675,414 | |
| | 1,652,334 | | | GNMA, 2.615%, 11/20/2064(b)(c) | | | 1,764,369 | |
| | 2,787,527 | | | GNMA, 2.779%, 10/20/2063(b)(c) | | | 2,994,566 | |
| | 528,003 | | | GNMA, 4.447%, 4/20/2065(b) | | | 594,342 | |
| | 1,800,815 | | | GNMA, 4.527%, 1/20/2063(b) | | | 1,936,750 | |
| | 716,975 | | | GNMA, 4.548%, 6/20/2062(b) | | | 756,447 | |
| | 3,901,629 | | | GNMA, 4.550%, 12/20/2061(b) | | | 4,113,917 | |
| | 1,704,771 | | | GNMA, 4.564%, 2/20/2065(b) | | | 1,917,414 | |
| | 1,892,949 | | | GNMA, 4.613%, 7/20/2064(b) | | | 2,121,134 | |
| | 3,210,316 | | | GNMA, 4.669%, 5/20/2064(b) | | | 3,594,201 | |
| | 1,883,489 | | | GNMA, 4.673%, 7/20/2064(b) | | | 2,115,806 | |
| | 3,610,000 | | | GNMA (TBA), 3.000%, 11/01/2046(g) | | | 3,774,354 | |
| | 3,610,000 | | | GNMA (TBA), 3.500%, 11/01/2046(g) | | | 3,829,984 | |
| | 2,030,000 | | | Goldman Sachs Group, Inc. (The), MTN, 3.850%, 7/08/2024(b) | | | 2,155,334 | |
| | 2,560,000 | | | HCA Holdings, Inc., 6.250%, 2/15/2021 | | | 2,777,600 | |
| | 1,795,000 | | | HCA, Inc., 5.375%, 2/01/2025 | | | 1,853,338 | |
| | 1,350,000 | | | Hewlett Packard Enterprise Co.,
6.350%, 10/15/2045, 144A(b) | | | 1,393,123 | |
| | 1,705,419 | | | Hilton Grand Vacations Trust, Series 2013-A, Class A,
2.280%, 1/25/2026, 144A(b) | | | 1,698,949 | |
| | 3,810,000 | | | INVISTA Finance LLC,
4.250%, 10/15/2019, 144A(b) | | | 3,791,255 | |
| | 3,174,000 | | | JPMorgan Chase & Co., 3.875%, 2/01/2024(b) | | | 3,422,527 | |
| | 3,800,000 | | | JPMorgan Chase Commercial Mortgage Securities Corp., Series 2014-PHH, Class A,
1.724%, 8/15/2027, 144A(b)(c) | | | 3,796,873 | |
| | 810,706 | | | JPMorgan Resecuritization Trust, Series 2010-4, Class A2,
2.409%, 9/26/2035, 144A(b)(c) | | | 801,466 | |
| | 4,270,000 | | | Kraft Heinz Foods Co., 3.000%, 6/01/2026(b) | | | 4,304,066 | |
| | 1,180,000 | | | Kraft Heinz Foods Co., 4.375%, 6/01/2046 | | | 1,248,471 | |
| | 1,020,000 | | | Ladder Capital Finance Holdings LLLP/Ladder Capital Finance Corp.,
7.375%, 10/01/2017 | | | 1,027,650 | |
| | 5,210,000 | | | Liberty Mutual Group, Inc.,
4.850%, 8/01/2044, 144A(b) | | | 5,427,028 | |
| | 4,562,746 | | | Longtrain Leasing III LLC, Series 2015-1A, Class A1,
2.980%, 1/15/2045, 144A(b) | | | 4,499,496 | |
| | |
| | | | United States – continued | | | | |
| $ | 1,402,744 | | | Marriott Vacation Club Owner Trust, Series 2012-1A, Class B,
3.500%, 5/20/2030, 144A(b) | | $ | 1,427,622 | |
| | 1,900,000 | | | Morgan Stanley, 3.950%, 4/23/2027(b) | | | 1,973,433 | |
| | 1,400,000 | | | Morgan Stanley Re-REMIC Trust, Series 2009-GG10, Class A4B,
5.988%, 8/12/2045, 144A(b)(c) | | | 1,416,979 | |
| | 1,500,000 | | | Morgan Stanley Re-REMIC Trust, Series 2010-GG10, Class A4B,
5.988%, 8/15/2045, 144A(b)(c) | | | 1,520,706 | |
| | 1,370,000 | | | MPLX LP, 4.500%, 7/15/2023 | | | 1,396,612 | |
| | 960,000 | | | MPLX LP, 4.875%, 12/01/2024 | | | 992,953 | |
| | 1,030,000 | | | MPLX LP, 4.875%, 6/01/2025 | | | 1,064,280 | |
| | 1,220,000 | | | MPLX LP, 5.500%, 2/15/2023 | | | 1,260,378 | |
| | 815,000 | | | Newfield Exploration Co.,
5.625%, 7/01/2024 | | | 835,375 | |
| | 1,800,000 | | | Noble Energy, Inc.,
5.250%, 11/15/2043 | | | 1,832,224 | |
| | 3,540,000 | | | OneMain Financial Issuance Trust, Series 2016-2A, Class A,
4.100%, 3/20/2028, 144A(b) | | | 3,643,570 | |
| | 518,479 | | | Orange Lake Timeshare Trust, Series 2012-AA, Class B,
4.870%, 3/10/2027, 144A | | | 530,896 | |
| | 850,000,000 | | | Procter & Gamble Co. (The),
0.275%, 5/08/2020, (JPY)(b) | | | 8,467,896 | |
| | 2,015,000 | | | Quicken Loans, Inc.,
5.750%, 5/01/2025, 144A | | | 1,999,887 | |
| | 2,670,000 | | | RBSCF Trust, Series 2010-RR4, Class CSCB, 5.695%, 9/16/2040, 144A(b)(c) | | | 2,695,947 | |
| | 404,503 | | | RBSSP Resecuritization Trust, Series 2010-3, Class 9A1,
5.500%, 2/26/2035, 144A(b) | | | 407,698 | |
| | 6,272,000 | | | Sirius International Group,
6.375%, 3/20/2017, 144A(b) | | | 6,371,367 | |
| | 925,000 | | | Spectrum Brands, Inc.,
4.000%, 10/01/2026, 144A, (EUR) | | | 1,056,420 | |
| | 3,890,000 | | | Spirit Airlines Pass Through Certificates, Series 2015-1, Class B,
4.450%, 10/01/2025(b) | | | 3,914,079 | |
| | 1,591,479 | | | SpringCastle America Funding LLC, Series 2014-AA, Class A,
2.700%, 5/25/2023, 144A(b) | | | 1,596,644 | |
| | 1,865,000 | | | SpringCastle America Funding LLC, Series 2016-AA, Class A,
3.050%, 4/25/2029, 144A(b) | | | 1,874,325 | |
| | 1,648,333 | | | TAL Advantage V LLC,
Series 2013-2A, Class A,
3.550%, 11/20/2038, 144A(b) | | | 1,631,968 | |
| | 2,955,000 | | | Targa Resources Partners LP/Targa Resources Partners Finance Corp.,
5.000%, 1/15/2018 | | | 3,058,425 | |
| | 1,760,000 | | | Tenet Healthcare Corp., 4.375%, 10/01/2021 | | | 1,751,200 | |
| | 4,415,000 | | | Tenet Healthcare Corp., 4.500%, 4/01/2021 | | | 4,442,594 | |
| | 2,050,000 | | | Time Warner Cable LLC,
4.500%, 9/15/2042(b) | | | 1,956,231 | |
See accompanying notes to financial statements.
33 |
Portfolio of Investments – as of September 30, 2016
Loomis Sayles Global Bond Fund – continued
| | | | | | | | |
Principal
Amount (‡) | | | Description | | Value (†) | |
|
| | Bonds and Notes – continued | |
| | |
| | | | United States – continued | | | | |
| $ | 575,000 | | | Time Warner Cable LLC,
5.500%, 9/01/2041 | | $ | 613,758 | |
| | 7,822,761 | | | Trinity Rail Leasing LP, Series 2010-1A, Class A, 5.194%, 10/16/2040, 144A(b) | | | 7,712,920 | |
| | 8,825,000 | | | U.S. Treasury Bond,
2.875%, 5/15/2043(b)(h) | | | 9,826,090 | |
| | 1,045,000 | | | U.S. Treasury Bond, 3.125%, 2/15/2042 | | | 1,217,057 | |
| | 36,455,000 | | | U.S. Treasury Note, 0.750%, 4/30/2018 | | | 36,459,265 | |
| | 3,640,000 | | | U.S. Treasury Note, 0.875%, 9/15/2019 | | | 3,639,858 | |
| | 3,675,000 | | | U.S. Treasury Note, 1.125%, 2/28/2021 | | | 3,677,297 | |
| | 12,300,000 | | | U.S. Treasury Note, 1.125%, 6/30/2021 | | | 12,285,584 | |
| | 1,110,000 | | | U.S. Treasury Note, 1.375%, 6/30/2023 | | | 1,108,049 | |
| | 5,740,000 | | | U.S. Treasury Note, 1.625%, 5/15/2026 | | | 5,747,623 | |
| | 1,377,417 | | | United Airlines Pass Through Trust, Series 2013-1, Class B,
5.375%, 2/15/2023 | | | 1,437,431 | |
| | 2,600,000 | | | Verizon Communications, Inc.,
2.625%, 8/15/2026 | | | 2,551,822 | |
| | 1,145,000 | | | Verizon Communications, Inc.,
3.850%, 11/01/2042(b) | | | 1,089,830 | |
| | 725,000 | | | Verizon Communications, Inc.,
4.272%, 1/15/2036(b) | | | 755,381 | |
| | 2,150,000 | | | Verizon Communications, Inc.,
4.400%, 11/01/2034(b) | | | 2,274,997 | |
| | 655,000 | | | Virginia Electric & Power Co.,
4.450%, 2/15/2044(b) | | | 749,634 | |
| | 3,150,000 | | | Wachovia Bank Commercial Mortgage Trust, Series 2007-C30, Class A5, 5.342%, 12/15/2043(b) | | | 3,170,100 | |
| | 1,255,000 | | | Westlake Chemical Corp.,
3.600%, 8/15/2026, 144A(b) | | | 1,258,559 | |
| | 1,160,000 | | | Westlake Chemical Corp.,
5.000%, 8/15/2046, 144A | | | 1,164,726 | |
| | 4,520,000 | | | Whiting Petroleum Corp.,
5.000%, 3/15/2019 | | | 4,373,100 | |
| | 1,030,000 | | | Zimmer Biomet Holdings, Inc.,
3.550%, 4/01/2025(b) | | | 1,061,566 | |
| | | | | | | | |
| | | | | | | 418,481,567 | |
| | | | | | | | |
| | |
| | | | Total Bonds and Notes | | | | |
| | | | (Identified Cost $1,163,405,071) | | | 1,164,817,546 | |
| | | | | | | | |
| |
| | Short-Term Investments – 5.5% | | | | |
| $ | 14,179,276 | | | Tri-Party Repurchase Agreement with Fixed Income Clearing Corporation, dated 9/30/2016 at 0.030% to be repurchased at $14,179,311 on 10/03/2016 collateralized by $13,410,000 U.S. Treasury Note, 2.500% due 8/15/2023 valued at $14,466,038 including accrued interest (Note 2 of Notes to Financial Statements) | | $ | 14,179,276 | |
| | 53,000,000 | | | U.S. Treasury Bills,
0.436%, 03/30/2017(i) | | | 52,885,732 | |
| | | | | | | | |
| | |
| | | | Total Short-Term Investments | | | | |
| | | | (Identified Cost $67,063,736) | | | 67,065,008 | |
| | | | | | | | |
| | |
| | | | Total Investments – 100.8% | | | | |
| | | | (Identified Cost $1,230,468,807)(a) | | | 1,231,882,554 | |
| | | | Other assets less liabilities—(0.8)% | | | (10,079,507 | ) |
| | | | | | | | |
| | |
| | | | Net Assets – 100.0% | | $ | 1,221,803,047 | |
| | | | | | | | |
| |
| | (‡) | | | Principal Amount stated in U.S. dollars unless otherwise noted. | |
| | (†) | | | See Note 2 of Notes to Financial Statements. | |
| | (††) | | | Amount shown represents units. One unit represents a principal amount of 100. | |
| | (a) | | | Federal Tax Information: | | | | |
| | | | At September 30, 2016, the net unrealized depreciation on investments based on a cost of $1,237,267,284 for federal income tax purposes was as follows: | |
| | | | Aggregate gross unrealized appreciation for all investments in which there is an excess of value over tax cost | | $ | 48,884,252 | |
| | | | Aggregate gross unrealized depreciation for all investments in which there is an excess of tax cost over value | | | (54,268,982 | ) |
| | | | | | | | |
| | | | Net unrealized depreciation | | $ | (5,384,730 | ) |
| | | | | | | | |
| | (b) | | | Security (or a portion thereof) has been designated to cover the Fund’s obligations under open derivative contracts or TBA transactions. | |
| | (c) | | | Variable rate security. Rate as of September 30, 2016 is disclosed. | |
| | (d) | | | Perpetual bond with no specified maturity date. | |
| | (e) | | | Illiquid security. (Unaudited) | |
| | (f) | | | Securities classified as fair valued pursuant to the Fund’s pricing policies and procedures. At September 30, 2016, the value of these securities amounted to $3,151,065 or 0.3% of net assets. See Note 2 of Notes to Financial Statements. | |
| | (g) | | | When-issued/delayed delivery. See Note 2 of Notes to Financial Statements. | |
| | (h) | | | Security (or a portion thereof) has been pledged as collateral for open derivative contracts. | |
| | (i) | | | Interest rate represents discount rate at time of purchase; not a coupon rate. | |
| |
| | 144A | | | All or a portion of these securities are exempt from registration under Rule 144A of the Securities Act of 1933. These securities may be resold in transactions exempt from registration, normally to qualified institutional buyers. At September 30, 2016, the value of Rule 144A holdings amounted to $276,480,472 or 22.6% of net assets. | |
| | ABS | | | Asset-Backed Securities | | | | |
| | EMTN | | | Euro Medium Term Note | | | | |
| | FNMA | | | Federal National Mortgage Association | | | | |
| | GMTN | | | Global Medium Term Note | | | | |
| | GNMA | | | Government National Mortgage Association | | | | |
| | MTN | | | Medium Term Note | | | | |
See accompanying notes to financial statements.
| 34
Portfolio of Investments – as of September 30, 2016
Loomis Sayles Global Bond Fund – continued
| | | | | | | | |
| | REMIC | | | Real Estate Mortgage Investment Conduit | | | | |
| | TBA | | | To Be Announced | | | | |
| | |
| | AUD | | | Australian Dollar | | | | |
| | BRL | | | Brazilian Real | | | | |
| | CAD | | | Canadian Dollar | | | | |
| | DKK | | | Danish Krone | | | | |
| | EUR | | | Euro | | | | |
| | GBP | | | British Pound | | | | |
| | IDR | | | Indonesian Rupiah | | | | |
| | JPY | | | Japanese Yen | | | | |
| | MXN | | | Mexican Peso | | | | |
| | MYR | | | Malaysian Ringgit | | | | |
| | NOK | | | Norwegian Krone | | | | |
| | PLN | | | Polish Zloty | | | | |
| | SEK | | | Swedish Krona | | | | |
| | SGD | | | Singapore Dollar | | | | |
| | ZAR | | | South African Rand | | | | |
At September 30, 2016, the Fund had the following open forward foreign currency contracts:
| | | | | | | | | | | | | | | | |
Contract
to
Buy/Sell | | Delivery
Date | | Currency | | Units
of
Currency | | | Notional
Value | | | Unrealized
Appreciation
(Depreciation) | |
Sell1 | | 12/21/2016 | | Brazilian Real | | | 6,025,000 | | | $ | 1,811,062 | | | $ | (64,027 | ) |
Sell2 | | 12/21/2016 | | Euro | | | 17,250,000 | | | | 19,447,799 | | | | 29,935 | |
Buy3 | | 12/21/2016 | | Japanese Yen | | | 7,908,000,000 | | | | 78,254,452 | | | | 734,160 | |
Sell4 | | 12/21/2016 | | Mexican Peso | | | 422,590,000 | | | | 21,607,317 | | | | 1,195,819 | |
Sell2 | | 12/21/2016 | | South African Rand | | | 168,000,000 | | | | 12,059,078 | | | | (588,761 | ) |
Buy3 | | 12/21/2016 | | South Korean Won | | | 17,143,469,000 | | | | 15,559,146 | | | | 170,727 | |
Buy3 | | 12/21/2016 | | Swiss Franc | | | 8,430,000 | | | | 8,718,657 | | | | (47,161 | ) |
| | | | | | | | | | | | | | | | |
Total | | | $ | 1,430,692 | |
| | | | | | | | | | | | | | | | |
At September 30, 2016, the Fund had the following open forward cross currency contracts:
| | | | | | | | | | | | | | | | |
Settlement Date | | Deliver/Units of Currency | | | Receive/Units of Currency | | | Unrealized
Appreciation
(Depreciation) | |
12/21/2016 | | Australian Dollar | | | 37,215,000 | | | Euro3 | | | 24,769,626 | | | | (507,374 | ) |
12/21/2016 | | British Pound | | | 2,390,000 | | | Euro5 | | | 2,804,736 | | | | 59,281 | |
12/21/2016 | | British Pound | | | 1,215,000 | | | Euro5 | | | 1,412,117 | | | | 14,667 | |
12/21/2016 | | Japanese Yen | | | 3,015,000,000 | | | Euro5 | | | 26,355,877 | | | | (121,408 | ) |
12/21/2016 | | Norwegian Krone | | | 56,420,000 | | | Euro3 | | | 6,074,940 | | | | (209,839 | ) |
| | | | | | | | | | | | | | | | |
Total | | | | | | | | | | | | | | $ | (764,673 | ) |
| | | | | | | | | | | | | | | | |
1 Counterparty is Deutsche Bank AG
2 Counterparty is Citibank N.A.
3 Counterparty is Credit Suisse International
4 Counterparty is UBS AG
5 Counterparty is Morgan Stanley & Co.
At September 30, 2016, open long futures contracts were as follows:
| | | | | | | | | | | | | | | | |
| |
Financial Futures | | Expiration
Date | | | Contracts | | | Notional
Value | | | Unrealized
Appreciation
(Depreciation) | |
5 Year U.S. Treasury Note | | | 12/30/2016 | | | | 922 | | | $ | 112,037,406 | | | $ | 243,697 | |
German Euro Bund | | | 12/08/2016 | | | | 179 | | | | 33,318,880 | | | | 115,744 | |
Ultra Long U.S. Treasury Bond | | | 12/20/2016 | | | | 131 | | | | 24,087,625 | | | | (526,458 | ) |
| | | | | | | | | | | | | | | | |
Total | | | | | | | | | | | | | | $ | (167,017 | ) |
| | | | | | | | | | | | | | | | |
See accompanying notes to financial statements.
35 |
Portfolio of Investments – as of September 30, 2016
Loomis Sayles Global Bond Fund – continued
At September 30, 2016, open short futures contracts were as follows:
| | | | | | | | | | | | | | | | |
Financial Futures | | Expiration
Date | | | Contracts | | | Notional
Value | | | Unrealized
Appreciation
(Depreciation) | |
10 Year U.S. Treasury Note | | | 12/20/2016 | | | | 888 | | | $ | 116,439,000 | | | $ | (119,501 | ) |
30 Year U.S. Treasury Bond | | | 12/20/2016 | | | | 264 | | | | 44,393,250 | | | | 634,714 | |
| | | | | | | | | | | | | | | | |
Total | | | | | | | | | | | | | | $ | 515,213 | |
| | | | | | | | | | | | | | | | |
Industry Summary at September 30, 2016
| | | | |
Treasuries | | | 38.4 | % |
Banking | | | 8.3 | |
Mortgage Related | | | 6.7 | |
Automotive | | | 3.2 | |
Non-Agency Commercial Mortgage-Backed Securities | | | 2.9 | |
ABS Other | | | 2.8 | |
Local Authorities | | | 2.8 | |
ABS Home Equity | | | 2.7 | |
Life Insurance | | | 2.1 | |
Cable Satellite | | | 2.0 | |
Other Investments, less than 2% each | | | 23.4 | |
Short-Term Investments | | | 5.5 | |
| | | | |
Total Investments | | | 100.8 | |
Other assets less liabilities (including forward foreign currency contracts and futures contracts) | | | (0.8 | ) |
| | | | |
Net Assets | | | 100.0 | % |
| | | | |
Currency Exposure Summary at September 30, 2016
| | | | |
United States Dollar | | | 50.1 | % |
Euro | | | 15.3 | |
Japanese Yen | | | 13.3 | |
British Pound | | | 5.3 | |
Australian Dollar | | | 3.5 | |
Mexican Peso | | | 2.8 | |
Norwegian Krone | | | 2.7 | |
Canadian Dollar | | | 2.3 | |
Other, less than 2% each | | | 5.5 | |
| | | | |
Total Investments | | | 100.8 | |
Other assets less liabilities (including forward foreign currency contracts and futures contracts) | | | (0.8 | ) |
| | | | |
Net Assets | | | 100.0 | % |
| | | | |
See accompanying notes to financial statements.
| 36
Portfolio of Investments – as of September 30, 2016
Loomis Sayles Inflation Protected Securities Fund
| | | | | | | | |
Principal
Amount | | | Description | | Value (†) | |
| |
| | Bonds and Notes – 98.6% of Net Assets | | | | |
| | |
| | | | Treasuries – 98.6% | | | | |
| $ | 1,720,009 | | | U.S. Treasury Inflation Indexed Bond, 0.750%, 2/15/2045(b) | | $ | 1,772,877 | |
| | 695,741 | | | U.S. Treasury Inflation Indexed Bond, 1.000%, 2/15/2046(b) | | | 769,094 | |
| | 2,908,255 | | | U.S. Treasury Inflation Indexed Bond, 3.375%, 4/15/2032(b) | | | 4,267,629 | |
| | 6,673,689 | | | U.S. Treasury Inflation Indexed Note, 0.125%, 4/15/2020(b)(c) | | | 6,803,879 | |
| | 6,483,393 | | | U.S. Treasury Inflation Indexed Note, 0.125%, 4/15/2021(b) | | | 6,618,760 | |
| | 1,541,140 | | | U.S. Treasury Inflation Indexed Note, 0.125%, 7/15/2026(b) | | | 1,557,986 | |
| | 3,911,870 | | | U.S. Treasury Inflation Indexed Note, 0.250%, 1/15/2025(b) | | | 3,984,364 | |
| | 3,394,606 | | | U.S. Treasury Inflation Indexed Note, 0.375%, 7/15/2025(b)(c) | | | 3,505,746 | |
| | 1,380,487 | | | U.S. Treasury Inflation Indexed Note, 0.625%, 1/15/2026(b) | | | 1,451,872 | |
| | | | | | | | |
| | |
| | | | Total Bonds and Notes | | | | |
| | | | (Identified Cost $29,814,195) | | | 30,732,207 | |
| | | | | | | | |
| |
| | Short-Term Investments – 1.3% | | | | |
| | 390,424 | | | Tri-Party Repurchase Agreement with Fixed Income Clearing Corporation, dated 9/30/2016 at 0.030% to be repurchased at $390,425 on 10/03/2016 collateralized by $370,000 U.S. Treasury Note, 2.500% due 8/15/2023 valued at $399,138 including accrued interest (Note 2 of Notes to Financial Statements) | | | 390,424 | |
| | 20,000 | | | U.S. Treasury Bills,
0.345%, 01/12/2017(d)(e) | | | 19,985 | |
| | | | | | | | |
| | |
| | | | Total Short-Term Investments | | | | |
| | | | (Identified Cost $410,403) | | | 410,409 | |
| | | | | | | | |
| | |
| | | | Total Investments – 99.9% | | | | |
| | | | (Identified Cost $30,224,598)(a) | | | 31,142,616 | |
| | | | Other assets less liabilities—0.1% | | | 34,518 | |
| | | | | | | | |
| | |
| | | | Net Assets – 100.0% | | $ | 31,177,134 | |
| | | | | | | | |
| | (†) | | | See Note 2 of Notes to Financial Statements. | |
| | (a) | | | Federal Tax Information: | | | | |
| | | | At September 30, 2016, the net unrealized appreciation on investments based on a cost of $30,386,840 for federal income tax purposes was as follows: | |
| | | | Aggregate gross unrealized appreciation for all investments in which there is an excess of value over tax cost | | $ | 755,776 | |
| | | | Aggregate gross unrealized depreciation for all investments in which there is an excess of tax cost over value | | | — | |
| | | | | | | | |
| | | | Net unrealized appreciation | | $ | 755,776 | |
| | | | | | | | |
| | (b) | | | Treasury Inflation Protected Security (TIPS). | |
| | (c) | | | Security (or a portion thereof) has been designated to cover the Fund’s obligations under open derivative contracts. | |
| | (d) | | | Interest rate represents discount rate at time of purchase; not a coupon rate. | |
| | (e) | | | Security (or a portion thereof) has been pledged as collateral for open derivative contracts. | |
At September 30, 2016, open long futures contracts were as follows:
| | | | | | | | | | | | | | | | |
Financial Futures | | Expiration
Date | | | Contracts | | | Notional
Value | | | Unrealized
Appreciation
(Depreciation) | |
Eurodollar | | | 6/19/2017 | | | | 60 | | | $ | 14,852,250 | | | $ | 2,097 | |
| | | | | | | | | | | | | | | | |
See accompanying notes to financial statements.
37 |
Portfolio of Investments – as of September 30, 2016
Loomis Sayles Inflation Protected Securities Fund – continued
At September 30, 2016, open short futures contracts were as follows:
| | | | | | | | | | | | | | | | |
Financial Futures | | Expiration
Date | | | Contracts | | | Notional
Value | | | Unrealized
Appreciation
(Depreciation) | |
2 Year U.S. Treasury Note | | | 12/30/2016 | | | | 35 | | | $ | 7,646,406 | | | $ | (3,158 | ) |
Eurodollar | | | 12/17/2018 | | | | 60 | | | | 14,820,750 | | | | (4,654 | ) |
| | | | | | | | | | | | | | | | |
Total | | | | | | | | | | | | | | $ | (7,812 | ) |
| | | | | | | | | | | | | | | | |
Industry Summary at September 30, 2016
| | | | |
Treasuries | | | 98.6 | % |
Short-Term Investments | | | 1.3 | |
| | | | |
Total Investments | | | 99.9 | |
Other assets less liabilities (including futures contracts) | | | 0.1 | |
| | | | |
Net Assets | | | 100.0 | % |
| | | | |
See accompanying notes to financial statements.
| 38
Portfolio of Investments – as of September 30, 2016
Loomis Sayles Institutional High Income Fund
| | | | | | | | |
Principal
Amount (‡) | | | Description | | Value (†) | |
| |
| | Bonds and Notes – 83.5% of Net Assets | | | | |
| |
| | Non-Convertible Bonds – 69.7% | | | | |
| | |
| | | | Aerospace & Defense – 1.9% | | | | |
| $ | 345,000 | | | Bombardier, Inc.,
6.125%, 1/15/2023, 144A | | $ | 306,188 | |
| | 135,000 | | | Bombardier, Inc.,
7.350%, 12/22/2026, 144A, (CAD) | | | 93,382 | |
| | 2,175,000 | | | Bombardier, Inc.,
7.450%, 5/01/2034, 144A | | | 1,862,344 | |
| | 1,165,000 | | | Huntington Ingalls Industries, Inc.,
5.000%, 11/15/2025, 144A | | | 1,231,987 | |
| | 1,900,000 | | | Meccanica Holdings USA, Inc.,
6.250%, 1/15/2040, 144A | | | 1,862,000 | |
| | 5,200,000 | | | Meccanica Holdings USA, Inc.,
7.375%, 7/15/2039, 144A | | | 5,694,000 | |
| | 2,610,000 | | | Textron Financial Corp., (fixed rate to 2/15/2017, variable rate thereafter),
6.000%, 2/15/2067, 144A | | | 1,856,362 | |
| | 625,000 | | | TransDigm, Inc., 6.500%, 5/15/2025 | | | 650,781 | |
| | | | | | | | |
| | | | | | | 13,557,044 | |
| | | | | | | | |
| | | | Airlines – 2.5% | | | | |
| | 4,890,000 | | | Air Canada,
7.625%, 10/01/2019, 144A, (CAD) | | | 3,869,397 | |
| | 4,080,000 | | | Air Canada, 7.750%, 4/15/2021, 144A | | | 4,406,400 | |
| | 351,452 | | | Air Canada Pass Through Trust, Series 2013-1, Class B,
5.375%, 11/15/2022, 144A | | | 361,996 | |
| | 810,000 | | | Allegiant Travel Co.,
5.500%, 7/15/2019 | | | 838,350 | |
| | 423,844 | | | American Airlines Pass Through Trust, Series 2013-2, Class C,
6.000%, 1/15/2017, 144A | | | 427,760 | |
| | 191,754 | | | Continental Airlines Pass Through Trust, Series 2000-2, Class A-1,
7.707%, 10/02/2022 | | | 209,012 | |
| | 21,655 | | | Continental Airlines Pass Through Trust, Series 2000-2, Class B,
8.307%, 10/02/2019 | | | 22,514 | |
| | 348,974 | | | United Airlines Pass Through Trust, Series 2014-1, Class B,
4.750%, 10/11/2023 | | | 356,589 | |
| | 1,150,000 | | | United Continental Holdings, Inc.,
6.375%, 6/01/2018 | | | 1,207,500 | |
| | 232,203 | | | US Airways Pass Through Trust, Series 2010-1B, Class B,
8.500%, 10/22/2018 | | | 239,603 | |
| | 1,184,774 | | | US Airways Pass Through Trust, Series 2011-1B, Class B,
9.750%, 4/22/2020 | | | 1,312,221 | |
| | 246,313 | | | US Airways Pass Through Trust, Series 2012-1B, Class B,
8.000%, 4/01/2021 | | | 272,791 | |
| | 2,039,981 | | | US Airways Pass Through Trust, Series 2013-1, Class B,
5.375%, 5/15/2023 | | | 2,121,581 | |
| | 1,750,000 | | | Virgin Australia Holdings Ltd.,
8.500%, 11/15/2019, 144A | | | 1,802,500 | |
| | 166,800 | | | Virgin Australia Pass Through Trust, Series 2013-1B,
6.000%, 4/23/2022, 144A | | | 169,302 | |
| | |
| | | | Airlines – continued | | | | |
| $ | 249,909 | | | Virgin Australia Pass Through Trust, Series 2013-1C,
7.125%, 10/23/2018, 144A | | $ | 253,033 | |
| | | | | | | | |
| | | | | | | 17,870,549 | |
| | | | | | | | |
| | | | Automotive – 1.0% | | | | |
| | 1,000,000 | | | American Axle & Manufacturing, Inc.,
6.625%, 10/15/2022 | | | 1,057,500 | |
| | 2,090,000 | | | Goodyear Tire & Rubber Co. (The),
7.000%, 3/15/2028 | | | 2,283,325 | |
| | 3,505,000 | | | Lear Corp., 5.375%, 3/15/2024 | | | 3,763,494 | |
| | | | | | | | |
| | | | | | | 7,104,319 | |
| | | | | | | | |
| | | | Banking – 1.4% | | | | |
| | 915,000 | | | Bank of America Corp., Series K, (fixed rate to 1/30/2018, variable rate thereafter), 8.000%(b) | | | 933,300 | |
| | 4,520,000 | | | Citigroup, Inc.,
6.250%, 6/29/2017, (NZD) | | | 3,364,775 | |
| | 160,000 | | | RBS Capital Trust II, (fixed rate to 1/03/2034, variable rate thereafter),
6.425%(b) | | | 170,800 | |
| | 3,545,000 | | | Royal Bank of Scotland Group PLC,
4.700%, 7/03/2018 | | | 3,641,123 | |
| | 105,000 | | | Royal Bank of Scotland Group PLC,
5.250%, (EUR)(b) | | | 111,582 | |
| | 1,545,000 | | | Royal Bank of Scotland Group PLC,
5.500%, (EUR)(b) | | | 1,647,494 | |
| | 85,000 | | | Royal Bank of Scotland Group PLC, (fixed rate to 9/30/2017, variable rate thereafter), 7.640%(b) | | | 82,450 | |
| | | | | | | | |
| | | | | | | 9,951,524 | |
| | | | | | | | |
| | | | Brokerage – 0.3% | | | | |
| | 350,000 | | | Jefferies Finance LLC/JFIN Co-Issuer Corp., 6.875%, 4/15/2022, 144A | | | 325,500 | |
| | 1,615,000 | | | Jefferies Group LLC, 6.250%, 1/15/2036 | | | 1,683,277 | |
| | | | | | | | |
| | | | | | | 2,008,777 | |
| | | | | | | | |
| | | | Building Materials – 1.1% | | | | |
| | 4,325,000 | | | Atrium Windows & Doors, Inc.,
7.750%, 5/01/2019, 144A | | | 3,887,094 | |
| | 670,000 | | | Masco Corp., 6.500%, 8/15/2032 | | | 737,000 | |
| | 3,245,000 | | | NCI Building Systems, Inc.,
8.250%, 1/15/2023, 144A | | | 3,528,937 | |
| | | | | | | | |
| | | | | | | 8,153,031 | |
| | | | | | | | |
| | | | Cable Satellite – 1.7% | | | | |
| | 125,000 | | | CCO Holdings LLC/CCO Holdings Capital Corp., 5.125%, 2/15/2023 | | | 130,313 | |
| | 60,000 | | | CCO Holdings LLC/CCO Holdings Capital Corp.,
5.125%, 5/01/2023, 144A | | | 62,625 | |
| | 70,000 | | | CCO Holdings LLC/CCO Holdings Capital Corp.,
5.375%, 5/01/2025, 144A | | | 73,413 | |
| | 2,215,000 | | | CCO Holdings LLC/CCO Holdings Capital Corp., 5.750%, 1/15/2024 | | | 2,353,437 | |
| | 300,000 | | | CCO Holdings LLC/CCO Holdings Capital Corp.,
5.875%, 5/01/2027, 144A | | | 319,500 | |
See accompanying notes to financial statements.
39 |
Portfolio of Investments – as of September 30, 2016
Loomis Sayles Institutional High Income Fund – continued
| | | | | | | | |
Principal
Amount (‡) | | | Description | | Value (†) | |
| |
| | Bonds and Notes – continued | | | | |
| | |
| | | | Cable Satellite – continued | | | | |
| $ | 3,215,000 | | | CSC Holdings LLC, 5.250%, 6/01/2024 | | $ | 3,054,250 | |
| | 1,390,000 | | | DISH DBS Corp., 5.000%, 3/15/2023 | | | 1,351,775 | |
| | 2,686,000 | | | DISH DBS Corp., 5.875%, 11/15/2024 | | | 2,652,425 | |
| | 1,720,000 | | | DISH DBS Corp., 7.750%, 7/01/2026, 144A | | | 1,827,500 | |
| | 170,000 | | | Time Warner Cable LLC, 4.500%, 9/15/2042 | | | 162,224 | |
| | | | | | | | |
| | | | | | | 11,987,462 | |
| | | | | | | | |
| | | | Chemicals – 3.2% | | | | |
| | 1,025,000 | | | Aruba Investments, Inc.,
8.750%, 2/15/2023, 144A | | | 1,045,500 | |
| | 1,060,000 | | | GCP Applied Technologies, Inc.,
9.500%, 2/01/2023, 144A | | | 1,210,997 | |
| | 4,043,000 | | | Hercules, Inc., 6.500%, 6/30/2029 | | | 3,638,700 | |
| | 2,564,000 | | | Hexion, Inc., 7.875%, 2/15/2023(c)(d) | | | 923,040 | |
| | 3,687,000 | | | Hexion, Inc., 8.875%, 2/01/2018 | | | 3,511,867 | |
| | 2,641,000 | | | Hexion, Inc., 9.200%, 3/15/2021(c)(d) | | | 1,029,990 | |
| | 3,190,000 | | | Hexion, Inc./Hexion Nova Scotia Finance ULC, 9.000%, 11/15/2020 | | | 2,308,763 | |
| | 1,405,000 | | | INEOS Group Holdings S.A.,
5.875%, 2/15/2019, 144A | | | 1,433,100 | |
| | 4,680,000 | | | Kraton Polymers LLC/Kraton Polymers Capital Corp.,
10.500%, 4/15/2023, 144A | | | 5,311,800 | |
| | 2,971,000 | | | TPC Group, Inc., 8.750%, 12/15/2020, 144A | | | 2,304,159 | |
| | | | | | | | |
| | | | | | | 22,717,916 | |
| | | | | | | | |
| | | | Construction Machinery – 0.7% | | | | |
| | 1,370,000 | | | United Rentals North America, Inc.,
5.500%, 7/15/2025 | | | 1,397,400 | |
| | 2,320,000 | | | United Rentals North America, Inc.,
5.750%, 11/15/2024 | | | 2,407,000 | |
| | 1,140,000 | | | United Rentals North America, Inc.,
5.875%, 9/15/2026 | | | 1,174,200 | |
| | | | | | | | |
| | | | | | | 4,978,600 | |
| | | | | | | | |
| | | | Consumer Cyclical Services – 0.3% | | | | |
| | 135,000 | | | ServiceMaster Co. LLC (The),
7.100%, 3/01/2018 | | | 139,219 | |
| | 1,902,000 | | | ServiceMaster Co. LLC (The),
7.450%, 8/15/2027 | | | 2,021,826 | |
| | | | | | | | |
| | | | | | | 2,161,045 | |
| | | | | | | | |
| | | | Diversified Manufacturing – 0.1% | | | | |
| | 970,000 | | | General Electric Co., Series A, GMTN,
5.500%, 2/01/2017, (NZD) | | | 711,813 | |
| | | | | | | | |
| | | | Electric – 1.1% | | | | |
| | 455,000 | | | AES Corp. (The), 4.875%, 5/15/2023 | | | 461,825 | |
| | 200,000 | | | AES Corp. (The), 5.500%, 4/15/2025 | | | 205,750 | |
| | 1,423,000 | | | DPL, Inc., 6.750%, 10/01/2019 | | | 1,476,363 | |
| | 340,000 | | | Dynegy, Inc., 5.875%, 6/01/2023 | | | 308,550 | |
| | 665,000 | | | Dynegy, Inc., 7.625%, 11/01/2024 | | | 653,030 | |
| | |
| | | | Electric – continued | | | | |
| $ | 1,100,000 | | | EDP Finance BV, 4.900%, 10/01/2019, 144A | | $ | 1,169,091 | |
| | 1,000,000 | | | EDP Finance BV, 6.000%, 2/02/2018, 144A | | | 1,045,360 | |
| | 2,430,000 | | | NRG Energy, Inc., 7.250%, 5/15/2026, 144A | | | 2,472,525 | |
| | | | | | | | |
| | | | | | | 7,792,494 | |
| | | | | | | | |
| | | | Environmental – 0.1% | | | | |
| | 536,000 | | | Advanced Disposal Services, Inc.,
8.250%, 10/01/2020 | | | 562,800 | |
| | | | | | | | |
| | | | Finance Companies – 3.3% | | | | |
| | 1,000,000 | | | AGFC Capital Trust I, (fixed rate to 1/15/2017, variable rate thereafter),
6.000%, 1/15/2067, 144A | | | 500,000 | |
| | 240,000 | | | International Lease Finance Corp.,
4.625%, 4/15/2021 | | | 251,400 | |
| | 60,000 | | | International Lease Finance Corp.,
6.250%, 5/15/2019 | | | 65,025 | |
| | 300,000 | | | International Lease Finance Corp.,
8.250%, 12/15/2020 | | | 356,250 | |
| | 3,980,000 | | | iStar, Inc., 4.875%, 7/01/2018 | | | 3,999,900 | |
| | 1,190,000 | | | iStar, Inc., 5.000%, 7/01/2019 | | | 1,186,882 | |
| | 840,000 | | | iStar, Inc., 5.850%, 3/15/2017 | | | 850,030 | |
| | 1,900,000 | | | iStar, Inc., 6.500%, 7/01/2021 | | | 1,928,500 | |
| | 1,984,000 | | | Ladder Capital Finance Holdings LLLP/Ladder Capital Finance Corp.,
5.875%, 8/01/2021, 144A | | | 1,884,800 | |
| | 885,000 | | | Ladder Capital Finance Holdings LLLP/Ladder Capital Finance Corp.,
7.375%, 10/01/2017 | | | 891,638 | |
| | 815,000 | | | Navient Corp., MTN, 6.125%, 3/25/2024 | | | 758,969 | |
| | 875,000 | | | Navient LLC, MTN, 7.250%, 1/25/2022 | | | 892,500 | |
| | 115,000 | | | Navient LLC, Series A, MTN,
5.000%, 6/15/2018 | | | 115,000 | |
| | 5,550,000 | | | Navient LLC, Series A, MTN,
5.625%, 8/01/2033(c)(e) | | | 4,412,250 | |
| | 1,040,000 | | | Oxford Finance LLC/Oxford Finance Co-Issuer, Inc.,
7.250%, 1/15/2018, 144A | | | 1,038,700 | |
| | 3,205,000 | | | Springleaf Finance Corp., 5.250%, 12/15/2019 | | | 3,273,106 | |
| | 805,000 | | | Springleaf Finance Corp., 8.250%, 10/01/2023 | | | 845,250 | |
| | | | | | | | |
| | | | | | | 23,250,200 | |
| | | | | | | | |
| | | | Food & Beverage – 0.2% | | | | |
| | 1,081,000 | | | Wells Enterprises, Inc.,
6.750%, 2/01/2020, 144A | | | 1,116,133 | |
| | | | | | | | |
| | | | Government Guaranteed – 0.5% | | | | |
| | 4,720,000 | | | Queensland Treasury Corp.,
7.125%, 9/18/2017, 144A, (NZD) | | | 3,589,621 | |
| | | | | | | | |
| | | | Government Owned – No Guarantee – 0.1% | |
| | 900,000 | | | Petrobras Global Finance BV,
5.625%, 5/20/2043 | | | 679,500 | |
| | 75,000(††) | | | Petroleos Mexicanos,
7.650%, 11/24/2021, 144A, (MXN) | | | 376,359 | |
| | | | | | | | |
| | | | | | | 1,055,859 | |
| | | | | | | | |
See accompanying notes to financial statements.
| 40
Portfolio of Investments – as of September 30, 2016
Loomis Sayles Institutional High Income Fund – continued
| | | | | | | | |
Principal
Amount (‡) | | | Description | | Value (†) | |
| |
| | Bonds and Notes – continued | | | | |
| | |
| | | | Healthcare – 5.2% | | | | |
| $ | 1,080,000 | | | BioScrip, Inc., 8.875%, 2/15/2021 | | $ | 1,009,800 | |
| | 2,825,000 | | | HCA, Inc., 5.875%, 5/01/2023 | | | 3,008,625 | |
| | 1,065,000 | | | HCA, Inc., 7.050%, 12/01/2027 | | | 1,132,894 | |
| | 4,660,000 | | | HCA, Inc., 7.500%, 11/06/2033 | | | 5,050,275 | |
| | 1,815,000 | | | HCA, Inc., 7.690%, 6/15/2025 | | | 2,039,897 | |
| | 375,000 | | | HCA, Inc., 8.360%, 4/15/2024 | | | 435,405 | |
| | 2,945,000 | | | HCA, Inc., MTN, 7.580%, 9/15/2025 | | | 3,320,487 | |
| | 3,875,000 | | | HCA, Inc., MTN, 7.750%, 7/15/2036 | | | 4,199,531 | |
| | 2,475,000 | | | Hologic, Inc.,
5.250%, 7/15/2022, 144A | | | 2,626,594 | |
| | 1,465,000 | | | Kindred Healthcare, Inc., 8.000%, 1/15/2020 | | | 1,490,638 | |
| | 540,000 | | | Tenet Healthcare Corp., 5.000%, 3/01/2019 | | | 527,850 | |
| | 1,555,000 | | | Tenet Healthcare Corp., 6.750%, 6/15/2023 | | | 1,446,150 | |
| | 9,829,000 | | | Tenet Healthcare Corp., 6.875%, 11/15/2031 | | | 8,084,352 | |
| | 2,554,000 | | | Universal Health Services, Inc., 4.750%, 8/01/2022, 144A | | | 2,637,005 | |
| | | | | | | | |
| | | | | | | 37,009,503 | |
| | | | | | | | |
| | | | Home Construction – 1.5% | | | | |
| | 300,000 | | | Beazer Homes USA, Inc., 7.250%, 2/01/2023 | | | 298,500 | |
| | 2,205,000 | | | Beazer Homes USA, Inc.,
8.750%, 3/15/2022, 144A | | | 2,326,275 | |
| | 882,000 | | | K. Hovnanian Enterprises, Inc.,
5.000%, 11/01/2021(c)(e) | | | 617,400 | |
| | 595,000 | | | K. Hovnanian Enterprises, Inc.,
8.000%, 11/01/2019, 144A | | | 359,975 | |
| | 3,060,000 | | | Lennar Corp., 4.500%, 6/15/2019 | | | 3,205,350 | |
| | 400,000 | | | PulteGroup, Inc., 6.000%, 2/15/2035 | | | 404,000 | |
| | 2,425,000 | | | TRI Pointe Group, Inc., 4.875%, 7/01/2021 | | | 2,485,625 | |
| | 1,000,000 | | | TRI Pointe Holdings, Inc./TRI Pointe Group, Inc., 5.875%, 6/15/2024 | | | 1,040,000 | |
| | | | | | | | |
| | | | | | | 10,737,125 | |
| | | | | | | | |
| | | | Independent Energy – 7.6% | | | | |
| | 530,000 | | | Anadarko Petroleum Corp., 3.450%, 7/15/2024 | | | 522,793 | |
| | 480,000 | | | Anadarko Petroleum Corp., 4.500%, 7/15/2044 | | | 440,399 | |
| | 4,910,000 | | | Bellatrix Exploration Ltd.,
8.500%, 5/15/2020, 144A | | | 4,566,300 | |
| | 1,050,000 | | | Bonanza Creek Energy, Inc.,
5.750%, 2/01/2023 | | | 477,750 | |
| | 220,000 | | | Bonanza Creek Energy, Inc.,
6.750%, 4/15/2021 | | | 100,100 | |
| | 647,000 | | | California Resources Corp., 5.500%, 9/15/2021 | | | 342,910 | |
| | 106,000 | | | California Resources Corp., 6.000%, 11/15/2024 | | | 50,615 | |
| | 140,000 | | | California Resources Corp.,
8.000%, 12/15/2022, 144A | | | 93,100 | |
| | 1,000,000 | | | Chesapeake Energy Corp., 4.875%, 4/15/2022 | | | 842,500 | |
| | 150,000 | | | Chesapeake Energy Corp.,
6.250%, 1/15/2017, (EUR) | | | 166,817 | |
| | |
| | | | Independent Energy – continued | | | | |
| $ | 630,000 | | | Continental Resources, Inc., 3.800%, 6/01/2024 | | $ | 576,450 | |
| | 325,000 | | | Continental Resources, Inc., 4.500%, 4/15/2023 | | | 312,000 | |
| | 2,040,000 | | | Continental Resources, Inc., 5.000%, 9/15/2022 | | | 2,034,900 | |
| | 6,850,000 | | | Eclipse Resources Corp., 8.875%, 7/15/2023 | | | 6,674,469 | |
| | 405,000 | | | Jones Energy Holdings LLC/Jones Energy Finance Corp.,
6.750%, 4/01/2022 | | | 344,250 | |
| | 1,115,000 | | | MEG Energy Corp., 6.375%, 1/30/2023, 144A | | | 882,244 | |
| | 7,815,000 | | | MEG Energy Corp., 7.000%, 3/31/2024, 144A | | | 6,173,850 | |
| | 1,680,000 | | | Oasis Petroleum, Inc., 6.875%, 3/15/2022 | | | 1,608,600 | |
| | 1,075,000 | | | OGX Austria GmbH,
8.375%, 4/01/2022, 144A(c)(d)(f) | | | — | |
| | 400,000 | | | OGX Austria GmbH,
8.500%, 6/01/2018, 144A(c)(d)(f) | | | — | |
| | 565,000 | | | QEP Resources, Inc., 5.250%, 5/01/2023 | | | 556,525 | |
| | 340,000 | | | Range Resources Corp.,
5.000%, 8/15/2022, 144A | | | 338,300 | |
| | 5,250,000 | | | Rex Energy Corp., (Step to 8.000% on 10/01/2017), 1.000%, 10/01/2020(g) | | | 2,861,250 | |
| | 2,241,000 | | | RSP Permian, Inc., 6.625%, 10/01/2022 | | | 2,347,447 | |
| | 1,140,000 | | | Sanchez Energy Corp., 6.125%, 1/15/2023 | | | 914,850 | |
| | 1,270,000 | | | SM Energy Co., 5.000%, 1/15/2024 | | | 1,193,800 | |
| | 545,000 | | | SM Energy Co., 5.625%, 6/01/2025 | | | 512,300 | |
| | 572,000 | | | SM Energy Co., 6.125%, 11/15/2022 | | | 572,000 | |
| | 145,000 | | | SM Energy Co., 6.500%, 11/15/2021 | | | 148,263 | |
| | 1,000,000 | | | SM Energy Co., 6.500%, 1/01/2023 | | | 1,010,000 | |
| | 2,495,000 | | | Southwestern Energy Co., 4.100%, 3/15/2022 | | | 2,264,212 | |
| | 660,000 | | | Southwestern Energy Co., 5.800%, 1/23/2020 | | | 658,350 | |
| | 5,390,000 | | | Southwestern Energy Co., 6.700%, 1/23/2025 | | | 5,390,000 | |
| | 690,000 | | | Ultra Petroleum Corp.,
6.125%, 10/01/2024, 144A(f) | | | 545,100 | |
| | 4,526,000 | | | Whiting Petroleum Corp., 5.000%, 3/15/2019 | | | 4,378,905 | |
| | 2,005,000 | | | Whiting Petroleum Corp., 5.750%, 3/15/2021 | | | 1,874,675 | |
| | 1,690,000 | | | Whiting Petroleum Corp., 6.250%, 4/01/2023 | | | 1,542,125 | |
| | 950,000 | | | WPX Energy, Inc., 5.250%, 1/15/2017 | | | 957,125 | |
| | | | | | | | |
| | | | | | | 54,275,274 | |
| | | | | | | | |
| | | | Industrial Other – 0.3% | | | | |
| | 1,340,000 | | | Broadspectrum Ltd., 8.375%, 5/15/2020, 144A | | | 1,427,100 | |
| | 635,000 | | | Cleaver-Brooks, Inc.,
8.750%, 12/15/2019, 144A | | | 665,163 | |
| | | | | | | | |
| | | | | | | 2,092,263 | |
| | | | | | | | |
See accompanying notes to financial statements.
41 |
Portfolio of Investments – as of September 30, 2016
Loomis Sayles Institutional High Income Fund – continued
| | | | | | | | |
Principal
Amount (‡) | | | Description | | Value (†) | |
| |
| | Bonds and Notes – continued | | | | |
| | |
| | | | Integrated Energy – 0.0% | | | | |
| $ | 1,075,000 | | | Pacific Exploration and Production Corp., 5.125%, 3/28/2023, 144A(f) | | $ | 198,875 | |
| | 625,000 | | | Pacific Exploration and Production Corp., 5.625%, 1/19/2025, 144A(f) | | | 115,625 | |
| | | | | | | | |
| | | | | | | 314,500 | |
| | | | | | | | |
| | | | Life Insurance – 0.4% | | | | |
| | 280,000 | | | MetLife Capital Trust X,
9.250%, 4/08/2068, 144A | | | 402,836 | |
| | 1,530,000 | | | MetLife, Inc., 10.750%, 8/01/2069 | | | 2,451,978 | |
| | | | | | | | |
| | | | | | | 2,854,814 | |
| | | | | | | | |
| | | | Local Authorities – 0.2% | | | | |
| | 2,095,000 | | | New South Wales Treasury Corp.,
6.000%, 2/01/2018, (AUD) | | | 1,693,778 | |
| | | | | | | | |
| | | | Media Entertainment – 0.4% | | | | |
| | 1,000,000 | | | iHeartCommunications, Inc.,
9.000%, 3/01/2021 | | | 745,000 | |
| | 1,890,000 | | | iHeartCommunications, Inc.,
9.000%, 9/15/2022 | | | 1,374,975 | |
| | 739,000 | | | R.R. Donnelley & Sons Co.,
7.625%, 6/15/2020 | | | 799,968 | |
| | | | | | | | |
| | | | | | | 2,919,943 | |
| | | | | | | | |
| | | | Metals & Mining – 6.6% | | | | |
| | 4,146,853 | | | 1839688 Alberta ULC, PIK,
14.000%, 2/13/2020(c)(d)(f)(h) | | | 1,659 | |
| | 500,000 | | | AK Steel Corp., 7.625%, 10/01/2021 | | | 480,000 | |
| | 2,210,000 | | | Alcoa, Inc., 5.125%, 10/01/2024 | | | 2,350,888 | |
| | 650,000 | | | Alcoa, Inc., 5.400%, 4/15/2021 | | | 695,500 | |
| | 3,155,000 | | | Alcoa, Inc., 5.950%, 2/01/2037 | | | 3,172,352 | |
| | 3,000,000 | | | ArcelorMittal, 6.250%, 8/05/2020 | | | 3,262,500 | |
| | 5,685,000 | | | Barminco Finance Pty Ltd.,
9.000%, 6/01/2018, 144A | | | 5,500,237 | |
| | 1,880,000 | | | Barrick Gold Corp., 5.250%, 4/01/2042 | | | 2,061,627 | |
| | 210,000 | | | Cliffs Natural Resources, Inc.,
8.000%, 9/30/2020, 144A | | | 205,800 | |
| | 945,000 | | | Essar Steel Algoma, Inc.,
9.500%, 11/15/2019, 144A(c)(e)(f) | | | 127,575 | |
| | 290,000 | | | First Quantum Minerals Ltd.,
7.250%, 10/15/2019, 144A | | | 275,500 | |
| | 4,530,000 | | | First Quantum Minerals Ltd.,
7.250%, 5/15/2022, 144A | | | 4,009,050 | |
| | 785,000 | | | Freeport-McMoran Oil & Gas LLC/FCX Oil & Gas, Inc.,
6.500%, 11/15/2020 | | | 805,606 | |
| | 12,000,000 | | | Freeport-McMoRan, Inc., 5.450%, 3/15/2043 | | | 9,630,000 | |
| | 3,960,000 | | | Hecla Mining Co., 6.875%, 5/01/2021 | | | 3,974,850 | |
| | 535,000 | | | Lundin Mining Corp.,
7.500%, 11/01/2020, 144A | | | 568,438 | |
| | 1,860,000 | | | Lundin Mining Corp.,
7.875%, 11/01/2022, 144A | | | 1,980,900 | |
| | 800,000 | | | Rain CII Carbon LLC/CII Carbon Corp., 8.250%, 1/15/2021, 144A | | | 780,000 | |
| | 4,000,000 | | | United States Steel Corp., 6.650%, 6/01/2037 | | | 3,200,000 | |
| | |
| | | | Metals & Mining – continued | | | | |
| 750,000 | | | United States Steel Corp., 7.375%, 4/01/2020 | | | 746,250 | |
| | 3,680,000 | | | United States Steel Corp., 7.500%, 3/15/2022 | | | 3,624,800 | |
| | | | | | | | |
| | | | | | | 47,453,532 | |
| | | | | | | | |
| | | | Midstream – 1.3% | | | | |
| | 800,000 | | | Blue Racer Midstream LLC/Blue Racer Finance Corp.,
6.125%, 11/15/2022, 144A | | | 782,000 | |
| | 2,545,000 | | | Gibson Energy, Inc.,
5.375%, 7/15/2022, 144A, (CAD) | | | 1,886,514 | |
| | 5,415,000 | | | Regency Energy Partners LP/Regency Energy Finance Corp., 5.000%, 10/01/2022 | | | 5,715,246 | |
| | 764,273 | | | Transportadora de Gas del Sur S.A.,
9.625%, 5/14/2020, 144A | | | 827,326 | |
| | | | | | | | |
| | | | | | | 9,211,086 | |
| | | | | | | | |
| | | | Non-Agency Commercial Mortgage-Backed Securities – 0.2% | |
| | 320,000 | | | GS Mortgage Securities Trust, Series 2007-GG10, Class AM,
5.988%, 8/10/2045(i) | | | 308,009 | |
| | 1,434,127 | | | Motel 6 Trust, Series 2015-M6MZ, Class M,
8.230%, 2/05/2020, 144A(c)(e) | | | 1,443,538 | |
| | | | | | | | |
| | | | | | | 1,751,547 | |
| | | | | | | | |
| | | | Oil Field Services – 1.5% | | | | |
| | 1,790,000 | | | Basic Energy Services, Inc.,
7.750%, 10/15/2022 | | | 662,300 | |
| | 3,255,000 | | | FTS International, Inc., 6.250%, 5/01/2022 | | | 1,245,037 | |
| | 1,330,000 | | | Paragon Offshore PLC,
6.750%, 7/15/2022, 144A(f) | | | 369,075 | |
| | 3,072,000 | | | Paragon Offshore PLC,
7.250%, 8/15/2024, 144A(f) | | | 852,480 | |
| | 6,050,000 | | | Pioneer Energy Services Corp.,
6.125%, 3/15/2022 | | | 3,993,000 | |
| | 3,006,000 | | | Precision Drilling Corp.,
6.625%, 11/15/2020 | | | 2,788,065 | |
| | 4,675,000 | | | Sidewinder Drilling, Inc.,
9.750%, 11/15/2019, 144A | | | 303,875 | |
| | 530,000 | | | Transocean, Inc., 6.800%, 3/15/2038 | | | 347,150 | |
| | | | | | | | |
| | | | | | | 10,560,982 | |
| | | | | | | | |
| | | | Packaging – 0.9% | | | | |
| | 335,000 | | | Ardagh Packaging Finance PLC/Ardagh Holdings USA, Inc.,
6.000%, 6/30/2021, 144A | | | 344,213 | |
| | 4,050,000 | | | Reynolds Group Issuer, Inc./Reynolds Group Issuer LLC/Reynolds Group Issuer (Luxembourg) S.A.,
8.250%, 2/15/2021 | | | 4,222,125 | |
| | 1,830,000 | | | Sealed Air Corp.,
5.500%, 9/15/2025, 144A | | | 1,962,675 | |
| | | | | | | | |
| | | | | | | 6,529,013 | |
| | | | | | | | |
| | | | Property & Casualty Insurance – 0.6% | |
| | 1,920,000 | | | MBIA Insurance Corp.,
11.940%, 1/15/2033, 144A(i)(j) | | | 768,000 | |
See accompanying notes to financial statements.
| 42
Portfolio of Investments – as of September 30, 2016
Loomis Sayles Institutional High Income Fund – continued
| | | | | | | | |
Principal
Amount (‡) | | | Description | | Value (†) | |
| |
| | Bonds and Notes – continued | | | | |
| |
| | | | Property & Casualty Insurance – continued | |
| $ | 3,245,000 | | | Sirius International Group, (fixed rate to 6/30/2017, variable rate thereafter),
7.506%, 144A(b) | | $ | 3,265,768 | |
| | | | | | | | |
| | | | | | | 4,033,768 | |
| | | | | | | | |
| | | | Railroads – 0.0% | | | | |
| | 314,000 | | | Missouri Pacific Railroad Co.,
5.000%, 1/01/2045(c)(e) | | | 307,027 | |
| | 30,000 | | | Missouri Pacific Railroad Co., Series A, 4.750%, 1/01/2020(c)(e) | | | 29,924 | |
| | | | | | | | |
| | | | | | | 336,951 | |
| | | | | | | | |
| | | | REITs – Office Property – 0.1% | | | | |
| | 470,000 | | | Highwoods Realty LP, 5.850%, 3/15/2017 | | | 478,446 | |
| | | | | | | | |
| | |
| | | | Restaurants – 0.1% | | | | |
| | 405,000 | | | Wagamama Finance PLC,
7.875%, 2/01/2020, 144A, (GBP) | | | 551,844 | |
| | | | | | | | |
| | |
| | | | Retailers – 1.6% | | | | |
| | 1,679,000 | | | Foot Locker, Inc., 8.500%, 1/15/2022 | | | 1,981,220 | |
| | 500,000 | | | Group 1 Automotive, Inc., 5.000%, 6/01/2022 | | | 501,560 | |
| | 1,925,000 | | | J.C. Penney Corp., Inc., 5.650%, 6/01/2020 | | | 1,929,582 | |
| | 675,000 | | | J.C. Penney Corp., Inc., 5.750%, 2/15/2018 | | | 698,625 | |
| | 165,000 | | | J.C. Penney Corp., Inc., 6.375%, 10/15/2036 | | | 141,900 | |
| | 1,265,000 | | | J.C. Penney Corp., Inc., 8.125%, 10/01/2019 | | | 1,378,850 | |
| | 3,005,000 | | | Nine West Holdings, Inc.,
6.125%, 11/15/2034 | | | 390,650 | |
| | 4,499,000 | | | TRU Taj LLC/TRU Taj Finance, Inc., 12.000%, 8/15/2021, 144A | | | 4,532,742 | |
| | | | | | | | |
| | | | | | | 11,555,129 | |
| | | | | | | | |
| | | | Supermarkets – 3.9% | | | | |
| | 6,060,000 | | | New Albertson’s, Inc., 7.450%, 8/01/2029 | | | 5,938,800 | |
| | 2,865,000 | | | New Albertson’s, Inc., 7.750%, 6/15/2026 | | | 2,854,256 | |
| | 10,375,000 | | | New Albertson’s, Inc., 8.000%, 5/01/2031 | | | 10,232,344 | |
| | 5,625,000 | | | New Albertson’s, Inc., 8.700%, 5/01/2030 | | | 5,709,375 | |
| | 1,100,000 | | | New Albertson’s, Inc., Series C, MTN, 6.625%, 6/01/2028 | | | 1,012,000 | |
| | 825,000 | | | Safeway, Inc., 3.950%, 8/15/2020 | | | 787,875 | |
| | 1,570,000 | | | SUPERVALU, Inc., 7.750%, 11/15/2022 | | | 1,499,350 | |
| | | | | | | | |
| | | | | | | 28,034,000 | |
| | | | | | | | |
| | | | Technology – 2.0% | | | | |
| | 874,000 | | | Advanced Micro Devices, Inc.,
7.000%, 7/01/2024 | | | 858,705 | |
| | 1,499,000 | | | Alcatel-Lucent USA, Inc.,
6.450%, 3/15/2029 | | | 1,658,269 | |
| | |
| | | | Technology – continued | | | | |
| 4,210,000 | | | Alcatel-Lucent USA, Inc., 6.500%, 1/15/2028 | | | 4,588,900 | |
| | 3,420,000 | | | Amkor Technology, Inc., 6.375%, 10/01/2022 | | | 3,531,150 | |
| | 1,000,000 | | | Micron Technology, Inc., 5.500%, 2/01/2025 | | | 980,000 | |
| | 2,210,000 | | | Microsemi Corp.,
9.125%, 4/15/2023, 144A | | | 2,519,400 | |
| | 12,000 | | | Motorola Solutions, Inc., 6.625%, 11/15/2037 | | | 12,430 | |
| | | | | | | | |
| | | | | | | 14,148,854 | |
| | | | | | | | |
| | | | Transportation Services – 0.4% | | | | |
| | 3,285,000 | | | APL Ltd., 8.000%, 1/15/2024(c)(e) | | | 2,168,100 | |
| | 355,384 | | | Atlas Air Pass Through Trust, Series 1998-1, Class B,
7.680%, 1/02/2018(d) | | | 361,603 | |
| | 87,732 | | | Atlas Air Pass Through Trust, Series 1998-1, Class C,
8.010%, 7/02/2011(d)(k) | | | 89,706 | |
| | 42,921 | | | Atlas Air Pass Through Trust, Series 1999-1, Class B,
7.630%, 1/02/2018(d) | | | 42,921 | |
| | 191,503 | | | Atlas Air Pass Through Trust, Series 1999-1, Class C,
8.770%, 7/02/2012(d)(k) | | | 197,248 | |
| | | | | | | | |
| | | | | | | 2,859,578 | |
| | | | | | | | |
| | | | Treasuries – 7.9% | | | | |
| | 2,385,000 | | | Hellenic Republic Government Bond,
3.375%, 7/17/2017, 144A, (EUR) | | | 2,619,416 | |
| | 350,000 | | | Hellenic Republic Government Bond, Series PSI, (Step to 3.650% on 2/24/2020), 3.000%, 2/24/2024, (EUR)(g) | | | 287,482 | |
| | 270,000 | | | Hellenic Republic Government Bond, Series PSI, (Step to 3.650% on 2/24/2020), 3.000%, 2/24/2035, (EUR)(g) | | | 178,651 | |
| | 170,000 | | | Hellenic Republic Government Bond, Series PSI, (Step to 3.650% on 2/24/2020), 3.000%, 2/24/2036, (EUR)(g) | | | 112,855 | |
| | 40,000 | | | Hellenic Republic Government Bond, Series PSI, (Step to 3.650% on 2/24/2020), 3.000%, 2/24/2037, (EUR)(g) | | | 26,364 | |
| | 490,000 | | | Hellenic Republic Government Bond, Series PSI, (Step to 3.650% on 2/24/2020), 3.000%, 2/24/2038, (EUR)(g) | | | 319,698 | |
| | 635,000 | | | Hellenic Republic Government Bond, Series PSI, (Step to 3.650% on 2/24/2020), 3.000%, 2/24/2039, (EUR)(g) | | | 414,820 | |
| | 60,000 | | | Hellenic Republic Government Bond, Series PSI, (Step to 3.650% on 2/24/2020), 3.000%, 2/24/2040, (EUR)(g) | | | 39,087 | |
| | 1,540,000 | | | Hellenic Republic Government Bond, Series PSI, (Step to 3.650% on 2/24/2020), 3.000%, 2/24/2041, (EUR)(g) | | | 1,005,023 | |
See accompanying notes to financial statements.
43 |
Portfolio of Investments – as of September 30, 2016
Loomis Sayles Institutional High Income Fund – continued
| | | | | | | | |
Principal
Amount (‡) | | | Description | | Value (†) | |
| |
| | Bonds and Notes – continued | | | | |
| | |
| | | | Treasuries – continued | | | | |
| | 48,865,000 | | | Iceland Government International Bond, 6.000%, 10/13/2016, (ISK) | | $ | 290,819 | |
| | 24,750,000 | | | Iceland Government International Bond, 7.250%, 10/26/2022, (ISK) | | | 162,790 | |
| | 50,205,000 | | | Iceland Government International Bond, 8.750%, 2/26/2019, (ISK) | | | 322,149 | |
| | 110,000(††) | | | Mexican Fixed Rate Bonds, Series M,
7.750%, 5/29/2031, (MXN) | | | 641,720 | |
| | 310,000(††) | | | Mexican Fixed Rate Bonds, Series M-20,
7.500%, 6/03/2027, (MXN) | | | 1,768,564 | |
| | 1,595,000(††) | | | Mexican Fixed Rate Bonds, Series M-20,
8.000%, 12/07/2023, (MXN) | | | 9,247,862 | |
| | 75,000(††) | | | Mexican Fixed Rate Bonds, Series M-20,
8.500%, 5/31/2029, (MXN) | | | 462,221 | |
| | 490,000(††) | | | Mexican Fixed Rate Bonds, Series M-20,
10.000%, 12/05/2024, (MXN) | | | 3,192,473 | |
| | 15,955,000 | | | New Zealand Government Bond,
5.000%, 3/15/2019, (NZD) | | | 12,470,975 | |
| | 1,575,000 | | | Norway Government Bond,
3.750%, 5/25/2021, 144A, (NOK) | | | 222,446 | |
| | 1,590,000 | | | Norway Government Bond,
4.250%, 5/19/2017, 144A, (NOK) | | | 203,445 | |
| | 2,260,000 | | | Norway Government Bond,
4.500%, 5/22/2019, 144A, (NOK) | | | 310,363 | |
| | 4,170,000 | | | Republic of Brazil,
10.250%, 1/10/2028, (BRL) | | | 1,301,462 | |
| | 20,850,000 | | | U.S. Treasury Note,
0.750%, 1/31/2018 | | | 20,857,339 | |
| | | | | | | | |
| | | | | | | 56,458,024 | |
| | | | | | | | |
| | | | Wireless – 1.4% | | | | |
| | 29,970,000 | | | America Movil SAB de CV,
6.450%, 12/05/2022, (MXN) | | | 1,505,475 | |
| | 7,280,000 | | | Sprint Capital Corp., 6.875%, 11/15/2028 | | | 6,834,100 | |
| | 215,000 | | | Sprint Capital Corp., 8.750%, 3/15/2032 | | | 219,300 | |
| | 605,000 | | | Sprint Communications, Inc.,
6.000%, 11/15/2022 | | | 561,137 | |
| | 760,000 | | | Sprint Corp., 7.125%, 6/15/2024 | | | 741,000 | |
| | | | | | | | |
| | | | | | | 9,861,012 | |
| | | | | | | | |
| | | | Wirelines – 6.1% | | | | |
| | 1,350,000 | | | CenturyLink, Inc., 7.650%, 3/15/2042 | | | 1,164,375 | |
| | 1,495,000 | | | CenturyLink, Inc., Series P,
7.600%, 9/15/2039 | | | 1,300,650 | |
| | 385,000 | | | Cincinnati Bell Telephone Co. LLC, 6.300%, 12/01/2028 | | | 366,231 | |
| | 2,460,000 | | | Cincinnati Bell, Inc.,
7.000%, 7/15/2024, 144A | | | 2,521,500 | |
| | |
| | | | Wirelines – continued | | | | |
| 2,595,000 | | | Communications Sales & Leasing, Inc./CSL Capital LLC,
8.250%, 10/15/2023 | | | 2,723,427 | |
| | 1,539,000 | | | Consolidated Communications, Inc., 6.500%, 10/01/2022 | | | 1,492,830 | |
| | 1,620,000 | | | FairPoint Communications, Inc.,
8.750%, 8/15/2019, 144A | | | 1,652,400 | |
| | 1,945,000 | | | Frontier Communications Corp.,
6.875%, 1/15/2025 | | | 1,721,325 | |
| | 465,000 | | | Frontier Communications Corp.,
7.000%, 11/01/2025 | | | 409,200 | |
| | 4,851,000 | | | Frontier Communications Corp.,
7.875%, 1/15/2027 | | | 4,341,645 | |
| | 902,000 | | | Frontier Communications Corp.,
8.750%, 4/15/2022 | | | 920,040 | |
| | 2,600,000 | | | Frontier Communications Corp.,
9.000%, 8/15/2031 | | | 2,392,000 | |
| | 940,000 | | | Frontier Communications Corp.,
11.000%, 9/15/2025 | | | 981,125 | |
| | 1,160,000 | | | Level 3 Communications, Inc.,
5.750%, 12/01/2022 | | | 1,212,200 | |
| | 200,000 | | | Oi Brasil Holdings Cooperatief UA, 5.750%, 2/10/2022, 144A(f) | | | 50,250 | |
| | 900,000 | | | Portugal Telecom International Finance BV, EMTN, 4.500%, 6/16/2025, (EUR)(j) | | | 232,533 | |
| | 2,100,000 | | | Portugal Telecom International Finance BV, EMTN, 5.000%, 11/04/2019, (EUR)(j) | | | 542,578 | |
| | 800,000 | | | Qwest Capital Funding, Inc.,
6.875%, 7/15/2028 | | | 756,000 | |
| | 1,385,000 | | | Qwest Capital Funding, Inc.,
7.625%, 8/03/2021 | | | 1,426,550 | |
| | 5,332,000 | | | Qwest Capital Funding, Inc.,
7.750%, 2/15/2031 | | | 5,172,040 | |
| | 645,000 | | | Qwest Corp., 7.250%, 9/15/2025 | | | 705,842 | |
| | 1,407,000 | | | Qwest Corp., 7.250%, 10/15/2035 | | | 1,392,053 | |
| | 2,827,000 | | | Telecom Italia Capital S.A.,
6.000%, 9/30/2034 | | | 2,799,437 | |
| | 2,140,000 | | | Telecom Italia Capital S.A.,
6.375%, 11/15/2033 | | | 2,177,450 | |
| | 610,000 | | | Windstream Services LLC,
7.500%, 6/01/2022 | | | 585,600 | |
| | 4,155,000 | | | Windstream Services LLC,
7.500%, 4/01/2023 | | | 3,968,025 | |
| | 260,000 | | | Windstream Services LLC,
7.750%, 10/15/2020 | | | 264,550 | |
| | 375,000 | | | Windstream Services LLC,
7.750%, 10/01/2021 | | | 374,062 | |
| | | | | | | | |
| | | | | | | 43,645,918 | |
| | | | | | | | |
| | |
| | | | Total Non-Convertible Bonds | | | | |
| | | | (Identified Cost $501,236,562) | | | 497,936,071 | |
| | | | | | | | |
|
| | Convertible Bonds – 13.3% | |
| | |
| | | | Automotive – 0.3% | | | | |
| | 2,331,000 | | | Navistar International Corp.,
4.500%, 10/15/2018 | | | 2,205,709 | |
See accompanying notes to financial statements.
| 44
Portfolio of Investments – as of September 30, 2016
Loomis Sayles Institutional High Income Fund – continued
| | | | | | | | |
Principal
Amount (‡) | | | Description | | Value (†) | |
| |
| | Bonds and Notes – continued | | | | |
| | |
| | | | Automotive – continued | | | | |
| $ | 195,000 | | | Navistar International Corp.,
4.750%, 4/15/2019 | | $ | 180,984 | |
| | | | | | | | |
| | | | | | | 2,386,693 | |
| | | | | | | | |
| | | | Building Materials – 1.4% | | | | |
| | 3,510,000 | | | CalAtlantic Group, Inc., 0.250%, 6/01/2019 | | | 3,251,137 | |
| | 2,050,000 | | | CalAtlantic Group, Inc., 1.250%, 8/01/2032 | | | 2,135,844 | |
| | 770,000 | | | KB Home, 1.375%, 2/01/2019 | | | 748,825 | |
| | 2,295,000 | | | Lennar Corp., 3.250%, 11/15/2021 | | | 4,133,869 | |
| | | | | | | | |
| | | | | | | 10,269,675 | |
| | | | | | | | |
| | | | Cable Satellite – 1.6% | | | | |
| | 10,465,000 | | | Dish Network Corp.,
3.375%, 8/15/2026, 144A | | | 11,459,175 | |
| | | | | | | | |
| | | | Consumer Products – 0.4% | | | | |
| | 3,622,000 | | | Iconix Brand Group, Inc.,
1.500%, 3/15/2018 | | | 3,123,975 | |
| | | | | | | | |
| | | | Diversified Manufacturing – 0.4% | | | | |
| | 2,315,000 | | | Trinity Industries, Inc., 3.875%, 6/01/2036 | | | 2,766,425 | |
| | | | | | | | |
| | | | Finance Companies – 0.1% | | | | |
| | 390,000 | | | Euronet Worldwide, Inc., 1.500%, 10/01/2044 | | | 490,912 | |
| | | | | | | | |
| | | | Healthcare – 0.3% | | | | |
| | 1,325,000 | | | Hologic, Inc., (accretes to principal after 3/01/2018), 2.000%, 3/01/2042(g) | | | 1,805,312 | |
| | | | | | | | |
| | | | Leisure – 0.4% | | | | |
| | 3,000,000 | | | Rovi Corp., 0.500%, 3/01/2020 | | | 2,989,590 | |
| | | | | | | | |
| | | | Metals & Mining – 0.4% | | | | |
| | 1,895,000 | | | RTI International Metals, Inc.,
1.625%, 10/15/2019 | | | 2,020,544 | |
| | 460,000 | | | TimkenSteel Corp., 6.000%, 6/01/2021 | | | 505,425 | |
| | | | | | | | |
| | | | | | | 2,525,969 | |
| | | | | | | | |
| | | | Midstream – 1.0% | | | | |
| | 6,200,000 | | | Chesapeake Energy Corp., 2.250%, 12/15/2038 | | | 5,773,750 | |
| | 572,000 | | | Chesapeake Energy Corp., 2.500%, 5/15/2037 | | | 568,425 | |
| | 928,000 | | | Whiting Petroleum Corp.,
Series 2, 1.250%, 6/05/2020 | | | 890,880 | |
| | | | | | | | |
| | | | | | | 7,233,055 | |
| | | | | | | | |
| | | | Pharmaceuticals – 0.3% | | | | |
| | 225,000 | | | BioMarin Pharmaceutical, Inc.,
0.750%, 10/15/2018 | | | 269,860 | |
| | 310,000 | | | BioMarin Pharmaceutical, Inc.,
1.500%, 10/15/2020 | | | 386,531 | |
| | 750,000 | | | Intercept Pharmaceuticals, Inc.,
3.250%, 7/01/2023 | | | 838,594 | |
| | 255,000 | | | Ironwood Pharmaceuticals, Inc.,
2.250%, 6/15/2022 | | | 303,928 | |
| | | | | | | | |
| | | | | | | 1,798,913 | |
| | | | | | | | |
| |
| | | | Property & Casualty Insurance – 1.1% | |
| 6,533,000 | | | Old Republic International Corp.,
3.750%, 3/15/2018 | | | 7,843,683 | |
| | | | | | | | |
| | | | Technology – 5.6% | | | | |
| | 1,490,000 | | | Brocade Communications Systems, Inc., 1.375%, 1/01/2020 | | | 1,470,444 | |
| | 7,895,000 | | | Ciena Corp., 0.875%, 6/15/2017 | | | 7,850,591 | |
| | 4,140,000 | | | Ciena Corp., 3.750%, 10/15/2018, 144A | | | 5,237,100 | |
| | 3,595,000 | | | Intel Corp., 3.250%, 8/01/2039 | | | 6,574,356 | |
| | 42,179 | | | Liberty Interactive LLC, 3.500%, 1/15/2031 | | | 39,234 | |
| | 9,900,000 | | | Micron Technology, Inc., Series G,
3.000%, 11/15/2043 | | | 8,798,625 | |
| | 9,525,000 | | | Nuance Communications, Inc.,
1.000%, 12/15/2035, 144A | | | 8,286,750 | |
| | 989,000 | | | Nuance Communications, Inc.,
1.500%, 11/01/2035 | | | 927,806 | |
| | 830,000 | | | Viavi Solutions, Inc.,
0.625%, 8/15/2033 | | | 825,850 | |
| | | | | | | | |
| | | | | | | 40,010,756 | |
| | | | | | | | |
| | |
| | | | Total Convertible Bonds | | | | |
| | | | (Identified Cost $81,887,720) | | | 94,704,133 | |
| | | | | | | | |
|
| | Municipals – 0.5% | |
| | |
| | | | District of Columbia – 0.1% | | | | |
| | 540,000 | | | Metropolitan Washington Airports Authority, Series D,
8.000%, 10/01/2047 | | | 745,572 | |
| | | | | | | | |
| | | | Puerto Rico – 0.4% | | | | |
| | 4,260,000 | | | Commonwealth of Puerto Rico, GO, Refunding, Series A,
8.000%, 7/01/2035(f) | | | 2,784,975 | |
| | | | | | | | |
| | |
| | | | Total Municipals | | | | |
| | | | (Identified Cost $4,105,940) | | | 3,530,547 | |
| | | | | | | | |
| | |
| | | | Total Bonds and Notes | | | | |
| | | | (Identified Cost $587,230,222) | | | 596,170,751 | |
| | | | | | | | |
|
| | Loan Participations – 0.1% | |
| | |
| | | | ABS Other – 0.1% | | | | |
| | 649,869 | | | Rise Ltd., Series 2014-1, Class B,
6.500%, 2/15/2039(c)(e)(i)
(Identified Cost $654,743) | | | 642,558 | |
| | | | | | | | |
|
| | Senior Loans – 1.1% | |
| | |
| | | | Chemicals – 0.3% | | | | |
| | 529,423 | | | Emerald Performance Materials LLC, New 1st Lien Term Loan,
4.500%, 8/01/2021(i) | | | 532,404 | |
| | 235,214 | | | Emerald Performance Materials LLC, New 2nd Lien Term Loan,
7.750%, 8/01/2022(i) | | | 234,626 | |
| | 1,610,000 | | | Houghton International, Inc., New 2nd Lien Term Loan,
9.750%, 12/20/2020(i) | | | 1,585,850 | |
| | | | | | | | |
| | | | | | | 2,352,880 | |
| | | | | | | | |
See accompanying notes to financial statements.
45 |
Portfolio of Investments – as of September 30, 2016
Loomis Sayles Institutional High Income Fund – continued
| | | | | | | | |
Principal
Amount (‡) | | | Description | | Value (†) | |
|
| | Senior Loans – continued | |
| | |
| | | | Diversified Manufacturing – 0.1% | | | | |
| $ | 509,842 | | | Ameriforge Group, Inc., 1st Lien Term Loan, 5.000%, 12/19/2019(i) | | $ | 285,511 | |
| | | | | | | | |
| | | | Financial Other – 0.1% | | | | |
| | 728,900 | | | DBRS Ltd., Term Loan, 6.250%, 3/04/2022(i) | | | 714,781 | |
| | | | | | | | |
| | | | Media Entertainment – 0.0% | | | | |
| | 13,864 | | | Dex Media, Inc., Term Loan,
11.000%, 7/29/2021(i) | | | 13,206 | |
| | | | | | | | |
| | | | Oil Field Services – 0.1% | | | | |
| | 436,364 | | | FTS International, Inc., New Term Loan B, 5.750%, 4/16/2021(i) | | | 171,491 | |
| | 156,778 | | | Petroleum Geo-Services ASA, New Term Loan B, 3.250%, 3/19/2021(i) | | | 103,082 | |
| | 95,596 | | | UTEX Industries, Inc., 2nd Lien Term
Loan 2014, 8.250%, 5/22/2022(i) | | | 45,408 | |
| | | | | | | | |
| | | | | | | 319,981 | |
| | | | | | | | |
| | | | Other Utility – 0.1% | | | | |
| | 408,038 | | | PowerTeam Services LLC, 1st Lien Term Loan, 4.250%, 5/06/2020(i) | | | 406,508 | |
| | 325,000 | | | PowerTeam Services LLC, 2nd Lien Term Loan, 8.250%, 11/06/2020(i) | | | 323,375 | |
| | | | | | | | |
| | | | | | | 729,883 | |
| | | | | | | | |
| | | | Retailers – 0.0% | | | | |
| | 301,886 | | | Toys “R” Us Property Co. I LLC, New Term Loan B, 6.000%, 8/21/2019(i) | | | 284,150 | |
| | | | | | | | |
| | | | Supermarkets – 0.1% | | | | |
| | 837,246 | | | Supervalu, Inc., Refi Term Loan B,
5.500%, 3/21/2019(i) | | | 838,100 | |
| | | | | | | | |
| | | | Technology – 0.0% | | | | |
| | 128,399 | | | IQOR U.S., Inc., 2nd Lien Term Loan, 9.750%, 4/01/2022(c)(e)(i) | | | 90,521 | |
| | | | | | | | |
| | | | Transportation Services – 0.0% | | | | |
| | 145,675 | | | OSG Bulk Ships, Inc., OBS Term Loan, 5.250%, 8/05/2019(i) | | | 145,129 | |
| | | | | | | | |
| | | | Wirelines – 0.3% | | | | |
| | 723,750 | | | Fairpoint Communications, Inc., Refi Term Loan, 7.500%, 2/14/2019(i) | | | 723,359 | |
| | 718,192 | | | Hawaiian Telcom Communications, Inc., Term Loan B, 5.250%, 6/06/2019(i) | | | 721,603 | |
| | 532,532 | | | Integra Telecom, Inc., 2nd Lien Term Loan, 9.750%, 2/12/2021(c)(e)(i) | | | 503,243 | |
| | | | | | | | |
| | | | | | | 1,948,205 | |
| | | | | | | | |
| | |
| | | | Total Senior Loans | | | | |
| | | | (Identified Cost $8,340,652) | | | 7,722,347 | |
| | | | | | | | |
| | |
| | Shares | | | | | | | |
|
| | Common Stocks – 10.8% | |
| | |
| | | | Airlines – 0.4% | | | | |
| | 52,244 | | | United Continental Holdings, Inc.(j) | | | 2,741,243 | |
| | | | | | | | |
| | | | Automobiles – 1.5% | | | | |
| | 876,900 | | | Ford Motor Co. | | | 10,584,183 | |
| | | | | | | | |
| | | | Chemicals – 0.1% | | | | |
| | 4,302 | | | PPG Industries, Inc. | | | 444,655 | |
| | | | | | | | |
| | | | Containers & Packaging – 0.1% | | | | |
| | 40,621 | | | Owens-Illinois, Inc.(j) | | | 747,020 | |
| | | | | | | | |
| | | | Diversified Telecommunication Services – 0.1% | |
| | 78,091 | | | Telefonica S.A., Sponsored ADR | | | 787,157 | |
| | | | | | | | |
| | | | Electronic Equipment, Instruments & Components – 3.7% | |
| | 1,119,766 | | | Corning, Inc. | | | 26,482,466 | |
| | | | | | | | |
| | | | Energy Equipment & Services – 0.0% | |
| | 142,224 | | | Hercules Offshore, Inc.(j) | | | 246,048 | |
| | | | | | | | |
| | | | Household Durables – 0.1% | | | | |
| | 6,775 | | | KB Home | | | 109,213 | |
| | 8,126 | | | Newell Brands, Inc. | | | 427,915 | |
| | | | | | | | |
| | | | | | | 537,128 | |
| | | | | | | | |
| | | | Internet Software & Services – 0.0% | |
| | 2,154 | | | Dex Media, Inc.(d)(j) | | | 4,282 | |
| | | | | | | | |
| | | | Metals & Mining – 0.2% | | | | |
| | 202,147 | | | ArcelorMittal, (Registered)(j) | | | 1,220,968 | |
| | 6,543 | | | Cliffs Natural Resources, Inc.(j) | | | 38,277 | |
| | | | | | | | |
| | | | | | | 1,259,245 | |
| | | | | | | | |
| | | | Multi-Utilities – 0.1% | | | | |
| | 10,224 | | | CMS Energy Corp. | | | 429,510 | |
| | | | | | | | |
| | | | Oil, Gas & Consumable Fuels – 0.4% | |
| | 2,846 | | | Chesapeake Energy Corp.(j) | | | 17,844 | |
| | 10,741 | | | Halcon Resources Corp.(j) | | | 100,751 | |
| | 23,429 | | | OGX Petroleo e Gas S.A., Sponsored ADR | | | 15,698 | |
| | 82,985 | | | Repsol YPF S.A., Sponsored ADR | | | 1,132,745 | |
| | 78,750 | | | Rex Energy Corp.(j) | | | 45,982 | |
| | 33,796 | | | Royal Dutch Shell PLC, Sponsored ADR | | | 1,692,166 | |
| | 42,858 | | | Whiting Petroleum Corp.(j) | | | 374,579 | |
| | | | | | | | |
| | | | | | | 3,379,765 | |
| | | | | | | | |
| | | | Pharmaceuticals – 0.5% | | | | |
| | 64,900 | | | Bristol-Myers Squibb Co. | | | 3,499,408 | |
| | | | | | | | |
| | | | REITs – Apartments – 0.0% | | | | |
| | 6,185 | | | Apartment Investment & Management Co., Class A | | | 283,953 | |
| | | | | | | | |
| | | | REITs – Diversified – 0.2% | | | | |
| | 41,117 | | | Weyerhaeuser Co. | | | 1,313,277 | |
| | | | | | | | |
| | | | REITs – Shopping Centers – 0.0% | | | | |
| | 7,868 | | | DDR Corp. | | | 137,139 | |
| | | | | | | | |
| | | | Semiconductors & Semiconductor Equipment – 3.2% | |
| | 603,280 | | | Intel Corp. | | | 22,773,820 | |
| | | | | | | | |
| | | | Trading Companies & Distributors – 0.2% | |
| | 20,913 | | | United Rentals, Inc.(j) | | | 1,641,461 | |
| | | | | | | | |
| | |
| | | | Total Common Stocks | | | | |
| | | | (Identified Cost $68,342,256) | | | 77,291,760 | |
| | | | | | | | |
See accompanying notes to financial statements.
| 46
Portfolio of Investments – as of September 30, 2016
Loomis Sayles Institutional High Income Fund – continued
| | | | | | | | |
Shares | | | Description | | Value (†) | |
|
| | Preferred Stocks – 1.8% | |
|
| | Convertible Preferred Stocks – 1.5% | |
| | |
| | | | Banking – 0.0% | | | | |
| | 138 | | | Wells Fargo & Co., Series L, Class A, 7.500% | | $ | 180,587 | |
| | | | | | | | |
| | | | Communications – 0.0% | | | | |
| | 191 | | | Cincinnati Bell, Inc., 6.750% | | | 9,581 | |
| | | | | | | | |
| | | | Electric – 0.1% | | | | |
| | 17,119 | | | AES Trust III, 6.750% | | | 873,069 | |
| | | | | | | | |
| | | | Energy – 0.7% | | | | |
| | 94,364 | | | El Paso Energy Capital Trust I, 4.750% | | | 4,718,200 | |
| | | | | | | | |
| | | | Midstream – 0.3% | | | | |
| | 12,537 | | | Chesapeake Energy Corp., 5.000%(j) | | | 537,524 | |
| | 160 | | | Chesapeake Energy Corp.,
Series A, 5.750%, 144A(j) | | | 83,300 | |
| | 3,000 | | | Chesapeake Energy Corp.,
5.750%, 144A(j) | | | 1,586,250 | |
| | 30 | | | Chesapeake Energy Corp., 5.750%(j) | | | 15,862 | |
| | | | | | | | |
| | | | | | | 2,222,936 | |
| | | | | | | | |
| | | | REITs – Diversified – 0.0% | | | | |
| | 15 | | | Crown Castle International Corp., Series A, 4.500% | | | 1,695 | |
| | | | | | | | |
| | | | REITs – Mortgage – 0.3% | | | | |
| | 37,475 | | | iStar, Inc., Series J, 4.500% | | | 1,833,652 | |
| | | | | | | | |
| | | | Technology – 0.1% | | | | |
| | 10,979 | | | Belden, Inc., 6.750% | | | 1,102,621 | |
| | | | | | | | |
| | |
| | | | Total Convertible Preferred Stocks | | | | |
| | | | (Identified Cost $11,424,334) | | | 10,942,341 | |
| | | | | | | | |
|
| | Non-Convertible Preferred Stocks – 0.3% | |
| | |
| | | | Banking – 0.1% | | | | |
| | 18,000 | | | Bank of America Corp., 6.375% | | | 460,620 | |
| | | | | | | | |
| | | | Finance Companies – 0.1% | | | | |
| | 5,300 | | | iStar, Inc., Series F, 7.800% | | | 129,373 | |
| | 2,575 | | | iStar, Inc., Series G, 7.650% | | | 61,954 | |
| | 12,475 | | | SLM Corp., Series A, 6.970% | | | 641,340 | |
| | | | | | | | |
| | | | | | | 832,667 | |
| | | | | | | | |
| | | | Home Construction – 0.1% | | | | |
| | 96,887 | | | Hovnanian Enterprises, Inc., 7.625%(j) | | | 445,680 | |
| | | | | | | | |
| | | | REITs – Warehouse/Industrials – 0.0% | |
| | 3,363 | | | ProLogis, Inc., Series Q, 8.540% | | | 218,175 | |
| | | | | | | | |
| | |
| | | | Total Non-Convertible Preferred Stocks | | | | |
| | | | (Identified Cost $1,818,099) | | | 1,957,142 | |
| | | | | | | | |
| | |
| | | | Total Preferred Stocks | | | | |
| | | | (Identified Cost $13,242,433) | | | 12,899,483 | |
| | | | | | | | |
|
| | Warrants – 0.0% | |
| | 34,303 | | | FairPoint Communications, Inc., Expiration on 1/24/2018 at
$48.81(c)(d)(j) | | | — | |
| | 2,917 | | | Halcon Resources Corp., Expiration on 9/9/2020 at $14.04(d)(j) | | | 4,451 | |
| | | | | | | | |
| | |
| | | | Total Warrants | | | | |
| | | | (Identified Cost $—) | | | 4,451 | |
| | | | | | | | |
| | |
| Principal
Amount (‡) |
| | | | | | |
|
| | Short-Term Investments – 1.3% | |
| $ | 63,967 | | | Repurchase Agreement with State Street Bank and Trust Company, dated 9/30/2016 at 0.000% to be repurchased at $63,967 on 10/03/2016 collateralized by $64,300 U.S. Treasury Note, 1.500% due 8/31/2018 valued at $65,249 including accrued interest (Note 2 of Notes to Financial Statements) | | | 63,967 | |
| | 9,205,426 | | | Tri-Party Repurchase Agreement with Fixed Income Clearing Corporation, dated 9/30/2016 at 0.030% to be repurchased at $9,205,449 on 10/03/2016 collateralized by $9,390,000 U.S. Treasury Note, 0.750% due 9/30/2018 valued at $9,390,000 including accrued interest (Note 2 of Notes to Financial Statements) | | | 9,205,426 | |
| | | | | | | | |
| | |
| | | | Total Short-Term Investments | | | | |
| | | | (Identified Cost $9,269,393) | | | 9,269,393 | |
| | | | | | | | |
| | |
| | | | Total Investments – 98.6% | | | | |
| | | | (Identified Cost $687,079,699)(a) | | | 704,000,743 | |
| | | | Other assets less liabilities—1.4% | | | 10,187,421 | |
| | | | | | | | |
| | |
| | | | Net Assets – 100.0% | | $ | 714,188,164 | |
| | | | | | | | |
| |
| | (‡) | | | Principal Amount stated in U.S. dollars unless otherwise noted. | |
| | (†) | | | See Note 2 of Notes to Financial Statements. | |
| | (††) | | | Amount shown represents units. One unit represents a principal amount of 100. | |
| | (a) | | | Federal Tax Information: | |
| | | | At September 30, 2016, the net unrealized appreciation on investments based on a cost of $696,195,649 for federal income tax purposes was as follows: | |
| | | | Aggregate gross unrealized appreciation for all investments in which there is an excess of value over tax cost | | $ | 76,886,207 | |
| | | | Aggregate gross unrealized depreciation for all investments in which there is an excess of tax cost over value | | | (69,081,113 | ) |
| | | | | | | | |
| | | | Net unrealized appreciation | | $ | 7,805,094 | |
| | | | | | | | |
| | (b) | | | Perpetual bond with no specified maturity date. | |
| | (c) | | | Illiquid security. (Unaudited) | |
See accompanying notes to financial statements.
47 |
Portfolio of Investments – as of September 30, 2016
Loomis Sayles Institutional High Income Fund – continued
| | | | | | |
| | (d) | | | Fair valued security by the Fund’s investment adviser. At September 30, 2016, the value of these securities amounted to $2,654,900 or 0.4% of net assets. See Note 2 of Notes to Financial Statements. |
| | (e) | | | Securities classified as fair valued pursuant to the Fund’s pricing policies and procedures. At September 30, 2016, the value of these securities amounted to $10,342,136 or 1.4% of net assets. See Note 2 of Notes to Financial Statements. |
| | (f) | | | The issuer is in default with respect to interest and/or principal payments. Income is not being accrued. |
| | (g) | | | Coupon rate is a fixed rate for an initial period then resets at a specified date and rate. |
| | (h) | | | Payment-in-kind security for which the issuer has the option at each interest payment date of making interest payments in cash or additional debt securities. |
| | (i) | | | Variable rate security. Rate as of September 30, 2016 is disclosed. |
| | (j) | | | Non-income producing security. |
| | (k) | | | Maturity has been extended under the terms of a plan of reorganization. |
| |
| | 144A | | | All or a portion of these securities are exempt from registration under Rule 144A of the Securities Act of 1933. These securities may be resold in transactions exempt from registration, normally to qualified institutional buyers. At September 30, 2016, the value of Rule 144A holdings amounted to $150,167,052 or 21.0% of net assets. |
| | ABS | | | Asset-Backed Securities |
| | ADR | | | An American Depositary Receipt is a certificate issued by a custodian bank representing the right to receive securities of the foreign issuer described. The values of ADRs may be significantly influenced by trading on exchanges not located in the United States. |
| | EMTN | | | Euro Medium Term Note |
| | GMTN | | | Global Medium Term Note |
| | GO | | | General Obligation |
| | MTN | | | Medium Term Note |
| | PIK | | | Payment-in-Kind |
| | REITs | | | Real Estate Investment Trusts |
| |
| | AUD | | | Australian Dollar |
| | BRL | | | Brazilian Real |
| | CAD | | | Canadian Dollar |
| | EUR | | | Euro |
| | GBP | | | British Pound |
| | ISK | | | Icelandic Krona |
| | MXN | | | Mexican Peso |
| | NOK | | | Norwegian Krone |
| | NZD | | | New Zealand Dollar |
Industry Summary at September 30, 2016
| | | | |
Treasuries | | | 7.9 | % |
Technology | | | 7.7 | |
Independent Energy | | | 7.6 | |
Metals & Mining | | | 7.2 | |
Wirelines | | | 6.4 | |
Healthcare | | | 5.5 | |
Supermarkets | | | 4.0 | |
Electronic Equipment, Instruments & Components | | | 3.7 | |
Chemicals | | | 3.6 | |
Finance Companies | | | 3.5 | |
Cable Satellite | | | 3.3 | |
Semiconductors & Semiconductor Equipment | | | 3.2 | |
Airlines | | | 2.9 | |
Midstream | | | 2.6 | |
Building Materials | | | 2.5 | |
Other Investments, less than 2% each | | | 25.7 | |
Short-Term Investments | | | 1.3 | |
| | | | |
Total Investments | | | 98.6 | |
Other assets less liabilities | | | 1.4 | |
| | | | |
Net Assets | | | 100.0 | % |
| | | | |
See accompanying notes to financial statements.
| 48
Portfolio of Investments – as of September 30, 2016
Loomis Sayles Investment Grade Fixed Income Fund
| | | | | | | | |
Principal
Amount (‡) | | | Description | | Value (†) | |
| |
| | Bonds and Notes – 91.1% of Net Assets | | | | |
| |
| | Non-Convertible Bonds – 86.6% | | | | |
| | |
| | | | ABS Home Equity – 0.0% | | | | |
| $ | 47,636 | | | Morgan Stanley Mortgage Loan Trust, Series 2005-3AR, Class 5A,
2.690%, 7/25/2035(b)(c) | | $ | 43,515 | |
| | | | | | | | |
| | | | ABS Other – 3.1% | | | | |
| | 2,834,196 | | | FAN Engine Securitization Ltd., Series 2013-1A, Class 1A,
4.625%, 10/15/2043, 144A(d)(e) | | | 2,805,089 | |
| | 10,053,745 | | | Shenton Aircraft Investment I Ltd., Series 2015-1A, Class A,
4.750%, 10/15/2042, 144A | | | 9,790,538 | |
| | 554,648 | | | Trinity Rail Leasing LP, Series 2009-1A, Class A,
6.657%, 11/16/2039, 144A | | | 607,988 | |
| | 346,741 | | | Trinity Rail Leasing LP, Series 2012-1A, Class A1, 2.266%, 1/15/2043, 144A | | | 339,264 | |
| | 784,888 | | | Trip Rail Master Funding LLC, Series 2011-1A, Class A1A,
4.370%, 7/15/2041, 144A | | | 803,920 | |
| | | | | | | | |
| | | | | | | 14,346,799 | |
| | | | | | | | |
| | | | Aerospace & Defense – 0.2% | |
| | 410,000 | | | Textron, Inc., EMTN,
6.625%, 4/07/2020, (GBP) | | | 604,954 | |
| | 340,000 | | | TransDigm, Inc., 6.500%, 5/15/2025 | | | 354,025 | |
| | | | | | | | |
| | | | | | | 958,979 | |
| | | | | | | | |
| | | | Airlines – 1.8% | |
| | 307,016 | | | Air Canada Pass Through Trust, Series 2013-1, Class B,
5.375%, 11/15/2022, 144A | | | 316,226 | |
| | 510,293 | | | American Airlines Pass Through Trust, Series 2013-1, Class A,
4.000%, 1/15/2027 | | | 542,733 | |
| | 90,936 | | | Continental Airlines Pass Through Certificates, Series 2012-2, Class B,
5.500%, 4/29/2022 | | | 95,071 | |
| | 839,000 | | | Continental Airlines Pass Through Certificates, Series 2012-3, Class C,
6.125%, 4/29/2018 | | | 876,755 | |
| | 145,663 | | | Continental Airlines Pass Through Trust, Series 2000-2, Class A-1,
7.707%, 10/02/2022 | | | 158,772 | |
| | 641,833 | | | Continental Airlines Pass Through Trust, Series 2007-1, Class A,
5.983%, 10/19/2023 | | | 723,667 | |
| | 84,209 | | | Continental Airlines Pass Through Trust, Series 2012-1, Class B,
6.250%, 10/11/2021 | | | 90,314 | |
| | 783,718 | | | Delta Air Lines Pass Through Trust, Series 2007-1, Class B,
8.021%, 2/10/2024 | | | 892,498 | |
| | 1,736,072 | | | Delta Air Lines Pass Through Trust, Series 2009-1, Class A,
7.750%, 6/17/2021 | | | 1,962,456 | |
| |
| | | | Airlines – continued | |
| $ | 811,520 | | | Delta Air Lines Pass Through Trust, Series 2010-1, Class A,
6.200%, 1/02/2020 | | $ | 862,241 | |
| | 474,097 | | | US Airways Pass Through Trust, Series 2011-1, Class A,
7.125%, 4/22/2025 | | | 565,360 | |
| | 900,574 | | | US Airways Pass Through Trust, Series 2012-2A, Class A,
4.625%, 12/03/2026 | | | 981,625 | |
| | | | | | | | |
| | | | | | | 8,067,718 | |
| | | | | | | | |
| | | | Automotive – 2.9% | | | | |
| | 840,000 | | | Cummins, Inc., 5.650%, 3/01/2098 | | | 938,843 | |
| | 10,935,000 | | | Ford Motor Credit Co. LLC, GMTN,
4.389%, 1/08/2026 | | | 11,665,972 | |
| | 200,000 | | | General Motors Co., 5.200%, 4/01/2045 | | | 208,036 | |
| | 340,000 | | | General Motors Co., 6.750%, 4/01/2046 | | | 426,250 | |
| | | | | | | | |
| | | | | | | 13,239,101 | |
| | | | | | | | |
| | | | Banking – 10.9% | |
| | 2,875,000 | | | Ally Financial, Inc., 4.125%, 2/13/2022 | | | 2,907,344 | |
| | 130,000 | | | Bank of America Corp., 5.420%, 3/15/2017 | | | 132,243 | |
| | 800,000 | | | Bank of America Corp., 5.490%, 3/15/2019 | | | 864,354 | |
| | 683,000 | | | Bank of America Corp., MTN,
3.300%, 1/11/2023 | | | 707,020 | |
| | 400,000 | | | Bank of America Corp., MTN,
4.250%, 10/22/2026 | | | 424,375 | |
| | 750,000 | | | Bank of America Corp., Series L, MTN, 7.625%, 6/01/2019 | | | 860,707 | |
| | 3,305,000 | | | Capital One NA, 2.400%, 9/05/2019 | | | 3,357,269 | |
| | 1,045,000 | | | Citigroup, Inc.,
5.130%, 11/12/2019, (NZD) | | | 797,969 | |
| | 3,545,000 | | | Citigroup, Inc.,
6.250%, 6/29/2017, (NZD) | | | 2,638,966 | |
| | 250,000 | | | Cooperatieve Rabobank UA,
1.700%, 3/19/2018 | | | 251,231 | |
| | 815,000 | | | Cooperatieve Rabobank UA,
3.875%, 2/08/2022 | | | 891,917 | |
| | 4,099,000 | | | Goldman Sachs Group, Inc. (The),
3.375%, 2/01/2018, (CAD) | | | 3,198,748 | |
| | 6,050,000 | | | Goldman Sachs Group, Inc. (The),
3.550%, 2/12/2021, (CAD) | | | 4,880,120 | |
| | 660,000 | | | Goldman Sachs Group, Inc. (The), GMTN, 5.375%, 3/15/2020 | | | 730,843 | |
| | 4,110,000 | | | JPMorgan Chase & Co.,
4.125%, 12/15/2026 | | | 4,385,399 | |
| | 300,000 | | | JPMorgan Chase & Co., EMTN,
0.829%, 5/30/2017, (GBP)(b) | | | 387,484 | |
| | 1,291,000 | | | Merrill Lynch & Co., Inc., Series C, MTN, 6.050%, 6/01/2034 | | | 1,521,766 | |
| | 665,000 | | | Morgan Stanley, 2.500%, 1/24/2019 | | | 677,608 | |
| | 615,000 | | | Morgan Stanley, 3.750%, 2/25/2023 | | | 653,187 | |
| | 1,215,000 | | | Morgan Stanley, 4.350%, 9/08/2026 | | | 1,297,136 | |
| | 840,000 | | | Morgan Stanley, 5.750%, 1/25/2021 | | | 957,545 | |
| | 1,518,000 | | | Morgan Stanley,
8.000%, 5/09/2017, (AUD) | | | 1,197,963 | |
See accompanying notes to financial statements.
49 |
Portfolio of Investments – as of September 30, 2016
Loomis Sayles Investment Grade Fixed Income Fund – continued
| | | | | | | | |
Principal
Amount (‡) | | | Description | | Value (†) | |
|
| | Bonds and Notes – continued | |
| |
| | | | Banking – continued | |
| $ | 5,992,000 | | | Morgan Stanley, MTN, 4.100%, 5/22/2023 | | $ | 6,335,108 | |
| | 2,202,000 | | | Morgan Stanley, MTN, 6.250%, 8/09/2026 | | | 2,760,786 | |
| | 455,000 | | | Morgan Stanley, Series F, MTN,
1.129%, 10/18/2016(b) | | | 455,062 | |
| | 420,000 | | | National City Bank of Indiana,
4.250%, 7/01/2018 | | | 438,449 | |
| | 905,000 | | | Royal Bank of Scotland Group PLC,
6.000%, 12/19/2023 | | | 943,207 | |
| | 2,695,000 | | | Royal Bank of Scotland Group PLC,
6.125%, 12/15/2022 | | | 2,855,660 | |
| | 50,000 | | | Royal Bank of Scotland PLC (The), EMTN, 4.350%, 1/23/2017, (EUR) | | | 56,773 | |
| | 304,000 | | | Royal Bank of Scotland PLC (The), EMTN, 6.934%, 4/09/2018, (EUR) | | | 370,584 | |
| | 100,000 | | | Santander International Debt SAU, EMTN, 4.000%, 3/27/2017, (EUR) | | | 114,512 | |
| | 1,500,000 | | | Societe Generale S.A., EMTN, (fixed rate to 6/16/2018, variable rate thereafter), 8.875%, (GBP)(f) | | | 2,138,647 | |
| | | | | | | | |
| | | | | | | 50,189,982 | |
| | | | | | | | |
| | | | Brokerage – 1.1% | |
| | 3,223,000 | | | Jefferies Group LLC, 5.125%, 1/20/2023 | | | 3,433,758 | |
| | 934,000 | | | Jefferies Group LLC, 6.250%, 1/15/2036 | | | 973,487 | |
| | 437,000 | | | Jefferies Group LLC, 6.450%, 6/08/2027 | | | 494,728 | |
| | 80,000 | | | Jefferies Group LLC, 6.875%, 4/15/2021 | | | 93,334 | |
| | | | | | | | |
| | | | | | | 4,995,307 | |
| | | | | | | | |
| | | | Building Materials – 0.8% | |
| | 1,010,000 | | | Masco Corp., 6.500%, 8/15/2032 | | | 1,111,000 | |
| | 285,000 | | | Masco Corp., 7.750%, 8/01/2029 | | | 340,575 | |
| | 1,712,000 | | | Owens Corning, 7.000%, 12/01/2036 | | | 2,161,198 | |
| | | | | | | | |
| | | | | | | 3,612,773 | |
| | | | | | | | |
| | | | Cable Satellite – 0.0% | |
| | 15,000 | | | Cox Communications, Inc.,
4.800%, 2/01/2035, 144A | | | 14,864 | |
| | 185,000 | | | Time Warner Cable LLC, 5.500%, 9/01/2041 | | | 197,470 | |
| | | | | | | | |
| | | | | | | 212,334 | |
| | | | | | | | |
| | | | Chemicals – 0.7% | |
| | 2,995,000 | | | INVISTA Finance LLC,
4.250%, 10/15/2019, 144A | | | 2,980,265 | |
| | 140,000 | | | Methanex Corp., 5.250%, 3/01/2022 | | | 144,603 | |
| | | | | | | | |
| | | | | | | 3,124,868 | |
| | | | | | | | |
| | | | Collateralized Mortgage Obligations – 0.1% | |
| | 512,433 | | | Federal Home Loan Mortgage Corp., REMIC, Series 2912, Class EH,
5.500%, 1/15/2035 | | | 586,337 | |
| | 5,423 | | | Federal National Mortgage Association, REMIC, 7.000%, 4/25/2020(c) | | | 5,603 | |
| | | | | | | | |
| | | | | | | 591,940 | |
| | | | | | | | |
| |
| | | | Consumer Products – 0.1% | |
| $ | 459,000 | | | Hasbro, Inc., 6.600%, 7/15/2028 | | $ | 555,531 | |
| | | | | | | | |
| | | | Diversified Manufacturing – 2.3% | | | | |
| | 65,000 | | | General Electric Co., GMTN,
3.100%, 1/09/2023 | | | 69,054 | |
| | 12,895,000 | | | General Electric Co., GMTN,
4.250%, 1/17/2018, (NZD) | | | 9,530,396 | |
| | 600,000 | | | General Electric Co., Series A, GMTN, 5.500%, 2/01/2017, (NZD) | | | 440,297 | |
| | 592,000 | | | Snap-on, Inc., 6.700%, 3/01/2019 | | | 662,087 | |
| | | | | | | | |
| | | | | | | 10,701,834 | |
| | | | | | | | |
| | | | Electric – 2.7% | |
| | 985,000 | | | Allegheny Energy Supply Co. LLC,
6.750%, 10/15/2039, 144A | | | 765,837 | |
| | 818,032 | | | Bruce Mansfield Unit Pass Through Trust, 6.850%, 6/01/2034(d)(e) | | | 416,526 | |
| | 468,000 | | | Cleveland Electric Illuminating Co. (The), 5.700%, 4/01/2017 | | | 477,475 | |
| | 1,800,000 | | | EDP Finance BV, 4.125%, 1/15/2020, 144A | | | 1,865,700 | |
| | 2,581,000 | | | EDP Finance BV, 4.900%, 10/01/2019, 144A | | | 2,743,113 | |
| | 607,000 | | | EDP Finance BV, 6.000%, 2/02/2018, 144A | | | 634,533 | |
| | 450,000 | | | EDP Finance BV, EMTN,
8.625%, 1/04/2024, (GBP) | | | 796,146 | |
| | 683,000 | | | Enel Finance International NV,
5.125%, 10/07/2019, 144A | | | 749,339 | |
| | 1,322,000 | | | Enel Finance International NV,
6.000%, 10/07/2039, 144A | | | 1,598,710 | |
| | 531,000 | | | Enel Finance International NV,
6.800%, 9/15/2037, 144A | | | 701,421 | |
| | 875,000 | | | Enel Finance International NV, EMTN, 5.750%, 9/14/2040, (GBP) | | | 1,584,272 | |
| | | | | | | | |
| | | | | | | 12,333,072 | |
| | | | | | | | |
| | | | Finance Companies – 4.1% | |
| | 3,826,000 | | | Aviation Capital Group Corp.,
6.750%, 4/06/2021, 144A | | | 4,495,550 | |
| | 286,000 | | | General Electric Co., Series A, MTN,
0.980%, 5/13/2024(b) | | | 267,939 | |
| | 30,000 | | | International Lease Finance Corp.,
3.875%, 4/15/2018 | | | 30,713 | |
| | 889,000 | | | International Lease Finance Corp.,
4.625%, 4/15/2021 | | | 931,228 | |
| | 19,000 | | | International Lease Finance Corp.,
5.875%, 8/15/2022 | | | 21,066 | |
| | 2,080,000 | | | International Lease Finance Corp.,
6.250%, 5/15/2019 | | | 2,254,200 | |
| | 490,000 | | | Navient LLC, 4.875%, 6/17/2019 | | | 488,163 | |
| | 4,297,000 | | | Navient LLC, 5.500%, 1/25/2023 | | | 3,942,497 | |
| | 129,000 | | | Navient LLC, MTN, 4.625%, 9/25/2017 | | | 130,935 | |
| | 159,000 | | | Navient LLC, MTN, 5.500%, 1/15/2019 | | | 161,385 | |
| | 1,382,000 | | | Navient LLC, MTN, 7.250%, 1/25/2022 | | | 1,409,640 | |
| | 983,000 | | | Navient LLC, Series A, MTN,
5.625%, 8/01/2033(d)(e) | | | 781,485 | |
| | 611,000 | | | Springleaf Finance Corp., 5.250%, 12/15/2019 | | | 623,984 | |
See accompanying notes to financial statements.
| 50
Portfolio of Investments – as of September 30, 2016
Loomis Sayles Investment Grade Fixed Income Fund – continued
| | | | | | | | |
Principal
Amount (‡) | | | Description | | Value (†) | |
|
| | Bonds and Notes – continued | |
| |
| | | | Finance Companies – continued | |
| $ | 1,522,000 | | | Springleaf Finance Corp., 7.750%, 10/01/2021 | | $ | 1,596,197 | |
| | 611,000 | | | Springleaf Finance Corp., 8.250%, 10/01/2023 | | | 641,550 | |
| | 987,000 | | | Springleaf Finance Corp., Series J, MTN, 6.500%, 9/15/2017 | | | 1,021,545 | |
| | | | | | | | |
| | | | | | | 18,798,077 | |
| | | | | | | | |
| | | | Government Guaranteed – 1.0% | |
| | 5,314,000 | | | Japan Bank for International Cooperation (Japan),
2.300%, 3/19/2018, (CAD) | | | 4,102,913 | |
| | 736,000 | | | Queensland Treasury Corp., 7.125%, 9/18/2017, 144A, (NZD) | | | 559,737 | |
| | | | | | | | |
| | | | | | | 4,662,650 | |
| | | | | | | | |
| | | | Government Owned – No Guarantee – 0.4% | |
| | 780,000 | | | Pertamina Persero PT,
6.450%, 5/30/2044, 144A | | | 903,551 | |
| | 705,000 | | | Petrobras Global Finance BV,
4.375%, 5/20/2023 | | | 630,623 | |
| | 625,000 | | | Petrobras Global Finance BV,
5.625%, 5/20/2043 | | | 471,875 | |
| | | | | | | | |
| | | | | | | 2,006,049 | |
| | | | | | | | |
| | | | Health Insurance – 0.0% | |
| | 15,000 | | | Cigna Corp., 7.875%, 5/15/2027 | | | 20,968 | |
| | | | | | | | |
| | | | Healthcare – 1.6% | | | | |
| | 649,000 | | | Boston Scientific Corp., 6.000%, 1/15/2020 | | | 733,163 | |
| | 1,520,000 | | | HCA, Inc., 4.500%, 2/15/2027 | | | 1,529,500 | |
| | 4,388,000 | | | HCA, Inc., 5.250%, 4/15/2025 | | | 4,678,705 | |
| | 42,000 | | | HCA, Inc., 5.875%, 3/15/2022 | | | 46,305 | |
| | 232,000 | | | HCA, Inc., MTN, 7.750%, 7/15/2036 | | | 251,430 | |
| | | | | | | | |
| | | | | | | 7,239,103 | |
| | | | | | | | |
| | | | Home Construction – 0.8% | |
| | 2,536,000 | | | PulteGroup, Inc., 6.000%, 2/15/2035 | | | 2,561,360 | |
| | 1,105,000 | | | PulteGroup, Inc., 6.375%, 5/15/2033 | | | 1,151,042 | |
| | | | | | | | |
| | | | | | | 3,712,402 | |
| | | | | | | | |
| | | | Hybrid ARMs – 0.0% | |
| | 25,406 | | | FNMA, 2.423%, 2/01/2037(b) | | | 26,422 | |
| | 32,869 | | | FNMA, 3.002%, 9/01/2036(b) | | | 34,812 | |
| | | | | | | | |
| | | | | | | 61,234 | |
| | | | | | | | |
| | | | Independent Energy – 1.5% | |
| | 115,000 | | | Anadarko Petroleum Corp., 6.375%, 9/15/2017 | | | 119,892 | |
| | 46,000 | | | Chesapeake Energy Corp., 6.625%, 8/15/2020 | | | 43,298 | |
| | 42,000 | | | Chesapeake Energy Corp.,
6.875%, 11/15/2020 | | | 39,270 | |
| | 450,000 | | | Continental Resources, Inc.,
3.800%, 6/01/2024 | | | 411,750 | |
| | 80,000 | | | Continental Resources, Inc.,
4.500%, 4/15/2023 | | | 76,800 | |
| |
| | | | Independent Energy – continued | |
| $ | 2,277,000 | | | EQT Corp., 8.125%, 6/01/2019 | | $ | 2,602,723 | |
| | 1,632,000 | | | Equitable Resources, Inc., 6.500%, 4/01/2018 | | | 1,710,657 | |
| | 1,805,000 | | | Noble Energy, Inc., 3.900%, 11/15/2024 | | | 1,840,934 | |
| | | | | | | | |
| | | | | | | 6,845,324 | |
| | | | | | | | |
| | | | Integrated Energy – 0.1% | |
| | 500,000 | | | Reliance Holdings USA, Inc., 5.400%, 2/14/2022, 144A | | | 563,308 | |
| | | | | | | | |
| | | | Life Insurance – 2.2% | | | | |
| | 50,000 | | | American International Group, Inc.,
4.125%, 2/15/2024 | | | 53,876 | |
| | 71,000 | | | American International Group, Inc.,
4.875%, 6/01/2022 | | | 79,885 | |
| | 1,788,000 | | | Forethought Financial Group, Inc.,
8.625%, 4/15/2021, 144A(d)(e) | | | 2,055,771 | |
| | 1,898,000 | | | National Life Insurance Co.,
10.500%, 9/15/2039, 144A(d)(e) | | | 2,910,545 | |
| | 1,989,000 | | | NLV Financial Corp.,
7.500%, 8/15/2033, 144A(d)(e) | | | 2,294,304 | |
| | 2,190,000 | | | Penn Mutual Life Insurance Co. (The), 7.625%, 6/15/2040, 144A | | | 2,858,519 | |
| | | | | | | | |
| | | | | | | 10,252,900 | |
| | | | | | | | |
| | | | Local Authorities – 1.5% | |
| | 2,407,000 | | | New South Wales Treasury Corp.,
3.500%, 3/20/2019, (AUD) | | | 1,922,091 | |
| | 3,412,400 | | | New South Wales Treasury Corp.,
6.000%, 2/01/2018, (AUD) | | | 2,758,877 | |
| | 3,037,000 | | | New South Wales Treasury Corp., Series 17RG,
5.500%, 3/01/2017, (AUD) | | | 2,359,954 | |
| | | | | | | | |
| | | | | | | 7,040,922 | |
| | | | | | | | |
| | | | Media Entertainment – 0.5% | |
| | 182,000 | | | 21st Century Fox America, Inc.,
8.150%, 10/17/2036 | | | 264,111 | |
| | 18,220,000 | | | Grupo Televisa SAB, EMTN,
7.250%, 5/14/2043, (MXN) | | | 814,605 | |
| | 50,000 | | | Viacom, Inc., 4.375%, 3/15/2043 | | | 45,903 | |
| | 845,000 | | | Viacom, Inc., 5.250%, 4/01/2044 | | | 884,666 | |
| | 305,000 | | | Viacom, Inc., 5.850%, 9/01/2043 | | | 343,993 | |
| | | | | | | | |
| | | | | | | 2,353,278 | |
| | | | | | | | |
| | | | Metals & Mining – 1.5% | |
| | 319,000 | | | ArcelorMittal, 7.250%, 2/25/2022 | | | 362,065 | |
| | 1,750,000 | | | ArcelorMittal, 7.750%, 3/01/2041 | | | 1,824,375 | |
| | 387,000 | | | ArcelorMittal, 8.000%, 10/15/2039 | | | 417,960 | |
| | 1,717,000 | | | Freeport-McMoran Oil & Gas LLC/FCX Oil & Gas, Inc.,
6.500%, 11/15/2020 | | | 1,762,071 | |
| | 1,571,000 | | | United States Steel Corp., 7.500%, 3/15/2022 | | | 1,547,435 | |
| | 873,000 | | | Worthington Industries, Inc.,
6.500%, 4/15/2020 | | | 970,029 | |
| | | | | | | | |
| | | | | | | 6,883,935 | |
| | | | | | | | |
| | | | Midstream – 3.1% | |
| | 159,000 | | | DCP Midstream LLC,
6.450%, 11/03/2036, 144A | | | 154,628 | |
See accompanying notes to financial statements.
51 |
Portfolio of Investments – as of September 30, 2016
Loomis Sayles Investment Grade Fixed Income Fund – continued
| | | | | | | | |
Principal
Amount (‡) | | | Description | | Value (†) | |
|
| | Bonds and Notes – continued | |
| |
| | | | Midstream – continued | |
| $ | 1,330,000 | | | Enbridge Energy Partners LP,
5.875%, 10/15/2025 | | $ | 1,529,029 | |
| | 1,265,000 | | | Enbridge Energy Partners LP,
7.375%, 10/15/2045 | | | 1,599,580 | |
| | 152,000 | | | Florida Gas Transmission Co.,
7.900%, 5/15/2019, 144A | | | 172,419 | |
| | 607,000 | | | IFM U.S. Colonial Pipeline 2 LLC,
6.450%, 5/01/2021, 144A | | | 685,294 | |
| | 8,400,000 | | | ONEOK Partners LP, 4.900%, 3/15/2025 | | | 9,036,107 | |
| | 55,000 | | | ONEOK Partners LP, 6.200%, 9/15/2043 | | | 60,762 | |
| | 615,000 | | | Southern Natural Gas Co.,
5.900%, 4/01/2017, 144A | | | 628,090 | |
| | 500,000 | | | Williams Partners LP, 3.350%, 8/15/2022 | | | 494,945 | |
| | | | | | | | |
| | | | | | | 14,360,854 | |
| | | | | | | | |
| | | | Mortgage Related – 0.0% | |
| | 424 | | | FHLMC, 10.000%, with various maturities in 2018(g) | | | 444 | |
| | 1,040 | | | FNMA, 6.000%, 12/01/2018 | | | 1,191 | |
| | 1,470 | | | GNMA, 10.000%, 5/15/2018 | | | 1,477 | |
| | | | | | | | |
| | | | | | | 3,112 | |
| | | | | | | | |
| | | | Natural Gas – 0.4% | |
| | 1,518,000 | | | NiSource Finance Corp.,
6.125%, 3/01/2022 | | | 1,811,287 | |
| | | | | | | | |
| | | | Non-Agency Commercial Mortgage-Backed Securities – 2.9% | |
| | 220,215 | | | Bear Stearns Commercial Mortgage Securities, Series 2007-PW16, Class A4, 5.910%, 6/11/2040(b) | | | 223,633 | |
| | 345,390 | | | CD Commercial Mortgage Trust, Series 2007-CD4, Class A4,
5.322%, 12/11/2049 | | | 346,864 | |
| | 1,655,000 | | | Commercial Mortgage Trust, Series 2014-FL5, Class SV2,
2.874%, 10/15/2031, 144A(b)(d)(e) | | | 1,653,798 | |
| | 580,000 | | | Commercial Mortgage Trust, Series 2014-FL5, Class SV3,
3.474%, 10/15/2031, 144A(b)(d)(e) | | | 579,307 | |
| | 505,000 | | | Commercial Mortgage Trust, Series 2014-FL5, Class SV4,
4.674%, 10/15/2031, 144A(b)(d)(e) | | | 505,142 | |
| | 1,694,749 | | | Credit Suisse Mortgage Capital Certificates, Series 2007-C3, Class A4,
5.881%, 6/15/2039(b) | | | 1,712,429 | |
| | 999,909 | | | Credit Suisse Mortgage Capital Certificates, Series 2007-C4, Class A4,
6.134%, 9/15/2039(b) | | | 1,022,619 | |
| | 356,657 | | | Credit Suisse Mortgage Capital Certificates, Series 2007-C5, Class A4,
5.695%, 9/15/2040(b) | | | 364,839 | |
| | 897,354 | | | Greenwich Capital Commercial Funding Corp., Series 2007-GG11, Class A4, 5.736%, 12/10/2049 | | | 921,065 | |
| |
| | | | Non-Agency Commercial Mortgage-Backed Securities – continued | |
| $ | 231,160 | | | GS Mortgage Securities Trust, Series 2007-GG10, Class A4,
5.988%, 8/10/2045(b) | | $ | 234,648 | |
| | 410,929 | | | Institutional Mortgage Securities Canada, Inc., Series 2014-5A, Class A1, 2.003%, 7/12/2047, 144A, (CAD) | | | 310,746 | |
| | 778,163 | | | JPMorgan Chase Commercial Mortgage Securities Trust, Series 2007-LD11, Class A4,
5.940%, 6/15/2049(b) | | | 788,872 | |
| | 500,340 | | | JPMorgan Chase Commercial Mortgage Securities Trust, Series 2007-LDPX, Class A3,
5.420%, 1/15/2049 | | | 504,065 | |
| | 189,790 | | | Morgan Stanley Capital I Trust, Series 2007-IQ14, Class A4,
5.692%, 4/15/2049(b) | | | 191,856 | |
| | 491,608 | | | Morgan Stanley Capital I Trust, Series 2008-T29, Class A4,
6.477%, 1/11/2043(b) | | | 514,565 | |
| | 3,515,000 | | | Original Wempi, Inc.,
4.309%, 2/13/2024, (CAD) | | | 2,900,843 | |
| | 303,664 | | | Wachovia Bank Commercial Mortgage Trust, Series 2007-C30, Class A5, 5.342%, 12/15/2043 | | | 305,602 | |
| | 94,890 | | | WFRBS Commercial Mortgage Trust, Series 2011-C3, Class D,
5.813%, 3/15/2044, 144A(b) | | | 99,520 | |
| | | | | | | | |
| | | | | | | 13,180,413 | |
| | | | | | | | |
| | | | Oil Field Services – 0.2% | |
| | 827,000 | | | Rowan Cos., Inc.,
7.875%, 8/01/2019 | | | 882,822 | |
| | | | | | | | |
| | | | Packaging – 0.4% | | | | |
| | 1,660,000 | | | Sealed Air Corp.,
5.500%, 9/15/2025, 144A | | | 1,780,350 | |
| | | | | | | | |
| | | | Paper – 0.3% | | | | |
| | 704,000 | | | Georgia-Pacific LLC, 7.250%, 6/01/2028 | | | 952,959 | |
| | 175,000 | | | WestRock MWV LLC, 7.550%, 3/01/2047(d)(e) | | | 224,342 | |
| | 133,000 | | | WestRock MWV LLC, 8.200%, 1/15/2030 | | | 181,353 | |
| | | | | | | | |
| | | | | | | 1,358,654 | |
| | | | | | | | |
| | | | Property & Casualty Insurance – 1.1% | |
| | 87,000 | | | MBIA Insurance Corp., 11.940%, 1/15/2033, 144A(b)(h) | | | 34,800 | |
| | 1,640,000 | | | Old Republic International Corp., 4.875%, 10/01/2024 | | | 1,773,312 | |
| | 167,000 | | | Sirius International Group, 6.375%, 3/20/2017, 144A | | | 169,646 | |
| | 1,530,000 | | | XLIT Ltd., 6.250%, 5/15/2027 | | | 1,847,778 | |
| | 1,211,000 | | | XLIT Ltd., 6.375%, 11/15/2024 | | | 1,442,988 | |
| | | | | | | | |
| | | | | | | 5,268,524 | |
| | | | | | | | |
See accompanying notes to financial statements.
| 52
Portfolio of Investments – as of September 30, 2016
Loomis Sayles Investment Grade Fixed Income Fund – continued
| | | | | | | | |
Principal
Amount (‡) | | | Description | | Value (†) | |
|
| | Bonds and Notes – continued | |
| |
| | | | Railroads – 0.0% | |
| $ | 144,000 | | | Missouri Pacific Railroad Co., 5.000%, 1/01/2045(d)(e) | | $ | 140,802 | |
| | | | | | | | |
| | | | REITs – Office Property – 0.2% | | | | |
| | 816,000 | | | Highwoods Properties, Inc., 7.500%, 4/15/2018 | | | 882,286 | |
| | 61,000 | | | Highwoods Realty LP, 5.850%, 3/15/2017 | | | 62,096 | |
| | | | | | | | |
| | | | | | | 944,382 | |
| | | | | | | | |
| | | | REITs – Single Tenant – 0.1% | | | | |
| | 109,000 | | | Realty Income Corp., 5.750%, 1/15/2021 | | | 124,260 | |
| | 270,000 | | | Realty Income Corp., 6.750%, 8/15/2019 | | | 306,962 | |
| | | | | | | | |
| | | | | | | 431,222 | |
| | | | | | | | |
| | | | Restaurants – 0.1% | | | | |
| | 463,000 | | | Darden Restaurants, Inc., 6.000%, 8/15/2035 | | | 505,062 | |
| | | | | | | | |
| | | | Retailers – 0.0% | | | | |
| | 66,000 | | | J.C. Penney Corp., Inc., 6.375%, 10/15/2036 | | | 56,760 | |
| | | | | | | | |
| | | | Sovereigns – 2.2% | | | | |
| | 2,429,000 | | | Republic of Iceland, 5.875%, 5/11/2022, 144A | | | 2,853,735 | |
| | 2,806,000 | | | U.S. Department of Housing and Urban Development, 1.980%, 8/01/2020 | | | 2,881,594 | |
| | 1,851,000 | | | U.S. Department of Housing and Urban Development, 2.350%, 8/01/2021 | | | 1,935,072 | |
| | 2,244,000 | | | U.S. Department of Housing and Urban Development, 2.450%, 8/01/2022 | | | 2,360,037 | |
| | | | | | | | |
| | | | | | | 10,030,438 | |
| | | | | | | | |
| | | | Supermarkets – 0.6% | | | | |
| | 171,000 | | | Koninklijke Ahold Delhaize NV,
5.700%, 10/01/2040 | | | 206,978 | |
| | 272,000 | | | New Albertson’s, Inc., 7.450%, 8/01/2029 | | | 266,560 | |
| | 230,000 | | | New Albertson’s, Inc., 7.750%, 6/15/2026 | | | 229,137 | |
| | 1,017,000 | | | New Albertson’s, Inc., 8.000%, 5/01/2031 | | | 1,003,016 | |
| | 167,000 | | | New Albertson’s, Inc., 8.700%, 5/01/2030 | | | 169,505 | |
| | 65,000 | | | New Albertson’s, Inc., Series C, MTN, 6.625%, 6/01/2028 | | | 59,800 | |
| | 1,063,000 | | | SUPERVALU, Inc., 6.750%, 6/01/2021 | | | 993,905 | |
| | | | | | | | |
| | | | | | | 2,928,901 | |
| | | | | | | | |
| | | | Supranational – 0.5% | | | | |
| | 3,321,000 | | | Inter-American Development Bank, EMTN,
6.000%, 12/15/2017, (NZD) | | | 2,519,468 | |
| | | | | | | | |
| | |
| | | | Technology – 1.9% | | | | |
| $ | 2,706,000 | | | Corning, Inc., 7.250%, 8/15/2036 | | $ | 3,354,206 | |
| | 2,695,000 | | | Ingram Micro, Inc., 5.250%, 9/01/2017 | | | 2,772,611 | |
| | 990,000 | | | KLA-Tencor Corp., 5.650%, 11/01/2034 | | | 1,102,208 | |
| | 37,000 | | | Motorola Solutions, Inc., 6.625%, 11/15/2037 | | | 38,328 | |
| | 228,000 | | | Samsung Electronics Co. Ltd.,
7.700%, 10/01/2027, 144A | | | 290,892 | |
| | 1,125,000 | | | Western Digital Corp.,
7.375%, 4/01/2023, 144A | | | 1,237,500 | |
| | | | | | | | |
| | | | | | | 8,795,745 | |
| | | | | | | | |
| | | | Transportation Services – 0.3% | | | | |
| | 76,000 | | | APL Ltd., 8.000%, 1/15/2024(d)(e) | | | 50,160 | |
| | 419,145 | | | Atlas Air Pass Through Trust,
Series 1998-1, Class B,
7.680%, 1/02/2018(c) | | | 426,481 | |
| | 717,000 | | | ERAC USA Finance LLC,
6.700%, 6/01/2034, 144A | | | 951,108 | |
| | | | | | | | |
| | | | | | | 1,427,749 | |
| | | | | | | | |
| | | | Treasuries – 25.1% | | | | |
| | 8,301,000 | | | Canadian Government,
0.250%, 5/01/2017, (CAD) | | | 6,317,226 | |
| | 30,366,000 | | | Canadian Government,
0.750%, 9/01/2020, (CAD) | | | 23,307,488 | |
| | 26,800,000 | | | Canadian Government,
1.750%, 9/01/2019, (CAD) | | | 21,149,928 | |
| | 62,675,000 | | | Iceland Government International Bond, 6.000%, 10/13/2016, (ISK) | | | 373,010 | |
| | 51,425,000 | | | Iceland Government International Bond, 7.250%, 10/26/2022, (ISK) | | | 338,242 | |
| | 87,450,000 | | | Iceland Government International Bond, 8.750%, 2/26/2019, (ISK) | | | 561,137 | |
| | 255,000(††) | | | Mexican Fixed Rate Bonds,
Series M,
7.750%, 5/29/2031, (MXN) | | | 1,487,624 | |
| | 265,000(††) | | | Mexican Fixed Rate Bonds, Series M-20,
7.500%, 6/03/2027, (MXN) | | | 1,511,837 | |
| | 737,400(††) | | | Mexican Fixed Rate Bonds, Series M-20,
8.000%, 12/07/2023, (MXN) | | | 4,275,469 | |
| | 175,000(††) | | | Mexican Fixed Rate Bonds, Series M-20,
8.500%, 5/31/2029, (MXN) | | | 1,078,517 | |
| | 1,165,000(††) | | | Mexican Fixed Rate Bonds, Series M-20, 10.000%, 12/05/2024, (MXN) | | | 7,590,268 | |
| | 1,675,000 | | | New Zealand Government Bond,
5.000%, 3/15/2019, (NZD) | | | 1,309,237 | |
| | 10,896,000 | | | Norway Government Bond,
3.750%, 5/25/2021, 144A, (NOK) | | | 1,538,900 | |
| | 28,844,000 | | | Norway Government Bond,
4.250%, 5/19/2017, 144A, (NOK) | | | 3,690,665 | |
| | 15,641,000 | | | Norway Government Bond,
4.500%, 5/22/2019, 144A, (NOK) | | | 2,147,962 | |
| | 3,986,000 | | | Republic of Brazil,
8.500%, 1/05/2024, (BRL) | | | 1,132,195 | |
| | 20,000,000 | | | U.S. Treasury Note, 0.750%, 10/31/2017 | | | 20,014,060 | |
See accompanying notes to financial statements.
53 |
Portfolio of Investments – as of September 30, 2016
Loomis Sayles Investment Grade Fixed Income Fund – continued
| | | | | | | | |
Principal
Amount (‡) | | | Description | | Value (†) | |
|
| | Bonds and Notes – continued | |
| | |
| | | | Treasuries – continued | | | | |
| $ | 13,000,000 | | | U.S. Treasury Note, 0.750%, 4/30/2018 | | $ | 13,001,521 | |
| | 5,000,000 | | | U.S. Treasury Note, 0.750%, 9/30/2018 | | | 4,998,440 | |
| | | | | | | | |
| | | | | | | 115,823,726 | |
| | | | | | | | |
| | | | Wireless – 0.2% | | | | |
| | 10,630,000 | | | America Movil SAB de CV,
6.450%, 12/05/2022, (MXN) | | | 533,974 | |
| | 178,000 | | | Sprint Capital Corp., 6.875%, 11/15/2028 | | | 167,097 | |
| | 66,000 | | | Sprint Communications, Inc.,
6.000%, 11/15/2022 | | | 61,215 | |
| | 25,000 | | | Sprint Corp., 7.125%, 6/15/2024 | | | 24,375 | |
| | | | | | | | |
| | | | | | | 786,661 | |
| | | | | | | | |
| | | | Wirelines – 5.1% | | | | |
| | 1,985,000 | | | AT&T, Inc., 2.625%, 12/01/2022 | | | 2,000,737 | |
| | 1,585,000 | | | AT&T, Inc., 3.000%, 2/15/2022 | | | 1,636,566 | |
| | 1,860,000 | | | AT&T, Inc., 3.950%, 1/15/2025 | | | 1,974,403 | |
| | 1,518,000 | | | BellSouth Telecommunications LLC, 5.850%, 11/15/2045 | | | 1,568,216 | |
| | 186,000 | | | CenturyLink, Inc., Series G,
6.875%, 1/15/2028 | | | 179,258 | |
| | 1,719,000 | | | CenturyLink, Inc., Series P,
7.600%, 9/15/2039 | | | 1,495,530 | |
| | 926,000 | | | Embarq Corp., 7.995%, 6/01/2036 | | | 937,094 | |
| | 228,000 | | | Portugal Telecom International Finance BV, EMTN, 4.500%, 6/16/2025, (EUR)(h) | | | 58,908 | |
| | 100,000 | | | Portugal Telecom International Finance BV, EMTN,
5.000%, 11/04/2019, (EUR)(h) | | | 25,837 | |
| | 380,000 | | | Qwest Capital Funding, Inc.,
6.500%, 11/15/2018 | | | 401,850 | |
| | 1,856,000 | | | Qwest Corp., 6.875%, 9/15/2033 | | | 1,850,243 | |
| | 1,427,000 | | | Telecom Italia Capital S.A.,
6.000%, 9/30/2034 | | | 1,413,087 | |
| | 150,000 | | | Telefonica Emisiones SAU,
4.570%, 4/27/2023 | | | 166,821 | |
| | 300,000 | | | Telefonica Emisiones SAU, EMTN,
5.289%, 12/09/2022, (GBP) | | | 473,304 | |
| | 1,000,000 | | | Telefonica Emisiones SAU, EMTN,
5.375%, 2/02/2026, (GBP) | | | 1,660,380 | |
| | 400,000 | | | Telefonica Emisiones SAU, EMTN,
5.445%, 10/08/2029, (GBP) | | | 698,899 | |
| | 6,725,000 | | | Verizon Communications, Inc.,
2.450%, 11/01/2022 | | | 6,829,910 | |
| | | | | | | | |
| | | | | | | 23,371,043 | |
| | | | | | | | |
| | |
| | | | Total Non-Convertible Bonds | | | | |
| | | | (Identified Cost $396,241,005) | | | 399,821,878 | |
| | | | | | | | |
|
| | Convertible Bonds – 4.0% | |
| | |
| | | | Midstream – 0.0% | | | | |
| | 170,000 | | | Chesapeake Energy Corp., 2.500%, 5/15/2037 | | | 168,938 | |
| | | | | | | | |
| |
| | | | Property & Casualty Insurance – 1.8% | |
| $ | 6,829,000 | | | Old Republic International Corp.,
3.750%, 3/15/2018 | | $ | 8,199,068 | |
| | | | | | | | |
| | | | Technology – 2.2% | | | | |
| | 3,568,000 | | | Intel Corp., 3.250%, 8/01/2039 | | | 6,524,980 | |
| | 402,000 | | | Lam Research Corp., Series B,
1.250%, 5/15/2018 | | | 639,934 | |
| | 2,615,000 | | | Priceline Group, Inc. (The),
0.900%, 9/15/2021 | | | 2,807,856 | |
| | | | | | | | |
| | | | | | | 9,972,770 | |
| | | | | | | | |
| | |
| | | | Total Convertible Bonds | | | | |
| | | | (Identified Cost $13,440,120) | | | 18,340,776 | |
| | | | | | | | |
|
| | Municipals – 0.5% | |
| | |
| | | | Illinois – 0.1% | | | | |
| | 315,000 | | | State of Illinois, 5.100%, 6/01/2033 | | | 303,660 | |
| | | | | | | | |
| | | | Michigan – 0.1% | | | | |
| | 715,000 | | | Michigan Tobacco Settlement Finance Authority Taxable Turbo, Series A, 7.309%, 6/01/2034 | | | 701,651 | |
| | | | | | | | |
| | | | Virginia – 0.3% | | | | |
| | 1,595,000 | | | Virginia Tobacco Settlement Financing Corp., Series A-1, 6.706%, 6/01/2046 | | | 1,369,913 | |
| | | | | | | | |
| | |
| | | | Total Municipals | | | | |
| | | | (Identified Cost $2,548,668) | | | 2,375,224 | |
| | | | | | | | |
| | |
| | | | Total Bonds and Notes | | | | |
| | | | (Identified Cost $412,229,793) | | | 420,537,878 | |
| | | | | | | | |
|
| | Senior Loans – 0.4% | |
| | |
| | | | Finance Companies – 0.4% | | | | |
| | 1,878,922 | | | Flying Fortress, Inc., New Term Loan, 3.588%, 4/30/2020 (b) (Identified Cost $1,877,230) | | | 1,889,256 | |
| | | | | | | | |
| | |
| | Shares | | | | | | | |
|
| | Common Stocks – 4.6% | |
| | |
| | | | Automobiles – 0.2% | | | | |
| | 91,715 | | | Ford Motor Co. | | | 1,107,000 | |
| | | | | | | | |
| | | | Chemicals – 0.1% | | | | |
| | 3,363 | | | PPG Industries, Inc. | | | 347,599 | |
| | | | | | | | |
| | | | Electronic Equipment, Instruments & Components – 3.7% | |
| | 721,200 | | | Corning, Inc. | | | 17,056,380 | |
| | | | | | | | |
| | | | Metals & Mining – 0.1% | | | | |
| | 84,025 | | | ArcelorMittal, (Registered)(h) | | | 507,511 | |
| | | | | | | | |
See accompanying notes to financial statements.
| 54
Portfolio of Investments – as of September 30, 2016
Loomis Sayles Investment Grade Fixed Income Fund – continued
| | | | | | | | |
Shares | | | Description | | Value (†) | |
|
| | Common Stocks – continued | |
| |
| | | | Oil, Gas & Consumable Fuels – 0.5% | |
| | 64,896 | | | Repsol YPF S.A., Sponsored ADR | | $ | 885,831 | |
| | 26,419 | | | Royal Dutch Shell PLC, Sponsored ADR | | | 1,322,799 | |
| | | | | | | | |
| | | | | | | 2,208,630 | |
| | | | | | | | |
| | |
| | | | Total Common Stocks | | | | |
| | | | (Identified Cost $14,367,967) | | | 21,227,120 | |
| | | | | | | | |
|
| | Preferred Stocks – 0.7% | |
|
| | Convertible Preferred Stocks – 0.6% | |
| | |
| | | | Banking – 0.2% | | | | |
| | 714 | | | Bank of America Corp., Series L, 7.250% | | | 871,680 | |
| | | | | | | | |
| | | | Energy – 0.2% | | | | |
| | 15,775 | | | El Paso Energy Capital Trust I, 4.750% | | | 788,750 | |
| | | | | | | | |
| | | | Metals & Mining – 0.2% | | | | |
| | 31,440 | | | Alcoa, Inc., Series 1, 5.375% | | | 1,027,773 | |
| | | | | | | | |
| | | | Midstream – 0.0% | | | | |
| | 4,353 | | | Chesapeake Energy Corp., 5.000%(h) | | | 186,635 | |
| | | | | | | | |
| | |
| | | | Total Convertible Preferred Stocks | | | | |
| | | | (Identified Cost $3,134,105) | | | 2,874,838 | |
| | | | | | | | |
|
| | Non-Convertible Preferred Stocks – 0.1% | |
| | |
| | | | Electric – 0.1% | | | | |
| | 213 | | | Connecticut Light & Power Co., 2.200% | | | 11,063 | |
| | 2,360 | | | Union Electric Co., 4.500% | | | 238,596 | |
| | | | | | | | |
| | | | | | | 249,659 | |
| | | | | | | | |
| |
| | | | Total Non-Convertible Preferred Stocks | |
| | | | (Identified Cost $131,140) | | | 249,659 | |
| | | | | | | | |
| | |
| | | | Total Preferred Stocks | | | | |
| | | | (Identified Cost $3,265,245) | | | 3,124,497 | |
| | | | | | | | |
Principal
Amount (‡) | | | Description | | Value (†) | |
|
| | Short-Term Investments – 3.4% | |
| $ | 15,542,796 | | | Tri-Party Repurchase Agreement with Fixed Income Clearing Corporation, dated 9/30/2016 at 0.030% to be repurchased at $15,542,835 on 10/03/2016 collateralized by $15,680,000 U.S.Treasury Note, 1.500% due 3/31/2023 valued at $15,856,400 including accrued interest (Note 2 of Notes to Financial Statements) (Identified Cost $15,542,796) | | $ | 15,542,796 | |
| | | | | | | | |
| | |
| | | | Total Investments – 100.2% | | | | |
| | | | (Identified Cost $447,283,031)(a) | | | 462,321,547 | |
| | | | Other assets less liabilities—(0.2)% | | | (892,763 | ) |
| | | | | | | | |
| | |
| | | | Net Assets – 100.0% | | $ | 461,428,784 | |
| | | | | | | | |
| |
| | (‡) | | | Principal Amount stated in U.S. dollars unless otherwise noted. | |
| | (†) | | | See Note 2 of Notes to Financial Statements. | |
| | (††) | | | Amount shown represents units. One unit represents a principal amount of 100. | |
| | (a) | | | Federal Tax Information: | | | | |
| | | | At September 30, 2016, the net unrealized appreciation on investments based on a cost of $450,585,021 for federal income tax purposes was as follows: | |
| | | | Aggregate gross unrealized appreciation for all investments in which there is an excess of value over tax cost | | $ | 38,263,642 | |
| | | | Aggregate gross unrealized depreciation for all investments in which there is an excess of tax cost over value | | | (26,527,116 | ) |
| | | | | | | | |
| | | | Net unrealized appreciation | | $ | 11,736,526 | |
| | | | | | | | |
| | (b) | | | Variable rate security. Rate as of September 30, 2016 is disclosed. | |
| | (c) | | | Fair valued by the Fund’s adviser. At September 30, 2016, the value of this security amounted to $475,599 or 0.1% of net assets. See Note 2 of Notes to Financial Statements. | |
| | (d) | | | Illiquid security. (Unaudited) | |
| | (e) | | | Securities classified as fair valued pursuant to the Fund’s pricing policies and procedures. At September 30, 2016, the value of these securities amounted to $14,417,271 or 3.1% of net assets. See Note 2 of Notes to Financial Statements. | |
| | (f) | | | Perpetual bond with no specified maturity date. | |
| | (g) | | | The Fund’s investment in mortgage related securities of Federal Home Loan Mortgage Corporation are interests in separate pools of mortgages. All separate investments in securities of each issuer which have the same coupon rate have been aggregated for the purpose of presentation in the Portfolio of Investments. | |
| | (h) | | | Non-income producing security. | |
| |
| | 144A | | | All or a portion of these securities are exempt from registration under Rule 144A of the Securities Act of 1933. These securities may be resold in transactions exempt from registration, normally to qualified institutional buyers. At September 30, 2016, the value of Rule 144A holdings amounted to $62,842,594 or 13.6% of net assets. | |
| | ABS | | | Asset-Backed Securities | |
| | ADR | | | An American Depositary Receipt is a certificate issued by a custodian bank representing the right to receive securities of the foreign issuer described. The values of ADRs may be significantly influenced by trading on exchanges not located in the United States. | |
| | ARMs | | | Adjustable Rate Mortgages | |
| | EMTN | | | Euro Medium Term Note | |
| | FHLMC | | | Federal Home Loan Mortgage Corp. | |
See accompanying notes to financial statements.
55 |
Portfolio of Investments – as of September 30, 2016
Loomis Sayles Investment Grade Fixed Income Fund – continued
| | | | | | |
| | FNMA | | | Federal National Mortgage Association |
| | GMTN | | | Global Medium Term Note |
| | GNMA | | | Government National Mortgage Association |
| | MTN | | | Medium Term Note |
| | REITs | | | Real Estate Investment Trusts |
| | REMIC | | | Real Estate Mortgage Investment Conduit |
| |
| | AUD | | | Australian Dollar |
| | BRL | | | Brazilian Real |
| | CAD | | | Canadian Dollar |
| | EUR | | | Euro |
| | GBP | | | British Pound |
| | ISK | | | Icelandic Krona |
| | MXN | | | Mexican Peso |
| | NOK | | | Norwegian Krone |
| | NZD | | | New Zealand Dollar |
Industry Summary at September 30, 2016
| | | | |
Treasuries | | | 25.1 | % |
Banking | | | 11.1 | |
Wirelines | | | 5.1 | |
Finance Companies | | | 4.5 | |
Technology | | | 4.1 | |
Electronic Equipment, Instruments & Components | | | 3.7 | |
Midstream | | | 3.1 | |
ABS Other | | | 3.1 | |
Property & Casualty Insurance | | | 2.9 | |
Automotive | | | 2.9 | |
Non-Agency Commercial Mortgage-Backed Securities | | | 2.9 | |
Electric | | | 2.8 | |
Diversified Manufacturing | | | 2.3 | |
Life Insurance | | | 2.2 | |
Sovereigns | | | 2.2 | |
Other Investments, less than 2% each | | | 18.8 | |
Short-Term Investments | | | 3.4 | |
| | | | |
Total Investments | | | 100.2 | |
Other assets less liabilities | | | (0.2 | ) |
| | | | |
Net Assets | | | 100.0 | % |
| | | | |
Currency Exposure Summary at September 30, 2016
| | | | |
United States Dollar | | | 72.3 | % |
Canadian Dollar | | | 14.5 | |
New Zealand Dollar | | | 3.9 | |
Mexican Peso | | | 3.5 | |
Other, less than 2% each | | | 6.0 | |
| | | | |
Total Investments | | | 100.2 | |
Other assets less liabilities | | | (0.2 | ) |
| | | | |
Net Assets | | | 100.0 | % |
| | | | |
See accompanying notes to financial statements.
| 56
Statements of Assets and Liabilities
September 30, 2016
| | | | | | | | | | | | |
| | | Fixed Income
Fund | | | Global Bond
Fund | | | Inflation
Protected
Securities Fund | |
ASSETS | | | | | | | | | | | | |
Investments at cost | | $ | 1,161,152,972 | | | $ | 1,230,468,807 | | | $ | 30,224,598 | |
Net unrealized appreciation | | | 21,871,392 | | | | 1,413,747 | | | | 918,018 | |
| | | | | | | | | | | | |
Investments at value | | | 1,183,024,364 | | | | 1,231,882,554 | | | | 31,142,616 | |
Cash | | | 4,119,210 | | | | — | | | | — | |
Due from brokers (Note 2) | | | — | | | | 1,319,827 | | | | 45,000 | |
Foreign currency at value (identified cost $168,225, $13,455,397 and $0, respectively) | | | 168,502 | | | | 13,432,385 | | | | — | |
Receivable for Fund shares sold | | | — | | | | 3,261,982 | | | | 132,160 | |
Receivable for securities sold | | | 49,627 | | | | 27,088,704 | | | | — | |
Receivable for when-issued/delayed delivery securities sold (Note 2) | | | — | | | | 70,882,464 | | | | — | |
Collateral received for delayed delivery securities or forward foreign currency contracts (Notes 2 and 4) | | | — | | | | 1,810,000 | | | | — | |
Dividends and interest receivable | | | 14,911,588 | | | | 9,627,989 | | | | 62,461 | |
Unrealized appreciation on forward foreign currency contracts (Note 2) | | | — | | | | 2,204,589 | | | | — | |
Tax reclaims receivable | | | 22,309 | | | | 4,082 | | | | — | |
Receivable for variation margin on futures contracts (Note 2) | | | — | | | | 285,378 | | | | 7,031 | |
Prepaid expenses (Note 8) | | | 5,144 | | | | 6,497 | | | | 112 | |
| | | | | | | | | | | | |
TOTAL ASSETS | | | 1,202,300,744 | | | | 1,361,806,451 | | | | 31,389,380 | |
| | | | | | | | | | | | |
| | | |
| LIABILITIES | | | | | | | | | | | | |
Payable for securities purchased | | | — | | | | 6,746,848 | | | | — | |
Payable for when-issued/delayed delivery securities purchased (Note 2) | | | — | | | | 127,494,744 | | | | — | |
Payable for Fund shares redeemed | | | — | | | | 1,343,829 | | | | 10,639 | |
Unrealized depreciation on forward foreign currency contracts (Note 2) | | | — | | | | 1,538,570 | | | | — | |
Foreign taxes payable (Note 2) | | | — | | | | 18,165 | | | | — | |
Due to brokers (Note 2) | | | — | | | | 1,810,000 | | | | — | |
Distributions payable | | | — | | | | — | | | | 42,299 | |
Management fees payable (Note 6) | | | 505,587 | | | | 547,409 | | | | 16,695 | |
Deferred Trustees’ fees (Note 6) | | | 168,353 | | | | 261,171 | | | | 87,480 | |
Administrative fees payable (Note 6) | | | 43,895 | | | | 44,185 | | | | 1,121 | |
Payable to distributor (Note 6d) | | | — | | | | 22,267 | | | | 266 | |
Other accounts payable and accrued expenses | | | 74,204 | | | | 176,216 | | | | 53,746 | |
| | | | | | | | | | | | |
TOTAL LIABILITIES | | | 792,039 | | | | 140,003,404 | | | | 212,246 | |
| | | | | | | | | | | | |
NET ASSETS | | $ | 1,201,508,705 | | | $ | 1,221,803,047 | | | $ | 31,177,134 | |
| | | | | | | | | | | | |
NET ASSETS CONSIST OF: | | | | | | | | | | | | |
Paid-in capital | | $ | 1,164,076,419 | | | $ | 1,226,233,659 | | | $ | 32,775,269 | |
Undistributed (Distributions in excess of) net investment income/Accumulated net investment loss | | | 19,210,462 | | | | (1,709,790 | ) | | | (129,717 | ) |
Accumulated net realized loss on investments, futures contracts, swaptions written and foreign currency transactions | | | (3,613,138 | ) | | | (5,064,619 | ) | | | (2,380,721 | ) |
Net unrealized appreciation on investments, futures contracts, swaptions written and foreign currency translations | | | 21,834,962 | | | | 2,343,797 | | | | 912,303 | |
| | | | | | | | | | | | |
NET ASSETS | | $ | 1,201,508,705 | | | $ | 1,221,803,047 | | | $ | 31,177,134 | |
| | | | | | | | | | | | |
| | | |
| COMPUTATION OF NET ASSET VALUE AND OFFERING PRICE: | | | | | | | | | | | | |
Institutional Class: | | | | | | | | | | | | |
Net assets | | $ | 1,201,508,705 | | | $ | 822,992,767 | | | $ | 29,655,271 | |
| | | | | | | | | | | | |
Shares of beneficial interest | | | 88,861,821 | | | | 49,973,715 | | | | 2,788,136 | |
| | | | | | | | | | | | |
Net asset value, offering and redemption price per share | | $ | 13.52 | | | $ | 16.47 | | | $ | 10.64 | |
| | | | | | | | | | | | |
Retail Class: | | | | | | | | | | | | |
Net assets | | $ | — | | | $ | 350,915,125 | | | $ | 1,521,863 | |
| | | | | | | | | | | | |
Shares of beneficial interest | | | — | | | | 21,621,524 | | | | 143,270 | |
| | | | | | | | | | | | |
Net asset value, offering and redemption price per share | | $ | — | | | $ | 16.23 | | | $ | 10.62 | |
| | | | | | | | | | | | |
Class N shares: | | | | | | | | | | | | |
Net assets | | $ | — | | | $ | 47,895,155 | | | $ | — | |
| | | | | | | | | | | | |
Shares of beneficial interest | | | — | | | | 2,902,975 | | | | — | |
| | | | | | | | | | | | |
Net asset value, offering and redemption price per share | | $ | — | | | $ | 16.50 | | | $ | — | |
| | | | | | | | | | | | |
See accompanying notes to financial statements.
57 |
Statements of Assets and Liabilities – continued
September 30, 2016
| | | | | | | | |
| | | Institutional
High Income
Fund | | | Investment
Grade Fixed
Income Fund | |
ASSETS | | | | | | | | |
Investments at cost | | $ | 687,079,699 | | | $ | 447,283,031 | |
Net unrealized appreciation | | | 16,921,044 | | | | 15,038,516 | |
| | | | | | | | |
Investments at value | | | 704,000,743 | | | | 462,321,547 | |
Cash | | | 273,524 | | | | 16,806 | |
Foreign currency at value (identified cost $11 and $85,505, respectively) | | | 11 | | | | 85,645 | |
Receivable for Fund shares sold | | | 500,000 | | | | — | |
Receivable for securities sold | | | 145,795 | | | | — | |
Dividends and interest receivable | | | 9,834,756 | | | | 4,363,181 | |
Tax reclaims receivable | | | 5,882 | | | | 6,146 | |
Prepaid expenses (Note 8) | | | 2,717 | | | | 2,061 | |
| | | | | | | | |
TOTAL ASSETS | | | 714,763,428 | | | | 466,795,386 | |
| | | | | | | | |
| | |
| LIABILITIES | | | | | | | | |
Payable for securities purchased | | | — | | | | 4,999,137 | |
Management fees payable (Note 6) | | | 362,230 | | | | 160,809 | |
Deferred Trustees’ fees (Note 6) | | | 120,502 | | | | 125,379 | |
Administrative fees payable (Note 6) | | | 25,923 | | | | 16,802 | |
Payable to distributor (Note 6d) | | | 78 | | | | — | |
Other accounts payable and accrued expenses | | | 66,531 | | | | 64,475 | |
| | | | | | | | |
TOTAL LIABILITIES | | | 575,264 | | | | 5,366,602 | |
| | | | | | | | |
NET ASSETS | | $ | 714,188,164 | | | $ | 461,428,784 | |
| | | | | | | | |
NET ASSETS CONSIST OF: | | | | | | | | |
Paid-in capital | | $ | 679,551,990 | | | $ | 442,720,790 | |
Undistributed (Distributions in excess of) net investment income | | | 20,278,507 | | | | (1,030,169 | ) |
Accumulated net realized gain (loss) on investments and foreign currency transactions | | | (2,549,720 | ) | | | 4,718,612 | |
Net unrealized appreciation on investments and foreign currency translations | | | 16,907,387 | | | | 15,019,551 | |
| | | | | | | | |
NET ASSETS | | $ | 714,188,164 | | | $ | 461,428,784 | |
| | | | | | | | |
| | |
| COMPUTATION OF NET ASSET VALUE AND OFFERING PRICE: | | | | | | | | |
Institutional Class: | | | | | | | | |
Net assets | | $ | 714,188,164 | | | $ | 461,428,784 | |
| | | | | | | | |
Shares of beneficial interest | | | 104,916,981 | | | | 37,144,461 | |
| | | | | | | | |
Net asset value, offering and redemption price per share | | $ | 6.81 | | | $ | 12.42 | |
| | | | | | | | |
See accompanying notes to financial statements.
| 58
Statements of Operations
For the Year Ended September 30, 2016
| | | | | | | | | | | | |
| | | Fixed Income
Fund | | | Global Bond
Fund | | | Inflation
Protected
Securities Fund | |
INVESTMENT INCOME | | | | | | | | | | | | |
Interest | | $ | 57,209,616 | | | $ | 43,365,363 | | | $ | 394,103 | |
Dividends | | | 3,943,478 | | | | 239,344 | | | | — | |
Less net foreign taxes withheld | | | (98,981 | ) | | | (127,229 | ) | | | — | |
| | | | | | | | | | | | |
| | | 61,054,113 | | | | 43,477,478 | | | | 394,103 | |
| | | | | | | | | | | | |
Expenses | | | | | | | | | | | | |
Management fees (Note 6) | | | 6,044,882 | | | | 8,556,500 | | | | 73,113 | |
Distribution fees (Note 6) | | | — | | | | 967,737 | | | | 11,452 | |
Administrative fees (Note 6) | | | 532,869 | | | | 665,846 | | | | 12,892 | |
Trustees’ fees and expenses (Note 6) | | | 51,220 | | | | 61,425 | | | | 23,167 | |
Transfer agent fees and expenses (Notes 6 and 7) | | | 5,213 | | | | 2,476,264 | | | | 31,633 | |
Audit and tax services fees | | | 57,299 | | | | 55,233 | | | | 46,848 | |
Custodian fees and expenses | | | 73,461 | | | | 177,931 | | | | 7,187 | |
Legal fees | | | 20,099 | | | | 25,954 | | | | 516 | |
Registration fees | | | 30,998 | | | | 82,443 | | | | 40,201 | |
Shareholder reporting expenses | | | 4,230 | | | | 212,831 | | | | 5,195 | |
Miscellaneous expenses (Note 8) | | | 40,133 | | | | 95,492 | | | | 9,705 | |
| | | | | | | | | | | | |
Total expenses | | | 6,860,404 | | | | 13,377,656 | | | | 261,909 | |
Less waiver and/or expense reimbursement (Note 6) | | | — | | | | (1,067,719 | ) | | | (133,392 | ) |
| | | | | | | | | | | | |
Net expenses | | | 6,860,404 | | | | 12,309,937 | | | | 128,517 | |
| | | | | | | | | | | | |
Net investment income | | | 54,193,709 | | | | 31,167,541 | | | | 265,586 | |
| | | | | | | | | | | | |
| | | |
| NET REALIZED AND UNREALIZED GAIN (LOSS) ON INVESTMENTS, FUTURES CONTRACTS, SWAPTIONS WRITTEN AND FOREIGN CURRENCY TRANSACTIONS | | | | | | | | | | | | |
Net realized gain (loss) on: | | | | | | | | | | | | |
Investments | | | (14,889,348 | ) | | | (71,747,471 | ) | | | (358,607 | ) |
Futures contracts | | | — | | | | (3,819,963 | ) | | | (15,889 | ) |
Swaptions written | | | — | | | | — | | | | 34,250 | |
Foreign currency transactions | | | 156,209 | | | | 4,027,388 | | | | — | |
Net change in unrealized appreciation (depreciation) on: | | | | | | | | | | | | |
Investments | | | 71,275,756 | | | | 175,697,358 | | | | 1,907,677 | |
Futures contracts | | | — | | | | 1,625,312 | | | | (5,715 | ) |
Swaptions written | | | — | | | | — | | | | (15,958 | ) |
Foreign currency translations | | | 75,294 | | | | (3,065,368 | ) | | | — | |
| | | | | | | | | | | | |
Net realized and unrealized gain on investments, futures contracts, swaptions written and foreign currency transactions | | | 56,617,911 | | | | 102,717,256 | | | | 1,545,758 | |
| | | | | | | | | | | | |
| | | |
| NET INCREASE IN NET ASSETS RESULTING FROM OPERATIONS | | $ | 110,811,620 | | | $ | 133,884,797 | | | $ | 1,811,344 | |
| | | | | | | | | | | | |
See accompanying notes to financial statements.
59 |
Statements of Operations – continued
For the Year Ended September 30, 2016
| | | | | | | | |
| | | Institutional
High Income
Fund | | | Investment
Grade Fixed
Income Fund | |
INVESTMENT INCOME | | | | | | | | |
Interest | | $ | 39,738,327 | | | $ | 20,151,640 | |
Dividends | | | 2,820,087 | | | | 826,516 | |
Less net foreign taxes withheld | | | (47,973 | ) | | | (25,850 | ) |
| | | | | | | | |
| | | 42,510,441 | | | | 20,952,306 | |
| | | | | | | | |
Expenses | | | | | | | | |
Management fees (Note 6) | | | 3,896,072 | | | | 1,995,995 | |
Administrative fees (Note 6) | | | 286,319 | | | | 219,840 | |
Trustees’ fees and expenses (Note 6) | | | 37,659 | | | | 34,427 | |
Transfer agent fees and expenses (Notes 6 and 7) | | | 13,042 | | | | 2,617 | |
Audit and tax services fees | | | 53,104 | | | | 56,720 | |
Custodian fees and expenses | | | 59,889 | | | | 34,441 | |
Legal fees | | | 10,590 | | | | 8,262 | |
Registration fees | | | 23,473 | | | | 27,373 | |
Shareholder reporting expenses | | | 3,030 | | | | 2,282 | |
Miscellaneous expenses (Note 8) | | | 25,441 | | | | 23,383 | |
| | | | | | | | |
Total expenses | | | 4,408,619 | | | | 2,405,340 | |
| | | | | | | | |
Net investment income | | | 38,101,822 | | | | 18,546,966 | |
| | | | | | | | |
| | |
| NET REALIZED AND UNREALIZED GAIN (LOSS) ON INVESTMENTS AND FOREIGN CURRENCY TRANSACTIONS | | | | | | | | |
Net realized gain (loss) on: | | | | | | | | |
Investments | | | 1,187,433 | | | | (1,434,270 | ) |
Foreign currency transactions | | | (66,101 | ) | | | (60,960 | ) |
Net change in unrealized appreciation (depreciation) on: | | | | | | | | |
Investments | | | 43,629,819 | | | | 19,781,126 | |
Foreign currency translations | | | 10,793 | | | | 31,405 | |
| | | | | | | | |
Net realized and unrealized gain on investments and foreign currency transactions | | | 44,761,944 | | | | 18,317,301 | |
| | | | | | | | |
| | |
| NET INCREASE IN NET ASSETS RESULTING FROM OPERATIONS | | $ | 82,863,766 | | | $ | 36,864,267 | |
| | | | | | | | |
See accompanying notes to financial statements.
| 60
Statements of Changes in Net Assets
| | | | | | | | | | | | | | | | |
| | | Fixed Income Fund | | | Global Bond Fund | |
| | | Year Ended
September 30, 2016 | | | Year Ended
September 30, 2015 | | | Year Ended
September 30, 2016 | | | Year Ended
September 30, 2015 | |
| FROM OPERATIONS: | | | | | | | | | | | | | | | | |
Net investment income | | $ | 54,193,709 | | | $ | 60,526,080 | | | $ | 31,167,541 | | | $ | 41,044,407 | |
Net realized gain (loss) on investments, futures contracts and foreign currency transactions | | | (14,733,139 | ) | | | 16,668,733 | | | | (71,540,046 | ) | | | (50,222,329 | ) |
Net change in unrealized appreciation (depreciation) on investments, futures contracts and foreign currency translations | | | 71,351,050 | | | | (161,324,372 | ) | | | 174,257,302 | | | | (104,977,581 | ) |
| | | | | | | | | | | | | | | | |
Net increase (decrease) in net assets resulting from operations | | | 110,811,620 | | | | (84,129,559 | ) | | | 133,884,797 | | | | (114,155,503 | ) |
| | | | | | | | | | | | | | | | |
| FROM DISTRIBUTIONS TO SHAREHOLDERS: | | | | | | | | | | | | | | | | |
Net investment income | | | | | | | | | | | | | | | | |
Institutional Class | | | (55,935,164 | ) | | | (62,823,544 | ) | | | — | | | | (13,369,024 | ) |
Retail Class | | | — | | | | — | | | | — | | | | (5,236,847 | ) |
Class N | | | — | | | | — | | | | — | | | | (249,121 | ) |
Net realized capital gains | | | | | | | | | | | | | | | | |
Institutional Class | | | (20,555,156 | ) | | | (52,933,321 | ) | | | — | | | | (14,810,093 | ) |
Retail Class | | | — | | | | — | | | | — | | | | (6,158,675 | ) |
Class N | | | — | | | | — | | | | — | | | | (266,282 | ) |
| | | | | | | | | | | | | | | | |
Total distributions | | | (76,490,320 | ) | | | (115,756,865 | ) | | | — | | | | (40,090,042 | ) |
| | | | | | | | | | | | | | | | |
| NET INCREASE (DECREASE) IN NET ASSETS FROM CAPITAL SHARE TRANSACTIONS (NOTE 11) | | | (103,275,850 | ) | | | 66,423,160 | | | | (681,545,914 | ) | | | (340,547,779 | ) |
| | | | | | | | | | | | | | | | |
Net decrease in net assets | | | (68,954,550 | ) | | | (133,463,264 | ) | | | (547,661,117 | ) | | | (494,793,324 | ) |
| NET ASSETS | | | | | | | | | | | | | | | | |
Beginning of the year | | | 1,270,463,255 | | | | 1,403,926,519 | | | | 1,769,464,164 | | | | 2,264,257,488 | |
| | | | | | | | | | | | | | | | |
End of the year | | $ | 1,201,508,705 | | | $ | 1,270,463,255 | | | $ | 1,221,803,047 | | | $ | 1,769,464,164 | |
| | | | | | | | | | | | | | | | |
| UNDISTRIBUTED (DISTRIBUTIONS IN EXCESS OF) NET INVESTMENT INCOME/ACCUMULATED NET INVESTMENT LOSS | | $ | 19,210,462 | | | $ | 35,400,813 | | | $ | (1,709,790 | ) | | $ | (21,063,941 | ) |
| | | | | | | | | | | | | | | | |
See accompanying notes to financial statements.
61 |
Statements of Changes in Net Assets – continued
| | | | | | | | | | | | | | | | |
| | | Inflation Protected Securities Fund | | | Institutional High Income Fund | |
| | | Year Ended
September 30, 2016 | | | Year Ended
September 30, 2015 | | | Year Ended
September 30, 2016 | | | Year Ended
September 30, 2015 | |
| FROM OPERATIONS: | | | | | | | | | | | | | | | | |
Net investment income | | $ | 265,586 | | | $ | 218,436 | | | $ | 38,101,822 | | | $ | 35,878,007 | |
Net realized gain (loss) on investments, futures contracts, swaptions written and foreign currency transactions | | | (340,246 | ) | | | (532,097 | ) | | | 1,121,332 | | | | 18,138,284 | |
Net change in unrealized appreciation (depreciation) on investments, futures contracts, swaptions written and foreign currency translations | | | 1,886,004 | | | | (289,533 | ) | | | 43,640,612 | | | | (110,679,582 | ) |
| | | | | | | | | | | | | | | | |
Net increase (decrease) in net assets resulting from operations | | | 1,811,344 | | | | (603,194 | ) | | | 82,863,766 | | | | (56,663,291 | ) |
| | | | | | | | | | | | | | | | |
| FROM DISTRIBUTIONS TO SHAREHOLDERS: | | | | | | | | | | | | | | | | |
Net investment income | | | | | | | | | | | | | | | | |
Institutional Class | | | (347,784 | ) | | | (150,516 | ) | | | (38,822,138 | ) | | | (35,993,409 | ) |
Retail Class | | | (16,091 | ) | | | (93,557 | ) | | | — | | | | — | |
Net realized capital gains | | | | | | | | | | | | | | | | |
Institutional Class | | | — | | | | — | | | | (20,172,827 | ) | | | (30,161,602 | ) |
Paid-in capital | | | | | | | | | | | | | | | | |
Institutional Class | | | (21,528 | ) | | | — | | | | — | | | | — | |
Retail Class | | | (575 | ) | | | — | | | | — | | | | — | |
| | | | | | | | | | | | | | | | |
Total distributions | | | (385,978 | ) | | | (244,073 | ) | | | (58,994,965 | ) | | | (66,155,011 | ) |
| | | | | | | | | | | | | | | | |
| NET INCREASE (DECREASE) IN NET ASSETS FROM CAPITAL SHARE TRANSACTIONS (NOTE 11) | | | (13,146,542 | ) | | | 13,565,630 | | | | 59,897,205 | | | | 59,907,686 | |
| | | | | | | | | | | | | | | | |
Net increase (decrease) in net assets | | | (11,721,176 | ) | | | 12,718,363 | | | | 83,766,006 | | | | (62,910,616 | ) |
| NET ASSETS | | | | | | | | | | | | | | | | |
Beginning of the year | | | 42,898,310 | | | | 30,179,947 | | | | 630,422,158 | | | | 693,332,774 | |
| | | | | | | | | | | | | | | | |
End of the year | | $ | 31,177,134 | | | $ | 42,898,310 | | | $ | 714,188,164 | | | $ | 630,422,158 | |
| | | | | | | | | | | | | | | | |
| UNDISTRIBUTED (DISTRIBUTIONS IN EXCESS OF) NET INVESTMENT INCOME | | $ | (129,717 | ) | | $ | (33,820 | ) | | $ | 20,278,507 | | | $ | 21,352,219 | |
| | | | | | | | | | | | | | | | |
See accompanying notes to financial statements.
| 62
Statements of Changes in Net Assets – continued
| | | | | | | | |
| | | Investment Grade Fixed Income Fund | |
| | | Year Ended
September 30, 2016 | | | Year Ended
September 30, 2015 | |
| FROM OPERATIONS: | | | | | | | | |
Net investment income | | $ | 18,546,966 | | | $ | 20,815,759 | |
Net realized gain (loss) on investments and foreign currency transactions | | | (1,495,230 | ) | | | 3,141,130 | |
Net change in unrealized appreciation (depreciation) on investments and foreign currency translations | | | 19,812,531 | | | | (46,423,266 | ) |
| | | | | | | | |
Net increase (decrease) in net assets resulting from operations | | | 36,864,267 | | | | (22,466,377 | ) |
| | | | | | | | |
| FROM DISTRIBUTIONS TO SHAREHOLDERS: | | | | | | | | |
Net investment income | | | | | | | | |
Institutional Class | | | (9,226,102 | ) | | | (22,346,530 | ) |
Net realized capital gains | | | | | | | | |
Institutional Class | | | (5,935,580 | ) | | | (5,521,716 | ) |
| | | | | | | | |
Total distributions | | | (15,161,682 | ) | | | (27,868,246 | ) |
| | | | | | | | |
| NET INCREASE (DECREASE) IN NET ASSETS FROM CAPITAL SHARE TRANSACTIONS (NOTE 11) | | | (121,681,227 | ) | | | 135,152 | |
| | | | | | | | |
Net decrease in net assets | | | (99,978,642 | ) | | | (50,199,471 | ) |
| NET ASSETS | | | | | | | | |
Beginning of the year | | | 561,407,426 | | | | 611,606,897 | |
| | | | | | | | |
End of the year | | $ | 461,428,784 | | | $ | 561,407,426 | |
| | | | | | | | |
| DISTRIBUTIONS IN EXCESS OF NET INVESTMENT INCOME | | $ | (1,030,169 | ) | | $ | (1,673,007 | ) |
| | | | | | | | |
See accompanying notes to financial statements.
63 |
Financial Highlights
For a share outstanding throughout each period.
| | | | | | | | | | | | | | | | | | | | |
| | | Fixed Income Fund – Institutional Class | |
| | | Year Ended
September 30,
2016 | | | Year Ended
September 30,
2015 | | | Year Ended
September 30,
2014 | | | Year Ended
September 30,
2013 | | | Year Ended
September 30,
2012 | |
Net asset value, beginning of the period | | $ | 13.16 | | | $ | 15.22 | | | $ | 14.97 | | | $ | 14.83 | | | $ | 13.69 | |
| | | | | | | | | | | | | | | | | | | | |
INCOME (LOSS) FROM INVESTMENT OPERATIONS: | | | | | | | | | | | | | | | | | | | | |
Net investment income(a) | | | 0.58 | | | | 0.60 | | | | 0.65 | | | | 0.69 | | | | 0.72 | |
Net realized and unrealized gain (loss) | | | 0.61 | | | | (1.46 | ) | | | 0.57 | | | | 0.27 | | | | 1.31 | |
| | | | | | | | | | | | | | | | | | | | |
Total from Investment Operations | | | 1.19 | | | | (0.86 | ) | | | 1.22 | | | | 0.96 | | | | 2.03 | |
| | | | | | | | | | | | | | | | | | | | |
LESS DISTRIBUTIONS FROM: | | | | | | | | | | | | | | | | | | | | |
Net investment income | | | (0.61 | ) | | | (0.65 | ) | | | (0.76 | ) | | | (0.74 | ) | | | (0.84 | ) |
Net realized capital gains | | | (0.22 | ) | | | (0.55 | ) | | | (0.21 | ) | | | (0.08 | ) | | | (0.05 | ) |
| | | | | | | | | | | | | | | | | | | | |
Total Distributions | | | (0.83 | ) | | | (1.20 | ) | | | (0.97 | ) | | | (0.82 | ) | | | (0.89 | ) |
| | | | | | | | | | | | | | | | | | | | |
Net asset value, end of the period | | $ | 13.52 | | | $ | 13.16 | | | $ | 15.22 | | | $ | 14.97 | | | $ | 14.83 | |
| | | | | | | | | | | | | | | | | | | | |
Total return | | | 9.72 | % | | | (5.96 | )% | | | 8.51 | % | | | 6.71 | % | | | 15.79 | % |
RATIOS TO AVERAGE NET ASSETS: | | | | | | | | | | | | | | | | | | | | |
Net assets, end of the period (000’s) | | $ | 1,201,509 | | | $ | 1,270,463 | | | $ | 1,403,927 | | | $ | 1,192,028 | | | $ | 1,134,935 | |
Net expenses | | | 0.57 | % | | | 0.57 | % | | | 0.57 | % | | | 0.57 | % | | | 0.57 | % |
Gross expenses | | | 0.57 | % | | | 0.57 | % | | | 0.57 | % | | | 0.57 | % | | | 0.57 | % |
Net investment income | | | 4.48 | % | | | 4.29 | % | | | 4.31 | % | | | 4.64 | % | | | 5.10 | % |
Portfolio turnover rate | | | 14 | % | | | 15 | % | | | 26 | % | | | 18 | % | | | 17 | % |
| (a) | | Per share net investment income has been calculated using the average shares outstanding during the period. | |
| | | | | | | | | | | | | | | | | | | | |
| | | Global Bond Fund – Institutional Class | |
| | | Year Ended
September 30,
2016 | | | Year Ended
September 30,
2015 | | | Year Ended
September 30,
2014 | | | Year Ended
September 30,
2013 | | | Year Ended
September 30,
2012 | |
Net asset value, beginning of the period | | $ | 15.00 | | | $ | 16.13 | | | $ | 16.56 | | | $ | 17.36 | | | $ | 16.52 | |
| | | | | | | | | | | | | | | | | | | | |
INCOME (LOSS) FROM INVESTMENT OPERATIONS: | | | | | | | | | | | | | | | | | | | | |
Net investment income(a) | | | 0.33 | | | | 0.32 | | | | 0.34 | | | | 0.33 | | | | 0.44 | |
Net realized and unrealized gain (loss) | | | 1.14 | | | | (1.16 | ) | | | (0.08 | ) | | | (0.70 | ) | | | 1.05 | |
| | | | | | | | | | | | | | | | | | | | |
Total from Investment Operations | | | 1.47 | | | | (0.84 | ) | | | 0.26 | | | | (0.37 | ) | | | 1.49 | |
| | | | | | | | | | | | | | | | | | | | |
LESS DISTRIBUTIONS FROM: | | | | | | | | | | | | | | | | | | | | |
Net investment income | | | — | | | | (0.14 | ) | | | (0.51 | ) | | | (0.43 | ) | | | (0.65 | ) |
Net realized capital gains | | | — | | | | (0.15 | ) | | | (0.18 | ) | | | — | | | | — | |
| | | | | | | | | | | | | | | | | | | | |
Total Distributions | | | — | | | | (0.29 | ) | | | (0.69 | ) | | | (0.43 | ) | | | (0.65 | ) |
| | | | | | | | | | | | | | | | | | | | |
Net asset value, end of the period | | $ | 16.47 | | | $ | 15.00 | | | $ | 16.13 | | | $ | 16.56 | | | $ | 17.36 | |
| | | | | | | | | | | | | | | | | | | | |
Total return | | | 9.80 | %(b) | | | (5.31 | )%(b) | | | 1.57 | %(b) | | | (2.14 | )%(b) | | | 9.45 | % |
RATIOS TO AVERAGE NET ASSETS: | | | | | | | | | | | | | | | | | | | | |
Net assets, end of the period (000’s) | | $ | 822,993 | | | $ | 1,289,885 | | | $ | 1,553,641 | | | $ | 1,669,103 | | | $ | 1,629,719 | |
Net expenses | | | 0.75 | %(c) | | | 0.75 | %(c) | | | 0.75 | %(c) | | | 0.75 | %(c) | | | 0.72 | % |
Gross expenses | | | 0.83 | % | | | 0.78 | % | | | 0.77 | % | | | 0.78 | % | | | 0.72 | % |
Net investment income | | | 2.13 | % | | | 2.07 | % | | | 2.03 | % | | | 1.96 | % | | | 2.64 | % |
Portfolio turnover rate | | | 120 | % | | | 117 | % | | | 143 | % | | | 185 | %(d) | | | 102 | % |
| (a) | | Per share net investment income has been calculated using the average shares outstanding during the period. | |
| (b) | | Had certain expenses not been waived/reimbursed during the period, total returns would have been lower. | |
| (c) | | The investment adviser agreed to waive its fees and/or reimburse a portion of the Fund’s expenses during the period. Without this waiver/reimbursement, expenses would have been higher. | |
| (d) | | The variation in the Fund’s turnover rate from 2012 to 2013 is due to an increase in TBA transactions. See Note 2 of Notes to Financial Statements. | |
See accompanying notes to financial statements.
| 64
Financial Highlights – continued
For a share outstanding throughout each period.
| | | | | | | | | | | | | | | | | | | | |
| | | Global Bond Fund – Retail Class | |
| | | Year Ended
September 30,
2016 | | | Year Ended
September 30,
2015 | | | Year Ended
September 30,
2014 | | | Year Ended
September 30,
2013 | | | Year Ended
September 30,
2012 | |
Net asset value, beginning of the period | | $ | 14.82 | | | $ | 15.97 | | | $ | 16.40 | | | $ | 17.20 | | | $ | 16.37 | |
| | | | | | | | | | | | | | | | | | | | |
INCOME (LOSS) FROM INVESTMENT OPERATIONS: | | | | | | | | | | | | | | | | | | | | |
Net investment income(a) | | | 0.29 | | | | 0.28 | | | | 0.29 | | | | 0.29 | | | | 0.40 | |
Net realized and unrealized gain (loss) | | | 1.12 | | | | (1.15 | ) | | | (0.07 | ) | | | (0.70 | ) | | | 1.04 | |
| | | | | | | | | | | | | | | | | | | | |
Total from Investment Operations | | | 1.41 | | | | (0.87 | ) | | | 0.22 | | | | (0.41 | ) | | | 1.44 | |
| | | | | | | | | | | | | | | | | | | | |
LESS DISTRIBUTIONS FROM: | | | | | | | | | | | | | | | | | | | | |
Net investment income | | | — | | | | (0.13 | ) | | | (0.47 | ) | | | (0.39 | ) | | | (0.61 | ) |
Net realized capital gains | | | — | | | | (0.15 | ) | | | (0.18 | ) | | | — | | | | — | |
| | | | | | | | | | | | | | | | | | | | |
Total Distributions | | | — | | | | (0.28 | ) | | | (0.65 | ) | | | (0.39 | ) | | | (0.61 | ) |
| | | | | | | | | | | | | | | | | | | | |
Net asset value, end of the period | | $ | 16.23 | | | $ | 14.82 | | | $ | 15.97 | | | $ | 16.40 | | | $ | 17.20 | |
| | | | | | | | | | | | | | | | | | | | |
Total return | | | 9.51 | %(b) | | | (5.56 | )%(b) | | | 1.35 | % | | | (2.39 | )% | | | 9.20 | % |
RATIOS TO AVERAGE NET ASSETS: | | | | | | | | | | | | | | | | | | | | |
Net assets, end of the period (000’s) | | $ | 350,915 | | | $ | 447,304 | | | $ | 682,624 | | | $ | 798,335 | | | $ | 995,211 | |
Net expenses | | | 1.00 | %(c) | | | 1.00 | %(c) | | | 0.98 | % | | | 0.98 | % | | | 0.97 | % |
Gross expenses | | | 1.08 | % | | | 1.03 | % | | | 0.98 | % | | | 0.98 | % | | | 0.97 | % |
Net investment income | | | 1.87 | % | | | 1.81 | % | | | 1.80 | % | | | 1.72 | % | | | 2.43 | % |
Portfolio turnover rate | | | 120 | % | | | 117 | % | | | 143 | % | | | 185 | %(d) | | | 102 | % |
| (a) | | Per share net investment income has been calculated using the average shares outstanding during the period. | |
| (b) | | Had certain expenses not been waived/reimbursed during the period, total returns would have been lower. | |
| (c) | | The investment adviser agreed to waive its fees and/or reimburse a portion of the Fund’s expenses during the period. Without this waiver/reimbursement, expenses would have been higher. | |
| (d) | | The variation in the Fund’s turnover rate from 2012 to 2013 is due to an increase in TBA transactions. See Note 2 of Notes to Financial Statements. | |
| | | | | | | | | | | | | | | | |
| | | Global Bond Fund – Class N | |
| | | Year Ended
September 30,
2016
| | | Year Ended
September 30,
2015
| | | Year Ended
September 30,
2014
| | | Period Ended
September 30,
2013*
| |
Net asset value, beginning of the period | | $ | 15.01 | | | $ | 16.13 | | | $ | 16.56 | | | $ | 17.18 | |
| | | | | | | | | | | | | | | | |
INCOME (LOSS) FROM INVESTMENT OPERATIONS: | | | | | | | | | | | | | | | | |
Net investment income(a) | | | 0.34 | | | | 0.34 | | | | 0.36 | | | | 0.22 | |
Net realized and unrealized gain (loss) | | | 1.15 | | | | (1.17 | ) | | | (0.08 | ) | | | (0.56 | ) |
| | | | | | | | | | | | | | | | |
Total from Investment Operations | | | 1.49 | | | | (0.83 | ) | | | 0.28 | | | | (0.34 | ) |
| | | | | | | | | | | | | | | | |
LESS DISTRIBUTIONS FROM: | | | | | | | | | | | | | | | | |
Net investment income | | | — | | | | (0.14 | ) | | | (0.53 | ) | | | (0.28 | ) |
Net realized capital gains | | | — | | | | (0.15 | ) | | | (0.18 | ) | | | — | |
| | | | | | | | | | | | | | | | |
Total Distributions | | | — | | | | (0.29 | ) | | | (0.71 | ) | | | (0.28 | ) |
| | | | | | | | | | | | | | | | |
Net asset value, end of the period | | $ | 16.50 | | | $ | 15.01 | | | $ | 16.13 | | | $ | 16.56 | |
| | | | | | | | | | | | | | | | |
Total return | | | 9.93 | % | | | (5.22 | )% | | | 1.70 | % | | | (1.97 | )%(b)(c) |
RATIOS TO AVERAGE NET ASSETS: | | | | | | | | | | | | | | | | |
Net assets, end of the period (000’s) | | $ | 47,895 | | | $ | 32,275 | | | $ | 27,993 | | | $ | 550 | |
Net expenses | | | 0.66 | % | | | 0.63 | % | | | 0.63 | %(d) | | | 0.70 | %(e)(f) |
Gross expenses | | | 0.66 | % | | | 0.63 | % | | | 0.63 | %(d) | | | 0.83 | %(f) |
Net investment income | | | 2.19 | % | | | 2.20 | % | | | 2.16 | % | | | 2.01 | %(f) |
Portfolio turnover rate | | | 120 | % | | | 117 | % | | | 143 | % | | | 185 | % |
| * | | From commencement of Class operations on February 1, 2013 through September 30, 2013. | |
| (a) | | Per share net investment income has been calculated using the average shares outstanding during the period. | |
| (b) | | Periods less than one year are not annualized. | |
| (c) | | Had certain expenses not been waived/reimbursed during the period, total returns would have been lower. | |
| (d) | | Includes fee/expense recovery of 0.01%. | |
| (e) | | The investment adviser agreed to waive its fees and/or reimburse a portion of the Fund’s expenses during the period. Without this waiver/reimbursement, expenses would have been higher. | |
| (f) | | Computed on an annualized basis for periods less than one year. | |
See accompanying notes to financial statements.
65 |
Financial Highlights – continued
For a share outstanding throughout each period.
| | | | | | | | | | | | | | | | | | | | |
| | | Inflation Protected Securities Fund – Institutional Class | |
| | | Year Ended
September 30,
2016 | | | Year Ended
September 30,
2015 | | | Year Ended
September 30,
2014 | | | Year Ended
September 30,
2013 | | | Year Ended
September 30,
2012 | |
Net asset value, beginning of the period | | $ | 10.17 | | | $ | 10.33 | | | $ | 10.64 | | | $ | 12.18 | | | $ | 11.58 | |
| | | | | | | | | | | | | | | | | | | | |
INCOME (LOSS) FROM INVESTMENT OPERATIONS: | | | | | | | | | | | | | | | | | | | | |
Net investment income(a) | | | 0.12 | | | | 0.06 | | | | 0.15 | | | | 0.09 | | | | 0.11 | |
Net realized and unrealized gain (loss) | | | 0.49 | | | | (0.15 | ) | | | (0.16 | ) | | | (0.74 | ) | | | 0.92 | |
| | | | | | | | | | | | | | | | | | | | |
Total from Investment Operations | | | 0.61 | | | | (0.09 | ) | | | (0.01 | ) | | | (0.65 | ) | | | 1.03 | |
| | | | | | | | | | | | | | | | | | | | |
LESS DISTRIBUTIONS FROM: | | | | | | | | | | | | | | | | | | | | |
Net investment income | | | (0.13 | ) | | | (0.07 | ) | | | (0.20 | ) | | | (0.19 | ) | | | (0.28 | ) |
Net realized capital gains | | | — | | | | — | | | | (0.10 | ) | | | (0.70 | ) | | | (0.15 | ) |
Paid-in capital | | | (0.01 | ) | | | — | | | | — | | | | — | | | | — | |
| | | | | | | | | | | | | | | | | | | | |
Total Distributions | | | (0.14 | ) | | | (0.07 | ) | | | (0.30 | ) | | | (0.89 | ) | | | (0.43 | ) |
| | | | | | | | | | | | | | | | | | | | |
Net asset value, end of the period | | $ | 10.64 | | | $ | 10.17 | | | $ | 10.33 | | | $ | 10.64 | | | $ | 12.18 | |
| | | | | | | | | | | | | | | | | | | | |
Total return(b) | | | 6.00 | % | | | (0.92 | )% | | | (0.02 | )% | | | (5.70 | )% | | | 9.01 | % |
RATIOS TO AVERAGE NET ASSETS: | | | | | | | | | | | | | | | | | | | | |
Net assets, end of the period (000’s) | | $ | 29,655 | | | $ | 23,696 | | | $ | 24,480 | | | $ | 18,434 | | | $ | 23,771 | |
Net expenses(c) | | | 0.40 | % | | | 0.40 | % | | | 0.40 | % | | | 0.40 | % | | | 0.40 | % |
Gross expenses | | | 0.86 | % | | | 0.80 | % | | | 0.91 | % | | | 0.91 | % | | | 0.85 | % |
Net investment income | | | 1.16 | % | | | 0.62 | % | | | 1.41 | % | | | 0.75 | % | | | 0.95 | % |
Portfolio turnover rate | | | 61 | % | | | 135 | % | | | 206 | %(d) | | | 56 | % | | | 166 | % |
| (a) | | Per share net investment income has been calculated using the average shares outstanding during the period. | |
| (b) | | Had certain expenses not been waived/reimbursed during the period, total returns would have been lower. | |
| (c) | | The investment adviser agreed to waive its fees and/or reimburse a portion of the Fund’s expenses during the period. Without this waiver/reimbursement, expenses would have been higher. | |
| (d) | | The variation in the Fund’s turnover rate from 2013 to 2014 was primarily due to portfolio repositioning, as well as fluctuation in the level of fund assets due to shareholder flows. | |
| | | | | | | | | | | | | | | | | | | | |
| | | Inflation Protected Securities Fund – Retail Class | |
| | | Year Ended
September 30,
2016 | | | Year Ended
September 30,
2015 | | | Year Ended
September 30,
2014 | | | Year Ended
September 30,
2013 | | | Year Ended
September 30,
2012 | |
Net asset value, beginning of the period | | $ | 10.14 | | | $ | 10.31 | | | $ | 10.61 | | | $ | 12.15 | | | $ | 11.56 | |
| | | | | | | | | | | | | | | | | | | | |
INCOME (LOSS) FROM INVESTMENT OPERATIONS: | | | | | | | | | | | | | | | | | | | | |
Net investment income (loss)(a) | | | (0.05 | ) | | | 0.08 | | | | 0.14 | | | | (0.05 | ) | | | 0.04 | |
Net realized and unrealized gain (loss) | | | 0.60 | | | | (0.20 | ) | | | (0.16 | ) | | | (0.64 | ) | | | 0.96 | |
| | | | | | | | | | | | | | | | | | | | |
Total from Investment Operations | | | 0.55 | | | | (0.12 | ) | | | (0.02 | ) | | | (0.69 | ) | | | 1.00 | |
| | | | | | | | | | | | | | | | | | | | |
LESS DISTRIBUTIONS FROM: | | | | | | | | | | | | | | | | | | | | |
Net investment income | | | (0.07 | ) | | | (0.05 | ) | | | (0.18 | ) | | | (0.15 | ) | | | (0.26 | ) |
Net realized capital gains | | | — | | | | — | | | | (0.10 | ) | | | (0.70 | ) | | | (0.15 | ) |
Paid-in capital | | | (0.00 | )(e) | | | — | | | | — | | | | — | | | | — | |
| | | | | | | | | | | | | | | | | | | | |
Total Distributions | | | (0.07 | ) | | | (0.05 | ) | | | (0.28 | ) | | | (0.85 | ) | | | (0.41 | ) |
| | | | | | | | | | | | | | | | | | | | |
Net asset value, end of the period | | $ | 10.62 | | | $ | 10.14 | | | $ | 10.31 | | | $ | 10.61 | | | $ | 12.15 | |
| | | | | | | | | | | | | | | | | | | | |
Total return(b) | | | 5.47 | % | | | (1.17 | )% | | | (0.15 | )% | | | (6.04 | )% | | | 8.71 | % |
RATIOS TO AVERAGE NET ASSETS: | | | | | | | | | | | | | | | | | | | | |
Net assets, end of the period (000’s) | | $ | 1,522 | | | $ | 19,203 | | | $ | 5,700 | | | $ | 3,499 | | | $ | 3,169 | |
Net expenses(c) | | | 0.65 | % | | | 0.65 | % | | | 0.65 | % | | | 0.65 | % | | | 0.65 | % |
Gross expenses | | | 1.07 | % | | | 1.03 | % | | | 1.19 | % | | | 1.23 | % | | | 1.23 | % |
Net investment income (loss) | | | (0.47 | )% | | | 0.75 | % | | | 1.36 | % | | | (0.44 | )% | | | 0.35 | % |
Portfolio turnover rate | | | 61 | % | | | 135 | % | | | 206 | %(d) | | | 56 | % | | | 166 | % |
| (a) | | Per share net investment income (loss) has been calculated using the average shares outstanding during the period. | |
| (b) | | Had certain expenses not been waived/reimbursed during the period, total returns would have been lower. | |
| (c) | | The investment adviser agreed to waive its fees and/or reimburse a portion of the Fund’s expenses during the period. Without this waiver/reimbursement, expenses would have been higher. | |
| (d) | | The variation in the Fund’s turnover rate from 2013 to 2014 was primarily due to portfolio repositioning, as well as fluctuation in the level of fund assets due to shareholder flows. | |
| (e) | | Amount rounds to less than $0.01 per share. | |
See accompanying notes to financial statements.
| 66
Financial Highlights – continued
For a share outstanding throughout each period.
| | | | | | | | | | | | | | | | | | | | |
| | | Institutional High Income Fund – Institutional Class | |
| | | Year Ended
September 30,
2016 | | | Year Ended
September 30,
2015 | | | Year Ended
September 30,
2014 | | | Year Ended
September 30,
2013 | | | Year Ended
September 30,
2012 | |
Net asset value, beginning of the period | | $ | 6.72 | | | $ | 8.15 | | | $ | 8.24 | | | $ | 7.74 | | | $ | 7.15 | |
| | | | | | | | | | | | | | | | | | | | |
INCOME (LOSS) FROM INVESTMENT OPERATIONS: | | | | | | | | | | | | | | | | | | | | |
Net investment income(a) | | | 0.37 | | | | 0.40 | | | | 0.42 | | | | 0.46 | | | | 0.46 | |
Net realized and unrealized gain (loss) | | | 0.36 | | | | (1.04 | ) | | | 0.43 | | | | 0.57 | | | | 0.75 | |
| | | | | | | | | | | | | | | | | | | | |
Total from Investment Operations | | | 0.73 | | | | (0.64 | ) | | | 0.85 | | | | 1.03 | | | | 1.21 | |
| | | | | | | | | | | | | | | | | | | | |
LESS DISTRIBUTIONS FROM: | | | | | | | | | | | | | | | | | | | | |
Net investment income | | | (0.42 | ) | | | (0.43 | ) | | | (0.52 | ) | | | (0.50 | ) | | | (0.45 | ) |
Net realized capital gains | | | (0.22 | ) | | | (0.36 | ) | | | (0.42 | ) | | | (0.03 | ) | | | (0.17 | ) |
| | | | | | | | | | | | | | | | | | | | |
Total Distributions | | | (0.64 | ) | | | (0.79 | ) | | | (0.94 | ) | | | (0.53 | ) | | | (0.62 | ) |
| | | | | | | | | | | | | | | | | | | | |
Net asset value, end of the period | | $ | 6.81 | | | $ | 6.72 | | | $ | 8.15 | | | $ | 8.24 | | | $ | 7.74 | |
| | | | | | | | | | | | | | | | | | | | |
Total return | | | 12.53 | % | | | (8.38 | )% | | | 11.14 | % | | | 14.17 | % | | | 18.37 | % |
RATIOS TO AVERAGE NET ASSETS: | | | | | | | | | | | | | | | | | | | | |
Net assets, end of the period (000’s) | | $ | 714,188 | | | $ | 630,422 | | | $ | 693,333 | | | $ | 664,866 | | | $ | 652,767 | |
Net expenses | | | 0.68 | % | | | 0.68 | % | | | 0.68 | % | | | 0.68 | % | | | 0.68 | % |
Gross expenses | | | 0.68 | % | | | 0.68 | % | | | 0.68 | % | | | 0.68 | % | | | 0.68 | % |
Net investment income | | | 5.87 | % | | | 5.45 | % | | | 5.16 | % | | | 5.76 | % | | | 6.30 | % |
Portfolio turnover rate | | | 17 | % | | | 19 | % | | | 29 | % | | | 28 | % | | | 21 | % |
| (a) | | Per share net investment income has been calculated using the average shares outstanding during the period. | |
| | | | | | | | | | | | | | | | | | | | |
| | | Investment Grade Fixed Income Fund – Institutional Class | |
| | | Year Ended
September 30,
2016 | | | Year Ended
September 30,
2015 | | | Year Ended
September 30,
2014 | | | Year Ended
September 30,
2013 | | | Year Ended
September 30,
2012 | |
Net asset value, beginning of the period | | $ | 11.81 | | | $ | 12.82 | | | $ | 12.82 | | | $ | 13.21 | | | $ | 12.52 | |
| | | | | | | | | | | | | | | | | | | | |
INCOME (LOSS) FROM INVESTMENT OPERATIONS: | | | | | | | | | | | | | | | | | | | | |
Net investment income(a) | | | 0.45 | | | | 0.42 | | | | 0.46 | | | | 0.49 | | | | 0.56 | |
Net realized and unrealized gain (loss) | | | 0.50 | | | | (0.88 | ) | | | 0.21 | | | | (0.21 | ) | | | 0.97 | |
| | | | | | | | | | | | | | | | | | | | |
Total from Investment Operations | | | 0.95 | | | | (0.46 | ) | | | 0.67 | | | | 0.28 | | | | 1.53 | |
| | | | | | | | | | | | | | | | | | | | |
LESS DISTRIBUTIONS FROM: | | | | | | | | | | | | | | | | | | | | |
Net investment income | | | (0.22 | ) | | | (0.44 | ) | | | (0.51 | ) | | | (0.54 | ) | | | (0.66 | ) |
Net realized capital gains | | | (0.12 | ) | | | (0.11 | ) | | | (0.16 | ) | | | (0.13 | ) | | | (0.18 | ) |
| | | | | | | | | | | | | | | | | | | | |
Total Distributions | | | (0.34 | ) | | | (0.55 | ) | | | (0.67 | ) | | | (0.67 | ) | | | (0.84 | ) |
| | | | | | | | | | | | | | | | | | | | |
Net asset value, end of the period | | $ | 12.42 | | | $ | 11.81 | | | $ | 12.82 | | | $ | 12.82 | | | $ | 13.21 | |
| | | | | | | | | | | | | | | | | | | | |
Total return | | | 8.27 | % | | | (3.74 | )% | | | 5.36 | % | | | 2.14 | % | | | 12.78 | % |
RATIOS TO AVERAGE NET ASSETS: | | | | | | | | | | | | | | | | | | | | |
Net assets, end of the period (000’s) | | $ | 461,429 | | | $ | 561,407 | | | $ | 611,607 | | | $ | 739,886 | | | $ | 690,693 | |
Net expenses | | | 0.48 | % | | | 0.48 | % | | | 0.48 | % | | | 0.47 | % | | | 0.48 | % |
Gross expenses | | | 0.48 | % | | | 0.48 | % | | | 0.48 | % | | | 0.47 | % | | | 0.48 | % |
Net investment income | | | 3.72 | % | | | 3.34 | % | | | 3.52 | % | | | 3.72 | % | | | 4.44 | % |
Portfolio turnover rate | | | 23 | % | | | 26 | % | | | 23 | % | | | 25 | % | | | 19 | % |
| (a) | | Per share net investment income has been calculated using the average shares outstanding during the period. | |
See accompanying notes to financial statements.
67 |
Notes to Financial Statements
September 30, 2016
1. Organization. Loomis Sayles Funds I (the “Trust”) is organized as a Massachusetts business trust. The Trust is registered under the Investment Company Act of 1940, as amended (the “1940 Act”) as an open-end management investment company. The Declaration of Trust permits the Board of Trustees to authorize the issuance of an unlimited number of shares of the Trust in multiple series. The financial statements for certain funds of the Trust are presented in separate reports. The following funds (individually, a “Fund” and collectively, the “Funds”) are included in this report:
Loomis Sayles Fixed Income Fund (the “Fixed Income Fund”)
Loomis Sayles Global Bond Fund (the “Global Bond Fund”)
Loomis Sayles Inflation Protected Securities Fund (the “Inflation Protected Securities Fund”)
Loomis Sayles Institutional High Income Fund (the “Institutional High Income Fund”)
Loomis Sayles Investment Grade Fixed Income Fund (the “Investment Grade Fixed Income Fund”)
Each Fund is a diversified investment company.
Each Fund offers Institutional Class shares. Global Bond Fund and Inflation Protected Securities Fund also offer Retail Class shares. In addition, Global Bond Fund offers Class N shares.
Each share class is sold without a sales charge. Retail Class shares pay a Rule 12b-1 fee. Class N shares are offered with no initial minimum investment to certain retirement plans held in an omnibus fashion and fund of funds that are distributed by NGAM Distribution, L.P. (“NGAM Distribution”) and with an initial minimum investment of $1,000,000 to other categories of investors. Institutional Class shares are intended for institutional investors with a minimum initial investment of $100,000 for Global Bond Fund and Inflation Protected Securities Fund and $3,000,000 for Fixed Income Fund, Institutional High Income Fund and Investment Grade Fixed Income Fund, though some categories of investors are exempted from the minimum investment amount as outlined in the Funds’ prospectus.
Most expenses can be directly attributed to a Fund. Expenses which cannot be directly attributed to a Fund are generally apportioned based on the relative net assets of each of the funds in Natixis Funds Trust I, Natixis Funds Trust II, Natixis Funds Trust IV, Gateway Trust (“Natixis Funds Trusts”), Loomis Sayles Funds I and Loomis Sayles Funds II (“Loomis Sayles Funds Trusts”). Expenses of a Fund are borne pro rata by the holders of each class of shares, except that each class bears expenses unique to that class (such as the Rule 12b-1 fees applicable to Retail Class), and transfer agent fees for Global Bond Fund are borne collectively for Institutional Class and Retail Class, and individually for Class N. In addition, each class votes as a class only with respect to its own Rule 12b-1 Plan. Shares of each class would receive their pro rata share of the net assets of a Fund if the Fund were liquidated. The Trustees approve separate distributions from net investment income on each class of shares.
2. Significant Accounting Policies. The following is a summary of significant accounting policies consistently followed by each Fund in the preparation of its financial statements. The Funds’ financial statements follow the accounting and reporting guidelines provided for investment companies and are prepared in accordance with accounting principles generally accepted in the United States of America which require the use of management estimates that affect the reported amounts and disclosures in the financial statements. Actual results could differ from those estimates. Management has evaluated the events and transactions subsequent to year-end through the date the financial statements were issued and has determined that there were no material events that would require disclosure in the Funds’ financial statements.
a. Valuation. Fund securities and other investments are valued at market value based on market quotations obtained or determined by independent pricing services recommended by the adviser and approved by the Board of Trustees. Fund securities and other investments for which market quotations are not readily available are valued at fair value as determined in good faith by the adviser pursuant to procedures approved by the Board of Trustees, as described below. Market value is determined as follows:
Debt securities and unlisted preferred equity securities are valued based on evaluated bids furnished to the Fund by an independent pricing service or bid prices obtained from broker-dealers. Senior loans are valued at bid prices supplied by an independent pricing service, if available. Listed equity securities (including shares of closed-end investment companies and exchange-traded funds) are valued at the last sale price quoted on the exchange where they are traded most extensively or, if there is no reported sale during the day, the closing bid quotation as reported by an independent pricing service. Securities traded on the NASDAQ Global Select Market, NASDAQ Global Market and NASDAQ Capital Market are valued at the NASDAQ Official Closing Price (“NOCP”), or if lacking an NOCP, at the most recent bid quotations on the applicable NASDAQ Market. Unlisted equity securities (except unlisted preferred equity securities) are valued at the last sale price quoted in the market where they are traded most extensively or, if there is no reported sale during the day, the closing bid quotation as reported by an independent pricing service. If there is no last sale price or closing bid quotation available, unlisted equity securities will be valued using evaluated bids furnished by an independent pricing service, if available. In some foreign markets, an official close price and a last sale price may be available from the foreign exchange or market. In those cases, the official close price is used. Broker-dealer bid prices may be used to value debt and unlisted equity securities and senior loans where an independent pricing service is unable to price a security or where an independent pricing service does not provide a reliable price for the security. Forward foreign currency contracts are valued utilizing interpolated rates determined based on information provided by an independent pricing service. Futures contracts are valued at the most
| 68
Notes to Financial Statements – continued
September 30, 2016
recent settlement price on the exchange on which the adviser believes that, over time, they are traded most extensively. Swaptions are valued at mid prices (between the bid and the ask price) supplied by an independent pricing service, if available. Other swaptions not priced through an independent pricing service are valued based on quotations obtained from broker-dealers. Centrally cleared credit default swap agreements are valued at settlement prices of the clearinghouse on which the contracts were traded or prices obtained from broker-dealers. Bilateral credit default swaps are valued based on mid prices (between the bid price and the ask price) supplied by an independent pricing service.
Fund securities and other investments for which market quotations are not readily available are valued at fair value as determined in good faith by the adviser pursuant to procedures approved by the Board of Trustees. The Fund may also value securities and other investments at fair value in other circumstances such as when extraordinary events occur after the close of a foreign market but prior to the close of the New York Stock Exchange (“NYSE”). This may include situations relating to a single issuer (such as a declaration of bankruptcy or a delisting of the issuer’s security from the primary market on which it has traded) as well as events affecting the securities markets in general (such as market disruptions or closings and significant fluctuations in U.S. and/or foreign markets). When fair valuing its securities or other investments, the Fund may, among other things, use modeling tools or other processes that may take into account factors such as securities or other market activity and/or significant events that occur after the close of the foreign market and before the time the Fund’s net asset value (“NAV”) is calculated. Fair value pricing may require subjective determinations about the value of a security, and fair values used to determine a Fund’s NAV may differ from quoted or published prices, or from prices that are used by others, for the same securities. In addition, the use of fair value pricing may not always result in adjustments to the prices of securities held by the Fund.
Illiquid securities for which market quotations are readily available and have been evaluated by the adviser are considered and classified as fair valued securities.
As of September 30, 2016, securities held by the funds were fair valued as follows:
| | | | | | | | | | | | | | | | |
Fund | | Securities
classified as fair
valued | | | Percentage of
Net Assets | | | Securities fair
valued by the
Fund’s adviser | | | Percentage of
Net Assets | |
Fixed Income Fund | | $ | 20,402,403 | | | | 1.7% | | | $ | 3,590,940 | | | | 0.3% | |
Global Bond Fund | | | 3,151,065 | | | | 0.3% | | | | — | | | | — | |
Institutional High Income Fund | | | 10,342,136 | | | | 1.4% | | | | 2,654,900 | | | | 0.4% | |
Investment Grade Fixed Income Fund | | | 14,417,271 | | | | 3.1% | | | | 475,599 | | | | 0.1% | |
b. Investment Transactions and Related Investment Income. Investment transactions are accounted for on a trade date plus one day basis for daily NAV calculation. However, for financial reporting purposes, investment transactions are reported on trade date. Dividend income is recorded on ex-dividend date, or in the case of certain foreign securities, as soon as a Fund is notified, and interest income is recorded on an accrual basis. Interest income is increased by the accretion of discount and decreased by the amortization of premium, if applicable. Periodic principal adjustments for inflation-protected securities are recorded to interest income. Negative principal adjustments (in the event of deflation) are recorded as reductions of interest income to the extent of interest income earned, not to exceed the amount of positive principal adjustments on a cumulative basis. Distributions received from investments in securities that represent a return of capital or capital gain are recorded as a reduction of cost of investments or as a realized gain, respectively. The calendar year-end amounts of ordinary income, capital gains, and return of capital included in distributions received from the Funds’ investments in real estate investment trusts (“REITs”) are reported to the Funds after the end of the fiscal year; accordingly, the Funds estimate these amounts for accounting purposes until the characterization of REIT distributions is reported to the Funds after the end of the fiscal year. Estimates are based on the most recent REIT distribution information available. In determining net gain or loss on securities sold, the cost of securities has been determined on an identified cost basis. Investment income, non-class-specific expenses and realized and unrealized gains and losses are allocated on a pro rata basis to each class based on the relative net assets of each class to the total net assets of the Fund.
c. Foreign Currency Translation. The books and records of the Funds are maintained in U.S. dollars. The values of securities, currencies and other assets and liabilities denominated in currencies other than U.S. dollars are translated into U.S. dollars based upon foreign exchange rates prevailing at the end of the period. Purchases and sales of investment securities, income and expenses are translated into U.S. dollars on the respective dates of such transactions.
Net realized foreign exchange gains or losses arise from sales of foreign currency, changes in exchange rates between the trade and settlement dates on securities transactions and the difference between the amounts of dividends, interest and foreign withholding taxes recorded on the Fund’s books and the U.S. dollar equivalent of the amounts actually received or paid. Net unrealized foreign exchange gains or losses arise from changes in the value of assets and liabilities, other than investment securities, as of the end of the fiscal period, resulting from changes in exchange rates. Net realized foreign exchange gains or losses and the net change in unrealized foreign exchange gains or losses are disclosed in the Statements of Operations. For federal income tax purposes, net realized foreign exchange gains or losses are characterized as ordinary income and may, if the funds have net losses, reduce or eliminate the amount of income available to be distributed by the funds.
69 |
Notes to Financial Statements – continued
September 30, 2016
The values of investment securities are presented at the foreign exchange rates prevailing at the end of the period for financial reporting purposes. Net realized and unrealized gains or losses on investments reported in the Statements of Operations reflect gains or losses resulting from changes in exchange rates and fluctuations which arise due to changes in market prices of investment securities. For federal income tax purposes, a portion of the net realized gain or loss on investments arising from changes in exchange rates, which is reflected in the Statements of Operations, may be characterized as ordinary income and may, if the Funds have net losses, reduce or eliminate the amount of income available to be distributed by the Funds.
For the year ended September 30, 2016, the amount of income available to be distributed has been reduced by the following amounts as a result of losses arising from changes in exchange rates:
| | | | |
Fixed Income Fund | | $ | 18,023,413 | |
Global Bond Fund | | $ | 96,088,776 | |
Inflation Protected Securities Fund | | $ | — | |
Institutional High Income Fund | | $ | 2,192,867 | |
Investment Grade Fixed Income Fund | | $ | 11,035,082 | |
The Funds may use foreign currency exchange contracts to facilitate transactions in foreign-denominated investments. Losses may arise from changes in the value of the foreign currency or if the counterparties do not perform under the contracts’ terms.
d. Forward Foreign Currency Contracts. Certain Funds may enter into forward foreign currency contracts, including forward foreign cross currency contracts, to acquire exposure to foreign currencies or to hedge the Funds’ investments against currency fluctuation. A contract can also be used to offset a previous contract. These contracts involve market risk in excess of the unrealized gain or loss reflected in the Funds’ Statements of Assets and Liabilities. The U.S. dollar value of the currencies a Fund has committed to buy or sell represents the aggregate exposure to each currency a Fund has acquired or hedged through currency contracts outstanding at period end. Gains or losses are recorded for financial statement purposes as unrealized until settlement date. Contracts are traded over-the-counter directly with a counterparty. Risks may arise upon entering into these contracts from the potential inability of counterparties to meet the terms of their contracts and from unanticipated movements in the value of a foreign currency relative to the U.S. dollar. Certain contracts may require the movement of cash and/or securities as collateral for the Funds’ or counterparty’s net obligations under the contracts.
e. Futures Contracts. The Funds may enter into futures contracts. Futures contracts are agreements between two parties to buy and sell a particular instrument or index for a specified price on a specified future date.
When a Fund enters into a futures contract, it is required to deposit with (or for the benefit of) its broker an amount of cash or short-term high-quality securities as “initial margin.” As the value of the contract changes, the value of the futures contract position increases or declines. Subsequent payments, known as “variation margin,” are made or received by a Fund, depending on the price fluctuations in the fair value of the contract and the value of cash or securities on deposit with the broker. The aggregate principal amounts of the contracts are not recorded in the financial statements. Fluctuations in the value of the contracts are recorded in the Statements of Assets and Liabilities as an asset (liability) and in the Statements of Operations as unrealized appreciation (depreciation) until the contracts are closed, when they are recorded as realized gains (losses). Realized gain or loss on a futures position is equal to the difference between the value of the contract at the time it was opened and the value at the time it was closed, minus brokerage commissions. When a Fund enters into a futures contract certain risks may arise, such as illiquidity in the futures market, which may limit a Fund’s ability to close out a futures contract prior to settlement date, and unanticipated movements in the value of securities or interest rates.
Futures contracts are exchange-traded. Exchange-traded futures contracts are standardized and are settled through a clearing house with fulfillment supported by the credit of the exchange. Therefore, counterparty credit risks to the Funds are reduced; however, in the event that a counterparty enters into bankruptcy, a Fund’s claim against initial/variation margin on deposit with the counterparty may be subject to terms of a final settlement in bankruptcy court.
f. Swaptions. Certain Funds may enter into interest rate swaptions. An interest rate swaption gives the holder the right, but not the obligation, to enter into or cancel an interest rate swap agreement at a future date. Interest rate swaptions may be either purchased or written. The buyer of an interest rate swaption may purchase either the right to receive a fixed rate in the underlying swap (known as a “receiver swaption”) or to pay a fixed rate (known as a “payer swaption”), based on the notional amount of the swap agreement, in exchange for a floating rate. The notional amounts of swaptions are not recorded in the financial statements.
When a Fund purchases an interest rate swaption, it pays a premium and the swaption is subsequently marked-to-market to reflect current value. Premiums paid for purchasing interest rate swaptions which expire are treated as realized losses. Premiums paid for purchasing interest rate swaptions which are exercised are added to the cost or deducted from the proceeds on the underlying swap to determine the realized gain or loss. If a Fund enters into a closing sale transaction, the difference between the premium paid and the proceeds of the closing sale transaction is treated as a realized gain or loss. The risk associated with purchasing interest rate swaptions is limited to the premium paid.
| 70
Notes to Financial Statements – continued
September 30, 2016
When a Fund writes an interest rate swaption, an amount equal to the premium received is recorded as a liability and is subsequently adjusted to the current value. Premiums received for written interest rate swaptions which expire are treated as realized gains. Premiums received for written interest rate swaptions which are exercised are deducted from the cost or added to the proceeds on the underlying swap to determine the realized gain or loss. If a Fund enters into a closing purchase transaction, the difference between the premium received and any amount paid on effecting a closing purchase transaction, including commission, is treated as a realized gain or, if the premium received is less than the amount paid, as a realized loss. A Fund, as writer of a written interest rate swaption, bears the risk of an unfavorable change in the market value of the swap underlying the written interest rate swaption.
Over-the-counter interest rate swaptions are subject to the risk that the counterparty is unable or unwilling to meet its obligations under the swaption.
g. Swap Agreements. The Funds may enter into credit default and interest rate swaps. A credit default swap is an agreement between two parties (the “protection buyer” and “protection seller”) to exchange the credit risk of an issuer (“reference obligation”) for a specified time period. The reference obligation may be one or more debt securities or an index of such securities. The Funds may be either the protection buyer or the protection seller. As a protection buyer, the Funds have the ability to hedge the downside risk of an issuer or group of issuers. As a protection seller, the Funds have the ability to gain exposure to an issuer or group of issuers whose bonds are unavailable or in short supply in the cash bond market, as well as realize additional income in the form of fees paid by the protection buyer. The protection buyer is obligated to pay the protection seller a stream of payments (“fees”) over the term of the contract, provided that no credit event, such as a default or a downgrade in credit rating, occurs on the reference obligation. The Funds may also pay or receive upfront premiums. If a credit event occurs, the protection seller must pay the protection buyer the difference between the agreed upon notional value and market value of the reference obligation. Market value in this case is determined by a facilitated auction whereby a minimum number of allowable broker bids, together with a specified valuation method, are used to calculate the value. The maximum potential amount of undiscounted future payments that a Fund as the protection seller could be required to make under a credit default swap agreement would be an amount equal to the notional amount of the agreement.
An interest rate swap is an agreement with another party to receive or pay interest (e.g., an exchange of fixed rate payments for floating rate payments) to protect themselves from interest rate fluctuations. This type of swap is an agreement that obligates two parties to exchange a series of cash flows at specified intervals based upon or calculated by reference to a specified interest rate(s) for a specified notional amount. The payment flows are usually netted against each other, with the difference being paid by one party to the other.
The notional amounts of swap agreements are not recorded in the financial statements. Swap agreements are valued daily and fluctuations in the value are recorded in the Statements of Operations as change in unrealized appreciation (depreciation) on swap agreements. Fees are accrued in accordance with the terms of the agreement and are recorded in the Statements of Assets and Liabilities as fees receivable or payable. When received or paid, fees are recorded in the Statements of Operations as realized gain or loss. Upfront premiums paid or received by the Funds are recorded on the Statements of Assets and Liabilities as an asset or liability, respectively, and are amortized or accreted over the term of the agreement and recorded as realized gain or loss. Payments made or received by the Funds as a result of a credit event or termination of the agreement are recorded as realized gain or loss.
Swap agreements are privately negotiated in the over-the-counter market and may be entered into as a bilateral contract or centrally cleared (“centrally cleared swaps”). Bilateral swap agreements are traded between counterparties and, as such, are subject to the risk that a party to the agreement will not be able to meet its obligations. In a centrally cleared swap, immediately following execution of the swap agreement, the swap agreement is novated to a central counterparty (the “CCP”) and the Fund faces the CCP through a broker. Upon entering into a centrally cleared swap, the Fund is required to deposit initial margin with the broker in the form of cash or securities in an amount that varies depending on the size and risk profile of the particular swap. Subsequent payments, known as “variation margin,” are made or received by the Fund based on the daily change in the value of the centrally cleared swap agreement. For centrally cleared swaps, the Fund’s counterparty credit risk is reduced as the CCP stands between the Fund and the counterparty. The Funds cover their net obligations under outstanding swap agreements by segregating or earmarking cash or securities.
For the year ended September 30, 2016, no swap agreements were held by the Funds.
h. When-Issued and Delayed Delivery Transactions. The Funds may enter into when-issued or delayed delivery transactions. When-issued refers to transactions made conditionally because a security, although authorized, has not been issued. Delayed delivery refers to transactions for which delivery or payment will occur at a later date, beyond the normal settlement period. The price of when-issued and delayed delivery securities and the date when the securities will be delivered and paid for are fixed at the time the transaction is negotiated. The security and the obligation to pay for it are recorded by the Funds at the time the commitment is entered into. The value of the security may vary with market fluctuations during the time before the Funds take delivery of the security. No interest accrues to the Funds until the transaction settles.
Delayed delivery transactions include those designated as To Be Announced (“TBAs”) in the Portfolios of Investments. For TBAs, the actual security that will be delivered to fulfill the transaction is not designated at the time of the trade. The security is “to be announced” 48 hours prior to the established trade settlement date. Certain transactions require the Funds or counterparty to post cash and/or securities as collateral
71 |
Notes to Financial Statements – continued
September 30, 2016
for the net mark-to-market exposure to the other party. The Funds cover their net obligations under outstanding delayed delivery commitments by segregating or earmarking cash or securities at the custodian.
Purchases of when-issued or delayed delivery securities may have a similar effect on the Funds’ NAV as if the Funds’ had created a degree of leverage in the portfolio. Risks may arise upon entering into such transactions from the potential inability of counterparties to meet their obligations under the transactions. Additionally, losses may arise due to changes in the value of the underlying securities.
i. Federal and Foreign Income Taxes. The Trust treats each Fund as a separate entity for federal income tax purposes. Each Fund intends to meet the requirements of the Internal Revenue Code of 1986, as amended, applicable to regulated investment companies, and to distribute to its shareholders substantially all of its net investment income and any net realized capital gains at least annually. Management has performed an analysis of each Fund’s tax positions for the open tax years as of September 30, 2016 and has concluded that no provisions for income tax are required. The Funds’ federal tax returns for the prior three fiscal years remain subject to examination by the Internal Revenue Service. Management is not aware of any events that are reasonably possible to occur in the next twelve months that would result in the amounts of any unrecognized tax benefits significantly increasing or decreasing for the Funds. However, management’s conclusions regarding tax positions taken may be subject to review and adjustment at a later date based on factors including, but not limited to, new tax laws and accounting regulations and interpretations thereof.
A Fund may be subject to foreign withholding taxes on investment income and taxes on capital gains on investments that are accrued and paid based upon the Fund’s understanding of the tax rules and regulations that exist in the countries in which the Fund invests. Foreign withholding taxes on dividend and interest income are reflected on the Statements of Operations as a reduction of investment income, net of amounts eligible to be reclaimed. Dividends and interest receivable on the Statements of Assets and Liabilities are net of foreign withholding taxes. Foreign withholding taxes where reclaims have been or will be filed are reflected on the Statements of Assets and Liabilities as tax reclaims receivable. Capital gains taxes paid are included in net realized gain (loss) on investments in the Statements of Operations. Accrued but unpaid capital gains taxes are reflected as foreign taxes payable on the Statements of Assets and Liabilities, if applicable, and reduce unrealized gains on investments. In the event that realized gains on investments are subsequently offset by realized losses, taxes paid on realized gains may be returned to a Fund. Such amounts, if applicable, are reflected as foreign tax rebates receivable on the Statements of Assets and Liabilities and are recorded as a realized gain when received.
j. Dividends and Distributions to Shareholders. Dividends and distributions are recorded on ex-dividend date. The timing and characterization of certain income and capital gain distributions are determined in accordance with federal tax regulations, which may differ from accounting principles generally accepted in the United States of America. Permanent differences are primarily due to differing treatments for book and tax purposes of items such as distribution redesignations, foreign currency gains and losses, convertible bonds, paydown gains and losses, premium amortization, capital gain and return of capital distributions received, corporate actions, trust preferred securities, net operating losses, defaulted and/or non-income producing securities, return of capital distributions, treasury inflation-protected bonds and contingent payment debt instruments. Permanent book and tax basis differences relating to shareholder distributions will result in reclassifications to capital accounts reported on the Statements of Assets and Liabilities. Temporary differences between book and tax distributable earnings are primarily due to deferred Trustees’ fees, straddle loss deferrals, wash sales, convertible bonds, premium amortization, forward foreign currency and futures contracts mark-to-market, trust preferred securities, return of capital distributions received, contingent payment debt instruments, corporate actions, treasury inflation-protected bonds and defaulted and/or non-income producing securities. Amounts of income and capital gain available to be distributed on a tax basis are determined annually, and at other times during the Funds’ fiscal year as may be necessary to avoid knowingly declaring and paying a return of capital distribution. Distributions from net investment income and short-term capital gains are considered to be distributed from ordinary income for tax purposes.
The tax characterization of distributions is determined on an annual basis. The tax character of distributions paid to shareholders during the years ended September 30, 2016 and 2015 was as follows:
| | | | | | | | | | | | | | | | | | | | | | | | | | | | |
| | | 2016 Distributions Paid From: | | | 2015 Distributions Paid From: | |
Fund | | Ordinary
Income | | | Long-Term
Capital Gains | | | Return of
Capital | | | Total | | | Ordinary
Income | | | Long-Term
Capital Gains | | | Total | |
Fixed Income Fund | | $ | 57,108,952 | | | $ | 19,381,368 | | | $ | — | | | $ | 76,490,320 | | | $ | 68,550,473 | | | $ | 47,206,392 | | | $ | 115,756,865 | |
Global Bond Fund | | | — | | | | — | | | | — | | | | — | | | | 29,469,272 | | | | 10,620,770 | | | | 40,090,042 | |
Inflation Protected Securities Fund | | | 363,875 | | | | — | | | | 22,103 | | | | 385,978 | | | | 244,073 | | | | — | | | | 244,073 | |
Institutional High Income Fund | | | 39,304,593 | | | | 19,690,372 | | | | — | | | | 58,994,965 | | | | 40,546,892 | | | | 25,608,119 | | | | 66,155,011 | |
Investment Grade Fixed Income Fund | | | 9,885,081 | | | | 5,276,601 | | | | — | | | | 15,161,682 | | | | 22,367,076 | | | | 5,501,170 | | | | 27,868,246 | |
Differences between these amounts and those reported in the Statements of Changes in Net Assets are primarily attributable to different book and tax treatment for short-term capital gains.
| 72
Notes to Financial Statements – continued
September 30, 2016
As of September 30, 2016, the components of distributable earnings on a tax basis were as follows:
| | | | | | | | | | | | | | | | | | | | |
| | | Fixed Income
Fund | | | Global
Bond Fund | | | Inflation Protected
Securities Fund | | | Institutional High
Income Fund | | | Investment Grade
Fixed Income Fund | |
Undistributed ordinary income | | $ | 26,807,212 | | | $ | — | | | $ | — | | | $ | 29,545,848 | | | $ | 949,223 | |
Undistributed long-term capital gains | | | — | | | | 1,500,912 | | | | — | | | | — | | | | 6,083,088 | |
| | | | | | | | | | | | | | | | | | | | |
Total undistributed earnings | | | 26,807,212 | | | | 1,500,912 | | | | — | | | | 29,545,848 | | | | 7,032,311 | |
| | | | | | | | | | | | | | | | | | | | |
Capital loss carryforward: | | | | | | | | | | | | | | | | | | | | |
Short-term: | | | | | | | | | | | | | | | | | | | | |
No expiration date | | | — | | | | — | | | | (760,777 | ) | | | — | | | | — | |
Long-term: | | | | | | | | | | | | | | | | | | | | |
No expiration date | | | — | | | | — | | | | (1,463,356 | ) | | | — | | | | — | |
| | | | | | | | | | | | | | | | | | | | |
Total capital loss carryforward | | | — | | | | — | | | | (2,224,133 | ) | | | — | | | | — | |
| | | | | | | | | | | | | | | | | | | | |
Late-year ordinary and post-October capital loss deferrals | | | (558,312 | )* | | | — | | | | — | | | | (710,982 | )* | | | — | |
| | | | | | | | | | | | | | | | | | | | |
Unrealized appreciation (depreciation) | | | 12,922,744 | | | | (5,670,353 | ) | | | 755,777 | | | | 8,073,232 | | | | 11,852,746 | |
| | | | | | | | | | | | | | | | | | | | |
Total accumulated earnings (losses) | | $ | 39,171,644 | | | $ | (4,169,441 | ) | | $ | (1,468,356 | ) | | $ | 36,908,098 | | | $ | 18,885,057 | |
| | | | | | | | | | | | | | | | | | | | |
* Under current tax law, capital losses, foreign currency losses, and losses on passive foreign investment companies and contingent payment debt instruments after October 31 or December 31, as applicable, may be deferred and treated as occurring on the first day of the following taxable year.
As of September 30, 2016, unrealized appreciation (depreciation) on a tax basis was as follows:
| | | | | | | | | | | | | | | | | | | | |
| | | Fixed Income
Fund | | | Global
Bond Fund | | | Inflation Protected
Securities Fund | | | Institutional High
Income Fund | | | Investment Grade
Fixed Income Fund | |
Unrealized appreciation (depreciation) | | | | | | | | | | | | | | | | | | | | |
Investments | | $ | 49,973,516 | | | $ | 24,088,283 | | | $ | 755,777 | | | $ | 21,875,872 | | | $ | 32,314,992 | |
Foreign currency translations | | | (37,050,772 | ) | | | (29,758,636 | ) | | | — | | | | (13,802,640 | ) | | | (20,462,246 | ) |
| | | | | | | | | | | | | | | | | | | | |
Total unrealized appreciation (depreciation) | | $ | 12,922,744 | | | $ | (5,670,353 | ) | | $ | 755,777 | | | $ | 8,073,232 | | | $ | 11,852,746 | |
| | | | | | | | | | | | | | | | | | | | |
k. Loan Participations. Each Fund may invest in loans to corporate, governmental or other borrowers. The Funds’ investments in loans may be in the form of participations in loans or assignments of all or a portion of loans. A loan is often administered by a bank or other financial institution that acts as agent for all holders. The agent administers the terms of the loan, as specified in the loan agreement. When investing in a loan participation, (i) a Fund has the right to receive payments of principal, interest and any fees to which it is entitled only from the party from whom the Fund has purchased the participation and only upon receipt by that party of payments from the borrower and (ii) a Fund generally has no right to enforce compliance by the borrower with the terms of the loan agreement or to vote on matters arising under the loan agreement. Thus, a Fund may be subject to credit risk both of the party from whom it purchased the loan participation and the borrower and the Fund may have minimal control over the terms of any loan modification. When a Fund purchases assignments from lenders, it acquires direct rights against the borrower on the loan. Loan agreements and participations outstanding at the end of the period, if any, are listed in each applicable Fund’s Schedule of Investments.
l. Repurchase Agreements. Each Fund may enter into repurchase agreements, under the terms of a Master Repurchase Agreement, under which each Fund acquires securities as collateral and agrees to resell the securities at an agreed upon time and at an agreed upon price. It is each Fund’s policy that the market value of the collateral for repurchase agreements be at least equal to 102% of the repurchase price, including interest. Certain repurchase agreements are tri-party arrangements whereby the collateral is held in a segregated account for the benefit of the Fund and on behalf of the counterparty. Repurchase agreements could involve certain risks in the event of default or insolvency of the counterparty, including possible delays or restrictions upon a Fund’s ability to dispose of the underlying securities. As of September 30, 2016, each Fund, as applicable, had investments in repurchase agreements for which the value of the related collateral exceeded the value of the repurchase agreement. The gross value of repurchase agreements is included in the Statements of Assets and Liabilities for financial reporting purposes.
m. Due to/from Brokers. Transactions and positions in certain forward foreign currency contracts and delayed delivery commitments are maintained and cleared by registered U.S. broker/dealers pursuant to customer agreements between a Fund and the various broker/dealers. The due to brokers balance in the Statements of Assets and Liabilities for Global Bond Fund represents cash received as collateral for forward foreign currency contracts or delayed delivery securities. The due from brokers balance in the Statements of Assets and Liabilities for Global Bond Fund represents cash pledged as collateral for forward foreign currency contracts and as initial margin for futures contracts. The due
73 |
Notes to Financial Statements – continued
September 30, 2016
from brokers balance in the Statements of Assets and Liabilities for Inflation Protected Securities Fund represents cash pledged as initial margin for futures contracts. In certain circumstances a Fund’s use of cash and/or securities held at brokers is restricted by regulation or broker mandated limits.
n. Securities Lending. The Funds have entered into an agreement with State Street Bank and Trust Company (“State Street Bank”), as agent of the Funds, to lend securities to certain designated borrowers. The loans are collateralized with cash or securities in an amount equal to at least 105% or 102% of the market value (including accrued interest) of the loaned international or domestic securities, respectively, when the loan is initiated. Thereafter, the value of the collateral must remain at least 102% of the market value (including accrued interest) of loaned securities for U.S. equities and U.S. corporate debt; at least 105% of the market value (including accrued interest) of loaned securities for non-U.S. equities; and at least 100% of the market value (including accrued interest) of loaned securities for U.S. Government securities, sovereign debt issued by non-U.S. Governments and non-U.S. corporate debt. In the event that the market value of the collateral falls below the required percentages described above, the borrower will deliver additional collateral on the next business day. As with other extensions of credit, the Funds may bear the risk of loss with respect to the investment of the collateral. The Funds invest cash collateral in short-term investments, a portion of the income from which is remitted to the borrowers and the remainder allocated between the Funds and State Street Bank as lending agent.
For the year ended September 30, 2016, none of the Funds had loaned securities under this agreement.
o. Indemnifications. Under the Trust’s organizational documents, its officers and Trustees are indemnified against certain liabilities arising out of the performance of their duties to the Funds. Additionally, in the normal course of business, the Funds enter into contracts with service providers that contain general indemnification clauses. The Funds’ maximum exposure under these arrangements is unknown as this would involve future claims that may be made against the Funds that have not yet occurred. However, based on experience, the Funds expect the risk of loss to be remote.
3. Fair Value Measurements. In accordance with accounting standards related to fair value measurements and disclosures, the Funds have categorized the inputs utilized in determining the value of each Fund’s assets or liabilities. These inputs are summarized in the three broad levels listed below:
| | • | | Level 1—quoted prices in active markets for identical assets or liabilities; |
| | • | | Level 2—prices determined using other significant inputs that are observable either directly, or indirectly through corroboration with observable market data (which could include quoted prices for similar assets or liabilities, interest rates, credit risk, etc.); and |
| | • | | Level 3—prices determined using significant unobservable inputs when quoted prices or observable inputs are unavailable such as when there is little or no market activity for an asset or liability (unobservable inputs reflect each Fund’s own assumptions in determining the fair value of assets or liabilities and would be based on the best information available). |
The inputs or methodology used for valuing securities are not necessarily an indication of the risk associated with investing in those securities.
The Funds’ pricing policies and procedures are recommended by the adviser and approved by the Board of Trustees. Debt securities are valued based on evaluated bids furnished to the Funds by an independent pricing service. Broker-dealer bid prices may be used if an independent pricing service either is unable to price a security or does not provide a reliable price for a security. Broker-dealer bid prices for which the Funds do not have knowledge of the inputs used by the broker-dealer are categorized in Level 3. All security prices, including those obtained from an independent pricing service and broker-dealer bid prices, are reviewed on a daily basis by the adviser, subject to oversight by Fund management and the Board of Trustees. If the adviser, in good faith, believes that the price provided by an independent pricing service is unreliable, broker-dealer bid prices may be used until the price provided by the independent pricing service is considered to be reliable. Reliability of all security prices, including those obtained from an independent pricing service and broker-dealer bid prices, is tested in a variety of ways, including comparison to recent transaction prices and daily fluctuations, amongst other validation procedures in place. Securities for which market quotations are not readily available are valued at fair value as determined in good faith by the Funds’ adviser pursuant to procedures approved by the Board of Trustees. Fair valued securities may be categorized in Level 3.
The following is a summary of the inputs used to value the Funds’ investments as of September 30, 2016, at value:
Fixed Income Fund
Asset Valuation Inputs
| | | | | | | | | | | | | | | | |
Description | | Level 1 | | | Level 2 | | | Level 3 | | | Total | |
Bonds and Notes | | | | | | | | | | | | | | | | |
Non-Convertible Bonds | | | | | | | | | | | | | | | | |
ABS Other | | $ | — | | | $ | 837,035 | | | $ | 793,720 | (b) | | $ | 1,630,755 | |
Chemicals | | | — | | | | 26,927,927 | | | | 2,239,350 | (c) | | | 29,167,277 | |
| 74
Notes to Financial Statements – continued
September 30, 2016
Fixed Income Fund – continued
Asset Valuation Inputs – continued
| | | | | | | | | | | | | | | | |
Description | | Level 1 | | | Level 2 | | | Level 3 | | | Total | |
Finance Companies | | $ | 728,882 | | | $ | 54,662,914 | | | $ | — | | | $ | 55,391,796 | |
Metals & Mining | | | — | | | | 20,903,845 | | | | 1,041 | (c) | | | 20,904,886 | |
Transportation Services | | | — | | | | 1,650,000 | | | | 525,427 | (c) | | | 2,175,427 | |
All Other Non-Convertible Bonds(a) | | | — | | | | 824,284,398 | | | | — | | | | 824,284,398 | |
| | | | | | | | | | | | | | | | |
Total Non-Convertible Bonds | | | 728,882 | | | | 929,266,119 | | | | 3,559,538 | | | | 933,554,539 | |
| | | | | | | | | | | | | | | | |
Convertible Bonds(a) | | | — | | | | 88,685,645 | | | | — | | | | 88,685,645 | |
Municipals(a) | | | — | | | | 7,098,116 | | | | — | | | | 7,098,116 | |
| | | | | | | | | | | | | | | | |
Total Bonds and Notes | | | 728,882 | | | | 1,025,049,880 | | | | 3,559,538 | | | | 1,029,338,300 | |
| | | | | | | | | | | | | | | | |
Senior Loans | | | | | | | | | | | | | | | | |
Wirelines | | | — | | | | — | | | | 1,099,188 | (d) | | | 1,099,188 | |
All Other Senior Loans(a) | | | — | | | | 6,036,961 | | | | — | | | | 6,036,961 | |
| | | | | | | | | | | | | | | | |
Total Senior Loans | | | — | | | | 6,036,961 | | | | 1,099,188 | | | | 7,136,149 | |
| | | | | | | | | | | | | | | | |
Common Stocks | | | | | | | | | | | | | | | | |
Internet Software & Services | | | — | | | | — | | | | 13,493 | (c) | | | 13,493 | |
All Other Common Stocks(a) | | | 87,610,028 | | | | — | | | | — | | | | 87,610,028 | |
| | | | | | | | | | | | | | | | |
Total Common Stocks | | | 87,610,028 | | | | — | | | | 13,493 | | | | 87,623,521 | |
| | | | | | | | | | | | | | | | |
Preferred Stocks | | | | | | | | | | | | | | | | |
Convertible Preferred Stocks | | | | | | | | | | | | | | | | |
Midstream | | | 464,487 | | | | 860,471 | | | | — | | | | 1,324,958 | |
REITs—Mortgage | | | — | | | | 151,977 | | | | — | | | | 151,977 | |
All Other Convertible Preferred Stocks(a) | | | 13,885,473 | | | | — | | | | — | | | | 13,885,473 | |
| | | | | | | | | | | | | | | | |
Total Convertible Preferred Stocks | | | 14,349,960 | | | | 1,012,448 | | | | — | | | | 15,362,408 | |
| | | | | | | | | | | | | | | | |
Non-Convertible Preferred Stocks | | | | | | | | | | | | | | | | |
Electric | | | — | | | | 775,652 | | | | — | | | | 775,652 | |
All Other Non-Convertible Preferred Stocks(a) | | | 1,290,391 | | | | — | | | | — | | | | 1,290,391 | |
| | | | | | | | | | | | | | | | |
Total Non-Convertible Preferred Stocks | | | 1,290,391 | | | | 775,652 | | | | — | | | | 2,066,043 | |
| | | | | | | | | | | | | | | | |
Total Preferred Stocks | | | 15,640,351 | | | | 1,788,100 | | | | — | | | | 17,428,451 | |
| | | | | | | | | | | | | | | | |
Warrants | | | — | | | | — | | | | 17,909 | (c) | | | 17,909 | |
Short-Term Investments | | | — | | | | 41,480,034 | | | | — | | | | 41,480,034 | |
| | | | | | | | | | | | | | | | |
Total | | $ | 103,979,261 | | | $ | 1,074,354,975 | | | $ | 4,690,128 | | | $ | 1,183,024,364 | |
| | | | | | | | | | | | | | | | |
(a) Details of the major categories of the Fund’s investments are reflected within the Portfolio of Investments.
(b) Fair valued by the Fund’s adviser using broker-dealer bid prices for which the inputs are unobservable to the Fund.
(c) Fair valued by the Fund’s adviser.
(d) Valued using broker-dealer bid prices.
Global Bond Fund
Asset Valuation Inputs
| | | | | | | | | | | | | | | | |
Description | | Level 1 | | | Level 2 | | | Level 3 | | | Total | |
Bonds and Notes | | | | | | | | | | | | | | | | |
United States | | $ | — | | | $ | 416,607,242 | | | $ | 1,874,325 | (b) | | $ | 418,481,567 | |
All Other Bonds and Notes(a) | | | — | | | | 746,335,979 | | | | — | | | | 746,335,979 | |
| | | | | | | | | | | | | | | | |
Total Bonds and Notes | | | — | | | | 1,162,943,221 | | | | 1,874,325 | | | | 1,164,817,546 | |
| | | | | | | | | | | | | | | | |
Short-Term Investments | | | — | | | | 67,065,008 | | | | — | | | | 67,065,008 | |
| | | | | | | | | | | | | | | | |
Total Investments | | | — | | | | 1,230,008,229 | | | | 1,874,325 | | | | 1,231,882,554 | |
| | | | | | | | | | | | | | | | |
Forward Foreign Currency Contracts (unrealized appreciation) | | | — | | | | 2,204,589 | | | | — | | | | 2,204,589 | |
Futures Contracts (unrealized appreciation) | | | 994,155 | | | | — | | | | — | | | | 994,155 | |
| | | | | | | | | | | | | | | | |
Total | | $ | 994,155 | | | $ | 1,232,212,818 | | | $ | 1,874,325 | | | $ | 1,235,081,298 | |
| | | | | | | | | | | | | | | | |
75 |
Notes to Financial Statements – continued
September 30, 2016
Global Bond Fund – continued
Liability Valuation Inputs
| | | | | | | | | | | | | | | | |
Description | | Level 1 | | | Level 2 | | | Level 3 | | | Total | |
Forward Foreign Currency Contracts (unrealized depreciation) | | $ | — | | | $ | (1,538,570 | ) | | $ | — | | | $ | (1,538,570 | ) |
Futures Contracts (unrealized depreciation) | | | (645,959 | ) | | | — | | | | — | | | | (645,959 | ) |
| | | | | | | | | | | | | | | | |
Total | | $ | (645,959 | ) | | $ | (1,538,570 | ) | | $ | — | | | $ | (2,184,529 | ) |
| | | | | | | | | | | | | | | | |
(a) Details of the major categories of the Fund’s investments are reflected within the Portfolio of Investments.
(b) Valued using broker-dealer bid prices.
For the year ended September 30, 2016, there were no transfers among Levels 1, 2 and 3.
Inflation Protected Securities Fund
Asset Valuation Inputs
| | | | | | | | | | | | | | | | |
Description | | Level 1 | | | Level 2 | | | Level 3 | | | Total | |
Bonds and Notes(a) | | $ | — | | | $ | 30,732,207 | | | $ | — | | | $ | 30,732,207 | |
Short-Term Investments | | | — | | | | 410,409 | | | | — | | | | 410,409 | |
| | | | | | | | | | | | | | | | |
Total Investments | | | — | | | | 31,142,616 | | | | — | | | | 31,142,616 | |
| | | | | | | | | | | | | | | | |
Futures Contracts (unrealized appreciation) | | | 2,097 | | | | — | | | | — | | | | 2,097 | |
| | | | | | | | | | | | | | | | |
Total | | $ | 2,097 | | | $ | 31,142,616 | | | $ | — | | | $ | 31,144,713 | |
| | | | | | | | | | | | | | | | |
|
| Liability Valuation Inputs | |
Description | | Level 1 | | | Level 2 | | | Level 3 | | | Total | |
Futures Contracts (unrealized depreciation) | | $ | (7,812 | ) | | $ | — | | | $ | — | | | $ | (7,812 | ) |
| | | | | | | | | | | | | | | | |
(a) Details of the major categories of the Fund’s investments are reflected within the Portfolio of Investments.
For the year ended September 30, 2016, there were no transfers among Levels 1, 2 and 3.
Institutional High Income Fund
Asset Valuation Inputs
| | | | | | | | | | | | | | | | |
Description | | Level 1 | | | Level 2 | | | Level 3 | | | Total | |
Bonds and Notes | | | | | | | | | | | | | | | | |
Non-Convertible Bonds | | | | | | | | | | | | | | | | |
Chemicals | | $ | — | | | $ | 20,764,886 | | | $ | 1,953,030 | (c) | | $ | 22,717,916 | |
Independent Energy | | | — | | | | — | | | | — | (d) | | | — | |
Metals & Mining | | | — | | | | 47,451,873 | | | | 1,659 | (c) | | | 47,453,532 | |
Transportation Services | | | — | | | | 2,168,100 | | | | 691,478 | (c) | | | 2,859,578 | |
All Other Non-Convertible Bonds(a) | | | — | | | | 424,905,045 | | | | — | | | | 424,905,045 | |
| | | | | | | | | | | | | | | | |
Total Non-Convertible Bonds | | | — | | | | 495,289,904 | | | | 2,646,167 | | | | 497,936,071 | |
| | | | | | | | | | | | | | | | |
Convertible Bonds(a) | | | — | | | | 94,704,133 | | | | — | | | | 94,704,133 | |
Municipals(a) | | | — | | | | 3,530,547 | | | | — | | | | 3,530,547 | |
| | | | | | | | | | | | | | | | |
Total Bonds and Notes | | | — | | | | 593,524,584 | | | | 2,646,167 | | | | 596,170,751 | |
| | | | | | | | | | | | | | | | |
Loan Participations | | | | | | | | | | | | | | | | |
ABS Other | | | — | | | | — | | | | 642,558 | (b) | | | 642,558 | |
Senior Loans | | | | | | | | | | | | | | | | |
Wirelines | | | — | | | | 1,444,962 | | | | 503,243 | (b) | | | 1,948,205 | |
All Other Senior Loans(a) | | | — | | | | 5,774,142 | | | | — | | | | 5,774,142 | |
| | | | | | | | | | | | | | | | |
Total Senior Loans | | | — | | | | 7,219,104 | | | | 503,243 | | | | 7,722,347 | |
| | | | | | | | | | | | | | | | |
Common Stocks | | | | | | | | | | | | | | | | |
Internet Software & Services | | | — | | | | — | | | | 4,282 | (c) | | | 4,282 | |
All Other Common Stocks(a) | | | 77,287,478 | | | | — | | | | — | | | | 77,287,478 | |
| | | | | | | | | | | | | | | | |
Total Common Stocks | | | 77,287,478 | | | | — | | | | 4,282 | | | | 77,291,760 | |
| | | | | | | | | | | | | | | | |
| 76
Notes to Financial Statements – continued
September 30, 2016
Institutional High Income Fund – continued
Asset Valuation Inputs – continued
| | | | | | | | | | | | | | | | |
Description | | Level 1 | | | Level 2 | | | Level 3 | | | Total | |
Preferred Stocks | | | | | | | | | | | | | | | | |
Convertible Preferred Stocks | | | | | | | | | | | | | | | | |
Midstream | | $ | — | | | $ | 2,222,936 | | | $ | — | | | $ | 2,222,936 | |
REITs—Mortgage | | | — | | | | 1,833,652 | | | | — | | | | 1,833,652 | |
All Other Convertible Preferred Stocks(a) | | | 6,885,753 | | | | — | | | | — | | | | 6,885,753 | |
| | | | | | | | | | | | | | | | |
Total Convertible Preferred Stocks | | | 6,885,753 | | | | 4,056,588 | | | | — | | | | 10,942,341 | |
| | | | | | | | | | | | | | | | |
Non-Convertible Preferred Stocks(a) | | | 1,738,967 | | | | 218,175 | | | | — | | | | 1,957,142 | |
| | | | | | | | | | | | | | | | |
Total Preferred Stocks | | | 8,624,720 | | | | 4,274,763 | | | | — | | | | 12,899,483 | |
| | | | | | | | | | | | | | | | |
Warrants(d) | | | — | | | | — | | | | 4,451 | (c) | | | 4,451 | |
Short-Term Investments | | | — | | | | 9,269,393 | | | | — | | | | 9,269,393 | |
| | | | | | | | | | | | | | | | |
Total | | $ | 85,912,198 | | | $ | 614,287,844 | | | $ | 3,800,701 | | | $ | 704,000,743 | |
| | | | | | | | | | | | | | | | |
(a) Details of the major categories of the Fund’s investments are reflected within the Portfolio of Investments.
(b) Valued using broker-dealer bid prices.
(c) Fair valued by the Fund’s adviser.
(d) Includes securities fair valued at zero using Level 2 inputs.
Investment Grade Fixed Income Fund
Asset Valuation Inputs
| | | | | | | | | | | | | | | | |
Description | | Level 1 | | | Level 2 | | | Level 3 | | | Total | |
Bonds and Notes | | | | | | | | | | | | | | | | |
Non-Convertible Bonds | | | | | | | | | | | | | | | | |
ABS Home Equity | | $ | — | | | $ | — | | | $ | 43,515 | (c) | | $ | 43,515 | |
ABS Other | | | — | | | | 10,933,722 | | | | 3,413,077 | (b) | | | 14,346,799 | |
Collateralized Mortgage Obligations | | | — | | | | 586,337 | | | | 5,603 | (c) | | | 591,940 | |
Non-Agency Commercial Mortgage-Backed Securities | | | — | | | | 10,442,166 | | | | 2,738,247 | (b) | | | 13,180,413 | |
Transportation Services | | | — | | | | 1,001,268 | | | | 426,481 | (c) | | | 1,427,749 | |
All Other Non-Convertible Bonds(a) | | | — | | | | 370,231,462 | | | | — | | | | 370,231,462 | |
| | | | | | | | | | | | | | | | |
Total Non-Convertible Bonds | | | — | | | | 393,194,955 | | | | 6,626,923 | | | | 399,821,878 | |
| | | | | | | | | | | | | | | | |
Convertible Bonds(a) | | | — | | | | 18,340,776 | | | | — | | | | 18,340,776 | |
Municipals(a) | | | — | | | | 2,375,224 | | | | — | | | | 2,375,224 | |
| | | | | | | | | | | | | | | | |
Total Bonds and Notes | | | — | | | | 413,910,955 | | | | 6,626,923 | | | | 420,537,878 | |
| | | | | | | | | | | | | | | | |
Senior Loans(a) | | | — | | | | 1,889,256 | | | | — | | | | 1,889,256 | |
Common Stocks(a) | | | 21,227,120 | | | | — | | | | — | | | | 21,227,120 | |
Preferred Stocks | | | | | | | | | | | | | | | | |
Convertible Preferred Stocks | | | | | | | | | | | | | | | | |
Midstream | | | — | | | | 186,635 | | | | — | | | | 186,635 | |
All Other Convertible Preferred Stocks(a) | | | 2,688,203 | | | | — | | | | — | | | | 2,688,203 | |
| | | | | | | | | | | | | | | | |
Total Convertible Preferred Stocks | | | 2,688,203 | | | | 186,635 | | | | — | | | | 2,874,838 | |
| | | | | | | | | | | | | | | | |
Non-Convertible Preferred Stocks | | | | | | | | | | | | | | | | |
Electric | | | — | | | | 249,659 | | | | — | | | | 249,659 | |
| | | | | | | | | | | | | | | | |
Total Non-Convertible Preferred Stocks | | | — | | | | 249,659 | | | | — | | | | 249,659 | |
| | | | | | | | | | | | | | | | |
Total Preferred Stocks | | | 2,688,203 | | | | 436,294 | | | | — | | | | 3,124,497 | |
| | | | | | | | | | | | | | | | |
Short-Term Investments | | | — | | | | 15,542,796 | | | | — | | | | 15,542,796 | |
| | | | | | | | | | | | | | | | |
Total | | $ | 23,915,323 | | | $ | 431,779,301 | | | $ | 6,626,923 | | | $ | 462,321,547 | |
| | | | | | | | | | | | | | | | |
(a) Details of the major categories of the Fund’s investments are reflected within the Portfolio of Investments.
(b) Valued using broker-dealer bid prices.
(c) Fair valued by the Fund’s adviser.
77 |
Notes to Financial Statements – continued
September 30, 2016
The following is a reconciliation of Level 3 investments for which significant unobservable inputs were used to determine fair value as of September 30, 2015 and/or September 30, 2016:
Fixed Income Fund
Asset Valuation Inputs
| | | | | | | | | | | | | | | | | | | | | | | | | | | | | | | | | | | | | | | | |
Investments in Securities | | Balance as of
September 30,
2015 | | | Accrued
Discounts
(Premiums) | | | Realized
Gain
(Loss) | | | Change in
Unrealized
Appreciation
(Depreciation) | | | Purchases | | | Sales | | | Transfers
into
Level 3 | | | Transfers
out of
Level 3 | | | Balance as of
September 30,
2016 | | | Change in
Unrealized
Appreciation
(Depreciation)
from
Investments
Still Held at
September 30,
2016 | |
Bonds and Notes | | | | | | | | | | | | | | | | | | | | | | | | | | | | | | | | | | | | | | | | |
Non-Convertible Bonds | | | | | | | | | | | | | | | | | | | | | | | | | | | | | | | | | | | | | | | | |
ABS Other | | $ | 2,620,751 | | | $ | — | | | $ | — | | | $ | (1,639,845 | ) | | $ | 27,233 | | | $ | (214,419 | ) | | $ | — | | | $ | — | | | $ | 793,720 | | | $ | (1,709,504 | ) |
Chemicals | | | — | | | | 55,013 | | | | — | | | | (1,178,851 | ) | | | — | | | | — | | | | 3,363,188 | | | | — | | | | 2,239,350 | | | | (1,178,851 | ) |
Metals & Mining | | | 832,714 | | | | 14,761 | | | | — | | | | (846,434 | ) | | | — | | | | — | | | | — | | | | — | | | | 1,041 | | | | (846,434 | ) |
Non-Agency Commercial Mortgage-Backed Securities | | | 2,177,712 | | | | — | | | | — | | | | — | | | | — | | | | — | | | | — | | | | (2,177,712 | ) | | | — | | | | — | |
Oil Field Services | | | 317,750 | | | | — | | | | — | | | | — | | | | — | | | | — | | | | — | | | | (317,750 | ) | | | — | | | | — | |
Retailers | | | 1,207,488 | | | | — | | | | — | | | | — | | | | — | | | | — | | | | — | | | | (1,207,488 | ) | | | — | | | | — | |
Transportation Services | | | 532,735 | | | | — | | | | 817 | | | | (4,613 | ) | | | — | | | | (3,512 | ) | | | — | | | | — | | | | 525,427 | | | | (4,613 | ) |
Senior Loans | | | | | | | | | | | | | | | | | | | | | | | | | | | | | | | | | | | | | | | | |
Wirelines | | | — | | | | 956 | | | | — | | | | (56,694 | ) | | | — | | | | — | | | | 1,154,926 | | | | — | | | | 1,099,188 | | | | (56,695 | ) |
Common Stocks | | | | | | | | | | | | | | | | | | | | | | | | | | | | | | | | | | | | | | | | |
Internet Software & Services | | | — | | | | — | | | | — | | | | (19,569 | ) | | | 33,062 | | | | — | | | | — | | | | — | | | | 13,493 | | | | (19,569 | ) |
Warrants | | | — | | | | — | | | | — | | | | 17,909 | | | | — | | | | — | | | | — | | | | — | | | | 17,909 | | | | 17,909 | |
| | | | | | | | | | | | | | | | | | | | | | | | | | | | | | | | | | | | | | | | |
Total | | $ | 7,689,150 | | | $ | 70,730 | | | $ | 817 | | | $ | (3,728,097 | ) | | $ | 60,295 | | | $ | (217,931 | ) | | $ | 4,518,114 | | | $ | (3,702,950 | ) | | $ | 4,690,128 | | | $ | (3,797,757 | ) |
| | | | | | | | | | | | | | | | | | | | | | | | | | | | | | | | | | | | | | | | |
Debt securities valued at $3,363,188 were transferred from Level 2 to Level 3 during the period ended September 30, 2016. At September 30, 2015, these securities were valued on the basis of evaluated bids furnished to the Fund by an independent pricing service in accordance with the Fund’s valuation policies. At September 30, 2016, these securities were valued at fair value as determined in good faith by the Fund’s adviser as an independent pricing service did not provide a reliable price for the securities.
A debt security valued at $2,177,712 was transferred from Level 3 to Level 2 during the period ended September 30, 2016. At September 30, 2015, this security was valued using broker-dealer bid prices based on inputs unobservable to the Fund as an independent pricing service was unable to price the security. At September 30, 2016, this security was valued on the basis of evaluated bids furnished to the Fund by an independent pricing service in accordance with the Fund’s valuation policies.
Debt securities valued at $1,525,238 were transferred from Level 3 to Level 2 during the period ended September 30, 2016. At September 30, 2015, these securities were valued at fair value as determined in good faith by the Fund’s investment adviser as an independent pricing service did not provide a reliable price for the securities. At September 30, 2016, these securities were valued on the basis of evaluated bids furnished to the Fund by an independent pricing service in accordance with the Fund’s valuation policies.
A debt security valued at $1,154,926 was transferred from Level 2 to Level 3 during the period ended September 30, 2016. At September 30, 2015, this security was valued on the basis of evaluated bids furnished to the Fund by an independent pricing service in accordance with the Fund’s valuation policies. At September 30, 2016, this security was valued using broker-dealer bid prices based on inputs unobservable to the Fund as an independent pricing service did not provide a reliable price for the security.
All transfers are recognized as of the beginning of the reporting period.
| 78
Notes to Financial Statements – continued
September 30, 2016
Global Bond Fund
Asset Valuation Inputs
| | | | | | | | | | | | | | | | | | | | | | | | | | | | | | | | | | | | | | | | |
Investments in Securities | | Balance as of
September 30,
2015 | | | Accrued
Discounts
(Premiums) | | | Realized
Gain
(Loss) | | | Change in
Unrealized
Appreciation
(Depreciation) | | | Purchases | | | Sales | | | Transfers
into
Level 3 | | | Transfers
out of
Level 3 | | | Balance as of
September 30,
2016 | | | Change in
Unrealized
Appreciation
(Depreciation)
from
Investments
Still Held at
September 30,
2016 | |
Bonds and Notes | | | | | | | | | | | | | | | | | | | | | | | | | | | | | | | | | | | | | | | | |
Canada | | $ | 3,432,506 | | | $ | — | | | $ | (220,902 | ) | | $ | 335,360 | | | $ | — | | | $ | (3,546,964 | ) | | $ | — | | | $ | — | | | $ | — | | | $ | — | |
United States | | | 5,708,550 | | | | — | | | | 60,514 | | | | (59,668 | ) | | | 1,864,929 | | | | (5,700,000 | ) | | | — | | | | — | | | | 1,874,325 | | | | 9,396 | |
| | | | | | | | | | | | | | | | | | | | | | | | | | | | | | | | | | | | | | | | |
Total | | $ | 9,141,056 | | | $ | — | | | $ | (160,388 | ) | | $ | 275,692 | | | $ | 1,864,929 | | | $ | (9,246,964 | ) | | $ | — | | | $ | — | | | $ | 1,874,325 | | | $ | 9,396 | |
| | | | | | | | | | | | | | | | | | | | | | | | | | | | | | | | | | | | | | | | |
Institutional High Income Fund
Asset Valuation Inputs
| | | | | | | | | | | | | | | | | | | | | | | | | | | | | | | | | | | | | | | | |
Investments in Securities | | Balance as of
September 30,
2015 | | | Accrued
Discounts
(Premiums) | | | Realized
Gain
(Loss) | | | Change in
Unrealized
Appreciation
(Depreciation) | | | Purchases | | | Sales | | | Transfers
into
Level 3 | | | Transfers
out of
Level 3 | | | Balance as of
September 30,
2016 | | | Change in
Unrealized
Appreciation
(Depreciation)
from
Investments
Still Held at
September 30,
2016 | |
Bonds and Notes | | | | | | | | | | | | | | | | | | | | | | | | | | | | | | | | | | | | | | | | |
Non-Convertible Bonds | | | | | | | | | | | | | | | | | | | | | | | | | | | | | | | | | | | | | | | | |
Airlines | | $ | 1,492,764 | | | $ | — | | | $ | — | | | $ | — | | | $ | — | | | $ | — | | | $ | — | | | $ | (1,492,764 | ) | | $ | — | | | $ | — | |
Chemicals | | | — | | | | 99,261 | | | | — | | | | (1,215,199 | ) | | | — | | | | — | | | | 3,068,968 | | | | — | | | | 1,953,030 | | | | (1,215,199 | ) |
Independent Energy | | | — | | | | 70,798 | | | | — | | | | (70,888 | ) | | | — | | | | — | | | | 90 | | | | — | | | | — | (a) | | | — | |
Metals & Mining | | | 1,326,993 | | | | 26,164 | | | | — | | | | (1,351,498 | ) | | | — | | | | — | | | | — | | | | — | | | | 1,659 | | | | (1,351,498 | ) |
Non-Agency Commercial Mortgage-Backed Securities | | | 1,451,808 | | | | — | | | | — | | | | — | | | | — | | | | — | | | | — | | | | (1,451,808 | ) | | | — | | | | — | |
Oil Field Services | | | 1,916,750 | | | | — | | | | — | | | | — | | | | — | | | | — | | | | — | | | | (1,916,750 | ) | | | — | | | | — | |
Retailers | | | 1,843,065 | | | | — | | | | — | | | | — | | | | — | | | | — | | | | — | | | | (1,843,065 | ) | | | — | | | | — | |
Transportation Services | | | 786,339 | | | | — | | | | 16,905 | | | | (26,300 | ) | | | — | | | | (85,466 | ) | | | — | | | | — | | | | 691,478 | | | | (6,606 | ) |
Loan Participations | | | | | | | | | | | | | | | | | | | | | | | | | | | | | | | | | | | — | | | | | |
ABS Other | | | 701,799 | | | | — | | | | (363 | ) | | | (10,439 | ) | | | — | | | | (48,439 | ) | | | — | | | | — | | | | 642,558 | | | | (10,561 | ) |
Senior Loans | | | | | | | | | | | | | | | | | | | | | | | | | | | | | | | | | | | — | | | | | |
Wirelines | | | — | | | | 432 | | | | — | | | | (25,951 | ) | | | — | | | | — | | | | 528,762 | | | | — | | | | 503,243 | | | | (25,951 | ) |
Common Stocks | | | | | | | | | | | | | | | | | | | | | | | | | | | | | | | | | | | | | | | | |
Internet Software & Services | | | — | | | | — | | | | — | | | | (6,211 | ) | | | 10,493 | | | | — | | | | — | | | | — | | | | 4,282 | | | | (6,211 | ) |
Warrants | | | — | | | | — | | | | — | | | | 4,451 | | | | — | | | | — | | | | — | | | | — | | | | 4,451 | (a) | | | 4,451 | |
| | | | | | | | | | | | | | | | | | | | | | | | | | | | | | | | | | | | | | | | |
Total | | $ | 9,519,518 | | | $ | 196,655 | | | $ | 16,542 | | | $ | (2,702,035 | ) | | $ | 10,493 | | | $ | (133,905 | ) | | $ | 3,597,820 | | | $ | (6,704,387 | ) | | $ | 3,800,701 | | | $ | (2,611,575 | ) |
| | | | | | | | | | | | | | | | | | | | | | | | | | | | | | | | | | | | | | | | |
(a) Includes securities fair valued at zero using Level 3 inputs.
Debt securities valued at $2,944,572 were transferred from Level 3 to Level 2 during the period ended September 30, 2016. At September 30, 2015, these securities were valued using broker-dealer bid prices based on inputs unobservable to the Fund as an independent pricing service was unable to price the securities. At September 30, 2016, these securities were valued on the basis of evaluated bids furnished to the Fund by an independent pricing service in accordance with the Fund’s valuation policies.
Debt securities valued at $3,069,058 were transferred from Level 2 to Level 3 during the period ended September 30, 2016. At September 30, 2015, these securities were valued on the basis of evaluated bids furnished to the Fund by an independent pricing service in accordance with the Fund’s valuation policies. At September 30, 2016, these securities were valued at fair value as determined in good faith by the Fund’s adviser as an independent pricing service did not provide a reliable price for the securities.
Debt securities valued at $3,759,815 were transferred from Level 3 to Level 2 during the period ended September 30, 2016. At September 30, 2015, these securities were valued at fair value as determined in good faith by the Fund’s investment adviser as an independent pricing service did not provide a reliable price for the securities. At September 30, 2016, these securities were valued on the basis of evaluated bids furnished to the Fund by an independent pricing service in accordance with the Fund’s valuation policies.
79 |
Notes to Financial Statements – continued
September 30, 2016
A debt security valued at $528,762 was transferred from Level 2 to Level 3 during the period ended September 30, 2016. At September 30, 2015, this security was valued on the basis of evaluated bids furnished to the Fund by an independent pricing service in accordance with the Fund’s valuation policies. At September 30, 2016, this security was valued using broker-dealer bid prices based on inputs unobservable to the Fund as an independent pricing service did not provide a reliable price for the security.
All transfers are recognized as of the beginning of the reporting period.
Investment Grade Fixed Income Fund
Asset Valuation Inputs
| | | | | | | | | | | | | | | | | | | | | | | | | | | | | | | | | | | | | | | | |
Investments in Securities | | Balance as of
September 30,
2015 | | | Accrued
Discounts
(Premiums) | | | Realized
Gain
(Loss) | | | Change in
Unrealized
Appreciation
(Depreciation) | | | Purchases | | | Sales | | | Transfers
into
Level 3 | | | Transfers
out of
Level 3 | | | Balance as of
September 30,
2016 | | | Change in
Unrealized
Appreciation
(Depreciation)
from
Investments
Still Held at
September 30,
2016 | |
Bonds and Notes | | | | | | | | | | | | | | | | | | | | | | | | | | | | | | | | | | | | | | | | |
Non-Convertible Bonds | | | | | | | | | | | | | | | | | | | | | | | | | | | | | | | | | | | | | | | | |
ABS Home Equity | | $ | 71,159 | | | $ | — | | | $ | (7,562 | ) | | $ | 1,000 | | | $ | — | | | $ | (21,082 | ) | | $ | — | | | $ | — | | | $ | 43,515 | | | $ | (609 | ) |
ABS Other | | | 3,983,601 | | | | — | | | | 1,227 | | | | (52,151 | ) | | | — | | | | (107,264 | ) | | | — | | | | (412,336 | ) | | | 3,413,077 | | | | (47,719 | ) |
Collateralized Mortgage Obligations | | | — | | | | — | | | | (55 | ) | | | (320 | ) | | | — | | | | (1,954 | ) | | | 7,932 | | | | — | | | | 5,603 | | | | (320 | ) |
Non-Agency Commercial Mortgage-Backed Securities | | | 2,735,916 | | | | — | | | | — | | | | 2,331 | | | | — | | | | — | | | | — | | | | — | | | | 2,738,247 | | | | 2,331 | |
Transportation Services | | | 432,977 | | | | — | | | | — | | | | (6,496 | ) | | | — | | | | — | | | | — | | | | — | | | | 426,481 | | | | (6,496 | ) |
| | | | | | | | | | | | | | | | | | | | | | | | | | | | | | | | | | | | | | | | |
Total | | $ | 7,223,653 | | | $ | — | | | $ | (6,390 | ) | | $ | (55,636 | ) | | $ | — | | | $ | (130,300 | ) | | $ | 7,932 | | | $ | (412,336 | ) | | $ | 6,626,923 | | | $ | (52,813 | ) |
| | | | | | | | | | | | | | | | | | | | | | | | | | | | | | | | | | | | | | | | |
A debt security valued at $412,336 was transferred from Level 3 to Level 2 during the period ended September 30, 2016. At September 30, 2015, this security was valued using broker-dealer bid prices based on inputs unobservable to the Fund as an independent pricing service was unable to price the security. At September 30, 2016, this security was valued on the basis of evaluated bids furnished to the Fund by an independent pricing service in accordance with the Fund’s valuation policies.
A debt security valued at $7,932 was transferred from Level 2 to Level 3 during the period ended September 30, 2016. At September 30, 2015, this security was valued on the basis of evaluated bids furnished to the Fund by an independent pricing service in accordance with the Fund’s valuation policies. At September 30, 2016, this security was valued at fair value as determined in good faith by the Fund’s adviser as an independent pricing service did not provide a reliable price for the security.
All transfers are recognized as of the beginning of the reporting period.
4. Derivatives. Derivative instruments are defined as financial instruments whose value and performance are based on the value and performance of an underlying asset, reference rate or index. Derivative instruments that Global Bond Fund and Inflation Protected Securities Fund used during the period include forward foreign currency contracts, futures contracts and swaptions.
Inflation Protected Securities Fund may use interest rate swaptions to gain exposure, such as to enter into a contract to benefit from a rise or fall in interest rates. During the year ended September 30, 2016, the Fund engaged in interest rate swaptions for this purpose.
Global Bond Fund is subject to the risk that changes in foreign currency exchange rates will have an unfavorable effect on the value of Fund assets denominated in foreign currencies. The Fund may enter into forward foreign currency exchange contracts for hedging purposes to protect the value of the Funds’ holdings of foreign securities. The Fund may also use forward foreign currency contracts to gain exposure to foreign currencies, regardless of whether securities denominated in such currencies are held in the Fund. During the year ended September 30, 2016, Global Bond Fund engaged in forward foreign currency transactions for hedging purposes and to gain exposure to foreign currencies.
Global Bond Fund and Inflation Protected Securities Fund are subject to the risk that changes in interest rates will affect the value of the Funds’ investments in fixed-income securities. A Fund will be subject to increased interest rate risk to the extent that it invests in fixed-income securities with longer maturities or durations, as compared to investing in fixed-income securities with shorter maturities or durations. The Funds may use futures contracts and interest rate swaptions to hedge against changes in interest rates and to manage duration without having to buy or sell portfolio securities. During the year ended September 30, 2016, Global Bond Fund used futures contracts and Inflation Protected Securities Fund used interest rate swaptions to manage duration. Inflation Protected Securities Fund also used futures and interest rate swaptions to hedge against changes in interest rates.
| 80
Notes to Financial Statements – continued
September 30, 2016
The following is a summary of derivative instruments for Global Bond Fund as of September 30, 2016, as reflected within the Statements of Assets and Liabilities:
| | | | | | | | |
Assets | | Unrealized
appreciation on
forward foreign
currency contracts | | | Unrealized
appreciation
on futures
contracts1
| |
Over-the-counter asset derivatives | | | | | | | | |
Foreign exchange contracts | | $ | 2,204,589 | | | $ | — | |
Exchange-traded/cleared asset derivatives | | | | | | | | |
Interest rate contracts | | | — | | | | 994,155 | |
| | | | | | | | |
Total asset derivatives | | $ | 2,204,589 | | | $ | 994,155 | |
| | | | | | | | |
| | |
Liabilities | | Unrealized
depreciation on
forward foreign
currency contracts | | | Unrealized
depreciation
on futures
contracts1 | |
Over-the-counter liability derivatives | | | | | | | | |
Foreign exchange contracts | | $ | (1,538,570 | ) | | $ | — | |
Exchange-traded/cleared liability derivatives | | | | | | | | |
Interest rate contracts | | | — | | | | (645,959 | ) |
| | | | | | | | |
Total liability derivatives | | $ | (1,538,570 | ) | | $ | (645,959 | ) |
| | | | | | | | |
1 Represents cumulative unrealized appreciation (depreciation) on futures contracts. Only the current day’s variation margin on futures contracts is reported within the Statements of Assets and Liabilities as receivable or payable for variation margin, as applicable.
Transactions in derivative instruments for Global Bond Fund during the year ended September 30, 2016, as reflected within the Statements of Operations, were as follows:
| | | | | | | | |
Net Realized Gain (Loss) on: | | Futures
contracts | | | Foreign currency
transactions2 | |
Interest rate contracts | | $ | (3,819,963 | ) | | $ | — | |
Foreign exchange contracts | | | — | | | | 4,219,387 | |
| | | | | | | | |
Total | | $ | (3,819,963 | ) | | $ | 4,219,387 | |
| | | | | | | | |
| | |
Net Change in Unrealized
Appreciation (Depreciation) on: | | Futures
contracts | | | Foreign currency
translations2 | |
Interest rate contracts | | $ | 1,625,312 | | | $ | — | |
Foreign exchange contracts | | | — | | | | (3,603,759 | ) |
| | | | | | | | |
Total | | $ | 1,625,312 | | | $ | (3,603,759 | ) |
| | | | | | | | |
2 Represents realized gain and change in unrealized appreciation (depreciation), respectively, for forward foreign currency contracts during the period. Does not include other foreign currency gains or losses included in the Statements of Operations.
The following is a summary of derivative instruments for Inflation Protected Securities Fund as of September 30, 2016, as reflected within the Statements of Assets and Liabilities:
| | | | |
Assets | | Investments
at value1 | |
Exchange-traded/cleared asset derivatives | | | | |
Interest rate contracts | | $ | 2,097 | |
| |
Liabilities | | Unrealized
depreciation
on futures
contracts1 | |
Exchange-traded/cleared liability derivatives | | | | |
Interest rate contracts | | $ | (7,812 | ) |
1 Represents cumulative unrealized appreciation (depreciation) on futures contracts. Only the current day’s variation margin on futures contracts is reported within the Statements of Assets and Liabilities as receivable or payable for variation margin, as applicable.
81 |
Notes to Financial Statements – continued
September 30, 2016
Transactions in derivative instruments for Inflation Protected Securities Fund during the year ended September 30, 2016, as reflected within the Statements of Operations, were as follows:
| | | | | | | | | | | | |
Net Realized Gain (Loss) on: | | Investments2 | | | Futures
contracts | | | Swaptions
written | |
Interest rate contracts | | $ | (77,000 | ) | | $ | (15,889 | ) | | $ | 34,250 | |
| | | |
Net Change in Unrealized
Appreciation (Depreciation) on: | | Investments2 | | | Futures
contracts | | | Swaptions
written | |
Interest rate contracts | | $ | 29,951 | | | $ | (5,715 | ) | | $ | (15,958 | ) |
2 Represents realized loss and change in unrealized appreciation (depreciation), respectively, for purchased swaptions during the period.
As the Funds value their derivatives at fair value and recognize changes in fair value through the Statements of Operations, they do not qualify for hedge accounting under authoritative guidance for derivative instruments. The Funds’ investments in derivatives may represent an economic hedge; however, they are considered to be non-hedge transactions for the purpose of these disclosures.
The volume of forward foreign currency contract and futures contract activity, as a percentage of net assets for Global Bond Fund and Inflation Protected Securities Fund based on gross month-end notional amounts outstanding during the period, including long and short positions at absolute value, was as follows for the year ended September 30, 2016:
| | | | | | | | |
Global Bond Fund | | Forwards | | | Futures | |
Average Notional Amount Outstanding | | | 35.40% | | | | 22.98% | |
Highest Notional Amount Outstanding | | | 56.66% | | | | 29.66% | |
Lowest Notional Amount Outstanding | | | 24.28% | | | | 19.23% | |
Notional Amount Outstanding as of September 30, 2016 | | | 24.28% | | | | 27.03% | |
| | | | |
Inflation Protected Fund | | Futures | |
Average Notional Amount Outstanding | | | 17.67% | |
Highest Notional Amount Outstanding | | | 119.70% | |
Lowest Notional Amount Outstanding | | | 0.00% | |
Notional Amount Outstanding as of September 30, 2016 | | | 119.70% | |
Notional amounts outstanding at the end of the prior period are included in the average notional amount outstanding.
Unrealized gain and/or loss on open forwards and futures is recorded in the Statements of Assets and Liabilities. The aggregate notional values of forward and futures contracts are not recorded in the Statements of Assets and Liabilities, and therefore are not included in the Funds’ net assets.
The volume of interest rate swaption activity, as a percentage of net assets, for Inflation Protected Securities Fund, based on average premiums paid or received during the period, including long and short positions at absolute value, was as follows for the year ended September 30, 2016:
| | | | | | | | |
Inflation Protected Securities Fund | | Interest
Rate
Call Swaptions
Purchased | | | Interest
Rate
Call Swaptions
Written | |
Average Premium Paid/Received | | | 0.24% | | | | 0.11% | |
Highest Premium Paid/Received | | | 0.29% | | | | 0.13% | |
Lowest Premium Paid/Received | | | 0.00% | | | | 0.00% | |
Premium Paid/Received as of September 30, 2016 | | | 0.00% | | | | 0.00% | |
Swaptions outstanding at the end of the prior period are included in the average premium paid/received.
The following is a summary of Inflation Protected Securities Fund’s written interest rate swaption activity:
| | | | | | | | |
| | | Notional
Amount | | | Premiums | |
Outstanding at September 30, 2015 | | $ | 2,500,000 | | | $ | 34,250 | |
Swaptions written | | | — | | | | — | |
Swaptions expired | | | (2,500,000 | ) | | | (34,250 | ) |
| | | | | | | | |
Outstanding at September 30, 2016 | | $ | — | | | $ | — | |
| | | | | | | | |
Over-the-counter derivatives, including forward foreign currency contracts and interest rate swaptions, are entered into pursuant to International Swaps and Derivatives Association, Inc. (“ISDA”) agreements negotiated between the Funds and their counterparties. ISDA
| 82
Notes to Financial Statements – continued
September 30, 2016
agreements typically contain, among other things, terms for the posting of collateral and master netting provisions in the event of a default or other termination event. Collateral is posted by a Fund or the counterparty to the extent of the net mark-to-market exposure to the other party of all open contracts under the agreement, subject to minimum transfer requirements. Master netting provisions allow the Funds and the counterparty, in the event of a default or other termination event, to offset amounts owed by each related to derivative contracts, including any posted collateral, to one net amount payable by either the Funds or the counterparty. The Funds’ ISDA agreements typically contain provisions that allow a counterparty to terminate open contracts early if the NAV of a Fund declines beyond a certain threshold. For financial reporting purposes, the Funds do not offset derivative assets and liabilities, and any related collateral received or pledged, on the Statements of Assets and Liabilities.
As of September 30, 2016, gross amounts of over-the-counter derivative assets and liabilities not offset in the Statements of Assets and Liabilities and the related net amounts after taking into account master netting arrangements, by counterparty, are as follows:
Global Bond Fund
| | | | | | | | | | | | | | | | | | | | |
Counterparty | | Gross Amounts of
Assets | | | Offset
Amount | | | Net Asset
Balance | | | Collateral
(Received)/
Pledged | | | Net
Amount | |
Citibank N.A. | | $ | 29,935 | | | $ | (29,935 | ) | | $ | — | | | $ | — | | | $ | — | |
Credit Suisse International | | | 904,887 | | | | (764,374 | ) | | | 140,513 | | | | (80,000 | ) | | | 60,513 | |
Morgan Stanley & Co. | | | 73,948 | | | | (73,948 | ) | | | — | | | | — | | | | — | |
UBS AG | | | 1,195,819 | | | | — | | | | 1,195,819 | | | | (1,195,819 | ) | | | — | |
| | | | | | | | | | | | | | | | | | | | |
| | $ | 2,204,589 | | | $ | (868,257 | ) | | $ | 1,336,332 | | | $ | (1,275,819 | ) | | $ | 60,513 | |
| | | | | | | | | | | | | | | | | | | | |
| | | | | |
Counterparty | | Gross Amounts of
Liabilities | | | Offset
Amount | | | Net Liability
Balance | | | Collateral
(Received)/
Pledged | | | Net
Amount | |
Citibank N.A. | | $ | (588,761 | ) | | $ | 29,935 | | | $ | (558,826 | ) | | $ | 558,826 | | | $ | — | |
Credit Suisse International | | | (764,374 | ) | | | 764,374 | | | | — | | | | — | | | | — | |
Deutsche Bank AG | | | (64,027 | ) | | | — | | | | (64,027 | ) | | | — | | | | (64,027 | ) |
Morgan Stanley & Co. | | | (121,408 | ) | | | 73,948 | | | | (47,460 | ) | | | 47,460 | | | | — | |
| | | | | | | | | | | | | | | | | | | | |
| | $ | (1,538,570 | ) | | $ | 868,257 | | | $ | (670,313 | ) | | $ | 606,286 | | | $ | (64,027 | ) |
| | | | | | | | | | | | | | | | | | | | |
The actual collateral received or pledged, if any, may exceed the amounts shown in the table due to overcollateralization. Timing differences may exist between when contracts under the ISDA agreements are marked-to-market and when collateral moves. The ISDA agreements include tri-party control agreements under which collateral is held for the benefit of the secured party at a third party custodian, State Street Bank.
Counterparty risk is managed based on policies and procedures established by each Fund’s adviser. Such policies and procedures may include, but are not limited to, minimum counterparty credit rating requirements, monitoring of counterparty credit default swap spreads and posting of collateral. A Fund’s risk of loss from counterparty credit risk on over-the-counter derivatives is generally limited to the Fund’s aggregated unrealized gains and the amount of any collateral pledged to the counterparty, which may be offset by any collateral posted to the Fund by the counterparty. ISDA master agreements can help to manage counterparty risk by specifying collateral posting arrangements at pre-arranged exposure levels. Under these ISDA agreements, collateral is routinely transferred if the total net exposure in respect of certain transactions, net of existing collateral already in place, exceeds a specified amount (typically $250,000, depending on the counterparty). With exchange-traded derivatives, there is minimal counterparty credit risk to the Fund because the exchange’s clearinghouse, as counterparty to these instruments, stands between the buyer and the seller of the contract. Credit risk still exists in exchange-traded derivatives with respect to initial and variation margin that is held in a broker’s customer accounts. While brokers are required to segregate customer margin from their own assets, in the event that a broker becomes insolvent or goes into bankruptcy and at that time there is a shortfall in the aggregate amount of margin held by the broker for all its clients, U.S. bankruptcy laws will typically allocate that shortfall on a pro rata basis across all of the broker’s customers, potentially resulting in losses to the Fund. Based on balances reflected on each Fund’s Statement of Assets and Liabilities, the following table shows (i) the maximum amount of loss due to credit risk that, based on the gross fair value of the financial instrument, the applicable Fund would incur if parties (including OTC derivative counterparties and brokers holding margin for exchange-traded derivatives) to the relevant financial instruments failed completely to perform according to the terms of the contracts and the collateral or other security, if any, for the amount due proved to be of no value to the Fund, and (ii) the amount of loss that the applicable Fund would incur after taking into account master netting provisions pursuant to ISDA agreements, as of September 30, 2016:
| | | | | | | | |
Fund | | Maximum Amount
of Loss - Gross | | | Maximum Amount
of Loss - Net | |
Global Bond Fund | | $ | 9,376,984 | | | $ | 6,626,622 | |
Inflation Protected Securities Fund | | | 72,016 | | | | 72,016 | |
83 |
Notes to Financial Statements – continued
September 30, 2016
These amounts include cash received as collateral for Global Bond Fund of $1,480,000.
5. Purchases and Sales of Securities. For the year ended September 30, 2016, purchases and sales of securities (excluding short-term investments and option/swaption contracts and including paydowns) were as follows:
| | | | | | | | | | | | | | | | |
| | | U.S. Government/Agency Securities | | | Other Securities | |
Fund | | Purchases | | | Sales | | | Purchases | | | Sales | |
Fixed Income Fund | | $ | 72,481,445 | | | $ | 133,003,947 | | | $ | 90,881,079 | | | $ | 181,684,061 | |
Global Bond Fund | | | 1,224,664,211 | | | | 1,208,165,511 | | | | 538,131,260 | | | | 1,233,392,347 | |
Inflation Protected Securities Fund | | | 17,664,095 | | | | 30,174,657 | | | | — | | | | — | |
Institutional High Income Fund | | | 25,013,672 | | | | 19,445,699 | | | | 133,035,094 | | | | 86,557,898 | |
Investment Grade Fixed Income Fund | | | 49,937,891 | | | | 96,947,221 | | | | 59,459,010 | | | | 115,148,761 | |
6. Management Fees and Other Transactions with Affiliates.
a. Management Fees. Loomis, Sayles & Company, L.P. (“Loomis Sayles”) serves as investment adviser to each Fund. Separate management agreements for each Fund in effect for the year ended September 30, 2016, provided for fees at the following annual percentage rates of each Fund’s average daily net assets:
| | | | | | | | | | | | | | | | | | | | |
| | | Percentage of Average Daily Net Assets | |
Fund | | First
$1 Billion | | | Next
$1 Billion | | | Next
$3 Billion | | | Next
$5 Billion | | | Over
$10 Billion | |
Fixed Income Fund | | | 0.50% | | | | 0.50% | | | | 0.50% | | | | 0.50% | | | | 0.50% | |
Global Bond Fund | | | 0.60% | | | | 0.50% | | | | 0.48% | | | | 0.45% | | | | 0.40% | |
Inflation Protected Securities Fund | | | 0.25% | | | | 0.25% | | | | 0.25% | | | | 0.25% | | | | 0.25% | |
Institutional High Income Fund | | | 0.60% | | | | 0.60% | | | | 0.60% | | | | 0.60% | | | | 0.60% | |
Investment Grade Fixed Income Fund | | | 0.40% | | | | 0.40% | | | | 0.40% | | | | 0.40% | | | | 0.40% | |
Loomis Sayles has given binding undertakings to the Funds to waive management fees and/or reimburse certain expenses to limit the Funds’ operating expenses, exclusive of acquired fund fees and expenses, brokerage expenses, interest expense, taxes, organizational and extraordinary expenses such as litigation and indemnification expenses. These undertakings are in effect until January 31, 2017, may be terminated before then only with the consent of the Funds’ Board of Trustees, and are reevaluated on an annual basis. Management fees payable, as reflected on the Statements of Assets and Liabilities, is net of waivers and/or expense reimbursements, if any, pursuant to these undertakings. Waivers/reimbursements that exceed management fees payable are reflected on the Statements of Assets and Liabilities as receivable from investment adviser.
For the year ended September 30, 2016, the expense limits as a percentage of average daily net assets under the expense limitation agreements were as follows:
| | | | | | | | | | | | |
| | | Expense Limit as a Percentage of
Average Daily Net Assets | |
Fund | | Institutional
Class | | | Retail
Class | | | Class N | |
Fixed Income Fund | | | 0.65% | | | | — | | | | — | |
Global Bond Fund | | | 0.75% | | | | 1.00% | | | | 0.70% | |
Inflation Protected Securities Fund | | | 0.40% | | | | 0.65% | | | | — | |
Institutional High Income Fund | | | 0.75% | | | | — | | | | — | |
Investment Grade Fixed Income Fund | | | 0.55% | | | | — | | | | — | |
Loomis Sayles shall be permitted to recover expenses they have borne under the expense limitation agreements (whether through waiver of its management fees or otherwise) on a class by class basis in later periods to the extent the annual operating expenses of a class fall below a class’ expense limits, provided, however, that a class is not obligated to pay such waived/reimbursed fees or expenses more than one year after the end of the fiscal year in which the fees or expenses were waived/reimbursed.
| 84
Notes to Financial Statements – continued
September 30, 2016
For the year ended September 30, 2016, the management fees and waivers of management fees for each Fund were as follows:
| | | | | | | | | | | | | | | | | | | | |
Fund | | Gross
Management
Fees | | | Waivers of
Management
Fees1 | | | Net
Management
Fees | | | Percentage of
Average
Daily Net Assets | |
| | | | | Gross | | | Net | |
Fixed Income Fund | | $ | 6,044,882 | | | $ | — | | | $ | 6,044,882 | | | | 0.50% | | | | 0.50% | |
Global Bond Fund | | | 8,556,500 | | | | — | | | | 8,556,500 | | | | 0.57% | | | | 0.57% | |
Inflation Protected Securities Fund | | | 73,113 | | | | 73,113 | | | | — | | | | 0.25% | | | | — | |
Institutional High Income Fund | | | 3,896,072 | | | | — | | | | 3,896,072 | | | | 0.60% | | | | 0.60% | |
Investment Grade Fixed Income Fund | | | 1,995,995 | | | | — | | | | 1,995,995 | | | | 0.40% | | | | 0.40% | |
1 Management fee waivers are subject to possible recovery until September 30, 2017.
For the year ended September 30, 2016, class-specific expenses have been reimbursed as follows:
| | | | | | | | | | | | | | | | |
| | | Reimbursement2 | |
Fund | | Institutional
Class | | | Retail
Class | | | Class N | | | Total | |
Global Bond Fund | | $ | 787,178 | | | $ | 280,541 | | | $ | — | | | $ | 1,067,719 | |
In addition, the investment adviser reimbursed non-class-specific expenses of Inflation Protected Securities Fund in the amount of $60,279 for the year ended September 30, 20162.
2 Expense reimbursements are subject to possible recovery until September 30, 2017.
No expenses were recovered for any of the Funds during the year ended September 30, 2016 under the terms of the expense limitation agreements.
Certain officers and employees of Loomis Sayles are also officers or Trustees of the Trust. Loomis Sayles’ general partner is indirectly owned by Natixis Global Asset Management, L.P. (“Natixis US”), which is part of Natixis Global Asset Management, an international asset management group based in Paris, France.
b. Distribution Fees. NGAM Distribution, which is a wholly-owned subsidiary of Natixis US, has entered into a distribution agreement with the Trust. Pursuant to this agreement, NGAM Distribution serves as principal underwriter of the Funds of the Trust.
Pursuant to Rule 12b-1 under the 1940 Act, Global Bond Fund and Inflation Protected Securities Fund have adopted a Distribution Plan relating to each Fund’s Retail Class shares (the “Retail Class Plans”).
Under the Retail Class Plans, each Fund pays NGAM Distribution a monthly distribution fee at an annual rate not to exceed 0.25% of the average daily net assets attributable to the Fund’s Retail Class shares, as compensation for services provided by NGAM Distribution in connection with the marketing or sale of Retail Class shares or for payments made by NGAM Distribution to securities dealers or other financial intermediaries as commissions, asset-based sales charges or other compensation with respect to the sale of Retail Class shares, or for providing personal services to investors and/or the maintenance of shareholder accounts.
For the year ended September 30, 2016, the distribution fees for each Fund were as follows:
| | | | |
Fund | | Retail Class | |
Global Bond Fund | | $ | 967,737 | |
Inflation Protected Securities Fund | | | 11,452 | |
c. Administrative Fees. NGAM Advisors, L.P. (“NGAM Advisors”) provides certain administrative services for the Funds and contracts with State Street Bank to serve as sub-administrator. NGAM Advisors is a wholly-owned subsidiary of Natixis US. Pursuant to an agreement among Natixis Funds Trusts, Loomis Sayles Funds Trusts and NGAM Advisors, each Fund pays NGAM Advisors monthly its pro rata portion of fees equal to an annual rate of 0.0575% of the first $15 billion of the average daily net assets of the Natixis Funds Trusts and Loomis Sayles Funds Trusts, 0.0500% of the next $15 billion, 0.0400% of the next $30 billion, 0.0350% of the next $30 billion and 0.0325% of such assets in excess of $90 billion, subject to an annual aggregate minimum fee for the Natixis Funds Trusts and Loomis Sayles Funds Trusts of $10 million, which is reevaluated on an annual basis.
85 |
Notes to Financial Statements – continued
September 30, 2016
For the year ended September 30, 2016, the administrative fees for each Fund were as follows:
| | | | |
Fund | | Administrative
Fees | |
Fixed Income Fund | | $ | 532,869 | |
Global Bond Fund | | | 665,846 | |
Inflation Protected Securities Fund | | | 12,892 | |
Institutional High Income Fund | | | 286,319 | |
Investment Grade Fixed Income Fund | | | 219,840 | |
d. Sub-Transfer Agent Fees. NGAM Distribution has entered into agreements, which include servicing agreements, with financial intermediaries that provide recordkeeping, processing, shareholder communications and other services to customers of the intermediaries that hold positions in the Funds and has agreed to compensate the intermediaries for providing those services. Intermediaries transact with the Funds primarily through the use of omnibus accounts on behalf of their customers who hold positions in the Funds. These services would have been provided by the Funds’ transfer agent and other service providers if the shareholders’ accounts were maintained directly at the Funds’ transfer agent. Accordingly, the Funds have agreed to reimburse NGAM Distribution for all or a portion of the servicing fees paid to these intermediaries. The reimbursement amounts (sub-transfer agent fees) paid to NGAM Distribution are subject to a current per-account equivalent fee limit approved by the Funds’ Board of Trustees, which is based on fees for similar services paid to the Funds’ transfer agent and other service providers. Class N shares do not bear such expenses.
For the year ended September 30, 2016, the sub-transfer agent fees (which are reflected in transfer agent fees and expenses in the Statements of Operations) for each Fund were as follows:
| | | | |
Fund | | Sub-Transfer
Agent Fees | |
Global Bond Fund | | $ | 2,419,724 | |
Inflation Protected Securities Fund | | | 19,633 | |
Institutional High Income Fund | | | 6,249 | |
As of September 30, 2016, the Funds owe NGAM Distribution the following reimbursements for sub-transfer agent fees (which are reflected in the Statements of Assets and Liabilities as payable to distributor):
| | | | |
Fund | | Reimbursements of
Sub-Transfer Agent Fees | |
Global Bond Fund | | $ | 22,267 | |
Inflation Protected Securities Fund | | | 266 | |
Institutional High Income Fund | | | 78 | |
Sub-transfer agent fees attributable to Institutional Class and Retail Class are allocated on a pro rata basis to each class based on the relative net assets of each class to the total net assets of those classes.
e. Trustees Fees and Expenses. The Trust does not pay any compensation directly to its officers or Trustees who are directors, officers or employees of NGAM Advisors, NGAM Distribution, Natixis US or their affiliates. The Chairperson of the Board of Trustees receives a retainer fee at the annual rate of $325,000. The Chairperson does not receive any meeting attendance fees for Board of Trustees meetings or committee meetings that she attends. Each Independent Trustee (other than the Chairperson) receives, in the aggregate, a retainer fee at the annual rate of $155,000. Each Independent Trustee also receives a meeting attendance fee of $10,000 for each meeting of the Board of Trustees that he or she attends in person and $5,000 for each meeting of the Board of Trustees that he or she attends telephonically. In addition, the chairperson of the Contract Review Committee and the chairperson of the Audit Committee each receive an additional retainer fee at the annual rate of $17,500. The chairperson of the Governance Committee receives an additional retainer fee at the annual rate of $10,000. Each Contract Review Committee member is compensated $6,000 for each Committee meeting that he or she attends in person and $3,000 for each meeting that he or she attends telephonically. Each Audit Committee member is compensated $6,000 for each Committee meeting that he or she attends in person and $3,000 for each meeting that he or she attends telephonically. These fees are allocated among the funds in the Natixis Funds Trusts and Loomis Sayles Funds Trusts based on a formula that takes into account, among other factors, the relative net assets of each fund. Trustees are reimbursed for travel expenses in connection with attendance at meetings.
Prior to January 1, 2016, the Chairperson of the Board received a retainer fee at the annual rate of $300,000 and each Independent Trustee (other than the Chairperson) received, in the aggregate, a retainer fee at the annual rate of $130,000. The chairperson of the Governance Committee received an additional retainer fee at the annual rate of $5,000. All other Trustee fees remained unchanged.
A deferred compensation plan (the “Plan”) is available to the Trustees on a voluntary basis. Deferred amounts remain in the Funds until distributed in accordance with the provisions of the Plan. The value of a participating Trustee’s deferral account is based on theoretical
| 86
Notes to Financial Statements – continued
September 30, 2016
investments of deferred amounts, on the normal payment dates, in certain funds of the Natixis Funds Trusts and Loomis Sayles Funds Trusts as designated by the participating Trustees. Changes in the value of participants’ deferral accounts are allocated pro rata among the funds in the Natixis Funds Trusts and Loomis Sayles Funds Trusts, and are normally reflected as Trustees’ fees and expenses in the Statements of Operations. The portions of the accrued obligations allocated to the Funds under the Plan are reflected as Deferred Trustees’ fees in the Statements of Assets and Liabilities.
f. Affiliated Ownership. As of September 30, 2016, Loomis Sayles owned shares equating to 5.08% of Inflation Protected Securities Fund and Loomis Sayles Employees’ Profit Sharing Retirement Plan (“Retirement Plan”) held shares of the Funds representing the following percentages of the Fund’s net assets:
| | | | |
Fund | | Retirement Plan | |
Global Bond Fund | | | 0.56% | |
Inflation Protected Securities Fund | | | 13.99% | |
Institutional High Income Fund | | | 2.28% | |
Investment activities of affiliated shareholders could have material impacts on the Funds.
g. Payment by Affiliates. For the year ended September 30, 2016, Loomis Sayles reimbursed Fixed Income Fund $4,383 and Investment Grade Fixed Income Fund $1,265 in connection with a trading error.
7. Class-Specific Transfer Agent Fees and Expenses. For the year ended September 30, 2016, Global Bond Fund incurred the following class-specific transfer agent fees and expenses (including sub-transfer agent fees, where applicable):
| | | | | | | | | | | | |
| | | Institutional
Class | | | Retail
Class | | | Class N | |
Transfer Agent Fees and Expenses | | $ | 1,829,790 | | | $ | 645,899 | | | $ | 575 | |
Transfer agent fees and expenses attributable to Institutional Class and Retail Class are allocated on a pro rata basis to each class based on the relative net assets of each class to the total net assets of those classes. Transfer agent fees and expenses attributable to Class N are allocated to Class N.
All other Funds in this report allocate transfer agent fees and expenses on a pro rata basis based on the relative net assets of each class to the total net assets of those classes.
8. Line of Credit. Effective April 14, 2016, each Fund, together with certain other funds of Natixis Funds Trusts and Loomis Sayles Funds Trusts, entered into a 364-day, $400,000,000 syndicated, committed, unsecured line of credit with Citibank, N.A. to be used for temporary or emergency purposes only. Any one Fund may borrow up to the full $400,000,000 under the line of credit (as long as all borrowings by all Funds in the aggregate do not exceed the $400,000,000 limit at any time), subject to each Fund’s investment restrictions. Interest is charged to the Funds at a rate equal to the greater of the eurodollar or the federal funds rate plus 1.00%. In addition, a commitment fee of 0.10% per annum, payable on the last business day of each month, is accrued and apportioned among the participating funds based on their average daily unused portion of the line of credit. The Funds paid an arrangement fee, an upfront fee, and other fees in connection with the new line of credit agreement, which are being amortized over a period of 364 days and are reflected as miscellaneous expenses on the Statements of Operations. The unamortized balance is reflected as prepaid expenses on the Statements of Assets and Liabilities.
Prior to April 14, 2016 each Fund, together with certain other funds of Natixis Funds Trusts and Loomis Sayles Funds Trusts, participated in a $150,000,000 committed unsecured line of credit provided by State Street Bank. Any one Fund was able to borrow up to the full $150,000,000 under the line of credit (as long as all borrowings by all Funds in the aggregate do not exceed the $150,000,000 limit at any time). Interest was charged to each participating Fund based on its borrowings at a rate per annum equal to the greater of the Federal Funds rate or overnight LIBOR, plus 1.25%. In addition, a commitment fee of 0.15% per annum, payable at the end of each calendar quarter, was accrued and apportioned among the participating funds based on their average daily unused portion of the line of credit.
For the year ended September 30, 2016, Global Bond Fund had an average daily balance on the line of credit with State Street Bank (for those days on which there were borrowings) of $42,365,797 at a weighted average interest rate of 1.64%. Interest expense incurred (which is reflected in miscellaneous expenses in the Statements of Operations) was $3,860.
9. Concentration of Risk. Each Fund’s investments in foreign securities are subject to foreign currency fluctuations, higher volatility than U.S. securities, varying degrees of regulation and limited liquidity. Greater political, economic, credit and information risks are also associated with foreign securities.
10. Concentration of Ownership. From time to time, a Fund may have a concentration of one or more accounts constituting a significant percentage of shares outstanding. Investment activities by holders of such accounts could have material impacts on the Funds. As of September 30, 2016, based on management’s evaluation of the shareholder account base, the Funds had accounts representing controlling
87 |
Notes to Financial Statements – continued
September 30, 2016
ownership of more than 5% of the Fund’s total outstanding shares. The number of such accounts, based on accounts that represent more than 5% of an individual class of shares, and the aggregate percentage of net assets represented by such holdings were as follows:
| | | | | | | | | | | | | | | | |
Fund | | Number of 5%
Non-Affiliated
Account Holders | | | Percentage of
Non-Affiliated
Ownership | | | Percentage of
Affiliated Ownership
(Note 6) | | | Total
Percentage of
Ownership | |
Fixed Income Fund | | | 2 | | | | 17.72% | | | | — | | | | 17.72% | |
Global Bond Fund | | | 1 | | | | 17.63% | | | | — | | | | 17.63% | |
Inflation Protected Securities Fund | | | 2 | | | | 25.63% | | | | 19.07% | | | | 44.70% | |
Institutional High Income Fund | | | 2 | | | | 12.34% | | | | — | | | | 12.34% | |
Investment Grade Fixed Income Fund | | | 3 | | | | 29.48% | | | | — | | | | 29.48% | |
Omnibus shareholder accounts for which NGAM Advisors understands that the intermediary has discretion over the underlying shareholder accounts or investment models where a shareholder account may be invested for a non-discretionary customer are included in the table above. For other omnibus accounts, the Funds do not have information on the individual shareholder accounts underlying the omnibus accounts; therefore, there could be other 5% shareholders in addition to those disclosed in the table above.
11. Capital Shares. Each Fund may issue an unlimited number of shares of beneficial interest, without par value. Transactions in capital shares were as follows:
| | | | | | | | | | | | | | | | |
| | | Fixed Income Fund | |
| | |
| | | Year Ended September 30, 2016 | | | Year Ended September 30, 2015 | |
| | | | |
| Institutional Class | | Shares | | | Amount | | | Shares | | | Amount | |
Issued from the sale of shares | | | 4,891,553 | | | $ | 62,806,285 | | | | 7,578,053 | | | $ | 110,559,437 | |
Issued in connection with the reinvestment of distributions | | | 5,631,834 | | | | 68,539,429 | | | | 7,657,868 | | | | 105,448,844 | |
Redeemed | | | (18,212,948 | ) | | | (234,621,564 | ) | | | (10,927,998 | ) | | | (149,585,121 | ) |
| | | | | | | | | | | | | | | | |
Increase (decrease) from capital share transactions | | | (7,689,561 | ) | | $ | (103,275,850 | ) | | | 4,307,923 | | | $ | 66,423,160 | |
| | | | | | | | | | | | | | | | |
| |
| | | Global Bond Fund | |
| | |
| | | Year Ended September 30, 2016 | | | Year Ended September 30, 2015 | |
| | | | |
| Institutional Class | | Shares | | | Amount | | | Shares | | | Amount | |
Issued from the sale of shares | | | 12,012,824 | | | $ | 185,937,871 | | | | 26,388,877 | | | $ | 413,652,643 | |
Issued in connection with the reinvestment of distributions | | | — | | | | — | | | | 1,664,577 | | | | 26,297,178 | |
Redeemed | | | (48,030,491 | ) | | | (748,675,574 | ) | | | (38,370,302 | ) | | | (595,400,327 | ) |
| | | | | | | | | | | | | | | | |
Net change | | | (36,017,667 | ) | | $ | (562,737,703 | ) | | | (10,316,848 | ) | | $ | (155,450,506 | ) |
| | | | | | | | | | | | | | | | |
| | | | |
| Retail Class | | | | | | | | | | | | |
Issued from the sale of shares | | | 3,051,116 | | | $ | 46,513,165 | | | | 5,417,060 | | | $ | 83,284,513 | |
Issued in connection with the reinvestment of distributions | | | — | | | | — | | | | 713,900 | | | | 11,162,875 | |
Redeemed | | | (11,614,502 | ) | | | (176,898,846 | ) | | | (18,692,966 | ) | | | (285,905,721 | ) |
| | | | | | | | | | | | | | | | |
Net change | | | (8,563,386 | ) | | $ | (130,385,681 | ) | | | (12,562,006 | ) | | $ | (191,458,333 | ) |
| | | | | | | | | | | | | | | | |
| | | | |
| Class N | | | | | | | | | | | | |
Issued from the sale of shares | | | 919,910 | | | $ | 14,173,535 | | | | 404,297 | | | $ | 6,188,648 | |
Issued in connection with the reinvestment of distributions | | | — | | | | — | | | | 32,616 | | | | 515,369 | |
Redeemed | | | (166,839 | ) | | | (2,596,065 | ) | | | (22,359 | ) | | | (342,957 | ) |
| | | | | | | | | | | | | | | | |
Net change | | | 753,071 | | | $ | 11,577,470 | | | | 414,554 | | | $ | 6,361,060 | |
| | | | | | | | | | | | | | | | |
Increase (decrease) from capital share transactions | | | (43,827,982 | ) | | $ | (681,545,914 | ) | | | (22,464,300 | ) | | $ | (340,547,779 | ) |
| | | | | | | | | | | | | | | | |
| 88
Notes to Financial Statements – continued
September 30, 2016
11. Capital Shares – continued
| | | | | | | | | | | | | | | | |
| | | Inflation Protected Securities Fund | |
| | |
| | | Year Ended September 30, 2016 | | | Year Ended September 30, 2015 | |
| | | | |
| Institutional Class | | Shares | | | Amount | | | Shares | | | Amount | |
Issued from the sale of shares | | | 1,087,435 | | | $ | 11,405,849 | | | | 1,045,091 | | | $ | 10,909,078 | |
Issued in connection with the reinvestment of distributions | | | 27,761 | | | | 292,974 | | | | 14,391 | | | | 146,404 | |
Redeemed | | | (656,052 | ) | | | (6,793,970 | ) | | | (1,099,553 | ) | | | (11,391,665 | ) |
| | | | | | | | | | | | | | | | |
Net change | | | 459,144 | | | $ | 4,904,853 | | | | (40,071 | ) | | $ | (336,183 | ) |
| | | | | | | | | | | | | | | | |
| | | | |
| Retail Class | | | | | | | | | | | | |
Issued from the sale of shares | | | 475,636 | | | $ | 4,848,867 | | | | 2,403,561 | | | $ | 24,961,328 | |
Issued in connection with the reinvestment of distributions | | | 1,606 | | | | 16,580 | | | | 9,224 | | | | 93,439 | |
Redeemed | | | (2,228,362 | ) | | | (22,916,842 | ) | | | (1,071,383 | ) | | | (11,152,954 | ) |
| | | | | | | | | | | | | | | | |
Net change | | | (1,751,120 | ) | | $ | (18,051,395 | ) | | | 1,341,402 | | | $ | 13,901,813 | |
| | | | | | | | | | | | | | | | |
Increase (decrease) from capital share transactions | | | (1,291,976 | ) | | $ | (13,146,542 | ) | | | 1,301,331 | | | $ | 13,565,630 | |
| | | | | | | | | | | | | | | | |
| |
| | | Institutional High Income Fund | |
| | |
| | | Year Ended September 30, 2016 | | | Year Ended September 30, 2015 | |
| | | | |
| Institutional Class | | Shares | | | Amount | | | Shares | | | Amount | |
Issued from the sale of shares | | | 16,969,729 | | | $ | 103,359,817 | | | | 13,671,170 | | | $ | 97,738,097 | |
Issued in connection with the reinvestment of distributions | | | 9,032,268 | | | | 52,567,796 | | | | 8,207,097 | | | | 58,434,535 | |
Redeemed | | | (14,850,839 | ) | | | (96,030,408 | ) | | | (13,146,041 | ) | | | (96,264,946 | ) |
| | | | | | | | | | | | | | | | |
Increase (decrease) from capital share transactions | | | 11,151,158 | | | $ | 59,897,205 | | | | 8,732,226 | | | $ | 59,907,686 | |
| | | | | | | | | | | | | | | | |
| |
| | | Investment Grade Fixed Income Fund | |
| | |
| | | Year Ended September 30, 2016 | | | Year Ended September 30, 2015 | |
| | | | |
| Institutional Class | | Shares | | | Amount | | | Shares | | | Amount | |
Issued from the sale of shares | | | 4,197,598 | | | $ | 50,532,659 | | | | 7,899,784 | | | $ | 100,220,843 | |
Issued in connection with the reinvestment of distributions | | | 1,199,344 | | | | 14,138,073 | | | | 2,051,654 | | | | 25,569,037 | |
Redeemed | | | (15,778,562 | ) | | | (186,351,959 | ) | | | (10,127,811 | ) | | | (125,654,728 | ) |
| | | | | | | | | | | | | | | | |
Increase (decrease) from capital share transactions | | | (10,381,620 | ) | | $ | (121,681,227 | ) | | | (176,373 | ) | | $ | 135,152 | |
| | | | | | | | | | | | | | | | |
89 |
Report of Independent Registered Public Accounting Firm
To the Trustees of Loomis Sayles Funds Trust I and Shareholders of Loomis Sayles Fixed Income Fund, Loomis Sayles Global Bond Fund, Loomis Sayles Inflation Protected Securities Fund, Loomis Sayles Institutional High Income Fund and Loomis Sayles Investment Grade Fixed Income Fund:
In our opinion, the accompanying statements of assets and liabilities, including the portfolios of investments, and the related statements of operations and of changes in net assets and the financial highlights present fairly, in all material respects, the financial position of the Loomis Sayles Fixed Income Fund, Loomis Sayles Global Bond Fund, Loomis Sayles Inflation Protected Securities Fund, Loomis Sayles Institutional High Income Fund, and Loomis Sayles Investment Grade Fixed Income Fund, each a series of Loomis Sayles Funds Trust I (collectively, the “Funds”) at September 30, 2016, and the results of each of their operations, the changes in each of their net assets and the financial highlights for each of the periods indicated, in conformity with accounting principles generally accepted in the United States of America. These financial statements and financial highlights (hereafter referred to as “financial statements”) are the responsibility of the Funds’ management. Our responsibility is to express an opinion on these financial statements based on our audits. We conducted our audits of these financial statements in accordance with the standards of the Public Company Accounting Oversight Board (United States). Those standards require that we plan and perform the audit to obtain reasonable assurance about whether the financial statements are free of material misstatement. An audit includes examining, on a test basis, evidence supporting the amounts and disclosures in the financial statements, assessing the accounting principles used and significant estimates made by management, and evaluating the overall financial statement presentation. We believe that our audits, which included confirmation of securities at September 30, 2016 by correspondence with the custodian, agent banks and brokers, provide a reasonable basis for our opinion expressed above.
PricewaterhouseCoopers LLP
Boston, Massachusetts
November 21, 2016
| 90
2016 U.S. Tax Distribution Information to Shareholders (Unaudited)
Corporate Dividends Received Deduction. For the fiscal year ended September 30, 2016, a percentage of dividends distributed by the Funds listed below qualify for the dividends received deduction for corporate shareholders. These percentages are as follows:
| | | | |
Fund | | Qualifying Percentage | |
Fixed Income | | | 5.98% | |
Inflation Protected Securities | | | 0.45% | |
Institutional High Income | | | 6.67% | |
Investment Grade Fixed Income | | | 9.64% | |
Capital Gains Distributions. Pursuant to Internal Revenue Section 852(b), the following Funds paid distributions, which have been designated as capital gains distributions for the fiscal year ended September 30, 2016, unless subsequently determined to be different.
| | | | |
Fund | | Amount | |
Fixed Income | | $ | 19,381,368 | |
Institutional High Income | | | 19,690,372 | |
Investment Grade Fixed Income | | | 5,276,601 | |
Qualified Dividend Income. For the fiscal year ended September 30, 2016, the Funds below will designate up to the maximum amount allowable pursuant to the Internal Revenue Code as qualified dividend income eligible for reduced tax rates. These lower rates range from 0% to 20% depending on an individual’s tax bracket. If the Funds pay a distribution during calendar year 2016, complete information will be reported in conjunction with Form 1099-DIV.
|
Fund |
Fixed Income |
Institutional High Income |
Investment Grade Fixed Income |
Foreign Tax Credit. For the year ended September 30, 2016, the Fund intends to pass through foreign tax credits and have derived gross income from sources within foreign countries amounting to:
| | | | | | | | |
Fund | | Foreign Tax Credit
Pass-Through | | | Foreign Source
Income | |
Global Bond | | $ | 127,229 | | | $ | 34,113,932 | |
91 |
Trustee and Officer Information
The tables below provide certain information regarding the trustees and officers of Loomis Sayles Funds I (the “Trust”). Unless otherwise indicated, the address of all persons below is 399 Boylston Street, Boston, MA 02116. The Funds’ Statement(s) of Additional Information include additional information about the trustees of the Trust and are available by calling Loomis Sayles Funds at 800-633-3330.
| | | | | | | | |
| Name and Year of Birth | | Position(s)
Held with
the Trust, Length
of Time Served and
Term of Office1 | | Principal Occupation(s)
During Past 5 Years | | Number of Portfolios in
Fund Complex Overseen2 and Other Directorships
Held During
Past 5 Years | | Experience,
Qualifications,
Attributes, Skills
for Board
Membership |
| | | | |
Independent Trustees | | | | | | | | |
Kenneth A. Drucker (1945) | | Trustee since 2008 Chairperson of the Audit Committee and Governance Committee Member | | Retired | | 44 None | | Significant experience on the Board and on the boards of other business organizations (including at investment companies); executive experience (including as treasurer of an aerospace, automotive, and metal manufacturing corporation) |
| | | | |
Edmond J. English (1953) | | Trustee since 2013 Audit Committee Member | | Chief Executive Officer of Bob’s Discount Furniture (retail) | | 44 Director, Burlington Stores, Inc. (retail); Formerly, Director, BJ’s Wholesale Club (retail) | | Experience on the Board and significant experience on the boards of other business organizations (including retail companies and a bank); executive experience (including at a retail company) |
| | | | |
Richard A. Goglia (1951) | | Trustee since 2015 Audit Committee Member | | Retired; formerly Vice President and Treasurer of Raytheon Company (defense) | | 44 None | | Experience on the Board and executive experience (including his role as vice president and treasurer of a defense company and experience at a financial services company) |
| | | | |
Wendell J. Knox (1948) | | Trustee since 2009 Contract Review Committee Member and Governance Committee Member | | Director of Abt Associates Inc. (research and consulting) | | 44 Director, Eastern Bank (bank); Director, The Hanover Insurance Group (property and casualty insurance) | | Significant experience on the Board and on the boards of other business organizations (including at a bank and at a property and casualty insurance firm); executive experience (including roles as president and chief executive officer of a research and consulting company) |
| | | | |
Martin T. Meehan (1956) | | Trustee since 2012 Contract Review Committee Member | | President, University of Massachusetts; formerly, Chancellor and faculty member, University of Massachusetts Lowell | | 44 None | | Experience on the Board and on the boards of other business organizations; experience as President of the University of Massachusetts; government experience (including as a member of the U.S. House of Representatives); academic experience |
| 92
| | | | | | | | |
| Name and Year of Birth | | Position(s)
Held with
the Trust, Length
of Time Served and
Term of Office1 | | Principal Occupation(s)
During Past 5 Years | | Number of Portfolios in
Fund Complex Overseen2 and Other Directorships
Held During
Past 5 Years | | Experience,
Qualifications,
Attributes, Skills
for Board
Membership |
Sandra O. Moose (1942) | | Chairperson of the Board of Trustees since November 2005 Trustee since 2003 Ex Officio member of the Audit Committee, the Contract Review Committee and the Governance Committee | | President, Strategic Advisory Services (management consulting) | | 44 Formerly, Director, AES Corporation (international power company); formerly, Director, Verizon Communications (telecommunications company) | | Significant experience on the Board and on the boards of other business organizations (including at a telecommunications company, an international power company and a specialty chemicals corporation); executive experience (including at a management consulting company) |
| | | | |
James P. Palermo (1955) | | Trustee since 2016 Contract Review Committee Member | | Founding Partner, Breton Capital Management, LLC (private equity); formerly, Chief Executive Officer of Global Client Management of The Bank of New York Mellon Corporation | | 44 None | | Experience on the Board; financial services industry and executive experience (including roles as chief executive officer of client management and asset servicing for a banking and financial services company) |
| | | | |
Erik R. Sirri (1958) | | Trustee since 2009 Audit Committee Member | | Professor of Finance at Babson College | | 44 None | | Significant experience on the Board; experience as Director of the Division of Trading and Markets at the Securities and Exchange Commission; academic experience; training as an economist |
| | | | |
Peter J. Smail (1952) | | Trustee since 2009 Chairperson of the Contract Review Committee and Governance Committee Member | | Retired | | 44 None | | Significant experience on the Board; mutual fund industry and executive experience (including roles as president and chief executive officer for an investment adviser) |
| | | | |
Cynthia L. Walker (1956) | | Trustee since 2005 Chairperson of the Governance Committee and Contract Review Committee Member | | Deputy Dean for Finance and Administration, Yale University School of Medicine | | 44 None | | Significant experience on the Board; executive experience in a variety of academic organizations (including roles as dean for finance and administration) |
93 |
| | | | | | | | |
| Name and Year of Birth | | Position(s)
Held with
the Trust, Length
of Time Served and
Term of Office1 | | Principal Occupation(s)
During Past 5 Years | | Number of Portfolios in
Fund Complex Overseen2 and Other Directorships
Held During
Past 5 Years | | Experience,
Qualifications,
Attributes, Skills
for Board
Membership |
| | | | |
Interested Trustees | | | | | | | | |
Kevin P. Charleston3 (1965) One Financial Center Boston, MA 02111 | | Trustee since 2015 President and Chief Executive Officer since 2015 | | President, Chief Executive Officer and Director; formerly, Chief Financial Officer, Loomis, Sayles & Company, L.P. | | 44 None | | Experience on the Board; continuing service as President, Chief Executive Officer and Director of Loomis, Sayles & Company, L.P. |
| | | | |
David L. Giunta4 (1965) | | Trustee since 2011 Executive Vice President since 2008 | | President and Chief Executive Officer, NGAM Distribution Corporation, NGAM Advisors, L.P. and NGAM Distribution, L.P. | | 44 None | | Significant experience on the Board; continuing experience as President and Chief Executive Officer of NGAM Advisors, L.P. |
| | | | |
John T. Hailer5 (1960) | | Trustee since 2003 | | President and Chief Executive Officer – U.S. and Asia, Natixis Global Asset Management, L.P. | | 44 None | | Significant experience on the Board; continuing experience as President and Chief Executive Officer – U.S. and Asia, Natixis Global Asset Management, L.P. |
| 1 | Each trustee serves until retirement, resignation or removal from the Board. The current retirement age is 75. The position of Chairperson of the Board is appointed for a three-year term. Ms. Moose was appointed to serve an additional three-year term as the Chairperson of the Board on December 13, 2013. |
| 2 | The trustees of the Trusts serve as trustees of a fund complex that includes all series of the Natixis Funds Trust I, Natixis Funds Trust II, Natixis Funds Trust IV and Gateway Trust (collectively, the “Natixis Funds Trusts”), Loomis Sayles Funds I and Loomis Sayles Funds II (collectively, the “Loomis Sayles Funds Trusts”) and Natixis ETF Trust (collectively, the “Fund Complex”). |
| 3 | Mr. Charleston is deemed an “interested person” of the Trust because he holds the following positions with an affiliated person of the Trust: President and Chief Executive Officer of Loomis, Sayles & Company, L.P. |
| 4 | Mr. Giunta is deemed an “interested person” of the Trust because he holds the following positions with an affiliated person of the Trust: President and Chief Executive Officer of NGAM Distribution Corporation, NGAM Advisors, L.P. and NGAM Distribution, L.P. |
| 5 | Mr. Hailer is deemed an “interested person” of the Trust because he holds the following positions with an affiliated person of the Trust: President and Chief Executive Officer — U.S. and Asia, Natixis Global Asset Management, L.P. |
| 94
| | | | | | |
| Name and Year of Birth | | Position(s)
Held with
the Trust(s) | | Term of Office1
and Length of
Time Served | | Principal Occupation(s)
During Past 5 Years2 |
| | | |
Officers of the Trust | | | | | | |
Daniel J. Fuss (1933) One Financial Center Boston, MA 02111 | | Executive Vice President | | Since June 2003 | | Vice Chairman and Director, Loomis, Sayles & Company, L.P. |
| | | |
Russell L. Kane (1969) | | Secretary, Clerk and Chief Legal Officer | | Since July 2016 | | Executive Vice President, General Counsel, Secretary and Clerk, NGAM Distribution Corporation, NGAM Advisors, L.P. and NGAM Distribution, L.P.; formerly, Chief Compliance Officer for Mutual Funds, Senior Vice President, Deputy General Counsel, Assistant Secretary and Assistant Clerk, NGAM Distribution Corporation, NGAM Advisors, L.P. and NGAM Distribution, L.P. |
| | | |
Michael C. Kardok (1959) | | Treasurer, Principal Financial and Accounting Officer | | Since October 2004 | | Senior Vice President, NGAM Advisors, L.P. and NGAM Distribution, L.P. |
| | | |
Rosa Licea-Mailloux (1976) | | Chief Compliance Officer, Assistant Secretary and Anti-Money Laundering Officer | | Since July 2016 | | Mutual Funds Chief Compliance Officer, Senior Vice President, Deputy General Counsel, Assistant Secretary and Assistant Clerk, NGAM Distribution Corporation, NGAM Advisors, L.P. and NGAM Distribution, L.P.; formerly, Associate General Counsel, NGAM Distribution, L.P. |
| 1 | Each officer of the Trusts serves for an indefinite term in accordance with the Trusts’ current by-laws until the date his or her successor is elected and qualified, or until he or she sooner dies, retires, is removed or becomes disqualified. |
| 2 | Each person listed above, except as noted, holds the same position(s) with the Fund Complex. Mr. Fuss is not an officer of the Natixis Funds Trusts or the Natixis ETF Trust. Previous positions during the past five years with NGAM Distribution, L.P., NGAM Advisors, L.P. or Loomis, Sayles & Company, L.P. are omitted, if not materially different from a trustee’s or officer’s current position with such entity. |
95 |

Loomis Sayles High Income Opportunities Fund
Loomis Sayles Securitized Asset Fund
Annual Report
September 30, 2016
LOOMIS SAYLES HIGH INCOME OPPORTUNITIES FUND
| | | | |
| Managers | | Symbol | | |
| Matthew J. Eagan, CFA® | | Institutional Class | | LSIOX |
| Daniel J. Fuss, CFA®, CIC | | | | |
| Elaine M. Stokes | | | | |
Investment Objective
The Fund’s investment objective is high current income. Capital appreciation is the Fund’s secondary objective.
Market Conditions
In the beginning of the period, the Federal Reserve (Fed) raised interest rates for the first time since June 2006. This led to modest losses within investment-grade markets and added to an already challenging environment for high yield. After oil prices bottomed in mid-February, capital returned to markets and riskier assets rebounded strongly. Volatility spiked temporarily in June following the U.K. referendum vote to leave the European Union, but conditions were generally calm for the remainder of the period. Fixed-income markets finished the period on a positive note and added to full-year gains.
After declining through mid-February, U.S. high yield became a sought-after asset. The sector rewarded investors by producing strong and steady gains with minimal volatility. Spreads (the difference in yield between non-Treasury and Treasury securities of similar maturity) are trading inside the long-term average, but remain above the lows of 2014. Lower-quality credits and cyclical sectors outperformed during the period as the search for yield presses onward.
Investment-grade corporate bonds also performed well during the one-year period, bouncing back from the lows experienced during the fourth quarter of 2015. The sector’s longer duration (price sensitivity to interest rate changes) was a positive tailwind as longer-maturity yields declined. Overall returns were positive across all sectors, with cyclical sectors and energy performing well during the second half of the period.
Performance Results
For the 12 months ended September 30, 2016, Institutional Class shares of Loomis Sayles High Income Opportunities Fund returned 12.65%. The Fund underperformed its benchmark, the Bloomberg Barclays U.S. Corporate High-Yield Bond Index, which returned 12.73%.
Explanation of Fund Performance
High yield industrial securities were top contributors to the fund’s relative performance due to industry and security selection. In particular, technology and basic industry holdings outperformed. High yield utilities also aided relative performance and outperformed duration-matched Treasuries (Treasuries with similar duration, or price sensitivity to interest rate changes). In addition, out-of-benchmark exposure to Yankee (U.S. dollar-denominated bonds issued by a non-U.S. entity) government-related securities lifted performance.
Meanwhile, our cash and reserve positions lagged the strongly rising high yield market in the second half of the period and hindered results. Our position in convertible securities also detracted. Despite generating a positive absolute return, the allocation lagged on a relative basis due to a selected holding in the transportation industry. Similarly, our high yield financials generated a positive absolute return, but weighed on relative performance. An underweight allocation to the lowest-quality high yield bonds also detracted from performance.
Outlook
Our outlook for the U.S. and global economies remains positive, with expectations for better growth momentum through the end of the year. In the United States, we expect steady gains in employment, increased bank lending and stronger consumer confidence to support GDP growth. The global economy is facing more headwinds but should experience modestly stronger growth next year, led by a healthier U.S. economy and still-accommodative global central bank policies.
Inflation expectations remain low. However, U.S. inflation is showing signs of acceleration and recent economic data have been favorable. We think the Fed is likely to raise rates in December if market conditions remain stable.
Oil prices are likely to be range bound over the short term as elevated supply should be countered by OPEC’s expected production cut in November. We remain constructive on intermediate- to longer-term oil prices and expect that supply and demand will adjust.
We expect low global yields to continue supporting flows into U.S. credit, but at a more modest pace. In this environment, we intend to maintain a yield cushion in our portfolios through exposure to corporate bonds. Credit fundamentals have been stable, reflecting a slowly improving U.S. economy. However, downside risks – including slowing profit growth, rising leverage and free cash flow approaching peak levels – are increasing as we move further into the late stage of the credit cycle.1 Despite these risks, we believe the current phase of the credit cycle can continue for some time, and we do not expect a significant increase in corporate defaults in 2017.
| 1 | | A credit cycle is a cyclical pattern that follows credit availability and corporate health. |
1 |
Within credit, we favor the investment-grade financials, technology and energy sectors. We are also biased to higher-quality high yield. Convertible bonds continue to look attractive, and our focus has shifted from equity-sensitive convertibles to more balanced and credit-sensitive issues. We believe these securities offer yield and upside potential with more limited downside risk.
Risks include growing geopolitical risks, a prolonged period of low economic growth, declining corporate profit expectations and a shift to downturn in the U.S. credit cycle. Looking ahead, we remain focused on careful security selection using fundamental credit analysis. We intend to build on our key investment themes of yield and diversification, using our reserve allocation during periods of extreme short-term market dislocation to potentially add long-term value.
Hypothetical Growth of $10,000 Investment in Institutional Class Shares
September 30, 2006 through September 30, 2016
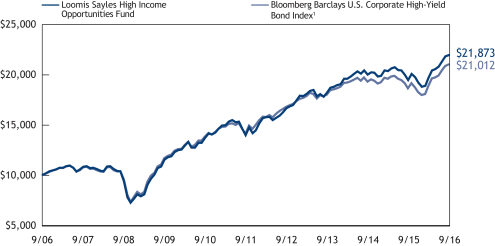
Average Annual Total Returns — September 30, 2016
| | | | | | | | | | | | | | | | | | | | |
| | | | | |
| | | | | | | | | | | | Expense Ratios2 | |
| | | 1 Year | | | 5 Years | | | 10 Years | | | Gross | | | Net | |
| | | | | | |
| Institutional Class (Inception 4/12/04) | | | 12.65 | %3 | | | 9.46 | % | | | 8.14 | % | | | 0.00 | % | | | 0.00 | % |
| | | | | | |
| Comparative Performance | | | | | | | | | | | | | | | | | | | | |
| Bloomberg Barclays U.S. Corporate High-Yield Bond Index1 | | | 12.73 | | | | 8.34 | | | | 7.71 | | | | | | | | | |
Performance data shown represents past performance and is no guarantee of, and not necessarily indicative of, future results. Total return and value will vary, and you may have a gain or loss when shares are sold. Current performance may be lower or higher than quoted. For most recent month-end performance, visit loomissayles.com. Performance for other share classes will be greater or less than shown based on differences in fees and sales charges. You may not invest directly in an index. Performance for periods less than one year is cumulative, not annualized. Returns reflect changes in share price and reinvestment of dividends and capital gains, if any. The table(s) do not reflect taxes shareholders might owe on any fund distributions or when they redeem their shares.
| 1 | | Bloomberg Barclays U.S. Corporate High-Yield Bond Index is an unmanaged index that covers the U.S.-dollar-denominated, non-investment-grade, fixed-rate, taxable corporate bond market. |
| 2 | | The amount shown under Gross and Net Expense Ratio is 0.00% to reflect the fact that the Fund does not pay any advisory, administration or distribution and service fees, and that Loomis Sayles has agreed to pay certain expenses of the Fund. All fees are paid by investors indirectly through separately negotiated advisory relationships with the Fund’s Adviser or through “wrap fee” programs sponsored by broker dealers and investment advisers that may be affiliated or unaffiliated with the Fund, Loomis Sayles or NGAM Advisors, L.P. |
| 3 | | Generally accepted accounting principles require adjustments to be made to the net assets of the Fund for financial reporting purposes only, and as such, the total returns reflected above are different from the total returns reported in the financial highlights. The returns presented in the table above are what an investor would have actually experienced. |
| 2
LOOMIS SAYLES SECURITIZED ASSET FUND
| | | | |
| Managers | | Symbol | | |
| Ian Anderson | | Institutional Class | | LSSAX |
| Alessandro Pagani, CFA® | | | | |
| Clifton V. Rowe, CFA® | | | | |
Investment Objective
The Fund’s investment objective is to seek a high level of current income consistent with capital preservation.
Market Conditions
In the beginning of the period, the Federal Reserve (Fed) raised interest rates for the first time since June 2006. This led to modest losses within investment-grade markets and added to an already challenging environment for high yield. After oil prices bottomed in mid-February, capital returned to markets and riskier assets rebounded strongly. Volatility spiked temporarily in June following the U.K. referendum vote to leave the European Union (EU), but conditions were generally calm for the remainder of the period. Fixed-income markets finished the period on a positive note and added to full-year gains.
At the start of the first quarter, the Fed projected four rate hikes during 2016. Yet as of September 30, there had been no increases and markets anticipated only one 25 basis point hike before year-end. The Fed consistently lowered economic projections throughout 2016, which removed some of the upward pressure on U.S. Treasury yields.
Yields on securitized assets generally followed U.S. Treasury yields lower, resulting in a positive total return for the sector. The Fed still owns $1.7 trillion worth of mortgage-backed securities (MBS) and remains a powerful force in that market as principal payments from matured securities are reinvested.
Performance Results
For the 12 months ended September 30, 2016, Institutional Class shares of the Loomis Sayles Securitized Asset Fund returned 4.27%. The Fund outperformed its benchmark, the Bloomberg Barclays U.S. Securitized Bond Index, which returned 3.68%.
Explanation of Fund Performance
The fund’s outperformance primarily was due to allocation differences between the fund and the benchmark. The fund generally favors various spread (non-government) sectors relative to the benchmark, which is almost entirely composed of U.S. agency-backed securities. In particular, the fund’s exposure to residential mortgage-backed securities (RMBS) helped boost relative performance, as the sector outperformed Treasuries on a duration-adjusted basis, which considers a security’s return relative to Treasuries with similar duration (price sensitivity to interest rate changes). The fund’s allocation to asset-backed securities (ABS) was especially helpful to absolute return, as selected student loan names performed well. In addition, the fund’s yield-curve (a curve that shows the relationship among bond yields across the maturity spectrum) positioning and longer-than-benchmark duration also contributed to performance. Specifically, the yield curve flattened over the period, and our overweight position to the long end of the curve proved to be beneficial. Despite posting a positive absolute return, the fund’s allocation to U.S. securitized agency credit weighed on relative performance.
Outlook
Agency MBS spreads (the difference in yield between agency MBS and Treasuries of similar maturity) remain narrow relative to history. Additionally, refinancing risk is beginning to increase, as mortgages issued in recent years are of relatively high quality compared with those issued in earlier years. Therefore, we prefer to underweight recently issued 30-year MBS, favoring sectors with less refinance risk, such as low-loan balance mortgages and home equity conversion mortgages. Within the commercial real estate sector, top-tier assets and markets have generally recovered and are at or above prior peak levels. We believe investment-grade commercial mortgage-backed securities (CMBS) remain attractive. We also believe ABS currently offer an attractive combination of strong credit quality and enhanced yield. We favor buying higher-yielding securities, such as subordinated bonds, and bonds of less-frequent issuers. Our analysis indicates the credit risk of these securities is inefficiently priced, and they offer attractive opportunities for additional yield.
3 |
Hypothetical Growth of $10,000 Investment in Institutional Class Shares
September 30, 2006 through September 30, 2016
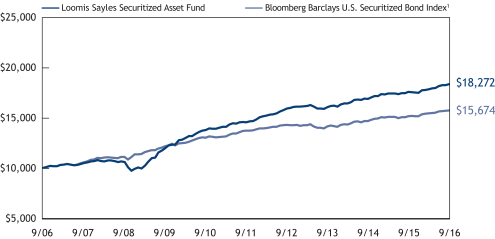
Average Annual Total Returns — September 30, 2016
| | | | | | | | | | | | | | | | | | | | |
| | | | | |
| | | | | | | | | | | | Expense Ratios2 | |
| | | 1 Year | | | 5 Years | | | 10 Years | | | Gross | | | Net | |
| | | | | | |
| Institutional Class (Inception 3/2/06) | | | 4.27 | % | | | 4.72 | % | | | 6.21 | % | | | 0.00 | % | | | 0.00 | % |
| | | | | | |
| Comparative Performance | | | | | | | | | | | | | | | | | | | | |
| Bloomberg Barclays U.S. Securitized Bond Index1 | | | 3.68 | | | | 2.76 | | | | 4.60 | | | | | | | | | |
Performance data shown represents past performance and is no guarantee of, and not necessarily indicative of, future results. Total return and value will vary, and you may have a gain or loss when shares are sold. Current performance may be lower or higher than quoted. For most recent month-end performance, visit loomissayles.com. Performance for other share classes will be greater or less than shown based on differences in fees and sales charges. You may not invest directly in an index. Performance for periods less than one year is cumulative, not annualized. Returns reflect changes in share price and reinvestment of dividends and capital gains, if any. The table(s) do not reflect taxes shareholders might owe on any fund distributions or when they redeem their shares.
| 1 | | Bloomberg Barclays U.S. Securitized Bond Index is an unmanaged index of asset-backed securities, collateralized mortgage-backed securities (ERISA eligible), and fixed-rate mortgage-backed securities. |
| 2 | | The amount shown under Gross and Net Expense Ratio is 0.00% to reflect the fact that the Fund does not pay any advisory, administration or distribution and service fees, and that Loomis Sayles has agreed to pay certain expenses of the Fund. All fees are paid by investors indirectly through separately negotiated advisory relationships with the Fund’s Adviser or through “wrap fee” programs sponsored by broker dealers and investment advisers that may be affiliated or unaffiliated with the Fund, Loomis Sayles or NGAM Advisors, L.P. |
1623920.1.1
| 4
ADDITIONAL INFORMATION
The views expressed in this report reflect those of the portfolio managers as of the dates indicated. The managers’ views are subject to change at any time without notice based on changes in market or other conditions. References to specific securities or industries should not be regarded as investment advice. Because the Funds are actively managed, there is no assurance that they will continue to invest in the securities or industries mentioned.
All investing involves risk, including the risk of loss. There is no assurance that any investment will meet its performance objectives or that losses will be avoided.
Additional Index Information
This document may contain references to third party copyrights, indexes, and trademarks, each of which is the property of its respective owner. Such owner is not affiliated with Natixis Global Asset Management or any of its related or affiliated companies (collectively “NGAM”) and does not sponsor, endorse or participate in the provision of any NGAM services, funds or other financial products.
The index information contained herein is derived from third parties and is provided on an “as is” basis. The user of this information assumes the entire risk of use of this information. Each of the third party entities involved in compiling, computing or creating index information disclaims all warranties (including, without limitation, any warranties of originality, accuracy, completeness, timeliness, non-infringement, merchantability and fitness for a particular purpose) with respect to such information.
Proxy Voting Information
A description of the Funds’ proxy voting policies and procedures is available without charge, upon request by calling Loomis Sayles at 800-633-3330; on the Funds’ website at www.loomissayles.com, and on the Securities and Exchange Commission’s (“SEC’s”) website at www.sec.gov. Information about how the Funds voted proxies relating to portfolio securities during the most recent 12-month period ended June 30 is available on the Funds’ website and the SEC’s website.
Quarterly Portfolio Schedules
The Funds file a complete schedule of portfolio holdings with the SEC for the first and third quarters of each fiscal year on Form N-Q. The Funds’ Forms N-Q are available on the SEC’s website at www.sec.gov and may be reviewed and copied at the SEC’s Public Reference Room in Washington, DC. Information on the operation of the Public Reference Room may be obtained by calling 800-SEC-0330.
5 |
UNDERSTANDING FUND EXPENSES
Typically, mutual fund shareholders incur two types of costs: (1) transaction costs; and (2) ongoing costs, including management fees, distribution fees (12b-1 fees), and other fund expenses. However, the Funds are unlike other mutual funds; they do not charge any fees or expenses.
You should be aware that shares in the Funds are available only to institutional investment advisory clients of Loomis, Sayles & Company, L.P. (“Loomis Sayles”) and NGAM Advisors, L.P. (“NGAM Advisors”) and to participants in “wrap fee” programs sponsored by broker-dealers and investment advisers that may be affiliated or unaffiliated with the Funds, Loomis Sayles or NGAM Advisors. The institutional investment advisory clients of Loomis Sayles and NGAM Advisors pay Loomis Sayles or NGAM Advisors a fee for their investment advisory services, while participants in “wrap fee” programs pay a “wrap fee” to the program’s sponsor. The “wrap fee” program sponsors, in turn, pay a fee to NGAM Advisors. “Wrap fee” program participants should read carefully the wrap fee brochure provided to them by their program’s sponsor and the fees paid by such sponsor to NGAM Advisors. Shareholders pay no additional fees or expenses to purchase shares of the Funds. However, shareholders will indirectly pay a proportionate share of those costs, such as brokerage commissions, taxes and extraordinary expenses, that are borne by the Funds through a reduction in each Fund’s net asset value.
The first line in each Fund’s table shows the actual amount of Fund expenses ($0) you would have paid on a $1,000 investment in the Fund from April 1, 2016 through September 30, 2016.
The second line in each Fund’s table provides information about hypothetical account values and hypothetical expenses based on the Fund’s actual expense ratio (0%) and an assumed rate of return of 5% per year before expenses, which is not the Fund’s actual return. The hypothetical account values and expenses may not be used to estimate the actual ending account balance or expenses you paid on your investment for the period. You may use this information to compare the ongoing costs of investing in the Funds to other funds. To do so, compare this 5% hypothetical example with the 5% hypothetical examples that appear in the shareholder reports of the other funds.
Please note that the expenses shown reflect ongoing costs only, and do not include any transaction costs. Therefore, the second line in the table is useful in comparing ongoing costs only, and will not help you determine the relative costs of owning different funds. If transaction costs were included, total costs would be higher.
Loomis Sayles High Income Opportunities Fund
| | | | | | | | | | | | |
Institutional Class | | Beginning
Account Value
4/1/2016 | | | Ending
Account Value
9/30/2016 | | | Expenses Paid
During Period*
4/1/2016 – 9/30/2016 | |
Actual | | | $1,000.00 | | | | $1,115.20 | | | | $0.00 | |
Hypothetical (5% return before expenses) | | | $1,000.00 | | | | $1,025.00 | | | | $0.00 | |
* Expenses are equal to the Fund’s annualized expense ratio of 0.00%, multiplied by the average account value over the period, multiplied by the number of days in the most recent fiscal half-year (183), divided by 366 (to reflect the half-year period). | |
Loomis Sayles Securitized Asset Fund
| | | | | | | | | | | | |
Institutional Class | | Beginning
Account Value
4/1/2016 | | | Ending
Account Value
9/30/2016 | | | Expenses Paid
During Period*
4/1/2016 – 9/30/2016 | |
Actual | | | $1,000.00 | | | | $1,027.70 | | | | $0.00 | |
Hypothetical (5% return before expenses) | | | $1,000.00 | | | | $1,025.00 | | | | $0.00 | |
* Expenses are equal to the Fund’s annualized expense ratio of 0.00%, multiplied by the average account value over the period, multiplied by the number of days in the most recent fiscal half-year (183), divided by 366 (to reflect the half-year period). | |
| 6
BOARD APPROVAL OF THE EXISTING ADVISORY AGREEMENTS
The Board of Trustees of the Trust (the “Board”), including the Independent Trustees, considers matters bearing on each Fund’s advisory agreement (collectively, the “Agreements”) at most of its meetings throughout the year. Each year, usually in the spring, the Contract Review Committee of the Board meets to review the Agreements to determine whether to recommend that the full Board approve the continuation of the Agreements, typically for an additional one-year period. After the Committee has made its recommendation, the full Board, including the Independent Trustees, determines whether to approve the continuation of the Agreements.
In connection with these meetings, the Trustees receive materials that the Funds’ investment adviser (the “Adviser”) believes to be reasonably necessary for the Trustees to evaluate the Agreements. These materials generally include, among other items, (i) information on the investment performance of the Funds and the performance of peer groups and categories of funds and the Funds’ performance benchmarks, (ii) information on the Funds’ advisory fees, if any, and other expenses, including information comparing the Funds’ expenses to the fees charged to institutional accounts with similar strategies managed by the Adviser, if any, and to those of peer groups of funds and information about any applicable expense caps and fee “breakpoints,” (iii) sales and redemption data in respect of the Funds, (iv) information about the profitability of the Agreements to the Adviser and (v) information obtained through the completion by the Adviser of a questionnaire distributed on behalf of the Trustees. The Board, including the Independent Trustees, also considers other matters such as (i) the Adviser’s financial results and financial condition, (ii) each Fund’s investment objective and strategies and the size, education and experience of the Adviser’s respective investment staffs and their use of technology, external research and trading cost measurement tools, (iii) arrangements in respect of the distribution of the Funds’ shares and the related costs, (iv) the procedures employed to determine the value of the Funds’ assets, (v) the allocation of the Funds’ brokerage, if any, including, if applicable, allocations to brokers affiliated with the Adviser and the use of “soft” commission dollars to pay Fund expenses and to pay for research and other similar services, (vi) the resources devoted to, and the record of compliance with, the Funds’ investment policies and restrictions, policies on personal securities transactions and other compliance policies, (vii) information about amounts invested by the Funds’ portfolio managers in the Funds or in similar accounts that they manage and (viii) the general economic outlook with particular emphasis on the mutual fund industry. Throughout the process, the Trustees are afforded the opportunity to ask questions of and request additional materials from the Adviser.
In addition to the materials requested by the Trustees in connection with their annual consideration of the continuation of the Agreements, the Trustees receive materials in advance of each regular quarterly meeting of the Board that provide detailed information about the Funds’ investment performance. This information generally includes, among other things, an internal performance rating for each Fund based on agreed-upon criteria, graphs showing each Fund’s performance and fee differentials against each Fund’s peer group/category, performance ratings provided by a third-party, total return information for various periods, and third-party performance rankings for various periods comparing a Fund against similarly categorized funds. The portfolio management team for each Fund or other representatives of the Adviser make periodic presentations to the Contract Review Committee and/or the full Board, and Funds identified as presenting possible performance concerns may be subject to more frequent board presentations and reviews. In addition, each quarter the Trustees are provided with detailed statistical information about each Fund’s portfolio. The Trustees also receive periodic updates between meetings.
The Board most recently approved the continuation of the Agreements at its meeting held in June 2016. The Agreements were continued for a one-year period for both Funds. In considering whether to approve the continuation of the Agreements, the Board, including the Independent Trustees, did not identify any single factor as determinative. Individual Trustees may have evaluated the information presented differently from one another, giving different weights to various factors. Matters considered by the Trustees, including the Independent Trustees, in connection with their approval of the Agreements included, but were not limited to, the factors listed below.
The nature, extent and quality of the services provided to the Funds under the Agreements. The Trustees considered the nature, extent and quality of the services provided by the Adviser and its affiliates to the Funds and the resources dedicated to the Funds by the Adviser and its affiliates.
The Trustees considered not only the advisory services provided by the Adviser to the Funds, but also the monitoring and oversight services provided by NGAM Advisors, L.P. (“NGAM Advisors”). They also considered the administrative services provided by NGAM Advisors and its affiliates to the Funds. The Trustees also considered that the Funds are generally only available to institutional clients of Loomis Sayles and participants in certain “wrap programs.”
After reviewing these and related factors, the Trustees concluded, within the context of their overall conclusions regarding each of the Agreements, that the nature, extent and quality of services provided supported the renewal of the Agreements.
Investment performance of the Funds and the Adviser. As noted above, the Trustees received information about the performance of the Funds over various time periods, including information that compared the performance of the Funds to the performance of peer groups and categories of funds and the Funds’ respective performance benchmarks. In addition, the Trustees also reviewed data prepared by an independent third party that analyzed the performance of the Funds using a variety of performance metrics, including metrics that also measured the performance of the Funds on a risk adjusted basis. With respect to each Fund, the Board concluded that the Fund’s performance or other relevant factors supported the renewal of the Agreement relating to that Fund.
The Trustees also considered the Adviser’s performance and reputation generally, the performance of the fund family generally, and the historical responsiveness of the Adviser to Trustee concerns about performance and the willingness of the Adviser to take steps intended to improve performance.
7 |
After reviewing these and related factors, the Trustees concluded, within the context of their overall conclusions regarding each of the Agreements, that the performance of the Funds and the Adviser supported the renewal of the Agreements.
The costs of the services to be provided and profits to be realized by the Adviser and its affiliates from their respective relationships with the Funds. Under the terms of the Agreements, the Adviser does not charge the Funds an investment advisory fee or any other fee for services. The Adviser also bears most of the Funds’ expenses. The Trustees considered that, although the Funds do not compensate the Adviser directly for services under the Agreements, the Adviser will typically receive an advisory fee from its advisory clients who have invested in the Funds or from the sponsors of “wrap programs,” who in turn charge the programs’ participants. Because the Funds do not charge an advisory fee, the Trustees did not consider the profitability of the Adviser’s relationship to the Funds.
After reviewing these and related factors, the Trustees concluded, within the context of their overall conclusions regarding each of the Agreements and in light of the structure of the advisory arrangements, that each Fund’s advisory fee of 0% was fair and reasonable and supported the renewal of the Agreements.
Economies of Scale. The Trustees noted that because the Adviser has borne most of the Funds’ expenses, economies of scale were not relevant to these Funds.
The Trustees also considered other factors, which included but were not limited to the following:
| • | | The effect of recent market and economic events on the performance, asset levels and expense ratios of each Fund. |
| • | | Whether each Fund has operated in accordance with its investment objective and the Fund’s record of compliance with its investment restrictions, and the compliance programs of the Funds and the Adviser. They also considered the compliance-related resources the Adviser and its affiliates were providing to the Funds. |
| • | | The nature, quality, cost and extent of administrative and shareholder services performed by the Adviser and its affiliates, both under the Agreements and under separate agreements covering administrative services. |
| • | | So-called “fallout benefits” to the Adviser, such as the financial and other benefits to the Adviser from being able to offer the Funds to its advisory clients and investors in certain “wrap” programs and engagement of affiliates of the Adviser to provide distribution, administrative and brokerage services to the Funds, and the benefits of research made available to the Adviser by reason of brokerage commissions (if any) generated by the Funds’ securities transactions. The Trustees also considered the benefits to the parent company of NGAM Advisors from the retention of the Adviser. The Trustees considered the possible conflicts of interest associated with these fallout and other benefits, and the reporting, disclosure and other processes in place to disclose and monitor such possible conflicts of interest. |
| • | | The Trustees’ review and discussion of the Funds’ advisory arrangements in prior years, and management’s record of responding to Trustee concerns raised during the year and in prior years. |
Based on their evaluation of all factors that they deemed to be material, including those factors described above, and assisted by the advice of independent counsel, the Trustees, including the Independent Trustees, concluded that each of the existing Agreements should be continued through June 30, 2017.
| 8
Portfolio of Investments – as of September 30, 2016
Loomis Sayles High Income Opportunities Fund
| | | | | | | | |
Principal
Amount | | | Description | | Value (†) | |
| |
| | Bonds and Notes – 91.0% of Net Assets | | | | |
| |
| | Non-Convertible Bonds – 87.8% | | | | |
| | |
| | | | ABS Home Equity – 2.1% | | | | |
| $ | 165,000 | | | American Homes 4 Rent,
Series 2014-SFR1, Class E,
3.031%, 6/17/2031, 144A(b) | | $ | 161,989 | |
| | 175,000 | | | American Homes 4 Rent,
Series 2014-SFR2, Class D,
5.149%, 10/17/2036, 144A | | | 193,631 | |
| | 57,625 | | | Banc of America Alternative Loan Trust,
Series 2003-8, Class 1CB1,
5.500%, 10/25/2033 | | | 58,752 | |
| | 291,778 | | | Banc of America Alternative Loan Trust, Series 2004-9, Class 2CB1, 6.000%, 10/25/2034 | | | 297,545 | |
| | 70,492 | | | Banc of America Funding Corp., Series 2007-4, Class 5A1, 5.500%, 11/25/2034 | | | 69,828 | |
| | 66,785 | | | Banc of America Funding Trust, Series 2005-7, Class 3A1, 5.750%, 11/25/2035 | | | 68,423 | |
| | 100,000 | | | CAM Mortgage Trust LLC,
Series 2015-1, Class M,
4.750%, 7/15/2064, 144A(b) | | | 98,357 | |
| | 91,995 | | | Countrywide Alternative Loan Trust, Series 2005-14, Class 2A1, 0.735%, 5/25/2035(b) | | | 76,312 | |
| | 63,053 | | | Countrywide Asset-Backed Certificates,
Series 2004-13, Class AF5B,
4.903%, 5/25/2035(b) | | | 64,431 | |
| | 221,228 | | | DSLA Mortgage Loan,
Series 2005-AR5, Class 2A1A,
0.861%, 9/19/2045(b) | | | 162,867 | |
| | 320,000 | | | Freddie Mac Structured Agency Credit Risk Debt Notes, Series 2013-DN2, Class M2,
4.775%, 11/25/2023(b) | | | 338,836 | |
| | 270,000 | | | Freddie Mac Structured Agency Credit Risk Debt Notes, Series 2015-DNA1, Class M3,
3.825%, 10/25/2027(b) | | | 280,775 | |
| | 77,562 | | | GMAC Mortgage Corp. Loan Trust,
Series 2005-AR4, Class 3A1,
3.558%, 7/19/2035(b) | | | 69,871 | |
| | 64,758 | | | GSR Mortgage Loan Trust,
Series 2004-14, Class 5A1,
3.189%, 12/25/2034(b) | | | 64,203 | |
| | 117,302 | | | IndyMac Index Mortgage Loan Trust,
Series 2005-16IP, Class A1,
1.165%, 7/25/2045(b) | | | 98,028 | |
| | 97,455 | | | Lehman Mortgage Trust,
Series 2005-3, Class 1A6,
1.025%, 1/25/2036(b) | | | 63,271 | |
| | 295,573 | | | MASTR Adjustable Rate Mortgages Trust,
Series 2005-2, Class 4A1,
2.920%, 3/25/2035(b) | | | 229,031 | |
| | 76,151 | | | Structured Asset Securities Corp. Mortgage Pass Through Certificates,
Series 2004-20, Class 8A7,
5.750%, 11/25/2034 | | | 77,164 | |
| | 175,000 | | | Vericrest Opportunity Loan Transferee,
Series 2015-NP14, Class A2,
4.875%, 11/27/2045, 144A(b) | | | 168,377 | |
| | |
| | | | ABS Home Equity – continued | | | | |
| $ | 115,145 | | | WaMu Mortgage Pass Through Certificates, Series 2006-AR11, Class 2A,
2.193%, 9/25/2046(b) | | $ | 108,375 | |
| | 180,021 | | | WaMu Mortgage Pass Through Certificates, Series 2006-AR19, Class 2A, 1.943%, 1/25/2047(b) | | | 160,959 | |
| | | | | | | | |
| | | | | | | 2,911,025 | |
| | | | | | | | |
| | | | ABS Other – 0.2% | | | | |
| | 221,726 | | | AIM Aviation Finance Ltd.,
Series 2015-1A, Class B1,
5.072%, 2/15/2040, 144A(b) | | | 213,429 | |
| | 31,438 | | | Sierra Receivables Funding Co. LLC,
Series 2011-3A, Class C,
9.310%, 7/20/2028, 144A | | | 31,658 | |
| | | | | | | | |
| | | | | | | 245,087 | |
| | | | | | | | |
| | | | Aerospace & Defense – 2.9% | |
| | 90,000 | | | Embraer Netherlands Finance BV,
5.050%, 6/15/2025 | | | 90,450 | |
| | 75,000 | | | Engility Corp.,
8.875%, 9/01/2024, 144A | | | 75,938 | |
| | 90,000 | | | Huntington Ingalls Industries, Inc.,
5.000%, 11/15/2025, 144A | | | 95,175 | |
| | 690,000 | | | KLX, Inc., 5.875%, 12/01/2022, 144A | | | 714,150 | |
| | 1,425,000 | | | Meccanica Holdings USA, Inc.,
6.250%, 1/15/2040, 144A | | | 1,396,500 | |
| | 400,000 | | | Meccanica Holdings USA, Inc.,
7.375%, 7/15/2039, 144A | | | 438,000 | |
| | 350,000 | | | Oshkosh Corp., 5.375%, 3/01/2025 | | | 366,187 | |
| | 265,000 | | | TransDigm, Inc., 6.000%, 7/15/2022 | | | 279,575 | |
| | 225,000 | | | TransDigm, Inc., 6.500%, 7/15/2024 | | | 236,813 | |
| | 185,000 | | | TransDigm, Inc., 6.500%, 5/15/2025 | | | 192,631 | |
| | | | | | | | |
| | | | | | | 3,885,419 | |
| | | | | | | | |
| | | | Airlines – 2.1% | |
| | 1,162,230 | | | American Airlines Pass Through Trust,
Series 2013-1, Class B,
5.625%, 1/15/2021, 144A | | | 1,212,915 | |
| | 325,142 | | | Delta Air Lines Pass Through Trust,
Series 2007-1, Class B, 8.021%, 2/10/2024 | | | 370,271 | |
| | 1,217,293 | | | Latam Airlines Pass Through Trust,
Series 2015-1, Class B, 4.500%, 8/15/2025 | | | 1,171,644 | |
| | 54,761 | | | Virgin Australia Pass Through Trust,
Series 2013-1C,
7.125%, 10/23/2018, 144A | | | 55,446 | |
| | | | | | | | |
| | | | | | | 2,810,276 | |
| | | | | | | | |
| | | | Automotive – 2.1% | |
| | 150,000 | | | Allison Transmission, Inc.,
5.000%, 10/01/2024, 144A | | | 153,750 | |
| | 975,000 | | | General Motors Financial Co., Inc.,
5.250%, 3/01/2026 | | | 1,070,827 | |
| | 65,000 | | | Goodyear Tire & Rubber Co. (The),
5.000%, 5/31/2026 | | | 66,869 | |
| | 60,000 | | | Goodyear Tire & Rubber Co. (The),
5.125%, 11/15/2023 | | | 62,550 | |
| | 320,000 | | | Goodyear Tire & Rubber Co. (The),
7.000%, 3/15/2028 | | | 349,600 | |
See accompanying notes to financial statements.
9 |
Portfolio of Investments – as of September 30, 2016
Loomis Sayles High Income Opportunities Fund – continued
| | | | | | | | |
Principal
Amount | | | Description | | Value (†) | |
| |
| | Bonds and Notes – continued | | | | |
| |
| | | | Automotive – continued | |
| $ | 500,000 | | | Midas Intermediate Holdco II LLC/Midas Intermediate Holdco II Finance, Inc., 7.875%, 10/01/2022, 144A | | $ | 508,750 | |
| | 585,000 | | | ZF North America Capital, Inc.,
4.750%, 4/29/2025, 144A | | | 614,250 | |
| | | | | | | | |
| | | | | | | 2,826,596 | |
| | | | | | | | |
| | | | Banking – 4.6% | |
| | 600,000 | | | Ally Financial, Inc., 3.500%, 1/27/2019 | | | 605,250 | |
| | 155,000 | | | Ally Financial, Inc., 4.125%, 3/30/2020 | | | 157,712 | |
| | 20,000 | | | Ally Financial, Inc., 4.125%, 2/13/2022 | | | 20,225 | |
| | 980,000 | | | Ally Financial, Inc., 5.125%, 9/30/2024 | | | 1,038,800 | |
| | 1,125,000 | | | Commerzbank AG,
8.125%, 9/19/2023, 144A | | | 1,294,312 | |
| | 1,335,000 | | | Intesa Sanpaolo SpA,
5.017%, 6/26/2024, 144A | | | 1,218,276 | |
| | 405,000 | | | Royal Bank of Scotland Group PLC,
4.700%, 7/03/2018 | | | 415,982 | |
| | 265,000 | | | Royal Bank of Scotland Group PLC,
6.000%, 12/19/2023 | | | 276,188 | |
| | 1,210,000 | | | Royal Bank of Scotland Group PLC,
6.125%, 12/15/2022 | | | 1,282,133 | |
| | | | | | | | |
| | | | | | | 6,308,878 | |
| | | | | | | | |
| | | | Brokerage – 0.7% | |
| | 200,000 | | | Jefferies Finance LLC/JFIN Co-Issuer Corp., 6.875%, 4/15/2022, 144A | | | 186,000 | |
| | 140,000 | | | Jefferies Group LLC, 6.250%, 1/15/2036 | | | 145,919 | |
| | 515,000 | | | Jefferies Group LLC, 6.450%, 6/08/2027 | | | 583,031 | |
| | | | | | | | |
| | | | | | | 914,950 | |
| | | | | | | | |
| | | | Building Materials – 1.2% | |
| | 670,000 | | | Atrium Windows & Doors, Inc.,
7.750%, 5/01/2019, 144A | | | 602,162 | |
| | 300,000 | | | Cemex SAB de CV,
7.750%, 4/16/2026, 144A | | | 332,850 | |
| | 265,000 | | | HD Supply, Inc.,
5.250%, 12/15/2021, 144A | | | 280,238 | |
| | 15,000 | | | Masco Corp., 7.750%, 8/01/2029 | | | 17,925 | |
| | 150,000 | | | NCI Building Systems, Inc.,
8.250%, 1/15/2023, 144A | | | 163,125 | |
| | 160,000 | | | U.S. Concrete, Inc., 6.375%, 6/01/2024 | | | 166,000 | |
| | 100,000 | | | USG Corp., 5.500%, 3/01/2025, 144A | | | 107,250 | |
| | | | | | | | |
| | | | | | | 1,669,550 | |
| | | | | | | | |
| | | | Cable Satellite – 7.7% | |
| | 690,000 | | | Altice Financing S.A.,
6.625%, 2/15/2023, 144A | | | 708,112 | |
| | 150,000 | | | Cablevision S.A.,
6.500%, 6/15/2021, 144A | | | 156,563 | |
| | 400,000 | | | CCO Holdings LLC/CCO Holdings Capital Corp., 5.125%, 2/15/2023 | | | 417,000 | |
| | 605,000 | | | CCO Holdings LLC/CCO Holdings Capital Corp., 5.750%, 1/15/2024 | | | 642,812 | |
| | 575,000 | | | CCO Holdings LLC/CCO Holdings Capital Corp., 5.875%, 5/01/2027, 144A | | | 612,375 | |
| | 540,000 | | | CSC Holdings LLC, 5.250%, 6/01/2024 | | | 513,000 | |
| | 45,000 | | | CSC Holdings LLC,
6.750%, 11/15/2021 | | | 47,588 | |
| | 25,000 | | | CSC Holdings LLC, 7.625%, 7/15/2018 | | | 26,938 | |
| | 300,000 | | | CSC Holdings LLC,
10.125%, 1/15/2023, 144A | | | 345,750 | |
| |
| | | | Cable Satellite – continued | |
| 745,000 | | | CSC Holdings LLC,
10.875%, 10/15/2025, 144A | | | 872,581 | |
| | 625,000 | | | DISH DBS Corp., 5.000%, 3/15/2023 | | | 607,812 | |
| | 440,000 | | | DISH DBS Corp., 5.125%, 5/01/2020 | | | 456,500 | |
| | 480,000 | | | DISH DBS Corp., 5.875%, 7/15/2022 | | | 493,310 | |
| | 500,000 | | | DISH DBS Corp., 5.875%, 11/15/2024 | | | 493,750 | |
| | 245,000 | | | DISH DBS Corp.,
7.750%, 7/01/2026, 144A | | | 260,313 | |
| | 115,000 | | | Sirius XM Radio, Inc.,
5.750%, 8/01/2021, 144A | | | 120,405 | |
| | 1,320,000 | | | Unitymedia GmbH,
6.125%, 1/15/2025, 144A | | | 1,384,350 | |
| | 875,000 | | | Virgin Media Secured Finance PLC,
5.250%, 1/15/2026, 144A | | | 888,125 | |
| | 200,000 | | | Virgin Media Secured Finance PLC, 5.500%, 1/15/2025, 144A | | | 204,500 | |
| | 565,000 | | | Ziggo Bond Finance BV,
5.875%, 1/15/2025, 144A | | | 565,000 | |
| | 660,000 | | | Ziggo Secured Finance BV,
5.500%, 1/15/2027, 144A | | | 659,175 | |
| | | | | | | | |
| | | | | | | 10,475,959 | |
| | | | | | | | |
| | | | Chemicals – 0.5% | |
| | 805,000 | | | Hercules, Inc., 6.500%, 6/30/2029 | | | 724,500 | |
| | | | | | | | |
| | | | Construction Machinery – 0.5% | |
| | 115,000 | | | United Rentals North America, Inc.,
4.625%, 7/15/2023 | | | 117,875 | |
| | 290,000 | | | United Rentals North America, Inc.,
5.750%, 11/15/2024 | | | 300,875 | |
| | 255,000 | | | United Rentals North America, Inc.,
6.125%, 6/15/2023 | | | 267,431 | |
| | | | | | | | |
| | | | | | | 686,181 | |
| | | | | | | | |
| | | | Consumer Cyclical Services – 1.3% | |
| | 330,000 | | | IHS Markit Ltd.,
5.000%, 11/01/2022, 144A | | | 349,173 | |
| | 460,000 | | | Interval Acquisition Corp.,
5.625%, 4/15/2023 | | | 474,950 | |
| | 285,000 | | | Realogy Group LLC/Realogy Co-Issuer Corp., 5.250%, 12/01/2021, 144A | | | 299,872 | |
| | 645,000 | | | ServiceMaster Co. LLC (The),
7.450%, 8/15/2027 | | | 685,635 | |
| | | | | | | | |
| | | | | | | 1,809,630 | |
| | | | | | | | |
| | | | Consumer Products – 0.2% | |
| | 225,000 | | | Avon International Operations, Inc.,
7.875%, 8/15/2022, 144A | | | 232,313 | |
| | | | | | | | |
| | | | Diversified Manufacturing – 0.1% | |
| | 75,000 | | | Entegris, Inc., 6.000%, 4/01/2022, 144A | | | 77,625 | |
| | | | | | | | |
| | | | Electric – 1.8% | |
| | 300,000 | | | AES Corp. (The), 5.500%, 4/15/2025 | | | 308,625 | |
| | 220,000 | | | AES Corp. (The), 6.000%, 5/15/2026 | | | 232,650 | |
| | 315,000 | | | Calpine Corp.,
7.875%, 1/15/2023, 144A | | | 332,719 | |
| | 20,310 | | | CE Generation LLC, 7.416%, 12/15/2018 | | | 18,990 | |
| | 925,000 | | | Enel SpA, (fixed rate to 9/24/2023, variable rate thereafter), 8.750%, 9/24/2073, 144A | | | 1,081,094 | |
| | 155,000 | | | NRG Energy, Inc., 6.250%, 7/15/2022 | | | 157,325 | |
| | 35,000 | | | NRG Energy, Inc., 6.625%, 3/15/2023 | | | 35,350 | |
See accompanying notes to financial statements.
| 10
Portfolio of Investments – as of September 30, 2016
Loomis Sayles High Income Opportunities Fund – continued
| | | | | | | | |
Principal
Amount | | | Description | | Value (†) | |
| |
| | Bonds and Notes – continued | | | | |
| |
| | | | Electric – continued | |
| $ | 165,000 | | | NRG Energy, Inc.,
7.250%, 5/15/2026, 144A | | $ | 167,887 | |
| | 67,000 | | | NRG Energy, Inc., 7.875%, 5/15/2021 | | | 70,015 | |
| | | | | | | | |
| | | | | | | 2,404,655 | |
| | | | | | | | |
| | | | Environmental – 0.3% | |
| | 195,000 | | | GFL Environmental, Inc.,
7.875%, 4/01/2020, 144A | | | 205,725 | |
| | 175,000 | | | GFL Environmental, Inc., 9.875%, 2/01/2021, 144A | | | 191,625 | |
| | | | | | | | |
| | | | | | | 397,350 | |
| | | | | | | | |
| | | | Finance Companies – 6.2% | |
| | 150,000 | | | AerCap Ireland Capital Ltd./AerCap Global Aviation Trust, 3.750%, 5/15/2019 | | | 153,187 | |
| | 570,000 | | | AerCap Ireland Capital Ltd./AerCap Global Aviation Trust, 4.500%, 5/15/2021 | | | 596,362 | |
| | 220,000 | | | AerCap Ireland Capital Ltd./AerCap Global Aviation Trust, 4.625%, 10/30/2020 | | | 231,000 | |
| | 375,000 | | | Aircastle Ltd., 5.125%, 3/15/2021 | | | 400,781 | |
| | 410,000 | | | Aircastle Ltd., 5.500%, 2/15/2022 | | | 441,775 | |
| | 30,000 | | | Aircastle Ltd., 7.625%, 4/15/2020 | | | 34,163 | |
| | 220,000 | | | International Lease Finance Corp., 5.875%, 8/15/2022 | | | 243,925 | |
| | 45,000 | | | International Lease Finance Corp., 6.250%, 5/15/2019 | | | 48,769 | |
| | 70,000 | | | International Lease Finance Corp., 8.250%, 12/15/2020 | | | 83,125 | |
| | 255,000 | | | International Lease Finance Corp., 8.625%, 1/15/2022 | | | 313,650 | |
| | 135,000 | | | iStar, Inc., 4.000%, 11/01/2017 | | | 135,337 | |
| | 195,000 | | | iStar, Inc., 4.875%, 7/01/2018 | | | 195,975 | |
| | 585,000 | | | iStar, Inc., 5.000%, 7/01/2019 | | | 583,467 | |
| | 75,000 | | | iStar, Inc., 5.850%, 3/15/2017 | | | 75,896 | |
| | 245,000 | | | iStar, Inc., 6.500%, 7/01/2021 | | | 248,675 | |
| | 55,000 | | | iStar, Inc., 7.125%, 2/15/2018 | | | 57,338 | |
| | 865,000 | | | Ladder Capital Finance Holdings LLLP/Ladder Capital Finance Corp., 5.875%, 8/01/2021, 144A | | | 821,750 | |
| | 210,000 | | | Ladder Capital Finance Holdings LLLP/Ladder Capital Finance Corp., 7.375%, 10/01/2017 | | | 211,575 | |
| | 30,000 | | | Navient Corp., MTN, 6.125%, 3/25/2024 | | | 27,938 | |
| | 65,000 | | | Navient LLC, 4.875%, 6/17/2019 | | | 64,756 | |
| | 185,000 | | | Navient LLC, 5.500%, 1/25/2023 | | | 169,737 | |
| | 835,000 | | | Navient LLC, MTN, 5.500%, 1/15/2019 | | | 847,525 | |
| | 145,000 | | | Provident Funding Associates LP/PFG Finance Corp., 6.750%, 6/15/2021, 144A | | | 146,269 | |
| | 870,000 | | | Quicken Loans, Inc.,
5.750%, 5/01/2025, 144A | | | 863,475 | |
| | 395,000 | | | Springleaf Finance Corp.,
5.250%, 12/15/2019 | | | 403,394 | |
| | 280,000 | | | Springleaf Finance Corp.,
7.750%, 10/01/2021 | | | 293,650 | |
| | 110,000 | | | Springleaf Finance Corp.,
8.250%, 10/01/2023 | | | 115,500 | |
| | 200,000 | | | Springleaf Finance Corp.,
Series J, MTN, 6.500%, 9/15/2017 | | | 207,000 | |
| | 102,000 | | | Stearns Holdings LLC,
9.375%, 8/15/2020, 144A | | | 98,940 | |
| | 320,000 | | | Unifin Financiera SAB de CV SOFOM ENR, 7.250%, 9/27/2023, 144A | | | 318,800 | |
| | | | | | | | |
| | | | | | | 8,433,734 | |
| | | | | | | | |
| | | | Financial Other – 1.2% | |
| 450,000 | | | Icahn Enterprises LP/Icahn Enterprises Finance Corp., 4.875%, 3/15/2019 | | | 452,250 | |
| | 860,000 | | | Icahn Enterprises LP/Icahn Enterprises Finance Corp., 5.875%, 2/01/2022 | | | 825,600 | |
| | 388,000 | | | Rialto Holdings LLC/Rialto Corp.,
7.000%, 12/01/2018, 144A | | | 393,820 | |
| | | | | | | | |
| | | | | | | 1,671,670 | |
| | | | | | | | |
| | | | Food & Beverage – 1.0% | |
| | 730,000 | | | Cosan Luxembourg S.A.,
7.000%, 1/20/2027, 144A | | | 761,937 | |
| | 195,000 | | | JBS USA LLC/JBS USA Finance, Inc.,
5.750%, 6/15/2025, 144A | | | 191,588 | |
| | 20,000 | | | JBS USA LLC/JBS USA Finance, Inc.,
7.250%, 6/01/2021, 144A | | | 20,675 | |
| | 120,000 | | | TreeHouse Foods, Inc., 4.875%, 3/15/2022 | | | 124,200 | |
| | 265,000 | | | WhiteWave Foods Co. (The), 5.375%, 10/01/2022 | | | 301,106 | |
| | | | | | | | |
| | | | | | | 1,399,506 | |
| | | | | | | | |
| | | | Gaming – 0.9% | |
| | 150,000 | | | Boyd Gaming Corp.,
6.375%, 4/01/2026, 144A | | | 160,875 | |
| | 80,000 | | | GLP Capital LP/GLP Financing II, Inc.,
5.375%, 4/15/2026 | | | 86,000 | |
| | 925,000 | | | MGM Resorts International,
6.000%, 3/15/2023 | | | 1,003,625 | |
| | | | | | | | |
| | | | | | | 1,250,500 | |
| | | | | | | | |
| | | | Government Owned – No Guarantee – 1.4% | |
| | 675,000 | | | Petrobras Global Finance BV,
4.875%, 3/17/2020 | | | 676,687 | |
| | 610,000 | | | Petrobras Global Finance BV,
5.375%, 1/27/2021 | | | 603,290 | |
| | 260,000 | | | Petrobras Global Finance BV,
6.250%, 3/17/2024 | | | 252,850 | |
| | 340,000 | | | Petrobras Global Finance BV,
8.375%, 5/23/2021 | | | 371,450 | |
| | | | | | | | |
| | | | | | | 1,904,277 | |
| | | | | | | | |
| | | | Healthcare – 4.3% | |
| | 135,000 | | | Amsurg Corp., 5.625%, 7/15/2022 | | | 138,038 | |
| | 750,000 | | | CHS/Community Health Systems, Inc.,
6.875%, 2/01/2022 | | | 645,000 | |
| | 300,000 | | | HCA Holdings, Inc., 6.250%, 2/15/2021 | | | 325,500 | |
| | 125,000 | | | HCA, Inc., 4.500%, 2/15/2027 | | | 125,781 | |
| | 655,000 | | | HCA, Inc., 5.375%, 2/01/2025 | | | 676,287 | |
| | 430,000 | | | HCA, Inc., 7.050%, 12/01/2027 | | | 457,413 | |
| | 35,000 | | | HCA, Inc., 7.500%, 12/15/2023 | | | 38,806 | |
| | 790,000 | | | HCA, Inc., 7.500%, 11/06/2033 | | | 856,162 | |
| | 40,000 | | | HCA, Inc., 7.690%, 6/15/2025 | | | 44,956 | |
| | 40,000 | | | HCA, Inc., 8.360%, 4/15/2024 | | | 46,443 | |
| | 205,000 | | | HCA, Inc., MTN, 7.580%, 9/15/2025 | | | 231,138 | |
| | 20,000 | | | HCA, Inc., MTN, 7.750%, 7/15/2036 | | | 21,675 | |
| | 135,000 | | | Hologic, Inc., 5.250%, 7/15/2022, 144A | | | 143,269 | |
| | 70,000 | | | Kindred Healthcare, Inc.,
8.000%, 1/15/2020 | | | 71,225 | |
| | 190,000 | | | Kindred Healthcare, Inc.,
8.750%, 1/15/2023 | | | 190,000 | |
| | 140,000 | | | LifePoint Health, Inc.,
5.500%, 12/01/2021 | | | 145,950 | |
| | 50,000 | | | MEDNAX, Inc.,
5.250%, 12/01/2023, 144A | | | 52,563 | |
See accompanying notes to financial statements.
11 |
Portfolio of Investments – as of September 30, 2016
Loomis Sayles High Income Opportunities Fund – continued
| | | | | | | | |
Principal
Amount | | | Description | | Value (†) | |
| |
| | Bonds and Notes – continued | | | | |
| |
| | | | Healthcare – continued | |
| $ | 180,000 | | | Team Health, Inc.,
7.250%, 12/15/2023, 144A | | $ | 193,725 | |
| | 490,000 | | | Tenet Healthcare Corp.,
6.750%, 6/15/2023 | | | 455,700 | |
| | 1,145,000 | | | Tenet Healthcare Corp.,
6.875%, 11/15/2031 | | | 941,762 | |
| | | | | | | | |
| | | | | | | 5,801,393 | |
| | | | | | | | |
| | | | Home Construction – 1.6% | |
| | 20,000 | | | Beazer Homes USA, Inc.,
8.750%, 3/15/2022, 144A | | | 21,100 | |
| | 200,000 | | | Corporacion GEO SAB de CV,
8.875%, 3/27/2022, 144A(c)(d)(e) | | | 2 | |
| | 260,000 | | | K. Hovnanian Enterprises, Inc.,
5.000%, 11/01/2021(e)(f) | | | 182,000 | |
| | 385,000 | | | Lennar Corp., 4.750%, 11/15/2022 | | | 397,513 | |
| | 720,000 | | | PulteGroup, Inc., 6.000%, 2/15/2035 | | | 727,200 | |
| | 495,000 | | | PulteGroup, Inc., 6.375%, 5/15/2033 | | | 515,625 | |
| | 380,000 | | | TRI Pointe Holdings, Inc./TRI Pointe Group, Inc., 4.375%, 6/15/2019 | | | 390,925 | |
| | 200,000 | | | Urbi Desarrollos Urbanos SAB de CV,
9.750%, 2/03/2022, 144A(c)(d)(e) | | | 2 | |
| | | | | | | | |
| | | | | | | 2,234,367 | |
| | | | | | | | |
| | | | Independent Energy – 8.1% | |
| | 1,035,000 | | | Antero Resources Corp.,
5.125%, 12/01/2022 | | | 1,042,762 | |
| | 75,000 | | | Antero Resources Corp.,
5.375%, 11/01/2021 | | | 75,844 | |
| | 595,000 | | | Baytex Energy Corp.,
5.625%, 6/01/2024, 144A | | | 484,925 | |
| | 220,000 | | | Bonanza Creek Energy, Inc.,
5.750%, 2/01/2023 | | | 100,100 | |
| | 500,000 | | | Bonanza Creek Energy, Inc.,
6.750%, 4/15/2021 | | | 227,500 | |
| | 68,000 | | | California Resources Corp.,
5.500%, 9/15/2021 | | | 36,040 | |
| | 33,000 | | | California Resources Corp.,
6.000%, 11/15/2024 | | | 15,758 | |
| | 110,000 | | | Callon Petroleum Co.,
6.125%, 10/01/2024, 144A | | | 113,850 | |
| | 103,000 | | | Chesapeake Energy Corp.,
4.875%, 4/15/2022 | | | 86,778 | |
| | 8,000 | | | Chesapeake Energy Corp.,
5.750%, 3/15/2023 | | | 6,800 | |
| | 12,000 | | | Chesapeake Energy Corp.,
6.125%, 2/15/2021 | | | 11,010 | |
| | 21,000 | | | Chesapeake Energy Corp.,
6.625%, 8/15/2020 | | | 19,766 | |
| | 110,000 | | | Concho Resources, Inc.,
5.500%, 10/01/2022 | | | 114,125 | |
| | 300,000 | | | Concho Resources, Inc.,
5.500%, 4/01/2023 | | | 309,375 | |
| | 600,000 | | | CONSOL Energy, Inc.,
5.875%, 4/15/2022 | | | 552,000 | |
| | 310,000 | | | Continental Resources, Inc.,
3.800%, 6/01/2024 | | | 283,650 | |
| | 80,000 | | | Continental Resources, Inc.,
4.500%, 4/15/2023 | | | 76,800 | |
| | 630,000 | | | Continental Resources, Inc.,
5.000%, 9/15/2022 | | | 628,425 | |
| |
| | | | Independent Energy – continued | |
| 445,000 | | | Eclipse Resources Corp.,
8.875%, 7/15/2023 | | | 433,597 | |
| | 100,000 | | | Halcon Resources Corp.,
8.625%, 2/01/2020, 144A | | | 100,500 | |
| | 85,000 | | | Matador Resources Co., 6.875%, 4/15/2023 | | | 87,975 | |
| | 250,000 | | | MEG Energy Corp.,
6.375%, 1/30/2023, 144A | | | 197,812 | |
| | 280,000 | | | MEG Energy Corp.,
6.500%, 3/15/2021, 144A | | | 228,550 | |
| | 465,000 | | | MEG Energy Corp.,
7.000%, 3/31/2024, 144A | | | 367,350 | |
| | 135,000 | | | Newfield Exploration Co.,
5.625%, 7/01/2024 | | | 138,375 | |
| | 834,000 | | | Oasis Petroleum, Inc., 6.875%, 3/15/2022 | | | 798,555 | |
| | 75,000 | | | PDC Energy, Inc.,
6.125%, 9/15/2024, 144A | | | 77,625 | |
| | 580,000 | | | QEP Resources, Inc., 5.250%, 5/01/2023 | | | 571,300 | |
| | 220,000 | | | QEP Resources, Inc., 5.375%, 10/01/2022 | | | 218,350 | |
| | 5,000 | | | QEP Resources, Inc., 6.875%, 3/01/2021 | | | 5,213 | |
| | 380,000 | | | Rex Energy Corp.,
(Step to 8.000% on 10/01/2017),
1.000%, 10/01/2020(g) | | | 207,100 | |
| | 660,000 | | | Rice Energy, Inc., 6.250%, 5/01/2022 | | | 681,450 | |
| | 370,000 | | | RSP Permian, Inc., 6.625%, 10/01/2022 | | | 387,575 | |
| | 200,000 | | | Sanchez Energy Corp., 6.125%, 1/15/2023 | | | 160,500 | |
| | 280,000 | | | SM Energy Co., 5.000%, 1/15/2024 | | | 263,200 | |
| | 230,000 | | | SM Energy Co., 5.625%, 6/01/2025 | | | 216,200 | |
| | 170,000 | | | SM Energy Co., 6.125%, 11/15/2022 | | | 170,000 | |
| | 135,000 | | | SM Energy Co., 6.500%, 11/15/2021 | | | 138,037 | |
| | 15,000 | | | SM Energy Co., 6.500%, 1/01/2023 | | | 15,150 | |
| | 100,000 | | | SM Energy Co., 6.750%, 9/15/2026 | | | 101,000 | |
| | 250,000 | | | Southwestern Energy Co., 6.700%, 1/23/2025 | | | 250,000 | |
| | 270,000 | | | Whiting Petroleum Corp., 5.000%, 3/15/2019 | | | 261,225 | |
| | 755,000 | | | Whiting Petroleum Corp., 5.750%, 3/15/2021 | | | 705,925 | |
| | | | | | | | |
| | | | | | | 10,968,072 | |
| | | | | | | | |
| | | | Industrial Other – 0.1% | |
| | 130,000 | | | Broadspectrum Ltd.,
8.375%, 5/15/2020, 144A | | | 138,450 | |
| | | | | | | | |
| | | | Life Insurance – 0.3% | |
| | 430,000 | | | CNO Financial Group, Inc.,
5.250%, 5/30/2025 | | | 426,775 | |
| | | | | | | | |
| | | | Lodging – 0.4% | |
| | 115,000 | | | Hilton Domestic Operating Co., Inc.,
4.250%, 9/01/2024, 144A | | | 117,300 | |
| | 400,000 | | | Hilton Worldwide Finance LLC/Hilton Worldwide Finance Corp.,
5.625%, 10/15/2021 | | | 412,000 | |
| | | | | | | | |
| | | | | | | 529,300 | |
| | | | | | | | |
| | | | Media Entertainment – 1.6% | |
| | 660,000 | | | AMC Networks, Inc., 4.750%, 12/15/2022 | | | 668,250 | |
| | 830,000 | | | Clear Channel Worldwide Holdings, Inc., 7.625%, 3/15/2020 | | | 822,737 | |
| | 85,000 | | | Clear Channel Worldwide Holdings, Inc.,
Series A, 6.500%, 11/15/2022 | | | 85,638 | |
| | 540,000 | | | Clear Channel Worldwide Holdings, Inc.,
Series B, 6.500%, 11/15/2022 | | | 562,275 | |
| | 45,000 | | | Outfront Media Capital LLC/Outfront Media Capital Corp., 5.250%, 2/15/2022 | | | 46,800 | |
| | | | | | | | |
| | | | | | | 2,185,700 | |
| | | | | | | | |
See accompanying notes to financial statements.
| 12
Portfolio of Investments – as of September 30, 2016
Loomis Sayles High Income Opportunities Fund – continued
| | | | | | | | |
Principal
Amount | | | Description | | Value (†) | |
| |
| | Bonds and Notes – continued | | | | |
| |
| | | | Metals & Mining – 3.3% | |
| $ | 405,000 | | | Alcoa, Inc., 5.125%, 10/01/2024 | | $ | 430,819 | |
| | 235,000 | | | Alcoa, Inc., 5.900%, 2/01/2027 | | | 251,450 | |
| | 50,000 | | | Alcoa, Inc., 6.750%, 1/15/2028 | | | 54,625 | |
| | 390,000 | | | Anglo American Capital PLC,
4.125%, 9/27/2022, 144A | | | 386,100 | |
| | 395,000 | | | Anglo American Capital PLC,
4.875%, 5/14/2025, 144A | | | 402,900 | |
| | 150,000 | | | ArcelorMittal, 7.750%, 3/01/2041 | | | 156,375 | |
| | 930,000 | | | ArcelorMittal, 8.000%, 10/15/2039 | | | 1,004,400 | |
| | 160,000 | | | Essar Steel Algoma, Inc.,
9.500%, 11/15/2019, 144A(d)(e)(f) | | | 21,600 | |
| | 175,000 | | | First Quantum Minerals Ltd.,
7.000%, 2/15/2021, 144A | | | 156,625 | |
| | 355,000 | | | First Quantum Minerals Ltd.,
7.250%, 5/15/2022, 144A | | | 314,175 | |
| | 870,000 | | | Freeport-McMoRan, Inc., 4.550%, 11/14/2024 | | | 788,437 | |
| | 75,000 | | | Freeport-McMoRan, Inc., 5.450%, 3/15/2043 | | | 60,187 | |
| | 165,000 | | | Glencore Finance Canada Ltd., 5.550%, 10/25/2042, 144A | | | 159,384 | |
| | 340,000 | | | Lundin Mining Corp., 7.500%, 11/01/2020, 144A | | | 361,250 | |
| | | | | | | | |
| | | | | | | 4,548,327 | |
| | | | | | | | |
| | | | Midstream – 5.2% | |
| | 365,000 | | | Access Midstream Partners LP/ACMP Finance Corp., 4.875%, 3/15/2024 | | | 368,910 | |
| | 120,000 | | | Gibson Energy, Inc.,
6.750%, 7/15/2021, 144A | | | 122,700 | |
| | 55,000 | | | Kinder Morgan Energy Partners LP,
3.450%, 2/15/2023 | | | 54,827 | |
| | 80,000 | | | Kinder Morgan Energy Partners LP,
3.500%, 9/01/2023 | | | 80,125 | |
| | 35,000 | | | Kinder Morgan Energy Partners LP,
4.700%, 11/01/2042 | | | 32,286 | |
| | 150,000 | | | MPLX LP, 4.500%, 7/15/2023 | | | 152,914 | |
| | 430,000 | | | MPLX LP, 4.875%, 12/01/2024 | | | 444,760 | |
| | 340,000 | | | NGL Energy Partners LP/NGL Energy Finance Corp., 5.125%, 7/15/2019 | | | 321,300 | |
| | 375,000 | | | NGL Energy Partners LP/NGL Energy Finance Corp., 6.875%, 10/15/2021 | | | 355,312 | |
| | 195,000 | | | Regency Energy Partners LP/Regency Energy Finance Corp.,
4.500%, 11/01/2023 | | | 196,313 | |
| | 175,000 | | | Regency Energy Partners LP/Regency Energy Finance Corp., 5.750%, 9/01/2020 | | | 190,004 | |
| | 130,000 | | | Regency Energy Partners LP/Regency Energy Finance Corp., 5.875%, 3/01/2022 | | | 143,348 | |
| | 160,000 | | | Rose Rock Midstream LP/Rose Rock Finance Corp., 5.625%, 7/15/2022 | | | 147,200 | |
| | 175,000 | | | Rose Rock Midstream LP/Rose Rock Finance Corp., 5.625%, 11/15/2023 | | | 159,250 | |
| | 825,000 | | | Sabine Pass Liquefaction LLC,
5.625%, 2/01/2021 | | | 871,406 | |
| | 160,000 | | | Sabine Pass Liquefaction LLC,
5.625%, 4/15/2023 | | | 170,800 | |
| | 335,000 | | | Sabine Pass Liquefaction LLC,
5.625%, 3/01/2025 | | | 360,125 | |
| | 195,000 | | | Sabine Pass Liquefaction LLC,
6.250%, 3/15/2022 | | | 213,038 | |
| |
| | | | Midstream – continued | |
| 985,000 | | | Targa Resources Partners LP/Targa Resources Partners Finance Corp., 4.125%, 11/15/2019 | | | 998,790 | |
| | 50,000 | | | Targa Resources Partners LP/Targa Resources Partners Finance Corp.,
4.250%, 11/15/2023 | | | 48,313 | |
| | 670,000 | | | Targa Resources Partners LP/Targa Resources Partners Finance Corp.,
5.250%, 5/01/2023 | | | 678,375 | |
| | 105,000 | | | Targa Resources Partners LP/Targa Resources Partners Finance Corp.,
6.375%, 8/01/2022 | | | 108,675 | |
| | 15,000 | | | Targa Resources Partners LP/Targa Resources Partners Finance Corp.,
6.875%, 2/01/2021 | | | 15,488 | |
| | 80,000 | | | Tesoro Logistics LP/Tesoro Logistics Finance Corp., 5.500%, 10/15/2019 | | | 85,200 | |
| | 525,000 | | | Tesoro Logistics LP/Tesoro Logistics Finance Corp., 6.250%, 10/15/2022 | | | 560,437 | |
| | 135,000 | | | Western Refining Logistics LP/WNRL Finance Corp., 7.500%, 2/15/2023 | | | 138,375 | |
| | | | | | | | |
| | | | | | | 7,018,271 | |
| | | | | | | | |
| | | | Non-Agency Commercial Mortgage-Backed Securities – 1.4% | |
| | 590,000 | | | BXHTL Mortgage Trust,
Series 2015-DRMZ, Class M,
8.717%, 5/15/2020, 144A(b)(e)(f) | | | 573,514 | |
| | 650,000 | | | GS Mortgage Securities Trust,
Series 2007-GG10, Class AM,
5.988%, 8/10/2045(b) | | | 625,643 | |
| | 385,000 | | | Hilton USA Trust,
Series 2013-HLT, Class EFX,
5.609%, 11/05/2030, 144A(b) | | | 385,594 | |
| | 250,000 | | | Morgan Stanley Capital I Trust,
Series 2007-HQ12, Class AM,
5.902%, 4/12/2049(b) | | | 250,792 | |
| | | | | | | | |
| | | | | | | 1,835,543 | |
| | | | | | | | |
| | | | Oil Field Services – 0.5% | |
| | 60,000 | | | Diamond Offshore Drilling, Inc.,
4.875%, 11/01/2043 | | | 41,636 | |
| | 370,000 | | | Ensco PLC, 5.750%, 10/01/2044 | | | 225,953 | |
| | 20,000 | | | Global Marine, Inc., 7.000%, 6/01/2028 | | | 14,000 | |
| | 90,000 | | | Noble Holding International Ltd.,
5.250%, 3/15/2042 | | | 50,850 | |
| | 185,000 | | | Noble Holding International Ltd.,
6.050%, 3/01/2041 | | | 109,150 | |
| | 155,000 | | | Paragon Offshore PLC,
6.750%, 7/15/2022, 144A(d) | | | 43,013 | |
| | 310,000 | | | Paragon Offshore PLC,
7.250%, 8/15/2024, 144A(d) | | | 86,025 | |
| | 15,000 | | | Parker Drilling Co., 6.750%, 7/15/2022 | | | 11,625 | |
| | 85,000 | | | Rowan Cos., Inc., 5.850%, 1/15/2044 | | | 58,438 | |
| | | | | | | | |
| | | | | | | 640,690 | |
| | | | | | | | |
| | | | Packaging – 1.3% | |
| | 330,000 | | | ARD Finance S.A., PIK,
7.125%, 9/15/2023, 144A(h) | | | 328,350 | |
| | 345,000 | | | Ardagh Packaging Finance PLC/Ardagh MP Holdings USA, Inc.,
4.625%, 5/15/2023, 144A | | | 346,725 | |
See accompanying notes to financial statements.
13 |
Portfolio of Investments – as of September 30, 2016
Loomis Sayles High Income Opportunities Fund – continued
| | | | | | | | |
Principal
Amount | | | Description | | Value (†) | |
| |
| | Bonds and Notes – continued | | | | |
| |
| | | | Packaging – continued | |
| $ | 350,000 | | | Ardagh Packaging Finance PLC/Ardagh MP Holdings USA, Inc.,
7.250%, 5/15/2024, 144A | | $ | 372,750 | |
| | 325,000 | | | Reynolds Group Issuer, Inc./Reynolds Group Issuer LLC/Reynolds Group Issuer (Luxembourg) S.A., 8.250%, 2/15/2021 | | | 338,812 | |
| | 360,000 | | | Signode Industrial Group Lux S.A./Signode Industrial Group U.S., Inc.,
6.375%, 5/01/2022, 144A | | | 364,500 | |
| | | | | | | | |
| | | | | | | 1,751,137 | |
| | | | | | | | |
| | | | Pharmaceuticals – 2.3% | |
| | 200,000 | | | Grifols Worldwide Operations Ltd.,
5.250%, 4/01/2022 | | | 207,000 | |
| | 1,065,000 | | | Valeant Pharmaceuticals International,
6.375%, 10/15/2020, 144A | | | 998,437 | |
| | 375,000 | | | Valeant Pharmaceuticals International, 7.250%, 7/15/2022, 144A | | | 347,812 | |
| | 95,000 | | | Valeant Pharmaceuticals International, Inc., 5.500%, 3/01/2023, 144A | | | 81,225 | |
| | 115,000 | | | Valeant Pharmaceuticals International, Inc., 5.625%, 12/01/2021, 144A | | | 102,638 | |
| | 1,390,000 | | | Valeant Pharmaceuticals International, Inc., 5.875%, 5/15/2023, 144A | | | 1,198,875 | |
| | 15,000 | | | Valeant Pharmaceuticals International, Inc., 6.750%, 8/15/2018, 144A | | | 15,075 | |
| | 220,000 | | | VRX Escrow Corp.,
5.375%, 3/15/2020, 144A | | | 203,500 | |
| | | | | | | | |
| | | | | | | 3,154,562 | |
| | | | | | | | |
| | | | Property & Casualty Insurance – 0.4% | |
| | 555,000 | | | HUB International Ltd.,
7.875%, 10/01/2021, 144A | | | 566,100 | |
| | | | | | | | |
| | | | Refining – 0.3% | |
| | 335,000 | | | Ultrapar International S.A.,
5.250%, 10/06/2026, 144A | | | 332,487 | |
| | 115,000 | | | Western Refining, Inc.,
6.250%, 4/01/2021 | | | 113,563 | |
| | | | | | | | |
| | | | | | | 446,050 | |
| | | | | | | | |
| | | | REITs – Hotels – 0.3% | |
| | 385,000 | | | Felcor Lodging LP, 5.625%, 3/01/2023 | | | 395,588 | |
| | | | | | | | |
| | | | Retailers – 1.4% | |
| | 480,000 | | | Dillard’s, Inc., 7.000%, 12/01/2028 | | | 549,571 | |
| | 75,000 | | | Dillard’s, Inc., 7.875%, 1/01/2023 | | | 90,094 | |
| | 280,000 | | | Foot Locker, Inc., 8.500%, 1/15/2022 | | | 330,400 | |
| | 160,000 | | | GameStop Corp.,
5.500%, 10/01/2019, 144A | | | 163,400 | |
| | 125,000 | | | Group 1 Automotive, Inc.,
5.000%, 6/01/2022 | | | 125,390 | |
| | 535,000 | | | Group 1 Automotive, Inc.,
5.250%, 12/15/2023, 144A | | | 537,006 | |
| | 40,000 | | | J.C. Penney Corp., Inc., 5.750%, 2/15/2018 | | | 41,400 | |
| | 225,000 | | | Nine West Holdings, Inc., 6.125%, 11/15/2034 | | | 29,250 | |
| | | | | | | | |
| | | | | | | 1,866,511 | |
| | | | | | | | |
| |
| | | | Supermarkets – 1.3% | |
| 730,000 | | | Albertsons Cos. LLC/Safeway, Inc./New Albertson’s/Albertson’s LLC,
5.750%, 3/15/2025, 144A | | | 728,175 | |
| | 415,000 | | | KeHE Distributors LLC/KeHE Finance Corp., 7.625%, 8/15/2021, 144A | | | 411,888 | |
| | 5,000 | | | New Albertson’s, Inc.,
7.450%, 8/01/2029 | | | 4,900 | |
| | 10,000 | | | New Albertson’s, Inc.,
8.700%, 5/01/2030 | | | 10,150 | |
| | 615,000 | | | New Albertson’s, Inc.,
Series C, MTN, 6.625%, 6/01/2028 | | | 565,800 | |
| | | | | | | | |
| | | | | | | 1,720,913 | |
| | | | | | | | |
| | | | Technology – 8.1% | |
| | 110,000 | | | ACI Worldwide, Inc.,
6.375%, 8/15/2020, 144A | | | 113,713 | |
| | 2,305,000 | | | Alcatel-Lucent USA, Inc.,
6.450%, 3/15/2029 | | | 2,549,906 | |
| | 290,000 | | | Alcatel-Lucent USA, Inc.,
6.500%, 1/15/2028 | | | 316,100 | |
| | 251,000 | | | Blackboard, Inc.,
7.750%, 11/15/2019, 144A | | | 247,235 | |
| | 135,000 | | | Camelot Finance S.A.,
7.875%, 10/15/2024, 144A | | | 139,219 | |
| | 70,000 | | | CommScope Technologies Finance LLC, 6.000%, 6/15/2025, 144A | | | 74,638 | |
| | 140,000 | | | CommScope, Inc.,
5.000%, 6/15/2021, 144A | | | 144,900 | |
| | 165,000 | | | Diamond 1 Finance Corp./Diamond 2 Finance Corp.,
5.875%, 6/15/2021, 144A | | | 175,308 | |
| | 1,265,000 | | | Diamond 1 Finance Corp./Diamond 2 Finance Corp.,
6.020%, 6/15/2026, 144A | | | 1,386,823 | |
| | 475,000 | | | Diamond 1 Finance Corp./Diamond 2 Finance Corp.,
7.125%, 6/15/2024, 144A | | | 522,428 | |
| | 150,000 | | | Equinix, Inc., 5.375%, 1/01/2022 | | | 158,625 | |
| | 140,000 | | | Equinix, Inc., 5.375%, 4/01/2023 | | | 146,825 | |
| | 695,000 | | | First Data Corp.,
7.000%, 12/01/2023, 144A | | | 734,962 | |
| | 330,000 | | | IMS Health, Inc.,
5.000%, 10/15/2026, 144A | | | 343,200 | |
| | 320,000 | | | Micron Technology, Inc.,
5.250%, 1/15/2024, 144A | | | 307,200 | |
| | 175,000 | | | Microsemi Corp.,
9.125%, 4/15/2023, 144A | | | 199,500 | |
| | 190,000 | | | MSCI, Inc., 5.250%, 11/15/2024, 144A | | | 201,144 | |
| | 675,000 | | | NXP BV/NXP Funding LLC,
4.625%, 6/15/2022, 144A | | | 729,000 | |
| | 655,000 | | | Open Text Corp.,
5.625%, 1/15/2023, 144A | | | 668,100 | |
| | 20,000 | | | Open Text Corp.,
5.875%, 6/01/2026, 144A | | | 20,925 | |
| | 575,000 | | | Sabre GLBL, Inc.,
5.250%, 11/15/2023, 144A | | | 585,062 | |
| | 235,000 | | | Sabre GLBL, Inc.,
5.375%, 4/15/2023, 144A | | | 241,462 | |
| | 205,000 | | | Western Digital Corp.,
7.375%, 4/01/2023, 144A | | | 225,500 | |
| | 660,000 | | | Western Digital Corp.,
10.500%, 4/01/2024, 144A | | | 765,600 | |
| | | | | | | | |
| | | | | | | 10,997,375 | |
| | | | | | | | |
See accompanying notes to financial statements.
| 14
Portfolio of Investments – as of September 30, 2016
Loomis Sayles High Income Opportunities Fund – continued
| | | | | | | | |
Principal
Amount | | | Description | | Value (†) | |
| |
| | Bonds and Notes – continued | | | | |
| |
| | | | Transportation Services – 0.3% | |
| $ | 185,000 | | | APL Ltd., 8.000%, 1/15/2024(e)(f) | | $ | 122,100 | |
| | 5,521 | | | Atlas Air Pass Through Trust,
Series 1998-1, Class B, 7.680%, 1/02/2018(c) | | | 5,617 | |
| | 105,279 | | | Atlas Air Pass Through Trust, Series 1998-1, Class C, 8.010%, 7/02/2011(c)(i) | | | 107,648 | |
| | 115,000 | | | Avis Budget Car Rental LLC/Avis Budget Finance, Inc., 5.125%, 6/01/2022, 144A | | | 115,359 | |
| | | | | | | | |
| | | | | | | 350,724 | |
| | | | | | | | |
| | | | Wireless – 3.4% | |
| | 220,000 | | | Altice Luxembourg S.A.,
7.625%, 2/15/2025, 144A | | | 225,500 | |
| | 970,000 | | | Altice Luxembourg S.A.,
7.750%, 5/15/2022, 144A | | | 1,035,475 | |
| | 690,000 | | | SFR Group S.A.,
6.000%, 5/15/2022, 144A | | | 703,800 | |
| | 496,000 | | | Sprint Capital Corp., 6.875%, 11/15/2028 | | | 465,620 | |
| | 1,205,000 | | | Sprint Corp., 7.250%, 9/15/2021 | | | 1,209,519 | |
| | 585,000 | | | T-Mobile USA, Inc., 6.125%, 1/15/2022 | | | 621,562 | |
| | 395,000 | | | Wind Acquisition Finance S.A.,
4.750%, 7/15/2020, 144A | | | 397,963 | |
| | | | | | | | |
| | | | | | | 4,659,439 | |
| | | | | | | | |
| | | | Wirelines – 2.9% | |
| | 20,000 | | | CenturyLink, Inc., 5.625%, 4/01/2020 | | | 21,150 | |
| | 245,000 | | | CenturyLink, Inc., 6.450%, 6/15/2021 | | | 262,456 | |
| | 25,000 | | | CenturyLink, Inc.,
Series W, 6.750%, 12/01/2023 | | | 26,000 | |
| | 220,000 | | | Cincinnati Bell Telephone Co. LLC,
6.300%, 12/01/2028 | | | 209,275 | |
| | 15,000 | | | Frontier Communications Corp.,
7.000%, 11/01/2025 | | | 13,200 | |
| | 235,000 | | | Frontier Communications Corp.,
7.450%, 7/01/2035 | | | 188,588 | |
| | 480,000 | | | Frontier Communications Corp.,
10.500%, 9/15/2022 | | | 508,800 | |
| | 640,000 | | | Level 3 Communications, Inc.,
5.750%, 12/01/2022 | | | 668,800 | |
| | 95,000 | | | Level 3 Financing, Inc., 5.125%, 5/01/2023 | | | 97,850 | |
| | 645,000 | | | Level 3 Financing, Inc.,
5.250%, 3/15/2026, 144A | | | 665,962 | |
| | 110,000 | | | Level 3 Financing, Inc., 5.375%, 8/15/2022 | | | 114,950 | |
| | 35,000 | | | Level 3 Financing, Inc., 5.375%, 5/01/2025 | | | 36,488 | |
| | 480,000 | | | Qwest Capital Funding, Inc.,
6.875%, 7/15/2028 | | | 453,600 | |
| | 5,000 | | | Telecom Italia Capital S.A.,
6.000%, 9/30/2034 | | | 4,951 | |
| | 320,000 | | | Telecom Italia Capital S.A.,
7.200%, 7/18/2036 | | | 340,800 | |
| | 290,000 | | | Telecom Italia Capital S.A.,
7.721%, 6/04/2038 | | | 317,550 | |
| | | | | | | | |
| | | | | | | 3,930,420 | |
| | | | | | | | |
| | |
| | | | Total Non-Convertible Bonds | | | | |
| | | | (Identified Cost $115,529,927) | | | 119,205,388 | |
| | | | | | | | |
| |
| | Convertible Bonds – 3.2% | | | | |
| |
| | | | Building Materials – 0.1% | |
| 80,000 | | | CalAtlantic Group, Inc., 0.250%, 6/01/2019 | | | 74,100 | |
| | | | | | | | |
| | | | Diversified Operations – 0.4% | |
| | 485,000 | | | RWT Holdings, Inc., 5.625%, 11/15/2019 | | | 491,062 | |
| | | | | | | | |
| | | | Healthcare – 0.3% | |
| | 400,000 | | | Brookdale Senior Living, Inc.,
2.750%, 6/15/2018 | | | 397,250 | |
| | | | | | | | |
| | | | Leisure – 0.4% | |
| | 590,000 | | | Rovi Corp., 0.500%, 3/01/2020 | | | 587,953 | |
| | | | | | | | |
| | | | Media Entertainment – 0.2% | |
| | 205,000 | | | Liberty Media Corp.,
2.250%, 9/30/2046, 144A | | | 212,816 | |
| | | | | | | | |
| | | | Metals & Mining – 0.0% | |
| | 40,000 | | | RTI International Metals, Inc.,
1.625%, 10/15/2019 | | | 42,650 | |
| | | | | | | | |
| | | | Midstream – 0.1% | |
| | 170,000 | | | Whiting Petroleum Corp.,
Series 2, 1.250%, 6/05/2020 | | | 163,200 | |
| | | | | | | | |
| | | | Pharmaceuticals – 0.8% | |
| | 481,000 | | | BioMarin Pharmaceutical, Inc.,
1.500%, 10/15/2020 | | | 599,747 | |
| | 600,000 | | | Ionis Pharmaceuticals, Inc.,
1.000%, 11/15/2021 | | | 558,375 | |
| | | | | | | | |
| | | | | | | 1,158,122 | |
| | | | | | | | |
| | | | Technology – 0.9% | |
| | 20,000 | | | Advanced Micro Devices, Inc.,
2.125%, 9/01/2026 | | | 21,750 | |
| | 220,000 | | | Cypress Semiconductor Corp.,
4.500%, 1/15/2022, 144A | | | 248,737 | |
| | 145,000 | | | Micron Technology, Inc., Series G,
3.000%, 11/15/2043 | | | 128,869 | |
| | 695,000 | | | Nuance Communications, Inc., 1.000%, 12/15/2035, 144A | | | 604,650 | |
| | 165,000 | | | Viavi Solutions, Inc., 0.625%, 8/15/2033 | | | 164,175 | |
| | | | | | | | |
| | | | | | | 1,168,181 | |
| | | | | | | | |
| | | | Total Convertible Bonds | | | | |
| | | | (Identified Cost $4,144,072) | | | 4,295,334 | |
| | | | | | | | |
| | |
| | | | Total Bonds and Notes | | | | |
| | | | (Identified Cost $119,673,999) | | | 123,500,722 | |
| | | | | | | | |
| |
| | Senior Loans – 0.4% | | | | |
| |
| | | | Chemicals – 0.1% | |
| | 153,036 | | | Chemours Co. (The), Term Loan B,
3.750%, 5/12/2022(b) | | | 151,410 | |
| | | | | | | | |
| | | | Independent Energy – 0.3% | |
| | 407,467 | | | Chesapeake Energy Corp.,
Term Loan, 8/23/2021(j) | | | 427,458 | |
| | | | | | | | |
| | |
| | | | Total Senior Loans | | | | |
| | | | (Identified Cost $559,887) | | | 578,868 | |
| | | | | | | | |
See accompanying notes to financial statements.
15 |
Portfolio of Investments – as of September 30, 2016
Loomis Sayles High Income Opportunities Fund – continued
| | | | | | | | |
Shares | | | Description | | Value (†) | |
| |
| | Preferred Stocks – 2.2% | | | | |
| |
| | | | Food & Beverage – 0.2% | |
| | 3,002 | | | Bunge Ltd., 4.875% | | $ | 285,512 | |
| | | | | | | | |
| | | | Midstream – 0.3% | |
| | 641 | | | Chesapeake Energy Corp., 5.750%(k) | | | 338,929 | |
| | 13 | | | Chesapeake Energy Corp., 5.750%, 144A(k) | | | 6,874 | |
| | 90 | | | Chesapeake Energy Corp., 5.750%(k) | | | 46,856 | |
| | | | | | | | |
| | | | | | | 392,659 | |
| | | | | | | | |
| | | | Pharmaceuticals – 1.4% | |
| | 1,174 | | | Allergan PLC, Series A, 5.500% | | | 964,594 | |
| | 1,131 | | | Teva Pharmaceutical Industries Ltd., 7.000% | | | 915,657 | |
| | | | | | | | |
| | | | | | | 1,880,251 | |
| | | | | | | | |
| | | | Technology – 0.3% | |
| | 3,780 | | | Belden, Inc., 6.750% | | | 379,625 | |
| | | | | | | | |
| | |
| | | | Total Preferred Stocks | | | | |
| | | | (Identified Cost $3,313,335) | | | 2,938,047 | |
| | | | | | | | |
| |
| | Common Stocks – 0.3% | | | | |
| |
| | | | Energy Equipment & Services – 0.0% | |
| | 2,515 | | | Hercules Offshore, Inc.(k) | | | 4,351 | |
| | | | | | | | |
| | | | Oil, Gas & Consumable Fuels – 0.1% | |
| | 8,051 | | | Halcon Resources Corp.(k) | | | 75,519 | |
| | 5,700 | | | Rex Energy Corp.(k) | | | 3,328 | |
| | 7,845 | | | Whiting Petroleum Corp.(k) | | | 68,565 | |
| | | | | | | | |
| | | | | | | 147,412 | |
| | | | | | | | |
| | | | Pharmaceuticals – 0.2% | |
| | 4,298 | | | Bristol-Myers Squibb Co. | | | 231,748 | |
| | | | | | | | |
| | |
| | | | Total Common Stocks | | | | |
| | | | (Identified Cost $1,133,319) | | | 383,511 | |
| | | | | | | | |
| |
| | Warrants – 0.0% | | | | |
| | 2,186 | | | Halcon Resources Corp., Expiration on
9/9/2020 at $14.04(c)(k) | | | 3,336 | |
| | 1,657 | | | FairPoint Communications, Inc., Expiration on
1/24/2018 at $48.81(c)(e)(k) | | | — | |
| | | | | | | | |
| | |
| | | | Total Warrants | | | | |
| | | | (Identified Cost $—) | | | 3,336 | |
| | | | | | | | |
Principal
Amount | | | Description | | Value (†) | |
| |
| | Short-Term Investments – 5.4% | | | | |
| $ | 7,290,248 | | | Tri-Party Repurchase Agreement with Fixed Income Clearing Corporation, dated 9/30/2016 at 0.030% to be repurchased at $7,290,266 on 10/03/2016 collateralized by $7,355,000 U.S. Treasury Note, 1.500% due 3/31/2023 valued at $7,437,744 including accrued interest (Note 2 of Notes to Financial Statements) (Identified Cost $7,290,248) | | $ | 7,290,248 | |
| | | | | | | | |
| | |
| | | | Total Investments – 99.3% | | | | |
| | | | (Identified Cost $131,970,788)(a) | | | 134,694,732 | |
| | | | Other assets less liabilities—0.7% | | | 1,010,956 | |
| | | | | | | | |
| | |
| | | | Net Assets – 100.0% | | $ | 135,705,688 | |
| | | | | | | | |
| |
| | (†) | | | See Note 2 of Notes to Financial Statements. | |
| | (a) | | | Federal Tax Information: | |
| | | | At September 30, 2016, the net unrealized appreciation on investments based on a cost of $132,149,831 for federal income tax purposes was as follows: | |
| | | | Aggregate gross unrealized appreciation for all investments in which there is an excess of value over tax cost | | $ | 6,360,115 | |
| | | | Aggregate gross unrealized depreciation for all investments in which there is an excess of tax cost over value | | | (3,815,214 | ) |
| | | | | | | | |
| | | | Net unrealized appreciation | | $ | 2,544,901 | |
| | | | | | | | |
| | (b) | | | Variable rate security. Rate as of September 30, 2016 is disclosed. | |
| | (c) | | | Fair valued by the Fund’s adviser. At September 30, 2016, the value of these securities amounted to $116,605 or 0.1% of net assets. See Note 2 of Notes to Financial Statements. | |
| | (d) | | | The issuer is in default with respect to interest and/or principal payments. Income is not being accrued. | |
| | (e) | | | Illiquid security. (Unaudited) | |
| | (f) | | | Securities classified as fair valued pursuant to the Fund’s pricing policies and procedures. At September 30, 2016, the value of these securities amounted to $899,214 or 0.7% of net assets. See Note 2 of Notes to Financial Statements. | |
| | (g) | | | Coupon rate is a fixed rate for an initial period then resets at a specified date and rate. | |
| | (h) | | | Payment-in-kind security for which the issuer has the option at each interest payment date of making interest payments in cash or additional debt securities. For the period ended September 30, 2016, the issuer has not made any interest payments. | |
| | (i) | | | Maturity has been extended under the terms of a plan of reorganization. | |
| | (j) | | | Position is unsettled. Contract rate was not determined at September 30, 2016 and does not take effect until settlement date. Maturity date is not finalized until settlement date. | |
| | (k) | | | Non-income producing security. | |
| |
| | 144A | | | All or a portion of these securities are exempt from registration under Rule 144A of the Securities Act of 1933. These securities may be resold in transactions exempt from registration, normally to qualified institutional buyers. At September 30, 2016, the value of Rule 144A holdings amounted to $48,201,840 or 35.5% of net assets. | |
| | ABS | | | Asset-Backed Securities | | | | |
| | MTN | | | Medium Term Note | | | | |
| | PIK | | | Payment-in-Kind | | | | |
| | REITs | | | Real Estate Investment Trusts | | | | |
See accompanying notes to financial statements.
| 16
Portfolio of Investments – as of September 30, 2016
Loomis Sayles High Income Opportunities Fund – continued
Industry Summary at September 30, 2016
| | | | |
Technology | | | 9.3 | % |
Independent Energy | | | 8.4 | |
Cable Satellite | | | 7.7 | |
Finance Companies | | | 6.2 | |
Midstream | | | 5.6 | |
Pharmaceuticals | | | 4.7 | |
Banking | | | 4.6 | |
Healthcare | | | 4.6 | |
Wireless | | | 3.4 | |
Metals & Mining | | | 3.3 | |
Wirelines | | | 2.9 | |
Aerospace & Defense | | | 2.9 | |
ABS Home Equity | | | 2.1 | |
Automotive | | | 2.1 | |
Airlines | | | 2.1 | |
Other Investments, less than 2% each | | | 24.0 | |
Short-Term Investments | | | 5.4 | |
| | | | |
Total Investments | | | 99.3 | |
Other assets less liabilities | | | 0.7 | |
| | | | |
Net Assets | | | 100.0 | % |
| | | | |
See accompanying notes to financial statements.
17 |
Portfolio of Investments – as of September 30, 2016
Loomis Sayles Securitized Asset Fund
| | | | | | | | |
Principal
Amount | | | Description | | Value (†) | |
| |
| | Bonds and Notes – 121.1% of Net Assets | | | | |
| | |
| | | | ABS Car Loan – 12.6% | | | | |
| $ | 1,070,000 | | | AmeriCredit Automobile Receivables Trust, Series 2014-2, Class B, 1.600%, 7/08/2019 | | $ | 1,072,108 | |
| | 3,700,000 | | | AmeriCredit Automobile Receivables Trust, Series 2014-4, Class C,
2.470%, 11/09/2020(b) | | | 3,754,745 | |
| | 1,840,000 | | | AmeriCredit Automobile Receivables Trust, Series 2015-2, Class C, 2.400%, 1/08/2021 | | | 1,862,442 | |
| | 1,275,000 | | | AmeriCredit Automobile Receivables Trust, Series 2015-3, Class C, 2.730%, 3/08/2021 | | | 1,300,848 | |
| | 1,440,000 | | | AmeriCredit Automobile Receivables Trust, Series 2016-2, Class C, 2.870%, 11/08/2021 | | | 1,477,596 | |
| | 645,000 | | | Avis Budget Rental Car Funding AESOP LLC, Series 2013-1A, Class B,
2.620%, 9/20/2019, 144A | | | 645,362 | |
| | 2,630,000 | | | Avis Budget Rental Car Funding AESOP LLC, Series 2014-1A, Class A,
2.460%, 7/20/2020, 144A(b) | | | 2,656,672 | |
| | 300,000 | | | Avis Budget Rental Car Funding AESOP LLC, Series 2014-2A, Class A,
2.500%, 2/20/2021, 144A | | | 303,054 | |
| | 4,395,000 | | | Avis Budget Rental Car Funding AESOP LLC, Series 2015-1A, Class A,
2.500%, 7/20/2021, 144A(b) | | | 4,438,835 | |
| | 2,430,000 | | | California Republic Auto Receivables Trust, Series 2016-2, Class B,
2.520%, 5/16/2022 | | | 2,431,192 | |
| | 25,923 | | | CarFinance Capital Auto Trust, Series 2014-1A, Class A, 1.460%, 12/17/2018, 144A | | | 25,923 | |
| | 3,082,555 | | | CarFinance Capital Auto Trust, Series 2014-2A, Class A, 1.440%, 11/16/2020, 144A(b) | | | 3,078,793 | |
| | 1,835,000 | | | CarNow Auto Receivables Trust, Series 2015-1A, Class C, 3.880%, 4/15/2020, 144A | | | 1,845,086 | |
| | 2,845,660 | | | Centre Point Funding LLC, Series 2012-2A, Class 1, 2.610%, 8/20/2021, 144A | | | 2,823,484 | |
| | 109,349 | | | CPS Auto Receivables Trust, Series 2013-D, Class A, 1.540%, 7/16/2018, 144A | | | 109,396 | |
| | 4,000,000 | | | CPS Auto Receivables Trust, Series 2014-C, Class B, 2.670%, 8/17/2020, 144A(b) | | | 4,044,616 | |
| | 2,225,000 | | | CPS Auto Receivables Trust, Series 2014-D, Class C, 4.350%, 11/16/2020, 144A | | | 2,253,722 | |
| | 1,610,000 | | | CPS Auto Receivables Trust, Series 2015-B, Class C, 4.200%, 5/17/2021, 144A | | | 1,627,068 | |
| | 1,745,000 | | | CPS Auto Receivables Trust, Series 2016-A, Class D, 5.000%, 12/15/2021, 144A | | | 1,771,282 | |
| | 450,000 | | | Credit Acceptance Auto Loan Trust, Series 2014-1A, Class B, 2.290%, 4/15/2022, 144A | | | 450,866 | |
| | |
| | | | ABS Car Loan – continued | | | | |
| $ | 3,240,000 | | | Credit Acceptance Auto Loan Trust,
Series 2014-2A, Class A,
1.880%, 3/15/2022, 144A(b) | | $ | 3,246,242 | |
| | 4,000,000 | | | Credit Acceptance Auto Loan Trust,
Series 2015-1A, Class B,
2.610%, 1/17/2023, 144A(b) | | | 4,022,945 | |
| | 6,770,000 | | | Credit Acceptance Auto Loan Trust, Series 2016-2A, Class B, 3.180%, 5/15/2024, 144A | | | 6,883,454 | |
| | 5,680,000 | | | Drive Auto Receivables Trust, Series 2015-BA, Class C, 2.760%, 7/15/2021, 144A(b) | | | 5,727,389 | |
| | 1,900,000 | | | Drive Auto Receivables Trust, Series 2015-DA, Class C, 3.380%, 11/15/2021, 144A | | | 1,934,981 | |
| | 2,010,000 | | | Drive Auto Receivables Trust, Series 2016-AA, Class C, 3.910%, 5/17/2021, 144A | | | 2,060,388 | |
| | 1,806,744 | | | DT Auto Owner Trust,
Series 2014-2A, Class C,
2.460%, 1/15/2020, 144A(b) | | | 1,811,657 | |
| | 1,240,000 | | | DT Auto Owner Trust,
Series 2015-2A, Class D,
4.250%, 2/15/2022, 144A | | | 1,262,905 | |
| | 2,340,000 | | | DT Auto Owner Trust,
Series 2015-3A, Class D,
4.530%, 10/17/2022, 144A | | | 2,395,480 | |
| | 5,040,000 | | | DT Auto Owner Trust,
Series 2016-4A, Class C,
2.740%, 10/17/2022, 144A | | | 5,037,047 | |
| | 1,072,420 | | | Exeter Automobile Receivables Trust, Series 2014-1A, Class B,
2.420%, 1/15/2019, 144A | | | 1,073,114 | |
| | 784,648 | | | Exeter Automobile Receivables Trust,
Series 2014-3A, Class A,
1.320%, 1/15/2019, 144A(b) | | | 783,637 | |
| | 4,200,000 | | | Exeter Automobile Receivables Trust, Series 2014-3A, Class B,
2.770%, 11/15/2019, 144A(b) | | | 4,231,856 | |
| | 2,000,000 | | | First Investors Auto Owner Trust,
Series 2014-1A, Class B,
2.260%, 1/15/2020, 144A | | | 2,008,652 | |
| | 1,915,000 | | | First Investors Auto Owner Trust,
Series 2014-2A, Class D,
3.470%, 2/15/2021, 144A | | | 1,938,234 | |
| | 956,042 | | | Flagship Credit Auto Trust,
Series 2013-1, Class B,
2.760%, 9/17/2018, 144A | | | 956,847 | |
| | 5,530,000 | | | Flagship Credit Auto Trust,
Series 2014-2, Class B,
2.840%, 11/16/2020, 144A(b) | | | 5,582,015 | |
| | 1,535,000 | | | Flagship Credit Auto Trust,
Series 2015-2B,
3.080%, 12/15/2021, 144A | | | 1,563,004 | |
| | 710,000 | | | Flagship Credit Auto Trust,
Series 2016-2, Class B,
3.840%, 9/15/2022, 144A | | | 740,297 | |
| | 1,390,000 | | | Ford Credit Auto Owner Trust/Ford Credit, Series 2014-1, Class A,
2.260%, 11/15/2025, 144A | | | 1,417,022 | |
See accompanying notes to financial statements.
| 18
Portfolio of Investments – as of September 30, 2016
Loomis Sayles Securitized Asset Fund – continued
| | | | | | | | |
Principal
Amount | | | Description | | Value (†) | |
| |
| | Bonds and Notes – continued | | | | |
| | |
| | | | ABS Car Loan – continued | | | | |
| $ | 3,900,000 | | | Ford Credit Auto Owner Trust/Ford Credit, Series 2014-2, Class A,
2.310%, 4/15/2026, 144A(b) | | $ | 3,987,283 | |
| | 3,210,000 | | | Hertz Vehicle Financing LLC, Series 2016-3A, Class A, 2.270%, 7/25/2020, 144A(b) | | | 3,212,909 | |
| | 8,605,000 | | | NextGear Floorplan Master Owner Trust, Series 2014-1A, Class A,
1.920%, 10/15/2019, 144A(b) | | | 8,581,822 | |
| | 4,415,000 | | | Prestige Auto Receivables Trust, Series 2015-1, Class A3, 1.530%, 2/15/2021, 144A(b) | | | 4,421,808 | |
| | 7,120,000 | | | Santander Drive Auto Receivables Trust, Series 2014-5, Class C,
2.460%, 6/15/2020(b) | | | 7,199,173 | |
| | 1,940,000 | | | Santander Drive Auto Receivables Trust, Series 2015-2, Class C, 2.440%, 4/15/2021 | | | 1,961,403 | |
| | 1,820,000 | | | Santander Drive Auto Receivables Trust, Series 2016-2, Class C, 2.660%, 11/15/2021 | | | 1,848,456 | |
| | 1,515,000 | | | Westlake Automobile Receivables Trust, Series 2016-1A, Class C,
3.290%, 9/15/2021, 144A | | | 1,545,553 | |
| | 2,795,000 | | | Westlake Automobile Receivables Trust, Series 2016-2A, Class C,
2.830%, 5/17/2021, 144A | | | 2,830,346 | |
| | | | | | | | |
| | | | | | | 128,239,009 | |
| | | | | | | | |
| | | | ABS Credit Card – 1.8% | |
| | 2,000,000 | | | Barclays Dryrock Issuance Trust,
Series 2015-1, Class A, 2.200%, 12/15/2022 | | | 2,045,259 | |
| | 4,975,000 | | | GE Capital Credit Card Master Note Trust, Series 2010-2, Class A, 4.470%, 3/15/2020(b) | | | 5,054,725 | |
| | 9,215,000 | | | World Financial Network Credit Card Master Trust, Series 2012-A, Class A,
3.140%, 1/17/2023(b) | | | 9,589,673 | |
| | 1,000,000 | | | World Financial Network Credit Card Master Trust, Series 2012-C, Class M,
3.320%, 8/15/2022 | | | 1,029,210 | |
| | | | | | | | |
| | | | | | | 17,718,867 | |
| | | | | | | | |
| | | | ABS Home Equity – 3.4% | |
| | 1,956,028 | | | Bayview Opportunity Master Fund Trust, Series 16-RPL3, Class A1,
3.475%, 7/28/2031, 144A(c) | | | 1,954,598 | |
| | 2,848,031 | | | Colony American Finance Ltd., Series 2015-1, Class A, 2.896%, 10/15/2047, 144A(b) | | | 2,883,121 | |
| | 1,500,000 | | | Colony American Homes,
Series 2014-1A, Class B, 1.881%, 5/17/2031, 144A(c) | | | 1,494,370 | |
| | 131,288 | | | Countrywide Alternative Loan Trust, Series 2006-J5, Class 4A1,
4.633%, 7/25/2021(c)(d) | | | 119,619 | |
| | 130,668 | | | Countrywide Asset-Backed Certificates, Series 2004-S1, Class A3,
5.115%, 2/25/2035(c) | | | 132,574 | |
| | | | | | | | |
Principal
Amount | | | Description | | Value (†) | |
| |
| | | | ABS Home Equity – continued | |
| $ | 507,947 | | | Countrywide Asset-Backed Certificates, Series 2006-S7, Class A3, 5.712%, 11/25/2035(c)(d) | | $ | 496,456 | |
| | 6,025,000 | | | Freddie Mac Structured Agency Credit Risk Debt Notes,
Series 2015-DNA1, Class M2,
2.375%, 10/25/2027(b)(c) | | | 6,128,913 | |
| | 4,098,228 | | | HarborView Mortgage Loan Trust, Series 2004-3, Class 1A,
2.834%, 5/19/2034(b)(c) | | | 4,055,555 | |
| | 2,025,000 | | | Home Partners of America Trust, Series 2016-1, Class D,
3.831%, 3/17/2033, 144A(c) | | | 2,046,089 | |
| | 1,239,115 | | | Mill City Mortgage Trust,
Series 2015-1, Class A1,
2.230%, 6/25/2056, 144A(c) | | | 1,240,839 | |
| | 743,271 | | | Mill City Mortgage Trust,
Series 2016-1, Class A1,
2.500%, 4/25/2057, 144A(c) | | | 747,431 | |
| | 154,966 | | | Morgan Stanley Mortgage Loan Trust, Series 2005-3AR, Class 5A,
2.690%, 7/25/2035(c)(d) | | | 141,560 | |
| | 1,417,000 | | | Progress Residential Trust,
Series 2015-SFR3,
4.673%, 11/12/2032, 144A | | | 1,492,058 | |
| | 105,373 | | | Residential Accredit Loans, Inc., Trust, Series 2006-QS13, Class 2A1, 5.750%, 9/25/2021(d) | | | 101,457 | |
| | 461,128 | | | Residential Accredit Loans, Inc., Trust, Series 2006-QS18, Class 3A3, 5.750%, 12/25/2021(d) | | | 424,157 | |
| | 21,049 | | | Residential Accredit Loans, Inc., Trust, Series 2006-QS6, Class 2A1, 6.000%, 6/25/2021(d) | | | 19,905 | |
| | 2,913,386 | | | Sequoia Mortgage Trust,
Series 2013-5, Class A1, 2.500%, 5/25/2043, 144A(b)(c) | | | 2,910,144 | |
| | 2,259,105 | | | Towd Point Mortgage Trust,
Series 2015-2, Class 1AE2,
2.750%, 11/25/2060, 144A(b)(c) | | | 2,286,997 | |
| | 2,336,920 | | | Towd Point Mortgage Trust,
Series 2016-3, Class A1,
2.250%, 8/25/2055, 144A(c) | | | 2,335,859 | |
| | 4,121,302 | | | WaMu Mortgage Pass Through Certificates,
Series 2007-HY2, Class 2A2,
2.925%, 11/25/2036(c) | | | 3,685,331 | |
| | | | | | | | |
| | | | | | | 34,697,033 | |
| | | | | | | | |
| | | | ABS Other – 4.4% | |
| | 1,182,657 | | | CLI Funding V LLC,
Series 2014-1A, Class A,
3.290%, 6/18/2029, 144A | | | 1,151,954 | |
| | 2,122,675 | | | DB Master Finance LLC,
Series 2015-1A, Class A2I,
3.262%, 2/20/2045, 144A | | | 2,133,713 | |
| | 986,022 | | | Diamond Resorts Owner Trust,
Series 2011-1, Class A,
4.000%, 3/20/2023, 144A | | | 986,728 | |
| | 462,709 | | | FRS I LLC, Series 2013-1A, Class A1, 1.800%, 4/15/2043, 144A | | | 453,767 | |
See accompanying notes to financial statements.
19 |
Portfolio of Investments – as of September 30, 2016
Loomis Sayles Securitized Asset Fund – continued
| | | | | | | | |
Principal
Amount | | | Description | | Value (†) | |
| |
| | Bonds and Notes – continued | | | | |
| |
| | | | ABS Other – continued | |
| $ | 408,781 | | | Global Container Assets Ltd.,
Series 2013-1A, Class A1,
2.200%, 11/05/2028, 144A | | $ | 407,999 | |
| | 9,265,000 | | | OneMain Financial Issuance Trust, Series 2015-3A, Class A, 3.630%, 11/20/2028, 144A(b) | | | 9,457,491 | |
| | 4,160,000 | | | OneMain Financial Issuance Trust, Series 2016-2A, Class B, 5.940%, 3/20/2028, 144A | | | 4,365,752 | |
| | 2,620,673 | | | Orange Lake Timeshare Trust, Series 2012-AA, Class A, 3.450%, 3/10/2027, 144A | | | 2,654,112 | |
| | 4,359,096 | | | Shenton Aircraft Investment I Ltd., Series 2015-1A, Class A, 4.750%, 10/15/2042, 144A(b) | | | 4,244,975 | |
| | 240,503 | | | Sierra Timeshare Receivables Funding LLC, Series 2011-3A, Class A,
3.370%, 7/20/2028, 144A | | | 240,960 | |
| | 469,948 | | | Sierra Timeshare Receivables Funding LLC, Series 2012-1A, Class A,
2.840%, 11/20/2028, 144A | | | 470,944 | |
| | 196,187 | | | Sierra Timeshare Receivables Funding LLC, Series 2013-1A, Class A,
1.590%, 11/20/2029, 144A | | | 195,388 | |
| | 3,045,000 | | | SpringCastle America Funding LLC, Series 2016-AA, Class A, 3.050%, 4/25/2029, 144A | | | 3,060,225 | |
| | 1,158,006 | | | Springleaf Funding Trust,
Series 2014-AA, Class A, 2.410%, 12/15/2022, 144A | | | 1,159,486 | |
| | 973,193 | | | SVO VOI Mortgage LLC,
Series 2012-AA, Class A, 2.000%, 9/20/2029, 144A | | | 962,890 | |
| | 1,620,542 | | | TAL Advantage V LLC,
Series 2014-1A, Class A,
3.510%, 2/22/2039, 144A | | | 1,593,892 | |
| | 641,865 | | | TAL Advantage V LLC,
Series 2014-2A, Class A2,
3.330%, 5/20/2039, 144A | | | 628,802 | |
| | 3,977,167 | | | TAL Advantage V LLC,
Series 2014-3A, Class A,
3.270%, 11/21/2039, 144A(b) | | | 3,876,168 | |
| | 3,847,667 | | | Textainer Marine Containers Ltd.,
Series 2014-1A, Class A,
3.270%, 10/20/2039, 144A(b) | | | 3,744,389 | |
| | 2,233,084 | | | Trip Rail Master Funding LLC,
Series 2011-1A, Class A1B,
3.024%, 7/15/2041, 144A(c) | | | 2,247,210 | |
| | 635,000 | | | Verizon Owner Trust,
Series 2016-1A, Class A,
1.420%, 1/20/2021, 144A | | | 636,461 | |
| | | | | | | | |
| | | | | | | 44,673,306 | |
| | | | | | | | |
| | | | ABS Student Loan – 2.4% | |
| | 2,570,636 | | | Panhandle-Plains Higher Education Authority, Inc.,
Series 2011-1, Class A2,
1.596%, 7/01/2024(b)(c) | | | 2,567,965 | |
| | 136,274 | | | SoFi Professional Loan Program LLC,
Series 2014-A, Class A2,
3.020%, 10/25/2027, 144A | | | 139,337 | |
| |
| | | | ABS Student Loan – continued | |
| 657,562 | | | SoFi Professional Loan Program LLC,
Series 2014-B, Class A1, 1.775%, 8/25/2032, 144A(c) | | | 663,884 | |
| | 8,085,000 | | | SoFi Professional Loan Program LLC,
Series 2015-C, Class B,
3.580%, 8/25/2036, 144A(b) | | | 8,178,915 | |
| | 3,220,000 | | | SoFi Professional Loan Program LLC,
Series 2016-B, Class A2B,
2.740%, 10/25/2032, 144A(b) | | | 3,301,291 | |
| | 9,251,805 | | | South Carolina Student Loan Corp.,
Series 2010-1, Class A2,
1.715%, 7/25/2025(b)(c) | | | 9,290,477 | |
| | | | | | | | |
| | | | | | | 24,141,869 | |
| | | | | | | | |
| | | | Agency Commercial Mortgage-Backed Securities – 5.5% | |
| | 1,663,036 | | | Federal National Mortgage Association,
Series 2015-M17, Class FA,
1.397%, 11/25/2022(c) | | | 1,668,113 | |
| | 411,703,573 | | | FHLMC Multifamily Structured Pass Through Certificates,
Series K028, Class X1,
0.471%, 2/25/2023(b)(c)(e) | | | 7,348,373 | |
| | 6,125,000 | | | FHLMC Multifamily Structured Pass Through Certificates,
Series K029, Class A2,
3.320%, 2/25/2023(b)(c) | | | 6,685,703 | |
| | 87,027,018 | | | FHLMC Multifamily Structured Pass Through Certificates,
Series K031, Class X1,
0.368%, 4/25/2023(b)(c)(e) | | | 1,204,872 | |
| | 34,979,104 | | | FHLMC Multifamily Structured Pass Through Certificates,
Series K036, Class X1,
0.918%, 10/25/2023(c)(e) | | | 1,564,024 | |
| | 12,230,097 | | | FHLMC Multifamily Structured Pass Through Certificates,
Series K038, Class X1,
1.189%, 3/25/2024(c)(e) | | | 875,557 | |
| | 39,823,955 | | | FHLMC Multifamily Structured Pass Through Certificates,
Series K040, Class X1,
0.874%, 9/25/2024(c)(e) | | | 1,942,441 | |
| | 45,961,085 | | | FHLMC Multifamily Structured Pass Through Certificates,
Series K046, Class X1,
0.501%, 3/25/2025(c)(e) | | | 1,283,436 | |
| | 75,036,905 | | | FHLMC Multifamily Structured Pass Through Certificates,
Series K047, Class X1,
0.287%, 5/25/2025(c)(e) | | | 1,012,473 | |
| | 37,633,708 | | | FHLMC Multifamily Structured Pass Through Certificates,
Series K049, Class X1,
0.741%, 7/25/2025(c)(e) | | | 1,667,407 | |
| | 21,780,335 | | | FHLMC Multifamily Structured Pass Through Certificates,
Series K050, Class X1,
0.462%, 8/25/2025(c)(e) | | | 570,342 | |
See accompanying notes to financial statements.
| 20
Portfolio of Investments – as of September 30, 2016
Loomis Sayles Securitized Asset Fund – continued
| | | | | | | | |
Principal
Amount | | | Description | | Value (†) | |
| |
| | Bonds and Notes – continued | | | | |
| |
| | | | Agency Commercial Mortgage-Backed Securities – continued | |
| $ | 23,812,440 | | | FHLMC Multifamily Structured
Pass Through Certificates,
Series K051, Class X1,
0.688%, 9/25/2025(c)(e) | | $ | 983,516 | |
| | 17,813,118 | | | FHLMC Multifamily Structured
Pass Through Certificates,
Series K052, Class X1,
0.811%, 11/25/2025(c)(e) | | | 879,674 | |
| | 9,793,535 | | | FHLMC Multifamily Structured
Pass Through Certificates,
Series K053, Class X1,
0.894%, 12/25/2025(c)(e) | | | 664,656 | |
| | 17,138,477 | | | FHLMC Multifamily Structured
Pass Through Certificates,
Series K054, Class X1,
1.319%, 1/25/2026(c)(e) | | | 1,531,753 | |
| | 7,737,228 | | | FHLMC Multifamily Structured
Pass Through Certificates,
Series K055, Class X1, 1.503%, 3/25/2026(c)(e) | | | 804,629 | |
| | 8,735,000 | | | FHLMC Multifamily Structured
Pass Through Certificates,
Series K057, Class X1,
1.194%, 7/25/2026(c)(e) | | | 806,343 | |
| | 15,802,521 | | | FHLMC Multifamily Structured
Pass Through Certificates,
Series K152, Class X1,
1.097%, 1/25/2031(c)(e) | | | 1,495,805 | |
| | 3,630,989 | | | FHLMC Multifamily Structured
Pass Through Certificates,
Series KS01, Class X1,
1.571%, 1/25/2023(c)(e) | | | 217,622 | |
| | 52,794,045 | | | FHLMC Multifamily Structured
Pass Through Certificates,
Series KS03, Class X,
0.437%, 8/25/2025(c)(e) | | | 927,924 | |
| | 4,000,000 | | | Government National Mortgage Association, Series 2008-52, Class E, 6.041%, 8/16/2042(b)(c) | | | 5,059,643 | |
| | 2,000,000 | | | Government National Mortgage Association, Series 2008-80, Class E, 5.674%, 8/16/2042(c) | | | 2,311,948 | |
| | 14,422,477 | | | Government National Mortgage Association,
Series 2014-101, Class IO,
0.898%, 4/16/2056(c)(e) | | | 900,998 | |
| | 21,777,736 | | | Government National Mortgage Association, Series 2014-86, Class IO, 0.867%, 4/16/2056(c)(e) | | | 1,246,529 | |
| | 73,672,734 | | | Government National Mortgage Association,
Series 2015-146, Class IB,
0.869%, 7/16/2055(b)(c)(e) | | | 4,545,991 | |
| | 17,949,703 | | | Government National Mortgage Association,
Series 2015-171, Class IO,
0.894%, 11/16/2055(c)(e) | | | 1,249,321 | |
| | | | | | | | |
Principal
Amount | | | Description | | Value (†) | |
| |
| | | | Agency Commercial Mortgage-Backed Securities – continued | |
| $ | 27,669,384 | | | Government National Mortgage Association,
Series 2015-189, Class IG,
0.934%, 1/16/2057(c)(e) | | $ | 1,943,760 | |
| | 14,069,459 | | | Government National Mortgage Association, Series 2015-68, Class IO, 0.827%, 7/16/2057(c)(e) | | | 918,472 | |
| | 48,469,390 | | | Government National Mortgage Association, Series 2015-70, Class IO, 1.118%, 12/16/2049(b)(c)(e) | | | 3,444,579 | |
| | | | | | | | |
| | | | | | | 55,755,904 | |
| | | | | | | | |
| | | | Collateralized Mortgage Obligations – 22.0% | |
| | 159,139 | | | Federal Home Loan Mortgage Corp., REMIC, Series 1673, Class SE, 8.390%, 2/15/2024(c)(d) | | | 179,412 | |
| | 123,754 | | | Federal Home Loan Mortgage Corp., REMIC, Series 2060, Class ZA, 6.000%, 4/15/2028(b)(d) | | | 138,580 | |
| | 1,407,392 | | | Federal Home Loan Mortgage Corp., REMIC, Series 2626, Class SQ, 13.689%, 6/15/2023(c) | | | 1,712,538 | |
| | 524,753 | | | Federal Home Loan Mortgage Corp., REMIC, Series 2646, Class MH, 5.000%, 7/15/2033 | | | 558,795 | |
| | 240,935 | | | Federal Home Loan Mortgage Corp., REMIC, Series 2649, Class IM, 7.000%, 7/15/2033(b)(d)(e) | | | 61,611 | |
| | 284,410 | | | Federal Home Loan Mortgage Corp., REMIC, Series 2725, Class SC, 8.290%, 11/15/2033(c)(d) | | | 301,510 | |
| | 4,566,024 | | | Federal Home Loan Mortgage Corp., REMIC, Series 2882, Class TF, 0.774%, 10/15/2034(b)(c) | | | 4,577,148 | |
| | 7,444,567 | | | Federal Home Loan Mortgage Corp., REMIC, Series 2912, Class EH, 5.500%, 1/15/2035(b) | | | 8,518,237 | |
| | 4,271,444 | | | Federal Home Loan Mortgage Corp., REMIC, Series 3013, Class AS, 17.121%, 5/15/2035(b)(c) | | | 6,135,882 | |
| | 9,508,369 | | | Federal Home Loan Mortgage Corp., REMIC, Series 3149, Class LS, 6.676%, 5/15/2036(b)(c)(e) | | | 2,305,619 | |
| | 2,696,138 | | | Federal Home Loan Mortgage Corp., REMIC, Series 3416, Class BI, 5.726%, 2/15/2038(c)(d)(e) | | | 496,908 | |
| | 1,982,472 | | | Federal Home Loan Mortgage Corp., REMIC, Series 3417, Class WS, 14.753%, 2/15/2038(b)(c) | | | 2,619,449 | |
| | 1,906,290 | | | Federal Home Loan Mortgage Corp., REMIC, Series 3561, Class W, 3.287%, 6/15/2048(b)(c) | | | 1,876,828 | |
| | 450,000 | | | Federal Home Loan Mortgage Corp., REMIC, Series 3605, Class NC, 5.500%, 6/15/2037(d) | | | 511,300 | |
| | 2,115,227 | | | Federal Home Loan Mortgage Corp., REMIC, Series 3620, Class AT, 4.265%, 12/15/2036(b)(c) | | | 2,226,958 | |
| | 1,776,604 | | | Federal Home Loan Mortgage Corp., REMIC, Series 3752, Class KF, 1.024%, 12/15/2037(c) | | | 1,785,263 | |
See accompanying notes to financial statements.
21 |
Portfolio of Investments – as of September 30, 2016
Loomis Sayles Securitized Asset Fund – continued
| | | | | | | | |
Principal
Amount | | | Description | | Value (†) | |
| |
| | Bonds and Notes – continued | | | | |
| |
| | | | Collateralized Mortgage Obligations – continued | |
| $ | 2,122,160 | | | Federal Home Loan Mortgage Corp., REMIC, Series 3785, Class LS, 8.851%, 1/15/2041(b)(c) | | $ | 2,585,468 | |
| | 473,442 | | | Federal Home Loan Mortgage Corp., REMIC, Series 3808, Class SH, 8.154%, 2/15/2041(c) | | | 508,007 | |
| | 2,613,860 | | | Federal Home Loan Mortgage Corp., REMIC, Series 3828, Class EF, 0.924%, 5/15/2037(b)(c) | | | 2,623,211 | |
| | 1,800,000 | | | Federal Home Loan Mortgage Corp., REMIC, Series 4041, Class ES, 21.379%, 8/15/2040(b)(c) | | | 3,816,218 | |
| | 6,692,139 | | | Federal Home Loan Mortgage Corp., REMIC, Series 4097,
5.626%, 8/15/2032(c) | | | 937,804 | |
| | 1,959,097 | | | Federal Home Loan Mortgage Corp., REMIC, Series 4238, Class FD, 0.824%, 2/15/2042(c) | | | 1,955,752 | |
| | 21,355,649 | | | Federal Home Loan Mortgage Corp., REMIC, Series 4321, Class BS, 1.838%, 6/15/2039(c)(e) | | | 1,311,696 | |
| | 800,000 | | | Federal Home Loan Mortgage Corp., REMIC, Series 4395, Class PE, 2.500%, 4/15/2037 | | | 765,474 | |
| | 460,133 | | | Federal Home Loan Mortgage Corp., REMIC, Series 4460, Class NT, 6.500%, 8/15/2043(c) | | | 502,525 | |
| | 546,865 | | | Federal Home Loan Mortgage Corp., REMIC, Series 4460, Class TN, 5.000%, 8/15/2043(c) | | | 591,581 | |
| | 1,399,000 | | | Federal Home Loan Mortgage Corp., REMIC, Series 4480, Class NB, 3.500%, 6/15/2045 | | | 1,536,562 | |
| | 794,057 | | | Federal Home Loan Mortgage Corp., Series 224, Class IO,
6.000%, 3/01/2033(b)(d)(e) | | | 139,709 | |
| | 1,570,742 | | | Federal Home Loan Mortgage Corp., Series 3792, Class DF,
0.924%, 11/15/2040(c) | | | 1,569,228 | |
| | 339,235 | | | Federal National Mortgage Association, REMIC,
Series 1996-45, Class SC,
6.725%, 1/25/2024(c)(d)(e) | | | 47,926 | |
| | 86,880 | | | Federal National Mortgage Association, REMIC,
Series 2003-26, Class OI,
5.500%, 11/25/2032(b)(d)(e) | | | 398 | |
| | 1,679,506 | | | Federal National Mortgage Association, REMIC,
Series 2005-22, Class DG,
6.810%, 4/25/2035(c) | | | 1,883,573 | |
| | 3,496,587 | | | Federal National Mortgage Association, REMIC,
Series 2006-46, Class SK,
22.274%, 6/25/2036(b)(c) | | | 5,821,377 | |
| | 192,956 | | | Federal National Mortgage Association, REMIC,
Series 2006-69, Class KI,
6.775%, 8/25/2036(c)(d)(e) | | | 40,942 | |
| |
| | | | Collateralized Mortgage Obligations – continued | |
| 929,070 | | | Federal National Mortgage Association, REMIC,
Series 2008-15, Class AS,
30.374%, 8/25/2036(c) | | | 1,832,110 | |
| | 1,000,000 | | | Federal National Mortgage Association, REMIC,
Series 2008-35, Class CD,
4.500%, 5/25/2023(b) | | | 1,035,295 | |
| | 2,635,924 | | | Federal National Mortgage Association, REMIC,
Series 2008-86, Class LA,
3.496%, 8/25/2038(b)(c) | | | 2,817,997 | |
| | 651,770 | | | Federal National Mortgage Association, REMIC,
Series 2008-87, Class LD,
4.627%, 11/25/2038(c) | | | 701,922 | |
| | 1,585,857 | | | Federal National Mortgage Association, REMIC,
Series 2009-11, Class VP,
2.929%, 3/25/2039(b)(c) | | | 1,636,818 | |
| | 153,375 | | | Federal National Mortgage Association, REMIC,
Series 2009-71, Class MB,
4.500%, 9/25/2024(d) | | | 162,709 | |
| | 493,984 | | | Federal National Mortgage Association, REMIC,
Series 2010-75, Class MT,
4.364%, 12/25/2039(c)(d) | | | 496,668 | |
| | 5,034,460 | | | Federal National Mortgage Association, REMIC,
Series 2010-95, Class FB,
0.925%, 9/25/2040(b)(c) | | | 5,042,209 | |
| | 458,025 | | | Federal National Mortgage Association, REMIC,
Series 2011-100, Class SH,
7.177%, 11/25/2040(c) | | | 579,882 | |
| | 1,500,000 | | | Federal National Mortgage Association, REMIC,
Series 2013-109, Class US,
10.867%, 7/25/2043(c) | | | 1,978,710 | |
| | 939,818 | | | Federal National Mortgage Association, REMIC,
Series 2013-23, Class TS,
5.365%, 3/25/2043(c) | | | 942,427 | |
| | 770,590 | | | Federal National Mortgage Association, REMIC,
Series 2013-26, Class SJ,
4.832%, 4/25/2033(c) | | | 770,576 | |
| | 6,103,905 | | | Federal National Mortgage Association, REMIC,
Series 2013-34, Class PS,
5.625%, 8/25/2042(b)(c)(e) | | | 1,231,154 | |
| | 239,465 | | | Federal National Mortgage Association, REMIC,
Series 2014-67, Class PT,
6.000%, 10/25/2044(c) | | | 235,432 | |
| | 2,114,135 | | | Federal National Mortgage Association, REMIC,
Series 2015-1, Class SN,
6.000%, 7/25/2043(b)(c) | | | 2,218,302 | |
See accompanying notes to financial statements.
| 22
Portfolio of Investments – as of September 30, 2016
Loomis Sayles Securitized Asset Fund – continued
| | | | | | | | |
Principal
Amount | | | Description | | Value (†) | |
| |
| | Bonds and Notes – continued | | | | |
| |
| | | | Collateralized Mortgage Obligations – continued | |
| $ | 687,206 | | | Federal National Mortgage Association, REMIC,
Series 2015-55, Class KT, 5.500%, 5/25/2041(c) | | $ | 760,723 | |
| | 3,002,994 | | | Federal National Mortgage Association, REMIC,
Series 2016-26, Class KL,
4.500%, 11/25/2042(b)(c) | | | 3,110,969 | |
| | 2,380,113 | | | Federal National Mortgage Association, REMIC,
Series 2016-32, Class TG,
4.500%, 1/25/2043(b)(c) | | | 2,437,816 | |
| | 1,024,854 | | | Federal National Mortgage Association, Series 334, Class 11, 6.000%, 3/25/2033(b)(d)(e) | | | 213,295 | |
| | 220,337 | | | Federal National Mortgage Association, Series 334, Class 19,
7.000%, 2/25/2033(b)(c)(d)(e) | | | 47,133 | |
| | 1,121,378 | | | Federal National Mortgage Association, Series 339, Class 13,
6.000%, 6/25/2033(b)(d)(e) | | | 261,596 | |
| | 210,117 | | | Federal National Mortgage Association, Series 339, Class 7,
5.500%, 11/25/2033(b)(d)(e) | | | 39,928 | |
| | 2,337,303 | | | Federal National Mortgage Association, Series 356, Class 13,
5.500%, 6/25/2035(b)(d)(e) | | | 481,735 | |
| | 960,157 | | | Federal National Mortgage Association, Series 359, Class 17,
6.000%, 7/25/2035(b)(d)(e) | | | 194,917 | |
| | 589,594 | | | Federal National Mortgage Association, Series 374, Class 18, 6.500%, 8/25/2036(b)(d)(e) | | | 120,634 | |
| | 1,208,711 | | | Federal National Mortgage Association, Series 374, Class 20, 6.500%, 9/25/2036(b)(d)(e) | | | 247,066 | |
| | 561,038 | | | Federal National Mortgage Association, Series 374, Class 22,
7.000%, 10/25/2036(b)(d)(e) | | | 119,634 | |
| | 685,555 | | | Federal National Mortgage Association, Series 374, Class 23,
7.000%, 10/25/2036(b)(d)(e) | | | 156,990 | |
| | 814,002 | | | Federal National Mortgage Association, Series 374, Class 24,
7.000%, 6/25/2037(b)(d)(e) | | | 188,089 | |
| | 766,940 | | | Federal National Mortgage Association, Series 381, Class 12,
6.000%, 11/25/2035(b)(d)(e) | | | 140,909 | |
| | 359,676 | | | Federal National Mortgage Association, Series 381, Class 13,
6.000%, 11/25/2035(b)(c)(d)(e) | | | 57,050 | |
| | 526,002 | | | Federal National Mortgage Association, Series 381, Class 18,
7.000%, 3/25/2037(b)(d)(e) | | | 108,513 | |
| | 338,338 | | | Federal National Mortgage Association, Series 381, Class 19,
7.000%, 3/25/2037(b)(c)(d)(e) | | | 70,050 | |
| |
| | | | Collateralized Mortgage Obligations – continued | |
| 93,480 | | | Federal National Mortgage Association, Series 383, Class 32, 6.000%, 1/25/2038(b)(d)(e) | | | 17,079 | |
| | 2,803,410 | | | Federal National Mortgage Association, Series 384, Class 20,
5.500%, 5/25/2036(b)(c)(d)(e) | | | 487,745 | |
| | 923,008 | | | Federal National Mortgage Association, Series 384, Class 31, 6.500%, 7/25/2037(b)(d)(e) | | | 182,021 | |
| | 865,267 | | | Federal National Mortgage Association, Series 384, Class 36,
7.000%, 7/25/2037(b)(c)(d)(e) | | | 188,107 | |
| | 811,464 | | | Federal National Mortgage Association, Series 384, Class 4,
4.500%, 9/25/2036(b)(c)(d)(e) | | | 104,138 | |
| | 462,397 | | | Federal National Mortgage Association, Series 385, Class 23, 7.000%, 7/25/2037(b)(d)(e) | | | 88,818 | |
| | 75,519 | | | Federal National Mortgage Association, Series 386, Class 25, 7.000%, 3/25/2038(c)(d)(e) | | | 14,017 | |
| | 10,959,066 | | | FHLMC Multifamily Structured Pass Through Certificates,
Series K017, Class X1,
1.522%, 12/25/2021(c)(e) | | | 641,593 | |
| | 5,116,182 | | | Government National Mortgage Association, Series 2006-46, Class IO,
0.438%, 4/16/2046(c)(d)(e) | | | 78,765 | |
| | 5,225,191 | | | Government National Mortgage Association, Series 2006-51, Class IO,
0.617%, 8/16/2046(b)(c)(d)(e) | | | 175,907 | |
| | 12,753,846 | | | Government National Mortgage Association,
Series 2009-114, Class IO,
0.015%, 10/16/2049(c)(d)(e) | | | 135,555 | |
| | 244,859 | | | Government National Mortgage Association,
Series 2009-65, Class NZ,
5.500%, 8/20/2039(d) | | | 308,228 | |
| | 11,497,135 | | | Government National Mortgage Association, Series 2010-124, Class X,
0.373%, 12/16/2052(b)(c)(d)(e) | | | 221,338 | |
| | 405,167 | | | Government National Mortgage Association, Series 2010-49, Class IA,
1.510%, 10/16/2052(c)(d)(e) | | | 25,483 | |
| | 773,401 | | | Government National Mortgage Association,
Series 2010-H20, Class AF,
0.824%, 10/20/2060(c) | | | 766,626 | |
| | 13,415,942 | | | Government National Mortgage Association,
Series 2011-119, Class IO,
0.835%, 8/16/2051(c)(e) | | | 480,534 | |
| | 43,416,508 | | | Government National Mortgage Association,
Series 2011-121, Class IO,
0.876%, 6/16/2043(b)(c)(e) | | | 1,076,386 | |
| | 27,715,310 | | | Government National Mortgage Association,
Series 2011-161, Class IO,
0.881%, 4/16/2045(c)(e) | | | 931,160 | |
See accompanying notes to financial statements.
23 |
Portfolio of Investments – as of September 30, 2016
Loomis Sayles Securitized Asset Fund – continued
| | | | | | | | |
Principal
Amount | | | Description | | Value (†) | |
| |
| | Bonds and Notes – continued | | | | |
| |
| | | | Collateralized Mortgage Obligations – continued | |
| $ | 11,470,495 | | | Government National Mortgage Association, Series 2011-38, Class IO,
0.100%, 4/16/2053(b)(c)(d)(e) | | $ | 242,630 | |
| | 3,655,827 | | | Government National Mortgage Association, Series 2011-53, Class IO,
0.434%, 5/16/2051(b)(c)(d)(e) | | | 111,097 | |
| | 1,377,164 | | | Government National Mortgage Association,
Series 2011-H01, Class AF,
0.944%, 11/20/2060(c) | | | 1,371,200 | |
| | 658,667 | | | Government National Mortgage Association,
Series 2011-H21, Class FT,
1.230%, 10/20/2061(c) | | | 659,143 | |
| | 17,000,000 | | | Government National Mortgage Association,
Series 2012-100, Class IC,
1.387%, 9/16/2050(c)(e) | | | 1,329,487 | |
| | 12,925,139 | | | Government National Mortgage Association,
Series 2012-111, Class IC,
1.287%, 9/16/2050(c)(d)(e) | | | 959,365 | |
| | 63,957,653 | | | Government National Mortgage Association,
Series 2012-142, Class IO,
1.078%, 4/16/2054(b)(c)(e) | | | 3,260,069 | |
| | 22,554,239 | | | Government National Mortgage Association, Series 2012-23, Class IO,
1.090%, 6/16/2053(b)(c)(d)(e) | | | 881,436 | |
| | 40,852,812 | | | Government National Mortgage Association, Series 2012-55, Class IO,
0.945%, 4/16/2052(b)(c)(e) | | | 1,435,985 | |
| | 23,820,144 | | | Government National Mortgage Association, Series 2012-70, Class IO,
0.588%, 8/16/2052(b)(c)(d)(e) | | | 758,472 | |
| | 20,883,081 | | | Government National Mortgage Association, Series 2012-79, Class IO,
0.857%, 3/16/2053(c)(e) | | | 1,070,863 | |
| | 8,554,612 | | | Government National Mortgage Association,
Series 2012-H08, Class FA,
1.094%, 1/20/2062(b)(c) | | | 8,565,330 | |
| | 2,498,701 | | | Government National Mortgage Association,
Series 2012-H20, Class BA,
1.054%, 9/20/2062(b)(c) | | | 2,498,287 | |
| | 349,572 | | | Government National Mortgage Association,
Series 2012-H24, Class FE,
1.094%, 10/20/2062(c) | | | 348,262 | |
| | 4,806,463 | | | Government National Mortgage Association,
Series 2012-H26, Class BA,
0.844%, 10/20/2062(b)(c) | | | 4,765,091 | |
| | 2,999,984 | | | Government National Mortgage Association,
Series 2012-H30, Class GA,
0.844%, 12/20/2062(b)(c) | | | 2,974,801 | |
| | 6,042,597 | | | Government National Mortgage Association,
Series 2013-175, Class IO,
0.808%, 5/16/2055(c)(d)(e) | | | 266,049 | |
| |
| | | | Collateralized Mortgage Obligations – continued | |
| 24,634,074 | | | Government National Mortgage Association,
Series 2013-H16, Class AI,
1.606%, 7/20/2063(c)(e) | | | 1,678,196 | |
| | 16,511,383 | | | Government National Mortgage Association,
Series 2013-H18, Class EI,
1.693%, 7/20/2063(c)(e) | | | 1,307,041 | |
| | 2,897,987 | | | Government National Mortgage Association,
Series 2013-H18, Class JI,
1.370%, 8/20/2063(c)(d)(e) | | | 160,527 | |
| | 325,409 | | | Government National Mortgage Association,
Series 2013-H22, Class FT,
1.180%, 4/20/2063(c) | | | 328,387 | |
| | 45,241,808 | | | Government National Mortgage Association,
Series 2014-130, Class IB,
0.918%, 8/16/2054(b)(c)(e) | | | 2,611,240 | |
| | 357,939 | | | Government National Mortgage Association,
Series 2014-160, Class ST,
6.500%, 10/20/2044(c) | | | 354,468 | |
| | 44,241,849 | | | Government National Mortgage Association, Series 2014-24, Class IX,
0.812%, 1/16/2054(b)(c)(e) | | | 2,178,610 | |
| | 39,665,964 | | | Government National Mortgage Association, Series 2014-70, Class IO,
1.171%, 3/16/2049(b)(c)(e) | | | 2,361,390 | |
| | 15,626,803 | | | Government National Mortgage Association,
Series 2014-H03, Class FS,
1.144%, 2/20/2064(b)(c) | | | 15,646,763 | |
| | 4,673,648 | | | Government National Mortgage Association,
Series 2014-H05, Class FB,
1.094%, 12/20/2063(b)(c) | | | 4,680,629 | |
| | 3,843,584 | | | Government National Mortgage Association,
Series 2014-H06, Class FA,
1.064%, 3/20/2064(b)(c) | | | 3,844,397 | |
| | 7,929,096 | | | Government National Mortgage Association,
Series 2014-H12, Class HZ,
4.605%, 6/20/2064(b)(c) | | | 9,276,040 | |
| | 3,582,360 | | | Government National Mortgage Association,
Series 2014-H14, Class FA,
0.994%, 7/20/2064(b)(c) | | | 3,561,624 | |
| | 2,649,679 | | | Government National Mortgage Association,
Series 2014-H15, Class FA,
0.994%, 7/20/2064(b)(c) | | | 2,632,596 | |
| | 284,133 | | | Government National Mortgage Association,
Series 2015-180, Class HT,
5.000%, 8/20/2045(c)(d) | | | 280,134 | |
| | 2,530,227 | | | Government National Mortgage Association, Series 2015-39, Class SN,
3.620%, 3/20/2045(b)(c) | | | 2,627,727 | |
See accompanying notes to financial statements.
| 24
Portfolio of Investments – as of September 30, 2016
Loomis Sayles Securitized Asset Fund – continued
| | | | | | | | |
Principal
Amount | | | Description | | Value (†) | |
| |
| | Bonds and Notes – continued | | | | |
| |
| | | | Collateralized Mortgage Obligations – continued | |
| $ | 89,398 | | | Government National Mortgage Association, Series 2015-63, Class TB,
5.000%, 5/20/2045(c)(d) | | $ | 87,997 | |
| | 6,556,571 | | | Government National Mortgage Association,
Series 2015-H10, Class JA,
2.250%, 4/20/2065(b) | | | 6,562,471 | |
| | 2,166,815 | | | Government National Mortgage Association,
Series 2015-H29, Class FA,
1.194%, 10/20/2065(c) | | | 2,167,789 | |
| | 103,893 | | | Government National Mortgage Association,
Series 2015-H29, Class HZ,
4.592%, 9/20/2065(c)(d) | | | 125,164 | |
| | 1,595,700 | | | Government National Mortgage Association,
Series 2015-H30, Class FA,
1.174%, 8/20/2061(c) | | | 1,594,782 | |
| | 1,770,000 | | | Government National Mortgage Association,
Series 2016-17, Class GT,
5.000%, 8/20/2045(c) | | | 1,885,027 | |
| | 54,010 | | | Government National Mortgage Association, Series 2016-9, Class SB,
8.521%, 10/20/2045(c)(d) | | | 53,300 | |
| | 4,758,974 | | | Government National Mortgage Association,
Series 2016-H06, Class FC,
1.414%, 2/20/2066(b)(c) | | | 4,793,448 | |
| | 29,822,752 | | | Government National Mortgage Association,
Series 2016-H09, Class JI,
2.286%, 4/20/2066(b)(c)(e) | | | 3,718,539 | |
| | 5,875,659 | | | Government National Mortgage Association,
Series 2016-H10, Class FJ,
1.123%, 4/20/2066(b)(c) | | | 5,873,562 | |
| | 3,046,377 | | | Government National Mortgage Association,
Series 2016-H13, Class FT,
1.112%, 5/20/2066(b)(c) | | | 3,047,541 | |
| | 505,721 | | | Government National Mortgage Association,
Series 2016-H14, Class JZ,
4.559%, 8/20/2063(c)(d) | | | 558,851 | |
| | 2,880,000 | | | Government National Mortgage Association,
Series 2016-H19, Class FC,
1.021%, 8/20/2066(c) | | | 2,864,823 | |
| | 5,000,000 | | | Government National Mortgage Association,
Series 2016-H19, Class FE,
0.894%, 6/20/2061(c) | | | 4,984,813 | |
| | 3,000,000 | | | Government National Mortgage Association,
Series 2016-H19, Class FJ,
0.924%, 9/20/2063(c) | | | 2,985,020 | |
| | | | | | | | |
| | | | | | | 223,336,710 | |
| | | | | | | | |
| | | | Hybrid ARMs – 1.6% | | | | |
| 105,554 | | | FHLMC, 2.691%, 1/01/2035(b)(c) | | | 111,678 | |
| | 251,715 | | | FHLMC, 2.723%, 1/01/2036(b)(c) | | | 266,846 | |
| | 2,133,476 | | | FHLMC, 2.730%, 6/01/2035(b)(c) | | | 2,248,635 | |
| | 1,917,760 | | | FHLMC, 3.070%, 2/01/2037(b)(c) | | | 2,048,626 | |
| | 643,064 | | | FNMA, 2.423%, 2/01/2037(b)(c) | | | 668,771 | |
| | 961,516 | | | FNMA, 2.660%, 9/01/2034(b)(c) | | | 1,011,214 | |
| | 237,765 | | | FNMA, 2.670%, 10/01/2035(b)(c) | | | 244,488 | |
| | 2,615,228 | | | FNMA, 2.706%, 6/01/2034(b)(c) | | | 2,758,908 | |
| | 2,057,238 | | | FNMA, 2.799%, 8/01/2038(b)(c) | | | 2,179,045 | |
| | 4,256,282 | | | FNMA, 2.938%, 9/01/2037(b)(c) | | | 4,496,418 | |
| | 421,487 | | | FNMA, 3.002%, 9/01/2036(b)(c) | | | 446,409 | |
| | | | | | | | |
| | | | | | | 16,481,038 | |
| | | | | | | | |
| | | | Mortgage Related – 47.3% | |
| | 2,105,751 | | | Federal Home Loan Mortgage Corp., REMIC, Series 3417, Class VS,
16.249%, 2/15/2038(b)(c) | | | 3,048,417 | |
| | 4,371,026 | | | FHLMC, 3.500%, with various maturities from 2042 to 2046(b)(f) | | | 4,614,671 | |
| | 877,208 | | | FHLMC, 4.000%, 9/01/2045 | | | 940,864 | |
| | 78,767 | | | FHLMC, 5.000%, 9/01/2035 | | | 87,444 | |
| | 4,207,432 | | | FNMA, 4.000%, with various maturities from 2041 to 2052(f) | | | 4,530,588 | |
| | 1,866,001 | | | FNMA, 4.500%, 5/01/2045 | | | 2,044,041 | |
| | 593,345 | | | FNMA, 5.500%, 8/01/2034(b) | | | 684,344 | |
| | 7,075 | | | FNMA, 6.000%, 10/01/2034 | | | 8,192 | |
| | 28,000,000 | | | FNMA (TBA),
2.500%, 11/01/2031(g) | | | 28,949,720 | |
| | 17,200,000 | | | FNMA (TBA),
3.000%, 11/01/2046(g) | | | 17,835,807 | |
| | 74,545,000 | | | FNMA (TBA),
3.500%, 11/01/2046(g) | | | 78,564,894 | |
| | 121,695,000 | | | FNMA (TBA),
4.000%, 11/01/2046(g) | | | 130,546,413 | |
| | 745,316 | | | GNMA, 0.978%, 8/20/2063(c) | | | 745,164 | |
| | 468,237 | | | GNMA, 2.184%, 7/20/2060(c) | | | 488,195 | |
| | 350,909 | | | GNMA, 2.206%, 9/20/2060(c) | | | 366,705 | |
| | 2,004,537 | | | GNMA, 2.208%, 2/20/2061(c) | | | 2,090,080 | |
| | 2,795,673 | | | GNMA, 2.470%, 2/20/2063(b)(c) | | | 2,943,741 | |
| | 1,268,041 | | | GNMA, 2.818%, 6/20/2065(c) | | | 1,363,206 | |
| | 1,765,109 | | | GNMA, 4.430%, 5/20/2063 | | | 1,911,953 | |
| | 3,892,519 | | | GNMA, 4.432%, 2/20/2063(b) | | | 4,174,010 | |
| | 2,111,698 | | | GNMA, 4.482%, 4/20/2063 | | | 2,272,831 | |
| | 1,659,199 | | | GNMA, 4.485%, 2/20/2062 | | | 1,751,196 | |
| | 2,096,892 | | | GNMA, 4.489%, 4/20/2063 | | | 2,269,052 | |
| | 951,768 | | | GNMA, 4.504%, 7/20/2062 | | | 1,012,358 | |
| | 1,214,150 | | | GNMA, 4.516%, 1/20/2063 | | | 1,299,750 | |
| | 1,775,746 | | | GNMA, 4.517%, 1/20/2062 | | | 1,872,021 | |
| | 3,138,340 | | | GNMA, 4.531%, 12/20/2061(b) | | | 3,307,960 | |
| | 4,570,022 | | | GNMA, 4.534%, 6/20/2064(b) | | | 5,099,894 | |
| | 1,255,734 | | | GNMA, 4.535%, with various
maturities from 2063 to 2064(f) | | | 1,343,843 | |
| | 1,140,847 | | | GNMA, 4.548%, 6/20/2062 | | | 1,203,655 | |
| | 1,418,699 | | | GNMA, 4.550%, 12/20/2061 | | | 1,495,891 | |
| | 883,829 | | | GNMA, 4.551%, 9/20/2063 | | | 980,475 | |
| | 439,668 | | | GNMA, 4.556%, 10/20/2061 | | | 460,676 | |
| | 3,908,432 | | | GNMA, 4.557%, 12/20/2064(b) | | | 4,374,637 | |
| | 434,544 | | | GNMA, 4.558%, 11/20/2061 | | | 455,040 | |
| | 5,472,171 | | | GNMA, 4.560%, with various
maturities from 2063 to 2066(b)(f) | | | 5,912,054 | |
| | 6,312,344 | | | GNMA, 4.568%, 7/20/2065(b) | | | 7,129,037 | |
| | 4,446,308 | | | GNMA, 4.571%, 6/20/2063(b) | | | 4,816,181 | |
See accompanying notes to financial statements.
25 |
Portfolio of Investments – as of September 30, 2016
Loomis Sayles Securitized Asset Fund – continued
| | | | | | | | |
Principal
Amount | | | Description | | Value (†) | |
| |
| | Bonds and Notes – continued | | | | |
| |
| | | | Mortgage Related – continued | |
| $ | 4,386,732 | | | GNMA, 4.583%, 3/20/2062(b) | | $ | 4,631,918 | |
| | 933,090 | | | GNMA, 4.610%, 7/20/2062 | | | 995,249 | |
| | 1,183,109 | | | GNMA, 4.614%, 6/20/2061 | | | 1,237,088 | |
| | 903,588 | | | GNMA, 4.623%, 10/20/2061 | | | 945,469 | |
| | 942,231 | | | GNMA, 4.626%, 6/20/2062 | | | 997,675 | |
| | 622,118 | | | GNMA, 4.634%, 3/20/2062 | | | 657,694 | |
| | 1,654,297 | | | GNMA, 4.648%, 8/20/2061 | | | 1,729,530 | |
| | 858,675 | | | GNMA, 4.651%, 11/20/2063 | | | 958,679 | |
| | 996,582 | | | GNMA, 4.658%, 3/20/2062 | | | 1,051,249 | |
| | 14,162,552 | | | GNMA, 4.667%, with various
maturities from 2061 to 2062(b)(f) | | | 14,939,615 | |
| | 1,122,379 | | | GNMA, 4.672%, 10/20/2064 | | | 1,265,159 | |
| | 10,618,045 | | | GNMA, 4.679%, 12/20/2061(b) | | | 11,216,621 | |
| | 1,283,114 | | | GNMA, 4.683%, 8/20/2061 | | | 1,333,651 | |
| | 1,842,426 | | | GNMA, 4.687%, 5/20/2064 | | | 2,083,806 | |
| | 619,832 | | | GNMA, 4.688%, 1/20/2062 | | | 651,612 | |
| | 6,016,898 | | | GNMA, 4.700%, with various maturities in 2061(b)(f) | | | 6,280,687 | |
| | 599,018 | | | GNMA, 4.708%, 11/20/2063 | | | 633,238 | |
| | 3,160,822 | | | GNMA, 4.714%, 7/20/2063(b) | | | 3,336,157 | |
| | 597,505 | | | GNMA, 4.718%, 12/20/2063 | | | 669,946 | |
| | 2,196,458 | | | GNMA, 4.727%, 6/20/2061(b) | | | 2,291,595 | |
| | 1,144,046 | | | GNMA, 4.755%, 8/20/2062 | | | 1,208,011 | |
| | 782,296 | | | GNMA, 4.797%, 5/20/2061 | | | 813,437 | |
| | 3,752,630 | | | GNMA, 4.807%, 5/20/2061(b) | | | 3,894,430 | |
| | 713,760 | | | GNMA, 4.909%, 1/20/2062 | | | 762,575 | |
| | 170,099 | | | GNMA, 5.500%, with various maturities in 2059(f) | | | 175,079 | |
| | 722,095 | | | GNMA, 6.551%, 5/20/2061 | | | 753,274 | |
| | 15,500,000 | | | GNMA, (TBA),
3.000%, 11/01/2046(g) | | | 16,205,673 | |
| | 15,600,000 | | | GNMA (TBA),
3.500%, 11/01/2046(g) | | | 16,550,625 | |
| | 4,265,770 | | | Government National Mortgage Association,
Series 2012-H11, Class BA,
2.000%, 5/20/2062(b) | | | 4,286,358 | |
| | 2,468,733 | | | Government National Mortgage Association,
Series 2013-H13, Class SI,
1.277%, 6/20/2063(c)(d)(e) | | | 150,082 | |
| | 25,157,487 | | | Government National Mortgage Association,
Series 2014-H24, Class HI,
0.935%, 9/20/2064(c)(e) | | | 1,179,257 | |
| | 12,358,593 | | | Government National Mortgage Association,
Series 2015-H01, Class XZ,
4.631%, 10/20/2064(b)(c) | | | 14,912,809 | |
| | 17,251,957 | | | Government National Mortgage Association,
Series 2015-H04, Class FL,
0.964%, 2/20/2065(b)(c) | | | 17,127,142 | |
| | 5,595,804 | | | Government National Mortgage Association,
Series 2015-H05, Class FA,
0.794%, 4/20/2061(b)(c) | | | 5,554,365 | |
| | 2,598,234 | | | Government National Mortgage Association,
Series 2015-H12, Class FL,
0.724%, 5/20/2065(b)(c) | | | 2,568,231 | |
| |
| | | | Mortgage Related – continued | |
| 729,902 | | | Government National Mortgage Association,
Series 2015-H28, Class JZ,
5.020%, 3/20/2065(c) | | | 825,476 | |
| | 21,863,952 | | | Government National Mortgage Association,
Series 2016-H01, Class AI,
1.785%, 1/20/2066(c)(e) | | | 2,425,532 | |
| | | | | | | | |
| | | | | | | 480,293,994 | |
| | | | | | | | |
| | | | Non-Agency Commercial Mortgage-Backed Securities – 20.1% | |
| | 48,868 | | | A10 Securitization LLC,
Series 2013-1, Class A,
2.400%, 11/15/2025, 144A | | | 48,859 | |
| | 709,357 | | | A10 Securitization LLC,
Series 2014-1, Class A1,
1.720%, 4/15/2033, 144A | | | 706,198 | |
| | 1,257,290 | | | Banc of America Merrill Lynch Commercial Mortgage, Inc.,
Series 2007-5, Class A4,
5.492%, 2/10/2051 | | | 1,286,381 | |
| | 660,605 | | | Bear Stearns Commercial Mortgage Securities,
Series 2007-PW15, Class A4,
5.331%, 2/11/2044 | | | 665,521 | |
| | 1,798,290 | | | CD Commercial Mortgage Trust,
Series 2007-CD4, Class A4,
5.322%, 12/11/2049(b) | | | 1,805,967 | |
| | 11,529,257 | | | CDGJ Commercial Mortgage Trust Pass Through Certificates,
Series 2014-BXCH,
1.924%, 12/15/2027, 144A(b)(c) | | | 11,540,091 | |
| | 3,076,000 | | | CGBAM Commercial Mortgage Trust, Series 2014-HD, Class B,
1.724%, 2/15/2031, 144A(c) | | | 3,059,584 | |
| | 4,052,123 | | | COBALT CMBS Commercial Mortgage Trust,
Series 2007-C2, Class A3,
5.484%, 4/15/2047(b)(c) | | | 4,085,260 | |
| | 1,325,000 | | | Commercial Mortgage Pass Through Certificates,
Series 2012-CR2, Class A4,
3.147%, 8/15/2045 | | | 1,407,391 | |
| | 3,010,000 | | | Commercial Mortgage Pass Through Certificates,
Series 2014-BBG, Class A,
1.325%, 3/15/2029, 144A(b)(c) | | | 2,980,912 | |
| | 1,220,000 | | | Commercial Mortgage Pass Through Certificates,
Series 2014-CR14, Class A2,
3.147%, 2/10/2047 | | | 1,250,313 | |
| | 2,670,000 | | | Commercial Mortgage Pass Through Certificates,
Series 2014-CR16, Class ASB, 3.653%, 4/10/2047(b) | | | 2,872,858 | |
| | 2,797,000 | | | Commercial Mortgage Pass Through Certificates,
Series 2014-FL4, Class AR4,
4.275%, 5/13/2031, 144A(c)(h)(i) | | | 2,729,540 | |
See accompanying notes to financial statements.
| 26
Portfolio of Investments – as of September 30, 2016
Loomis Sayles Securitized Asset Fund – continued
| | | | | | | | |
Principal
Amount | | | Description | | Value (†) | |
| |
| | Bonds and Notes – continued | | | | |
| |
| | | | Non-Agency Commercial Mortgage-Backed Securities – continued | |
| $ | 5,380,000 | | | Commercial Mortgage Pass Through Certificates,
Series 2014-FL5, Class SV1,
2.374%, 10/15/2031, 144A(c)(h)(i) | | $ | 5,374,722 | |
| | 8,255,000 | | | Commercial Mortgage Pass Through Certificates,
Series 2016-DC2, Class A5,
3.765%, 2/10/2049(b) | | | 9,045,120 | |
| | 257,937 | | | Credit Suisse Mortgage Capital Certificates, Series 2007-C2, Class A3,
5.542%, 1/15/2049(b)(c) | | | 257,947 | |
| | 4,457,200 | | | Credit Suisse Mortgage Capital Certificates, Series 2007-C3, Class A4,
5.881%, 6/15/2039(b)(c) | | | 4,503,697 | |
| | 1,343,077 | | | Credit Suisse Mortgage Capital Certificates, Series 2007-C4, Class A4, 6.134%, 9/15/2039(c) | | | 1,373,582 | |
| | 7,656,106 | | | Credit Suisse Mortgage Capital Certificates, Series 2007-C5, Class A4,
5.695%, 9/15/2040(b)(c) | | | 7,831,735 | |
| | 4,108,000 | | | Credit Suisse Mortgage Capital Certificates, Series 2008-C1, Class A3,
6.267%, 2/15/2041(b)(c) | | | 4,226,567 | |
| | 2,543,969 | | | GP Portfolio Trust,
Series 2014-GPP, Class A,
1.474%, 2/15/2027, 144A(b)(c) | | | 2,539,897 | |
| | 10,795,913 | | | Greenwich Capital Commercial Funding Corp.,
Series 2007-GG11, Class A4,
5.736%, 12/10/2049(b) | | | 11,081,174 | |
| | 5,320,898 | | | Greenwich Capital Commercial Funding Corp.,
Series 2007-GG9, Class A4,
5.444%, 3/10/2039(b) | | | 5,328,733 | |
| | 5,200,000 | | | GS Mortgage Securities Corp. II,
Series 2013-KING, Class C,
3.550%, 12/10/2027, 144A(b)(c) | | | 5,268,320 | |
| | 5,775,000 | | | GS Mortgage Securities Corp. Trust,
Series 2013-PEMB, Class A,
3.668%, 3/05/2033, 144A(b)(c) | | | 6,026,876 | |
| | 10,874,816 | | | GS Mortgage Securities Trust,
Series 2007-GG10, Class A4,
5.988%, 8/10/2045(b)(c) | | | 11,038,888 | |
| | 3,461,000 | | | GS Mortgage Securities Trust,
Series 2013-GC16, Class B,
5.161%, 11/10/2046(b)(c) | | | 3,990,683 | |
| | 3,205,000 | | | GS Mortgage Securities Trust,
Series 2014-GC20, Class A3,
3.680%, 4/10/2047(b) | | | 3,405,700 | |
| | 6,465,000 | | | JPMorgan Chase Commercial Mortgage Securities Corp.,
Series 2014-CBM, Class A,
1.424%, 10/15/2029, 144A(b)(c) | | | 6,401,135 | |
| | 1,923,767 | | | JPMorgan Chase Commercial Mortgage Securities Trust,
Series 2007-CB18, Class A4, 5.440%, 6/12/2047(b) | | | 1,933,545 | |
| |
| | | | Non-Agency Commercial Mortgage-Backed Securities – continued | |
| 2,334,062 | | | JPMorgan Chase Commercial Mortgage Securities Trust,
Series 2007-LD11, Class A4, 5.940%, 6/15/2049(c) | | | 2,366,181 | |
| | 562,907 | | | JPMorgan Chase Commercial Mortgage Securities Trust,
Series 2007-LDPX, Class A3, 5.420%, 1/15/2049 | | | 567,098 | |
| | 1,628,000 | | | JPMorgan Chase Commercial Mortgage Securities Trust,
Series 2014-C19, Class ASB, 3.584%, 4/15/2047 | | | 1,751,716 | |
| | 3,445,097 | | | JPMorgan Chase Commercial Mortgage Securities Trust,
Series 2014-FL5, Class A,
1.504%, 7/15/2031, 144A(b)(c) | | | 3,443,587 | |
| | 3,025,000 | | | JPMorgan Chase Commercial Mortgage Securities Trust,
Series 2015-SGP, Class D,
5.024%, 7/15/2036, 144A(b)(c) | | | 3,009,841 | |
| | 2,829,604 | | | Merrill Lynch/Countrywide Commercial Mortgage Trust,
Series 2007-5, Class A4,
5.378%, 8/12/2048(b) | | | 2,843,311 | |
| | 7,525,000 | | | Merrill Lynch/Countrywide Commercial Mortgage Trust,
Series 2007-6, Class A4,
5.485%, 3/12/2051(b)(c) | | | 7,600,566 | |
| | 5,881,254 | | | Merrill Lynch/Countrywide Commercial Mortgage Trust,
Series 2007-9, Class A4,
5.700%, 9/12/2049(b) | | | 6,061,141 | |
| | 3,390,000 | | | Morgan Stanley Bank of America Merrill Lynch Trust,
Series 2014-C14, Class A3,
3.669%, 2/15/2047(b) | | | 3,612,282 | |
| | 6,407,192 | | | Morgan Stanley Capital I,
Series 2007-HQ13, Class A3, 5.569%, 12/15/2044(b) | | | 6,566,053 | |
| | 9,130,000 | | | Morgan Stanley Capital I Trust,
Series 2007-IQ14, Class A4,
5.692%, 4/15/2049(b)(c) | | | 9,229,374 | |
| | 1,000,000 | | | Morgan Stanley Capital I Trust,
Series 2011-C2, Class D,
5.646%, 6/15/2044, 144A(c) | | | 1,052,777 | |
| | 3,475,000 | | | RBS Commercial Funding, Inc., Trust, Series 2013-SMV, Class C,
3.704%, 3/11/2031, 144A(c) | | | 3,488,253 | |
| | 680,000 | | | SCG Trust,
Series 2013-SRP1, Class A,
1.924%, 11/15/2026, 144A(c) | | | 674,852 | |
| | 905,000 | | | SCG Trust,
Series 2013-SRP1, Class B,
3.024%, 11/15/2026, 144A(c) | | | 874,372 | |
| | 2,100,000 | | | Starwood Retail Property Trust, Inc.,
1.744%, 11/15/2027, 144A(c) | | | 2,083,326 | |
| | 6,500,000 | | | Starwood Retail Property Trust, Inc.,
2.174%, 11/15/2027, 144A(b)(c) | | | 6,385,597 | |
| | 2,420,000 | | | Wachovia Bank Commercial Mortgage Trust,
Series 2007-C30, Class A5,
5.342%, 12/15/2043(b) | | | 2,435,442 | |
See accompanying notes to financial statements.
27 |
Portfolio of Investments – as of September 30, 2016
Loomis Sayles Securitized Asset Fund – continued
| | | | | | | | |
Principal
Amount | | | Description | | Value (†) | |
| |
| | Bonds and Notes – continued | | | | |
| |
| | | | Non-Agency Commercial Mortgage-Backed Securities – continued | |
| $ | 6,702,755 | | | Wachovia Bank Commercial Mortgage Trust,
Series 2007-C34, Class A3,
5.678%, 5/15/2046(b) | | $ | 6,825,055 | |
| | 4,000,000 | | | Wells Fargo Commercial Mortgage Trust, Series 2015-C29, Class ASB,
3.400%, 6/15/2048(b) | | | 4,258,070 | |
| | 4,632,000 | | | WFRBS Commercial Mortgage Trust, Series 2014-C20, Class ABS,
3.638%, 5/15/2047(b) | | | 4,994,482 | |
| | | | | | | | |
| | | | | | | 204,190,572 | |
| | | | | | | | |
| | |
| | | | Total Bonds and Notes | | | | |
| | | | (Identified Cost $1,232,525,606) | | | 1,229,528,302 | |
| | | | | | | | |
| |
| | Short-Term Investments – 7.0% | | | | |
| | 25,000,000 | | | Federal Home Loan Bank Discount Notes, 0.390%, 10/03/2016(j) | | | 25,000,000 | |
| | 10,000,000 | | | Federal Home Loan Bank Discount Notes, 0.320%, 02/01/2017(j) | | | 9,988,910 | |
| | 10,000,000 | | | Federal Home Loan Bank Discount Notes, 0.358%, 02/06/2017(j) | | | 9,988,450 | |
| | 26,387,913 | | | Tri-Party Repurchase Agreement with Fixed Income Clearing Corporation, dated 9/30/2016 at 0.030% to be repurchased at $26,387,979 on 10/03/2016 collateralized by $24,955,000 U.S. Treasury Note, 2.500% due 8/15/2023 valued at $26,920,206 including accrued interest (Note 2 of Notes to Financial Statements) | | | 26,387,913 | |
| | | | | | | | |
| | |
| | | | Total Short-Term Investments | | | | |
| | | | (Identified Cost $71,361,859) | | | 71,365,273 | |
| | | | | | | | |
| | |
| | | | Total Investments – 128.1% | | | | |
| | | | (Identified Cost $1,303,887,465)(a) | | | 1,300,893,575 | |
| | | | Other assets less liabilities—(28.1)% | | | (285,035,032 | ) |
| | | | | | | | |
| | |
| | | | Net Assets – 100.0% | | $ | 1,015,858,543 | |
| | | | | | | | |
| |
| | (†) | | | See Note 2 of Notes to Financial Statements. | |
| | (a) | | | Federal Tax Information: | | | | |
| | | | At September 30, 2016, the net unrealized depreciation on investments based on a cost of $1,303,887,465 for federal income tax purposes was as follows: | |
| | | | Aggregate gross unrealized appreciation for all investments in which there is an excess of value over tax cost | | $ | 18,570,087 | |
| | | | Aggregate gross unrealized depreciation for all investments in which there is an excess of tax cost over value | | | (21,563,977 | ) |
| | | | | | | | |
| | | | Net unrealized depreciation | | $ | (2,993,890 | ) |
| | | | | | | | |
| | | | |
| | (b) | | | Security (or a portion thereof) has been designated to cover the Fund’s obligations under open derivative contracts or TBA transactions. |
| | (c) | | | Variable rate security. Rate as of September 30, 2016 is disclosed. |
| | (d) | | | Fair valued by the Fund’s adviser. At September 30, 2016, the value of these securities amounted to $12,990,671 or 1.3% of net assets. See Note 2 of Notes to Financial Statements. |
| | (e) | | | Security represents right to receive monthly interest payments on an underlying pool of mortgages. Principal shown is the outstanding par amount of the pool held as of the end of the period. |
| | (f) | | | The Fund’s investment in mortgage related securities of Federal National Mortgage Association and Government National Mortgage Association are interests in separate pools of mortgages. All separate investments in securities of each issuer which have the same coupon rate have been aggregated for the purpose of presentation in the Portfolio of Investments. |
| | (g) | | | When-issued/delayed delivery. See Note 2 of Notes to Financial Statements. |
| | (h) | | | Illiquid security. (Unaudited) |
| | (i) | | | Securities classified as fair valued pursuant to the Fund’s pricing policies and procedures. At September 30, 2016, the value of these securities amounted to $8,104,262 or 0.8% of net assets. See Note 2 of Notes to Financial Statements. |
| | (j) | | | Interest rate represents discount rate at time of purchase; not a coupon rate. |
| |
| | 144A | | | All or a portion of these securities are exempt from registration under Rule 144A of the Securities Act of 1933. These securities may be resold in transactions exempt from registration, normally to qualified institutional buyers. At September 30, 2016, the value of Rule 144A holdings amounted to $249,368,024 or 24.5% of net assets. |
| | ABS | | | Asset-Backed Securities |
| | ARMs | | | Adjustable Rate Mortgages |
| | FHLMC | | | Federal Home Loan Mortgage Corp. |
| | FNMA | | | Federal National Mortgage Association |
| | GNMA | | | Government National Mortgage Association |
| | REMIC | | | Real Estate Mortgage Investment Conduit |
| | TBA | | | To Be Announced |
See accompanying notes to financial statements.
| 28
Portfolio of Investments – as of September 30, 2016
Loomis Sayles Securitized Asset Fund – continued
At September 30, 2016, open long futures contracts were as follows:
| | | | | | | | | | | | | | | | |
Financial Futures | | Expiration
Date | | | Contracts | | | Notional
Value | | | Unrealized
Appreciation
(Depreciation) | |
10 Year U.S. Treasury Note | | | 12/20/2016 | | | | 337 | | | $ | 44,189,125 | | | $ | 238,919 | |
30 Year U.S. Treasury Bond | | | 12/20/2016 | | | | 61 | | | | 10,257,531 | | | | (43,968 | ) |
| | | | | | | | | | | | | | | | |
Total | | | | | | | | | | | | | | $ | 194,951 | |
| | | | | | | | | | | | | | | | |
At September 30, 2016, open short futures contracts were as follows:
| | | | | | | | | | | | | | | | |
Financial Futures | | Expiration
Date | | | Contracts | | | Notional
Value | | | Unrealized
Appreciation
(Depreciation) | |
2 Year U.S. Treasury Note | | | 12/30/2016 | | | | 273 | | | $ | 59,641,969 | | | $ | (60,117 | ) |
5 Year U.S. Treasury Note | | | 12/30/2016 | | | | 551 | | | | 66,955,109 | | | | (150,309 | ) |
| | | | | | | | | | | | | | | | |
Total | | | | | | | | | | | | | | $ | (210,426 | ) |
| | | | | | | | | | | | | | | | |
Industry Summary at September 30, 2016
| | | | |
Mortgage Related | | | 47.3 | % |
Collateralized Mortgage Obligations | | | 22.0 | |
Non-Agency Commercial Mortgage-Backed Securities | | | 20.1 | |
ABS Car Loan | | | 12.6 | |
Agency Commercial Mortgage-Backed Securities | | | 5.5 | |
ABS Other | | | 4.4 | |
ABS Home Equity | | | 3.4 | |
ABS Student Loan | | | 2.4 | |
Other Investments, less than 2% each | | | 3.4 | |
Short-Term Investments | | | 7.0 | |
| | | | |
Total Investments | | | 128.1 | |
Other assets less liabilities (including futures contracts) | | | (28.1 | ) |
| | | | |
Net Assets | | | 100.0 | % |
| | | | |
See accompanying notes to financial statements.
29 |
Statements of Assets and Liabilities
September 30, 2016
| | | | | | | | |
| | | High Income
Opportunities
Fund | | | Securitized
Asset Fund | |
ASSETS | | | | | | | | |
Investments at cost | | $ | 131,970,788 | | | $ | 1,303,887,465 | |
Net unrealized appreciation (depreciation) | | | 2,723,944 | | | | (2,993,890 | ) |
| | | | | | | | |
Investments at value | | | 134,694,732 | | | | 1,300,893,575 | |
Cash | | | 3,121 | | | | 10,033,731 | |
Due from brokers (Note 2) | | | — | | | | 910,000 | |
Receivable for Fund shares sold | | | 251,216 | | | | 2,267,799 | |
Receivable for securities sold | | | — | | | | 215,259 | |
Receivable for when-issued/delayed delivery securities sold (Note 2) | | | — | | | | 288,640,625 | |
Collateral received for delayed delivery securities (Note 2) | | | — | | | | 1,024,000 | |
Dividends and interest receivable | | | 1,795,550 | | | | 3,920,604 | |
| | | | | | | | |
TOTAL ASSETS | | | 136,744,619 | | | | 1,607,905,593 | |
| | | | | | | | |
| | |
| LIABILITIES | | | | | | | | |
Payable for securities purchased | | | 1,016,756 | | | | 14,053,554 | |
Payable for when-issued/delayed delivery securities purchased (Note 2) | | | — | | | | 576,513,055 | |
Payable for Fund shares redeemed | | | 826 | | | | 349,534 | |
Due to brokers (Note 2) | | | — | | | | 1,024,000 | |
Payable for variation margin on futures contracts (Note 2) | | | — | | | | 89,941 | |
Other accounts payable and accrued expenses | | | 21,349 | | | | 16,966 | |
| | | | | | | | |
TOTAL LIABILITIES | | | 1,038,931 | | | | 592,047,050 | |
| | | | | | | | |
NET ASSETS | | $ | 135,705,688 | | | $ | 1,015,858,543 | |
| | | | | | | | |
NET ASSETS CONSIST OF: | | | | | | | | |
Paid-in capital | | $ | 133,821,168 | | | $ | 1,017,293,744 | |
Undistributed net investment income | | | 621,993 | | | | 6,923,736 | |
Accumulated net realized loss on investments, futures contracts and swap agreements | | | (1,461,417 | ) | | | (5,349,572 | ) |
Net unrealized appreciation (depreciation) on investments, futures contracts and swap agreements | | | 2,723,944 | | | | (3,009,365 | ) |
| �� | | | | | | | |
NET ASSETS | | $ | 135,705,688 | | | $ | 1,015,858,543 | |
| | | | | | | | |
| | |
| COMPUTATION OF NET ASSET VALUE AND OFFERING PRICE: | | | | | | | | |
Institutional Class: | | | | | | | | |
Net assets | | $ | 135,705,688 | | | $ | 1,015,858,543 | |
| | | | | | | | |
Shares of beneficial interest | | | 12,725,387 | | | | 96,114,831 | |
| | | | | | | | |
Net asset value, offering and redemption price per share | | $ | 10.66 | | | $ | 10.57 | |
| | | | | | | | |
See accompanying notes to financial statements.
| 30
Statements of Operations
For the Year Ended September 30, 2016
| | | | | | | | |
| | | High Income
Opportunities
Fund | | | Securitized
Asset Fund | |
INVESTMENT INCOME | | | | | | | | |
Interest | | $ | 7,752,193 | | | $ | 36,937,926 | |
Dividends | | | 157,188 | | | | — | |
Less net foreign taxes withheld | | | (2,216 | ) | | | — | |
| | | | | | | | |
Investment income | | | 7,907,165 | | | | 36,937,926 | |
| | | | | | | | |
| | |
| NET REALIZED AND UNREALIZED GAIN (LOSS) ON INVESTMENTS, FUTURES CONTRACTS AND SWAP AGREEMENTS | | | | | | | | |
Net realized gain (loss) on: | | | | | | | | |
Investments | | | (1,090,036 | ) | | | 11,898,381 | |
Futures contracts | | | (178,082 | ) | | | 3,747,980 | |
Swap agreements | | | (12,050 | ) | | | — | |
Net change in unrealized appreciation (depreciation) on: | | | | | | | | |
Investments | | | 8,707,108 | | | | (11,493,063 | ) |
Futures contracts | | | 94,209 | | | | (240,516 | ) |
Swap agreements | | | 155,510 | | | | — | |
| | | | | | | | |
Net realized and unrealized gain on investments, futures contracts and swap agreements | | | 7,676,659 | | | | 3,912,782 | |
| | | | | | | | |
| | |
| NET INCREASE IN NET ASSETS RESULTING FROM OPERATIONS | | $ | 15,583,824 | | | $ | 40,850,708 | |
| | | | | | | | |
See accompanying notes to financial statements.
31 |
Statements of Changes in Net Assets
| | | | | | | | | | | | | | | | |
| | | High Income Opportunities Fund | | | Securitized Asset Fund | |
| | | Year Ended
September 30, 2016 | | | Year Ended
September 30, 2015 | | | Year Ended
September 30, 2016 | | | Year Ended
September 30, 2015 | |
| FROM OPERATIONS: | | | | | | | | | | | | | | | | |
Investment income | | $ | 7,907,165 | | | $ | 5,611,702 | | | $ | 36,937,926 | | | $ | 31,304,527 | |
Net realized gain (loss) on investments, futures contracts and swap agreements | | | (1,280,168 | ) | | | 1,281,433 | | | | 15,646,361 | | | | 12,737,624 | |
Net change in unrealized appreciation (depreciation) on investments, futures contracts and swap agreements | | | 8,956,827 | | | | (9,407,119 | ) | | | (11,733,579 | ) | | | (8,233,795 | ) |
| | | | | | | | | | | | | | | | |
Net increase (decrease) in net assets resulting from operations | | | 15,583,824 | | | | (2,513,984 | ) | | | 40,850,708 | | | | 35,808,356 | |
| | | | | | | | | | | | | | | | |
| FROM DISTRIBUTIONS TO SHAREHOLDERS: | | | | | | | | | | | | | | | | |
Net investment income | | | | | | | | | | | | | | | | |
Institutional Class | | | (8,169,008 | ) | | | (5,404,902 | ) | | | (44,606,095 | ) | | | (45,553,367 | ) |
Net realized capital gains | | | | | | | | | | | | | | | | |
Institutional Class | | | (452,100 | ) | | | — | | | | — | | | | — | |
| | | | | | | | | | | | | | | | |
Total distributions | | | (8,621,108 | ) | | | (5,404,902 | ) | | | (44,606,095 | ) | | | (45,553,367 | ) |
| | | | | | | | | | | | | | | | |
| NET INCREASE IN NET ASSETS FROM CAPITAL SHARE TRANSACTIONS (NOTE 10) | | | 8,574,679 | | | | 58,743,789 | | | | 74,405,757 | | | | 130,545,963 | |
| | | | | | | | | | | | | | | | |
Net increase in net assets | | | 15,537,395 | | | | 50,824,903 | | | | 70,650,370 | | | | 120,800,952 | |
| NET ASSETS | | | | | | | | | | | | | | | | |
Beginning of the year | | | 120,168,293 | | | | 69,343,390 | | | | 945,208,173 | | | | 824,407,221 | |
| | | | | | | | | | | | | | | | |
End of the year | | $ | 135,705,688 | | | $ | 120,168,293 | | | $ | 1,015,858,543 | | | $ | 945,208,173 | |
| | | | | | | | | | | | | | | | |
| UNDISTRIBUTED NET INVESTMENT INCOME | | $ | 621,993 | | | $ | 687,851 | | | $ | 6,923,736 | | | $ | 5,198,597 | |
| | | | | | | | | | | | | | | | |
See accompanying notes to financial statements.
| 32
Financial Highlights
For a share outstanding throughout each period.
| | | | | | | | | | | | | | | | | | | | |
| | | High Income Opportunities Fund – Institutional Class | |
| | | Year Ended
September 30,
2016 | | | Year Ended
September 30,
2015 | | | Year Ended
September 30,
2014 | | | Year Ended
September 30,
2013 | | | Year Ended
September 30,
2012 | |
Net asset value, beginning of the period | | $ | 10.11 | | | $ | 10.92 | | | $ | 10.53 | | | $ | 10.35 | | | $ | 9.36 | |
INCOME (LOSS) FROM INVESTMENT OPERATIONS: | | | | | | | | | | | | | | | | | | | | |
Net investment income(a) | | | 0.60 | | | | 0.55 | | | | 0.62 | | | | 0.67 | | | | 0.72 | |
Net realized and unrealized gain (loss) | | | 0.60 | | | | (0.81 | ) | | | 0.43 | | | | 0.25 | | | | 1.01 | |
| | | | |
Total from Investment Operations | | | 1.20 | | | | (0.26) | | | | 1.05 | | | | 0.92 | | | | 1.73 | |
| | | | |
LESS DISTRIBUTIONS FROM: | | | | | | | | | | | | | | | | | | | | |
Net investment income | | | (0.62 | ) | | | (0.55 | ) | | | (0.66 | ) | | | (0.74 | ) | | | (0.74 | ) |
Net realized capital gains | | | (0.03 | ) | | | — | | | | — | | | | — | | | | — | |
| | | | |
Total Distributions | | | (0.65) | | | | (0.55) | | | | (0.66) | | | | (0.74) | | | | (0.74) | |
| | | | |
Net asset value, end of the period | | $ | 10.66 | | | $ | 10.11 | | | $ | 10.92 | | | $ | 10.53 | | | $ | 10.35 | |
| | | | |
Total return | | | 12.55 | %(c) | | | (2.61 | )% | | | 10.01 | % | | | 9.19 | % | | | 19.24 | % |
RATIOS TO AVERAGE NET ASSETS: | | | | | | | | | | | | | | | | | | | | |
Net assets, end of the period (000’s) | | $ | 135,706 | | | $ | 120,168 | | | $ | 69,343 | | | $ | 78,102 | | | $ | 74,121 | |
Net expenses(b) | | | — | | | | — | | | | — | | | | — | | | | — | |
Gross expenses(b) | | | — | | | | — | | | | — | | | | — | | | | — | |
Net investment income | | | 5.94 | % | | | 5.12 | % | | | 5.70 | % | | | 6.33 | % | | | 7.28 | % |
Portfolio turnover rate | | | 36 | % | | | 28 | % | | | 41 | % | | | 41 | % | | | 30 | % |
| (a) | | Per share net investment income has been calculated using the average shares outstanding during the period. | |
| (b) | | Loomis Sayles has agreed to pay, without reimbursement from the Fund, all expenses associated with the operations of the Fund. | |
| (c) | | Generally accepted accounting principles require adjustments to be made to the net assets of the Fund at period end for financial reporting purposes only, and as such, the total returns based on the adjusted net asset values per share may differ from the total returns reported in the average annual total return table. | |
| | | | | | | | | | | | | | | | | | | | |
| | | Securitized Asset Fund – Institutional Class | |
| | | Year Ended
September 30,
2016 | | | Year Ended
September 30,
2015 | | | Year Ended
September 30,
2014 | | | Year Ended
September 30,
2013 | | | Year Ended
September 30,
2012 | |
Net asset value, beginning of the period | | $ | 10.62 | | | $ | 10.73 | | | $ | 10.73 | | | $ | 11.39 | | | $ | 11.13 | |
| | | | |
INCOME (LOSS) FROM INVESTMENT OPERATIONS: | | | | | | | | | | | | | | | | | | | | |
Net investment income(a) | | | 0.40 | | | | 0.37 | | | | 0.41 | | | | 0.41 | | | | 0.45 | |
Net realized and unrealized gain (loss) | | | 0.04 | | | | 0.06 | | | | 0.14 | | | | (0.33 | ) | | | 0.55 | |
| | | | |
Total from Investment Operations | | | 0.44 | | | | 0.43 | | | | 0.55 | | | | 0.08 | | | | 1.00 | |
| | | | |
LESS DISTRIBUTIONS FROM: | | | | | | | | | | | | | | | | | | | | |
Net investment income | | | (0.49 | ) | | | (0.54 | ) | | | (0.55 | ) | | | (0.62 | ) | | | (0.54 | ) |
Net realized capital gains | | | — | | | | — | | | | — | | | | (0.12 | ) | | | (0.20 | ) |
| | | | |
Total Distributions | | | (0.49) | | | | (0.54) | | | | (0.55) | | | | (0.74) | | | | (0.74) | |
| | | | |
Net asset value, end of the period | | $ | 10.57 | | | $ | 10.62 | | | $ | 10.73 | | | $ | 10.73 | | | $ | 11.39 | |
| | | | |
Total return | | | 4.27 | % | | | 4.13 | % | | | 5.25 | % | | | 0.75 | % | | | 9.42 | % |
RATIOS TO AVERAGE NET ASSETS: | | | | | | | | | | | | | | | | | | | | |
Net assets, end of the period (000’s) | | $ | 1,015,859 | | | $ | 945,208 | | | $ | 824,407 | | | $ | 689,196 | | | $ | 713,366 | |
Net expenses(b) | | | — | | | | — | | | | — | | | | — | | | | — | |
Gross expenses(b) | | | — | | | | — | | | | — | | | | — | | | | — | |
Net investment income | | | 3.84 | % | | | 3.47 | % | | | 3.80 | % | | | 3.67 | % | | | 4.08 | % |
Portfolio turnover rate | | | 306 | % | | | 272 | % | | | 260 | % | | | 244 | % | | | 230 | % |
| (a) | | Per share net investment income has been calculated using the average shares outstanding during the period. | |
| (b) | | Loomis Sayles has agreed to pay, without reimbursement from the Fund, all expenses associated with the operations of the Fund. | |
See accompanying notes to financial statements.
33 |
Notes to Financial Statements
September 30, 2016
1. Organization. Loomis Sayles Funds I (the “Trust”) is organized as a Massachusetts business trust. The Trust is registered under the Investment Company Act of 1940, as amended (the “1940 Act”), as an open-end management investment company. The Declaration of Trust permits the Board of Trustees to authorize the issuance of an unlimited number of shares of the Trust in multiple series. The financial statements for certain funds of the Trust are presented in separate reports. The following funds (individually, a “Fund” and collectively, the “Funds”) are included in this report:
Loomis Sayles High Income Opportunities Fund (the “High Income Opportunities Fund”)
Loomis Sayles Securitized Asset Fund (the “Securitized Asset Fund”)
Each Fund is a diversified investment company.
Each Fund offers Institutional Class shares. The Funds’ shares are offered exclusively to investors in “wrap fee” programs approved by NGAM Advisors, L.P. (“NGAM Advisors”) and/or Loomis, Sayles & Company, L.P. (“Loomis Sayles”) and to institutional advisory clients of NGAM Advisors or Loomis Sayles that, in each case, meet the Funds’ policies as established by Loomis Sayles.
2. Significant Accounting Policies. The following is a summary of significant accounting policies consistently followed by each Fund in the preparation of its financial statements. The Funds’ financial statements follow the accounting and reporting guidelines provided for investment companies and are prepared in accordance with accounting principles generally accepted in the United States of America which require the use of management estimates that affect the reported amounts and disclosures in the financial statements. Actual results could differ from those estimates. Management has evaluated the events and transactions subsequent to year-end through the date the financial statements were issued and has determined that there were no material events that would require disclosure in the Funds’ financial statements.
a. Valuation. Fund securities and other investments are valued at market value based on market quotations obtained or determined by independent pricing services recommended by the adviser and approved by the Board of Trustees. Fund securities and other investments for which market quotations are not readily available are valued at fair value as determined in good faith by the adviser pursuant to procedures approved by the Board of Trustees, as described below. Market value is determined as follows:
Debt securities and unlisted preferred equity securities are valued based on evaluated bids furnished to the Funds by an independent pricing service or bid prices obtained from broker-dealers. Senior loans are valued at bid prices supplied by an independent pricing service, if available. Listed equity securities (including shares of closed-end investment companies and exchange-traded funds) are valued at the last sale price quoted on the exchange where they are traded most extensively or, if there is no reported sale during the day, the closing bid quotation as reported by an independent pricing service. Securities traded on the NASDAQ Global Select Market, NASDAQ Global Market and NASDAQ Capital Market are valued at the NASDAQ Official Closing Price (“NOCP”), or if lacking an NOCP, at the most recent bid quotations on the applicable NASDAQ Market. Unlisted equity securities (except unlisted preferred equity securities) are valued at the last sale price quoted in the market where they are traded most extensively or, if there is no reported sale during the day, the closing bid quotation as reported by an independent pricing service. If there is no last sale price or closing bid quotation available, unlisted equity securities will be valued using evaluated bids furnished by an independent pricing service, if available. In some foreign markets, an official close price and a last sale price may be available from the foreign exchange or market. In those cases, the official close price is used. Broker-dealer bid prices may be used to value debt and unlisted equity securities and senior loans where an independent pricing service is unable to price a security or where an independent pricing service does not provide a reliable price for the security. Forward foreign currency contracts are valued utilizing interpolated rates determined based on information provided by an independent pricing service. Futures contracts are valued at the most recent settlement price on the exchange on which the adviser believes that, over time, they are traded most extensively. Centrally cleared credit default swap agreements are valued at settlement prices of the clearinghouse on which the contracts were traded or prices obtained from broker-dealers. Bilateral credit default swaps are valued based on mid prices (between the bid price and the ask price) supplied by an independent pricing service.
Fund securities and other investments for which market quotations are not readily available are valued at fair value as determined in good faith by the adviser pursuant to procedures approved by the Board of Trustees. The Funds may also value securities and other investments at fair value in other circumstances such as when extraordinary events occur after the close of a foreign market but prior to the close of the New York Stock Exchange (“NYSE”). This may include situations relating to a single issuer (such as a declaration of bankruptcy or a delisting of the issuer’s security from the primary market on which it has traded) as well as events affecting the securities markets in general (such as market disruptions or closings and significant fluctuations in U.S. and/or foreign markets). When fair valuing its securities or other investments, the Funds may, among other things, use modeling tools or other processes that may take into account factors such as securities or other market activity and/or significant events that occur after the close of the foreign market and before the time the Fund’s net asset value (“NAV”) is calculated. Fair value pricing may require subjective determinations about the value of a security, and fair values used to determine a Fund’s NAV may differ from quoted or published prices, or from prices that are used by others, for the same securities. In addition, the use of fair value pricing may not always result in adjustments to the prices of securities held by a Fund.
Illiquid securities for which market quotations are readily available and have been evaluated by the adviser are considered and classified as fair valued securities.
| 34
Notes to Financial Statements – continued
September 30, 2016
As of September 30, 2016, securities held by the funds were fair valued as follows:
| | | | | | | | | | | | | | | | |
Fund | | Securities
classified as
fair valued | | | Percentage of
Net Assets | | | Securities fair
valued by the
Fund’s adviser | | | Percentage of
Net Assets | |
High Income Opportunities Fund | | $ | 899,214 | | | | 0.7% | | | $ | 116,605 | | | | 0.1% | |
Securitized Asset Fund | | | 8,104,262 | | | | 0.8% | | | | 12,990,671 | | | | 1.3% | |
b. Investment Transactions and Related Investment Income. Investment transactions are accounted for on a trade date plus one day basis for daily NAV calculation. However, for financial reporting purposes, investment transactions are reported on trade date. Dividend income is recorded on ex-dividend date, or in the case of certain foreign securities, as soon as a Fund is notified, and interest income is recorded on an accrual basis. Interest income is increased by the accretion of discount and decreased by the amortization of premium, if applicable. In determining net gain or loss on securities sold, the cost of securities has been determined on an identified cost basis.
c. Foreign Currency Translation. The books and records of the Funds are maintained in U.S. dollars. The values of securities, currencies and other assets and liabilities denominated in currencies other than U.S. dollars are translated into U.S. dollars based upon foreign exchange rates prevailing at the end of the period. Purchases and sales of investment securities, income and expenses are translated into U.S. dollars on the respective dates of such transactions.
Net realized foreign exchange gains or losses arise from sales of foreign currency, changes in exchange rates between the trade and settlement dates on securities transactions and the difference between the amounts of dividends, interest and foreign withholding taxes recorded on the Funds’ books and the U.S. dollar equivalent of the amounts actually received or paid. Net unrealized foreign exchange gains or losses arise from changes in the value of assets and liabilities, other than investment securities, as of the end of the fiscal period, resulting from changes in exchange rates. Net realized foreign exchange gains or losses and the net change in unrealized foreign exchange gains or losses are disclosed in the Statements of Operations.
The values of investment securities are presented at the foreign exchange rates prevailing at the end of the period for financial reporting purposes. Net realized and unrealized gains or losses on investments reported in the Statements of Operations reflect gains or losses resulting from changes in exchange rates and fluctuations which arise due to changes in market prices of investment securities. For federal income tax purposes, a portion of the net realized gain or loss on investments arising from changes in exchange rates, which is reflected in the Statements of Operations, may be characterized as ordinary income and may, if the Funds have net losses, reduce the amount of income available to be distributed by the Funds.
The Funds may use foreign currency exchange contracts to facilitate transactions in foreign-denominated investments. Losses may arise from changes in the value of the foreign currency or if the counterparties do not perform under the contracts’ terms.
d. Forward Foreign Currency Contracts. The Funds may enter into forward foreign currency contracts, including forward foreign cross currency contracts, to acquire exposure to foreign currencies or to hedge the Funds’ investments against currency fluctuation. A contract can also be used to offset a previous contract. These contracts involve market risk in excess of the unrealized gain or loss reflected in the Funds’ Statements of Assets and Liabilities. The U.S. dollar value of the currencies a Fund has committed to buy or sell represents the aggregate exposure to each currency a Fund has acquired or hedged through currency contracts outstanding at period end. Gains or losses are recorded for financial statement purposes as unrealized until settlement date. Contracts are traded over-the-counter directly with a counterparty. Risks may arise upon entering into these contracts from the potential inability of counterparties to meet the terms of their contracts and from unanticipated movements in the value of a foreign currency relative to the U.S. dollar. Certain contracts may require the movement of cash and/or securities as collateral for the Funds’ or counterparty’s net obligations under the contracts.
No forward foreign currency contracts were held by the Funds during the year ended September 30, 2016.
e. Futures Contracts. The Funds may enter into futures contracts. Futures contracts are agreements between two parties to buy and sell a particular instrument or index for a specified price on a specified future date.
When a Fund enters into a futures contract, it is required to deposit with (or for the benefit of) its broker an amount of cash or short-term high-quality securities as “initial margin.” As the value of the contract changes, the value of the futures contract position increases or declines. Subsequent payments, known as “variation margin,” are made or received by a Fund, depending on the price fluctuations in the fair value of the contract and the value of cash or securities on deposit with the broker. The aggregate principal amounts of the contracts are not recorded in the financial statements. Fluctuations in the value of the contracts are recorded in the Statements of Assets and Liabilities as an asset (liability) and in the Statements of Operations as unrealized appreciation (depreciation) until the contracts are closed, when they are recorded as realized gains (losses). Realized gain or loss on a futures position is equal to the difference between the value of the contract at the time it was opened and the value at the time it was closed, minus brokerage commissions. When a Fund enters into a futures contract certain risks may arise, such as illiquidity in the futures market, which may limit a Fund’s ability to close out a futures contract prior to settlement date, and unanticipated movements in the value of securities or interest rates.
35 |
Notes to Financial Statements – continued
September 30, 2016
Futures contracts are exchange-traded. Exchange-traded futures contracts are standardized and are settled through a clearing house with fulfillment supported by the credit of the exchange. Therefore, counterparty credit risks to the Funds are reduced; however, in the event that a counterparty enters into bankruptcy, a Fund’s claim against initial/variation margin on deposit with the counterparty may be subject to terms of a final settlement in bankruptcy court.
f. Swap Agreements. The Funds may enter into credit default swaps. A credit default swap is an agreement between two parties (the “protection buyer” and “protection seller”) to exchange the credit risk of an issuer (“reference obligation”) for a specified time period. The reference obligation may be one or more debt securities or an index of such securities. The Funds may be either the protection buyer or the protection seller. As a protection buyer, the Funds have the ability to hedge the downside risk of an issuer or group of issuers. As a protection seller, the Funds have the ability to gain exposure to an issuer or group of issuers whose bonds are unavailable or in short supply in the cash bond market, as well as realize additional income in the form of fees paid by the protection buyer. The protection buyer is obligated to pay the protection seller a stream of payments (“fees”) over the term of the contract, provided that no credit event, such as a default or a downgrade in credit rating, occurs on the reference obligation. The Funds may also pay or receive upfront premiums. If a credit event occurs, the protection seller must pay the protection buyer the difference between the agreed upon notional value and market value of the reference obligation. Market value in this case is determined by a facilitated auction whereby a minimum number of allowable broker bids, together with a specified valuation method, are used to calculate the value. The maximum potential amount of undiscounted future payments that a Fund as the protection seller could be required to make under a credit default swap agreement would be an amount equal to the notional amount of the agreement.
Implied credit spreads, represented in absolute terms, are disclosed in the Portfolio of Investments for those agreements for which the Fund is the protection seller. Implied credit spreads serve as an indicator of the current status of the payment/performance risk and represent the likelihood or risk of default for the credit derivative. The implied credit spread of a particular reference entity reflects the cost of buying/selling protection and may include upfront payments required to be made to enter into the agreement. Wider credit spreads represent a deterioration of the reference entity’s credit soundness and a greater likelihood or risk of default or other credit event occurring as defined under the terms of the agreement.
The notional amounts of swap agreements are not recorded in the financial statements. Swap agreements are valued daily, and fluctuations in value are recorded in the Statements of Operations as change in unrealized appreciation (depreciation) on swap agreements. Fees are accrued in accordance with the terms of the agreement and are recorded in the Statements of Assets and Liabilities as fees receivable or payable. When received or paid, fees are recorded in the Statements of Operations as realized gain or loss. Upfront premiums paid or received by the Funds are recorded on the Statements of Assets and Liabilities as an asset or liability, respectively, and are amortized or accreted over the term of the agreement and recorded as realized gain or loss. Payments made or received by the Funds as a result of a credit event or termination of the agreement are recorded as realized gain or loss.
Swap agreements are privately negotiated in the over-the-counter market and may be entered into as a bilateral contract or centrally cleared (“centrally cleared swaps”). Bilateral swap agreements are traded between counterparties and, as such, are subject to the risk that a party to the agreement will not be able to meet its obligations. In a centrally cleared swap, immediately following execution of the swap agreement, the swap agreement is novated to a central counterparty (the “CCP”) and the Fund faces the CCP through a broker. Upon entering into a centrally cleared swap, the Fund is required to deposit initial margin with the broker in the form of cash or securities in an amount that varies depending on the size and risk profile of the particular swap. Subsequent payments, known as “variation margin,” are made or received by the Fund based on the daily change in the value of the centrally cleared swap agreement. For centrally cleared swaps, the Fund’s counterparty credit risk is reduced as the CCP stands between the Fund and the counterparty. The Funds cover their net obligations under outstanding swap agreements by segregating or earmarking cash or securities.
g. When-Issued and Delayed Delivery Transactions. The Funds may enter into when-issued or delayed delivery transactions. When-issued refers to transactions made conditionally because a security, although authorized, has not been issued. Delayed delivery refers to transactions for which delivery or payment will occur at a later date, beyond the normal settlement period. The price of when-issued and delayed delivery securities and the date when the securities will be delivered and paid for are fixed at the time the transaction is negotiated. The security and the obligation to pay for it are recorded by the Funds at the time the commitment is entered into. The value of the security may vary with market fluctuations during the time before the Funds take delivery of the security. No interest accrues to the Funds until the transaction settles.
Delayed delivery transactions include those designated as To Be Announced (“TBAs”) in the Portfolios of Investments. For TBAs, the actual security that will be delivered to fulfill the transaction is not designated at the time of the trade. The security is “to be announced” 48 hours prior to the established trade settlement date. Certain transactions require the Funds or counterparty to post cash and/or securities as collateral for the net mark-to-market exposure to the other party. The Funds cover their net obligations under outstanding delayed delivery commitments by segregating or earmarking cash or securities at the custodian.
Purchases of when-issued or delayed delivery securities may have a similar effect on the Funds’ NAV as if the Funds’ had created a degree of leverage in the portfolio. Risks may arise upon entering into such transactions from the potential inability of counterparties to meet their obligations under the transactions. Additionally, losses may arise due to changes in the value of the underlying securities.
| 36
Notes to Financial Statements – continued
September 30, 2016
h. Stripped Securities. Each Fund may invest in stripped securities, which are usually structured with two or more classes that receive different proportions of the interest and principal distribution on a pool of U.S. or foreign government securities or mortgage assets. In some cases, one class will receive all of the interest (the interest-only or “IO” class), while the other class will receive all of the principal (the principal-only or “PO” class). Stripped securities commonly have greater market volatility than other types of fixed-income securities. In the case of stripped mortgage securities, if the underlying mortgage assets experience greater than anticipated prepayments of principal, a Fund may fail to recoup fully its investments in IOs.
i. Federal and Foreign Income Taxes. The Trust treats each Fund as a separate entity for federal income tax purposes. Each Fund intends to meet the requirements of the Internal Revenue Code of 1986, as amended, applicable to regulated investment companies, and to distribute to its shareholders substantially all of its investment income and any net realized capital gains at least annually. Management has performed an analysis of each Fund’s tax positions for the open tax years as of September 30, 2016 and has concluded that no provisions for income tax are required. The Funds’ federal tax returns for the prior three fiscal years remain subject to examination by the Internal Revenue Service. Management is not aware of any events that are reasonably possible to occur in the next twelve months that would result in the amounts of any unrecognized tax benefits significantly increasing or decreasing for the Funds. However, management’s conclusions regarding tax positions taken may be subject to review and adjustment at a later date based on factors including, but not limited to, new tax laws and accounting regulations and interpretations thereof.
A Fund may be subject to foreign withholding taxes on investment income and taxes on capital gains on investments that are accrued and paid based upon the Fund’s understanding of the tax rules and regulations that exist in the countries in which the Fund invests. Foreign withholding taxes on dividend and interest income are reflected on the Statements of Operations as a reduction of investment income, net of amounts eligible to be reclaimed. Dividends and interest receivable on the Statements of Assets and Liabilities are net of foreign withholding taxes. Foreign withholding taxes where reclaims have been or will be filed are reflected on the Statements of Assets and Liabilities as tax reclaims receivable. Capital gains taxes paid are included in net realized gain (loss) on investments in the Statements of Operations. Accrued but unpaid capital gains taxes are reflected as foreign taxes payable on the Statements of Assets and Liabilities, if applicable, and reduce unrealized gains on investments. In the event that realized gains on investments are subsequently offset by realized losses, taxes paid on realized gains may be returned to a Fund. Such amounts, if applicable, are reflected as foreign tax rebates receivable on the Statements of Assets and Liabilities and are recorded as a realized gain when received.
j. Dividends and Distributions to Shareholders. Dividends and distributions are recorded on ex-dividend date. The timing and characterization of certain income and capital gain distributions are determined in accordance with federal tax regulations, which may differ from accounting principles generally accepted in the United States of America. Permanent differences are primarily due to differing treatments for book and tax purposes of items such as premium amortization, from corporate actions, defaulted bonds and/or non-income producing securities, contingent payment debt instruments, distribution re-designations, return of capital distributions received, convertible bonds and paydown gains and losses. Permanent book and tax basis differences relating to shareholder distributions will result in reclassifications to capital accounts reported on the Statements of Assets and Liabilities. Temporary differences between book and tax distributable earnings are primarily due to wash sales, from corporate actions, premium amortization, defaulted bonds and/or non-income producing securities, contingent payment debt instruments, convertible bonds and futures contracts mark-to-market. Amounts of income and capital gain available to be distributed on a tax basis are determined annually, and at other times during the Funds’ fiscal year as may be necessary to avoid knowingly declaring and paying a return of capital distribution. Distributions from net investment income and short-term capital gains are considered to be distributed from ordinary income for tax purposes.
The tax characterization of distributions is determined on an annual basis. The tax characterization of distributions paid to shareholders during the years ended September 30, 2016 and 2015 were as follows:
| | | | | | | | | | | | | | | | | | | | | | | | |
| | | 2016 Distributions Paid From: | | | 2015 Distributions Paid From: | |
Fund | | Ordinary
Income | | | Long-Term
Capital Gains | | | Total | | | Ordinary
Income | | | Long-Term
Capital Gains | | | Total | |
High Income Opportunities Fund | | $ | 8,164,479 | | | $ | 456,629 | | | $ | 8,621,108 | | | $ | 5,404,902 | | | $ | — | | | $ | 5,404,902 | |
Securitized Asset Fund | | | 44,606,095 | | | | — | | | | 44,606,095 | | | | 45,553,367 | | | | — | | | | 45,553,367 | |
Differences between these amounts and those reported in the Statements of Changes in Net Assets are primarily attributable to different book and tax treatment for short-term capital gains.
37 |
Notes to Financial Statements – continued
September 30, 2016
As of September 30, 2016, the components of distributable earnings on a tax basis were as follows:
| | | | | | | | |
| | | High Income
Opportunities
Fund | | | Securitized Asset
Fund | |
Undistributed ordinary income | | $ | 711,892 | | | $ | 6,923,736 | |
| | | | | | | | |
Capital loss carryforward: | | | | | | | | |
Short-term: | | | | | | | | |
No expiration date | | | (239,774 | ) | | | — | |
Long-term: | | | | | | | | |
No expiration date | | | (1,054,802 | ) | | | (5,365,047 | ) |
| | | | | | | | |
Total capital loss carryforward | | | (1,294,576 | ) | | | (5,365,047 | ) |
| | | | | | | | |
Unrealized appreciation (depreciation) | | | 2,544,901 | | | | (2,993,890 | ) |
| | | | | | | | |
Total accumulated earnings (losses) | | $ | 1,962,217 | | | $ | (1,435,201 | ) |
| | | | | | | | |
Capital loss carryforward utilized in the current year | | $ | — | | | $ | 6,012,537 | |
| | | | | | | | |
k. Repurchase Agreements. Each Fund may enter into repurchase agreements, under the terms of a Master Repurchase Agreement, under which each Fund acquires securities as collateral and agrees to resell the securities at an agreed upon time and at an agreed upon price. It is each Fund’s policy that the market value of the collateral for repurchase agreements be at least equal to 102% of the repurchase price, including interest. Certain repurchase agreements are tri-party arrangements whereby the collateral is held in a segregated account for the benefit of the Fund and on behalf of the counterparty. Repurchase agreements could involve certain risks in the event of default or insolvency of the counterparty, including possible delays or restrictions upon a Fund’s ability to dispose of the underlying securities. As of September 30, 2016, each Fund, as applicable, had investments in repurchase agreements for which the value of the related collateral exceeded the value of the repurchase agreement. The gross value of repurchase agreements is included in the Statements of Assets and Liabilities for financial reporting purposes.
l. Due to/from Brokers. Transactions and positions in certain futures contracts and delayed delivery commitments are maintained and cleared by registered U.S. broker/dealers pursuant to customer agreements between the Funds and the various broker/dealers. The due to brokers balance in the Statement of Assets and Liabilities for Securitized Asset Fund represents cash received as collateral for delayed delivery securities. The due from brokers balance in the Statement of Assets and Liabilities for Securitized Asset Fund represents cash pledged as initial margin for futures contracts. In certain circumstances the Fund’s use of cash held at brokers is restricted by regulation or broker mandated limits.
m. Securities Lending. The Funds have entered into an agreement with State Street Bank and Trust Company (“State Street Bank”), as agent of the Funds, to lend securities to certain designated borrowers. The loans are collateralized with cash or securities in an amount equal to at least 105% or 102% of the market value (including accrued interest) of the loaned international or domestic securities, respectively, when the loan is initiated. Thereafter, the value of the collateral must remain at least 102% of the market value (including accrued interest) of loaned securities for U.S. equities and U.S. corporate debt; at least 105% of the market value (including accrued interest) of loaned securities for non-U.S. equities; and at least 100% of the market value (including accrued interest) of loaned securities for U.S. Government securities, sovereign debt issued by non-U.S. Governments and non-U.S. corporate debt. In the event that the market value of the collateral falls below the required percentages described above, the borrower will deliver additional collateral on the next business day. As with other extensions of credit, the Funds may bear the risk of loss with respect to the investment of the collateral. The Funds invest cash collateral in short-term investments, a portion of the income from which is remitted to the borrowers and the remainder allocated between the Funds and State Street Bank as lending agent.
For the year ended September 30, 2016, neither Fund had loaned securities under this agreement.
n. Indemnifications. Under the Trust’s organizational documents, its officers and Trustees are indemnified against certain liabilities arising out of the performance of their duties to the Funds. Additionally, in the normal course of business, the Funds enter into contracts with service providers that contain general indemnification clauses. The Funds’ maximum exposure under these arrangements is unknown as this would involve future claims that may be made against the Funds that have not yet occurred. However, based on experience, the Funds expect the risk of loss to be remote.
3. Fair Value Measurements. In accordance with accounting standards related to fair value measurements and disclosures, the Funds have categorized the inputs utilized in determining the value of each Fund’s assets or liabilities. These inputs are summarized in the three broad levels listed below:
| | • | | Level 1—quoted prices in active markets for identical assets or liabilities; |
| | • | | Level 2—prices determined using other significant inputs that are observable either directly, or indirectly through corroboration with observable market data (which could include quoted prices for similar assets or liabilities, interest rates, credit risk, etc.); and |
| 38
Notes to Financial Statements – continued
September 30, 2016
| | • | | Level 3—prices determined using significant unobservable inputs when quoted prices or observable inputs are unavailable such as when there is little or no market activity for an asset or liability (unobservable inputs reflect each Fund’s own assumptions in determining the fair value of assets or liabilities and would be based on the best information available). |
The inputs or methodology used for valuing securities are not necessarily an indication of the risk associated with investing in those securities.
The Funds’ pricing policies and procedures are recommended by the adviser and approved by the Board of Trustees. Debt securities are valued based on evaluated bids furnished to the Funds by an independent pricing service. Broker-dealer bid prices may be used if an independent pricing service either is unable to price a security or does not provide a reliable price for a security. Broker-dealer bid prices for which the Funds do not have knowledge of the inputs used by the broker-dealer are categorized in Level 3. All security prices, including those obtained from an independent pricing service and broker-dealer bid prices, are reviewed on a daily basis by the adviser, subject to oversight by Fund management and the Board of Trustees. If the adviser, in good faith, believes that the price provided by an independent pricing service is unreliable, broker-dealer bid prices may be used until the price provided by the independent pricing service is considered to be reliable. Reliability of all security prices, including those obtained from an independent pricing service and broker-dealer bid prices, is tested in a variety of ways, including comparison to recent transaction prices and daily fluctuations, amongst other validation procedures in place. Securities for which market quotations are not readily available are valued at fair value as determined in good faith by the Funds’ adviser pursuant to procedures approved by the Board of Trustees. Fair valued securities may be categorized in Level 3.
The following is a summary of the inputs used to value the Funds’ investments as of September 30, 2016, at value:
High Income Opportunities Fund
Asset Valuation Inputs
| | | | | | | | | | | | | | | | |
Description | | Level 1 | | | Level 2 | | | Level 3 | | | Total | |
Bonds and Notes | | | | | | | | | | | | | | | | |
Non-Convertible Bonds | | | | | | | | | | | | | | | | |
Home Construction | | $ | — | | | $ | 2,234,363 | | | $ | 4 | (b) | | $ | 2,234,367 | |
Non-Agency Commercial Mortgage-Backed Securities | | | — | | | | 1,262,029 | | | | 573,514 | (c) | | | 1,835,543 | |
Transportation Services | | | — | | | | 237,459 | | | | 113,265 | (b) | | | 350,724 | |
All Other Non-Convertible Bonds(a) | | | — | | | | 114,784,754 | | | | — | | | | 114,784,754 | |
| | | | | | | | | | | | | | | | |
Total Non-Convertible Bonds | | | — | | | | 118,518,605 | | | | 686,783 | | | | 119,205,388 | |
| | | | | | | | | | | | | | | | |
Convertible Bonds(a) | | | — | | | | 4,295,334 | | | | — | | | | 4,295,334 | |
| | | | | | | | | | | | | | | | |
Total Bonds and Notes | | | — | | | | 122,813,939 | | | | 686,783 | | | | 123,500,722 | |
| | | | | | | | | | | | | | | | |
Senior Loans(a) | | | — | | | | 578,868 | | | | — | | | | 578,868 | |
Preferred Stocks | | | | | | | | | | | | | | | | |
Midstream | | | — | | | | 392,659 | | | | — | | | | 392,659 | |
Pharmaceuticals | | | 964,594 | | | | 915,657 | | | | — | | | | 1,880,251 | |
All Other Preferred Stocks(a) | | | 665,137 | | | | — | | | | — | | | | 665,137 | |
| | | | | | | | | | | | | | | | |
Total Preferred Stocks | | | 1,629,731 | | | | 1,308,316 | | | | — | | | | 2,938,047 | |
| | | | | | | | | | | | | | | | |
Common Stocks(a) | | | 383,511 | | | | — | | | | — | | | | 383,511 | |
| | | | | | | | | | | | | | | | |
Warrants(d) | | | — | | | | — | | | | 3,336 | (b) | | | 3,336 | |
Short-Term Investments | | | — | | | | 7,290,248 | | | | — | | | | 7,290,248 | |
| | | | | | | | | | | | | | | | |
Total | | $ | 2,013,242 | | | $ | 131,991,371 | | | $ | 690,119 | | | $ | 134,694,732 | |
| | | | | | | | | | | | | | | | |
(a) Details of the major categories of the Fund’s investments are reflected within the Portfolio of Investments.
(b) Fair valued by the Fund’s adviser.
(c) Valued using broker-dealer bid prices.
(d) Includes a security fair valued at zero using Level 2 inputs.
39 |
Notes to Financial Statements – continued
September 30, 2016
Securitized Asset Fund
Asset Valuation Inputs
| | | | | | | | | | | | | | | | |
Description | | Level 1 | | | Level 2 | | | Level 3 | | | Total | |
Bonds and Notes | | | | | | | | | | | | | | | | |
ABS Car Loan | | $ | — | | | $ | 123,201,962 | | | $ | 5,037,047 | (b) | | $ | 128,239,009 | |
ABS Home Equity | | | — | | | | 33,393,879 | | | | 1,303,154 | (c) | | | 34,697,033 | |
ABS Other | | | — | | | | 40,626,353 | | | | 4,046,953 | (b) | | | 44,673,306 | |
Collateralized Mortgage Obligations | | | — | | | | 205,095,499 | | | | 18,241,211 | (d) | | | 223,336,710 | |
Mortgage Related | | | — | | | | 476,539,123 | | | | 3,754,871 | (e) | | | 480,293,994 | |
Non-Agency Commercial Mortgage-Backed Securities | | | — | | | | 198,815,850 | | | | 5,374,722 | (b) | | | 204,190,572 | |
All Other Bonds and Notes(a) | | | — | | | | 114,097,678 | | | | — | | | | 114,097,678 | |
| | | | | | | | | | | | | | | | |
Total Bonds and Notes | | | — | | | | 1,191,770,344 | | | | 37,757,958 | | | | 1,229,528,302 | |
| | | | | | | | | | | | | | | | |
Short-Term Investments | | | — | | | | 71,365,273 | | | | — | | | | 71,365,273 | |
| | | | | | | | | | | | | | | | |
Total Investments | | | — | | | | 1,263,135,617 | | | | 37,757,958 | | | | 1,300,893,575 | |
| | | | | | | | | | | | | | | | |
Futures Contracts (unrealized appreciation) | | | 238,919 | | | | — | | | | — | | | | 238,919 | |
| | | | | | | | | | | | | | | | |
Total | | $ | 238,919 | | | $ | 1,263,135,617 | | | $ | 37,757,958 | | | $ | 1,301,132,494 | |
| | | | | | | | | | | | | | | | |
| Liability Valuation Inputs | | | | | | | | | | | | | | | | |
Description | | Level 1 | | | Level 2 | | | Level 3 | | | Total | |
Futures Contracts (unrealized depreciation) | | $ | (254,394 | ) | | $ | — | | | $ | — | | | $ | (254,394 | ) |
| | | | | | | | | | | | | | | | |
(a) Details of the major categories of the Fund’s investments are reflected within the Portfolio of Investments.
(b) Valued using broker-dealer bid prices.
(c) Fair valued by the Fund’s adviser.
(d) Valued using broker-dealer bid prices ($6,703,776) or fair valued by the Fund’s adviser ($11,537,435).
(e) Valued using broker-dealer bid prices ($3,604,789) or fair valued by the Fund’s adviser ($150,082).
The following is a reconciliation of Level 3 investments for which significant unobservable inputs were used to determine fair value as of September 30, 2015 and/or September 30, 2016:
High Income Opportunities Fund
Asset Valuation Inputs
| | | | | | | | | | | | | | | | | | | | | | | | | | | | | | | | | | | | | | | | |
Investments in
Securities | | Balance
as of
Septem
ber 30,
2015 | | | Accrued
Discounts
(Premiums) | | | Realized
Gain
(Loss) | | | Change in
Unrealized
Appreciation
(Depreciation) | | | Purchases | | | Sales | | | Transfers
into
Level 3 | | | Transfers
out of
Level 3 | | | Balance
as of
Septem
ber 30,
2016 | | | Change in
Unrealized
Appreciation
(Depreciation)
from
Investments
Still Held at
September 30,
2016 | |
Bonds and Notes | | | | | | | | | | | | | | | | | | | | | | | | | | | | | | | | | | | | | | | | |
Non-
Convertible Bonds | | | | | | | | | | | | | | | | | | | | | | | | | | | | | | | | | | | | | | | | |
ABS Other | | $ | 241,176 | | | $ | — | | | $ | — | | | $ | — | | | $ | — | | | $ | — | | | $ | — | | | $ | (241,176 | ) | | $ | — | | | $ | — | |
Home Construction | | | — | | | | 276 | | | | — | | | | (12,292 | ) | | | — | | | | — | | | | 12,020 | | | | — | | | | 4 | | | | (12,292 | ) |
Non-Agency Commercial Mortgage-
Backed Securities | | | 590,000 | | | | — | | | | — | | | | (16,486 | ) | | | — | | | | — | | | | — | | | | — | | | | 573,514 | | | | (16,486 | ) |
Retailers | | | 307,361 | | | | — | | | | — | | | | — | | | | — | | | | — | | | | — | | | | (307,361 | ) | | | — | | | | — | |
Transportation Services | | | 167,081 | | | | — | | | | 7,976 | | | | (11,150 | ) | | | — | | | | (50,642 | ) | | | — | | | | — | | | | 113,265 | | | | (1,402 | ) |
Warrants | | | — | | | | — | | | | — | | | | 3,336 | | | | — | | | | — | | | | — | | | | — | | | | 3,336 | (a) | | | 3,336 | |
| | | | | | | | | | | | | | | | | | | | | | | | | | | | | | | | | | | | | | | | |
Total | | $ | 1,305,618 | | | $ | 276 | | | $ | 7,976 | | | $ | (36,592 | ) | | $ | — | | | $ | (50,642 | ) | | $ | 12,020 | | | $ | (548,537 | ) | | $ | 690,119 | | | $ | (26,844 | ) |
| | | | | | | | | | | | | | | | | | | | | | | | | | | | | | | | | | | | | | | | |
(a) Includes a security fair valued at zero using Level 3 inputs.
A debt security valued at $241,176 was transferred from Level 3 to Level 2 during the period ended September 30, 2016. At September 30, 2015, this security was valued using broker-dealer bid prices based on inputs unobservable to the Fund as an independent pricing service was unable to price the security. At September 30, 2016, this security was valued on the basis of evaluated bids furnished to the Fund by an independent pricing service in accordance with the Fund’s valuation policies.
Debt securities valued at $12,020 were transferred from Level 2 to Level 3 during the period ended September 30, 2016. At September 30, 2015, these securities were valued on the basis of evaluated bids furnished to the Fund by an independent pricing service in accordance with the Fund’s valuation policies. At September 30, 2016, these securities were valued at fair value as determined in good faith by the Fund’s adviser as an independent pricing service did not provide a reliable price for the securities.
| 40
Notes to Financial Statements – continued
September 30, 2016
A debt security valued at $307,361 was transferred from Level 3 to Level 2 during the period ended September 30, 2016. At September 30, 2015, this security was valued at fair value as determined in good faith by the Fund’s investment adviser as an independent pricing service did not provide a reliable price for the security. At September 30, 2016, this security was valued on the basis of evaluated bids furnished to the Fund by an independent pricing service in accordance with the Fund’s valuation policies.
All transfers are recognized as of the beginning of the reporting period.
Securitized Asset Fund
Asset Valuation Inputs
| | | | | | | | | | | | | | | | | | | | | | | | | | | | | | | | | | | | | | | | |
Investments in
Securities | | Balance
as of
Septem
ber 30,
2015 | | | Accrued
Discounts
(Premiums) | | | Realized
Gain
(Loss) | | | Change in
Unrealized
Appreciation
(Depreciation) | | | Purchases | | | Sales | | | Transfers
into
Level 3 | | | Transfers
out of
Level 3 | | | Balance
as of
Septem
ber 30,
2016 | | | Change in
Unrealized
Appreciation
(Depreciation)
from
Investments
Still Held at
September 30,
2016 | |
Bonds and Notes | | | | | | | | | | | | | | | | | | | | | | | | | | | | | | | | | | | | | | | | |
Non-
Convertible Bonds | | | | | | | | | | | | | | | | | | | | | | | | | | | | | | | | | | | | | | | | |
ABS Car Loan | | $ | 1,902,944 | | | $ | — | | | $ | — | | | $ | (2,110 | ) | | $ | 5,039,157 | | | $ | — | | | $ | — | | | $ | (1,902,944 | ) | | $ | 5,037,047 | | | $ | (2,110 | ) |
ABS Home Equity | | | 1,971,905 | | | | — | | | | 91,075 | | | | (131,793 | ) | | | — | | | | (628,033 | ) | | | — | | | | — | | | | 1,303,154 | | | | (13,519 | ) |
ABS Other | | | 10,620,593 | | | | — | | | | 3,033 | | | | (11,757 | ) | | | 3,044,883 | | | | (439,053 | ) | | | — | | | | (9,170,746 | ) | | | 4,046,953 | | | | (1,092 | ) |
Collateralized Mortgage Obligations | | | 3,673,400 | | | | — | | | | (3,248,887 | ) | | | (245,098 | ) | | | 7,150,586 | | | | (3,182,353 | ) | | | 14,093,563 | | | | — | | | | 18,241,211 | | | | (245,098 | ) |
Mortgage Related | | | 1,477,722 | | | | — | | | | (77,010 | ) | | | (20,153 | ) | | | 2,374,312 | | | | — | | | | — | | | | — | | | | 3,754,871 | | | | (20,153 | ) |
Non-Agency Commercial Mortgage-Backed Securities | | | 5,376,412 | | | | — | | | | — | | | | (1,690 | ) | | | — | | | | — | | | | — | | | | — | | | | 5,374,722 | | | | (1,689 | ) |
| | | | | | | | | | | | | | | | | | | | | | | | | | | | | | | | | | | | | | | | |
Total | | $ | 25,022,976 | | | $ | — | | | $ | (3,231,789 | ) | | $ | (412,601 | ) | | $ | 17,608,938 | | | $ | (4,249,439 | ) | | $ | 14,093,563 | | | $ | (11,073,690 | ) | | $ | 37,757,958 | | | $ | (283,661 | ) |
| | | | | | | | | | | | | | | | | | | | | | | | | | | | | | | | | | | | | | | | |
Debt securities valued at $11,073,690 were transferred from Level 3 to Level 2 during the period ended September 30, 2016. At September 30, 2015, these securities were valued using broker-dealer bid prices based on inputs unobservable to the Fund as an independent pricing service was unable to price the securities. At September 30, 2016, these securities were valued on the basis of evaluated bids furnished to the Fund by an independent pricing service in accordance with the Fund’s valuation policies.
Debt securities valued at $14,093,563 were transferred from Level 2 to Level 3 during the period ended September 30, 2016. At September 30, 2015, these securities were valued on the basis of evaluated bids furnished to the Fund by an independent pricing service in accordance with the Fund’s valuation policies. At September 30, 2016, these securities were valued at fair value as determined in good faith by the Fund’s adviser as an independent pricing service did not provide a reliable price for the securities.
All transfers are recognized as of the beginning of the reporting period.
The significant unobservable inputs used for those securities fair valued by the adviser and categorized in Level 3 as of September 30, 2016, were as follows:
| | | | | | | | | | | | | | | | |
Description | | Valuation Technique(s) | | | Unobservable Input | | | Unobservable
Input Value(s) | | | Value | |
Bonds and Notes | | | | | | | | | | | | | | | | |
ABS Home Equity | | | Market Discount | | | | Discount Rate1 | | | | 1.50 – 3.50% | | | $ | 1,303,154 | |
Collateralized Mortgage Obligations | | | Market Discount | | | | Discount Rate1 | | | | 1.00 – 3.00% | | | | 11,537,435 | |
Mortgage Related | | | Market Discount | | | | Discount Rate1 | | | | 1.25% | | | | 150,082 | |
| | | | | | | | | | | | | | | | |
Total | | | | | | | | | | | | | | $ | 12,990,671 | |
| | | | | | | | | | | | | | | | |
1 Securities are valued using a discount to the “round lot” price for the same security. The significant unobservable input used in the fair value measurement is the discount rate. A significant change in the discount rate could have a material effect on the fair value measurement. There is an inverse relationship between the discount rate and the fair value measurement, meaning a significant increase in the discount rate would result in a lower fair value measurement, and vice versa.
4. Derivatives. Derivative instruments are defined as financial instruments whose value and performance are based on the value and performance of an underlying asset, reference rate or index. Derivative instruments that the Funds used during the period include futures contracts and swap agreements.
The Funds are subject to the risk that changes in interest rates will affect the value of the Funds’ investments in fixed-income securities. The Funds will be subject to increased interest rate risk to the extent that they invest in fixed-income securities with longer maturities or durations, as compared to investing in fixed-income securities with shorter maturities or durations. The Funds may use futures contracts to hedge against
41 |
Notes to Financial Statements – continued
September 30, 2016
changes in interest rates and to manage their duration without having to buy or sell portfolio securities. During the year ended September 30, 2016, High Income Opportunities Fund used futures contracts to manage duration and Securitized Asset Fund used futures contracts to manage duration and to hedge against changes in interest rates.
High Income Opportunities Fund seeks to achieve high current income. The Fund may use a number of derivative instruments for risk management or as part of their investment strategies. During the year ended September 30, 2016, the Fund used credit default swap agreements (as a protection seller) to gain investment exposure in accordance with its objective.
Transactions in derivative instruments for High Income Opportunities Fund during the year ended September 30, 2016 as reflected in the Statements of Operations were as follows:
| | | | | | | | |
Net Realized Gain (Loss) on: | | Futures
contracts | | | Swap
agreements | |
Interest rate contracts | | $ | (178,082 | ) | | $ | — | |
Credit contracts | | | — | | | | (12,050 | ) |
| | |
Net Change in Unrealized Appreciation (Depreciation) on: | | Futures
contracts | | | Swap
agreements | |
Interest rate contracts | | $ | 94,209 | | | $ | — | |
Credit contracts | | | — | | | | 155,510 | |
The following is a summary of derivative instruments for Securitized Asset Fund as of September 30, 2016, as reflected within the Statements of Assets and Liabilities:
| | | | |
Assets | | Unrealized
appreciation
on futures
contracts1 | |
Exchange-traded/cleared asset derivatives
Interest rate contracts | | $ | 238,919 | |
| |
Liabilities | | Unrealized
depreciation
on futures
contracts1 | |
Exchange-traded/cleared liability derivatives
Interest rate contracts | | $ | (254,394 | ) |
1 Represents cumulative unrealized appreciation (depreciation) on futures contracts. Only the current day’s variation margin on futures contracts is reported within the Statements of Assets and Liabilities as receivable or payable for variation margin, as applicable.
Transactions in derivative instruments for Securitized Asset Fund during the year ended September 30, 2016 as reflected in the Statements of Operations were as follows:
| | | | |
Net Realized Gain (Loss) on: | | Futures
contracts | |
Interest rate contracts | | $ | 3,747,980 | |
| |
Net Change in Unrealized
Appreciation (Depreciation) on: | | Futures
contracts | |
Interest rate contracts | | $ | (240,516 | ) |
As the Funds value their derivatives at fair value and recognize changes in fair value through the Statements of Operations, they do not qualify for hedge accounting under authoritative guidance for derivative instruments. The Funds’ investments in derivatives may represent an economic hedge; however, they are considered to be non-hedge transactions for the purpose of these disclosures.
The volume of futures contract and swap agreement activity, as a percentage of net assets, based on gross month-end notional amounts outstanding during the period, including long and short positions at absolute value, was as follows for the year ended September 30, 2016:
| | | | | | | | |
High Income Opportunities Fund | | Futures | | | Credit Default
Swaps | |
Average Notional Amount Outstanding | | | 1.95% | | | | 2.00% | |
Highest Notional Amount Outstanding | | | 6.80% | | | | 5.17% | |
Lowest Notional Amount Outstanding | | | 0.00% | | | | 0.00% | |
Notional Amount Outstanding as of September 30, 2016 | | | 0.00% | | | | 0.00% | |
| 42
Notes to Financial Statements – continued
September 30, 2016
| | | | | | | | |
| | |
Securitized Asset Fund | | Futures | | | | |
Average Notional Amount Outstanding | | | 18.17% | | | | | |
Highest Notional Amount Outstanding | | | 20.88% | | | | | |
Lowest Notional Amount Outstanding | | | 15.91% | | | | | |
Notional Amount Outstanding as of September 30, 2016 | | | 17.82% | | | | | |
Notional amounts outstanding at the end of the prior period, if applicable, are included in the averages above.
Unrealized gain and/or loss on open futures and swap contracts is recorded in the Statements of Assets and Liabilities. The aggregate notional values of futures and swap contracts are not recorded in the Statements of Assets and Liabilities, and therefore are not included in the Funds’ net assets.
Counterparty risk is managed based on policies and procedures established by each Fund’s adviser. Such policies and procedures may include, but are not limited to, minimum counterparty credit rating requirements, monitoring of counterparty credit default swap spreads and posting of collateral. With exchange-traded derivatives, there is minimal counterparty credit risk to the Fund because the exchange’s clearinghouse, as counterparty to these instruments, stands between the buyer and the seller of the contract. Credit risk still exists in exchange-traded derivatives with respect to initial and variation margin that is held in a broker’s customer accounts. While brokers are required to segregate customer margin from their own assets, in the event that a broker becomes insolvent or goes into bankruptcy and at that time there is a shortfall in the aggregate amount of margin held by the broker for all its clients, U.S. bankruptcy laws will typically allocate that shortfall on a pro rata basis across all of the broker’s customers, potentially resulting in losses to the Fund. Based on balances reflected on each Fund’s Statement of Assets and Liabilities, the following table shows the maximum amount of loss due to credit risk that, based on the gross fair value of the financial instrument, the applicable Fund would incur if parties to the relevant financial instruments failed completely to perform according to the terms of the contracts and the collateral or other security, if any, for the amount due proved to be of no value to the Fund:
| | | | | | | | |
Fund | | Maximum Amount
of Loss - Gross | | | Maximum Amount
of Loss - Net | |
Securitized Asset Fund | | $ | 910,000 | | | $ | 910,000 | |
5. Purchases and Sales of Securities. For the year ended September 30, 2016, purchases and sales of securities (excluding short-term investments and including paydowns) were as follows:
| | | | | | | | | | | | | | | | |
| | | U.S. Government/Agency
Securities | | | Other Securities | |
Fund | | Purchases | | | Sales | | | Purchases | | | Sales | |
High Income Opportunities Fund | | $ | — | | | $ | — | | | $ | 58,874,701 | | | $ | 44,452,755 | |
Securitized Asset Fund | | | 3,510,500,387 | | | | 3,509,019,208 | | | | 199,918,496 | | | | 143,355,683 | |
6. Management Fees and Other Transactions with Affiliates.
a. Management Fees. Loomis Sayles has agreed to pay, without reimbursement from the Funds or the Trust, the following expenses of the Funds: compensation to Trustees of the Trust who are not “interested persons” (as defined in the 1940 Act) of the Trust; registration, filing and other fees in connection with requirements of regulatory authorities; the charges and expenses of any entity appointed by the Funds for custodial, paying agent, shareholder servicing and plan agent services; charges and expenses of the independent registered public accounting firm retained by the Funds; charges and expenses of any transfer agents and registrars appointed by the Funds; any cost of certificates representing shares of the Funds; legal fees and expenses in connection with the day-to-day affairs of the Funds, including registering and qualifying its shares with Federal and State regulatory authorities; expenses of meetings of shareholders and Trustees of the Trust; the costs of services, including services of counsel, required in connection with the preparation of the Funds’ registration statements and prospectuses, including amendments and revisions thereto, annual, semi-annual and other periodic reports of the Funds, and notices and proxy solicitation material furnished to shareholders of the Funds or regulatory authorities, and any costs of printing or mailing these items; the Funds’ expenses of bookkeeping, accounting and financial reporting, including related clerical expenses and all other expenses incurred; and other operating expenses of the Funds, as applicable.
Loomis Sayles serves as investment adviser to each Fund. Under the terms of each management agreement, Loomis Sayles does not charge the Funds an investment advisory fee, also known as a management fee, or any other fee for those services or for bearing those expenses. Although the Funds do not compensate Loomis Sayles directly for services under the advisory agreement, Loomis Sayles will typically receive an advisory fee from the sponsors of “wrap programs,” who in turn charge the programs’ participants.
Certain officers and employees of Loomis Sayles are also officers or Trustees of the Trust. Loomis Sayles’ general partner is indirectly owned by Natixis Global Asset Management, L.P. (“Natixis US”), which is part of Natixis Global Asset Management, an international asset management group based in Paris, France.
43 |
Notes to Financial Statements – continued
September 30, 2016
b. Service and Distribution Fees. NGAM Distribution, L.P. (“NGAM Distribution”), which is a wholly-owned subsidiary of Natixis US, has entered into a distribution agreement with the Trust. Pursuant to this agreement, NGAM Distribution serves as principal underwriter of the Funds of the Trust. NGAM Distribution currently is not paid a fee for serving as distributor for the Funds. Loomis Sayles has agreed to reimburse NGAM Distribution to the extent that NGAM Distribution incurs expenses in connection with any redemption of Fund shares.
c. Administrative Fees. NGAM Advisors provides certain administrative services for the Funds and contracts with State Street Bank to serve as sub-administrator. NGAM Advisors is a wholly-owned subsidiary of Natixis US. Loomis Sayles has agreed to pay, without reimbursement from the Trust or Funds, fees to NGAM Advisors for services to the Funds.
d. Trustees Fees and Expenses. The Trust does not pay any compensation directly to its officers or Trustees who are directors, officers or employees of NGAM Advisors, NGAM Distribution, Natixis US or their affiliates. The Chairperson of the Board of Trustees receives a retainer fee at the annual rate of $325,000. The Chairperson does not receive any meeting attendance fees for Board of Trustees meetings or committee meetings that she attends. Each Independent Trustee (other than the Chairperson) receives, in the aggregate, a retainer fee at the annual rate of $155,000. Each Independent Trustee also receives a meeting attendance fee of $10,000 for each meeting of the Board of Trustees that he or she attends in person and $5,000 for each meeting of the Board of Trustees that he or she attends telephonically. In addition, the chairperson of the Contract Review Committee and the chairperson of the Audit Committee each receive an additional retainer fee at the annual rate of $17,500. The chairperson of the Governance Committee receives an additional retainer fee at the annual rate of $10,000. Each Contract Review Committee member is compensated $6,000 for each Committee meeting that he or she attends in person and $3,000 for each meeting that he or she attends telephonically. Each Audit Committee member is compensated $6,000 for each Committee meeting that he or she attends in person and $3,000 for each meeting that he or she attends telephonically. These fees are allocated among the funds in the Natixis Funds Trusts and Loomis Sayles Funds Trusts based on a formula that takes into account, among other factors, the relative net assets of each fund. Trustees are reimbursed for travel expenses in connection with attendance at meetings. Loomis Sayles has agreed to pay, without reimbursement from the Trust or Funds, Trustees fees and expenses allocable to the Funds.
Prior to January 1, 2016, the Chairperson of the Board received a retainer fee at the annual rate of $300,000 and each Independent Trustee (other than the Chairperson) received, in the aggregate, a retainer fee at the annual rate of $130,000. The chairperson of the Governance Committee received an additional retainer fee at the annual rate of $5,000. All other Trustee fees remained unchanged.
A deferred compensation plan (the “Plan”) is available to the Trustees on a voluntary basis. Deferred amounts remain in the Funds until distributed in accordance with the provisions of the Plan. The value of a participating Trustee’s deferral account is based on theoretical investments of deferred amounts, on the normal payment dates, in certain funds of the Natixis Funds Trusts and Loomis Sayles Funds Trusts as designated by the participating Trustees. Changes in the value of participants’ deferral accounts are allocated pro rata among the funds in the Natixis Funds Trusts and Loomis Sayles Funds Trusts, and are normally reflected as Trustees’ fees and expenses in the Statements of Operations. The portions of the accrued obligations allocated to the Funds under the Plan are reflected as Deferred Trustees’ fees in the Statements of Assets and Liabilities.
7. Line of Credit. Effective April 14, 2016, each Fund, together with certain other funds of Natixis Funds Trusts and Loomis Sayles Funds Trusts, entered into a 364-day, $400,000,000 syndicated, committed, unsecured line of credit with Citibank, N.A. to be used for temporary or emergency purposes only. Any one Fund may borrow up to the full $400,000,000 under the line of credit (as long as all borrowings by all Funds in the aggregate do not exceed the $400,000,000 limit at any time), subject to each Fund’s investment restrictions. Interest is charged to the Funds at a rate equal to the greater of the eurodollar or the federal funds rate plus 1.00%. In addition, a commitment fee of 0.10% per annum, payable on the last business day of each month, is accrued and apportioned among the participating funds (applicable allocations to the Funds are paid by Loomis Sayles) based on their average daily unused portion of the line of credit. Loomis Sayles, on behalf of the Funds, paid an arrangement fee, an upfront fee, and other fees in connection with the new line of credit agreement.
Prior to April 14, 2016 each Fund, together with certain other funds of Natixis Funds Trusts and Loomis Sayles Funds Trusts, participated in a $150,000,000 committed unsecured line of credit provided by State Street Bank. Any one Fund was able to borrow up to the full $150,000,000 under the line of credit (as long as all borrowings by all Funds in the aggregate do not exceed the $150,000,000 limit at any time). Interest was charged to each participating Fund based on its borrowings at a rate per annum equal to the greater of the Federal Funds rate or overnight LIBOR, plus 1.25%. In addition, a commitment fee of 0.15% per annum, payable at the end of each calendar quarter, was accrued and apportioned among the participating funds (applicable allocations to the Funds were paid by Loomis Sayles) based on their average daily unused portion of the line of credit.
For the year ended September 30, 2016, none of the Funds had borrowings under these agreements.
8. Concentration of Risk. Securitized Asset Fund’s investments in mortgage-related and asset-backed securities are subject to certain risks not associated with investments in other securities. Mortgage-related and asset-backed securities are subject to the risk that unexpected changes in interest rates will have a direct effect on expected maturity. A shortened maturity may result in the reinvestment of prepaid amounts in securities with lower yields than the original obligations. An extended maturity may result in a reduction of a security’s value.
| 44
Notes to Financial Statements – continued
September 30, 2016
9. Concentration of Ownership. From time to time, a Fund may have a concentration of one or more accounts constituting a significant percentage of shares outstanding. Investment activities by holders of such accounts could have material impacts on the Funds. As of September 30, 2016, based on management’s evaluation of the shareholder account base, the Funds had accounts representing controlling ownership of more than 5% of the Fund’s total outstanding shares. The number of such accounts, based on accounts that represent more than 5% of an individual class of shares, and the aggregate percentage of net assets represented by such holdings were as follows:
| | | | | | | | |
Fund | | Number of 5%
Account Holders | | | Percentage of
Ownership | |
High Income Opportunities Fund | | | 2 | | | | 19.39% | |
Omnibus shareholder accounts for which NGAM Advisors understands that the intermediary has discretion over the underlying shareholder accounts or investment models where a shareholder account may be invested for a non-discretionary customer are included in the table above. For other omnibus accounts, the Funds do not have information on the individual shareholder accounts underlying the omnibus accounts; therefore, there could be other 5% shareholders in addition to those disclosed in the table above.
10. Capital Shares. Each Fund may issue an unlimited number of shares of beneficial interest, without par value. Transactions in capital shares were as follows:
| | | | | | | | | | | | | | | | |
| | | High Income Opportunities Fund | |
| | |
| | | Year Ended September 30, 2016 | | | Year Ended September 30, 2015 | |
| | | | |
| Institutional Class | | Shares | | | Amount | | | Shares | | | Amount | |
Issued from the sale of shares | | | 3,946,889 | | | $ | 39,857,592 | | | | 6,505,450 | | | $ | 69,135,896 | |
Issued in connection with the reinvestment of distributions | | | 455,812 | | | | 4,556,737 | | | | 289,937 | | | | 3,110,225 | |
Redeemed | | | (3,569,068 | ) | | | (35,839,650 | ) | | | (1,254,258 | ) | | | (13,502,332 | ) |
| | | | | | | | | | | | | | | | |
Increase (decrease) from capital share transactions | | | 833,633 | | | $ | 8,574,679 | | | | 5,541,129 | | | $ | 58,743,789 | |
| | | | | | | | | | | | | | | | |
| |
| | | Securitized Asset Fund | |
| | |
| | | Year Ended September 30, 2016 | | | Year Ended September 30, 2015 | |
| | | | |
| Institutional Class | | Shares | | | Amount | | | Shares | | | Amount | |
Issued from the sale of shares | | | 24,907,012 | | | $ | 261,801,082 | | | | 29,900,131 | | | $ | 320,342,338 | |
Issued in connection with the reinvestment of distributions | | | 657,888 | | | | 6,909,793 | | | | 527,702 | | | | 5,634,046 | |
Redeemed | | | (18,480,008 | ) | | | (194,305,118 | ) | | | (18,242,201 | ) | | | (195,430,421 | ) |
| | | | | | | | | | | | | | | | |
Increase (decrease) from capital share transactions | | | 7,084,892 | | | $ | 74,405,757 | | | | 12,185,632 | | | $ | 130,545,963 | |
| | | | | | | | | | | | | | | | |
45 |
Report of Independent Registered Public Accounting Firm
To the Trustees of Loomis Sayles Funds Trust I and Shareholders of Loomis Sayles High Income Opportunities Fund and Loomis Sayles Securitized Asset Fund:
In our opinion, the accompanying statements of assets and liabilities, including the portfolios of investments, and the related statements of operations and of changes in net assets and the financial highlights present fairly, in all material respects, the financial position of the Loomis Sayles High Income Opportunities Fund and Loomis Sayles Securitized Asset Fund, each a series of Loomis Sayles Funds Trust I (collectively, the “Funds”) at September 30, 2016, and the results of each of their operations, the changes in each of their net assets and the financial highlights for each of the periods indicated, in conformity with accounting principles generally accepted in the United States of America. These financial statements and financial highlights (hereafter referred to as “financial statements”) are the responsibility of the Funds’ management. Our responsibility is to express an opinion on these financial statements based on our audits. We conducted our audits of these financial statements in accordance with the standards of the Public Company Accounting Oversight Board (United States). Those standards require that we plan and perform the audit to obtain reasonable assurance about whether the financial statements are free of material misstatement. An audit includes examining, on a test basis, evidence supporting the amounts and disclosures in the financial statements, assessing the accounting principles used and significant estimates made by management, and evaluating the overall financial statement presentation. We believe that our audits, which included confirmation of securities at September 30, 2016 by correspondence with the custodian, agent banks and brokers, provide a reasonable basis for our opinion expressed above.
PricewaterhouseCoopers LLP
Boston, Massachusetts
November 21, 2016
| 46
2016 U.S. Tax Distribution Information to Shareholders (Unaudited)
Corporate Dividends Received Deduction. For the fiscal year ended September 30, 2016, a percentage of dividends distributed by the Fund listed below qualifies for the dividends received deduction for corporate shareholders. This percentage is as follows:
| | | | |
Fund | | Qualifying Percentage | |
High Income Opportunities Fund | | | 1.27% | |
Capital Gains Distributions. Pursuant to Internal Revenue Section 852(b), the following Fund paid distributions, which have been designated as capital gains distributions for the fiscal year ended September 30, 2016, unless subsequently determined to be different.
| | | | |
Fund | | Amount | |
High Income Opportunities Fund | | $ | 456,629 | |
Qualified Dividend Income. For the fiscal year ended September 30, 2016, the Fund below will designate up to the maximum amount allowable pursuant to the Internal Revenue Code as qualified dividend income eligible for reduced tax rates. These lower rates range from 0% to 20% depending on an individual’s tax bracket. If the Fund pays a distribution during calendar year 2016, complete information will be reported in conjunction with Form 1099-DIV.
|
Fund |
High Income Opportunities Fund |
47 |
Trustee and Officer Information
The tables below provide certain information regarding the trustees and officers of Loomis Sayles Funds I (the “Trust”). Unless otherwise indicated, the address of all persons below is 399 Boylston Street, Boston, MA 02116. The Funds’ Statement of Additional Information includes additional information about the trustees of the Trust and are available by calling 800-633-3330.
| | | | | | | | |
| Name and Year of Birth | | Position(s) Held with the Trust, Length of Time Served and Term of Office1 | | Principal Occupation(s) During Past 5 Years | | Number of Portfolios in Fund Complex Overseen2 and Other Directorships
Held During Past 5 Years | | Experience, Qualifications, Attributes, Skills for Board Membership |
| | | | |
Independent Trustees | | | | | | | | |
Kenneth A. Drucker (1945) | | Trustee since 2008 Chairperson of the Audit Committee and Governance Committee Member | | Retired | | 44 None | | Significant experience on the Board and on the boards of other business organizations (including at investment companies); executive experience (including as treasurer of an aerospace, automotive, and metal manufacturing corporation) |
| | | | |
Edmond J. English (1953) | | Trustee since 2013 Audit Committee Member | | Chief Executive Officer of Bob’s Discount Furniture (retail) | | 44 Director, Burlington Stores, Inc. (retail); Formerly, Director, BJ’s Wholesale Club (retail) | | Experience on the Board and significant experience on the boards of other business organizations (including retail companies and a bank); executive experience (including at a retail company) |
| | | | |
Richard A. Goglia (1951) | | Trustee since 2015 Audit Committee Member | | Retired; formerly Vice President and Treasurer of Raytheon Company (defense) | | 44 None | | Experience on the Board and executive experience (including his role as vice president and treasurer of a defense company and experience at a financial services company) |
| | | | |
Wendell J. Knox (1948) | | Trustee since 2009 Contract Review Committee Member and Governance Committee Member | | Director of Abt Associates Inc. (research and consulting) | | 44 Director, Eastern Bank (bank); Director, The Hanover Insurance Group (property and casualty insurance) | | Significant experience on the Board and on the boards of other business organizations (including at a bank and at a property and casualty insurance firm); executive experience (including roles as president and chief executive officer of a research and consulting company) |
| | | | |
Martin T. Meehan (1956) | | Trustee since 2012 Contract Review Committee Member | | President, University of Massachusetts; formerly, Chancellor and faculty member, University of Massachusetts Lowell | | 44 None | | Experience on the Board and on the boards of other business organizations; experience as President of the University of Massachusetts; government experience (including as a member of the U.S. House of Representatives); academic experience |
| 48
| | | | | | | | |
| Name and Year of Birth | | Position(s) Held with the Trust, Length of Time Served and Term of Office1 | | Principal Occupation(s) During Past 5 Years | | Number of Portfolios in Fund Complex Overseen2 and Other Directorships
Held During Past 5 Years | | Experience, Qualifications, Attributes, Skills for Board Membership |
Sandra O. Moose (1942) | | Chairperson of the Board of Trustees since November 2005 Trustee since 2003 Ex Officio member of the Audit Committee, the Contract Review Committee and the Governance Committee | | President, Strategic Advisory Services (management consulting) | | 44 Formerly, Director, AES Corporation (international power company); formerly, Director, Verizon Communications (telecommunications company) | | Significant experience on the Board and on the boards of other business organizations (including at a telecommunications company, an international power company and a specialty chemicals corporation); executive experience (including at a management consulting company) |
| | | | |
James P. Palermo (1955) | | Trustee since 2016 Contract Review Committee Member | | Founding Partner, Breton Capital Management, LLC (private equity); formerly, Chief Executive Officer of Global Client Management of The Bank of New York Mellon Corporation | | 44 None | | Experience on the Board; financial services industry and executive experience (including roles as chief executive officer of client management and asset servicing for a banking and financial services company) |
| | | | |
Erik R. Sirri (1958) | | Trustee since 2009 Audit Committee Member | | Professor of Finance at Babson College | | 44 None | | Significant experience on the Board; experience as Director of the Division of Trading and Markets at the Securities and Exchange Commission; academic experience; training as an economist |
| | | | |
Peter J. Smail (1952) | | Trustee since 2009 Chairperson of the Contract Review Committee and Governance Committee Member | | Retired | | 44 None | | Significant experience on the Board; mutual fund industry and executive experience (including roles as president and chief executive officer for an investment adviser) |
| | | | |
Cynthia L. Walker (1956) | | Trustee since 2005 Chairperson of the Governance Committee and Contract Review Committee Member | | Deputy Dean for Finance and Administration, Yale University School of Medicine | | 44 None | | Significant experience on the Board; executive experience in a variety of academic organizations (including roles as dean for finance and administration) |
|
Interested Trustees |
Kevin P. Charleston3 (1965) One Financial Center Boston, MA 02111 | | Trustee since 2015 President and Chief Executive Officer of Loomis Sayles Funds I since 2015 | | President, Chief Executive Officer and Director; formerly, Chief Financial Officer, Loomis, Sayles & Company, L.P. | | 44 None | | Experience on the Board; continuing service as President, Chief Executive Officer and Director of Loomis, Sayles & Company, L.P. |
49 |
| | | | | | | | |
| Name and Year of Birth | | Position(s) Held with the Trust, Length of Time Served and Term of Office1 | | Principal Occupation(s)
During Past 5 Years | | Number of Portfolios in Fund Complex Overseen2 and Other Directorships
Held During Past 5 Years | | Experience, Qualifications, Attributes, Skills for Board Membership |
David L. Giunta4 (1965) | | Trustee since 2011 Executive Vice President since 2008 | | President and Chief Executive Officer, NGAM Distribution Corporation, NGAM Advisors, L.P. and NGAM Distribution, L.P. | | 44 None | | Significant experience on the Board; continuing experience as President and Chief Executive Officer of NGAM Advisors, L.P. |
| | | | |
John T. Hailer5 (1960) | | Trustee since 2003 | | President and Chief Executive Officer —
U.S. and Asia, Natixis Global Asset Management, L.P. | | 44 None | | Significant experience on the Board; continuing experience as President and Chief Executive Officer — U.S. and Asia, Natixis Global Asset Management, L.P. |
| 1 | Each trustee serves until retirement, resignation or removal from the Board. The current retirement age is 75. The position of Chairperson of the Board is appointed for a three-year term. Ms. Moose was appointed to serve an additional three-year term as the Chairperson of the Board on December 13, 2013. |
| 2 | The trustees of the Trust serve as trustees of a fund complex that includes all series of the Natixis Funds Trust I, Natixis Funds Trust II, Natixis Funds Trust IV and Gateway Trust (collectively, the “Natixis Funds Trusts”), Loomis Sayles Funds I and Loomis Sayles Funds II (collectively, the “Loomis Sayles Funds Trusts”) and Natixis ETF Trust (collectively, the “Fund Complex”). |
| 3 | Mr. Charleston is deemed an “interested person” of the Trust because he holds the following positions with an affiliated person of the Trust: President and Chief Executive Officer of Loomis, Sayles & Company, L.P. |
| 4 | Mr. Giunta is deemed an “interested person” of the Trust because he holds the following positions with an affiliated person of the Trust: President and Chief Executive Officer of NGAM Distribution Corporation, NGAM Advisors, L.P. and NGAM Distribution, L.P. |
| 5 | Mr. Hailer is deemed an “interested person” of the Trust because he holds the following positions with an affiliated person of the Trust: President and Chief Executive Officer — U.S. and Asia, Natixis Global Asset Management, L.P. |
| | | | | | |
| Name and Year of Birth | | Position(s) Held with the Trust | | Term of Office1 and Length of Time Served | | Principal Occupation(s) During Past 5 Years2 |
|
Officers of the Trust |
Daniel J. Fuss (1933) One Financial Center Boston, MA 02111 | | Executive Vice President | | Since June 2003 | | Vice Chairman and Director, Loomis, Sayles & Company, L.P. |
| | | |
Russell L. Kane (1969) | | Secretary, Clerk and Chief Legal Officer | | Since July 2016 | | Executive Vice President, General Counsel, Secretary and Clerk, NGAM Distribution Corporation, NGAM Advisors, L.P. and NGAM Distribution, L.P.; formerly, Chief Compliance Officer for Mutual Funds, Senior Vice President, Deputy General Counsel, Assistant Secretary and Assistant Clerk, NGAM Distribution Corporation, NGAM Advisors, L.P. and NGAM Distribution, L.P. |
| | | |
Michael C. Kardok (1959) | | Treasurer, Principal Financial and Accounting Officer | | Since October 2004 | | Senior Vice President, NGAM Advisors, L.P. and NGAM Distribution, L.P. |
| | | |
Rosa Licea-Mailloux (1976) | | Chief Compliance Officer, Assistant Secretary and Anti-Money Laundering Officer | | Since July 2016 | | Senior Vice President, Deputy General Counsel, Assistant Secretary and Assistant Clerk, NGAM Distribution Corporation, NGAM Advisors, L.P. and NGAM Distribution, L.P.; formerly, Associate General Counsel, NGAM Distribution, L.P. |
| 1 | Each officer of the Trust serves for an indefinite term in accordance with the Trust’s current by-laws until the date his or her successor is elected and qualified, or until he or she sooner dies, retires, is removed or becomes disqualified. |
| 2 | Each person listed above, except as noted, holds the same position(s) with the Fund Complex. Mr. Fuss is not an officer of the Natixis Funds Trusts. Previous positions during the past five years with NGAM Distribution, L.P., NGAM Advisors, L.P. or Loomis, Sayles & Company, L.P. are omitted, if not materially different from a trustee’s or officer’s current position with such entity. |
| 50

Loomis Sayles Bond Fund
Annual Report
September 30, 2016
LOOMIS SAYLES BOND FUND
| | | | |
| Managers | | Symbols | | |
| Matthew J. Eagan, CFA® | | Institutional Class | | LSBDX |
| Daniel J. Fuss, CFA®, CIC | | Retail Class | | LSBRX |
| Brian P. Kennedy | | Admin Class | | LBFAX |
| Elaine M. Stokes | | Class N | | LSBNX |
Investment Objective
The Fund’s investment objective is high total investment return through a combination of current income and capital appreciation.
Market Conditions
In the beginning of the period, the Federal Reserve (Fed) raised interest rates for the first time since June 2006. This led to modest losses within investment-grade markets and added to an already challenging environment for high yield. After oil prices bottomed in mid-February, capital returned to markets and riskier assets rebounded strongly. Volatility spiked temporarily in June following the U.K. referendum vote to leave the European Union (EU), but conditions were generally calm for the remainder of the period. Fixed-income markets finished the period on a positive note and added to full-year gains.
After declining through mid-February, U.S. high yield became a sought-after asset. The sector rewarded investors by producing strong and steady gains with minimal volatility. Spreads (the difference in yield between non-Treasury and Treasury securities of similar maturity) are trading inside the long-term average, but remain above the lows of 2014. Lower-quality credits and cyclical sectors outperformed during the period as the search for yield presses onward.
Investment-grade corporate bonds also performed well during the one-year period, bouncing back from the lows experienced during the fourth quarter of 2015. The sector’s longer duration (price sensitivity to interest rate changes) was a positive tailwind as longer-maturity yields declined. Overall returns were positive across all sectors, with cyclical sectors and energy performing well during the second half of the period.
For roughly the first half of the period, the U.S. dollar continued to strengthen against most major global currencies. But the Fed struck a more dovish tone early in 2016, and this contributed to a pause in the dollar bull market. A more stable dollar supported currencies — particularly those in the emerging markets — that suffered during the dollar’s ascent. The recovery in oil prices also helped ease the strain on commodity-related currencies.
Performance Results
For the 12 months ended September 30, 2016, Institutional Class shares of Loomis Sayles Bond Fund returned 9.17%. The fund outperformed its benchmark, the Bloomberg Barclays U.S. Government/Credit Bond Index, which returned 5.86%.
1 |
Explanation of Fund Performance
In general, our out-of-benchmark allocation to high yield credit drove the fund’s outperformance. In particular, a significant allocation to high yield industrials contributed to results. The stabilization and recovery of oil prices led to strong returns for the sector, and our selected basic industry and energy names drove fund performance. Elsewhere, exposure to convertible securities aided performance, largely due to security selection in the technology sector. Similarly, name-specific exposure to technology stocks lifted fund performance. A small allocation to government-related securities also boosted performance, with Yankee bonds (foreign issues denominated in the U.S. dollar) issued in Brazil driving results. Additionally, an allocation to non-U.S.-dollar-denominated securities added value. New Zealand dollar-denominated holdings were key contributors. Though non-USD positions contributed positively to performance overall, U.S. dollar appreciation relative to foreign currencies challenged some of the fund’s non-USD holdings during the period. During the period the Fund’s distributions were reduced to reflect the realization of currency losses from certain bond sales and maturities.
On the negative side, our shorter-than-benchmark duration detracted from results as interest rates declined over the period. Our cash and reserve positions, which help promote portfolio liquidity, lagged the benchmark and hindered relative performance. Elsewhere, an underweight to the investment-grade corporate sector weighed on relative results. Specifically, industrial and utility names detracted, while financial holdings had a muted influence on performance. A small allocation to high yield utilities also detracted from performance, as the typically defensive holdings struggled given investors’ preference for riskier high yield sectors.
Outlook
Our outlook for the U.S. and global economies remains positive, with expectations for better growth momentum through the end of the year. In the U.S., we expect steady gains in employment, increased bank lending and stronger consumer confidence to support GDP growth. The global economy is facing more headwinds but should experience modestly stronger growth next year, led by a healthier U.S. economy and still-accommodative global central bank policies.
Inflation expectations remain low. However, U.S. inflation is showing signs of acceleration and recent economic data have been favorable. We think the Fed is likely to raise rates in December if market conditions remain stable.
Oil prices are likely to be range-bound over the short term as elevated supply should be countered by OPEC’s expected production cut in November. We remain constructive on intermediate- to longer-term oil prices and expect that supply and demand will adjust.
We expect low global yields to continue supporting flows into U.S. credit, but at a more modest pace. In this environment, we intend to maintain a yield cushion in our portfolios through exposure to corporate bonds. Credit fundamentals have been stable, reflecting a
| 2
LOOMIS SAYLES BOND FUND
slowly improving U.S. economy. However, downside risks — including slowing profit growth, rising leverage and free cash flow approaching peak levels — are increasing as we move further into the late stage of the credit cycle.1 Despite these risks, we believe the current phase of the credit cycle can continue for some time, and we do not expect a significant increase in corporate defaults in 2017.
Within credit, we favor the investment-grade financials, technology and energy sectors. We are also biased to higher-quality high yield. Convertible bonds continue to look attractive, and our focus has shifted from equity-sensitive convertibles to more balanced and credit-sensitive issues. We believe these securities offer yield and upside potential with more limited downside risk.
The Fed’s slow and cautious approach has helped keep the U.S. dollar range-bound against major currencies. Over the long term, improving global growth and further stability in commodities could support non-U.S.-dollar-denominated bonds. We are beginning to see more divergence in emerging market country fundamentals and political backdrops, which could expand potential relative value opportunities. We intend to maintain our current positions, which we believe represent long-term value, but are cautious on further exposure until we get better clarity on some of these evolving macro trends.
Risks include growing geopolitical risks, a prolonged period of low economic growth, declining corporate profit expectations and a shift to downturn in the U.S. credit cycle. Looking ahead, we remain focused on careful security selection using fundamental credit analysis. We intend to build on our key investment themes of yield and diversification, using our reserve allocation during periods of extreme short-term market dislocation to potentially add long-term value.
Since early 2015, monthly or quarterly ordinary income distributions for certain Loomis Sayles-managed fixed-income funds have been below historic averages. This is primarily due to the impact of foreign currency losses. Fund officers have analyzed the fund’s current portfolio of investments, schedule of maturities and the corresponding amounts of unrealized currency losses that may become realized in the fiscal year ending on September 30, 2017. Based on this analysis, fund officers believe that realized currency losses may have a less significant impact on this fund’s distributions in the 2017 fiscal year. As a result, the distribution amount may improve going forward. This analysis is based on certain assumptions, including but not limited to the level of foreign currency exchange rates, security prices, interest rates and the net asset level of the fund. Changes to these assumptions could impact the analysis and the amounts of future fund distributions.
| 1 | | A credit cycle is a cyclical pattern that follows credit availability and corporate health. |
3 |
Hypothetical Growth of $100,000 Investment in Institutional Class Shares
September 30, 2006 through September 30, 20162
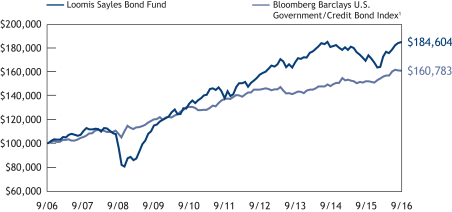
See notes to chart on page 5.
| 4
LOOMIS SAYLES BOND FUND
Average Annual Total Returns — September 30, 20162
| | | | | | | | | | | | | | | | | | | | | | | | |
| | | | | | |
| | | | | | | | | | | | | | | Expense Ratio3 | |
| | | 1 year | | | 5 years | | | 10 years | | | Life of
Class N | | | Gross | | | Net | |
| | | | | | | |
Institutional Class
(Inception 5/16/91) | | | 9.17 | % | | | 6.06 | % | | | 6.33 | % | | | — | % | | | 0.64 | % | | | 0.64 | % |
Retail Class
(Inception 12/31/96) | | | 8.86 | | | | 5.78 | | | | 6.02 | | | | — | | | | 0.89 | | | | 0.89 | |
Admin Class
(Inception 1/2/98) | | | 8.64 | | | | 5.50 | | | | 5.75 | | | | — | | | | 1.14 | | | | 1.14 | |
Class N
(Inception 2/1/13) | | | 9.18 | | | | — | | | | — | | | | 3.11 | | | | 0.57 | | | | 0.57 | |
| | | | | | | |
| Comparative Performance | | | | | | | | | | | | | | | | | | | | | | | | |
Bloomberg Barclays U.S. Government/ Credit Bond Index1 | | | 5.86 | | | | 3.24 | | | | 4.86 | | | | 3.05 | | | | | | | | | |
Performance data shown represents past performance and is no guarantee of, and not necessarily indicative of, future results. Total return and value will vary, and you may have a gain or loss when shares are sold. Current performance may be lower or higher than quoted. For most recent month-end performance, visit loomissayles.com. Performance for other share classes will be greater or less than shown based on differences in fees and sales charges. You may not invest directly in an index. Performance for periods less than one year is cumulative, not annualized. Returns reflect changes in share price and reinvestment of dividends and capital gains, if any. The table(s) do not reflect taxes shareholders might owe on any fund distributions or when they redeem their shares.
| 1 | | Bloomberg Barclays U.S. Government/Credit Bond Index is an unmanaged index that includes U.S. Treasuries, government-related issues, and investment-grade U.S. corporate securities. |
| 2 | | Fund performance has been increased by fee waivers and/or expense reimbursements, if any, without which performance would have been lower. |
| 3 | | As of the most recent prospectus, the investment advisor has contractually agreed to waive fees and/or reimburse expenses (with certain exceptions) once the expense cap of the Fund has been exceeded. This arrangement is set to expire on 1/31/17. When an expense cap has not been exceeded, the Fund may have similar expense ratios. |
1639619.1.1
5 |
ADDITIONAL INFORMATION
The views expressed in this report reflect those of the portfolio managers as of the dates indicated. The managers’ views are subject to change at any time without notice based on changes in market or other conditions. References to specific securities or industries should not be regarded as investment advice. Because the Fund is actively managed, there is no assurance that it will continue to invest in the securities or industries mentioned.
All investing involves risk, including the risk of loss. There is no assurance that any investment will meet its performance objectives or that losses will be avoided.
Additional Index Information
This document may contain references to third party copyrights, indexes, and trademarks, each of which is the property of its respective owner. Such owner is not affiliated with Natixis Global Asset Management or any of its related or affiliated companies (collectively “NGAM”) and does not sponsor, endorse or participate in the provision of any NGAM services, funds or other financial products.
The index information contained herein is derived from third parties and is provided on an “as is” basis. The user of this information assumes the entire risk of use of this information. Each of the third party entities involved in compiling, computing or creating index information disclaims all warranties (including, without limitation, any warranties of originality, accuracy, completeness, timeliness, non-infringement, merchantability and fitness for a particular purpose) with respect to such information.
Proxy Voting Information
A description of the Fund’s proxy voting policies and procedures is available without charge upon request, by calling Loomis Sayles Funds at 800-633-3330; on the Fund’s website at www.loomissayles.com, and on the Securities and Exchange Commission’s (“SEC’s”) website at www.sec.gov. Information about how the Fund voted proxies relating to portfolio securities during the most recent 12-month period ended June 30 is available on the Fund’s website and the SEC’s website.
Quarterly Portfolio Schedules
The Fund files a complete schedule of portfolio holdings with the SEC for the first and third quarters of each fiscal year on Form N-Q. The Fund’s Form N-Q is available on the SEC’s website at www.sec.gov and may be reviewed and copied at the SEC’s Public Reference Room in Washington, DC. Information on the operation of the Public Reference Room may be obtained by calling 800-SEC-0330.
UNDERSTANDING YOUR FUND’S EXPENSES
As a mutual fund shareholder you incur two types of costs: (1) transaction costs, and (2) ongoing costs, including management fees, distribution and/or service fees (12b-1 fees), and other fund expenses. Certain exemptions may apply. These costs are described in more detail in the Fund’s prospectus. The following examples are intended to help you understand the ongoing costs of investing in the Fund and help you compare these with the ongoing costs of investing in other mutual funds.
| 6
The first line in the table for each class of Fund shares shows the actual amount of Fund expenses you would have paid on a $1,000 investment in the Fund from April 1, 2016 through September 30, 2016. To estimate the expenses you paid over the period, simply divide your account value by $1,000 (for example $8,600 account value divided by $1,000 = 8.6) and multiply the result by the number in the Expenses Paid During Period column as shown below for your class.
The second line in the table for each class of Fund shares provides information about hypothetical account values and hypothetical expenses based on the Fund’s actual expense ratios and an assumed rate of return of 5% per year before expenses, which is not the Fund’s actual return. The hypothetical account values and expenses may not be used to estimate the actual ending account balance or expenses you paid on your investment for the period. You may use this information to compare the ongoing costs of investing in the Fund to other funds. To do so, compare this 5% hypothetical example with the 5% hypothetical examples that appear in the shareholder reports of the other funds.
Please note that the expenses shown reflect ongoing costs only, and do not include any transaction costs. Therefore, the second line in the table is useful in comparing ongoing costs only, and will not help you determine the relative costs of owning different funds. If transaction costs were included, total costs would be higher.
Loomis Sayles Bond Fund
| | | | | | | | | | | | |
Institutional Class | | Beginning
Account Value
4/1/2016 | | | Ending
Account Value
9/30/2016 | | | Expenses Paid
During Period*
4/1/2016 – 9/30/2016 | |
Actual | | | $1,000.00 | | | | $1,070.90 | | | | $3.42 | |
Hypothetical (5% return before expenses) | | | $1,000.00 | | | | $1,021.70 | | | | $3.34 | |
| | | |
Retail Class | | | | | | | | | |
Actual | | | $1,000.00 | | | | $1,069.90 | | | | $4.71 | |
Hypothetical (5% return before expenses) | | | $1,000.00 | | | | $1,020.45 | | | | $4.60 | |
| | | |
Admin Class | | | | | | | | | |
Actual | | | $1,000.00 | | | | $1,068.20 | | | | $6.00 | |
Hypothetical (5% return before expenses) | | | $1,000.00 | | | | $1,019.20 | | | | $5.86 | |
| | | |
Class N | | | | | | | | | |
Actual | | | $1,000.00 | | | | $1,071.30 | | | | $3.06 | |
Hypothetical (5% return before expenses) | | | $1,000.00 | | | | $1,022.05 | | | | $2.98 | |
* Expenses are equal to the Fund’s annualized expense ratio: 0.66%, 0.91%, 1.16% and 0.59% for Institutional Class, Retail Class, Admin Class and Class N, respectively, multiplied by the average account value over the period, multiplied by the number of days in the most recent fiscal half-year (183), divided by 366 (to reflect the half-year period). | |
7 |
BOARD APPROVAL OF THE EXISTING ADVISORY AGREEMENT
The Board of Trustees of the Trust (the “Board”), including the Independent Trustees, considers matters bearing on the Fund’s advisory agreement (the “Agreement”) at most of its meetings throughout the year. Each year, usually in the spring, the Contract Review Committee of the Board meets to review the Agreement to determine whether to recommend that the full Board approve the continuation of the Agreement, typically for an additional one-year period. After the Committee has made its recommendation, the full Board, including the Independent Trustees, determines whether to approve the continuation of the Agreement.
In connection with these meetings, the Trustees receive materials that the Fund’s investment adviser (the “Adviser”) believes to be reasonably necessary for the Trustees to evaluate the Agreement. These materials generally include, among other items, (i) information on the investment performance of the Fund and the performance of a peer group and category of funds and the Fund’s performance benchmarks, (ii) information on the Fund’s advisory fee and other expenses, including information comparing the Fund’s expenses to the fees charged to institutional accounts with similar strategies managed by the Adviser, if any, and to those of a peer group of funds and information about any applicable expense caps and/or fee “breakpoints,” (iii) sales and redemption data in respect of the Fund, (iv) information about the profitability of the Agreement to the Adviser and (v) information obtained through the completion by the Adviser of a questionnaire distributed on behalf of the Trustees. The Board, including the Independent Trustees, also considers other matters such as (i) the Adviser’s financial results and/or financial condition, (ii) the Fund’s investment objective and strategies and the size, education and experience of the Adviser’s investment staff and its use of technology, external research and trading cost measurement tools, (iii) arrangements in respect of the distribution of the Fund’s shares and the related costs, (iv) the procedures employed to determine the value of the Fund’s assets, (v) the allocation of the Fund’s brokerage, if any, including, if applicable, allocations to brokers affiliated with the Adviser and the use of “soft” commission dollars to pay Fund expenses and to pay for research and other similar services, (vi) the resources devoted to, and the record of compliance with, the Fund’s investment policies and restrictions, policies on personal securities transactions and other compliance policies, (vii) information about amounts invested by the Fund’s portfolio managers in the Fund or in similar accounts that they manage and (viii) the general economic outlook with particular emphasis on the mutual fund industry. Throughout the process, the Trustees are afforded the opportunity to ask questions of and request additional materials from the Adviser.
In addition to the materials requested by the Trustees in connection with their annual consideration of the continuation of the Agreement, the Trustees receive materials in advance of each regular quarterly meeting of the Board that provide detailed information about the Fund’s investment performance and the fees charged to the Fund for advisory and other services. This information generally includes, among other things, an internal performance rating for the Fund based on agreed-upon criteria, graphs showing the Fund’s
| 8
performance and fee differentials against the Fund’s peer group/category, performance ratings provided by a third-party, total return information for various periods, and third-party performance rankings for various periods comparing the Fund against similarly categorized funds. The portfolio management team for the Fund or other representatives of the Adviser make periodic presentations to the Contract Review Committee and/or the full Board, and if the Fund is identified as presenting possible performance concerns it may be subject to more frequent board presentations and reviews. In addition, each quarter the Trustees are provided with detailed statistical information about the Fund’s portfolio. The Trustees also receive periodic updates between meetings.
The Board most recently approved the continuation of the Agreement at its meeting held in June 2016. The Agreement was continued for a one-year period for the Fund. In considering whether to approve the continuation of the Agreement, the Board, including the Independent Trustees, did not identify any single factor as determinative. Individual Trustees may have evaluated the information presented differently from one another, giving different weights to various factors. Matters considered by the Trustees, including the Independent Trustees, in connection with their approval of the Agreement included, but were not limited to, the factors listed below.
The nature, extent and quality of the services provided to the Fund under the Agreement. The Trustees considered the nature, extent and quality of the services provided by the Adviser and its affiliates to the Fund and the resources dedicated to the Fund by the Adviser and its affiliates.
The Trustees considered not only the advisory services provided by the Adviser to the Fund, but also the monitoring and oversight services provided by NGAM Advisors, L.P. (“NGAM Advisors”). They also considered the administrative services provided by NGAM Advisors and its affiliates to the Fund.
The Trustees also considered the benefits to shareholders of investing in a mutual fund that is part of a family of funds that offers shareholders the right to exchange shares of one type of fund for shares of another type of fund, and provides a variety of fund and shareholder services.
After reviewing these and related factors, the Trustees concluded, within the context of their overall conclusions regarding the Agreement, that the nature, extent and quality of services provided supported the renewal of the Agreement.
Investment performance of the Fund and the Adviser. As noted above, the Trustees received information about the performance of the Fund over various time periods, including information that compared the performance of the Fund to the performance of a peer group and category of funds and the Fund’s performance benchmark. In addition, the Trustees also reviewed data prepared by an independent third party that analyzed the performance of the Fund using a variety of performance metrics, including metrics that also measured the performance of the Fund on a risk adjusted basis.
The Board concluded that the Fund’s performance or other relevant factors supported the renewal of the Agreement. The Trustees noted that while the Fund had performance that lagged that of its peer group and/or category for certain (although not all) periods, the
9 |
Board concluded that other factors relevant to performance supported renewal of the Agreement. These factors included the following: (1) that the underperformance was attributable, to a significant extent, to investment decisions by the Adviser that were reasonable and consistent with the Fund’s investment objective and policies; and (2) that the Fund’s long-term performance was competitive when compared to relevant performance benchmarks or peer groups.
The Trustees also considered the Adviser’s performance and reputation generally, the performance of the fund family generally, and the historical responsiveness of the Adviser to Trustee concerns about performance and the willingness of the Adviser to take steps intended to improve performance.
After reviewing these and related factors, the Trustees concluded, within the context of their overall conclusions regarding the Agreement, that the performance of the Fund and the Adviser supported the renewal of the Agreement.
The costs of the services to be provided and profits to be realized by the Adviser and its affiliates from their respective relationships with the Fund. The Trustees considered the fees charged to the Fund for advisory services as well as the total expense level of the Fund. This information included comparisons (provided both by management and also by an independent third party) of the Fund’s advisory fee and total expense level to those of its peer group and information about the advisory fees charged by the Adviser to comparable accounts (such as institutional separate accounts), as well as information about differences in such fees and the reasons for any such differences. In considering the fees charged to comparable accounts, the Trustees considered, among other things, management’s representations about the differences between managing mutual funds as compared to other types of accounts, including the additional resources required to effectively manage mutual fund assets and the greater regulatory costs associated with the management of such assets. In evaluating the Fund’s advisory fee, the Trustees also took into account the demands, complexity and quality of the investment management of the Fund, as well as the need for the Adviser to offer competitive compensation and the potential need to expend additional resources to the extent the Fund grows in size. The Trustees considered that over the past several years, management had made recommendations regarding reductions in advisory fee rates, implementation of advisory fee breakpoints and the institution of advisory fee waivers and expense caps for various funds in the fund family. The Trustees noted that the Fund currently has an expense cap in place, and that the current expenses are below the cap.
The Trustees also considered the compensation directly or indirectly received by the Adviser and its affiliates from their relationships with the Fund. The Trustees reviewed information provided by management as to the profitability of the Adviser’s and its affiliates’ relationships with the Fund, and information about the allocation of expenses used to calculate profitability. They also reviewed information provided by management about the effect of distribution costs and changes in asset levels on Adviser profitability, including information regarding resources spent on distribution activities. When reviewing profitability, the Trustees also considered information about court cases in which adviser compensation or profitability were issues, the performance of the Fund, the expense levels
| 10
of the Fund, and whether the Adviser had implemented breakpoints. The Trustees also noted management’s history of proposing additional advisory fee breakpoints as the Fund grew to substantially larger scale.
After reviewing these and related factors, the Trustees concluded, within the context of their overall conclusions regarding the Agreement, that the advisory fee charged to the Fund was fair and reasonable, and that the costs of these services generally and the related profitability of the Adviser and its affiliates in respect of their relationships with the Fund supported the renewal of the Agreement.
Economies of Scale. The Trustees considered the existence of any economies of scale in the provision of services by the Adviser and whether those economies are shared with the Fund through breakpoints in its investment advisory fee or other means, such as expense waivers or caps. The Trustees also discussed with management the factors considered with respect to the implementation of breakpoints in investment advisory fees or expense waivers or caps for certain funds. Management explained that a number of factors are taken into account in considering the possible implementation of breakpoints or an expense cap for a fund, including, among other things, factors such as a fund’s assets, the projected growth of a fund, projected profitability and a fund’s fees and performance. With respect to economies of scale, the Trustees noted that the Fund had breakpoints in its advisory fees and it was subject to an expense cap, and that the current expenses are below the cap. In considering these issues, the Trustees also took note of the costs of the services provided (both on an absolute and a relative basis) and the profitability to the Adviser and its affiliates of their relationships with the Fund, as discussed above.
After reviewing these and related factors, the Trustees concluded, within the context of their overall conclusions regarding the Agreement, that the extent to which economies of scale were shared with the Fund supported the renewal of the Agreement.
The Trustees also considered other factors, which included but were not limited to the following:
| • | | The effect of recent market and economic events on the performance, asset levels and expense ratios of the Fund. |
| • | | Whether the Fund has operated in accordance with its investment objective and the Fund’s record of compliance with its investment restrictions, and the compliance programs of the Fund and the Adviser. They also considered the compliance-related resources the Adviser and its affiliates were providing to the Fund. |
| • | | The nature, quality, cost and extent of administrative and shareholder services performed by the Adviser and its affiliates, both under the Agreement and under a separate agreement covering administrative services. |
| • | | So-called “fallout benefits” to the Adviser, such as the engagement of affiliates of the Adviser to provide distribution, administrative and brokerage services to the Fund, and the benefits of research made available to the Adviser by reason of brokerage commissions (if any) generated by the Fund’s securities transactions. The Trustees also considered the benefits to the parent company of NGAM Advisors from the retention |
11 |
| | of the Adviser. The Trustees considered the possible conflicts of interest associated with these fallout and other benefits, and the reporting, disclosure and other processes in place to disclose and monitor such possible conflicts of interest. |
| • | | The Trustees’ review and discussion of the Fund’s advisory arrangements in prior years, and management’s record of responding to Trustee concerns raised during the year and in prior years. |
Based on their evaluation of all factors that they deemed to be material, including those factors described above, and assisted by the advice of independent counsel, the Trustees, including the Independent Trustees, concluded that the existing Agreement should be continued through June 30, 2017.
| 12
Portfolio of Investments – as of September 30, 2016
Loomis Sayles Bond Fund
| | | | | | | | |
Principal
Amount (‡) | | | Description | | Value (†) | |
|
| | Bonds and Notes – 84.3% of Net Assets | |
|
| | Non-Convertible Bonds – 75.5% | |
| | |
| | | | ABS Other – 0.4% | | | | |
| $ | 29,950,364 | | | FAN Engine Securitization Ltd., Series 2013-1A, Class 1A, 4.625%, 10/15/2043, 144A(b)(c) | | $ | 29,642,774 | |
| | 17,727,369 | | | GCA2014 Holdings Ltd., Series 2014-1, Class C, 6.000%, 1/05/2030, 144A(b)(d) | | | 11,115,060 | |
| | 6,907,090 | | | GCA2014 Holdings Ltd., Series 2014-1, Class D, 7.500%, 1/05/2030, 144A(b)(d) | | | 1,990,623 | |
| | 32,585,000 | | | GCA2014 Holdings Ltd., Series 2014-1, Class E,
Zero Coupon, 1/05/2030, 144A(b)(d)(e) | | | 456,190 | |
| | 14,797,680 | | | Global Container Assets Ltd., Series 2015-1A, Class B, 4.500%, 2/05/2030, 144A(b)(c) | | | 14,471,213 | |
| | | | | | | | |
| | | | | | | 57,675,860 | |
| | | | | | | | |
| | | | Aerospace & Defense – 1.2% | | | | |
| | 36,735,000 | | | Bombardier, Inc., 6.000%, 10/15/2022, 144A | | | 33,245,175 | |
| | 100,000 | | | Bombardier, Inc., 6.125%, 1/15/2023, 144A | | | 88,750 | |
| | 1,510,000 | | | Bombardier, Inc., 7.350%, 12/22/2026, 144A, (CAD) | | | 1,044,495 | |
| | 13,664,000 | | | Bombardier, Inc., 7.450%, 5/01/2034, 144A | | | 11,699,800 | |
| | 275,000 | | | Meccanica Holdings USA, Inc., 6.250%, 7/15/2019 | | | 299,750 | |
| | 24,903,000 | | | Meccanica Holdings USA, Inc., 6.250%, 1/15/2040, 144A | | | 24,404,940 | |
| | 25,480,000 | | | Meccanica Holdings USA, Inc., 7.375%, 7/15/2039, 144A | | | 27,900,600 | |
| | 770,000 | | | Meccanica Holdings USA, Inc., 7.375%, 7/15/2039 | | | 843,150 | |
| | 6,995,000 | | | Textron Financial Corp., (fixed rate to 2/15/2017, variable rate thereafter), 6.000%, 2/15/2067, 144A | | | 4,975,194 | |
| | 23,658,000 | | | Textron, Inc., EMTN, 6.625%, 4/07/2020, (GBP) | | | 34,907,322 | |
| | 25,941,000 | | | TransDigm, Inc., 6.500%, 7/15/2024 | | | 27,302,902 | |
| | 4,585,000 | | | TransDigm, Inc., 6.500%, 5/15/2025 | | | 4,774,131 | |
| | | | | | | | |
| | | | | | | 171,486,209 | |
| | | | | | | | |
| | | | Airlines – 1.3% | | | | |
| | 24,305,000 | | | Air Canada, 7.625%, 10/01/2019, 144A, (CAD) | | | 19,232,249 | |
| | 54,931,000 | | | American Airlines Group, Inc., 5.500%, 10/01/2019, 144A | | | 57,196,904 | |
| | 3,810,842 | | | Continental Airlines Pass Through Certificates, Series 2012-2, Class B, 5.500%, 4/29/2022 | | | 3,984,121 | |
| | 32,465,000 | | | Continental Airlines Pass Through Certificates, Series 2012-3, Class C, 6.125%, 4/29/2018 | | | 33,925,925 | |
| | 112,294 | | | Continental Airlines Pass Through Trust, Series 1997-4, Class B, 6.900%, 7/02/2018 | | | 113,698 | |
| | 1,207 | | | Continental Airlines Pass Through Trust, Series 1999-2, Class B, 7.566%, 9/15/2021 | | | 1,210 | |
| | 940,894 | | | Continental Airlines Pass Through Trust, Series 2001-1, Class A-1, 6.703%, 12/15/2022 | | | 1,010,285 | |
| | 4,116,496 | | | Continental Airlines Pass Through Trust, Series 2012-1, Class B, 6.250%, 10/11/2021 | | | 4,414,942 | |
See accompanying notes to financial statements.
13 |
Portfolio of Investments – as of September 30, 2016
Loomis Sayles Bond Fund – continued
| | | | | | | | |
Principal
Amount (‡) | | | Description | | Value (†) | |
|
| | Bonds and Notes – continued | |
| | |
| | | | Airlines – continued | | | | |
| $ | 356,647 | | | UAL Pass Through Trust, Series 2009-1, 10.400%, 5/01/2018 | | $ | 357,075 | |
| | 6,518,972 | | | United Airlines Pass Through Trust, Series 2014-1, Class A, 4.000%, 10/11/2027 | | | 6,991,597 | |
| | 298,830 | | | US Airways Pass Through Trust, Series 2011-1B, Class B, 9.750%, 4/22/2020 | | | 330,975 | |
| | 56,320,000 | | | Virgin Australia Holdings Ltd., 8.500%, 11/15/2019, 144A | | | 58,009,600 | |
| | 5,408,224 | | | Virgin Australia Pass Through Trust, Series 2013-1B, 6.000%, 4/23/2022, 144A | | | 5,489,348 | |
| | 8,100,135 | | | Virgin Australia Pass Through Trust, Series 2013-1C, 7.125%, 10/23/2018, 144A | | | 8,201,387 | |
| | | | | | | | |
| | | | | | | 199,259,316 | |
| | | | | | | | |
| | | | Automotive – 0.5% | | | | |
| | 3,172,000 | | | Cummins, Inc., 6.750%, 2/15/2027 | | | 3,995,321 | |
| | 2,611,000 | | | Ford Motor Co., 6.500%, 8/01/2018 | | | 2,843,272 | |
| | 1,560,000 | | | Ford Motor Co., 6.625%, 2/15/2028 | | | 1,869,239 | |
| | 1,580,000 | | | Ford Motor Co., 7.500%, 8/01/2026 | | | 2,019,709 | |
| | 37,875,000 | | | General Motors Financial Co., Inc., 4.375%, 9/25/2021 | | | 40,452,394 | |
| | 6,201,000 | | | Goodyear Tire & Rubber Co. (The), 7.000%, 3/15/2028 | | | 6,774,592 | |
| | 9,660,000 | | | Midas Intermediate Holdco II LLC/Midas Intermediate Holdco II Finance, Inc., 7.875%, 10/01/2022, 144A | | | 9,829,050 | |
| | | | | | | | |
| | | | | | | 67,783,577 | |
| | | | | | | | |
| | | | Banking – 7.2% | | | | |
| | 59,285,000 | | | Bank of America Corp., MTN, 3.300%, 1/11/2023 | | | 61,369,935 | |
| | 54,910,000 | | | Bank of Nova Scotia, 2.130%, 6/15/2020, (CAD) | | | 42,846,918 | |
| | 16,525,000 | | | Bank of Nova Scotia, 2.462%, 3/14/2019, (CAD) | | | 12,934,580 | |
| | 27,100,000 | | | BNP Paribas S.A., (fixed rate to 10/23/2017, variable rate thereafter), 7.436%, (GBP)(f) | | | 37,145,374 | |
| | 22,200,000 | | | BNP Paribas S.A., (fixed rate to 6/25/2037, variable rate thereafter), 7.195%, 144A(f) | | | 24,975,000 | |
| | 7,340,000 | | | Citigroup, Inc., 4.500%, 1/14/2022 | | | 8,106,568 | |
| | 52,380,000 | | | Citigroup, Inc., 5.130%, 11/12/2019, (NZD) | | | 39,997,722 | |
| | 39,930,000 | | | Citigroup, Inc., 6.250%, 6/29/2017, (NZD) | | | 29,724,662 | |
| | 16,780,000 | | | Cooperatieve Rabobank UA, 3.875%, 2/08/2022 | | | 18,363,646 | |
| | 4,045,000 | | | Cooperatieve Rabobank UA, 3.950%, 11/09/2022 | | | 4,240,280 | |
| | 27,405,000 | | | Goldman Sachs Group, Inc. (The), 3.550%, 2/12/2021, (CAD) | | | 22,105,732 | |
| | 4,065,000 | | | Goldman Sachs Group, Inc. (The), GMTN, 5.375%, 3/15/2020 | | | 4,501,329 | |
| | 26,445,000 | | | Intesa Sanpaolo SpA, 5.017%, 6/26/2024, 144A | | | 24,132,808 | |
| | 69,375,000 | | | JPMorgan Chase & Co., 4.250%, 11/02/2018, (NZD) | | | 51,592,410 | |
| | 1,600,000 | | | Merrill Lynch & Co., Inc., EMTN, 0.247%, 9/14/2018, (EUR)(g) | | | 1,791,108 | |
| | 3,600,000 | | | Merrill Lynch & Co., Inc., Series C, MTN, 6.050%, 6/01/2034 | | | 4,243,500 | |
| | 42,630,000 | | | Morgan Stanley, 2.500%, 1/24/2019 | | | 43,438,222 | |
| | 6,600,000 | | | Morgan Stanley, 3.750%, 2/25/2023 | | | 7,009,807 | |
See accompanying notes to financial statements.
| 14
Portfolio of Investments – as of September 30, 2016
Loomis Sayles Bond Fund – continued
| | | | | | | | |
Principal
Amount (‡) | | | Description | | Value (†) | |
|
| | Bonds and Notes – continued | |
| | |
| | | | Banking – continued | | | | |
| $ | 47,205,000 | | | Morgan Stanley, 4.350%, 9/08/2026 | | $ | 50,396,152 | |
| | 53,595,000 | | | Morgan Stanley, 4.750%, 11/16/2018, (AUD) | | | 42,635,604 | |
| | 75,000,000 | | | Morgan Stanley, 5.000%, 9/30/2021, (AUD) | | | 62,092,528 | |
| | 152,340,000 | | | Morgan Stanley, 7.600%, 8/08/2017, (NZD) | | | 114,794,962 | |
| | 150,195,000 | | | Morgan Stanley, 8.000%, 5/09/2017, (AUD) | | | 118,529,709 | |
| | 1,400,000 | | | Morgan Stanley, EMTN, 5.750%, 2/14/2017, (GBP) | | | 1,846,053 | |
| | 139,740,000 | | | Morgan Stanley, MTN, 4.100%, 5/22/2023 | | | 147,741,652 | |
| | 15,000,000 | | | Morgan Stanley, MTN, 6.250%, 8/09/2026 | | | 18,806,445 | |
| | 68,800,000 | | | Morgan Stanley, Series MPLE, 3.125%, 8/05/2021, (CAD) | | | 54,768,880 | |
| | 2,250,000 | | | National Australia Bank Ltd., 5.000%, 3/11/2024, (AUD) | | | 1,981,720 | |
| | 6,000,000 | | | Societe Generale S.A., EMTN, (fixed rate to 6/16/2018, variable rate thereafter), 8.875%, (GBP)(f) | | | 8,554,586 | |
| | 2,800,000 | | | Societe Generale S.A., MTN, 5.200%, 4/15/2021, 144A | | | 3,189,220 | |
| | | | | | | | |
| | | | | | | 1,063,857,112 | |
| | | | | | | | |
| | | | Brokerage – 1.1% | | | | |
| | 5,996,000 | | | Jefferies Finance LLC/JFIN Co-Issuer Corp., 6.875%, 4/15/2022, 144A | | | 5,576,280 | |
| | 29,995,000 | | | Jefferies Finance LLC/JFIN Co-Issuer Corp., 7.500%, 4/15/2021, 144A | | | 29,170,137 | |
| | 19,787,000 | | | Jefferies Group LLC, 5.125%, 4/13/2018 | | | 20,657,905 | |
| | 51,270,000 | | | Jefferies Group LLC, 5.125%, 1/20/2023 | | | 54,622,648 | |
| | 29,470,000 | | | Jefferies Group LLC, 6.250%, 1/15/2036 | | | 30,715,903 | |
| | 22,428,000 | | | Jefferies Group LLC, 6.450%, 6/08/2027 | | | 25,390,739 | |
| | | | | | | | |
| | | | | | | 166,133,612 | |
| | | | | | | | |
| | | | Building Materials – 0.6% | | | | |
| | 15,670,000 | | | Atrium Windows & Doors, Inc., 7.750%, 5/01/2019, 144A | | | 14,083,412 | |
| | 15,272,000 | | | Masco Corp., 6.500%, 8/15/2032 | | | 16,799,200 | |
| | 16,235,000 | | | Masco Corp., 7.125%, 3/15/2020 | | | 18,670,250 | |
| | 9,733,000 | | | Masco Corp., 7.750%, 8/01/2029 | | | 11,630,935 | |
| | 21,460,000 | | | Owens Corning, 7.000%, 12/01/2036 | | | 27,090,718 | |
| | 2,395,000 | | | Titan Global Finance PLC, EMTN, 4.250%, 7/10/2019, (EUR) | | | 2,811,491 | |
| | | | | | | | |
| | | | | | | 91,086,006 | |
| | | | | | | | |
| | | | Cable Satellite – 0.3% | | | | |
| | 965,000 | | | DISH DBS Corp., 5.000%, 3/15/2023 | | | 938,463 | |
| | 1,105,000 | | | DISH DBS Corp., 5.875%, 11/15/2024 | | | 1,091,187 | |
| | 37,585,000 | | | Shaw Communications, Inc., 5.650%, 10/01/2019, (CAD) | | | 31,437,957 | |
| | 6,190,000 | | | Time Warner Cable LLC, 4.500%, 9/15/2042 | | | 5,906,863 | |
| | 535,000 | | | Time Warner Cable LLC, 5.875%, 11/15/2040 | | | 594,111 | |
| | 15,800,000 | | | Videotron Ltd., 5.625%, 6/15/2025, 144A, (CAD) | | | 12,374,328 | |
| | | | | | | | |
| | | | | | | 52,342,909 | |
| | | | | | | | |
| | | | Chemicals – 2.6% | | | | |
| | 123,840,000 | | | Chemours Co. (The), 6.625%, 5/15/2023 | | | 120,744,000 | |
| | 23,615,000 | | | Chemours Co. (The), 7.000%, 5/15/2025 | | | 23,201,737 | |
| | 56,305,000 | | | Consolidated Energy Finance S.A., 6.750%, 10/15/2019, 144A | | | 55,601,187 | |
See accompanying notes to financial statements.
15 |
Portfolio of Investments – as of September 30, 2016
Loomis Sayles Bond Fund – continued
| | | | | | | | |
Principal
Amount (‡) | | | Description | | Value (†) | |
|
| | Bonds and Notes – continued | |
| | |
| | | | Chemicals – continued | | | | |
| $ | 20,000,000 | | | Eco Services Operations LLC/Eco Finance Corp., 8.500%, 11/01/2022, 144A | | $ | 20,800,000 | |
| | 23,289,000 | | | Hercules, Inc., 6.500%, 6/30/2029 | | | 20,960,100 | |
| | 33,969,000 | | | Hexion, Inc., 7.875%, 2/15/2023(b)(d) | | | 12,228,840 | |
| | 4,955,000 | | | Hexion, Inc., 8.875%, 2/01/2018 | | | 4,719,638 | |
| | 11,305,000 | | | Hexion, Inc., 9.200%, 3/15/2021(b)(d) | | | 4,408,950 | |
| | 3,390,000 | | | Hexion, Inc./Hexion Nova Scotia Finance ULC, 9.000%, 11/15/2020 | | | 2,453,513 | |
| | 119,535,000 | | | INVISTA Finance LLC, 4.250%, 10/15/2019, 144A | | | 118,946,888 | |
| | 6,795,000 | | | Methanex Corp., 5.250%, 3/01/2022 | | | 7,018,433 | |
| | 2,305,000 | | | TPC Group, Inc., 8.750%, 12/15/2020, 144A | | | 1,787,643 | |
| | | | | | | | |
| | | | | | | 392,870,929 | |
| | | | | | | | |
| | | | Construction Machinery – 0.2% | | | | |
| | 27,030,000 | | | Toro Co., 6.625%, 5/01/2037(b)(c) | | | 32,394,293 | |
| | | | | | | | |
| | | | Consumer Cyclical Services – 0.1% | | | | |
| | 1,000,000 | | | ServiceMaster Co. LLC (The), 7.100%, 3/01/2018 | | | 1,031,250 | |
| | 8,919,000 | | | ServiceMaster Co. LLC (The), 7.450%, 8/15/2027 | | | 9,480,897 | |
| | | | | | | | |
| | | | | | | 10,512,147 | |
| | | | | | | | |
| | | | Consumer Products – 0.1% | | | | |
| | 15,036,000 | | | Avon Products, Inc., 8.950%, 3/15/2043 | | | 12,291,930 | |
| | | | | | | | |
| | | | Diversified Manufacturing – 0.5% | | | | |
| | 64,245,000 | | | General Electric Co., GMTN, 4.250%, 1/17/2018, (NZD) | | | 47,481,991 | |
| | 45,800,000 | | | General Electric Co., Series A, GMTN, 5.500%, 2/01/2017, (NZD) | | | 33,609,338 | |
| | | | | | | | |
| | | | | | | 81,091,329 | |
| | | | | | | | |
| | | | Electric – 1.5% | | | | |
| | 3,075,000 | | | AES Corp. (The), 4.875%, 5/15/2023 | | | 3,121,125 | |
| | 54,584,477 | | | Alta Wind Holdings LLC, 7.000%, 6/30/2035, 144A | | | 55,846,143 | |
| | 66,179,285 | | | Bruce Mansfield Unit Pass Through Trust, 6.850%, 6/01/2034(b)(c) | | | 33,697,168 | |
| | 1,801,497 | | | CE Generation LLC, 7.416%, 12/15/2018 | | | 1,684,400 | |
| | 4,255,000 | | | DPL, Inc., 6.750%, 10/01/2019 | | | 4,414,562 | |
| | 12,250,000 | | | Dynegy, Inc., 5.875%, 6/01/2023 | | | 11,116,875 | |
| | 69,835,000 | | | Dynegy, Inc., 7.625%, 11/01/2024 | | | 68,577,970 | |
| | 38,973,000 | | | EDP Finance BV, 4.125%, 1/15/2020, 144A | | | 40,395,514 | |
| | 8,663,000 | | | Empresa Nacional de Electricidad S.A., 7.875%, 2/01/2027 | | | 10,764,956 | |
| | 588,222 | | | Red Oak Power LLC, Series A, 8.540%, 11/30/2019 | | | 588,957 | |
| | 65,293 | | | Salton Sea Funding Corp., Series F, 7.475%, 11/30/2018 | | | 64,636 | |
| | | | | | | | |
| | | | | | | 230,272,306 | |
| | | | | | | | |
| | | | Finance Companies – 4.4% | | | | |
| | 3,100,000 | | | AGFC Capital Trust I, (fixed rate to 1/15/2017, variable rate thereafter), 6.000%, 1/15/2067, 144A | | | 1,550,000 | |
| | 11,695,000 | | | General Electric Co., Series A, MTN, 0.980%, 5/13/2024(g) | | | 10,956,461 | |
See accompanying notes to financial statements.
| 16
Portfolio of Investments – as of September 30, 2016
Loomis Sayles Bond Fund – continued
| | | | | | | | |
Principal
Amount (‡) | | | Description | | Value (†) | |
|
| | Bonds and Notes – continued | |
| | |
| | | | Finance Companies – continued | | | | |
| $ | 19,330,000 | | | iStar, Inc., 4.875%, 7/01/2018 | | $ | 19,426,650 | |
| | 20,395,000 | | | iStar, Inc., 5.000%, 7/01/2019 | | | 20,341,565 | |
| | 34,525,000 | | | iStar, Inc., 5.850%, 3/15/2017 | | | 34,937,263 | |
| | 1,890,000 | | | Ladder Capital Finance Holdings LLLP/Ladder Capital Finance Corp., 5.875%, 8/01/2021, 144A | | | 1,795,500 | |
| | 30,220,000 | | | Ladder Capital Finance Holdings LLLP/Ladder Capital Finance Corp., 7.375%, 10/01/2017 | | | 30,446,650 | |
| | 2,830,000 | | | Navient Corp., 5.875%, 10/25/2024 | | | 2,575,300 | |
| | 68,000,000 | | | Navient Corp., MTN, 6.125%, 3/25/2024 | | | 63,325,000 | |
| | 34,415,000 | | | Navient LLC, 4.875%, 6/17/2019 | | | 34,285,944 | |
| | 27,420,000 | | | Navient LLC, 5.500%, 1/25/2023 | | | 25,157,850 | |
| | 150,996(††) | | | Navient LLC, 6.000%, 12/15/2043 | | | 3,469,133 | |
| | 11,663,000 | | | Navient LLC, MTN, 5.500%, 1/15/2019 | | | 11,837,945 | |
| | 8,000,000 | | | Navient LLC, MTN, 7.250%, 1/25/2022 | | | 8,160,000 | |
| | 3,355,000 | | | Navient LLC, MTN, 8.000%, 3/25/2020 | | | 3,598,237 | |
| | 23,623,000 | | | Navient LLC, Series A, MTN, 5.000%, 6/15/2018 | | | 23,623,000 | |
| | 51,024,000 | | | Navient LLC, Series A, MTN, 5.625%, 8/01/2033(b)(c) | | | 40,564,080 | |
| | 400,000 | | | Oxford Finance LLC/Oxford Finance Co-Issuer, Inc., 7.250%, 1/15/2018, 144A | | | 399,500 | |
| | 74,340,000 | | | Springleaf Finance Corp., 5.250%, 12/15/2019 | | | 75,919,725 | |
| | 155,536,000 | | | Springleaf Finance Corp., 7.750%, 10/01/2021 | | | 163,118,380 | |
| | 77,845,000 | | | Springleaf Finance Corp., 8.250%, 10/01/2023 | | | 81,737,250 | |
| | | | | | | | |
| | | | | | | 657,225,433 | |
| | | | | | | | |
| | | | Food & Beverage – 0.0% | | | | |
| | 1,500,000 | | | Fonterra Co-operative Group Ltd., MTN, 4.500%, 6/30/2021, (AUD) | | | 1,218,491 | |
| | | | | | | | |
| | | | Government Owned – No Guarantee – 0.5% | | | | |
| | 28,720,000 | | | Pertamina Persero PT, 6.450%, 5/30/2044, 144A | | | 33,269,219 | |
| | 31,880,000 | | | Petrobras Global Finance BV, 4.375%, 5/20/2023 | | | 28,516,660 | |
| | 24,335,000 | | | Petrobras Global Finance BV, 5.625%, 5/20/2043 | | | 18,372,925 | |
| | | | | | | | |
| | | | | | | 80,158,804 | |
| | | | | | | | |
| | | | Healthcare – 1.4% | | | | |
| | 3,240,000 | | | BioScrip, Inc., 8.875%, 2/15/2021 | | | 3,029,400 | |
| | 27,204,000 | | | HCA, Inc., 7.050%, 12/01/2027 | | | 28,938,255 | |
| | 27,545,000 | | | HCA, Inc., 7.500%, 11/06/2033 | | | 29,851,894 | |
| | 45,324,000 | | | HCA, Inc., 8.360%, 4/15/2024 | | | 52,624,790 | |
| | 6,944,000 | | | HCA, Inc., MTN, 7.580%, 9/15/2025 | | | 7,829,360 | |
| | 12,446,000 | | | HCA, Inc., MTN, 7.750%, 7/15/2036 | | | 13,488,352 | |
| | 335,000 | | | Kindred Healthcare, Inc., 8.000%, 1/15/2020 | | | 340,863 | |
| | 915,000 | | | Kindred Healthcare, Inc., 8.750%, 1/15/2023 | | | 915,000 | |
| | 1,430,000 | | | Tenet Healthcare Corp., 4.375%, 10/01/2021 | | | 1,422,850 | |
| | 13,068,000 | | | Tenet Healthcare Corp., 5.000%, 3/01/2019 | | | 12,773,970 | |
| | 37,850,000 | | | Tenet Healthcare Corp., 6.750%, 6/15/2023 | | | 35,200,500 | |
See accompanying notes to financial statements.
17 |
Portfolio of Investments – as of September 30, 2016
Loomis Sayles Bond Fund – continued
| | | | | | | | |
Principal
Amount (‡) | | | Description | | Value (†) | |
|
| | Bonds and Notes – continued | |
| | |
| | | | Healthcare – continued | | | | |
| $ | 34,938,000 | | | Tenet Healthcare Corp., 6.875%, 11/15/2031 | | $ | 28,736,505 | |
| | 690,000 | | | Universal Health Services, Inc., 4.750%, 8/01/2022, 144A | | | 712,425 | |
| | | | | | | | |
| | | | | | | 215,864,164 | |
| | | | | | | | |
| | | | Home Construction – 0.8% | | | | |
| | 7,385,000 | | | Beazer Homes USA, Inc., 7.250%, 2/01/2023 | | | 7,348,075 | |
| | 16,729,000 | | | K. Hovnanian Enterprises, Inc., 5.000%, 11/01/2021(b)(c) | | | 11,710,300 | |
| | 45,718,000 | | | K. Hovnanian Enterprises, Inc., 8.000%, 11/01/2019, 144A | | | 27,659,390 | |
| | 52,605,000 | | | PulteGroup, Inc., 6.000%, 2/15/2035 | | | 53,131,050 | |
| | 13,360,000 | | | TRI Pointe Holdings, Inc./TRI Pointe Group, Inc., 4.375%, 6/15/2019 | | | 13,744,100 | |
| | | | | | | | |
| | | | | | | 113,592,915 | |
| | | | | | | | |
| | | | Independent Energy – 1.3% | | | | |
| | 1,190,000 | | | Anadarko Petroleum Corp., 3.450%, 7/15/2024 | | | 1,173,818 | |
| | 2,770,000 | | | Anadarko Petroleum Corp., 4.500%, 7/15/2044 | | | 2,541,469 | |
| | 7,440,000 | | | Baytex Energy Corp., 5.125%, 6/01/2021, 144A | | | 6,193,800 | |
| | 6,507,000 | | | Baytex Energy Corp., 5.625%, 6/01/2024, 144A | | | 5,303,205 | |
| | 15,760,000 | | | Bellatrix Exploration Ltd., 8.500%, 5/15/2020, 144A | | | 14,656,800 | |
| | 345,000 | | | Bonanza Creek Energy, Inc., 5.750%, 2/01/2023 | | | 156,975 | |
| | 140,000 | | | Bonanza Creek Energy, Inc., 6.750%, 4/15/2021 | | | 63,700 | |
| | 11,379,000 | | | California Resources Corp., 5.500%, 9/15/2021 | | | 6,030,870 | |
| | 1,709,000 | | | California Resources Corp., 6.000%, 11/15/2024 | | | 816,048 | |
| | 1,835,000 | | | Chesapeake Energy Corp., 4.875%, 4/15/2022 | | | 1,545,988 | |
| | 15,000 | | | Chesapeake Energy Corp., 6.625%, 8/15/2020 | | | 14,119 | |
| | 1,940,000 | | | Chesapeake Energy Corp., 6.875%, 11/15/2020 | | | 1,813,900 | |
| | 8,471,000 | | | Continental Resources, Inc., 3.800%, 6/01/2024 | | | 7,750,965 | |
| | 1,597,000 | | | Continental Resources, Inc., 4.500%, 4/15/2023 | | | 1,533,120 | |
| | 1,775,000 | | | EQT Corp., 8.125%, 6/01/2019 | | | 2,028,912 | |
| | 145,000 | | | MEG Energy Corp., 6.375%, 1/30/2023, 144A | | | 114,731 | |
| | 95,000 | | | MEG Energy Corp., 6.500%, 3/15/2021, 144A | | | 77,544 | |
| | 235,000 | | | MEG Energy Corp., 7.000%, 3/31/2024, 144A | | | 185,650 | |
| | 370,000 | | | Noble Energy, Inc., 5.625%, 5/01/2021 | | | 386,676 | |
| | 4,855,000 | | | Oasis Petroleum, Inc., 6.875%, 1/15/2023 | | | 4,636,525 | |
| | 280,000 | | | Pan American Energy LLC/Argentine Branch, 7.875%, 5/07/2021, 144A | | | 300,300 | |
| | 4,270,000 | | | QEP Resources, Inc., 5.250%, 5/01/2023 | | | 4,205,950 | |
| | 4,335,000 | | | QEP Resources, Inc., 6.875%, 3/01/2021 | | | 4,519,237 | |
| | 15,445,000 | | | Rex Energy Corp., (Step to 8.000% on 10/01/2017), 1.000%, 10/01/2020(h) | | | 8,417,525 | |
| | 9,500,000 | | | Rice Energy, Inc., 6.250%, 5/01/2022 | | | 9,808,750 | |
| | 8,579,000 | | | RSP Permian, Inc., 6.625%, 10/01/2022 | | | 8,986,502 | |
| | 23,125,000 | | | Sanchez Energy Corp., 6.125%, 1/15/2023 | | | 18,557,812 | |
| | 12,420,000 | | | Sanchez Energy Corp., 7.750%, 6/15/2021 | | | 10,929,600 | |
| | 90,000 | | | SM Energy Co., 5.000%, 1/15/2024 | | | 84,600 | |
| | 20,982,000 | | | SM Energy Co., 6.125%, 11/15/2022 | | | 20,982,000 | |
| | 57,825,000 | | | Ultra Petroleum Corp., 6.125%, 10/01/2024, 144A(i) | | | 45,681,750 | |
See accompanying notes to financial statements.
| 18
Portfolio of Investments – as of September 30, 2016
Loomis Sayles Bond Fund – continued
| | | | | | | | |
Principal
Amount (‡) | | | Description | | Value (†) | |
|
| | Bonds and Notes – continued | |
| | |
| | | | Independent Energy – continued | | | | |
| $ | 2,845,000 | | | Whiting Petroleum Corp., 5.750%, 3/15/2021 | | $ | 2,660,075 | |
| | 1,965,000 | | | Whiting Petroleum Corp., 6.250%, 4/01/2023 | | | 1,793,063 | |
| | | | | | | | |
| | | | | | �� | 193,951,979 | |
| | | | | | | | |
| | | | Industrial Other – 0.1% | | | | |
| | 8,380,000 | | | Broadspectrum Ltd., 8.375%, 5/15/2020, 144A | | | 8,924,700 | |
| | 160,000 | | | Cleaver-Brooks, Inc., 8.750%, 12/15/2019, 144A | | | 167,600 | |
| | | | | | | | |
| | | | | | | 9,092,300 | |
| | | | | | | | |
| | | | Integrated Energy – 0.0% | | | | |
| | 2,155,000 | | | Pacific Exploration and Production Corp., 5.125%, 3/28/2023, 144A(i) | | | 398,675 | |
| | 1,250,000 | | | Pacific Exploration and Production Corp., 5.625%, 1/19/2025, 144A(i) | | | 231,250 | |
| | | | | | | | |
| | | | | | | 629,925 | |
| | | | | | | | |
| | | | Life Insurance – 2.0% | | | | |
| | 6,212,000 | | | American International Group, Inc., 4.875%, 6/01/2022 | | | 6,989,388 | |
| | 67,930,000 | | | AXA S.A., (fixed rate to 12/14/2036, variable rate thereafter), 6.379%, 144A(f) | | | 74,015,169 | |
| | 1,185,000 | | | AXA S.A., EMTN, (fixed rate to 10/16/2019, variable rate thereafter), 6.772%, (GBP)(f) | | | 1,639,152 | |
| | 15,000,000 | | | Forethought Financial Group, Inc., 8.625%, 4/15/2021, 144A(b)(c) | | | 17,246,400 | |
| | 5,760,000 | | | Genworth Holdings, Inc., 4.800%, 2/15/2024 | | | 4,737,600 | |
| | 31,605,000 | | | Genworth Holdings, Inc., 4.900%, 8/15/2023 | | | 26,311,163 | |
| | 2,030,000 | | | MetLife Capital Trust X, 9.250%, 4/08/2068, 144A | | | 2,920,561 | |
| | 10,175,000 | | | MetLife, Inc., 10.750%, 8/01/2069 | | | 16,306,455 | |
| | 57,985,000 | | | Mutual of Omaha Insurance Co., 6.800%, 6/15/2036, 144A | | | 73,986,367 | |
| | 38,476,000 | | | National Life Insurance Co., 10.500%, 9/15/2039, 144A(b)(c) | | | 59,002,177 | |
| | 12,950,000 | | | NLV Financial Corp., 7.500%, 8/15/2033, 144A(b)(c) | | | 14,937,773 | |
| | | | | | | | |
| | | | | | | 298,092,205 | |
| | | | | | | | |
| | | | Local Authorities – 1.6% | | | | |
| | 38,490,000 | | | New South Wales Treasury Corp., 3.500%, 3/20/2019, (AUD) | | | 30,735,894 | |
| | 99,500,000 | | | New South Wales Treasury Corp., 4.000%, 4/08/2021, (AUD) | | | 83,424,323 | |
| | 142,855,000 | | | New South Wales Treasury Corp., 6.000%, 2/01/2018, (AUD) | | | 115,496,230 | |
| | 1,507,000 | | | Ontario Hydro, Zero Coupon, 11/27/2020, (CAD) | | | 1,083,841 | |
| | 1,490,000 | | | Province of Ontario Canada, 2.100%, 9/08/2018, (CAD) | | | 1,163,993 | |
| | | | | | | | |
| | | | | | | 231,904,281 | |
| | | | | | | | |
| | | | Media Entertainment – 0.7% | | | | |
| | 164,410,000 | | | Grupo Televisa SAB, EMTN, 7.250%, 5/14/2043, (MXN) | | | 7,350,672 | |
| | 1,595,000 | | | iHeartCommunications, Inc., 9.000%, 3/01/2021 | | | 1,188,275 | |
| | 66,650,000 | | | iHeartCommunications, Inc., 9.000%, 9/15/2022 | | | 48,487,875 | |
| | 34,725,000 | | | R.R. Donnelley & Sons Co., 6.000%, 4/01/2024 | | | 34,464,562 | |
| | 3,610,000 | | | R.R. Donnelley & Sons Co., 6.500%, 11/15/2023 | | | 3,637,075 | |
| | 1,976,000 | | | R.R. Donnelley & Sons Co., 7.000%, 2/15/2022 | | | 2,050,100 | |
| | | | | | | | |
| | | | | | | 97,178,559 | |
| | | | | | | | |
See accompanying notes to financial statements.
19 |
Portfolio of Investments – as of September 30, 2016
Loomis Sayles Bond Fund – continued
| | | | | | | | |
Principal
Amount (‡) | | | Description | | Value (†) | |
|
| | Bonds and Notes – continued | |
| | |
| | | | Metals & Mining – 2.3% | | | | |
| $ | 8,456,540 | | | 1839688 Alberta ULC, PIK, 14.000%, 2/13/2020(b)(d)(i)(j) | | $ | 3,383 | |
| | 155,000 | | | AK Steel Corp., 7.625%, 5/15/2020 | | | 151,125 | |
| | 3,000,000 | | | AK Steel Corp., 7.625%, 10/01/2021 | | | 2,880,000 | |
| | 13,492,000 | | | Alcoa, Inc., 5.870%, 2/23/2022 | | | 14,503,900 | |
| | 11,795,000 | | | Alcoa, Inc., 5.900%, 2/01/2027 | | | 12,620,650 | |
| | 2,050,000 | | | Alcoa, Inc., 5.950%, 2/01/2037 | | | 2,061,275 | |
| | 6,490,000 | | | Alcoa, Inc., 6.750%, 1/15/2028 | | | 7,090,325 | |
| | 35,180,000 | | | ArcelorMittal, 7.750%, 3/01/2041 | | | 36,675,150 | |
| | 3,635,000 | | | ArcelorMittal, 8.000%, 10/15/2039 | | | 3,925,800 | |
| | 3,950,000 | | | Barrick Gold Corp., 5.800%, 11/15/2034 | | | 4,128,741 | |
| | 23,735,000 | | | Barrick North America Finance LLC, 5.750%, 5/01/2043 | | | 27,832,563 | |
| | 28,838,000 | | | Cliffs Natural Resources, Inc., 8.000%, 9/30/2020, 144A | | | 28,261,240 | |
| | 34,330,000 | | | Essar Steel Algoma, Inc., 9.500%, 11/15/2019, 144A(b)(c)(i) | | | 4,634,550 | |
| | 100,000 | | | First Quantum Minerals Ltd., 7.000%, 2/15/2021, 144A | | | 89,500 | |
| | 16,650,000 | | | First Quantum Minerals Ltd., 7.250%, 5/15/2022, 144A | | | 14,735,250 | |
| | 975,000 | | | Hecla Mining Co., 6.875%, 5/01/2021 | | | 978,656 | |
| | 19,310,000 | | | Lundin Mining Corp., 7.500%, 11/01/2020, 144A | | | 20,516,875 | |
| | 66,920,000 | | | Lundin Mining Corp., 7.875%, 11/01/2022, 144A | | | 71,269,800 | |
| | 6,500,000 | | | Rain CII Carbon LLC/CII Carbon Corp., 8.250%, 1/15/2021, 144A | | | 6,337,500 | |
| | 11,965,000 | | | Russel Metals, Inc., 6.000%, 4/19/2022, 144A, (CAD) | | | 9,188,412 | |
| | 15,555,000 | | | United States Steel Corp., 6.650%, 6/01/2037 | | | 12,444,000 | |
| | 5,167,000 | | | United States Steel Corp., 6.875%, 4/01/2021 | | | 5,115,330 | |
| | 2,848,000 | | | United States Steel Corp., 7.375%, 4/01/2020 | | | 2,833,760 | |
| | 38,460,000 | | | United States Steel Corp., 7.500%, 3/15/2022 | | | 37,883,100 | |
| | 10,540,000 | | | Worthington Industries, Inc., 6.500%, 4/15/2020 | | | 11,711,458 | |
| | | | | | | | |
| | | | | | | 337,872,343 | |
| | | | | | | | |
| | | | Midstream – 0.8% | | | | |
| | 755,000 | | | Blue Racer Midstream LLC/Blue Racer Finance Corp., 6.125%, 11/15/2022, 144A | | | 738,013 | |
| | 9,050,000 | | | DCP Midstream LLC, 6.450%, 11/03/2036, 144A | | | 8,801,125 | |
| | 7,500,000 | | | Florida Gas Transmission Co., 7.900%, 5/15/2019, 144A | | | 8,507,520 | |
| | 310,000 | | | Gibson Energy, Inc., 5.375%, 7/15/2022, 144A, (CAD) | | | 229,792 | |
| | 31,400,000 | | | IFM U.S. Colonial Pipeline 2 LLC, 6.450%, 5/01/2021, 144A | | | 35,450,129 | |
| | 205,000 | | | NGPL PipeCo LLC, 7.768%, 12/15/2037, 144A | | | 222,425 | |
| | 26,020,000 | | | Plains All American Pipeline LP, 6.125%, 1/15/2017 | | | 26,331,199 | |
| | 7,325,000 | | | Regency Energy Partners LP/Regency Energy Finance Corp., 4.500%, 11/01/2023 | | | 7,374,334 | |
| | 1,455,000 | | | Regency Energy Partners LP/Regency Energy Finance Corp., 5.000%, 10/01/2022 | | | 1,535,675 | |
| | 5,556,000 | | | Targa Resources Partners LP/Targa Resources Partners Finance Corp., 4.125%, 11/15/2019 | | | 5,633,784 | |
| | 4,258,532 | | | Transportadora de Gas del Sur S.A., 9.625%, 5/14/2020, 144A | | | 4,609,860 | |
| | 18,753,000 | | | Williams Partners LP, 3.350%, 8/15/2022 | | | 18,563,426 | |
| | | | | | | | |
| | | | | | | 117,997,282 | |
| | | | | | | | |
See accompanying notes to financial statements.
| 20
Portfolio of Investments – as of September 30, 2016
Loomis Sayles Bond Fund – continued
| | | | | | | | |
Principal
Amount (‡) | | | Description | | Value (†) | |
|
| | Bonds and Notes – continued | |
| | |
| | | | Mortgage Related – 0.0% | | | | |
| $ | 54,453 | | | FHLMC, 5.000%, 12/01/2031 | | $ | 61,013 | |
| | | | | | | | |
| | | | Natural Gas – 0.2% | | | | |
| | 4,130,000 | | | NiSource Finance Corp., 6.125%, 3/01/2022 | | | 4,927,941 | |
| | 21,041,000 | | | NiSource Finance Corp., 6.400%, 3/15/2018 | | | 22,462,130 | |
| | 1,235,000 | | | NiSource Finance Corp., 6.800%, 1/15/2019 | | | 1,375,205 | |
| | | | | | | | |
| | | | | | | 28,765,276 | |
| | | | | | | | |
| | | | Non-Agency Commercial Mortgage-Backed Securities – 0.4% | | | | |
| | 11,160,000 | | | GS Mortgage Securities Trust, Series 2007-GG10, Class AM, 5.988%, 8/10/2045(g) | | | 10,741,801 | |
| | 16,001,584 | | | Institutional Mortgage Securities Canada, Inc., Series 2014-5A, Class A1, 2.003%, 7/12/2047, 144A, (CAD) | | | 12,100,440 | |
| | 38,527,228 | | | Motel 6 Trust, Series 2015-M6MZ, Class M, 8.230%, 2/05/2020, 144A(b)(c) | | | 38,780,063 | |
| | | | | | | | |
| | | | | | | 61,622,304 | |
| | | | | | | | |
| | | | Oil Field Services – 0.8% | | | | |
| | 485,000 | | | Basic Energy Services, Inc., 7.750%, 10/15/2022 | | | 179,450 | |
| | 14,585,000 | | | FTS International, Inc., 6.250%, 5/01/2022 | | | 5,578,763 | |
| | 8,997,000 | | | Global Marine, Inc., 7.000%, 6/01/2028 | | | 6,297,900 | |
| | 15,000,000 | | | Nabors Industries, Inc., 5.100%, 9/15/2023 | | | 14,437,500 | |
| | 29,512,000 | | | Paragon Offshore PLC, 6.750%, 7/15/2022, 144A(i) | | | 8,189,580 | |
| | 47,072,000 | | | Paragon Offshore PLC, 7.250%, 8/15/2024, 144A(i) | | | 13,062,480 | |
| | 10,000 | | | Precision Drilling Corp., 5.250%, 11/15/2024 | | | 8,150 | |
| | 10,000 | | | Precision Drilling Corp., 6.500%, 12/15/2021 | | | 9,050 | |
| | 20,000 | | | Precision Drilling Corp., 6.625%, 11/15/2020 | | | 18,550 | |
| | 23,050,000 | | | Rowan Cos., Inc., 7.875%, 8/01/2019 | | | 24,605,875 | |
| | 10,432,000 | | | Sidewinder Drilling, Inc., 9.750%, 11/15/2019, 144A | | | 678,080 | |
| | 1,180,000 | | | Sidewinder Drilling, Inc., 9.750%, 11/15/2019 | | | 76,700 | |
| | 51,710,000 | | | Transocean, Inc., 5.050%, 10/15/2022 | | | 40,527,712 | |
| | 1,670,000 | | | Transocean, Inc., 6.800%, 3/15/2038 | | | 1,093,850 | |
| | | | | | | | |
| | | | | | | 114,763,640 | |
| | | | | | | | |
| | | | Packaging – 0.1% | | | | |
| | 10,351,000 | | | Reynolds Group Issuer, Inc./Reynolds Group Issuer LLC/Reynolds Group Issuer (Luxembourg) S.A., 8.250%, 2/15/2021 | | | 10,790,917 | |
| | 1,705,000 | | | Signode Industrial Group Lux S.A./Signode Industrial Group U.S., Inc., 6.375%, 5/01/2022, 144A | | | 1,726,313 | |
| | | | | | | | |
| | | | | | | 12,517,230 | |
| | | | | | | | |
| | | | Paper – 0.9% | | | | |
| | 38,882,000 | | | Georgia-Pacific LLC, 7.750%, 11/15/2029 | | | 55,641,891 | |
| | 9,625,000 | | | International Paper Co., 8.700%, 6/15/2038 | | | 14,235,519 | |
| | 8,214,000 | | | WestRock MWV LLC, 7.950%, 2/15/2031 | | | 11,074,879 | |
| | 25,138,000 | | | WestRock MWV LLC, 8.200%, 1/15/2030 | | | 34,277,096 | |
See accompanying notes to financial statements.
21 |
Portfolio of Investments – as of September 30, 2016
Loomis Sayles Bond Fund – continued
| | | | | | | | |
Principal
Amount (‡) | | | Description | | Value (†) | |
|
| | Bonds and Notes – continued | |
| | |
| | | | Paper – continued | | | | |
| $ | 4,127,000 | | | Weyerhaeuser Co., 6.950%, 10/01/2027 | | $ | 5,130,674 | |
| | 14,035,000 | | | Weyerhaeuser Co., 7.375%, 3/15/2032 | | | 19,001,299 | |
| | | | | | | | |
| | | | | | | 139,361,358 | |
| | | | | | | | |
| | | | Property & Casualty Insurance – 0.2% | | | | |
| | 2,000,000 | | | Liberty Mutual Group, Inc., (fixed rate to 3/15/2017, variable rate thereafter), 7.000%, 3/07/2067, 144A | | | 1,710,000 | |
| | 13,985,000 | | | MBIA Insurance Corp., 11.940%, 1/15/2033, 144A(e)(g) | | | 5,594,000 | |
| | 80,000 | | | MBIA Insurance Corp., 11.940%, 1/15/2033(e)(g) | | | 32,000 | |
| | 1,371,000 | | | Old Republic International Corp., 4.875%, 10/01/2024 | | | 1,482,446 | |
| | 12,080,000 | | | Sirius International Group, 6.375%, 3/20/2017, 144A | | | 12,271,384 | |
| | 1,140,000 | | | Sirius International Group, (fixed rate to 6/30/2017, variable rate thereafter), 7.506%, 144A(f) | | | 1,147,296 | |
| | 6,575,000 | | | XLIT Ltd., 6.250%, 5/15/2027 | | | 7,940,614 | |
| | | | | | | | |
| | | | | | | 30,177,740 | |
| | | | | | | | |
| | | | Railroads – 0.1% | | | | |
| | 7,944,000 | | | Missouri Pacific Railroad Co., 5.000%, 1/01/2045(b)(c) | | | 7,767,587 | |
| | 63,300 | | | Missouri Pacific Railroad Co., Series A, 4.750%, 1/01/2020(b)(c) | | | 63,140 | |
| | | | | | | | |
| | | | | | | 7,830,727 | |
| | | | | | | | |
| | | | Real Estate Operations/Development – 0.1% | | | | |
| | 7,750,000 | | | First Industrial LP, 5.950%, 5/15/2017 | | | 7,947,408 | |
| | | | | | | | |
| | | | Restaurants – 0.0% | | | | |
| | 1,325,000 | | | Wagamama Finance PLC, 7.875%, 2/01/2020, 144A, (GBP) | | | 1,805,415 | |
| | | | | | | | |
| | | | Retailers – 0.8% | | | | |
| | 4,680,000 | | | Dillard’s, Inc., 7.000%, 12/01/2028 | | | 5,358,319 | |
| | 7,182,000 | | | Dillard’s, Inc., 7.750%, 7/15/2026 | | | 8,268,637 | |
| | 2,250,000 | | | Dillard’s, Inc., 7.750%, 5/15/2027 | | | 2,621,250 | |
| | 8,524,000 | | | Foot Locker, Inc., 8.500%, 1/15/2022 | | | 10,058,320 | |
| | 7,675,000 | | | GameStop Corp., 5.500%, 10/01/2019, 144A | | | 7,838,094 | |
| | 36,970,000 | | | J.C. Penney Corp., Inc., 6.375%, 10/15/2036 | | | 31,794,200 | |
| | 3,515,000 | | | J.C. Penney Corp., Inc., 7.625%, 3/01/2097 | | | 2,899,875 | |
| | 14,133,000 | | | Macy’s Retail Holdings, Inc., 6.790%, 7/15/2027 | | | 16,289,328 | |
| | 9,245,000 | | | Marks & Spencer PLC, 7.125%, 12/01/2037, 144A | | | 11,527,221 | |
| | 815,000 | | | Nine West Holdings, Inc., 6.125%, 11/15/2034 | | | 105,950 | |
| | 24,302,000 | | | TRU Taj LLC/TRU Taj Finance, Inc., 12.000%, 8/15/2021, 144A | | | 24,484,265 | |
| | | | | | | | |
| | | | | | | 121,245,459 | |
| | | | | | | | |
| | | | Sovereigns – 0.4% | | | | |
| | 58,860,000 | | | Portugal Government International Bond, 5.125%, 10/15/2024, 144A | | | 58,628,798 | |
| | 65,000 | | | Portugal Government International Bond, 5.125%, 10/15/2024, 144A | | | 64,745 | |
| | | | | | | | |
| | | | | | | 58,693,543 | |
| | | | | | | | |
See accompanying notes to financial statements.
| 22
Portfolio of Investments – as of September 30, 2016
Loomis Sayles Bond Fund – continued
| | | | | | | | |
Principal
Amount (‡) | | | Description | | Value (†) | |
|
| | Bonds and Notes – continued | |
| | |
| | | | Supermarkets – 1.5% | | | | |
| $ | 107,435,000 | | | New Albertson’s, Inc., 7.450%, 8/01/2029 | | $ | 105,286,300 | |
| | 27,027,000 | | | New Albertson’s, Inc., 7.750%, 6/15/2026 | | | 26,925,649 | |
| | 23,152,000 | | | New Albertson’s, Inc., 8.000%, 5/01/2031 | | | 22,833,660 | |
| | 6,955,000 | | | New Albertson’s, Inc., 8.700%, 5/01/2030 | | | 7,059,325 | |
| | 21,208,000 | | | New Albertson’s, Inc., Series C, MTN, 6.625%, 6/01/2028 | | | 19,511,360 | |
| | 3,585,000 | | | SUPERVALU, Inc., 6.750%, 6/01/2021 | | | 3,351,975 | |
| | 35,540,000 | | | SUPERVALU, Inc., 7.750%, 11/15/2022 | | | 33,940,700 | |
| | | | | | | | |
| | | | | | | 218,908,969 | |
| | | | | | | | |
| | | | Supranational – 1.3% | | | | |
| | 18,525,000 | | | European Investment Bank, MTN, 6.000%, 8/06/2020, (AUD) | | | 16,121,612 | |
| | 185,840,000 | | | Inter-American Development Bank, EMTN, 6.000%, 12/15/2017, (NZD) | | | 140,987,020 | |
| | 40,000,000 | | | Inter-American Development Bank, MTN, 6.500%, 8/20/2019, (AUD) | | | 34,496,492 | |
| | | | | | | | |
| | | | | | | 191,605,124 | |
| | | | | | | | |
| | | | Technology – 1.8% | | | | |
| | 238,000 | | | Advanced Micro Devices, Inc., 7.000%, 7/01/2024 | | | 233,835 | |
| | 75,630,000 | | | Alcatel-Lucent USA, Inc., 6.450%, 3/15/2029 | | | 83,665,687 | |
| | 57,898,000 | | | Amkor Technology, Inc., 6.375%, 10/01/2022 | | | 59,779,685 | |
| | 2,630,000 | | | Arrow Electronics, Inc., 6.875%, 6/01/2018 | | | 2,840,229 | |
| | 5,645,000 | | | Corning, Inc., 7.250%, 8/15/2036 | | | 6,997,226 | |
| | 73,905,000 | | | KLA-Tencor Corp., 4.650%, 11/01/2024 | | | 81,213,983 | |
| | 12,970,000 | | | KLA-Tencor Corp., 5.650%, 11/01/2034 | | | 14,440,046 | |
| | 4,385,000 | | | Motorola Solutions, Inc., 6.625%, 11/15/2037 | | | 4,542,378 | |
| | 3,036,000 | | | Samsung Electronics Co. Ltd., 7.700%, 10/01/2027, 144A | | | 3,873,456 | |
| | 8,080,000 | | | Western Digital Corp., 7.375%, 4/01/2023, 144A | | | 8,888,000 | |
| | | | | | | | |
| | | | | | | 266,474,525 | |
| | | | | | | | |
| | | | Transportation Services – 0.2% | | | | |
| | 20,994,000 | | | APL Ltd., 8.000%, 1/15/2024(b)(c) | | | 13,856,040 | |
| | 6,427,401 | | | Atlas Air Pass Through Trust, Series 1998-1, Class B, 7.680%, 1/02/2018(d) | | | 6,539,880 | |
| | 1,986,784 | | | Atlas Air Pass Through Trust, Series 1998-1, Class C, 8.010%, 7/02/2011(d)(k) | | | 2,031,487 | |
| | 1,959,577 | | | Atlas Air Pass Through Trust, Series 1999-1, Class B, 7.630%, 1/02/2018(d) | | | 1,959,577 | |
| | 7,520,331 | | | Atlas Air Pass Through Trust, Series 1999-1, Class C, 8.770%, 7/02/2012(d)(k) | | | 7,745,941 | |
| | 3,160,409 | | | Atlas Air Pass Through Trust, Series 2000-1, Class B, 9.057%, 1/02/2018(d) | | | 3,207,815 | |
| | | | | | | | |
| | | | | | | 35,340,740 | |
| | | | | | | | |
| | | | Treasuries – 26.8% | | | | |
| | 597,515,000 | | | Canadian Government, 0.250%, 5/01/2017, (CAD) | | | 454,720,779 | |
| | 545,500,000 | | | Canadian Government, 0.750%, 9/01/2020, (CAD) | | | 418,699,680 | |
See accompanying notes to financial statements.
23 |
Portfolio of Investments – as of September 30, 2016
Loomis Sayles Bond Fund – continued
| | | | | | | | |
Principal
Amount (‡) | | | Description | | Value (†) | |
|
| | Bonds and Notes – continued | |
| | |
| | | | Treasuries – continued | | | | |
| | 254,495,000 | | | Canadian Government, 1.250%, 9/01/2018, (CAD) | | $ | 196,719,330 | |
| | 6,575,000 | | | Hellenic Republic Government Bond, 3.375%, 7/17/2017, 144A, (EUR) | | | 7,221,240 | |
| | 980,000 | | | Hellenic Republic Government Bond, Series PSI, (Step to 3.650% on 2/24/2020), 3.000%, 2/24/2024, (EUR)(h) | | | 804,950 | |
| | 2,040,000 | | | Hellenic Republic Government Bond, Series PSI, (Step to 3.650% on 2/24/2020), 3.000%, 2/24/2035, (EUR)(h) | | | 1,349,804 | |
| | 1,290,000 | | | Hellenic Republic Government Bond, Series PSI, (Step to 3.650% on 2/24/2020), 3.000%, 2/24/2036, (EUR)(h) | | | 856,372 | |
| | 310,000 | | | Hellenic Republic Government Bond, Series PSI, (Step to 3.650% on 2/24/2020), 3.000%, 2/24/2037, (EUR)(h) | | | 204,322 | |
| | 3,710,000 | | | Hellenic Republic Government Bond, Series PSI, (Step to 3.650% on 2/24/2020), 3.000%, 2/24/2038, (EUR)(h) | | | 2,420,574 | |
| | 4,825,000 | | | Hellenic Republic Government Bond, Series PSI, (Step to 3.650% on 2/24/2020), 3.000%, 2/24/2039, (EUR)(h) | | | 3,151,975 | |
| | 465,000 | | | Hellenic Republic Government Bond, Series PSI, (Step to 3.650% on 2/24/2020), 3.000%, 2/24/2040, (EUR)(h) | | | 302,920 | |
| | 6,200,000 | | | Hellenic Republic Government Bond, Series PSI, (Step to 3.650% on 2/24/2020), 3.000%, 2/24/2041, (EUR)(h) | | | 4,046,195 | |
| | 8,742,110,000 | | | Iceland Government International Bond, 6.000%, 10/13/2016, (ISK) | | | 52,028,564 | |
| | 2,331,740,000 | | | Iceland Government International Bond, 7.250%, 10/26/2022, (ISK) | | | 15,336,742 | |
| | 5,523,835,000 | | | Iceland Government International Bond, 8.750%, 2/26/2019, (ISK) | | | 35,444,608 | |
| | 8,357,200(†††) | | | Mexican Fixed Rate Bonds, Series M, 5.000%, 6/15/2017, (MXN) | | | 43,127,458 | |
| | 8,554,600(†††) | | | Mexican Fixed Rate Bonds, Series M, 6.500%, 6/10/2021, (MXN) | | | 45,454,057 | |
| | 4,579,595(†††) | | | Mexican Fixed Rate Bonds, Series M, 7.750%, 5/29/2031, (MXN) | | | 26,716,530 | |
| | 10,160,320(†††) | | | Mexican Fixed Rate Bonds, Series M-20, 7.500%, 6/03/2027, (MXN) | | | 57,965,085 | |
| | 39,547,655(†††) | | | Mexican Fixed Rate Bonds, Series M-20, 8.000%, 12/07/2023, (MXN) | | | 229,298,588 | |
| | 3,288,446(†††) | | | Mexican Fixed Rate Bonds, Series M-20, 8.500%, 5/31/2029, (MXN) | | | 20,266,535 | |
| | 34,470,000(†††) | | | Mexican Fixed Rate Bonds, Series M-20, 10.000%, 12/05/2024, (MXN) | | | 224,580,723 | |
| | 113,749(†††) | | | Mexican Fixed Rate Bonds, Series M-20, 10.000%, 12/05/2024, (MXN) | | | 741,103 | |
| | 137,580,000 | | | New Zealand Government Bond, 5.000%, 3/15/2019, (NZD) | | | 107,537,247 | |
| | 128,565,000 | | | New Zealand Government Bond, 6.000%, 5/15/2021, (NZD) | | | 110,254,446 | |
| | 83,000,000 | | | New Zealand Government Bond, Series 420, 3.000%, 4/15/2020, (NZD) | | | 62,620,642 | |
| | 764,599,000 | | | Norway Government Bond, 3.750%, 5/25/2021, 144A, (NOK) | | | 107,988,395 | |
| | 1,317,525,000 | | | Norway Government Bond, 4.250%, 5/19/2017, 144A, (NOK) | | | 168,580,773 | |
| | 1,096,778,000 | | | Norway Government Bond, 4.500%, 5/22/2019, 144A, (NOK) | | | 150,619,368 | |
| | 253,010,000 | | | Republic of Brazil, 8.500%, 1/05/2024, (BRL) | | | 71,865,685 | |
| | 97,345,000 | | | Republic of Brazil, 10.250%, 1/10/2028, (BRL) | | | 30,381,494 | |
| | 150,000,000 | | | U.S. Treasury Note, 0.500%, 3/31/2017 | | | 150,011,700 | |
| | 275,000,000 | | | U.S. Treasury Note, 0.500%, 7/31/2017 | | | 274,742,050 | |
| | 300,000,000 | | | U.S. Treasury Note, 0.625%, 6/30/2018 | | | 299,343,600 | |
| | 150,000,000 | | | U.S. Treasury Note, 0.750%, 1/31/2018 | | | 150,052,800 | |
| | 150,000,000 | | | U.S. Treasury Note, 0.750%, 8/31/2018 | | | 149,970,750 | |
See accompanying notes to financial statements.
| 24
Portfolio of Investments – as of September 30, 2016
Loomis Sayles Bond Fund – continued
| | | | | | | | |
Principal
Amount (‡) | | | Description | | Value (†) | |
|
| | Bonds and Notes – continued | |
| | |
| | | | Treasuries – continued | | | | |
| $ | 300,000,000 | | | U.S. Treasury Note, 0.750%, 9/30/2018 | | $ | 299,906,400 | |
| | | | | | | | |
| | | | | | | 3,975,333,484 | |
| | | | | | | | |
| | | | Wireless – 0.8% | | | | |
| | 281,500,000 | | | America Movil SAB de CV, 6.450%, 12/05/2022, (MXN) | | | 14,140,512 | |
| | 143,600,000 | | | America Movil SAB de CV, 8.460%, 12/18/2036, (MXN) | | | 7,329,797 | |
| | 44,104,000 | | | Sprint Capital Corp., 6.875%, 11/15/2028 | | | 41,402,630 | |
| | 8,400,000 | | | Sprint Capital Corp., 8.750%, 3/15/2032 | | | 8,568,000 | |
| | 27,683,000 | | | Sprint Communications, Inc., 6.000%, 11/15/2022 | | | 25,675,982 | |
| | 10,853,000 | | | Sprint Corp., 7.125%, 6/15/2024 | | | 10,581,675 | |
| | 11,346,000 | | | Sprint Corp., 7.250%, 9/15/2021 | | | 11,388,548 | |
| | | | | | | | |
| | | | | | | 119,087,144 | |
| | | | | | | | |
| | | | Wirelines – 5.6% | | | | |
| | 75,360,000 | | | AT&T, Inc., 2.625%, 12/01/2022 | | | 75,957,454 | |
| | 59,951,000 | | | AT&T, Inc., 3.000%, 2/15/2022 | | | 61,901,446 | |
| | 5,790,000 | | | Bell Canada, MTN, 6.550%, 5/01/2029, 144A, (CAD) | | | 5,695,203 | |
| | 3,695,000 | | | Bell Canada, MTN, 7.300%, 2/23/2032, (CAD) | | | 3,924,510 | |
| | 10,946,000 | | | Bell Canada, Series M-17, 6.100%, 3/16/2035, (CAD) | | | 10,628,621 | |
| | 95,630,000 | | | CenturyLink, Inc., 6.450%, 6/15/2021 | | | 102,443,638 | |
| | 11,005,000 | | | CenturyLink, Inc., Series G, 6.875%, 1/15/2028 | | | 10,606,069 | |
| | 7,255,000 | | | CenturyLink, Inc., Series P, 7.600%, 9/15/2039 | | | 6,311,850 | |
| | 11,795,000 | | | CenturyLink, Inc., Series W, 6.750%, 12/01/2023 | | | 12,266,800 | |
| | 1,440,000 | | | Cincinnati Bell Telephone Co. LLC, 6.300%, 12/01/2028 | | | 1,369,800 | |
| | 3,620,000 | | | Cincinnati Bell, Inc., 7.000%, 7/15/2024, 144A | | | 3,710,500 | |
| | 11,991,000 | | | Consolidated Communications, Inc., 6.500%, 10/01/2022 | | | 11,631,270 | |
| | 8,735,000 | | | Embarq Corp., 7.995%, 6/01/2036 | | | 8,839,645 | |
| | 11,505,000 | | | FairPoint Communications, Inc., 8.750%, 8/15/2019, 144A | | | 11,735,100 | |
| | 21,745,000 | | | Frontier Communications Corp., 6.250%, 9/15/2021 | | | 20,902,381 | |
| | 24,305,000 | | | Frontier Communications Corp., 6.875%, 1/15/2025 | | | 21,509,925 | |
| | 60,000 | | | Frontier Communications Corp., 7.000%, 11/01/2025 | | | 52,800 | |
| | 4,035,000 | | | Frontier Communications Corp., 7.875%, 1/15/2027 | | | 3,611,325 | |
| | 1,240,000 | | | Frontier Communications Corp., 9.000%, 8/15/2031 | | | 1,140,800 | |
| | 1,235,000 | | | Level 3 Financing, Inc., 5.375%, 8/15/2022 | | | 1,290,575 | |
| | 305,000 | | | Oi Brasil Holdings Cooperatief UA, 5.750%, 2/10/2022, 144A(i) | | | 76,631 | |
| | 24,165,000 | | | Portugal Telecom International Finance BV, EMTN, 4.500%, 6/16/2025, (EUR)(e) | | | 6,243,520 | |
| | 43,231,000 | | | Portugal Telecom International Finance BV, EMTN, 5.000%, 11/04/2019, (EUR)(e) | | | 11,169,609 | |
| | 64,382,000 | | | Qwest Capital Funding, Inc., 6.875%, 7/15/2028 | | | 60,840,990 | |
| | 16,040,000 | | | Qwest Capital Funding, Inc., 7.625%, 8/03/2021 | | | 16,521,200 | |
| | 41,590,000 | | | Qwest Capital Funding, Inc., 7.750%, 2/15/2031 | | | 40,342,300 | |
| | 32,321,000 | | | Qwest Corp., 6.875%, 9/15/2033 | | | 32,220,740 | |
| | 10,785,000 | | | Qwest Corp., 7.250%, 9/15/2025 | | | 11,802,327 | |
| | 785,000 | | | Qwest Corp., 7.250%, 10/15/2035 | | | 776,661 | |
See accompanying notes to financial statements.
25 |
Portfolio of Investments – as of September 30, 2016
Loomis Sayles Bond Fund – continued
| | | | | | | | |
Principal
Amount (‡) | | | Description | | Value (†) | |
|
| | Bonds and Notes – continued | |
| | |
| | | | Wirelines – continued | | | | |
| $ | 63,364,000 | | | Telecom Italia Capital S.A., 6.000%, 9/30/2034 | | $ | 62,746,201 | |
| | 32,356,000 | | | Telecom Italia Capital S.A., 6.375%, 11/15/2033 | | | 32,922,230 | |
| | 4,300,000 | | | Telecom Italia SpA, EMTN, 5.875%, 5/19/2023, (GBP) | | | 6,504,207 | |
| | 1,850,000 | | | Telefonica Emisiones SAU, 5.134%, 4/27/2020 | | | 2,039,336 | |
| | 2,100,000 | | | Telefonica Emisiones SAU, 5.462%, 2/16/2021 | | | 2,384,668 | |
| | 4,700,000 | | | Telefonica Emisiones SAU, EMTN, 5.289%, 12/09/2022, (GBP) | | | 7,415,100 | |
| | 18,145,000 | | | Telefonica Emisiones SAU, EMTN, 5.375%, 2/02/2026, (GBP) | | | 30,127,601 | |
| | 45,415,000 | | | Telus Corp., 4.950%, 3/15/2017, (CAD) | | | 35,194,159 | |
| | 27,020,000 | | | Telus Corp., Series CG, 5.050%, 12/04/2019, (CAD) | | | 22,687,985 | |
| | 73,892,000 | | | Verizon Communications, Inc., 2.450%, 11/01/2022 | | | 75,044,715 | |
| | | | | | | | |
| | | | | | | 832,589,892 | |
| | | | | | | | |
| | |
| | | | Total Non-Convertible Bonds
(Identified Cost $11,813,723,956) | | | 11,207,967,207 | |
| | | | | | | | |
| |
| | Convertible Bonds – 7.3% | | | | |
| | |
| | | | Building Materials – 0.1% | | | | |
| | 1,015,000 | | | CalAtlantic Group, Inc., 0.250%, 6/01/2019 | | | 940,144 | |
| | 415,000 | | | CalAtlantic Group, Inc., 1.250%, 8/01/2032 | | | 432,378 | |
| | 14,067,000 | | | KB Home, 1.375%, 2/01/2019 | | | 13,680,157 | |
| | | | | | | | |
| | | | | | | 15,052,679 | |
| | | | | | | | |
| | | | Cable Satellite – 1.3% | | | | |
| | 170,470,000 | | | Dish Network Corp., 3.375%, 8/15/2026, 144A | | | 186,664,650 | |
| | | | | | | | |
| | | | Chemicals – 0.1% | | | | |
| | 5,934,000 | | | RPM International, Inc., 2.250%, 12/15/2020 | | | 7,109,674 | |
| | | | | | | | |
| | | | Consumer Products – 0.0% | | | | |
| | 675,000 | | | Iconix Brand Group, Inc., 1.500%, 3/15/2018 | | | 582,188 | |
| | | | | | | | |
| | | | Diversified Manufacturing – 0.2% | | | | |
| | 25,202,000 | | | Trinity Industries, Inc., 3.875%, 6/01/2036 | | | 30,116,390 | |
| | | | | | | | |
| | | | Healthcare – 0.3% | | | | |
| | 27,720,000 | | | Hologic, Inc., (accretes to principal after 3/01/2018), 2.000%, 3/01/2042(h) | | | 37,768,500 | |
| | | | | | | | |
| | | | Leisure – 0.2% | | | | |
| | 35,626,000 | | | Rovi Corp., 0.500%, 3/01/2020 | | | 35,502,378 | |
| | | | | | | | |
| | | | Metals & Mining – 0.0% | | | | |
| | 2,005,000 | | | TimkenSteel Corp., 6.000%, 6/01/2021 | | | 2,202,994 | |
| | | | | | | | |
| | | | Midstream – 0.3% | | | | |
| | 33,110,000 | | | Chesapeake Energy Corp., 2.250%, 12/15/2038 | | | 30,833,688 | |
| | 10,327,000 | | | Chesapeake Energy Corp., 2.500%, 5/15/2037 | | | 10,262,456 | |
| | | | | | | | |
| | | | | | | 41,096,144 | |
| | | | | | | | |
See accompanying notes to financial statements.
| 26
Portfolio of Investments – as of September 30, 2016
Loomis Sayles Bond Fund – continued
| | | | | | | | |
Principal
Amount (‡) | | | Description | | Value (†) | |
|
| | Bonds and Notes – continued | |
| | |
| | | | Pharmaceuticals – 0.0% | | | | |
| $ | 2,107,000 | | | BioMarin Pharmaceutical, Inc., 0.750%, 10/15/2018 | | $ | 2,527,083 | |
| | 2,929,000 | | | BioMarin Pharmaceutical, Inc., 1.500%, 10/15/2020 | | | 3,652,097 | |
| | | | | | | | |
| | | | | | | 6,179,180 | |
| | | | | | | | |
| | | | Property & Casualty Insurance – 0.4% | | | | |
| | 47,743,000 | | | Old Republic International Corp., 3.750%, 3/15/2018 | | | 57,321,439 | |
| | | | | | | | |
| | | | Technology – 4.4% | | | | |
| | 5,410,000 | | | Brocade Communications Systems, Inc., 1.375%, 1/01/2020 | | | 5,338,994 | |
| | 14,865,000 | | | Ciena Corp., 3.750%, 10/15/2018, 144A | | | 18,804,225 | |
| | 316,175,000 | | | Intel Corp., 3.250%, 8/01/2039 | | | 578,205,031 | |
| | 1,605,000 | | | Lam Research Corp., Series B, 1.250%, 5/15/2018 | | | 2,554,959 | |
| | 6,962,350 | | | Liberty Interactive LLC, 3.500%, 1/15/2031 | | | 6,476,287 | |
| | 11,900,000 | | | Nuance Communications, Inc., 1.000%, 12/15/2035, 144A | | | 10,353,000 | |
| | 1,231,000 | | | Nuance Communications, Inc., 1.500%, 11/01/2035 | | | 1,154,832 | |
| | 13,345,000 | | | Priceline Group, Inc. (The), 0.900%, 9/15/2021 | | | 14,329,194 | |
| | 15,405,000 | | | Viavi Solutions, Inc., 0.625%, 8/15/2033 | | | 15,327,975 | |
| | | | | | | | |
| | | | | | | 652,544,497 | |
| | | | | | | | |
| | |
| | | | Total Convertible Bonds
(Identified Cost $755,987,319) | | | 1,072,140,713 | |
| | | | | | | | |
|
| | Municipals – 1.5% | |
| | |
| | | | District of Columbia – 0.1% | | | | |
| | 5,610,000 | | | Metropolitan Washington Airports Authority, Series D, 8.000%, 10/01/2047 | | | 7,745,671 | |
| | | | | | | | |
| | | | Illinois – 0.1% | | | | |
| | 25,725,000 | | | State of Illinois, 5.100%, 6/01/2033 | | | 24,798,900 | |
| | | | | | | | |
| | | | Michigan – 0.1% | | | | |
| | 18,050,000 | | | Michigan Tobacco Settlement Finance Authority Taxable Turbo, Series A, 7.309%, 6/01/2034 | | | 17,713,006 | |
| | | | | | | | |
| | | | Virginia – 0.8% | | | | |
| | 135,045,000 | | | Virginia Tobacco Settlement Financing Corp., Series A-1, 6.706%, 6/01/2046 | | | 115,987,450 | |
| | | | | | | | |
| | | | Puerto Rico – 0.4% | | | | |
| | 85,210,000 | | | Commonwealth of Puerto Rico, GO, Refunding, Series A, 8.000%, 7/01/2035(i) | | | 55,706,037 | |
| | | | | | | | |
| | | | Total Municipals
(Identified Cost $249,371,922) | | | 221,951,064 | |
| | | | | | | | |
| | |
| | | | Total Bonds and Notes
(Identified Cost $12,819,083,197) | | | 12,502,058,984 | |
| | | | | | | | |
See accompanying notes to financial statements.
27 |
Portfolio of Investments – as of September 30, 2016
Loomis Sayles Bond Fund – continued
| | | | | | | | |
Principal
Amount (‡) | | | Description | | Value (†) | |
|
| | Senior Loans – 1.5% | |
| | |
| | | | Automotive – 0.1% | | | | |
| $ | 9,352,240 | | | IBC Capital Ltd., 1st Lien Term Loan, 4.985%, 9/09/2021(g) | | $ | 9,157,433 | |
| | 7,744,876 | | | IBC Capital Ltd., 2nd Lien Term Loan, 8.000%, 9/09/2022(b)(c)(g) | | | 6,989,751 | |
| | | | | | | | |
| | | | | | | 16,147,184 | |
| | | | | | | | |
| | | | Chemicals – 0.4% | | | | |
| | 7,953,832 | | | Emerald Performance Materials LLC, New 2nd Lien Term Loan, 7.750%, 8/01/2022(g) | | | 7,933,947 | |
| | 48,235,000 | | | Houghton International, Inc., New 2nd Lien Term Loan, 9.750%, 12/20/2020(g) | | | 47,511,475 | |
| | | | | | | | |
| | | | | | | 55,445,422 | |
| | | | | | | | |
| | | | Consumer Cyclical Services – 0.5% | | | | |
| | 38,130,062 | | | SourceHov LLC, 2014 1st Lien Term Loan, 7.750%, 10/31/2019(g) | | | 31,790,939 | |
| | 55,750,000 | | | SourceHov LLC, 2014 2nd Lien Term Loan, 11.500%, 4/30/2020(g) | | | 35,680,000 | |
| | | | | | | | |
| | | | | | | 67,470,939 | |
| | | | | | | | |
| | | | Diversified Manufacturing – 0.1% | | | | |
| | 12,644,469 | | | Ameriforge Group, Inc., 1st Lien Term Loan, 5.000%, 12/19/2019(g) | | | 7,080,903 | |
| | | | | | | | |
| | | | Financial Other – 0.1% | | | | |
| | 16,730,113 | | | DBRS Ltd., Term Loan, 6.250%, 3/04/2022(g) | | | 16,406,051 | |
| | | | | | | | |
| | | | Industrial Other – 0.0% | | | | |
| | 2,819,636 | | | Eastman Kodak Co., Exit Term Loan, 7.250%, 9/03/2019(g) | | | 2,802,013 | |
| | | | | | | | |
| | | | Media Entertainment – 0.0% | | | | |
| | 3,598,822 | | | Dex Media, Inc., Term Loan, 11.000%, 7/29/2021(g) | | | 3,427,878 | |
| | | | | | | | |
| | | | Natural Gas – 0.0% | | | | |
| | 1,829,664 | | | Southcross Holdings Borrower LP, Exit Term Loan B, 3.500%, 4/13/2023(g) | | | 1,527,770 | |
| | | | | | | | |
| | | | Oil Field Services – 0.1% | | | | |
| | 3,109,527 | | | FTS International, Inc., New Term Loan B, 5.750%, 4/16/2021(g) | | | 1,222,044 | |
| | 8,124,988 | | | Paragon Offshore Finance Co., Term Loan B, 5.250%, 7/18/2021(g)(i) | | | 1,960,153 | |
| | 3,801,875 | | | Petroleum Geo-Services ASA, New Term Loan B, 3.250%, 3/19/2021(g) | | | 2,499,733 | |
| | 3,558,623 | | | UTEX Industries, Inc., 2nd Lien Term Loan 2014, 8.250%, 5/22/2022(g) | | | 1,690,346 | |
| | | | | | | | |
| | | | | | | 7,372,276 | |
| | | | | | | | |
| | | | Other Utility – 0.0% | | | | |
| | 4,525,000 | | | PowerTeam Services LLC, 2nd Lien Term Loan, 8.250%, 11/06/2020(g) | | | 4,502,375 | |
| | | | | | | | |
| | | | Retailers – 0.0% | | | | |
| | 4,505,757 | | | Toys “R” Us Property Co. I LLC, New Term Loan B, 6.000%, 8/21/2019(g) | | | 4,241,043 | |
| | | | | | | | |
| | | | Technology – 0.1% | | | | |
| | 5,596,800 | | | Aptean, Inc., 2nd Lien Term Loan, 8.500%, 2/26/2021(g) | | | 5,488,390 | |
| | 7,048,927 | | | IQOR U.S., Inc., 2nd Lien Term Loan, 9.750%, 4/01/2022(b)(c)(g) | | | 4,969,494 | |
| | | | | | | | |
| | | | | | | 10,457,884 | |
| | | | | | | | |
See accompanying notes to financial statements.
| 28
Portfolio of Investments – as of September 30, 2016
Loomis Sayles Bond Fund – continued
| | | | | | | | |
Principal
Amount (‡) | | | Description | | Value (†) | |
|
| | Senior Loans – continued | |
| | |
| | | | Transportation Services – 0.0% | | | | |
| $ | 4,734,434 | | | OSG Bulk Ships, Inc., OBS Term Loan, 5.250%, 8/05/2019(g) | | $ | 4,716,680 | |
| | | | | | | | |
| | | | Wireless – 0.0% | | | | |
| | 4,615,385 | | | Asurion LLC, New 2nd Lien Term Loan, 8.500%, 3/03/2021(g) | | | 4,584,600 | |
| | | | | | | | |
| | | | Wirelines – 0.1% | | | | |
| | 19,347,093 | | | Integra Telecom, Inc., 2nd Lien Term Loan, 9.750%, 2/12/2021(b)(c)(g) | | | 18,283,003 | |
| | 2,548,975 | | | LTS Buyer LLC, 2nd Lien Term Loan, 8.000%, 4/12/2021(g) | | | 2,548,975 | |
| | | | | | | | |
| | | | | | | 20,831,978 | |
| | | | | | | | |
| | |
| | | | Total Senior Loans
(Identified Cost $282,499,160) | | | 227,014,996 | |
| | | | | | | | |
| | |
| | Shares | | | | | | | |
|
| | Common Stocks – 9.3% | |
| | |
| | | | Airlines – 0.1% | | | | |
| | 213,831 | | | United Continental Holdings, Inc.(e) | | | 11,219,713 | |
| | | | | | | | |
| | | | Automobiles – 1.8% | | | | |
| | 21,480,222 | | | Ford Motor Co. | | | 259,266,280 | |
| | | | | | | | |
| | | | Containers & Packaging – 0.1% | | | | |
| | 645,508 | | | Owens-Illinois, Inc.(e) | | | 11,870,892 | |
| | | | | | | | |
| | | | Diversified Telecommunication Services – 0.3% | | | | |
| | 375,021 | | | Hawaiian Telcom Holdco, Inc.(e) | | | 8,396,720 | |
| | 421,481 | | | Level 3 Communications, Inc.(e) | | | 19,548,289 | |
| | 1,759,489 | | | Telefonica S.A., Sponsored ADR | | | 17,735,649 | |
| | | | | | | | |
| | | | | | | 45,680,658 | |
| | | | | | | | |
| | | | Energy Equipment & Services – 0.0% | | | | |
| | 486,727 | | | Hercules Offshore, Inc.(e) | | | 842,038 | |
| | | | | | | | |
| | | | Household Durables – 0.1% | | | | |
| | 256,311 | | | Newell Brands, Inc. | | | 13,497,337 | |
| | | | | | | | |
| | | | Internet Software & Services – 0.0% | | | | |
| | 559,124 | | | Dex Media, Inc.(d)(e) | | | 1,111,539 | |
| | | | | | | | |
| | | | Metals & Mining – 0.3% | | | | |
| | 6,559,672 | | | ArcelorMittal, (Registered)(e) | | | 39,620,419 | |
| | 324,383 | | | Cliffs Natural Resources, Inc.(e) | | | 1,897,640 | |
| | | | | | | | |
| | | | | | | 41,518,059 | |
| | | | | | | | |
| | | | Multi-Utilities – 0.0% | | | | |
| | 63,091 | | | CMS Energy Corp. | | | 2,650,453 | |
| | | | | | | | |
See accompanying notes to financial statements.
29 |
Portfolio of Investments – as of September 30, 2016
Loomis Sayles Bond Fund – continued
| | | | | | | | |
Shares | | | Description | | Value (†) | |
|
| | Common Stocks – continued | |
| | |
| | | | Oil, Gas & Consumable Fuels – 0.4% | | | | |
| | 1,033,462 | | | Chesapeake Energy Corp.(e) | | $ | 6,479,807 | |
| | 248,036 | | | Halcon Resources Corp.(e) | | | 2,326,577 | |
| | 868,395 | | | Repsol YPF S.A., Sponsored ADR | | | 11,853,592 | |
| | 231,675 | | | Rex Energy Corp.(e) | | | 135,275 | |
| | 758,315 | | | Royal Dutch Shell PLC, Sponsored ADR | | | 37,968,832 | |
| | 2,021 | | | Southcross Holdings Group LLC(d)(e) | | | — | |
| | 2,021 | | | Southcross Holdings LP, Class A(d)(e) | | | 727,560 | |
| | | | | | | | |
| | | | | | | 59,491,643 | |
| | | | | | | | |
| | | | Pharmaceuticals – 1.2% | | | | |
| | 3,414,069 | | | Bristol-Myers Squibb Co. | | | 184,086,600 | |
| | | | | | | | |
| | | | REITs – Diversified – 0.2% | | | | |
| | 226,669 | | | NexPoint Residential Trust, Inc. | | | 4,456,313 | |
| | 647,982 | | | Weyerhaeuser Co. | | | 20,696,545 | |
| | | | | | | | |
| | | | | | | 25,152,858 | |
| | | | | | | | |
| | | | Semiconductors & Semiconductor Equipment – 4.7% | | | | |
| | 18,520,348 | | | Intel Corp. | | | 699,143,137 | |
| | | | | | | | |
| | | | Trading Companies & Distributors – 0.1% | | | | |
| | 208,780 | | | United Rentals, Inc.(e) | | | 16,387,142 | |
| | | | | | | | |
| | |
| | | | Total Common Stocks (Identified Cost $995,697,565) | | | 1,371,918,349 | |
| | | | | | | | |
|
| | Preferred Stocks – 1.7% | |
|
| | Convertible Preferred Stocks – 1.5% | |
| | |
| | | | Banking – 0.3% | | | | |
| | 25,823 | | | Bank of America Corp., Series L, 7.250% | | | 31,525,751 | |
| | 12,483 | | | Wells Fargo & Co., Series L, Class A, 7.500% | | | 16,335,254 | |
| | | | | | | | |
| | | | | | | 47,861,005 | |
| | | | | | | | |
| | | | Communications – 0.0% | | | | |
| | 14,923 | | | Cincinnati Bell, Inc., 6.750% | | | 748,538 | |
| | | | | | | | |
| | | | Electric – 0.2% | | | | |
| | 430,351 | | | AES Trust III, 6.750% | | | 21,947,901 | |
| | | | | | | | |
| | | | Energy – 0.1% | | | | |
| | 325,710 | | | El Paso Energy Capital Trust I, 4.750% | | | 16,285,500 | |
| | | | | | | | |
| | | | Metals & Mining – 0.3% | | | | |
| | 1,182,307 | | | Alcoa, Inc., Series 1, 5.375% | | | 38,649,616 | |
| | | | | | | | |
| | | | Midstream – 0.4% | | | | |
| | 257,387 | | | Chesapeake Energy Corp., 4.500%(e) | | | 11,705,961 | |
| | 476,844 | | | Chesapeake Energy Corp., 5.000%(e) | | | 20,444,687 | |
See accompanying notes to financial statements.
| 30
Portfolio of Investments – as of September 30, 2016
Loomis Sayles Bond Fund – continued
| | | | | | | | |
Shares | | | Description | | Value (†) | |
|
| | Preferred Stocks – continued | |
| | |
| | | | Midstream – continued | | | | |
| | 39,322 | | | Chesapeake Energy Corp., 5.750%, 144A(e) | | $ | 20,791,507 | |
| | 3,044 | | | Chesapeake Energy Corp., 5.750%(e) | | | 1,609,515 | |
| | 16,454 | | | Chesapeake Energy Corp., Series A, 5.750%, 144A(e) | | | 8,566,364 | |
| | | | | | | | |
| | | | | | | 63,118,034 | |
| | | | | | | | |
| | | | REITs – Diversified – 0.0% | | | | |
| | 37,815 | | | Crown Castle International Corp., Series A, 4.500% | | | 4,273,851 | |
| | | | | | | | |
| | | | REITs – Health Care – 0.1% | | | | |
| | 172,150 | | | Welltower, Inc., 6.500% | | | 11,456,582 | |
| | | | | | | | |
| | | | REITs – Hotels – 0.0% | | | | |
| | 231,450 | | | FelCor Lodging Trust, Inc., Series A, 1.950% | | | 5,788,564 | |
| | | | | | | | |
| | | | REITs – Mortgage – 0.0% | | | | |
| | 58,431 | | | iStar, Inc., Series J, 4.500% | | | 2,859,029 | |
| | | | | | | | |
| | | | Technology – 0.1% | | | | |
| | 95,290 | | | Belden, Inc., 6.750% | | | 9,569,975 | |
| | | | | | | | |
| | |
| | | | Total Convertible Preferred Stocks
(Identified Cost $268,728,572) | | | 222,558,595 | |
| | | | | | | | |
|
| | Non-Convertible Preferred Stocks – 0.2% | |
| | |
| | | | Electric – 0.0% | | | | |
| | 2,925 | | | Connecticut Light & Power Co., 1.900% | | | 127,878 | |
| | 100 | | | Entergy Arkansas, Inc., 4.320% | | | 9,853 | |
| | 5,000 | | | Entergy Mississippi, Inc., 4.360% | | | 489,844 | |
| | 665 | | | Entergy New Orleans, Inc., 4.360% | | | 69,118 | |
| | 200 | | | Entergy New Orleans, Inc., 4.750% | | | 20,456 | |
| | 50,100 | | | Southern California Edison Co., 4.780% | | | 1,268,532 | |
| | | | | | | | |
| | | | | | | 1,985,681 | |
| | | | | | | | |
| | | | Finance Companies – 0.1% | | | | |
| | 67,611 | | | iStar, Inc., Series E, 7.875% | | | 1,644,976 | |
| | 64,123 | | | iStar, Inc., Series F, 7.800% | | | 1,565,242 | |
| | 16,004 | | | iStar, Inc., Series G, 7.650% | | | 385,056 | |
| | 149,767 | | | SLM Corp., Series A, 6.970% | | | 7,699,522 | |
| | | | | | | | |
| | | | | | | 11,294,796 | |
| | | | | | | | |
| | | | Home Construction – 0.0% | | | | |
| | 52,867 | | | Hovnanian Enterprises, Inc., 7.625%(e) | | | 243,188 | |
| | | | | | | | |
| | | | REITs – Office Property – 0.0% | | | | |
| | 2,318 | | | Highwoods Properties, Inc., Series A, 8.625% | | | 2,972,835 | |
| | | | | | | | |
See accompanying notes to financial statements.
31 |
Portfolio of Investments – as of September 30, 2016
Loomis Sayles Bond Fund – continued
| | | | | | | | |
Shares | | | Description | | Value (†) | |
|
| | Preferred Stocks – continued | |
| | |
| | | | REITs – Warehouse/Industrials – 0.1% | | | | |
| | 169,007 | | | ProLogis, Inc., Series Q, 8.540% | | $ | 10,964,329 | |
| | | | | | | | |
| | | | Total Non-Convertible Preferred Stocks
(Identified Cost $21,386,932) | | | 27,460,829 | |
| | | | | | | | |
| | |
| | | | Total Preferred Stocks
(Identified Cost $290,115,504) | | | 250,019,424 | |
| | | | | | | | |
|
| | Closed-End Investment Companies – 0.0% | |
| | 170,002 | | | NexPoint Credit Strategies Fund
(Identified Cost $9,807,937) | | | 3,779,144 | |
| | | | | | | | |
|
| | Warrants – 0.0% | |
| | 67,377 | | | Halcon Resources Corp., Expiration on 9/9/2020 at $14.04(d)(e)
(Identified Cost $0) | | | 102,811 | |
| | | | | | | | |
| | |
| Principal
Amount (‡) |
| | | | | | |
| |
| | Short-Term Investments – 4.0% | | | | |
| $ | 57,455 | | | Repurchase Agreement with State Street Bank and Trust Company, dated 9/30/2016 at 0.000% to be repurchased at $57,455 on 10/03/2016 collateralized by $57,800 U.S. Treasury Note, 1.500% due 8/31/2018 valued at $58,653 including accrued interest (Note 2 of Notes to Financial Statements) | | | 57,455 | |
| | 598,750,054 | | | Tri-Party Repurchase Agreement with Fixed Income Clearing Corporation, dated 9/30/2016 at 0.030% to be repurchased at $598,751,551 on 10/03/2016 collateralized by $3,195,000 U.S. Treasury Note, 1.500% due 3/31/2023 valued at $3,230,944; $100,000,000 U.S. Treasury Note, 1.625% due 5/31/2023 valued at $102,274,000; $425,000,000 U.S. Treasury Note, 1.750% due 5/15/2023 valued at $438,812,500; $58,205,000 U.S. Treasury Note, 2.500% due 8/15/2023 valued at $62,788,644; $3,285,000 U.S. Treasury Note, 3.500% due 5/15/2020 valued at $3,621,713 including accrued interest (Note 2 of Notes to Financial Statements) | | | 598,750,054 | |
| | | | | | | | |
| | | | Total Short-Term Investments
(Identified Cost $598,807,509) | | | 598,807,509 | |
| | | | | | | | |
| | |
| | | | Total Investments – 100.8%
(Identified Cost $14,996,010,872)(a) | | | 14,953,701,217 | |
| | | | Other assets less liabilities—(0.8)% | | | (113,040,712 | ) |
| | | | | | | | |
| | | | Net Assets – 100.0% | | $ | 14,840,660,505 | |
| | | | | | | | |
| | |
| | (‡) | | | Principal Amount stated in U.S. dollars unless otherwise noted. | | | | |
| | (†) | | | See Note 2 of Notes to Financial Statements. | | | | |
| | (††) | | | Amount shown represents units. One unit represents a principal amount of 25. | |
See accompanying notes to financial statements.
| 32
Portfolio of Investments – as of September 30, 2016
Loomis Sayles Bond Fund – continued
| | | | | | | | |
| | (†††) | | | Amount shown represents units. One unit represents a principal amount of 100. | |
| | (a) | | | Federal Tax Information: | | | | |
| | | | At September 30, 2016, the net unrealized depreciation on investments based on a cost of $15,261,082,901 for federal income tax purposes was as follows: | |
| | | | Aggregate gross unrealized appreciation for all investments in which there is an excess of value over tax cost | | $ | 1,404,008,206 | |
| | | | Aggregate gross unrealized depreciation for all investments in which there is an excess of tax cost over value | | | (1,711,389,890 | ) |
| | | | | | | | |
| | | | Net unrealized depreciation | | $ | (307,381,684 | ) |
| | | | | | | | |
| | (b) | | | Illiquid security. (Unaudited) | | | | |
| | (c) | | | Securities classified as fair valued pursuant to the Fund’s pricing policies and procedures. At September 30, 2016, the value of these securities amounted to $349,009,806 or 2.4% of net assets. See Note 2 of Notes to Financial Statements. | |
| | (d) | | | Fair valued by the Fund’s adviser. At September 30, 2016, the value of these securities amounted to $53,629,656 or 0.4% of net assets. See Note 2 of Notes to Financial Statements. | |
| | (e) | | | Non-income producing security. | | | | |
| | (f) | | | Perpetual bond with no specified maturity date. | | | | |
| | (g) | | | Variable rate security. Rate as of September 30, 2016 is disclosed. | | | | |
| | (h) | | | Coupon rate is a fixed rate for an initial period then resets at a specified date and rate. | |
| | (i) | | | The issuer is in default with respect to interest and/or principal payments. Income is not being accrued. | |
| | (j) | | | Payment-in-kind security for which the issuer has the option at each interest payment date of making interest payments in cash or additional debt securities. | |
| | (k) | | | Maturity has been extended under the terms of a plan of reorganization. | | | | |
| |
| | 144A | | | All or a portion of these securities are exempt from registration under Rule 144A of the Securities Act of 1933. These securities may be resold in transactions exempt from registration, normally to qualified institutional buyers. At September 30, 2016, the value of Rule 144A holdings amounted to $2,242,370,975 or 15.1% of net assets. | |
| | ABS | | | Asset-Backed Securities | | | | |
| | ADR | | | An American Depositary Receipt is a certificate issued by a custodian bank representing the right to receive securities of the foreign issuer described. The values of ADRs may be significantly influenced by trading on exchanges not located in the United States. | |
| | EMTN | | | Euro Medium Term Note | | | | |
| | FHLMC | | | Federal Home Loan Mortgage Corp. | | | | |
| | GMTN | | | Global Medium Term Note | | | | |
| | GO | | | General Obligation | | | | |
| | MTN | | | Medium Term Note | | | | |
| | PIK | | | Payment-in-Kind | | | | |
| | REITs | | | Real Estate Investment Trusts | | | | |
| | |
| | AUD | | | Australian Dollar | | | | |
| | BRL | | | Brazilian Real | | | | |
| | CAD | | | Canadian Dollar | | | | |
| | EUR | | | Euro | | | | |
| | GBP | | | British Pound | | | | |
| | ISK | | | Icelandic Krona | | | | |
| | MXN | | | Mexican Peso | | | | |
| | NOK | | | Norwegian Krone | | | | |
| | NZD | | | New Zealand Dollar | | | | |
See accompanying notes to financial statements.
33 |
Portfolio of Investments – as of September 30, 2016
Loomis Sayles Bond Fund – continued
Industry Summary at September 30, 2016
| | | | |
Treasuries | | | 26.8 | % |
Banking | | | 7.5 | |
Technology | | | 6.4 | |
Wirelines | | | 5.7 | |
Semiconductors & Semiconductor Equipment | | | 4.7 | |
Finance Companies | | | 4.5 | |
Chemicals | | | 3.1 | |
Metals & Mining | | | 2.9 | |
Life Insurance | | | 2.0 | |
Other Investments, less than 2% each | | | 33.2 | |
Short-Term Investments | | | 4.0 | |
| | | | |
Total Investments | | | 100.8 | |
Other assets less liabilities | | | (0.8 | ) |
| | | | |
Net Assets | | | 100.0 | % |
| | | | |
Currency Exposure Summary at September 30, 2016
| | | | |
United States Dollar | | | 72.9 | % |
Canadian Dollar | | | 9.3 | |
New Zealand Dollar | | | 5.0 | |
Mexican Peso | | | 4.6 | |
Australian Dollar | | | 3.4 | |
Norwegian Krone | | | 2.8 | |
Other, less than 2% each | | | 2.8 | |
| | | | |
Total Investments | | | 100.8 | |
Other assets less liabilities | | | (0.8 | ) |
| | | | |
Net Assets | | | 100.0 | % |
| | | | |
See accompanying notes to financial statements.
| 34
Statement of Assets and Liabilities
September 30, 2016
| | | | |
ASSETS | | | | |
Investments at cost | | $ | 14,996,010,872 | |
Net unrealized depreciation | | | (42,309,655 | ) |
| | | | |
Investments at value | | | 14,953,701,217 | |
Cash | | | 26,254,117 | |
Foreign currency at value
(identified cost $2,697,579) | | | 2,709,060 | |
Receivable for Fund shares sold | | | 16,712,682 | |
Receivable for securities sold | | | 10,212,773 | |
Dividends and interest receivable | | | 168,261,916 | |
Tax reclaims receivable | | | 96,383 | |
Prepaid expenses (Note 7) | | | 66,969 | |
| | | | |
TOTAL ASSETS | | | 15,178,015,117 | |
| | | | |
LIABILITIES | | | | |
Payable for securities purchased | | | 302,784,325 | |
Payable for Fund shares redeemed | | | 25,468,916 | |
Management fees payable (Note 5) | | | 6,470,760 | |
Deferred Trustees’ fees (Note 5) | | | 1,413,395 | |
Administrative fees payable (Note 5) | | | 543,913 | |
Payable to distributor (Note 5d) | | | 128,669 | |
Other accounts payable and accrued expenses | | | 544,634 | |
| | | | |
TOTAL LIABILITIES | | | 337,354,612 | |
| | | | |
NET ASSETS | | $ | 14,840,660,505 | |
| | | | |
NET ASSETS CONSIST OF: | | | | |
Paid-in capital | | $ | 14,976,246,948 | |
Distributions in excess of net investment income | | | (133,808,338 | ) |
Accumulated net realized gain on investments and foreign currency transactions | | | 40,775,358 | |
Net unrealized depreciation on investments and foreign currency translations | | | (42,553,463 | ) |
| | | | |
NET ASSETS | | $ | 14,840,660,505 | |
| | | | |
| |
COMPUTATION OF NET ASSET VALUE AND OFFERING PRICE: | | | | |
Institutional Class: | | | | |
Net assets | | $ | 10,045,426,848 | |
| | | | |
Shares of beneficial interest | | | 715,529,831 | |
| | | | |
Net asset value, offering and redemption price per share | | $ | 14.04 | |
| | | | |
Retail Class: | | | | |
Net assets | | $ | 4,495,996,755 | |
| | | | |
Shares of beneficial interest | | | 321,828,595 | |
| | | | |
Net asset value, offering and redemption price per share | | $ | 13.97 | |
| | | | |
Admin Class shares: | | | | |
Net assets | | $ | 185,902,070 | |
| | | | |
Shares of beneficial interest | | | 13,355,544 | |
| | | | |
Net asset value, offering and redemption price per share | | $ | 13.92 | |
| | | | |
Class N shares: | | | | |
Net assets | | $ | 113,334,832 | |
| | | | |
Shares of beneficial interest | | | 8,081,605 | |
| | | | |
Net asset value, offering and redemption price per share | | $ | 14.02 | |
| | | | |
See accompanying notes to financial statements.
35 |
Statement of Operations
For the Year Ended September 30, 2016
| | | | |
INVESTMENT INCOME | | | | |
Interest | | $ | 734,750,531 | |
Dividends | | | 64,300,905 | |
Less net foreign taxes withheld | | | (875,588 | ) |
| | | | |
| | | 798,175,848 | |
| | | | |
Expenses | | | | |
Management fees (Note 5) | | | 84,783,102 | |
Service and distribution fees (Note 5) | | | 13,854,414 | |
Administrative fees (Note 5) | | | 7,217,873 | |
Trustees’ fees and expenses (Note 5) | | | 418,033 | |
Transfer agent fees and expenses (Notes 5 and 6) | | | 12,558,694 | |
Audit and tax services fees | | | 64,391 | |
Custodian fees and expenses | | | 950,872 | |
Legal fees | | | 272,747 | |
Registration fees | | | 245,265 | |
Shareholder reporting expenses | | | 679,498 | |
Miscellaneous expenses (Note 7) | | | 473,087 | |
| | | | |
Total expenses | | | 121,517,976 | |
Less waiver and/or expense reimbursement (Note 5) | | | (896 | ) |
| | | | |
Net expenses | | | 121,517,080 | |
| | | | |
Net investment income | | | 676,658,768 | |
| | | | |
| |
NET REALIZED AND UNREALIZED GAIN (LOSS) ON INVESTMENTS AND FOREIGN CURRENCY TRANSACTIONS | | | | |
Net realized gain (loss) on: | | | | |
Investments | | | (288,703,491 | ) |
Foreign currency transactions | | | 1,196,997 | |
Net change in unrealized appreciation (depreciation) on: | | | | |
Investments | | | 914,032,411 | |
Foreign currency translations | | | 1,931,776 | |
| | | | |
Net realized and unrealized gain on investments and foreign currency transactions | | | 628,457,693 | |
| | | | |
| |
NET INCREASE IN NET ASSETS RESULTING FROM OPERATIONS | | $ | 1,305,116,461 | |
| | | | |
See accompanying notes to financial statements.
| 36
Statement of Changes in Net Assets
| | | | | | | | |
| | | Year Ended
September 30, 2016 | | | Year Ended
September 30, 2015 | |
FROM OPERATIONS: | | | | | | | | |
Net investment income | | $ | 676,658,768 | | | $ | 956,689,736 | |
Net realized gain (loss) on investments and foreign currency transactions | | | (287,506,494 | ) | | | 481,989,097 | |
Net change in unrealized appreciation (depreciation) on investments and foreign currency translations | | | 915,964,187 | | | | (2,911,372,919 | ) |
| | | | | | | | |
Net increase (decrease) in net assets resulting from operations | | | 1,305,116,461 | | | | (1,472,694,086 | ) |
| | | | | | | | |
FROM DISTRIBUTIONS TO SHAREHOLDERS: | | | | | | | | |
Net investment income | | | | | | | | |
Institutional Class | | | (245,533,574 | ) | | | (512,255,001 | ) |
Retail Class | | | (102,678,061 | ) | | | (252,624,470 | ) |
Admin Class | | | (3,770,457 | ) | | | (8,089,242 | ) |
Class N | | | (2,134,874 | ) | | | (1,912,703 | ) |
Net realized capital gains | | | | | | | | |
Institutional Class | | | (431,902,062 | ) | | | (410,991,876 | ) |
Retail Class | | | (204,088,780 | ) | | | (225,446,461 | ) |
Admin Class | | | (8,388,507 | ) | | | (7,713,407 | ) |
Class N | | | (3,281,035 | ) | | | (1,037,226 | ) |
| | | | | | | | |
Total distributions | | | (1,001,777,350 | ) | | | (1,420,070,386 | ) |
| | | | | | | | |
NET DECREASE IN NET ASSETS FROM CAPITAL SHARE TRANSACTIONS (NOTE 9) | | | (5,022,677,532 | ) | | | (1,987,306,136 | ) |
| | | | | | | | |
Net decrease in net assets | | | (4,719,338,421 | ) | | | (4,880,070,608 | ) |
NET ASSETS | | | | | | | | |
Beginning of the year | | | 19,559,998,926 | | | | 24,440,069,534 | |
| | | | | | | | |
End of the year | | $ | 14,840,660,505 | | | $ | 19,559,998,926 | |
| | | | | | | | |
DISTRIBUTIONS IN EXCESS OF NET INVESTMENT INCOME | | $ | (133,808,338 | ) | | $ | (29,208,524 | ) |
| | | | | | | | |
See accompanying notes to financial statements.
37 |
Financial Highlights
For a share outstanding throughout each period.
| | | | | | | | | | | | | | | | | | | | | | | | |
| | | Institutional Class | |
| | | Year Ended
September 30,
2016 | | | Year Ended
September 30,
2015 | | | Year Ended
September 30,
2014 | | | Year Ended
September 30,
2013 | | | Year Ended
September 30,
2012 | | | | |
Net asset value, beginning of the period | | $ | 13.65 | | | $ | 15.49 | | | $ | 15.09 | | | $ | 14.99 | | | $ | 13.88 | | | | | |
| | | | |
INCOME (LOSS) FROM INVESTMENT OPERATIONS: | | | | | | | | | | | | | | | | | | | | | | | | |
Net investment income(a) | | | 0.56 | | | | 0.61 | | | | 0.60 | | | | 0.69 | | | | 0.72 | | | | | |
Net realized and unrealized gain (loss) | | | 0.62 | | | | (1.55 | ) | | | 0.54 | | | | 0.27 | | | | 1.24 | | | | | |
| | | | |
Total from Investment Operations | | | 1.18 | | | | (0.94 | ) | | | 1.14 | | | | 0.96 | | | | 1.96 | | | | | |
| | | | |
LESS DISTRIBUTIONS FROM: | | | | | | | | | | | | | | | | | | | | | | | | |
Net investment income | | | (0.29 | ) | | | (0.50 | ) | | | (0.67 | ) | | | (0.86 | ) | | | (0.85 | ) | | | | |
Net realized capital gains | | | (0.50 | ) | | | (0.40 | ) | | | (0.07 | ) | | | — | | | | — | | | | | |
| | | | |
Total Distributions | | | (0.79 | ) | | | (0.90 | ) | | | (0.74 | ) | | | (0.86 | ) | | | (0.85 | ) | | | | |
| | | | |
Net asset value, end of the period | | $ | 14.04 | | | $ | 13.65 | | | $ | 15.49 | | | $ | 15.09 | | | $ | 14.99 | | | | | |
| | | | |
Total return | | | 9.17 | % | | | (6.37 | )% | | | 7.66 | % | | | 6.51 | % | | | 14.52 | % | | | | |
RATIOS TO AVERAGE NET ASSETS: | | | | | | | | | | | | | | | | | | | | | | | | |
Net assets, end of the period (000’s) | | $ | 10,045,427 | | | $ | 12,966,991 | | | $ | 15,488,726 | | | $ | 12,997,813 | | | $ | 12,971,639 | | | | | |
Net expenses | | | 0.66 | % | | | 0.64 | % | | | 0.63 | % | | | 0.63 | % | | | 0.63 | % | | | | |
Gross expenses | | | 0.66 | % | | | 0.64 | % | | | 0.63 | % | | | 0.63 | % | | | 0.63 | % | | | | |
Net investment income | | | 4.21 | % | | | 4.17 | % | | | 3.85 | % | | | 4.57 | % | | | 4.99 | % | | | | |
Portfolio turnover rate | | | 13 | % | | | 22 | % | | | 26 | % | | | 28 | % | | | 20 | % | | | | |
| (a) | Per share net investment income has been calculated using the average shares outstanding during the period. |
See accompanying notes to financial statements.
| 38
Financial Highlights – continued
For a share outstanding throughout each period.
| | | | | | | | | | | | | | | | | | | | | | | | |
| | | Retail Class | |
| | | Year Ended
September 30,
2016 | | | Year Ended
September 30,
2015 | | | Year Ended
September 30,
2014 | | | Year Ended
September 30,
2013 | | | Year Ended
September 30,
2012 | | | | |
Net asset value, beginning of the period | | $ | 13.59 | | | $ | 15.43 | | | $ | 15.02 | | | $ | 14.93 | | | $ | 13.83 | | | | | |
| | | | |
INCOME (LOSS) FROM INVESTMENT OPERATIONS: | | | | | | | | | | | | | | | | | | | | | | | | |
Net investment income(a) | | | 0.53 | | | | 0.57 | | | | 0.55 | | | | 0.65 | | | | 0.68 | | | | | |
Net realized and unrealized gain (loss) | | | 0.61 | | | | (1.55 | ) | | | 0.56 | | | | 0.25 | | | | 1.23 | | | | | |
| | | | |
Total from Investment Operations | | | 1.14 | | | | (0.98 | ) | | | 1.11 | | | | 0.90 | | | | 1.91 | | | | | |
| | | | |
LESS DISTRIBUTIONS FROM: | | | | | | | | | | | | | | | | | | | | | | | | |
Net investment income | | | (0.26 | ) | | | (0.46 | ) | | | (0.63 | ) | | | (0.81 | ) | | | (0.81 | ) | | | | |
Net realized capital gains | | | (0.50 | ) | | | (0.40 | ) | | | (0.07 | ) | | | — | | | | — | | | | | |
| | | | |
Total Distributions | | | (0.76 | ) | | | (0.86 | ) | | | (0.70 | ) | | | (0.81 | ) | | | (0.81 | ) | | | | |
| | | | |
Net asset value, end of the period | | $ | 13.97 | | | $ | 13.59 | | | $ | 15.43 | | | $ | 15.02 | | | $ | 14.93 | | | | | |
| | | | |
Total return | | | 8.86 | % | | | (6.58 | )% | | | 7.40 | % | | | 6.15 | % | | | 14.25 | % | | | | |
RATIOS TO AVERAGE NET ASSETS: | | | | | | | | | | | | | | | | | | | | | | | | |
Net assets, end of the period (000’s) | | $ | 4,495,997 | | | $ | 6,268,878 | | | $ | 8,627,288 | | | $ | 8,282,010 | | | $ | 8,651,794 | | | | | |
Net expenses | | | 0.91 | % | | | 0.89 | % | | | 0.91 | % | | | 0.92 | % | | | 0.92 | % | | | | |
Gross expenses | | | 0.91 | % | | | 0.89 | % | | | 0.91 | % | | | 0.92 | % | | | 0.92 | % | | | | |
Net investment income | | | 3.97 | % | | | 3.91 | % | | | 3.58 | % | | | 4.28 | % | | | 4.69 | % | | | | |
Portfolio turnover rate | | | 13 | % | | | 22 | % | | | 26 | % | | | 28 | % | | | 20 | % | | | | |
| (a) | Per share net investment income has been calculated using the average shares outstanding during the period. |
See accompanying notes to financial statements.
39 |
Financial Highlights – continued
For a share outstanding throughout each period.
| | | | | | | | | | | | | | | | | | | | | | | | |
| | | Admin Class | |
| | | Year Ended
September 30,
2016 | | | Year Ended
September 30,
2015 | | | Year Ended
September 30,
2014 | | | Year Ended
September 30,
2013 | | | Year Ended
September 30,
2012 | | | | |
Net asset value, beginning of the period | | $ | 13.54 | | | $ | 15.38 | | | $ | 14.98 | | | $ | 14.89 | | | $ | 13.80 | | | | | |
| | | | |
INCOME (LOSS) FROM INVESTMENT OPERATIONS: | | | | | | | | | | | | | | | | | | | | | | | | |
Net investment income(a) | | | 0.49 | | | | 0.53 | | | | 0.51 | | | | 0.61 | | | | 0.63 | | | | | |
Net realized and unrealized gain (loss) | | | 0.62 | | | | (1.55 | ) | | | 0.55 | | | | 0.25 | | | | 1.23 | | | | | |
| | | | |
Total from Investment Operations | | | 1.11 | | | | (1.02 | ) | | | 1.06 | | | | 0.86 | | | | 1.86 | | | | | |
| | | | |
LESS DISTRIBUTIONS FROM: | | | | | | | | | | | | | | | | | | | | | | | | |
Net investment income | | | (0.23 | ) | | | (0.42 | ) | | | (0.59 | ) | | | (0.77 | ) | | | (0.77 | ) | | | | |
Net realized capital gains | | | (0.50 | ) | | | (0.40 | ) | | | (0.07 | ) | | | — | | | | — | | | | | |
| | | | |
Total Distributions | | | (0.73 | ) | | | (0.82 | ) | | | (0.66 | ) | | | (0.77 | ) | | | (0.77 | ) | | | | |
| | | | |
Net asset value, end of the period | | $ | 13.92 | | | $ | 13.54 | | | $ | 15.38 | | | $ | 14.98 | | | $ | 14.89 | | | | | |
| | | | |
Total return | | | 8.64 | % | | | (6.89 | )% | | | 7.15 | % | | | 5.88 | % | | | 13.91 | % | | | | |
RATIOS TO AVERAGE NET ASSETS: | | | | | | | | | | | | | | | | | | | | | | | | |
Net assets, end of the period (000’s) | | $ | 185,902 | | | $ | 239,088 | | | $ | 292,668 | | | $ | 272,181 | | | $ | 302,018 | | | | | |
Net expenses | | | 1.16 | % | | | 1.14 | % | | | 1.17 | % | | | 1.18 | % | | | 1.20 | % | | | | |
Gross expenses | | | 1.16 | % | | | 1.14 | % | | | 1.17 | % | | | 1.18 | % | | | 1.20 | % | | | | |
Net investment income | | | 3.72 | % | | | 3.67 | % | | | 3.32 | % | | | 4.02 | % | | | 4.42 | % | | | | |
Portfolio turnover rate | | | 13 | % | | | 22 | % | | | 26 | % | | | 28 | % | | | 20 | % | | | | |
| (a) | Per share net investment income has been calculated using the average shares outstanding during the period. |
See accompanying notes to financial statements.
| 40
Financial Highlights – continued
For a share outstanding throughout each period.
| | | | | | | | | | | | | | | | | | | | |
| | | Class N | |
| | | Year Ended
September 30,
2016 | | | Year Ended
September 30,
2015 | | | Year Ended
September 30,
2014 | | | Period Ended
September 30,
2013* | | | | |
Net asset value, beginning of the period | | $ | 13.64 | | | $ | 15.48 | | | $ | 15.07 | | | $ | 15.33 | | | | | |
| | | | |
INCOME (LOSS) FROM INVESTMENT OPERATIONS: | | | | | | | | | | | | | | | | | | | | |
Net investment income(a) | | | 0.57 | | | | 0.63 | | | | 0.59 | | | | 0.47 | | | | | |
Net realized and unrealized gain (loss) | | | 0.61 | | | | (1.56 | ) | | | 0.57 | | | | (0.25 | ) | | | | |
| | | | |
Total from Investment Operations | | | 1.18 | | | | (0.93 | ) | | | 1.16 | | | | 0.22 | | | | | |
| | | | |
LESS DISTRIBUTIONS FROM: | | | | | | | | | | | | | | | | | | | | |
Net investment income | | | (0.30 | ) | | | (0.51 | ) | | | (0.68 | ) | | | (0.48 | ) | | | | |
Net realized capital gains | | | (0.50 | ) | | | (0.40 | ) | | | (0.07 | ) | | | — | | | | | |
| | | | |
Total Distributions | | | (0.80 | ) | | | (0.91 | ) | | | (0.75 | ) | | | (0.48 | ) | | | | |
| | | | |
Net asset value, end of the period | | $ | 14.02 | | | $ | 13.64 | | | $ | 15.48 | | | $ | 15.07 | | | | | |
| | | | |
Total return | | | 9.18 | % | | | (6.31 | )% | | | 7.79 | % | | | 1.45 | %(b)(c) | | | | |
RATIOS TO AVERAGE NET ASSETS: | | | | | | | | | | | | | | | | | | | | |
Net assets, end of the period (000’s) | | $ | 113,335 | | | $ | 85,042 | | | $ | 31,387 | | | $ | 241 | | | | | |
Net expenses | | | 0.58 | % | | | 0.57 | % | | | 0.58 | %(d) | | | 0.65 | %(e)(f) | | | | |
Gross expenses | | | 0.58 | % | | | 0.57 | % | | | 0.58 | %(d) | | | 2.14 | %(e) | | | | |
Net investment income | | | 4.28 | % | | | 4.33 | % | | | 3.80 | % | | | 4.73 | %(e) | | | | |
Portfolio turnover rate | | | 13 | % | | | 22 | % | | | 26 | % | | | 28 | % | | | | |
| * | From commencement of Class operations on February 1, 2013 through September 30, 2013. |
| (a) | Per share net investment income has been calculated using the average shares outstanding during the period. |
| (b) | Periods less than one year are not annualized. |
| (c) | Had certain expenses not been waived/reimbursed during the period, total returns would have been lower. |
| (d) | Includes fee/expense recovery of 0.01%. |
| (e) | Computed on an annualized basis for periods less than one year. |
| (f) | The investment adviser agreed to waive its fees and/or reimburse a portion of the Fund’s expenses during the period. Without this waiver/reimbursement, expenses would have been higher. |
See accompanying notes to financial statements.
41 |
Notes to Financial Statements
September 30, 2016
1. Organization. Loomis Sayles Funds I (the “Trust”) is organized as a Massachusetts business trust. The Trust is registered under the Investment Company Act of 1940, as amended (the “1940 Act”) as an open-end management investment company. The Declaration of Trust permits the Board of Trustees to authorize the issuance of an unlimited number of shares of the Trust in multiple series. The financial statements for certain funds of the Trust are presented in separate reports. Information presented in these financial statements pertains to Loomis Sayles Bond Fund (the “Fund”).
The Fund is a diversified investment company.
The Fund offers Institutional Class, Retail Class, Admin Class and Class N shares.
Each share class is sold without a sales charge. Retail Class and Admin Class shares pay a Rule 12b-1 fee. Admin Class shares are primarily intended for employer-sponsored retirement plans and are offered exclusively through intermediaries. Class N shares do not pay a front-end sales charge, a CDSC or Rule 12b-1 fees. Class N shares are offered with no initial minimum investment to certain retirement plans held in an omnibus fashion and fund of funds that are distributed by NGAM Distribution, L.P. (“NGAM Distribution”) and with an initial minimum investment of $1,000,000 to other categories of investors. Institutional Class shares are intended for institutional investors with a minimum initial investment of $100,000, though some categories of investors are exempted from the minimum investment amount as outlined in the Fund’s prospectus.
Most expenses can be directly attributed to a Fund. Expenses which cannot be directly attributed to a Fund are generally apportioned based on the relative net assets of each of the funds in Natixis Funds Trust I, Natixis Funds Trust II, Natixis Funds Trust IV, Gateway Trust (“Natixis Funds Trusts”), Loomis Sayles Funds I and Loomis Sayles Funds II (“Loomis Sayles Funds Trusts”). Expenses of the Fund are borne pro rata by the holders of each class of shares, except that each class bears expenses unique to that class (such as the Rule 12b-1 fees applicable to Retail Class and Admin Class), and transfer agent fees are borne collectively for Institutional Class, Retail Class, and Admin Class and individually for Class N. In addition, each class votes as a class only with respect to its own Rule 12b-1 Plan. Shares of each class would receive their pro rata share of the net assets of the Fund if the Fund were liquidated. The Trustees approve separate distributions from net investment income on each class of shares.
2. Significant Accounting Policies. The following is a summary of significant accounting policies consistently followed by the Fund in the preparation of its financial statements. The Fund’s financial statements follow the accounting and reporting guidelines provided for investment companies and are prepared in accordance with accounting principles generally accepted in the United States of America which require the use of management estimates that affect the reported amounts and disclosures in the financial statements. Actual results could differ from those estimates. Management has evaluated the events and transactions subsequent to year-end through the date the financial statements were issued and has determined that there were no material events that would require disclosure in the Fund’s financial statements.
| 42
Notes to Financial Statements – continued
September 30, 2016
a. Valuation. Fund securities and other investments are valued at market value based on market quotations obtained or determined by independent pricing services recommended by the adviser and approved by the Board of Trustees. Fund securities and other investments for which market quotations are not readily available are valued at fair value as determined in good faith by the adviser pursuant to procedures approved by the Board of Trustees, as described below. Market value is determined as follows:
Debt securities and unlisted preferred equity securities are valued based on evaluated bids furnished to the Fund by an independent pricing service or bid prices obtained from broker-dealers. Senior loans are valued at bid prices supplied by an independent pricing service, if available. Listed equity securities (including shares of closed-end investment companies and exchange-traded funds) are valued at the last sale price quoted on the exchange where they are traded most extensively or, if there is no reported sale during the day, the closing bid quotation as reported by an independent pricing service. Securities traded on the NASDAQ Global Select Market, NASDAQ Global Market and NASDAQ Capital Market are valued at the NASDAQ Official Closing Price (“NOCP”), or if lacking an NOCP, at the most recent bid quotations on the applicable NASDAQ Market. Unlisted equity securities (except unlisted preferred equity securities) are valued at the last sale price quoted in the market where they are traded most extensively or, if there is no reported sale during the day, the closing bid quotation as reported by an independent pricing service. If there is no last sale price or closing bid quotation available, unlisted equity securities will be valued using evaluated bids furnished by an independent pricing service, if available. In some foreign markets, an official close price and a last sale price may be available from the foreign exchange or market. In those cases, the official close price is used. Broker-dealer bid prices may be used to value debt and unlisted equity securities and senior loans where an independent pricing service is unable to price a security or where an independent pricing service does not provide a reliable price for the security.
Fund securities and other investments for which market quotations are not readily available are valued at fair value as determined in good faith by the adviser pursuant to procedures approved by the Board of Trustees. The Fund may also value securities and other investments at fair value in other circumstances such as when extraordinary events occur after the close of a foreign market but prior to the close of the New York Stock Exchange (“NYSE”). This may include situations relating to a single issuer (such as a declaration of bankruptcy or a delisting of the issuer’s security from the primary market on which it has traded) as well as events affecting the securities markets in general (such as market disruptions or closings and significant fluctuations in U.S. and/or foreign markets). When fair valuing its securities or other investments, the Fund may, among other things, use modeling tools or other processes that may take into account factors such as securities or other market activity and/or significant events that occur after the close of the foreign market and before the time the Fund’s net asset value (“NAV”) is calculated. Fair value pricing may require subjective determinations about the value of a security, and fair values used to determine a Fund’s NAV may differ from quoted or published prices, or from
43 |
Notes to Financial Statements – continued
September 30, 2016
prices that are used by others, for the same securities. In addition, the use of fair value pricing may not always result in adjustments to the prices of securities held by the Fund.
Illiquid securities for which market quotations are readily available and have been evaluated by the adviser are considered and classified as fair valued securities.
As of September 30, 2016, securities held by the Fund were fair valued as follows:
| | | | | | |
Securities
classified as
fair valued | | Percentage of
Net Assets | | Securities fair
valued by the
Fund’s adviser | | Percentage of
Net Assets |
| $349,009,806 | | 2.4% | | $53,629,656 | | 0.4% |
b. Investment Transactions and Related Investment Income. Investment transactions are accounted for on a trade date plus one day basis for daily NAV calculation. However, for financial reporting purposes, investment transactions are reported on trade date. Dividend income is recorded on ex-dividend date, or in the case of certain foreign securities, as soon as the Fund is notified, and interest income is recorded on an accrual basis. Interest income is increased by the accretion of discount and decreased by the amortization of premium, if applicable. Distributions received from investments in securities that represent a return of capital or capital gain are recorded as a reduction of cost of investments or as a realized gain, respectively. In determining net gain or loss on securities sold, the cost of securities has been determined on an identified cost basis. Investment income, non-class specific expenses and realized and unrealized gains and losses are allocated on a pro rata basis to each class based on the relative net assets of each class to the total net assets of the Fund.
c. Foreign Currency Translation. The books and records of the Fund are maintained in U.S. dollars. The values of securities, currencies and other assets and liabilities denominated in currencies other than U.S. dollars are translated into U.S. dollars based upon foreign exchange rates prevailing at the end of the period. Purchases and sales of investment securities, income and expenses are translated into U.S. dollars on the respective dates of such transactions.
Net realized foreign exchange gains or losses arise from sales of foreign currency, changes in exchange rates between the trade and settlement dates on securities transactions and the difference between the amounts of dividends, interest and foreign withholding taxes recorded on the Fund’s books and the U.S. dollar equivalent of the amounts actually received or paid. Net unrealized foreign exchange gains or losses arise from changes in the value of assets and liabilities, other than investment securities, as of the end of the fiscal period, resulting from changes in exchange rates. Net realized foreign exchange gains or losses and the net change in unrealized foreign exchange gains or losses are disclosed in the Statement of Operations. For federal income tax purposes, net realized foreign exchange gains or losses are characterized as ordinary income and may, if the Fund has net losses, reduce the amount of income available to be distributed by the Fund.
| 44
Notes to Financial Statements – continued
September 30, 2016
The values of investment securities are presented at the foreign exchange rates prevailing at the end of the period for financial reporting purposes. Net realized and unrealized gains or losses on investments reported in the Statement of Operations reflect gains or losses resulting from changes in exchange rates and fluctuations which arise due to changes in market prices of investment securities. For federal income tax purposes, a portion of the net realized gain or loss on investments arising from changes in exchange rates, which is reflected in the Statement of Operations, may be characterized as ordinary income and may, if the Fund has net losses, reduce the amount of income available to be distributed by the Fund.
For the year ended September 30, 2016, the amount of income available to be distributed by the Fund has been reduced by $498,037,452 as a result of losses arising from changes in exchange rates.
The Fund may use foreign currency exchange contracts to facilitate transactions in foreign-denominated investments. Losses may arise from changes in the value of the foreign currency or if the counterparties do not perform under the contracts’ terms.
d. When-Issued and Delayed Delivery Transactions. The Fund may enter into when-issued or delayed delivery transactions. When-issued refers to transactions made conditionally because a security, although authorized, has not been issued. Delayed delivery refers to transactions for which delivery or payment will occur at a later date, beyond the normal settlement period. The price of when-issued and delayed delivery securities and the date when the securities will be delivered and paid for are fixed at the time the transaction is negotiated. The security and the obligation to pay for it are recorded by the Fund at the time the commitment is entered into. The value of the security may vary with market fluctuations during the time before the Fund takes delivery of the security. No interest accrues to the Fund until the transaction settles.
Delayed delivery transactions include those designated as To Be Announced (“TBAs”) in the Portfolios of Investments. For TBAs, the actual security that will be delivered to fulfill the transaction is not designated at the time of the trade. The security is “to be announced” 48 hours prior to the established trade settlement date. Certain transactions require the Fund or counterparty to post cash and/or securities as collateral for the net mark-to-market exposure to the other party. The Fund covers its net obligations under outstanding delayed delivery commitments by segregating or earmarking cash or securities at the custodian.
Purchases of when-issued or delayed delivery securities may have a similar effect on the Fund’s NAV as if the Fund’s had created a degree of leverage in the portfolio. Risks may arise upon entering into such transactions from the potential inability of counterparties to meet their obligations under the transactions. Additionally, losses may arise due to changes in the value of the underlying securities.
45 |
Notes to Financial Statements – continued
September 30, 2016
There were no when-issued or delayed delivery securities held by the Fund as of September 30, 2016.
e. Federal and Foreign Income Taxes. The Fund intends to meet the requirements of the Internal Revenue Code of 1986, as amended, applicable to regulated investment companies, and to distribute to its shareholders substantially all of its net investment income and any net realized capital gains at least annually. Management has performed an analysis of the Fund’s tax positions for the open tax years as of September 30, 2016 and has concluded that no provisions for income tax are required. The Fund’s federal tax returns for the prior three fiscal years remain subject to examination by the Internal Revenue Service. Management is not aware of any events that are reasonably possible to occur in the next twelve months that would result in the amounts of any unrecognized tax benefits significantly increasing or decreasing for the Fund. However, management’s conclusions regarding tax positions taken may be subject to review and adjustment at a later date based on factors including, but not limited to, new tax laws and accounting regulations and interpretations thereof.
The Fund may be subject to foreign withholding taxes on investment income and taxes on capital gains on investments that are accrued and paid based upon the Fund’s understanding of the tax rules and regulations that exist in the countries in which the Fund invests. Foreign withholding taxes on dividend and interest income are reflected on the Statement of Operations as a reduction of investment income, net of amounts eligible to be reclaimed. Dividends and interest receivable on the Statement of Assets and Liabilities are net of foreign withholding taxes. Foreign withholding taxes where reclaims have been or will be filed are reflected on the Statement of Assets and Liabilities as tax reclaims receivable. Capital gains taxes paid are included in net realized gain (loss) on investments in the Statement of Operations. Accrued but unpaid capital gains taxes are reflected as foreign taxes payable on the Statement of Assets and Liabilities, if applicable, and reduce unrealized gains on investments. In the event that realized gains on investments are subsequently offset by realized losses, taxes paid on realized gains may be returned to the Fund. Such amounts, if applicable, are reflected as foreign tax rebates receivable on the Statement of Assets and Liabilities and are recorded as a realized gain when received.
f. Dividends and Distributions to Shareholders. Dividends and distributions are recorded on ex-dividend date. The timing and characterization of certain income and capital gain distributions are determined in accordance with federal tax regulations, which may differ from accounting principles generally accepted in the United States of America. Permanent differences are primarily due to differing treatments for book and tax purposes of items such as foreign currency transactions, defaulted and/or non-income producing securities, distribution re-designations, basis tracking from corporate actions, contingent payment debt instruments, premium amortization, convertible bonds, paydown gains and losses, return of capital and capital gain distributions received and trust preferred securities. Permanent book and tax basis differences relating to shareholder distributions will result in
| 46
Notes to Financial Statements – continued
September 30, 2016
reclassifications to capital accounts reported on the Statement of Assets and Liabilities. Temporary differences between book and tax distributable earnings are primarily due to deferred Trustees’ fees, wash sales, premium amortization, convertible bonds, defaulted and/or non-income producing securities, return of capital distributions received, trust preferred securities, corporate actions and contingent payment debt instruments. Amounts of income and capital gain available to be distributed on a tax basis are determined annually, and at other times during the Fund’s fiscal year as may be necessary to avoid knowingly declaring and paying a return of capital distribution. Distributions from net investment income and short-term capital gains are considered to be distributed from ordinary income for tax purposes.
The tax characterization of distributions is determined on an annual basis. The tax character of distributions paid to shareholders during the years ended September 30, 2016 and 2015 were as follows:
| | | | | | | | | | |
2016 Distributions Paid From: | | 2015 Distributions Paid From: |
Ordinary
Income | | Long-Term
Capital Gains | | Total | | Ordinary
Income | | Long-Term
Capital Gains | | Total |
| $363,139,491 | | $638,637,859 | | $1,001,777,350 | | $776,328,389 | | $643,741,997 | | $1,420,070,386 |
Differences between these amounts and those reported in the Statements of Changes in Net Assets are primarily attributable to different book and tax treatment for short-term capital gains.
As of September 30, 2016, the components of distributable earnings on a tax basis were as follows:
| | | | |
Undistributed ordinary income | | $ | 35,943,818 | |
Undistributed long-term capital gains | | | 139,351,343 | |
| | | | |
Total undistributed earnings | | | 175,295,161 | |
| | | | |
Unrealized depreciation | | | (291,083,978 | ) |
| | | | |
Total accumulated losses | | $ | (115,788,817 | ) |
| | | | |
As of September 30, 2016, unrealized appreciation (depreciation) on a tax basis was as follows:
| | | | |
Unrealized appreciation (depreciation) | | | | |
Investments | | $ | 462,174,586 | |
Foreign currency translations | | | (753,258,564 | ) |
| | | | |
Total unrealized depreciation | | $ | (291,083,978 | ) |
| | | | |
g. Repurchase Agreements. The Fund may enter into repurchase agreements, under the terms of a Master Repurchase Agreement, under which the Fund acquires securities as collateral and agrees to resell the securities at an agreed upon time and at an agreed upon price. It is the Fund’s policy that the market value of the collateral for repurchase agreements be at least equal to 102% of the repurchase price, including interest. Certain repurchase agreements are tri-party arrangements whereby the collateral is held in a
47 |
Notes to Financial Statements – continued
September 30, 2016
segregated account for the benefit of the Fund and on behalf of the counterparty. Repurchase agreements could involve certain risks in the event of default or insolvency of the counterparty, including possible delays or restrictions upon the Fund’s ability to dispose of the underlying securities. As of September 30, 2016, the Fund had investments in repurchase agreements for which the value of the related collateral exceeded the value of the repurchase agreement. The gross value of repurchase agreements is included in the Statement of Assets and Liabilities for financial reporting purposes.
h. Securities Lending. The Fund has entered into an agreement with State Street Bank and Trust Company (“State Street Bank”), as agent of the Fund, to lend securities to certain designated borrowers. The loans are collateralized with cash or securities in an amount equal to at least 105% or 102% of the market value (including accrued interest) of the loaned international or domestic securities, respectively, when the loan is initiated. Thereafter, the value of the collateral must remain at least 102% of the market value (including accrued interest) of loaned securities for U.S. equities and U.S. corporate debt; at least 105% of the market value (including accrued interest) of loaned securities for non-U.S. equities; and at least 100% of the market value (including accrued interest) of loaned securities for U.S. Government securities, sovereign debt issued by non-U.S. Governments and non-U.S. corporate debt. In the event that the market value of the collateral falls below the required percentages described above, the borrower will deliver additional collateral on the next business day. As with other extensions of credit, the Fund may bear the risk of loss with respect to the investment of the collateral. The Fund invests cash collateral in short-term investments, a portion of the income from which is remitted to the borrowers and the remainder allocated between the Fund and State Street Bank as lending agent.
For the year ended September 30, 2016, the Fund did not loan securities under this agreement.
i. Indemnifications. Under the Trust’s organizational documents, its officers and Trustees are indemnified against certain liabilities arising out of the performance of their duties to the Fund. Additionally, in the normal course of business, the Fund enters into contracts with service providers that contain general indemnification clauses. The Fund’s maximum exposure under these arrangements is unknown as this would involve future claims that may be made against the Fund that have not yet occurred. However, based on experience, the Fund expects the risk of loss to be remote.
3. Fair Value Measurements. In accordance with accounting standards related to fair value measurements and disclosures, the Fund has categorized the inputs utilized in determining the value of the Fund’s assets or liabilities. These inputs are summarized in the three broad levels listed below:
| | • | | Level 1—quoted prices in active markets for identical assets or liabilities; |
| 48
Notes to Financial Statements – continued
September 30, 2016
| | • | | Level 2—prices determined using other significant inputs that are observable either directly, or indirectly through corroboration with observable market data (which could include quoted prices for similar assets or liabilities, interest rates, credit risk, etc.); and |
| | • | | Level 3—prices determined using significant unobservable inputs when quoted prices or observable inputs are unavailable such as when there is little or no market activity for an asset or liability (unobservable inputs reflect the Fund’s own assumptions in determining the fair value of assets or liabilities and would be based on the best information available). |
The inputs or methodology used for valuing securities are not necessarily an indication of the risk associated with investing in those securities.
The Fund’s pricing policies and procedures are recommended by the adviser and approved by the Board of Trustees. Debt securities are valued based on evaluated bids furnished to the Fund by an independent pricing service. Broker-dealer bid prices may be used if an independent pricing service either is unable to price a security or does not provide a reliable price for a security. Broker-dealer bid prices for which the Fund does not have knowledge of the inputs used by the broker-dealer are categorized in Level 3. All security prices, including those obtained from an independent pricing service and broker-dealer bid prices, are reviewed on a daily basis by the adviser, subject to oversight by Fund management and the Board of Trustees. If the adviser, in good faith, believes that the price provided by an independent pricing service is unreliable, broker-dealer bid prices may be used until the price provided by the independent pricing service is considered to be reliable. Reliability of all security prices, including those obtained from an independent pricing service and broker-dealer bid prices, is tested in a variety of ways, including comparison to recent transaction prices and daily fluctuations, amongst other validation procedures in place. Securities for which market quotations are not readily available are valued at fair value as determined in good faith by the Fund’s adviser pursuant to procedures approved by the Board of Trustees. Fair valued securities may be categorized in Level 3.
49 |
Notes to Financial Statements – continued
September 30, 2016
The following is a summary of the inputs used to value the Fund’s investments as of September 30, 2016, at value:
Asset Valuation Inputs
| | | | | | | | | | | | | | | | |
Description | | Level 1 | | | Level 2 | | | Level 3 | | | Total | |
Bonds and Notes | | | | | | | | | | | | | | | | |
Non-Convertible Bonds | | | | | | | | | | | | | | | | |
ABS Other | | $ | — | | | $ | 14,471,213 | | | $ | 43,204,647 | (b) | | $ | 57,675,860 | |
Airlines | | | — | | | | 199,144,408 | | | | 114,908 | (c) | | | 199,259,316 | |
Chemicals | | | — | | | | 376,233,139 | | | | 16,637,790 | (d) | | | 392,870,929 | |
Finance Companies | | | 3,469,133 | | | | 653,756,300 | | | | — | | | | 657,225,433 | |
Metals & Mining | | | — | | | | 337,868,960 | | | | 3,383 | (d) | | | 337,872,343 | |
Transportation Services | | | — | | | | 13,856,040 | | | | 21,484,700 | (d) | | | 35,340,740 | |
All Other Non-Convertible Bonds(a) | | | — | | | | 9,527,722,586 | | | | — | | | | 9,527,722,586 | |
| | | | | | | | | | | | | | | | |
Total Non-Convertible Bonds | | | 3,469,133 | | | | 11,123,052,646 | | | | 81,445,428 | | | | 11,207,967,207 | |
| | | | | | | | | | | | | | | | |
Convertible Bonds(a) | | | — | | | | 1,072,140,713 | | | | — | | | | 1,072,140,713 | |
Municipals(a) | | | — | | | | 221,951,064 | | | | — | | | | 221,951,064 | |
| | | | | | | | | | | | | | | | |
Total Bonds and Notes | | | 3,469,133 | | | | 12,417,144,423 | | | | 81,445,428 | | | | 12,502,058,984 | |
| | | | | | | | | | | | | | | | |
Senior Loans | | | | | | | | | | | | | | | | |
Wirelines | | | — | | | | 2,548,975 | | | | 18,283,003 | (c) | | | 20,831,978 | |
All Other Senior Loans(a) | | | — | | | | 206,183,018 | | | | — | | | | 206,183,018 | |
| | | | | | | | | | | | | | | | |
Total Senior Loans | | | — | | | | 208,731,993 | | | | 18,283,003 | | | | 227,014,996 | |
| | | | | | | | | | | | | | | | |
| 50
Notes to Financial Statements – continued
September 30, 2016
Asset Valuation Inputs – continued
| | | | | | | | | | | | | | | | |
Description | | Level 1 | | | Level 2 | | | Level 3 | | | Total | |
Common Stocks | | | | | | | | | | | | | | | | |
Internet Software & Services | | $ | — | | | $ | — | | | $ | 1,111,539 | (d) | | $ | 1,111,539 | |
Oil, Gas & Consumable Fuels(e) | | | 58,764,083 | | | | — | | | | 727,560 | (d) | | | 59,491,643 | |
All Other Common Stocks(a) | | | 1,311,315,167 | | | | — | | | | — | | | | 1,311,315,167 | |
| | | | | | | | | | | | | | | | |
Total Common Stocks | | | 1,370,079,250 | | | | — | | | | 1,839,099 | | | | 1,371,918,349 | |
| | | | | | | | | | | | | | | | |
Preferred Stocks | | | | | | | | | | | | | | | | |
Convertible Preferred Stocks | | | | | | | | | | | | | | | | |
Midstream | | | 11,705,961 | | | | 51,412,073 | | | | — | | | | 63,118,034 | |
REITs—Mortgage | | | — | | | | 2,859,029 | | | | — | | | | 2,859,029 | |
All Other Convertible Preferred Stocks(a) | | | 156,581,532 | | | | — | | | | — | | | | 156,581,532 | |
| | | | | | | | | | | | | | | | |
Total Convertible Preferred Stocks | | | 168,287,493 | | | | 54,271,102 | | | | — | | | | 222,558,595 | |
| | | | | | | | | | | | | | | | |
Non-Convertible Preferred Stocks | | | | | | | | | | | | | | | | |
Electric | | | 1,268,532 | | | | 717,149 | | | | — | | | | 1,985,681 | |
REITs—Office Property | | | — | | | | 2,972,835 | | | | — | | | | 2,972,835 | |
REITs—Warehouse/Industrials | | | — | | | | 10,964,329 | | | | — | | | | 10,964,329 | |
All Other Non-Convertible Preferred Stocks(a) | | | 11,537,984 | | | | — | | | | — | | | | 11,537,984 | |
| | | | | | | | | | | | | | | | |
Total Non-Convertible Preferred Stocks | | | 12,806,516 | | | | 14,654,313 | | | | — | | | | 27,460,829 | |
| | | | | | | | | | | | | | | | |
Total Preferred Stocks | | | 181,094,009 | | | | 68,925,415 | | | | — | | | | 250,019,424 | |
| | | | | | | | | | | | | | | | |
51 |
Notes to Financial Statements – continued
September 30, 2016
Asset Valuation Inputs – continued
| | | | | | | | | | | | | | | | |
Description | | Level 1 | | | Level 2 | | | Level 3 | | | Total | |
Closed-End Investment Companies | | $ | 3,779,144 | | | $ | — | | | $ | — | | | $ | 3,779,144 | |
Warrants | | | — | | | | — | | | | 102,811 | (d) | | | 102,811 | |
Short-Term Investments | | | — | | | | 598,807,509 | | | | — | | | | 598,807,509 | |
| | | | | | | | | | | | | | | | |
Total | | $ | 1,558,421,536 | | | $ | 13,293,609,340 | | | $ | 101,670,341 | | | $ | 14,953,701,217 | |
| | | | | | | | | | | | | | | | |
(a) Details of the major categories of the Fund’s investments are reflected within the Portfolio of Investments.
(b) Valued using broker-dealer bid prices ($29,642,774) and fair valued by the Fund’s adviser using broker-dealer bid prices for which the inputs are unobservable to the Fund ($13,561,873).
(c) Valued using broker-dealer bid prices.
(d) Fair valued by the Fund’s adviser.
(e) Includes a security fair valued at zero using Level 3 inputs.
The following is a reconciliation of Level 3 investments for which significant unobservable inputs were used to determine fair value as of September 30, 2015 and/or September 30, 2016:
Asset Valuation Inputs
| | | | | | | | | | | | | | | | | | | | |
Investments in Securities | | Balance as of
September 30,
2015 | | | Accrued
Discounts
(Premiums) | | | Realized Gain
(Loss) | | | Change in
Unrealized
Appreciation
(Depreciation) | | | Purchases | |
Bonds and Notes | | | | | | | | | | | | | | | | | | | | |
Non-Convertible Bonds | | | | | | | | | | | | | | | | | | | | |
ABS Other | | $ | 75,947,254 | | | $ | — | | | $ | 12,967 | | | $ | (28,639,049 | ) | | $ | 464,794 | |
Airlines | | | 376,513 | | | | — | | | | 68,740 | | | | (87,649 | ) | | | — | |
Chemicals | | | — | | | | 419,374 | | | | — | | | | (9,105,142 | ) | | | — | |
Metals & Mining | | | 2,706,093 | | | | 109,722 | | | | — | | | | (2,812,432 | ) | | | — | |
Non-Agency Commercial Mortgage-Backed Securities | | | 39,002,217 | | | | — | | | | — | | | | — | | | | — | |
Oil Field Services | | | 4,760,920 | | | | — | | | | — | | | | — | | | | — | |
Retailers | | | 15,663,313 | | | | — | | | | — | | | | — | | | | — | |
Transportation Services | | | 24,921,569 | | | | — | | | | 792,707 | | | | (999,988 | ) | | | — | |
Senior Loans | | | | | | | | | | | | | | | | | | | | |
Wirelines | | | — | | | | 15,552 | | | | — | | | | (942,665 | ) | | | — | |
Common Stocks | | | | | | | | | | | | | | | | | | | | |
Internet Software & Services | | | — | | | | — | | | | — | | | | (1,527,862 | ) | | | 2,639,401 | |
Oil, Gas & Consumable Fuels | | | — | | | | — | | | | — | | | | (2,223,432 | ) | | | 2,950,992 | |
Warrants | | | — | | | | — | | | | — | | | | 102,811 | | | | — | |
| | | | | | | | | | | | | | | | | | | | |
Total | | $ | 163,377,879 | | | $ | 544,648 | | | $ | 874,414 | | | $ | (46,235,408 | ) | | $ | 6,055,187 | |
| | | | | | | | | | | | | | | | | | | | |
| 52
Notes to Financial Statements – continued
September 30, 2016
Asset Valuation Inputs – continued
| | | | | | | | | | | | | | | | | | | | |
Investments in Securities –
continued | | Sales | | | Transfers
into
Level 3 | | | Transfers out
of
Level 3 | | | Balance as
of September 30,
2016 | | | Change in
Unrealized
Appreciation
(Depreciation)
from
Investments
Still Held
at September 30,
2016 | |
Bonds and Notes | | | | | | | | | | | | | | | | | | | | |
Non-Convertible Bonds | | | | | | | | | | | | | | | | | | | | |
ABS Other | | $ | (4,581,319 | ) | | $ | — | | | $ | — | | | $ | 43,204,647 | | | $ | (29,854,066 | ) |
Airlines | | | (807,512 | ) | | | 941,329 | | | | (376,513 | ) | | | 114,908 | | | | (87,649 | ) |
Chemicals | | | — | | | | 25,323,558 | | | | — | | | | 16,637,790 | | | | (9,105,142 | ) |
Metals & Mining | | | — | | | | — | | | | — | | | | 3,383 | | | | (2,812,432 | ) |
Non-Agency Commercial Mortgage-Backed Securities | | | — | | | | — | | | | (39,002,217 | ) | | | — | | | | — | |
Oil Field Services | | | — | | | | — | | | | (4,760,920 | ) | | | — | | | | — | |
Retailers | | | — | | | | — | | | | (15,663,313 | ) | | | — | | | | — | |
Transportation Services | | | (3,229,588 | ) | | | — | | | | — | | | | 21,484,700 | | | | (124,460 | ) |
Senior Loans | | | | | | | | | | | | | | | | | | | | |
Wirelines | | | — | | | | 19,210,116 | | | | — | | | | 18,283,003 | | | | (942,665 | ) |
Common Stocks | | | | | | | | | | | | | | | | | | | | |
Internet Software & Services | | | — | | | | — | | | | — | | | | 1,111,539 | | | | (1,527,862 | ) |
Oil, Gas & Consumable Fuels | | | — | | | | — | | | | — | | | | 727,560 | (a) | | | (2,223,432 | ) |
Warrants | | | — | | | | — | | | | — | | | | 102,811 | | | | 102,811 | |
| | | | | | | | | | | | | | | | | | | | |
Total | | $ | (8,618,419 | ) | | $ | 45,475,003 | | | $ | (59,802,963 | ) | | $ | 101,670,341 | | | $ | (46,574,897 | ) |
| | | | | | | | | | | | | | | | | | | | |
(a) Includes a security fair valued at zero using Level 3 inputs.
Debt securities valued at $941,329 were transferred from Level 2 to Level 3 during the period ended September 30, 2016. At September 30, 2015, these securities were valued on the basis of evaluated bids furnished to the Fund by an independent pricing service in accordance with the Fund’s valuation policies. At September 30, 2016, these securities were valued using broker-dealer bid prices based on inputs unobservable to the Fund as an independent pricing service was unable to price the securities.
Debt securities valued at $39,378,730 were transferred from Level 3 to Level 2 during the period ended September 30, 2016. At September 30, 2015, these securities were valued using broker-dealer bid prices based on inputs unobservable to the Fund as an independent pricing service was unable to price the securities. At September 30, 2016, these securities were valued on the basis of evaluated bids furnished to the Fund by an independent pricing service in accordance with the Fund’s valuation policies.
53 |
Notes to Financial Statements – continued
September 30, 2016
Debt securities valued at $25,323,558 were transferred from Level 2 to Level 3 during the period ended September 30, 2016. At September 30, 2015, these securities were valued on the basis of evaluated bids furnished to the Fund by an independent pricing service in accordance with the Fund’s valuation policies. At September 30, 2016, these securities were valued at fair value as determined in good faith by the Fund’s adviser as an independent pricing service did not provide a reliable price for the securities.
Debt securities valued at $20,424,233 were transferred from Level 3 to Level 2 during the period ended September 30, 2016. At September 30, 2015, these securities were valued at fair value as determined in good faith by the Fund’s investment adviser as an independent pricing service did not provide a reliable price for the securities. At September 30, 2016, these securities were valued on the basis of evaluated bids furnished to the Fund by an independent pricing service in accordance with the Fund’s valuation policies.
A debt security valued at $19,210,116 was transferred from Level 2 to Level 3 during the period ended September 30, 2016. At September 30, 2015, this security was valued on the basis of evaluated bids furnished to the Fund by an independent pricing service in accordance with the Fund’s valuation policies. At September 30, 2016, this security was valued using broker-dealer bid prices based on inputs unobservable to the Fund as an independent pricing service did not provide a reliable price for the security.
All transfers are recognized as of the beginning of the reporting period.
4. Purchases and Sales of Securities. For the year ended September 30, 2016, purchases and sales of securities (excluding short-term investments and U.S. Government/Agency securities and including paydowns) were $873,291,787 and $5,717,233,608, respectively. Purchases and sales of U.S. Government/Agency securities (excluding short-term investments and including paydowns) were $1,174,440,429 and $1,460,692,728, respectively.
5. Management Fees and Other Transactions with Affiliates.
a. Management Fees. Loomis, Sayles & Company, L.P. (“Loomis Sayles”) serves as investment adviser to the Fund. Under the terms of the management agreement, the Fund pays a management fee at the following annual rates, calculated daily and payable monthly, based on the Fund’s average daily net assets:
| | | | | | | | | | | | | | |
| Percentage of Average Daily Net Assets | |
First
$3 billion | | | Next
$12 billion | | | Next
$10 billion | | | Over
$25 billion | |
| | 0.60% | | | | 0.50% | | | | 0.49% | | | | 0.48% | |
Loomis Sayles has given a binding undertaking to the Fund to waive management fees and/or reimburse certain expenses to limit the Fund’s operating expenses, exclusive of acquired fund fees and expenses, brokerage expenses, interest expense, taxes, organizational and extraordinary expenses such as litigation and indemnification expenses. This
| 54
Notes to Financial Statements – continued
September 30, 2016
undertaking is in effect until January 31, 2017, may be terminated before then only with the consent of the Fund’s Board of Trustees and is reevaluated on an annual basis. Management fees payable, as reflected on the Statement of Assets and Liabilities, is net of waivers and/or expense reimbursements, if any, pursuant to this undertaking. Waivers/reimbursements that exceed management fees payable are reflected on the Statement of Assets and Liabilities as receivable from investment adviser.
For the year ended September 30, 2016, the expense limits as a percentage of average daily net assets under the expense limitation agreement were as follows:
| | | | | | | | | | | | |
| Expense Limit as a Percentage of Average Daily Net Assets | |
Institutional
Class | | Retail
Class | | | Admin
Class | | | Class N | |
| 0.70% | | | 0.95% | | | | 1.20% | | | | 0.65% | |
Loomis Sayles shall be permitted to recover expenses it has borne under the expense limitation agreement (whether through waiver of its management fees or otherwise) on a class by class basis in later periods to the extent the annual operating expenses of a class fall below a class’ expense limits, provided, however, that a class is not obligated to pay such waived/reimbursed fees or expenses more than one year after the end of the fiscal year in which the fees or expenses were waived/reimbursed.
For the year ended September 30, 2016, the management fees for the Fund were $84,783,102 (effective rate of 0.52% of average daily net assets).
No expenses were recovered during the year ended September 30, 2016 under the terms of the expense limitation agreement.
Certain officers and employees of Loomis Sayles are also officers or Trustees of the Trust. Loomis Sayles’ general partner is indirectly owned by Natixis Global Asset Management, L.P. (“Natixis US”), which is part of Natixis Global Asset Management, an international asset management group based in Paris, France.
b. Service and Distribution Fees. NGAM Distribution, which is a wholly-owned subsidiary of Natixis US, has entered into a distribution agreement with the Trust. Pursuant to this agreement, NGAM Distribution serves as principal underwriter of the Funds of the Trust.
Pursuant to Rule 12b-1 under the 1940 Act, the Trust has adopted Distribution Plans relating to the Fund’s Retail Class shares (the “Retail Class Plan”) and Admin Class shares (the “Admin Class Plan”).
Under the Retail Class Plan, the Fund pays NGAM Distribution a monthly distribution fee at an annual rate not to exceed 0.25% of the average daily net assets attributable to the Fund’s Retail Class shares, as compensation for services provided by NGAM Distribution in connection with the marketing or sale of Retail Class shares or for payments made by NGAM Distribution to securities dealers or other financial intermediaries as commissions,
55 |
Notes to Financial Statements – continued
September 30, 2016
asset-based sales charges or other compensation with respect to the sale of Retail Class shares, or for providing personal services to investors and/or the maintenance of shareholder accounts.
Under the Admin Class Plan, the Fund pays NGAM Distribution a monthly distribution fee at an annual rate not to exceed 0.25% of the average daily net assets attributable to the Fund’s Admin Class shares, as compensation for services provided by NGAM Distribution in connection with the marketing or sale of Admin Class shares or for payments made by NGAM Distribution to securities dealers or other financial intermediaries as commissions, asset-based sales charges or other compensation with respect to the sales of Admin Class shares, or for providing personal services to investors and/or the maintenance of shareholder accounts.
In addition, the Admin Class shares of the Fund may pay NGAM Distribution an administrative service fee, at an annual rate not to exceed 0.25% of the average daily net assets attributable to Admin Class shares. These fees are subsequently paid to securities dealers or financial intermediaries for providing personal services and/or account maintenance for their customers who hold such shares.
For the year ended September 30, 2016, the service and distribution fees for the Fund were as follows:
| | | | | | | | |
Service Fees | | Distribution Fees | |
Admin
Class | | Retail
Class | | | Admin
Class | |
| $533,263 | | | $12,787,888 | | | | $533,263 | |
c. Administrative Fees. NGAM Advisors, L.P. (“NGAM Advisors”) provides certain administrative services for the Fund and contracts with State Street Bank to serve as sub-administrator. NGAM Advisors is a wholly-owned subsidiary of Natixis US. Pursuant to an agreement among Natixis Funds Trusts, Loomis Sayles Funds Trusts and NGAM Advisors, the Fund pays NGAM Advisors monthly its pro rata portion of fees equal to an annual rate of 0.0575% of the first $15 billion of the average daily net assets of the Natixis Funds Trusts and Loomis Sayles Funds Trusts, 0.0500% of the next $15 billion, 0.0400% of the next $30 billion, 0.0350% of the next $30 billion and 0.0325% of such assets in excess of $90 billion, subject to an annual aggregate minimum fee for the Natixis Funds Trusts and Loomis Sayles Funds Trusts of $10 million, which is reevaluated on an annual basis.
For the year ended September 30, 2016, the administrative fees for the Fund were $7,217,873.
d. Sub-Transfer Agent Fees. NGAM Distribution has entered into agreements, which include servicing agreements, with financial intermediaries that provide recordkeeping, processing, shareholder communications and other services to customers of the intermediaries that hold positions in the Fund and has agreed to compensate the
| 56
Notes to Financial Statements – continued
September 30, 2016
intermediaries for providing those services. Intermediaries transact with the Fund primarily through the use of omnibus accounts on behalf of their customers who hold positions in the Fund. These services would have been provided by the Fund’s transfer agent and other service providers if the shareholders’ accounts were maintained directly at the Fund’s transfer agent. Accordingly, the Fund has agreed to reimburse NGAM Distribution for all or a portion of the servicing fees paid to these intermediaries. The reimbursement amounts (sub-transfer agent fees) paid to NGAM Distribution are subject to a current per-account equivalent fee limit approved by the Fund’s Board of Trustees, which is based on fees for similar services paid to the Fund’s transfer agent and other service providers. Class N shares do not bear such expenses.
For the year ended September 30, 2016, the sub-transfer agent fees (which are reflected in transfer agent fees and expenses in the Statement of Operations) for the Fund were $12,131,665.
As of September 30, 2016, the Fund owes NGAM Distribution $128,669 in reimbursements for sub-transfer agent fees (which are reflected in the Statement of Assets and Liabilities as payable to distributor).
Sub-transfer agent fees attributable to Institutional Class, Retail Class and Admin Class are allocated on a pro rata basis to each class based on the relative net assets of each class to the total net assets of those classes.
e. Trustees Fees and Expenses. The Trust does not pay any compensation directly to its officers or Trustees who are directors, officers or employees of NGAM Advisors, NGAM Distribution, Natixis US or their affiliates. The Chairperson of the Board of Trustees receives a retainer fee at the annual rate of $325,000. The Chairperson does not receive any meeting attendance fees for Board of Trustees meetings or committee meetings that she attends. Each Independent Trustee (other than the Chairperson) receives, in the aggregate, a retainer fee at the annual rate of $155,000. Each Independent Trustee also receives a meeting attendance fee of $10,000 for each meeting of the Board of Trustees that he or she attends in person and $5,000 for each meeting of the Board of Trustees that he or she attends telephonically. In addition, the chairperson of the Contract Review Committee and the chairperson of the Audit Committee each receive an additional retainer fee at the annual rate of $17,500. The chairperson of the Governance Committee receives an additional retainer fee at the annual rate of $10,000. Each Contract Review Committee member is compensated $6,000 for each Committee meeting that he or she attends in person and $3,000 for each meeting that he or she attends telephonically. Each Audit Committee member is compensated $6,000 for each Committee meeting that he or she attends in person and $3,000 for each meeting that he or she attends telephonically. These fees are allocated among the funds in the Natixis Funds Trusts and Loomis Sayles Funds Trusts based on a formula that takes into account, among other factors, the relative net assets of each fund. Trustees are reimbursed for travel expenses in connection with attendance at meetings.
57 |
Notes to Financial Statements – continued
September 30, 2016
Prior to January 1, 2016, the Chairperson of the Board received a retainer fee at the annual rate of $300,000 and each Independent Trustee (other than the Chairperson) received, in the aggregate, a retainer fee at the annual rate of $130,000. The chairperson of the Governance Committee received an additional retainer fee at the annual rate of $5,000. All other Trustee fees remained unchanged.
A deferred compensation plan (the “Plan”) is available to the Trustees on a voluntary basis. Deferred amounts remain in the Fund until distributed in accordance with the provisions of the Plan. The value of a participating Trustee’s deferral account is based on theoretical investments of deferred amounts, on the normal payment dates, in certain funds of the Natixis Funds Trusts and Loomis Sayles Funds Trusts as designated by the participating Trustees. Changes in the value of participants’ deferral accounts are allocated pro rata among the funds in the Natixis Funds Trusts and Loomis Sayles Funds Trusts, and are normally reflected as Trustees’ fees and expenses in the Statement of Operations. The portions of the accrued obligations allocated to the Fund under the Plan are reflected as Deferred Trustees’ fees in the Statement of Assets and Liabilities.
f. Affiliated Ownership. As of September 30, 2016, Loomis Sayles Funded Pension Plan and Trust and Loomis Sayles Employees’ Profit Sharing Retirement Plan held shares of the Fund representing 0.08% and 0.22% of the Fund’s net assets, respectively.
Investment activities of affiliated shareholders could have material impacts on the Fund.
g. Reimbursement of Transfer Agent Fees and Expenses. NGAM Advisors had given a binding contractual undertaking to the Fund to reimburse any and all transfer agency expenses for the Fund’s Class N shares. This undertaking was in effect through January 31, 2016 and is not subject to recovery under the expense limitation agreement described above.
For the period October 1, 2015 through January 31, 2016, NGAM Advisors reimbursed the Fund $896 for transfer agency expenses related to Class N shares.
6. Class-Specific Transfer Agent Fees and Expenses. For the year ended September 30, 2016, the Fund incurred the following class-specific transfer agent fees and expenses (including sub-transfer agent fees, where applicable):
| | | | | | | | | | | | |
| Transfer Agent Fees and Expenses | |
Institutional
Class | | Retail Class | | | Admin
Class | | | Class N | |
| $8,447,037 | | | $3,944,114 | | | | $164,684 | | | | $2,859 | |
Transfer agent fees and expenses attributable to Institutional Class, Retail Class and Admin Class are allocated on a pro rata basis to each class based on relative net assets of each class to the total net assets of those classes. Transfer agent fees and expenses attributable to Class N are allocated to Class N.
| 58
Notes to Financial Statements – continued
September 30, 2016
7. Line of Credit. Effective April 14, 2016, each Fund, together with certain other funds of Natixis Funds Trusts and Loomis Sayles Funds Trusts, entered into a 364-day, $400,000,000 syndicated, committed, unsecured line of credit with Citibank, N.A. to be used for temporary or emergency purposes only. Any one Fund may borrow up to the full $400,000,000 under the line of credit (as long as all borrowings by all Funds in the aggregate do not exceed the $400,000,000 limit at any time) subject to each Fund’s investment restrictions. Interest is charged to the Funds at a rate equal to the greater of the eurodollar or the federal funds rate plus 1.00%. In addition, a commitment fee of 0.10% per annum, payable on the last business day of each month, is accrued and apportioned among the participating funds based on their average daily unused portion of the line of credit. The Funds paid an arrangement fee, an upfront fee, and other fees in connection with the new line of credit agreement, which are being amortized over a period of 364 days and are reflected as miscellaneous expenses on the Statement of Operations. The unamortized balance is reflected as prepaid expenses on the Statement of Assets and Liabilities.
Prior to April 14, 2016 each Fund, together with certain other funds of Natixis Funds Trusts and Loomis Sayles Funds Trusts, participated in a $150,000,000 committed unsecured line of credit provided by State Street Bank. Any one Fund was able to borrow up to the full $150,000,000 under the line of credit (as long as all borrowings by all Funds in the aggregate do not exceed the $150,000,000 limit at any time). Interest was charged to each participating Fund based on its borrowings at a rate per annum equal to the greater of the Federal Funds rate or overnight LIBOR, plus 1.25%. In addition, a commitment fee of 0.15% per annum, payable at the end of each calendar quarter, was accrued and apportioned among the participating funds based on their average daily unused portion of the line of credit.
For the year ended September 30, 2016, the Fund had no borrowings under these agreements.
8. Concentration of Risk. The Fund’s investments in foreign securities are subject to foreign currency fluctuations, higher volatility than U.S. securities, varying degrees of regulation and limited liquidity. Greater political, economic, credit and information risks are also associated with foreign securities.
59 |
Notes to Financial Statements – continued
September 30, 2016
9. Capital Shares. The Fund may issue an unlimited number of shares of beneficial interest, without par value. Transactions in capital shares were as follows:
| | | | | | | | | | | | | | | | |
| | | Year Ended
September 30, 2016 | | | Year Ended
September 30, 2015 | |
| Institutional Class | | Shares | | | Amount | | | Shares | | | Amount | |
Issued from the sale of shares | | | 160,180,222 | | | $ | 2,127,904,277 | | | | 246,690,367 | | | $ | 3,644,602,280 | |
Issued in connection with the reinvestment of distributions | | | 47,619,624 | | | | 617,686,160 | | | | 56,771,737 | | | | 833,303,917 | |
Redeemed | | | (442,133,934 | ) | | | (5,869,449,395 | ) | | | (353,219,966 | ) | | | (5,125,809,847 | ) |
| | �� | | | | | | | | | | | | | | |
Net change | | | (234,334,088 | ) | | $ | (3,123,858,958 | ) | | | (49,757,862 | ) | | $ | (647,903,650 | ) |
| | | | | | | | | | | | | | | | |
| Retail Class | | | | | | | | | | | | |
Issued from the sale of shares | | | 42,787,867 | | | $ | 566,015,340 | | | | 104,527,961 | | | $ | 1,544,181,465 | |
Issued in connection with the reinvestment of distributions | | | 23,387,521 | | | | 301,525,815 | | | | 31,828,665 | | | | 465,533,479 | |
Redeemed | | | (205,716,845 | ) | | | (2,732,824,450 | ) | | | (234,276,979 | ) | | | (3,391,871,683 | ) |
| | | | | | | | | | | | | | | | |
Net change | | | (139,541,457 | ) | | $ | (1,865,283,295 | ) | | | (97,920,353 | ) | | $ | (1,382,156,739 | ) |
| | | | | | | | | | | | | | | | |
| Admin Class | | | | | | | | | | | | |
Issued from the sale of shares | | | 2,197,113 | | | $ | 29,050,927 | | | | 4,705,090 | | | $ | 69,390,142 | |
Issued in connection with the reinvestment of distributions | | | 903,959 | | | | 11,602,619 | | | | 1,038,776 | | | | 15,140,337 | |
Redeemed | | | (7,399,879 | ) | | | (98,569,951 | ) | | | (7,121,582 | ) | | | (103,449,460 | ) |
| | | | | | | | | | | | | | | | |
Net change | | | (4,298,807 | ) | | $ | (57,916,405 | ) | | | (1,377,716 | ) | | $ | (18,918,981 | ) |
| | | | | | | | | | | | | | | | |
| Class N | | | | | | | | | | | | |
Issued from the sale of shares | | | 3,139,426 | | | $ | 41,893,559 | | | | 5,127,053 | | | $ | 74,872,446 | |
Issued in connection with the reinvestment of distributions | | | 413,778 | | | | 5,369,820 | | | | 199,677 | | | | 2,908,708 | |
Redeemed | | | (1,707,652 | ) | | | (22,882,253 | ) | | | (1,118,321 | ) | | | (16,107,920 | ) |
| | | | | | | | | | | | | | | | |
Net change | | | 1,845,552 | | | $ | 24,381,126 | | | | 4,208,409 | | | $ | 61,673,234 | |
| | | | | | | | | | | | | | | | |
Increase (decrease) from capital share transactions | | | (376,328,800 | ) | | $ | (5,022,677,532 | ) | | | (144,847,522 | ) | | $ | (1,987,306,136 | ) |
| | | | | | | | | | | | | | | | |
| 60
Report of Independent Registered Public Accounting Firm
To the Trustees of Loomis Sayles Funds Trust I and Shareholders of Loomis Sayles Bond Fund:
In our opinion, the accompanying statement of assets and liabilities, including the portfolio of investments, and the related statements of operations and of changes in net assets and the financial highlights present fairly, in all material respects, the financial position of the Loomis Sayles Bond Fund, a series of Loomis Sayles Funds Trust I (the “Fund”) at September 30, 2016, and the results of its operations, the changes in its net assets and the financial highlights for each of the periods indicated, in conformity with accounting principles generally accepted in the United States of America. These financial statements and financial highlights (hereafter referred to as “financial statements”) are the responsibility of the Fund’s management. Our responsibility is to express an opinion on these financial statements based on our audits. We conducted our audits of these financial statements in accordance with the standards of the Public Company Accounting Oversight Board (United States). Those standards require that we plan and perform the audit to obtain reasonable assurance about whether the financial statements are free of material misstatement. An audit includes examining, on a test basis, evidence supporting the amounts and disclosures in the financial statements, assessing the accounting principles used and significant estimates made by management, and evaluating the overall financial statement presentation. We believe that our audits, which included confirmation of securities at September 30, 2016 by correspondence with the custodian, agent banks and brokers, provide a reasonable basis for our opinion expressed above.
PricewaterhouseCoopers LLP
Boston, Massachusetts
November 21, 2016
61 |
2016 U.S. Tax Distribution Information to
Shareholders (Unaudited)
Corporate Dividends Received Deduction. For the fiscal year ended September 30, 2016, 18.96% of dividends distributed by Bond Fund qualify for the dividends received deduction for corporate shareholders.
Capital Gains Distributions. Pursuant to Internal Revenue Section 852(b), the Bond Fund designated $638,637,859 as capital gains distributions for the fiscal year ended September 30, 2016, unless subsequently determined to be different.
Qualified Dividend Income. For the fiscal year ended September 30, 2016, the Bond Fund will designate up to the maximum amount allowable pursuant to the Internal Revenue Code as qualified dividend income eligible for reduced tax rates. These lower rates range from 0% to 20% depending on an individual’s tax bracket. If the Fund pays a distribution during calendar year 2016, complete information will be reported in conjunction with Form 1099-DIV.
| 62
Trustee and Officer Information
As of 9/30/16
The tables below provide certain information regarding the trustees and officers of Loomis Sayles Funds I (the “Trust”). Unless otherwise indicated, the address of all persons below is 399 Boylston Street, Boston, MA 02116. The Fund’s Statement of Additional Information includes additional information about the trustees of the Trust and are available by calling Loomis Sayles Funds at 800-633-3330.
| | | | | | | | |
| Name and Year of Birth | | Position(s) Held
with the Trust,
Length of Time
Served and
Term of Office1 | | Principal
Occupation(s)
During Past 5 Years | | Number of
Portfolios in
Fund Complex
Overseen2 and
Other
Directorships Held
During Past 5 Years | | Experience,
Qualifications,
Attributes, Skills
for Board
Membership |
| | |
| INDEPENDENT TRUSTEES | | | | |
| | | | |
Kenneth A. Drucker (1945) | | Trustee since 2008 Chairperson of the Audit Committee and Governance Committee Member | | Retired | | 44 None | | Significant experience on the Board and on the boards of other business organizations (including at investment companies); executive experience (including as treasurer of an aerospace, automotive, and metal manufacturing corporation) |
| | | | |
| Edmond J. English (1953) | | Trustee since 2013 Audit Committee Member | | Chief Executive Officer of Bob’s Discount Furniture (retail) | | 44 Director, Burlington Stores, Inc. (retail); Formerly, Director, BJ’s Wholesale Club (retail) | | Experience on the Board and significant experience on the boards of other business organizations (including retail companies and a bank); executive experience (including at a retail company) |
| | | | |
Richard A. Goglia (1951) | | Trustee since 2015 Audit Committee Member | | Retired; formerly Vice President and Treasurer of Raytheon Company (defense) | | 44 None | | Experience on the Board and executive experience (including his role as vice president and treasurer of a defense company and experience at a financial services company) |
63 |
Trustee and Officer Information – continued
| | | | | | | | |
| Name and Year of Birth | | Position(s) Held
with the Trust,
Length of Time
Served and
Term of Office1 | | Principal
Occupation(s)
During Past 5 Years | | Number of
Portfolios in
Fund Complex
Overseen2 and
Other
Directorships Held
During Past 5 Years | | Experience,
Qualifications,
Attributes, Skills
for Board
Membership |
| | |
| INDEPENDENT TRUSTEES – continued | | | | |
| | | | |
Wendell J. Knox (1948) | | Trustee since 2009 Contract Review Committee Member and Governance Committee Member | | Director of Abt Associates Inc. (research and consulting) | | 44 Director, Eastern Bank (bank); Director, The Hanover Insurance Group (property and casualty insurance) | | Significant experience on the Board and on the boards of other business organizations (including at a bank and at a property and casualty insurance firm); executive experience (including roles as president and chief executive officer of a research and consulting company) |
| | | | |
| Martin T. Meehan (1956) | | Trustee since 2012 Contract Review Committee Member | | President, University of Massachusetts; formerly, Chancellor and faculty member, University of Massachusetts Lowell | | 44 None | | Experience on the Board and on the boards of other business organizations; experience as President of the University of Massachusetts; government experience (including as a member of the U.S. House of Representatives); academic experience |
| 64
Trustee and Officer Information – continued
| | | | | | | | |
| Name and Year of Birth | | Position(s) Held
with the Trust,
Length of Time
Served and
Term of Office1 | | Principal
Occupation(s)
During Past 5 Years | | Number of
Portfolios in
Fund Complex
Overseen2 and
Other
Directorships Held
During Past 5 Years | | Experience,
Qualifications,
Attributes, Skills
for Board
Membership |
| | |
| INDEPENDENT TRUSTEES – continued | | | | |
| | | | |
Sandra O. Moose (1942) | | Chairperson of the Board of Trustees since November 2005 Trustee since 2003 Ex Officio member of the Audit Committee, the Contract Review Committee and the Governance Committee | | President, Strategic Advisory Services (management consulting) | | 44 Formerly, Director, AES Corporation (international power company); formerly, Director, Verizon Communications (telecommunications company) | | Significant experience on the Board and on the boards of other business organizations (including at a telecommunications company, an international power company and a specialty chemicals corporation); executive experience (including at a management consulting company) |
| | | | |
James P. Palermo (1955) | | Trustee since 2016 Contract Review Committee Member | | Founding Partner, Breton Capital Management, LLC (private equity); formerly, Chief Executive Officer of Global Client Management of The Bank of New York Mellon Corporation | | 44 None | | Experience on the Board; financial services industry and executive experience (including roles as chief executive officer of client management and asset servicing for a banking and financial services company) |
| | | | |
Erik R. Sirri (1958) | | Trustee since 2009 Audit Committee Member | | Professor of Finance at Babson College | | 44 None | | Significant experience on the Board; experience as Director of the Division of Trading and Markets at the Securities and Exchange Commission; academic experience; training as an economist |
65 |
Trustee and Officer Information – continued
| | | | | | | | |
| Name and Year of Birth | | Position(s) Held
with the Trust,
Length of Time
Served and
Term of Office1 | | Principal
Occupation(s)
During Past 5 Years | | Number of
Portfolios in
Fund Complex
Overseen2 and
Other
Directorships Held
During Past 5 Years | | Experience,
Qualifications,
Attributes, Skills
for Board
Membership |
| | |
| INDEPENDENT TRUSTEES – continued | | | | |
| | | | |
Peter J. Smail (1952) | | Trustee since 2009 Chairperson of the Contract Review Committee and Governance Committee Member | | Retired | | 44 None | | Significant experience on the Board; mutual fund industry and executive experience (including roles as president and chief executive officer for an investment adviser) |
| | | | |
Cynthia L. Walker (1956) | | Trustee since 2005 Chairperson of the Governance Committee and Contract Review Committee Member | | Deputy Dean for Finance and Administration, Yale University School of Medicine | | 44 None | | Significant experience on the Board; executive experience in a variety of academic organizations (including roles as dean for finance and administration) |
| | |
| INTERESTED TRUSTEES | | | | |
| | | | |
Kevin P. Charleston3 (1965) One Financial Center Boston, MA 02111 | | Trustee since 2015 President and Chief Executive Officer of Loomis Sayles Funds I since 2015 | | President, Chief Executive Officer and Director; formerly, Chief Financial Officer, Loomis, Sayles & Company, L.P. | | 44 None | | Experience on the Board; continuing service as President, Chief Executive Officer and Director of Loomis, Sayles & Company, L.P. |
| | | | |
David L. Giunta4
(1965) | | Trustee since 2011 Executive Vice President since 2008 | | President and Chief Executive Officer, NGAM Distribution Corporation, NGAM Advisors, L.P. and NGAM Distribution, L.P. | | 44 None | | Significant experience on the Board; continuing experience as President and Chief Executive Officer of NGAM Advisors, L.P. |
| 66
Trustee and Officer Information – continued
| | | | | | | | |
| Name and Year of Birth | | Position(s) Held
with the Trust,
Length of Time
Served and
Term of Office1 | | Principal
Occupation(s)
During Past 5 Years | | Number of
Portfolios in
Fund Complex
Overseen2 and
Other
Directorships Held
During Past 5 Years | | Experience,
Qualifications,
Attributes, Skills
for Board
Membership |
| | |
| INTERESTED TRUSTEES – continued | | | | |
| | | | |
John T. Hailer5 (1960) | | Trustee since 2003 | | President and Chief Executive Officer – U.S. and Asia, Natixis Global Asset Management, L.P. | | 44 None | | Significant experience on the Board; continuing experience as President and Chief Executive Officer – U.S. and Asia, Natixis Global Asset Management, L.P. |
| 1 | Each trustee serves until retirement, resignation or removal from the Board. The current retirement age is 75. The position of Chairperson of the Board is appointed for a three-year term. Ms. Moose was appointed to serve an additional three-year term as the Chairperson of the Board on December 13, 2013. |
| 2 | The trustees of the Trust serve as trustees of a fund complex that includes all series of the Natixis Funds Trust I, Natixis Funds Trust II, Natixis Funds Trust IV and Gateway Trust (collectively, the “Natixis Funds Trusts”), Loomis Sayles Funds I and Loomis Sayles Funds II (collectively, the “Loomis Sayles Funds Trusts”) and Natixis ETF Trust (collectively, the “Fund Complex”). |
| 3 | Mr. Charleston is deemed an “interested person” of the Trust because he holds the following positions with an affiliated person of the Trust: President and Chief Executive Officer of Loomis, Sayles & Company, L.P. |
| 4 | Mr. Giunta is deemed an “interested person” of the Trust because he holds the following positions with an affiliated person of the Trust: President and Chief Executive Officer of NGAM Distribution Corporation, NGAM Advisors, L.P. and NGAM Distribution, L.P. |
| 5 | Mr. Hailer is deemed an “interested person” of the Trust because he holds the following positions with an affiliated person of the Trust: President and Chief Executive Officer – U.S. and Asia, Natixis Global Asset Management, L.P. |
67 |
Trustee and Officer Information – continued
| | | | | | |
| Name and Year of Birth | | Position(s) Held with
the Trust | | Term of Office1 and
Length of Time Served | | Principal Occupation(s)
During Past 5 Years2 |
| |
| OFFICERS OF THE TRUST | | |
| | | |
Daniel J. Fuss (1933) One Financial Center Boston, MA 02111 | | Executive Vice President | | Since June 2003 | | Vice Chairman and Director, Loomis, Sayles & Company, L.P. |
| | | |
Russell L. Kane (1969) | | Secretary, Clerk and Chief Legal Officer | | Since July 2016 | | Executive Vice President, General Counsel, Secretary and Clerk, NGAM Distribution Corporation, NGAM Advisors, L.P. and NGAM Distribution, L.P.; formerly, Chief Compliance Officer for Mutual Funds, Senior Vice President, Deputy General Counsel, Assistant Secretary and Assistant Clerk, NGAM Distribution Corporation, NGAM Advisors, L.P. and NGAM Distribution, L.P. |
| | | |
Michael C. Kardok (1959) | | Treasurer, Principal Financial and Accounting Officer | | Since October 2004 | | Senior Vice President, NGAM Advisors, L.P. and NGAM Distribution, L.P. |
| | | |
Rosa Licea-Mailloux (1976) | | Chief Compliance Officer, Assistant Secretary and Anti-Money Laundering Officer | | Since July 2016 | | Senior Vice President, Deputy General Counsel, Assistant Secretary and Assistant Clerk, NGAM Distribution Corporation, NGAM Advisors, L.P. and NGAM Distribution, L.P.; formerly, Associate General Counsel, NGAM Distribution, L.P. |
| 1 | Each officer of the Trust serves for an indefinite term in accordance with the Trust’s current by-laws until the date his or her successor is elected and qualified, or until he or she sooner dies, retires, is removed or becomes disqualified. |
| 2 | Each person listed above, except as noted, holds the same position(s) with the Fund Complex. Mr. Fuss is not an officer of the Natixis Funds Trusts. Previous positions during the past five years with NGAM Distribution, L.P., NGAM Advisors, L.P. or Loomis, Sayles & Company, L.P. are omitted, if not materially different from a trustee’s or officer’s current position with such entity. |
| 68
ANNUAL REPORT
September 30, 2016

Loomis Sayles High Income Fund
Loomis Sayles Intermediate Duration Bond Fund
Loomis Sayles Limited Term Government
and Agency Fund

TABLE OF CONTENTS
Portfolio Review page 1
Portfolio of Investments page 20
Financial Statements page 59
Notes to Financial Statements page 73
LOOMIS SAYLES HIGH INCOME FUND
| | |
| Managers | | Symbols |
| Matthew J. Eagan, CFA® | | Class A NEFHX |
| Elaine M. Stokes | | Class C NEHCX |
| Loomis, Sayles & Company, L.P. | | Class Y NEHYX |
Investment Goal
The Fund seeks high current income plus the opportunity for capital appreciation to produce a high total return
Market Conditions
In the beginning of the period, the Federal Reserve (Fed) raised interest rates for the first time since June 2006. This led to modest losses within investment-grade markets and added to an already challenging environment for high yield. After oil prices bottomed in mid-February, capital returned to markets and riskier assets rebounded strongly. Volatility spiked temporarily in June following the U.K. referendum vote to leave the European Union (EU), but conditions were generally calm for the remainder of the period. Fixed-income markets finished the period on a positive note and added to full-year gains.
After declining through mid-February, U.S. high yield became a sought-after asset. The sector rewarded investors by producing strong and steady gains with minimal volatility. Spreads (the difference in yield between non-Treasury and Treasury securities of similar maturity) are trading inside the long-term average, but remain above the lows of 2014. Lower-quality credits and cyclical sectors outperformed during the period as the search for yield presses onward.
Investment-grade corporate bonds also performed well during the one-year period, bouncing back from the lows experienced during the fourth quarter of 2015. The sector’s longer duration (price sensitivity to interest rate changes) was a positive tailwind as longer-maturity yields declined. Overall returns were positive across all sectors, with cyclical sectors and energy performing well during the second half of the period.
For roughly the first half of the period, the U.S. dollar continued to strengthen against most major global currencies. But the Fed struck a more dovish tone early in 2016, and this contributed to a pause in the dollar bull market. A more stable dollar supported currencies —particularly those in the emerging markets — that suffered during the dollar’s ascent. The recovery in oil prices also helped ease the strain on commodity-related currencies.
Performance Results
For the 12 months ended September 30, 2016, Class A shares of Loomis Sayles High Income Fund returned 10.66%. The fund underperformed its benchmark, the Bloomberg Barclays U.S. Corporate High-Yield Bond Index, which returned 12.73%.
Explanation of Fund Performance
High yield industrial securities were top contributors to the fund’s relative performance due to industry and security selection. In particular, basic industry and energy holdings
1 |
performed well. High yield utilities also aided relative return and outperformed duration-matched Treasuries (Treasuries with similar duration, or price sensitivity to interest rate changes). In addition, out-of-benchmark exposure to Yankee (U.S. dollar-denominated bonds issued by a non-U.S. entity) government-related securities lifted performance.
Out-of-benchmark exposure to non-U.S.-dollar-denominated holdings weighed on relative performance. In particular, securities denominated in the Mexican peso detracted, as the peso hit an all-time low versus the U.S. dollar in mid-September. U.S. dollar appreciation relative to foreign currencies challenged some of the fund’s non-U.S.-dollar-denominated holdings during the period. During the period the Fund’s distributions were reduced to reflect the realization of currency losses from certain bond sales and maturities. In addition, our position in convertible securities detracted from results. Despite generating a positive absolute return, the allocation lagged on a relative basis due to a selected holding in the transportation industry. Our cash and reserve positions lagged the strongly rising high yield market in the second half of the period and hindered results. Out-of-benchmark positions in residential mortgage-backed securities (RMBS), asset-backed securities (ABS) and commercial mortgage-backed securities (CMBS) posted positive absolute returns but detracted on a relative basis. An underweight allocation to the lowest-quality high yield bonds also detracted from performance.
Outlook
Our outlook for the U.S. and global economies remains positive, with expectations for better growth momentum through the end of the year. In the U.S., we expect steady gains in employment, increased bank lending and stronger consumer confidence to support Gross Domestic Product (GDP) growth. The global economy is facing more headwinds but should experience modestly stronger growth next year, led by a healthier U.S. economy and still-accommodative global central bank policies.
Inflation expectations remain low. However, U.S. inflation is showing signs of acceleration and recent economic data have been favorable. We think the Fed is likely to raise rates in December if market conditions remain stable.
Oil prices are likely to be range-bound over the short term as elevated supply should be countered by OPEC’s expected production cut in November. We remain constructive on intermediate- to longer-term oil prices and expect that supply and demand will adjust.
We expect low global yields to continue supporting flows into U.S. credit, but at a more modest pace. In this environment, we intend to maintain a yield cushion in our portfolios through exposure to corporate bonds. Credit fundamentals have been stable, reflecting a slowly improving U.S. economy. However, downside risks — including slowing profit growth, rising leverage and free cash flow approaching peak levels — are increasing as we move further into the late stage of the credit cycle.1 Despite these risks, we believe the current phase of the credit cycle can continue for some time, and we do not expect a significant increase in corporate defaults in 2017.
Within credit, we favor the investment-grade financials, technology and energy sectors. We are also biased to higher-quality high yield. Convertible bonds continue to look attractive, and our focus has shifted from equity-sensitive convertibles to more balanced and credit-sensitive issues. We believe these securities offer yield and upside potential with more limited downside risk.
| 2
LOOMIS SAYLES HIGH INCOME FUND
The Fed’s slow and cautious approach has helped keep the U.S. dollar range-bound against major currencies. Over the long term, improving global growth and further stability in commodities could support non-U.S.-dollar-denominated bonds. We are beginning to see more divergence in emerging market country fundamentals and political backdrops, which could expand potential relative value opportunities. We intend to maintain our current positions, which we believe represent long-term value, but are cautious on further exposure until we get better clarity on some of these evolving macro trends.
Risks include growing geopolitical risks, a prolonged period of low economic growth, declining corporate profit expectations and a shift to downturn in the U.S. credit cycle. Looking ahead, we remain focused on careful security selection using fundamental credit analysis. We intend to build on our key investment themes of yield and diversification, using our reserve allocation during periods of extreme short-term market dislocation to potentially add long-term value.
Since early 2015, monthly or quarterly ordinary income distributions for certain Loomis Sayles-managed fixed-income funds have been below historic averages. This is primarily due to the impact of foreign currency losses. Fund officers have analyzed the fund’s current portfolio of investments, schedule of maturities and the corresponding amounts of unrealized currency losses that may become realized in the fiscal year ending on September 30, 2017. Based on this analysis, fund officers believe that realized currency losses may have a less significant impact on this fund’s distributions in the 2017 fiscal year. As a result, the distribution amount may improve going forward. This analysis is based on certain assumptions, including but not limited to the level of foreign currency exchange rates, security prices, interest rates and the net asset level of the fund. Changes to these assumptions could impact the analysis and the amounts of future fund distributions.
| 1 | A credit cycle is a cyclical pattern that follows credit availability and corporate health. |
Hypothetical Growth of $10,000 Investment in Class A Shares4
September 30, 2006 through September 30, 2016
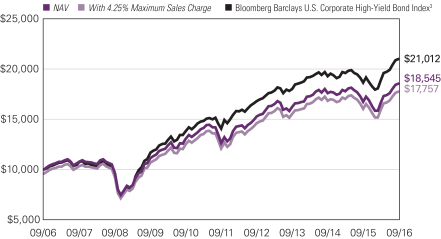
3 |
Average Annual Total Returns — September 30, 20164
| | | | | | | | | | | | | | | | | | | | |
| | | | | |
| | | | | | | | | | | | Expense Ratio5 | |
| | | 1 Year | | | 5 Years | | | 10 Years | | | Gross | | | Net | |
| | | | | | |
| Class A (Inception 2/22/84) | | | | | | | | | | | | | | | | | | | | |
| NAV | | | 10.66 | % | | | 7.98 | % | | | 6.37 | % | | | 1.13 | % | | | 1.10 | % |
| With 4.25% Maximum Sales Charge | | | 5.88 | | | | 7.03 | | | | 5.90 | | | | | | | | | |
| | | | | | |
| Class C (Inception 3/2/98) | | | | | | | | | | | | | | | | | | | | |
| NAV | | | 9.81 | | | | 7.16 | | | | 5.58 | | | | 1.88 | % | | | 1.85 | % |
| With CDSC2 | | | 8.81 | | | | 7.16 | | | | 5.58 | | | | | | | | | |
| | | | | | |
| Class Y (Inception 2/29/08)1 | | | | | | | | | | | | | | | | | | | | |
| NAV | | | 10.98 | | | | 8.22 | | | | 6.59 | | | | 0.88 | % | | | 0.85 | % |
| | | | | | |
| Comparative Performance | | | | | | | | | | | | | | | | | | | | |
| Bloomberg Barclays U.S. Corporate High-Yield Bond Index3 | | | 12.73 | | | | 8.34 | | | | 7.71 | | | | | | | | | |
Performance data shown represents past performance and is no guarantee of, and not necessarily indicative of, future results. Total return and value will vary, and you may have a gain or loss when shares are sold. Current performance may be lower or higher than quoted. For most recent month-end performance, visit ngam.natixis.com. Performance for other share classes will be greater or less than shown based on differences in fees and sales charges. You may not invest directly in an index. Performance for periods less than one year is cumulative, not annualized. Returns reflect changes in share price and reinvestment of dividends and capital gains, if any. The table(s) do not reflect taxes shareholders might we on any fund distributions or when they redeem their shares.
| 1 | Prior to the inception of Class Y shares (2/29/08), performance is that of Class A shares, restated to reflect the higher net expenses of that share class. |
| 2 | Class C shares performance assumes a 1% CDSC applied when you sell shares within one year of purchase. |
| 3 | Bloomberg Barclays U.S. Corporate High-Yield Bond Index is an unmanaged index that covers the U.S. dollar-denominated, non-investment grade, fixed-rate, taxable corporate bond market. |
| 4 | Fund performance has been increased by fee waivers and/or expense reimbursements, if any, without which performance would have been lower. |
| 5 | As of the most recent prospectus, the investment advisor has contractually agreed to waive fees and/or reimburse expenses (with certain exceptions) once the expense cap of the Fund has been exceeded. This arrangement is set to expire on 1/31/17. When an expense cap has not been exceeded, the Fund may have similar expense ratios. |
| 4
LOOMIS SAYLES INTERMEDIATE DURATION BOND FUND
| | |
| Managers | | Symbols |
| Christopher T. Harms | | Class A LSDRX |
| Clifton V. Rowe, CFA® | | Class C LSCDX |
| Kurt L. Wagner, CFA®, CIC | | Class Y LSDIX |
Investment Goal
The Fund’s investment objective is above-average total return through a combination of current income and capital appreciation.
Market Conditions
Investment-grade corporate bonds performed well during the one-year period, bouncing back from the lows experienced during the fourth quarter of 2015. The sector’s longer duration (greater price sensitivity to interest rate changes) was a positive tailwind, as longer-maturity yields declined. Overall returns were positive across all sectors, with cyclical sectors and energy performing well during the second half of the period.
Yields on securitized assets generally followed U.S. Treasury yields lower, resulting in a positive total return for the sector. The Federal Reserve (the Fed) still owns $1.7 trillion worth of mortgage-backed securities (MBS) and remains a powerful force in that market as principal payments from matured securities are reinvested.
At the start of the first quarter, the Fed projected four rate hikes during 2016. Yet as of September 30, there had been no increases and markets anticipated only one 25 basis point hike before year-end. The Fed consistently lowered economic projections throughout 2016, which removed some of the upward pressure on U.S. Treasury yields.
Performance Results
For the 12 months ended September 30, 2016, Class A shares of Loomis Sayles Intermediate Duration Bond Fund returned 3.64%. The fund outperformed its benchmark, the Bloomberg Barclays U.S. Intermediate Government/Credit Bond Index, which returned 3.52%.
Explanation of Fund Performance
Overall, the fund’s investment-grade holdings generated positive absolute and relative return during the period. Within the space, the industrial and financial sectors contributed the most on a relative basis, primarily due to security selection. Specifically, energy and banking names aided results. In addition, the fund’s exposure to non-agency securitized credit contributed to absolute return and had a significant impact on relative performance. In particular, commercial mortgage-backed securities (CMBS) added to returns. We continued to focus on top-tranche, super-senior CMBS, finding opportunities among seasoned and new issues. Asset-backed securities (ABS) also benefited relative results, as we remained focused on low-risk, high-quality issues. Elsewhere, a meaningful underweight to U.S. Treasuries contributed to returns.
Though our overall exposure to investment-grade industrials lifted absolute and relative results, the fund’s underweight position in the sector hampered relative performance.
5 |
Similarly, government-related securities contributed to relative performance, but the fund’s underweight position in the sector weighed slightly on results. Elsewhere, security selection among agency collateralized mortgage obligations (CMOs) and agency CMBS detracted modestly from relative performance.
Outlook
We believe one Fed rate hike in the next year is probable, with December being the earliest possibility. However, the Fed may delay the hike until the first half of 2017. We expect global quantitative easing and accommodative monetary policy to anchor yields, which is why we expect to maintain underweight positions in lower-yielding government bonds, favoring spread product (non-Treasury securities) instead.
The fund has a modest overweight position to credit, but we have reduced credit beta (a measure of co-movement of portfolio returns to changes in the market return). We remain focused on security selection, buying new issues with concessions and secondary bonds that offer strong risk-return opportunities. We are also maintaining an overweight to CMBS, particularly senior bonds, and view the sector as an attractive alternative to government markets.
We believe MBS valuations appear full and do not fully compensate for prepayment risk. Accordingly, we are focusing on securities with limited prepayment risk. We also believe the high-quality ABS sector remains attractive relative to government bonds, and we are maintaining our exposure to senior and subordinate debt of prime and subprime issuers.
Overall, we continue to pursue a yield advantage relative to the benchmark. We are monitoring our portfolio and holdings in an effort to avoid undue exposures to macroeconomic events, and we continue to evaluate market events and trading levels for potential opportunities.
Hypothetical Growth of $10,000 Investment in Class A Shares1,4,5
September 30, 2006 through September 30, 2016
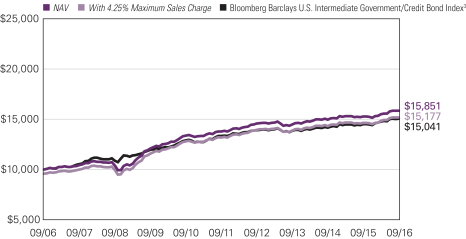
See notes to chart on page 7.
| 6
LOOMIS SAYLES INTERMEDIATE DURATION BOND FUND
Average Annual Total Returns — September 30, 20164,5
| | | | | | | | | | | | | | | | | | | | |
| | | | | |
| | | | | | | | | | | | Expense Ratio6 | |
| | | 1 Year | | | 5 Years | | | 10 Years | | | Gross | | | Net | |
| | | | | | |
| Class A (Inception 1/28/98)1 | | | | | | | | | | | | | | | | | | | | |
| NAV | | | 3.64 | % | | | 2.84 | % | | | 4.71 | % | | | 0.71 | % | | | 0.65 | % |
| With 4.25% Maximum Sales Charge | | | -0.75 | | | | 1.94 | | | | 4.25 | | | | | | | | | |
| | | | | | |
| Class C (Inception 8/31/16)1 | | | | | | | | | | | | | | | | | | | | |
| NAV | | | 2.98 | | | | 2.00 | | | | 3.75 | | | | 1.47 | | | | 1.40 | |
| With CDSC2 | | | 1.98 | | | | 2.00 | | | | 3.75 | | | | | | | | | |
| | | | | | |
| Class Y (Inception 5/28/10)1 | | | | | | | | | | | | | | | | | | | | |
| NAV | | | 3.90 | | | | 3.11 | | | | 4.98 | | | | 0.47 | | | | 0.40 | |
| | | | | | |
| Comparative Performance | | | | | | | | | | | | | | | | | | | | |
| Bloomberg Barclays U.S. Intermediate Government/Credit Bond Index3 | | | 3.52 | | | | 2.45 | | | | 4.17 | | | | | | | | | |
Performance data shown represents past performance and is no guarantee of, and not necessarily indicative of, future results. Total return and value will vary, and you may have a gain or loss when shares are sold. Current performance may be lower or higher than quoted. For most recent month-end performance, visit ngam.natixis.com. Performance for other share classes will be greater or less than shown based on differences in fees and sales charges. You may not invest directly in an index. Performance for periods less than one year is cumulative, not annualized. Returns reflect changes in share price and reinvestment of dividends and capital gains, if any. The table(s) do not reflect taxes shareholders might we on any fund distributions or when they redeem their shares.
| 1 | Effective August 31, 2016, the Fund’s Retail Class shares and Institutional Class shares were redesignated as Class A shares and Class Y shares, respectively. Accordingly, the returns shown in the table for Class A shares prior to August 31, 2016 are those of Retail Class shares, restated to reflect the sales loads of Class A shares, and the returns in the table for Class Y shares prior to August 31, 2016 are those of Institutional Class shares. Prior to the inception of Retail Class shares (May 28, 2010), performance is that of Institutional Class shares, restated to reflect the higher net expenses and sales loads of Class A shares. Prior to the inception of Class C shares (August 31, 2016), performance is that of Retail Class shares, restated to reflect the higher net expenses and sales loads of Class C shares. |
| 2 | Class C shares performance assumes a 1% CDSC applied when you sell shares within one year of purchase. |
| 3 | Bloomberg Barclays U.S. Intermediate Government/Credit Bond Index is an unmanaged index that includes U.S. Treasuries, government-related issues, and investment grade U.S. corporate securities with remaining maturities of one to ten years. |
| 4 | The Fund revised its investment strategy on May 28, 2010; performance may have been different had the current investment strategy been in place for all periods shown. |
| 5 | Fund performance has been increased by fee waivers and/or expense reimbursements, if any, without which performance would have been lower. |
| 6 | As of the most recent prospectus, the investment advisor has contractually agreed to waive fees and/or reimburse expenses (with certain exceptions) once the expense cap of the Fund has been exceeded. This arrangement is set to expire on 1/31/18. When an expense cap has not been exceeded, the Fund may have similar expense ratios. |
7 |
LOOMIS SAYLES LIMITED TERM GOVERNMENT AND AGENCY FUND
| | |
| Managers | | Symbols |
| Christopher T. Harms | | Class A NEFLX |
| Clifton V. Rowe, CFA® | | Class C NECLX |
| Kurt L. Wagner, CFA®, CIC | | Class Y NELYX |
| Loomis, Sayles & Company, L.P. | | |
Investment Goal
The Fund seeks a high current return consistent with preservation of capital.
Market Conditions
In December 2015, the Federal Reserve (the Fed) raised interest rates for the first time since June 2006. This led to modest short-term losses within investment-grade markets and added to an already challenging environment for high yield. After oil prices bottomed in mid-February, capital returned to the financial markets, and riskier assets rebounded strongly. Volatility spiked temporarily in June, following the U.K. referendum vote to leave the European Union (Brexit), but conditions generally remained calm for the rest of the period. Fixed-income markets ended September with positive 12-month returns.
Early in 2016, the Fed projected it would implement four rate hikes during the year. Yet, as of September 30, the federal funds rate target remained unchanged, and financial markets anticipated only one 25 basis point hike before year-end. The Fed consistently lowered economic projections throughout 2016, which removed some of the upward pressure on U.S. Treasury yields. Yields on securitized assets generally followed U.S. Treasury yields lower, resulting in a positive total return for the sector. The Fed still owns $1.7 trillion worth of mortgage-backed securities (MBS) and remains a powerful force in the mortgage market, reinvesting principal payments from matured securities.
Performance Results
For the 12 months ended September 30, 2016, Class A shares of the Loomis Sayles Limited Term Government and Agency Fund returned 0.93%. The Fund underperformed its benchmark, the Bloomberg Barclays U.S. 1-5 Year Government Bond Index, which returned 1.52%.
Explanation of Fund Performance
Duration (price sensitivity to interest rate changes) and yield curve (a curve that shows the relationship among bond yields across the maturity spectrum) positioning were the largest detractors from relative performance. The yield curve flattened during the period, which weighed on results given the fund’s shorter-than-benchmark duration. Exposure to agency collateralized-mortgage obligations (CMOs) had a muted effect on relative performance, as these securities narrowly lagged duration-matched Treasuries (Treasuries with similar duration, or price sensitivity to interest rate changes). However, agency CMOs contributed to the fund’s absolute return.
| 8
LOOMIS SAYLES LIMITED TERM GOVERNMENT AND AGENCY FUND
We maintained a large allocation (in terms of market value) to agency MBS during the period, and these securities were the largest contributors to the fund’s performance. In addition, the fund’s allocation to agency and non-agency commercial mortgage-backed securities (CMBS) also generated positive absolute and relative returns. These bonds considerably outperformed Treasuries on a duration-adjusted basis, which considers a security’s return compared to similar duration Treasuries. Out-of-benchmark exposure to asset-backed securities (ABS) also aided performance, as selected car loans performed particularly well.
Outlook
Agency MBS spreads (the difference in yield between agency MBS and Treasuries of similar maturity) remain narrow relative to history. Additionally, refinancing risk is beginning to increase, as mortgages issued in recent years are of relatively high quality compared with those issued in earlier years. Therefore, we prefer to underweight recently issued 30-year MBS, favoring sectors with less refinance risk, such as low-loan balance mortgages and home equity conversion mortgages. Within the commercial real estate sector, top-tier assets and markets have generally recovered and are at or above prior peak levels. We believe investment grade CMBS remain attractive. We also believe ABS currently offer an attractive combination of strong credit quality and enhanced yield. We favor buying higher-yielding securities and bonds of less-frequent issuers. Our analysis indicates the credit risk of these securities is inefficiently priced, and they offer attractive opportunities for additional yield.
Hypothetical Growth of $10,000 Investment in Class A Shares3
September 30, 2006 through September 30, 2016
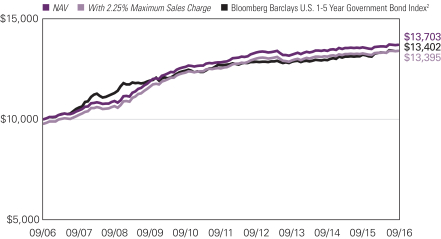
9 |
Average Annual Total Returns — September 30, 20163
| | | | | | | | | | | | | | | | | | | | |
| | | | | |
| | | | | | | | | | | | Expense Ratio4 | |
| | | 1 Year | | | 5 Years | | | 10 Years | | | Gross | | | Net | |
| | | | | | |
| Class A (Inception 1/3/89) | | | | | | | | | | | | | | | | | | | | |
| NAV | | | 0.93 | % | | | 1.34 | % | | | 3.20 | % | | | 0.77 | % | | | 0.77 | % |
| With 2.25% Maximum Sales Charge | | | -1.37 | | | | 0.89 | | | | 2.96 | | | | | | | | | |
| | | | | | |
| Class C (Inception 12/30/94) | | | | | | | | | | | | | | | | | | | | |
| NAV | | | 0.18 | | | | 0.59 | | | | 2.43 | | | | 1.53 | | | | 1.53 | |
| With CDSC1 | | | -0.81 | | | | 0.59 | | | | 2.43 | | | | | | | | | |
| | | | | | |
| Class Y (Inception 3/31/94) | | | | | | | | | | | | | | | | | | | | |
| NAV | | | 1.19 | | | | 1.60 | | | | 3.47 | | | | 0.52 | | | | 0.52 | |
| | | | | | |
| Comparative Performance | | | | | | | | | | | | | | | | | | | | |
| Bloomberg Barclays U.S. 1-5 Year Government Bond Index2 | | | 1.52 | | | | 1.11 | | | | 2.97 | | | | | | | | | |
Performance data shown represents past performance and is no guarantee of, and not necessarily indicative of, future results. Total return and value will vary, and you may have a gain or loss when shares are sold. Current performance may be lower or higher than quoted. For most recent month-end performance, visit ngam.natixis.com. Performance for other share classes will be greater or less than shown based on differences in fees and sales charges. You may not invest directly in an index. Performance for periods less than one year is cumulative, not annualized. Returns reflect changes in share price and reinvestment of dividends and capital gains, if any. The table(s) do not reflect taxes shareholders might we on any fund distributions or when they redeem their shares.
| 1 | Class C shares performance assumes a 1% CDSC applied when you sell shares within one year of purchase. |
| 2 | Bloomberg Barclays U.S. 1-5 Year Government Bond Index is an unmanaged index that includes U.S. Treasury and agency securities with remaining maturities of one to five years. |
| 3 | Fund performance has been increased by fee waivers and/or expense reimbursements, if any, without which performance would have been lower. |
| 4 | As of the most recent prospectus, the investment advisor has contractually agreed to waive fees and/or reimburse expenses (with certain exceptions) once the expense cap of the Fund has been exceeded. This arrangement is set to expire on 1/31/17. When an expense cap has not been exceeded, the Fund may have similar expense ratios. |
1623923.1.1
| 10
ADDITIONAL INFORMATION
The views expressed in this report reflect those of the portfolio managers as of the dates indicated. The managers’ views are subject to change at any time without notice based on changes in market or other conditions. References to specific securities or industries should not be regarded as investment advice. Because the Funds are actively managed, there is no assurance that they will continue to invest in the securities or industries mentioned.
All investing involves risk, including the risk of loss. There is no assurance that any investment will meet its performance objectives or that losses will be avoided.
ADDITIONAL INDEX INFORMATION
This document may contain references to third party copyrights, indexes, and trademarks, each of which is the property of its respective owner. Such owner is not affiliated with Natixis Global Asset Management or any of its related or affiliated companies (collectively “NGAM”) and does not sponsor, endorse or participate in the provision of any NGAM services, funds or other financial products.
The index information contained herein is derived from third parties and is provided on an “as is” basis. The user of this information assumes the entire risk of use of this information. Each of the third party entities involved in compiling, computing or creating index information disclaims all warranties (including, without limitation, any warranties of originality, accuracy, completeness, timeliness, non-infringement, merchantability and fitness for a particular purpose) with respect to such information.
PROXY VOTING INFORMATION
A description of the Natixis Funds’ proxy voting policies and procedures is available without charge, upon request, by calling Natixis Funds at 800-225-5478; on the funds’ website at ngam.natixis.com; and on the Securities and Exchange Commission’s (“SEC’s”) website at www.sec.gov. Information regarding how the funds voted proxies relating to portfolio securities the most recent 12-month period ended June 30 is available from the funds’ website and the SEC’s website.
QUARTERLY PORTFOLIO SCHEDULES
The Natixis Funds file complete schedules of portfolio holdings with the SEC for the first and third quarters of each fiscal year on Form N-Q. The Funds’ Forms N-Q are available on the SEC’s website at www.sec.gov and may be reviewed and copied at the SEC’s Public Reference Room in Washington, DC. Information on the operation of the Public Reference Room may be obtained by calling 800-SEC-0330.
11 |
UNDERSTANDING FUND EXPENSES
As a mutual fund shareholder, you incur different costs: transaction costs, including sales charges (loads) on purchases and contingent deferred sales charges on redemptions, and ongoing costs, including management fees, distribution and/or service fees (12b-1 fees), and other fund expenses. Certain exemptions may apply. Certain exemptions may apply. These costs are described in more detail in the Funds’ prospectuses. The following examples are intended to help you understand the ongoing costs of investing in the Funds and help you compare these with the ongoing costs of investing in other mutual funds.
The first line in the table of each class of Fund shares shows the actual account values and actual fund expenses you would have paid on a $1,000 investment in the Fund from April 1, 2016 through September 30, 2016. To estimate the expenses you paid over the period, simply divide your account value by $1,000 (for example $8,600 account value divided by $1,000 = 8.60) and multiply the result by the number in the Expenses Paid During Period column as shown below for your class.
The second line in the table of each class of fund shares provides information about hypothetical account values and hypothetical expenses based on the Fund’s actual expense ratios and an assumed rate of return of 5% per year before expenses, which is not the Fund’s actual return. The hypothetical account values and expenses may not be used to estimate the actual ending account balance or expenses you paid on your investment for the period. You may use this information to compare the ongoing costs of investing in the Fund to other funds. To do so, compare this 5% hypothetical example with the 5% hypothetical examples that appear in the shareholder reports of the other funds.
Please note that the expenses shown reflect ongoing costs only, and do not include any transaction costs such as sales charges. Therefore, the second line in the table of each fund is useful in comparing ongoing costs only, and will not help you determine the relative costs of owning different funds. If transaction costs were included, total costs would be higher.
| 12
| | | | | | | | | | | | |
| LOOMIS SAYLES HIGH INCOME FUND | | BEGINNING
ACCOUNT VALUE
4/1/2016 | | | ENDING
ACCOUNT VALUE
9/30/2016 | | | EXPENSES PAID
DURING PERIOD*
4/1/2016 – 9/30/2016 | |
| Class A | | | | | | | | | | | | |
| Actual | | | $1,000.00 | | | | $1,113.30 | | | | $5.81 | |
| Hypothetical (5% return before expenses) | | | $1,000.00 | | | | $1,019.50 | | | | $5.55 | |
| Class C | | | | | | | | | | | | |
| Actual | | | $1,000.00 | | | | $1,108.90 | | | | $9.75 | |
| Hypothetical (5% return before expenses) | | | $1,000.00 | | | | $1,015.75 | | | | $9.32 | |
| Class Y | | | | | | | | | | | | |
| Actual | | | $1,000.00 | | | | $1,115.00 | | | | $4.49 | |
| Hypothetical (5% return before expenses) | | | $1,000.00 | | | | $1,020.75 | | | | $4.29 | |
| * | Expenses are equal to the Fund’s annualized expense ratio (after waiver/reimbursement): 1.10%, 1.85% and 0.85% for Class A, C and Y, respectively, multiplied by the average account value over the period, multiplied by the number of days in the most recent fiscal half-year (183), divided by 366 (to reflect the half-year period). |
| | | | | | | | | | | | |
LOOMIS SAYLES INTERMEDIATE
DURATION BOND FUND | | BEGINNING
ACCOUNT VALUE
4/1/2016 | | | ENDING
ACCOUNT VALUE
9/30/2016 | | | EXPENSES PAID
DURING PERIOD
4/1/2016 – 9/30/2016 | |
| Class A | | | | | | | | | | | | |
| Actual | | | $1,000.00 | | | | $1,023.00 | | | | $3.29 | 1 |
| Hypothetical (5% return before expenses) | | | $1,000.00 | | | | $1,021.75 | | | | $3.29 | * |
| Class C | | | | | | | | | | | | |
| Actual | | | $1,000.00 | | | | $1,000.80 | | | | $1.15 | 2 |
| Hypothetical (5% return before expenses) | | | $1,000.00 | | | | $1,018.00 | | | | $7.06 | * |
| Class Y | | | | | | | | | | | | |
| Actual | | | $1,000.00 | | | | $1,024.30 | | | | $2.02 | 1 |
| Hypothetical (5% return before expenses) | | | $1,000.00 | | | | $1,023.00 | | | | $2.02 | * |
| * | Hypothetical expenses are equal to the Fund’s annualized expense ratio (after waiver/reimbursement): 0.65%, 1.40% and 0.40% for Class A, C and Y respectively, multiplied by the average account value over the period, multiplied by the number of days in the most recent fiscal half-year (183), divided by 366 (to reflect the half-year period). |
| 1 | Actual expenses for Class A and Y are equal to the Fund’s annualized expense ratio (after waiver/reimbursement): 0.65% and 0.40%, respectively, multiplied by the average account value over the period, multiplied by the number of days in the most recent fiscal half-year (183), divided by 366 (to reflect the half-year period). |
| 2 | Class C commenced operations on August 31, 2016. Actual expenses are equal to the Fund’s annualized expense ratio (after waiver/reimbursement): 1.40%, multiplied by the average account value over the period, multiplied by the number of days in the most recent fiscal period (30), divided by 366 (to reflect the partial period). |
13 |
| | | | | | | | | | | | |
LOOMIS SAYLES LIMITED TERM
GOVERNMENT AND AGENCY FUND | | BEGINNING
ACCOUNT VALUE
4/1/2016 | | | ENDING
ACCOUNT VALUE
9/30/2016 | | | EXPENSES PAID
DURING PERIOD*
4/1/2016 – 9/30/2016 | |
| Class A | | | | | | | | | | | | |
| Actual | | | $1,000.00 | | | | $1,006.40 | | | | $3.91 | |
| Hypothetical (5% return before expenses) | | | $1,000.00 | | | | $1,021.10 | | | | $3.94 | |
| Class C | | | | | | | | | | | | |
| Actual | | | $1,000.00 | | | | $1,002.60 | | | | $7.66 | |
| Hypothetical (5% return before expenses) | | | $1,000.00 | | | | $1,017.35 | | | | $7.72 | |
| Class Y | | | | | | | | | | | | |
| Actual | | | $1,000.00 | | | | $1,007.60 | | | | $2.66 | |
| Hypothetical (5% return before expenses) | | | $1,000.00 | | | | $1,022.35 | | | | $2.68 | |
| * | Expenses are equal to the Fund’s annualized expense ratio: 0.78%, 1.53% and 0.53% for Class A, C and Y, respectively, multiplied by the average account value over the period, multiplied by the number of days in the most recent fiscal half-year (183), divided by 366 (to reflect the half-year period). |
| 14
BOARD APPROVAL OF THE EXISTING ADVISORY AGREEMENTS
The Board of Trustees of the Trusts (the “Board”), including the Independent Trustees, considers matters bearing on each Fund’s advisory agreement (collectively, the “Agreements”) at most of its meetings throughout the year. Each year, usually in the spring, the Contract Review Committee of the Board meets to review the Agreements to determine whether to recommend that the full Board approve the continuation of the Agreements, typically for an additional one-year period. After the Committee has made its recommendation, the full Board, including the Independent Trustees, determines whether to approve the continuation of the Agreements.
In connection with these meetings, the Trustees receive materials that the Funds’ investment adviser (the “Adviser”) believes to be reasonably necessary for the Trustees to evaluate the Agreements. These materials generally include, among other items, (i) information on the investment performance of the Funds and the performance of peer groups of funds and the Funds’ performance benchmarks, (ii) information on the Funds’ advisory fees and other expenses, including information comparing the Funds’ expenses to the fees charged to institutional accounts with similar strategies managed by the Adviser, if any, and to those of peer groups of funds and information about any applicable expense caps and/or fee “breakpoints,” (iii) sales and redemption data in respect of the Funds, (iv) information about the profitability of the Agreements to the Adviser and (v) information obtained through the completion by the Adviser of a questionnaire distributed on behalf of the Trustees. The Board, including the Independent Trustees, also considers other matters such as (i) the Adviser’s financial results and financial condition, (ii) each Fund’s investment objective and strategies and the size, education and experience of the Adviser’s investment staff and its use of technology, external research and trading cost measurement tools, (iii) arrangements in respect of the distribution of the Funds’ shares and the related costs, (iv) the procedures employed to determine the value of the Funds’ assets, (v) the allocation of the Funds’ brokerage, if any, including, if applicable, allocations to brokers affiliated with the Adviser and the use of “soft” commission dollars to pay Fund expenses and to pay for research and other similar services, (vi) the resources devoted to, and the record of compliance with, the Funds’ investment policies and restrictions, policies on personal securities transactions and other compliance policies, (vii) information about amounts invested by the Funds’ portfolio managers in the Funds or in similar accounts that they manage and (viii) the general economic outlook with particular emphasis on the mutual fund industry. Throughout the process, the Trustees are afforded the opportunity to ask questions of and request additional materials from the Adviser.
In addition to the materials requested by the Trustees in connection with their annual consideration of the continuation of the Agreements, the Trustees receive materials in advance of each regular quarterly meeting of the Board that provide detailed information about the Funds’ investment performance and the fees charged to the Funds for advisory and other services. This information generally includes, among other things, an internal performance rating for each Fund based on agreed-upon criteria, graphs showing each Fund’s performance and fee differentials against each Fund’s peer group/category, performance ratings provided by a third-party, total return information for various periods,
15 |
and third-party performance rankings for various periods comparing a Fund against similarly categorized funds. The portfolio management team for each Fund or other representatives of the Adviser make periodic presentations to the Contract Review Committee and/or the full Board, and Funds identified as presenting possible performance concerns may be subject to more frequent board presentations and reviews. In addition, each quarter the Trustees are provided with detailed statistical information about each Fund’s portfolio. The Trustees also receive periodic updates between meetings.
The Board most recently approved the continuation of the Agreements at its meeting held in June 2016. The Agreements were continued for a one-year period for the Funds. In considering whether to approve the continuation of the Agreements, the Board, including the Independent Trustees, did not identify any single factor as determinative. Individual Trustees may have evaluated the information presented differently from one another, giving different weights to various factors. Matters considered by the Trustees, including the Independent Trustees, in connection with their approval of the Agreements included, but were not limited to, the factors listed below.
The nature, extent and quality of the services provided to the Funds under the Agreements. The Trustees considered the nature, extent and quality of the services provided by the Adviser and its affiliates to the Funds and the resources dedicated to the Funds by the Adviser and its affiliates.
The Trustees considered not only the advisory services provided by the Adviser to the Funds, but also the monitoring and oversight services provided by NGAM Advisors, L.P. (“NGAM Advisors”). They also considered the administrative services provided by NGAM Advisors and its affiliates to the Funds.
For each Fund, the Trustees also considered the benefits to shareholders of investing in a mutual fund that is part of a family of funds that offers shareholders the right to exchange shares of one type of fund for shares of another type of fund, and provides a variety of fund and shareholder services.
After reviewing these and related factors, the Trustees concluded, within the context of their overall conclusions regarding each of the Agreements, that the nature, extent and quality of services provided supported the renewal of the Agreements.
Investment performance of the Funds and the Adviser. As noted above, the Trustees received information about the performance of the Funds over various time periods, including information that compared the performance of the Funds to the performance of peer groups and categories of funds and the Funds’ respective performance benchmarks. In addition, the Trustees also reviewed data prepared by an independent third party that analyzed the performance of the Funds using a variety of performance metrics, including metrics that also measured the performance of the Funds on a risk adjusted basis.
With respect to each Fund, the Board concluded that the Fund’s performance or other relevant factors supported the renewal of the Agreement relating to that Fund. In the case of each fund that had performance that lagged that of a relevant peer group median and/or category median for certain (although not necessarily all) periods, the Board concluded that other factors relevant to performance supported renewal of the Agreements. These factors included one or more of the following: (1) that the underperformance was attributable, to a significant extent, to investment decisions by the Adviser that were reasonable and
| 16
consistent with the Fund’s investment objective and policies; (2) that the Fund’s more recent performance, although lagging in certain periods, had shown improvement relative to its category; (3) that the Fund’s more recent performance was competitive when compared to relevant performance benchmarks and/or peer groups; and (4) that the Fund’s performance, although lagging the performance of its category for certain periods, was competitive when compared to relevant benchmarks or peer groups.
The Trustees also considered the Adviser’s performance and reputation generally, the performance of the fund family generally, and the historical responsiveness of the Adviser to Trustee concerns about performance and the willingness of the Adviser to take steps intended to improve performance.
After reviewing these and related factors, the Trustees concluded, within the context of their overall conclusions regarding each of the Agreements, that the performance of the Funds and the Adviser and/or other relevant factors supported the renewal of the Agreements.
The costs of the services to be provided and profits to be realized by the Adviser and its affiliates from their respective relationships with the Funds. The Trustees considered the fees charged to the Funds for advisory services as well as the total expense levels of the Funds. This information included comparisons (provided both by management and also by an independent third party) of the Funds’ advisory fees and total expense levels to those of their peer groups and information about the advisory fees charged by the Adviser to comparable accounts (such as institutional separate accounts), as well as information about differences in such fees and the reasons for any such differences. In considering the fees charged to comparable accounts, the Trustees considered, among other things, management’s representations about the differences between managing mutual funds as compared to other types of accounts, including the additional resources required to effectively manage mutual fund assets and the greater regulatory costs associated with the management of such assets. In evaluating each fund’s advisory fee, the Trustees also took into account the demands, complexity and quality of the investment management of such Fund, as well as the need for the Adviser to offer competitive compensation and the potential need to expend additional resources to the extent the Funds grow in size. The Trustees considered that over the past several years, management had made recommendations regarding reductions in advisory fee rates, implementation of advisory fee breakpoints and the institution of advisory fee waivers and expense caps for various funds in the fund family. They noted that the Funds in this report have expense caps in place, and they considered the amounts waived or reimbursed by the Adviser for Funds with current expenses above the cap. The Trustees also considered that the Loomis Sayles Limited Term Government and Agency Fund is below the cap.
The Trustees also considered the compensation directly or indirectly received or to be received by the Adviser and its affiliates from their relationships with the Funds. The Trustees reviewed information provided by management as to the profitability of the Adviser’s and its affiliates’ relationships with the Funds, and information about the allocation of expenses used to calculate profitability. They also reviewed information provided by management about the effect of distribution costs and changes in asset levels on Adviser profitability, including information regarding resources spent on distribution activities. When reviewing profitability, the Trustees also considered information about
17 |
court cases in which adviser compensation or profitability were issues and the performance of the relevant Funds, the expense levels of the Funds, whether the Adviser had implemented breakpoints and/or expense caps with respect to such Funds.
After reviewing these and related factors, the Trustees concluded, within the context of their overall conclusions regarding each of the Agreements, that the advisory fee charged to each of the Funds was fair and reasonable, and that the costs of these services generally and the related profitability of the Adviser and its affiliates in respect of their relationships with the Funds supported the renewal of the Agreements.
Economies of Scale. The Trustees considered the existence of any economies of scale in the provision of services by the Adviser and whether those economies are shared with the Funds through breakpoints in their investment advisory fees or other means, such as expense waivers or caps. The Trustees also discussed with management the factors considered with respect to the implementation of breakpoints in investment advisory fees or expense waivers or caps for certain funds. Management explained that a number of factors are taken into account in considering the possible implementation of breakpoints or an expense cap for a fund, including, among other things, factors such as a fund’s assets, the projected growth of a fund, projected profitability and a fund’s fees and performance. With respect to economies of scale, the Trustees noted that each of the Funds was subject to an expense cap or waiver. In considering these issues, the Trustees also took note of the costs of the services provided (both on an absolute and a relative basis) and the profitability to the Adviser and its affiliates of their relationships with the Funds, as discussed above.
After reviewing these and related factors, the Trustees concluded, within the context of their overall conclusions regarding each of the Agreements, that the extent to which economies of scale were shared with the Funds supported the renewal of the Agreements.
The Trustees also considered other factors, which included but were not limited to the following:
| · | | The effect of recent market and economic events on the performance, asset levels and expense ratios of each Fund. |
| · | | Whether each Fund has operated in accordance with its investment objective and the Fund’s record of compliance with its investment restrictions, and the compliance programs of the Funds and the Adviser. They also considered the compliance-related resources the Adviser and its affiliates were providing to the Funds. |
| · | | The nature, quality, cost and extent of administrative and shareholder services performed by the Adviser and its affiliates, both under the Agreements and under separate agreements covering administrative services. |
| · | | So-called “fallout benefits” to the Adviser, such as the engagement of affiliates of the Adviser to provide distribution, administrative and brokerage services to the Funds, and the benefits of research made available to the Adviser by reason of brokerage commissions (if any) generated by the Funds’ securities transactions. The Trustees also considered the benefits to the parent company of NGAM Advisors from the retention of the Adviser. The Trustees considered the possible conflicts of interest associated with these fallout and other benefits, and the reporting, disclosure and other processes in place to disclose and monitor such possible conflicts of interest. |
| 18
| · | | The Trustees’ review and discussion of the Funds’ advisory arrangements in prior years, and management’s record of responding to Trustee concerns raised during the year and in prior years. |
Based on their evaluation of all factors that they deemed to be material, including those factors described above, and assisted by the advice of independent counsel, the Trustees, including the Independent Trustees, concluded that each of the existing Agreements should be continued through June 30, 2017.
19 |
Portfolio of Investments – as of September 30, 2016
Loomis Sayles High Income Fund
| | | | | | | | |
Principal
Amount (‡) | | | Description | | Value (†) | |
| | Bonds and Notes — 88.1% of Net Assets | |
| | Non-Convertible Bonds — 84.9% | |
| | | | ABS Home Equity — 1.9% | |
| $ | 300,000 | | | American Homes 4 Rent, Series 2014-SFR1, Class E, 3.031%, 6/17/2031, 144A(b) | | $ | 294,526 | |
| | 124,523 | | | Banc of America Alternative Loan Trust, Series 2003-8, Class 1CB1, 5.500%, 10/25/2033 | | | 126,959 | |
| | 112,788 | | | Banc of America Funding Corp., Series 2007-4, Class 5A1, 5.500%, 11/25/2034 | | | 111,724 | |
| | 144,445 | | | Banc of America Funding Trust, Series 2005-7, Class 3A1, 5.750%, 11/25/2035 | | | 147,987 | |
| | 216,848 | | | Countrywide Home Loan Mortgage Pass Through Trust, Series 2005-11, Class 4A1, 0.795%, 4/25/2035(b) | | | 170,083 | |
| | 111,499 | | | Countrywide Home Loan Mortgage Pass Through Trust, Series 2005-HYB7, Class 2A, 3.068%, 11/20/2035(b)(j) | | | 98,704 | |
| | 257,929 | | | DSLA Mortgage Loan, Series 2005-AR5, Class 2A1A, 0.861%, 9/19/2045(b) | | | 189,887 | |
| | 250,000 | | | Freddie Mac Structured Agency Credit Risk Debt Notes, Series 2013-DN2, Class M2, 4.775%, 11/25/2023(b) | | | 264,715 | |
| | 305,000 | | | Freddie Mac Structured Agency Credit Risk Debt Notes, Series 2015-DNA1, Class M3, 3.825%, 10/25/2027(b) | | | 317,172 | |
| | 193,906 | | | GMAC Mortgage Corp. Loan Trust, Series 2005-AR4, Class 3A1, 3.558%, 7/19/2035(b) | | | 174,679 | |
| | 73,490 | | | JPMorgan Alternative Loan Trust, Series 2006-A1, Class 5A1, 2.880%, 3/25/2036(b) | | | 52,178 | |
| | 251,332 | | | Lehman Mortgage Trust, Series 2005-3, Class 1A6, 1.025%, 1/25/2036(b) | | | 163,172 | |
| | 347,029 | | | MASTR Adjustable Rate Mortgages Trust, Series 2005-2, Class 3A1, 3.221%, 3/25/2035(b) | | | 296,313 | |
| | 343,311 | | | MASTR Adjustable Rate Mortgages Trust, Series 2005-2, Class 4A1, 2.920%, 3/25/2035(b) | | | 266,022 | |
| | 68,830 | | | New York Mortgage Trust, Series 2006-1, Class 2A2, 3.005%, 5/25/2036(b) | | | 61,601 | |
| | 220,000 | | | Vericrest Opportunity Loan Transferee, Series 2015-NP14, Class A2, 4.875%, 11/27/2045, 144A(b) | | | 211,674 | |
| | 450,053 | | | WaMu Mortgage Pass Through Certificates, Series 2006-AR19, Class 2A, 1.943%, 1/25/2047(b) | | | 402,398 | |
| | | | | | | | |
| | | | | | | 3,349,794 | |
| | | | | | | | |
| | | | ABS Other — 0.4% | |
| | 274,940 | | | AIM Aviation Finance Ltd., Series 2015-1A, Class B1, 5.072%, 2/15/2040, 144A(b) | | | 264,652 | |
| | 62,877 | | | Sierra Receivables Funding Co. LLC, Series 2011-3A, Class C, 9.310%, 7/20/2028, 144A | | | 63,316 | |
| | 450,000 | | | Springleaf Funding Trust, Series 2014-AA, Class C, 4.450%, 12/15/2022, 144A | | | 449,316 | |
| | | | | | | | |
| | | | | | | 777,284 | |
| | | | | | | | |
| | | | Aerospace & Defense — 2.8% | |
| | 210,000 | | | Embraer Netherlands Finance BV, 5.050%, 6/15/2025 | | | 211,050 | |
| | 95,000 | | | Engility Corp., 8.875%, 9/01/2024, 144A | | | 96,188 | |
| | 125,000 | | | Huntington Ingalls Industries, Inc., 5.000%, 12/15/2021, 144A | | | 131,250 | |
| | 115,000 | | | Huntington Ingalls Industries, Inc., 5.000%, 11/15/2025, 144A | | | 121,613 | |
| | 770,000 | | | KLX, Inc., 5.875%, 12/01/2022, 144A | | | 796,950 | |
| | 1,500,000 | | | Meccanica Holdings USA, Inc., 6.250%, 1/15/2040, 144A | | | 1,470,000 | |
| | 900,000 | | | Meccanica Holdings USA, Inc., 7.375%, 7/15/2039, 144A | | | 985,500 | |
See accompanying notes to financial statements.
| 20
Portfolio of Investments – as of September 30, 2016
Loomis Sayles High Income Fund – (continued)
| | | | | | | | |
Principal
Amount (‡) | | | Description | | Value (†) | |
| | | | Aerospace & Defense — continued | |
| $ | 620,000 | | | TransDigm, Inc., 6.000%, 7/15/2022 | | $ | 654,100 | |
| | 515,000 | | | TransDigm, Inc., 6.500%, 7/15/2024 | | | 542,037 | |
| | | | | | | | |
| | | | | | | 5,008,688 | |
| | | | | | | | |
| | | | Airlines — 0.1% | |
| | 83,956 | | | Virgin Australia Pass Through Trust, Series 2013-1B, 6.000%, 4/23/2022, 144A | | | 85,215 | |
| | 119,478 | | | Virgin Australia Pass Through Trust, Series 2013-1C, 7.125%, 10/23/2018, 144A | | | 120,972 | |
| | | | | | | | |
| | | | | | | 206,187 | |
| | | | | | | | |
| | | | Automotive — 1.3% | |
| | 195,000 | | | Allison Transmission, Inc., 5.000%, 10/01/2024, 144A | | | 199,875 | |
| | 115,000 | | | Goodyear Tire & Rubber Co. (The), 5.000%, 5/31/2026 | | | 118,306 | |
| | 240,000 | | | Goodyear Tire & Rubber Co. (The), 5.125%, 11/15/2023 | | | 250,200 | |
| | 700,000 | | | Midas Intermediate Holdco II LLC/Midas Intermediate Holdco II Finance, Inc., 7.875%, 10/01/2022, 144A | | | 712,250 | |
| | 310,000 | | | Nexteer Automotive Group Ltd., 5.875%, 11/15/2021, 144A | | | 328,600 | |
| | 735,000 | | | ZF North America Capital, Inc., 4.750%, 4/29/2025, 144A | | | 771,750 | |
| | | | | | | | |
| | | | | | | 2,380,981 | |
| | | | | | | | |
| | | | Banking — 3.9% | |
| | 1,985,000 | | | Ally Financial, Inc., 4.625%, 3/30/2025 | | | 2,034,625 | |
| | 485,000 | | | Ally Financial, Inc., 5.750%, 11/20/2025 | | | 507,431 | |
| | 1,195,000 | | | Commerzbank AG, 8.125%, 9/19/2023, 144A | | | 1,374,848 | |
| | 470,000 | | | Intesa Sanpaolo SpA, 5.017%, 6/26/2024, 144A | | | 428,906 | |
| | 895,000 | | | Intesa Sanpaolo SpA, 5.710%, 1/15/2026, 144A | | | 843,333 | |
| | 300,000 | | | Royal Bank of Scotland Group PLC, 5.125%, 5/28/2024 | | | 300,318 | |
| | 335,000 | | | Royal Bank of Scotland Group PLC, 6.000%, 12/19/2023 | | | 349,143 | |
| | 1,025,000 | | | Royal Bank of Scotland Group PLC, 6.125%, 12/15/2022 | | | 1,086,104 | |
| | | | | | | | |
| | | | | | | 6,924,708 | |
| | | | | | | | |
| | | | Brokerage — 0.3% | |
| | 535,000 | | | Jefferies Finance LLC/JFIN Co-Issuer Corp., 6.875%, 4/15/2022, 144A | | | 497,550 | |
| | | | | | | | |
| | | | Building Materials — 1.5% | |
| | 890,000 | | | Atrium Windows & Doors, Inc., 7.750%, 5/01/2019, 144A | | | 799,887 | |
| | 350,000 | | | Cemex SAB de CV, 7.750%, 4/16/2026, 144A | | | 388,325 | |
| | 50,000 | | | Masco Corp., 6.500%, 8/15/2032 | | | 55,000 | |
| | 345,000 | | | Masco Corp., 7.750%, 8/01/2029 | | | 412,275 | |
| | 245,000 | | | NCI Building Systems, Inc., 8.250%, 1/15/2023, 144A | | | 266,438 | |
| | 180,000 | | | U.S. Concrete, Inc., 6.375%, 6/01/2024 | | | 186,750 | |
| | 555,000 | | | Vulcan Materials Co., 4.500%, 4/01/2025 | | | 599,400 | |
| | | | | | | | |
| | | | | | | 2,708,075 | |
| | | | | | | | |
| | | | Cable Satellite — 7.2% | |
| | 795,000 | | | Altice Financing S.A., 6.625%, 2/15/2023, 144A | | | 815,869 | |
| | 170,000 | | | Cablevision S.A., 6.500%, 6/15/2021, 144A | | | 177,438 | |
| | 475,000 | | | CCO Holdings LLC/CCO Holdings Capital Corp., 5.125%, 2/15/2023 | | | 495,187 | |
| | 625,000 | | | CCO Holdings LLC/CCO Holdings Capital Corp., 5.125%, 5/01/2023, 144A | | | 652,344 | |
| | 430,000 | | | CCO Holdings LLC/CCO Holdings Capital Corp., 5.250%, 9/30/2022 | | | 449,350 | |
| | 15,000 | | | CCO Holdings LLC/CCO Holdings Capital Corp., 5.750%, 1/15/2024 | | | 15,938 | |
See accompanying notes to financial statements.
21 |
Portfolio of Investments – as of September 30, 2016
Loomis Sayles High Income Fund – (continued)
| | | | | | | | |
Principal
Amount (‡) | | | Description | | Value (†) | |
| | | | Cable Satellite — continued | |
| $ | 865,000 | | | CCO Holdings LLC/CCO Holdings Capital Corp., 5.750%, 2/15/2026, 144A | | $ | 916,900 | |
| | 760,000 | | | CSC Holdings LLC, 5.250%, 6/01/2024 | | | 722,000 | |
| | 75,000 | | | CSC Holdings LLC, 6.750%, 11/15/2021 | | | 79,313 | |
| | 220,000 | | | CSC Holdings LLC, 10.125%, 1/15/2023, 144A | | | 253,550 | |
| | 200,000 | | | CSC Holdings LLC, 10.875%, 10/15/2025, 144A | | | 234,250 | |
| | 895,000 | | | DISH DBS Corp., 5.125%, 5/01/2020 | | | 928,562 | |
| | 1,620,000 | | | DISH DBS Corp., 5.875%, 11/15/2024 | | | 1,599,750 | |
| | 295,000 | | | DISH DBS Corp., 7.750%, 7/01/2026, 144A | | | 313,437 | |
| | 150,000 | | | Sirius XM Radio, Inc., 5.750%, 8/01/2021, 144A | | | 157,050 | |
| | 1,485,000 | | | Unitymedia GmbH, 6.125%, 1/15/2025, 144A | | | 1,557,394 | |
| | 515,000 | | | Unitymedia Hessen GmbH & Co. KG/Unitymedia NRW GmbH, 5.000%, 1/15/2025, 144A | | | 521,437 | |
| | 265,000 | | | Virgin Media Finance PLC, 6.000%, 10/15/2024, 144A | | | 274,278 | |
| | 485,000 | | | Virgin Media Finance PLC, 6.375%, 4/15/2023, 144A | | | 509,250 | |
| | 375,000 | | | Virgin Media Secured Finance PLC, 5.500%, 1/15/2025, 144A | | | 383,437 | |
| | 595,000 | | | Virgin Media Secured Finance PLC, 5.500%, 8/15/2026, 144A | | | 606,900 | |
| | 141,963 | | | Wave Holdco LLC/Wave Holdco Corp., PIK, 8.250%, 7/15/2019, 144A(c) | | | 142,673 | |
| | 840,000 | | | Ziggo Secured Finance BV, 5.500%, 1/15/2027, 144A | | | 838,950 | |
| | | | | | | | |
| | | | | | | 12,645,257 | |
| | | | | | | | |
| | | | Chemicals — 0.8% | |
| | 1,510,000 | | | Hercules, Inc., 6.500%, 6/30/2029 | | | 1,359,000 | |
| | | | | | | | |
| | | | Construction Machinery — 0.5% | |
| | 800,000 | | | United Rentals North America, Inc., 5.750%, 11/15/2024 | | | 830,000 | |
| | | | | | | | |
| | | | Consumer Cyclical Services — 0.9% | |
| | 455,000 | | | Interval Acquisition Corp., 5.625%, 4/15/2023 | | | 469,788 | |
| | 1,095,000 | | | ServiceMaster Co. LLC (The), 7.450%, 8/15/2027 | | | 1,163,985 | |
| | | | | | | | |
| | | | | | | 1,633,773 | |
| | | | | | | | |
| | | | Consumer Products — 0.2% | |
| | 290,000 | | | Avon International Operations, Inc., 7.875%, 8/15/2022, 144A | | | 299,425 | |
| | | | | | | | |
| | | | Electric — 1.7% | |
| | 520,000 | | | AES Corp. (The), 5.500%, 4/15/2025 | | | 534,950 | |
| | 150,000 | | | AES Corp. (The), 6.000%, 5/15/2026 | | | 158,625 | |
| | 1,502,000 | | | Enel SpA, (fixed rate to 9/24/2023, variable rate thereafter), 8.750%, 9/24/2073, 144A | | | 1,755,463 | |
| | 425,000 | | | NRG Energy, Inc., 6.250%, 7/15/2022 | | | 431,375 | |
| | 100,000 | | | NRG Energy, Inc., 6.625%, 3/15/2023 | | | 101,000 | |
| | 8,608 | | | Red Oak Power LLC, Series A, 8.540%, 11/30/2019 | | | 8,619 | |
| | | | | | | | |
| | | | | | | 2,990,032 | |
| | | | | | | | |
| | | | Environmental — 0.3% | |
| | 335,000 | | | GFL Environmental, Inc., 7.875%, 4/01/2020, 144A | | | 353,425 | |
| | 95,000 | | | GFL Environmental, Inc., 9.875%, 2/01/2021, 144A | | | 104,025 | |
| | | | | | | | |
| | | | | | | 457,450 | |
| | | | | | | | |
See accompanying notes to financial statements.
| 22
Portfolio of Investments – as of September 30, 2016
Loomis Sayles High Income Fund – (continued)
| | | | | | | | |
Principal
Amount (‡) | | | Description | | Value (†) | |
| | | | Finance Companies — 5.5% | |
| $ | 740,000 | | | AerCap Ireland Capital Ltd./AerCap Global Aviation Trust, 4.500%, 5/15/2021 | | $ | 774,225 | |
| | 685,000 | | | AerCap Ireland Capital Ltd./AerCap Global Aviation Trust, 5.000%, 10/01/2021 | | | 731,238 | |
| | 515,000 | | | Aircastle Ltd., 5.500%, 2/15/2022 | | | 554,913 | |
| | 600,000 | | | iStar, Inc., 4.000%, 11/01/2017 | | | 601,500 | |
| | 505,000 | | | iStar, Inc., 5.000%, 7/01/2019 | | | 503,677 | |
| | 1,015,000 | | | Ladder Capital Finance Holdings LLLP/Ladder Capital Finance Corp., 5.875%, 8/01/2021, 144A | | | 964,250 | |
| | 585,000 | | | Ladder Capital Finance Holdings LLLP/Ladder Capital Finance Corp., 7.375%, 10/01/2017 | | | 589,388 | |
| | 870,000 | | | Navient Corp., 5.000%, 10/26/2020 | | | 858,037 | |
| | 200,000 | | | Navient Corp., 5.875%, 3/25/2021 | | | 199,250 | |
| | 435,000 | | | Oxford Finance LLC/Oxford Finance Co-Issuer, Inc., 7.250%, 1/15/2018, 144A | | | 434,456 | |
| | 540,000 | | | Provident Funding Associates LP/PFG Finance Corp., 6.750%, 6/15/2021, 144A | | | 544,725 | |
| | 1,335,000 | | | Quicken Loans, Inc., 5.750%, 5/01/2025, 144A | | | 1,324,987 | |
| | 1,110,000 | | | Springleaf Finance Corp., 7.750%, 10/01/2021 | | | 1,164,112 | |
| | 405,000 | | | Unifin Financiera SAB de CV SOFOM ENR, 7.250%, 9/27/2023, 144A | | | 403,481 | |
| | | | | | | | |
| | | | | | | 9,648,239 | |
| | | | | | | | |
| | | | Financial Other — 1.3% | |
| | 565,000 | | | Icahn Enterprises LP/Icahn Enterprises Finance Corp, 6.000%, 8/01/2020 | | | 567,825 | |
| | 695,000 | | | Icahn Enterprises LP/Icahn Enterprises Finance Corp., 4.875%, 3/15/2019 | | | 698,475 | |
| | 180,000 | | | Icahn Enterprises LP/Icahn Enterprises Finance Corp., 5.875%, 2/01/2022 | | | 172,800 | |
| | 804,000 | | | Rialto Holdings LLC/Rialto Corp., 7.000%, 12/01/2018, 144A | | | 816,060 | |
| | | | | | | | |
| | | | | | | 2,255,160 | |
| | | | | | | | |
| | | | Food & Beverage — 1.2% | |
| | 1,800,000 | | | BRF S.A., 7.750%, 5/22/2018, 144A, (BRL) | | | 513,629 | |
| | 840,000 | | | Cosan Luxembourg S.A., 7.000%, 1/20/2027, 144A | | | 876,750 | |
| | 305,000 | | | JBS USA LLC/JBS USA Finance, Inc., 5.750%, 6/15/2025, 144A | | | 299,663 | |
| | 20,000 | | | JBS USA LLC/JBS USA Finance, Inc., 7.250%, 6/01/2021, 144A | | | 20,675 | |
| | 385,000 | | | Marfrig Holdings Europe BV, 8.000%, 6/08/2023, 144A | | | 393,662 | |
| | | | | | | | |
| | | | | | | 2,104,379 | |
| | | | | | | | |
| | | | Gaming — 1.2% | |
| | 175,000 | | | Boyd Gaming Corp., 6.375%, 4/01/2026, 144A | | | 187,688 | |
| | 375,000 | | | GLP Capital LP/GLP Financing II, Inc., 5.375%, 4/15/2026 | | | 403,125 | |
| | 725,000 | | | MGM Resorts International, 6.000%, 3/15/2023 | | | 786,625 | |
| | 600,000 | | | MGM Resorts International, 6.750%, 10/01/2020 | | | 672,000 | |
| | | | | | | | |
| | | | | | | 2,049,438 | |
| | | | | | | | |
| | | | Government Owned – No Guarantee — 2.3% | |
| | 725,000 | | | Petrobras Global Finance BV, 4.875%, 3/17/2020 | | | 726,813 | |
| | 600,000 | | | Petrobras Global Finance BV, 5.375%, 1/27/2021 | | | 593,400 | |
| | 530,000 | | | Petrobras Global Finance BV, 6.250%, 3/17/2024 | | | 515,425 | |
| | 300,000 | | | Petrobras Global Finance BV, 8.375%, 5/23/2021 | | | 327,750 | |
| | 160,521(††) | | | Petroleos Mexicanos, 7.190%, 9/12/2024, 144A, (MXN) | | | 764,594 | |
| | 129,850(††) | | | Petroleos Mexicanos, 7.470%, 11/12/2026, (MXN) | | | 580,830 | |
| | 510,000 | | | YPF S.A., 31.354%, 7/07/2020, 144A(b) | | | 594,150 | |
| | | | | | | | |
| | | | | | | 4,102,962 | |
| | | | | | | | |
See accompanying notes to financial statements.
23 |
Portfolio of Investments – as of September 30, 2016
Loomis Sayles High Income Fund – (continued)
| | | | | | | | |
Principal
Amount (‡) | | | Description | | Value (†) | |
| | | | Health Insurance — 0.2% | |
| $ | 365,000 | | | Centene Corp., 6.125%, 2/15/2024 | | $ | 396,025 | |
| | | | | | | | |
| | | | Healthcare — 4.3% | |
| | 360,000 | | | Amsurg Corp., 5.625%, 7/15/2022 | | | 368,100 | |
| | 960,000 | | | CHS/Community Health Systems, Inc., 6.875%, 2/01/2022 | | | 825,600 | |
| | 145,000 | | | Fresenius Medical Care U.S. Finance II, Inc., 4.750%, 10/15/2024, 144A | | | 152,250 | |
| | 260,000 | | | HCA, Inc., 5.375%, 2/01/2025 | | | 268,450 | |
| | 170,000 | | | HCA, Inc., 7.050%, 12/01/2027 | | | 180,838 | |
| | 655,000 | | | HCA, Inc., 7.500%, 12/15/2023 | | | 726,231 | |
| | 145,000 | | | HCA, Inc., 7.500%, 11/06/2033 | | | 157,144 | |
| | 590,000 | | | HCA, Inc., 7.690%, 6/15/2025 | | | 663,107 | |
| | 480,000 | | | HCA, Inc., 8.360%, 4/15/2024 | | | 557,318 | |
| | 820,000 | | | HCA, Inc., MTN, 7.580%, 9/15/2025 | | | 924,550 | |
| | 515,000 | | | HCA, Inc., MTN, 7.750%, 7/15/2036 | | | 558,131 | |
| | 305,000 | | | LifePoint Health, Inc., 5.500%, 12/01/2021 | | | 317,963 | |
| | 65,000 | | | MEDNAX, Inc., 5.250%, 12/01/2023, 144A | | | 68,331 | |
| | 235,000 | | | Team Health, Inc., 7.250%, 12/15/2023, 144A | | | 252,919 | |
| | 310,000 | | | Tenet Healthcare Corp., 5.000%, 3/01/2019 | | | 303,025 | |
| | 675,000 | | | Tenet Healthcare Corp., 6.750%, 6/15/2023 | | | 627,750 | |
| | 705,000 | | | Tenet Healthcare Corp., 6.875%, 11/15/2031 | | | 579,862 | |
| | | | | | | | |
| | | | | | | 7,531,569 | |
| | | | | | | | |
| | | | Home Construction — 1.3% | |
| | 25,000 | | | Beazer Homes USA, Inc., 8.750%, 3/15/2022, 144A | | | 26,375 | |
| | 1,200,000 | | | Corporacion GEO SAB de CV, 8.875%, 3/27/2022, 144A(d)(e)(j) | | | 12 | |
| | 750,000 | | | K. Hovnanian Enterprises, Inc., 5.000%, 11/01/2021(e)(f) | | | 525,000 | |
| | 800,000 | | | Lennar Corp., 4.750%, 5/30/2025 | | | 812,000 | |
| | 915,000 | | �� | TRI Pointe Holdings, Inc./TRI Pointe Group, Inc., 4.375%, 6/15/2019 | | | 941,306 | |
| | 200,000 | | | Urbi Desarrollos Urbanos SAB de CV, 9.500%, 1/21/2020, 144A(d)(e)(j) | | | 2 | |
| | 900,000 | | | Urbi Desarrollos Urbanos SAB de CV, 9.750%, 2/03/2022, 144A(d)(e)(j) | | | 9 | |
| | | | | | | | |
| | | | | | | 2,304,704 | |
| | | | | | | | |
| | | | Independent Energy — 7.5% | |
| | 1,205,000 | | | Antero Resources Corp., 5.125%, 12/01/2022 | | | 1,214,037 | |
| | 110,000 | | | Antero Resources Corp., 5.375%, 11/01/2021 | | | 111,238 | |
| | 685,000 | | | Baytex Energy Corp., 5.625%, 6/01/2024, 144A | | | 558,275 | |
| | 370,000 | | | Bonanza Creek Energy, Inc., 5.750%, 2/01/2023 | | | 168,350 | |
| | 650,000 | | | Bonanza Creek Energy, Inc., 6.750%, 4/15/2021 | | | 295,750 | |
| | 90,000 | | | California Resources Corp., 5.500%, 9/15/2021 | | | 47,700 | |
| | 41,000 | | | California Resources Corp., 6.000%, 11/15/2024 | | | 19,578 | |
| | 140,000 | | | Callon Petroleum Co., 6.125%, 10/01/2024, 144A | | | 144,900 | |
| | 153,000 | | | Chesapeake Energy Corp., 4.875%, 4/15/2022 | | | 128,903 | |
| | 8,000 | | | Chesapeake Energy Corp., 5.750%, 3/15/2023 | | | 6,800 | |
| | 13,000 | | | Chesapeake Energy Corp., 6.125%, 2/15/2021 | | | 11,928 | |
| | 34,000 | | | Chesapeake Energy Corp., 6.625%, 8/15/2020 | | | 32,003 | |
| | 70,000 | | | Concho Resources, Inc., 5.500%, 10/01/2022 | | | 72,625 | |
| | 125,000 | | | Concho Resources, Inc., 5.500%, 4/01/2023 | | | 128,906 | |
| | 795,000 | | | CONSOL Energy, Inc., 5.875%, 4/15/2022 | | | 731,400 | |
| | 645,000 | | | Continental Resources, Inc., 3.800%, 6/01/2024 | | | 590,175 | |
See accompanying notes to financial statements.
| 24
Portfolio of Investments – as of September 30, 2016
Loomis Sayles High Income Fund – (continued)
| | | | | | | | |
Principal
Amount (‡) | | | Description | | Value (†) | |
| | | | Independent Energy — continued | |
| $ | 235,000 | | | Continental Resources, Inc., 4.500%, 4/15/2023 | | $ | 225,600 | |
| | 470,000 | | | Continental Resources, Inc., 5.000%, 9/15/2022 | | | 468,825 | |
| | 690,000 | | | Eclipse Resources Corp., 8.875%, 7/15/2023 | | | 672,319 | |
| | 170,000 | | | Halcon Resources Corp., 8.625%, 2/01/2020, 144A | | | 170,850 | |
| | 145,000 | | | Matador Resources Co., 6.875%, 4/15/2023 | | | 150,075 | |
| | 410,000 | | | MEG Energy Corp., 6.375%, 1/30/2023, 144A | | | 324,412 | |
| | 250,000 | | | MEG Energy Corp., 6.500%, 3/15/2021, 144A | | | 204,062 | |
| | 585,000 | | | MEG Energy Corp., 7.000%, 3/31/2024, 144A | | | 462,150 | |
| | 185,000 | | | Newfield Exploration Co., 5.625%, 7/01/2024 | | | 189,625 | |
| | 625,000 | | | Oasis Petroleum, Inc., 6.875%, 3/15/2022 | | | 598,437 | |
| | 100,000 | | | PDC Energy, Inc., 6.125%, 9/15/2024, 144A | | | 103,500 | |
| | 405,000 | | | QEP Resources, Inc., 5.250%, 5/01/2023 | | | 398,925 | |
| | 520,000 | | | QEP Resources, Inc., 5.375%, 10/01/2022 | | | 516,100 | |
| | 1,150,000 | | | Rex Energy Corp., (Step to 8.000% on 10/01/2017), 1.000%, 10/01/2020(g) | | | 626,750 | |
| | 1,025,000 | | | Rice Energy, Inc., 6.250%, 5/01/2022 | | | 1,058,312 | |
| | 565,000 | | | RSP Permian, Inc., 6.625%, 10/01/2022 | | | 591,837 | |
| | 330,000 | | | Sanchez Energy Corp., 6.125%, 1/15/2023 | | | 264,825 | |
| | 920,000 | | | SM Energy Co., 5.000%, 1/15/2024 | | | 864,800 | |
| | 35,000 | | | SM Energy Co., 6.125%, 11/15/2022 | | | 35,000 | |
| | 250,000 | | | SM Energy Co., 6.750%, 9/15/2026 | | | 252,500 | |
| | 395,000 | | | Southwestern Energy Co., 6.700%, 1/23/2025 | | | 395,000 | |
| | 55,000 | | | Whiting Petroleum Corp., 5.000%, 3/15/2019 | | | 53,213 | |
| | 455,000 | | | Whiting Petroleum Corp., 5.750%, 3/15/2021 | | | 425,425 | |
| | | | | | | | |
| | | | | | | 13,315,110 | |
| | | | | | | | |
| | | | Industrial Other — 0.2% | |
| | 330,000 | | | Broadspectrum Ltd., 8.375%, 5/15/2020, 144A | | | 351,450 | |
| | | | | | | | |
| | | | Integrated Energy — 0.1% | |
| | 100,000 | | | Pacific Exploration and Production Corp., 5.125%, 3/28/2023, 144A(d) | | | 18,500 | �� |
| | 800,000 | | | Pacific Exploration and Production Corp., 5.375%, 1/26/2019, 144A(d) | | | 148,000 | |
| | 580,000 | | | Pacific Exploration and Production Corp., 5.625%, 1/19/2025, 144A(d) | | | 107,300 | |
| | | | | | | | |
| | | | | | | 273,800 | |
| | | | | | | | |
| | | | Life Insurance — 0.2% | |
| | 340,000 | | | CNO Financial Group, Inc., 5.250%, 5/30/2025 | | | 337,450 | |
| | | | | | | | |
| | | | Lodging — 0.1% | |
| | 150,000 | | | Hilton Domestic Operating Co., Inc., 4.250%, 9/01/2024, 144A | | | 153,000 | |
| | | | | | | | |
| | | | Media Entertainment — 0.9% | |
| | 470,000 | | | Clear Channel Worldwide Holdings, Inc., 7.625%, 3/15/2020 | | | 465,887 | |
| | 1,155,000 | | | Clear Channel Worldwide Holdings, Inc., Series B, 6.500%, 11/15/2022 | | | 1,202,644 | |
| | | | | | | | |
| | | | | | | 1,668,531 | |
| | | | | | | | |
| | | | Metals & Mining — 2.6% | |
| | 200,000 | | | Anglo American Capital PLC, 4.125%, 9/27/2022, 144A | | | 198,000 | |
| | 200,000 | | | Anglo American Capital PLC, 4.875%, 5/14/2025, 144A | | | 204,000 | |
| | 1,395,000 | | | ArcelorMittal, 7.750%, 3/01/2041 | | | 1,454,287 | |
| | 180,000 | | | Constellium NV, 4.625%, 5/15/2021, 144A, (EUR) | | | 179,455 | |
| | 460,000 | | | Essar Steel Algoma, Inc., 9.500%, 11/15/2019, 144A(d)(e)(f) | | | 62,100 | |
See accompanying notes to financial statements.
25 |
Portfolio of Investments – as of September 30, 2016
Loomis Sayles High Income Fund – (continued)
| | | | | | | | |
Principal
Amount (‡) | | | Description | | Value (†) | |
| | | | Metals & Mining — continued | |
| $ | 175,000 | | | First Quantum Minerals Ltd., 7.000%, 2/15/2021, 144A | | $ | 156,625 | |
| | 270,000 | | | First Quantum Minerals Ltd., 7.250%, 5/15/2022, 144A | | | 238,950 | |
| | 1,375,000 | | | Freeport-McMoRan, Inc., 4.550%, 11/14/2024 | | | 1,246,094 | |
| | 85,000 | | | Freeport-McMoRan, Inc., 5.450%, 3/15/2043 | | | 68,213 | |
| | 245,000 | | | Glencore Finance Canada Ltd., 5.550%, 10/25/2042, 144A | | | 236,660 | |
| | 440,000 | | | Lundin Mining Corp., 7.500%, 11/01/2020, 144A | | | 467,500 | |
| | | | | | | | |
| | | | | | | 4,511,884 | |
| | | | | | | | |
| | | | Midstream — 5.5% | |
| | 250,000 | | | Access Midstream Partners LP/ACMP Finance Corp., 4.875%, 3/15/2024 | | | 252,678 | |
| | 200,000 | | | Gibson Energy, Inc., 6.750%, 7/15/2021, 144A | | | 204,500 | |
| | 40,000 | | | Kinder Morgan Energy Partners LP, 3.450%, 2/15/2023 | | | 39,874 | |
| | 60,000 | | | Kinder Morgan Energy Partners LP, 3.500%, 9/01/2023 | | | 60,093 | |
| | 75,000 | | | Kinder Morgan Energy Partners LP, 4.700%, 11/01/2042 | | | 69,185 | |
| | 30,000 | | | Kinder Morgan Energy Partners LP, 5.000%, 3/01/2043 | | | 28,218 | |
| | 270,000 | | | MPLX LP, 4.875%, 12/01/2024 | | | 279,268 | |
| | 570,000 | | | NGL Energy Partners LP/NGL Energy Finance Corp., 5.125%, 7/15/2019 | | | 538,650 | |
| | 365,000 | | | NGL Energy Partners LP/NGL Energy Finance Corp., 6.875%, 10/15/2021 | | | 345,838 | |
| | 445,000 | | | Regency Energy Partners LP/Regency Energy Finance Corp., 4.500%, 11/01/2023 | | | 447,997 | |
| | 295,000 | | | Regency Energy Partners LP/Regency Energy Finance Corp., 5.875%, 3/01/2022 | | | 325,289 | |
| | 385,000 | | | Rose Rock Midstream LP/Rose Rock Finance Corp., 5.625%, 7/15/2022 | | | 354,200 | |
| | 985,000 | | | Sabine Pass Liquefaction LLC, 5.625%, 2/01/2021 | | | 1,040,406 | |
| | 480,000 | | | Sabine Pass Liquefaction LLC, 5.625%, 3/01/2025 | | | 516,000 | |
| | 425,000 | | | Sabine Pass Liquefaction LLC, 6.250%, 3/15/2022 | | | 464,313 | |
| | 935,000 | | | Summit Midstream Holdings LLC/Summit Midstream Finance Corp., 5.500%, 8/15/2022 | | | 890,587 | |
| | 1,863,000 | | | Targa Resources Partners LP/Targa Resources Partners Finance Corp., 4.125%, 11/15/2019 | | | 1,889,082 | |
| | 95,000 | | | Targa Resources Partners LP/Targa Resources Partners Finance Corp., 4.250%, 11/15/2023 | | | 91,794 | |
| | 640,000 | | | Targa Resources Partners LP/Targa Resources Partners Finance Corp., 5.250%, 5/01/2023 | | | 648,000 | |
| | 300,000 | | | Targa Resources Partners LP/Targa Resources Partners Finance Corp., 6.375%, 8/01/2022 | | | 310,500 | |
| | 15,000 | | | Targa Resources Partners LP/Targa Resources Partners Finance Corp., 6.875%, 2/01/2021 | | | 15,488 | |
| | 355,000 | | | Tesoro Logistics LP/Tesoro Logistics Finance Corp., 5.500%, 10/15/2019 | | | 378,075 | |
| | 360,000 | | | Tesoro Logistics LP/Tesoro Logistics Finance Corp., 6.250%, 10/15/2022 | | | 384,300 | |
| | 180,000 | | | Western Refining Logistics LP/WNRL Finance Corp., 7.500%, 2/15/2023 | | | 184,500 | |
| | | | | | | | |
| | | | | | | 9,758,835 | |
| | | | | | | | |
| | | | Non-Agency Commercial Mortgage-Backed Securities — 2.0% | |
| | 935,000 | | | BXHTL Mortgage Trust, Series 2015-DRMZ, Class M, 8.717%, 5/15/2020, 144A(b)(e)(f) | | | 908,874 | |
| | 1,690,000 | | | GS Mortgage Securities Trust, Series 2007-GG10, Class AM, 5.988%, 8/10/2045(b) | | | 1,626,671 | |
See accompanying notes to financial statements.
| 26
Portfolio of Investments – as of September 30, 2016
Loomis Sayles High Income Fund – (continued)
| | | | | | | | |
Principal
Amount (‡) | | | Description | | Value (†) | |
| | | | Non-Agency Commercial Mortgage-Backed Securities — continued | |
| $ | 805,000 | | | Hilton USA Trust, Series 2013-HLT, Class EFX, 5.609%, 11/05/2030, 144A(b) | | $ | 806,242 | |
| | 125,000 | | | JPMorgan Chase Commercial Mortgage Securities Trust, Series 2007-LDPX, Class AM, 5.464%, 1/15/2049(b) | | | 122,546 | |
| | | | | | | | |
| | | | | | | 3,464,333 | |
| | | | | | | | |
| | | | Oil Field Services — 0.6% | |
| | 130,000 | | | Diamond Offshore Drilling, Inc., 4.875%, 11/01/2043 | | | 90,212 | |
| | 430,000 | | | Ensco PLC, 5.750%, 10/01/2044 | | | 262,595 | |
| | 160,000 | | | Noble Holding International Ltd., 5.250%, 3/15/2042 | | | 90,400 | |
| | 160,000 | | | Noble Holding International Ltd., 6.050%, 3/01/2041 | | | 94,400 | |
| | 435,000 | | | Paragon Offshore PLC, 6.750%, 7/15/2022, 144A(d) | | | 120,712 | |
| | 905,000 | | | Paragon Offshore PLC, 7.250%, 8/15/2024, 144A(d) | | | 251,137 | |
| | 35,000 | | | Parker Drilling Co., 6.750%, 7/15/2022 | | | 27,125 | |
| | 100,000 | | | Rowan Cos., Inc., 5.850%, 1/15/2044 | | | 68,750 | |
| | | | | | | | |
| | | | | | | 1,005,331 | |
| | | | | | | | |
| | | | Packaging — 1.4% | |
| | 200,000 | | | ARD Finance S.A., PIK, 7.125%, 9/15/2023, 144A(h) | | | 199,000 | |
| | 395,000 | | | Ardagh Packaging Finance PLC/Ardagh MP Holdings USA, Inc., 4.625%, 5/15/2023, 144A | | | 396,975 | |
| | 200,000 | | | Ardagh Packaging Finance PLC/Ardagh MP Holdings USA, Inc., 7.250%, 5/15/2024, 144A | | | 213,000 | |
| | 755,000 | | | Sealed Air Corp., 6.875%, 7/15/2033, 144A | | | 809,737 | |
| | 775,000 | | | Signode Industrial Group Lux S.A./Signode Industrial Group U.S., Inc., 6.375%, 5/01/2022, 144A | | | 784,688 | |
| | | | | | | | |
| | | | | | | 2,403,400 | |
| | | | | | | | |
| | | | Pharmaceuticals — 2.4% | |
| | 1,540,000 | | | Valeant Pharmaceuticals International, 6.375%, 10/15/2020, 144A | | | 1,443,750 | |
| | 530,000 | | | Valeant Pharmaceuticals International, 7.250%, 7/15/2022, 144A | | | 491,575 | |
| | 265,000 | | | Valeant Pharmaceuticals International, Inc., 5.500%, 3/01/2023, 144A | | | 226,575 | |
| | 85,000 | | | Valeant Pharmaceuticals International, Inc., 5.625%, 12/01/2021, 144A | | | 75,863 | |
| | 2,015,000 | | | Valeant Pharmaceuticals International, Inc., 5.875%, 5/15/2023, 144A | | | 1,737,937 | |
| | 335,000 | | | VRX Escrow Corp., 5.375%, 3/15/2020, 144A | | | 309,875 | |
| | | | | | | | |
| | | | | | | 4,285,575 | |
| | | | | | | | |
| | | | Property & Casualty Insurance — 0.4% | |
| | 786,000 | | | HUB International Ltd., 7.875%, 10/01/2021, 144A | | | 801,720 | |
| | | | | | | | |
| | | | Refining — 0.2% | |
| | 230,000 | | | Ultrapar International S.A., 5.250%, 10/06/2026, 144A | | | 228,275 | |
| | 140,000 | | | Western Refining, Inc., 6.250%, 4/01/2021 | | | 138,250 | |
| | | | | | | | |
| | | | | | | 366,525 | |
| | | | | | | | |
| | | | Retailers — 1.2% | |
| | 40,000 | | | Dillard’s, Inc., 7.000%, 12/01/2028 | | | 45,798 | |
| | 435,000 | | | Dillard’s, Inc., 7.750%, 7/15/2026 | | | 500,815 | |
| | 205,000 | | | Dillard’s, Inc., 7.750%, 5/15/2027 | | | 238,825 | |
| | 35,000 | | | Dillard’s, Inc., 7.875%, 1/01/2023 | | | 42,044 | |
| | 1,035,000 | | | GameStop Corp., 5.500%, 10/01/2019, 144A | | | 1,056,994 | |
See accompanying notes to financial statements.
27 |
Portfolio of Investments – as of September 30, 2016
Loomis Sayles High Income Fund – (continued)
| | | | | | | | |
Principal
Amount (‡) | | | Description | | Value (†) | |
| | | | Retailers — continued | |
| $ | 115,000 | | | J.C. Penney Corp., Inc., 5.750%, 2/15/2018 | | $ | 119,025 | |
| | 520,000 | | | Nine West Holdings, Inc., 6.125%, 11/15/2034 | | | 67,600 | |
| | | | | | | | |
| | | | | | | 2,071,101 | |
| | | | | | | | |
| | | | Supermarkets — 0.7% | |
| | 335,000 | | | Albertsons Cos. LLC/Safeway, Inc./New Albertson’s/Albertson’s LLC, 5.750%, 3/15/2025, 144A | | | 334,163 | |
| | 935,000 | | | New Albertson’s, Inc., Series C, MTN, 6.625%, 6/01/2028 | | | 860,200 | |
| | | | | | | | |
| | | | | | | 1,194,363 | |
| | | | | | | | |
| | | | Supranational — 2.4% | |
| | 30,700,000 | | | European Bank for Reconstruction & Development, GMTN, 6.400%, 3/04/2019, (INR) | | | 456,617 | |
| | 5,420,000,000 | | | International Bank for Reconstruction & Development, 4.500%, 8/03/2017, (COP) | | | 1,841,618 | |
| | 21,150,000 | | | International Bank for Reconstruction & Development, Series GDIF, 5.000%, 5/24/2017, (INR) | | | 313,692 | |
| | 100,890,000 | | | International Finance Corp., 7.800%, 6/03/2019, (INR) | | | 1,575,130 | |
| | | | | | | | |
| | | | | | | 4,187,057 | |
| | | | | | | | |
| | | | Technology — 7.2% | |
| | 1,545,000 | | | Alcatel-Lucent USA, Inc., 6.450%, 3/15/2029 | | | 1,709,156 | |
| | 1,930,000 | | | Alcatel-Lucent USA, Inc., 6.500%, 1/15/2028 | | | 2,103,700 | |
| | 550,000 | | | Blackboard, Inc., 7.750%, 11/15/2019, 144A | | | 541,750 | |
| | 170,000 | | | Camelot Finance S.A., 7.875%, 10/15/2024, 144A | | | 175,313 | |
| | 60,000 | | | CommScope Technologies Finance LLC, 6.000%, 6/15/2025, 144A | | | 63,975 | |
| | 75,000 | | | CommScope, Inc., 4.375%, 6/15/2020, 144A | | | 77,250 | |
| | 330,000 | | | CommScope, Inc., 5.000%, 6/15/2021, 144A | | | 341,550 | |
| | 190,000 | | | Diamond 1 Finance Corp./Diamond 2 Finance Corp., 5.875%, 6/15/2021, 144A | | | 201,870 | |
| | 1,440,000 | | | Diamond 1 Finance Corp./Diamond 2 Finance Corp., 6.020%, 6/15/2026, 144A | | | 1,578,676 | |
| | 580,000 | | | Diamond 1 Finance Corp./Diamond 2 Finance Corp., 7.125%, 6/15/2024, 144A | | | 637,912 | |
| | 480,000 | | | Equinix, Inc., 5.375%, 1/01/2022 | | | 507,600 | |
| | 430,000 | | | First Data Corp., 5.000%, 1/15/2024, 144A | | | 436,450 | |
| | 800,000 | | | First Data Corp., 7.000%, 12/01/2023, 144A | | | 846,000 | |
| | 200,000 | | | IMS Health, Inc., 5.000%, 10/15/2026, 144A | | | 208,000 | |
| | 55,000 | | | Micron Technology, Inc., 5.250%, 1/15/2024, 144A | | | 52,800 | |
| | 360,000 | | | Micron Technology, Inc., 5.500%, 2/01/2025 | | | 352,800 | |
| | 210,000 | | | Microsemi Corp., 9.125%, 4/15/2023, 144A | | | 239,400 | |
| | 515,000 | | | Open Text Corp., 5.625%, 1/15/2023, 144A | | | 525,300 | |
| | 190,000 | | | Open Text Corp., 5.875%, 6/01/2026, 144A | | | 198,788 | |
| | 275,000 | | | Sabre GLBL, Inc., 5.250%, 11/15/2023, 144A | | | 279,812 | |
| | 405,000 | | | Sabre GLBL, Inc., 5.375%, 4/15/2023, 144A | | | 416,137 | |
| | 235,000 | | | Western Digital Corp., 7.375%, 4/01/2023, 144A | | | 258,500 | |
| | 755,000 | | | Western Digital Corp., 10.500%, 4/01/2024, 144A | | | 875,800 | |
| | | | | | | | |
| | | | | | | 12,628,539 | |
| | | | | | | | |
| | | | Transportation Services — 0.1% | |
| | 275,000 | | | APL Ltd., 8.000%, 1/15/2024(e)(f) | | | 181,500 | |
| | | | | | | | |
See accompanying notes to financial statements.
| 28
Portfolio of Investments – as of September 30, 2016
Loomis Sayles High Income Fund – (continued)
| | | | | | | | |
Principal
Amount (‡) | | | Description | | Value (†) | |
| | | | Treasuries — 1.7% | |
| | 55,000 | | | Hellenic Republic Government Bond, Series PSI,
(Step to 3.650% on 2/24/2020), 3.000%, 2/24/2035, (EUR)(g) | | $ | 36,392 | |
| | 55,000 | | | Hellenic Republic Government Bond, Series PSI,
(Step to 3.650% on 2/24/2020), 3.000%, 2/24/2036, (EUR)(g) | | | 36,512 | |
| | 20,000 | | | Hellenic Republic Government Bond, Series PSI,
(Step to 3.650% on 2/24/2020), 3.000%, 2/24/2041, (EUR)(g) | | | 13,052 | |
| | 107,066(††) | | | Mexican Fixed Rate Bonds, Series M, 4.750%, 6/14/2018, (MXN) | | | 547,216 | |
| | 142,200(††) | | | Mexican Fixed Rate Bonds, Series M, 5.750%, 3/05/2026, (MXN) | | | 719,122 | |
| | 131,500(††) | | | Mexican Fixed Rate Bonds, Series M, 6.500%, 6/10/2021, (MXN) | | | 698,713 | |
| | 151,030(††) | | | Mexican Fixed Rate Bonds, Series M-20, 10.000%, 12/05/2024, (MXN) | | | 983,998 | |
| | | | | | | | |
| | | | | | | 3,035,005 | |
| | | | | | | | |
| | | | Wireless — 3.7% | |
| | 100,000 | | | Altice Luxembourg S.A., 7.250%, 5/15/2022, 144A, (EUR) | | | 118,401 | |
| | 355,000 | | | Altice Luxembourg S.A., 7.625%, 2/15/2025, 144A | | | 363,875 | |
| | 785,000 | | | Altice Luxembourg S.A., 7.750%, 5/15/2022, 144A | | | 837,988 | |
| | 6,000,000 | | | America Movil SAB de CV, 6.450%, 12/05/2022, (MXN) | | | 301,396 | |
| | 6,100,000 | | | America Movil SAB de CV, 8.460%, 12/18/2036, (MXN) | | | 311,363 | |
| | 605,000 | | | SFR Group S.A., 7.375%, 5/01/2026, 144A | | | 618,425 | |
| | 786,000 | | | Sprint Capital Corp., 6.875%, 11/15/2028 | | | 737,858 | |
| | 1,420,000 | | | Sprint Corp., 7.250%, 9/15/2021 | | | 1,425,325 | |
| | 605,000 | | | T-Mobile USA, Inc., 6.000%, 4/15/2024 | | | 647,350 | |
| | 370,000 | | | T-Mobile USA, Inc., 6.125%, 1/15/2022 | | | 393,125 | |
| | 515,000 | | | T-Mobile USA, Inc., 6.731%, 4/28/2022 | | | 540,750 | |
| | 200,000 | | | Wind Acquisition Finance S.A., 4.750%, 7/15/2020, 144A | | | 201,500 | |
| | | | | | | | |
| | | | | | | 6,497,356 | |
| | | | | | | | |
| | | | Wirelines — 2.7% | |
| | 705,000 | | | CenturyLink, Inc., 7.650%, 3/15/2042 | | | 608,062 | |
| | 30,000 | | | CenturyLink, Inc., Series T, 5.800%, 3/15/2022 | | | 30,750 | |
| | 130,000 | | | Cincinnati Bell Telephone Co. LLC, 6.300%, 12/01/2028 | | | 123,663 | |
| | 60,000,000 | | | Empresa de Telecomunicaniones de Bogota, 7.000%, 1/17/2023, 144A, (COP) | | | 15,138 | |
| | 405,000 | | | Frontier Communications Corp., 9.000%, 8/15/2031 | | | 372,600 | |
| | 340,000 | | | Frontier Communications Corp., 10.500%, 9/15/2022 | | | 360,400 | |
| | 15,000 | | | Frontier Communications Corp., 11.000%, 9/15/2025 | | | 15,656 | |
| | 705,000 | | | Level 3 Communications, Inc., 5.750%, 12/01/2022 | | | 736,725 | |
| | 1,545,000 | | | Level 3 Financing, Inc., 5.250%, 3/15/2026, 144A | | | 1,595,212 | |
| | 345,000 | | | Telecom Italia Capital S.A., 6.375%, 11/15/2033 | | | 351,038 | |
| | 35,000 | | | Telecom Italia Capital S.A., 7.721%, 6/04/2038 | | | 38,325 | |
| | 450,000 | | | Telecom Italia SpA, 5.303%, 5/30/2024, 144A | | | 460,066 | |
| | | | | | | | |
| | | | | | | 4,707,635 | |
| | | | | | | | |
| | | | Total Non-Convertible Bonds
(Identified Cost $150,365,268) | | | 149,660,180 | |
| | | | | | | | |
| | | | | | | | |
| | Convertible Bonds — 3.2% | |
| | | | Building Materials — 0.0% | |
| | 25,000 | | | CalAtlantic Group, Inc., 0.250%, 6/01/2019 | | | 23,156 | |
| | | | | | | | |
See accompanying notes to financial statements.
29 |
Portfolio of Investments – as of September 30, 2016
Loomis Sayles High Income Fund – (continued)
| | | | | | | | |
Principal
Amount (‡) | | | Description | | Value (†) | |
| | | | Diversified Operations — 0.1% | |
| $ | 160,000 | | | RWT Holdings, Inc., 5.625%, 11/15/2019 | | $ | 162,000 | |
| | | | | | | | |
| | | | Healthcare — 0.3% | |
| | 595,000 | | | Brookdale Senior Living, Inc., 2.750%, 6/15/2018 | | | 590,909 | |
| | | | | | | | |
| | | | Leisure — 0.4% | |
| | 685,000 | | | Rovi Corp., 0.500%, 3/01/2020 | | | 682,623 | |
| | | | | | | | |
| | | | Media Entertainment — 0.2% | |
| | 265,000 | | | Liberty Media Corp., 2.250%, 9/30/2046, 144A | | | 275,103 | |
| | | | | | | | |
| | | | Metals & Mining — 0.0% | |
| | 25,000 | | | RTI International Metals, Inc., 1.625%, 10/15/2019 | | | 26,656 | |
| | | | | | | | |
| | | | Midstream — 0.6% | |
| | 1,068,000 | | | Whiting Petroleum Corp., Series 2, 1.250%, 6/05/2020 | | | 1,025,280 | |
| | | | | | | | |
| | | | Pharmaceuticals — 0.8% | |
| | 604,000 | | | BioMarin Pharmaceutical, Inc., 1.500%, 10/15/2020 | | | 753,113 | |
| | 765,000 | | | Ionis Pharmaceuticals, Inc., 1.000%, 11/15/2021 | | | 711,928 | |
| | | | | | | | |
| | | | | | | 1,465,041 | |
| | | | | | | | |
| | | | Technology — 0.8% | |
| | 30,000 | | | Advanced Micro Devices, Inc., 2.125%, 9/01/2026 | | | 32,625 | |
| | 5,000 | | | CalAmp Corp., 1.625%, 5/15/2020 | | | 4,625 | |
| | 260,000 | | | Cypress Semiconductor Corp., 4.500%, 1/15/2022, 144A | | | 293,963 | |
| | 180,000 | | | Micron Technology, Inc., Series G, 3.000%, 11/15/2043 | | | 159,975 | |
| | 845,000 | | | Nuance Communications, Inc., 1.000%, 12/15/2035, 144A | | | 735,150 | |
| | 205,000 | | | Viavi Solutions, Inc., 0.625%, 8/15/2033 | | | 203,975 | |
| | | | | | | | |
| | | | | | | 1,430,313 | |
| | | | | | | | |
| | | | Total Convertible Bonds
(Identified Cost $5,745,898) | | | 5,681,081 | |
| | | | | | | | |
| | | | | | | | |
| | | | Total Bonds and Notes
(Identified Cost $156,111,166) | | | 155,341,261 | |
| | | | | | | | |
| | | | | | | | |
| | Senior Loans — 1.8% | |
| | | | Consumer Cyclical Services — 0.2% | |
| | 468,419 | | | SourceHov LLC, 2014 1st Lien Term Loan, 7.750%, 10/31/2019(b) | | | 390,544 | |
| | | | | | | | |
| | | | Independent Energy — 0.3% | |
| | 531,086 | | | Chesapeake Energy Corp., Term Loan, 8.500%, 8/23/2021(b) | | | 557,141 | |
| | | | | | | | |
| | | | Media Entertainment — 0.0% | |
| | 26,479 | | | Dex Media, Inc., Term Loan, 11.000%, 7/29/2021(b) | | | 25,222 | |
| | | | | | | | |
| | | | Other Utility — 0.2% | |
| | 239,982 | | | PowerTeam Services LLC, 1st Lien Term Loan, 4.250%, 5/06/2020(b) | | | 239,082 | |
| | 95,000 | | | PowerTeam Services LLC, 2nd Lien Term Loan, 8.250%, 11/06/2020(b) | | | 94,525 | |
| | | | | | | | |
| | | | | | | 333,607 | |
| | | | | | | | |
| | | | Supermarkets — 0.3% | |
| | 467,128 | | | Albertson’s LLC, 2016 Term Loan B4, 4.500%, 8/25/2021(b) | | | 470,524 | |
| | | | | | | | |
| | | | Transportation Services — 0.0% | |
| | 82,401 | | | OSG Bulk Ships, Inc., OBS Term Loan, 5.250%, 8/05/2019(b) | | | 82,091 | |
| | | | | | | | |
See accompanying notes to financial statements.
| 30
Portfolio of Investments – as of September 30, 2016
Loomis Sayles High Income Fund – (continued)
| | | | | | | | |
Principal
Amount (‡) | | | Description | | Value (†) | |
| | | | Wirelines — 0.8% | |
| $ | 1,206,250 | | | Fairpoint Communications, Inc., Refi Term Loan, 7.500%, 2/14/2019(b) | | $ | 1,205,599 | |
| | 159,324 | | | Integra Telecom, Inc., 2nd Lien Term Loan, 9.750%, 2/12/2021(b)(e)(f) | | | 150,561 | |
| | | | | | | | |
| | | | | | | 1,356,160 | |
| | | | | | | | |
| | | | Total Senior Loans
(Identified Cost $3,297,748) | | | 3,215,289 | |
| | | | | | | | |
Shares | | | | | | |
| | Preferred Stocks — 2.2% | |
| | Convertible Preferred Stocks — 1.9% | |
| | | | Food & Beverage — 0.2% | |
| | 3,415 | | | Bunge Ltd., 4.875% | | | 324,791 | |
| | | | | | | | |
| | | | Midstream — 0.3% | |
| | 988 | | | Chesapeake Energy Corp., 5.750%(i) | | | 522,405 | |
| | 20 | | | Chesapeake Energy Corp., 5.750%, 144A(i) | | | 10,575 | |
| | 137 | | | Chesapeake Energy Corp., 5.750%(i) | | | 71,326 | |
| | | | | | | | |
| | | | | | | 604,306 | |
| | | | | | | | |
| | | | Pharmaceuticals — 1.0% | |
| | 888 | | | Allergan PLC, Series A, 5.500% | | | 729,608 | |
| | 1,439 | | | Teva Pharmaceutical Industries Ltd., 7.000% | | | 1,165,014 | |
| | | | | | | | |
| | | | | | | 1,894,622 | |
| | | | | | | | |
| | | | REITs – Mortgage — 0.1% | |
| | 2,107 | | | iStar, Inc., Series J, 4.500% | | | 103,095 | |
| | | | | | | | |
| | | | Technology — 0.3% | |
| | 4,850 | | | Belden, Inc., 6.750% | | | 487,085 | |
| | | | | | | | |
| | | | Total Convertible Preferred Stocks
(Identified Cost $3,807,099) | | | 3,413,899 | |
| | | | | | | | |
| | | | | | | | |
| | Non-Convertible Preferred Stocks — 0.3% | |
| | | | Finance Companies — 0.3% | |
| | 12,925 | | | iStar, Inc., Series E, 7.875% | | | 314,466 | |
| | 7,500 | | | iStar, Inc., Series F, 7.800% | | | 183,075 | |
| | 550 | | | iStar, Inc., Series G, 7.650% | | | 13,233 | |
| | | | | | | | |
| | | | | | | 510,774 | |
| | | | | | | | |
| | | | Total Non-Convertible Preferred Stocks
(Identified Cost $417,822) | | | 510,774 | |
| | | | | | | | |
| | | | | | | | |
| | | | Total Preferred Stocks
(Identified Cost $4,224,921) | | | 3,924,673 | |
| | | | | | | | |
| | | | | | | | |
| | Other Investments — 0.6% | |
| | | | Aircraft ABS — 0.6% | |
| | 100 | | | ECAF I Blocker Ltd.(e)(j)
(Identified Cost $1,000,000) | | | 985,586 | |
| | | | | | | | |
See accompanying notes to financial statements.
31 |
Portfolio of Investments – as of September 30, 2016
Loomis Sayles High Income Fund – (continued)
| | | | | | | | |
Shares | | | Description | | Value (†) | |
| | Common Stocks — 0.7% | |
| | | | Energy Equipment & Services — 0.0% | |
| | 4,625 | | | Hercules Offshore, Inc.(i) | | $ | 8,001 | |
| | | | | | | | |
| | | | Internet Software & Services — 0.0% | |
| | 4,113 | | | Dex Media, Inc.(i)(j) | | | 8,177 | |
| | | | | | | | |
| | | | Oil, Gas & Consumable Fuels — 0.5% | |
| | 12,992 | | | Halcon Resources Corp.(i) | | | 121,865 | |
| | 14,882 | | | Kinder Morgan, Inc. | | | 344,221 | |
| | 17,250 | | | Rex Energy Corp.(i) | | | 10,072 | |
| | 49,233 | | | Whiting Petroleum Corp.(i) | | | 430,296 | |
| | | | | | | | |
| | | | | | | 906,454 | |
| | | | | | | | |
| | | | Pharmaceuticals — 0.2% | |
| | 5,539 | | | Bristol-Myers Squibb Co. | | | 298,663 | |
| | | | | | | | |
| | | | Total Common Stocks
(Identified Cost $3,087,477) | | | 1,221,295 | |
| | | | | | | | |
| | | | | | | | |
| | Warrants — 0.0% | |
| | 22,512 | | | Kinder Morgan, Inc., Expiration on 5/25/2017 at $40.00(i) | | | 349 | |
| | 10,360 | | | FairPoint Communications, Inc., Expiration on 1/24/2018 at $48.81(e)(i)(j) | | | — | |
| | 3,528 | | | Halcon Resources Corp., Expiration on 9/9/2020 at $14.04(i)(j) | | | 5,383 | |
| | | | | | | | |
| | | | Total Warrants
(Identified Cost $29,891) | | | 5,732 | |
| | | | | | | | |
Principal
Amount (‡) | | | | | | |
| | Short-Term Investments — 5.5% | |
| $ | 9,627,235 | | | Tri-Party Repurchase Agreement with Fixed Income Clearing Corporation, dated 9/30/2016 at 0.030% to be repurchased at $9,627,259 on 10/03/2016 collateralized by $8,940,000 U.S. Treasury Note, 2.750% due 2/15/2024 valued at $9,822,825 including accrued interest (Note 2 of Notes to Financial Statements) | | | 9,627,235 | |
| | 12,523 | | | Repurchase Agreement with State Street Bank and Trust Company, dated 9/30/2016 at 0.000% to be repurchased at $12,523 on 10/03/2016 collateralized by $12,600 U.S. Treasury Note, 1.500% due 8/31/2018 valued at $12,786 including accrued interest (Note 2 of Notes to Financial Statements) | | | 12,523 | |
| | | | | | | | |
| | | | Total Short-Term Investments
(Identified Cost $9,639,758) | | | 9,639,758 | |
| | | | | | | | |
| | | | | | | | |
| | | | Total Investments — 98.9%
(Identified Cost $177,390,961)(a) | | | 174,333,594 | |
| | | | Other assets less liabilities — 1.1% | | | 1,942,867 | |
| | | | | | | | |
| | | | Net Assets — 100.0% | | $ | 176,276,461 | |
| | | | | | | | |
| | | | | | | | |
| | (‡) | | | Principal Amount stated in U.S. dollars unless otherwise noted. | |
| | (†) | | | See Note 2 of Notes to Financial Statements. | |
| | (††) | | | Amount shown represents units. One unit represents a principal amount of 100. | |
See accompanying notes to financial statements.
| 32
Portfolio of Investments – as of September 30, 2016
Loomis Sayles High Income Fund – (continued)
| | | | | | | | |
| | | | | | | | |
| | (a) | | | Federal Tax Information: | |
| | | | At September 30, 2016, the net unrealized depreciation on investments based on a cost of $177,504,166 for federal income tax purposes was as follows: | |
| | | | Aggregate gross unrealized appreciation for all investments in which there is an excess of value over tax cost | | $ | 9,142,529 | |
| | | | Aggregate gross unrealized depreciation for all investments in which there is an excess of tax cost over value | | | (12,313,101 | ) |
| | | | | | | | |
| | | | Net unrealized depreciation | | $ | (3,170,572 | ) |
| | | | | | | | |
| | | | | | | | |
| | (b) | | | Variable rate security. Rate as of September 30, 2016 is disclosed. | |
| | (c) | | | Payment-in-kind security for which the issuer has the option at each interest payment date of making interest payments in cash or additional debt securities. For the period ended September 30, 2016, interest payments were made in cash and additional debt securities. | |
| | (d) | | | The issuer is in default with respect to interest and/or principal payments. Income is not being accrued. | |
| | (e) | | | Illiquid security. (Unaudited) | |
| | (f) | | | Securities classified as fair valued pursuant to the Fund’s pricing policies and procedures. At September 30, 2016, the value of these securities amounted to $1,828,035 or 1.0% of net assets. See Note 2 of Notes to Financial Statements. | |
| | (g) | | | Coupon rate is a fixed rate for an initial period then resets at a specified date and rate. | |
| | (h) | | | Payment-in-kind security for which the issuer has the option at each interest payment date of making interest payments in cash or additional debt securities. For the period ended September 30, 2016, the issuer has not made any interest payments. | |
| | (i) | | | Non-income producing security. | |
| | (j) | | | Fair valued by the Fund’s adviser. At September 30, 2016, the value of these securities amounted to $1,097,873 or 0.6% of net assets. See Note 2 of Notes to Financial Statements. | |
| | | | | |
| | 144A | | | All or a portion of these securities are exempt from registration under Rule 144A of the Securities Act of 1933. These securities may be resold in transactions exempt from registration, normally to qualified institutional buyers. At September 30, 2016, the value of Rule 144A holdings amounted to $60,581,057 or 34.4% of net assets. | |
| | ABS | | | Asset-Backed Securities | |
| | GMTN | | | Global Medium Term Note | |
| | MTN | | | Medium Term Note | |
| | PIK | | | Payment-in-Kind | |
| | REITs | | | Real Estate Investment Trusts | |
| | | | | |
| | BRL | | | Brazilian Real | |
| | COP | | | Colombian Peso | |
| | EUR | | | Euro | |
| | INR | | | Indian Rupee | |
| | MXN | | | Mexican Peso | |
See accompanying notes to financial statements.
33 |
Portfolio of Investments – as of September 30, 2016
Loomis Sayles High Income Fund – (continued)
At September 30, 2016, the Fund had the following open forward foreign currency contracts:
| | | | | | | | | | | | | | | | | | |
Contract
to
Buy/Sell | | Delivery
Date | | | Currency | | Units of
Currency | | | Notional
Value | | | Unrealized
Appreciation
(Depreciation) | |
| Sell1 | | | 12/21/2016 | | | Euro | | | 170,000 | | | $ | 191,659 | | | $ | 233 | |
| | | | | | | | | | | | | | | | | | |
1 Counterparty is Bank of America, N.A.
Industry Summary at September 30, 2016
| | | | |
Technology | | | 8.3 | % |
Independent Energy | | | 7.8 | |
Cable Satellite | | | 7.2 | |
Midstream | | | 6.4 | |
Finance Companies | | | 5.8 | |
Healthcare | | | 4.6 | |
Pharmaceuticals | | | 4.4 | |
Banking | | | 3.9 | |
Wireless | | | 3.7 | |
Wirelines | | | 3.5 | |
Aerospace & Defense | | | 2.8 | |
Metals & Mining | | | 2.6 | |
Supranational | | | 2.4 | |
Government Owned – No Guarantee | | | 2.3 | |
Non-Agency Commercial Mortgage-Backed Securities | | | 2.0 | |
Other Investments, less than 2% each | | | 25.7 | |
Short-Term Investments | | | 5.5 | |
| | | | |
Total Investments | | | 98.9 | |
Other assets less liabilities (including forward foreign currency contracts) | | | 1.1 | |
| | | | |
Net Assets | | | 100.0 | % |
| | | | |
See accompanying notes to financial statements.
| 34
Portfolio of Investments – as of September 30, 2016
Loomis Sayles Intermediate Duration Bond Fund
| | | | | | | | |
Principal
Amount | | | Description | | Value (†) | |
| | Bonds and Notes — 96.2% of Net Assets | |
| | Non-Convertible Bonds — 96.0% | |
| | | | ABS Car Loan — 7.2% | |
| $ | 89,000 | | | AmeriCredit Automobile Receivables Trust, Series 2014-1, Class B, 1.680%, 7/08/2019 | | $ | 89,223 | |
| | 147,000 | | | AmeriCredit Automobile Receivables Trust, Series 2014-4, Class C, 2.470%, 11/09/2020 | | | 149,175 | |
| | 375,000 | | | AmeriCredit Automobile Receivables Trust, Series 2015-3, Class C, 2.730%, 3/08/2021 | | | 382,602 | |
| | 152,000 | | | AmeriCredit Automobile Receivables Trust, Series 2016-1, Class C, 2.890%, 1/10/2022 | | | 156,134 | |
| | 72,000 | | | AmeriCredit Automobile Receivables Trust, Series 2016-2, Class C, 2.870%, 11/08/2021 | | | 73,880 | |
| | 160,000 | | | AmeriCredit Automobile Receivables Trust, Series 2016-3, Class C, 2.240%, 4/08/2022 | | | 161,254 | |
| | 210,000 | | | Avis Budget Rental Car Funding AESOP LLC, Series 2014-1A, Class A, 2.460%, 7/20/2020, 144A | | | 212,130 | |
| | 360,000 | | | Avis Budget Rental Car Funding AESOP LLC, Series 2016-1A, Class A, 2.990%, 6/20/2022, 144A | | | 368,893 | |
| | 57,648 | | | California Republic Auto Receivables Trust, Series 2013-2, Class A2, 1.230%, 3/15/2019 | | | 57,694 | |
| | 225,000 | | | California Republic Auto Receivables Trust, Series 2016-2, Class A3, 1.560%, 7/15/2020 | | | 225,869 | |
| | 52,327 | | | Capital Auto Receivables Asset Trust, Series 2014-2, Class A3, 1.260%, 5/21/2018 | | | 52,354 | |
| | 371,000 | | | Capital Auto Receivables Asset Trust, Series 2015-1, Class A3, 1.610%, 6/20/2019 | | | 372,594 | |
| | 2,232 | | | CarFinance Capital Auto Trust, Series 2014-1A, Class A, 1.460%, 12/17/2018, 144A | | | 2,232 | |
| | 126,211 | | | CarFinance Capital Auto Trust, Series 2014-2A, Class A, 1.440%, 11/16/2020, 144A | | | 126,057 | |
| | 20,517 | | | CarMax Auto Owner Trust, Series 2013-4, Class A3, 0.800%, 7/16/2018 | | | 20,510 | |
| | 33,295 | | | CarMax Auto Owner Trust, Series 2014-1, Class A3, 0.790%, 10/15/2018 | | | 33,275 | |
| | 9,312 | | | CPS Auto Receivables Trust, Series 2013-D, Class A, 1.540%, 7/16/2018, 144A | | | 9,316 | |
| | 64,229 | | | CPS Auto Receivables Trust, Series 2014-C, Class A, 1.310%, 2/15/2019, 144A | | | 64,194 | |
| | 465,000 | | | CPS Auto Receivables Trust, Series 2015-A, Class B, 2.790%, 2/16/2021, 144A | | | 471,525 | |
| | 345,000 | | | Credit Acceptance Auto Loan Trust, Series 2014-2A, Class A, 1.880%, 3/15/2022, 144A | | | 345,665 | |
| | 275,000 | | | Credit Acceptance Auto Loan Trust, Series 2015-1A, Class B, 2.610%, 1/17/2023, 144A | | | 276,577 | |
| | 800,000 | | | Credit Acceptance Auto Loan Trust, Series 2016-2A, Class B, 3.180%, 5/15/2024, 144A | | | 813,407 | |
| | 322,000 | | | Drive Auto Receivables Trust, Series 2015-BA, Class C, 2.760%, 7/15/2021, 144A | | | 324,686 | |
| | 362,000 | | | Drive Auto Receivables Trust, Series 2016-BA, Class C, 3.190%, 7/15/2022, 144A | | | 368,442 | |
| | 107,000 | | | DT Auto Owner Trust, Series 2015-2A, Class D, 4.250%, 2/15/2022, 144A | | | 108,976 | |
| | 335,000 | | | DT Auto Owner Trust, Series 2015-3A, Class D, 4.530%, 10/17/2022, 144A | | | 342,943 | |
| | 255,000 | | | DT Auto Owner Trust, Series 2016-2A, Class D, 5.430%, 11/15/2022, 144A | | | 267,670 | |
| | 440,000 | | | DT Auto Owner Trust, Series 2016-4A, Class C, 2.740%, 10/17/2022, 144A | | | 439,742 | |
See accompanying notes to financial statements.
35 |
Portfolio of Investments – as of September 30, 2016
Loomis Sayles Intermediate Duration Bond Fund – (continued)
| | | | | | | | |
Principal
Amount | | | Description | | Value (†) | |
| | | | ABS Car Loan — continued | |
| $ | 76,020 | | | Exeter Automobile Receivables Trust, Series 2014-1A, Class B, 2.420%, 1/15/2019, 144A | | $ | 76,069 | |
| | 8,457 | | | Exeter Automobile Receivables Trust, Series 2014-3A, Class A, 1.320%, 1/15/2019, 144A | | | 8,446 | |
| | 36,982 | | | First Investors Auto Owner Trust, Series 2013-3A, Class A3, 1.440%, 10/15/2019, 144A | | | 36,989 | |
| | 40,791 | | | First Investors Auto Owner Trust, Series 2014-1A, Class A3, 1.490%, 1/15/2020, 144A | | | 40,805 | |
| | 290,000 | | | Flagship Credit Auto Trust, Series 2015-2B, 3.080%, 12/15/2021, 144A | | | 295,291 | |
| | 195,000 | | | Flagship Credit Auto Trust, Series 2016-2, Class B, 3.840%, 9/15/2022, 144A | | | 203,321 | |
| | 135,000 | | | Flagship Credit Auto Trust, Series 2016-3, Class B, 2.430%, 6/15/2021, 144A | | | 135,984 | |
| | 115,000 | | | Ford Credit Auto Owner Trust/Ford Credit, Series 2014-1, Class A, 2.260%, 11/15/2025, 144A | | | 117,236 | |
| | 230,000 | | | Ford Credit Auto Owner Trust/Ford Credit, Series 2014-2, Class A, 2.310%, 4/15/2026, 144A | | | 235,147 | |
| | 705,000 | | | Ford Credit Auto Owner Trust/Ford Credit, Series 2016-2, Class A, 2.030%, 12/15/2027, 144A | | | 711,063 | |
| | 590,000 | | | GM Financial Automobile Leasing Trust, Series 2016-2, Class A3, 1.620%, 9/20/2019 | | | 593,089 | |
| | 490,000 | | | Hyundai Auto Lease Securitization Trust, Series 2016-C, Class A4, 1.650%, 7/15/2020, 144A | | | 490,238 | |
| | 595,000 | | | NextGear Floorplan Master Owner Trust, Series 2014-1A, Class A, 1.920%, 10/15/2019, 144A | | | 593,397 | |
| | 299,000 | | | Prestige Auto Receivables Trust, Series 2015-1, Class A3, 1.530%, 2/15/2021, 144A | | | 299,461 | |
| | 121,000 | | | Santander Drive Auto Receivables Trust, Series 2015-4, Class C, 2.970%, 3/15/2021 | | | 123,221 | |
| | 188,000 | | | Santander Drive Auto Receivables Trust, Series 2016-2, Class C, 2.660%, 11/15/2021 | | | 190,939 | |
| | 76,835 | | | SMART Trust/Australia, Series 2013-1US, Class A4A, 1.050%, 10/14/2018 | | | 76,752 | |
| | 138,514 | | | SMART Trust/Australia, Series 2013-2US, Class A4A, 1.180%, 2/14/2019 | | | 137,987 | |
| | 279,394 | | | World Omni Auto Receivables Trust, Series 2014-B, Class A3, 1.140%, 1/15/2020 | | | 279,627 | |
| | 640,000 | | | World Omni Auto Receivables Trust, Series 2016-B, Class A3, 1.300%, 2/15/2022 | | | 640,376 | |
| | | | | | | | |
| | | | | | | 11,602,457 | |
| | | | | | | | |
| | | | ABS Credit Card — 2.0% | |
| | 434,000 | | | Bank of America Credit Card Trust, Series 2015-A2, Class A, 1.360%, 9/15/2020 | | | 435,759 | |
| | 415,000 | | | Barclays Dryrock Issuance Trust, Series 2014-3, Class A, 2.410%, 7/15/2022 | | | 427,595 | |
| | 1,085,000 | | | Chase Issuance Trust, Series 2016-A4, Class A4, 1.490%, 7/15/2022 | | | 1,088,616 | |
| | 260,000 | | | Citibank Credit Card Issuance Trust, Series 2014-A1, Class A1, 2.880%, 1/23/2023 | | | 275,314 | |
| | 470,000 | | | Synchrony Credit Card Master Note Trust, Series 2016-3, Class A, 1.580%, 9/15/2022 | | | 470,926 | |
| | 501,000 | | | World Financial Network Credit Card Master Trust, Series 2012-A, Class A, 3.140%, 1/17/2023 | | | 521,370 | �� |
| | | | | | | | |
| | | | | | | 3,219,580 | |
| | | | | | | | |
See accompanying notes to financial statements.
| 36
Portfolio of Investments – as of September 30, 2016
Loomis Sayles Intermediate Duration Bond Fund – (continued)
| | | | | | | | |
Principal
Amount | | | Description | | Value (†) | |
| | | | ABS Home Equity — 1.2% | |
| $ | 329,364 | | | Colony American Finance Ltd., Series 2015-1, Class A, 2.896%, 10/15/2047, 144A | | $ | 333,422 | |
| | 221,076 | | | Colony American Homes, Series 2014-1A, Class A, 1.681%, 5/17/2031, 144A(b) | | | 221,183 | |
| | 26,074 | | | Countrywide Alternative Loan Trust, Series 2006-J5, Class 4A1, 4.633%, 7/25/2021(b)(c) | | | 23,756 | |
| | 17,729 | | | Countrywide Asset-Backed Certificates, Series 2004-S1, Class A3, 5.115%, 2/25/2035(b) | | | 17,988 | |
| | 500,000 | | | Freddie Mac Structured Agency Credit Risk Debt Notes, Series 2015-DNA1, Class M2, 2.375%, 10/25/2027(b) | | | 508,624 | |
| | 226,427 | | | Mill City Mortgage Trust, Series 2016-1, Class A1, 2.500%, 4/25/2057, 144A(b) | | | 227,694 | |
| | 20,473 | | | RBSSP Resecuritization Trust, Series 2010-3, Class 9A1, 5.500%, 2/26/2035, 144A | | | 20,635 | |
| | 199,135 | | | Towd Point Mortgage Trust, Series 2015-2, Class 1AE2, 2.750%, 11/25/2060, 144A(b) | | | 201,594 | |
| | 319,992 | | | Towd Point Mortgage Trust, Series 2016-2, Class A1A, 2.750%, 8/25/2055, 144A(b) | | | 324,238 | |
| | 90,628 | | | Wells Fargo Mortgage Backed Securities Trust, Series 2005-AR10, Class 2A4, 2.956%, 5/01/2035(b) | | | 93,799 | |
| | | | | | | | |
| | | | | | | 1,972,933 | |
| | | | | | | | |
| | | | ABS Other — 1.5% | |
| | 39,271 | | | CCG Receivables Trust, Series 2014-1, Class A2, 1.060%, 11/15/2021, 144A | | | 39,233 | |
| | 132,975 | | | DB Master Finance LLC, Series 2015-1A, Class A2I, 3.262%, 2/20/2045, 144A | | | 133,666 | |
| | 42,646 | | | FRS I LLC, Series 2013-1A, Class A1, 1.800%, 4/15/2043, 144A | | | 41,822 | |
| | 37,958 | | | Global Container Assets Ltd., Series 2013-1A, Class A1, 2.200%, 11/05/2028, 144A | | | 37,886 | |
| | 398,000 | | | John Deere Owner Trust, Series 2014-B, Class A4, 1.500%, 6/15/2021 | | | 399,802 | |
| | 190,263 | | | OneMain Financial Issuance Trust, Series 2014-2A, Class A, 2.470%, 9/18/2024, 144A | | | 190,686 | |
| | 385,000 | | | OneMain Financial Issuance Trust, Series 2015-1A, Class A, 3.190%, 3/18/2026, 144A | | | 388,922 | |
| | 350,000 | | | OneMain Financial Issuance Trust, Series 2016-1A, Class A, 3.660%, 2/20/2029, 144A | | | 358,906 | |
| | 245,779 | | | Shenton Aircraft Investment I Ltd., Series 2015-1A, Class A, 4.750%, 10/15/2042, 144A | | | 239,344 | |
| | 102,478 | | | Springleaf Funding Trust, Series 2014-AA, Class A, 2.410%, 12/15/2022, 144A | | | 102,609 | |
| | 203,958 | | | TAL Advantage V LLC, Series 2014-1A, Class A, 3.510%, 2/22/2039, 144A | | | 200,604 | |
| | 85,015 | | | TAL Advantage V LLC, Series 2014-2A, Class A2, 3.330%, 5/20/2039, 144A | | | 83,285 | |
| | 204,167 | | | TAL Advantage V LLC, Series 2014-3A, Class A, 3.270%, 11/21/2039, 144A | | | 198,982 | |
| | | | | | | | |
| | | | | | | 2,415,747 | |
| | | | | | | | |
| | | | ABS Student Loan — 1.1% | |
| | 425,726 | | | North Carolina State Education Assistance Authority, Series 2011-2, Class A2, 1.515%, 7/25/2025(b) | | | 423,065 | |
| | 165,734 | | | SoFi Professional Loan Program LLC, Series 2015-A, Class A2, 2.420%, 3/25/2030, 144A | | | 167,789 | |
| | 528,194 | | | SoFi Professional Loan Program LLC, Series 2015-C, Class A2, 2.510%, 8/25/2033, 144A | | | 537,415 | |
| | 295,000 | | | SoFi Professional Loan Program LLC, Series 2016-B, Class A2B, 2.740%, 10/25/2032, 144A | | | 302,447 | |
| | 386,359 | | | South Carolina Student Loan Corp., Series 2010-1, Class A2, 1.715%, 7/25/2025(b) | | | 387,974 | |
| | | | | | | | |
| | | | | | | 1,818,690 | |
| | | | | | | | |
See accompanying notes to financial statements.
37 |
Portfolio of Investments – as of September 30, 2016
Loomis Sayles Intermediate Duration Bond Fund – (continued)
| | | | | | | | |
Principal
Amount | | | Description | | Value (†) | |
| | | | Aerospace & Defense — 0.3% | |
| $ | 54,000 | | | Rockwell Collins, Inc., 1.200%, 12/15/2016(b) | | $ | 54,035 | |
| | 450,000 | | | Rolls-Royce PLC, 2.375%, 10/14/2020, 144A | | | 457,754 | |
| | | | | | | | |
| | | | | | | 511,789 | |
| | | | | | | | |
| | | | Agency Commercial Mortgage-Backed Securities — 4.5% | |
| | 648,018 | | | FHLMC Multifamily Structured Pass Through Certificates, Series K013, Class A2, 3.974%, 1/25/2021 | | | 710,644 | |
| | 509,476 | | | FHLMC Multifamily Structured Pass Through Certificates, Series K029, Class A2, 3.320%, 2/25/2023(b) | | | 556,115 | |
| | 701,647 | | | FHLMC Multifamily Structured Pass Through Certificates, Series K042, Class A2, 2.670%, 12/25/2024 | | | 737,552 | |
| | 371,879 | | | FHLMC Multifamily Structured Pass Through Certificates, Series K704, Class A2, 2.412%, 8/25/2018 | | | 378,797 | |
| | 923,523 | | | FHLMC Multifamily Structured Pass Through Certificates, Series K708, Class A2, 2.130%, 1/25/2019 | | | 939,171 | |
| | 321,775 | | | FHLMC Multifamily Structured Pass Through Certificates, Series K709, Class A2, 2.086%, 3/25/2019 | | | 327,282 | |
| | 1,304,975 | | | FHLMC Multifamily Structured Pass Through Certificates, Series K710, Class A2, 1.883%, 5/25/2019 | | | 1,323,249 | |
| | 1,014,484 | | | FHLMC Multifamily Structured Pass Through Certificates, Series K711, Class A2, 1.730%, 7/25/2019 | | | 1,025,536 | |
| | 625,673 | | | FHLMC Multifamily Structured Pass Through Certificates, Series KLH2, Class A, 1.225%, 11/25/2022(b) | | | 626,457 | |
| | 603,327 | | | FHLMC Multifamily Structured Pass Through Certificates, Series KP03, Class A2, 1.780%, 7/25/2019 | | | 608,881 | |
| | | | | | | | |
| | | | | | | 7,233,684 | |
| | | | | | | | |
| | | | Airlines — 0.6% | |
| | 485,000 | | | American Airlines Pass Through Trust, Series 2016-3, Class A, 3.250%, 4/15/2030 | | | 487,488 | |
| | 74,239 | | | Delta Air Lines Pass Through Trust, Series 2009-1, Class A, 7.750%, 6/17/2021 | | | 83,919 | |
| | 371,435 | | | Latam Airlines Pass Through Trust, Series 2015-1, Class A, 4.200%, 8/15/2029 | | | 363,078 | |
| | | | | | | | |
| | | | | | | 934,485 | |
| | | | | | | | |
| | | | Automotive — 1.9% | |
| | 500,000 | | | American Honda Finance Corp., MTN, 1.200%, 7/12/2019 | | | 497,071 | |
| | 447,000 | | | American Honda Finance Corp., MTN, 1.600%, 7/13/2018 | | | 450,681 | |
| | 585,000 | | | BMW U.S. Capital LLC, 1.850%, 9/15/2021, 144A | | | 583,332 | |
| | 220,000 | | | Daimler Finance North America LLC, 2.450%, 5/18/2020, 144A | | | 224,644 | |
| | 45,000 | | | Delphi Automotive PLC, 3.150%, 11/19/2020 | | | 46,594 | |
| | 360,000 | | | Ford Motor Credit Co. LLC, 2.459%, 3/27/2020 | | | 363,359 | |
| | 326,000 | | | General Motors Financial Co., Inc., 3.450%, 4/10/2022 | | | 330,664 | |
| | 331,000 | | | General Motors Financial Co., Inc., 4.250%, 5/15/2023 | | | 343,785 | |
| | 103,000 | | | Magna International, Inc., 3.625%, 6/15/2024 | | | 108,271 | |
| | 150,000 | | | PACCAR Financial Corp., MTN, 1.200%, 8/12/2019 | | | 149,559 | |
| | | | | | | | |
| | | | | | | 3,097,960 | |
| | | | | | | | |
See accompanying notes to financial statements.
| 38
Portfolio of Investments – as of September 30, 2016
Loomis Sayles Intermediate Duration Bond Fund – (continued)
| | | | | | | | |
Principal
Amount | | | Description | | Value (†) | |
| | | | Banking — 15.1% | |
| $ | 530,000 | | | ABN AMRO Bank NV, 1.800%, 9/20/2019, 144A | | $ | 530,456 | |
| | 105,000 | | | Bank of America Corp., 6.000%, 9/01/2017 | | | 109,182 | |
| | 365,000 | | | Bank of Montreal, MTN, 1.500%, 7/18/2019 | | | 364,228 | |
| | 700,000 | | | Bank of Montreal, MTN, 1.900%, 8/27/2021 | | | 696,344 | |
| | 49,000 | | | Bank of Montreal, MTN, 1.400%, 9/11/2017 | | | 49,030 | |
| | 415,000 | | | Bank of New York Mellon Corp. (The), MTN, 2.450%, 8/17/2026 | | | 412,461 | |
| | 845,000 | | | Bank of Nova Scotia, 1.650%, 6/14/2019 | | | 846,494 | |
| | 505,000 | | | Barclays PLC, 3.200%, 8/10/2021 | | | 507,655 | |
| | 295,000 | | | Bear Stearns Cos. LLC (The), 7.250%, 2/01/2018 | | | 316,801 | |
| | 490,000 | | | BNZ International Funding Ltd., 2.100%, 9/14/2021, 144A | | | 487,781 | |
| | 750,000 | | | Canadian Imperial Bank of Commerce, 1.600%, 9/06/2019 | | | 750,005 | |
| | 520,000 | | | Capital One NA, 2.250%, 9/13/2021 | | | 519,803 | |
| | 220,000 | | | Citigroup, Inc., 4.450%, 9/29/2027 | | | 230,224 | |
| | 430,000 | | | Citizens Bank NA, Series BKNT, 2.500%, 3/14/2019 | | | 436,988 | |
| | 250,000 | | | Comerica Bank, 2.500%, 6/02/2020 | | | 255,307 | |
| | 745,000 | | | Commonwealth Bank of Australia, 2.000%, 9/06/2021, 144A | | | 743,976 | |
| | 485,000 | | | Cooperatieve Rabobank UA, 4.625%, 12/01/2023 | | | 523,754 | |
| | 450,000 | | | Credit Suisse Group Funding Guernsey Ltd., 3.800%, 6/09/2023, 144A | | | 455,976 | |
| | 525,000 | | | Danske Bank AS, 2.000%, 9/08/2021, 144A | | | 524,652 | |
| | 693,000 | | | Deutsche Bank AG, GMTN, 3.375%, 5/12/2021 | | | 677,893 | |
| | 780,000 | | | Fifth Third Bank, Series BKNT, 1.625%, 9/27/2019 | | | 779,556 | |
| | 215,000 | | | Goldman Sachs Group, Inc. (The), 2.750%, 9/15/2020 | | | 220,230 | |
| | 259,000 | | | Goldman Sachs Group, Inc. (The), 5.950%, 1/18/2018 | | | 273,254 | |
| | 185,000 | | | HSBC USA, Inc., 2.375%, 11/13/2019 | | | 187,273 | |
| | 430,000 | | | ING Bank NV, 2.050%, 8/15/2021, 144A | | | 430,476 | |
| | 246,000 | | | JPMorgan Chase & Co., 6.000%, 1/15/2018 | | | 259,903 | |
| | 585,000 | | | JPMorgan Chase Bank NA, 1.650%, 9/23/2019 | | | 586,845 | |
| | 555,000 | | | Key Bank NA, Series BKNT, 1.600%, 8/22/2019 | | | 555,047 | |
| | 445,000 | | | Lloyds Bank PLC, 1.750%, 3/16/2018 | | | 445,255 | |
| | 532,000 | | | Macquarie Bank Ltd., 1.600%, 10/27/2017, 144A | | | 532,810 | |
| | 116,000 | | | Merrill Lynch & Co., Inc., MTN, 6.875%, 4/25/2018 | | | 125,148 | |
| | 219,000 | | | Merrill Lynch & Co., Inc., Series C, GMTN, 6.400%, 8/28/2017 | | | 228,489 | |
| | 460,000 | | | Mizuho Bank Ltd., 1.800%, 3/26/2018, 144A | | | 460,948 | |
| | 535,000 | | | Morgan Stanley, Series F, GMTN, 6.625%, 4/01/2018 | | | 573,242 | |
| | 295,000 | | | National Bank of Canada, 2.100%, 12/14/2018 | | | 298,749 | |
| | 540,000 | | | Nordea Bank AB, 1.625%, 9/30/2019, 144A | | | 539,152 | |
| | 317,000 | | | Royal Bank of Canada, 1.400%, 10/13/2017 | | | 317,168 | |
| | 652,000 | | | Royal Bank of Canada, GMTN, 1.625%, 4/15/2019 | | | 653,470 | |
| | 305,000 | | | Santander Bank NA, 2.000%, 1/12/2018 | | | 305,038 | |
| | 604,000 | | | Santander Holdings USA, Inc., 2.700%, 5/24/2019 | | | 611,542 | |
| | 365,000 | | | Santander UK Group Holdings PLC, 4.750%, 9/15/2025, 144A | | | 365,410 | |
| | 380,000 | | | Santander UK PLC, 2.500%, 3/14/2019 | | | 385,666 | |
| | 675,000 | | | Skandinaviska Enskilda Banken AB, 1.875%, 9/13/2021 | | | 669,634 | |
| | 815,000 | | | Societe Generale S.A., 5.000%, 1/17/2024, 144A | | | 850,982 | |
| | 370,000 | | | Standard Chartered PLC, 4.050%, 4/12/2026, 144A | | | 381,522 | |
| | 875,000 | | | Sumitomo Mitsui Financial Group, Inc., 2.058%, 7/14/2021 | | | 867,867 | |
| | 525,000 | | | Svenska Handelsbanken AB, Series BKNT, 1.500%, 9/06/2019 | | | 523,283 | |
See accompanying notes to financial statements.
39 |
Portfolio of Investments – as of September 30, 2016
Loomis Sayles Intermediate Duration Bond Fund – (continued)
| | | | | | | | |
Principal
Amount | | | Description | | Value (†) | |
| | | | Banking — continued | |
| $ | 335,000 | | | Svenska Handelsbanken AB, Series BKNT, 1.875%, 9/07/2021 | | $ | 333,176 | |
| | 740,000 | | | Toronto-Dominion Bank (The), GMTN, 1.450%, 9/06/2018 | | | 741,297 | |
| | 620,000 | | | UBS Group Funding Jersey Ltd., 2.650%, 2/01/2022, 144A | | | 618,846 | |
| | 770,000 | | | Wells Fargo Bank NA, 1.750%, 5/24/2019 | | | 773,464 | |
| | 60,000 | | | Westpac Banking Corp., 2.000%, 8/19/2021 | | | 59,903 | |
| | | | | | | | |
| | | | | | | 24,393,655 | |
| | | | | | | | |
| | | | Brokerage — 0.3% | |
| | 390,000 | | | Ameriprise Financial, Inc., 2.875%, 9/15/2026 | | | 390,919 | |
| | 75,000 | | | Brookfield Finance, Inc., 4.250%, 6/02/2026 | | | 77,461 | |
| | | | | | | | |
| | | | | | | 468,380 | |
| | | | | | | | |
| | | | Building Materials — 0.1% | |
| | 107,000 | | | Fortune Brands Home & Security, Inc., 3.000%, 6/15/2020 | | | 110,182 | |
| | 40,000 | | | Masco Corp., 3.500%, 4/01/2021 | | | 41,400 | |
| | 27,000 | | | Masco Corp., 7.125%, 3/15/2020 | | | 31,050 | |
| | | | | | | | |
| | | | | | | 182,632 | |
| | | | | | | | |
| | | | Cable Satellite — 0.1% | |
| | 170,000 | | | Cox Enterprises, Inc., 7.375%, 7/15/2027, 144A | | | 208,674 | |
| | | | | | | | |
| | | | Chemicals — 0.8% | |
| | 535,000 | | | Air Liquide Finance S.A., 2.500%, 9/27/2026, 144A | | | 537,033 | |
| | 107,000 | | | Airgas, Inc., 3.050%, 8/01/2020 | | | 111,042 | |
| | 107,000 | | | Albemarle Corp., 3.000%, 12/01/2019 | | | 110,394 | |
| | 125,000 | | | Eastman Chemical Co., 4.500%, 1/15/2021 | | | 136,319 | |
| | 45,000 | | | Methanex Corp., 3.250%, 12/15/2019 | | | 44,492 | |
| | 360,000 | | | Westlake Chemical Corp., 3.600%, 8/15/2026, 144A | | | 361,021 | |
| | | | | | | | |
| | | | | | | 1,300,301 | |
| | | | | | | | |
| | | | Collateralized Mortgage Obligations — 1.8% | |
| | 230,741 | | | Government National Mortgage Association, Series 2014-H14, Class FA, 0.994%, 7/20/2064(b) | | | 229,406 | |
| | 162,632 | | | Government National Mortgage Association, Series 2014-H15, Class FA, 0.994%, 7/20/2064(b) | | | 161,583 | |
| | 629,014 | | | Government National Mortgage Association, Series 2015-H10, Class JA, 2.250%, 4/20/2065 | | | 629,580 | |
| | 642,084 | | | Government National Mortgage Association, Series 2016-H06, Class FC, 1.414%, 2/20/2066(b) | | | 646,735 | |
| | 1,313,210 | | | Government National Mortgage Association, Series 2016-H10, Class FJ, 1.123%, 4/20/2066(b) | | | 1,312,741 | |
| | | | | | | | |
| | | | | | | 2,980,045 | |
| | | | | | | | |
| | | | Construction Machinery — 0.8% | |
| | 835,000 | | | Caterpillar Financial Services Corp., 1.700%, 8/09/2021 | | | 828,485 | |
| | 174,000 | | | John Deere Capital Corp., 2.450%, 9/11/2020 | | | 179,247 | |
| | 220,000 | | | John Deere Capital Corp., MTN, 1.250%, 10/09/2019 | | | 218,560 | |
| | | | | | | | |
| | | | | | | 1,226,292 | |
| | | | | | | | |
See accompanying notes to financial statements.
| 40
Portfolio of Investments – as of September 30, 2016
Loomis Sayles Intermediate Duration Bond Fund – (continued)
| | | | | | | | |
Principal
Amount | | | Description | | Value (†) | |
| | | | Consumer Cyclical Services — 0.3% | |
| $ | 225,000 | | | Alibaba Group Holding Ltd., 2.500%, 11/28/2019 | | $ | 229,513 | |
| | 67,000 | | | Western Union Co. (The), 3.350%, 5/22/2019 | | | 68,647 | |
| | 116,000 | | | Western Union Co. (The), 3.650%, 8/22/2018 | | | 119,627 | |
| | | | | | | | |
| | | | | | | 417,787 | |
| | | | | | | | |
| | | | Diversified Manufacturing — 0.7% | |
| | 430,000 | | | 3M Co., 2.250%, 9/19/2026 | | | 429,435 | |
| | 650,000 | | | Siemens Financieringsmaatschappij NV, 1.700%, 9/15/2021, 144A | | | 645,065 | |
| | 80,000 | | | Snap-On, Inc., 4.250%, 1/15/2018 | | | 83,016 | |
| | | | | | | | |
| | | | | | | 1,157,516 | |
| | | | | | | | |
| | | | Electric — 2.4% | |
| | 197,000 | | | Delmarva Power & Light Co., 3.500%, 11/15/2023 | | | 213,137 | |
| | 385,000 | | | DTE Energy Co., 2.850%, 10/01/2026 | | | 383,476 | |
| | 510,000 | | | Duke Energy Corp., 2.650%, 9/01/2026 | | | 500,446 | |
| | 130,000 | | | Duke Energy Progress LLC, 1.035%, 3/06/2017(b) | | | 130,082 | |
| | 280,000 | | | Entergy Louisiana LLC, 3.050%, 6/01/2031 | | | 287,483 | |
| | 451,000 | | | Exelon Corp., 2.450%, 4/15/2021 | | | 460,005 | |
| | 179,000 | | | Exelon Generation Co. LLC, 2.950%, 1/15/2020 | | | 184,493 | |
| | 116,000 | | | Exelon Generation Co. LLC, 4.250%, 6/15/2022 | | | 124,492 | |
| | 395,000 | | | Fortis, Inc., 2.100%, 10/04/2021, 144A | | | 393,554 | |
| | 188,000 | | | National Rural Utilities Cooperative Finance Corp., (fixed rate to 4/30/2023, variable rate thereafter), 4.750%, 4/30/2043 | | | 190,880 | |
| | 280,000 | | | NextEra Energy Capital Holdings, Inc., 1.649%, 9/01/2018 | | | 281,106 | |
| | 456,000 | | | NextEra Energy Capital Holdings, Inc., Series F, 2.056%, 9/01/2017 | | | 458,474 | |
| | 273,000 | | | Southern Co. (The), 2.750%, 6/15/2020 | | | 281,593 | |
| | | | | | | | |
| | | | | | | 3,889,221 | |
| | | | | | | | |
| | | | Finance Companies — 0.5% | |
| | 617,000 | | | Ares Capital Corp., 3.625%, 1/19/2022 | | | 621,019 | |
| | 228,000 | | | FS Investment Corp., 4.750%, 5/15/2022 | | | 234,244 | |
| | | | | | | | |
| | | | | | | 855,263 | |
| | | | | | | | |
| | | | Food & Beverage — 0.4% | |
| | 9,000 | | | Anheuser-Busch Cos. LLC, 5.000%, 3/01/2019 | | | 9,753 | |
| | 158,000 | | | Coca-Cola Co. (The), 3.300%, 9/01/2021 | | | 170,434 | |
| | 340,000 | | | Flowers Foods, Inc., 3.500%, 10/01/2026 | | | 339,263 | |
| | 175,000 | | | Hershey Co. (The), 2.300%, 8/15/2026 | | | 173,375 | |
| | | | | | | | |
| | | | | | | 692,825 | |
| | | | | | | | |
| | | | Government Owned – No Guarantee — 1.2% | |
| | 397,000 | | | Ecopetrol S.A., 5.875%, 9/18/2023 | | | 428,264 | |
| | 775,000 | | | Petroleos Mexicanos, 4.625%, 9/21/2023, 144A | | | 776,085 | |
| | 780,000 | | | Sinopec Group Overseas Development 2016 Ltd., 1.750%, 9/29/2019, 144A | | | 774,789 | |
| | | | | | | | |
| | | | | | | 1,979,138 | |
| | | | | | | | |
| | | | Health Insurance — 0.4% | |
| | 695,000 | | | Aetna, Inc., 1.700%, 6/07/2018 | | | 697,214 | |
| | | | | | | | |
See accompanying notes to financial statements.
41 |
Portfolio of Investments – as of September 30, 2016
Loomis Sayles Intermediate Duration Bond Fund – (continued)
| | | | | | | | |
Principal
Amount | | | Description | | Value (†) | |
| | | | Healthcare — 0.6% | |
| $ | 41,000 | | | Agilent Technologies, Inc., 6.500%, 11/01/2017 | | $ | 43,175 | |
| | 245,000 | | | Express Scripts Holding Co., 3.000%, 7/15/2023 | | | 248,845 | |
| | 183,000 | | | Life Technologies Corp., 6.000%, 3/01/2020 | | | 204,634 | |
| | 36,000 | | | Quest Diagnostics, Inc., 4.700%, 4/01/2021 | | | 39,890 | |
| | 94,000 | | | Quest Diagnostics, Inc., 4.750%, 1/30/2020 | | | 102,271 | |
| | 385,000 | | | Thermo Fisher Scientific, Inc., 2.950%, 9/19/2026 | | | 382,083 | |
| | | | | | | | |
| | | | | | | 1,020,898 | |
| | | | | | | | |
| | | | Hybrid ARMs — 0.2% | |
| | 64,056 | | | FHLMC, 2.691%, 1/01/2035(b) | | | 67,772 | |
| | 188,352 | | | FHLMC, 2.946%, 5/01/2036(b) | | | 200,627 | |
| | | | | | | | |
| | | | | | | 268,399 | |
| | | | | | | | |
| | | | Independent Energy — 0.4% | |
| | 14,000 | | | Anadarko Petroleum Corp., 6.375%, 9/15/2017 | | | 14,596 | |
| | 107,000 | | | ConocoPhillips Co., 2.875%, 11/15/2021 | | | 109,931 | |
| | 156,000 | | | Devon Energy Corp., 5.850%, 12/15/2025 | | | 175,559 | |
| | 179,000 | | | Encana Corp., 6.500%, 5/15/2019 | | | 193,300 | |
| | 103,000 | | | Newfield Exploration Co., 5.750%, 1/30/2022 | | | 106,347 | |
| | | | | | | | |
| | | | | | | 599,733 | |
| | | | | | | | |
| | | | Industrial Other — 0.4% | |
| | 245,000 | | | CK Hutchison International 16 Ltd., 2.750%, 10/03/2026, 144A | | | 241,250 | |
| | 440,000 | | | Hutchison Whampoa International 14 Ltd., 1.625%, 10/31/2017, 144A | | | 440,301 | |
| | | | | | | | |
| | | | | | | 681,551 | |
| | | | | | | | |
| | | | Integrated Energy — 0.7% | |
| | 540,000 | | | BP Capital Markets PLC, 2.112%, 9/16/2021 | | | 543,138 | |
| | 340,000 | | | BP Capital Markets PLC, 2.750%, 5/10/2023 | | | 345,681 | |
| | 143,000 | | | BP Capital Markets PLC, 3.062%, 3/17/2022 | | | 149,794 | |
| | 94,000 | | | Shell International Finance BV, 1.625%, 11/10/2018 | | | 94,272 | |
| | | | | | | | |
| | | | | | | 1,132,885 | |
| | | | | | | | |
| | | | Life Insurance — 1.1% | |
| | 165,000 | | | AIG Global Funding, 1.650%, 12/15/2017, 144A | | | 165,677 | |
| | 402,000 | | | Jackson National Life Global Funding, 3.050%, 4/29/2026, 144A | | | 408,607 | |
| | 371,000 | | | New York Life Global Funding, 1.450%, 12/15/2017, 144A | | | 372,562 | |
| | 286,000 | | | Prudential Financial, Inc., 3.500%, 5/15/2024 | | | 299,100 | |
| | 344,000 | | | Reliance Standard Life Global Funding II, 2.150%, 10/15/2018, 144A | | | 346,985 | |
| | 63,000 | | | Unum Group, 5.625%, 9/15/2020 | | | 70,334 | |
| | 140,000 | | | Voya Financial, Inc., 3.650%, 6/15/2026 | | | 139,371 | |
| | | | | | | | |
| | | | | | | 1,802,636 | |
| | | | | | | | |
| | | | Media Entertainment — 0.6% | | | | |
| | 95,000 | | | Activision Blizzard, Inc., 2.300%, 9/15/2021, 144A | | | 95,248 | |
| | 112,000 | | | S&P Global, Inc, 3.300%, 8/14/2020 | | | 117,570 | |
| | 290,000 | | | S&P Global, Inc., 2.950%, 1/22/2027, 144A | | | 291,543 | |
| | 49,000 | | | Scripps Networks Interactive, Inc., 3.950%, 6/15/2025 | | | 51,406 | |
| | 395,000 | | | Viacom, Inc., 3.450%, 10/04/2026 | | | 394,886 | |
| | | | | | | | |
| | | | | | | 950,653 | |
| | | | | | | | |
See accompanying notes to financial statements.
| 42
Portfolio of Investments – as of September 30, 2016
Loomis Sayles Intermediate Duration Bond Fund – (continued)
| | | | | | | | |
Principal
Amount | | | Description | | Value (†) | |
| | | | Metals & Mining — 0.5% | | | | |
| $ | 125,000 | | | Alcoa, Inc., 6.750%, 7/15/2018 | | $ | 134,687 | |
| | 164,000 | | | Barrick North America Finance LLC, 4.400%, 5/30/2021 | | | 179,647 | |
| | 273,000 | | | Glencore Funding LLC, 2.125%, 4/16/2018, 144A | | | 270,739 | |
| | 31,000 | | | Reliance Steel & Aluminum Co., 4.500%, 4/15/2023 | | | 32,401 | |
| | 169,000 | | | Rio Tinto Finance USA PLC, 3.500%, 3/22/2022 | | | 182,355 | |
| | | | | | | | |
| | | | | | | 799,829 | |
| | | | | | | | |
| | | | Midstream — 1.0% | | | | |
| | 116,000 | | | DCP Midstream Operating LP, 4.950%, 4/01/2022 | | | 118,175 | |
| | 255,000 | | | Energy Transfer Partners LP, 2.500%, 6/15/2018 | | | 256,668 | |
| | 125,000 | | | Energy Transfer Partners LP, 4.650%, 6/01/2021 | | | 132,778 | |
| | 246,000 | | | Kinder Morgan Energy Partners LP, 4.150%, 3/01/2022 | | | 258,157 | |
| | 255,000 | | | Kinder Morgan, Inc., 5.625%, 11/15/2023, 144A | | | 281,147 | |
| | 117,000 | | | National Fuel Gas Co., 5.200%, 7/15/2025 | | | 126,480 | |
| | 125,000 | | | Plains All American Pipeline LP/PAA Finance Corp., 3.650%, 6/01/2022 | | | 126,710 | |
| | 160,000 | | | Plains All American Pipeline LP/PAA Finance Corp., 3.850%, 10/15/2023 | | | 159,152 | |
| | 45,000 | | | TransCanada PipeLines Ltd., 2.500%, 8/01/2022 | | | 45,133 | |
| | 143,000 | | | Williams Partners LP, 3.600%, 3/15/2022 | | | 145,484 | |
| | | | | | | | |
| | | | | | | 1,649,884 | |
| | | | | | | | |
| | | | Mortgage Related — 3.3% | | | | |
| | 5,641 | | | FHLMC, 3.000%, 10/01/2026 | | | 5,927 | |
| | 609 | | | FHLMC, 6.500%, 1/01/2024 | | | 698 | |
| | 100 | | | FHLMC, 8.000%, 7/01/2025 | | | 114 | |
| | 217 | | | FNMA, 6.000%, 9/01/2021 | | | 223 | |
| | 247,745 | | | GNMA, 4.285%, 2/20/2063 | | | 267,293 | |
| | 467,595 | | | GNMA, 4.329%, 2/20/2063 | | | 501,264 | |
| | 198,923 | | | GNMA, 4.483%, 10/20/2062 | | | 213,438 | |
| | 438,458 | | | GNMA, 4.501%, 4/20/2063 | | | 471,948 | |
| | 253,140 | | | GNMA, 4.508%, 4/20/2063 | | | 272,490 | |
| | 279,285 | | | GNMA, 4.511%, 5/20/2062 | | | 296,033 | |
| | 218,574 | | | GNMA, 4.514%, 5/20/2062 | | | 231,354 | |
| | 245,131 | | | GNMA, 4.560%, 3/20/2063 | | | 263,939 | |
| | 233,734 | | | GNMA, 4.561%, 3/20/2062 | | | 247,357 | |
| | 282,036 | | | GNMA, 4.571%, 2/20/2063 | | | 301,911 | |
| | 161,377 | | | GNMA, 4.586%, 7/20/2062 | | | 171,998 | |
| | 204,897 | | | GNMA, 4.595%, 6/20/2062 | | | 216,863 | |
| | 423,371 | | | GNMA, 4.624%, 11/20/2064 | | | 450,261 | |
| | 233,197 | | | GNMA, 4.683%, 8/20/2061 | | | 242,382 | |
| | 581,300 | | | GNMA, 4.687%, 5/20/2064 | | | 657,457 | |
| | 1,969 | | | GNMA, 6.500%, 12/15/2023 | | | 2,270 | |
| | 306 | | | GNMA, 8.500%, 9/15/2022 | | | 311 | |
| | 840 | | | GNMA, 9.500%, 1/15/2019 | | | 892 | |
| | 489,227 | | | Government National Mortgage Association, Series 2015-H09, Class HA, 1.750%, 3/20/2065 | | | 489,673 | |
| | | | | | | | |
| | | | | | | 5,306,096 | |
| | | | | | | | |
See accompanying notes to financial statements.
43 |
Portfolio of Investments – as of September 30, 2016
Loomis Sayles Intermediate Duration Bond Fund – (continued)
| | | | | | | | |
Principal
Amount | | | Description | | Value (†) | |
| | | | Natural Gas — 0.1% | | | | |
| $ | 107,000 | | | NiSource Finance Corp., 6.125%, 3/01/2022 | | $ | 127,673 | |
| | | | | | | | |
| | | | Non-Agency Commercial Mortgage-Backed Securities — 9.2% | | | | |
| | 33,483 | | | Banc of America Merrill Lynch Commercial Mortgage, Inc., Series 2007-5, Class A4, 5.492%, 2/10/2051 | | | 34,258 | |
| | 491,600 | | | CFCRE Commercial Mortgage Trust, Series 2016-C3, Class A3, 3.865%, 1/10/2048 | | | 540,907 | |
| | 361,996 | | | CFCRE Commercial Mortgage Trust, Series 2016-C4, Class A4, 3.283%, 5/10/2058 | | | 380,316 | |
| | 992,138 | | | Citigroup Commercial Mortgage Trust, Series 2016-GC37, Class A4, 3.314%, 4/10/2049 | | | 1,053,170 | |
| | 295,000 | | | Citigroup Commercial Mortgage Trust, Series 2016-P4, Class A2, 2.450%, 7/10/2049 | | | 302,467 | |
| | 435,000 | | | Commercial Mortgage Pass Through Certificates, Series 2012-LTRT, Class A2, 3.400%, 10/05/2030, 144A | | | 452,372 | |
| | 263,676 | | | Commercial Mortgage Pass Through Certificates, Series 2013-CR8, Class A5, 3.612%, 6/10/2046(b) | | | 285,927 | |
| | 84,913 | | | Commercial Mortgage Pass Through Certificates, Series 2014-CR14, Class A2, 3.147%, 2/10/2047 | | | 87,023 | |
| | 232,393 | | | Commercial Mortgage Pass Through Certificates, Series 2014-CR15, Class A2, 2.928%, 2/10/2047 | | | 239,043 | |
| | 205,578 | | | Commercial Mortgage Pass Through Certificates, Series 2014-CR16, Class ASB, 3.653%, 4/10/2047 | | | 221,197 | |
| | 478,193 | | | Commercial Mortgage Pass Through Certificates, Series 2014-LC17, Class A3, 3.723%, 10/10/2047 | | | 508,868 | |
| | 730,000 | | | Commercial Mortgage Pass Through Certificates, Series 2014-TWC, Class A, 1.377%, 2/13/2032, 144A(b) | | | 728,342 | |
| | 804,436 | | | Commercial Mortgage Pass Through Certificates, Series 2016-DC2, Class A5, 3.765%, 2/10/2049 | | | 881,432 | |
| | 226,424 | | | Credit Suisse Mortgage Capital Certificates, Series 2007-C3, Class A4, 5.881%, 6/15/2039(b) | | | 228,786 | |
| | 153,683 | | | Credit Suisse Mortgage Capital Certificates, Series 2007-C4, Class A4, 6.134%, 9/15/2039(b) | | | 157,174 | |
| | 308,963 | | | Credit Suisse Mortgage Capital Certificates, Series 2007-C5, Class A4, 5.695%, 9/15/2040(b) | | | 316,050 | |
| | 84,913 | | | CSAIL Commercial Mortgage Trust, Series 2015-C4, Class ASB, 3.617%, 11/15/2048 | | | 91,358 | |
| | 222,006 | | | GP Portfolio Trust, Series 2014-GPP, Class A, 1.474%, 2/15/2027, 144A(b) | | | 221,651 | |
| | 228,914 | | | Greenwich Capital Commercial Funding Corp., Series 2007-GG11, Class A4, 5.736%, 12/10/2049 | | | 234,962 | |
| | 203,942 | | | Greenwich Capital Commercial Funding Corp., Series 2007-GG9, Class A4, 5.444%, 3/10/2039 | | | 204,242 | |
| | 340,000 | | | GS Mortgage Securities Corp. Trust, Series 2013-PEMB, Class A, 3.668%, 3/05/2033, 144A(b) | | | 354,829 | |
| | 875,844 | | | GS Mortgage Securities Trust, Series 2007-GG10, Class A4, 5.988%, 8/10/2045(b) | | | 889,058 | |
| | 236,862 | | | GS Mortgage Securities Trust, Series 2014-GC20, Class A3, 3.680%, 4/10/2047 | | | 251,695 | |
See accompanying notes to financial statements.
| 44
Portfolio of Investments – as of September 30, 2016
Loomis Sayles Intermediate Duration Bond Fund – (continued)
| | | | | | | | |
Principal
Amount | | | Description | | Value (†) | |
| | | | Non-Agency Commercial Mortgage-Backed Securities — continued | | | | |
| $ | 344,622 | | | JPMorgan Chase Commercial Mortgage Securities Trust, Series 2007-LD11, Class A4, 5.940%, 6/15/2049(b) | | $ | 349,364 | |
| | 88,049 | | | JPMorgan Chase Commercial Mortgage Securities Trust, Series 2007-LDPX, Class A3, 5.420%, 1/15/2049 | | | 88,705 | |
| | 120,665 | | | JPMorgan Chase Commercial Mortgage Securities Trust, Series 2014-C19, Class ASB, 3.584%, 4/15/2047 | | | 129,835 | |
| | 313,755 | | | JPMorgan Chase Commercial Mortgage Securities Trust, Series 2014-FL5, Class A, 1.504%, 7/15/2031, 144A(b) | | | 313,618 | |
| | 520,000 | | | JPMorgan Chase Commercial Mortgage Securities Trust, Series 2015-SGP, Class A, 2.224%, 7/15/2036, 144A(b) | | | 522,930 | |
| | 276,271 | | | Merrill Lynch Mortgage Trust, Series 2007-C1, Class A4, 6.008%, 6/12/2050(b) | | | 280,992 | |
| | 389,059 | | | Merrill Lynch/Countrywide Commercial Mortgage Trust, Series 2007-5, Class A4, 5.378%, 8/12/2048 | | | 390,944 | |
| | 211,835 | | | Merrill Lynch/Countrywide Commercial Mortgage Trust, Series 2007-6, Class A4, 5.485%, 3/12/2051(b) | | | 213,962 | |
| | 263,676 | | | Morgan Stanley Bank of America Merrill Lynch Trust, Series 2014-C14, Class A3, 3.669%, 2/15/2047 | | | 280,965 | |
| | 129,604 | | | Morgan Stanley Bank of America Merrill Lynch Trust, Series 2015-C22, Class A4, 3.306%, 4/15/2048 | | | 138,137 | |
| | 701,647 | | | Morgan Stanley Capital I Trust, Series 2007-IQ14, Class A4, 5.692%, 4/15/2049(b) | | | 709,284 | |
| | 185,000 | | | SCG Trust, Series 2013-SRP1, Class B, 3.024%, 11/15/2026, 144A(b) | | | 178,739 | |
| | 505,000 | | | UBS-Barclays Commercial Mortgage Trust, Series 2012-TFT, Class A, 2.892%, 6/05/2030, 144A | | | 510,114 | |
| | 366,465 | | | Wachovia Bank Commercial Mortgage Trust, Series 2007-C32, Class A3, 5.889%, 6/15/2049(b) | | | 372,496 | |
| | 376,025 | | | Wachovia Bank Commercial Mortgage Trust, Series 2007-C34, Class A3, 5.678%, 5/15/2046 | | | 382,886 | |
| | 201,109 | | | Wells Fargo Commercial Mortgage Trust, Series 2016-C33, Class A4, 3.426%, 3/15/2059 | | | 214,942 | |
| | 290,000 | | | Wells Fargo Commercial Mortgage Trust, Series 2016-C35, Class A2, 2.495%, 7/15/2048 | | | 298,781 | |
| | 224,134 | | | WFCG Commercial Mortgage Trust, Series 2015-BXRP, Class A, 1.646%, 11/15/2029, 144A(b) | | | 221,092 | |
| | 178,764 | | | WFRBS Commercial Mortgage Trust, Series 2004-C19, Class A3, 3.660%, 3/15/2047 | | | 189,807 | |
| | 348,589 | | | WFRBS Commercial Mortgage Trust, Series 2014-C20, Class ABS, 3.638%, 5/15/2047 | | | 375,868 | |
| | | | | | | | |
| | | | | | | 14,828,588 | |
| | | | | | | | |
| | | | Oil Field Services — 0.2% | | | | |
| | 65,000 | | | Nabors Industries, Inc., 4.625%, 9/15/2021 | | | 61,254 | |
| | 143,000 | | | Oceaneering International, Inc., 4.650%, 11/15/2024 | | | 144,101 | |
| | 89,000 | | | Rowan Cos., Inc., 5.000%, 9/01/2017 | | | 89,556 | |
| | 54,000 | | | Schlumberger Holdings Corp., 3.625%, 12/21/2022, 144A | | | 57,886 | |
| | | | | | | | |
| | | | | | | 352,797 | |
| | | | | | | | |
See accompanying notes to financial statements.
45 |
Portfolio of Investments – as of September 30, 2016
Loomis Sayles Intermediate Duration Bond Fund – (continued)
| | | | | | | | |
Principal
Amount | | | Description | | Value (†) | |
| | | | Pharmaceuticals — 0.9% | | | | |
| $ | 22,000 | | | Amgen, Inc., 2.200%, 5/22/2019 | | $ | 22,409 | |
| | 147,000 | | | Eli Lilly & Co., 1.950%, 3/15/2019 | | | 149,541 | |
| | 215,000 | | | Gilead Sciences, Inc., 2.500%, 9/01/2023 | | | 217,279 | |
| | 259,000 | | | Mylan, Inc., 4.200%, 11/29/2023 | | | 271,034 | |
| | 775,000 | | | Shire Acquisitions Investments Ireland Designated Activity Co., 1.900%, 9/23/2019 | | | 774,602 | |
| | | | | | | | |
| | | | | | | 1,434,865 | |
| | | | | | | | |
| | | | Property & Casualty Insurance — 0.4% | | | | |
| | 245,000 | | | Berkshire Hathaway Finance Corp., 1.300%, 8/15/2019 | | | 245,414 | |
| | 355,000 | | | Old Republic International Corp., 3.875%, 8/26/2026 | | | 354,376 | |
| | | | | | | | |
| | | | | | | 599,790 | |
| | | | | | | | |
| | | | Railroads — 0.5% | | | | |
| | 255,000 | | | Canadian National Railway Co., 1.450%, 12/15/2016 | | | 255,152 | |
| | 206,000 | | | CSX Corp., 3.700%, 10/30/2020 | | | 220,169 | |
| | 27,000 | | | CSX Corp., 6.150%, 5/01/2037 | | | 35,162 | |
| | 215,000 | | | Union Pacific Corp., 3.646%, 2/15/2024 | | | 234,845 | |
| | | | | | | | |
| | | | | | | 745,328 | |
| | | | | | | | |
| | | | REITs – Health Care — 0.6% | | | | |
| | 478,000 | | | HCP, Inc., 4.000%, 12/01/2022 | | | 505,141 | |
| | 31,000 | | | Healthcare Realty Trust, Inc., 3.750%, 4/15/2023 | | | 31,791 | |
| | 385,000 | | | Ventas Realty LP, 3.250%, 10/15/2026 | | | 388,598 | |
| | | | | | | | |
| | | | | | | 925,530 | |
| | | | | | | | |
| | | | REITs – Single Tenant — 0.1% | | | | |
| | 179,000 | | | Realty Income Corp., 5.875%, 3/15/2035 | | | 220,212 | |
| | | | | | | | |
| | | | Retailers — 0.8% | | | | |
| | 335,000 | | | El Puerto de Liverpool SAB de CV, 3.875%, 10/06/2026, 144A | | | 330,645 | |
| | 220,000 | | | Home Depot, Inc. (The), 2.125%, 9/15/2026 | | | 216,148 | |
| | 143,000 | | | Ross Stores, Inc., 3.375%, 9/15/2024 | | | 152,041 | |
| | 380,000 | | | TJX Cos., Inc. (The), 2.250%, 9/15/2026 | | | 373,797 | |
| | 180,000 | | | Walgreens Boots Alliance, Inc., 2.600%, 6/01/2021 | | | 184,206 | |
| | | | | | | | |
| | | | | | | 1,256,837 | |
| | | | | | | | |
| | | | Sovereigns — 0.3% | | | | |
| | 455,000 | | | Republic of Turkey, 5.625%, 3/30/2021 | | | 484,575 | |
| | | | | | | | |
| | | | Supermarkets — 0.3% | | | | |
| | 545,000 | | | Kroger Co. (The), 2.650%, 10/15/2026 | | | 540,930 | |
| | | | | | | | |
| | | | Technology — 1.4% | | | | |
| | 49,000 | | | Apple, Inc., 2.700%, 5/13/2022 | | | 51,203 | |
| | 139,000 | | | Apple, Inc., 2.850%, 2/23/2023 | | | 146,327 | |
| | 170,000 | | | Diamond 1 Finance Corp./Diamond 2 Finance Corp., 6.020%, 6/15/2026, 144A | | | 186,372 | |
| | 114,000 | | | Hewlett Packard Enterprise Co., 4.400%, 10/15/2022, 144A | | | 121,559 | |
| | 120,000 | | | Hewlett Packard Enterprise Co., 4.900%, 10/15/2025, 144A | | | 128,077 | |
| | 246,000 | | | HP, Inc., 4.300%, 6/01/2021 | | | 266,065 | |
| | 72,000 | | | Ingram Micro, Inc., 4.950%, 12/15/2024 | | | 72,862 | |
| | 280,000 | | | Intel Corp., 2.600%, 5/19/2026 | | | 285,248 | |
See accompanying notes to financial statements.
| 46
Portfolio of Investments – as of September 30, 2016
Loomis Sayles Intermediate Duration Bond Fund – (continued)
| | | | | | | | |
Principal
Amount | | | Description | | Value (†) | |
| | | | Technology — continued | | | | |
| $ | 89,000 | | | Jabil Circuit, Inc., 5.625%, 12/15/2020 | | $ | 96,120 | |
| | 22,000 | | | Jabil Circuit, Inc., 8.250%, 3/15/2018 | | | 23,951 | |
| | 36,000 | | | KLA-Tencor Corp., 4.125%, 11/01/2021 | | | 38,746 | |
| | 770,000 | | | Pitney Bowes, Inc., 3.375%, 10/01/2021 | | | 769,630 | |
| | 67,000 | | | Xerox Corp., 2.800%, 5/15/2020 | | | 66,620 | |
| | 89,000 | | | Xerox Corp., 6.350%, 5/15/2018 | | | 94,513 | |
| | | | | | | | |
| | | | | | | 2,347,293 | |
| | | | | | | | |
| | | | Tobacco — 0.0% | | | | |
| | 31,000 | | | Philip Morris International, Inc., 2.900%, 11/15/2021 | | | 32,535 | |
| | 5,000 | | | Philip Morris International, Inc., 5.650%, 5/16/2018 | | | 5,347 | |
| | | | | | | | |
| | | | | | | 37,882 | |
| | | | | | | | |
| | | | Transportation Services — 0.3% | | | | |
| | 430,000 | | | TTX Co., 2.600%, 6/15/2020, 144A | | | 438,406 | |
| | | | | | | | |
| | | | Treasuries — 26.1% | | | | |
| | 385,000 | | | U.S. Treasury Note, 0.750%, 7/15/2019 | | | 383,752 | |
| | 775,000 | | | U.S. Treasury Note, 0.750%, 8/15/2019 | | | 772,305 | |
| | 1,585,000 | | | U.S. Treasury Note, 0.875%, 9/15/2019 | | | 1,584,938 | |
| | 2,350,900 | | | U.S. Treasury Note, 1.125%, 2/28/2021 | | | 2,352,369 | |
| | 3,735,000 | | | U.S. Treasury Note, 1.125%, 7/31/2021 | | | 3,729,603 | |
| | 4,730,000 | | | U.S. Treasury Note, 1.125%, 8/31/2021 | | | 4,725,194 | |
| | 661,400 | | | U.S. Treasury Note, 1.250%, 3/31/2021 | | | 664,862 | |
| | 5,966,200 | | | U.S. Treasury Note, 1.375%, 1/31/2021 | | | 6,031,458 | |
| | 1,395,000 | | | U.S. Treasury Note, 1.375%, 5/31/2021 | | | 1,410,094 | |
| | 1,790,000 | | | U.S. Treasury Note, 1.375%, 6/30/2023 | | | 1,786,853 | |
| | 5,191,000 | | | U.S. Treasury Note, 1.500%, 8/15/2026 | | | 5,140,507 | |
| | 3,771,900 | | | U.S. Treasury Note, 1.625%, 6/30/2020 | | | 3,854,116 | |
| | 925,000 | | | U.S. Treasury Note, 1.625%, 5/15/2026 | | | 926,229 | |
| | 782,100 | | | U.S. Treasury Note, 1.750%, 4/30/2022 | | | 802,019 | |
| | 3,003,200 | | | U.S. Treasury Note, 1.750%, 1/31/2023 | | | 3,074,175 | |
| | 2,319,500 | | | U.S. Treasury Note, 1.875%, 8/31/2022 | | | 2,393,525 | |
| | 1,805,500 | | | U.S. Treasury Note, 1.875%, 10/31/2022 | | | 1,862,698 | |
| | 728,500 | | | U.S. Treasury Note, 2.000%, 11/15/2021 | | | 756,900 | |
| | | | | | | | |
| | | | | | | 42,251,597 | |
| | | | | | | | |
| | | | Wireless — 0.3% | | | | |
| | 385,000 | | | Crown Castle International Corp., 4.875%, 4/15/2022 | | | 429,467 | |
| | | | | | | | |
| | | | Wirelines — 0.5% | | | | |
| | 429,000 | | | AT&T, Inc., 3.600%, 2/17/2023 | | | 452,206 | |
| | 400,000 | | | Deutsche Telekom International Finance BV, 1.500%, 9/19/2019, 144A | | | 399,856 | |
| | | | | | | | |
| | | | | | | 852,062 | |
| | | | | | | | |
| | | | Total Non-Convertible Bonds
(Identified Cost $154,018,415) | | | 155,342,664 | |
| | | | | | | | |
See accompanying notes to financial statements.
47 |
Portfolio of Investments – as of September 30, 2016
Loomis Sayles Intermediate Duration Bond Fund – (continued)
| | | | | | | | |
Principal
Amount | | | Description | | Value (†) | |
| | Municipals — 0.2% | | | | |
| | | | New Jersey — 0.2% | | | | |
| $ | 275,000 | | | New Jersey Economic Development Authority Revenue, School Facilities Construction, Refunding, Series QQ, 1.802%, 6/15/2017 (Identified Cost $275,000) | | $ | 276,326 | |
| | | | | | | | |
| | | | Total Bonds and Notes
(Identified Cost $154,293,415) | | | 155,618,990 | |
| | | | | | | | |
| | | | | | | | |
| | Short-Term Investments — 3.7% | | | | |
| | 6,065,192 | | | Tri-Party Repurchase Agreement with Fixed Income Clearing Corporation, dated 9/30/2016 at 0.030% to be repurchased at $6,065,207 on 10/03/2016 collateralized by $5,005,000 U.S. Treasury Note, 2.500% due 8/15/2023 valued at $5,399,144; $795,000 U.S. Treasury Note, 0.750% due 9/30/2018 valued at $795,000 including accrued interest (Note 2 of Notes to Financial Statements) (Identified Cost $6,065,192) | | | 6,065,192 | |
| | | | | | | | |
| | | | | | | | |
| | | | Total Investments — 99.9%
(Identified Cost $160,358,607)(a) | | | 161,684,182 | |
| | | | Other assets less liabilities — 0.1% | | | 129,342 | |
| | | | | | | | |
| | | | Net Assets — 100.0% | | $ | 161,813,524 | |
| | | | | | | | |
| | | | | | | | |
| | (†) | | | See Note 2 of Notes to Financial Statements. | | | | |
| | (a) | | | Federal Tax Information: | | | | |
| | | | At September 30, 2016, the net unrealized appreciation on investments based on a cost of $160,672,016 for federal income tax purposes was as follows: | |
| | | | Aggregate gross unrealized appreciation for all investments in which there is an excess of value over tax cost | | $ | 1,769,978 | |
| | | | Aggregate gross unrealized depreciation for all investments in which there is an excess of tax cost over value | | | (757,812 | ) |
| | | | | | | | |
| | | | Net unrealized appreciation | | $ | 1,012,166 | |
| | | | | | | | |
| | | | | | | | |
| | (b) | | | Variable rate security. Rate as of September 30, 2016 is disclosed. | | | | |
| | (c) | | | Fair valued by the Fund’s adviser. At September 30, 2016, the value of this security amounted to $23,756 or less than 0.1% of net assets. | |
| | | | | | | | |
| | 144A | | | All or a portion of these securities are exempt from registration under Rule 144A of the Securities Act of 1933. These securities may be resold in transactions exempt from registration, normally to qualified institutional buyers. At September 30, 2016, the value of Rule 144A holdings amounted to $32,103,749 or 19.8% of net assets. | |
| | ABS | | | Asset-Backed Securities | | | | |
| | ARMs | | | Adjustable Rate Mortgages | | | | |
| | FHLMC | | | Federal Home Loan Mortgage Corp. | | | | |
| | FNMA | | | Federal National Mortgage Association | | | | |
| | GMTN | | | Global Medium Term Note | | | | |
| | GNMA | | | Government National Mortgage Association | | | | |
| | MTN | | | Medium Term Note | | | | |
| | REITs | | | Real Estate Investment Trusts | | | | |
See accompanying notes to financial statements.
| 48
Portfolio of Investments – as of September 30, 2016
Loomis Sayles Intermediate Duration Bond Fund – (continued)
Industry Summary at September 30, 2016
| | | | |
Treasuries | | | 26.1 | % |
Banking | | | 15.1 | |
Non-Agency Commercial Mortgage-Backed Securities | | | 9.2 | |
ABS Car Loan | | | 7.2 | |
Agency Commercial Mortgage-Backed Securities | | | 4.5 | |
Mortgage Related | | | 3.3 | |
Electric | | | 2.4 | |
ABS Credit Card | | | 2.0 | |
Other Investments, less than 2% each | | | 26.4 | |
Short-Term Investments | | | 3.7 | |
| | | | |
Total Investments | | | 99.9 | |
Other assets less liabilities | | | 0.1 | |
| | | | |
Net Assets | | | 100.0 | % |
| | | | |
See accompanying notes to financial statements.
49 |
Portfolio of Investments – as of September 30, 2016
Loomis Sayles Limited Term Government and Agency Fund
| | | | | | | | |
Principal
Amount | | | Description | | Value (†) | |
| | Bonds and Notes — 98.1% of Net Assets | | | | |
| | | | ABS Car Loan — 1.4% | | | | |
| $ | 1,550,000 | | | Avis Budget Rental Car Funding AESOP LLC, Series 2016-1A, Class A,
2.990%, 6/20/2022, 144A | | $ | 1,588,291 | |
| | 2,210,666 | | | CPS Auto Receivables Trust, Series 2015-C, Class A,
1.770%, 6/17/2019, 144A | | | 2,217,010 | |
| | 2,695,000 | | | Credit Acceptance Auto Loan Trust, Series 2014-2A, Class A,
1.880%, 3/15/2022, 144A | | | 2,700,192 | |
| | 1,825,000 | | | Credit Acceptance Auto Loan Trust, Series 2016-2A, Class A,
2.420%, 11/15/2023, 144A | | | 1,834,738 | |
| | 478,949 | | | First Investors Auto Owner Trust, Series 2014-1A, Class A3,
1.490%, 1/15/2020, 144A | | | 479,113 | |
| | 3,500,000 | | | NextGear Floorplan Master Owner Trust, Series 2014-1A, Class A,
1.920%, 10/15/2019, 144A | | | 3,490,573 | |
| | 725,000 | | | NextGear Floorplan Master Owner Trust, Series 2016-1A, Class A2,
2.740%, 4/15/2021, 144A | | | 725,688 | |
| | | | | | | | |
| | | | | | | 13,035,605 | |
| | | | | | | | |
| | | | ABS Home Equity — 0.7% | | | | |
| | 2,462,863 | | | Home Partners of America Trust, Series 2016-1, Class A,
2.181%, 3/17/2033, 144A(b) | | | 2,478,842 | |
| | 2,148,185 | | | Mill City Mortgage Trust, Series 2015-1, Class A1, 2.230%, 6/25/2056, 144A(b) | | | 2,151,174 | |
| | 1,820,096 | | | Towd Point Mortgage Trust, Series 2015-2, Class 1AE2,
2.750%, 11/25/2060, 144A(b) | | | 1,842,568 | |
| | | | | | | | |
| | | | | | | 6,472,584 | |
| | | | | | | | |
| | | | ABS Student Loan — 0.0% | | | | |
| | 400,000 | | | SoFi Professional Loan Program, Series 2016-D, Class A1,
1.600%, 1/25/2039, 144A(b) | | | 400,000 | |
| | | | | | | | |
| | | | Agency Commercial Mortgage-Backed Securities — 17.5% | | | | |
| | 6,835,078 | | | Federal National Mortgage Association, Series 2015-M17, Class FA,
1.397%, 11/25/2022(b) | | | 6,855,943 | |
| | 1,000,000 | | | Federal National Mortgage Association, Series 2016-M3, Class ASQ2,
2.263%, 2/25/2023 | | | 1,023,941 | |
| | 6,000,000 | | | FHLMC Multifamily Structured Pass Through Certificates, Series K006, Class A2, 4.251%, 1/25/2020 | | | 6,496,807 | |
| | 4,305,000 | | | FHLMC Multifamily Structured Pass Through Certificates, Series K014, Class A2, 3.871%, 4/25/2021 | | | 4,708,702 | |
| | 4,000,000 | | | FHLMC Multifamily Structured Pass Through Certificates, Series K015, Class A2, 3.230%, 7/25/2021 | | | 4,280,541 | |
| | 6,625,000 | | | FHLMC Multifamily Structured Pass Through Certificates, Series K017, Class A2, 2.873%, 12/25/2021 | | | 7,003,968 | |
| | 3,508,587 | | | FHLMC Multifamily Structured Pass Through Certificates, Series K703, Class A2, 2.699%, 5/25/2018 | | | 3,582,093 | |
| | 693,427 | | | FHLMC Multifamily Structured Pass Through Certificates, Series K704, Class A2, 2.412%, 8/25/2018 | | | 706,327 | |
| | 2,590,000 | | | FHLMC Multifamily Structured Pass Through Certificates, Series K706, Class A2, 2.323%, 10/25/2018 | | | 2,639,299 | |
See accompanying notes to financial statements.
| 50
Portfolio of Investments – as of September 30, 2016
Loomis Sayles Limited Term Government and Agency Fund – (continued)
| | | | | | | | |
Principal
Amount | | | Description | | Value (†) | |
| | | | Agency Commercial Mortgage-Backed Securities — continued | | | | |
| $ | 7,896,503 | | | FHLMC Multifamily Structured Pass Through Certificates, Series K708, Class A2, 2.130%, 1/25/2019 | | $ | 8,030,295 | |
| | 34,370,000 | | | FHLMC Multifamily Structured Pass Through Certificates, Series K711, Class A2, 1.730%, 7/25/2019 | | | 34,744,420 | |
| | 5,040,000 | | | FHLMC Multifamily Structured Pass Through Certificates, Series KABM, Class A, 1.225%, 9/25/2022(b) | | | 5,045,945 | |
| | 1,774,943 | | | FHLMC Multifamily Structured Pass Through Certificates, Series KF06, Class A, 0.855%, 11/25/2021(b) | | | 1,771,607 | |
| | 12,048,953 | | | FHLMC Multifamily Structured Pass Through Certificates, Series KF14, Class A, 1.175%, 1/25/2023(b) | | | 12,056,521 | |
| | 5,057,865 | | | FHLMC Multifamily Structured Pass Through Certificates, Series KJ04, Class A1, 1.376%, 10/25/2020 | | | 5,060,538 | |
| | 19,300,000 | | | FHLMC Multifamily Structured Pass Through Certificates, Series KLH2, Class A, 1.225%, 11/25/2022(b) | | | 19,324,183 | |
| | 26,135,000 | | | FHLMC Multifamily Structured Pass Through Certificates, Series KP03, Class A2, 1.780%, 7/25/2019 | | | 26,375,581 | |
| | 216,741 | | | Government National Mortgage Association, Series 2003-72, Class Z,
5.247%, 11/16/2045(b) | | | 236,368 | |
| | 192,529 | | | Government National Mortgage Association, Series 2003-88, Class Z,
4.879%, 3/16/2046(b) | | | 209,133 | |
| | 11,362,046 | | | Government National Mortgage Association, Series 2013-52, Class KX,
3.534%, 8/16/2051(b) | | | 11,781,022 | |
| | | | | | | | |
| | | | | | | 161,933,234 | |
| | | | | | | | |
| | | | Collateralized Mortgage Obligations — 14.4% | | | | |
| | 99,136 | | | Federal Home Loan Mortgage Corp., REMIC, Series 1500, Class FD,
1.210%, 5/15/2023(b)(c) | | | 94,823 | |
| | 65,794 | | | Federal Home Loan Mortgage Corp., REMIC, Series 1552, Class I,
0.910%, 8/15/2023(b)(c) | | | 64,032 | |
| | 253,696 | | | Federal Home Loan Mortgage Corp., REMIC, Series 2131, Class ZB,
6.000%, 3/15/2029(c) | | | 276,662 | |
| | 36,249 | | | Federal Home Loan Mortgage Corp., REMIC, Series 2646, Class FM,
0.924%, 11/15/2032(b)(c) | | | 35,544 | |
| | 1,010,675 | | | Federal Home Loan Mortgage Corp., REMIC, Series 2874, Class BC,
5.000%, 10/15/2019 | | | 1,049,407 | |
| | 1,662,043 | | | Federal Home Loan Mortgage Corp., REMIC, Series 2931, Class DE,
4.000%, 2/15/2020 | | | 1,694,112 | |
| | 1,862,864 | | | Federal Home Loan Mortgage Corp., REMIC, Series 2978, Class JG,
5.500%, 5/15/2035 | | | 2,106,332 | |
| | 2,896,940 | | | Federal Home Loan Mortgage Corp., REMIC, Series 3036, Class NE,
5.000%, 9/15/2035 | | | 3,219,979 | |
| | 375,492 | | | Federal Home Loan Mortgage Corp., REMIC, Series 3057, Class PE,
5.500%, 11/15/2034(c) | | | 373,335 | |
| | 3,126,744 | | | Federal Home Loan Mortgage Corp., REMIC, Series 3412, Class AY,
5.500%, 2/15/2038 | | | 3,387,838 | |
| | 2,053,249 | | | Federal Home Loan Mortgage Corp., REMIC, Series 3561, Class W,
3.287%, 6/15/2048(b) | | | 2,021,516 | |
See accompanying notes to financial statements.
51 |
Portfolio of Investments – as of September 30, 2016
Loomis Sayles Limited Term Government and Agency Fund – (continued)
| | | | | | | | |
Principal
Amount | | | Description | | Value (†) | |
| | | | Collateralized Mortgage Obligations — continued | | | | |
| $ | 2,412,367 | | | Federal Home Loan Mortgage Corp., REMIC, Series 3620, Class AT,
4.265%, 12/15/2036(b) | | $ | 2,539,793 | |
| | 864,469 | | | Federal Home Loan Mortgage Corp., REMIC, Series 4212, Class FW,
2.624%, 6/15/2043(b) | | | 850,702 | |
| | 1,881,772 | | | Federal National Mortgage Association, REMIC, Series 2003-48, Class GH,
5.500%, 6/25/2033 | | | 2,150,590 | |
| | 67,620 | | | Federal National Mortgage Association, REMIC, Series 1992-162, Class FB, 1.470%, 9/25/2022(b)(c) | | | 66,624 | |
| | 63,703 | | | Federal National Mortgage Association, REMIC, Series 1994-42, Class FD,
1.070%, 4/25/2024(b)(c) | | | 62,108 | |
| | 19,066 | | | Federal National Mortgage Association, REMIC, Series 2002-W10, Class A7, 4.034%, 8/25/2042(b)(c) | | | 19,778 | |
| | 1,054,378 | | | Federal National Mortgage Association, REMIC, Series 2005-100, Class BQ, 5.500%, 11/25/2025 | | | 1,160,461 | |
| | 436,099 | | | Federal National Mortgage Association, REMIC, Series 2005-33, Class QD,
5.000%, 1/25/2034(c) | | | 436,062 | |
| | 1,174,444 | | | Federal National Mortgage Association, REMIC, Series 2007-73, Class A1,
0.585%, 7/25/2037(b) | | | 1,151,430 | |
| | 2,288,457 | | | Federal National Mortgage Association, REMIC, Series 2008-86, Class LA,
3.496%, 8/25/2038(b) | | | 2,446,529 | |
| | 5,412,360 | | | Federal National Mortgage Association, REMIC, Series 2013-67, Class NF,
1.525%, 7/25/2043(b) | | | 5,253,004 | |
| | 48,479 | | | Federal National Mortgage Association, REMIC, Series G93-19, Class FD,
1.050%, 4/25/2023(b)(c) | | | 47,266 | |
| | 11,585 | | | FHLMC Structured Pass Through Securities, Series T-60, Class 2A1,
3.479%, 3/25/2044(b)(c) | | | 12,377 | |
| | 877,555 | | | FHLMC Structured Pass Through Securities, Series T-62, Class 1A1,
1.689%, 10/25/2044(b) | | | 895,659 | |
| | 1,359,521 | | | Government National Mortgage Association, Series 2010-H20, Class AF,
0.824%, 10/20/2060(b) | | | 1,347,611 | |
| | 1,209,951 | | | Government National Mortgage Association, Series 2010-H24, Class FA,
0.844%, 10/20/2060(b) | | | 1,199,816 | |
| | 1,112,470 | | | Government National Mortgage Association, Series 2011-H06, Class FA,
0.944%, 2/20/2061(b) | | | 1,107,858 | |
| | 1,973,751 | | | Government National Mortgage Association, Series 2012-124, Class HT,
7.221%, 7/20/2032(b) | | | 2,244,105 | |
| | 3,400,821 | | | Government National Mortgage Association, Series 2012-H15, Class FA,
0.944%, 5/20/2062(b) | | | 3,401,050 | |
| | 1,250,509 | | | Government National Mortgage Association, Series 2012-H18, Class NA,
1.014%, 8/20/2062(b) | | | 1,248,508 | |
| | 6,272,755 | | | Government National Mortgage Association, Series 2012-H29, Class HF,
0.994%, 10/20/2062(b) | | | 6,264,996 | |
| | 5,641,265 | | | Government National Mortgage Association, Series 2013-H02, Class GF,
0.994%, 12/20/2062(b) | | | 5,636,306 | |
| | 4,796,689 | | | Government National Mortgage Association, Series 2013-H08, Class FA,
0.844%, 3/20/2063(b) | | | 4,757,129 | |
| | 3,651,120 | | | Government National Mortgage Association, Series 2013-H10, Class FA,
0.894%, 3/20/2063(b) | | | 3,631,166 | |
See accompanying notes to financial statements.
| 52
Portfolio of Investments – as of September 30, 2016
Loomis Sayles Limited Term Government and Agency Fund – (continued)
| | | | | | | | |
Principal
Amount | | | Description | | Value (†) | |
| | | | Collateralized Mortgage Obligations — continued | | | | |
| $ | 12,020,528 | | | Government National Mortgage Association, Series 2013-H22, Class FT,
1.180%, 4/20/2063(b) | | $ | 12,130,546 | |
| | 6,946,284 | | | Government National Mortgage Association, Series 2014-H14, Class FA,
0.994%, 7/20/2064(b) | | | 6,906,075 | |
| | 4,833,105 | | | Government National Mortgage Association, Series 2014-H15, Class FA, 0.994%, 7/20/2064(b) | | | 4,801,946 | |
| | 10,631,136 | | | Government National Mortgage Association, Series 2015-H10, Class JA, 2.250%, 4/20/2065 | | | 10,640,703 | |
| | 3,031,163 | | | Government National Mortgage Association, Series 2015-H11, Class FA, 0.744%, 4/20/2065(b) | | | 3,013,817 | |
| | 6,903,969 | | | Government National Mortgage Association, Series 2015-H19, Class FH, 0.794%, 7/20/2065(b) | | | 6,883,130 | |
| | 2,250,154 | | | Government National Mortgage Association, Series 2015-H29, Class FA, 1.194%, 10/20/2065(b) | | | 2,251,166 | |
| | 1,427,732 | | | Government National Mortgage Association, Series 2015-H30, Class FA, 1.174%, 8/20/2061(b) | | | 1,426,910 | |
| | 7,034,594 | | | Government National Mortgage Association, Series 2016-H06, Class FC, 1.414%, 2/20/2066(b) | | | 7,085,553 | |
| | 4,896,383 | | | Government National Mortgage Association, Series 2016-H10, Class FJ, 1.123%, 4/20/2066(b) | | | 4,894,635 | |
| | 8,960,000 | | | Government National Mortgage Association, Series 2016-H19, Class FJ, 0.924%, 9/20/2063(b) | | | 8,915,259 | |
| | 374,713 | | | NCUA Guaranteed Notes, Series 2010-A1, Class A, 0.863%, 12/07/2020(b) | | | 373,858 | |
| | 874,440 | | | NCUA Guaranteed Notes, Series 2010-R1, Class 1A, 0.969%, 10/07/2020(b) | | | 876,142 | |
| | 1,361,770 | | | NCUA Guaranteed Notes, Series 2010-R3, Class 1A, 1.079%, 12/08/2020(b) | | | 1,364,132 | |
| | 89,325 | | | NCUA Guaranteed Notes, Series 2010-R3, Class 2A, 1.079%, 12/08/2020(b) | | | 89,511 | |
| | | | | | | | |
| | | | | | | 133,907,891 | |
| | | | | | | | |
| | | | Government Sponsored — 1.5% | | | | |
| | 13,510,000 | | | Federal Home Loan Bank, 1.000%, 9/26/2019 | | | 13,498,165 | |
| | | | | | | | |
| | | | Hybrid ARMs — 11.2% | | | | |
| | 729,415 | | | FHLMC, 2.618%, 4/01/2036(b) | | | 757,205 | |
| | 969,446 | | | FHLMC, 2.643%, 6/01/2037(b) | | | 1,005,461 | |
| | 328,308 | | | FHLMC, 2.667%, 9/01/2038(b) | | | 347,246 | |
| | 1,742,190 | | | FHLMC, 2.681%, 2/01/2036(b) | | | 1,845,277 | |
| | 1,122,811 | | | FHLMC, 2.694%, 9/01/2038(b) | | | 1,182,525 | |
| | 5,721,909 | | | FHLMC, 2.709%, 3/01/2037(b) | | | 6,048,926 | |
| | 2,187,430 | | | FHLMC, 2.720%, 7/01/2033(b) | | | 2,315,794 | |
| | 3,565,684 | | | FHLMC, 2.721%, 2/01/2036(b) | | | 3,749,812 | |
| | 1,368,552 | | | FHLMC, 2.754%, 9/01/2038(b) | | | 1,448,444 | |
| | 880,269 | | | FHLMC, 2.765%, 4/01/2037(b) | | | 931,170 | |
| | 665,119 | | | FHLMC, 2.798%, 11/01/2038(b) | | | 704,811 | |
| | 895,565 | | | FHLMC, 2.907%, 11/01/2038(b) | | | 947,070 | |
| | 1,555,806 | | | FHLMC, 2.921%, 3/01/2036(b) | | | 1,646,566 | |
| | 2,553,083 | | | FHLMC, 2.927%, 9/01/2035(b) | | | 2,708,766 | |
| | 579,986 | | | FHLMC, 2.964%, 2/01/2035(b) | | | 611,893 | |
| | 2,642,512 | | | FHLMC, 2.975%, 4/01/2037(b) | | | 2,793,474 | |
| | 633,819 | | | FHLMC, 3.001%, 12/01/2034(b) | | | 671,570 | |
See accompanying notes to financial statements.
53 |
Portfolio of Investments – as of September 30, 2016
Loomis Sayles Limited Term Government and Agency Fund – (continued)
| | | | | | | | |
Principal
Amount | | | Description | | Value (†) | |
| | | | Hybrid ARMs — continued | | | | |
| $ | 1,562,839 | | | FHLMC, 3.009%, 3/01/2038(b) | | $ | 1,657,496 | |
| | 708,191 | | | FHLMC, 3.207%, 3/01/2037(b) | | | 752,103 | |
| | 139,694 | | | FHLMC, 3.460%, 12/01/2037(b) | | | 145,074 | |
| | 243,818 | | | FNMA, 2.423%, 2/01/2037(b) | | | 253,565 | |
| | 1,938,069 | | | FNMA, 2.436%, 7/01/2035(b) | | | 2,021,048 | |
| | 1,336,146 | | | FNMA, 2.527%, 1/01/2036(b) | | | 1,417,199 | |
| | 737,120 | | | FNMA, 2.543%, 10/01/2033(b) | | | 778,893 | |
| | 2,785,555 | | | FNMA, 2.625%, 11/01/2033(b) | | | 2,923,244 | |
| | 2,021,414 | | | FNMA, 2.629%, 10/01/2033(b) | | | 2,141,004 | |
| | 540,389 | | | FNMA, 2.634%, 11/01/2035(b) | | | 571,095 | |
| | 750,612 | | | FNMA, 2.637%, 12/01/2034(b) | | | 789,580 | |
| | 4,695,777 | | | FNMA, 2.649%, 4/01/2034(b) | | | 4,956,185 | |
| | 662,131 | | | FNMA, 2.660%, 9/01/2034(b) | | | 696,355 | |
| | 3,543,903 | | | FNMA, 2.689%, 7/01/2035(b) | | | 3,733,579 | |
| | 3,261,561 | | | FNMA, 2.695%, 4/01/2037(b) | | | 3,426,305 | |
| | 1,127,951 | | | FNMA, 2.703%, 9/01/2036(b) | | | 1,183,480 | |
| | 1,422,887 | | | FNMA, 2.738%, 6/01/2036(b) | | | 1,513,233 | |
| | 6,094,172 | | | FNMA, 2.748%, 10/01/2034(b) | | | 6,438,710 | |
| | 1,927,283 | | | FNMA, 2.751%, 4/01/2037(b) | | | 2,037,170 | |
| | 342,277 | | | FNMA, 2.762%, 4/01/2033(b) | | | 360,589 | |
| | 4,873,130 | | | FNMA, 2.763%, 9/01/2037(b) | | | 5,127,103 | |
| | 1,449,940 | | | FNMA, 2.801%, 6/01/2033(b) | | | 1,532,071 | |
| | 879,187 | | | FNMA, 2.806%, 2/01/2037(b) | | | 929,222 | |
| | 4,104,049 | | | FNMA, 2.807%, 6/01/2037(b) | | | 4,359,536 | |
| | 1,881,253 | | | FNMA, 2.840%, 8/01/2035(b) | | | 1,982,498 | |
| | 1,394,468 | | | FNMA, 2.842%, 4/01/2034(b) | | | 1,470,888 | |
| | 1,112,324 | | | FNMA, 2.873%, 5/01/2035(b) | | | 1,184,657 | |
| | 481,983 | | | FNMA, 2.905%, 8/01/2035(b) | | | 510,098 | |
| | 1,139,343 | | | FNMA, 2.906%, 8/01/2034(b) | | | 1,211,001 | |
| | 4,898,447 | | | FNMA, 2.912%, 3/01/2037(b) | | | 5,174,969 | |
| | 512,240 | | | FNMA, 2.915%, 8/01/2038(b) | | | 533,554 | |
| | 1,604,810 | | | FNMA, 2.924%, 2/01/2047(b) | | | 1,685,814 | |
| | 311,729 | | | FNMA, 2.932%, 8/01/2033(b) | | | 330,817 | |
| | 3,104,522 | | | FNMA, 2.938%, 9/01/2037(b) | | | 3,279,677 | |
| | 498,151 | | | FNMA, 2.977%, 8/01/2036(b) | | | 529,421 | |
| | 744,485 | | | FNMA, 3.011%, 7/01/2041(b) | | | 777,882 | |
| | 3,948,882 | | | FNMA, 3.039%, 7/01/2037(b) | | | 4,174,272 | |
| | 1,453,104 | | | FNMA, 3.723%, 6/01/2035(b) | | | 1,537,895 | |
| | | | | | | | |
| | | | | | | 103,843,292 | |
| | | | | | | | |
| | | | Mortgage Related — 18.2% | | | | |
| | 115,185 | | | FHLMC, 3.000%, 10/01/2026 | | | 121,030 | |
| | 830,393 | | | FHLMC, 4.000%, with various maturities from 2024 to 2042(d) | | | 889,097 | |
| | 616,031 | | | FHLMC, 4.500%, with various maturities from 2025 to 2034(d) | | | 659,403 | |
| | 257,778 | | | FHLMC, 5.500%, 10/01/2023 | | | 278,862 | |
| | 21,376 | | | FHLMC, 6.000%, 11/01/2019 | | | 22,353 | |
| | 388,761 | | | FHLMC, 6.500%, with various maturities from 2017 to 2034(d) | | | 462,647 | |
| | 444 | | | FHLMC, 7.500%, 6/01/2026 | | | 508 | |
See accompanying notes to financial statements.
| 54
Portfolio of Investments – as of September 30, 2016
Loomis Sayles Limited Term Government and Agency Fund – (continued)
| | | | | | | | |
Principal
Amount | | | Description | | Value (†) | |
| | | | Mortgage Related — continued | | | | |
| $ | 1,016 | | | FHLMC, 10.000%, 7/01/2019 | | $ | 1,068 | |
| | 17,118 | | | FHLMC, 11.500%, 4/01/2020 | | | 17,378 | |
| | 184,299 | | | FNMA, 3.000%, 3/01/2042 | | | 192,982 | |
| | 2,273,646 | | | FNMA, 5.000%, with various maturities from 2037 to 2038(d) | | | 2,554,052 | |
| | 1,231,376 | | | FNMA, 5.500%, with various maturities from 2018 to 2033(d) | | | 1,366,694 | |
| | 1,651,014 | | | FNMA, 6.000%, with various maturities from 2017 to 2022(d) | | | 1,794,481 | |
| | 233,281 | | | FNMA, 6.500%, with various maturities from 2017 to 2037(d) | | | 271,982 | |
| | 13,309 | | | FNMA, 7.000%, 12/01/2022 | | | 13,345 | |
| | 91,131 | | | FNMA, 7.500%, with various maturities from 2017 to 2032(d) | | | 104,598 | |
| | 4,336,123 | | | GNMA, 2.208%, 2/20/2061(b) | | | 4,521,165 | |
| | 3,232,773 | | | GNMA, 2.339%, 2/20/2063(b) | | | 3,388,302 | |
| | 4,385,572 | | | GNMA, 2.626%, 3/20/2063(b) | | | 4,633,273 | |
| | 1,261,976 | | | GNMA, 2.724%, 6/20/2065(b) | | | 1,348,568 | |
| | 1,210,219 | | | GNMA, 2.730%, 5/20/2065(b) | | | 1,294,990 | |
| | 2,445,643 | | | GNMA, 2.822%, 2/20/2063(b) | | | 2,594,125 | |
| | 3,551,932 | | | GNMA, 4.427%, 6/20/2063 | | | 3,854,579 | |
| | 1,948,674 | | | GNMA, 4.444%, 3/20/2063 | | | 2,096,102 | |
| | 1,907,628 | | | GNMA, 4.463%, 2/20/2063 | | | 2,041,135 | |
| | 4,148,796 | | | GNMA, 4.485%, 2/20/2062 | | | 4,378,834 | |
| | 4,816,485 | | | GNMA, 4.489%, 10/20/2065 | | | 5,458,652 | |
| | 4,374,273 | | | GNMA, 4.531%, 12/20/2061 | | | 4,610,692 | |
| | 6,853,370 | | | GNMA, 4.542%, 12/20/2062 | | | 7,342,516 | |
| | 16,544,009 | | | GNMA, 4.550%, 12/20/2061 | | | 17,444,170 | |
| | 1,959,476 | | | GNMA, 4.561%, 3/20/2062 | | | 2,073,678 | |
| | 11,545,510 | | | GNMA, 4.590%, 11/20/2062 | | | 12,339,444 | |
| | 1,388,086 | | | GNMA, 4.594%, 4/20/2063 | | | 1,499,740 | |
| | 4,094,189 | | | GNMA, 4.595%, 6/20/2062 | | | 4,333,277 | |
| | 2,927,424 | | | GNMA, 4.605%, with various maturities from 2063 to 2066(d) | | | 3,279,994 | |
| | 1,203,793 | | | GNMA, 4.608%, 8/20/2061 | | | 1,261,499 | |
| | 1,712,536 | | | GNMA, 4.632%, 3/20/2062 | | | 1,810,351 | |
| | 1,846,024 | | | GNMA, 4.634%, 3/20/2064 | | | 2,063,485 | |
| | 2,147,848 | | | GNMA, 4.651%, 11/20/2063 | | | 2,397,994 | |
| | 450,104 | | | GNMA, 4.659%, 1/20/2064 | | | 503,498 | |
| | 6,964,075 | | | GNMA, 4.667%, 2/20/2062 | | | 7,366,325 | |
| | 8,263,251 | | | GNMA, 4.683%, 8/20/2061 | | | 8,588,712 | |
| | 3,384,024 | | | GNMA, 4.686%, 2/20/2062 | | | 3,564,018 | |
| | 1,913,903 | | | GNMA, 4.687%, 5/20/2064 | | | 2,164,647 | |
| | 1,397,257 | | | GNMA, 4.699%, 6/20/2061 | | | 1,445,477 | |
| | 7,166,717 | | | GNMA, 4.700%, with various maturities in 2061(d) | | | 7,485,738 | |
| | 1,436,100 | | | GNMA, 4.717%, 3/20/2061 | | | 1,492,528 | |
| | 1,293,394 | | | GNMA, 4.755%, 8/20/2062 | | | 1,365,710 | |
| | 582,287 | | | GNMA, 5.082%, 4/20/2061 | | | 614,393 | |
| | 18,371 | | | GNMA, 6.000%, 12/15/2031 | | | 21,462 | |
| | 80,605 | | | GNMA, 6.500%, 5/15/2031 | | | 97,180 | |
| | 75,702 | | | GNMA, 7.000%, 10/15/2028 | | | 84,167 | |
| | 4,312,989 | | | Government National Mortgage Association, Series 2015-H04, Class FL, 0.964%, 2/20/2065(b) | | | 4,281,786 | |
See accompanying notes to financial statements.
55 |
Portfolio of Investments – as of September 30, 2016
Loomis Sayles Limited Term Government and Agency Fund – (continued)
| | | | | | | | |
Principal
Amount | | | Description | | Value (†) | |
| | | | Mortgage Related — continued | | | | |
| $ | 5,629,379 | | | Government National Mortgage Association, Series 2015-H05, Class FA, 0.794%, 4/20/2061(b) | | $ | 5,587,691 | |
| | 13,069,884 | | | Government National Mortgage Association, Series 2015-H09, Class HA,
1.750%, 3/20/2065 | | | 13,081,801 | |
| | 6,560,540 | | | Government National Mortgage Association, Series 2015-H12, Class FL,
0.724%, 5/20/2065(b) | | | 6,484,784 | |
| | | | | | | | |
| | | | | | | 169,046,962 | |
| | | | | | | | |
| | | | Non-Agency Commercial Mortgage-Backed Securities — 5.9% | | | | |
| | 636,349 | | | A10 Securitization LLC, Series 2014-1, Class A1, 1.720%, 4/15/2033, 144A | | | 633,516 | |
| | 2,482,346 | | | Banc of America Merrill Lynch Commercial Mortgage, Inc., Series 2007-2, Class A4, 5.791%, 4/10/2049(b) | | | 2,495,375 | |
| | 313,904 | | | Banc of America Merrill Lynch Commercial Mortgage, Inc., Series 2007-5, Class A4, 5.492%, 2/10/2051 | | | 321,167 | |
| | 3,445,000 | | | Banc of America Merrill Lynch Commercial Mortgage, Inc., Series 2016-ASHF, Class A, 2.424%, 12/15/2033, 144A(b) | | | 3,485,834 | |
| | 478,172 | | | Barclays Commercial Mortgage Securities, Series 2015-RRI, Class A,
1.674%, 5/15/2032, 144A(b) | | | 478,168 | |
| | 3,256,355 | | | CDGJ Commercial Mortgage Trust Pass Through Certificates,
Series 2014-BXCH, 1.924%, 12/15/2027, 144A(b) | | | 3,259,415 | |
| | 2,465,794 | | | CG-CCRE Commercial Mortgage Trust, Series 2014-FL1, Class A,
1.474%, 6/15/2031, 144A(b) | | | 2,465,014 | |
| | 3,425,000 | | | Commercial Mortgage Pass Through Certificates, Series 2014-FL5, Class A, 1.894%, 10/15/2031, 144A(b) | | | 3,361,697 | |
| | 3,040,000 | | | Commercial Mortgage Pass Through Certificates, Series 2014-FL5, Class SV1, 2.374%, 10/15/2031, 144A(b)(e)(f) | | | 3,037,018 | |
| | 4,282,000 | | | Commercial Mortgage Pass Through Certificates, Series 2016-DC2, Class ASB, 3.550%, 2/10/2049 | | | 4,576,456 | |
| | 2,438,425 | | | GP Portfolio Trust, Series 2014-GPP, Class A, 1.474%, 2/15/2027, 144A(b) | | | 2,434,522 | |
| | 3,280,539 | | | Greenwich Capital Commercial Funding Corp., Series 2007-GG11, Class A4, 5.736%, 12/10/2049 | | | 3,367,221 | |
| | 3,042,252 | | | Greenwich Capital Commercial Funding Corp., Series 2007-GG9, Class A4, 5.444%, 3/10/2039 | | | 3,046,731 | |
| | 5,535,000 | | | JPMorgan Chase Commercial Mortgage Securities Corp., Series 2014-CBM, Class A, 1.424%, 10/15/2029, 144A(b) | | | 5,480,323 | |
| | 1,478,689 | | | JPMorgan Chase Commercial Mortgage Securities Trust, Series 2014-FL5, Class A, 1.504%, 7/15/2031, 144A(b) | | | 1,478,041 | |
| | 4,115,000 | | | JPMorgan Chase Commercial Mortgage Securities Trust, Series 2015-SGP, Class A, 2.224%, 7/15/2036, 144A(b) | | | 4,138,186 | |
| | 985,704 | | | LB-UBS Commercial Mortgage Trust, Series 2007-C2, Class A3,
5.430%, 2/15/2040 | | | 993,848 | |
| | 706,197 | | | Merrill Lynch/Countrywide Commercial Mortgage Trust, Series 2007-5, Class A4, 5.378%, 8/12/2048 | | | 709,618 | |
| | 1,788,000 | | | Merrill Lynch/Countrywide Commercial Mortgage Trust, Series 2007-6, Class A4, 5.485%, 3/12/2051(b) | | | 1,805,955 | |
| | 1,723,925 | | | Resource Capital Corp. Ltd., Series 2014-CRE2, Class A,
1.580%, 4/15/2032, 144A(b) | | | 1,705,287 | |
| | 3,700,000 | | | Starwood Retail Property Trust, Inc., 1.744%, 11/15/2027, 144A(b) | | | 3,670,622 | |
See accompanying notes to financial statements.
| 56
Portfolio of Investments – as of September 30, 2016
Loomis Sayles Limited Term Government and Agency Fund – (continued)
| | | | | | | | |
Principal
Amount | | | Description | | Value (†) | |
| | | | Non-Agency Commercial Mortgage-Backed Securities — continued | | | | |
| $ | 1,361,349 | | | Wachovia Bank Commercial Mortgage Trust, Series 2007-C34, Class A3,
5.678%, 5/15/2046 | | $ | 1,386,189 | |
| | | | | | | | |
| | | | | | | 54,330,203 | |
| | | | | | | | |
| | | | Sovereigns — 0.2% | | | | |
| | 1,955,000 | | | U.S. Department of Housing and Urban Development, Series 4,
1.880%, 8/01/2019 | | | 1,995,566 | |
| | | | | | | | |
| | | | Treasuries — 27.1% | | | | |
| | 6,635,000 | | | U.S. Treasury Note, 0.750%, 7/15/2019 | | | 6,613,489 | |
| | 6,000,000 | | | U.S. Treasury Note, 0.750%, 8/15/2019 | | | 5,979,138 | |
| | 15,365,000 | | | U.S. Treasury Note, 1.000%, 10/31/2016 | | | 15,375,156 | |
| | 15,970,000 | | | U.S. Treasury Note, 1.125%, 1/15/2019 | | | 16,077,303 | |
| | 24,105,000 | | | U.S. Treasury Note, 1.125%, 6/30/2021 | | | 24,076,749 | |
| | 28,700,000 | | | U.S. Treasury Note, 1.125%, 8/31/2021 | | | 28,670,841 | |
| | 21,450,000 | | | U.S. Treasury Note, 1.250%, 1/31/2020 | | | 21,647,748 | |
| | 48,640,000 | | | U.S. Treasury Note, 1.375%, 1/31/2021 | | | 49,172,024 | |
| | 15,120,000 | | | U.S. Treasury Note, 1.375%, 9/30/2023 | | | 15,062,710 | |
| | 4,860,000 | | | U.S. Treasury Note, 1.500%, 5/31/2020 | | | 4,943,339 | |
| | 8,705,000 | | | U.S. Treasury Note, 1.625%, 3/31/2019 | | | 8,870,595 | |
| | 2,385,000 | | | U.S. Treasury Note, 1.625%, 8/31/2019 | | | 2,435,216 | |
| | 10,050,000 | | | U.S. Treasury Note, 1.625%, 12/31/2019 | | | 10,266,306 | |
| | 17,125,000 | | | U.S. Treasury Note, 1.625%, 7/31/2020 | | | 17,497,606 | |
| | 10,360,000 | | | U.S. Treasury Note, 1.625%, 11/30/2020 | | | 10,583,797 | |
| | 13,545,000 | | | U.S. Treasury Note, 2.125%, 8/31/2020 | | | 14,092,625 | |
| | | | | | | | |
| | | | | | | 251,364,642 | |
| | | | | | | | |
| | | | Total Bonds and Notes
(Identified Cost $912,811,312) | | | 909,828,144 | |
| | | | | | | | |
| | | | | | | | |
| | Short-Term Investments — 2.1% | | | | |
| | 7,910,000 | | | Federal Home Loan Bank Discount Notes, 0.100%, 10/06/2016(g) | | | 7,909,873 | |
| | 7,910,000 | | | Federal Home Loan Bank Discount Notes, 0.100%, 10/07/2016(g) | | | 7,909,834 | |
| | 4,037,380 | | | Tri-Party Repurchase Agreement with Fixed Income Clearing Corporation, dated 9/30/2016 at 0.030% to be repurchased at $4,037,390 on 10/03/2016 collateralized by $3,750,000 U.S. Treasury Note, 2.750% due 2/15/2024 valued at $4,120,313 including accrued interest (Note 2 of Notes to Financial Statements) | | | 4,037,380 | |
| | | | | | | | |
| | | | Total Short-Term Investments
(Identified Cost $19,857,226) | | | 19,857,087 | |
| | | | | | | | |
| | | | | | | | |
| | | | Total Investments — 100.2%
(Identified Cost $932,668,538)(a) | | | 929,685,231 | |
| | | | Other assets less liabilities — (0.2)% | | | (2,088,995 | ) |
| | | | | | | | |
| | | | Net Assets — 100.0% | | $ | 927,596,236 | |
| | | | | | | | |
| | (†) | | | See Note 2 of Notes to Financial Statements. | | | | |
See accompanying notes to financial statements.
57 |
Portfolio of Investments – as of September 30, 2016
Loomis Sayles Limited Term Government and Agency Fund – (continued)
| | | | | | | | |
| | | | | | | | |
| | (a) | | | Federal Tax Information: | | | | |
| | | | At September 30, 2016, the net unrealized depreciation on investments based on a cost of $932,952,443 for federal income tax purposes was as follows: | |
| | | | Aggregate gross unrealized appreciation for all investments in which there is an excess of value over tax cost | | $ | 5,747,831 | |
| | | | Aggregate gross unrealized depreciation for all investments in which there is an excess of tax cost over value | | | (9,015,043 | ) |
| | | | | | | | |
| | | | Net unrealized depreciation | | $ | (3,267,212 | ) |
| | | | | | | | |
| | | | | | | | |
| | (b) | | | Variable rate security. Rate as of September 30, 2016 is disclosed. | | | | |
| | (c) | | | Fair valued by the Fund’s adviser. At September 30, 2016, the value of these securities amounted to $1,488,611 or 0.2% of net assets. See Note 2 of Notes to Financial Statements. | |
| | (d) | | | The Fund’s investment in mortgage related securities of Federal Home Loan Mortgage Corporation, Federal National Mortgage Association and Government National Mortgage Association are interests in separate pools of mortgages. All separate investments in securities of each issuer which have the same coupon rate have been aggregated for the purpose of presentation in the Portfolio of Investments. | |
| | (e) | | | Securities classified as fair valued pursuant to the Fund’s pricing policies and procedures. At September 30, 2016, the value of these securities amounted to $3,037,018 or 0.3% of net assets. See Note 2 of Notes to Financial Statements. | |
| | (f) | | | Illiquid security. (Unaudited) | | | | |
| | (g) | | | Interest rate represents discount rate at time of purchase; not a coupon rate. | | | | |
| | | | | | | | |
| | 144A | | | All or a portion of these securities are exempt from registration under Rule 144A of the Securities Act of 1933. These securities may be resold in transactions exempt from registration, normally to qualified institutional buyers. At September 30, 2016, the value of Rule 144A holdings amounted to $55,535,832 or 6.0% of net assets. | |
| | ABS | | | Asset-Backed Securities | | | | |
| | ARMs | | | Adjustable Rate Mortgages | | | | |
| | FHLMC | | | Federal Home Loan Mortgage Corp. | | | | |
| | FNMA | | | Federal National Mortgage Association | | | | |
| | GNMA | | | Government National Mortgage Association | | | | |
| | REMIC | | | Real Estate Mortgage Investment Conduit | | | | |
Industry Summary at September 30, 2016
| | | | |
Treasuries | | | 27.1 | % |
Mortgage Related | | | 18.2 | |
Agency Commercial Mortgage-Backed Securities | | | 17.5 | |
Collateralized Mortgage Obligations | | | 14.4 | |
Hybrid ARMs | | | 11.2 | |
Non-Agency Commercial Mortgage-Backed Securities | | | 5.9 | |
Other Investments, less than 2% each | | | 3.8 | |
Short-Term Investments | | | 2.1 | |
| | | | |
Total Investments | | | 100.2 | |
Other assets less liabilities | | | (0.2 | ) |
| | | | |
Net Assets | | | 100.0 | % |
| | | | |
See accompanying notes to financial statements.
| 58
Statements of Assets and Liabilities
September 30, 2016
| | | | | | | | | | | | |
| | | High Income
Fund | | | Intermediate
Duration
Bond Fund | | | Limited Term
Government
and Agency
Fund | |
ASSETS | | | | | | | | | | | | |
Investments at cost | | $ | 177,390,961 | | | $ | 160,358,607 | | | $ | 932,668,538 | |
Net unrealized appreciation (depreciation) | | | (3,057,367 | ) | | | 1,325,575 | | | | (2,983,307 | ) |
| | | | | | | | | | | | |
Investments at value | | | 174,333,594 | | | | 161,684,182 | | | | 929,685,231 | |
Cash | | | 11,497 | | | | — | | | | 8,963,956 | |
Due from brokers (Note 2) | | | 7,000 | | | | — | | | | — | |
Receivable for Fund shares sold | | | 409,880 | | | | 3,625,476 | | | | 903,845 | |
Receivable for securities sold | | | 3,125 | | | | 3,607,407 | | | | 40,358,826 | |
Dividends and interest receivable | | | 2,502,833 | | | | 557,071 | | | | 2,466,162 | |
Unrealized appreciation on forward foreign currency contracts (Note 2) | | | 233 | | | | — | | | | — | |
Tax reclaims receivable | | | 113 | | | | — | | | | — | |
Prepaid expenses (Note 7) | | | 667 | | | | 630 | | | | 4,123 | |
| | | | | | | | | | | | |
TOTAL ASSETS | | | 177,268,942 | | | | 169,474,766 | | | | 982,382,143 | |
| | | | | | | | | | | | |
LIABILITIES | | | | | | | | | | | | |
Payable for securities purchased | | | 576,206 | | | | 7,435,392 | | | | 52,896,451 | |
Payable for Fund shares redeemed | | | 94,323 | | | | 68,176 | | | | 866,403 | |
Distributions payable | | | — | | | | — | | | | 282,209 | |
Management fees payable (Note 6) | | | 104,536 | | | | 20,822 | | | | 286,840 | |
Deferred Trustees’ fees (Note 6) | | | 138,870 | | | | 91,845 | | | | 277,672 | |
Administrative fees payable (Note 6) | | | 6,242 | | | | 5,648 | | | | 33,812 | |
Payable to distributor (Note 6d) | | | 2,170 | | | | 670 | | | | 5,346 | |
Other accounts payable and accrued expenses | | | 70,134 | | | | 38,689 | | | | 137,174 | |
| | | | | | | | | | | | |
TOTAL LIABILITIES | | | 992,481 | | | | 7,661,242 | | | | 54,785,907 | |
| | | | | | | | | | | | |
NET ASSETS | | $ | 176,276,461 | | | $ | 161,813,524 | | | $ | 927,596,236 | |
| | | | | | | | | | | | |
NET ASSETS CONSIST OF: | | | | | | | | | | | | |
Paid-in capital | | $ | 182,442,032 | | | $ | 159,609,800 | | | $ | 943,352,211 | |
Undistributed (Distributions in excess of) net investment income | | | (462,119 | ) | | | (46,973 | ) | | | 206,971 | |
Accumulated net realized gain (loss) on investments, futures contracts and foreign currency transactions | | | (2,644,640 | ) | | | 925,122 | | | | (12,979,639 | ) |
Net unrealized appreciation (depreciation) on investments, futures contracts and foreign currency translations | | | (3,058,812 | ) | | | 1,325,575 | | | | (2,983,307 | ) |
| | | | | | | | | | | | |
NET ASSETS | | $ | 176,276,461 | | | $ | 161,813,524 | | | $ | 927,596,236 | |
| | | | | | | | | | | | |
See accompanying notes to financial statements.
59 |
Statements of Assets and Liabilities (continued)
September 30, 2016
| | | | | | | | | | | | |
| | | High Income
Fund | | | Intermediate
Duration
Bond Fund | | | Limited Term
Government
and Agency
Fund | |
COMPUTATION OF NET ASSET VALUE AND
OFFERING PRICE: | | | | | | | | | | | | |
Class A shares: | | | | | | | | | | | | |
Net assets | | $ | 34,820,023 | | | $ | 19,327,479 | | | $ | 442,671,381 | |
| | | | | | | | | | | | |
Shares of beneficial interest | | | 8,231,175 | | | | 1,836,345 | | | | 38,461,737 | |
| | | | | | | | | | | | |
Net asset value and redemption price per share | | $ | 4.23 | | | $ | 10.52 | | | $ | 11.51 | |
| | | | | | | | | | | | |
Offering price per share (100/[100-maximum sales charge] of net asset value) (Note 1) | | $ | 4.42 | | | $ | 10.99 | | | $ | 11.77 | |
| | | | | | | | | | | | |
Class C shares: (redemption price per share is equal to net asset value less any applicable contingent deferred sales charge) (Note 1) | | | | | | | | | | | | |
Net assets | | $ | 12,287,615 | | | $ | 3,088,270 | | | $ | 73,026,808 | |
| | | | | | | | | | | | |
Shares of beneficial interest | | | 2,897,625 | | | | 293,283 | | | | 6,339,471 | |
| | | | | | | | | | | | |
Net asset value and offering price per share | | $ | 4.24 | | | $ | 10.53 | | | $ | 11.52 | |
| | | | | | | | | | | | |
Class Y shares: | | | | | | | | | | | | |
Net assets | | $ | 129,168,823 | | | $ | 139,397,775 | | | $ | 411,898,047 | |
| | | | | | | | | | | | |
Shares of beneficial interest | | | 30,608,965 | | | | 13,248,536 | | | | 35,673,753 | |
| | | | | | | | | | | | |
Net asset value, offering and redemption price per share | | $ | 4.22 | | | $ | 10.52 | | | $ | 11.55 | |
| | | | | | | | | | | | |
See accompanying notes to financial statements.
| 60
Statements of Operations
For the Year Ended September 30, 2016
| | | | | | | | | | | | |
| | | High Income
Fund | | | Intermediate
Duration Bond
Fund | | | Limited Term
Government
and Agency
Fund | |
INVESTMENT INCOME | | | | | | | | | | | | |
Interest | | $ | 9,845,287 | | | $ | 3,328,498 | | | $ | 15,742,859 | |
Dividends | | | 321,901 | | | | — | | | | — | |
Less net foreign taxes withheld | | | (2,758 | ) | | | (80 | ) | | | — | |
| | | | | | | | | | | | |
| | | 10,164,430 | | | | 3,328,418 | | | | 15,742,859 | |
| | | | | | | | | | | | |
Expenses | | | | | | | | | | | | |
Management fees (Note 6) | | | 971,664 | | | | 330,657 | | | | 3,309,940 | |
Service and distribution fees (Note 6) | | | 203,910 | | | | 48,482 | | | | 1,782,782 | |
Administrative fees (Note 6) | | | 71,381 | | | | 58,358 | | | | 401,349 | |
Trustees’ fees and expenses (Note 6) | | | 28,536 | | | | 25,555 | | | | 51,193 | |
Transfer agent fees and expenses (Note 6) | | | 197,329 | | | | 41,660 | | | | 719,832 | |
Audit and tax services fees | | | 52,554 | | | | 52,558 | | | | 56,844 | |
Custodian fees and expenses | | | 23,140 | | | | 19,407 | | | | 46,340 | |
Legal fees | | | 2,651 | | | | 2,182 | | | | 15,311 | |
Registration fees | | | 66,659 | | | | 64,111 | | | | 81,496 | |
Shareholder reporting expenses | | | 15,158 | | | | 20,771 | | | | 48,327 | |
Miscellaneous expenses (Note 7) | | | 15,326 | | | | 10,365 | | | | 32,743 | |
| | | | | | | | | | | | |
Total expenses | | | 1,648,308 | | | | 674,106 | | | | 6,546,157 | |
Less waiver and/or expense reimbursement (Note 6) | | | (67,553 | ) | | | (96,550 | ) | | | — | |
| | | | | | | | | | | | |
Net expenses | | | 1,580,755 | | | | 577,556 | | | | 6,546,157 | |
| | | | | | | | | | | | |
Net investment income | | | 8,583,675 | | | | 2,750,862 | | | | 9,196,702 | |
| | | | | | | | | | | | |
NET REALIZED AND UNREALIZED GAIN (LOSS) ON INVESTMENTS, FUTURES CONTRACTS AND FOREIGN CURRENCY TRANSACTIONS | | | | | | | | | | | | |
Net realized gain (loss) on: | | | | | | | | | | | | |
Investments | | | (5,386,807 | ) | | | 1,570,969 | | | | 2,246,153 | |
Futures contracts | | | (176,542 | ) | | | — | | | | — | |
Foreign currency transactions | | | 217,666 | | | | — | | | | — | |
Net change in unrealized appreciation (depreciation) on: | | | | | | | | | | | | |
Investments | | | 13,492,650 | | | | 1,160,767 | | | | (2,140,764 | ) |
Futures contracts | | | 160,868 | | | | — | | | | — | |
Foreign currency translations | | | (247,496 | ) | | | — | | | | — | |
| | | | | | | | | | | | |
Net realized and unrealized gain on investments, futures contracts and foreign currency transactions | | | 8,060,339 | | | | 2,731,736 | | | | 105,389 | |
| | | | | | | | | | | | |
NET INCREASE IN NET ASSETS RESULTING FROM OPERATIONS | | $ | 16,644,014 | | | $ | 5,482,598 | | | $ | 9,302,091 | |
| | | | | | | | | | | | |
See accompanying notes to financial statements.
61 |
Statements of Changes in Net Assets
| | | | | | | | | | | | | | | | |
| | | High Income Fund | | | Intermediate Duration
Bond Fund | |
| | | Year Ended
September 30,
2016 | | | Year Ended
September 30,
2015 | | | Year Ended
September 30,
2016 | | | Year Ended
September 30,
2015 | |
FROM OPERATIONS: | | | | | | | | | | | | | | | | |
Net investment income | | $ | 8,583,675 | | | $ | 8,768,344 | | | $ | 2,750,862 | | | $ | 1,895,908 | |
Net realized gain (loss) on investments, futures contracts and foreign currency transactions | | | (5,345,683 | ) | | | 1,420,418 | | | | 1,570,969 | | | | 453,061 | |
Net change in unrealized appreciation (depreciation) on investments, futures contracts and foreign currency translations | | | 13,406,022 | | | | (19,080,751 | ) | | | 1,160,767 | | | | (279,129 | ) |
| | | | | | | | | | | | | | | | |
Net increase (decrease) in net assets resulting from operations | | | 16,644,014 | | | | (8,891,989 | ) | | | 5,482,598 | | | | 2,069,840 | �� |
| | | | | | | | | | | | | | | | |
FROM DISTRIBUTIONS TO SHAREHOLDERS: | | | | | | | | | | | | | | | | |
Net investment income | | | | | | | | | | | | | | | | |
Class A | | | (1,391,187 | ) | | | (1,926,317 | ) | | | (390,657 | ) | | | (195,269 | ) |
Class B(a) | | | (14 | ) | | | (2,085 | ) | | | — | | | | — | |
Class C | | | (384,341 | ) | | | (515,596 | ) | | | (1 | ) | | | — | |
Class Y | | | (4,855,484 | ) | | | (6,296,139 | ) | | | (2,556,145 | ) | | | (1,890,490 | ) |
Net realized capital gains | | | | | | | | | | | | | | | | |
Class A | | | (81,866 | ) | | | (1,004,492 | ) | | | (64,649 | ) | | | (2,801 | ) |
Class B(a) | | | (3 | ) | | | (2,711 | ) | | | — | | | | — | |
Class C | | | (29,530 | ) | | | (348,393 | ) | | | — | | | | — | |
Class Y | | | (273,287 | ) | | | (3,159,866 | ) | | | (284,383 | ) | | | (35,990 | ) |
| | | | | | | | | | | | | | | | |
Total distributions | | | (7,015,712 | ) | | | (13,255,599 | ) | | | (3,295,835 | ) | | | (2,124,550 | ) |
| | | | | | | | | | | | | | | | |
NET INCREASE (DECREASE) IN NET ASSETS FROM CAPITAL SHARE TRANSACTIONS (NOTE 10) | | | (670,213 | ) | | | 6,973,865 | | | | 52,609,062 | | | | 34,383,012 | |
| | | | | | | | | | | | | | | | |
Net increase (decrease) in net assets | | | 8,958,089 | | | | (15,173,723 | ) | | | 54,795,825 | | | | 34,328,302 | |
NET ASSETS | | | | | | | | | | | | | | | | |
Beginning of the year | | | 167,318,372 | | | | 182,492,095 | | | | 107,017,699 | | | | 72,689,397 | |
| | | | | | | | | | | | | | | | |
End of the year | | $ | 176,276,461 | | | $ | 167,318,372 | | | $ | 161,813,524 | | | $ | 107,017,699 | |
| | | | | | | | | | | | | | | | |
UNDISTRIBUTED (DISTRIBUTIONS IN EXCESS OF) NET INVESTMENT INCOME | | $ | (462,119 | ) | | $ | 61,927 | | | $ | (46,973 | ) | | $ | (64,773 | ) |
| | | | | | | | | | | | | | | | |
| (a) | On January 11, 2016, Class B shares were converted into Class A shares. See Note 1 of Notes to Financial Statements. |
See accompanying notes to financial statements.
| 62
Statements of Changes in Net Assets (continued)
| | | | | | | | |
| | | Limited Term Government and
Agency Fund | |
| | | Year Ended
September 30,
2016 | | | Year Ended
September 30,
2015 | |
FROM OPERATIONS: | | | | | | | | |
Net investment income | | $ | 9,196,702 | | | $ | 9,761,506 | |
Net realized gain on investments | | | 2,246,153 | | | | 4,686,019 | |
Net change in unrealized appreciation (depreciation) on investments | | | (2,140,764 | ) | | | (4,747,808 | ) |
| | | | | | | | |
Net increase in net assets resulting from operations | | | 9,302,091 | | | | 9,699,717 | |
| | | | | | | | |
FROM DISTRIBUTIONS TO SHAREHOLDERS: | | | | | | | | |
Net investment income | | | | | | | | |
Class A | | | (5,792,542 | ) | | | (5,253,842 | ) |
Class B(a) | | | (5,359 | ) | | | (29,227 | ) |
Class C | | | (543,862 | ) | | | (503,848 | ) |
Class Y | | | (7,311,896 | ) | | | (6,898,857 | ) |
| | | | | | | | |
Total distributions | | | (13,653,659 | ) | | | (12,685,774 | ) |
| | | | | | | | |
NET INCREASE IN NET ASSETS FROM
CAPITAL SHARE TRANSACTIONS (NOTE 10) | | | 88,093,679 | | | | 141,117,260 | |
| | | | | | | | |
Net increase in net assets | | | 83,742,111 | | | | 138,131,203 | |
NET ASSETS | | | | | | | | |
Beginning of the year | | | 843,854,125 | | | | 705,722,922 | |
| | | | | | | | |
End of the year | | $ | 927,596,236 | | | $ | 843,854,125 | |
| | | | | | | | |
UNDISTRIBUTED NET INVESTMENT INCOME | | $ | 206,971 | | | $ | 38,911 | |
| | | | | | | | |
| (a) | On January 11, 2016, Class B shares were converted into Class A shares. See Note 1 of Notes to Financial Statements. |
See accompanying notes to financial statements.
63 |
Financial Highlights
For a share outstanding throughout each period.
| | | | | | | | | | | | | | | | | | | | |
| | | High Income Fund—Class A | |
| | | Year Ended
September 30,
2016 | | | Year Ended
September 30,
2015 | | | Year Ended
September 30,
2014 | | | Year Ended
September 30,
2013 | | | Year Ended
September 30,
2012 | |
Net asset value, beginning of the period | | $ | 3.99 | | | $ | 4.49 | | | $ | 4.59 | | | $ | 4.60 | | | $ | 4.46 | |
| | | | | | | | | | | | | | | | | | | | |
INCOME (LOSS) FROM INVESTMENT OPERATIONS: | | | | | | | | | | | | | | | | | | | | |
Net investment income(a) | | | 0.20 | | | | 0.19 | | | | 0.21 | | | | 0.24 | | | | 0.24 | |
Net realized and unrealized gain (loss) | | | 0.21 | | | | (0.39 | ) | | | 0.17 | | | | 0.03 | | | | 0.59 | |
| | | | | | | | | | | | | | | | | | | | |
Total from Investment Operations | | | 0.41 | | | | (0.20 | ) | | | 0.38 | | | | 0.27 | | | | 0.83 | |
| | | | | | | | | | | | | | | | | | | | |
LESS DISTRIBUTIONS FROM: | | | | | | | | | | | | | | | | | | | | |
Net investment income | | | (0.16 | ) | | | (0.19 | ) | | | (0.22 | ) | | | (0.27 | ) | | | (0.30 | ) |
Net realized capital gains | | | (0.01 | ) | | | (0.11 | ) | | | (0.26 | ) | | | (0.01 | ) | | | (0.39 | ) |
| | | | | | | | | | | | | | | | | | | | |
Total Distributions | | | (0.17 | ) | | | (0.30 | ) | | | (0.48 | ) | | | (0.28 | ) | | | (0.69 | ) |
| | | | | | | | | | | | | | | | | | | | |
Net asset value, end of the period | | $ | 4.23 | | | $ | 3.99 | | | $ | 4.49 | | | $ | 4.59 | | | $ | 4.60 | |
| | | | | | | | | | | | | | | | | | | | |
Total return(b) | | | 10.66 | %(c) | | | (4.78 | )%(c) | | | 8.42 | % | | | 6.27 | % | | | 20.90 | %(c) |
RATIOS TO AVERAGE NET ASSETS: | | | | | | | | | | | | | | | | | | | | |
Net assets, end of the period (000’s) | | $ | 34,820 | | | $ | 37,870 | | | $ | 42,630 | | | $ | 45,791 | | | $ | 95,876 | |
Net expenses | | | 1.10 | %(d) | | | 1.11 | %(d)(e) | | | 1.14 | % | | | 1.15 | %(f) | | | 1.15 | %(d) |
Gross expenses | | | 1.14 | % | | | 1.13 | % | | | 1.14 | % | | | 1.15 | %(f) | | | 1.19 | % |
Net investment income | | | 5.16 | % | | | 4.41 | % | | | 4.57 | % | | | 5.11 | % | | | 5.50 | % |
Portfolio turnover rate | | | 38 | % | | | 69 | % | | | 59 | % | | | 47 | % | | | 34 | % |
| (a) | Per share net investment income has been calculated using the average shares outstanding during the period. |
| (b) | A sales charge for Class A shares is not reflected in total return calculations. |
| (c) | Had certain expenses not been waived/reimbursed during the period, total returns would have been lower. |
| (d) | The investment adviser agreed to waive its fees and/or reimburse a portion of the Fund’s expenses during the period. Without this waiver/reimbursement, expenses would have been higher. |
| (e) | Effective July 1, 2015, the expense limit decreased to 1.10%. |
| (f) | Includes fee/expense recovery of 0.02%. |
See accompanying notes to financial statements.
| 64
Financial Highlights (continued)
For a share outstanding throughout each period.
| | | | | | | | | | | | | | | | | | | | |
| | | High Income Fund—Class C | |
| | | Year Ended
September 30,
2016 | | | Year Ended
September 30,
2015 | | | Year Ended
September 30,
2014 | | | Year Ended
September 30,
2013 | | | Year Ended
September 30,
2012 | |
Net asset value, beginning of the period | | $ | 4.00 | | | $ | 4.50 | | | $ | 4.61 | | | $ | 4.61 | | | $ | 4.47 | |
| | | | | | | | | | | | | | | | | | | | |
INCOME (LOSS) FROM INVESTMENT OPERATIONS: | | | | | | | | | | | | | | | | | | | | |
Net investment income(a) | | | 0.18 | | | | 0.16 | | | | 0.18 | | | | 0.21 | | | | 0.21 | |
Net realized and unrealized gain (loss) | | | 0.20 | | | | (0.39 | ) | | | 0.16 | | | | 0.04 | | | | 0.59 | |
| | | | | | | | | | | | | | | | | | | | |
Total from Investment Operations | | | 0.38 | | | | (0.23 | ) | | | 0.34 | | | | 0.25 | | | | 0.80 | |
| | | | | | | | | | | | | | | | | | | | |
LESS DISTRIBUTIONS FROM: | | | | | | | | | | | | | | | | | | | | |
Net investment income | | | (0.13 | ) | | | (0.16 | ) | | | (0.19 | ) | | | (0.24 | ) | | | (0.27 | ) |
Net realized capital gains | | | (0.01 | ) | | | (0.11 | ) | | | (0.26 | ) | | | (0.01 | ) | | | (0.39 | ) |
| | | | | | | | | | | | | | | | | | | | |
Total Distributions | | | (0.14 | ) | | | (0.27 | ) | | | (0.45 | ) | | | (0.25 | ) | | | (0.66 | ) |
| | | | | | | | | | | | | | | | | | | | |
Net asset value, end of the period | | $ | 4.24 | | | $ | 4.00 | | | $ | 4.50 | | | $ | 4.61 | | | $ | 4.61 | |
| | | | | | | | | | | | | | | | | | | | |
Total return(b) | | | 9.81 | %(c) | | | (5.48 | )%(c) | | | 7.60 | % | | | 5.46 | % | | | 19.96 | %(c) |
RATIOS TO AVERAGE NET ASSETS: | | | | | | | | | | | | | | | | | | | | |
Net assets, end of the period (000’s) | | $ | 12,288 | | | $ | 12,609 | | | $ | 14,555 | | | $ | 15,233 | | | $ | 16,863 | |
Net expenses | | | 1.85 | %(d) | | | 1.86 | %(d)(e) | | | 1.89 | % | | | 1.90 | %(f) | | | 1.90 | %(d) |
Gross expenses | | | 1.89 | % | | | 1.88 | % | | | 1.89 | % | | | 1.90 | %(f) | | | 1.94 | % |
Net investment income | | | 4.43 | % | | | 3.68 | % | | | 3.84 | % | | | 4.36 | % | | | 4.78 | % |
Portfolio turnover rate | | | 38 | % | | | 69 | % | | | 59 | % | | | 47 | % | | | 34 | % |
| (a) | Per share net investment income has been calculated using the average shares outstanding during the period. |
| (b) | A contingent deferred sales charge for Class C shares is not reflected in total return calculations. |
| (c) | Had certain expenses not been waived/reimbursed during the period, total returns would have been lower. |
| (d) | The investment adviser agreed to waive its fees and/or reimburse a portion of the Fund’s expenses during the period. Without this waiver/reimbursement, expenses would have been higher. |
| (e) | Effective July 1, 2015, the expense limit decreased to 1.85%. |
| (f) | Includes fee/expense recovery of 0.01%. |
See accompanying notes to financial statements.
65 |
Financial Highlights (continued)
For a share outstanding throughout each period.
| | | | | | | | | | | | | | | | | | | | |
| | | High Income Fund—Class Y | |
| | | Year Ended
September 30,
2016 | | | Year Ended
September 30,
2015 | | | Year Ended
September 30,
2014 | | | Year Ended
September 30,
2013 | | | Year Ended
September 30,
2012 | |
Net asset value, beginning of the period | | $ | 3.98 | | | $ | 4.48 | | | $ | 4.59 | | | $ | 4.59 | | | $ | 4.46 | |
| | | | | | | | | | | | | | | | | | | | |
INCOME (LOSS) FROM INVESTMENT OPERATIONS: | | | | | | | | | | | | | | | | | | | | |
Net investment income(a) | | | 0.21 | | | | 0.20 | | | | 0.22 | | | | 0.25 | | | | 0.26 | |
Net realized and unrealized gain (loss) | | | 0.21 | | | | (0.39 | ) | | | 0.16 | | | | 0.04 | | | | 0.57 | |
| | | | | | | | | | | | | | | | | | | | |
Total from Investment Operations | | | 0.42 | | | | (0.19 | ) | | | 0.38 | | | | 0.29 | | | | 0.83 | |
| | | | | | | | | | | | | | | | | | | | |
LESS DISTRIBUTIONS FROM: | | | | | | | | | | | | | | | | | | | | |
Net investment income | | | (0.17 | ) | | | (0.20 | ) | | | (0.23 | ) | | | (0.28 | ) | | | (0.31 | ) |
Net realized capital gains | | | (0.01 | ) | | | (0.11 | ) | | | (0.26 | ) | | | (0.01 | ) | | | (0.39 | ) |
| | | | | | | | | | | | | | | | | | | | |
Total Distributions | | | (0.18 | ) | | | (0.31 | ) | | | (0.49 | ) | | | (0.29 | ) | | | (0.70 | ) |
| | | | | | | | | | | | | | | | | | | | |
Net asset value, end of the period | | $ | 4.22 | | | $ | 3.98 | | | $ | 4.48 | | | $ | 4.59 | | | $ | 4.59 | |
| | | | | | | | | | | | | | | | | | | | |
Total return | | | 10.98 | %(b) | | | (4.54 | )%(b) | | | 8.72 | % | | | 6.56 | % | | | 20.93 | %(b) |
RATIOS TO AVERAGE NET ASSETS: | | | | | | | | | | | | | | | | | | | | |
Net assets, end of the period (000’s) | | $ | 129,169 | | | $ | 116,837 | | | $ | 125,185 | | | $ | 108,170 | | | $ | 110,917 | |
Net expenses | | | 0.85 | %(c) | | | 0.86 | %(c)(d) | | | 0.89 | % | | | 0.90 | %(e) | | | 0.90 | %(c) |
Gross expenses | | | 0.89 | % | | | 0.88 | % | | | 0.89 | % | | | 0.90 | %(e) | | | 0.95 | % |
Net investment income | | | 5.43 | % | | | 4.67 | % | | | 4.83 | % | | | 5.37 | % | | | 5.78 | % |
Portfolio turnover rate | | | 38 | % | | | 69 | % | | | 59 | % | | | 47 | % | | | 34 | % |
| (a) | Per share net investment income has been calculated using the average shares outstanding during the period. |
| (b) | Had certain expenses not been waived/reimbursed during the period, total returns would have been lower. |
| (c) | The investment adviser agreed to waive its fees and/or reimburse a portion of the Fund’s expenses during the period. Without this waiver/reimbursement, expenses would have been higher. |
| (d) | Effective July 1, 2015, the expense limit decreased to 0.85%. |
| (e) | Includes fee/expense recovery of 0.01%. |
See accompanying notes to financial statements.
| 66
Financial Highlights (continued)
For a share outstanding throughout each period.
| | | | | | | | | | | | | | | | | | | | |
| | | Intermediate Duration Bond Fund—Class A* | |
| | | Year Ended
September 30,
2016 | | | Year Ended
September 30,
2015 | | | Year Ended
September 30,
2014 | | | Year Ended
September 30,
2013 | | | Year Ended
September 30,
2012 | |
Net asset value, beginning of the period | | $ | 10.39 | | | $ | 10.39 | | | $ | 10.34 | | | $ | 10.80 | | | $ | 10.55 | |
| | | | | | | | | | | | | | | | | | | | |
INCOME (LOSS) FROM INVESTMENT OPERATIONS: | | | | | | | | | | | | | | | | | | | | |
Net investment income(a) | | | 0.20 | | | | 0.20 | | | | 0.22 | | | | 0.18 | | | | 0.20 | |
Net realized and unrealized gain (loss) | | | 0.17 | | | | 0.03 | | | | 0.11 | | | | (0.23 | ) | | | 0.39 | |
| | | | | | | | | | | | | | | | | | | | |
Total from Investment Operations | | | 0.37 | | | | 0.23 | | | | 0.33 | | | | (0.05 | ) | | | 0.59 | |
| | | | | | | | | | | | | | | | | | | | |
LESS DISTRIBUTIONS FROM: | | | | | | | | | | | | | | | | | | | | |
Net investment income | | | (0.21 | ) | | | (0.22 | ) | | | (0.25 | ) | | | (0.24 | ) | | | (0.26 | ) |
Net realized capital gains | | | (0.03 | ) | | | (0.01 | ) | | | (0.03 | ) | | | (0.17 | ) | | | (0.08 | ) |
| | | | | | | | | | | | | | | | | | | | |
Total Distributions | | | (0.24 | ) | | | (0.23 | ) | | | (0.28 | ) | | | (0.41 | ) | | | (0.34 | ) |
| | | | | | | | | | | | | | | | | | | | |
Net asset value, end of the period | | $ | 10.52 | | | $ | 10.39 | | | $ | 10.39 | | | $ | 10.34 | | | $ | 10.80 | |
| | | | | | | | | | | | | | | | | | | | |
Total return(b)(c) | | | 3.64 | % | | | 2.17 | % | | | 3.24 | % | | | (0.46 | )% | | | 5.69 | % |
RATIOS TO AVERAGE NET ASSETS: | | | | | | | | | | | | | | | | | | | | |
Net assets, end of the period (000’s) | | $ | 19,327 | | | $ | 18,425 | | | $ | 5,931 | | | $ | 5,601 | | | $ | 3,084 | |
Net expenses(d) | | | 0.65 | % | | | 0.65 | % | | | 0.65 | % | | | 0.65 | % | | | 0.65 | % |
Gross expenses | | | 0.72 | % | | | 0.71 | % | | | 0.85 | % | | | 0.79 | % | | | 0.84 | % |
Net investment income | | | 1.89 | % | | | 1.93 | % | | | 2.07 | % | | | 1.71 | % | | | 1.91 | % |
Portfolio turnover rate | | | 151 | % | | | 151 | % | | | 134 | % | | | 124 | % | | | 82 | % |
| * | Effective August 31, 2016, Retail Class shares were redesignated as Class A shares. See Note 1 of Notes to Financial Statements. |
| (a) | Per share net investment income has been calculated using the average shares outstanding during the period. |
| (b) | A sales charge for Class A shares is not reflected in total return calculations. |
| (c) | Had certain expenses not been waived/reimbursed during the period, total returns would have been lower. |
| (d) | The investment adviser agreed to waive its fees and/or reimburse a portion of the Fund’s expenses during the period. Without this waiver/reimbursement, expenses would have been higher. |
See accompanying notes to financial statements.
67 |
Financial Highlights (continued)
For a share outstanding throughout each period.
| | | | |
| | | Intermediate Duration Bond Fund—Class C | |
| | | Period Ended
September 30,
2016* | |
Net asset value, beginning of the period | | $ | 10.53 | |
| | | | |
INCOME (LOSS) FROM INVESTMENT OPERATIONS: | | | | |
Net investment income(a) | | | 0.01 | |
Net realized and unrealized gain (loss) | | | 0.00 | (g) |
| | | | |
Total from Investment Operations | | | 0.01 | |
| | | | |
LESS DISTRIBUTIONS FROM: | | | | |
Net investment income | | | (0.01 | ) |
Net realized capital gains | | | — | |
| | | | |
Total Distributions | | | (0.01 | ) |
| | | | |
Net asset value, end of the period | | $ | 10.53 | |
| | | | |
Total return(b)(c)(d) | | | 0.08 | % |
RATIOS TO AVERAGE NET ASSETS: | | | | |
Net assets, end of the period (000’s) | | $ | 3,088 | |
Net expenses(e)(f) | | | 1.40 | % |
Gross expenses(f) | | | 1.56 | % |
Net investment income(f) | | | 0.86 | % |
Portfolio turnover rate | | | 151 | % |
| * | From commencement of Class operations on August 31, 2016 through September 30, 2016. |
| (a) | Per share net investment loss has been calculated using the average shares outstanding during the period. |
| (b) | A contingent deferred sales charge for Class C shares is not reflected in total return calculations. |
| (c) | Had certain expenses not been waived/reimbursed during the period, total returns would have been lower. |
| (d) | Periods less than one year are not annualized. |
| (e) | The investment adviser agreed to waive its fees and/or reimburse a portion of the Fund’s expenses during the period. Without this waiver/reimbursement, expenses would have been higher. |
| (f) | Computed on an annualized basis for periods less than one year. |
| (g) | Amount rounds to less than $0.01 per share. |
See accompanying notes to financial statements.
| 68
Financial Highlights (continued)
For a share outstanding throughout each period.
| | | | | | | | | | | | | | | | | | | | |
| | | Intermediate Duration Bond Fund—Class Y* | |
| | | Year Ended
September 30,
2016 | | | Year Ended
September 30,
2015 | | | Year Ended
September 30,
2014 | | | Year Ended
September 30,
2013 | | | Year Ended
September 30,
2012 | |
Net asset value, beginning of the period | | $ | 10.39 | | | $ | 10.39 | | | $ | 10.33 | | | $ | 10.80 | | | $ | 10.54 | |
| | | | | | | | | | | | | | | | | | | | |
INCOME (LOSS) FROM INVESTMENT OPERATIONS: | | | | | | | | | | | | | | | | | | | | |
Net investment income(a) | | | 0.22 | | | | 0.22 | | | | 0.24 | | | | 0.21 | | | | 0.22 | |
Net realized and unrealized gain (loss) | | | 0.18 | | | | 0.04 | | | | 0.12 | | | | (0.24 | ) | | | 0.40 | |
| | | | | | | | | | | | | | | | | | | | |
Total from Investment Operations | | | 0.40 | | | | 0.26 | | | | 0.36 | | | | (0.03 | ) | | | 0.62 | |
| | | | | | | | | | | | | | | | | | | | |
LESS DISTRIBUTIONS FROM: | | | | | | | | | | | | | | | | | | | | |
Net investment income | | | (0.24 | ) | | | (0.25 | ) | | | (0.27 | ) | | | (0.27 | ) | | | (0.28 | ) |
Net realized capital gains | | | (0.03 | ) | | | (0.01 | ) | | | (0.03 | ) | | | (0.17 | ) | | | (0.08 | ) |
| | | | | | | | | | | | | | | | | | | | |
Total Distributions | | | (0.27 | ) | | | (0.26 | ) | | | (0.30 | ) | | | (0.44 | ) | | | (0.36 | ) |
| | | | | | | | | | | | | | | | | | | | |
Net asset value, end of the period | | $ | 10.52 | | | $ | 10.39 | | | $ | 10.39 | | | $ | 10.33 | | | $ | 10.80 | |
| | | | | | | | | | | | | | | | | | | | |
Total return(b) | | | 3.90 | % | | | 2.42 | % | | | 3.60 | % | | | (0.30 | )% | | | 6.06 | % |
RATIOS TO AVERAGE NET ASSETS: | | | | | | | | | | | | | | | | | | | | |
Net assets, end of the period (000’s) | | $ | 139,398 | | | $ | 88,592 | | | $ | 66,759 | | | $ | 66,424 | | | $ | 75,588 | |
Net expenses(c) | | | 0.40 | % | | | 0.40 | % | | | 0.40 | % | | | 0.40 | % | | | 0.40 | % |
Gross expenses | | | 0.47 | % | | | 0.47 | % | | | 0.57 | % | | | 0.48 | % | | | 0.51 | % |
Net investment income | | | 2.11 | % | | | 2.15 | % | | | 2.31 | % | | | 1.97 | % | | | 2.12 | % |
Portfolio turnover rate | | | 151 | % | | | 151 | % | | | 134 | % | | | 124 | % | | | 82 | % |
| * | Effective August 31, 2016, Institutional Class shares were redesignated as Class Y shares. See Note 1 of Notes to Financial Statements. |
| (a) | Per share net investment income has been calculated using the average shares outstanding during the period. |
| (b) | Had certain expenses not been waived/reimbursed during the period, total returns would have been lower. |
| (c) | The investment adviser agreed to waive its fees and/or reimburse a portion of the Fund’s expenses during the period. Without this waiver/reimbursement, expenses would have been higher. |
See accompanying notes to financial statements.
69 |
Financial Highlights (continued)
For a share outstanding throughout each period.
| | | | | | | | | | | | | | | | | | | | |
| | | Limited Term Government and Agency Fund—Class A | |
| | | Year Ended
September 30,
2016 | | | Year Ended
September 30,
2015 | | | Year Ended
September 30,
2014 | | | Year Ended
September 30,
2013 | | | Year Ended
September 30,
2012 | |
Net asset value, beginning of the period | | $ | 11.57 | | | $ | 11.61 | | | $ | 11.68 | | | $ | 12.04 | | | $ | 11.87 | |
| | | | | | | | | | | | | | | | | | | | |
INCOME (LOSS) FROM INVESTMENT OPERATIONS: | | | | | | | | | | | | | | | | | | | | |
Net investment income(a) | | | 0.11 | | | | 0.14 | | | | 0.16 | | | | 0.13 | | | | 0.18 | |
Net realized and unrealized gain (loss) | | | 0.00 | (b) | | | 0.01 | (c) | | | 0.01 | | | | (0.23 | ) | | | 0.28 | |
| | | | | | | | | | | | | | | | | | | | |
Total from Investment Operations | | | 0.11 | | | | 0.15 | | | | 0.17 | | | | (0.10 | ) | | | 0.46 | |
| | | | | | | | | | | | | | | | | | | | |
LESS DISTRIBUTIONS FROM: | | | | | | | | | | | | | | | | | | | | |
Net investment income | | | (0.17 | ) | | | (0.19 | ) | | | (0.24 | ) | | | (0.26 | ) | | | (0.29 | ) |
Net realized capital gains | | | — | | | | — | | | | — | | | | (0.00 | )(b) | | | (0.00 | )(b) |
Paid-in capital | | | — | | | | — | | | | — | | | | (0.00 | )(b) | | | — | |
| | | | | | | | | | | | | | | | | | | | |
Total Distributions | | | (0.17 | ) | | | (0.19 | ) | | | (0.24 | ) | | | (0.26 | ) | | | (0.29 | ) |
| | | | | | | | | | | | | | | | | | | | |
Net asset value, end of the period | | $ | 11.51 | | | $ | 11.57 | | | $ | 11.61 | | | $ | 11.68 | | | $ | 12.04 | |
| | | | | | | | | | | | | | | | | | | | |
Total return(d) | | | 0.93 | % | | | 1.26 | % | | | 1.44 | % | | | (0.81 | )% | | | 3.94 | %(e) |
RATIOS TO AVERAGE NET ASSETS: | | | | | | | | | | | | | | | | | | | | |
Net assets, end of the period (000’s) | | $ | 442,671 | | | $ | 346,317 | | | $ | 314,360 | | | $ | 355,212 | | | $ | 357,870 | |
Net expenses | | | 0.77 | % | | | 0.77 | % | | | 0.80 | %(f) | | | 0.87 | %(g) | | | 0.85 | %(h) |
Gross expenses | | | 0.77 | % | | | 0.77 | % | | | 0.80 | %(f) | | | 0.87 | %(g) | | | 0.90 | % |
Net investment income | | | 0.96 | % | | | 1.21 | % | | | 1.35 | % | | | 1.11 | % | | | 1.54 | % |
Portfolio turnover rate | | | 109 | %(i) | | | 48 | % | | | 24 | % | | | 39 | % | | | 56 | % |
| (a) | Per share net investment income has been calculated using the average shares outstanding during the period. |
| (b) | Amount rounds to less than $0.01 per share. |
| (c) | The amount shown for a share outstanding does not correspond with the aggregate realized and unrealized gain (loss) on investments for the period due to the timing of sales and redemptions of fund shares in relation to fluctuating market values of investments of the Fund. |
| (d) | A sales charge for Class A shares is not reflected in total return calculations. |
| (e) | Had certain expenses not been waived/reimbursed during the period, total returns would have been lower. |
| (f) | Includes fee/expense recovery of less than 0.01%. |
| (g) | Includes corporate tax expenses of 0.03%. Without this expense the ratio of net expenses would have been 0.84%. |
| (h) | The investment adviser agreed to waive its fees and/or reimburse a portion of the Fund’s expenses during the period. Without this waiver/reimbursement, expenses would have been higher. |
| (i) | The variation in the Fund’s turnover rate from 2015 to 2016 was primarily due to fluctuation in the level of fund assets due to shareholder flows. |
See accompanying notes to financial statements.
| 70
Financial Highlights (continued)
For a share outstanding throughout each period.
| | | | | | | | | | | | | | | | | | | | |
| | | Limited Term Government and Agency Fund—Class C | |
| | | Year Ended
September 30,
2016 | | | Year Ended
September 30,
2015 | | | Year Ended
September 30,
2014 | | | Year Ended
September 30,
2013 | | | Year Ended
September 30,
2012 | |
Net asset value, beginning of the period | | $ | 11.58 | | | $ | 11.62 | | | $ | 11.69 | | | $ | 12.05 | | | $ | 11.88 | |
| | | | | | | | | | | | | | | | | | | | |
INCOME (LOSS) FROM INVESTMENT OPERATIONS: | | | | | | | | | | | | | | | | | | | | |
Net investment income(a) | | | 0.02 | | | | 0.05 | | | | 0.07 | | | | 0.04 | | | | 0.10 | |
Net realized and unrealized gain (loss) | | | 0.00 | (b) | | | 0.01 | (c) | | | 0.01 | | | | (0.23 | ) | | | 0.27 | |
| | | | | | | | | | | | | | | | | | | | |
Total from Investment Operations | | | 0.02 | | | | 0.06 | | | | 0.08 | | | | (0.19 | ) | | | 0.37 | |
| | | | | | | | | | | | | | | | | | | | |
LESS DISTRIBUTIONS FROM: | | | | | | | | | | | | | | | | | | | | |
Net investment income | | | (0.08 | ) | | | (0.10 | ) | | | (0.15 | ) | | | (0.17 | ) | | | (0.20 | ) |
Net realized capital gains | | | — | | | | — | | | | — | | | | (0.00 | )(b) | | | (0.00 | )(b) |
Paid-in capital | | | — | | | | — | | | | — | | | | (0.00 | )(b) | | | — | |
| | | | | | | | | | | | | | | | | | | | |
Total Distributions | | | (0.08 | ) | | | (0.10 | ) | | | (0.15 | ) | | | (0.17 | ) | | | (0.20 | ) |
| | | | | | | | | | | | | | | | | | | | |
Net asset value, end of the period | | $ | 11.52 | | | $ | 11.58 | | | $ | 11.62 | | | $ | 11.69 | | | $ | 12.05 | |
| | | | | | | | | | | | | | | | | | | | |
Total return(d) | | | 0.18 | % | | | 0.51 | % | | | 0.69 | % | | | (1.55 | )% | | | 3.17 | %(e) |
RATIOS TO AVERAGE NET ASSETS: | | | | | | | | | | | | | | | | | | | | |
Net assets, end of the period (000’s) | | $ | 73,027 | | | $ | 63,167 | | | $ | 56,936 | | | $ | 71,963 | | | $ | 75,522 | |
Net expenses | | | 1.52 | % | | | 1.53 | % | | | 1.55 | %(f) | | | 1.62 | %(g) | | | 1.60 | %(h) |
Gross expenses | | | 1.52 | % | | | 1.53 | % | | | 1.55 | %(f) | | | 1.62 | %(g) | | | 1.65 | % |
Net investment income | | | 0.21 | % | | | 0.47 | % | | | 0.61 | % | | | 0.36 | % | | | 0.80 | % |
Portfolio turnover rate | | | 109 | %(i) | | | 48 | % | | | 24 | % | | | 39 | % | | | 56 | % |
| (a) | Per share net investment loss has been calculated using the average shares outstanding during the period. |
| (b) | Amount rounds to less than $0.01 per share. |
| (c) | The amount shown for a share outstanding does not correspond with the aggregate realized and unrealized gain (loss) on investments for the period due to the timing of sales and redemptions of fund shares in relation to fluctuating market values of investments of the Fund. |
| (d) | A contingent deferred sales charge for Class C shares is not reflected in total return calculations. |
| (e) | Had certain expenses not been waived/reimbursed during the period, total returns would have been lower. |
| (f) | Includes fee/expense recovery of less than 0.01%. |
| (g) | Includes corporate tax expenses of 0.03%. Without this expense the ratio of net expenses would have been 1.59%. |
| (h) | The investment adviser agreed to waive its fees and/or reimburse a portion of the Fund’s expenses during the period. Without this waiver/reimbursement, expenses would have been higher. |
| (i) | The variation in the Fund’s turnover rate from 2015 to 2016 was primarily due to fluctuation in the level of fund assets due to shareholder flows. |
See accompanying notes to financial statements.
71 |
Financial Highlights (continued)
For a share outstanding throughout each period.
| | | | | | | | | | | | | | | | | | | | |
| | | Limited Term Government and Agency Fund—Class Y | |
| | | Year Ended
September 30,
2016 | | | Year Ended
September 30,
2015 | | | Year Ended
September 30,
2014 | | | Year Ended
September 30,
2013 | | | Year Ended
September 30,
2012 | |
Net asset value, beginning of the period | | $ | 11.61 | | | $ | 11.65 | | | $ | 11.72 | | | $ | 12.08 | | | $ | 11.91 | |
| | | | | | | | | | | | | | | | | | | | |
INCOME (LOSS) FROM INVESTMENT OPERATIONS: | | | | | | | | | | | | | | | | | | | | |
Net investment income(a) | | | 0.14 | | | | 0.17 | | | | 0.18 | | | | 0.16 | | | | 0.21 | |
Net realized and unrealized gain (loss) | | | 0.00 | (b) | | | 0.01 | (c) | | | 0.02 | | | | (0.23 | ) | | | 0.28 | |
| | | | | | | | | | | | | | | | | | | | |
Total from Investment Operations | | | 0.14 | | | | 0.18 | | | | 0.20 | | | | (0.07 | ) | | | 0.49 | |
| | | | | | | | | | | | | | | | | | | | |
LESS DISTRIBUTIONS FROM: | | | | | | | | | | | | | | | | | | | | |
Net investment income | | | (0.20 | ) | | | (0.22 | ) | | | (0.27 | ) | | | (0.29 | ) | | | (0.32 | ) |
Net realized capital gains | | | — | | | | — | | | | — | | | | (0.00 | )(b) | | | (0.00 | )(b) |
Paid-in capital | | | — | | | | — | | | | — | | | | (0.00 | )(b) | | | — | |
| | | | | | | | | | | | | | | | | | | | |
Total Distributions | | | (0.20 | ) | | | (0.22 | ) | | | (0.27 | ) | | | (0.29 | ) | | | (0.32 | ) |
| | | | | | | | | | | | | | | | | | | | |
Net asset value, end of the period | | $ | 11.55 | | | $ | 11.61 | | | $ | 11.65 | | | $ | 11.72 | | | $ | 12.08 | |
| | | | | | | | | | | | | | | | | | | | |
Total return | | | 1.19 | % | | | 1.51 | % | | | 1.70 | % | | | (0.56 | )% | | | 4.19 | %(d) |
RATIOS TO AVERAGE NET ASSETS: | | | | | | | | | | | | | | | | | | | | |
Net assets, end of the period (000’s) | | $ | 411,898 | | | $ | 431,727 | | | $ | 330,224 | | | $ | 252,127 | | | $ | 220,444 | |
Net expenses | | | 0.52 | % | | | 0.52 | % | | | 0.55 | %(e) | | | 0.62 | %(f) | | | 0.60 | %(g) |
Gross expenses | | | 0.52 | % | | | 0.52 | % | | | 0.55 | %(e) | | | 0.62 | %(f) | | | 0.65 | % |
Net investment income | | | 1.20 | % | | | 1.45 | % | | | 1.58 | % | | | 1.35 | % | | | 1.77 | % |
Portfolio turnover rate | | | 109 | %(h) | | | 48 | % | | | 24 | % | | | 39 | % | | | 56 | % |
| (a) | Per share net investment income has been calculated using the average shares outstanding during the period. |
| (b) | Amount rounds to less than $0.01 per share. |
| (c) | The amount shown for a share outstanding does not correspond with the aggregate realized and unrealized gain (loss) on investments for the period due to the timing of sales and redemptions of fund shares in relation to fluctuating market values of investments of the Fund. |
| (d) | Had certain expenses not been waived/reimbursed during the period, total returns would have been lower. |
| (e) | Includes fee/expense recovery of less than 0.01%. |
| (f) | Includes corporate tax expenses of 0.03%. Without this expense the ratio of net expenses would have been 0.59%. |
| (g) | The investment adviser agreed to waive its fees and/or reimburse a portion of the Fund’s expenses during the period. Without this waiver/reimbursement, expenses would have been higher. |
| (h) | The variation in the Fund’s turnover rate from 2015 to 2016 was primarily due to fluctuation in the level of fund assets due to shareholder flows. |
See accompanying notes to financial statements.
| 72
Notes to Financial Statements
September 30, 2016
1. Organization. Loomis Sayles Funds I and Loomis Sayles Funds II (the “Trusts” and each a “Trust”) are each organized as a Massachusetts business trust. Each Trust is registered under the Investment Company Act of 1940, as amended (the “1940 Act”), as an open-end management investment company. Each Declaration of Trust permits the Board of Trustees to authorize the issuance of an unlimited number of shares of the Trust in multiple series. The financial statements for certain funds of the Trusts are presented in separate reports. The following funds (individually, a “Fund” and collectively, the “Funds”) are included in this report:
Loomis Sayles Funds I:
Loomis Sayles Intermediate Duration Bond Fund (the “Intermediate Duration Bond Fund”)
Loomis Sayles Funds II:
Loomis Sayles High Income Fund (the “High Income Fund”)
Loomis Sayles Limited Term Government and Agency Fund (the “Limited Term Government and Agency Fund”)
Each Fund is a diversified investment company.
The Funds each offer Class A, Class C and Class Y shares. Prior to August 31, 2016, Intermediate Duration Bond Fund offered Retail Class and Institutional Class shares. Effective August 31, 2016, Retail Class shares were redesignated as Class A shares and Institutional Class shares were redesignated as Class Y shares. In addition, the Fund began offering Class C shares. As of the close of business on January 11, 2016, Class B shares of High Income Fund and Limited Term Government and Agency Fund were converted into Class A shares and are no longer offered.
Class A shares of Intermediate Duration Bond Fund and High Income Fund are sold with a maximum front-end sales charge of 4.25% (4.50% prior to November 2, 2015 for High Income Fund). Class A shares of Limited Term Government and Agency Fund are sold with a maximum front-end sales charge of 2.25% (3.00% prior to November 2, 2015). Class C shares do not pay a front-end sales charge, do not convert to any other class of shares, pay higher Rule 12b-1 fees than Class A shares and may be subject to a CDSC of 1.00% if those shares are redeemed within one year of acquisition, except for reinvested distributions. Class Y shares do not pay a front-end sales charge, a CDSC or Rule 12b-1 fees. Class Y shares are generally intended for institutional investors with a minimum initial investment of $100,000, though some categories of investors are exempted from the minimum investment amount as outlined in the Funds’ prospectus.
Most expenses can be directly attributed to a Fund. Expenses which cannot be directly attributed to a Fund are generally apportioned based on the relative net assets of each of the funds in Natixis Funds Trust I, Natixis Funds Trust II, Natixis Funds Trust IV, Gateway Trust (“Natixis Funds Trusts”), Loomis Sayles Funds I and Loomis Sayles Funds II (“Loomis Sayles Funds Trusts”). Expenses of a Fund are borne pro rata by the holders of each class of shares, except that each class bears expenses unique to that
73 |
Notes to Financial Statements (continued)
September 30, 2016
class (such as the Rule 12b-1 fees applicable to Class A and Class C). In addition, each class votes as a class only with respect to its own Rule 12b-1 Plan. Shares of each class would receive their pro rata share of the net assets of a Fund if the Fund were liquidated. The Trustees approve separate distributions from net investment income on each class of shares.
2. Significant Accounting Policies. The following is a summary of significant accounting policies consistently followed by each Fund in the preparation of its financial statements. The Funds’ financial statements follow the accounting and reporting guidelines provided for investment companies and are prepared in accordance with accounting principles generally accepted in the United States of America which require the use of management estimates that affect the reported amounts and disclosures in the financial statements. Actual results could differ from those estimates. Management has evaluated the events and transactions subsequent to year-end through the date the financial statements were issued and has determined that there were no material events that would require disclosure in the Funds’ financial statements.
a. Valuation. Fund securities and other investments are valued at market value based on market quotations obtained or determined by independent pricing services recommended by the adviser and approved by the Board of Trustees. Fund securities and other investments for which market quotations are not readily available are valued at fair value as determined in good faith by the adviser pursuant to procedures approved by the Board of Trustees, as described below. Market value is determined as follows:
Debt securities and unlisted preferred equity securities are valued based on evaluated bids furnished to the Fund by an independent pricing service or bid prices obtained from broker-dealers. Senior loans are valued at bid prices supplied by an independent pricing service, if available. Listed equity securities (including shares of closed-end investment companies and exchange-traded funds) are valued at the last sale price quoted on the exchange where they are traded most extensively or, if there is no reported sale during the day, the closing bid quotation as reported by an independent pricing service. Securities traded on the NASDAQ Global Select Market, NASDAQ Global Market and NASDAQ Capital Market are valued at the NASDAQ Official Closing Price (“NOCP”), or if lacking an NOCP, at the most recent bid quotations on the applicable NASDAQ Market. Unlisted equity securities (except unlisted preferred equity securities) are valued at the last sale price quoted in the market where they are traded most extensively or, if there is no reported sale during the day, the closing bid quotation as reported by an independent pricing service. If there is no last sale price or closing bid quotation available, unlisted equity securities will be valued using evaluated bids furnished by an independent pricing service, if available. In some foreign markets, an official close price and a last sale price may be available from the foreign exchange
| 74
Notes to Financial Statements (continued)
September 30, 2016
or market. In those cases, the official close price is used. Broker-dealer bid prices may be used to value debt and unlisted equity securities and senior loans where an independent pricing service is unable to price a security or where an independent pricing service does not provide a reliable price for the security. Forward foreign currency contracts are valued utilizing interpolated rates determined based on information provided by an independent pricing service. Futures contracts are valued at the most recent settlement price on the exchange on which the adviser believes that, over time, they are traded most extensively. Centrally cleared credit default swap agreements are valued at settlement prices of the clearinghouse on which the contracts were traded or prices obtained from broker-dealers. Bilateral credit default swaps are valued based on mid prices (between the bid price and the ask price) supplied by an independent pricing service.
Fund securities and other investments for which market quotations are not readily available are valued at fair value as determined in good faith by the adviser pursuant to procedures approved by the Board of Trustees. The Funds may also value securities and other investments at fair value in other circumstances such as when extraordinary events occur after the close of a foreign market but prior to the close of the New York Stock Exchange (“NYSE”). This may include situations relating to a single issuer (such as a declaration of bankruptcy or a delisting of the issuer’s security from the primary market on which it has traded) as well as events affecting the securities markets in general (such as market disruptions or closings and significant fluctuations in U.S. and/or foreign markets). When fair valuing its securities or other investments, the Funds may, among other things, use modeling tools or other processes that may take into account factors such as securities or other market activity and/or significant events that occur after the close of the foreign market and before the time the Fund’s net asset value (“NAV”) is calculated. Fair value pricing may require subjective determinations about the value of a security, and fair values used to determine a Fund’s NAV may differ from quoted or published prices, or from prices that are used by others, for the same securities. In addition, the use of fair value pricing may not always result in adjustments to the prices of securities held by the Fund.
Illiquid securities for which market quotations are readily available and have been evaluated by the adviser are considered and classified as fair valued securities.
As of September 30, 2016, securities of the funds were fair valued as follows:
| | | | | | | | | | | | | | | | |
Fund | | Securities
classified as
fair valued | | | Percentage of
Net Assets | | | Securities fair
valued by the
Fund’s adviser | | | Percentage of
Net Assets | |
High Income Fund | | $ | 1,828,035 | | | | 1.0 | % | | $ | 1,097,873 | | | | 0.6 | % |
Intermediate Duration Bond Fund | | | — | | | | — | | | | 23,756 | | | | Less than 0.1 | % |
Limited Term Government and Agency Fund | | | 3,037,018 | | | | 0.3 | % | | | 1,488,611 | | | | 0.2 | % |
75 |
Notes to Financial Statements (continued)
September 30, 2016
b. Investment Transactions and Related Investment Income. Investment transactions are accounted for on a trade date plus one day basis for daily NAV calculation. However, for financial reporting purposes, investment transactions are reported on trade date. Dividend income is recorded on ex-dividend date, or in the case of certain foreign securities, as soon as a Fund is notified, and interest income is recorded on an accrual basis. Interest income is increased by the accretion of discount and decreased by the amortization of premium, if applicable. Periodic principal adjustments for inflation-protected securities are recorded to interest income. Negative principal adjustments (in the event of deflation) are recorded as reductions of interest income to the extent of interest income earned, not to exceed the amount of positive principal adjustments on a cumulative basis. In determining net gain or loss on securities sold, the cost of securities has been determined on an identified cost basis. Investment income, non-class specific expenses and realized and unrealized gains and losses are allocated on a pro rata basis to each class based on the relative net assets of each class to the total net assets of the Fund.
c. Foreign Currency Translation. The books and records of the Funds are maintained in U.S. dollars. The values of securities, currencies and other assets and liabilities denominated in currencies other than U.S. dollars are translated into U.S. dollars based upon foreign exchange rates prevailing at the end of the period. Purchases and sales of investment securities, income and expenses are translated into U.S. dollars on the respective dates of such transactions.
Net realized foreign exchange gains or losses arise from sales of foreign currency, changes in exchange rates between the trade and settlement dates on securities transactions and the difference between the amounts of dividends, interest and foreign withholding taxes recorded on the Fund’s books and the U.S. dollar equivalent of the amounts actually received or paid. Net unrealized foreign exchange gains or losses arise from changes in the value of assets and liabilities, other than investment securities, as of the end of the fiscal period, resulting from changes in exchange rates. Net realized foreign exchange gains or losses and the net change in unrealized foreign exchange gains or losses are disclosed in the Statements of Operations. For federal income tax purposes, net realized foreign exchange gains or losses are characterized as ordinary income and may, if the Funds have net losses, reduce the amount of income available to be distributed by the Funds.
The values of investment securities are presented at the foreign exchange rates prevailing at the end of the period for financial reporting purposes. Net realized and unrealized gains or losses on investments reported in the Statements of Operations reflect gains or losses resulting from changes in exchange rates and fluctuations which arise due to changes in market prices of investment securities. For federal income tax purposes, a portion of the net realized gain or loss on investments arising from changes in exchange rates, which is reflected in the Statements of Operations,
| 76
Notes to Financial Statements (continued)
September 30, 2016
may be characterized as ordinary income and may, if the Funds have net losses, reduce the amount of income available to be distributed by the Funds.
For the year ended September 30, 2016, the amount of income available to be distributed by High Income Fund has been reduced by $2,868,074 as a result of losses arising from changes in exchange rates.
The Funds may use foreign currency exchange contracts to facilitate transactions in foreign-denominated investments. Losses may arise from changes in the value of the foreign currency or if the counterparties do not perform under the contracts’ terms.
d. Forward Foreign Currency Contracts. The Funds may enter into forward foreign currency contracts, including forward foreign cross currency contracts to acquire exposure to foreign currencies or to hedge the Funds’ investments against currency fluctuation. A contract can also be used to offset a previous contract. These contracts involve market risk in excess of the unrealized gain or loss reflected in the Funds’ Statements of Assets and Liabilities. The U.S. dollar value of the currencies a Fund has committed to buy or sell represents the aggregate exposure to each currency a Fund has acquired or hedged through currency contracts outstanding at period end. Gains or losses are recorded for financial statement purposes as unrealized until settlement date. Contracts are traded over-the-counter directly with a counterparty. Risks may arise upon entering into these contracts from the potential inability of counterparties to meet the terms of their contracts and from unanticipated movements in the value of a foreign currency relative to the U.S. dollar. Certain contracts may require the movement of cash and/or securities as collateral for the Funds’ or counterparty’s net obligations under the contracts.
e. Futures Contracts. The Funds may enter into futures contracts. Futures contracts are agreements between two parties to buy and sell a particular instrument or index for a specified price on a specified future date.
When a Fund enters into a futures contract, it is required to deposit with (or for the benefit of) its broker an amount of cash or short-term high-quality securities as “initial margin.” As the value of the contract changes, the value of the futures contract position increases or declines. Subsequent payments, known as “variation margin,” are made or received by a Fund, depending on the price fluctuations in the fair value of the contract and the value of cash or securities on deposit with the broker. The aggregate principal amounts of the contracts are not recorded in the financial statements. Fluctuations in the value of the contracts are recorded in the Statements of Assets and Liabilities as an asset (liability) and in the Statements of Operations as unrealized appreciation (depreciation) until the contracts are closed, when they are recorded as realized gains (losses). Realized gain or loss on a futures position is equal to the difference between the value of the contract at the time it was opened and the value at the time it was closed, minus brokerage commissions. When a Fund enters into a futures contract certain risks may arise, such as illiquidity in the futures market,
77 |
Notes to Financial Statements (continued)
September 30, 2016
which may limit a Fund’s ability to close out a futures contract prior to settlement date, and unanticipated movements in the value of securities or interest rates.
Futures contracts are exchange-traded. Exchange-traded futures contracts are standardized and are settled through a clearing house with fulfillment supported by the credit of the exchange. Therefore, counterparty credit risks to the Funds are reduced; however, in the event that a counterparty enters into bankruptcy, a Fund’s claim against initial/variation margin on deposit with the counterparty may be subject to terms of a final settlement in bankruptcy court.
f. Swap Agreements. The Funds may enter into credit default swaps. A credit default swap is an agreement between two parties (the “protection buyer” and “protection seller”) to exchange the credit risk of an issuer (“reference obligation”) for a specified time period. The reference obligation may be one or more debt securities or an index of such securities. The Funds may be either the protection buyer or the protection seller. As a protection buyer, the Funds have the ability to hedge the downside risk of an issuer or group of issuers. As a protection seller, the Funds have the ability to gain exposure to an issuer or group of issuers whose bonds are unavailable or in short supply in the cash bond market, as well as realize additional income in the form of fees paid by the protection buyer. The protection buyer is obligated to pay the protection seller a stream of payments (“fees”) over the term of the contract, provided that no credit event, such as a default or a downgrade in credit rating, occurs on the reference obligation. The Funds may also pay or receive upfront premiums. If a credit event occurs, the protection seller must pay the protection buyer the difference between the agreed upon notional value and market value of the reference obligation. Market value in this case is determined by a facilitated auction whereby a minimum number of allowable broker bids, together with a specified valuation method, are used to calculate the value. The maximum potential amount of undiscounted future payments that a Fund as the protection seller could be required to make under a credit default swap agreement would be an amount equal to the notional amount of the agreement.
The notional amounts of swap agreements are not recorded in the financial statements. Swap agreements are valued daily and fluctuations in the value are recorded in the Statements of Operations as change in unrealized appreciation (depreciation) on swap agreements. Fees are accrued in accordance with the terms of the agreement and are recorded in the Statement of Assets and Liabilities as fees receivable or payable. When received or paid, fees are recorded in the Statement of Operations as realized gain or loss. Upfront premiums paid or received by the Funds are recorded on the Statements of Assets and Liabilities as an asset or liability, respectively, and are amortized or accreted over the term of the agreement and recorded as realized gain or loss. Payments made or received by the Funds as a result of a credit event or termination of the agreement are recorded as realized gain or loss.
Swap agreements are privately negotiated in the OTC market and may be entered into as a bilateral contract or centrally cleared (“centrally cleared swaps”). Bilateral swap
| 78
Notes to Financial Statements (continued)
September 30, 2016
agreements are traded between counterparties and, as such, are subject to the risk that a party to the agreement will not be able to meet its obligations. In a centrally cleared swap, immediately following execution of the swap agreement, the swap agreement is novated to a central counterparty (the “CCP”) and the Fund faces the CCP through a broker. Upon entering into a centrally cleared swap, the Fund is required to deposit initial margin with the broker in the form of cash or securities in an amount that varies depending on the size and risk profile of the particular swap. Subsequent payments, known as “variation margin,” are made or received by the Fund based on the daily change in the value of the centrally cleared swap agreement. For centrally cleared swaps, the Fund’s counterparty credit risk is reduced as the CCP stands between the Fund and the counterparty. The Funds cover their net obligations under outstanding swap agreements by segregating or earmarking cash or securities.
No swap agreements were held by the Funds during the year ended September 30, 2016.
g. When-Issued and Delayed Delivery Transactions. The Funds may enter into when-issued or delayed delivery transactions. When-issued refers to transactions made conditionally because a security, although authorized, has not been issued. Delayed delivery refers to transactions for which delivery or payment will occur at a later date, beyond the normal settlement period. The price of when-issued and delayed delivery securities and the date when the securities will be delivered and paid for are fixed at the time the transaction is negotiated. The security and the obligation to pay for it are recorded by the Funds at the time the commitment is entered into. The value of the security may vary with market fluctuations during the time before the Funds take delivery of the security. No interest accrues to the Funds until the transaction settles.
Delayed delivery transactions include those designated as To Be Announced (“TBAs”) in the Portfolios of Investments. For TBAs, the actual security that will be delivered to fulfill the transaction is not designated at the time of the trade. The security is “to be announced” 48 hours prior to the established trade settlement date. Certain transactions require the Funds or counterparty to post cash and/or securities as collateral for the net mark-to-market exposure to the other party. The Funds cover their net obligations under outstanding delayed delivery commitments by segregating or earmarking cash or securities at the custodian.
Purchases of when-issued or delayed delivery securities may have a similar effect on the Funds’ NAV as if the Funds’ had created a degree of leverage in the portfolio. Risks may arise upon entering into such transactions from the potential inability of counterparties to meet their obligations under the transactions. Additionally, losses may arise due to changes in the value of the underlying securities.
h. Federal and Foreign Income Taxes. The Trusts treat each Fund as a separate entity for federal income tax purposes. Each Fund intends to meet the requirements of the Internal Revenue Code of 1986, as amended, applicable to regulated investment companies, and to distribute to its shareholders substantially all of its net investment
79 |
Notes to Financial Statements (continued)
September 30, 2016
income and any net realized capital gains at least annually. Management has performed an analysis of each Fund’s tax positions for the open tax years as of September 30, 2016 and has concluded that no provisions for income tax are required. The Funds’ federal tax returns for the prior three fiscal years remain subject to examination by the Internal Revenue Service. Management is not aware of any events that are reasonably possible to occur in the next twelve months that would result in the amounts of any unrecognized tax benefits significantly increasing or decreasing for the Funds. However, management’s conclusions regarding tax positions taken may be subject to review and adjustment at a later date based on factors including, but not limited to, new tax laws and accounting regulations and interpretations thereof.
A Fund may be subject to foreign withholding taxes on investment income and taxes on capital gains on investments that are accrued and paid based upon the Fund’s understanding of the tax rules and regulations that exist in the countries in which the Fund invests. Foreign withholding taxes on dividend and interest income are reflected on the Statements of Operations as a reduction of investment income, net of amounts eligible to be reclaimed. Dividends and interest receivable on the Statements of Assets and Liabilities are net of foreign withholding taxes. Foreign withholding taxes where reclaims have been or will be filed are reflected on the Statements of Assets and Liabilities as tax reclaims receivable. Capital gains taxes paid are included in net realized gain (loss) on investments in the Statements of Operations. Accrued but unpaid capital gains taxes are reflected as foreign taxes payable on the Statements of Assets and Liabilities, if applicable, and reduce unrealized gains on investments. In the event that realized gains on investments are subsequently offset by realized losses, taxes paid on realized gains may be returned to a Fund. Such amounts, if applicable, are reflected as foreign tax rebates receivable on the Statements of Assets and Liabilities and are recorded as a realized gain when received.
i. Dividends and Distributions to Shareholders. Dividends and distributions are recorded on ex-dividend date. The timing and characterization of certain income and capital gain distributions are determined in accordance with federal tax regulations, which may differ from accounting principles generally accepted in the United States of America. Permanent differences are primarily due to differing treatments for book and tax purposes of items such as foreign currency gains and losses, contingent payment debt instruments, basis tracking from corporate actions, premium amortization, defaulted and/or non-income producing securities, paydown gains and losses, return of capital distributions received, convertible bonds and distribution re-designations. Permanent book and tax basis differences relating to shareholder distributions will result in reclassifications to capital accounts. Temporary differences between book and tax distributable earnings are primarily due to deferred Trustees’ fees, wash sales, premium amortization, forward foreign currency contracts mark-to-market, basis tracking from corporate actions, contingent payment debt instruments, convertible bonds, defaulted and/or non-income producing securities and return of capital
| 80
Notes to Financial Statements (continued)
September 30, 2016
distributions received. Amounts of income and capital gain available to be distributed on a tax basis are determined annually, and at other times during the Funds’ fiscal year as may be necessary to avoid knowingly declaring and paying a return of capital distribution. Distributions from net investment income and short-term capital gains are considered to be distributed from ordinary income for tax purposes.
The tax characterization of distributions is determined on an annual basis. The tax character of distributions paid to shareholders during the years ended September 30, 2016 and 2015 were as follows:
| | | | | | | | | | | | |
| | | 2016 Distributions Paid From: | |
Fund | | Ordinary Income | | | Long-Term
Capital Gains | | | Total | |
High Income Fund | | $ | 6,619,464 | | | $ | 396,248 | | | $ | 7,015,712 | |
Intermediate Duration Bond Fund | | | 3,295,835 | | | | — | | | | 3,295,835 | |
Limited Term Government and Agency Fund | | | 13,653,659 | | | | — | | | | 13,653,659 | |
| | | | | | | | | | | | |
| | | 2015 Distributions Paid From: | |
Fund | | Ordinary Income | | | Long-Term
Capital Gains | | | Total | |
High Income Fund | | $ | 9,843,443 | | | $ | 3,412,156 | | | $ | 13,255,599 | |
Intermediate Duration Bond Fund | | | 2,124,550 | | | | — | | | | 2,124,550 | |
Limited Term Government and Agency Fund | | | 12,685,774 | | | | — | | | | 12,685,774 | |
Differences between these amounts and those reported in the Statements of Changes in Net Assets are primarily attributable to different book and tax treatment for short-term capital gains.
As of September 30, 2016, the components of distributable earnings on a tax basis were as follows:
| | | | | | | | | | | | |
| | | High Income
Fund | | | Intermediate
Duration
Bond Fund | | | Limited Term
Government
and Agency
Fund | |
Undistributed ordinary income | | $ | 156,678 | | | $ | 1,283,403 | | | $ | 766,853 | |
| | | | | | | | | | | | |
Capital loss carryforward: | | | | | | | | | | | | |
Short-term: | | | | | | | | | | | | |
No expiration date | | | (251,066 | ) | | | — | | | | (848,283 | ) |
Long-term: | | | | | | | | | | | | |
No expiration date | | | (2,330,822 | ) | | | — | | | | (11,847,451 | ) |
| | | | | | | | | | | | |
Total capital loss carryforward | | | (2,581,888 | ) | | | — | | | | (12,695,734 | ) |
| | | | | | | | | | | | |
Unrealized appreciation (depreciation) | | | (3,172,250 | ) | | | 1,012,166 | | | | (3,267,212 | ) |
| | | | | | | | | | | | |
Total accumulated earnings (losses) | | $ | (5,597,460 | ) | | $ | 2,295,569 | | | $ | (15,196,093 | ) |
| | | | | | | | | | | | |
81 |
Notes to Financial Statements (continued)
September 30, 2016
As of September 30, 2016, unrealized appreciation (depreciation) on a tax basis was as follows:
| | | | | | | | | | | | |
| | | High Income
Fund | | | Intermediate
Duration Bond Fund | | | Limited Term
Government
and Agency
Fund | |
Unrealized appreciation (depreciation) | | | | | | | | | | | | |
Investments | | $ | (984,705 | ) | | $ | 1,012,166 | | | $ | (3,267,212 | ) |
Foreign currency translations | | | (2,187,545 | ) | | | — | | | | — | |
| | | | | | | | | | | | |
Total unrealized appreciation (depreciation) | | $ | (3,172,250 | ) | | $ | 1,012,166 | | | $ | (3,267,212 | ) |
| | | | | | | | | | | | |
j. Repurchase Agreements. Each Fund may enter into repurchase agreements, under the terms of a Master Repurchase Agreement, under which each Fund acquires securities as collateral and agrees to resell the securities at an agreed upon time and at an agreed upon price. It is each Fund’s policy that the market value of the collateral for repurchase agreements be at least equal to 102% of the repurchase price, including interest. Certain repurchase agreements are tri-party arrangements whereby the collateral is held in a segregated account for the benefit of the Fund and on behalf of the counterparty. Repurchase agreements could involve certain risks in the event of default or insolvency of the counterparty, including possible delays or restrictions upon a Fund’s ability to dispose of the underlying securities. As of September 30, 2016, each Fund, as applicable, had investments in repurchase agreements for which the value of the related collateral exceeded the value of the repurchase agreement. The gross value of repurchase agreements is included in the Statements of Assets and Liabilities for financial reporting purposes.
k. Due from Brokers. Transactions and positions in certain forward foreign currency contracts are maintained and cleared by registered U.S. broker/dealers pursuant to customer agreements between the Funds and the various broker/dealers. The due from broker balance in the Statement of Assets and Liabilities for High Income Fund represents cash pledged as collateral for forward foreign currency contracts. In certain circumstances the Fund’s use of cash held at brokers is restricted by regulation or broker mandated limits.
l. Securities Lending. The Funds have entered into an agreement with State Street Bank and Trust Company (“State Street Bank”), as agent of the Funds, to lend securities to certain designated borrowers. The loans are collateralized with cash or securities in an amount equal to at least 105% or 102% of the market value (including accrued interest) of the loaned international or domestic securities, respectively, when the loan is initiated. Thereafter, the value of the collateral must remain at least 102% of the market value (including accrued interest) of loaned securities for U.S. equities and U.S. corporate debt; at least 105% of the market value (including accrued interest) of
| 82
Notes to Financial Statements (continued)
September 30, 2016
loaned securities for non-U.S. equities; and at least 100% of the market value (including accrued interest) of loaned securities for U.S. Government securities, sovereign debt issued by non-U.S. Governments and non-U.S. corporate debt. In the event that the market value of the collateral falls below the required percentages described above, the borrower will deliver additional collateral on the next business day. As with other extensions of credit, the Funds may bear the risk of loss with respect to the investment of the collateral. The Funds invest cash collateral in short-term investments, a portion of the income from which is remitted to the borrowers and the remainder allocated between the Funds and State Street Bank as lending agent.
For the year ended September 30, 2016, none of the Funds had loaned securities under this agreement.
m. Indemnifications. Under the Trusts’ organizational documents, their officers and Trustees are indemnified against certain liabilities arising out of the performance of their duties to the Funds. Additionally, in the normal course of business, the Funds enter into contracts with service providers that contain general indemnification clauses. The Funds’ maximum exposure under these arrangements is unknown as this would involve future claims that may be made against the Funds that have not yet occurred. However, based on experience, the Funds expect the risk of loss to be remote.
3. Fair Value Measurements. In accordance with accounting standards related to fair value measurements and disclosures, the Funds have categorized the inputs utilized in determining the value of each Fund’s assets or liabilities. These inputs are summarized in the three broad levels listed below:
| | • | | Level 1 – quoted prices in active markets for identical assets or liabilities; |
| | • | | Level 2 – prices determined using other significant inputs that are observable either directly, or indirectly through corroboration with observable market data (which could include quoted prices for similar assets or liabilities, interest rates, credit risk, etc.); and |
| | • | | Level 3 – prices determined using significant unobservable inputs when quoted prices or observable inputs are unavailable such as when there is little or no market activity for an asset or liability (unobservable inputs reflect each Fund’s own assumptions in determining the fair value of assets or liabilities and would be based on the best information available). |
The inputs or methodology used for valuing securities are not necessarily an indication of the risk associated with investing in those securities.
The Funds’ pricing policies and procedures are recommended by the adviser and approved by the Board of Trustees. Debt securities are valued based on evaluated bids furnished to the Funds by an independent pricing service. Broker-dealer bid prices may be used if an independent pricing service either is unable to price a security or does
83 |
Notes to Financial Statements (continued)
September 30, 2016
not provide a reliable price for a security. Broker-dealer bid prices for which the Funds do not have knowledge of the inputs used by the broker-dealer are categorized in Level 3. All security prices, including those obtained from an independent pricing service and broker-dealer bid prices, are reviewed on a daily basis by the adviser, subject to oversight by Fund management and the Board of Trustees. If the adviser, in good faith, believes that the price provided by an independent pricing service is unreliable, broker-dealer bid prices may be used until the price provided by the independent pricing service is considered to be reliable. Reliability of all security prices, including those obtained from an independent pricing service and broker-dealer bid prices, is tested in a variety of ways, including comparison to recent transaction prices and daily fluctuations, amongst other validation procedures in place. Securities for which market quotations are not readily available are valued at fair value as determined in good faith by the Funds’ adviser pursuant to procedures approved by the Board of Trustees. Fair valued securities may be categorized in Level 3.
The following is a summary of the inputs used to value the Funds’ investments as of September 30, 2016, at value:
High Income Fund
Asset Valuation Inputs
| | | | | | | | | | | | | | | | |
Description | | Level 1 | | | Level 2 | | | Level 3 | | | Total | |
Bonds and Notes | | | | | | | | | | | | | | | | |
Non-Convertible Bonds | | | | | | | | | | | | | | | | |
ABS Home Equity | | $ | — | | | $ | 3,251,090 | | | $ | 98,704 | (b) | | $ | 3,349,794 | |
Government Owned - No Guarantee | | | — | | | | 3,508,812 | | | | 594,150 | (c) | | | 4,102,962 | |
Home Construction | | | — | | | | 2,304,681 | | | | 23 | (b) | | | 2,304,704 | |
Non-Agency Commercial Mortgage-Backed Securities | | | — | | | | 2,555,459 | | | | 908,874 | (c) | | | 3,464,333 | |
All Other Non-Convertible Bonds(a) | | | — | | | | 136,438,387 | | | | — | | | | 136,438,387 | |
| | | | | | | | | | | | | | | | |
Total Non-Convertible Bonds | | | — | | | | 148,058,429 | | | | 1,601,751 | | | | 149,660,180 | |
| | | | | | | | | | | | | | | | |
Convertible Bonds(a) | | | — | | | | 5,681,081 | | | | — | | | | 5,681,081 | |
| | | | | | | | | | | | | | | | |
Total Bonds and Notes | | | — | | | | 153,739,510 | | | | 1,601,751 | | | | 155,341,261 | |
| | | | | | | | | | | | | | | | |
Senior Loans | | | | | | | | | | | | | | | | |
Wirelines | | | — | | | | 1,205,599 | | | | 150,561 | (c) | | | 1,356,160 | |
All Other Senior Loans(a) | | | — | | | | 1,859,129 | | | | — | | | | 1,859,129 | |
| | | | | | | | | | | | | | | | |
Total Senior Loans | | | — | | | | 3,064,728 | | | | 150,561 | | | | 3,215,289 | |
| | | | | | | | | | | | | | | | |
| 84
Notes to Financial Statements (continued)
September 30, 2016
High Income Fund (continued)
Asset Valuation Inputs (continued)
| | | | | | | | | | | | | | | | |
Description | | Level 1 | | | Level 2 | | | Level 3 | | | Total | |
Preferred Stocks | | | | | | | | | | | | | | | | |
Convertible Preferred Stocks | | | | | | | | | | | | | | | | |
Midstream | | $ | — | | | $ | 604,306 | | | $ | — | | | $ | 604,306 | |
Pharmaceuticals | | | 729,608 | | | | 1,165,014 | | | | — | | | | 1,894,622 | |
REITs - Mortgage | | | — | | | | 103,095 | | | | — | | | | 103,095 | |
All Other Convertible Preferred Stocks(a) | | | 811,876 | | | | — | | | | — | | | | 811,876 | |
| | | | | | | | | | | | | | | | |
Total Convertible Preferred Stocks | | | 1,541,484 | | | | 1,872,415 | | | | — | | | | 3,413,899 | |
| | | | | | | | | | | | | | | | |
Non-Convertible Preferred Stocks(a) | | | 510,774 | | | | — | | | | — | | | | 510,774 | |
| | | | | | | | | | | | | | | | |
Total Preferred Stocks | | | 2,052,258 | | | | 1,872,415 | | | | — | | | | 3,924,673 | |
| | | | | | | | | | | | | | | | |
Other Investments(a) | | | — | | | | — | | | | 985,586 | (d) | | | 985,586 | |
Common Stocks | | | | | | | | | | | | | | | | |
Internet Software & Services | | | — | | | | — | | | | 8,177 | (b) | | | 8,177 | |
All Other Common Stocks(a) | | | 1,213,118 | | | | — | | | | — | | | | 1,213,118 | |
| | | | | | | | | | | | | | | | |
Total Common Stocks | | | 1,213,118 | | | | — | | | | 8,177 | | | | 1,221,295 | |
| | | | | | | | | | | | | | | | |
Warrants(e) | | | 349 | | | | — | | | | 5,383 | (b) | | | 5,732 | |
Short-Term Investments | | | — | | | | 9,639,758 | | | | — | | | | 9,639,758 | |
| | | | | | | | | | | | | | | | |
Total Investments | | | 3,265,725 | | | | 168,316,411 | | | | 2,751,458 | | | | 174,333,594 | |
| | | | | | | | | | | | | | | | |
Forward Foreign Currency Contracts (unrealized appreciation) | | | — | | | | 233 | | | | — | | | | 233 | |
| | | | | | | | | | | | | | | | |
Total | | $ | 3,265,725 | | | $ | 168,316,644 | | | $ | 2,751,458 | | | $ | 174,333,827 | |
| | | | | | | | | | | | | | | | |
| (a) | Details of the major categories of the Fund’s investments are reflected within the Portfolio of Investments. |
| (b) | Fair valued by the Fund’s adviser. |
| (c) | Valued using broker-dealer bid prices. |
| (d) | Fair valued by the Fund’s adviser using broker-dealer bid prices for which the inputs are unobservable to the Fund. |
| (e) | Includes a security fair valued at zero using Level 2 inputs. |
85 |
Notes to Financial Statements (continued)
September 30, 2016
Intermediate Duration Bond Fund
Asset Valuation Inputs
| | | | | | | | | | | | | | | | |
Description | | Level 1 | | | Level 2 | | | Level 3 | | | Total | |
Bonds and Notes | | | | | | | | | | | | | | | | |
Non-Convertible Bonds | | | | | | | | | | | | | | | | |
ABS Car Loan | | $ | — | | | $ | 11,162,715 | | | $ | 439,742 | (b) | | $ | 11,602,457 | |
ABS Home Equity | | | — | | | | 1,949,177 | | | | 23,756 | (c) | | | 1,972,933 | |
All Other Non-Convertible Bonds(a) | | | — | | | | 141,767,274 | | | | — | | | | 141,767,274 | |
| | | | | | | | | | | | | | | | |
Total Non-Convertible Bonds | | | — | | | | 154,879,166 | | | | 463,498 | | | | 155,342,664 | |
| | | | | | | | | | | | | | | | |
Municipals(a) | | | — | | | | 276,326 | | | | — | | | | 276,326 | |
| | | | | | | | | | | | | | | | |
Total Bonds and Notes | | | — | | | | 155,155,492 | | | | 463,498 | | | | 155,618,990 | |
| | | | | | | | | | | | | | | | |
Short-Term Investments | | | — | | | | 6,065,192 | | | | — | | | | 6,065,192 | |
| | | | | | | | | | | | | | | | |
Total | | $ | — | | | $ | 161,220,684 | | | $ | 463,498 | | | $ | 161,684,182 | |
| | | | | | | | | | | | | | | | |
| (a) | Details of the major categories of the Fund’s investments are reflected within the Portfolio of Investments. |
| (b) | Valued using broker-dealer bid prices. |
| (c) | Fair valued by the Fund’s adviser. |
For the year ended September 30, 2016 there were no transfers among Levels 1, 2 and 3.
Limited Term Government and Agency Fund
Asset Valuation Inputs
| | | | | | | | | | | | | | | | |
Description | | Level 1 | | | Level 2 | | | Level 3 | | | Total | |
Bonds and Notes | | | | | | | | | | | | | | | | |
ABS Student Loan | | $ | — | | | $ | — | | | $ | 400,000 | (b) | | $ | 400,000 | |
Agency Commercial Mortgage-Backed Securities | | | — | | | | 150,152,212 | | | | 11,781,022 | (b) | | | 161,933,234 | |
Collateralized Mortgage Obligations | | | — | | | | 132,419,280 | | | | 1,488,611 | (c) | | | 133,907,891 | |
Non-Agency Commercial Mortgage-Backed Securities | | | — | | | | 51,293,185 | | | | 3,037,018 | (b) | | | 54,330,203 | |
All Other Bonds and Notes(a) | | | — | | | | 559,256,816 | | | | — | | | | 559,256,816 | |
| | | | | | | | | | | | | | | | |
Total Bonds and Notes | | | — | | | | 893,121,493 | | | | 16,706,651 | | | | 909,828,144 | |
| | | | | | | | | | | | | | | | |
Short-Term Investments | | | — | | | | 19,857,087 | | | | — | | | | 19,857,087 | |
| | | | | | | | | | | | | | | | |
Total | | $ | — | | | $ | 912,978,580 | | | $ | 16,706,651 | | | $ | 929,685,231 | |
| | | | | | | | | | | | | | | | |
| (a) | Details of the major categories of the Fund’s investments are reflected within the Portfolio of Investments. |
| (b) | Valued using broker-dealer bid prices. |
| (c) | Fair valued by the Fund’s adviser. |
| 86
Notes to Financial Statements (continued)
September 30, 2016
The following is a reconciliation of Level 3 investments for which significant unobservable inputs were used to determine fair value as of September 30, 2015 and/or September 30, 2016:
High Income Fund
Asset Valuation Inputs
| | | | | | | | | | | | | | | | | | | | |
Investments in Securities | | Balance as of
September 30,
2015 | | | Accrued
Discounts
(Premiums) | | | Realized
Gain
(Loss) | | | Change in
Unrealized
Appreciation
(Depreciation) | | | Purchases | |
Bonds and Notes | | | | | | | | | | | | | | | | | | | | |
Non-Convertible Bonds | | | | | | | | | | | | | | | | | | | | |
ABS Home Equity | | $ | — | | | $ | — | | | $ | 9,906 | | | $ | (5,788 | ) | | $ | — | |
ABS Other | | | 750,966 | | | | — | | | | — | | | | — | | | | — | |
Government Owned - No Guarantee | | | — | | | | — | | | | — | | | | 84,150 | | | | 510,000 | |
Home Construction | | | — | | | | 27,009 | | | | — | | | | (95,096 | ) | | | — | |
Non-Agency Commercial Mortgage-Backed Securities | | | 935,000 | | | | — | | | | — | | | | (26,126 | ) | | | — | |
Senior Loans | | | | | | | | | | | | | | | | | | | | |
Wirelines | | | — | | | | 128 | | | | — | | | | (7,763 | ) | | | — | |
Other Investments | | | | | | | | | | | | | | | | | | | | |
Aircraft ABS | | | 1,000,000 | | | | — | | | | — | | | | (14,414 | ) | | | — | |
Common Stocks | | | | | | | | | | | | | | | | | | | | |
Internet Software & Services | | | — | | | | — | | | | — | | | | (11,863 | ) | | | 20,040 | |
Warrants | | | — | | | | — | | | | — | | | | 5,383 | | | | — | |
| | | | | | | | | | | | | | | | | | | | |
Total | | $ | 2,685,966 | | | $ | 27,137 | | | $ | 9,906 | | | $ | (71,517 | ) | | $ | 530,040 | |
| | | | | | | | | | | | | | | | | | | | |
87 |
Notes to Financial Statements (continued)
September 30, 2016
High Income Fund (continued)
Asset Valuation Inputs (continued)
| | | | | | | | | | | | | | | | | | | | |
Investments in Securities | | Sales | | | Transfers
into Level 3 | | | Transfers
out of
Level 3 | | | Balance as of
September 30,
2016 | | | Change in
Unrealized
Appreciation
(Depreciation)
from
Investments
Still Held at
September 30,
2016 | |
Bonds and Notes | | | | | | | | | | | | | | | | | | | | |
Non-Convertible Bonds | | | | | | | | | | | | | | | | | | | | |
ABS Home Equity | | $ | (44,737 | ) | | $ | 139,323 | | | $ | — | | | $ | 98,704 | | | $ | (5,788 | ) |
ABS Other | | | — | | | | — | | | | (750,966 | ) | | | — | | | | — | |
Government Owned - No Guarantee | | | — | | | | — | | | | — | | | | 594,150 | | | | 84,150 | |
Home Construction | | | — | | | | 68,110 | | | | — | | | | 23 | | | | (95,096 | ) |
Non-Agency Commercial Mortgage-Backed Securities | | | — | | | | — | | | | — | | | | 908,874 | | | | (26,126 | ) |
Senior Loans | | | | | | | | | | | | | | | | | | | | |
Wirelines | | | — | | | | 158,196 | | | | — | | | | 150,561 | | | | (7,763 | ) |
Other Investments | | | | | | | | | | | | | | | | | | | | |
Aircraft ABS | | | — | | | | — | | | | — | | | | 985,586 | | | | (14,414 | ) |
Common Stocks | | | | | | | | | | | | | | | | | | | | |
Internet Software & Services | | | — | | | | — | | | | — | | | | 8,177 | | | | (11,863 | ) |
Warrants | | | — | | | | — | | | | — | | | | 5,383 | | | | 5,383 | |
| | | | | | | | | | | | | | | | | | | | |
Total | | $ | (44,737 | ) | | $ | 365,629 | | | $ | (750,966 | ) | | $ | 2,751,458 | | | $ | (71,517 | ) |
| | | | | | | | | | | | | | | | | | | | |
Debt securities valued at $207,433 were transferred from Level 2 to Level 3 during the period ended September 30, 2016. At September 30, 2015, these securities were valued on the basis of evaluated bids furnished to the Fund by an independent pricing service in accordance with the Fund’s valuation policies. At September 30, 2016, these securities were valued at fair value as determined in good faith by the Fund’s adviser as an independent pricing service did not provide a reliable price for the securities.
Debt securities valued at $750,966 were transferred from Level 3 to Level 2 during the period ended September 30, 2016. At September 30, 2015, these securities were valued using broker-dealer bid prices based on inputs unobservable to the Fund as an independent pricing service was unable to price the securities. At September 30, 2016,
| 88
Notes to Financial Statements (continued)
September 30, 2016
these securities were valued on the basis of evaluated bids furnished to the Fund by an independent pricing service in accordance with the Fund’s valuation policies.
A debt security valued at $158,196 was transferred from Level 2 to Level 3 during the period ended September 30, 2016. At September 30, 2015, this security was valued on the basis of evaluated bids furnished to the Fund by an independent pricing service in accordance with the Fund’s valuation policies. At September 30, 2016, this security was valued using broker-dealer bid prices based on inputs unobservable to the Fund as an independent pricing service did not provide a reliable price for the security.
All transfers are recognized as of the beginning of the reporting period.
Intermediate Duration Bond
Asset Valuation Inputs
| | | | | | | | | | | | | | | | | | | | |
Investments in Securities | | Balance as of
September 30,
2015 | | | Accrued
Discounts
(Premiums) | | | Realized
Gain
(Loss) | | | Change in
Unrealized
Appreciation
(Depreciation) | | | Purchases | |
Bonds and Notes | | | | | | | | | | | | | | | | | | | | |
Non-Convertible Bonds | | | | | | | | | | | | | | | | | | | | |
ABS Car Loan | | $ | — | | | $ | — | | | $ | — | | | $ | (184 | ) | | $ | 439,926 | |
ABS Home Equity | | | 35,366 | | | | — | | | | 2,597 | | | | (1,314 | ) | | | — | |
| | | | | | | | | | | | | | | | | | | | |
Total | | $ | 35,366 | | | $ | — | | | $ | 2,597 | | | $ | (1,498 | ) | | $ | 439,926 | |
| | | | | | | | | | | | | | | | | | | | |
| | | | | |
Investments in Securities | | Sales | | | Transfers
into Level 3 | | | Transfers
out of
Level 3 | | | Balance as of
September 30,
2016 | | | Change in
Unrealized
Appreciation
(Depreciation)
from
Investments
Still Held at
September 30,
2016 | |
Bonds and Notes | | | | | | | | | | | | | | | | | | | | |
Non-Convertible Bonds | | | | | | | | | | | | | | | | | | | | |
ABS Car Loan | | $ | — | | | $ | — | | | $ | — | | | $ | 439,742 | | | $ | (184 | ) |
ABS Home Equity | | | (12,893 | ) | | | — | | | | — | | | | 23,756 | | | | (1,628 | ) |
| | | | | | | | | | | | | | | | | | | | |
Total | | $ | (12,893 | ) | | $ | — | | | $ | — | | | $ | 463,498 | | | $ | (1,812 | ) |
| | | | | | | | | | | | | | | | | | | | |
89 |
Notes to Financial Statements (continued)
September 30, 2016
Limited Term Government and Agency Fund
Asset Valuation Inputs
| | | | | | | | | | | | | | | | | | | | |
Investments in Securities | | Balance as of
September 30,
2015 | | | Accrued
Discounts
(Premiums) | | | Realized
Gain
(Loss) | | | Change in
Unrealized
Appreciation
(Depreciation) | | | Purchases | |
Bonds and Notes | | | | | | | | | | | | | | | | | | | | |
Non-Convertible Bonds | | | | | | | | | | | | | | | | | | | | |
ABS Student Loan | | $ | — | | | $ | — | | | $ | — | | | $ | — | | | $ | 400,000 | |
Agency Commercial Mortgage-Backed Securities | | | 14,113,679 | | | | — | | | | (341,631 | ) | | | (93,072 | ) | | | — | |
Collateralized Mortgage Obligations | | | 20,837 | | | | — | | | | (149,996 | ) | | | 42,763 | | | | — | |
Non-Agency Commercial Mortgage-Backed Securities | | | 3,037,972 | | | | — | | | | — | | | | (954 | ) | | | — | |
| | | | | | | | | | | | | | | | | | | | |
Total | | $ | 17,172,488 | | | $ | — | | | $ | (491,627 | ) | | $ | (51,263 | ) | | $ | 400,000 | |
| | | | | | | | | | | | | | | | | | | | |
| | | | | |
Investments in Securities | | Sales | | | Transfers
into Level 3 | | | Transfers
out of
Level 3 | | | Balance as of
September 30,
2016 | | | Change in
Unrealized
Appreciation
(Depreciation)
from
Investments
Still Held at
September 30,
2016 | |
Bonds and Notes | | | | | | | | | | | | | | | | | | | | |
Non-Convertible Bonds | | | | | | | | | | | | | | | | | | | | |
ABS Student Loan | | $ | — | | | $ | — | | | $ | — | | | $ | 400,000 | | | $ | — | |
Agency Commercial Mortgage-Backed Securities | | | (1,897,954 | ) | | | — | | | | — | | | | 11,781,022 | | | | (312,513 | ) |
Collateralized Mortgage Obligations | | | (2,485,345 | ) | | | 4,060,352 | | | | — | | | | 1,488,611 | | | | 42,766 | |
Non-Agency Commercial Mortgage-Backed Securities | | | — | | | | — | | | | — | | | | 3,037,018 | | | | (954 | ) |
| | | | | | | | | | | | | | | | | | | | |
Total | | $ | (4,383,299 | ) | | $ | 4,060,352 | | | $ | — | | | $ | 16,706,651 | | | $ | (270,701 | ) |
| | | | | | | | | | | | | | | | | | | | |
| 90
Notes to Financial Statements (continued)
September 30, 2016
Debt securities valued at $4,060,352 were transferred from Level 2 to Level 3 during the period ended September 30, 2016. At September 30, 2015, these securities were valued on the basis of evaluated bids furnished to the Fund by an independent pricing service in accordance with the Fund’s valuation policies. At September 30, 2016, these securities were valued at fair value as determined in good faith by the Fund’s adviser as an independent pricing service did not provide a reliable price for the securities.
All transfers are recognized as of the beginning of the reporting period.
4. Derivatives. Derivative instruments are defined as financial instruments whose value and performance are based on the value and performance of an underlying asset, reference rate or index. Derivative instruments that High Income Fund used during the period include forward foreign currency contracts and futures contracts.
High Income Fund is subject to the risk that changes in foreign currency exchange rates will have an unfavorable effect on the value of Fund assets denominated in foreign currencies. The Fund may enter into forward foreign currency contracts for hedging purposes to protect the value of the Fund’s holdings of foreign securities. The Fund may also use forward foreign currency contracts to gain exposure to foreign currencies, regardless of whether securities denominated in such currencies are held in the Fund. During the year ended September 30, 2016, High Income Fund engaged in forward foreign currency transactions for hedging purposes.
High Income Fund is subject to the risk that changes in interest rates will affect the value of the Fund’s investments in fixed-income securities. A Fund will be subject to increased interest rate risk to the extent that it invests in fixed-income securities with longer maturities or durations, as compared to investing in fixed-income securities with shorter maturities or durations. The Fund may use futures contracts to hedge against changes in interest rates and to manage its duration without having to buy or sell portfolio securities. During the year ended September 30, 2016, High Income Fund used futures contracts to manage duration.
The following is a summary of derivative instruments for High Income Fund as of September 30, 2016, as reflected within the Statements of Assets and Liabilities:
| | | | |
Assets | | Unrealized
appreciation on
forward foreign
currency contracts | |
Over-the-counter liability derivatives | | | | |
Foreign exchange contracts | | $ | 233 | |
91 |
Notes to Financial Statements (continued)
September 30, 2016
Transactions in derivative instruments for High Income Fund during the year ended September 30, 2016, as reflected within the Statements of Operations, were as follows:
| | | | | | | | |
Net Realized Gain (Loss) on: | | Futures contracts | | | Foreign currency transactions1 | |
Interest rate contracts | | $ | (176,542 | ) | | $ | — | |
Foreign exchange contracts | | | — | | | | 281,234 | |
| | | | | | | | |
Total | | $ | (176,542 | ) | | $ | 281,234 | |
| | | | | | | | |
| | |
Net Change in Unrealized
Appreciation (Depreciation) on: | | Futures contracts | | | Foreign currency translations1 | |
Interest rate contracts | | $ | 160,868 | | | $ | — | |
Foreign exchange contracts | | | — | | | | (263,174 | ) |
| | | | | | | | |
Total | | $ | 160,868 | | | $ | (263,174 | ) |
| | | | | | | | |
| 1 | Represents realized gain and change in unrealized appreciation (depreciation), respectively, for forward foreign currency contracts during the period. Does not include other foreign currency gains or losses included in the Statements of Operations. |
As the Funds value their derivatives at fair value and recognize changes in fair value through the Statements of Operations, they do not qualify for hedge accounting under authoritative guidance for derivative instruments. The Funds’ investments in derivatives may represent an economic hedge; however, they are considered to be non-hedge transactions for the purpose of these disclosures.
The volume of forward foreign currency contract and futures contract activity, as a percentage of net assets, based on gross month-end notional amounts outstanding during the period, including long and short positions at absolute value, was as follows for the year ended September 30, 2016:
| | | | | | | | |
High Income Fund | | Forwards | | | Futures | |
Average Notional Amount Outstanding | | | 1.18 | % | | | 2.28 | % |
Highest Notional Amount Outstanding | | | 2.03 | % | | | 7.49 | % |
Lowest Notional Amount Outstanding | | | 0.11 | % | | | 0.00 | % |
Notional Amount Outstanding as of
September 30, 2016 | | | 0.11 | % | | | 0.00 | % |
Notional amounts outstanding at the end of the prior period are included in the average notional amount outstanding.
Unrealized gain and/or loss on open forwards and futures is recorded in the Statements of Assets and Liabilities. The aggregate notional values of forward and futures contracts are not recorded in the Statements of Assets and Liabilities, and therefore are not included in the Funds’ net assets.
| 92
Notes to Financial Statements (continued)
September 30, 2016
Over-the-counter derivatives, including forward foreign currency contracts, are entered into pursuant to International Swaps and Derivatives Association, Inc. (“ISDA”) agreements negotiated between the Funds and their counterparties. ISDA agreements typically contain, among other things, terms for the posting of collateral and master netting provisions in the event of a default or other termination event. Collateral is posted by a Fund or the counterparty to the extent of the net mark-to-market exposure to the other party of all open contracts under the agreement, subject to minimum transfer requirements. Master netting provisions allow the Funds and the counterparty, in the event of a default or other termination event, to offset amounts owed by each related to derivative contracts, including any posted collateral, to one net amount payable by either the Funds or the counterparty. The Funds’ ISDA agreements typically contain provisions that allow a counterparty to terminate open contracts early if the NAV of a Fund declines beyond a certain threshold. For financial reporting purposes, the Funds do not offset derivative assets and liabilities, and any related collateral received or pledged, on the Statements of Assets and Liabilities.
As of September 30, 2016, gross amounts of over-the-counter derivative assets and liabilities not offset in the Statements of Assets and Liabilities and the related net amounts after taking into account master netting arrangements by counterparty, are as follows:
High Income Fund
| | | | | | | | | | | | | | | | | | | | |
Counterparty | | Gross Amounts of
Assets | | | Offset
Amount | | | Net Asset
Balance | | | Collateral
(Received)/
Pledged | | | Net
Amount | |
Bank of America, N.A. | | $ | 233 | | | $ | — | | | $ | 233 | | | $ | — | | | $ | 233 | |
The actual collateral received or pledged, if any, may exceed the amounts shown in the table due to overcollateralization. Timing differences may exist between when contracts under the ISDA agreements are marked-to-market and when collateral moves. The ISDA agreements include tri-party control agreements under which collateral is held for the benefit of the secured party at a third party custodian, State Street Bank.
Counterparty risk is managed based on policies and procedures established by each Fund’s adviser. Such policies and procedures may include, but are not limited to, minimum counterparty credit rating requirements, monitoring of counterparty credit default swap spreads and posting of collateral. A Fund’s risk of loss from counterparty credit risk on over-the-counter derivatives is generally limited to the Fund’s aggregated unrealized gains and the amount of any collateral pledged to the counterparty, which may be offset by any collateral posted to the Fund by the counterparty. ISDA master agreements can help to manage counterparty risk by specifying collateral posting arrangements at pre-arranged exposure levels. Under these ISDA agreements,
93 |
Notes to Financial Statements (continued)
September 30, 2016
collateral is routinely transferred if the total net exposure in respect of certain transactions, net of existing collateral already in place, exceeds a specified amount (typically $250,000, depending on the counterparty). With exchange-traded derivatives, there is minimal counterparty credit risk to the Fund because the exchange’s clearinghouse, as counterparty to these instruments, stands between the buyer and the seller of the contract. Credit risk still exists in exchange-traded derivatives with respect to initial and variation margin that is held in a broker’s customer accounts. While brokers are required to segregate customer margin from their own assets, in the event that a broker becomes insolvent or goes into bankruptcy and at that time there is a shortfall in the aggregate amount of margin held by the broker for all its clients, U.S. bankruptcy laws will typically allocate that shortfall on a pro rata basis across all of the broker’s customers, potentially resulting in losses to the Fund. Based on balances reflected on each Fund’s Statement of Assets and Liabilities, the following table shows (i) the maximum amount of loss due to credit risk that, based on the gross fair value of the financial instrument, the applicable Fund would incur if parties (including OTC derivative counterparties and brokers holding margin for exchange-traded derivatives) to the relevant financial instruments failed completely to perform according to the terms of the contracts and the collateral or other security, if any, for the amount due proved to be of no value to the Fund, and (ii) the amount of loss that the applicable Fund would incur after taking into account master netting provisions pursuant to ISDA agreements, as of September 30, 2016:
| | | | | | | | |
Fund | | Maximum Amount
of Loss - Gross | | | Maximum Amount
of Loss - Net | |
High Income Fund | | $ | 7,233 | | | $ | 7,233 | |
5. Purchases and Sales of Securities. For the year ended September 30, 2016, purchases and sales of securities (excluding short-term investments and including paydowns) were as follows:
| | | | | | | | | | | | | | | | |
| | | U.S. Government/
Agency Securities | | | Other Securities | |
Fund | | Purchases | | | Sales | | | Purchases | | | Sales | |
High Income Fund | | $ | 9,985,547 | | | $ | 13,851,481 | | | $ | 49,568,649 | | | $ | 52,338,522 | |
Intermediate Duration Bond Fund | | | 77,188,897 | | | | 51,415,612 | | | | 177,222,785 | | | | 142,480,422 | |
Limited Term Government and Agency Fund | | | 919,322,168 | | | | 900,410,968 | | | | 140,894,958 | | | | 67,739,496 | |
| 94
Notes to Financial Statements (continued)
September 30, 2016
6. Management Fees and Other Transactions with Affiliates.
a. Management Fees. Loomis, Sayles & Company, L.P. (“Loomis Sayles”) serves as investment adviser to each Fund. Under the terms of the management agreements, each Fund pays a management fee at the following annual rates, calculated daily and payable monthly, based on each Fund’s average daily net assets:
| | | | | | | | | | | | | | | | |
| | | Percentage of Average Daily Net Assets | |
Fund | | First $100 million | | | Next $400 million | | | Next $1.5 billion | | | Over $2 billion | |
High Income Fund | | | 0.6000 | % | | | 0.6000 | % | | | 0.6000 | % | | | 0.6000 | % |
Intermediate Duration Bond Fund | | | 0.2500 | % | | | 0.2500 | % | | | 0.2500 | % | | | 0.2500 | % |
Limited Term Government and Agency Fund | | | 0.3750 | % | | | 0.3750 | % | | | 0.3500 | % | | | 0.3000 | % |
Loomis Sayles has given binding undertakings to the Funds to waive management fees and/or reimburse certain expenses to limit the Funds’ operating expenses, exclusive of acquired fund fees and expenses, brokerage expenses, interest expense, taxes, organizational and extraordinary expenses such as litigation and indemnification expenses. These undertakings are in effect until January 31, 2017 (January 31, 2018 for Intermediate Duration Bond Fund), may be terminated before then only with the consent of the Funds’ Board of Trustees, and are reevaluated on an annual basis. Management fees payable, as reflected on the Statements of Assets and Liabilities, is net of waivers and/or expense reimbursements, if any, pursuant to these undertakings. Waivers/reimbursements that exceed management fees payable are reflected on the Statements of Assets and Liabilities as receivable from investment adviser.
For the year ended September 30, 2016 (period ending close of business January 11, 2016, for Class B) the expense limits as a percentage of average daily net assets under the expense limitation agreements were as follows:
| | | | | | | | | | | | | | | | |
| | | Expense Limit as a Percentage of
Average Daily Net Assets | |
Fund | | Class A | | | Class B | | | Class C | | | Class Y | |
High Income Fund | | | 1.10 | % | | | 1.85 | % | | | 1.85 | % | | | 0.85 | % |
Intermediate Duration Bond Fund | | | 0.65 | % | | | — | | | | 1.40 | % | | | 0.40 | % |
Limited Term Government and Agency Fund | | | 0.80 | % | | | 1.55 | % | | | 1.55 | % | | | 0.55 | % |
Loomis Sayles shall be permitted to recover expenses borne under the expense limitation agreements (whether through waiver of its management fees or otherwise) on a class by class basis in later periods to the extent the annual operating expenses of a class fall below a class’ expense limits, provided, however, that a class is not obligated to pay such waived/reimbursed fees or expenses more than one year after the end of the fiscal year in which the fees or expenses were waived/reimbursed.
95 |
Notes to Financial Statements (continued)
September 30, 2016
For the year ended September 30, 2016, the management fees and waivers of management fees for each Fund were as follows:
| | | | | | | | | | | | | | | | | | | | |
| | | Gross
Management
Fees | | | Waivers of
Management
Fees1 | | | Net
Management
Fees | | | Percentage of
Average
Daily Net Assets | |
Fund | | | | | Gross | | | Net | |
High Income Fund | | $ | 971,664 | | | $ | 67,553 | | | $ | 904,111 | | | | 0.600 | % | | | 0.558 | % |
Intermediate Duration Bond Fund | | | 330,657 | | | | 96,550 | | | | 234,107 | | | | 0.250 | % | | | 0.177 | % |
Limited Term Government and Agency Fund | | | 3,309,940 | | | | — | | | | 3,309,940 | | | | 0.364 | % | | | 0.364 | % |
| 1 | Management fee waivers are subject to possible recovery until September 30, 2017. |
No expenses were recovered for any of the Funds during the year ended September 30, 2016 under the terms of the expense limitation agreements.
Certain officers and employees of Loomis Sayles are also officers or Trustees of the Trust. Loomis Sayles’ general partner is indirectly owned by Natixis Global Asset Management, L.P. (“Natixis US”), which is part of Natixis Global Asset Management, an international asset management group based in Paris, France.
b. Service and Distribution Fees. NGAM Distribution, L.P. (“NGAM Distribution), which is a wholly-owned subsidiary of Natixis US, has entered into a distribution agreement with the Trusts. Pursuant to this agreement, NGAM Distribution serves as principal underwriter of the Funds of the Trusts.
Pursuant to Rule 12b-1 under the 1940 Act, the Trusts have adopted a Service Plan relating to each Fund’s Class A shares (the “Class A Plans”) (effective August 31, 2016 for Intermediate Duration Bond Fund), and a Distribution and Service Plan relating to each Fund’s Class B and Class C shares (the “Class B and Class C Plans”).
Under the Class A Plans, each Fund pays NGAM Distribution a monthly service fee at an annual rate not to exceed 0.25% of the average daily net assets attributable to the Fund’s Class A shares, as reimbursement for expenses incurred by NGAM Distribution in providing personal services to investors in Class A shares and/or the maintenance of shareholder accounts.
Under the Class B and Class C Plans, each Fund pays (or paid) NGAM Distribution a monthly service fee at an annual rate not to exceed 0.25% of the average daily net assets attributable to the Fund’s Class B and Class C shares, as compensation for services provided by NGAM Distribution in providing personal services to investors in Class B and Class C shares and/or the maintenance of shareholder accounts.
Also under the Class B and Class C Plans, each Fund pays (or paid) NGAM Distribution a monthly distribution fee at the annual rate of 0.75% of the average daily net assets
| 96
Notes to Financial Statements (continued)
September 30, 2016
attributable to the Fund’s Class B and Class C shares, as compensation for services provided by NGAM Distribution in connection with the marketing or sale of Class B and Class C shares.
For the year ended September 30, 2016, the service and distribution fees for each Fund were as follows:
| | | | | | | | | | | | | | | | | | | | |
| | | Service Fees | | | Distribution Fees | |
Fund | | Class A | | | Class B | | | Class C | | | Class B | | | Class C | |
High Income Fund | | $ | 85,726 | | | $ | 1 | | | $ | 29,545 | | | $ | 2 | | | $ | 88,636 | |
Intermediate Duration Bond Fund | | | 4,001 | | | | — | | | | — | (a) | | | — | | | | 1 | |
Limited Term Government and Agency Fund | | | 1,002,251 | | | | 1,734 | | | | 193,399 | | | | 5,201 | | | | 580,197 | |
Prior to August 31, 2016, pursuant to Rule 12b-1 under the 1940 Act, Intermediate Duration Bond Fund had adopted a Distribution Plan relating to the Fund’s Retail Class shares (the “Retail Class Plan”). Under the Retail Class Plan, the Fund paid NGAM Distribution a monthly distribution fee at an annual rate not to exceed 0.25% of the average daily net assets attributable to the Fund’s Retail Class shares, as compensation for services provided by NGAM Distribution in connection with the marketing or sale of Retail Class shares or for payments made by NGAM Distribution to securities dealers or other financial intermediaries as commissions, asset-based sales charges or other compensation with respect to the sale of Retail Class shares, or for providing personal services to investors and/or the maintenance of shareholder accounts.
For the period ended August 31, 2016, Retail Class shares of Intermediate Duration Bond Fund paid $44,480 in distribution fees.
c. Administrative Fees. NGAM Advisors, L.P. (“NGAM Advisors”) provides certain administrative services for the Funds and contracts with State Street Bank to serve as sub-administrator. NGAM Advisors is a wholly-owned subsidiary of Natixis US. Pursuant to an agreement among Natixis Funds Trusts, Loomis Sayles Funds Trusts and NGAM Advisors, each Fund pays NGAM Advisors monthly its pro rata portion of fees equal to an annual rate of 0.0575% of the first $15 billion of the average daily net assets of the Natixis Funds Trusts and Loomis Sayles Funds Trusts, 0.0500% of the next $15 billion, 0.0400% of the next $30 billion, 0.0350% of the next $30 billion and 0.0325% of such assets in excess of $90 billion, subject to an annual aggregate minimum fee for the Natixis Funds Trusts and Loomis Sayles Funds Trusts of $10 million, which is reevaluated on an annual basis.
97 |
Notes to Financial Statements (continued)
September 30, 2016
For the year ended September 30, 2016, the administrative fees for each Fund were as follows:
| | | | |
Fund | | Administrative
Fees | |
High Income Fund | | $ | 71,381 | |
Intermediate Duration Bond Fund | | | 58,358 | |
Limited Term Government and Agency Fund | | | 401,349 | |
d. Sub-Transfer Agent Fees. NGAM Distribution has entered into agreements, which include servicing agreements, with financial intermediaries that provide recordkeeping, processing, shareholder communications and other services to customers of the intermediaries that hold positions in the Funds and has agreed to compensate the intermediaries for providing those services. Intermediaries transact with the Funds primarily through the use of omnibus accounts on behalf of their customers who hold positions in the Funds. These services would have been provided by the Funds’ transfer agent and other service providers if the shareholders’ accounts were maintained directly at the Funds’ transfer agent. Accordingly, the Funds have agreed to reimburse NGAM Distribution for all or a portion of the servicing fees paid to these intermediaries. The reimbursement amounts (sub-transfer agent fees) paid to NGAM Distribution are subject to a current per-account equivalent fee limit approved by the Funds’ Board of Trustees, which is based on fees for similar services paid to the Funds’ transfer agent and other service providers.
For the year ended September 30, 2016, the sub-transfer agent fees (which are reflected in transfer agent fees and expenses in the Statements of Operations) for each Fund were as follows:
| | | | |
Fund | | Sub-Transfer
Agent Fees | |
High Income Fund | | $ | 166,948 | |
Intermediate Duration Bond Fund | | | 37,313 | |
Limited Term Government and Agency Fund | | | 403,560 | |
As of September 30, 2016, the Funds owe NGAM Distribution the following reimbursements for sub-transfer agent fees (which are reflected in the Statements of Assets and Liabilities as payable to distributor):
| | | | |
Fund | | Reimbursements
of Sub-Transfer
Agent Fees | |
High Income Fund | | $ | 2,170 | |
Intermediate Duration Bond Fund | | | 670 | |
Limited Term Government and Agency Fund | | | 5,346 | |
| 98
Notes to Financial Statements (continued)
September 30, 2016
e. Commissions. Commissions (including CDSCs) on Fund shares retained by NGAM Distribution during the year ended September 30, 2016 were as follows:
| | | | |
Fund | | Commissions | |
High Income Fund | | $ | 2,704 | |
Limited Term Government and Agency Fund | | | 49,660 | |
f. Trustees Fees and Expenses. The Trusts do not pay any compensation directly to their officers or Trustees who are directors, officers or employees of NGAM Advisors, NGAM Distribution, Natixis US or their affiliates. The Chairperson of the Board of Trustees receives a retainer fee at the annual rate of $325,000. The Chairperson does not receive any meeting attendance fees for Board of Trustees meetings or committee meetings that she attends. Each Independent Trustee (other than the Chairperson) receives, in the aggregate, a retainer fee at the annual rate of $155,000. Each Independent Trustee also receives a meeting attendance fee of $10,000 for each meeting of the Board of Trustees that he or she attends in person and $5,000 for each meeting of the Board of Trustees that he or she attends telephonically. In addition, the chairperson of the Contract Review Committee and the chairperson of the Audit Committee each receive an additional retainer fee at the annual rate of $17,500. The chairperson of the Governance Committee receives an additional retainer fee at the annual rate of $10,000. Each Contract Review Committee member is compensated $6,000 for each Committee meeting that he or she attends in person and $3,000 for each meeting that he or she attends telephonically. Each Audit Committee member is compensated $6,000 for each Committee meeting that he or she attends in person and $3,000 for each meeting that he or she attends telephonically. These fees are allocated among the funds in the Natixis Funds Trusts and Loomis Sayles Funds Trusts based on a formula that takes into account, among other factors, the relative net assets of each fund. Trustees are reimbursed for travel expenses in connection with attendance at meetings.
Prior to January 1, 2016, the Chairperson of the Board received a retainer fee at the annual rate of $300,000 and each Independent Trustee (other than the Chairperson) received, in the aggregate, a retainer fee at the annual rate of $130,000. The chairperson of the Governance Committee received an additional retainer fee at the annual rate of $5,000. All other Trustee fees remained unchanged.
A deferred compensation plan (the “Plan”) is available to the Trustees on a voluntary basis. Deferred amounts remain in the Funds until distributed in accordance with the provisions of the Plan. The value of a participating Trustee’s deferral account is based on theoretical investments of deferred amounts, on the normal payment dates, in certain funds of the Natixis Funds Trusts and Loomis Sayles Funds Trusts as designated by the participating Trustees. Changes in the value of participants’ deferral accounts are allocated pro rata among the funds in the Natixis Funds Trusts and Loomis Sayles Funds Trusts, and are normally reflected as Trustees’ fees and expenses
99 |
Notes to Financial Statements (continued)
September 30, 2016
in the Statements of Operations. The portions of the accrued obligations allocated to the Funds under the Plan are reflected as Deferred Trustees’ fees in the Statements of Assets and Liabilities.
g. Affiliated Ownership. As of September 30, 2016, Natixis US held shares of Intermediate Duration Bond Fund representing less than 0.01% of the Fund’s net assets. Loomis Sayles Employees’ Profit Sharing Retirement Plan (“Retirement Plan”) held shares of the Funds representing the following percentages of the Fund’s net assets:
| | | | |
Fund | | Retirement Plan | |
Intermediate Duration Bond Fund | | | 0.76 | % |
Limited Term Government and Agency Fund | | | 0.49 | % |
Investment activities of affiliated shareholders could have material impacts on the Funds.
h. Payment by Affiliates. For the year ended September 30, 2016, Loomis Sayles reimbursed High Income Fund $2,130 in connection with a trading error.
7. Line of Credit. Effective April 14, 2016, each Fund, together with certain other funds of Natixis Funds Trusts and Loomis Sayles Funds Trusts, entered into a 364-day, $400,000,000 syndicated, committed, unsecured line of credit with Citibank, N.A. to be used for temporary or emergency purposes only. Any one Fund may borrow up to the full $400,000,000 under the line of credit (as long as all borrowings by all Funds in the aggregate do not exceed the $400,000,000 limit at any time), subject to each Fund’s investment restrictions. Interest is charged to the Funds at a rate equal to the greater of the eurodollar or the federal funds rate plus 1.00%. In addition, a commitment fee of 0.10% per annum, payable on the last business day of each month, is accrued and apportioned among the participating funds based on their average daily unused portion of the line of credit. The Funds paid an arrangement fee, an upfront fee, and other fees in connection with the new line of credit agreement, which are being amortized over a period of 364 days and are reflected as miscellaneous expenses on the Statements of Operations. The unamortized balance is reflected as prepaid expenses on the Statements of Assets and Liabilities.
Prior to April 14, 2016 each Fund, together with certain other funds of Natixis Funds Trusts and Loomis Sayles Funds Trusts, participated in a $150,000,000 committed unsecured line of credit provided by State Street Bank. Any one Fund was able to borrow up to the full $150,000,000 under the line of credit (as long as all borrowings by all Funds in the aggregate do not exceed the $150,000,000 limit at any time). Interest was charged to each participating Fund based on its borrowings at a rate per annum equal to the greater of the Federal Funds rate or overnight LIBOR, plus 1.25%. In addition, a commitment fee of 0.15% per annum, payable at the end of each calendar quarter, was accrued and apportioned among the participating funds based on their average daily unused portion of the line of credit.
| 100
Notes to Financial Statements (continued)
September 30, 2016
For the year ended September 30, 2016, none of the Funds had borrowings under these agreements.
8. Concentration of Risk. Limited Term Government and Agency Fund’s investments in mortgage-related and asset-backed securities are subject to certain risks not associated with investments in other securities. Mortgage-related and asset-backed securities are subject to the risk that unexpected changes in interest rates will have a direct effect on expected maturity. A shortened maturity may result in the reinvestment of prepaid amounts in securities with lower yields than the original obligations. An extended maturity may result in a reduction of a security’s value.
Each Fund’s investments in foreign securities are subject to foreign currency fluctuations, higher volatility than U.S. securities, varying degrees of regulation and limited liquidity. Greater political, economic, credit and information risks are also associated with foreign securities.
9. Concentration of Ownership. From time to time, a Fund may have a concentration of one or more accounts constituting a significant percentage of shares outstanding. Investment activities by holders of such accounts could have material impacts on the Funds. As of September 30, 2016, based on management’s evaluation of the shareholder account base, the Funds had accounts representing controlling ownership of more than 5% of the Fund’s total outstanding shares. The number of such accounts, based on accounts that represent more than 5% of an individual class of shares, and the aggregate percentage of net assets represented by such holdings were as follows:
| | | | | | | | |
Fund | | Number of 5%
Account Holders | | | Percentage of
Ownership | |
High Income Fund | | | 2 | | | | 19.34 | % |
Intermediate Duration Bond Fund | | | 5 | | | | 44.13 | % |
Omnibus shareholder accounts for which NGAM Advisors understands that the intermediary has discretion over the underlying shareholder accounts or investment models where a shareholder account may be invested for a non-discretionary customer are included in the table above. For other omnibus accounts, the Funds do not have information on the individual shareholder accounts underlying the omnibus accounts; therefore, there could be other 5% shareholders in addition to those disclosed in the table above.
101 |
Notes to Financial Statements (continued)
September 30, 2016
10. Capital Shares. Each Fund may issue an unlimited number of shares of beneficial interest, without par value. Transactions in capital shares were as follows:
| | | | | | | | | | | | | | | | |
| |
| Year Ended
September 30, 2016 |
| |
| Year Ended
September 30, 2015 |
|
High Income Fund | | | Shares | | | | Amount | | | | Shares | | | | Amount | |
| Class A | | | | | | | | | | | | | | | | |
Issued from the sale of shares | | | 5,509,748 | | | $ | 22,242,447 | | | | 7,165,895 | | | $ | 31,113,644 | |
Issued in connection with the reinvestment of distributions | | | 299,177 | | | | 1,169,586 | | | | 580,589 | | | | 2,471,372 | |
Redeemed | | | (7,071,447 | ) | | | (28,018,252 | ) | | | (7,757,369 | ) | | | (33,308,895 | ) |
| | | | | | | | | | | | | | | | |
Net change | | | (1,262,522 | ) | | $ | (4,606,219 | ) | | | (10,885 | ) | | $ | 276,121 | |
| | | | | | | | | | | | | | | | |
| Class B(a) | | | | | | | | | | | | | | | | |
Issued in connection with the reinvestment of distributions | | | 4 | | | | 17 | | | | 790 | | | | 3,364 | |
Redeemed | | | (623 | ) | | | (2,485 | ) | | | (27,193 | ) | | | (117,824 | ) |
| | | | | | | | | | | | | | | | |
Net change | | | (619 | ) | | $ | (2,468 | ) | | | (26,403 | ) | | $ | (114,460 | ) |
| | | | | | | | | | | | | | | | |
| Class C | | | | | | | | | | | | | | | | |
Issued from the sale of shares | | | 799,861 | | | $ | 3,141,922 | | | | 649,877 | | | $ | 2,832,749 | |
Issued in connection with the reinvestment of distributions | | | 88,851 | | | | 345,998 | | | | 166,683 | | | | 709,594 | |
Redeemed | | | (1,144,474 | ) | | | (4,485,915 | ) | | | (900,836 | ) | | | (3,893,227 | ) |
| | | | | | | | | | | | | | | | |
Net change | | | (255,762 | ) | | $ | (997,995 | ) | | | (84,276 | ) | | $ | (350,884 | ) |
| | | | | | | | | | | | | | | | |
| Class Y | | | | | | | | | | | | | | | | |
Issued from the sale of shares | | | 14,901,804 | | | $ | 58,204,609 | | | | 28,556,251 | | | $ | 124,963,285 | |
Issued in connection with the reinvestment of distributions | | | 1,041,928 | | | | 4,056,961 | | | | 1,781,224 | | | | 7,571,272 | |
Redeemed | | | (14,689,863 | ) | | | (57,325,101 | ) | | | (28,942,559 | ) | | | (125,371,469 | ) |
| | | | | | | | | | | | | | | | |
Net change | | | 1,253,869 | | | $ | 4,936,469 | | | | 1,394,916 | | | $ | 7,163,088 | |
| | | | | | | | | | | | | | | | |
Increase (decrease) from capital share transactions | | | (265,034 | ) | | $ | (670,213 | ) | | | 1,273,352 | | | $ | 6,973,865 | |
| | | | | | | | | | | | | | | | |
| (a) | On January 11, 2016, Class B shares were converted into Class A shares. See Note 1 of Notes to Financial Statements. |
| 102
Notes to Financial Statements (continued)
September 30, 2016
10. Capital Shares (continued).
| | | | | | | | | | | | | | | | |
| |
| Year Ended
September 30, 2016 |
| |
| Year Ended
September 30, 2015 |
|
Intermediate Duration Bond Fund | | | Shares | | | | Amount | | | | Shares | | | | Amount | |
| Class A | | | | | | | | | | | | | | | | |
Issued from the sale of shares | | | 525,035 | | | $ | 5,443,679 | | | | 1,537,057 | | | $ | 16,023,946 | |
Issued in connection with the reinvestment of distributions | | | 43,720 | | | | 453,187 | | | | 18,774 | | | | 195,640 | |
Redeemed | | | (505,357 | ) | | | (5,247,036 | ) | | | (353,439 | ) | | | (3,689,833 | ) |
| | | | | | | | | | | | | | | | |
Net change | | | 63,398 | | | $ | 649,830 | | | | 1,202,392 | | | $ | 12,529,753 | |
| | | | | | | | | | | | | | | | |
| Class C* | | | | | | | | | | | | | | | | |
Issued from the sale of shares | | | 293,283 | | | $ | 3,088,274 | | | | — | | | $ | — | |
Issued in connection with the reinvestment of distributions | | | — | (a) | | | 1 | | | | — | | | | — | |
| | | | | | | | | | | | | | | | |
Net change | | | 293,283 | | | $ | 3,088,275 | | | | — | | | $ | — | |
| | | | | | | | | | | | | | | | |
| Class Y | | | | | | | | | | | | | | | | |
Issued from the sale of shares | | | 7,746,460 | | | $ | 80,334,377 | | | | 4,218,161 | | | $ | 44,085,723 | |
Issued in connection with the reinvestment of distributions | | | 231,356 | | | | 2,401,500 | | | | 164,768 | | | | 1,719,664 | |
Redeemed | | | (1,681,603 | ) | | | (17,455,864 | ) | | | (2,280,808 | ) | | | (23,952,128 | ) |
Redeemed in-kind (Note 11) | | | (1,574,765 | ) | | | (16,409,056 | ) | | | — | | | | — | |
| | | | | | | | | | | | | | | | |
Net change | | | 4,721,448 | | | $ | 48,870,957 | | | | 2,102,121 | | | $ | 21,853,259 | |
| | | | | | | | | | | | | | | | |
Increase (decrease) from capital share transactions | | | 5,078,129 | | | $ | 52,609,062 | | | | 3,304,513 | | | $ | 34,383,012 | |
| | | | | | | | | | | | | | | | |
| * | From commencement of Class operations on August 31, 2016 through September 30, 2016. |
| (a) | Amount rounds to less than one share. |
103 |
Notes to Financial Statements (continued)
September 30, 2016
10. Capital Shares (continued).
| | | | | | | | | | | | | | | | |
| |
| Year Ended
September 30, 2016 |
| |
| Year Ended
September 30, 2015 |
|
Limited Term Government and Agency Fund | | | Shares | | | | Amount | | | | Shares | | | | Amount | |
| Class A | | | | | | | | | | | | | | | | |
Issued from the sale of shares | | | 23,688,131 | | | $ | 272,639,541 | | | | 9,649,293 | | | $ | 111,950,383 | |
Issued in connection with the reinvestment of distributions | | | 418,361 | | | | 4,816,572 | | | | 375,777 | | | | 4,361,038 | |
Redeemed | | | (15,575,978 | ) | | | (179,339,659 | ) | | | (7,161,541 | ) | | | (83,105,890 | ) |
| | | | | | | | | | | | | | | | |
Net change | | | 8,530,514 | | | $ | 98,116,454 | | | | 2,863,529 | | | $ | 33,205,531 | |
| | | | | | | | | | | | | | | | |
| Class B(a) | | | | | | | | | | | | | | | | |
Issued from the sale of shares | | | 1,448 | | | $ | 16,709 | | | | 4,412 | | | $ | 51,055 | |
Issued in connection with the reinvestment of distributions | | | 426 | | | | 4,887 | | | | 2,463 | | | | 28,567 | |
Redeemed | | | (230,595 | ) | | | (2,644,555 | ) | | | (140,481 | ) | | | (1,628,030 | ) |
| | | | | | | | | | | | | | | | |
Net change | | | (228,721 | ) | | $ | (2,622,959 | ) | | | (133,606 | ) | | $ | (1,548,408 | ) |
| | | | | | | | | | | | | | | | |
| Class C | | | | | | | | | | | | | | | | |
Issued from the sale of shares | | | 4,330,687 | | | $ | 49,825,855 | | | | 2,240,435 | | | $ | 26,003,916 | |
Issued in connection with the reinvestment of distributions | | | 29,632 | | | | 341,361 | | | | 27,082 | | | | 314,602 | |
Redeemed | | | (3,475,708 | ) | | | (40,028,796 | ) | | | (1,711,009 | ) | | | (19,866,952 | ) |
| | | | | | | | | | | | | | | | |
Net change | | | 884,611 | | | $ | 10,138,420 | | | | 556,508 | | | $ | 6,451,566 | |
| | | | | | | | | | | | | | | | |
| Class Y | | | | | | | | | | | | | | | | |
Issued from the sale of shares | | | 22,122,240 | | | $ | 255,439,801 | | | | 24,653,312 | | | $ | 286,964,981 | |
Issued in connection with the reinvestment of distributions | | | 391,770 | | | | 4,524,155 | | | | 339,019 | | | | 3,946,537 | |
Redeemed | | | (24,037,266 | ) | | | (277,502,192 | ) | | | (16,140,773 | ) | | | (187,902,947 | ) |
| | | | | | | | | | | | | | | | |
Net change | | | (1,523,256 | ) | | $ | (17,538,236 | ) | | | 8,851,558 | | | $ | 103,008,571 | |
| | | | | | | | | | | | | | | | |
Increase (decrease) from capital share transactions | | | 7,663,148 | | | $ | 88,093,679 | | | | 12,137,989 | | | $ | 141,117,260 | |
| | | | | | | | | | | | | | | | |
| (a) | On January 11, 2016, Class B shares were converted into Class A shares. See Note 1 of Notes to Financial Statements. |
11. Redemption In-Kind. In certain circumstances, a Fund may distribute portfolio securities rather than cash as payment for redemption of Fund shares (redemption in-kind). For financial reporting purposes, the Fund will recognize a gain on in-kind redemptions to the extent the value of the distributed securities on the date of redemption exceeds the cost of those securities; the Fund will recognize a loss if the cost exceeds value. Gains and losses realized on redemptions in-kind are not recognized for tax purposes, and are re-classified from realized gain (loss) to paid-in-capital. The Intermediate Duration Bond Fund realized a loss of $16,464 on redemptions in-kind during the year ended September 30, 2016. This amount is included in realized gain (loss) on the Statements of Operations.
| 104
Notes to Financial Statements (continued)
September 30, 2016
12. Subsequent Event. Effective November 30, 2016, High Income Fund will begin offering Class N shares to investors. Class N shares are offered with no initial minimum investment to certain retirement plans held in an omnibus fashion and fund of funds that are distributed by NGAM Distribution and with an initial minimum investment of $1,000,000 to other categories of investors.
105 |
Report of Independent Registered Public
Accounting Firm
To the Trustees of Loomis Sayles Funds Trust I and Loomis Sayles Funds Trust II and Shareholders of Loomis Sayles Intermediate Duration Fixed Income Fund, Loomis Sayles High Income Fund and Loomis Sayles Limited Term Government and Agency Fund:
In our opinion, the accompanying statements of assets and liabilities, including the portfolios of investments, and the related statements of operations and of changes in net assets and the financial highlights present fairly, in all material respects, the financial position of the Loomis Sayles Intermediate Duration Fixed Income Fund, a series of Loomis Sayles Funds Trust I, and Loomis Sayles High Income Fund and Loomis Sayles Limited Term Government and Agency Fund, each a series of Loomis Sayles Funds Trust II (collectively, the “Funds”) at September 30, 2016, and the results of each of their operations, the changes in each of their net assets and the financial highlights for each of the periods indicated, in conformity with accounting principles generally accepted in the United States of America. These financial statements and financial highlights (hereafter referred to as “financial statements”) are the responsibility of the Funds’ management. Our responsibility is to express an opinion on these financial statements based on our audits. We conducted our audits of these financial statements in accordance with the standards of the Public Company Accounting Oversight Board (United States). Those standards require that we plan and perform the audit to obtain reasonable assurance about whether the financial statements are free of material misstatement. An audit includes examining, on a test basis, evidence supporting the amounts and disclosures in the financial statements, assessing the accounting principles used and significant estimates made by management, and evaluating the overall financial statement presentation. We believe that our audits, which included confirmation of securities at September 30, 2016 by correspondence with the custodian, agent banks and brokers, provide a reasonable basis for our opinion expressed above.
PricewaterhouseCoopers LLP
Boston, Massachusetts
November 21, 2016
| 106
2016 U.S. Tax Distribution Information To Shareholders (Unaudited)
Corporate Dividends Received Deduction. For the fiscal year ended September 30, 2016, a percentage of dividends distributed by the Fund listed below qualifies for the dividends received deduction for corporate shareholders. This percentage is as follows:
| | | | |
Fund | | Qualifying
Percentage | |
High Income | | | 2.39 | % |
Capital Gains Distributions. Pursuant to Internal Revenue Section 852(b), the following Fund paid distributions, which have been designated as capital gains distributions for the fiscal year ended September 30, 2016, unless subsequently determined to be different.
| | | | |
Fund | | Amount | |
High Income | | $ | 396,248 | |
Qualified Dividend Income. For the fiscal year ended September 30, 2016, the Fund below will designate up to the maximum amount allowable pursuant to the Internal Revenue Code as qualified dividend income eligible for reduced tax rates. These lower rates range from 0% to 20% depending on an individual’s tax bracket. If the Fund pays a distribution during calendar year 2016, complete information will be reported in conjunction with Form 1099-DIV.
107 |
Trustee and Officer Information
The tables below provide certain information regarding the trustees and officers of Loomis Sayles Funds I and Loomis Sayles Funds II (the “Trusts”). Unless otherwise indicated, the address of all persons below is 399 Boylston Street, Boston, MA 02116. The Funds’ Statement(s) of Additional Information include additional information about the trustees of the Trusts and are available by calling Natixis Funds at 800-225-5478.
| | | | | | | | |
Name and Year of
Birth | | Position(s) Held
with the Trusts,
Length of Time
Served and Term
of Office1 | | Principal
Occupation(s)
During Past
5 Years | | Number of
Portfolios in
Fund Complex
Overseen2
and Other
Directorships Held
During Past
5 Years | | Experience,
Qualifications,
Attributes, Skills
for Board
Membership |
| | | |
| INDEPENDENT TRUSTEES | | | | | | |
| | | | |
Kenneth A. Drucker (1945) | | Trustee since 2008 Chairperson of the Audit Committee and Governance Committee Member | | Retired | | 44 None | | Significant experience on the Board and on the boards of other business organizations (including at investment companies); executive experience (including as treasurer of an aerospace, automotive, and metal manufacturing corporation) |
| | | | |
Edmond J. English (1953) | | Trustee since 2013 Audit Committee Member | | Chief Executive Officer of Bob’s Discount Furniture (retail) | | 44 Director, Burlington Stores, Inc. (retail); Formerly, Director, BJ’s Wholesale Club (retail) | | Experience on the Board and significant experience on the boards of other business organizations (including retail companies and a bank); executive experience (including at a retail company) |
| 108
Trustee and Officer Information
| | | | | | | | |
Name and Year of
Birth | | Position(s) Held
with the Trusts,
Length of Time
Served and Term
of Office1 | | Principal
Occupation(s)
During Past
5 Years | | Number of
Portfolios in
Fund Complex
Overseen2
and Other
Directorships
Held During Past
5 Years | | Experience,
Qualifications,
Attributes, Skills
for Board
Membership |
| | | |
INDEPENDENT TRUSTEES continued | | | | | | |
| | | | |
Richard A. Goglia (1951) | | Trustee since 2015 Audit Committee Member | | Retired; formerly Vice President and Treasurer of Raytheon Company (defense) | | 44 None | | Experience on the Board and executive experience (including his role as vice president and treasurer of a defense company and experience at a financial services company) |
| | | | |
Wendell J. Knox (1948) | | Trustee since 2009 Contract Review Committee Member and Governance Committee Member | | Director of Abt Associates Inc. (research and consulting) | | 44 Director, Eastern Bank (bank); Director, The Hanover Insurance Group (property and casualty insurance) | | Significant experience on the Board and on the boards of other business organizations (including at a bank and at a property and casualty insurance firm); executive experience (including roles as president and chief executive officer of a research and consulting company) |
109 |
Trustee and Officer Information
| | | | | | | | |
Name and Year of
Birth | | Position(s) Held
with the Trusts,
Length of Time
Served and Term
of Office1 | | Principal
Occupation(s)
During Past
5 Years | | Number of
Portfolios in
Fund Complex
Overseen2
and Other
Directorships Held
During Past
5 Years | | Experience,
Qualifications,
Attributes, Skills
for Board
Membership |
| | | |
INDEPENDENT TRUSTEES continued | | | | | | |
| | | | |
Martin T. Meehan (1956) | | Trustee since 2012 Contract Review Committee Member | | President, University of Massachusetts; formerly, Chancellor and faculty member, University of Massachusetts Lowell | | 44 None | | Experience on the Board and on the boards of other business organizations; experience as President of the University of Massachusetts; government experience (including as a member of the U.S. House of Representatives); academic experience |
| | | | |
Sandra O. Moose
(1942) | | Chairperson of the Board of Trustees since November 2005 Trustee since 2003 Ex Officio member of the Audit Committee, the Contract Review Committee and the Governance Committee | | President, Strategic Advisory Services (management consulting) | | 44 Formerly, Director, AES Corporation (international power company); formerly, Director, Verizon Communications (telecommunications company) | | Significant experience on the Board and on the boards of other business organizations (including at a telecommunications company, an international power company and a specialty chemicals corporation); executive experience (including at a management consulting company) |
| 110
Trustee and Officer Information
| | | | | | | | |
Name and Year of
Birth | | Position(s) Held
with the Trusts,
Length of Time
Served and Term
of Office1 | | Principal
Occupation(s)
During Past
5 Years | | Number of
Portfolios in
Fund Complex
Overseen2
and Other
Directorships Held
During Past
5 Years | | Experience,
Qualifications,
Attributes, Skills
for Board
Membership |
| | | |
INDEPENDENT TRUSTEES continued | | | | | | |
| | | | |
James P. Palermo (1955) | | Trustee since 2016 Contract Review Committee Member | | Founding Partner, Breton Capital Management, LLC (private equity); formerly, Chief Executive Officer of Global Client Management of The Bank of New York Mellon Corporation | | 44 None | | Experience on the Board; financial services industry and executive experience (including roles as chief executive officer of client management and asset servicing for a banking and financial services company) |
| | | | |
Erik R. Sirri (1958) | | Trustee since 2009 Audit Committee Member | | Professor of Finance at Babson College | | 44 None | | Significant experience on the Board; experience as Director of the Division of Trading and Markets at the Securities and Exchange Commission; academic experience; training as an economist |
| | | | |
Peter J. Smail (1952) | | Trustee since 2009 Chairperson of the Contract Review Committee and Governance Committee Member | | Retired | | 44 None | | Significant experience on the Board; mutual fund industry and executive experience (including roles as president and chief executive officer for an investment adviser) |
111 |
Trustee and Officer Information
| | | | | | | | |
Name and Year of
Birth | | Position(s) Held
with the Trusts,
Length of Time
Served and Term
of Office1 | | Principal
Occupation(s)
During Past
5 Years | | Number of
Portfolios in
Fund Complex
Overseen2
and Other
Directorships Held
During Past
5 Years | | Experience,
Qualifications,
Attributes, Skills
for Board
Membership |
| | | |
INDEPENDENT TRUSTEES continued | | | | | | |
| | | | |
Cynthia L. Walker (1956) | | Trustee since 2005 Chairperson of the Governance Committee and Contract Review Committee Member | | Deputy Dean for Finance and Administration, Yale University School of Medicine | | 44 None | | Significant experience on the Board; executive experience in a variety of academic organizations (including roles as dean for finance and administration) |
| | | |
| INTERESTED TRUSTEES | | | | | | |
| | | | |
Kevin P. Charleston3 (1965) One Financial Center Boston, MA 02111 | | Trustee since 2015 President and Chief Executive Officer of Loomis Sayles Funds I since 2015 | | President, Chief Executive Officer and Director; formerly, Chief Financial Officer, Loomis, Sayles & Company, L.P. | | 44 None | | Experience on the Board; continuing service as President, Chief Executive Officer and Director of Loomis, Sayles & Company, L.P. |
| | | | |
David L. Giunta4
(1965) | | Trustee since 2011 President since 2008 and Chief Executive Officer since 2015 of Loomis Sayles Funds II and Executive Vice President of Loomis Sayles Funds I since 2008 | | President and Chief Executive Officer, NGAM Distribution Corporation, NGAM Advisors, L.P. and NGAM Distribution, L.P. | | 44 None | | Significant experience on the Board; continuing experience as President and Chief Executive Officer of NGAM Advisors, L.P. |
| 112
Trustee and Officer Information
| | | | | | | | |
Name and Year of
Birth | | Position(s) Held
with the Trusts,
Length of Time
Served and Term
of Office1 | | Principal
Occupation(s)
During Past
5 Years | | Number of
Portfolios in
Fund Complex
Overseen2
and Other
Directorships Held
During Past
5 Years | | Experience,
Qualifications,
Attributes, Skills
for Board
Membership |
| | | |
INTERESTED TRUSTEES continued | | | | | | |
| | | | |
John T. Hailer5 (1960) | | Trustee since 2003 | | President and Chief Executive Officer – U.S. and Asia, Natixis Global Asset Management, L.P. | | 44 None | | Significant experience on the Board; continuing experience as President and Chief Executive Officer – U.S. and Asia, Natixis Global Asset Management, L.P. |
| 1 | Each trustee serves until retirement, resignation or removal from the Board. The current retirement age is 75. The position of Chairperson of the Board is appointed for a three-year term. Ms. Moose was appointed to serve an additional three-year term as the Chairperson of the Board on December 13, 2013. |
| 2 | The trustees of the Trusts serve as trustees of a fund complex that includes all series of the Natixis Funds Trust I, Natixis Funds Trust II, Natixis Funds Trust IV and Gateway Trust (collectively, the “Natixis Funds Trusts”), Loomis Sayles Funds I and Loomis Sayles Funds II (collectively, the “Loomis Sayles Funds Trusts”) and Natixis ETF Trust (collectively, the “Fund Complex”). |
| 3 | Mr. Charleston is deemed an “interested person” of the Trusts because he holds the following positions with an affiliated person of the Trusts: President and Chief Executive Officer of Loomis, Sayles & Company, L.P. |
| 4 | Mr. Giunta is deemed an “interested person” of the Trusts because he holds the following positions with an affiliated person of the Trusts: President and Chief Executive Officer of NGAM Distribution Corporation, NGAM Advisors, L.P. and NGAM Distribution, L.P. |
| 5 | Mr. Hailer is deemed an “interested person” of the Trusts because he holds the following positions with an affiliated person of the Trusts: President and Chief Executive Officer – U.S. and Asia, Natixis Global Asset Management, L.P. |
113 |
Trustee and Officer Information
| | | | | | |
Name and Year of Birth | | Position(s) Held
with the Trusts | | Term of Office1 and
Length of Time Served | | Principal Occupation(s)
During Past 5 Years2 |
| | |
| OFFICERS OF THE TRUST | | | | |
| | | |
Daniel J. Fuss (1933) One Financial Center Boston, MA 02111 | | Executive Vice President of Loomis Sayles Funds I and Loomis Sayles Funds II | | Since June 2003 | | Vice Chairman and Director, Loomis, Sayles & Company, L.P. |
| | | |
Russell L. Kane (1969) | | Secretary, Clerk and Chief Legal Officer | | Since July 2016 | | Executive Vice President, General Counsel, Secretary and Clerk, NGAM Distribution Corporation, NGAM Advisors, L.P. and NGAM Distribution, L.P.; formerly, Chief Compliance Officer for Mutual Funds, Senior Vice President, Deputy General Counsel, Assistant Secretary and Assistant Clerk, NGAM Distribution Corporation, NGAM Advisors, L.P. and NGAM Distribution, L.P. |
| | | |
Michael C. Kardok (1959) | | Treasurer, Principal Financial and Accounting Officer | | Since October 2004 | | Senior Vice President, NGAM Advisors, L.P. and NGAM Distribution, L.P. |
| | | |
Rosa Licea-Mailloux (1976) | | Chief Compliance Officer, Assistant Secretary and Anti-Money Laundering Officer | | Since July 2016 | | Senior Vice President, Deputy General Counsel, Assistant Secretary and Assistant Clerk, NGAM Distribution Corporation, NGAM Advisors, L.P. and NGAM Distribution, L.P.; formerly, Associate General Counsel, NGAM Distribution, L.P. |
| 1 | Each officer of the Trusts serves for an indefinite term in accordance with the Trusts’ current by-laws until the date his or her successor is elected and qualified, or until he or she sooner dies, retires, is removed or becomes disqualified. |
| 2 | Each person listed above, except as noted, holds the same position(s) with the Fund Complex. Mr. Fuss is not an officer of the Natixis Funds Trusts. Previous positions during the past five years with NGAM Distribution, L.P., NGAM Advisors, L.P. or Loomis, Sayles & Company, L.P. are omitted, if not materially different from a trustee’s or officer’s current position with such entity. |
| 114
The Registrant has adopted a code of ethics that applies to the Registrant’s principal executive officer, principal financial officer and persons performing similar functions. There have been no amendments or waivers of the Registrant’s code of ethics during the period.
| Item 3. | Audit Committee Financial Expert. |
The Board of Trustees of the Registrant has established an audit committee Mr. Kenneth A. Drucker, Mr. Edmond J. English, Mr. Richard A. Goglia, and Mr. Erik R. Sirri are members of the audit committee and have been designated as “audit committee financial experts” by the Board of Trustees. Each of these individuals is also an Independent Trustee of the Registrant.
| Item 4. | Principal Accountant Fees and Services. |
Fees billed by the Principal Accountant for services rendered to the Registrant.
The table below sets forth fees billed by the principal accountant, PricewaterhouseCoopers LLP, for the past two fiscal years for professional services rendered in connection with a) the audit of the Registrant’s annual financial statements and services provided in connection with regulatory filings; b) audit-related services (including services that are reasonably related to the performance of the audit of the Registrant’s financial statements and but not reported under “Audit Fees”); c) tax compliance, tax advice and tax planning and d) all other fees billed for professional services rendered by the principal accountant to the Registrant, other than the services reported as a part of (a) through (c) of this Item.
| | | | | | | | | | | | | | | | | | | | | | | | | | | | | | | | |
| | | Audit fees | | | Audit-related fees1 | | | Tax fees2 | | | All other fees | |
| | | 10/1/14-
9/30/15 | | | 10/1/15-
9/30/16 | | | 10/1/14-
9/30/15 | | | 10/1/15-
9/30/16 | | | 10/1/14-
9/30/15 | | | 10/1/15-
9/30/16 | | | 10/1/14-
9/30/15 | | | 10/1/15-
9/30/16 | |
Loomis Sayles Funds I | | $ | 428,778 | | | $ | 435,208 | | | $ | 3,970 | | | $ | 13,478 | | | $ | 142,086 | | | $ | 80,676 | | | $ | — | | | $ | — | |
| 1. | Audit-related fees consist of: |
2015 & 2016 - performance of agreed-upon procedures related to the Registrant’s deferred compensation plan.
2015 & 2016 – review of Registrant’s tax returns and tax consulting services.
Aggregate fees billed to the Registrant for non-audit services during 2015 and 2016 were $146,056 and $94,154, respectively.
Fees billed by the Principal Accountant for services rendered to the Adviser and Control Affiliates.
The following table sets forth the fees billed by the Registrant’s principal accountant for non-audit services rendered to Loomis, Sayles & Company, L.P. and entities controlling, controlled by or under common control with Loomis, Sayles & Company, L.P. (“Control Affiliates”) that provide ongoing services to the Registrant, for engagements that related directly to the operations and financial reporting of the Registrant for the last two fiscal years.
| | | | | | | | | | | | | | | | | | | | | | | | |
| | | Audit-related fees | | | Tax fees | | | All other fees | |
| | | 10/1/14-
9/30/15 | | | 10/1/15-
9/30/16 | | | 10/1/14-
9/30/15 | | | 10/1/15-
9/30/16 | | | 10/1/14-
9/30/15 | | | 10/1/15-
9/30/16 | |
Control Affiliates | | $ | — | | | $ | — | | | $ | — | | | $ | — | | | $ | — | | | $ | — | |
The following table sets forth the aggregate fees billed by the Registrant’s principal accountant for non-audit services rendered to Loomis, Sayles & Company, L.P. and Control Affiliates that provide ongoing services to the Registrant, for the last two fiscal years, including the fees disclosed in the table above.
| | | | | | | | |
| | | Aggregate Non-Audit Fees | |
| | | 10/1/14-9/30/15 | | | 10/1/15-9/30/16 | |
Control Affiliates | | $ | 50,066 | | | $ | 119,120 | |
None of the services described above were approved pursuant to (c)(7)(i)(C) of Regulation S-X.
Audit Committee Pre Approval Policies.
Annually, the Registrant’s Audit Committee reviews the audit, audit-related, tax and other non-audit services together with the projected fees, for services proposed to be rendered to the Trust and/or other entities for which pre-approval is required during the upcoming year. Any subsequent revisions to already pre-approved services or fees (including fee increases) and requests for pre-approval of new services would be presented for consideration quarterly as needed.
If, in the opinion of management, a proposed engagement by the Registrant’s independent accountants needs to commence before the next regularly scheduled Audit Committee meeting, any member of the Audit Committee who is an Independent Trustee of the Registrant is authorized to pre-approve the engagement, but only for engagements to provide audit, audit related and tax services. This approval is subject to review of the full Audit Committee at its next quarterly meeting. All other engagements require the approval of all the members of the Audit Committee.
| Item 5. | Audit Committee of Listed Registrants. |
Not applicable.
| Item 6. | Schedule of Investments. |
Included as part of the Report to Shareholders filed as Item 1 herewith.
| Item 7. | Disclosure of Proxy Voting Policies and Procedures for Closed-End Management Investment Companies. |
Not applicable.
| Item 8. | Portfolio Managers of Closed-End Management Investment Companies |
Not applicable.
| Item 9. | Purchases of Equity Securities by Closed-End Management Investment Companies and Affiliated Purchasers. |
Not applicable.
| Item 10. | Submission of Matters to a Vote of Securities Holders. |
There were no material changes to the procedures by which shareholders may recommend nominees to the Registrant’s Board of Trustees.
| Item 11. | Controls and Procedures. |
The Registrant’s principal executive officer and principal financial officer have concluded that the Registrant’s disclosure controls and procedures are sufficient to ensure that information required to be disclosed by the Registrant in this Form N-CSR was recorded, processed, summarized and reported within the time periods specified in the Securities and Exchange Commission’s rules and forms, based upon such officers’ evaluation of these controls and procedures as of a date within 90 days of the filing date of the report.
There were no changes in the Registrant’s internal control over financial reporting that occurred during the Registrant’s last fiscal quarter of the period covered by the report that has materially affected, or is reasonably likely to materially affect, the Registrant’s internal control over financial reporting.
| | | | | | |
| | (a) | | (1) | | Code of Ethics required by Item 2 hereof, filed herewith as Exhibit (a)(1). |
| | | |
| | (a) | | (2) | | Certifications of Principal Executive Officer and Principal Financial Officer pursuant to Rule 30a-2(a) under the Investment Company Act of 1940 (17 CFR 270.30a-2(a)), filed herewith as Exhibits (a)(2)(1) and (a)(2)(2), respectively. |
| | | |
| | (a) | | (3) | | Not applicable. |
| | | |
| | (b) | | | | Certification of Principal Executive Officer and Principal Financial Officer pursuant to Section 906 of Sarbanes-Oxley Act of 2002 are filed herewith as Exhibit (b). |
SIGNATURES
Pursuant to the requirements of the Securities Exchange Act of 1934 and the Investment Company Act of 1940, the Registrant has duly caused this report to be signed on its behalf by the undersigned, thereunto duly authorized.
| | |
| Loomis Sayles Funds I |
| |
| By: | | /s/ Kevin Charleston |
| |
| Name: | | Kevin Charleston |
| Title: | | President and Chief Executive Officer |
| Date: | | November 21, 2016 |
Pursuant to the requirements of the Securities Exchange Act of 1934 and the Investment Company Act of 1940, this report has been signed by the following persons on behalf of the Registrant and in the capacities and on the dates indicated.
| | |
| By: | | /s/ Kevin Charleston |
| |
| Name: | | Kevin Charleston |
| Title: | | President and Chief Executive Officer |
| Date: | | November 21, 2016 |
| |
| By: | | /s/ Michael C. Kardok |
| |
| Name: | | Michael C. Kardok |
| Title: | | Treasurer |
| Date: | | November 21, 2016 |