UNITED STATES
SECURITIES AND EXCHANGE COMMISSION
Washington, D.C. 20549
FORM N-CSR
CERTIFIED SHAREHOLDER REPORT OF REGISTERED
MANAGEMENT INVESTMENT COMPANIES
Investment Company Act file number: 811-06241
Loomis Sayles Funds I
(Exact name of Registrant as specified in charter)
888 Boylston Street, Suite 800 Boston, Massachusetts 02199-8197
(Address of principal executive offices) (Zip code)
Russell L. Kane, Esq.
Natixis Distribution, L.P.
888 Boylston Street, Suite 800
Boston, Massachusetts 02199-8197
(Name and address of agent for service)
Registrant’s telephone number, including area code: (617) 449-2822
Date of fiscal year end: December 31
Date of reporting period: December 31, 2020
| Item 1. | Reports to Stockholders. |
The Registrant’s annual report transmitted to shareholders pursuant to Rule 30e-1 under the Investment Company Act of 1940 is as follows:

Loomis Sayles Bond Fund
Loomis Sayles Investment Grade Fixed Income Fund
Annual Report
December 31, 2020

LOOMIS SAYLES BOND FUND
| | | | |
| Managers | | Symbols | | |
| | |
| Matthew J. Eagan, CFA® | | Institutional Class | | LSBDX |
| | |
| Daniel J. Fuss, CFA®, CIC* | | Retail Class | | LSBRX |
| | |
| Brian P. Kennedy | | Admin Class | | LBFAX |
| | |
| Elaine M. Stokes | | Class N | | LSBNX |
| * | | Effective March 1, 2021, Daniel J. Fuss will no longer be portfolio manager of the Fund. |
Investment Objective
The Fund’s investment objective is high total investment return through a combination of current income and capital appreciation.
Market Conditions
Investors’ appetite for risk surged in the fourth quarter, which contributed to a broad range of nearly all positive returns across credit asset classes. In early November, investors were treated to the long-awaited news that coronavirus vaccines were effective and would soon become available to the public. The prospect of a gradual return to normal economic conditions in 2021 allowed market participants to look beyond recent adverse headlines, including the emergence of a new strain of the virus, ongoing Brexit negotiations, and a slowdown in the economic recovery. Investors instead were focused on and encouraged by the US Federal Reserve (Fed) statements indicating its intention to keep short-term interest rates near zero for a multiyear period. Not least, the resolution to the US election removed a factor that had weighed on sentiment in early autumn.
The developments mentioned above acted as a headwind for the Treasury market. While short-term yields were largely unchanged due to the steady outlook for Fed policy, longer-term yields rose (as prices fell). With Treasurys already having rallied significantly in the first nine months of the year, there was little room for further improvement – particularly in light of rising estimates for both economic growth and inflation in 2021. In addition, demand for “safe haven” assets was muted due to generally positive headlines.
Investment-grade corporate bonds delivered sizable outperformance in the quarter, closing out an impressive year. The combination of an improving credit outlook and stable Fed policy prompted investors to move further out on the risk spectrum in search of more attractive yields.
High yield corporate issues performed very well and finished as the best performing major segment of the bond market for the quarter. Yield spreads – the difference between yields on below investment-grade debt and Treasurys of similar maturities – declined to a level close to where they stood in February prior to the selloff associated with Covid-19.
Securitized assets – including mortgage-backed securities (MBS), asset-backed securities (ABS) and commercial mortgage-backed securities (CMBS) – outperformed Treasurys but trailed both corporates and high yield. The category benefited from the same search for yield that aided other credit-sensitive segments of the fixed-income market, with CMBS outpacing ABS and MBS, respectively.
Emerging market bonds also moved higher in the quarter, with the bulk of the gain occurring in November and December. The asset class made up all of the ground it lost in the February-March selloff, allowing it to finish the full year firmly in positive territory. Emerging-markets debt was boosted by the combination of the “risk-on” environment, rising commodity prices and the persistent weakness in the US dollar.
Performance Results1
For the three months ended December 31, 2020, Institutional Class shares of the Loomis Sayles Bond Fund returned 5.35% at net asset value. The Fund outperformed its benchmark, the Bloomberg Barclays U.S. Government/Credit Bond Index, which returned 0.82%.
| 1 | | Effective December 2, 2020, the Board of Trustees approved a change in the fiscal year-end of the Fund from September 30 to December 31. The Fund performance provided in this section reflects the three-month fiscal period ended December 31, 2020. |
1 |
Explanation of Fund Performance
Markets finished the year on a positive note as a Covid-19 vaccine was approved and distribution began on a global scale. Credit sectors continued to perform well under these conditions. The Fund’s exposure to high yield corporate credit was the biggest contributor to relative return, largely driven by energy and finance company holdings. Exposure to non-US-dollar securities, particularly those denominated in the Mexican peso, also helped performance during the period. Within equities, allocations to the consumer cyclical, consumer non-cyclical and technology sectors generated positive relative performance as stock markets posted strong gains for the quarter.
An underweight to emerging market credit detracted modestly from relative performance during the quarter.
Outlook
Looking ahead to the upcoming year, there are a number of structural economic factors in place that pose risks to our market outlook, including the ongoing impact of the pandemic, further delay in reaching a fiscal package and any resurgence of trade tensions between the US and China. That said, we are optimistic that economic conditions could continue to show improvement over the next year. This view is reflected in current market prices and appears to be shared by the consensus.
While the recent rise in coronavirus cases has led to renewed containment measures across the US, the likelihood of a vaccine has been priced into markets along with expectations for a fiscal package to arrive in the first quarter of the year. These measures help give us some confidence that the economic recovery could continue to show steady, if uneven, progress. GDP growth rebounded from the steep declines last year and we expect this trend to continue into 2021.
We anticipate limited changes in monetary policy, with the Fed likely maintaining its zero interest rate policy until at least 2023. The Fed has also indicated that full employment and longer-term inflation averages are additional factors in considering any future rate hikes. This accommodative stance should continue to boost investor confidence and demand for yield in a low global rate environment. In addition, we believe the overall health of the consumer, strong housing market and expected inventory rebuilding provide support to our outlook.
The credit markets have been progressing through the cycle,2 and we believe there are increasing signs of a shift towards recovery with corporate profits rebounding, easy monetary policy, balance sheet improvement and potential for large-scale vaccine distribution.
We have been maintaining a balance of liquidity, diversification and risk exposure in our portfolios. Within our credit allocation, we continue to focus on areas where we still see value based on our fundamental research. We are specifically focused on some of the sectors that were hardest hit by the pandemic including the transportation, recreational and hospitality industries. These areas of the economy include credits that have been cheap for their rating, have been able to access the capital markets for liquidity and are likely in a good position to benefit from the recovery.
Despite the higher valuations, we believe there are still selective opportunities in both the investment grade and high yield corporate sectors. Spreads have compressed but can potentially tighten further on improving fundamentals. We are selectively adding corporate credit, particularly in areas of the market that have lagged the recovery.
Our emerging market allocation largely represents US dollar-pay exposure to high quality securities with strong balance sheets and currently attractive real yields. We are holding little foreign currency but continue to evaluate opportunities in markets outside the US as we look for clarity on the outlook for global growth.
Market conditions in the past year have highlighted the notion that investors tend to overreact. The speed and severity of the recession and subsequent sharp rebound were unexpected, but also presented some favorable investment opportunities. These developments have served to reinforce our investment philosophy that markets are highly inefficient in the short term. We believe that we were able to capitalize on these developments in 2020 and that our portfolios are well-positioned to benefit from the expected economic growth and recovery in the new year.
During periods in which the US dollar appreciates relative to foreign currencies, Funds that hold non-US-dollar-denominated bonds may realize currency losses in connection with the maturity or sale of certain bonds. These losses impact a Fund’s ordinary income distributions (to the extent that losses are not offset by realized currency gains within the Fund’s fiscal year). A recognized currency loss, in accordance with federal tax rules, decreases the amount of ordinary income a Fund has available to distribute, even though these bonds continue to generate coupon income.
Fund officers have analyzed the Fund’s current portfolio of investments, realized currency gains and losses, schedule of maturities, and the corresponding amounts of unrealized currency losses that may become realized during the 2021 fiscal year. This analysis is performed regularly to determine how realized currency losses will impact periodic ordinary income distributions for the Fund. Based on the limited foreign currency exposures held by the Fund on the most recent quarterly analysis (as of December 31, 2020), Fund officers do not anticipate realized currency losses will have an impact on the distributions in the 2021 fiscal year. This analysis is based on certain assumptions including, but not limited to, the level of foreign currency exchange rates, security prices, interest rates, the Fund adviser’s ability to manage realized currency losses, and the net asset level of the Fund. Changes to these assumptions could materially impact the analysis and the amounts of future Fund distributions. Fund officers will continue to monitor these amounts on a regular basis and take the necessary actions required to manage the Fund’s distributions to address realized currency losses while seeking to avoid a return of capital distribution.
| 2 | | A credit cycle is a cyclical pattern that follows credit availability and corporate health. |
| 2
LOOMIS SAYLES BOND FUND
Hypothetical Growth of $100,000 Investment in Institutional Class Shares
December 31, 2010 through December 31, 20202

Average Annual Total Returns — December 31, 20202
| | | | | | | | | | | | | | | | | | | | | | | | | | | | |
| | | | | | | |
| | | | | | | | | | | | | | | | | | Expense Ratios3 | |
| | | 3 Months | | | 1 Year | | | 5 Years | | | 10 Years | | | Life of
Class N | | | Gross | | | Net | |
| | | | | | | | |
| Institutional Class (Inception 5/16/91) | | | 5.35 | % | | | 2.14 | % | | | 5.26 | % | | | 4.78 | % | | | — | % | | | 0.67 | % | | | 0.67 | % |
| | | | | | | | |
| Retail Class (Inception 12/31/96) | | | 5.31 | | | | 1.89 | | | | 5.00 | | | | 4.50 | | | | — | | | | 0.92 | | | | 0.92 | |
| | | | | | | | |
| Admin Class (Inception 1/2/98) | | | 5.26 | | | | 1.63 | | | | 4.75 | | | | 4.24 | | | | — | | | | 1.17 | | | | 1.17 | |
| | | | | | | | |
| Class N (Inception 2/1/13) | | | 5.45 | | | | 2.21 | | | | 5.36 | | | | — | | | | 3.55 | | | | 0.59 | | | | 0.59 | |
| | | | | | | | |
| Comparative Performance | | | | | | | | | | | | | | | | | | | | | | | | | | | | |
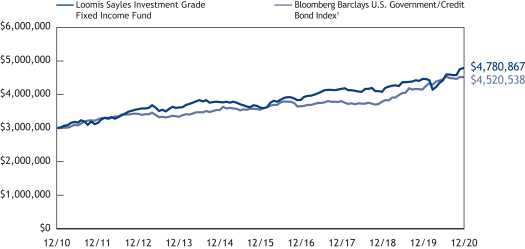
| Bloomberg Barclays U.S. Government/Credit Bond Index1 | | | 0.82 | | | | 8.93 | | | | 4.98 | | | | 4.19 | | | | 3.70 | | | | | | | | | |
Performance data shown represents past performance and is no guarantee of, and not necessarily indicative of, future results. Total return and value will vary, and you may have a gain or loss when shares are sold. Current performance may be lower or higher than quoted. For most recent month-end performance, visit loomissayles.com. Performance for other share classes will be greater or less than shown based on differences in fees and sales charges. You may not invest directly in an index. Performance for periods less than one year is cumulative, not annualized. Returns reflect changes in share price and reinvestment of dividends and capital gains, if any. The table(s) do not reflect taxes shareholders might owe on any fund distributions or when they redeem their shares.
| 1 | | Bloomberg Barclays U.S. Government/Credit Bond Index is the non-securitized component of the U.S. Aggregate Index and was the first macro index launched by Barclays Capital. The U.S. Government/Credit Bond Index includes investment grade, U.S. dollar-denominated, fixed rate Treasuries (i.e., public obligations of the U.S. Treasury that have remaining maturities of more than one year), government-related issues (i.e., agency, sovereign, supranational, and local authority debt), and corporate securities. The U.S. Government/Credit Index was launched on January 1, 1979, with index history backfilled to 1973, and is a subset of the U.S. Aggregate Index. |
| 2 | | Fund performance has been increased by fee waivers and/or expense reimbursements, if any, without which performance would have been lower. |
| 3 | | Expense ratios are as shown in the Fund’s prospectus in effect as of the date of this report. The expense ratios for the current reporting period can be found in the Financial Highlights section of this report under Ratios to Average Net Assets. Net expenses reflect contractual expense limitations set to expire on 1/31/22. When a Fund’s expenses are below the limitation, gross and net expense ratios will be the same. See Note 5 of the Notes to Financial Statements for more information about the Fund’s expense limitations. |
3 |
LOOMIS SAYLES INVESTMENT GRADE FIXED INCOME FUND
| | | | |
| Managers | | Symbols | | |
| | |
| Matthew J. Eagan, CFA® | | Institutional Class | | LSIGX |
| | |
| Daniel J. Fuss, CFA®, CIC* | | | | |
| | |
| Brian P. Kennedy | | | | |
| | |
| Elaine M. Stokes | | | | |
| * | | Effective March 1, 2021, Daniel J. Fuss will no longer be portfolio manager of the Fund. |
Investment Objective
The Fund’s investment objective is above-average total investment return through a combination of current income and capital appreciation.
Market Conditions
Investors’ appetite for risk surged in the fourth quarter, which contributed to a broad range of nearly all positive returns across credit asset classes. In early November, investors were treated to the long-awaited news that coronavirus vaccines were effective and would soon become available to the public. The prospect of a gradual return to normal economic conditions in 2021 allowed market participants to look beyond recent adverse headlines, including the emergence of a new strain of the virus, ongoing Brexit negotiations, and a slowdown in the economic recovery. Investors instead were focused on and encouraged by the US Federal Reserve (Fed) statements indicating its intention to keep short-term interest rates near zero for a multiyear period. Not least, the resolution to the US election removed a factor that had weighed on sentiment in early autumn.
The developments mentioned above acted as a headwind for the Treasury market. While short-term yields were largely unchanged due to the steady outlook for Fed policy, longer-term yields rose (as prices fell). With Treasurys already having rallied significantly in the first nine months of the year, there was little room for further improvement – particularly in light of rising estimates for both economic growth and inflation in 2021. In addition, demand for “safe haven” assets was muted due to generally positive headlines.
Investment-grade corporate bonds delivered sizable outperformance in the quarter, closing out an impressive year. The combination of an improving credit outlook and stable Fed policy prompted investors to move further out on the risk spectrum in search of more attractive yields.
High yield corporate issues performed very well and finished as the best performing major segment of the bond market for the quarter. Yield spreads – the difference between yields on below investment-grade debt and Treasurys of similar maturities – declined to a level close to where they stood in February prior to the selloff associated with Covid-19.
Securitized assets – including mortgage-backed securities (MBS), asset-backed securities (ABS) and commercial mortgage-backed securities (CMBS) – outperformed Treasurys but trailed both corporates and high yield. The category benefited from the same search for yield that aided other credit-sensitive segments of the fixed-income market, with CMBS outpacing ABS and MBS, respectively.
Emerging market bonds also moved higher in the quarter, with the bulk of the gain occurring in November and December. The asset class made up all of the ground it lost in the February-March selloff, allowing it to finish the full year firmly in positive territory. Emerging-markets debt was boosted by the combination of the “risk-on” environment, rising commodity prices and the persistent weakness in the US dollar.
Performance Results1
For the three months ended December 31, 2020, Institutional Class shares of the Loomis Sayles Investment Grade Fixed Income Fund returned 4.38% at net asset value. The Fund outperformed its benchmark, the Bloomberg Barclays U.S. Government/Credit Bond Index, which returned 0.82%.
Explanation of Fund Performance
Markets finished the year on a positive note as a Covid-19 vaccine was approved and distribution began on a global scale. Credit sectors continued to perform well under these conditions. The Fund’s exposure to high yield corporate credit was the biggest contributor to relative return, largely driven by consumer cyclical and transportation holdings. Selected insurance, finance company and consumer cyclical names within investment grade corporate credit were beneficial as well. Exposure to non-US-dollar securities, particularly those denominated in the Mexican peso, also helped performance during the period. Within equities, an allocation to the technology sector generated positive relative performance as stock markets posted strong gains for the quarter.
| 1 | | Effective December 2, 2020, the Board of Trustees approved a change in the fiscal year-end of the Fund from September 30 to December 31. The Fund performance provided in this section reflects the three-month fiscal period ended December 31, 2020. |
| 4
LOOMIS SAYLES INVESTMENT GRADE FIXED INCOME FUND
Holdings of defensive, reserve-like positions detracted marginally from performance.
Outlook
Looking ahead to the upcoming year, there are a number of structural economic factors in place that pose risks to our market outlook, including the ongoing impact of the pandemic, further delay in reaching a fiscal package and any resurgence of trade tensions between the US and China. That said, we are optimistic that economic conditions could continue to show improvement over the next year. This view is reflected in current market prices and appears to be shared by the consensus.
While the recent rise in coronavirus cases has led to renewed containment measures across the US, the likelihood of a vaccine has been priced into markets along with expectations for a fiscal package to arrive in the first quarter of the year. These measures help give us some confidence that the economic recovery could continue to show steady, if uneven, progress. GDP growth rebounded from the steep declines last year and we expect this trend to continue into 2021.
We anticipate limited changes in monetary policy, with the Fed likely maintaining its zero interest rate policy until at least 2023. The Fed has also indicated that full employment and longer-term inflation averages are additional factors in considering any future rate hikes. This accommodative stance should continue to boost investor confidence and demand for yield in a low global rate environment. In addition, we believe the overall health of the consumer, strong housing market and expected inventory rebuilding provide support to our outlook.
The credit markets have been progressing through the cycle,2 and we believe there are increasing signs of a shift towards recovery with corporate profits rebounding, easy monetary policy, balance sheet improvement and potential for large-scale vaccine distribution.
We have been maintaining a balance of liquidity, diversification and risk exposure in our portfolios. Within our credit allocation, we continue to focus on areas where we still see value based on our fundamental research. We are specifically focused on some of the sectors that were hardest hit by the pandemic including the transportation, recreational and hospitality industries. These areas of the economy include credits that have been cheap for their rating, have been able to access the capital markets for liquidity and are likely in a good position to benefit from the recovery.
Despite the higher valuations, we believe there are still selective opportunities in both the investment grade and high yield corporate sectors. Spreads have compressed but can potentially tighten further on improving fundamentals. We are selectively adding corporate credit, particularly in areas of the market that have lagged the recovery.
Our emerging market allocation largely represents US dollar-pay exposure to high quality securities with strong balance sheets and currently attractive real yields. We are holding little foreign currency but continue to evaluate opportunities in markets outside the US as we look for clarity on the outlook for global growth.
Market conditions in the past year have highlighted the notion that investors tend to overreact. The speed and severity of the recession and subsequent sharp rebound were unexpected, but also presented some favorable investment opportunities. These developments have served to reinforce our investment philosophy that markets are highly inefficient in the short term. We believe that we were able to capitalize on these developments in 2020 and that our portfolios are well-positioned to benefit from the expected economic growth and recovery in the new year.
During periods in which the US dollar appreciates relative to foreign currencies, Funds that hold non-US-dollar-denominated bonds may realize currency losses in connection with the maturity or sale of certain bonds. These losses impact a Fund’s ordinary income distributions (to the extent that losses are not offset by realized currency gains within the Fund’s fiscal year). A recognized currency loss, in accordance with federal tax rules, decreases the amount of ordinary income a Fund has available to distribute, even though these bonds continue to generate coupon income.
Fund officers have analyzed the Fund’s current portfolio of investments, realized currency gains and losses, schedule of maturities, and the corresponding amounts of unrealized currency losses that may become realized during the 2021 fiscal year. This analysis is performed regularly to determine how realized currency losses will impact periodic ordinary income distributions for the Fund. Based on the limited foreign currency exposures held by the Fund on the most recent quarterly analysis (as of December 31, 2020), Fund officers do not anticipate realized currency losses will have an impact on the distributions in the 2021 fiscal year. This analysis is based on certain assumptions including, but not limited to the level of foreign currency exchange rates, security prices, interest rates, the Fund adviser’s ability to manage realized currency losses, and the net asset level of the Fund. Changes to these assumptions could materially impact the analysis and the amounts of future Fund distributions. Fund officers will continue to monitor these amounts on a regular basis and take the necessary actions required to manage the Fund’s distributions to address realized currency losses while seeking to avoid a return of capital distribution.
| 2 | | A credit cycle is a cyclical pattern that follows credit availability and corporate health. |
5 |
Hypothetical Growth of $3,000,000 Investment in Institutional Class Shares
December 31, 2010 through December 31, 20202
Average Annual Total Returns — December 31, 20202
| | | | | | | | | | | | | | | | | | | | | | | | |
| | | | | | |
| | | | | | | | | | | | | | | Expense Ratios3 | |
| | | 3 Months | | | 1 Year | | | 5 Years | | | 10 Years | | | Gross | | | Net | |
| | | | | | | |
| Institutional Class (Inception 7/1/94) | | | 4.38 | % | | | 7.19 | % | | | 5.78 | % | | | 4.77 | % | | | 0.50 | % | | | 0.50 | % |
| | | | | | | |
| Comparative Performance | | | | | | | | | | | | | | | | | | | | | | | | |
| Bloomberg Barclays U.S. Government/Credit Bond Index1 | | | 0.82 | | | | 8.93 | | | | 4.98 | | | | 4.19 | | | | | | | | | |
Performance data shown represents past performance and is no guarantee of, and not necessarily indicative of, future results. Total return and value will vary, and you may have a gain or loss when shares are sold. Current performance may be lower or higher than quoted. For most recent month-end performance, visit loomissayles.com. Performance for other share classes will be greater or less than shown based on differences in fees and sales charges. You may not invest directly in an index. Performance for periods less than one year is cumulative, not annualized. Returns reflect changes in share price and reinvestment of dividends and capital gains, if any. The table(s) do not reflect taxes shareholders might owe on any fund distributions or when they redeem their shares.
| 1 | | Bloomberg Barclays U.S. Government/Credit Bond Index is the non-securitized component of the U.S. Aggregate Index and was the first macro index launched by Barclays Capital. The U.S. Government/Credit Bond Index includes investment grade, U.S. dollar-denominated, fixed-rate Treasuries (i.e., public obligations of the U.S. Treasury that have remaining maturities of more than one year), government-related issues (i.e., agency, sovereign, supranational, and local authority debt), and corporate securities. The U.S. Government/Credit Index was launched on January 1, 1979, with index history backfilled to 1973, and is a subset of the Bloomberg Barclays U.S. Aggregate Index. |
| 2 | | Fund performance has been increased by fee waivers and/or expense reimbursements, if any, without which performance would have been lower. |
| 3 | | Expense ratios are as shown in the Fund’s prospectus in effect as of the date of this report. The expense ratios for the current reporting period can be found in the Financial Highlights section of this report under Ratios to Average Net Assets. Net expenses reflect contractual expense limitations set to expire on 1/31/22. When a Fund’s expenses are below the limitation, gross and net expense ratios will be the same. See Note 6 of the Notes to Financial Statements for more information about the Fund’s expense limitations. |
| 6
ADDITIONAL INFORMATION
The views expressed in this report reflect those of the portfolio managers as of the dates indicated. The managers’ views are subject to change at any time without notice based on changes in market or other conditions. References to specific securities or industries should not be regarded as investment advice. Because the Fund is actively managed, there is no assurance that they will continue to invest in the securities or industries mentioned.
All investing involves risk, including the risk of loss. There is no assurance that any investment will meet its performance objectives or that losses will be avoided.
Additional Index Information
This document may contain references to third party copyrights, indexes, and trademarks, each of which is the property of its respective owner. Such owner is not affiliated with Natixis Investment Managers or any of its related or affiliated companies (collectively “Natixis Affiliates”) and does not sponsor, endorse or participate in the provision of any Natixis Affiliates services, funds or other financial products.
The index information contained herein is derived from third parties and is provided on an “as is” basis. The user of this information assumes the entire risk of use of this information. Each of the third party entities involved in compiling, computing or creating index information disclaims all warranties (including, without limitation, any warranties of originality, accuracy, completeness, timeliness, non-infringement, merchantability and fitness for a particular purpose) with respect to such information.
Proxy Voting Information
A description of the Fund’s proxy voting policies and procedures is available without charge upon request, by calling Loomis Sayles Funds at 800-633-3330; on the Fund’s website at www.loomissayles.com, and on the Securities and Exchange Commission’s (“SEC’s”) website at www.sec.gov. Information about how the Fund voted proxies relating to portfolio securities during the most recent 12-month period ended June 30 is available on the Fund’s website and the SEC’s website.
Quarterly Portfolio Schedules
The Natixis Funds file a complete schedule of portfolio holdings with the SEC for the first and third quarters of each fiscal year as an exhibit to its reports on Form N-PORT. The Funds’ Form N-PORT reports are available on the SEC’s website at www.sec.gov. First and third quarter schedules of portfolio holdings are also available at loomissayles.com. A hard copy may be requested from the Fund at no charge by calling 800-225-5478.
CFA® and Chartered Financial Analyst® are registered trademarks owned by the CFA Institute.
UNDERSTANDING YOUR FUND’S EXPENSES
As a mutual fund shareholder you incur two types of costs: (1) transaction costs, and (2) ongoing costs, including management fees, distribution and/or service fees (12b-1 fees), and other fund expenses. Certain exemptions may apply. These costs are described in more detail in the Fund’s prospectus. The following examples are intended to help you understand the ongoing costs of investing in the Fund and help you compare these with the ongoing costs of investing in other mutual funds.
The first line in the table for each class of Fund shares shows the actual amount of Fund expenses you would have paid on a $1,000 investment in the Fund from July 1, 2020 through December 31, 2020. To estimate the expenses you paid over the period, simply divide your account value by $1,000 (for example $8,600 account value divided by $1,000 = 8.6) and multiply the result by the number in the Expenses Paid During Period column as shown below for your class.
The second line in the table for each class of Fund shares provides information about hypothetical account values and hypothetical expenses based on the Fund’s actual expense ratios and an assumed rate of return of 5% per year before expenses, which is not the Fund’s actual return. The hypothetical account values and expenses may not be used to estimate the actual ending account balance or expenses you paid on your investment for the period. You may use this information to compare the ongoing costs of investing in the Fund to other funds. To do so, compare this 5% hypothetical example with the 5% hypothetical examples that appear in the shareholder reports of the other funds.
Please note that the expenses shown reflect ongoing costs only, and do not include any transaction costs. Therefore, the second line in the table is useful in comparing ongoing costs only, and will not help you determine the relative costs of owning different funds. If transaction costs were included, total costs would be higher.
7 |
Loomis Sayles Bond Fund
| | | | | | | | | | | | |
| Institutional Class | | Beginning
Account Value
7/1/2020 | | | Ending
Account Value
12/31/2020 | | | Expenses Paid
During Period**
7/1/2020 – 12/31/2020 | |
Actual | | | $1,000.00 | | | | $1,084.20 | | | | $3.52 | |
Hypothetical (5% return before expenses) | | | $1,000.00 | | | | $1,021.83 | | | | $3.41 | |
| | | |
Retail Class | | | | | | | | | |
Actual | | | $1,000.00 | | | | $1,083.20 | | | | $4.83 | |
Hypothetical (5% return before expenses) | | | $1,000.00 | | | | $1,020.57 | | | | $4.69 | |
| | | |
Admin Class | | | | | | | | | |
Actual | | | $1,000.00 | | | | $1,081.40 | | | | $6.14 | |
Hypothetical (5% return before expenses) | | | $1,000.00 | | | | $1,019.31 | | | | $5.96 | |
| | | |
Class N | | | | | | | | | |
Actual | | | $1,000.00 | | | | $1,084.60 | | | | $3.15 | |
Hypothetical (5% return before expenses) | | | $1,000.00 | | | | $1,022.18 | | | | $3.06 | |
|
* Expenses are equal to the Fund’s annualized expense ratio: 0.67%, 0.92%, 1.17% and 0.60% for Institutional Class, Retail Class, Admin Class and Class N, respectively, multiplied by the average account value over the period, multiplied by the number of days in the most recent fiscal half-year (184), divided by 365 (to reflect the half-year period). | |
Loomis Sayles Investment Grade Fixed Income Fund
| | | | | | | | | | | | |
Institutional Class | | Beginning
Account Value
7/1/2020 | | | Ending
Account Value
12/31/2020 | | | Expenses Paid
During Period*
7/1/2020 – 12/31/2020 | |
Actual | | | $1,000.00 | | | | $1,083.80 | | | | $2.84 | |
Hypothetical (5% return before expenses) | | | $1,000.00 | | | | $1,022.48 | | | | $2.75 | |
|
* Expenses are equal to the Fund’s annualized expense ratio (after waiver/reimbursement) of 0.54%, multiplied by the average account value over the period, multiplied by the number of days in the most recent fiscal half-year (184), divided by 365 (to reflect the half-year period). | |
| 8
Portfolio of Investments – as of December 31, 2020
Loomis Sayles Bond Fund
| | | | | | | | |
Principal
Amount (‡) | | | Description | | Value (†) | |
|
| | Bonds and Notes – 75.6% of Net Assets | |
|
| | Non-Convertible Bonds – 70.2% | |
| |
| | | | ABS Home Equity – 0.1% | |
| $ | 12,639,575 | | | Legacy Mortgage Asset Trust, Series 2018-GS2, Class A1,
4.000%, 4/25/2058, 144A(a) | | $ | 12,721,534 | |
| | | | | | | | |
| |
| | | | ABS Other – 0.3% | |
| | 21,324,711 | | | FAN Engine Securitization Ltd., Series 2013-1A, Class 1A,
4.625%, 10/15/2043, 144A(b)(c)(d) | | | 11,728,591 | |
| | 20,921,895 | | | GCA2014 Holdings Ltd., Series 2014-1, Class C,
6.000%, 1/05/2030, 144A(b)(c)(e)(f) | | | 7,061,349 | |
| | 9,492,593 | | | GCA2014 Holdings Ltd., Series 2014-1, Class D,
7.500%, 1/05/2030, 144A(b)(c)(e)(f) | | | 1,283,209 | |
| | 32,585,000 | | | GCA2014 Holdings Ltd.,
Series 2014-1, Class E,
Zero Coupon, 1/05/2030, 144A(b)(c)(e)(f)(g) | | | — | |
| | 7,237,764 | | | Global Container Assets Ltd., Series 2015-1A, Class B,
4.500%, 2/05/2030, 144A(b)(c)(d) | | | 6,268,338 | |
| | | | | | | | |
| | | | | | | 26,341,487 | |
| | | | | | | | |
| |
| | | | Aerospace & Defense – 3.0% | |
| | 260,000 | | | Boeing Co. (The), 3.100%, 5/01/2026 | | | 278,407 | |
| | 560,000 | | | Boeing Co. (The), 3.250%, 2/01/2035 | | | 574,283 | |
| | 3,715,000 | | | Boeing Co. (The), 3.550%, 3/01/2038 | | | 3,790,014 | |
| | 4,885,000 | | | Boeing Co. (The), 3.600%, 5/01/2034 | | | 5,143,619 | |
| | 22,105,000 | | | Boeing Co. (The), 3.625%, 2/01/2031 | | | 24,191,293 | |
| | 2,995,000 | | | Boeing Co. (The), 3.625%, 3/01/2048 | | | 3,019,720 | |
| | 2,950,000 | | | Boeing Co. (The), 3.650%, 3/01/2047 | | | 2,986,102 | |
| | 2,050,000 | | | Boeing Co. (The), 3.750%, 2/01/2050 | | | 2,143,890 | |
| | 1,200,000 | | | Boeing Co. (The), 3.850%, 11/01/2048 | | | 1,237,752 | |
| | 20,940,000 | | | Boeing Co. (The), 3.950%, 8/01/2059 | | | 22,411,183 | |
| | 7,085,000 | | | Boeing Co. (The), 5.150%, 5/01/2030 | | | 8,574,632 | |
| | 45,290,000 | | | Boeing Co. (The), 5.805%, 5/01/2050 | | | 62,416,189 | |
| | 21,310,000 | | | Boeing Co. (The), 5.930%, 5/01/2060 | | | 30,230,236 | |
| | 2,915,000 | | | Bombardier, Inc.,
7.450%, 5/01/2034, 144A | | | 2,549,546 | |
| | 4,055,000 | | | Embraer Netherlands Finance BV,
5.400%, 2/01/2027 | | | 4,308,478 | |
| | 10,576,000 | | | Leonardo U.S. Holdings, Inc.,
6.250%, 1/15/2040, 144A | | | 12,530,656 | |
| | 328,000 | | | Leonardo U.S. Holdings, Inc.,
7.375%, 7/15/2039 | | | 424,019 | |
| |
| | | | Aerospace & Defense – continued | |
| 10,821,000 | | | Leonardo U.S. Holdings, Inc.,
7.375%, 7/15/2039, 144A | | | 13,988,740 | |
| | 6,995,000 | | | Textron Financial Corp., 3-month LIBOR + 1.735%, 1.956%, 2/15/2067, 144A(h) | | | 5,138,247 | |
| | 9,030,000 | | | TransDigm, Inc., 5.500%, 11/15/2027 | | | 9,493,239 | |
| | 25,941,000 | | | TransDigm, Inc., 6.500%, 7/15/2024 | | | 26,400,674 | |
| | 400,000 | | | TransDigm, Inc., 7.500%, 3/15/2027 | | | 427,000 | |
| | 29,130,000 | | | TransDigm, Inc., 8.000%, 12/15/2025, 144A | | | 32,197,389 | |
| | | | | | | | |
| | | | | | | 274,455,308 | |
| | | | | | | | |
| |
| | | | Airlines – 1.6% | |
| | 29,160,000 | | | Air Canada Pass Through Trust, Series 2020-2A, 5.250%, 10/01/2030, 144A | | | 30,880,148 | |
| | 345,000 | | | American Airlines Group, Inc.,
3.750%, 3/01/2025, 144A | | | 266,782 | |
| | 29,295,000 | | | American Airlines Group, Inc.,
5.000%, 6/01/2022, 144A | | | 26,336,498 | |
| | 3,832,240 | | | American Airlines Pass Through Certificates, Series 2016-3, Class B, 3.750%, 4/15/2027 | | | 3,083,114 | |
| | 3,665,185 | | | American Airlines Pass Through Certificates, Series 2017-2, Class B, 3.700%, 4/15/2027 | | | 3,098,581 | |
| | 216,231 | | | Continental Airlines Pass Through Certificates, Series 2001-1, Class A-1, 6.703%, 12/15/2022 | | | 216,231 | |
| | 41,995,000 | | | Mileage Plus Holdings LLC/Mileage Plus Intellectual Property Assets Ltd., 6.500%, 6/20/2027, 144A | | | 45,144,625 | |
| | 4,817,252 | | | United Airlines Pass Through Trust, Series 2014-1, Class A, 4.000%, 10/11/2027 | | | 4,870,695 | |
| | 32,235,000 | | | United Airlines Pass Through Trust, Series 2020-1, Class A, 5.875%, 4/15/2029 | | | 34,777,697 | |
| | | | | | | | |
| | | | | | | 148,674,371 | |
| | | | | | | | |
| |
| | | | Automotive – 2.8% | |
| | 3,641,000 | | | Allison Transmission, Inc.,
4.750%, 10/01/2027, 144A | | | 3,832,152 | |
| | 3,172,000 | | | Cummins, Inc., 6.750%, 2/15/2027 | | | 4,019,789 | |
| | 1,000,000 | | | Dana, Inc., 5.625%, 6/15/2028 | | | 1,076,730 | |
| | 30,125,000 | | | Ford Motor Co., 4.750%, 1/15/2043 | | | 30,727,500 | |
| | 2,440,000 | | | Ford Motor Co., 5.291%, 12/08/2046 | | | 2,549,800 | |
| | 1,560,000 | | | Ford Motor Co., 6.625%, 2/15/2028 | | | 1,763,798 | |
| | 1,580,000 | | | Ford Motor Co., 7.500%, 8/01/2026 | | | 1,839,104 | |
| | 6,430,000 | | | Ford Motor Credit Co. LLC,
5.125%, 6/16/2025 | | | 6,991,339 | |
| | 26,145,000 | | | Ford Motor Credit Co. LLC,
5.596%, 1/07/2022 | | | 27,025,564 | |
| | 3,505,000 | | | General Motors Co., 5.200%, 4/01/2045 | | | 4,256,565 | |
| | 3,170,000 | | | General Motors Co., 6.250%, 10/02/2043 | | | 4,276,233 | |
| | 88,950,000 | | | General Motors Financial Co., Inc., 3.600%, 6/21/2030 | | | 99,177,801 | |
See accompanying notes to financial statements.
9 |
Portfolio of Investments – as of December 31, 2020
Loomis Sayles Bond Fund – continued
| | | | | | | | |
Principal
Amount (‡) | | | Description | | Value (†) | |
|
| | Bonds and Notes – continued | |
| |
| | | | Automotive – continued | |
| $ | 37,875,000 | | | General Motors Financial Co., Inc., 4.375%, 9/25/2021 | | $ | 38,897,722 | |
| | 20,094,000 | | | Goodyear Tire & Rubber Co. (The), 4.875%, 3/15/2027 | | | 20,546,115 | |
| | 2,365,000 | | | Goodyear Tire & Rubber Co. (The), 5.000%, 5/31/2026 | | | 2,406,388 | |
| | 6,201,000 | | | Goodyear Tire & Rubber Co. (The), 7.000%, 3/15/2028 | | | 6,728,891 | |
| | | | | | | | |
| | | | | | | 256,115,491 | |
| | | | | | | | |
| |
| | | | Banking – 5.8% | |
| | 16,572,000 | | | Banco Santander Mexico S.A. Institucion de Banca Multiple Grupo Financiero Santander, 5.375%, 4/17/2025, 144A | | | 19,038,908 | |
| | 13,982,000 | | | Bank of America Corp., (fixed rate to 10/24/2030, variable rate thereafter), MTN, 1.922%, 10/24/2031 | | | 14,166,849 | |
| | 4,423,000 | | | Bank of America Corp., (fixed rate to 12/20/2027, variable rate thereafter), 3.419%, 12/20/2028 | | | 4,995,974 | |
| | 12,588,000 | | | Bank of America Corp., (fixed rate to 4/29/2030, variable rate thereafter), 2.592%, 4/29/2031 | | | 13,491,295 | |
| | 8,870,000 | | | Bank of America Corp., (fixed rate to 7/23/2030, variable rate thereafter), MTN, 1.898%, 7/23/2031 | | | 8,961,726 | |
| | 59,285,000 | | | Bank of America Corp., Series L, MTN, 4.183%, 11/25/2027 | | | 68,775,686 | |
| | 47,298,000 | | | Barclays PLC, (fixed rate to 9/23/2030, variable rate thereafter), 3.564%, 9/23/2035 | | | 51,249,275 | |
| | 22,200,000 | | | BNP Paribas S.A., (fixed rate to 6/25/2037, variable rate thereafter), 7.195%, 144A(i) | | | 24,642,000 | |
| | 14,253,000 | | | BNP Paribas S.A., (fixed rate to 8/12/2030, variable rate thereafter), 2.588%, 8/12/2035, 144A | | | 14,530,934 | |
| | 7,340,000 | | | Citigroup, Inc., 4.500%, 1/14/2022 | | | 7,653,259 | |
| | 40,185,000 | | | Citigroup, Inc., (fixed rate to 3/31/2030, variable rate thereafter), 4.412%, 3/31/2031 | | | 48,730,625 | |
| | 2,955,000 | | | Citigroup, Inc., (fixed rate to 6/03/2030, variable rate thereafter), 2.572%, 6/03/2031 | | | 3,149,617 | |
| | 4,045,000 | | | Cooperatieve Rabobank UA, 3.950%, 11/09/2022 | | | 4,294,337 | |
| | 3,005,000 | | | Credit Agricole S.A., 3.250%, 1/14/2030, 144A | | | 3,291,677 | |
| | 2,275,000 | | | Deutsche Bank AG, (fixed rate to 12/01/2027, variable rate thereafter), 4.875%, 12/01/2032 | | | 2,380,560 | |
| | 26,445,000 | | | Intesa Sanpaolo SpA, 5.017%, 6/26/2024, 144A | | | 28,932,891 | |
| | 8,330,000 | | | JPMorgan Chase & Co., (fixed rate to 10/15/2029, variable rate thereafter), 2.739%, 10/15/2030 | | | 9,057,483 | |
| | 28,240,000 | | | JPMorgan Chase & Co., (fixed rate to 11/19/2030, variable rate thereafter), 1.764%, 11/19/2031 | | | 28,507,903 | |
| |
| | | | Banking – continued | |
| 6,600,000 | | | Morgan Stanley, 3.950%, 4/23/2027 | | | 7,630,583 | |
| | 45,685,000 | | | Morgan Stanley, (fixed rate to 2/13/2031, variable rate thereafter), MTN, 1.794%, 2/13/2032 | | | 46,011,651 | |
| | 47,205,000 | | | Morgan Stanley, GMTN, 4.350%, 9/08/2026 | | | 55,654,140 | |
| | 15,000,000 | | | Morgan Stanley, MTN, 6.250%, 8/09/2026 | | | 19,138,514 | |
| | 22,550,000 | | | Natwest Group PLC, (fixed rate to 8/28/2030, variable rate thereafter), 3.032%, 11/28/2035 | | | 23,293,473 | |
| | 20,365,000 | | | UniCredit SpA, (fixed rate to 6/30/2030, variable rate thereafter), 5.459%, 6/30/2035, 144A | | | 22,408,375 | |
| | | | | | | | |
| | | | | | | 529,987,735 | |
| | | | | | | | |
| |
| | | | Brokerage – 0.8% | |
| | 21,725,000 | | | Jefferies Group LLC, 6.250%, 1/15/2036 | | | 28,973,888 | |
| | 22,428,000 | | | Jefferies Group LLC, 6.450%, 6/08/2027 | | | 28,432,848 | |
| | 13,420,000 | | | Owl Rock Technology Finance Corp., 4.750%, 12/15/2025, 144A | | | 14,013,765 | |
| | | | | | | | |
| | | | | | | 71,420,501 | |
| | | | | | | | |
| |
| | | | Building Materials – 0.8% | |
| | 7,794,000 | | | American Woodmark Corp., 4.875%, 3/15/2026, 144A | | | 7,988,850 | |
| | 3,605,000 | | | Cemex SAB de CV, 5.200%, 9/17/2030, 144A | | | 3,952,883 | |
| | 29,985,000 | | | Cemex SAB de CV, 7.750%, 4/16/2026, 144A | | | 31,619,182 | |
| | 4,835,000 | | | JELD-WEN, Inc., 4.875%, 12/15/2027, 144A | | | 5,113,013 | |
| | 4,057,000 | | | Masco Corp., 6.500%, 8/15/2032 | | | 5,416,796 | |
| | 4,534,000 | | | Masco Corp., 7.750%, 8/01/2029 | | | 6,302,517 | |
| | 650,000 | | | Owens Corning, 4.400%, 1/30/2048 | | | 782,779 | |
| | 6,344,000 | | | Owens Corning, 7.000%, 12/01/2036 | | | 9,044,981 | |
| | | | | | | | |
| | | | | | | 70,221,001 | |
| | | | | | | | |
| |
| | | | Cable Satellite – 1.8% | |
| | 5,945,000 | | | Charter Communications Operating LLC/Charter Communications Operating Capital Corp., 2.800%, 4/01/2031 | | | 6,287,911 | |
| | 72,485,000 | | | Charter Communications Operating LLC/Charter Communications Operating Capital Corp., 3.700%, 4/01/2051 | | | 75,272,392 | |
| | 5,935,000 | | | Charter Communications Operating LLC/Charter Communications Operating Capital Corp., 5.125%, 7/01/2049 | | | 7,243,752 | |
| | 24,710,000 | | | CSC Holdings LLC, 5.375%, 2/01/2028, 144A | | | 26,377,925 | |
| | 9,330,000 | | | DISH DBS Corp., 5.875%, 11/15/2024 | | | 9,782,832 | |
| | 8,654,000 | | | DISH DBS Corp., 7.750%, 7/01/2026 | | | 9,692,566 | |
| | 6,190,000 | | | Time Warner Cable LLC,
4.500%, 9/15/2042 | | | 7,253,423 | |
See accompanying notes to financial statements.
| 10
Portfolio of Investments – as of December 31, 2020
Loomis Sayles Bond Fund – continued
| | | | | | | | |
Principal
Amount (‡) | | | Description | | Value (†) | |
|
| | Bonds and Notes – continued | |
| |
| | | | Cable Satellite – continued | |
| $ | 535,000 | | | Time Warner Cable LLC,
5.875%, 11/15/2040 | | $ | 714,096 | |
| | 17,637,000 | | | Ziggo BV, 5.500%, 1/15/2027, 144A | | | 18,408,619 | |
| | | | | | | | |
| | | | | | | 161,033,516 | |
| | | | | | | | |
| |
| | | | Chemicals – 0.1% | |
| | 9,275,000 | | | Minerals Technologies, Inc.,
5.000%, 7/01/2028, 144A | | | 9,714,079 | |
| | | | | | | | |
| |
| | | | Construction Machinery – 0.4% | |
| | 27,030,000 | | | Toro Co. (The), 6.625%, 5/01/2037(b)(d) | | | 35,817,759 | |
| | 3,280,000 | | | United Rentals North America, Inc., 4.875%, 1/15/2028 | | | 3,493,200 | |
| | | | | | | | |
| | | | | | | 39,310,959 | |
| | | | | | | | |
| |
| | | | Consumer Cyclical Services – 0.7% | |
| | 6,590,000 | | | Expedia Group, Inc., 3.250%, 2/15/2030 | | | 6,858,483 | |
| | 21,260,000 | | | Expedia Group, Inc., 3.800%, 2/15/2028 | | | 22,836,067 | |
| | 8,919,000 | | | ServiceMaster Co. LLC (The),
7.450%, 8/15/2027 | | | 10,379,486 | |
| | 8,108,000 | | | Uber Technologies, Inc., 6.250%, 1/15/2028, 144A | | | 8,817,450 | |
| | 10,590,000 | | | Uber Technologies, Inc., 7.500%, 9/15/2027, 144A | | | 11,649,000 | |
| | | | | | | | |
| | | | | | | 60,540,486 | |
| | | | | | | | |
| |
| | | | Consumer Products – 0.3% | |
| | 15,473,000 | | | Avon Products, Inc., 8.950%, 3/15/2043 | | | 20,230,947 | |
| | 3,435,000 | | | Whirlpool Corp., 4.600%, 5/15/2050 | | | 4,444,667 | |
| | | | | | | | |
| | | | | | | 24,675,614 | |
| | | | | | | | |
| |
| | | | Diversified Manufacturing – 0.3% | |
| | 8,950,000 | | | General Electric Co., 4.500%, 3/11/2044 | | | 10,939,392 | |
| | 11,695,000 | | | General Electric Co., Series A, MTN, 3-month LIBOR + 0.300%, 0.537%, 5/13/2024(h) | | | 11,326,123 | |
| | 2,080,000 | | | General Electric Co., Series D, (fixed rate to 1/21/2021, variable rate thereafter), 5.000%(i) | | | 1,934,920 | |
| | | | | | | | |
| | | | | | | 24,200,435 | |
| | | | | | | | |
| |
| | | | Electric – 1.0% | |
| | 35,345,617 | | | Alta Wind Holdings LLC, 7.000%, 6/30/2035, 144A | | | 41,537,262 | |
| | 1,230,000 | | | Edison International, 4.950%, 4/15/2025 | | | 1,400,078 | |
| | 8,663,000 | | | Empresa Nacional de Electricidad S.A., 7.875%, 2/01/2027 | | | 10,291,631 | |
| | 6,582,000 | | | Pacific Gas & Electric Co., 3.500%, 8/01/2050 | | | 6,541,923 | |
| | 8,302,000 | | | Pacific Gas & Electric Co., 4.250%, 3/15/2046 | | | 8,912,557 | |
| | 11,201,000 | | | Pacific Gas & Electric Co., 4.300%, 3/15/2045 | | | 11,942,063 | |
| |
| | | | Electric – continued | |
| 11,830,000 | | | Pacific Gas & Electric Co., 4.750%, 2/15/2044 | | | 13,291,174 | |
| | | | | | | | |
| | | | | | | 93,916,688 | |
| | | | | | | | |
| |
| | | | Finance Companies – 6.5% | |
| | 3,100,000 | | | AGFC Capital Trust I, 3-month LIBOR + 1.750%, 1.987%, 1/15/2067, 144A(b)(c)(f)(h) | | | 1,205,500 | |
| | 7,020,000 | | | Air Lease Corp., 3.125%, 12/01/2030 | | | 7,307,676 | |
| | 15,585,000 | | | Antares Holdings LP, 6.000%, 8/15/2023, 144A | | | 15,893,941 | |
| | 27,210,000 | | | Antares Holdings LP, 8.500%, 5/18/2025, 144A | | | 29,332,178 | |
| | 64,915,000 | | | GE Capital Funding LLC,
4.550%, 5/15/2032, 144A | | | 77,905,667 | |
| | 16,790,000 | | | GE Capital International Funding Co. Unlimited Co., 4.418%, 11/15/2035 | | | 20,039,638 | |
| | 445,000 | | | Navient Corp., 5.000%, 3/15/2027 | | | 448,894 | |
| | 27,420,000 | | | Navient Corp., 5.500%, 1/25/2023 | | | 28,653,900 | |
| | 5,365,000 | | | Navient Corp., 5.875%, 10/25/2024 | | | 5,700,313 | |
| | 150,996(††) | | | Navient Corp., 6.000%, 12/15/2043 | | | 3,787,483 | |
| | 38,431,000 | | | Navient Corp., 6.750%, 6/15/2026 | | | 41,745,674 | |
| | 58,523,000 | | | Navient Corp., MTN, 5.625%, 8/01/2033 | | | 56,182,080 | |
| | 75,452,000 | | | Navient Corp., MTN, 6.125%, 3/25/2024 | | | 80,545,010 | |
| | 2,950,000 | | | Navient Corp., MTN, 7.250%, 1/25/2022 | | | 3,082,750 | |
| | 31,410,000 | | | OneMain Finance Corp., 6.875%, 3/15/2025 | | | 36,474,862 | |
| | 10,145,000 | | | OneMain Finance Corp., 7.125%, 3/15/2026 | | | 11,996,463 | |
| | 36,085,000 | | | OneMain Finance Corp.,
7.750%, 10/01/2021 | | | 37,979,462 | |
| | 77,845,000 | | | OneMain Finance Corp.,
8.250%, 10/01/2023 | | | 89,327,137 | |
| | 14,750,000 | | | Owl Rock Capital Corp., 4.250%, 1/15/2026 | | | 15,536,596 | |
| | 10,870,000 | | | Quicken Loans LLC,
5.250%, 1/15/2028, 144A | | | 11,603,725 | |
| | 3,503,000 | | | Quicken Loans LLC/Quicken Loans Co-Issuer, Inc., 3.625%, 3/01/2029, 144A | | | 3,573,060 | |
| | 10,445,000 | | | Quicken Loans LLC/Quicken Loans Co-Issuer, Inc., 3.875%, 3/01/2031, 144A | | | 10,836,688 | |
| | | | | | | | |
| | | | | | | 589,158,697 | |
| | | | | | | | |
| |
| | | | Financial Other – 0.2% | |
| | 5,390,000 | | | Icahn Enterprises LP/Icahn Enterprises Finance Corp., 5.250%, 5/15/2027 | | | 5,778,080 | |
| | 14,125,000 | | | Nationstar Mortgage Holdings, Inc., 5.500%, 8/15/2028, 144A | | | 14,831,250 | |
| | | | | | | | |
| | | | | | | 20,609,330 | |
| | | | | | | | |
| |
| | | | Food & Beverage – 1.3% | |
| | 37,465,000 | | | Anheuser-Busch InBev Worldwide, Inc., 4.500%, 6/01/2050 | | | 47,290,564 | |
| | 24,200,000 | | | Fomento Economico Mexicano SAB de CV, 3.500%, 1/16/2050 | | | 26,929,632 | |
See accompanying notes to financial statements.
11 |
Portfolio of Investments – as of December 31, 2020
Loomis Sayles Bond Fund – continued
| | | | | | | | |
Principal
Amount (‡) | | | Description | | Value (†) | |
|
| | Bonds and Notes – continued | |
| |
| | | | Food & Beverage – continued | |
| $ | 43,345,000 | | | Kraft Heinz Foods Co., 4.375%, 6/01/2046 | | $ | 46,711,606 | |
| | | | | | | | |
| | | | | | | 120,931,802 | |
| | | | | | | | |
| |
| | | | Gaming – 0.2% | |
| | 17,635,000 | | | International Game Technology PLC, 6.250%, 1/15/2027, 144A | | | 20,194,720 | |
| | | | | | | | |
| |
| | | | Government Owned – No Guarantee – 0.6% | |
| | 8,465,000 | | | Pertamina Persero PT, 6.450%, 5/30/2044, 144A | | | 11,470,786 | |
| | 28,145,000 | | | Petroleos Mexicanos, 5.950%, 1/28/2031 | | | 28,074,638 | |
| | 15,400,000 | | | Saudi Arabian Oil Co., 3.250%, 11/24/2050, 144A | | | 15,616,640 | |
| | | | | | | | |
| | | | | | | 55,162,064 | |
| | | | | | | | |
| |
| | | | Government Sponsored – 0.2% | |
| | 15,815,000 | | | Petrobras Global Finance BV, 6.750%, 6/03/2050 | | | 19,650,137 | |
| | 2,375,000 | | | Petrobras Global Finance BV, 6.900%, 3/19/2049 | | | 3,010,313 | |
| | | | | | | | |
| | | | | | | 22,660,450 | |
| | | | | | | | |
| |
| | | | Healthcare – 2.7% | |
| | 27,204,000 | | | HCA, Inc., 7.050%, 12/01/2027 | | | 32,950,845 | |
| | 27,545,000 | | | HCA, Inc., 7.500%, 11/06/2033 | | | 38,287,550 | |
| | 12,446,000 | | | HCA, Inc., MTN, 7.750%, 7/15/2036 | | | 16,086,455 | |
| | 46,555,000 | | | Tenet Healthcare Corp., 5.125%, 5/01/2025 | | | 47,462,357 | |
| | 29,845,000 | | | Tenet Healthcare Corp., 6.125%, 10/01/2028, 144A | | | 31,097,893 | |
| | 23,235,000 | | | Tenet Healthcare Corp., 6.750%, 6/15/2023 | | | 24,919,538 | |
| | 49,062,000 | | | Tenet Healthcare Corp., 6.875%, 11/15/2031 | | | 51,760,410 | |
| | | | | | | | |
| | | | | | | 242,565,048 | |
| | | | | | | | |
| |
| | | | Home Construction – 0.9% | |
| | 8,225,000 | | | Beazer Homes USA, Inc., 7.250%, 10/15/2029 | | | 9,273,688 | |
| | 52,605,000 | | | PulteGroup, Inc., 6.000%, 2/15/2035 | | | 71,527,018 | |
| | | | | | | | |
| | | | | | | 80,800,706 | |
| | | | | | | | |
| |
| | | | Independent Energy – 2.3% | |
| | 6,177,000 | | | Aker BP ASA, 3.750%, 1/15/2030, 144A | | | 6,487,756 | |
| | 8,634,000 | | | Ascent Resources Utica Holdings LLC/ARU Finance Corp., 9.000%, 11/01/2027, 144A | | | 9,605,325 | |
| | 6,507,000 | | | Baytex Energy Corp., 5.625%, 6/01/2024, 144A | | | 4,476,295 | |
| | 46,735,000 | | | Chesapeake Energy Corp., 8.000%, 6/15/2027(b)(d)(j) | | | 2,103,075 | |
| | 19,891,000 | | | Continental Resources, Inc., 3.800%, 6/01/2024 | | | 20,539,645 | |
| | 1,768,000 | | | Continental Resources, Inc., 4.500%, 4/15/2023 | | | 1,822,985 | |
| | 3,480,000 | | | Diamondback Energy, Inc., 3.500%, 12/01/2029 | | | 3,717,739 | |
| |
| | | | Independent Energy – continued | |
| 17,381,000 | | | Hess Corp., 5.600%, 2/15/2041 | | | 21,211,033 | |
| | 1,724,000 | | | Leviathan Bond Ltd., 6.125%, 6/30/2025, 144A | | | 1,888,142 | |
| | 10,098,000 | | | MEG Energy Corp., 7.000%, 3/31/2024, 144A | | | 10,198,980 | |
| | 27,050,000 | | | Mesquite Energy, Inc., 6.125%, 1/15/2023(b)(d)(j) | | | 121,184 | |
| | 12,420,000 | | | Mesquite Energy, Inc., 7.750%, 6/15/2021(b)(d)(j) | | | 14,656 | |
| | 2,770,000 | | | Occidental Petroleum Corp., 4.500%, 7/15/2044 | | | 2,386,826 | |
| | 49,025,000 | | | Occidental Petroleum Corp., 6.625%, 9/01/2030 | | | 53,228,894 | |
| | 93,333 | | | Pan American Energy LLC, 7.875%, 5/07/2021, 144A | | | 94,179 | |
| | 7,215,000 | | | Parsley Energy LLC/Parsley Finance Corp., 4.125%, 2/15/2028, 144A | | | 7,575,750 | |
| | 4,270,000 | | | QEP Resources, Inc., 5.250%, 5/01/2023 | | | 4,494,175 | |
| | 190,000 | | | Range Resources Corp., 4.875%, 5/15/2025 | | | 179,472 | |
| | 22,947,000 | | | SM Energy Co., 10.000%, 1/15/2025, 144A | | | 24,756,141 | |
| | 25,660,000 | | | Vine Oil & Gas LP/Vine Oil & Gas Finance Corp., 8.750%, 4/15/2023, 144A(b)(d) | | | 20,271,400 | |
| | 3,615,000 | | | Vine Oil & Gas LP/Vine Oil & Gas Finance Corp., 9.750%, 4/15/2023, 144A(b)(d) | | | 2,892,000 | |
| | 9,140,000 | | | WPX Energy, Inc., 4.500%, 1/15/2030 | | | 9,688,400 | |
| | | | | | | | |
| | | | | | | 207,754,052 | |
| | | | | | | | |
| |
| | | | Life Insurance – 3.1% | |
| | 6,212,000 | | | American International Group, Inc., 4.875%, 6/01/2022 | | | 6,590,696 | |
| | 27,930,000 | | | AXA S.A., (fixed rate to 12/14/2036, variable rate thereafter), 6.379%, 144A(i) | | | 38,857,613 | |
| | 7,878,000 | | | Brighthouse Financial, Inc., 4.700%, 6/22/2047 | | | 8,226,568 | |
| | 20,335,000 | | | Brighthouse Financial, Inc., 5.625%, 5/15/2030 | | | 25,103,171 | |
| | 15,000,000 | | | Global Atlantic Fin Co., 8.625%, 4/15/2021, 144A | | | 15,252,351 | |
| | 2,030,000 | | | MetLife, Inc., 9.250%, 4/08/2068, 144A | | | 3,095,016 | |
| | 10,175,000 | | | MetLife, Inc., 10.750%, 8/01/2069 | | | 17,432,800 | |
| | 57,985,000 | | | Mutual of Omaha Insurance Co., 6.800%, 6/15/2036, 144A | | | 77,787,022 | |
| | 38,476,000 | | | National Life Insurance Co., 10.500%, 9/15/2039, 144A(b)(d) | | | 66,249,901 | |
| | 12,950,000 | | | NLV Financial Corp., 7.500%, 8/15/2033, 144A(b)(d) | | | 17,834,481 | |
| | 2,500,000 | | | Prudential Financial, Inc., MTN, 3.700%, 3/13/2051 | | | 3,005,350 | |
| | | | | | | | |
| | | | | | | 279,434,969 | |
| | | | | | | | |
| |
| | | | Media Entertainment – 0.4% | |
| | 10,215,000 | | | Discovery Communications LLC, 4.000%, 9/15/2055, 144A | | | 11,433,633 | |
See accompanying notes to financial statements.
| 12
Portfolio of Investments – as of December 31, 2020
Loomis Sayles Bond Fund – continued
| | | | | | | | |
Principal
Amount (‡) | | | Description | | Value (†) | |
|
| | Bonds and Notes – continued | |
| |
| | | | Media Entertainment – continued | |
| $ | 7,085,000 | | | iHeartCommunications, Inc., 8.375%, 5/01/2027 | | $ | 7,562,954 | |
| | 3,725,000 | | | ViacomCBS, Inc., 4.375%, 3/15/2043 | | | 4,400,968 | |
| | 6,730,000 | | | ViacomCBS, Inc., 4.900%, 8/15/2044 | | | 8,393,471 | |
| | 6,940,000 | | | ViacomCBS, Inc., 4.950%, 5/19/2050 | | | 8,989,524 | |
| | | | | | | | |
| | | | | | | 40,780,550 | |
| | | | | | | | |
| |
| | | | Metals & Mining – 1.4% | |
| | 4,205,000 | | | Anglo American Capital PLC, 2.625%, 9/10/2030, 144A | | | 4,397,120 | |
| | 35,180,000 | | | ArcelorMittal S.A., 7.000%, 3/01/2041 | | | 48,480,807 | |
| | 3,635,000 | | | ArcelorMittal S.A., 7.250%, 10/15/2039 | | | 5,100,341 | |
| | 3,950,000 | | | Barrick Gold Corp., Series A, 5.800%, 11/15/2034 | | | 4,979,624 | |
| | 5,370,000 | | | Barrick North America Finance LLC, 5.750%, 5/01/2043 | | | 7,832,353 | |
| | 12,096,000 | | | Commercial Metals Co., 5.375%, 7/15/2027 | | | 12,731,040 | |
| | 7,370,000 | | | First Quantum Minerals Ltd., 6.875%, 3/01/2026, 144A | | | 7,683,225 | |
| | 12,245,000 | | | First Quantum Minerals Ltd., 6.875%, 10/15/2027, 144A | | | 13,285,825 | |
| | 1,445,000 | | | First Quantum Minerals Ltd., 7.500%, 4/01/2025, 144A | | | 1,504,606 | |
| | 5,915,000 | | | Glencore Funding LLC, 2.500%, 9/01/2030, 144A | | | 6,045,485 | |
| | 2,570,000 | | | Kaiser Aluminum Corp., 6.500%, 5/01/2025, 144A | | | 2,749,900 | |
| | 9,550,000 | | | United States Steel Corp., 6.650%, 6/01/2037 | | | 8,022,000 | |
| | | | | | | | |
| | | | | | | 122,812,326 | |
| | | | | | | | |
| |
| | | | Midstream – 0.8% | |
| | 9,050,000 | | | DCP Midstream Operating LP, 6.450%, 11/03/2036, 144A | | | 9,774,000 | |
| | 7,325,000 | | | Energy Transfer Partners LP/Regency Energy Finance Corp., 4.500%, 11/01/2023 | | | 7,930,938 | |
| | 1,455,000 | | | Energy Transfer Partners LP/Regency Energy Finance Corp., 5.000%, 10/01/2022 | | | 1,544,000 | |
| | 17,922,000 | | | NGL Energy Partners LP/NGL Energy Finance Corp., 6.125%, 3/01/2025 | | | 11,358,067 | |
| | 205,000 | | | NGPL PipeCo LLC, 7.768%, 12/15/2037, 144A | | | 277,156 | |
| | 280,000 | | | Plains All American Pipeline LP/PAA Finance Corp., 4.300%, 1/31/2043 | | | 275,492 | |
| | 14,590,000 | | | Plains All American Pipeline LP/PAA Finance Corp., 4.700%, 6/15/2044 | | | 15,128,502 | |
| | 1,775,000 | | | Plains All American Pipeline LP/PAA Finance Corp., 4.900%, 2/15/2045 | | | 1,883,798 | |
| | 16,100,000 | | | Summit Midstream Partners LP, Series A, (fixed rate to 12/15/2022, variable rate thereafter), 9.500%(b)(d)(i)(j) | | | 5,153,610 | |
| |
| | | | Midstream – continued | |
| 18,753,000 | | | Williams Cos., Inc. (The), 3.350%, 8/15/2022 | | | 19,503,745 | |
| | | | | | | | |
| | | | | | | 72,829,308 | |
| | | | | | | | |
| |
| | | | Mortgage Related – 0.0% | |
| | 20,031 | | | FHLMC, 5.000%, 12/01/2031 | | | 22,192 | |
| | | | | | | | |
| |
| | | | Oil Field Services – 0.6% | |
| | 2,710,000 | | | Shelf Drilling Holdings Ltd., 8.250%, 2/15/2025, 144A | | | 1,246,600 | |
| | 4,030,000 | | | Transocean, Inc., 7.500%, 4/15/2031 | | | 1,400,425 | |
| | 67,054,000 | | | Transocean, Inc., 11.500%, 1/30/2027, 144A | | | 47,943,610 | |
| | | | | | | | |
| | | | | | | 50,590,635 | |
| | | | | | | | |
| |
| | | | Packaging – 0.2% | |
| | 12,925,000 | | | Owens-Brockway Glass Container, Inc., 6.625%, 5/13/2027, 144A | | | 13,991,312 | |
| | | | | | | | |
| |
| | | | Paper – 1.6% | |
| | 38,882,000 | | | Georgia-Pacific LLC, 7.750%, 11/15/2029 | | | 57,519,323 | |
| | 9,625,000 | | | International Paper Co., 8.700%, 6/15/2038 | | | 16,285,023 | |
| | 8,214,000 | | | WestRock MWV LLC, 7.950%, 2/15/2031 | | | 11,727,879 | |
| | 25,138,000 | | | WestRock MWV LLC, 8.200%, 1/15/2030 | | | 35,823,743 | |
| | 4,127,000 | | | Weyerhaeuser Co., 6.950%, 10/01/2027 | | | 5,374,036 | |
| | 14,035,000 | | | Weyerhaeuser Co., 7.375%, 3/15/2032 | | | 21,046,814 | |
| | | | | | | | |
| | | | | | | 147,776,818 | |
| | | | | | | | |
| |
| | | | Property & Casualty Insurance – 1.0% | |
| | 13,985,000 | | | MBIA Insurance Corp., 3-month LIBOR + 11.260%, 11.497%, 1/15/2033, 144A(g)(h) | | | 4,894,750 | |
| | 80,000 | | | MBIA Insurance Corp., 3-month LIBOR + 11.260%, 11.497%, 1/15/2033(g)(h) | | | 28,000 | |
| | 2,300,000 | | | MGIC Investment Corp., 5.250%, 8/15/2028 | | | 2,461,000 | |
| | 28,955,000 | | | Nationwide Mutual Insurance Co., 4.350%, 4/30/2050, 144A | | | 34,014,079 | |
| | 4,810,000 | | | Radian Group, Inc., 4.500%, 10/01/2024 | | | 5,074,550 | |
| | 2,825,000 | | | Radian Group, Inc., 4.875%, 3/15/2027 | | | 3,102,415 | |
| | 33,290,000 | | | Radian Group, Inc., 6.625%, 3/15/2025 | | | 37,700,925 | |
| | | | | | | | |
| | | | | | | 87,275,719 | |
| | | | | | | | |
| |
| | | | REITs – Diversified – 0.0% | |
| | 1,020,000 | | | iStar, Inc., 4.750%, 10/01/2024 | | | 1,032,750 | |
| | | | | | | | |
| |
| | | | REITs – Hotels – 0.2% | |
| | 821,000 | | | Service Properties Trust, 3.950%, 1/15/2028 | | | 793,291 | |
| | 8,807,000 | | | Service Properties Trust, 4.350%, 10/01/2024 | | | 8,696,913 | |
| | 2,507,000 | | | Service Properties Trust, 4.500%, 6/15/2023 | | | 2,519,535 | |
See accompanying notes to financial statements.
13 |
Portfolio of Investments – as of December 31, 2020
Loomis Sayles Bond Fund – continued
| | | | | | | | |
Principal
Amount (‡) | | | Description | | Value (†) | |
|
| | Bonds and Notes – continued | |
| |
| | | | REITs – Hotels – continued | |
| $ | 1,400,000 | | | Service Properties Trust, 4.650%, 3/15/2024 | | $ | 1,386,000 | |
| | 1,146,000 | | | Service Properties Trust, 4.750%, 10/01/2026 | | | 1,131,675 | |
| | 4,085,000 | | | Service Properties Trust, 4.950%, 2/15/2027 | | | 4,105,425 | |
| | | | | | | | |
| | | | | | | 18,632,839 | |
| | | | | | | | |
| |
| | | | Retailers – 0.5% | |
| | 4,680,000 | | | Dillard’s, Inc., 7.000%, 12/01/2028 | | | 5,008,349 | |
| | 7,182,000 | | | Dillard’s, Inc., 7.750%, 7/15/2026 | | | 8,105,390 | |
| | 2,250,000 | | | Dillard’s, Inc., 7.750%, 5/15/2027 | | | 2,477,902 | |
| | 1,795,000 | | | Hanesbrands, Inc., 5.375%, 5/15/2025, 144A | | | 1,899,146 | |
| | 9,245,000 | | | Marks & Spencer PLC, 7.125%, 12/01/2037, 144A | | | 10,334,246 | |
| | 12,530,000 | | | Michaels Stores, Inc., 8.000%, 7/15/2027, 144A | | | 13,469,750 | |
| | | | | | | | |
| | | | | | | 41,294,783 | |
| | | | | | | | |
| |
| | | | Sovereigns – 0.3% | |
| | 28,214,000 | | | Mexico Government International Bond, 3.771%, 5/24/2061 | | | 29,489,555 | |
| | | | | | | | |
| |
| | | | Supermarkets – 0.1% | |
| | 2,398,000 | | | Albertson’s Cos. LLC/Safeway, Inc./New Albertson’s LP/Albertson’s LLC, 5.750%, 3/15/2025 | | | 2,469,940 | |
| | 2,705,000 | | | Safeway, Inc., 7.250%, 2/01/2031 | | | 3,167,095 | |
| | | | | | | | |
| | | | | | | 5,637,035 | |
| | | | | | | | |
| |
| | | | Technology – 3.4% | |
| | 8,280,000 | | | Broadcom, Inc., 4.150%, 11/15/2030 | | | 9,586,271 | |
| | 34,815,000 | | | Broadcom, Inc., 4.300%, 11/15/2032 | | | 41,272,801 | |
| | 14,790,000 | | | Broadcom, Inc., 5.000%, 4/15/2030 | | | 17,978,900 | |
| | 14,400,000 | | | CommScope Technologies LLC, 5.000%, 3/15/2027, 144A | | | 14,184,000 | |
| | 49,820,000 | | | Iron Mountain, Inc., 4.875%, 9/15/2029, 144A | | | 52,560,100 | |
| | 14,075,000 | | | Jabil, Inc., 3.600%, 1/15/2030 | | | 15,662,871 | |
| | 12,420,000 | | | Jabil, Inc., 3.950%, 1/12/2028 | | | 14,046,061 | |
| | 35,206,000 | | | KLA Corp., 4.650%, 11/01/2024 | | | 40,072,352 | |
| | 12,970,000 | | | KLA Corp., 5.650%, 11/01/2034 | | | 17,487,702 | |
| | 39,770,000 | | | Microchip Technology, Inc., 0.972%, 2/15/2024, 144A | | | 39,867,349 | |
| | 4,735,000 | | | Micron Technology, Inc., 4.663%, 2/15/2030 | | | 5,810,540 | |
| | 5,205,000 | | | Micron Technology, Inc., 4.975%, 2/06/2026 | | | 6,152,067 | |
| | 5,730,000 | | | Micron Technology, Inc., 5.327%, 2/06/2029 | | | 7,167,578 | |
| | 1,771,000 | | | Samsung Electronics Co. Ltd., 7.700%, 10/01/2027, 144A | | | 2,144,079 | |
| | 9,561,000 | | | Seagate HDD Cayman, 4.091%, 6/01/2029, 144A | | | 10,240,309 | |
| | 8,816,000 | | | Seagate HDD Cayman, 4.875%, 6/01/2027 | | | 9,919,851 | |
| | | | | | | | |
| | | | | | | 304,152,831 | |
| | | | | | | | |
| |
| | | | Transportation Services – 0.8% | |
| 14,000,000 | | | Adani Ports & Special Economic Zone Ltd., 4.200%, 8/04/2027, 144A | | | 15,024,571 | |
| | 1,215,000 | | | Avis Budget Car Rental LLC/Avis Budget Finance, Inc., 5.750%, 7/15/2027, 144A | | | 1,233,225 | |
| | 20,994,000 | | | Fenix Marine Service Holdings Ltd., 8.000%, 1/15/2024(b)(d) | | | 19,012,166 | |
| | 31,370,000 | | | Penske Truck Leasing Co. LP/PTL Finance Corp., 4.000%, 7/15/2025, 144A | | | 35,574,051 | |
| | | | | | | | |
| | | | | | | 70,844,013 | |
| | | | | | | | |
| |
| | | | Treasuries – 15.7% | |
| | 828,465,000 | | | U.S. Treasury Bond, 1.250%, 5/15/2050 | | | 751,573,092 | |
| | 398,175,000 | | | U.S. Treasury Bond, 1.375%, 8/15/2050 | | | 372,915,773 | |
| | 20,670,000 | | | U.S. Treasury Bond, 1.625%, 11/15/2050 | | | 20,592,488 | |
| | 231,210,000 | | | U.S. Treasury Note, 0.125%, 11/30/2022 | | | 231,237,096 | |
| | 45,170,000 | | | U.S. Treasury Note, 0.125%, 12/31/2022 | | | 45,175,293 | |
| | | | | | | | |
| | | | | | | 1,421,493,742 | |
| | | | | | | | |
| |
| | | | Wireless – 1.1% | |
| | 2,571,000 | | | American Tower Corp., 1.875%, 10/15/2030 | | | 2,593,423 | |
| | 1,895,000 | | | American Tower Corp., 2.100%, 6/15/2030 | | | 1,945,042 | |
| | 2,960,000 | | | American Tower Corp., 2.950%, 1/15/2051 | | | 2,967,061 | |
| | 11,875,000 | | | American Tower Corp., 3.100%, 6/15/2050 | | | 12,231,576 | |
| | 9,660,000 | | | Crown Castle International Corp., 2.250%, 1/15/2031 | | | 10,020,690 | |
| | 10,150,000 | | | Crown Castle International Corp., 3.250%, 1/15/2051 | | | 10,709,251 | |
| | 2,240,000 | | | Crown Castle International Corp., 3.300%, 7/01/2030 | | | 2,507,185 | |
| | 2,385,000 | | | Millicom International Cellular S.A., 5.125%, 1/15/2028, 144A | | | 2,535,017 | |
| | 5,305,000 | | | Millicom International Cellular S.A., 6.250%, 3/25/2029, 144A | | | 5,968,125 | |
| | 39,900,000 | | | T-Mobile USA, Inc., 3.875%, 4/15/2030, 144A | | | 46,212,180 | |
| | | | | | | | |
| | | | | | | 97,689,550 | |
| | | | | | | | |
| |
| | | | Wirelines – 4.3% | |
| | 25,684,000 | | | AT&T, Inc., 3.650%, 9/15/2059, 144A | | | 25,934,121 | |
| | 15,813,000 | | | AT&T, Inc., 3.800%, 12/01/2057, 144A | | | 16,523,586 | |
| | 137,303,000 | | | AT&T, Inc., 4.300%, 2/15/2030 | | | 164,013,570 | |
| | 1,875,000 | | | CenturyLink, Inc., 5.625%, 4/01/2025 | | | 2,022,656 | |
| | 3,825,000 | | | Cincinnati Bell Telephone Co. LLC, 6.300%, 12/01/2028 | | | 4,056,604 | |
| | 3,036,000 | | | Cincinnati Bell, Inc., 8.000%, 10/15/2025, 144A | | | 3,237,135 | |
See accompanying notes to financial statements.
| 14
Portfolio of Investments – as of December 31, 2020
Loomis Sayles Bond Fund – continued
| | | | | | | | |
Principal
Amount (‡) | | | Description | | Value (†) | |
|
| | Bonds and Notes – continued | |
| |
| | | | Wirelines – continued | |
| $ | 49,543,000 | | | Telecom Italia Capital S.A., 6.000%, 9/30/2034 | | $ | 60,347,833 | |
| | 23,485,000 | | | Telecom Italia Capital S.A., 6.375%, 11/15/2033 | | | 28,886,550 | |
| | 71,128,000 | | | Verizon Communications, Inc., 4.329%, 9/21/2028 | | | 85,518,617 | |
| | | | | | | | |
| | | | | | | 390,540,672 | |
| | | | | | | | |
| | |
| | | | Total Non-Convertible Bonds | | | | |
| | |
| | | | (Identified Cost $6,048,694,173) | | | 6,359,487,673 | |
| | | | | | | | |
|
| | Convertible Bonds – 3.9% | |
| |
| | | | Airlines – 0.1% | |
| | 7,434,000 | | | Southwest Airlines Co., 1.250%, 5/01/2025 | | | 10,797,885 | |
| | | | | | | | |
| |
| | | | Cable Satellite – 2.5% | |
| | 48,505,000 | | | DISH Network Corp., 2.375%, 3/15/2024 | | | 45,203,257 | |
| | 184,765,000 | | | DISH Network Corp., 3.375%, 8/15/2026 | | | 176,123,846 | |
| | | | | | | | |
| | | | | | | 221,327,103 | |
| | | | | | | | |
| |
| | | | Consumer Cyclical Services – 0.1% | |
| | 11,830,000 | | | Uber Technologies, Inc., Zero Coupon, 12/15/2025, 144A | | | 12,102,550 | |
| | | | | | | | |
| |
| | | | Energy – 0.0% | |
| | 65,055,000 | | | Chesapeake Energy Corp., 5.500%, 9/15/2026(b)(d)(j) | | | 2,927,475 | |
| | | | | | | | |
| |
| | | | Healthcare – 0.1% | |
| | 2,835,000 | | | Teladoc Health, Inc., 1.250%, 6/01/2027, 144A | | | 3,395,493 | |
| | | | | | | | |
| |
| | | | Pharmaceuticals – 0.2% | |
| | 11,478,000 | | | BioMarin Pharmaceutical, Inc., 0.599%, 8/01/2024 | | | 12,316,895 | |
| | 3,222,000 | | | BioMarin Pharmaceutical, Inc., 1.250%, 5/15/2027, 144A | | | 3,366,990 | |
| | 2,333,000 | | | Neurocrine Biosciences, Inc., 2.250%, 5/15/2024 | | | 3,219,011 | |
| | | | | | | | |
| | | | | | | 18,902,896 | |
| | | | | | | | |
| |
| | | | REITs – Diversified – 0.2% | |
| | 15,110,000 | | | iStar, Inc., 3.125%, 9/15/2022 | | | 17,778,909 | |
| | | | | | | | |
| |
| | | | Technology – 0.7% | |
| | 13,345,000 | | | Booking Holdings, Inc., 0.900%, 9/15/2021 | | | 15,467,227 | |
| | 1,000,000 | | | Evolent Health, Inc., 3.500%, 12/01/2024, 144A | | | 1,140,417 | |
| | 10,741,000 | | | Nuance Communications, Inc., 1.250%, 4/01/2025 | | | 24,451,994 | |
| | 23,950,000 | | | Western Digital Corp., 1.500%, 2/01/2024 | | | 23,805,004 | |
| | | | | | | | |
| | | | | | | 64,864,642 | |
| | | | | | | | |
| | |
| | | | Total Convertible Bonds | | | | |
| | |
| | | | (Identified Cost $387,701,046) | | | 352,096,953 | |
| | | | | | | | |
|
| | Municipals – 1.5% | |
| |
| | | | Illinois – 0.4% | |
| 30,610,000 | | | State of Illinois, 5.100%, 6/01/2033 | | | 32,942,788 | |
| | | | | | | | |
| |
| | | | Virginia – 1.1% | |
| | 94,480,000 | | | Tobacco Settlement Financing Corp., Series A-1, 6.706%, 6/01/2046 | | | 98,851,590 | |
| | | | | | | | |
| | |
| | | | Total Municipals | | | | |
| | |
| | | | (Identified Cost $119,740,008) | | | 131,794,378 | |
| | | | | | | | |
| | |
| | | | Total Bonds and Notes | | | | |
| | |
| | | | (Identified Cost $6,556,135,227) | | | 6,843,379,004 | |
| | | | | | | | |
|
| | Senior Loans – 0.3% | |
| |
| | | | Chemicals – 0.1% | |
| | 10,864,295 | | | Aruba Investments, Inc., 2020 2nd Lien Term Loan, 3-month LIBOR + 7.750%, 8.500%, 11/24/2028(h) | | | 10,864,295 | |
| | | | | | | | |
| |
| | | | Independent Energy – 0.2% | |
| | 16,469,450 | | | Ascent Resources – Utica, 2020 Fixed 2nd Lien Term Loan, 11/01/2025(k) | | | 17,848,766 | |
| | | | | | | | |
| | |
| | | | Total Senior Loans | | | | |
| | |
| | | | (Identified Cost $27,171,572) | | | 28,713,061 | |
| | | | | | | | |
| | |
| | Shares | | | | | | | |
|
| | Common Stocks – 10.4% | |
| |
| | | | Aerospace & Defense – 0.0% | |
| | 8,484 | | | Lockheed Martin Corp. | | | 3,011,650 | |
| | | | | | | | |
| |
| | | | Air Freight & Logistics – 0.0% | |
| | 17,918 | | | United Parcel Service, Inc., Class B | | | 3,017,391 | |
| | | | | | | | |
| |
| | | | Beverages – 0.0% | |
| | 56,873 | | | Coca-Cola Co. (The) | | | 3,118,915 | |
| | | | | | | | |
| |
| | | | Capital Markets – 0.1% | |
| | 4,311 | | | BlackRock, Inc. | | | 3,110,559 | |
| | 46,950 | | | Morgan Stanley | | | 3,217,483 | |
| | | | | | | | |
| | | | | | | 6,328,042 | |
| | | | | | | | |
| |
| | | | Chemicals – 0.1% | |
| | 733,495 | | | Hexion Holdings Corp., Class B(g) | | | 9,484,090 | |
| | | | | | | | |
| |
| | | | Communications Equipment – 0.0% | |
| | 68,194 | | | Cisco Systems, Inc. | | | 3,051,682 | |
| | | | | | | | |
| |
| | | | Diversified Telecommunication Services – 3.5% | |
| | 11,115,698 | | | AT&T, Inc. | | | 319,687,474 | |
| | | | | | | | |
| |
| | | | Electric Utilities – 0.1% | |
| | 33,517 | | | Duke Energy Corp. | | | 3,068,817 | |
| | 41,500 | | | NextEra Energy, Inc. | | | 3,201,725 | |
| | | | | | | | |
| | | | | | | 6,270,542 | |
| | | | | | | | |
See accompanying notes to financial statements.
15 |
Portfolio of Investments – as of December 31, 2020
Loomis Sayles Bond Fund – continued
| | | | | | | | |
Shares | | | Description | | Value (†) | |
|
| | Common Stocks – continued | |
| |
| | | | Electronic Equipment, Instruments & Components – 1.7% | |
| | 4,304,382 | | | Corning, Inc. | | $ | 154,957,752 | |
| | | | | | | | |
| |
| | | | Food & Staples Retailing – 0.0% | |
| | 20,389 | | | Walmart, Inc. | | | 2,939,074 | |
| | | | | | | | |
| |
| | | | Health Care Equipment & Supplies – 0.0% | |
| | 28,594 | | | Abbott Laboratories | | | 3,130,757 | |
| | | | | | | | |
| |
| | | | Health Care Providers & Services – 0.1% | |
| | 9,534 | | | Anthem, Inc. | | | 3,061,272 | |
| | 8,813 | | | UnitedHealth Group, Inc. | | | 3,090,543 | |
| | | | | | | | |
| | | | | | | 6,151,815 | |
| | | | | | | | |
| |
| | | | Hotels, Restaurants & Leisure – 0.0% | |
| | 29,899 | | | Starbucks Corp. | | | 3,198,595 | |
| | | | | | | | |
| |
| | | | Household Products – 0.0% | |
| | 22,179 | | | Procter & Gamble Co. (The) | | | 3,085,986 | |
| | | | | | | | |
| |
| | | | Insurance – 0.1% | |
| | 32,666 | | | Progressive Corp. (The) | | | 3,230,014 | |
| | | | | | | | |
| |
| | | | IT Services – 0.1% | |
| | 12,274 | | | Accenture PLC, Class A | | | 3,206,092 | |
| | 17,442 | | | Automatic Data Processing, Inc. | | | 3,073,280 | |
| | | | | | | | |
| | | | | | | 6,279,372 | |
| | | | | | | | |
| |
| | | | Machinery – 0.1% | |
| | 12,002 | | | Deere & Co. | | | 3,229,138 | |
| | | | | | | | |
| |
| | | | Media – 0.1% | |
| | 1,740,413 | | | Clear Channel Outdoor Holdings, Inc.(g) | | | 2,871,681 | |
| | 58,744 | | | Comcast Corp., Class A | | | 3,078,186 | |
| | 83,772 | | | iHeartMedia, Inc., Class A(g) | | | 1,087,361 | |
| | | | | | | | |
| | | | | | | 7,037,228 | |
| | | | | | | | |
| |
| | | | Metals & Mining – 0.0% | |
| | 49,964 | | | Newmont Corp. | | | 2,992,344 | |
| | | | | | | | |
| |
| | | | Oil, Gas & Consumable Fuels – 0.5% | |
| | 93,585 | | | Battalion Oil Corp.(g) | | | 776,755 | |
| | 33,606 | | | Chevron Corp. | | | 2,838,027 | |
| | 666,240 | | | Lonestar Resources U.S., Inc.(b)(c)(e)(f)(g)(l) | | | 4,623,706 | |
| | 209,391 | | | Paragon Offshore Ltd., Litigation Units, Class A(b)(c)(e)(f)(g) | | | — | |
| | 299,302 | | | Paragon Offshore Ltd., Litigation Units, Class B(e)(g) | | | 1,945,463 | |
| | 1,271,611 | | | Whiting Petroleum Corp.(g) | | | 31,790,275 | |
| | 135,323 | | | Williams Cos., Inc. (The) | | | 2,713,226 | |
| | | | | | | | |
| | | | | | | 44,687,452 | |
| | | | | | | | |
| |
| | | | Pharmaceuticals – 3.7% | |
| | 5,237,873 | | | Bristol-Myers Squibb Co. | | | 324,905,262 | |
| | 19,959 | | | Johnson & Johnson | | | 3,141,148 | |
| | 36,570 | | | Merck & Co., Inc. | | | 2,991,426 | |
| | | | | | | | |
| | | | | | | 331,037,836 | |
| | | | | | | | |
| |
| | | | REITs – Diversified – 0.0% | |
| | 13,859 | | | American Tower Corp. | | | 3,110,791 | |
| | | | | | | | |
| |
| | | | Road & Rail – 0.0% | |
| | 14,785 | | | Union Pacific Corp. | | | 3,078,533 | |
| | | | | | | | |
| |
| | | | Software – 0.1% | |
| | 17,622 | | | iQor Holdings, Inc.(g) | | | 195,604 | |
| | 14,177 | | | Microsoft Corp. | | | 3,153,249 | |
| | | | | | | | |
| | | | | | | 3,348,853 | |
| | | | | | | | |
| |
| | | | Specialty Retail – 0.0% | |
| | 11,478 | | | Home Depot, Inc. (The) | | | 3,048,786 | |
| | | | | | | | |
| |
| | | | Technology Hardware, Storage & Peripherals – 0.1% | |
| | 24,317 | | | Apple, Inc. | | | 3,226,623 | |
| | | | | | | | |
| | |
| | | | Total Common Stocks | | | | |
| | |
| | | | (Identified Cost $970,243,833) | | | 941,740,735 | |
| | | | | | | | |
|
| | Preferred Stocks – 0.8% | |
|
| | Convertible Preferred Stocks – 0.6% | |
| |
| | | | Banking – 0.2% | |
| | 14,254 | | | Bank of America Corp., Series L, 7.250% | | | 21,645,839 | |
| | | | | | | | |
| |
| | | | Communications – 0.0% | |
| | 4,982 | | | Cincinnati Bell, Inc., Series B, 6.750% | | | 247,016 | |
| | | | | | | | |
| |
| | | | Energy – 0.0% | |
| | 257,387 | | | Chesapeake Energy Corp., 4.500%(b)(c)(f)(g) | | | — | |
| | 503,052 | | | Chesapeake Energy Corp., 5.000%(b)(c)(f)(g) | | | — | |
| | 3,044 | | | Chesapeake Energy Corp., 5.750%(b)(c)(f)(g) | | | — | |
| | 50,481 | | | Chesapeake Energy Corp., 5.750%(b)(c)(f)(g) | | | — | |
| | 39,322 | | | Chesapeake Energy Corp., 5.750%, 144A(b)(c)(f)(g) | | | — | |
| | 16,454 | | | Chesapeake Energy Corp., 5.750%, 144A(b)(c)(f)(g) | | | — | |
| | | | | | | | |
| | | | | | | — | |
| | | | | | | | |
| |
| | | | Food & Beverage – 0.0% | |
| | 17,733 | | | Bunge Ltd., 4.875% | | | 1,929,067 | |
| | | | | | | | |
| |
| | | | Healthcare – 0.1% | |
| | 85,919 | | | Boston Scientific Corp., Series A, 5.500% | | | 9,414,145 | |
| | | | | | | | |
| |
| | | | Midstream – 0.3% | |
| | 433,942 | | | El Paso Energy Capital Trust I, 4.750% | | | 22,460,838 | |
| | | | | | | | |
| | |
| | | | Total Convertible Preferred Stocks | | | | |
| | |
| | | | (Identified Cost $189,739,403) | | | 55,696,905 | |
| | | | | | | | |
|
| | Non-Convertible Preferred Stocks – 0.2% | |
| |
| | | | Electric – 0.0% | |
| | 2,925 | | | Connecticut Light & Power Co. (The), Series 1947, 1.900% | | | 142,504 | |
| | | | | | | | |
| |
| | | | Finance Companies – 0.0% | |
| | 16,004 | | | iStar, Inc., Series G, 7.650% | | | 402,542 | |
| | | | | | | | |
See accompanying notes to financial statements.
| 16
Portfolio of Investments – as of December 31, 2020
Loomis Sayles Bond Fund – continued
| | | | | | | | |
Shares | | | Description | | Value (†) | |
|
| | Preferred Stocks – continued | |
| |
| | | | Home Construction – 0.0% | |
| | 52,867 | | | Hovnanian Enterprises, Inc., 7.625%(g) | | $ | 431,395 | |
| | | | | | | | |
| |
| | | | REITs – Office Property – 0.1% | |
| | 2,318 | | | Highwoods Properties, Inc., Series A, 8.625% | | | 2,781,600 | |
| | | | | | | | |
| |
| | | | REITs – Warehouse/Industrials – 0.1% | |
| | 169,007 | | | Prologis, Inc., Series Q, 8.540% | | | 11,661,483 | |
| | | | | | | | |
| |
| | | | Total Non-Convertible Preferred Stocks | |
| | |
| | | | (Identified Cost $11,111,452) | | | 15,419,524 | |
| | | | | | | | |
| | |
| | | | Total Preferred Stocks | | | | |
| | |
| | | | (Identified Cost $200,850,855) | | | 71,116,429 | |
| | | | | | | | |
|
| | Warrants – 0.1% | |
| | 629,465 | | | iHeartMedia, Inc., Expiration on 5/1/2039(c)(f)(g) | | | 8,170,456 | |
| | 2,721,374 | | | SM Energy Co., Expiration on 6/30/2023(b)(c)(f)(g) | | | 2,063,618 | |
| | | | | | | | |
| | |
| | | | Total Warrants | | | | |
| | |
| | | | (Identified Cost $15,358,279) | | | 10,234,074 | |
| | | | | | | | |
|
| | Closed-End Investment Companies – 0.0% | |
| | 170,002 | | | NexPoint Strategic Opportunities Fund
(Identified Cost $9,807,937) | | | 1,788,421 | |
| | | | | | | | |
| | |
| Principal
Amount (‡) |
| | | | | | |
|
| | Short-Term Investments – 11.9% | |
| | |
| | 3,162,473,239 | | | Central Bank of Iceland, 0.000%, (ISK)(h)(m) | | | 24,749,360 | |
| | |
| | 241,901,927 | | | Tri-Party Repurchase Agreement with Fixed Income Clearing Corporation, Dated 12/31/2020 at 0.000% to be repurchased at $241,901,927 on 1/04/2021 collateralized by $139,695,300 U.S. Treasury Note, 2.125% due 12/31/2022 valued at $145,304,904; $101,435,100 U.S. Treasury Note, 0.125% due 12/31/2022 valued at $101,435,100 including accrued interest (Note 2 of Notes to Financial Statements) | | | 241,901,927 | |
| | |
| | 204,900,000 | | | U.S. Treasury Bills, 0.070%-0.071%, 3/11/2021(n)(o) | | | 204,871,826 | |
| | |
| | 175,000,000 | | | U.S. Treasury Bills, 0.091%, 1/28/2021(n) | | | 174,993,292 | |
| | |
| | 427,955,000 | | | U.S. Treasury Bills, 0.107%-0.111%, 4/15/2021(n)(o) | | | 427,855,946 | |
| | | | | | | | |
| | |
| | | | Total Short-Term Investments | | | | |
| | |
| | | | (Identified Cost $1,075,325,508) | | | 1,074,372,351 | |
| | | | | | | | |
| | |
| | | | Total Investments – 99.1% | | | | |
| | |
| | | | (Identified Cost $8,854,893,211) | | | 8,971,344,075 | |
| | |
| | | | Other assets less liabilities—0.9% | | | 82,082,821 | |
| | | | | | | | |
| | |
| | | | Net Assets – 100.0% | | $ | 9,053,426,896 | |
| | | | | | | | |
| | (†) | | | See Note 2 of Notes to Financial Statements. |
| |
| | (‡) | | | Principal Amount stated in U.S. dollars unless otherwise noted. |
| |
| | (††) | | | Amount shown represents units. One unit represents a principal amount of 25. |
| |
| | (a) | | | Variable rate security. The interest rate adjusts periodically based on; (i) changes in current interest rates and/or prepayments on underlying pools of assets, if applicable, (ii) reference to a base lending rate plus or minus a margin, and/or (iii) reference to a base lending rate adjusted by a multiplier and/or subject to certain floors or caps. Rate as of December 31, 2020 is disclosed. |
| |
| | (b) | | | Illiquid security. (Unaudited) |
| |
| | (c) | | | Level 3 security. Value has been determined using significant unobservable inputs. See Note 3 of Notes to Financial Statements. |
| |
| | (d) | | | Securities classified as fair valued pursuant to the Fund’s pricing policies and procedures. At December 31, 2020, the value of these securities amounted to $190,394,636 or 2.1% of net assets. See Note 2 of Notes to Financial Statements. |
| |
| | (e) | | | Securities subject to restriction on resale. At December 31, 2020, the restricted securities held by the Fund are as follows: |
| | | | | | | | | | | | | | |
| | | Acquisition
Date | | Acquisition
Cost | | | Value | | | % of
Net Assets | |
| | | | |
| GCA2014 Holdings Ltd., Series 2014-1, Class C | | 12/18/2014 | | $ | 20,921,895 | | | $ | 7,061,349 | | | | 0.1% | |
| | | | |
| GCA2014 Holdings Ltd., Series 2014-1, Class D | | 12/18/2014 | | | 9,492,593 | | | | 1,283,209 | | | | Less than 0.1% | |
| | | | |
| GCA2014 Holdings Ltd., Series 2014-1, Class E | | 12/18/2014 | | | 25,395,339 | | | | — | | | | — | |
| | | | |
| Lonestar Resources U.S., Inc. | | 12/01/2020 | | | 4,623,706 | * | | | 4,623,706 | | | | 0.1% | |
| | | | |
| Paragon Offshore Ltd., Litigation Units, Class A | | 7/18/2017 | | | 1,451,033 | | | | — | | | | — | |
| | | | |
| Paragon Offshore Ltd., Litigation Units, Class B | | 7/18/2017 | | | 28,157,326 | | | | 1,945,463 | | | | Less than 0.1% | |
| * | Represents basis assigned upon receipt in a taxable restructuring. |
| | | | | | |
| | (f) | | | Fair valued by the Fund’s adviser. At December 31, 2020, the value of these securities amounted to $24,407,838 or 0.3% of net assets. See Note 2 of Notes to Financial Statements. |
| |
| | (g) | | | Non-income producing security. |
| |
| | (h) | | | Variable rate security. Rate as of December 31, 2020 is disclosed. |
| |
| | (i) | | | Perpetual bond with no specified maturity date. |
| |
| | (j) | | | The issuer is in default with respect to interest and/or principal payments. Income is not being accrued. |
| |
| | (k) | | | Position is unsettled. Contract rate was not determined at December 31, 2020 and does not take effect until settlement date. Maturity date is not finalized until settlement date. |
| |
| | (l) | | | Affiliated issuer. See Note 5g for a summary of transactions in securities of affiliated issuers. |
| |
| | (m) | | | Security callable by issuer at any time. No specified maturity date. |
| |
| | (n) | | | Interest rate represents discount rate at time of purchase; not a coupon rate. |
| |
| | (o) | | | The Fund’s investment in U.S. Government/Agency securities is comprised of various lots with differing discount rates. These separate investments, which have the same maturity date, have been aggregated for the purpose of presentation in the Portfolio of Investments. |
| |
| | 144A | | | All or a portion of these securities are exempt from registration under Rule 144A of the Securities Act of 1933. These securities may be resold in transactions exempt from registration, normally to qualified institutional buyers. At December 31, 2020, the value of Rule 144A holdings amounted to $1,531,036,758 or 16.9% of net assets. |
| | ABS | | | Asset-Backed Securities |
| | CMT | | | Constant Maturity Treasury |
| | FHLMC | | | Federal Home Loan Mortgage Corp. |
| | GMTN | | | Global Medium Term Note |
| | LIBOR | | | London Interbank Offered Rate |
| | MTN | | | Medium Term Note |
| | REITs | | | Real Estate Investment Trusts |
| | ISK | | | Icelandic Krona |
See accompanying notes to financial statements.
17 |
Portfolio of Investments – as of December 31, 2020
Loomis Sayles Bond Fund – continued
Industry Summary at December 31, 2020
| | | | |
Treasuries | | | 15.7 | % |
Finance Companies | | | 6.5 | |
Banking | | | 6.0 | |
Wirelines | | | 4.3 | |
Cable Satellite | | | 4.3 | |
Technology | | | 4.1 | |
Pharmaceuticals | | | 3.9 | |
Diversified Telecommunication Services | | | 3.5 | |
Life Insurance | | | 3.1 | |
Aerospace & Defense | | | 3.0 | |
Healthcare | | | 2.9 | |
Automotive | | | 2.8 | |
Independent Energy | | | 2.5 | |
Other Investments, less than 2% each | | | 24.6 | |
Short-Term Investments | | | 11.9 | |
Closed-End Investment Companies | | | 0.0 | * |
| | | | |
Total Investments | | | 99.1 | |
Other assets less liabilities | | | 0.9 | |
| | | | |
Net Assets | | | 100.0 | % |
| | | | |
* Less than 0.1%
See accompanying notes to financial statements.
| 18
Portfolio of Investments – as of December 31, 2020
Loomis Sayles Investment Grade Fixed Income Fund
| | | | | | | | |
Principal
Amount (‡) | | | Description | | Value (†) | |
|
| | Bonds and Notes – 87.9% of Net Assets | |
|
| | Non-Convertible Bonds – 85.6% | |
| |
| | | | ABS Car Loan – 0.6% | |
| $ | 400,000 | | | CPS Auto Receivables Trust,
Series 2020-C, Class C,
1.710%, 8/17/2026, 144A | | $ | 405,506 | |
| | 145,000 | | | Drive Auto Receivables Trust,
Series 2018-5, Class D,
4.300%, 4/15/2026 | | | 153,086 | |
| | 100,000 | | | Drive Auto Receivables Trust,
Series 2019-1, Class D,
4.090%, 6/15/2026 | | | 104,747 | |
| | 315,000 | | | Exeter Automobile Receivables Trust,
Series 2019-4A, Class D,
2.580%, 9/15/2025, 144A | | | 323,955 | |
| | 450,000 | | | Santander Drive Auto Receivables Trust,
Series 2019-2, Class D,
3.220%, 7/15/2025 | | | 467,970 | |
| | 125,000 | | | Westlake Automobile Receivables Trust,
Series 2020-3A, Class D,
1.650%, 2/17/2026, 144A | | | 126,492 | |
| | | | | | | | |
| | | | | | | 1,581,756 | |
| | | | | | | | |
| |
| | | | ABS Home Equity – 0.2% | |
| | 234,496 | | | Credit Suisse Mortgage Trust,
Series 2018-RPL8, Class A1, 4.125%, 7/25/2058, 144A(a) | | | 235,383 | |
| | 346,613 | | | Legacy Mortgage Asset Trust, Series 2018-GS2, Class A1,
4.000%, 4/25/2058, 144A(a) | | | 348,861 | |
| | 10,839 | | | Morgan Stanley Mortgage Loan Trust, Series 2005-3AR, Class 5A,
2.713%, 7/25/2035(a)(b)(c) | | | 9,201 | |
| | | | | | | | |
| | | | | | | 593,445 | |
| | | | | | | | |
| |
| | | | ABS Other – 1.1% | |
| | 2,090,502 | | | FAN Engine Securitization Ltd., Series 2013-1A, Class 1A,
4.625%, 10/15/2043, 144A(b)(d)(e) | | | 1,149,776 | |
| | 150,000 | | | HPEFS Equipment Trust,
Series 2019-1A, Class C,
2.490%, 9/20/2029, 144A | | | 152,947 | |
| | 200,177 | | | S-Jets Ltd., Series 2017-1, Class A, 3.967%, 8/15/2042, 144A | | | 194,240 | |
| | 1,000,000 | | | SoFi Consumer Loan Program Trust, Series 2019-3, Class C,
3.350%, 5/25/2028, 144A | | | 1,034,859 | |
| | 110,000 | | | SoFi Consumer Loan Program Trust, Series 2019-4, Class C,
2.840%, 8/25/2028, 144A | | | 113,049 | |
| | | | | | | | |
| | | | | | | 2,644,871 | |
| | | | | | | | |
| |
| | | | ABS Student Loan – 0.0% | |
| | 90,286 | | | Earnest Student Loan Program LLC, Series 2017-A, Class A2,
2.650%, 1/25/2041, 144A | | | 91,542 | |
| | | | | | | | |
| |
| | | | Aerospace & Defense – 2.5% | |
| | 85,000 | | | Boeing Co. (The), 3.100%, 5/01/2026 | | | 91,018 | |
| | 15,000 | | | Boeing Co. (The), 3.250%, 2/01/2035 | | | 15,383 | |
| | 100,000 | | | Boeing Co. (The), 3.550%, 3/01/2038 | | | 102,019 | |
| | 115,000 | | | Boeing Co. (The), 3.600%, 5/01/2034 | | | 121,088 | |
| |
| | | | Aerospace & Defense – continued | |
| 510,000 | | | Boeing Co. (The), 3.625%, 2/01/2031 | | | 558,134 | |
| | 85,000 | | | Boeing Co. (The), 3.625%, 3/01/2048 | | | 85,702 | |
| | 65,000 | | | Boeing Co. (The), 3.650%, 3/01/2047 | | | 65,795 | |
| | 50,000 | | | Boeing Co. (The), 3.750%, 2/01/2050 | | | 52,290 | |
| | 390,000 | | | Boeing Co. (The), 3.850%, 11/01/2048 | | | 402,269 | |
| | 705,000 | | | Boeing Co. (The), 3.950%, 8/01/2059 | | | 754,531 | |
| | 160,000 | | | Boeing Co. (The), 5.150%, 5/01/2030 | | | 193,640 | |
| | 1,055,000 | | | Boeing Co. (The), 5.805%, 5/01/2050 | | | 1,453,943 | |
| | 490,000 | | | Boeing Co. (The), 5.930%, 5/01/2060 | | | 695,111 | |
| | 376,000 | | | Embraer Netherlands Finance BV,
5.400%, 2/01/2027 | | | 399,504 | |
| | 1,125,000 | | | Textron, Inc., 3.000%, 6/01/2030 | | | 1,212,693 | |
| | 195,000 | | | TransDigm, Inc., 8.000%, 12/15/2025, 144A | | | 215,534 | |
| | | | | | | | |
| | | | | | | 6,418,654 | |
| | | | | | | | |
| |
| | | | Airlines – 2.2% | |
| | 137,742 | | | Air Canada Pass Through Trust,
Series 2013-1, Class B,
5.375%, 11/15/2022, 144A | | | 137,443 | |
| | 1,490,000 | | | Air Canada Pass Through Trust, Series 2020-2A, 5.250%, 10/01/2030, 144A | | | 1,577,895 | |
| | 1,535,000 | | | American Airlines Group, Inc., 5.000%, 6/01/2022, 144A | | | 1,379,980 | |
| | 55,114 | | | American Airlines Pass Through Certificates, Series 2016-3, Class B, 3.750%, 4/15/2027 | | | 44,340 | |
| | 11,749 | | | Continental Airlines Pass Through Certificates, Series 2000-2, Class A-1, 7.707%, 10/02/2022 | | | 11,704 | |
| | 338,242 | | | Continental Airlines Pass Through Certificates, Series 2007-1, Class A, 5.983%, 10/19/2023 | | | 342,247 | |
| | 288,401 | | | Delta Air Lines Pass Through Trust, Series 2007-1, Class B, 8.021%, 2/10/2024 | | | 281,730 | |
| | 455,000 | | | Mileage Plus Holdings LLC/Mileage Plus Intellectual Property Assets Ltd., 6.500%, 6/20/2027, 144A | | | 489,125 | |
| | 221,506 | | | U.S. Airways Pass Through Trust, Series 2011-1, Class A, 7.125%, 4/22/2025 | | | 203,508 | |
| | 466,775 | | | U.S. Airways Pass Through Trust, Series 2012-2A, Class A, 4.625%, 12/03/2026 | | | 416,030 | |
| | 260,069 | | | United Airlines Pass Through Trust, Series 2016-2, Class B, 3.650%, 4/07/2027 | | | 251,612 | |
| | 500,000 | | | United Airlines Pass Through Trust, Series 2020-1, Class A, 5.875%, 4/15/2029 | | | 539,440 | |
| | | | | | | | |
| | | | | | | 5,675,054 | |
| | | | | | | | |
| |
| | | | Automotive – 2.6% | |
| | 659,000 | | | Cummins, Inc., 5.650%, 3/01/2098 | | | 968,433 | |
| | 869,000 | | | General Motors Co., 5.200%, 4/01/2045 | | | 1,055,337 | |
| | 250,000 | | | General Motors Co., 6.250%, 10/02/2043 | | | 337,242 | |
| | 1,625,000 | | | General Motors Financial Co., Inc., 3.600%, 6/21/2030 | | | 1,811,849 | |
| | 2,490,000 | | | Volkswagen Group of America Finance LLC, 0.875%, 11/22/2023, 144A | | | 2,504,027 | |
| | | | | | | | |
| | | | | | | 6,676,888 | |
| | | | | | | | |
See accompanying notes to financial statements.
19 |
Portfolio of Investments – as of December 31, 2020
Loomis Sayles Investment Grade Fixed Income Fund – continued
| | | | | | | | |
Principal
Amount (‡) | | | Description | | Value (†) | |
|
| | Bonds and Notes – continued | |
| |
| | | | Banking – 9.9% | |
| $ | 2,255,000 | | | Ally Financial, Inc., 4.125%, 2/13/2022 | | $ | 2,341,788 | |
| | 420,000 | | | Banco Santander Mexico S.A. Institucion de Banca Multiple Grupo Financiero Santander, 5.375%, 4/17/2025, 144A | | | 482,521 | |
| | 370,000 | | | Bank of America Corp., (fixed rate to 10/24/2030, variable rate thereafter), MTN, 1.922%, 10/24/2031 | | | 374,892 | |
| | 635,000 | | | Bank of America Corp., (fixed rate to 12/20/2022, variable rate thereafter),
3.004%, 12/20/2023 | | | 668,344 | |
| | 1,244,000 | | | Bank of America Corp., (fixed rate to 12/20/2027, variable rate thereafter),
3.419%, 12/20/2028 | | | 1,405,153 | |
| | 335,000 | | | Bank of America Corp., (fixed rate to 4/29/2030, variable rate thereafter),
2.592%, 4/29/2031 | | | 359,039 | |
| | 235,000 | | | Bank of America Corp., (fixed rate to 7/23/2030, variable rate thereafter), MTN, 1.898%, 7/23/2031 | | | 237,430 | |
| | 314,000 | | | Bank of America Corp., MTN,
4.250%, 10/22/2026 | | | 368,312 | |
| | 536,000 | | | Bank of America Corp., Series L, MTN, 4.183%, 11/25/2027 | | | 621,806 | |
| | 1,245,000 | | | Barclays PLC, (fixed rate to 9/23/2030, variable rate thereafter), 3.564%, 9/23/2035 | | | 1,349,007 | |
| | 1,040,000 | | | BNP Paribas S.A., (fixed rate to 3/01/2028, variable rate thereafter),
4.375%, 3/01/2033, 144A | | | 1,191,611 | |
| | 1,060,000 | | | Citigroup, Inc., (fixed rate to 3/31/2030, variable rate thereafter), 4.412%, 3/31/2031 | | | 1,285,417 | |
| | 80,000 | | | Citigroup, Inc., (fixed rate to 6/03/2030, variable rate thereafter), 2.572%, 6/03/2031 | | | 85,269 | |
| | 3,224,000 | | | JPMorgan Chase & Co., 4.125%, 12/15/2026 | | | 3,769,062 | |
| | 220,000 | | | JPMorgan Chase & Co., (fixed rate to 10/15/2029, variable rate thereafter), 2.739%, 10/15/2030 | | | 239,213 | |
| | 740,000 | | | JPMorgan Chase & Co., (fixed rate to 11/19/2030, variable rate thereafter), 1.764%, 11/19/2031 | | | 747,020 | |
| | 482,000 | | | Morgan Stanley, 3.950%, 4/23/2027 | | | 557,264 | |
| | 659,000 | | | Morgan Stanley, 5.750%, 1/25/2021 | | | 660,966 | |
| | 1,205,000 | | | Morgan Stanley, (fixed rate to 2/13/2031, variable rate thereafter), MTN, 1.794%, 2/13/2032 | | | 1,213,616 | |
| | 953,000 | | | Morgan Stanley, GMTN, 4.350%, 9/08/2026 | | | 1,123,576 | |
| | 1,727,000 | | | Morgan Stanley, MTN, 6.250%, 8/09/2026 | | | 2,203,481 | |
| | 710,000 | | | Natwest Group PLC, 6.000%, 12/19/2023 | | | 811,434 | |
| | 595,000 | | | Natwest Group PLC, (fixed rate to 8/28/2030, variable rate thereafter), 3.032%, 11/28/2035 | | | 614,617 | |
| | 1,685,000 | | | Societe Generale S.A., (fixed rate to 7/08/2030, variable rate thereafter), 3.653%, 7/08/2035, 144A | | | 1,824,671 | |
| |
| | | | Banking – continued | |
| 540,000 | | | UniCredit SpA, (fixed rate to 6/30/2030, variable rate thereafter), 5.459%, 6/30/2035, 144A | | | 594,182 | |
| | | | | | | | |
| | | | | | | 25,129,691 | |
| | | | | | | | |
| |
| | | | Brokerage – 1.7% | |
| | 2,528,000 | | | Jefferies Group LLC, 5.125%, 1/20/2023 | | | 2,761,675 | |
| | 733,000 | | | Jefferies Group LLC, 6.250%, 1/15/2036 | | | 977,577 | |
| | 343,000 | | | Jefferies Group LLC, 6.450%, 6/08/2027 | | | 434,834 | |
| | | | | | | | |
| | | | | | | 4,174,086 | |
| | | | | | | | |
| |
| | | | Building Materials – 0.6% | |
| | 211,000 | | | Masco Corp., 6.500%, 8/15/2032 | | | 281,722 | |
| | 104,000 | | | Masco Corp., 7.750%, 8/01/2029 | | | 144,566 | |
| | 778,000 | | | Owens Corning, 7.000%, 12/01/2036 | | | 1,109,236 | |
| | | | | | | | |
| | | | | | | 1,535,524 | |
| | | | | | | | |
| |
| | | | Cable Satellite – 1.5% | |
| | 565,000 | | | CCO Holdings LLC/CCO Holdings Capital Corp., 4.500%, 5/01/2032, 144A | | | 603,262 | |
| | 165,000 | | | Charter Communications Operating LLC/Charter Communications Operating Capital Corp., 2.800%, 4/01/2031 | | | 174,517 | |
| | 2,430,000 | | | Charter Communications Operating LLC/Charter Communications Operating Capital Corp., 3.700%, 4/01/2051 | | | 2,523,445 | |
| | 165,000 | | | Charter Communications Operating LLC/Charter Communications Operating Capital Corp., 5.125%, 7/01/2049 | | | 201,385 | |
| | 12,000 | | | Cox Communications, Inc., 4.800%, 2/01/2035, 144A | | | 15,176 | |
| | 145,000 | | | Time Warner Cable LLC, 5.500%, 9/01/2041 | | | 186,303 | |
| | | | | | | | |
| | | | | | | 3,704,088 | |
| | | | | | | | |
| |
| | | | Collateralized Mortgage Obligations – 0.1% | |
| | 221,491 | | | Federal Home Loan Mortgage Corp., REMIC, Series 2912, Class EH, 5.500%, 1/15/2035 | | | 259,609 | |
| | | | | | | | |
| |
| | | | Consumer Cyclical Services – 0.3% | |
| | 175,000 | | | Expedia Group, Inc., 3.250%, 2/15/2030 | | | 182,130 | |
| | 560,000 | | | Expedia Group, Inc., 3.800%, 2/15/2028 | | | 601,514 | |
| | 25,000 | | | Uber Technologies, Inc., 6.250%, 1/15/2028, 144A | | | 27,188 | |
| | 35,000 | | | Uber Technologies, Inc., 7.500%, 9/15/2027, 144A | | | 38,500 | |
| | | | | | | | |
| | | | | | | 849,332 | |
| | | | | | | | |
| |
| | | | Consumer Products – 0.6% | |
| | 360,000 | | | Hasbro, Inc., 6.600%, 7/15/2028 | | | 450,882 | |
| | 805,000 | | | Whirlpool Corp., 4.600%, 5/15/2050 | | | 1,041,618 | |
| | | | | | | | |
| | | | | | | 1,492,500 | |
| | | | | | | | |
| |
| | | | Diversified Manufacturing – 0.1% | |
| | 224,000 | | | General Electric Co., Series A, MTN, 3-month LIBOR + 0.300%, 0.537%, 5/13/2024(f) | | | 216,935 | |
| | | | | | | | |
See accompanying notes to financial statements.
| 20
Portfolio of Investments – as of December 31, 2020
Loomis Sayles Investment Grade Fixed Income Fund – continued
| | | | | | | | |
Principal
Amount (‡) | | | Description | | Value (†) | |
|
| | Bonds and Notes – continued | |
| |
| | | | Electric – 1.5% | |
| $ | 605,000 | | | Calpine Corp., 3.750%, 3/01/2031, 144A | | $ | 599,150 | |
| | 95,000 | | | Edison International, 4.950%, 4/15/2025 | | | 108,136 | |
| | 1,037,000 | | | Enel Finance International NV, 6.000%, 10/07/2039, 144A | | | 1,479,569 | |
| | 416,000 | | | Enel Finance International NV, 6.800%, 9/15/2037, 144A | | | 612,222 | |
| | 175,000 | | | Pacific Gas & Electric Co., 3.500%, 8/01/2050 | | | 173,934 | |
| | 225,000 | | | Pacific Gas & Electric Co., 4.250%, 3/15/2046 | | | 241,547 | |
| | 290,000 | | | Pacific Gas & Electric Co., 4.300%, 3/15/2045 | | | 309,187 | |
| | 310,000 | | | Pacific Gas & Electric Co., 4.750%, 2/15/2044 | | | 348,289 | |
| | | | | | | | |
| | | | | | | 3,872,034 | |
| | | | | | | | |
| |
| | | | Finance Companies – 4.6% | |
| | 185,000 | | | Air Lease Corp., 3.125%, 12/01/2030 | | | 192,581 | |
| | 2,435,000 | | | GE Capital Funding LLC, 4.550%, 5/15/2032, 144A | | | 2,922,288 | |
| | 445,000 | | | GE Capital International Funding Co. Unlimited Co., 4.418%, 11/15/2035 | | | 531,128 | |
| | 15,000 | | | Navient Corp., 5.000%, 3/15/2027 | | | 15,131 | |
| | 3,370,000 | | | Navient Corp., 5.500%, 1/25/2023 | | | 3,521,650 | |
| | 95,000 | | | Navient Corp., 5.875%, 10/25/2024 | | | 100,938 | |
| | 110,000 | | | Navient Corp., 6.750%, 6/15/2026 | | | 119,487 | |
| | 891,000 | | | Navient Corp., MTN, 5.625%, 8/01/2033 | | | 855,360 | |
| | 691,000 | | | Navient Corp., MTN, 6.125%, 3/25/2024 | | | 737,642 | |
| | 398,000 | | | Navient Corp., MTN, 7.250%, 1/25/2022 | | | 415,910 | |
| | 1,920,000 | | | Owl Rock Capital Corp., 4.250%, 1/15/2026 | | | 2,022,391 | |
| | 25,000 | | | Quicken Loans LLC/Quicken Loans Co-Issuer, Inc., 3.625%, 3/01/2029, 144A | | | 25,500 | |
| | 80,000 | | | Quicken Loans LLC/Quicken Loans Co-Issuer, Inc., 3.875%, 3/01/2031, 144A | | | 83,000 | |
| | | | | | | | |
| | | | | | | 11,543,006 | |
| | | | | | | | |
| |
| | | | Financial Other – 0.0% | |
| | 30,000 | | | Icahn Enterprises LP/Icahn Enterprises Finance Corp., 5.250%, 5/15/2027 | | | 32,160 | |
| | | | | | | | |
| |
| | | | Food & Beverage – 2.1% | |
| | 990,000 | | | Anheuser-Busch InBev Worldwide, Inc.,
4.500%, 6/01/2050 | | | 1,249,637 | |
| | 1,066,000 | | | Fomento Economico Mexicano SAB de CV, 3.500%, 1/16/2050 | | | 1,186,239 | |
| | 360,000 | | | Kraft Heinz Foods Co., 4.375%, 6/01/2046 | | | 387,961 | |
| | 2,515,000 | | | Nestle Holdings, Inc., 0.375%, 1/15/2024, 144A | | | 2,517,535 | |
| | | | | | | | |
| | | | | | | 5,341,372 | |
| | | | | | | | |
| |
| | | | Government Owned – No Guarantee – 0.6% | |
| | 780,000 | | | Pertamina Persero PT, 6.450%, 5/30/2044, 144A | | | 1,056,965 | |
| |
| | | | Government Owned – No Guarantee – continued | |
| 400,000 | | | Saudi Arabian Oil Co., 3.250%, 11/24/2050, 144A | | | 405,627 | |
| | | | | | | | |
| | | | | | | 1,462,592 | |
| | | | | | | | |
| |
| | | | Government Sponsored – 0.4% | |
| | 670,000 | | | Petrobras Global Finance BV, 6.750%, 6/03/2050 | | | 832,475 | |
| | 100,000 | | | Petrobras Global Finance BV, 6.900%, 3/19/2049 | | | 126,750 | |
| | | | | | | | |
| | | | | | | 959,225 | |
| | | | | | | | |
| |
| | | | Healthcare – 1.4% | |
| | 10,000 | | | Cigna Corp., 7.875%, 5/15/2027 | | | 13,604 | |
| | 1,192,000 | | | HCA, Inc., 4.500%, 2/15/2027 | | | 1,386,537 | |
| | 1,430,000 | | | HCA, Inc., 5.250%, 6/15/2049 | | �� | 1,888,738 | |
| | 182,000 | | | HCA, Inc., MTN, 7.750%, 7/15/2036 | | | 235,235 | |
| | | | | | | | |
| | | | | | | 3,524,114 | |
| | | | | | | | |
| |
| | | | Home Construction – 1.6% | |
| | 110,000 | | | MDC Holdings, Inc., 6.000%, 1/15/2043 | | | 147,460 | |
| | 1,989,000 | | | PulteGroup, Inc., 6.000%, 2/15/2035 | | | 2,704,443 | |
| | 867,000 | | | PulteGroup, Inc., 6.375%, 5/15/2033 | | | 1,187,877 | |
| | | | | | | | |
| | | | | | | 4,039,780 | |
| | | | | | | | |
| |
| | | | Hybrid ARMs – 0.0% | |
| | 4,021 | | | FNMA, 6-month LIBOR + 1.460%, 1.963%, 2/01/2037(f) | | | 4,139 | |
| | 8,687 | | | FNMA, 12-month LIBOR + 1.838%, 2.596%, 9/01/2036(f) | | | 9,132 | |
| | | | | | | | |
| | | | | | | 13,271 | |
| | | | | | | | |
| |
| | | | Independent Energy – 1.0% | |
| | 605,000 | | | Chesapeake Energy Corp.,
8.000%, 6/15/2027(d)(e)(g) | | | 27,225 | |
| | 353,000 | | | Continental Resources, Inc., 3.800%, 6/01/2024 | | | 364,511 | |
| | 13,000 | | | Continental Resources, Inc., 4.500%, 4/15/2023 | | | 13,404 | |
| | 455,000 | | | Hess Corp., 5.600%, 2/15/2041 | | | 555,263 | |
| | 40,000 | | | Leviathan Bond Ltd., 6.125%, 6/30/2025, 144A | | | 43,809 | |
| | 1,416,000 | | | Noble Energy, Inc., 3.900%, 11/15/2024 | | | 1,580,151 | |
| | | | | | | | |
| | | | | | | 2,584,363 | |
| | | | | | | | |
| |
| | | | Integrated Energy – 0.2% | |
| | 500,000 | | | Reliance Industries Ltd., 5.400%, 2/14/2022, 144A | | | 523,503 | |
| | | | | | | | |
| |
| | | | Life Insurance – 2.6% | |
| | 39,000 | | | American International Group, Inc., 4.125%, 2/15/2024 | | | 43,149 | |
| | 56,000 | | | American International Group, Inc., 4.875%, 6/01/2022 | | | 59,414 | |
| | 205,000 | | | Brighthouse Financial, Inc., 4.700%, 6/22/2047 | | | 214,070 | |
| | 1,402,000 | | | Global Atlantic Fin Co., 8.625%, 4/15/2021, 144A | | | 1,425,586 | |
| | 1,488,000 | | | National Life Insurance Co., 10.500%, 9/15/2039, 144A(d)(e) | | | 2,562,113 | |
| | 1,560,000 | | | NLV Financial Corp., 7.500%, 8/15/2033, 144A(d)(e) | | | 2,148,401 | |
| | | | | | | | |
| | | | | | | 6,452,733 | |
| | | | | | | | |
See accompanying notes to financial statements.
21 |
Portfolio of Investments – as of December 31, 2020
Loomis Sayles Investment Grade Fixed Income Fund – continued
| | | | | | | | |
Principal
Amount (‡) | | | Description | | Value (†) | |
|
| | Bonds and Notes – continued | |
| |
| | | | Media Entertainment – 1.2% | |
| $ | 1,170,000 | | | Discovery Communications LLC, 3.950%, 3/20/2028 | | $ | 1,342,909 | |
| | 225,000 | | | iHeartCommunications, Inc., 8.375%, 5/01/2027 | | | 240,179 | |
| | 205,000 | | | Netflix, Inc., 4.875%, 6/15/2030, 144A | | | 235,750 | |
| | 39,000 | | | ViacomCBS, Inc., 4.375%, 3/15/2043 | | | 46,077 | |
| | 663,000 | | | ViacomCBS, Inc., 5.250%, 4/01/2044 | | | 863,591 | |
| | 239,000 | | | ViacomCBS, Inc., 5.850%, 9/01/2043 | | | 332,453 | |
| | | | | | | | |
| | | | | | | 3,060,959 | |
| | | | | | | | |
| |
| | | | Metals & Mining – 0.6% | |
| | 178,000 | | | ArcelorMittal S.A., 7.000%, 3/01/2041 | | | 245,298 | |
| | 304,000 | | | ArcelorMittal S.A., 7.250%, 10/15/2039 | | | 426,549 | |
| | 480,000 | | | Freeport-McMoRan, Inc., 5.400%, 11/14/2034 | | | 600,600 | |
| | 155,000 | | | Glencore Funding LLC, 2.500%, 9/01/2030, 144A | | | 158,419 | |
| | | | | | | | |
| | | | | | | 1,430,866 | |
| | | | | | | | |
| |
| | | | Midstream – 2.5% | |
| | 125,000 | | | DCP Midstream Operating LP, 6.450%, 11/03/2036, 144A | | | 135,000 | |
| | 588,000 | | | Enable Midstream Partners LP, 5.000%, 5/15/2044 | | | 560,035 | |
| | 404,000 | | | Enbridge Energy Partners LP, 7.375%, 10/15/2045 | | | 616,497 | |
| | 735,000 | | | EnLink Midstream Partners LP, 5.450%, 6/01/2047 | | | 591,874 | |
| | 2,949,000 | | | ONEOK Partners LP, 4.900%, 3/15/2025 | | | 3,354,126 | |
| | 43,000 | | | ONEOK Partners LP, 6.200%, 9/15/2043 | | | 52,220 | |
| | 27,000 | | | Plains All American Pipeline LP/PAA Finance Corp., 2.850%, 1/31/2023 | | | 27,959 | |
| | 10,000 | | | Plains All American Pipeline LP/PAA Finance Corp., 4.300%, 1/31/2043 | | | 9,839 | |
| | 390,000 | | | Plains All American Pipeline LP/PAA Finance Corp., 4.700%, 6/15/2044 | | | 404,395 | |
| | 45,000 | | | Plains All American Pipeline LP/PAA Finance Corp., 4.900%, 2/15/2045 | | | 47,758 | |
| | 392,000 | | | Williams Cos., Inc. (The), 3.350%, 8/15/2022 | | | 407,693 | |
| | | | | | | | |
| | | | | | | 6,207,396 | |
| | | | | | | | |
| |
| | | | Non-Agency Commercial Mortgage-Backed Securities – 0.4% | |
| | 13,664 | | | Commercial Mortgage Pass Through Certificates, Series 2014-UBS4, Class A2, 2.963%, 8/10/2047 | | | 13,716 | |
| | 65,000 | | | GS Mortgage Securities Trust, Series 2014-GC18, Class B, 4.885%, 1/10/2047(a) | | | 62,966 | |
| | 55,000 | | | Morgan Stanley Bank of America Merrill Lynch Trust, Series 2013-C12, Class C, 4.763%, 10/15/2046(a) | | | 49,219 | |
| | 165,000 | | | Morgan Stanley Capital I Trust, Series 2011-C2, Class B, 5.200%, 6/15/2044, 144A(a) | | | 164,565 | |
| | 94,890 | | | WFRBS Commercial Mortgage Trust, Series 2011-C3, Class D, 5.642%, 3/15/2044, 144A(a) | | | 44,248 | |
| |
| | | | Non-Agency Commercial Mortgage-Backed Securities – continued | |
| 655,000 | | | WFRBS Commercial Mortgage Trust, Series 2014-C24, Class B, 4.204%, 11/15/2047(a) | | | 652,324 | |
| | | | | | | | |
| | | | | | | 987,038 | |
| | | | | | | | |
| |
| | | | Oil Field Services – 0.1% | |
| | 680,000 | | | Transocean, Inc., 6.800%, 3/15/2038 | | | 227,800 | |
| | 110,000 | | | Transocean, Inc., 7.500%, 4/15/2031 | | | 38,225 | |
| | | | | | | | |
| | | | | | | 266,025 | |
| | | | | | | | |
| |
| | | | Paper – 0.4% | |
| | 552,000 | | | Georgia-Pacific LLC, 7.250%, 6/01/2028 | | | 749,984 | |
| | 137,000 | | | WestRock MWV LLC, 7.550%, 3/01/2047(d)(e) | | | 194,182 | |
| | 104,000 | | | WestRock MWV LLC, 8.200%, 1/15/2030 | | | 148,209 | |
| | | | | | | | |
| | | | | | | 1,092,375 | |
| | | | | | | | |
| |
| | | | Pharmaceuticals – 1.0% | |
| | 2,225,000 | | | Viatris, Inc., 4.000%, 6/22/2050, 144A | | | 2,549,156 | |
| | | | | | | | |
| |
| | | | Property & Casualty Insurance – 1.9% | |
| | 87,000 | | | MBIA Insurance Corp., 3-month LIBOR + 11.260%, 11.497%, 1/15/2033, 144A(f)(h) | | | 30,450 | |
| | 2,715,000 | | | Nationwide Mutual Insurance Co., 4.350%, 4/30/2050, 144A | | | 3,189,370 | |
| | 1,286,000 | | | Old Republic International Corp., 4.875%, 10/01/2024 | | | 1,466,199 | |
| | | | | | | | |
| | | | | | | 4,686,019 | |
| | | | | | | | |
| |
| | | | Retailers – 0.6% | |
| | 1,270,000 | | | AutoZone, Inc., 4.000%, 4/15/2030 | | | 1,504,582 | |
| | | | | | | | |
| |
| | | | Sovereigns – 1.7% | |
| | 835,000 | | | Mexico Government International Bond, 3.771%, 5/24/2061 | | | 872,750 | |
| | 1,452,000 | | | U.S. Department of Housing and Urban Development, Series A, 2.350%, 8/01/2021 | | | 1,470,179 | |
| | 1,760,000 | | | U.S. Department of Housing and Urban Development, Series A, 2.450%, 8/01/2022 | | | 1,822,463 | |
| | | | | | | | |
| | | | | | | 4,165,392 | |
| | | | | | | | |
| |
| | | | Supermarkets – 0.0% | |
| | 39,000 | | | Koninklijke Ahold Delhaize NV, 5.700%, 10/01/2040 | | | 55,875 | |
| | | | | | | | |
| |
| | | | Technology – 3.1% | |
| | 1,065,000 | | | Avnet, Inc., 4.625%, 4/15/2026 | | | 1,205,493 | |
| | 220,000 | | | Broadcom, Inc., 4.150%, 11/15/2030 | | | 254,708 | |
| | 915,000 | | | Broadcom, Inc., 4.300%, 11/15/2032 | | | 1,084,722 | |
| | 390,000 | | | Broadcom, Inc., 5.000%, 4/15/2030 | | | 474,089 | |
| | 155,000 | | | CommScope Technologies LLC, 5.000%, 3/15/2027, 144A | | | 152,675 | |
| | 1,175,000 | | | Equinix, Inc., 2.150%, 7/15/2030 | | | 1,195,151 | |
| | 375,000 | | | Jabil, Inc., 3.600%, 1/15/2030 | | | 417,306 | |
| | 330,000 | | | Jabil, Inc., 3.950%, 1/12/2028 | | | 373,205 | |
| | 776,000 | | | KLA Corp., 5.650%, 11/01/2034 | | | 1,046,296 | |
See accompanying notes to financial statements.
| 22
Portfolio of Investments – as of December 31, 2020
Loomis Sayles Investment Grade Fixed Income Fund – continued
| | | | | | | | |
Principal
Amount (‡) | | | Description | | Value (†) | |
|
| | Bonds and Notes – continued | |
| |
| | | | Technology – continued | |
| $ | 1,050,000 | | | Microchip Technology, Inc., 0.972%, 2/15/2024, 144A | | $ | 1,052,570 | |
| | 120,000 | | | Micron Technology, Inc., 4.663%, 2/15/2030 | | | 147,258 | |
| | 155,000 | | | Micron Technology, Inc., 5.327%, 2/06/2029 | | | 193,887 | |
| | 133,000 | | | Samsung Electronics Co. Ltd., 7.700%, 10/01/2027, 144A | | | 161,018 | |
| | | | | | | | |
| | | | | | | 7,758,378 | |
| | | | | | | | |
| |
| | | | Transportation Services – 0.4% | |
| | 210,000 | | | Adani Ports & Special Economic Zone Ltd., 4.200%, 8/04/2027, 144A | | | 225,368 | |
| | 562,000 | | | ERAC USA Finance LLC, 6.700%, 6/01/2034, 144A | | | 832,702 | |
| | | | | | | | |
| | | | | | | 1,058,070 | |
| | | | | | | | |
| |
| | | | Treasuries – 25.1% | |
| | 14,915,000 | | | U.S. Treasury Bond, 1.250%, 5/15/2050 | | | 13,530,701 | |
| | 9,285,000 | | | U.S. Treasury Bond, 1.375%, 8/15/2050 | | | 8,695,983 | |
| | 2,105,000 | | | U.S. Treasury Bond, 3.000%, 8/15/2048 | | | 2,769,144 | |
| | 11,335,000 | | | U.S. Treasury Note, 0.125%, 11/30/2022 | | | 11,336,328 | |
| | 5,045,000 | | | U.S. Treasury Note, 0.125%, 12/31/2022 | | | 5,045,591 | |
| | 5,490,000 | | | U.S. Treasury Note, 1.500%, 9/30/2021 | | | 5,546,616 | |
| | 2,835,000 | | | U.S. Treasury Note, 1.500%, 10/31/2021 | | | 2,867,337 | |
| | 13,460,000 | | | U.S. Treasury Note, 1.500%, 11/30/2021 | | | 13,628,250 | |
| | | | | | | | |
| | | | | | | 63,419,950 | |
| | | | | | | | |
| |
| | | | Wireless – 2.1% | |
| | 1,250,000 | | | American Tower Corp., 1.875%, 10/15/2030 | | | 1,260,902 | |
| | 50,000 | | | American Tower Corp., 2.100%, 6/15/2030 | | | 51,320 | |
| | 75,000 | | | American Tower Corp., 2.950%, 1/15/2051 | | | 75,179 | |
| | 310,000 | | | American Tower Corp., 3.100%, 6/15/2050 | | | 319,309 | |
| | 1,415,000 | | | Crown Castle International Corp., 2.250%, 1/15/2031 | | | 1,467,834 | |
| | 265,000 | | | Crown Castle International Corp., 3.250%, 1/15/2051 | | | 279,601 | |
| | 55,000 | | | Crown Castle International Corp., 3.300%, 7/01/2030 | | | 61,560 | |
| | 395,000 | | | Crown Castle International Corp., 4.150%, 7/01/2050 | | | 478,677 | |
| | 1,050,000 | | | T-Mobile USA, Inc., 3.875%, 4/15/2030, 144A | | | 1,216,110 | |
| | | | | | | | |
| | | | | | | 5,210,492 | |
| | | | | | | | |
| |
| | | | Wirelines – 4.5% | |
| | 1,248,000 | | | AT&T, Inc., 3.650%, 9/15/2059, 144A | | | 1,260,153 | |
| | 371,000 | | | AT&T, Inc., 3.800%, 12/01/2057, 144A | | | 387,672 | |
| | 2,841,000 | | | AT&T, Inc., 4.300%, 2/15/2030 | | | 3,393,681 | |
| |
| | | | Wirelines – continued | |
| 201,000 | | | Telecom Italia Capital S.A., 6.000%, 9/30/2034 | | | 244,836 | |
| | 5,077,000 | | | Verizon Communications, Inc., 4.329%, 9/21/2028 | | | 6,104,179 | |
| | | | | | | | |
| | | | | | | 11,390,521 | |
| | | | | | | | |
| | |
| | | | Total Non-Convertible Bonds | | | | |
| | |
| | | | (Identified Cost $201,658,434) | | | 216,235,222 | |
| | | | | | | | |
| |
| | Convertible Bonds – 1.8% | | | | |
| | |
| | | | Airlines – 0.1% | | | | |
| | 115,000 | | | Southwest Airlines Co., 1.250%, 5/01/2025 | | | 167,038 | |
| | | | | | | | |
| | |
| | | | Cable Satellite – 0.3% | | | | |
| | 835,000 | | | DISH Network Corp., 3.375%, 8/15/2026 | | | 795,948 | |
| | | | | | | | |
| |
| | | | Consumer Cyclical Services – 0.1% | |
| | 155,000 | | | Uber Technologies, Inc., Zero Coupon, 12/15/2025, 144A | | | 158,571 | |
| | | | | | | | |
| |
| | | | Energy – 0.0% | |
| | 1,035,000 | | | Chesapeake Energy Corp., 5.500%, 9/15/2026(d)(e)(g) | | | 46,575 | |
| | | | | | | | |
| |
| | | | Healthcare – 0.0% | |
| | 45,000 | | | Teladoc Health, Inc., 1.250%, 6/01/2027, 144A | | | 53,897 | |
| | | | | | | | |
| |
| | | | Pharmaceuticals – 0.1% | |
| | 120,000 | | | BioMarin Pharmaceutical, Inc., 0.599%, 8/01/2024 | | | 128,771 | |
| | 25,000 | | | BioMarin Pharmaceutical, Inc., 1.250%, 5/15/2027, 144A | | | 26,125 | |
| | 60,000 | | | Neurocrine Biosciences, Inc., 2.250%, 5/15/2024 | | | 82,786 | |
| | | | | | | | |
| | | | | | | 237,682 | |
| | | | | | | | |
| |
| | | | REITs – Diversified – 0.1% | |
| | 264,000 | | | iStar, Inc., 3.125%, 9/15/2022 | | | 310,631 | |
| | | | | | | | |
| |
| | | | Technology – 1.1% | |
| | 2,051,000 | | | Booking Holdings, Inc., 0.900%, 9/15/2021 | | | 2,377,166 | |
| | 224,000 | | | Nuance Communications, Inc., 1.250%, 4/01/2025 | | | 509,938 | |
| | | | | | | | |
| | | | | | | 2,887,104 | |
| | | | | | | | |
| | |
| | | | Total Convertible Bonds | | | | |
| | |
| | | | (Identified Cost $4,601,284) | | | 4,657,446 | |
| | | | | | | | |
|
| | Municipals – 0.5% | |
| |
| | | | Illinois – 0.1% | |
| | 245,000 | | | State of Illinois, 5.100%, 6/01/2033 | | | 263,671 | |
| | | | | | | | |
| |
| | | | Virginia – 0.4% | |
| | 875,000 | | | Tobacco Settlement Financing Corp.,
Series A-1, 6.706%, 6/01/2046 | | | 915,486 | |
| | | | | | | | |
| | |
| | | | Total Municipals | | | | |
| | |
| | | | (Identified Cost $1,067,649) | | | 1,179,157 | |
| | | | | | | | |
| | |
| | | | Total Bonds and Notes | | | | |
| | |
| | | | (Identified Cost $207,327,367) | | | 222,071,825 | |
| | | | | | | | |
See accompanying notes to financial statements.
23 |
Portfolio of Investments – as of December 31, 2020
Loomis Sayles Investment Grade Fixed Income Fund – continued
| | | | | | | | |
Principal
Amount (‡) | | | Description | | Value (†) | |
|
| | Collateralized Loan Obligations – 0.3% | |
| $ | 600,000 | | | Alinea CLO Ltd., Series 2018-1A, Class B, 3-month LIBOR + 1.650%, 1.868%, 7/20/2031, 144A(f) | | $ | 599,320 | |
| | 255,000 | | | Voya CLO Ltd., Series 2018-3A, Class B, 3-month LIBOR + 1.650%, 1.887%, 10/15/2031, 144A(f) | | | 254,999 | |
| | | | | | | | |
| | |
| | | | Total Collateralized Loan Obligations | | | | |
| | |
| | | | (Identified Cost $855,110) | | | 854,319 | |
| | | | | | | | |
| | |
| | Shares | | | | | | | |
|
| | Common Stocks – 6.1% | |
| |
| | | | Aerospace & Defense – 0.0% | |
| | 67 | | | Lockheed Martin Corp. | | | 23,784 | |
| | | | | | | | |
| |
| | | | Air Freight & Logistics – 0.0% | |
| | 142 | | | United Parcel Service, Inc., Class B | | | 23,913 | |
| | | | | | | | |
| |
| | | | Beverages – 0.0% | |
| | 451 | | | Coca-Cola Co. (The) | | | 24,733 | |
| | | | | | | | |
| |
| | | | Capital Markets – 0.1% | |
| | 34 | | | BlackRock, Inc. | | | 24,533 | |
| | 372 | | | Morgan Stanley | | | 25,493 | |
| | | | | | | | |
| | | | | | | 50,026 | |
| | | | | | | | |
| |
| | | | Communications Equipment – 0.0% | |
| | 541 | | | Cisco Systems, Inc. | | | 24,210 | |
| | | | | | | | |
| |
| | | | Diversified Telecommunication Services – 1.0% | |
| | 88,190 | | | AT&T, Inc. | | | 2,536,344 | |
| | | | | | | | |
| |
| | | | Electric Utilities – 0.1% | |
| | 266 | | | Duke Energy Corp. | | | 24,355 | |
| | 329 | | | NextEra Energy, Inc. | | | 25,382 | |
| | | | | | | | |
| | | | | | | 49,737 | |
| | | | | | | | |
| |
| | | | Electronic Equipment, Instruments & Components – 4.5% | |
| | 315,646 | | | Corning, Inc. | | | 11,363,256 | |
| | | | | | | | |
| |
| | | | Food & Staples Retailing – 0.0% | |
| | 162 | | | Walmart, Inc. | | | 23,352 | |
| | | | | | | | |
| |
| | | | Health Care Equipment & Supplies – 0.0% | |
| | 227 | | | Abbott Laboratories | | | 24,854 | |
| | | | | | | | |
| |
| | | | Health Care Providers & Services – 0.0% | |
| | 76 | | | Anthem, Inc. | | | 24,403 | |
| | 70 | | | UnitedHealth Group, Inc. | | | 24,548 | |
| | | | | | | | |
| | | | | | | 48,951 | |
| | | | | | | | |
| |
| | | | Hotels, Restaurants & Leisure – 0.0% | |
| | 237 | | | Starbucks Corp. | | | 25,354 | |
| | | | | | | | |
| |
| | | | Household Products – 0.0% | |
| | 176 | | | Procter & Gamble Co. (The) | | | 24,489 | |
| | | | | | | | |
| |
| | | | Insurance – 0.0% | |
| | 259 | | | Progressive Corp. (The) | | | 25,610 | |
| | | | | | | | |
| |
| | | | IT Services – 0.0% | |
| | 97 | | | Accenture PLC, Class A | | | 25,337 | |
| | 138 | | | Automatic Data Processing, Inc. | | | 24,316 | |
| | | | | | | | |
| | | | | | | 49,653 | |
| | | | | | | | |
| |
| | | | Machinery – 0.0% | |
| | 95 | | | Deere & Co. | | | 25,560 | |
| | | | | | | | |
| |
| | | | Media – 0.0% | |
| | 466 | | | Comcast Corp., Class A | | | 24,418 | |
| | | | | | | | |
| |
| | | | Metals & Mining – 0.0% | |
| | 396 | | | Newmont Corp. | | | 23,716 | |
| | | | | | | | |
| |
| | | | Oil, Gas & Consumable Fuels – 0.0% | |
| | 266 | | | Chevron Corp. | | | 22,464 | |
| | 1,073 | | | Williams Cos., Inc. (The) | | | 21,513 | |
| | | | | | | | |
| | | | | | | 43,977 | |
| | | | | | | | |
| |
| | | | Pharmaceuticals – 0.4% | |
| | 13,089 | | | Bristol-Myers Squibb Co. | | | 811,911 | |
| | 158 | | | Johnson & Johnson | | | 24,866 | |
| | 290 | | | Merck & Co., Inc. | | | 23,722 | |
| | | | | | | | |
| | | | | | | 860,499 | |
| | | | | | | | |
| |
| | | | REITs – Diversified – 0.0% | |
| | 110 | | | American Tower Corp. | | | 24,691 | |
| | | | | | | | |
| |
| | | | Road & Rail – 0.0% | |
| | 117 | | | Union Pacific Corp. | | | 24,362 | |
| | | | | | | | |
| |
| | | | Software – 0.0% | |
| | 112 | | | Microsoft Corp. | | | 24,911 | |
| | | | | | | | |
| |
| | | | Specialty Retail – 0.0% | |
| | 91 | | | Home Depot, Inc. (The) | | | 24,171 | |
| | | | | | | | |
| |
| | | | Technology Hardware, Storage & Peripherals – 0.0% | |
| | 193 | | | Apple, Inc. | | | 25,609 | |
| | | | | | | | |
| | |
| | | | Total Common Stocks | | | | |
| | |
| | | | (Identified Cost $7,963,631) | | | 15,420,180 | |
| | | | | | | | |
|
| | Preferred Stocks – 0.9% | |
|
| | Convertible Preferred Stocks – 0.8% | |
| |
| | | | Banking – 0.4% | |
| | 714 | | | Bank of America Corp., Series L, 7.250% | | | 1,084,266 | |
| | | | | | | | |
| |
| | | | Energy – 0.0% | |
| | 3,453 | | | Chesapeake Energy Corp., 5.000%(b)(c)(d)(h) | | | — | |
| | | | | | | | |
| |
| | | | Food & Beverage – 0.0% | |
| | 281 | | | Bunge Ltd., 4.875% | | | 30,568 | |
| | | | | | | | |
| |
| | | | Healthcare – 0.1% | |
| | 2,268 | | | Boston Scientific Corp., Series A, 5.500% | | | 248,505 | |
| | | | | | | | |
| |
| | | | Midstream – 0.3% | |
| | 12,375 | | | El Paso Energy Capital Trust I, 4.750% | | | 640,530 | |
| | | | | | | | |
| | |
| | | | Total Convertible Preferred Stocks | | | | |
| | |
| | | | (Identified Cost $1,719,345) | | | 2,003,869 | |
| | | | | | | | |
See accompanying notes to financial statements.
| 24
Portfolio of Investments – as of December 31, 2020
Loomis Sayles Investment Grade Fixed Income Fund – continued
| | | | | | | | |
Shares | | | Description | | Value (†) | |
|
| | Preferred Stocks – continued | |
|
| | Non-Convertible Preferred Stocks – 0.1% | |
| |
| | | | Electric – 0.1% | |
| | 213 | | | Connecticut Light & Power Co. (The), Series 1949, 2.200% | | $ | 11,295 | |
| | 1,860 | | | Union Electric Co., 4.500% | | | 195,784 | |
| | | | | | | | |
| | | | | | | 207,079 | |
| | | | | | | | |
| |
| | | | Total Non-Convertible Preferred Stocks | |
| | |
| | | | (Identified Cost $104,765) | | | 207,079 | |
| | | | | | | | |
| | |
| | | | Total Preferred Stocks | | | | |
| | |
| | | | (Identified Cost $1,824,110) | | | 2,210,948 | |
| | | | | | | | |
| | |
| Principal
Amount (‡) |
| | | | | | |
|
| | Short-Term Investments – 4.3% | |
| | |
| | 35,493,709 | | | Central Bank of Iceland, 0.000%, (ISK)(f)(i) | | | 277,772 | |
| | |
| | 5,305,488 | | | Tri-Party Repurchase Agreement with Fixed Income Clearing Corporation, dated 12/31/2020 at 0.000% to be repurchased at $5,305,488 on 1/04/2021 collateralized by $5,411,600 U.S. Treasury Note, 1.250% due 12/31/2022 valued at $5,411,600 including accrued interest (Note 2 of Notes to Financial Statements) | | | 5,305,488 | |
| | |
| | 5,240,000 | | | U.S. Treasury Bills, 0.070%, 3/11/2021(j) | | | 5,239,280 | |
| | | | | | | | |
| | |
| | | | Total Short-Term Investments | | | | |
| | |
| | | | (Identified Cost $10,833,675) | | | 10,822,540 | |
| | | | | | | | |
| | |
| | | | Total Investments – 99.5% | | | | |
| | |
| | | | (Identified Cost $228,803,893) | | | 251,379,812 | |
| | |
| | | | Other assets less liabilities—0.5% | | | 1,310,139 | |
| | | | | | | | |
| | |
| | | | Net Assets – 100.0% | | $ | 252,689,951 | |
| | | | | | | | |
| |
| | (‡) | | | Principal Amount stated in U.S. dollars unless otherwise noted. | |
| |
| | (†) | | | See Note 2 of Notes to Financial Statements. | |
| |
| | (a) | | | Variable rate security. The interest rate adjusts periodically based on; (i) changes in current interest rates and/or prepayments on underlying pools of assets, if applicable, (ii) reference to a base lending rate plus or minus a margin, and/or (iii) reference to a base lending rate adjusted by a multiplier and/or subject to certain floors or caps. Rate as of December 31, 2020 is disclosed. | |
| |
| | (b) | | | Level 3 security. Value has been determined using significant unobservable inputs. See Note 3 of Notes to Financial Statements. | |
| |
| | (c) | | | Fair valued by the Fund’s adviser. At December 31, 2020, the value of these securities amounted to $9,201 or less than 0.1% of net assets. See Note 2 of Notes to Financial Statements. | |
| |
| | (d) | | | Illiquid security. (Unaudited) | |
| |
| | (e) | | | Securities classified as fair valued pursuant to the Fund’s pricing policies and procedures. At December 31, 2020, the value of these securities amounted to $6,128,272 or 2.4% of net assets. See Note 2 of Notes to Financial Statements. | |
| |
| | (f) | | | Variable rate security. Rate as of December 31, 2020 is disclosed. | |
| | (g) | | | The issuer is in default with respect to interest and/or principal payments. Income is not being accrued. |
| |
| | (h) | | | Non-income producing security. |
| |
| | (i) | | | Security callable by issuer at any time. No specified maturity date. |
| |
| | (j) | | | Interest rate represents discount rate at time of purchase; not a coupon rate. |
| |
| | 144A | | | All or a portion of these securities are exempt from registration under Rule 144A of the Securities Act of 1933. These securities may be resold in transactions exempt from registration, normally to qualified institutional buyers. At December 31, 2020, the value of Rule 144A holdings amounted to $44,551,131 or 17.6% of net assets. |
| | ABS | | | Asset-Backed Securities |
| | ARMs | | | Adjustable Rate Mortgages |
| | FNMA | | | Federal National Mortgage Association |
| | GMTN | | | Global Medium Term Note |
| | LIBOR | | | London Interbank Offered Rate |
| | MTN | | | Medium Term Note |
| | REITs | | | Real Estate Investment Trusts |
| | REMIC | | | Real Estate Mortgage Investment Conduit |
| | ISK | | | Icelandic Krona |
Industry Summary at December 31, 2020
| | | | |
Treasuries | | | 25.1 | % |
Banking | | | 10.3 | |
Finance Companies | | | 4.6 | |
Wirelines | | | 4.5 | |
Electronic Equipment, Instruments & Components | | | 4.5 | |
Technology | | | 4.2 | |
Midstream | | | 2.8 | |
Automotive | | | 2.6 | |
Life Insurance | | | 2.6 | |
Aerospace & Defense | | | 2.5 | |
Airlines | | | 2.3 | |
Food & Beverage | | | 2.1 | |
Wireless | | | 2.1 | |
Other Investments, less than 2% each | | | 24.7 | |
Short-Term Investments | | | 4.3 | |
Collateralized Loan Obligations | | | 0.3 | |
| | | | |
Total Investments | | | 99.5 | |
Other assets less liabilities | | | 0.5 | |
| | | | |
Net Assets | | | 100.0 | % |
| | | | |
See accompanying notes to financial statements.
25 |
Statements of Assets and Liabilities
December 31, 2020
| | | | | | | | |
| | | Bond Fund | | | Investment
Grade Fixed
Income Fund | |
ASSETS | |
Unaffiliated investments at cost | | $ | 8,850,269,505 | | | $ | 228,803,893 | |
Affiliated investments at cost | | | 4,623,706 | | | | — | |
Net unrealized appreciation (depreciation) | | | 116,450,864 | | | | 22,575,919 | |
| | | | | | | | |
Investments at value | | | 8,971,344,075 | | | | 251,379,812 | |
Cash | | | 2,529,193 | | | | 601,775 | |
Receivable for Fund shares sold | | | 13,385,983 | | | | 14,852 | |
Receivable for securities sold | | | 22,360,834 | | | | 32,474 | |
Dividends and interest receivable | | | 69,376,842 | | | | 1,662,620 | |
Prepaid expenses (Note 7) | | | 29,526 | | | | 17 | |
| | | | | | | | |
TOTAL ASSETS | | | 9,079,026,453 | | | | 253,691,550 | |
| | | | | | | | |
|
| LIABILITIES | |
Payable for securities purchased | | | 6,852,366 | | | | 685,695 | |
Payable for Fund shares redeemed | | | 11,202,858 | | | | — | |
Management fees payable (Note 5) | | | 4,014,389 | | | | 48,136 | |
Deferred Trustees’ fees (Note 5) | | | 2,351,654 | | | | 190,508 | |
Administrative fees payable (Note 5) | | | 301,014 | | | | 8,922 | |
Payable to distributor (Note 5d) | | | 70,949 | | | | — | |
Other accounts payable and accrued expenses | | | 806,327 | | | | 68,338 | |
| | | | | | | | |
TOTAL LIABILITIES | | | 25,599,557 | | | | 1,001,599 | |
| | | | | | | | |
NET ASSETS | | $ | 9,053,426,896 | | | $ | 252,689,951 | |
| | | | | | | | |
NET ASSETS CONSIST OF: | |
Paid-in capital | | $ | 9,216,489,961 | | | $ | 231,343,908 | |
Accumulated earnings (loss) | | | (163,063,065 | ) | | | 21,346,043 | |
| | | | | | | | |
NET ASSETS | | $ | 9,053,426,896 | | | $ | 252,689,951 | |
| | | | | | | | |
|
| COMPUTATION OF NET ASSET VALUE AND OFFERING PRICE: | |
|
Institutional Class: | |
Net assets | | $ | 6,630,032,414 | | | $ | 252,689,951 | |
| | | | | | | | |
Shares of beneficial interest | | | 488,099,763 | | | | 20,269,498 | |
| | | | | | | | |
Net asset value, offering and redemption price per share | | $ | 13.58 | | | $ | 12.47 | |
| | | | | | | | |
|
Retail Class: | |
Net assets | | $ | 1,469,488,647 | | | $ | — | |
| | | | | | | | |
Shares of beneficial interest | | | 108,791,315 | | | | — | |
| | | | | | | | |
Net asset value, offering and redemption price per share | | $ | 13.51 | | | $ | — | |
| | | | | | | | |
|
Admin Class shares: | |
Net assets | | $ | 50,062,284 | | | $ | — | |
| | | | | | | | |
Shares of beneficial interest | | | 3,721,970 | | | | — | |
| | | | | | | | |
Net asset value, offering and redemption price per share | | $ | 13.45 | | | $ | — | |
| | | | | | | | |
|
Class N shares: | |
Net assets | | $ | 903,843,551 | | | $ | — | |
| | | | | | | | |
Shares of beneficial interest | | | 66,625,584 | | | | — | |
| | | | | | | | |
Net asset value, offering and redemption price per share | | $ | 13.57 | | | $ | — | |
| | | | | | | | |
See accompanying notes to financial statements.
| 26
Statements of Operations
| | | | | | | | | | | | | | | | |
| | | Bond Fund | | | Investment Grade Fixed Income Fund | |
| | | Period Ended
December 31, 2020(a) | | | Year Ended
September 30, 2020 | | | Period Ended
December 31, 2020(a) | | | Year Ended
September 30, 2020 | |
| INVESTMENT INCOME | |
Interest | | $ | 71,045,976 | | | $ | 367,682,907 | | | $ | 1,676,678 | | | $ | 7,994,472 | |
Interest from affiliated investments (Note 5) | | | — | | | | 293,904 | | | | — | | | | — | |
Dividends | | | 12,777,238 | | | | 52,213,085 | | | | 150,452 | | | | 812,252 | |
Less net foreign taxes withheld | | | (12,005 | ) | | | (87,681 | ) | | | (518 | ) | | | (2,017 | ) |
| | | | | | | | | | | | | | | | |
| | | 83,811,209 | | | | 420,102,215 | | | | 1,826,612 | | | | 8,804,707 | |
| | | | | | | | | | | | | | | | |
Expenses | | | | | | | | | | | | | | | | |
Management fees (Note 5) | | | 12,121,027 | | | | 51,666,632 | | | | 237,554 | | | | 1,020,718 | |
Service and distribution fees (Note 5) | | | 992,645 | | | | 4,690,456 | | | | — | | | | — | |
Administrative fees (Note 5) | | | 954,262 | | | | 4,299,300 | | | | 25,864 | | | | 112,717 | |
Trustees’ fees and expenses (Note 5) | | | 192,165 | | | | 627,157 | | | | 14,045 | | | | 47,003 | |
Transfer agent fees and expenses (Notes 5 and 6) | | | 1,524,482 | | | | 6,820,982 | | | | 735 | | | | 2,207 | |
Audit and tax services fees | | | 46,225 | | | | 64,256 | | | | 41,773 | | | | 56,274 | |
Custodian fees and expenses | | | 111,656 | | | | 478,242 | | | | 8,843 | | | | 16,520 | |
Legal fees (Note 7) | | | 34,639 | | | | 241,946 | | | | 779 | | | | 6,497 | |
Registration fees | | | 71,972 | | | | 199,834 | | | | 58,049 | | | | 24,104 | |
Shareholder reporting expenses | | | 41,293 | | | | 350,707 | | | | 147 | | | | 2,260 | |
Miscellaneous expenses (Note 7) | | | 81,135 | | | | 284,950 | | | | 7,161 | | | | 30,851 | |
| | | | | | | | | | | | | | | | |
Total expenses | | | 16,171,501 | | | | 69,724,462 | | | | 394,950 | | | | 1,319,151 | |
Less waiver and/or expense reimbursement (Note 5) | | | (93,335 | ) | | | (319,980 | ) | | | (68,314 | ) | | | — | |
| | | | | | | | | | | | | | | | |
Net expenses | | | 16,078,166 | | | | 69,404,482 | | | | 326,636 | | | | 1,319,151 | |
| | | | | | | | | | | | | | | | |
Net investment income | | | 67,733,043 | | | | 350,697,733 | | | | 1,499,976 | | | | 7,485,556 | |
| | | | | | | | | | | | | | | | |
| | | | |
| NET REALIZED AND UNREALIZED GAIN (LOSS) ON INVESTMENTS AND FOREIGN CURRENCY TRANSACTIONS | | | | | | | | | | | | | | | | |
Net realized gain (loss) on: | | | | | | | | | | | | | | | | |
Unaffiliated investments | | | (483,000,128 | ) | | | (115,264,136 | ) | | | (2,046,710 | ) | | | 1,645,902 | |
Affiliated investments (Note 5) | | | — | | | | (16,997,878 | ) | | | — | | | | — | |
Foreign currency transactions (Note 2c) | | | 312,711 | | | | (2,467,204 | ) | | | 16,293 | | | | (38,480 | ) |
Net change in unrealized appreciation (depreciation) on: | | | | | | | | | | | | | | | | |
Unaffiliated investments | | | 886,281,313 | | | | (336,314,465 | ) | | | 10,685,205 | | | | (245,035 | ) |
Affiliated investments (Note 5) | | | — | | | | 12,188,974 | | | | — | | | | — | |
Foreign currency translations (Note 2c) | | | (63,480 | ) | | | 657,173 | | | | (439 | ) | | | 11,051 | |
| | | | | | | | | | | | | | | | |
Net realized and unrealized gain (loss) on investments and foreign currency transactions | | | 403,530,416 | | | | (458,197,536 | ) | | | 8,654,349 | | | | 1,373,438 | |
| | | | | | | | | | | | | | | | |
| | | | |
| NET INCREASE (DECREASE) IN NET ASSETS RESULTING FROM OPERATIONS | | $ | 471,263,459 | | | $ | (107,499,803 | ) | | $ | 10,154,325 | | | $ | 8,858,994 | |
| | | | | | | | | | | | | | | | |
| (a) | For the three month period ended December 31, 2020. See Note 1 of Notes to Financial Statements. |
See accompanying notes to financial statements.
27 |
Statements of Changes in Net Assets
| | | | | | | | | | | | |
| | | Bond Fund | |
| | | Period Ended
December 31, 2020(a) | | | Year Ended
September 30, 2020 | | | Year Ended
September 30, 2019 | |
| FROM OPERATIONS: | |
Net investment income | | $ | 67,733,043 | | | $ | 350,697,733 | | | $ | 448,515,423 | |
Net realized gain (loss) on investments and foreign currency transactions | | | (482,687,417 | ) | | | (134,729,218 | ) | | | 24,576,670 | |
Net change in unrealized appreciation (depreciation) on investments and foreign currency translations | | | 886,217,833 | | | | (323,468,318 | ) | | | 7,816,158 | |
| | | | | | | | | | | | |
Net increase (decrease) in net assets resulting from operations | | | 471,263,459 | | | | (107,499,803 | ) | | | 480,908,251 | |
| | | | | | | | | | | | |
| FROM DISTRIBUTIONS TO SHAREHOLDERS: | |
Institutional Class | | | (106,667,694 | ) | | | (254,323,638 | ) | | | (334,548,005 | ) |
Retail Class | | | (22,892,670 | ) | | | (57,798,889 | ) | | | (81,827,929 | ) |
Admin Class | | | (750,670 | ) | | | (2,055,462 | ) | | | (3,617,633 | ) |
Class N | | | (14,297,581 | ) | | | (27,248,637 | ) | | | (18,399,820 | ) |
| | | | | | | | | | | | |
Total distributions | | | (144,608,615 | ) | | | (341,426,626 | ) | | | (438,393,387 | ) |
| | | | | | | | | | | | |
| | | |
| NET DECREASE IN NET ASSETS FROM CAPITAL SHARE TRANSACTIONS (NOTE 10) | | | (320,623,442 | ) | | | (1,148,728,878 | ) | | | (1,508,711,343 | ) |
| | | | | | | | | | | | |
Net increase (decrease) in net assets | | | 6,031,402 | | | | (1,597,655,307 | ) | | | (1,466,196,479 | ) |
| NET ASSETS | |
Beginning of the year | | | 9,047,395,494 | | | | 10,645,050,801 | | | | 12,111,247,280 | |
| | | | | | | | | | | | |
End of the year | | $ | 9,053,426,896 | | | $ | 9,047,395,494 | | | $ | 10,645,050,801 | |
| | | | | | | | | | | | |
| (a) | For the three month period ended December 31, 2020. See Note 1 of Notes to Financial Statements. |
See accompanying notes to financial statements.
| 28
Statements of Changes in Net Assets – continued
| | | | | | | | | | | | |
| | | Investment Grade Fixed Income Fund | |
| | | Period Ended
December 31, 2020(a) | | | Year Ended
September 30, 2020 | | | Year Ended
September 30, 2019 | |
| FROM OPERATIONS: | |
Net investment income | | $ | 1,499,976 | | | $ | 7,485,556 | | | $ | 9,010,579 | |
Net realized gain (loss) on investments and foreign currency transactions | | | (2,030,417 | ) | | | 1,607,422 | | | | (2,404,099 | ) |
Net change in unrealized appreciation (depreciation) on investments and foreign currency translations | | | 10,684,766 | | | | (233,984 | ) | | | 5,430,056 | |
| | | | | | | | | | | | |
Net increase in net assets resulting from operations | | | 10,154,325 | | | | 8,858,994 | | | | 12,036,536 | |
| | | | | | | | | | | | |
| FROM DISTRIBUTIONS TO SHAREHOLDERS: | |
Institutional Class | | | (10,169,387 | ) | | | (7,664,904 | ) | | | (9,558,974 | ) |
| | | | | | | | | | | | |
| | | |
| NET INCREASE (DECREASE) IN NET ASSETS FROM CAPITAL SHARE TRANSACTIONS (NOTE 10) | | | 23,575,859 | | | | (61,121,051 | ) | | | 13,853,887 | |
| | | | | | | | | | | | |
Net increase (decrease) in net assets | | | 23,560,797 | | | | (59,926,961 | ) | | | 16,331,449 | |
| NET ASSETS | |
Beginning of the year | | | 229,129,154 | | | | 289,056,115 | | | | 272,724,666 | |
| | | | | | | | | | | | |
End of the year | | $ | 252,689,951 | | | $ | 229,129,154 | | | $ | 289,056,115 | |
| | | | | | | | | | | | |
| (a) | For the three month period ended December 31, 2020. See Note 1 of Notes to Financial Statements. |
See accompanying notes to financial statements.
29 |
Financial Highlights
For a share outstanding throughout each period.
| | | | | | | | | | | | | | | | | | | | | | | | |
| | | Bond Fund – Institutional Class | |
| | | Period Ended
December 31,
2020* | | | Year Ended
September 30,
2020 | | | Year Ended
September 30,
2019 | | | Year Ended
September 30,
2018 | | | Year Ended
September 30,
2017 | | | Year Ended
September 30,
2016 | |
Net asset value, beginning of the period | | $ | 13.10 | | | $ | 13.66 | | | $ | 13.57 | | | $ | 14.28 | | | $ | 14.04 | | | $ | 13.65 | |
| | | | |
INCOME (LOSS) FROM INVESTMENT OPERATIONS: | | | | | | | | | | | | | | | | | | | | | | | | |
Net investment income(a) | | | 0.10 | | | | 0.48 | | | | 0.55 | | | | 0.49 | | | | 0.53 | | | | 0.56 | |
Net realized and unrealized gain (loss) | | | 0.59 | | | | (0.57 | ) | | | 0.08 | | | | (0.37 | ) | | | 0.28 | | | | 0.62 | |
| | | | |
Total from Investment Operations | | | 0.69 | | | | (0.09 | ) | | | 0.63 | | | | 0.12 | | | | 0.81 | | | | 1.18 | |
| | | | |
LESS DISTRIBUTIONS FROM: | | | | | | | | | | | | | | | | | | | | | | | | |
Net investment income | | | (0.14 | ) | | | (0.45 | ) | | | (0.50 | ) | | | (0.54 | ) | | | (0.43 | ) | | | (0.29 | ) |
Net realized capital gains | | | (0.07 | ) | | | (0.02 | ) | | | (0.04 | ) | | | (0.29 | ) | | | (0.14 | ) | | | (0.50 | ) |
| | | | |
Total Distributions | | | (0.21 | ) | | | (0.47 | ) | | | (0.54 | ) | | | (0.83 | ) | | | (0.57 | ) | | | (0.79 | ) |
| | | | |
Net asset value, end of the period | | $ | 13.58 | | | $ | 13.10 | | | $ | 13.66 | | | $ | 13.57 | | | $ | 14.28 | | | $ | 14.04 | |
| | | | |
Total return | | | 5.35 | %(b) | | | (0.73 | )% | | | 4.88 | % | | | 0.97 | % | | | 5.99 | % | | | 9.17 | % |
RATIOS TO AVERAGE NET ASSETS: | | | | | | | | | | | | | | | | | | | | | | | | |
Net assets, end of the period (000’s) | | $ | 6,630,032 | | | $ | 6,668,481 | | | $ | 8,071,961 | | | $ | 9,025,850 | | | $ | 9,785,854 | | | $ | 10,045,427 | |
Net expenses | | | 0.67 | %(c) | | | 0.67 | % | | | 0.67 | % | | | 0.66 | % | | | 0.66 | % | | | 0.66 | % |
Gross expenses | | | 0.67 | %(c) | | | 0.67 | % | | | 0.67 | % | | | 0.66 | % | | | 0.66 | % | | | 0.66 | % |
Net investment income | | | 3.02 | %(c) | | | 3.65 | % | | | 4.12 | % | | | 3.59 | % | | | 3.80 | % | | | 4.21 | % |
Portfolio turnover rate | | | 26 | %(d) | | | 25 | % | | | 17 | % | | | 7 | % | | | 9 | % | | | 13 | % |
| * | | For the three month period ended December 31, 2020. See Note 1 of Notes to Financial Statements. | |
| (a) | | Per share net investment income has been calculated using the average shares outstanding during the period. | |
| (b) | | Periods less than one year are not annualized. | |
| (c) | | Computed on an annualized basis for periods less than one year. | |
| (d) | | The variation in the Fund’s turnover rate, if annualized, from the year ended September 30, 2020 to the period ended December 31, 2020 was primarily due to the disposition and realignment of certain foreign currency-denominated positions. | |
| | | | | | | | | | | | | | | | | | | | | | | | |
| | | Bond Fund – Retail Class | |
| | | Period
Ended
December 31,
2020* | | | Year
Ended
September 30,
2020 | | | Year
Ended
September 30,
2019 | | | Year
Ended
September 30,
2018 | | | Year
Ended
September 30,
2017 | | | Year
Ended
September 30,
2016 | |
Net asset value, beginning of the period | | $ | 13.03 | | | $ | 13.59 | | | $ | 13.49 | | | $ | 14.21 | | | $ | 13.97 | | | $ | 13.59 | |
| | | | |
INCOME (LOSS) FROM INVESTMENT OPERATIONS: | | | | | | | | | | | | | | | | | | | | | | | | |
Net investment income(a) | | | 0.09 | | | | 0.45 | | | | 0.52 | | | | 0.46 | | | | 0.50 | | | | 0.53 | |
Net realized and unrealized gain (loss) | | | 0.59 | | | | (0.57 | ) | | | 0.08 | | | | (0.38 | ) | | | 0.28 | | | | 0.61 | |
| | | | |
Total from Investment Operations | | | 0.68 | | | | (0.12 | ) | | | 0.60 | | �� | | 0.08 | | | | 0.78 | | | | 1.14 | |
| | | | |
LESS DISTRIBUTIONS FROM: | | | | | | | | | | | | | | | | | | | | | | | | |
Net investment income | | | (0.13 | ) | | | (0.42 | ) | | | (0.46 | ) | | | (0.51 | ) | | | (0.40 | ) | | | (0.26 | ) |
Net realized capital gains | | | (0.07 | ) | | | (0.02 | ) | | | (0.04 | ) | | | (0.29 | ) | | | (0.14 | ) | | | (0.50 | ) |
| | | | |
Total Distributions | | | (0.20 | ) | | | (0.44 | ) | | | (0.50 | ) | | | (0.80 | ) | | | (0.54 | ) | | | (0.76 | ) |
| | | | |
Net asset value, end of the period | | $ | 13.51 | | | $ | 13.03 | | | $ | 13.59 | | | $ | 13.49 | | | $ | 14.21 | | | $ | 13.97 | |
| | | | |
Total return | | | 5.31 | %(b) | | | (0.99 | )% | | | 4.72 | %(c) | | | 0.64 | % | | | 5.75 | % | | | 8.86 | % |
RATIOS TO AVERAGE NET ASSETS: | | | | | | | | | | | | | | | | | | | | | | | | |
Net assets, end of the period (000’s) | | $ | 1,469,489 | | | $ | 1,474,316 | | | $ | 2,019,828 | | | $ | 2,520,105 | | | $ | 3,496,126 | | | $ | 4,495,997 | |
Net expenses | | | 0.92 | %(d) | | | 0.92 | % | | | 0.91 | %(e) | | | 0.91 | % | | | 0.91 | % | | | 0.91 | % |
Gross expenses | | | 0.92 | %(d) | | | 0.92 | % | | | 0.92 | % | | | 0.91 | % | | | 0.91 | % | | | 0.91 | % |
Net investment income | | | 2.77 | %(d) | | | 3.41 | % | | | 3.88 | % | | | 3.33 | % | | | 3.56 | % | | | 3.97 | % |
Portfolio turnover rate | | | 26 | %(f) | | | 25 | % | | | 17 | % | | | 7 | % | | | 9 | % | | | 13 | % |
| * | | For the three month period ended December 31, 2020. See Note 1 of Notes to Financial Statements. | |
| (a) | | Per share net investment income has been calculated using the average shares outstanding during the period. | |
| (b) | | Periods less than one year are not annualized. | |
| (c) | | Had certain expenses not been waived/reimbursed during the period, total returns would have been lower. | |
| (d) | | Computed on an annualized basis for periods less than one year. | |
| (e) | | The administrator agreed to waive its fees and/or reimburse a portion of the Fund’s expenses during the period. Without this waiver/reimbursement, expenses would have been higher. | |
| (f) | | The variation in the Fund’s turnover rate, if annualized, from the year ended September 30, 2020 to the period ended December 31, 2020 was primarily due to the disposition and realignment of certain foreign currency-denominated positions. | |
See accompanying notes to financial statements.
| 30
Financial Highlights – continued
For a share outstanding throughout each period.
| | | | | | | | | | | | | | | | | | | | | | | | |
| | | Bond Fund – Admin Class | |
| | | Period Ended
December 31,
2020* | | | Year Ended
September 30,
2020 | | | Year Ended
September 30,
2019 | | | Year Ended
September 30,
2018 | | | Year Ended
September 30,
2017 | | | Year Ended
September 30,
2016 | |
Net asset value, beginning of the period | | $ | 12.97 | | | $ | 13.53 | | | $ | 13.44 | | | $ | 14.16 | | | $ | 13.92 | | | $ | 13.54 | |
| | | | |
INCOME (LOSS) FROM INVESTMENT OPERATIONS: | | | | | | | | | | | | | | | | | | | | | | | | |
Net investment income(a) | | | 0.08 | | | | 0.42 | | | | 0.48 | | | | 0.42 | | | | 0.46 | | | | 0.49 | |
Net realized and unrealized gain (loss) | | | 0.60 | | | | (0.58 | ) | | | 0.08 | | | | (0.38 | ) | | | 0.28 | | | | 0.62 | |
| | | | |
Total from Investment Operations | | | 0.68 | | | | (0.16 | ) | | | 0.56 | | | | 0.04 | | | | 0.74 | | | | 1.11 | |
| | | | |
LESS DISTRIBUTIONS FROM: | | | | | | | | | | | | | | | | | | | | | | | | |
Net investment income | | | (0.13 | ) | | | (0.38 | ) | | | (0.43 | ) | | | (0.47 | ) | | | (0.36 | ) | | | (0.23 | ) |
Net realized capital gains | | | (0.07 | ) | | | (0.02 | ) | | | (0.04 | ) | | | (0.29 | ) | | | (0.14 | ) | | | (0.50 | ) |
| | | | |
Total Distributions | | | (0.20 | ) | | | (0.40 | ) | | | (0.47 | ) | | | (0.76 | ) | | | (0.50 | ) | | | (0.73 | ) |
| | | | |
Net asset value, end of the period | | $ | 13.45 | | | $ | 12.97 | | | $ | 13.53 | | | $ | 13.44 | | | $ | 14.16 | | | $ | 13.92 | |
| | | | |
Total return | | | 5.26 | %(b) | | | (1.24 | )% | | | 4.40 | %(c) | | | 0.38 | % | | | 5.51 | % | | | 8.64 | % |
RATIOS TO AVERAGE NET ASSETS: | | | | | | | | | | | | | | | | | | | | | | | | |
Net assets, end of the period (000’s) | | $ | 50,062 | | | $ | 51,040 | | | $ | 84,028 | | | $ | 121,683 | | | $ | 170,436 | | | $ | 185,902 | |
Net expenses | | | 1.17 | %(d) | | | 1.17 | % | | | 1.16 | %(e) | | | 1.16 | % | | | 1.16 | % | | | 1.16 | % |
Gross expenses | | | 1.17 | %(d) | | | 1.17 | % | | | 1.17 | % | | | 1.16 | % | | | 1.16 | % | | | 1.16 | % |
Net investment income | | | 2.52 | %(d) | | | 3.19 | % | | | 3.63 | % | | | 3.08 | % | | | 3.31 | % | | | 3.72 | % |
Portfolio turnover rate | | | 26 | %(f) | | | 25 | % | | | 17 | % | | | 7 | % | | | 9 | % | | | 13 | % |
| * | | For the three month period ended December 31, 2020. See Note 1 of Notes to Financial Statements. | |
| (a) | | Per share net investment income has been calculated using the average shares outstanding during the period. | |
| (b) | | Periods less than one year are not annualized. | |
| (c) | | Had certain expenses not been waived/reimbursed during the period, total returns would have been lower. | |
| (d) | | Computed on an annualized basis for periods less than one year. | |
| (e) | | The administrator agreed to waive its fees and/or reimburse a portion of the Fund’s expenses during the period. Without this waiver/reimbursement, expenses would have been higher. | |
| (f) | | The variation in the Fund’s turnover rate, if annualized, from the year ended September 30, 2020 to the period ended December 31, 2020 was primarily due to the disposition and realignment of certain foreign currency-denominated positions. | |
| | | | | | | | | | | | | | | | | | | | | | | | |
| | | Bond Fund – Class N | |
| | | Period
Ended
December 31,
2020* | | | Year
Ended
September 30,
2020 | | | Year
Ended
September 30,
2019 | | | Year
Ended
September 30,
2018 | | | Year
Ended
September 30,
2017 | | | Year
Ended
September 30,
2016 | |
Net asset value, beginning of the period | | $ | 13.08 | | | $ | 13.64 | | | $ | 13.55 | | | $ | 14.27 | | | $ | 14.02 | | | $ | 13.64 | |
| | | | |
INCOME (LOSS) FROM INVESTMENT OPERATIONS: | | | | | | | | | | | | | | | | | | | | | | | | |
Net investment income(a) | | | 0.10 | | | | 0.48 | | | | 0.56 | | | | 0.50 | | | | 0.54 | | | | 0.57 | |
Net realized and unrealized gain (loss) | | | 0.61 | | | | (0.56 | ) | | | 0.08 | | | | (0.38 | ) | | | 0.29 | | | | 0.61 | |
| | | | |
Total from Investment Operations | | | 0.71 | | | | (0.08 | ) | | | 0.64 | | | | 0.12 | | | | 0.83 | | | | 1.18 | |
| | | | |
LESS DISTRIBUTIONS FROM: | | | | | | | | | | | | | | | | | | | | | | | | |
Net investment income | | | (0.15 | ) | | | (0.46 | ) | | | (0.51 | ) | | | (0.55 | ) | | | (0.44 | ) | | | (0.30 | ) |
Net realized capital gains | | | (0.07 | ) | | | (0.02 | ) | | | (0.04 | ) | | | (0.29 | ) | | | (0.14 | ) | | | (0.50 | ) |
| | | | |
Total Distributions | | | (0.22 | ) | | | (0.48 | ) | | | (0.55 | ) | | | (0.84 | ) | | | (0.58 | ) | | | (0.80 | ) |
| | | | |
Net asset value, end of the period | | $ | 13.57 | | | $ | 13.08 | | | $ | 13.64 | | | $ | 13.55 | | | $ | 14.27 | | | $ | 14.02 | |
| | | | |
Total return | | | 5.45 | %(b) | | | (0.66 | )% | | | 4.97 | % | | | 0.97 | % | | | 6.14 | % | | | 9.18 | % |
RATIOS TO AVERAGE NET ASSETS: | | | | | | | | | | | | | | | | | | | | | | | | |
Net assets, end of the period (000’s) | | $ | 903,844 | | | $ | 853,559 | | | $ | 469,234 | | | $ | 443,609 | | | $ | 224,074 | | | $ | 113,335 | |
Net expenses | | | 0.60 | %(c) | | | 0.60 | % | | | 0.59 | % | | | 0.59 | % | | | 0.59 | % | | | 0.58 | % |
Gross expenses | | | 0.60 | %(c) | | | 0.60 | % | | | 0.59 | % | | | 0.59 | % | | | 0.59 | % | | | 0.58 | % |
Net investment income | | | 3.08 | %(c) | | | 3.65 | % | | | 4.20 | % | | | 3.68 | % | | | 3.83 | % | | | 4.28 | % |
Portfolio turnover rate | | | 26 | %(d) | | | 25 | % | | | 17 | % | | | 7 | % | | | 9 | % | | | 13 | % |
| * | | For the three month period ended December 31, 2020. See Note 1 of Notes to Financial Statements. | |
| (a) | | Per share net investment income has been calculated using the average shares outstanding during the period. | |
| (b) | | Periods less than one year are not annualized. | |
| (c) | | Computed on an annualized basis for periods less than one year. | |
| (d) | | The variation in the Fund’s turnover rate, if annualized, from the year ended September 30, 2020 to the period ended December 31, 2020 was primarily due to the disposition and realignment of certain foreign currency-denominated positions. | |
See accompanying notes to financial statements.
31 |
Financial Highlights – continued
For a share outstanding throughout each period.
| | | | | | | | | | | | | | | | | | | | | | | | |
| | | Investment Grade Fixed Income Fund – Institutional Class | |
| | | Period Ended
December 31,
2020* | | | Year Ended
September 30,
2020 | | | Year Ended
September 30,
2019 | | | Year Ended
September 30,
2018 | | | Year Ended
September 30,
2017 | | | Year Ended
September 30,
2016 | |
Net asset value, beginning of the period | | $ | 12.48 | | | $ | 12.30 | | | $ | 12.20 | | | $ | 12.43 | | | $ | 12.42 | | | $ | 11.81 | |
| | | | |
INCOME (LOSS) FROM INVESTMENT OPERATIONS: | | | | | | | | | | | | | | | | | | | | | | | | |
Net investment income(a) | | | 0.08 | | | | 0.36 | | | | 0.39 | | | | 0.37 | | | | 0.46 | | | | 0.45 | |
Net realized and unrealized gain (loss) | | | 0.46 | | | | 0.18 | | | | 0.14 | | | | (0.22 | ) | | | 0.22 | | | | 0.50 | |
| | | | |
Total from Investment Operations | | | 0.54 | | | | 0.54 | | | | 0.53 | | | | 0.15 | | | | 0.68 | | | | 0.95 | |
| | | | |
LESS DISTRIBUTIONS FROM: | | | | | | | | | | | | | | | | | | | | | | | | |
Net investment income | | | (0.12 | ) | | | (0.32 | ) | | | (0.24 | ) | | | (0.30 | ) | | | (0.42 | ) | | | (0.22 | ) |
Net realized capital gains | | | (0.43 | ) | | | (0.04 | ) | | | (0.19 | ) | | | (0.08 | ) | | | (0.25 | ) | | | (0.12 | ) |
| | | | |
Total Distributions | | | (0.55 | ) | | | (0.36 | ) | | | (0.43 | ) | | | (0.38 | ) | | | (0.67 | ) | | | (0.34 | ) |
| | | | |
Net asset value, end of the period | | $ | 12.47 | | | $ | 12.48 | | | $ | 12.30 | | | $ | 12.20 | | | $ | 12.43 | | | $ | 12.42 | |
| | | | |
Total return | | | 4.38 | %(b)(c) | | | 4.53 | % | | | 4.46 | % | | | 1.27 | % | | | 5.73 | % | | | 8.27 | % |
RATIOS TO AVERAGE NET ASSETS: | | | | | | | | | | | | | | | | | | | | | | | | |
Net assets, end of the period (000’s) | | $ | 252,690 | | | $ | 229,129 | | | $ | 289,056 | | | $ | 272,725 | | | $ | 412,235 | | | $ | 461,429 | |
Net expenses | | | 0.55 | %(d)(e) | | | 0.52 | % | | | 0.50 | % | | | 0.49 | % | | | 0.49 | % | | | 0.48 | % |
Gross expenses | | | 0.67 | %(e) | | | 0.52 | % | | | 0.50 | % | | | 0.49 | % | | | 0.49 | % | | | 0.48 | % |
Net investment income | | | 2.53 | %(e) | | | 2.93 | % | | | 3.26 | % | | | 3.03 | % | | | 3.79 | % | | | 3.72 | % |
Portfolio turnover rate | | | 30 | %(f) | | | 29 | % | | | 11 | % | | | 1 | % | | | 3 | % | | | 23 | % |
| * | | For the three month period ended December 31, 2020. See Note 1 of Notes to Financial Statements. | |
| (a) | | Per share net investment income has been calculated using the average shares outstanding during the period. | |
| (b) | | Had certain expenses not been waived/reimbursed during the period, total returns would have been lower. | |
| (c) | | Periods less than one year are not annualized. | |
| (d) | | The investment adviser agreed to waive its fees and/or reimburse a portion of the Fund’s expenses during the period. Without this waiver/reimbursement, expenses would have been higher. | |
| (e) | | Computed on an annualized basis for periods less than one year. | |
| (f) | | The variation in the Fund’s turnover rate, if annualized, from the year ended September 30, 2020 to the period ended December 31, 2020 was primarily due to the disposition and realignment of certain foreign currency-denominated positions. | |
See accompanying notes to financial statements.
| 32
Notes to Financial Statements
December 31, 2020
1. Organization. Loomis Sayles Funds I (the “Trust”) is organized as a Massachusetts business trust. The Trust is registered under the Investment Company Act of 1940, as amended (the “1940 Act”) as an open-end management investment company. The Declaration of Trust permits the Board of Trustees to authorize the issuance of an unlimited number of shares of the Trust in multiple series. The financial statements for certain funds of the Trust are presented in separate reports. The following funds (individually, a “Fund” and collectively, the “Funds”) are included in this report:
Loomis Sayles Bond Fund (the “Bond Fund”)
Loomis Sayles Investment Grade Fixed Income Fund (the “Investment Grade Fixed Income Fund”)
Each Fund is a diversified investment company.
On December 2, 2020, the Board of Trustees approved a change to the fiscal year end of the Funds from September 30 to December 31. Accordingly, the Funds’ financial statements and related notes include information as of and for the three month period ended December 31, 2020, and the years ended September 30, 2020, and September 30, 2019, where applicable.
Each Fund offers Institutional Class shares. In addition, Bond Fund also offers Retail Class, Admin Class and Class N shares.
Each share class is sold without a sales charge. Retail Class and Admin Class shares pay a Rule 12b-1 fee. Admin Class shares are primarily intended for employer-sponsored retirement plans and are offered exclusively through intermediaries. Class N shares do not pay a front-end sales charge, a contingent deferred sales charge (“CDSC”) or Rule 12b-1 fees. Class N shares are offered with an initial minimum investment of $1,000,000. Institutional Class shares are intended for institutional investors with a minimum initial investment of $100,000 for Bond Fund and $3,000,000 for Investment Grade Fixed Income Fund. Certain categories of investors are exempted from the minimum investment amounts for Class N and Institutional Class as outlined in the relevant Fund’s prospectus.
Most expenses can be directly attributed to a Fund. Expenses which cannot be directly attributed to a Fund are generally apportioned based on the relative net assets of each of the funds in Natixis Funds Trust I, Natixis Funds Trust II, Natixis Funds Trust IV, and Gateway Trust (“Natixis Funds Trusts”), and Loomis Sayles Funds I and Loomis Sayles Funds II (“Loomis Sayles Funds Trusts”), and Natixis ETF Trust and Natixis ETF Trust II (“Natixis ETF Trusts”). Expenses of a Fund are borne pro rata by the holders of each class of shares, except that each class bears expenses unique to that class (such as the Rule 12b-1 fees applicable to Retail Class and Admin Class) and transfer agent fees are borne collectively for Institutional Class, Retail Class, and Admin Class, and individually for Class N. In addition, each class votes as a class only with respect to its own Rule 12b-1 Plan. Shares of each class would receive their pro rata share of the net assets of a Fund if the Fund were liquidated. The Trustees approve separate distributions from net investment income on each class of shares.
2. Significant Accounting Policies. The following is a summary of significant accounting policies consistently followed by each Fund in the preparation of its financial statements. The Funds’ financial statements follow the accounting and reporting guidelines provided for investment companies and are prepared in accordance with accounting principles generally accepted in the United States of America which require the use of management estimates that affect the reported amounts and disclosures in the financial statements. Actual results could differ from those estimates. Management has evaluated the events and transactions subsequent to year-end through the date the financial statements were issued and has determined that there were no material events that would require disclosure in the Funds’ financial statements.
a. Valuation. Fund securities and other investments are valued at market value based on market quotations obtained or determined by independent pricing services recommended by the adviser and approved by the Board of Trustees. Fund securities and other investments for which market quotations are not readily available are valued at fair value as determined in good faith by the adviser pursuant to procedures approved by the Board of Trustees, as described below. Market value is determined as follows:
Debt securities and unlisted preferred equity securities are valued based on evaluated bids furnished to the Funds by an independent pricing service or bid prices obtained from broker-dealers. Senior loans and collateralized loan obligations are valued at bid prices supplied by an independent pricing service, if available. Listed equity securities (including shares of closed-end investment companies and exchange-traded funds) are valued at the last sale price quoted on the exchange where they are traded most extensively or, if there is no reported sale during the day, the closing bid quotation as reported by an independent pricing service. Securities traded on the NASDAQ Global Select Market, NASDAQ Global Market and NASDAQ Capital Market are valued at the NASDAQ Official Closing Price (“NOCP”), or if lacking an NOCP, at the most recent bid quotations on the applicable NASDAQ Market. Unlisted equity securities (except unlisted preferred equity securities) are valued at the last sale price quoted in the market where they are traded most extensively or, if there is no reported sale during the day, the closing bid quotation as reported by an independent pricing service. If there is no last sale price or closing bid quotation available, unlisted equity securities will be valued using evaluated bids furnished by an independent pricing service, if available. In some foreign markets, an official close price and a last sale price may be available from the foreign exchange or market. In those cases, the official close price is used. Broker-dealer bid prices may be used to value debt and unlisted equity securities, senior loans and collateralized loan obligations where an independent pricing service is unable to price a security or where an independent pricing service does not provide a reliable price for the security.
33 |
Notes to Financial Statements – continued
December 31, 2020
Fund securities and other investments for which market quotations are not readily available are valued at fair value as determined in good faith by the adviser pursuant to procedures approved by the Board of Trustees. The Funds may also value securities and other investments at fair value in other circumstances such as when extraordinary events occur after the close of a foreign market but prior to the close of the New York Stock Exchange. This may include situations relating to a single issuer (such as a declaration of bankruptcy or a delisting of the issuer’s security from the primary market on which it has traded) as well as events affecting the securities markets in general (such as market disruptions or closings and significant fluctuations in U.S. and/or foreign markets). When fair valuing its securities or other investments, the Funds may, among other things, use modeling tools or other processes that may take into account factors such as securities or other market activity and/or significant events that occur after the close of the foreign market and before the time the Fund’s net asset value (“NAV”) is calculated. Fair value pricing may require subjective determinations about the value of a security, and fair values used to determine a Fund’s NAV may differ from quoted or published prices, or from prices that are used by others, for the same securities. In addition, the use of fair value pricing may not always result in adjustments to the prices of securities held by a Fund.
Illiquid securities for which market quotations are readily available and have been evaluated by the adviser are considered and classified as fair valued securities pursuant to the Funds’ pricing policies and procedures.
As of December 31, 2020, securities held by the Funds were fair valued as follows:
| | | | | | | | | | | | | | | | |
Fund | | Securities
classified as
fair valued | | | Percentage of
Net Assets | | | Securities fair
valued by the
Fund’s adviser | | | Percentage of
Net Assets | |
Bond Fund | | $ | 190,394,636 | | | | 2.1% | | | $ | 24,407,838 | | | | 0.3% | |
Investment Grade Fixed Income Fund | | | 6,128,272 | | | | 2.4% | | | | 9,201 | | | | Less than 0.1% | |
b. Investment Transactions and Related Investment Income. Investment transactions are accounted for on a trade date plus one day basis for daily NAV calculation. However, for financial reporting purposes, investment transactions are reported on trade date. Dividend income (including income reinvested) and foreign withholding tax, if applicable, is recorded on the ex-dividend date, or in the case of certain foreign securities, as soon as a Fund is notified, and interest income is recorded on an accrual basis. Interest income is increased by the accretion of discount and decreased by the amortization of premium, if applicable. Distributions received from investments in securities that represent a return of capital or capital gain are recorded as a reduction of cost of investments or as a realized gain, respectively. In determining net gain or loss on securities sold, the cost of securities has been determined on an identified cost basis. Investment income, non-class specific expenses and realized and unrealized gains and losses are allocated on a pro rata basis to each class based on the relative net assets of each class to the total net assets of the Fund.
c. Foreign Currency Translation. The books and records of the Funds are maintained in U.S. dollars. The values of securities, currencies and other assets and liabilities denominated in currencies other than U.S. dollars, if any, are translated into U.S. dollars based upon foreign exchange rates prevailing at the end of the period. Purchases and sales of investment securities, income and expenses are translated into U.S. dollars on the respective dates of such transactions.
Net realized foreign exchange gains or losses arise from sales of foreign currency, changes in exchange rates between the trade and settlement dates on securities transactions and the difference between the amounts of dividends, interest and foreign withholding taxes recorded on the Funds’ books and the U.S. dollar equivalent of the amounts actually received or paid. Net unrealized foreign exchange gains or losses arise from changes in the value of assets and liabilities, other than investment securities, as of the end of the fiscal period, resulting from changes in exchange rates. Net realized foreign exchange gains or losses and the net change in unrealized foreign exchange gains or losses are disclosed in the Statements of Operations. For federal income tax purposes, net realized foreign exchange gains or losses are characterized as ordinary income, and may, if the Funds have net losses, reduce the amount of income available to be distributed by the Funds.
The values of investment securities are presented at the foreign exchange rates prevailing at the end of the period for financial reporting purposes. Net realized and unrealized gains or losses on investments reported in the Statements of Operations reflect gains or losses resulting from changes in exchange rates and fluctuations which arise due to changes in market prices of investment securities. For federal income tax purposes, a portion of the net realized gain or loss on investments arising from changes in exchange rates, which is reflected in the Statements of Operations, may be characterized as ordinary income and may, if the Funds have net losses, reduce the amount of income available to be distributed by the Funds.
For the period ended December 31, 2020, the amount of income available to be distributed has been reduced by the following amounts as a result of losses arising from changes in exchange rates:
| | | | |
Bond Fund | | $ | 509,724,454 | |
Investment Grade Fixed Income Fund | | | 8,767,983 | |
The Funds may use foreign currency exchange contracts to facilitate transactions in foreign-denominated investments. Losses may arise from changes in the value of the foreign currency or if the counterparties do not perform under the contracts’ terms.
| 34
Notes to Financial Statements – continued
December 31, 2020
d. When-Issued and Delayed Delivery Transactions. The Funds may enter into when-issued or delayed delivery transactions. When-issued refers to transactions made conditionally because a security, although authorized, has not been issued. Delayed delivery refers to transactions for which delivery or payment will occur at a later date, beyond the normal settlement period. The price of when-issued and delayed delivery securities and the date when the securities will be delivered and paid for are fixed at the time the transaction is negotiated. The security and the obligation to pay for it are recorded by the Funds at the time the commitment is entered into. The value of the security may vary with market fluctuations during the time before the Funds take delivery of the security. No interest accrues to the Funds until the transaction settles.
Delayed delivery transactions include those designated as To Be Announced (“TBAs”) in the Portfolios of Investments. For TBAs, the actual security that will be delivered to fulfill the transaction is not designated at the time of the trade. The security is “to be announced” 48 hours prior to the established trade settlement date. Certain transactions require the Funds or counterparty to post cash and/or securities as collateral for the net mark-to-market exposure to the other party. The Funds cover their net obligations under outstanding delayed delivery commitments by segregating or earmarking cash or securities at the custodian.
Purchases of when-issued or delayed delivery securities may have a similar effect on the Funds’ NAV as if the Funds’ had created a degree of leverage in the portfolio. Risks may arise upon entering into such transactions from the potential inability of counterparties to meet their obligations under the transactions. Additionally, losses may arise due to changes in the value of the underlying securities.
There were no when-issued or delayed delivery securities held by the Funds as of December 31, 2020.
e. Federal and Foreign Income Taxes. The Trust treats each Fund as a separate entity for federal income tax purposes. Each Fund intends to meet the requirements of the Internal Revenue Code of 1986, as amended, applicable to regulated investment companies, and to distribute to its shareholders substantially all of its net investment income and any net realized capital gains at least annually. Management has performed an analysis of each Fund’s tax positions for the open tax years as of December 31, 2020 and has concluded that no provisions for income tax are required. The Funds’ federal tax returns for the prior three fiscal years remain subject to examination by the Internal Revenue Service. Management is not aware of any events that are reasonably possible to occur in the next twelve months that would result in the amounts of any unrecognized tax benefits significantly increasing or decreasing for the Funds. However, management’s conclusions regarding tax positions taken may be subject to review and adjustment at a later date based on factors including, but not limited to, new tax laws and accounting regulations and interpretations thereof.
A Fund may be subject to foreign withholding taxes on investment income and taxes on capital gains on investments that are accrued and paid based upon the Fund’s understanding of the tax rules and regulations that exist in the countries in which the Fund invests. Foreign withholding taxes on dividend and interest income are reflected on the Statements of Operations as a reduction of investment income, net of amounts eligible to be reclaimed. Dividends and interest receivable on the Statements of Assets and Liabilities are net of foreign withholding taxes. Foreign withholding taxes where reclaims have been or will be filed are reflected on the Statements of Assets and Liabilities as tax reclaims receivable. Capital gains taxes paid are included in net realized gain (loss) on investments in the Statements of Operations. Accrued but unpaid capital gains taxes are reflected as foreign taxes payable on the Statements of Assets and Liabilities, if applicable, and reduce unrealized gains on investments. In the event that realized gains on investments are subsequently offset by realized losses, taxes paid on realized gains may be returned to a Fund. Such amounts, if applicable, are reflected as foreign tax rebates receivable on the Statements of Assets and Liabilities and are recorded as a realized gain when received.
f. Dividends and Distributions to Shareholders. Dividends and distributions are recorded on the ex-dividend date. The timing and characterization of certain income and capital gain distributions are determined in accordance with federal tax regulations, which may differ from accounting principles generally accepted in the United States of America. Permanent differences are primarily due to differing treatments for book and tax purposes of items such as foreign currency gains and losses, defaulted and/or non-income producing securities, deferred Trustees’ fees, premium amortization, convertible bonds, contingent payment debt instruments, corporate actions, distribution re-designations, return of capital distributions received, capital gain distributions received, trust preferred securities and paydown gains and losses. Permanent book and tax basis differences relating to shareholder distributions, net investment income and net realized gains will result in reclassifications to capital accounts reported on the Statements of Assets and Liabilities. Temporary differences between book and tax distributable earnings are primarily due to deferred Trustees’ fees, wash sales, premium amortization, convertible bonds, defaulted and/or non-income producing securities, return of capital distributions received, trust preferred securities, corporate actions, paydown gains and losses, capital gain distributions received, foreign currency gains and losses and contingent payment debt instruments. Amounts of income and capital gain available to be distributed on a tax basis are determined annually, and at other times during the Funds’ fiscal year as may be necessary to avoid knowingly declaring and paying a return of capital distribution. Distributions from net investment income and net realized short-term capital gains are reported as distributed from ordinary income for tax purposes.
35 |
Notes to Financial Statements – continued
December 31, 2020
The tax characterization of distributions is determined on an annual basis. The tax character of distributions paid to shareholders during the period ended December 31, 2020 and years ended September 30, 2020 and September 30, 2019 were as follows:
| | | | | | | | | | | | | | | | | | | | | | | | |
| | | December 31, 2020
Distributions | | | September 30, 2020
Distributions | |
Fund | | Ordinary
Income | | | Long-Term
Capital Gains | | | Total | | | Ordinary
Income | | | Long-Term
Capital Gains | | | Total | |
Bond Fund | | $ | 109,153,682 | | | $ | 35,454,933 | | | $ | 144,608,615 | | | $ | 329,048,727 | | | $ | 12,377,899 | | | $ | 341,426,626 | |
Investment Grade Fixed Income Fund | | | 2,831,850 | | | | 7,337,537 | | | | 10,169,387 | | | | 6,726,290 | | | | 938,614 | | | | 7,664,904 | |
| | | | |
| | | September 30, 2019
Distributions | | | | | | | | | | |
| | | Ordinary
Income | | | Long-Term
Capital Gains | | | Total | | | | | | | | | | |
Bond Fund | | $ | 402,223,224 | | | $ | 36,170,163 | | | $ | 438,393,387 | | | | | | | | | | | | | |
Investment Grade Fixed Income Fund | | | 5,468,364 | | | | 4,090,610 | | | | 9,558,974 | | | | | | | | | | | | | |
Distributions paid to shareholders from net investment income and net realized capital gains, based on accounting principles generally accepted in the United States of America, are consolidated and reported on the Statements of Changes in Net Assets as Distributions to Shareholders. Distributions paid to shareholders from net investment income and net realized capital gains expressed in per-share amounts, based on accounting principles generally accepted in the United States of America, are separately stated and reported within the Financial Highlights.
As of December 31, 2020, the components of distributable earnings on a tax basis were as follows:
| | | | | | | | |
| | | Bond Fund | | | Investment
Grade Fixed
Income Fund | |
Post-October capital loss deferrals* | | $ | (239,352,474 | ) | | $ | (745,312 | ) |
| | | | | | | | |
Unrealized appreciation | | | 98,148,469 | | | | 22,416,673 | |
| | | | | | | | |
Total accumulated earnings (losses) | | $ | (141,204,005 | ) | | $ | 21,671,361 | |
| | | | | | | | |
Capital loss carryforward utilized in the current year | | $ | 111,860,218 | | | $ | — | |
| | | | | | | | |
* Under current tax law, capital losses, foreign currency losses, and losses on passive foreign investment companies and contingent payment debt instruments after October 31 or December 31, as applicable, may be deferred and treated as occurring on the first day of the following taxable year. Bond Fund and Investment Grade Fixed Income Fund are deferring capital losses.
As of December 31, 2020, unrealized appreciation (depreciation) as a component of distributable earnings were as follows:
| | | | | | | | |
| | | Bond Fund | | | Investment
Grade Fixed
Income Fund | |
Unrealized appreciation (depreciation) | | | | | | | | |
Investments | | $ | 99,140,421 | | | $ | 22,427,797 | |
Foreign currency translations | | | (991,952 | ) | | | (11,124 | ) |
| | | | | | | | |
Total unrealized appreciation | | $ | 98,148,469 | | | $ | 22,416,673 | |
| | | | | | | | |
As of December 31, 2020, the tax cost of investments and unrealized appreciation (depreciation) on a federal tax basis were as follows:
| | | | | | | | |
| | | Bond Fund | | | Investment
Grade Fixed
Income Fund | |
Federal tax cost | | $ | 8,873,194,756 | | | $ | 228,963,139 | |
| | | | | | | | |
Gross tax appreciation | | $ | 773,013,478 | | | $ | 26,701,281 | |
Gross tax depreciation | | | (674,864,159 | ) | | | (4,284,608 | ) |
| | | | | | | | |
Net tax appreciation | | $ | 98,149,319 | | | $ | 22,416,673 | |
| | | | | | | | |
The difference between these amounts and those reported in the components of distributable earnings are primarily attributable to foreign currency mark-to-market.
| 36
Notes to Financial Statements – continued
December 31, 2020
g. Senior Loans. Each Fund may invest in senior loans to corporate, governmental or other borrowers. Senior loans, which include both secured and unsecured loans made by banks and other financial institutions to corporate customers, typically hold the most senior position in a borrower’s capital structure, may be secured by the borrower’s assets and have interest rates that reset frequently. Senior Loans can include term loans, revolving credit facility loans and second lien loans. A senior loan is often administered by a bank or other financial institution that acts as agent for all holders. The agent administers the terms of the senior loan, as specified in the loan agreement. Large loans may be shared or syndicated among several lenders. A Fund may enter into the primary syndicate for a loan or it may also purchase all or a portion of loans from other lenders (sometimes referred to as loan assignments), in either case becoming a direct lender. Senior loans outstanding at the end of the period, if any, are listed in each applicable Fund’s Portfolio of Investments.
h. Collateralized Loan Obligations. Each Fund may invest in collateralized loan obligations (“CLOs”). A CLO is a type of asset-backed security designed to redirect the cash flows from a pool of leveraged loans to investors based on their risk preferences. Cash flows from a CLO are split into two or more portions, called tranches, varying in risk and yield. The risk of an investment in a CLO depends largely on the type of the collateralized securities and the class of the instrument in which the Fund invests. The intent of the Funds when investing in CLOs is to purchase only higher level, investment grade level select tranches. CLOs outstanding at the end of the period, if any, are listed in each applicable Fund’s Portfolio of Investments.
i. Repurchase Agreements. Each Fund may enter into repurchase agreements, under the terms of a Master Repurchase Agreement, under which each Fund acquires securities as collateral and agrees to resell the securities at an agreed upon time and at an agreed upon price. It is each Fund’s policy that the market value of the collateral for repurchase agreements be at least equal to 102% of the repurchase price, including interest. Certain repurchase agreements are tri-party arrangements whereby the collateral is held in a segregated account for the benefit of the Fund and on behalf of the counterparty. Repurchase agreements could involve certain risks in the event of default or insolvency of the counterparty, including possible delays or restrictions upon a Fund’s ability to dispose of the underlying securities. As of December 31, 2020, each Fund, as applicable, had investments in repurchase agreements for which the value of the related collateral exceeded the value of the repurchase agreement. The gross value of repurchase agreements is included in the Statements of Assets and Liabilities for financial reporting purposes.
j. Securities Lending. The Funds have entered into an agreement with State Street Bank and Trust Company (“State Street Bank”), as agent of the Funds, to lend securities to certain designated borrowers. The loans are collateralized with cash or securities in an amount equal to at least 105% or 102% of the market value (including accrued interest) of the loaned international or domestic securities, respectively, when the loan is initiated. Thereafter, the value of the collateral must remain at least 102% of the market value (including accrued interest) of loaned securities for U.S. equities and U.S. corporate debt; at least 105% of the market value (including accrued interest) of loaned securities for non-U.S. equities; and at least 100% of the market value (including accrued interest) of loaned securities for U.S. Government securities, sovereign debt issued by non-U.S. Governments and non-U.S. corporate debt. In the event that the market value of the collateral falls below the required percentages described above, the borrower will deliver additional collateral on the next business day. As with other extensions of credit, the Funds may bear the risk of loss with respect to the investment of the collateral. The Funds invest cash collateral in short-term investments, a portion of the income from which is remitted to the borrowers and the remainder allocated between the Funds and State Street Bank as lending agent.
For the period ended December 31, 2020, neither Fund had loaned securities under this agreement.
k. Indemnifications. Under the Trust’s organizational documents, its officers and Trustees are indemnified against certain liabilities arising out of the performance of their duties to the Funds. Additionally, in the normal course of business, the Funds enter into contracts with service providers that contain general indemnification clauses. The Funds’ maximum exposure under these arrangements is unknown as this would involve future claims that may be made against the Funds that have not yet occurred. However, based on experience, the Funds expect the risk of loss to be remote.
l. New Accounting Pronouncement. In March 2020, the Financial Accounting Standards Board issued Accounting Standard Update 2020-04, Reference Rate Reform (Topic 848) (“ASU 2020-04”). In response to concerns about structural risks of interbank offered rates, and particularly the risk of cessation of the London Interbank Offered Rate (“LIBOR”), which is expected to occur no later than December 31, 2021, regulators have undertaken reference rate reform initiatives to identify alternative reference rates that are more observable or transaction based and less susceptible to manipulation. ASU 2020-04 provides temporary guidance to ease the potential burden in accounting for (or recognizing the effects of) reference rate reform on financial reporting. ASU 2020-04 is elective and applies to all entities, subject to meeting certain criteria, that have contracts that reference LIBOR or another reference rate expected to be discontinued because of reference rate reform. ASU 2020-04 amendments offer optional expedients for contract modifications that would allow an entity to account for such modifications by prospectively adjusting the effective interest rate, instead of evaluating each contract, in accordance with existing accounting standards, as to whether reference rate modifications constitute the establishment of new contracts or the continuation of existing contracts. ASU 2020-04 amendments are currently effective and an entity may elect to apply its provisions as of any date from the beginning of an interim period that includes or is subsequent to March 12, 2020. No Fund contracts have yet been impacted by reference rate reform. Management expects to apply the optional expedients when appropriate.
37 |
Notes to Financial Statements – continued
December 31, 2020
3. Fair Value Measurements. In accordance with accounting standards related to fair value measurements and disclosures, the Funds have categorized the inputs utilized in determining the value of each Fund’s assets or liabilities. These inputs are summarized in the three broad levels listed below:
| | • | | Level 1—quoted prices in active markets for identical assets or liabilities; |
| | • | | Level 2—prices determined using other significant inputs that are observable either directly, or indirectly through corroboration with observable market data (which could include quoted prices for similar assets or liabilities, interest rates, credit risk, etc.); and |
| | • | | Level 3—prices determined using significant unobservable inputs when quoted prices or observable inputs are unavailable such as when there is little or no market activity for an asset or liability (unobservable inputs reflect each Fund’s own assumptions in determining the fair value of assets or liabilities and would be based on the best information available). |
The inputs or methodology used for valuing securities are not necessarily an indication of the risk associated with investing in those securities.
The Funds’ pricing policies and procedures are recommended by the adviser and approved by the Board of Trustees. Debt securities are valued based on evaluated bids furnished to the Funds by an independent pricing service. Broker-dealer bid prices may be used if an independent pricing service either is unable to price a security or does not provide a reliable price for a security. The Funds’ adviser may use internally developed models to validate broker-dealer bid prices that are only available from a single broker or market maker. Such securities are considered and classified as fair valued. Broker-dealer bid prices for which the Funds do not have knowledge of the inputs used by the broker-dealer are categorized in Level 3. Securities for which market quotations are not readily available are valued at fair value as determined in good faith by the Funds’ adviser pursuant to procedures approved by the Board of Trustees. Fair valued securities may be categorized in Level 3.
The following is a summary of the inputs used to value the Funds’ investments as of December 31, 2020, at value:
Bond Fund
Asset Valuation Inputs
| | | | | | | | | | | | | | | | |
Description | | Level 1 | | | Level 2 | | | Level 3 | | | Total | |
Bonds and Notes | | | | | | | | | | | | | | | | |
Non-Convertible Bonds | | | | | | | | | | | | | | | | |
ABS Other | | $ | — | | | $ | — | | | $ | 26,341,487 | (b)(c) | | $ | 26,341,487 | |
Finance Companies | | | 3,787,483 | | | | 584,165,714 | | | | 1,205,500 | (d) | | | 589,158,697 | |
All Other Non-Convertible Bonds(a) | | | — | | | | 5,743,987,489 | | | | — | | | | 5,743,987,489 | |
| | | | | | | | | | | | | | | | |
Total Non-Convertible Bonds | | | 3,787,483 | | | | 6,328,153,203 | | | | 27,546,987 | | | | 6,359,487,673 | |
| | | | | | | | | | | | | | | | |
Convertible Bonds(a) | | | — | | | | 352,096,953 | | | | — | | | | 352,096,953 | |
Municipals(a) | | | — | | | | 131,794,378 | | | | — | | | | 131,794,378 | |
| | | | | | | | | | | | | | | | |
Total Bonds and Notes | | | 3,787,483 | | | | 6,812,044,534 | | | | 27,546,987 | | | | 6,843,379,004 | |
| | | | | | | | | | | | | | | | |
Senior Loans(a) | | | — | | | | 28,713,061 | | | | — | | | | 28,713,061 | |
Common Stocks | | | | | | | | | | | | | | | | |
Chemicals | | | — | | | | 9,484,090 | | | | — | | | | 9,484,090 | |
Oil, Gas & Consumable Fuels | | | 38,118,283 | | | | 1,945,463 | | | | 4,623,706 | (c)(d) | | | 44,687,452 | |
Software | | | 3,153,249 | | | | 195,604 | | | | — | | | | 3,348,853 | |
All Other Common Stocks(a) | | | 884,220,340 | | | | — | | | | — | | | | 884,220,340 | |
| | | | | | | | | | | | | | | | |
Total Common Stocks | | | 925,491,872 | | | | 11,625,157 | | | | 4,623,706 | | | | 941,740,735 | |
| | | | | | | | | | | | | | | | |
Preferred Stocks | | | | | | | | | | | | | | | | |
Convertible Preferred Stocks | | | | | | | | | | | | | | | | |
Food & Beverage | | | — | | | | 1,929,067 | | | | — | | | | 1,929,067 | |
Energy | | | — | | | | — | | | | — | (c) | | | — | |
All Other Convertible Preferred Stocks(a) | | | 53,767,838 | | | | — | | | | — | | | | 53,767,838 | |
| | | | | | | | | | | | | | | | |
Total Convertible Preferred Stocks | | | 53,767,838 | | | | 1,929,067 | | | | — | | | | 55,696,905 | |
| | | | | | | | | | | | | | | | |
| 38
Notes to Financial Statements – continued
December 31, 2020
Bond Fund
Asset Valuation Inputs – continued
| | | | | | | | | | | | | | | | |
Description | | Level 1 | | | Level 2 | | | Level 3 | | | Total | |
Non-Convertible Preferred Stocks | | | | | | | | | | | | | | | | |
Electric | | $ | — | | | $ | 142,504 | | | $ | — | | | $ | 142,504 | |
REITs—Office Property | | | — | | | | 2,781,600 | | | | — | | | | 2,781,600 | |
REITs—Warehouse/Industrials | | | — | | | | 11,661,483 | | | | — | | | | 11,661,483 | |
All Other Non-Convertible Preferred Stocks(a) | | | 833,937 | | | | — | | | | — | | | | 833,937 | |
| | | | | | | | | | | | | | | | |
Total Non-Convertible Preferred Stocks | | | 833,937 | | | | 14,585,587 | | | | — | | | | 15,419,524 | |
| | | | | | | | | | | | | | | | |
Total Preferred Stocks | | | 54,601,775 | | | | 16,514,654 | | | | — | | | | 71,116,429 | |
| | | | | | | | | | | | | | | | |
Warrants | | | — | | | | — | | | | 10,234,074 | (d) | | | 10,234,074 | |
Closed-End Investment Companies | | | 1,788,421 | | | | — | | | | — | | | | 1,788,421 | |
Short-Term Investments | | | — | | | | 1,074,372,351 | | | | — | | | | 1,074,372,351 | |
| | | | | | | | | | | | | | | | |
Total | | $ | 985,669,551 | | | $ | 7,943,269,757 | | | $ | 42,404,767 | | | $ | 8,971,344,075 | |
| | | | | | | | | | | | | | | | |
(a) Details of the major categories of the Fund’s investments are reflected within the Portfolio of Investments.
(b) Valued using broker-dealer bid prices ($17,996,929) or fair valued by the Fund’s adviser using a broker-dealer bid price provided by a single market maker ($8,344,558).
(c) Includes a security fair valued at zero by the Fund’s adviser using Level 3 inputs.
(d) Fair valued by the Fund’s adviser.
Investment Grade Fixed Income Fund
Asset Valuation Inputs
| | | | | | | | | | | | | | | | |
Description | | Level 1 | | | Level 2 | | | Level 3 | | | Total | |
Bonds and Notes | | | | | | | | | | | | | | | | |
Non-Convertible Bonds | | | | | | | | | | | | | | | | |
ABS Home Equity | | $ | — | | | $ | 584,244 | | | $ | 9,201 | (b) | | $ | 593,445 | |
ABS Other | | | — | | | | 1,495,095 | | | | 1,149,776 | (c) | | | 2,644,871 | |
All Other Non-Convertible Bonds(a) | | | — | | | | 212,996,906 | | | | — | | | | 212,996,906 | |
| | | | | | | | | | | | | | | | |
Total Non-Convertible Bonds | | | — | | | | 215,076,245 | | | | 1,158,977 | | | | 216,235,222 | |
| | | | | | | | | | | | | | | | |
Convertible Bonds(a) | | | — | | | | 4,657,446 | | | | — | | | | 4,657,446 | |
Municipals(a) | | | — | | | | 1,179,157 | | | | — | | | | 1,179,157 | |
| | | | | | | | | | | | | | | | |
Total Bonds and Notes | | | — | | | | 220,912,848 | | | | 1,158,977 | | | | 222,071,825 | |
| | | | | | | | | | | | | | | | |
Collateralized Loan Obligations | | | — | | | | 854,319 | | | | — | | | | 854,319 | |
Common Stocks(a) | | | 15,420,180 | | | | — | | | | — | | | | 15,420,180 | |
Preferred Stocks | | | | | | | | | | | | | | | | |
Convertible Preferred Stocks | | | | | | | | | | | | | | | | |
Energy | | | — | | | | — | | | | — | (d) | | | — | |
Food & Beverage | | | — | | | | 30,568 | | | | — | | | | 30,568 | |
All Other Convertible Preferred Stocks(a) | | | 1,973,301 | | | | — | | | | — | | | | 1,973,301 | |
| | | | | | | | | | | | | | | | |
Total Convertible Preferred Stocks | | | 1,973,301 | | | | 30,568 | | | | — | | | | 2,003,869 | |
| | | | | | | | | | | | | | | | |
Non-Convertible Preferred Stocks(a) | | | — | | | | 207,079 | | | | — | | | | 207,079 | |
| | | | | | | | | | | | | | | | |
Total Preferred Stocks | | | 1,973,301 | | | | 237,647 | | | | — | | | | 2,210,948 | |
| | | | | | | | | | | | | | | | |
Short-Term Investments | | | — | | | | 10,822,540 | | | | — | | | | 10,822,540 | |
| | | | | | | | | | | | | | | | |
Total | | $ | 17,393,481 | | | $ | 232,827,354 | | | $ | 1,158,977 | | | $ | 251,379,812 | |
| | | | | | | | | | | | | | | | |
(a) Details of the major categories of the Fund’s investments are reflected within the Portfolio of Investments.
(b) Fair valued by the Fund’s adviser.
(c) Valued using broker-dealer bid prices.
(d) Includes a security fair valued at zero by the Fund’s adviser using level 3 inputs.
39 |
Notes to Financial Statements – continued
December 31, 2020
The following is a reconciliation of Level 3 investments for which significant unobservable inputs were used to determine fair value as of September 30, 2020 and/or December 31, 2020:
Bond Fund
Asset Valuation Inputs
| | | | | | | | | | | | | | | | | | | | | | | | | | | | | | | | | | | | | | | | |
Investments in Securities | | Balance as of
September 30,
2020 | | | Accrued
Discounts
(Premiums) | | | Realized
Gain
(Loss) | | | Change in
Unrealized
Appreciation
(Depreciation) | | | Purchases | | | Sales | | | Transfers
into
Level 3 | | | Transfers
out of
Level 3 | | | Balance as of
December 31,
2020 | | | Change in
Unrealized
Appreciation
(Depreciation)
from
Investments
Still Held at
December 31,
2020 | |
Bonds and Notes | | | | | | | | | | | | | | | | | | | | | | | | | | | | | | | | | | | | | | | | |
Non-Convertible Bonds | | | | | | | | | | | | | | | | | | | | | | | | | | | | | | | | | | | | | | | | |
ABS Other | | $ | 26,487,320 | (a) | | $ | — | | | $ | 195 | | | $ | 67,687 | | | $ | 371,202 | | | $ | (584,917 | ) | | $ | — | | | $ | — | | | $ | 26,341,487 | (a) | | $ | (15,229 | ) |
Finance Companies | | | 994,938 | | | | 400 | | | | — | | | | 210,162 | | | | — | | | | — | | | | — | | | | — | | | | 1,205,500 | | | | 210,162 | |
Common Stocks | | | | | | | | | | | | | | | | | | | | | | | | | | | | | | | | | | | | | | | | |
Oil, Gas & Consumable Fuels | | | 133,992 | (a) | | | — | | | | (2,950,992 | ) | | | 2,817,000 | | | | 4,623,706 | | | | — | | | | — | | | | — | | | | 4,623,706 | (a) | | | — | |
Preferred Stocks | | | | | | | | | | | | | | | | | | | | | | | | | | | | | | | | | | | | | | | | |
Convertible Preferred Stocks | | | | | | | | | | | | | | | | | | | | | | | | | | | | | | | | | | | | | | | | |
Energy | | | — | (a) | | | — | | | | — | | | | — | | | | — | | | | — | | | | — | | | | — | | | | — | (a) | | | — | |
Warrants | | | 8,436 | | | | — | | | | — | | | | 5,268,601 | | | | — | | | | — | | | | 4,957,037 | | | | — | | | | 10,234,074 | | | | 5,268,601 | |
| | | | | | | | | | | | | | | | | | | | | | | | | | | | | | | | | | | | | | | | |
Total | | $ | 27,624,686 | | | $ | 400 | | | $ | (2,950,797 | ) | | $ | 8,363,450 | | | $ | 4,994,908 | | | $ | (584,917 | ) | | $ | 4,957,037 | | | $ | — | | | $ | 42,404,767 | | | $ | 5,463,534 | |
| | | | | | | | | | | | | | | | | | | | | | | | | | | | | | | | | | | | | | | | |
(a) Includes a security fair valued at zero by the Fund’s adviser using Level 3 inputs.
Warrants valued at $4,957,037 were transferred from Level 2 to Level 3 during the period ended December 31, 2020. At December 31, 2019, this security was valued on the basis of closing bid quotations furnished to the Fund by an independent pricing service in accordance with the Fund’s valuation policies. At December 31, 2020, this security was valued at fair value as determined in good faith by the Fund’s adviser as an independent pricing service did not provide a reliable price for the security.
Investment Grade Fixed Income Fund
Asset Valuation Inputs
| | | | | | | | | | | | | | | | | | | | | | | | | | | | | | | | | | | | | | | | |
Investments in Securities | | Balance as of
September 30,
2020 | | | Accrued
Discounts
(Premiums) | | | Realized
Gain
(Loss) | | | Change in
Unrealized
Appreciation
(Depreciation) | | | Purchases | | | Sales | | | Transfers
into
Level 3 | | | Transfers
out of
Level 3 | | | Balance as of
December 31,
2020 | | | Change in
Unrealized
Appreciation
(Depreciation)
from
Investments
Still Held at
December 31,
2020 | |
Bonds and Notes | | | | | | | | | | | | | | | | | | | | | | | | | | | | | | | | | | | | | | | | |
Non-Convertible Bonds | | | | | | | | | | | | | | | | | | | | | | | | | | | | | | | | | | | | | | | | |
ABS Home Equity | | $ | 9,826 | | | $ | — | | | $ | 16 | | | $ | 105 | | | $ | — | | | $ | (746 | ) | | $ | — | | | $ | — | | | $ | 9,201 | | | $ | 8 | |
ABS Other | | | 1,149,776 | | | | — | | | | — | | | | — | | | | — | | | | — | | | | — | | | | — | | | | 1,149,776 | | | | — | |
Preferred Stocks | | | | | | | | | | | | | | | | | | | | | | | | | | | | | | | | | | | | | | | | |
Convertible Preferred Stocks | | | | | | | | | | | | | | | | | | | | | | | | | | | | | | | | | | | | | |
Energy | | | — | (a) | | | — | | | | — | | | | — | | | | — | | | | — | | | | — | | | | — | | | | — | (a) | | | — | |
| | | | | | | | | | | | | | | | | | | | | | | | | | | | | | | | | | | | | | | | |
Total | | $ | 1,159,602 | | | $ | — | | | $ | 16 | | | $ | 105 | | | $ | — | | | $ | (746 | ) | | $ | — | | | $ | — | | | $ | 1,158,977 | | | $ | 8 | |
| | | | | | | | | | | | | | | | | | | | | | | | | | | | | | | | | | | | | | | | |
(a) Includes a security fair valued at zero by the Fund’s adviser using Level 3 inputs.
4. Purchases and Sales of Securities. For the period ended December 31, 2020, purchases and sales of securities (excluding short-term investments and including paydowns) were as follows:
| | | | | | | | | | | | | | | | |
| | | U.S. Government/Agency
Securities | | | Other Securities | |
Fund | | Purchases | | | Sales | | | Purchases | | | Sales | |
Bond Fund | | $ | 551,607,938 | | | $ | 1,003,976,251 | | | $ | 1,499,004,598 | | | $ | 2,182,148,114 | |
Investment Grade Fixed Income Fund | | | 23,856,326 | | | | 20,229,394 | | | | 61,233,987 | | | | 45,575,096 | |
| 40
Notes to Financial Statements – continued
December 31, 2020
5. Management Fees and Other Transactions with Affiliates.
a. Management Fees. Loomis, Sayles & Company, L.P. (“Loomis Sayles”) serves as investment adviser to each Fund. Loomis Sayles is a limited partnership whose sole general partner, Loomis, Sayles & Company, Inc., is indirectly owned by Natixis Investment Managers, LLC (“Natixis”), which is part of Natixis Investment Managers, an international asset management group based in Paris, France.
Under the terms of the management agreements, each Fund pays a management fee at the following annual rates, calculated daily and payable monthly, based on each Fund’s average daily net assets:
| | | | | | | | | | | | | | | | |
| | | Percentage of Average Daily Net Assets | |
Fund | | First
$3 Billion | | | Next
$12 Billion | | | Next
$10 Billion | | | Over
$25 Billion | |
Bond Fund | | | 0.60% | | | | 0.50% | | | | 0.49% | | | | 0.48% | |
Investment Grade Fixed Income Fund | | | 0.40% | | | | 0.40% | | | | 0.40% | | | | 0.40% | |
Loomis Sayles has given binding undertakings to the Funds to waive management fees and/or reimburse certain expenses to limit the Funds’ operating expenses, exclusive of acquired fund fees and expenses, brokerage expenses, interest expense, taxes, organizational and extraordinary expenses such as litigation and indemnification expenses. These undertakings are in effect until January 31, 2022, may be terminated before then only with the consent of the Funds’ Board of Trustees, and are reevaluated on an annual basis. Management fees payable, as reflected on the Statements of Assets and Liabilities, are net of waivers and/or expense reimbursements, if any, pursuant to these undertakings. Waivers/reimbursements that exceed management fees payable are reflected on the Statements of Assets and Liabilities as receivable from investment adviser.
For the period ended December 31, 2020, the expense limits as a percentage of average daily net assets under the expense limitation agreements were as follows:
| | | | | | | | | | | | | | | | |
| | | Expense Limit as a Percentage of
Average Daily Net Assets | |
Fund | | Institutional
Class | | | Retail
Class | | | Admin
Class | | | Class N | |
Bond Fund | | | 0.67% | | | | 0.92% | | | | 1.17% | | | | 0.62% | |
Investment Grade Fixed Income Fund | | | 0.55% | | | | — | | | | — | | | | — | |
Loomis Sayles shall be permitted to recover expenses borne under the expense limitation agreements (whether through waiver of management fees or otherwise) on a class by class basis in later periods to the extent the annual operating expenses of a class fall below a class’ expense limits, provided, however, that a class is not obligated to pay such waived/reimbursed fees or expenses more than one year after the end of the fiscal year in which the fees or expenses were waived/reimbursed.
For the period ended December 31, 2020, the management for each Fund were as follows:
| | | | | | | | | | | | | | | | | | | | |
Fund | | Gross
Management
Fees | | | Contractual
Waivers of
Management
Fees1 | | | Net
Management
Fees | | | Percentage of
Average Daily
Net Assets | |
| | Gross | | | Net | |
Bond Fund | | $ | 12,121,027 | | | $ | — | | | $ | 12,121,027 | | | | 0.53% | | | | 0.53% | |
Investment Grade Fixed Income Fund | | | 237,554 | | | | 68,314 | | | | 169,240 | | | | 0.40% | | | | 0.28% | |
For the period ended December 31, 2020, class-specific expenses have been reimbursed as follows:
| | | | | | | | | | | | | | | | | | | | |
| | | Reimbursement1 | |
Fund | | Institutional
Class | | | Retail
Class | | | Admin
Class | | | Class N | | | Total | |
Bond Fund | | $ | 75,906 | | | $ | 16,860 | | | $ | 569 | | | $ | — | | | $ | 93,335 | |
1Waiver/expense reimbursements are subject to possible recovery until December 31, 2021.
Expense reimbursements represent less than 0.01% of net assets for each class of Bond Fund.
No expenses were recovered for either Fund during the period ended December 31, 2020 under the terms of the expense limitation agreements.
b. Service and Distribution Fees. Natixis Distribution, L.P. (“Natixis Distribution”) which is a wholly-owned subsidiary of Natixis, has entered into a distribution agreement with the Trust. Pursuant to this agreement, Natixis Distribution serves as principal underwriter of the Funds of the Trust.
41 |
Notes to Financial Statements – continued
December 31, 2020
Pursuant to Rule 12b-1 under the 1940 Act, Bond Fund has adopted Distribution Plans relating to the Fund’s Retail Class shares (the “Retail Class Plan”) and Admin Class shares (the “Admin Class Plan”).
Under the Retail Class Plan, Bond Fund pays Natixis Distribution a monthly distribution fee at an annual rate not to exceed 0.25% of the average daily net assets attributable to the Fund’s Retail Class shares, as compensation for services provided by Natixis Distribution in connection with the marketing or sale of Retail Class shares or for payments made by Natixis Distribution to securities dealers or other financial intermediaries as commissions, asset-based sales charges or other compensation with respect to the sale of Retail Class shares, or for providing personal services to investors and/or the maintenance of shareholder accounts.
Under the Admin Class Plan, Bond Fund pays Natixis Distribution a monthly distribution fee at an annual rate not to exceed 0.25% of the average daily net assets attributable to the Fund’s Admin Class shares, as compensation for services provided by Natixis Distribution in connection with the marketing or sale of Admin Class shares or for payments made by Natixis Distribution to securities dealers or other financial intermediaries as commissions, asset-based sales charges or other compensation with respect to the sales of Admin Class shares, or for providing personal services to investors and/or the maintenance of shareholder accounts.
In addition, the Admin Class shares of Bond Fund may pay Natixis Distribution an administrative service fee, at an annual rate not to exceed 0.25% of the average daily net assets attributable to Admin Class shares. These fees are subsequently paid to securities dealers or financial intermediaries for providing personal services and/or account maintenance for their customers who hold such shares.
For the period ended December 31, 2020, the service and distribution fees for Bond Fund were as follows:
| | | | |
Service Fees | | Distribution Fees |
Admin Class | | Retail Class | | Admin Class |
| $31,803 | | $929,039 | | $31,803 |
c. Administrative Fees. Natixis Advisors, L.P. (“Natixis Advisors”) provides certain administrative services for the Funds and contracts with State Street Bank to serve as sub-administrator. Pursuant to an agreement among Natixis Funds Trusts, Loomis Sayles Funds Trusts, Natixis ETF Trusts and Natixis Advisors, each Fund pays Natixis Advisors monthly its pro rata portion of fees equal to an annual rate of 0.0540% of the first $15 billion of the average daily net assets of the Natixis Funds Trusts, Loomis Sayles Funds Trusts and Natixis ETF Trusts, 0.0500% of the next $15 billion, 0.0400% of the next $30 billion, 0.0275% of the next $30 billion and 0.0225% of such assets in excess of $90 billion, subject to an annual aggregate minimum fee for the Natixis Funds Trusts, Loomis Sayles Funds Trusts and Natixis ETF Trusts of $10 million, which is reevaluated on an annual basis.
For the period ended December 31, 2020, the administrative fees for each Fund were as follows:
| | | | |
Fund | | Administrative
Fees | |
Bond Fund | | $ | 954,262 | |
Investment Grade Fixed Income Fund | | | 25,864 | |
d. Sub-Transfer Agent Fees. Natixis Distribution has entered into agreements, which include servicing agreements, with financial intermediaries that provide recordkeeping, processing, shareholder communications and other services to customers of the intermediaries that hold positions in the Funds and has agreed to compensate the intermediaries for providing those services. Intermediaries transact with the Funds primarily through the use of omnibus accounts on behalf of their customers who hold positions in the Funds. These services would have been provided by the Funds’ transfer agent and other service providers if the shareholders’ accounts were maintained directly at the Funds’ transfer agent. Accordingly, the Funds have agreed to reimburse Natixis Distribution for all or a portion of the servicing fees paid to these intermediaries. The reimbursement amounts (sub-transfer agent fees) paid to Natixis Distribution are subject to a current per-account equivalent fee limit approved by the Funds’ Board of Trustees, which is based on fees for similar services paid to the Funds’ transfer agent and other service providers. Class N shares do not bear such expenses.
For the period ended December 31, 2020, the sub-transfer agent fees (which are reflected in transfer agent fees and expenses in the Statements of Operations) for Bond Fund were $1,461,243.
As of December 31, 2020, Bond Fund owes Natixis Distribution $70,949 in reimbursements for sub-transfer agent fees (which are reflected in the Statement of Assets and Liabilities as payable to distributor).
Sub-transfer agent fees attributable to Institutional Class, Retail Class and Admin Class are allocated on a pro rata basis to each class based on the relative net assets of each class to the total net assets of those classes.
e. Trustees Fees and Expenses. The Trust does not pay any compensation directly to its officers or Trustees who are directors, officers or employees of Natixis Advisors, Natixis Distribution, Natixis or their affiliates. The Chairperson of the Board of Trustees receives a retainer fee
| 42
Notes to Financial Statements – continued
December 31, 2020
at the annual rate of $369,000. The Chairperson does not receive any meeting attendance fees for Board of Trustees meetings or committee meetings that he attends. Each Independent Trustee (other than the Chairperson) receives, in the aggregate, a retainer fee at the annual rate of $199,000. Each Independent Trustee also receives a meeting attendance fee of $10,000 for each meeting of the Board of Trustees that he or she attends in person and $5,000 for each meeting of the Board of Trustees that he or she attends telephonically. In addition, the chairperson of the Contract Review Committee, the chairperson of the Audit Committee and the chairperson of the Governance Committee each receive an additional retainer fee at the annual rate of $20,000. Each Contract Review Committee member is compensated $6,000 for each Committee meeting that he or she attends in person and $3,000 for each meeting that he or she attends telephonically. Each Audit Committee member is compensated $6,000 for each Committee meeting that he or she attends in person and $3,000 for each meeting that he or she attends telephonically. These fees are allocated among the funds in the Natixis Funds Trusts, Loomis Sayles Funds Trusts and Natixis ETF Trusts based on a formula that takes into account, among other factors, the relative net assets of each fund. Trustees are reimbursed for travel expenses in connection with attendance at meetings.
A deferred compensation plan (the “Plan”) is available to the Trustees on a voluntary basis. Deferred amounts remain in the Funds until distributed in accordance with the provisions of the Plan. The value of a participating Trustee’s deferral account is based on theoretical investments of deferred amounts, on the normal payment dates, in certain funds of the Natixis Funds Trusts, Loomis Sayles Funds Trusts and Natixis ETF Trusts as designated by the participating Trustees. Changes in the value of participants’ deferral accounts are allocated pro rata among the funds in the Natixis Funds Trusts, Loomis Sayles Funds Trusts and Natixis ETF Trusts, and are normally reflected as Trustees’ fees and expenses in the Statements of Operations. The portions of the accrued obligations allocated to the Funds under the Plan are reflected as Deferred Trustees’ fees in the Statements of Assets and Liabilities.
Certain officers and employees of Natixis Advisors and Loomis Sayles are also officers and/or Trustees of the Trust.
f. Affiliated Ownership. As of December 31, 2020, Loomis Sayles Employees’ Profit Sharing Retirement Plan held shares of Bond Fund representing 0.36% of the Fund’s net assets.
g. Affiliated Transactions. As a result of a business restructuring, Bond Fund received common shares of Lonestar Resources U.S., Inc. (the “Company”) constituting more than 5% of the voting securities of the Company. As such, the Company is considered to be an affiliate at December 31, 2020. A summary of affiliated transactions for the period ended December 31, 2020, is as follows:
| | | | | | | | | | | | | | | | | | | | | | | | | | | | | | | | |
| | | Beginning
Value | | | Purchase
Cost | | | Sales
Proceeds | | | Accrued
Discounts
(Premiums) | | | Realized
Gain (Loss) | | | Change in
Unrealized
Gain (Loss) | | | Ending
Value | | | Investment
Income | |
Lonestar Resources U.S., Inc. | | $ | — | | | $ | 4,623,706 | * | | $ | — | | | $ | — | | | $ | — | | | $ | — | | | $ | 4,623,706 | | | $ | — | |
| * | Represents basis assigned upon receipt in a taxable restructuring. |
6. Class-Specific Transfer Agent Fees and Expenses. Transfer agent fees and expenses for Bond Fund attributable to Institutional Class, Retail Class and Admin Class are allocated on a pro rata basis to each class based on relative net assets of each class to the total net assets of those classes. Transfer agent fees and expenses attributable to Class N are allocated to Class N.
For the period ended December 31, 2020, Bond Fund incurred the following class-specific transfer agent fees and expenses (including sub-transfer agent fees, where applicable):
| | | | | | | | | | | | | | | | |
| | | Transfer Agent Fees and Expenses | |
Fund | | Institutional
Class | | | Retail
Class | | | Admin
Class | | | Class N | |
Bond Fund | | $ | 1,237,556 | | | $ | 275,322 | | | $ | 9,426 | | | $ | 2,178 | |
7. Line of Credit. Each Fund, together with certain other funds of Natixis Funds Trusts, Loomis Sayles Funds Trusts and Natixis ETF Trusts, entered into a $400,000,000 committed unsecured line of credit provided by State Street Bank. Any one Fund may borrow up to $350,000,000 under the line of credit agreement (as long as all borrowings by all Funds in the aggregate do not exceed the $400,000,000 limit at any time), subject to each Fund’s investment restrictions and its contractual obligations under the line of credit. Interest is charged to the Funds based upon the terms set forth in the agreement. In addition, a commitment fee of 0.15% per annum, payable at the end of each calendar quarter, is accrued and apportioned among the participating funds based on their average daily unused portion of the line of credit. The Funds paid an arrangement fee, an upfront fee, and certain other legal fees in connection with the line of credit agreement, which are being amortized over a period of 364 days and are reflected in legal fees and/or miscellaneous expenses on the Statements of Operations. The unamortized balance is reflected as prepaid expenses on the Statements of Assets and Liabilities.
For the period ended December 31, 2020, neither Fund had borrowings under this agreement.
43 |
Notes to Financial Statements – continued
December 31, 2020
8. Risk. Global markets have experienced periods of high volatility triggered by the ongoing public health emergency known as coronavirus (“Covid-19”). As the situation continues, the extent and duration of the impact that the Covid-19 outbreak may have on financial markets and the economy as a whole remains highly uncertain. If the effects of the Covid-19 outbreak on financial markets and the economy continue for an extended period of time, the Funds’ future financial and investment results may be adversely affected.
9. Concentration of Ownership. From time to time, a Fund may have a concentration of one or more accounts constituting a significant percentage of shares outstanding. Investment activities by holders of such accounts could have material impacts on the Funds. As of December 31, 2020, based on management’s evaluation of the shareholder account base, the Funds had accounts representing controlling ownership of more than 5% of the Fund’s total outstanding shares. The number of such accounts, based on accounts that represent more than 5% of an individual class of shares, and the aggregate percentage of net assets represented by such holdings were as follows:
| | | | | | | | |
Fund | | Number of 5%
Account Holders | | | Percentage of
Ownership | |
Investment Grade Fixed Income Fund | | | 8 | | | | 59.59% | |
Omnibus shareholder accounts for which Natixis Advisors understands that the intermediary has discretion over the underlying shareholder accounts or investment models where a shareholder account may be invested for a non-discretionary customer are included in the table above. For other omnibus accounts, the Fund does not have information on the individual shareholder accounts underlying the omnibus accounts; therefore, there could be other 5% shareholders in addition to those disclosed in the table above.
10. Capital Shares. Each Fund may issue an unlimited number of shares of beneficial interest, without par value. Transactions in capital shares were as follows:
| | | | | | | | | | | | | | | | |
| | | Bond Fund | |
| | |
| | | Period Ended December 31, 2020(a) | | | Year Ended September 30, 2020 | |
| | | | |
| Institutional Class | | Shares | | | Amount | | | Shares | | | Amount | |
Issued from the sale of shares | | | 17,958,709 | | | $ | 240,258,146 | | | | 120,708,487 | | | $ | 1,570,749,463 | |
Issued in connection with the reinvestment of distributions | | | 7,237,580 | | | | 97,312,891 | | | | 17,523,667 | | | | 232,268,672 | |
Redeemed | | | (46,174,027 | ) | | | (616,268,376 | ) | | | (220,002,206 | ) | | | (2,875,026,445 | ) |
| | | | | | | | | | | | | | | | |
Net change | | | (20,977,738 | ) | | $ | (278,697,339 | ) | | | (81,770,052 | ) | | $ | (1,072,008,310 | ) |
| | | | | | | | | | | | | | | | |
|
| Retail Class | |
Issued from the sale of shares | | | 2,112,564 | | | $ | 28,122,287 | | | | 14,844,566 | | | $ | 195,224,157 | |
Issued in connection with the reinvestment of distributions | | | 1,659,270 | | | | 22,184,198 | | | | 4,247,554 | | | | 56,079,112 | |
Redeemed | | | (8,156,547 | ) | | | (108,572,252 | ) | | | (54,570,868 | ) | | | (707,245,691 | ) |
| | | | | | | | | | | | | | | | |
Net change | | | (4,384,713 | ) | | $ | (58,265,767 | ) | | | (35,478,748 | ) | | $ | (455,942,422 | ) |
| | | | | | | | | | | | | | | | |
|
| Admin Class | |
Issued from the sale of shares | | | 141,005 | | | $ | 1,869,144 | | | | 988,190 | | | $ | 12,986,806 | |
Issued in connection with the reinvestment of distributions | | | 55,811 | | | | 743,230 | | | | 153,962 | | | | 2,026,396 | |
Redeemed | | | (409,265 | ) | | | (5,417,629 | ) | | | (3,417,499 | ) | | | (43,720,128 | ) |
| | | | | | | | | | | | | | | | |
Net change | | | (212,449 | ) | | $ | (2,805,255 | ) | | | (2,275,347 | ) | | $ | (28,706,926 | ) |
| | | | | | | | | | | | | | | | |
|
| Class N | |
Issued from the sale of shares | | | 5,413,969 | | | $ | 72,589,711 | | | | 44,607,296 | | | $ | 587,746,459 | |
Issued in connection with the reinvestment of distributions | | | 1,031,794 | | | | 13,856,012 | | | | 2,000,372 | | | | 26,407,717 | |
Redeemed | | | (5,062,581 | ) | | | (67,300,804 | ) | | | (15,755,871 | ) | | | (206,225,396 | ) |
| | | | | | | | | | | | | | | | |
Net change | | | 1,383,182 | | | $ | 19,144,919 | | | | 30,851,797 | | | $ | 407,928,780 | |
| | | | | | | | | | | | | | | | |
Decrease from capital share transactions | | | (24,191,718 | ) | | $ | (320,623,442 | ) | | | (88,672,350 | ) | | $ | (1,148,728,878 | ) |
| | | | | | | | | | | | | | | | |
| (a) | For the period October 1, 2020 through December 31, 2020. |
| 44
Notes to Financial Statements – continued
December 31, 2020
10. Capital Shares – continued
| | | | | | | | |
| | | Bond Fund | |
| |
| | | Year Ended September 30, 2019 | |
| | |
| Institutional Class | | Shares | | | Amount | |
Issued from the sale of shares | | | 114,880,589 | | | $ | 1,536,762,571 | |
Issued in connection with the reinvestment of distributions | | | 22,980,553 | | | | 307,097,798 | |
Redeemed | | | (212,391,166 | ) | | | (2,831,530,285 | ) |
| | | | | | | | |
Net change | | | (74,530,024 | ) | | $ | (987,669,916 | ) |
| | | | | | | | |
|
| Retail Class | |
Issued from the sale of shares | | | 15,929,615 | | | $ | 212,676,780 | |
Issued in connection with the reinvestment of distributions | | | 6,000,286 | | | | 79,721,992 | |
Redeemed | | | (60,037,841 | ) | | | (797,894,770 | ) |
| | | | | | | | |
Net change | | | (38,107,940 | ) | | $ | (505,495,998 | ) |
| | | | | | | | |
|
| Admin Class | |
Issued from the sale of shares | | | 1,157,656 | | | $ | 15,385,127 | |
Issued in connection with the reinvestment of distributions | | | 264,817 | | | | 3,500,482 | |
Redeemed | | | (4,266,412 | ) | | | (56,394,526 | ) |
| | | | | | | | |
Net change | | | (2,843,939 | ) | | $ | (37,508,917 | ) |
| | | | | | | | |
|
| Class N | |
Issued from the sale of shares | | | 10,314,319 | | | $ | 138,677,808 | |
Issued in connection with the reinvestment of distributions | | | 1,364,601 | | | | 18,225,344 | |
Redeemed | | | (10,030,579 | ) | | | (134,939,664 | ) |
| | | | | | | | |
Net change | | | 1,648,341 | | | $ | 21,963,488 | |
| | | | | | | | |
Decrease from capital share transactions | | | (113,833,562 | ) | | $ | (1,508,711,343 | ) |
| | | | | | | | |
| | | | | | | | | | | | | | | | |
| | | Investment Grade Fixed Income Fund | |
| | |
| | | Period Ended December 31, 2020(a) | | | Year Ended September 30, 2020 | |
| | | | |
| Institutional Class | | Shares | | | Amount | | | Shares | | | Amount | |
Issued from the sale of shares | | | 1,437,694 | | | $ | 17,904,133 | | | | 2,019,833 | | | $ | 25,209,066 | |
Issued in connection with the reinvestment of distributions | | | 814,976 | | | | 10,137,526 | | | | 586,707 | | | | 7,179,359 | |
Redeemed | | | (349,545 | ) | | | (4,465,800 | ) | | | (7,736,662 | ) | | | (93,509,476 | ) |
| | | | | | | | | | | | | | | | |
Net change | | | 1,903,125 | | | $ | 23,575,859 | | | | (5,130,122 | ) | | $ | (61,121,051 | ) |
| | | | | | | | | | | | | | | | |
Increase (decrease) from capital share transactions | | | 1,903,125 | | | $ | 23,575,859 | | | | (5,130,122 | ) | | $ | (61,121,051 | ) |
| | | | | | | | | | | | | | | | |
(a) For the period October 1, 2020 through December 31, 2020.
| | | | | | | | |
| |
| | | Year Ended September 30, 2019 | |
| | |
| Institutional Class | | Shares | | | Amount | |
Issued from the sale of shares | | | 3,715,904 | | | $ | 44,596,334 | |
Issued in connection with the reinvestment of distributions | | | 744,228 | | | | 8,846,688 | |
Redeemed | | | (3,321,935 | ) | | | (39,589,135 | ) |
| | | | | | | | |
Net change | | | 1,138,197 | | | $ | 13,853,887 | |
| | | | | | | | |
Increase (decrease) from capital share transactions | | | 1,138,197 | | | $ | 13,853,887 | |
| | | | | | | | |
45 |
Report of Independent Registered Public Accounting Firm
To the Board of Trustees of Loomis Sayles Funds I and Shareholders of Loomis Sayles Bond Fund and Loomis Sayles Investment Grade Fixed Income Fund
Opinions on the Financial Statements
We have audited the accompanying statements of assets and liabilities, including the portfolios of investments, of Loomis Sayles Bond Fund and Loomis Sayles Investment Grade Fixed Income Fund (two of the funds constituting Loomis Sayles Funds I, hereafter collectively referred to as the “Funds”) as of December 31, 2020, the related statements of operations for the three month period ended December 31, 2020 and for the year ended September 30, 2020, the statements of changes in net assets for the three month period ended December 31, 2020 and for each of the two years in the period ended September 30, 2020, including the related notes, and the financial highlights for the three month period ended December 31, 2020 and for each of the five years in the period ended September 30, 2020 (collectively referred to as the “financial statements”). In our opinion, the financial statements present fairly, in all material respects, the financial position of each of the Funds as of December 31, 2020, the results of each of their operations for the three month period ended December 31, 2020 and for the year ended September 30, 2020, the changes in each of their net assets for the three month period ended December 31, 2020 and for each of the two years in the period ended September 30, 2020, and each of the financial highlights for the three month period ended December 31, 2020 and for each of the five years in the period ended September 30, 2020 in conformity with accounting principles generally accepted in the United States of America.
Basis for Opinions
These financial statements are the responsibility of the Funds’ management. Our responsibility is to express an opinion on the Funds’ financial statements based on our audits. We are a public accounting firm registered with the Public Company Accounting Oversight Board (United States) (PCAOB) and are required to be independent with respect to the Funds in accordance with the U.S. federal securities laws and the applicable rules and regulations of the Securities and Exchange Commission and the PCAOB.
We conducted our audits of these financial statements in accordance with the standards of the PCAOB. Those standards require that we plan and perform the audit to obtain reasonable assurance about whether the financial statements are free of material misstatement, whether due to error or fraud.
Our audits included performing procedures to assess the risks of material misstatement of the financial statements, whether due to error or fraud, and performing procedures that respond to those risks. Such procedures included examining, on a test basis, evidence regarding the amounts and disclosures in the financial statements. Our audits also included evaluating the accounting principles used and significant estimates made by management, as well as evaluating the overall presentation of the financial statements. Our procedures included confirmation of securities owned as of December 31, 2020 by correspondence with the custodian, agent banks and brokers; when replies were not received from brokers, we performed other auditing procedures. We believe that our audits provide a reasonable basis for our opinions.
/s/PricewaterhouseCoopers LLP
Boston, Massachusetts
February 22, 2021
We have served as the auditor of one or more of the investment companies in the Natixis Investment Company Complex since at least 1995. We have not been able to determine the specific year we began serving as auditor.
| 46
2020 U.S. Tax Distribution Information to Shareholders (unaudited)
Corporate Dividends Received Deduction. For the fiscal year ended December 31, 2020, a percentage of dividends distributed by the Funds listed below qualify for the dividends received deduction for corporate shareholders. These percentages are as follows:
| | | | |
Fund | | Qualifying Percentage | |
Bond Fund | | | 2.22% | |
Investment Grade Fixed Income | | | 3.69% | |
Capital Gains Distributions. Pursuant to Internal Revenue Section 852(b), the following Funds paid distributions, which have been designated as capital gains distributions for the fiscal year ended December 31, 2020.
| | | | |
Fund | | Amount | |
Bond Fund | | $ | 35,454,933 | |
Investment Grade Fixed Income | | | 7,337,537 | |
Qualified Dividend Income. For the fiscal year ended December 31, 2020, the Funds below will designate up to the maximum amount allowable pursuant to the Internal Revenue Code as qualified dividend income eligible for reduced tax rates. These lower rates range from 0% to 20% depending on an individual’s tax bracket. If the Funds pay a distribution during calendar year 2020, complete information will be reported in conjunction with Form 1099-DIV. These percentages are noted below:
| | | | |
Fund | | Qualifying Percentage | |
Bond Fund | | | 13.48% | |
Investment Grade Fixed Income | | | 9.91% | |
47 |
Trustee and Officer Information
The tables below provide certain information regarding the trustees and officers of Loomis Sayles Funds I (the “Trust”). Unless otherwise indicated, the address of all persons below is 888 Boylston Street, Suite 800, Boston, MA 02199-8197. The Funds’ Statement of Additional Information includes additional information about the trustees of the Trust/Trusts and are available by calling Loomis Sayles Funds at 800-633-3330.
| | | | | | | | |
| Name and Year of Birth | | Position(s)
Held with
the Trust, Length
of Time Served and Term of Office1 | | Principal Occupation(s)
During Past 5 Years | | Number of Portfolios in
Fund Complex Overseen2 and Other Directorships
Held During
Past 5 Years | | Experience,
Qualifications,
Attributes, Skills
for Board
Membership |
|
Independent Trustees |
Edmond J. English
(1953) | | Trustee since 2013 Chairperson of Governance Committee and Audit Committee Member | | Executive Chairman of Bob’s Discount Furniture (retail) | | 54 Director, Burlington Stores, Inc. (retail) | | Significant experience on the Board and on the boards of other business organizations (including retail companies and a bank); executive experience (including at a retail company) |
| | | | |
Richard A. Goglia
(1951) | | Trustee since 2015 Contract Review Committee Member and Governance Committee Member | | Retired | | 54 Director of Triumph Group (aerospace industry) | | Significant experience on the Board and executive experience (including his role as vice president and treasurer of a defense company and experience at a financial services company) |
| | | | |
Wendell J. Knox
(1948) | | Trustee since 2009 Chairperson of Contract Review Committee | | Retired | | 54 Director of Abt Associates Inc. (research and consulting); Director, The Hanover Insurance Group (property and casualty insurance); formerly, Director, Eastern Bank (bank) | | Significant experience on the Board and on the boards of other business organizations (including at a bank and at a property and casualty insurance firm); executive experience (including roles as president and chief executive officer of a research and consulting company) |
| | | | |
Martin T. Meehan
(1956) | | Trustee since 2012 Audit Committee Member | | President, University of Massachusetts | | 54 None | | Significant experience on the Board and on the boards of other business organizations; experience as President of the University of Massachusetts; government experience (including as a member of the U.S. House of Representatives); academic experience |
| 48
| | | | | | | | |
| Name and Year of Birth | | Position(s)
Held with
the Trust, Length
of Time Served and Term of Office1 | | Principal Occupation(s)
During Past 5 Years | | Number of Portfolios in
Fund Complex Overseen2 and Other Directorships
Held During
Past 5 Years | | Experience,
Qualifications,
Attributes, Skills
for Board
Membership |
Maureen B. Mitchell
(1951) | | Trustee since 2017 Contract Review Committee Member and Governance Committee Member | | Retired; formerly President, Global Sales and Marketing, GE Asset Management, Inc. (financial services) | | 54 Director, Sterling Bancorp (bank) | | Experience on the Board; financial services industry and executive experience (including role as president of global sales and marketing at a financial services company) |
| | | | |
James P. Palermo
(1955) | | Trustee since 2016 Contract Review Committee Member | | Founding Partner, Breton Capital Management, LLC (private equity); Partner, STEP Partners, LLC (private equity) | | 54 Director, FutureFuel.io (chemicals and biofuels) | | Experience on the Board; financial services industry and executive experience (including roles as chief executive officer of client management and asset servicing for a banking and financial services company) |
| | | | |
Erik R. Sirri
(1958) | | Chairperson of the Board of Trustees since January 2021 Trustee since 2009 Ex Officio member of Audit Committee, Contract Review Committee and Governance Committee | | Professor of Finance at Babson College | | 54 None | | Significant experience on the Board; experience as Director of the Division of Trading and Markets at the Securities and Exchange Commission; academic experience; training as an economist |
| | | | |
Peter J. Smail
(1952) | | Trustee since 2009 Audit Committee Member and Governance Committee Member | | Retired | | 54 None | | Significant experience on the Board; mutual fund industry and executive experience (including roles as president and chief executive officer for an investment adviser) |
| | | | |
Kirk A. Sykes
(1958) | | Trustee since 2019 Contract Review Committee Member | | Managing Director of Accordia Partners, LLC (real estate development); President of Primary Corporation (real estate development); Managing Principal of Merrick Capital Partners (infrastructure finance); formerly, President of Urban Strategy America Fund (real estate fund manager) | | 54 Trustee, Eastern Bank (bank); Director of Apartment Investment and Management Company (real estate investment trust); formerly Director, Ares Commercial Real Estate Corporation (real estate investment trust) | | Experience on the Board and significant experience on the boards of other business organizations (including real estate companies and banks) |
| | | | |
Cynthia L. Walker
(1956) | | Trustee since 2005 Chairperson of the Audit Committee and Governance Committee Member | | Retired; formerly, Deputy Dean for Finance and Administration, Yale University School of Medicine | | 54 None | | Significant experience on the Board; executive experience in a variety of academic organizations (including roles as dean for finance and administration) |
49 |
| | | | | | | | |
| Name and Year of Birth | | Position(s)
Held with
the Trust, Length
of Time Served and Term of Office1 | | Principal Occupation(s)
During Past 5 Years | | Number of Portfolios in
Fund Complex Overseen2 and Other Directorships
Held During
Past 5 Years | | Experience,
Qualifications,
Attributes, Skills
for Board
Membership |
|
Interested Trustees |
| | | | |
Kevin P. Charleston3
(1965) One Financial Center Boston, MA 02111 | | Trustee since 2015 President and Chief Executive Officer since 2015 | | President, Chief Executive Officer and Chairman of the Board of Directors, Loomis, Sayles & Company, L. P. | | 54 None | | Significant experience on the Board; continuing service as President, Chief Executive Officer and Chairman of the Board of Directors of Loomis, Sayles & Company, L.P. |
| | | | |
David L. Giunta4
(1965) | | Trustee since 2011 Executive Vice Presiden since 2008 | | President and Chief Executive Officer, Natixis Advisors, L.P., Natixis Distribution, L.P., Natixis Distribution Corporation and Chairman of the Board of Natixis Distribution Corporation | | 54 None | | Significant experience on the Board; experience as President and Chief Executive Officer of Natixis Advisors, L.P., Natixis Distribution, L.P., Natixis Distribution Corporation and Chairman of the Board of Natixis Distribution Corporation |
| 1 | Each trustee serves until retirement, resignation or removal from the Board. The current retirement age is 75. The position of Chairperson of the Board is appointed for a three-year term. |
| 2 | The trustees of the Trust serve as trustees of a fund complex that includes all series of the Natixis Funds Trust I, Natixis Funds Trust II, Natixis Funds Trust IV, Gateway Trust, Loomis Sayles Funds I, Loomis Sayles Funds II, Natixis ETF Trust and Natixis ETF Trust II (collectively, the “Fund Complex”). |
| 3 | Mr. Charleston is deemed an “interested person” of the Trust because he holds the following positions with an affiliated person of the Trust: President, Chief Executive Officer and Chairman of the Board of Directors of Loomis, Sayles & Company, L.P. |
| 4 | Mr. Giunta is deemed an “interested person” of the Trust because he holds the following positions with an affiliated person of the Trust: President and Chief Executive Officer, Natixis Advisors, L.P., Natixis Distribution, L.P., Natixis Distribution Corporation and Chairman of the Board of Natixis Distribution Corporation. |
| | | | | | |
| Name and Year of Birth | | Position(s)
Held with
the Trust | | Term of Office1
and Length of
Time Served | | Principal Occupation(s)
During Past 5 Years2 |
|
OFFICERS OF THE TRUST |
Russell L. Kane
(1969) | | Secretary, Clerk and Chief Legal Officer Chief Compliance Officer and Anti-Money Laundering Officer | | Since 2016
Since 2020 | | Executive Vice President, General Counsel, Secretary and Clerk, Natixis Distribution Corporation, Natixis Advisors, L.P. and Natixis Distribution, L.P.; formerly, Senior Vice President, Deputy General Counsel, Assistant Secretary and Assistant Clerk, Natixis Distribution Corporation, Natixis Advisors, L.P. and Natixis Distribution, L.P. |
| | | |
Michael C. Kardok
(1959) | | Treasurer, Principal Financial and Accounting Officer | | Since 2004 | | Senior Vice President, Natixis Advisors, L.P. and Natixis Distribution, L.P. |
| 1 | Each officer of the Trust serves for an indefinite term in accordance with the Trust’s current by-laws until the date his or her successor is elected and qualified, or until he or she sooner dies, retires, is removed or becomes disqualified. |
| 2 | Each person listed above, except as noted, holds the same position(s) with the Fund Complex. Previous positions during the past five years with Natixis Distribution, L.P., Natixis Advisors, L.P. or Loomis, Sayles & Company, L.P. are omitted, if not materially different from an officer’s current position with such entity. |
| 50
The Registrant has adopted a code of ethics that applies to the Registrant’s principal executive officer, principal financial officer and persons performing similar functions. There have been no amendments or waivers of the Registrant’s code of ethics during the period.
| Item 3. | Audit Committee Financial Expert. |
The Board of Trustees of the Registrant has established an audit committee. Mr. Edmond J. English, Mr. Martin T. Meehan, Mr. Peter J. Smail and Ms. Cynthia L. Walker are members of the audit committee and have been designated as “audit committee financial experts” by the Board of Trustees. Each of these individuals is also an Independent Trustee of the Registrant.
| Item 4. | Principal Accountant Fees and Services. |
Fees billed by the Principal Accountant for services rendered to the Registrant.
The table below sets forth fees billed by the principal accountant, PricewaterhouseCoopers LLP, for the past two fiscal years for professional services rendered in connection with a) the audit of the Registrant’s annual financial statements and services provided in connection with regulatory filings; b) audit-related services (including services that are reasonably related to the performance of the audit of the Registrant’s financial statements and but not reported under “Audit Fees”); c) tax compliance, tax advice and tax planning and d) all other fees billed for professional services rendered by the principal accountant to the Registrant, other than the services reported as a part of (a) through (c) of this Item.
| | | | | | | | | | | | | | | | |
| | | Audit fees | | | Audit-related fees | | | Tax fees1 | | | All other fees | |
| | | 10/1/20-12/31/20 | | | 10/1/20-12/31/20 | | | 10/1/20-12/31/20 | | | 10/1/20-12/31/20 | |
Loomis Sayles Bond Fund and Loomis Sayles Investment Grade Fixed Income Fund | | $ | 81,892 | | | $ | — | | | $ | 6,482 | | | $ | — | |
2020 – Review of Registrant’s tax returns.
Aggregate fees billed to the Registrant for non-audit services during 2020 were $6,482.
Fees billed by the Principal Accountant for services rendered to the Adviser and Control Affiliates.
The following table sets forth the fees billed by the Registrant’s principal accountant for non-audit services rendered to Loomis, Sayles & Company, L.P. (“Loomis Sayles”) and entities controlling, controlled by or under common control with Loomis Sayles (“Control Affiliates”) that provide ongoing services to the Registrant, for engagements that related directly to the operations and financial reporting of the Registrant for the last two fiscal years.
| | | | | | | | | | | | |
| | | 10/1/20-12/31/20 | | | 10/1/20-12/31/20 | | | 10/1/20-12/31/20 | |
Control Affiliates | | $ | — | | | $ | — | | | $ | — | |
The following table sets forth the aggregate fees billed by the Registrant’s principal accountant for non-audit services rendered to Loomis Sayles and Control Affiliates that provide ongoing services to the Registrant, for the last two fiscal years, including the fees disclosed in the table above.
| | | | |
| | | 10/1/20-12/31/20 | |
Control Affiliates | | $ | 1,646 | |
None of the services described above were approved pursuant to paragraph (c)(7)(i)(C) of Regulation S-X.
Audit Committee Pre Approval Policies.
Annually, the Registrant’s Audit Committee reviews the audit, audit-related, tax and other non-audit services together with the projected fees, for services proposed to be rendered to the Registrant and/or other entities for which pre-approval is required during the upcoming year. Any subsequent revisions to already pre-approved services or fees (including fee increases) and requests for pre-approval of new services would be presented for consideration quarterly as needed.
If, in the opinion of management, a proposed engagement by the Registrant’s independent accountants needs to commence before the next regularly scheduled Audit Committee meeting, any member of the Audit Committee who is an independent Board member is authorized to pre-approve the engagement, but only for engagements to provide audit, audit-related and tax services. This approval is subject to review by the full Audit Committee at its next quarterly meeting. All other engagements require the approval of all the members of the Audit Committee.
| Item 5. | Audit Committee of Listed Registrants. |
Not applicable.
| Item 6. | Schedule of Investments. |
Included as part of the Report to Shareholders filed as Item 1 herewith.
| Item 7. | Disclosure of Proxy Voting Policies and Procedures for Closed-End Management Investment Companies. |
Not applicable.
| Item 8. | Portfolio Managers of Closed-End Management Investment Companies |
Not applicable.
| Item 9. | Purchases of Equity Securities by Closed-End Management Investment Companies and Affiliated Purchasers. |
Not applicable.
| Item 10. | Submission of Matters to a Vote of Securities Holders. |
There were no material changes to the procedures by which shareholders may recommend nominees to the Registrant’s Board of Trustees.
| Item 11. | Controls and Procedures. |
The Registrant’s principal executive officer and principal financial officer have concluded that the Registrant’s disclosure controls and procedures are sufficient to ensure that information required to be disclosed by the Registrant in this Form N-CSR was recorded, processed, summarized and reported within the time periods specified in the Securities and Exchange Commission’s rules and forms, based upon such officers’ evaluation of these controls and procedures as of a date within 90 days of the filing date of the report.
There were no changes in the Registrant’s internal control over financial reporting that occurred during the Registrant’s last fiscal quarter of the period covered by the report that has materially affected, or is reasonably likely to materially affect, the Registrant’s internal control over financial reporting.
| Item 12. | Disclosure of Securities Lending Activities for Closed-End Management Investment Companies. |
Not applicable.
SIGNATURES
Pursuant to the requirements of the Securities Exchange Act of 1934 and the Investment Company Act of 1940, the Registrant has duly caused this report to be signed on its behalf by the undersigned, thereunto duly authorized.
| | |
| Loomis Sayles Funds I |
| |
| By: | | /s/ David L. Giunta |
| Name: | | David L. Giunta |
| Title: | | President and Chief Executive Officer |
| Date: | | February 22, 2021 |
Pursuant to the requirements of the Securities Exchange Act of 1934 and the Investment Company Act of 1940, this report has been signed by the following persons on behalf of the Registrant and in the capacities and on the dates indicated.
| | |
| Name: | | David L. Giunta
|
| Title: | | President and Chief Executive Officer |
| Date: | | February 22, 2021 |
| | |
| |
| By: | | /s/ Michael C. Kardok |
| | |
| Name: | | Michael C. Kardok |
| Title: | | Treasurer and Principal Financial and Accounting Officer |
| Date: | | February 22, 2021 |