UNITED STATES
SECURITIES AND EXCHANGE COMMISSION
Washington, D.C. 20549
FORM N-CSR
CERTIFIED SHAREHOLDER REPORT OF REGISTERED
MANAGEMENT INVESTMENT COMPANIES
Investment Company Act file number: 811-08282
Loomis Sayles Funds I
(Exact name of Registrant as specified in charter)
888 Boylston Street, Suite 800
Boston, Massachusetts 02199-8197
(Address of principal executive offices) (Zip code)
Russell L. Kane, Esq.
Natixis Distribution, L.P.
888 Boylston Street, Suite 800
Boston, Massachusetts 02199-8197
(Name and address of agent for service)
Registrant’s telephone number, including area code: (617) 449-2822
Date of fiscal year end: September 30
Date of reporting period: September 30, 2020
Item 1. Reports to Stockholders.
The Registrant’s annual report transmitted to shareholders pursuant to Rule 30e-1 under the Investment Company Act of 1940 is as follows:

Loomis Sayles Small Cap Growth Fund
Loomis Sayles Small Cap Value Fund
Loomis Sayles Small/Mid Cap Growth Fund
Annual Report
September 30, 2020
IMPORTANT NOTICE TO SHAREHOLDERS
Beginning on January 1, 2021, as permitted by regulations adopted by the Securities and Exchange Commission, paper copies of shareholder reports like this one will no longer be sent by mail, unless you specifically request paper copies of the reports from the Fund or from your financial intermediary, such as a broker-dealer or bank. Instead, the reports will be made available on the Funds’ website, and you will be notified by mail each time a report is posted and provided with a website link to access the report. If you wish to continue receiving paper copies of your shareholder reports after January 1, 2021, you can inform the Fund at any time by calling 1-800-633-3330. If you hold your account with a financial intermediary and you wish to continue receiving paper copies after January 1, 2021, you should call your financial intermediary directly. Paper copies are provided free of charge, and your election to receive reports in paper will apply to all funds held with the Natixis Funds complex. If you have already elected to receive shareholder reports electronically, you will not be affected by this change and you need not take any action. You currently may elect to receive shareholder reports and other communications from the Fund or your financial intermediary electronically at www.icsdelivery.com/loomissayles.
LOOMIS SAYLES SMALL CAP GROWTH FUND
| | | | |
| Managers | | Symbols | | |
| Mark F. Burns, CFA® | | Institutional Class | | LSSIX |
| John J. Slavik, CFA® | | Retail Class | | LCGRX |
| | Class N | | LSSNX |
Investment Objective
The Fund’s investment objective is long-term capital growth from investments in common stocks or other equity securities.
Market Conditions
The one-year period ending September 30, 2020 was positive for most domestic equity markets, although those positive returns were hard-fought. The robust positive returns in some ways masked the full extent of the challenges that investors faced over the course of this time period. After starting the period strongly, the Russell 2000® Growth Index declined in historic fashion during the first quarter of 2020 but then saw an equally sharp rebound in the second quarter. Further gains in the third quarter of 2020 added to the period’s total return.
Growth, as measured by the Russell 2000® Growth Index, significantly outperformed value, as measured by the Russell 2000® Value Index, over this time period.
Performance Results
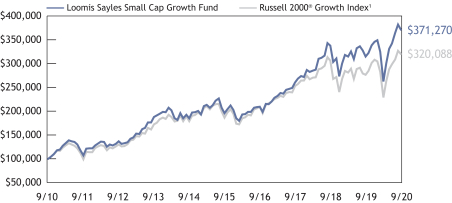
For the 12 months ended September 30, 2020, Institutional Class shares of the Loomis Sayles Small Cap Growth Fund returned 17.98% at net asset value. The Fund outperformed its benchmark, the Russell 2000® Growth Index, which returned 15.71%.
Explanation of Fund Performance
Among contributors to overall return, stock selection in the healthcare, financials, and information technology sectors, along with an underweight position in the real estate sector, drove the Fund’s outperformance. By contrast, stock selection in the consumer discretionary sector hurt relative performance.
Among individual stocks, the Fund’s top contributors to performance were medical equipment manufacturer Quidel Corp., contact center software provider Five9 Inc. and pet food maker Freshpet Inc. Quidel performed very well during the period, as its diagnostic tests were among those used for Covid-19 testing, boosting sales. Secular growth trends toward migrating contact-center solutions to the cloud and virtualizing workforces remained in place and supported Five9’s growth. Freshpet issued robust guidance in the belief that it has ample room to grow and to continue to penetrate the dog food market. Sales rose significantly as people began to shelter in place and bought supplies in bulk, and pet adoptions were also up during the pandemic, raising investor sentiment around the stock.
1 |
Conversely, specialty food distributor The Chefs’ Warehouse Inc., industrial manufacturer Hexcel Corp. and online education provider Laureate Education Inc. were the largest detractors from the Fund’s performance. Chefs’ Warehouse saw its end markets significantly impacted by the Covid-19 crisis, especially among caterers and restaurants. Hexcel encountered disruptions in the Boeing supply chain that weighed on the stock, and the effect of the Covid-19 crisis on the airline industry only exacerbated that impact. Laureate Education reported lackluster results during the period, and guidance was below expectations. Investor concerns about slowing growth in the US market and the ability to continue making divestitures in the current industry environment appeared to weigh on the stock. The Fund sold its positions in all three of these stocks.
Outlook
Despite the pause in September, the markets have been able to deliver spectacular returns, particularly when measured from the market bottom in March of this year. Despite strong returns, however, small-cap stocks underperformed their large-cap peers. The underperformance of small-caps during the third quarter put the rolling three-year differential between large-cap and small-cap performance at its widest level since 1999. The last time large-caps outperformed small-caps by such a wide margin, small-caps subsequently enjoyed a prolonged period of outperformance.
Volatility is likely to increase as we approach the election, and regardless of the outcome, it may continue to be an uncertain time for the markets. However, increasing visibility surrounding a potential vaccine for Covid-19 may provide some stability.
While there is so much that is not known about the pandemic and the continued economic impact, we remain focused on the underlying fundamentals of our companies. These stock-specific fundamentals should have a more significant effect on investment returns as uncertainty surrounding the virus and its economic ramifications fade. We certainly take into account how the world may change as a result of what we are going through and the impact those changes may have on individual companies, but we continue to seek out long-term secular winners that can grow into larger entities and create value for stakeholders.
LOOMIS SAYLES SMALL CAP GROWTH FUND
Hypothetical Growth of $100,000 Investment in Institutional Class Shares
September 30, 2010 through September 30, 20202
See notes to chart on page 4.
Top Ten Holdings as of September 30, 2020
| | | | | | |
| Security name | | % of
assets | |
| 1 | | Freshpet, Inc. | | | 2.07 | % |
| 2 | | Five9, Inc. | | | 1.92 | |
| 3 | | LHC Group, Inc. | | | 1.87 | |
| 4 | | SiteOne Landscape Supply, Inc. | | | 1.85 | |
| 5 | | Generac Holdings, Inc. | | | 1.74 | |
| 6 | | Kinsale Capital Group, Inc. | | | 1.68 | |
| 7 | | Palomar Holdings, Inc. | | | 1.63 | |
| 8 | | Inovalon Holdings, Inc., Class A | | | 1.57 | |
| 9 | | Globant S.A. | | | 1.54 | |
| 10 | | Goosehead Insurance, Inc., Series A | | | 1.52 | |
The portfolio is actively managed and holdings are subject to change. There is no guarantee the Fund continues to invest in the securities referenced. The holdings listed exclude any temporary cash investments.
Average Annual Total Returns — September 30, 20202
| | | | | | | | | | | | | | | | | | | | | | | | |
| | | | | | | | | | | | | | | Expense Ratios3 | |
| | | 1 year | | | 5 years | | | 10 years | | | Life of
Class N | | | Gross | | | Net | |
| | | | | | | |
Institutional Class
(Inception 12/31/96) | | | 17.98 | % | | | 13.62 | % | | | 14.02 | % | | | — | % | | | 0.95 | % | | | 0.95 | % |
| | | | | | | |
Retail Class
(Inception 12/31/96) | | | 17.67 | | | | 13.33 | | | | 13.72 | | | | — | | | | 1.20 | | | | 1.20 | |
| | | | | | | |
Class N
(Inception 2/1/13) | | | 18.09 | | | | 13.76 | | | | — | | | | 13.27 | | | | 0.82 | | | | 0.82 | |
| | | | | | | |
| Comparative Performance | | | | | | | | | | | | | | | | | | | | | | | | |
| Russell 2000® Growth Index1 | | | 15.71 | | | | 11.42 | | | | 12.34 | | | | 11.34 | | | | | | | | | |
Performance data shown represents past performance and is no guarantee of, and not necessarily indicative of, future results. Total return and value will vary, and you may have a gain or loss when shares are sold. Current performance may be lower or higher than quoted. For most recent month-end performance, visit loomissayles.com. Performance for other share classes will be greater or less than shown based on differences in fees and sales charges. You may not invest directly in an index. Performance for periods less than one year is cumulative, not annualized. Returns reflect changes in share price and reinvestment of dividends and capital gains, if any. The table(s) do not reflect taxes shareholders might owe on any fund distributions or when they redeem their shares.
| 1 | | Russell 2000® Growth Index is an unmanaged index that measures the performance of the small-cap growth segment of the U.S. equity universe. It includes those Russell 2000® companies with higher price-to-book ratios and higher forecasted growth values. |
| 2 | | Fund performance has been increased by fee waivers and/or expense reimbursements, if any, without which performance would have been lower. |
| 3 | | Expense ratios are as shown in the Fund’s prospectus in effect as of the date of this report. The expense ratios for the current reporting period can be found in the Financial Highlights section of this report under Ratios to Average Net Assets. Net expenses reflect contractual expense limitations set to expire on 1/31/21. When a Fund’s expenses are below the limitation, gross and net expense ratios will be the same. See Note 5 of the Notes to Financial Statements for more information about the Fund’s expense limitations. |
| 4
LOOMIS SAYLES SMALL CAP VALUE FUND
| | | | |
| Managers | | Symbols | | |
| Joseph R. Gatz, CFA® | | Institutional Class | | LSSCX |
| Jeffrey Schwartz, CFA® | | Retail Class | | LSCRX |
| | Admin Class | | LSVAX |
| | Class N | | LSCNX |
Investment Objective
The Fund’s investment objective is long-term capital growth from investments in common stocks or other equity securities.
Market Conditions
The one-year period ending September 30, 2020 included several distinct market phases. The first brought a cyclical-led rally that took domestic equity markets to new all-time highs by early 2020, based on improving leading economic indicators, renewed optimism over a trade deal with China and a supportive US Federal Reserve (the “Fed”) that provided an additional interest rate cut in the fourth quarter of 2019. In late February and March, the equity markets entered a swift and steep correction period as the Covid-19 emerged, causing resulting economic activity and corporate earnings projections to fall sharply. However, with a supportive Fed and many governmental stimulus programs, the market rebounded from its lows in record time as investors began to look beyond the impact of the virus with few attractive investment alternatives to stocks.
Small-cap stocks participated in the equity market recovery, matching the very healthy rebound of larger-cap stocks. The net result for the Russell 2000® Index was a slightly positive total return for the period. However, small-cap value stocks dramatically underperformed small-cap growth stocks by a margin of over 30 percentage points, with the Russell 2000® Growth Index returning +15.7% compared to the Russell 2000® Value Index return of -14.9%.
One of the driving forces behind growth stocks’ domination of market return was an investor preference for higher-visibility sales and earnings that certain sectors and industries provided during a period of increased global economic uncertainty. Record-low interest rates also had an impact on separating leading and lagging economic sectors over the course of the year. With optimism over Covid-19 vaccine development and future production volumes, the healthcare sector was the top performer. Lagging sectors included energy due to falling oil prices and demand, financials on concerns over lending credit problems and defensive sectors such as real estate and utilities.
Performance Review
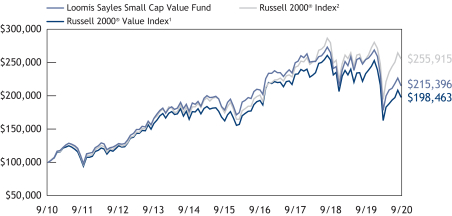
For the 12 months ended September 30, 2020, Institutional Class shares of the Loomis Sayles Small Cap Value Fund returned -15.31% at net asset value. The Fund underperformed its benchmark, the Russell 2000® Value Index, which returned -14.88%.
5 |
Explanation of Performance
Global event services provider Viad Corp., hotel meeting and conference company Ryman Hospitality Properties, Inc. and oilfield services company ChampionX Corp. detracted the most from relative performance. Viad’s operations include corporate gatherings, conventions, conferences, trade shows and exhibitions as well as a travel and tourism business that serves destinations in the US, Canada and Iceland. Both business lines were significantly impacted by Covid-19 and the near elimination of large group gatherings and tourism-related travel. Similarly, Ryman Hospitality is a REIT that specializes in group-oriented hotels used for large-scale meetings and conferences. The outbreak of Covid-19 created an immediate and severe disruption to the business that extended throughout the period. ChampionX, formerly known as Apergy Corp., struggled as energy stocks significantly underperformed the market. Investors also had concerns that the announced merger with the oilfield service division of Ecolabs might not close, and even once it did in June, the subsequent rally in the stock failed to offset declines from earlier in the period. The Fund sold its positions in Viad and Ryman Hospitality.
Looking at drivers of the Fund’s performance, very positive sector allocation was offset by lagging stock selection. The Fund started the fiscal year positioned fairly conservatively, residing in the upper portion of the market capitalization range and emphasizing companies with highly durable business models. This served the Fund well throughout the market correction and shortly thereafter, but caused it to lag the benchmark during the cyclical rally of lower quality stocks over the last few months of the fiscal period.
From a sector standpoint, the Fund’s fairly significant underweight positions in energy and financials contributed to performance, as these were the two worst performing sectors of the small-cap value market. An overweight to the industrials and information technology was also a positive to relative performance. Stock selection was favorable in the financials, communication services and healthcare sectors. By contrast, the Fund was negatively affected by its overweight position in the communication services sector and by stock selection particularly within the information technology, consumer discretionary and materials sectors.
Among individual stocks, medical diagnostic test manufacturer Quidel Corp., drug compound contract manufacturer Catalent Inc. and biopharmaceutical vaccine specialist Emergent BioSolutions Inc. had the largest positive contributions to performance for the period. During the last six months of the period, Quidel received emergency use authorization from the FDA to provide Covid-19 tests both to clinical labs and for point of care testing. The company ramped up manufacturing to produce nearly 7 million Covid-19 tests quarterly for healthcare workers, schools, and businesses as the economy reopened. Catalent’s expanding presence in biologics improved top line growth, expanding operating margins, and generating stronger free cash flow, which attracted new investors to the stock. During 2020, Catalent made numerous announcements regarding partnerships to manufacture potential Covid-19 vaccines on behalf of several well-known pharmaceutical
LOOMIS SAYLES SMALL CAP VALUE FUND
developers. Emergent BioSolutions is a specialty biopharmaceutical company providing vaccines and medical countermeasures for biological and chemical threats as well as infectious disease. Given the company’s area of expertise, as well as an established contract manufacturing operation, it recently announced several large contracts providing development and manufacturing services to a number of Covid-19 vaccine organizations. In addition, the company leveraged its own proprietary platform technology to develop Covid-19 therapeutic products.
Outlook
We remain committed to identifying inefficiencies in the small-cap market that result in stock prices and valuations that do not accurately reflect our assessment of the underlying value of the corporate enterprise.
While many forms of inefficiency may exist, we focus on companies that are misunderstood, underfollowed or in the midst of a “special situation” where we believe we can use our strengths in the form of our time horizon, resource deployment or a willingness to solve complex situations. We require fundamentally sound business models, capable management teams and financial stability.
Key to our process are distinct, company-specific catalysts on the horizon to sustain, enhance, or highlight the fundamental outlook. These principles are applied consistently over time, regardless of the current market environment. With a margin of safety and a proper time horizon, our goal is to achieve an attractive total return for our investors, while managing to an appropriate level of risk.
Hypothetical Growth of $100,000 Investment in Institutional Class Shares
September 30, 2010 through September 30, 20203
See notes to chart on page 9.
Top Ten Holdings as of September 30, 2020
| | | | | | |
| Security name | | % of
assets | |
| 1 | | Nomad Foods Ltd. | | | 1.75 | % |
| 2 | | GCI Liberty, Inc., Class A | | | 1.66 | |
| 3 | | NextEra Energy Partners LP | | | 1.49 | |
| 4 | | Arcosa, Inc. | | | 1.33 | |
| 5 | | Churchill Downs, Inc. | | | 1.29 | |
| 6 | | Darling Ingredients, Inc. | | | 1.28 | |
| 7 | | IAA, Inc. | | | 1.27 | |
| 8 | | Rexford Industrial Realty, Inc. | | | 1.25 | |
| 9 | | Vertiv Holdings Co. | | | 1.23 | |
| 10 | | Alamo Group, Inc. | | | 1.17 | |
The portfolio is actively managed and holdings are subject to change. There is no guarantee the Fund continues to invest in the securities referenced. The holdings listed exclude any temporary cash investments.
LOOMIS SAYLES SMALL CAP VALUE FUND
Average Annual Total Returns — September 30, 20203
| | | | | | | | | | | | | | | | | | | | | | | | |
| | | | | | | | | | | | | | | Expense Ratios4 | |
| | | 1 year | | | 5 years | | | 10 years | | | Life of Class N | | | Gross | | | Net | |
| | | | | | | |
Institutional Class
(Inception 5/13/91) | | | -15.31 | % | | | 3.80 | % | | | 7.98 | % | | | — | % | | | 0.95 | % | | | 0.92 | % |
| | | | | | | |
Retail Class
(Inception 12/31/96) | | | -15.56 | | | | 3.54 | | | | 7.70 | | | | — | | | | 1.20 | | | | 1.17 | |
| | | | | | | |
Admin Class
(Inception 1/2/98) | | | -15.74 | | | | 3.29 | | | | 7.43 | | | | — | | | | 1.45 | | | | 1.42 | |
| | | | | | | |
Class N
(Inception 2/1/13) | | | -15.28 | | | | 3.87 | | | | — | | | | 5.60 | | | | 0.85 | | | | 0.85 | |
| | | | | | | |
| Comparative Performance | | | | | | | | | | | | | | | | | | | | | | | | |
| Russell 2000® Value Index1 | | | -14.88 | | | | 4.11 | | | | 7.09 | | | | 4.86 | | | | | | | | | |
| Russell 2000® Index2 | | | 0.39 | | | | 8.00 | | | | 9.85 | | | | 8.25 | | | | | | | | | |
Performance data shown represents past performance and is no guarantee of, and not necessarily indicative of, future results. Total return and value will vary, and you may have a gain or loss when shares are sold. Current performance may be lower or higher than quoted. For most recent month-end performance, visit loomissayles.com. Performance for other share classes will be greater or less than shown based on differences in fees and sales charges. You may not invest directly in an index. Performance for periods less than one year is cumulative, not annualized. Returns reflect changes in share price and reinvestment of dividends and capital gains, if any. The table(s) do not reflect taxes shareholders might owe on any fund distributions or when they redeem their shares.
| 1 | | Russell 2000® Value Index is an unmanaged index that measures the performance of the small-cap value segment of the U.S. equity universe. It includes those Russell 2000® companies with lower price-to-book ratios and lower forecasted growth values. |
| 2 | | Russell 2000® Index is an unmanaged index that measures the performance of the small-cap segment of the U.S. equity universe. |
| 3 | | Fund performance has been increased by fee waivers and/or expense reimbursements, if any, without which performance would have been lower. |
| 4 | | Expense ratios are as shown in the Fund’s prospectus in effect as of the date of this report. The expense ratios for the current reporting period can be found in the Financial Highlights section of this report under Ratios to Average Net Assets. Net expenses reflect contractual expense limitations set to expire on 1/31/21. When a Fund’s expenses are below the limitation, gross and net expense ratios will be the same. See Note 5 of the Notes to Financial Statements for more information about the Fund’s expense limitations. |
LOOMIS SAYLES SMALL/MID CAP GROWTH FUND
| | | | |
| Managers | | Symbols | | |
| Mark F. Burns, CFA® | | Institutional Class | | LSMIX |
| John J. Slavik, CFA® | | Class N | | LSMNX |
Investment Objective
The Fund’s investment objective is long-term capital growth from investments in common stocks or other equity securities.
Market Conditions
The one-year period ending September 30, 2020 was positive for most domestic equity markets, although those positive returns were hard-fought. The robust positive returns in some ways masked the full extent of the challenges that investors faced over the course of this time period. After starting the period strongly, the Russell 2500™ Growth Index declined in historic fashion during the first quarter of 2020 but then saw an equally sharp rebound in the second quarter. Further gains in the third quarter of 2020 added to the period’s total return.
Growth, as measured by the Russell 2500™ Growth Index, significantly outperformed value, as measured by the Russell 2500™ Value Index, over this time period.
Performance Results
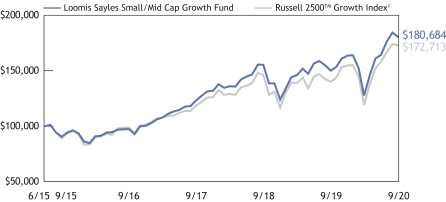
For the 12 months ended September 30, 2020, Institutional Class shares of the Loomis Sayles Small/Mid Cap Growth Fund returned 20.38% at net asset value. The Fund underperformed its benchmark, the Russell 2500™ Growth Index, which returned 23.37% during the one-year period.
Explanation of Fund Performance
The bulk of the Fund’s underperformance was concentrated in the second quarter of 2020. Stock selection in the information technology and consumer discretionary sectors drove the Fund’s underperformance. An underweight position in the real estate sector, along with stock selection in the consumer staples and financials sectors, contributed positively to relative returns.
Industrial manufacturer Hexcel Corp., online education provider Laureate Education Inc. and payment processing company WEX Inc. were the largest detractors from the Fund’s performance. Hexcel encountered disruptions in the Boeing supply chain that weighed on the stock, and the effect of the Covid-19 crisis on the airline industry only exacerbated that impact. Laureate Education reported lackluster results during the period, and guidance was below expectations. Investor concerns about slowing growth in the US market and the ability to continue making divestitures in the current industry environment appeared to weigh on the stock. Finally, the Covid-19 pandemic had a significant negative impact on WEX’s closed loop fuel card business for fleets of commercial vehicles, given the economic shutdown. The Fund sold its positions in all three of these stocks.
LOOMIS SAYLES SMALL/MID CAP GROWTH FUND
Among individual stocks, the Fund’s top contributors to performance were biotech company Immunomedics Inc., pet food maker Freshpet Inc. and electrical generator specialist Generac Holdings Inc. Immunomedics reported positive phase 3 drug testing data during the year, with the company stopping the trial early and the treatment receiving accelerated approval. Subsequently, industry peer Gilead Sciences announced it would acquire the company, and investors reacted positively. Freshpet issued robust guidance in the belief that it has ample room to grow and to continue to penetrate the dog food market. Sales rose significantly as people began to shelter in place and bought supplies in bulk, and pet adoptions were also up during the pandemic, raising investor sentiment around the stock. Generac benefited from continued national adoption of its home standby generators and continued to see new market development.
Outlook
Despite the pause in September, the markets have been able to deliver spectacular returns, particularly when measured from the market bottom in March of this year. Despite strong returns, however, small-cap stocks underperformed their large-cap peers. The underperformance of small-caps during the third quarter put the rolling three-year differential between large-cap and small-cap performance at its widest level since 1999. The last time large-caps outperformed small-caps by such a wide margin, small-caps subsequently enjoyed a prolonged period of outperformance.
Volatility is likely to increase as we approach the election, and regardless of the outcome, it may continue to be an uncertain time for the markets. However, increasing visibility surrounding a potential vaccine for Covid-19 may provide some stability.
While there is so much that is not known about the pandemic and the continued economic impact, we remain focused on the underlying fundamentals of our companies. These stock-specific fundamentals should have a more significant effect on investment returns as uncertainty surrounding the virus and its economic ramifications fades. We certainly take into account how the world may change as a result of what we are going through and the impact those changes may have on individual companies, but we continue to seek out long-term secular winners that can grow into larger entities and create value for stakeholders.
Hypothetical Growth of $100,000 Investment in Institutional Class Shares2
June 30, 2015 (inception) through September 30, 2020
See notes to chart on page 13.
Top Ten Holdings as of September 30, 2020
| | | | | | |
| Security name | | % of
assets | |
| 1 | | Freshpet, Inc. | | | 2.35 | % |
| 2 | | EPAM Systems, Inc. | | | 2.15 | |
| 3 | | SiteOne Landscape Supply, Inc. | | | 2.08 | |
| 4 | | Insulet Corp. | | | 2.07 | |
| 5 | | Black Knight, Inc. | | | 1.84 | |
| 6 | | Catalent, Inc. | | | 1.81 | |
| 7 | | LHC Group, Inc. | | | 1.71 | |
| 8 | | Ares Management Corp., Class A | | | 1.70 | |
| 9 | | Generac Holdings, Inc. | | | 1.67 | |
| 10 | | Monolithic Power Systems, Inc. | | | 1.66 | |
The portfolio is actively managed and holdings are subject to change. There is no guarantee the Fund continues to invest in the securities referenced. The holdings listed exclude any temporary cash investments.
LOOMIS SAYLES SMALL/MID CAP GROWTH FUND
Average Annual Total Returns — September 30, 20202
| | | | | | | | | | | | | | | | | | | | | | | | |
| | | | | | | | | | | | | | | Expense Ratios3 | |
| | | 1 year | | | 5 years | | | Life of
Class I | | | Life of
Class N | | | Gross | | | Net | |
| | | | | | | |
Institutional Class
(Inception 6/30/15) | | | 20.38 | % | | | 14.83 | % | | | 11.92 | % | | | — | % | | | 1.30 | % | | | 0.85 | % |
| | | | | | | |
Class N
(Inception 10/1/19) | | | — | | | | — | | | | — | | | | 22.08 | | | | 1.29 | | | | 0.83 | |
| | | | | | | |
| Comparative Performance | | | | | | | | | | | | | | | | | | | | | | | | |
| Russell 2500TM Growth Index1 | | | 23.37 | | | | 14.19 | | | | 10.92 | | | | 25.41 | | | | | | | | | |
Performance data shown represents past performance and is no guarantee of, and not necessarily indicative of, future results. Total return and value will vary, and you may have a gain or loss when shares are sold. Current performance may be lower or higher than quoted. For most recent month-end performance, visit loomissayles.com. Performance for other share classes will be greater or less than shown based on differences in fees and sales charges. You may not invest directly in an index. Performance for periods less than one year is cumulative, not annualized. Returns reflect changes in share price and reinvestment of dividends and capital gains, if any. The table(s) do not reflect taxes shareholders might owe on any fund distributions or when they redeem their shares.
| 1 | | The Russell 2500™ Growth Index measures the performance of the small-to-mid-cap growth segment of the U.S. equity universe. It includes those Russell 2500TM Index companies with higher price-to-book ratios and higher forecasted growth values. The Russell 2500TM Growth Index is constructed to provide a comprehensive and unbiased barometer of the small-to-mid-cap growth market. The Index is completely reconstituted annually to ensure larger stocks do not distort the performance and characteristics of the true small-to-mid-cap opportunity set and that the represented companies continue to reflect growth characteristics. Indices are unmanaged. |
| 2 | | Fund performance has been increased by fee waivers and/or expense reimbursements, if any, without which performance would have been lower. |
| 3 | | Expense ratios are as shown in the Fund’s prospectus in effect as of the date of this report. The expense ratios for the current reporting period can be found in the Financial Highlights section of this report under Ratios to Average Net Assets. Net expenses reflect contractual expense limitations set to expire on 1/31/21. When a Fund’s expenses are below the limitation, gross and net expense ratios will be the same. See Note 5 of the Notes to Financial Statements for more information about the Fund’s expense limitations. |
ADDITIONAL INFORMATION
The views expressed in this report reflects those of the portfolio managers as of the dates indicated. The managers’ views are subject to change at any time without notice based on changes in market or other conditions. References to specific securities or industries should not be regarded as investment advice. Because the Funds are actively managed, there is no assurance that they will continue to invest in the securities or industries mentioned.
All investing involves risk, including the risk of loss. There is no assurance that any investment will meet its performance objectives or that losses will be avoided.
Additional Index Information
This document may contain references to third party copyrights, indexes, and trademarks, each of which is the property of its respective owner. Such owner is not affiliated with Natixis Investment Managers or any of its related or affiliated companies (collectively “Natixis Affiliates”) and does not sponsor, endorse or participate in the provision of any Natixis Affiliates services, funds or other financial products.
The index information contained herein is derived from third parties and is provided on an “as is” basis. The user of this information assumes the entire risk of use of this information. Each of the third party entities involved in compiling, computing or creating index information disclaims all warranties (including, without limitation, any warranties of originality, accuracy, completeness, timeliness, non-infringement, merchantability and fitness for a particular purpose) with respect to such information.
Proxy Voting Information
A description of the Funds’ proxy voting policies and procedures is available without charge upon request, by calling Loomis Sayles at 800-633-3330; on the Funds’ website, at www.loomissayles.com, and on the Securities and Exchange Commission’s (“SEC”) website at www.sec.gov. Information about how the Funds voted proxies relating to portfolio securities during the most recent 12-month period ended June 30 is available on the Funds’ website and the SEC’s website.
Quarterly Portfolio Schedules
The Funds file a complete schedule of portfolio holdings with the SEC for the first and third quarters of each fiscal year on Form N-PORT. The Funds’ Forms N-PORT are available on the SEC’s website at www.sec.gov.
CFA® and Chartered Financial Analyst® are registered trademarks owned by the CFA Institute.
UNDERSTANDING YOUR FUND’S EXPENSES
As a mutual fund shareholder you incur two types of costs: (1) transaction costs and (2) ongoing costs, including management fees, distribution and/or service fees (12b-1 fees), and other fund expenses. Certain exemptions may apply. These costs are described in more detail in the Funds’ prospectus. The following examples are intended to help you understand the ongoing costs of investing in the Funds and help you compare these with the ongoing costs of investing in other mutual funds.
The first line in the table of each Fund shows the actual amount of Fund expenses you would have paid on a $1,000 investment in the Fund from April 1, 2020 through September 30, 2020. To estimate the expenses you paid over the period, simply divide your account value by $1,000 (for example $8,600 account value divided by $1,000 = 8.6) and multiply the result by the number in the Expenses Paid During Period column as shown below for your class.
The second line in the table of each Fund provides information about hypothetical account values and hypothetical expenses based on the Fund’s actual expense ratios and an assumed rate of return of 5% per year before expenses, which is not the Fund’s actual return. The hypothetical account values and expenses may not be used to estimate the actual ending account balance or expenses you paid on your investment for the period. You may use this information to compare the ongoing costs of investing in the Funds to other funds. To do so, compare this 5% hypothetical example with the 5% hypothetical examples that appear in the shareholder reports of other funds.
Please note that the expenses shown reflect ongoing costs only, and do not include any transaction costs. Therefore, the second line in the table is useful in comparing ongoing costs only, and will not help you determine the relative costs of owning different funds. If transaction costs were included, total costs would be higher.
Loomis Sayles Small Cap Growth Fund
| | | | | | | | | | | | |
Institutional Class | | Beginning
Account Value
4/1/2020 | | | Ending
Account Value
9/30/2020 | | | Expenses Paid
During Period*
4/1/2020 – 9/30/2020 | |
Actual | | | $1,000.00 | | | | $1,415.60 | | | | $5.62 | |
Hypothetical (5% return before expenses) | | | $1,000.00 | | | | $1,020.35 | | | | $4.70 | |
| | |
Retail Class | | | | | | | |
Actual | | | $1,000.00 | | | | $1,413.50 | | | | $7.12 | |
Hypothetical (5% return before expenses) | | | $1,000.00 | | | | $1,019.10 | | | | $5.96 | |
| | |
Class N | | | | | | | |
Actual | | | $1,000.00 | | | | $1,415.70 | | | | $4.95 | |
Hypothetical (5% return before expenses) | | | $1,000.00 | | | | $1,020.90 | | | | $4.14 | |
|
* Expenses are equal to the Fund’s annualized expense ratio: 0.93%, 1.18% and 0.82% for Institutional Class, Retail Class and Class N, respectively, multiplied by the average account value over the period, multiplied by the number of days in the most recent fiscal half-year (183), divided by 366 (to reflect the half-year period). | |
Loomis Sayles Small Cap Value Fund
| | | | | | | | | | |
Institutional Class | | Beginning
Account Value
4/1/2020 | | | Ending
Account Value
9/30/2020 | | | Expenses Paid
During Period*
4/1/2020 – 9/30/2020 |
Actual | | $ | 1,000.00 | | | $ | 1,210.20 | | | $4.97 |
Hypothetical (5% return before expenses) | | $ | 1,000.00 | | | $ | 1,020.50 | | | $4.55 |
| | | |
Retail Class | | | | | | | | |
Actual | | $ | 1,000.00 | | | $ | 1,208.30 | | | $6.35 |
Hypothetical (5% return before expenses) | | $ | 1,000.00 | | | $ | 1,019.25 | | | $5.81 |
| | | |
Admin Class | | | | | | | | |
Actual | | $ | 1,000.00 | | | $ | 1,206.90 | | | $7.72 |
Hypothetical (5% return before expenses) | | $ | 1,000.00 | | | $ | 1,018.00 | | | $7.06 |
| | | |
Class N | | | | | | | | |
Actual | | $ | 1,000.00 | | | $ | 1,210.10 | | | $4.70 |
Hypothetical (5% return before expenses) | | $ | 1,000.00 | | | $ | 1,020.75 | | | $4.29 |
| | | | | | |
|
* Expenses are equal to the Fund’s annualized expense ratio (after waiver/reimbursement): 0.90%, 1.15%, 1.40% and 0.85% for Institutional Class, Retail Class, Admin Class and Class N, respectively, multiplied by the average account value over the period, multiplied by the number of days in the most recent fiscal half-year (183), divided by 366 (to reflect the half-year period). |
Loomis Sayles Small/Mid Cap Growth Fund
| | | | | | | | | | |
Institutional Class | | Beginning
Account Value
4/1/2020 | | | Ending
Account Value
9/30/2020 | | | Expenses Paid
During Period*
4/1/2020 – 9/30/2020 |
Actual | | $ | 1,000.00 | | | $ | 1,414.40 | | | $5.07 |
Hypothetical (5% return before expenses) | | $ | 1,000.00 | | | $ | 1,020.80 | | | $4.24 |
| | |
Class N | | | | | | |
Actual | | $ | 1,000.00 | | | $ | 1,412.70 | | | $5.01 |
Hypothetical (5% return before expenses) | | $ | 1,000.00 | | | $ | 1,020.85 | | | $4.19 |
| | | | | | |
* Expenses are equal to the Fund’s annualized expense ratio (after waiver/reimbursement) 0.84% and 0.83% for Institutional Class and Class N, respectively, multiplied by the average account value over the period, multiplied by the number of days in the most recent fiscal half-year (183), divided by 366 (to reflect the half-year period). |
BOARD APPROVAL OF THE EXISTING ADVISORY AGREEMENTS
The Board of Trustees of the Trusts (the “Board”), including the Independent Trustees, considers matters bearing on each Fund’s advisory agreement (collectively, the “Agreements”) at most of its meetings throughout the year. Each year, usually in the spring, the Contract Review Committee of the Board meets to review the Agreements to determine whether to recommend that the full Board approve the continuation of the Agreements, typically for an additional one-year period. After the Contract Review Committee has made its recommendation, the full Board, including the Independent Trustees, determines whether to approve the continuation of the Agreements.
In connection with these meetings, the Trustees receive materials that the Funds’ investment adviser (the “Adviser”) believes to be reasonably necessary for the Trustees to evaluate the Agreements. These materials generally include, among other items, (i) information on the investment performance of the Funds and the performance of peer groups of funds and the Funds’ performance benchmarks, (ii) information on the Funds’ advisory fees and other expenses, including information comparing the Funds’ advisory fees to the fees charged to institutional accounts with similar strategies managed by the Adviser, if any, and to those of peer groups of funds and information about any applicable expense caps and/or fee “breakpoints,” (iii) sales and redemption data in respect of the Funds, (iv) information about the profitability of the Agreements to the Adviser and (v) information obtained through the completion by the Adviser of a questionnaire distributed on behalf of the Trustees. The Board, including the Independent Trustees, also considers other matters such as (i) each Fund’s investment objective and strategies and the size, education and experience of the Adviser’s investment staff and its use of technology, external research and trading cost measurement tools, (ii) arrangements in respect of the distribution of the Funds’ shares and the related costs, (iii) the allocation of the Funds’ brokerage, if any, including, to the extent applicable, the use of “soft” commission dollars to pay for research and other similar services, (iv) each Adviser’s policies and procedures relating to, among other things, compliance, trading and best execution, proxy voting and valuation, (v) information about amounts invested by the Funds’ portfolio managers in the Funds or in similar accounts that they manage and (vi) the general economic outlook with particular emphasis on the mutual fund industry. Throughout the process, the Trustees are afforded the opportunity to ask questions of and request additional materials from the Adviser.
In addition to the materials requested by the Trustees in connection with their annual consideration of the continuation of the Agreements, the Trustees receive materials in advance of each regular quarterly meeting of the Board that provide detailed information about the Funds’ investment performance and the fees charged to the Funds for advisory and other services. This information generally includes, among other things, an internal performance rating for each Fund based on agreed-upon criteria, graphs showing each Fund’s performance and expense differentials against each Fund’s peer group/category, performance ratings provided by a third-party, total return information for various periods, and third-party performance rankings for various periods comparing a Fund against similarly categorized funds. The portfolio management team for each Fund or
other representatives of the Adviser make periodic presentations to the Contract Review Committee and/or the full Board, and Funds identified as presenting possible performance concerns may be subject to more frequent Board or Committee presentations and reviews. In addition, each quarter the Trustees are provided with detailed statistical information about each Fund’s portfolio. The Trustees also receive periodic updates between meetings. These updates have increased in frequency during the Covid-19 crisis.
The Board most recently approved the continuation of the Agreements for a one-year period at its meeting held in June 2020. In considering whether to approve the continuation of the Agreements, the Board, including the Independent Trustees, did not identify any single factor as determinative. Individual Trustees may have evaluated the information presented differently from one another, giving different weights to various factors. Matters considered by the Trustees, including the Independent Trustees, in connection with their approval of the Agreements included, but were not limited to, the factors listed below.
The nature, extent and quality of the services provided to the Funds under the Agreements. The Trustees considered the nature, extent and quality of the services provided by the Adviser and its affiliates to the Funds and the resources dedicated to the Funds by the Adviser and its affiliates.
The Trustees considered not only the advisory services provided by the Adviser to the Funds, but also the monitoring and oversight services provided by Natixis Advisors, L.P. (“Natixis Advisors”). They also considered the administrative and shareholder services provided by Natixis Advisors and its affiliates to the Funds. They also took into consideration increases in the services provided resulting from new regulatory requirements.
For each Fund, the Trustees also considered the benefits to shareholders of investing in a mutual fund that is part of a family of funds that offers shareholders the right to exchange shares of one type of fund for shares of another type of fund, and provides a variety of fund and shareholder services.
After reviewing these and related factors, the Trustees concluded, within the context of their overall conclusions regarding each of the Agreements, that the nature, extent and quality of services provided supported the renewal of the Agreements.
Investment performance of the Funds and the Adviser. As noted above, the Trustees received information about the performance of the Funds over various time periods, including information that compared the performance of the Funds to the performance of peer groups and categories of funds and the Funds’ respective performance benchmarks. In addition, the Trustees reviewed data prepared by an independent third party that analyzed the performance of the Funds using a variety of performance metrics, including metrics that measured the performance of the Funds on a risk adjusted basis.
The Board noted that, through December 31, 2019, each Fund’s one-, three- and five-year performance, as applicable, stated as percentile rankings within categories selected by the
independent third-party data provider was as follows (where the best performance would be in the first percentile of its category):
| | | | | | | | | | | | |
| | | One-Year | | | Three-Year | | | Five-Year | |
Loomis Sayles Small Cap Growth Fund | | | 55% | | | | 29% | | | | 30% | |
Loomis Sayles Small Cap Value Fund | | | 42% | | | | 80% | | | | 57% | |
Loomis Sayles Small/Mid Cap Growth Fund | | | 62% | | | | 36% | | | | N/A | |
In the case of each Fund that had performance that lagged that of a relevant category median as determined by the independent third party for certain (although not necessarily all) periods, the Board concluded that other factors relevant to performance supported renewal of the Agreements. These factors included one or more of the following: (1) that the underperformance was attributable, to a significant extent, to investment decisions (such as security selection or sector allocation) by the Adviser that were reasonable and consistent with the Fund’s investment objective and policies; (2) that the Loomis Sayles Small Cap Growth Fund’s performance, although lagging in certain periods, was competitive over the long term relative to its category; (3) that the Loomis Sayles Small Cap Growth Fund’s more recent performance had been stronger relative to its category; (4) that the Loomis Sayles Small/Mid Cap Growth Fund’s mid-term performance has been strong relative to its category; and (5) that the Loomis Sayles Small Cap Value Fund’s shorter-term performance has been strong relative to its category. The Board also considered information about the Funds’ more recent performance, including how that performance had been impacted by the Covid-19 crisis.
The Trustees also considered the Adviser’s performance and reputation generally, the performance of the fund family generally, and the historical responsiveness of the Adviser to Trustee concerns about performance and the willingness of the Adviser to take steps intended to improve performance.
After reviewing these and related factors, the Trustees concluded, within the context of their overall conclusions regarding each of the Agreements, that the performance of the Funds and the Adviser and/or other relevant factors supported the renewal of the Agreements.
The costs of the services to be provided and profits to be realized by the Adviser and its affiliates from their respective relationships with the Funds. The Trustees considered the fees charged to the Funds for advisory and administrative services as well as the total expense levels of the Funds. This information included comparisons (provided both by management and by an independent third party) of the Funds’ advisory fees and total expense levels to those of their peer groups and information about the advisory fees charged by the Adviser to comparable accounts (such as institutional separate accounts), as well as information about differences in such fees and the reasons for any such differences. In considering the fees charged to comparable accounts, the Trustees considered, among other things, management’s representations about the differences between managing mutual funds as compared to other types of accounts, including the additional resources required to effectively manage mutual fund assets, the greater regulatory costs associated with the management of such assets, and the entrepreneurial, regulatory and other risks associated with sponsoring and managing mutual funds. In evaluating each Fund’s advisory fee, the
Trustees also took into account the demands, complexity and quality of the investment management of such Fund and the need for the Adviser to offer competitive compensation and the potential need to expend additional resources to the extent the Fund grows in size. The Trustees considered that over the past several years, management had made recommendations regarding reductions in advisory fee rates, implementation of advisory fee breakpoints and the institution of advisory fee waivers and expense caps for various funds in the fund family. They noted that the Loomis Sayles Small Cap Value Fund and Loomis Sayles Small/Mid Cap Growth Fund have expense caps in place, and they considered the amounts waived or reimbursed by the Adviser for certain Funds under their respective expense cap agreements. The Trustees also considered that Loomis Sayles Small Cap Growth Fund’s current expenses are below its cap. The Trustees noted that the Funds had total advisory fee rates that were below the medians of their respective peer groups of funds.
The Trustees also considered the compensation directly or indirectly received by the Adviser and its affiliates from their relationships with the Funds. The Trustees reviewed information provided by management as to the profitability of the Adviser’s and its affiliates’ relationships with the Funds, and information about how expenses are determined and allocated for purposes of profitability calculations. They also reviewed information provided by management about the effect of distribution costs and changes in asset levels on Adviser profitability, including information regarding resources spent on distribution activities. When reviewing profitability, the Trustees also considered information about court cases in which adviser compensation or profitability were issues, the performance of the Funds, the expense levels of the Funds, whether the Adviser had implemented breakpoints and/or expense caps with respect to such Funds and the overall profit margin of Natixis Investment Managers compared to that of certain other investment managers for which such data was available.
After reviewing these and related factors, the Trustees concluded, within the context of their overall conclusions regarding each of the Agreements, that the advisory fee charged to each of the Funds was fair and reasonable, and that the costs of these services generally and the related profitability of the Adviser and its affiliates in respect of their relationships with the Funds supported the renewal of the Agreements.
Economies of Scale. The Trustees considered the existence of any economies of scale in the provision of services by the Adviser and whether those economies are shared with the Funds through breakpoints in their investment advisory fees or other means, such as expense caps. The Trustees also considered management’s explanation of the factors that are taken into account with respect to the implementation of breakpoints in investment advisory fees or expense caps. With respect to economies of scale, the Trustees noted that although none of the Funds’ management fees were subject to breakpoints, each of the Funds was subject to an expense cap. In considering these issues, the Trustees also took note of the costs of the services provided (both on an absolute and on a relative basis) and the profitability to the Adviser and its affiliates of their relationships with the Funds, as discussed above. The Trustees also considered that the Funds have benefitted from the substantial reinvestment the Adviser has made into its business.
After reviewing these and related factors, the Trustees concluded, within the context of their overall conclusions regarding each of the Agreements, that the extent to which economies of scale were shared with the Funds supported the renewal of the Agreements.
The Trustees also considered other factors, which included but were not limited to the following:
| • | | The effect of recent market and economic events, including but not limited to the Covid-19 crisis, on the performance, asset levels and expense ratios of each Fund. |
| • | | Whether each Fund has operated in accordance with its investment objective and the Fund’s record of compliance with its investment restrictions, and the compliance programs of the Funds and the Adviser. They also considered the compliance-related resources the Adviser and its affiliates were providing to the Funds. |
| • | | So-called “fallout benefits” to the Adviser, such as the engagement of affiliates of the Adviser to provide distribution and administrative services to the Funds, and the benefits of research made available to the Adviser by reason of brokerage commissions (if any) generated by the Funds’ securities transactions. The Trustees also considered the benefits to the parent company of Natixis Advisors from the retention of the Adviser. The Trustees considered the possible conflicts of interest associated with these fallout and other benefits, and the reporting, disclosure and other processes in place to disclose and monitor such possible conflicts of interest. |
| • | | The Trustees’ review and discussion of the Funds’ advisory arrangements in prior years, and management’s record of responding to Trustee concerns raised during the year and in prior years. |
Based on their evaluation of all factors that they deemed to be material, including those factors described above, and assisted by the advice of independent counsel, the Trustees, including the Independent Trustees, concluded that each of the existing Agreements should be continued through June 30, 2021.
LIQUIDITY RISK MANAGEMENT PROGRAM
Annual Report for the Period Commencing on December 1, 2018 and ending December 31, 2019 (including updates through September 30, 2020)
Effective December 1, 2018, the Funds adopted a liquidity risk management program (the “Program”) pursuant to the requirements of Rule 22e-4 under the Investment Company Act of 1940, as amended (the “Rule”). The Rule requires registered open-end funds, including mutual funds and exchange-traded funds to establish liquidity risk management programs in order to effectively manage fund liquidity and mitigate the risk that a fund could not meet redemption requests without significantly diluting the interests of remaining investors.
The rule requires the Funds to assess, manage and review their liquidity risk considering applicable factors during normal and foreseeable stressed conditions. In fulfilling this requirement, each Fund assesses and reviews (where applicable and amongst other matters) its investment strategy, portfolio holdings, possible investment concentrations, use of derivatives, short-term and long-term cash flow projections, use of cash and cash equivalents, as well as borrowing arrangements and other funding sources. Each Program has established a Program Administrator which is the adviser of the Fund.
In accordance with the Program, each of the Fund’s portfolio investments is classified into one of four liquidity categories based on a determination of a reasonable expectation for how long it would take to convert the investment to cash (or sell or dispose of the investment) without significantly changing its market value.
Each Fund is prohibited from acquiring an investment if, after the acquisition, its holdings of illiquid assets will exceed 15% of its net assets. If a Fund does not hold a majority of highly liquid investments in its portfolio, then the Fund is required to establish a highly liquid investment minimum (“HLIM”). None of the Funds has established an HLIM.
During the period from December 1, 2018 to December 31, 2019, there were no material changes to the Program and no material events that impacted the operation of the Funds’ Programs. During the period, the Funds held sufficient liquid assets to meet redemptions on a timely basis and did not have any illiquid security violations during the period.
During the period January 1, 2020 through September 30, 2020, the Funds held sufficient liquid assets to meet redemptions on a timely basis and did not have any illiquid security violations.
Annual Program Assessment and Conclusion
In the opinion of the Program Administrator, the Program of each Fund approved by the Funds’ Board has been implemented effectively. The Program Administrator have also monitored, assessed and managed each Fund’s liquidity risk regularly and has determined that the Programs are operating effectively.
Pursuant to the Rule’s requirements, the Board has received and reviewed a written report prepared by each Fund’s Program Administrator that addressed the operation of the Program, assessed its adequacy and effectiveness and described any material changes made to the Program.
Portfolio of Investments – as of September 30, 2020
Loomis Sayles Small Cap Growth Fund
| | | | | | | | |
Shares | | | Description | | Value (†) | |
| |
| Common Stocks – 95.4% of Net Assets | | | |
| | |
| | | | Aerospace & Defense – 2.3% | | | |
| | 1,155,064 | | | Kratos Defense & Security Solutions, Inc.(a) | | $ | 22,269,634 | |
| | 372,156 | | | Mercury Systems, Inc.(a) | | | 28,827,204 | |
| | | | | | | | |
| | | | | | | 51,096,838 | |
| | | | | | | | |
| | |
| | | | Air Freight & Logistics – 1.0% | | | |
| | 874,105 | | | Air Transport Services Group, Inc.(a) | | | 21,905,071 | |
| | | | | | | | |
| | |
| | | | Auto Components – 1.7% | | | |
| | 83,566 | | | Dorman Products, Inc.(a) | | | 7,552,695 | |
| | 291,701 | | | Fox Factory Holding Corp.(a) | | | 21,682,135 | |
| | 488,815 | | | Stoneridge, Inc.(a) | | | 8,979,532 | |
| | | | | | | | |
| | | | | | | 38,214,362 | |
| | | | | | | | |
| | |
| | | | Beverages – 0.5% | | | |
| | 780,861 | | | Primo Water Corp. | | | 11,088,226 | |
| | | | | | | | |
| | |
| | | | Biotechnology – 9.4% | | | |
| | 199,179 | | | Blueprint Medicines Corp.(a) | | | 18,463,893 | |
| | 266,067 | | | ChemoCentryx, Inc.(a) | | | 14,580,472 | |
| | 589,709 | | | Dicerna Pharmaceuticals, Inc.(a) | | | 10,608,865 | |
| | 152,537 | | | Emergent BioSolutions, Inc.(a) | | | 15,761,648 | |
| | 805,957 | | | Halozyme Therapeutics, Inc.(a) | | | 21,180,550 | |
| | 405,099 | | | Natera, Inc.(a) | | | 29,264,352 | |
| | 323,557 | | | PTC Therapeutics, Inc.(a) | | | 15,126,290 | |
| | 599,929 | | | Rocket Pharmaceuticals, Inc.(a) | | | 13,714,377 | |
| | 324,427 | | | SpringWorks Therapeutics, Inc.(a) | | | 15,465,435 | |
| | 597,319 | | | Veracyte, Inc.(a) | | | 19,406,894 | |
| | 426,408 | | | Xencor, Inc.(a) | | | 16,540,366 | |
| | 439,455 | | | Y-mAbs Therapeutics, Inc.(a) | | | 16,870,678 | |
| | | | | | | | |
| | | | | | | 206,983,820 | |
| | | | | | | | |
| | |
| | | | Building Products – 5.6% | | | |
| | 428,365 | | | AAON, Inc. | | | 25,808,991 | |
| | 491,098 | | | Advanced Drainage Systems, Inc. | | | 30,664,159 | |
| | 327,400 | | | Patrick Industries, Inc. | | | 18,832,048 | |
| | 418,580 | | | Trex Co., Inc.(a) | | | 29,970,328 | |
| | 301,378 | | | UFP Industries, Inc. | | | 17,030,871 | |
| | | | | | | | |
| | | | | | | 122,306,397 | |
| | | | | | | | |
| | |
| | | | Capital Markets – 3.4% | | | |
| | 822,483 | | | AssetMark Financial Holdings, Inc.(a) | | | 17,880,780 | |
| | 465,405 | | | Focus Financial Partners, Inc., Class A(a) | | | 15,260,630 | |
| | 273,871 | | | Hamilton Lane, Inc., Class A | | | 17,689,328 | |
| | 411,731 | | | PJT Partners, Inc., Class A | | | 24,955,016 | |
| | | | | | | | |
| | | | | | | 75,785,754 | |
| | | | | | | | |
See accompanying notes to financial statements.
Portfolio of Investments – as of September 30, 2020
Loomis Sayles Small Cap Growth Fund – continued
| | | | | | | | |
Shares | | | Description | | Value (†) | |
| |
| Common Stocks – continued | | | |
| | |
| | | | Commercial Services & Supplies – 2.3% | | | |
| | 516,104 | | | Casella Waste Systems, Inc., Class A(a) | | $ | 28,824,408 | |
| | 348,672 | | | McGrath RentCorp | | | 20,777,365 | |
| | | | | | | | |
| | | | | | | 49,601,773 | |
| | | | | | | | |
| | |
| | | | Construction & Engineering – 0.9% | | | |
| | 1,127,993 | | | WillScot Mobile Mini Holdings Corp.(a) | | | 18,814,923 | |
| | | | | | | | |
| | |
| | | | Diversified Consumer Services – 1.6% | | | |
| | 307,575 | | | Arco Platform Ltd., Class A(a) | | | 12,561,363 | |
| | 566,986 | | | frontdoor, Inc.(a) | | | 22,061,425 | |
| | | | | | | | |
| | | | | | | 34,622,788 | |
| | | | | | | | |
| | |
| | | | Electrical Equipment – 1.7% | | | |
| | 197,874 | | | Generac Holdings, Inc.(a) | | | 38,316,321 | |
| | | | | | | | |
| | |
| | | | Electronic Equipment, Instruments & Components – 2.6% | | | |
| | 251,691 | | | Itron, Inc.(a) | | | 15,287,711 | |
| | 532,978 | | | nLight, Inc.(a) | | | 12,514,324 | |
| | 271,044 | | | Novanta, Inc.(a) | | | 28,551,775 | |
| | | | | | | | |
| | | | | | | 56,353,810 | |
| | | | | | | | |
| | |
| | | | Food Products – 2.8% | | | |
| | 408,360 | | | Freshpet, Inc.(a) | | | 45,593,394 | |
| | 766,817 | | | Simply Good Foods Co. (The)(a) | | | 16,908,315 | |
| | | | | | | | |
| | | | | | | 62,501,709 | |
| | | | | | | | |
| | |
| | | | Health Care Equipment & Supplies – 5.5% | | | |
| | 407,490 | | | AtriCure, Inc.(a) | | | 16,258,851 | |
| | 430,322 | | | CryoPort, Inc.(a) | | | 20,397,263 | |
| | 136,120 | | | iRhythm Technologies, Inc.(a) | | | 32,411,533 | |
| | 236,470 | | | NuVasive, Inc.(a) | | | 11,485,348 | |
| | 105,678 | | | Penumbra, Inc.(a) | | | 20,541,690 | |
| | 350,629 | | | STAAR Surgical Co.(a) | | | 19,831,576 | |
| | | | | | | | |
| | | | | | | 120,926,261 | |
| | | | | | | | |
| | |
| | | | Health Care Providers & Services – 4.8% | | | |
| | 138,729 | | | Amedisys, Inc.(a) | | | 32,799,697 | |
| | 415,753 | | | BioTelemetry, Inc.(a) | | | 18,950,022 | |
| | 255,497 | | | HealthEquity, Inc.(a) | | | 13,124,881 | |
| | 193,634 | | | LHC Group, Inc.(a) | | | 41,158,843 | |
| | | | | | | | |
| | | | | | | 106,033,443 | |
| | | | | | | | |
| | |
| | | | Health Care Technology – 3.7% | | | |
| | 1,304,123 | | | Inovalon Holdings, Inc., Class A(a) | | | 34,494,053 | |
| | 220,379 | | | Inspire Medical Systems, Inc.(a) | | | 28,439,910 | |
| | 546,780 | | | Phreesia, Inc.(a) | | | 17,568,042 | |
| | | | | | | | |
| | | | | | | 80,502,005 | |
| | | | | | | | |
See accompanying notes to financial statements.
Portfolio of Investments – as of September 30, 2020
Loomis Sayles Small Cap Growth Fund – continued
| | | | | | | | |
Shares | | | Description | | Value (†) | |
| |
| Common Stocks – continued | | | |
| | |
| | | | Hotels, Restaurants & Leisure – 2.2% | | | |
| | 275,570 | | | Texas Roadhouse, Inc. | | $ | 16,751,900 | |
| | 224,946 | | | Wingstop, Inc. | | | 30,738,871 | |
| | | | | | | | |
| | | | | | | 47,490,771 | |
| | | | | | | | |
| | |
| | | | Insurance – 4.8% | | | |
| | 387,703 | | | Goosehead Insurance, Inc., Series A | | | 33,571,203 | |
| | 193,960 | | | Kinsale Capital Group, Inc. | | | 36,887,313 | |
| | 343,888 | | | Palomar Holdings, Inc.(a) | | | 35,846,885 | |
| | | | | | | | |
| | | | | | | 106,305,401 | |
| | | | | | | | |
| | |
| | | | Internet & Direct Marketing Retail – 0.6% | | | |
| | 266,400 | | | Shutterstock, Inc. | | | 13,863,456 | |
| | | | | | | | |
| | |
| | | | IT Services – 4.0% | | | |
| | 535,314 | | | EVERTEC, Inc. | | | 18,580,749 | |
| | 466,095 | | | KBR, Inc. | | | 10,421,884 | |
| | 186,676 | | | ManTech International Corp., Class A | | | 12,858,243 | |
| | 863,471 | | | NIC, Inc. | | | 17,010,379 | |
| | 443,586 | | | WNS Holdings Ltd., ADR(a) | | | 28,371,760 | |
| | | | | | | | |
| | | | | | | 87,243,015 | |
| | | | | | | | |
| | |
| | | | Leisure Products – 0.7% | | | |
| | 309,510 | | | Malibu Boats, Inc., Class A(a) | | | 15,339,316 | |
| | | | | | | | |
| | |
| | | | Life Sciences Tools & Services – 3.7% | | | |
| | 697,887 | | | NeoGenomics, Inc.(a) | | | 25,745,051 | |
| | 279,851 | | | PRA Health Sciences, Inc.(a) | | | 28,388,086 | |
| | 190,481 | | | Repligen Corp.(a) | | | 28,103,567 | |
| | | | | | | | |
| | | | | | | 82,236,704 | |
| | | | | | | | |
| | |
| | | | Machinery – 2.9% | | | |
| | 434,127 | | | Kornit Digital Ltd.(a) | | | 28,161,818 | |
| | 146,873 | | | Proto Labs, Inc.(a) | | | 19,020,054 | |
| | 136,663 | | | RBC Bearings, Inc.(a) | | | 16,564,922 | |
| | | | | | | | |
| | | | | | | 63,746,794 | |
| | | | | | | | |
| | |
| | | | Media – 0.7% | | | |
| | 333,885 | | | TechTarget, Inc.(a) | | | 14,677,585 | |
| | | | | | | | |
| | |
| | | | Pharmaceuticals – 3.4% | | | |
| | 1,073,759 | | | Aerie Pharmaceuticals, Inc.(a) | | | 12,638,144 | |
| | 118,398 | | | GW Pharmaceuticals PLC, Sponsored ADR(a) | | | 11,526,045 | |
| | 170,802 | | | MyoKardia, Inc.(a) | | | 23,285,437 | |
| | 469,027 | | | Pacira BioSciences, Inc.(a) | | | 28,197,903 | |
| | | | | | | | |
| | | | | | | 75,647,529 | |
| | | | | | | | |
See accompanying notes to financial statements.
Portfolio of Investments – as of September 30, 2020
Loomis Sayles Small Cap Growth Fund – continued
| | | | | | | | |
Shares | | | Description | | Value (†) | |
| |
| Common Stocks – continued | | | |
| | |
| | | | Professional Services – 0.6% | | | |
| | 343,344 | | | Huron Consulting Group, Inc.(a) | | $ | 13,503,719 | |
| | | | | | | | |
| | |
| | | | Semiconductors & Semiconductor Equipment – 5.0% | | | |
| | 270,609 | | | Advanced Energy Industries, Inc.(a) | | | 17,032,131 | |
| | 822,809 | | | FormFactor, Inc.(a) | | | 20,512,628 | |
| | 674,621 | | | MACOM Technology Solutions Holdings, Inc.(a) | | | 22,943,860 | |
| | 1,217,036 | | | Rambus, Inc.(a) | | | 16,661,223 | |
| | 207,007 | | | Silicon Laboratories, Inc.(a) | | | 20,255,635 | |
| | 360,522 | | | Silicon Motion Technology Corp., ADR | | | 13,620,521 | |
| | | | | | | | |
| | | | | | | 111,025,998 | |
| | | | | | | | |
| | |
| | | | Software – 12.6% | | | |
| | 219,184 | | | Blackline, Inc.(a) | | | 19,645,462 | |
| | 376,911 | | | Envestnet, Inc.(a) | | | 29,082,453 | |
| | 326,057 | | | Five9, Inc.(a) | | | 42,283,072 | |
| | 189,176 | | | Globant S.A.(a) | | | 33,904,123 | |
| | 484,140 | | | Mimecast Ltd.(a) | | | 22,715,849 | |
| | 336,712 | | | Q2 Holdings, Inc.(a) | | | 30,728,337 | |
| | 446,739 | | | Rapid7, Inc.(a) | | | 27,358,296 | |
| | 356,174 | | | RealPage, Inc.(a) | | | 20,529,869 | |
| | 685,058 | | | Tenable Holdings, Inc.(a) | | | 25,860,939 | |
| | 226,364 | | | Varonis Systems, Inc.(a) | | | 26,126,933 | |
| | | | | | | | |
| | | | | | | 278,235,333 | |
| | | | | | | | |
| | |
| | | | Specialty Retail – 1.2% | | | |
| | 705,389 | | | National Vision Holdings, Inc.(a) | | | 26,974,075 | |
| | | | | | | | |
| | |
| | | | Textiles, Apparel & Luxury Goods – 1.3% | | | |
| | 245,712 | | | Columbia Sportswear Co. | | | 21,372,030 | |
| | 414,340 | | | Steven Madden Ltd. | | | 8,079,630 | |
| | | | | | | | |
| | | | | | | 29,451,660 | |
| | | | | | | | |
| | |
| | | | Trading Companies & Distributors – 1.9% | | | |
| | 334,212 | | | SiteOne Landscape Supply, Inc.(a) | | | 40,757,153 | |
| | | | | | | | |
| | |
| | | | Total Common Stocks
(Identified Cost $1,517,178,654) | | 2,101,552,010 | |
| | | | | | | | |
See accompanying notes to financial statements.
Portfolio of Investments – as of September 30, 2020
Loomis Sayles Small Cap Growth Fund – continued
| | | | | | | | |
Principal
Amount | | | Description | | Value (†) | |
| |
| | Short-Term Investments – 4.1% | | | | |
| | |
| $ | 89,820,709 | | | Tri-Party Repurchase Agreement with Fixed Income Clearing Corporation, dated 9/30/2020 at 0.000% to be repurchased at $89,820,709 on 10/01/2020 collateralized by $91,624,300 U.S. Treasury Note, 0.250% due 9/30/2025 valued at $91,617,154 including accrued interest (Note 2 of Notes to Financial Statements)
(Identified Cost $89,820,709) | | $ | 89,820,709 | |
| | | | | | | | |
| | |
| | | | Total Investments – 99.5%
(Identified Cost $1,606,999,363) | | 2,191,372,719 | |
| | |
| | | | Other assets less liabilities – 0.5% | | | 10,523,805 | |
| | | | | | | | |
| | |
| | | | Net Assets – 100.0% | | $ | 2,201,896,524 | |
| | | | | | | | |
| |
| | (†) | | | See Note 2 of Notes to Financial Statements. | |
| | |
| | (a) | | | Non-income producing security. | | | | |
| |
| | ADR | | | An American Depositary Receipt is a certificate issued by a custodian bank representing the right to receive securities of the foreign issuer described. The values of ADRs may be significantly influenced by trading on exchanges not located in the United States. | |
Industry Summary at September 30, 2020
| | | | |
Software | | | 12.6 | % |
Biotechnology | | | 9.4 | |
Building Products | | | 5.6 | |
Health Care Equipment & Supplies | | | 5.5 | |
Semiconductors & Semiconductor Equipment | | | 5.0 | |
Insurance | | | 4.8 | |
Health Care Providers & Services | | | 4.8 | |
IT Services | | | 4.0 | |
Life Sciences Tools & Services | | | 3.7 | |
Health Care Technology | | | 3.7 | |
Capital Markets | | | 3.4 | |
Pharmaceuticals | | | 3.4 | |
Machinery | | | 2.9 | |
Food Products | | | 2.8 | |
Electronic Equipment, Instruments & Components | | | 2.6 | |
Aerospace & Defense | | | 2.3 | |
Commercial Services & Supplies | | | 2.3 | |
Hotels, Restaurants & Leisure | | | 2.2 | |
Other Investments, less than 2% each | | | 14.4 | |
Short-Term Investments | | | 4.1 | |
| | | | |
Total Investments | | | 99.5 | |
Other assets less liabilities | | | 0.5 | |
| | | | |
Net Assets | | | 100.0 | % |
| | | | |
See accompanying notes to financial statements.
Portfolio of Investments – as of September 30, 2020
Loomis Sayles Small Cap Value Fund
| | | | | | | | |
Shares | | | Description | | Value (†) | |
| |
| Common Stocks – 98.9% of Net Assets | | | |
| | |
| | | | Aerospace & Defense – 1.5% | | | |
| | 123,384 | | | Aerojet Rocketdyne Holdings, Inc.(a) | | $ | 4,921,788 | |
| | 36,809 | | | BWX Technologies, Inc. | | | 2,072,715 | |
| | | | | | | | |
| | | | | | | 6,994,503 | |
| | | | | | | | |
| | |
| | | | Auto Components – 2.8% | | | |
| | 134,171 | | | Cooper Tire & Rubber Co. | | | 4,253,221 | |
| | 288,336 | | | Dana, Inc. | | | 3,552,299 | |
| | 20,928 | | | Fox Factory Holding Corp.(a) | | | 1,555,578 | |
| | 38,655 | | | LCI Industries | | | 4,108,640 | |
| | | | | | | | |
| | | | | | | 13,469,738 | |
| | | | | | | | |
| | |
| | | | Banks – 11.7% | | | |
| | 158,448 | | | Ameris Bancorp | | | 3,609,445 | |
| | 178,809 | | | Atlantic Union Bankshares Corp. | | | 3,821,148 | |
| | 183,909 | | | BancorpSouth Bank | | | 3,564,156 | |
| | 143,342 | | | Bryn Mawr Bank Corp. | | | 3,564,916 | |
| | 129,117 | | | Cathay General Bancorp | | | 2,799,257 | |
| | 205,315 | | | CVB Financial Corp. | | | 3,414,388 | |
| | 264,872 | | | Home BancShares, Inc. | | | 4,015,460 | |
| | 214,326 | | | OceanFirst Financial Corp. | | | 2,934,123 | |
| | 89,424 | | | Pinnacle Financial Partners, Inc. | | | 3,182,600 | |
| | 132,588 | | | Popular, Inc. | | | 4,808,967 | |
| | 86,403 | | | Prosperity Bancshares, Inc. | | | 4,478,267 | |
| | 62,945 | | | South State Corp. | | | 3,030,802 | |
| | 146,038 | | | TCF Financial Corp. | | | 3,411,448 | |
| | 152,089 | | | Triumph Bancorp, Inc.(a) | | | 4,736,051 | |
| | 118,577 | | | Wintrust Financial Corp. | | | 4,749,009 | |
| | | | | | | | |
| | | | | | | 56,120,037 | |
| | | | | | | | |
| | |
| | | | Beverages – 1.1% | | | |
| | 384,847 | | | Primo Water Corp. | | | 5,464,827 | |
| | | | | | | | |
| | |
| | | | Biotechnology – 1.9% | | | |
| | 49,164 | | | Emergent BioSolutions, Inc.(a) | | | 5,080,116 | |
| | 41,704 | | | United Therapeutics Corp.(a) | | | 4,212,104 | |
| | | | | | | | |
| | | | | | | 9,292,220 | |
| | | | | | | | |
| | |
| | | | Building Products – 2.4% | | | |
| | 41,253 | | | American Woodmark Corp.(a) | | | 3,240,011 | |
| | 52,093 | | | Armstrong World Industries, Inc. | | | 3,584,519 | |
| | 85,538 | | | UFP Industries, Inc. | | | 4,833,752 | |
| | | | | | | | |
| | | | | | | 11,658,282 | |
| | | | | | | | |
| | |
| | | | Capital Markets – 1.8% | | | |
| | 322,542 | | | Donnelley Financial Solutions, Inc.(a) | | | 4,309,161 | |
| | 85,801 | | | Stifel Financial Corp. | | | 4,338,099 | |
| | | | | | | | |
| | | | | | | 8,647,260 | |
| | | | | | | | |
See accompanying notes to financial statements.
Portfolio of Investments – as of September 30, 2020
Loomis Sayles Small Cap Value Fund – continued
| | | | | | | | |
Shares | | | Description | | Value (†) | |
| |
| Common Stocks – continued | | | |
| | |
| | | | Chemicals – 3.4% | | | |
| | 46,766 | | | Ashland Global Holdings, Inc. | | $ | 3,316,645 | |
| | 86,315 | | | Cabot Corp. | | | 3,109,929 | |
| | 48,315 | | | Ingevity Corp.(a) | | | 2,388,694 | |
| | 220,616 | | | Valvoline, Inc. | | | 4,200,529 | |
| | 75,242 | | | WR Grace & Co. | | | 3,031,500 | |
| | | | | | | | |
| | | | | | | 16,047,297 | |
| | | | | | | | |
| | |
| | | | Commercial Services & Supplies – 4.5% | | | |
| | 55,355 | | | Clean Harbors, Inc.(a) | | | 3,101,541 | |
| | 270,322 | | | Harsco Corp.(a) | | | 3,760,179 | |
| | 116,763 | | | IAA, Inc.(a) | | | 6,079,849 | |
| | 137,373 | | | KAR Auction Services, Inc. | | | 1,978,171 | |
| | 220,407 | | | Kimball International, Inc., Class B | | | 2,323,090 | |
| | 68,491 | | | McGrath RentCorp | | | 4,081,379 | |
| | | | | | | | |
| | | | | | | 21,324,209 | |
| | | | | | | | |
| | |
| | | | Communications Equipment – 0.7% | | | |
| | 300,248 | | | Viavi Solutions, Inc.(a) | | | 3,521,909 | |
| | | | | | | | |
| | |
| | | | Construction & Engineering – 2.4% | | | |
| | 116,522 | | | AECOM(a) | | | 4,875,281 | |
| | 144,312 | | | Arcosa, Inc. | | | 6,362,716 | |
| | | | | | | | |
| | | | | | | 11,237,997 | |
| | | | | | | | |
| | |
| | | | Distributors – 0.8% | | | |
| | 132,357 | | | Core-Mark Holding Co., Inc. | | | 3,829,088 | |
| | | | | | | | |
| | |
| | | | Diversified Consumer Services – 0.7% | | | |
| | 83,035 | | | frontdoor, Inc.(a) | | | 3,230,892 | |
| | | | | | | | |
| | |
| | | | Diversified Financial Services – 0.9% | | | |
| | 110,496 | | | Cannae Holdings, Inc.(a) | | | 4,117,081 | |
| | | | | | | | |
| | |
| | | | Diversified Telecommunication Services – 2.0% | | | |
| | 96,973 | | | GCI Liberty, Inc., Class A(a) | | | 7,947,907 | |
| | 204,894 | | | Liberty Latin America Ltd., Class C(a) | | | 1,667,837 | |
| | | | | | | | |
| | | | | | | 9,615,744 | |
| | | | | | | | |
| | |
| | | | Electric Utilities – 2.1% | | | |
| | 93,264 | | | ALLETE, Inc. | | | 4,825,479 | |
| | 169,437 | | | NRG Energy, Inc. | | | 5,208,494 | |
| | | | | | | | |
| | | | | | | 10,033,973 | |
| | | | | | | | |
| | |
| | | | Electrical Equipment – 1.2% | | | |
| | 339,757 | | | Vertiv Holdings Co.(a) | | | 5,884,591 | |
| | | | | | | | |
See accompanying notes to financial statements.
Portfolio of Investments – as of September 30, 2020
Loomis Sayles Small Cap Value Fund – continued
| | | | | | | | |
Shares | | | Description | | Value (†) | |
| |
| Common Stocks – continued | | | |
| | |
| | | | Electronic Equipment, Instruments & Components – 4.2% | | | |
| | 65,374 | | | Belden, Inc. | | $ | 2,034,439 | |
| | 126,191 | | | Kimball Electronics, Inc.(a) | | | 1,458,768 | |
| | 23,662 | | | Littelfuse, Inc. | | | 4,196,219 | |
| | 174,037 | | | Methode Electronics, Inc. | | | 4,960,054 | |
| | 27,993 | | | SYNNEX Corp. | | | 3,920,700 | |
| | 309,574 | | | TTM Technologies, Inc.(a) | | | 3,532,239 | |
| | | | | | | | |
| | | | | | | 20,102,419 | |
| | | | | | | | |
| | |
| | | | Energy Equipment & Services – 1.4% | | | |
| | 402,714 | | | ChampionX Corp.(a) | | | 3,217,685 | |
| | 102,555 | | | DMC Global, Inc. | | | 3,378,162 | |
| | | | | | | | |
| | | | | | | 6,595,847 | |
| | | | | | | | |
| | |
| | | | Entertainment – 1.2% | | | |
| | 139,588 | | | Liberty Media Corp.-Liberty Braves, Class C(a) | | | 2,932,744 | |
| | 41,130 | | | Madison Square Garden Entertainment Corp.(a) | | | 2,816,994 | |
| | | | | | | | |
| | | | | | | 5,749,738 | |
| | | | | | | | |
| | |
| | | | Food Products – 4.4% | | | |
| | 169,521 | | | Darling Ingredients, Inc.(a) | | | 6,107,842 | |
| | 22,737 | | | J&J Snack Foods Corp. | | | 2,964,677 | |
| | 328,895 | | | Nomad Foods Ltd.(a) | | | 8,380,245 | |
| | 43,337 | | | Post Holdings, Inc.(a) | | | 3,726,982 | |
| | | | | | | | |
| | | | | | | 21,179,746 | |
| | | | | | | | |
| | |
| | | | Health Care Equipment & Supplies – 1.8% | | | |
| | 26,003 | | | CONMED Corp. | | | 2,045,656 | |
| | 54,105 | | | Inmode Ltd.(a) | | | 1,957,519 | |
| | 109,619 | | | Lantheus Holdings, Inc.(a) | | | 1,388,873 | |
| | 13,717 | | | Quidel Corp.(a) | | | 3,009,235 | |
| | | | | | | | |
| | | | | | | 8,401,283 | |
| | | | | | | | |
| | |
| | | | Health Care Providers & Services – 0.6% | | | |
| | 46,740 | | | AMN Healthcare Services, Inc.(a) | | | 2,732,420 | |
| | | | | | | | |
| | |
| | | | Hotels, Restaurants & Leisure – 2.6% | | | |
| | 37,625 | | | Churchill Downs, Inc. | | | 6,163,727 | |
| | 18,625 | | | Cracker Barrel Old Country Store, Inc. | | | 2,135,543 | |
| | 47,411 | | | Marriott Vacations Worldwide Corp. | | | 4,305,393 | |
| | | | | | | | |
| | | | | | | 12,604,663 | |
| | | | | | | | |
| | |
| | | | Household Durables – 1.8% | | | |
| | 27,664 | | | Helen of Troy Ltd.(a) | | | 5,353,537 | |
| | 124,060 | | | Skyline Champion Corp.(a) | | | 3,321,086 | |
| | | | | | | | |
| | | | | | | 8,674,623 | |
| | | | | | | | |
See accompanying notes to financial statements.
Portfolio of Investments – as of September 30, 2020
Loomis Sayles Small Cap Value Fund – continued
| | | | | | | | |
Shares | | | Description | | Value (†) | |
| |
| Common Stocks – continued | | | |
| | |
| | | | Independent Power & Renewable Electricity Producers – 2.1% | | | |
| | 119,094 | | | NextEra Energy Partners LP | | $ | 7,140,876 | |
| | 148,639 | | | Vistra Corp. | | | 2,803,332 | |
| | | | | | | | |
| | | | | | | 9,944,208 | |
| | | | | | | | |
| | |
| | | | Industrial Conglomerates – 0.5% | | | |
| | 117,877 | | | Raven Industries, Inc. | | | 2,536,713 | |
| | | | | | | | |
| | |
| | | | Insurance – 2.3% | | | |
| | 142,727 | | | Employers Holdings, Inc. | | | 4,317,492 | |
| | 101,483 | | | First American Financial Corp. | | | 5,166,499 | |
| | 106,969 | | | ProAssurance Corp. | | | 1,672,995 | |
| | | | | | | | |
| | | | | | | 11,156,986 | |
| | | | | | | | |
| | |
| | | | Internet & Direct Marketing Retail – 0.3% | | | |
| | 208,714 | | | Qurate Retail, Inc., Class A | | | 1,498,567 | |
| | | | | | | | |
| | |
| | | | IT Services – 5.1% | | | |
| | 101,922 | | | CSG Systems International, Inc. | | | 4,173,706 | |
| | 38,552 | | | Euronet Worldwide, Inc.(a) | | | 3,512,087 | |
| | 100,602 | | | Genpact Ltd. | | | 3,918,448 | |
| | 196,739 | | | Perspecta, Inc. | | | 3,826,574 | |
| | 30,944 | | | Science Applications International Corp. | | | 2,426,628 | |
| | 252,186 | | | Unisys Corp.(a) | | | 2,690,825 | |
| | 29,162 | | | WEX, Inc.(a) | | | 4,052,643 | |
| | | | | | | | |
| | | | | | | 24,600,911 | |
| | | | | | | | |
| | |
| | | | Leisure Products – 1.0% | | | |
| | 80,374 | | | Brunswick Corp. | | | 4,734,832 | |
| | | | | | | | |
| | |
| | | | Machinery – 5.9% | | | |
| | 51,785 | | | Alamo Group, Inc. | | | 5,594,334 | |
| | 43,413 | | | Albany International Corp., Class A | | | 2,149,378 | |
| | 131,281 | | | Altra Industrial Motion Corp. | | | 4,853,459 | |
| | 129,874 | | | Columbus McKinnon Corp. | | | 4,298,829 | |
| | 28,114 | | | John Bean Technologies Corp. | | | 2,583,395 | |
| | 49,294 | | | Kadant, Inc. | | | 5,403,608 | |
| | 103,261 | | | Miller Industries, Inc. | | | 3,156,689 | |
| | | | | | | | |
| | | | | | | 28,039,692 | |
| | | | | | | | |
| | |
| | | | Marine – 0.5% | | | |
| | 66,581 | | | Kirby Corp.(a) | | | 2,408,235 | |
| | | | | | | | |
| | |
| | | | Media – 1.2% | | | |
| | 257,673 | | | Gray Television, Inc.(a) | | | 3,548,157 | |
| | 74,961 | | | John Wiley & Sons, Inc., Class A | | | 2,377,014 | |
| | | | | | | | |
| | | | | | | 5,925,171 | |
| | | | | | | | |
See accompanying notes to financial statements.
Portfolio of Investments – as of September 30, 2020
Loomis Sayles Small Cap Value Fund – continued
| | | | | | | | |
Shares | | | Description | | Value (†) | |
| |
| Common Stocks – continued | | | |
| | |
| | | | Metals & Mining – 0.0% | | | |
| | 10,560 | | | Haynes International, Inc. | | $ | 180,470 | |
| | | | | | | | |
| | |
| | | | Multi-Utilities – 1.7% | | | |
| | 180,920 | | | MDU Resources Group, Inc. | | | 4,070,700 | |
| | 79,677 | | | NorthWestern Corp. | | | 3,875,489 | |
| | | | | | | | |
| | | | | | | 7,946,189 | |
| | | | | | | | |
| | |
| | | | Oil, Gas & Consumable Fuels – 0.3% | | | |
| | 126,150 | | | Delek U.S. Holdings, Inc. | | | 1,404,049 | |
| | | | | | | | |
| | |
| | | | Pharmaceuticals – 1.6% | | | |
| | 55,941 | | | Catalent, Inc.(a) | | | 4,791,906 | |
| | 139,461 | | | Supernus Pharmaceuticals, Inc.(a) | | | 2,906,367 | |
| | | | | | | | |
| | | | | | | 7,698,273 | |
| | | | | | | | |
| | |
| | | | Professional Services – 2.5% | | | |
| | 53,558 | | | ASGN, Inc.(a) | | | 3,404,147 | |
| | 98,566 | | | Clarivate PLC(a) | | | 3,054,560 | |
| | 46,366 | | | Insperity, Inc. | | | 3,036,509 | |
| | 77,708 | | | Korn Ferry | | | 2,253,532 | |
| | | | | | | | |
| | | | | | | 11,748,748 | |
| | | | | | | | |
| | |
| | | | REITs – Apartments – 0.4% | | | |
| | 55,561 | | | American Campus Communities, Inc. | | | 1,940,190 | |
| | | | | | | | |
| | |
| | | | REITs – Shopping Centers – 0.5% | | | |
| | 236,448 | | | Retail Opportunity Investments Corp. | | | 2,462,606 | |
| | | | | | | | |
| | |
| | | | REITs – Single Tenant – 0.9% | | | |
| | 68,298 | | | Agree Realty Corp. | | | 4,346,485 | |
| | | | | | | | |
| | |
| | | | REITs – Storage – 0.9% | | | |
| | 134,064 | | | CubeSmart | | | 4,331,608 | |
| | | | | | | | |
| | |
| | | | REITs – Warehouse/Industrials – 3.7% | | | |
| | 144,498 | | | Americold Realty Trust | | | 5,165,803 | |
| | 42,797 | | | CyrusOne, Inc. | | | 2,997,074 | |
| | 130,767 | | | Rexford Industrial Realty, Inc. | | | 5,983,898 | |
| | 119,743 | | | STAG Industrial, Inc. | | | 3,650,964 | |
| | | | | | | | |
| | | | | | | 17,797,739 | |
| | | | | | | | |
| | |
| | | | Semiconductors & Semiconductor Equipment – 1.9% | | | |
| | 80,680 | | | Advanced Energy Industries, Inc.(a) | | | 5,077,999 | |
| | 209,440 | | | Tower Semiconductor Ltd.(a) | | | 3,815,997 | |
| | | | | | | | |
| | | | | | | 8,893,996 | |
| | | | | | | | |
See accompanying notes to financial statements.
Portfolio of Investments – as of September 30, 2020
Loomis Sayles Small Cap Value Fund – continued
| | | | | | | | |
Shares | | | Description | | Value (†) | |
| |
| Common Stocks – continued | | | |
| | |
| | | | Software – 1.3% | | | |
| | 108,958 | | | ACI Worldwide, Inc.(a) | | $ | 2,847,073 | |
| | 67,041 | | | Verint Systems, Inc.(a) | | | 3,230,035 | |
| | | | | | | | |
| | | | | | | 6,077,108 | |
| | | | | | | | |
| | |
| | | | Specialty Retail – 1.3% | | | |
| | 45,881 | | | Aaron’s, Inc. | | | 2,599,159 | |
| | 160,771 | | | Urban Outfitters, Inc.(a) | | | 3,345,644 | |
| | | | | | | | |
| | | | | | | 5,944,803 | |
| | | | | | | | |
| | |
| | | | Thrifts & Mortgage Finance – 1.2% | | | |
| | 51,041 | | | Federal Agricultural Mortgage Corp., Class C | | | 3,249,270 | |
| | 139,845 | | | Meta Financial Group, Inc. | | | 2,687,821 | |
| | | | | | | | |
| | | | | | | 5,937,091 | |
| | | | | | | | |
| | |
| | | | Trading Companies & Distributors – 1.1% | | | |
| | 187,898 | | | Alta Equipment Group, Inc.(a) | | | 1,471,241 | |
| | 96,714 | | | Herc Holdings, Inc.(a) | | | 3,830,842 | |
| | | | | | | | |
| | | | | | | 5,302,083 | |
| | | | | | | | |
| | |
| | | | Wireless Telecommunication Services – 0.8% | | | |
| | 132,811 | | | United States Cellular Corp.(a) | | | 3,921,909 | |
| | | | | | | | |
| | |
| | | | Total Common Stocks
(Identified Cost $414,919,972) | | | 473,309,049 | |
| | | | | | | | |
| |
| | Other Investments – 0.0% | | | | |
| | |
| | | | Metals & Mining – 0.0% | | | |
| | 507,316 | | | Ferroglobe R&W Trust(a)(b)(c)(d)
(Identified Cost $0) | | | — | |
| | | | | | | | |
| | |
| Principal
Amount |
| | | | | | |
| |
| | Short-Term Investments – 0.9% | | | | |
| | |
| $ | 4,424,559 | | | Tri-Party Repurchase Agreement with Fixed Income Clearing Corporation, dated 9/30/2020 at 0.000% to be repurchased at $4,424,559 on 10/01/2020 collateralized by $4,513,500 U.S. Treasury Note, 0.250% due 9/30/2025 valued at $4,513,148 including accrued interest (Note 2 of Notes to Financial Statements)
(Identified Cost $4,424,559) | | | 4,424,559 | |
| | | | | | | | |
| | |
| | | | Total Investments – 99.8%
(Identified Cost $419,344,531) | | | 477,733,608 | |
| | |
| | | | Other assets less liabilities – 0.2% | | | 915,727 | |
| | | | | | | | |
| | |
| | | | Net Assets – 100.0% | | $ | 478,649,335 | |
| | | | | | | | |
See accompanying notes to financial statements.
Portfolio of Investments – as of September 30, 2020
Loomis Sayles Small Cap Value Fund – continued
| | | | | | | | |
| | (†) | | | See Note 2 of Notes to Financial Statements. | | | | |
| |
| | (a) | | | Non-income producing security. | |
| | |
| | (b) | | | Security subject to restrictions on resale. This security was acquired on November 29, 2016 at a cost of $0. | | | | |
| | |
| | (c) | | | Illiquid security. (Unaudited) | | | | |
| | |
| | (d) | | | Security classified as fair valued pursuant to the Fund’s pricing policies and procedures. | | | | |
| | |
| | REITs | | | Real Estate Investment Trusts | | | | |
Industry Summary at September 30, 2020
| | | | |
Banks | | | 11.7 | % |
Machinery | | | 5.9 | |
IT Services | | | 5.1 | |
Commercial Services & Supplies | | | 4.5 | |
Food Products | | | 4.4 | |
Electronic Equipment, Instruments & Components | | | 4.2 | |
REITs – Warehouse/Industrials | | | 3.7 | |
Chemicals | | | 3.4 | |
Auto Components | | | 2.8 | |
Hotels, Restaurants & Leisure | | | 2.6 | |
Professional Services | | | 2.5 | |
Building Products | | | 2.4 | |
Construction & Engineering | | | 2.4 | |
Insurance | | | 2.3 | |
Electric Utilities | | | 2.1 | |
Independent Power & Renewable Electricity Producers | | | 2.1 | |
Diversified Telecommunication Services | | | 2.0 | |
Other Investments, less than 2% each | | | 34.8 | |
Short-Term Investments | | | 0.9 | |
| | | | |
Total Investments | | | 99.8 | |
Other assets less liabilities | | | 0.2 | |
| | | | |
Net Assets | | | 100.0 | % |
| | | | |
See accompanying notes to financial statements.
Portfolio of Investments – as of September 30, 2020
Loomis Sayles Small/Mid Cap Growth Fund
| | | | | | | | |
Shares | | | Description | | Value (†) | |
| |
| Common Stocks – 96.8% of Net Assets | | | |
| | |
| | | | Aerospace & Defense – 3.5% | | | |
| | 6,921 | | | Aerojet Rocketdyne Holdings, Inc.(a) | | $ | 276,079 | |
| | 8,216 | | | Axon Enterprise, Inc.(a) | | | 745,191 | |
| | 5,649 | | | HEICO Corp. | | | 591,224 | |
| | 5,333 | | | Kaman Corp. | | | 207,827 | |
| | | | | | | | |
| | | | | | | 1,820,321 | |
| | | | | | | | |
| | |
| | | | Auto Components – 1.6% | | | |
| | 4,237 | | | Fox Factory Holding Corp.(a) | | | 314,936 | |
| | 4,893 | | | LCI Industries | | | 520,077 | |
| | | | | | | | |
| | | | | | | 835,013 | |
| | | | | | | | |
| | |
| | | | Biotechnology – 7.1% | | | |
| | 28,722 | | | Amicus Therapeutics, Inc.(a) | | | 405,555 | |
| | 2,322 | | | Argenx SE, ADR(a) | | | 609,571 | |
| | 3,881 | | | Ascendis Pharma A/S, ADR(a) | | | 598,916 | |
| | 3,571 | | | Emergent BioSolutions, Inc.(a) | | | 368,991 | |
| | 9,213 | | | Immunomedics, Inc.(a) | | | 783,381 | |
| | 6,316 | | | Neurocrine Biosciences, Inc.(a) | | | 607,347 | |
| | 6,734 | | | PTC Therapeutics, Inc.(a) | | | 314,815 | |
| | | | | | | | |
| | | | | | | 3,688,576 | |
| | | | | | | | |
| | |
| | | | Building Products – 1.4% | | | |
| | 7,123 | | | Advanced Drainage Systems, Inc. | | | 444,760 | |
| | 2,932 | | | Masonite International Corp.(a) | | | 288,509 | |
| | | | | | | | |
| | | | | | | 733,269 | |
| | | | | | | | |
| | |
| | | | Capital Markets – 4.7% | | | |
| | 21,882 | | | Ares Management Corp., Class A | | | 884,470 | |
| | 5,567 | | | Hamilton Lane, Inc., Class A | | | 359,573 | |
| | 1,282 | | | MarketAxess Holdings, Inc. | | | 617,398 | |
| | 3,700 | | | Morningstar, Inc. | | | 594,257 | |
| | | | | | | | |
| | | | | | | 2,455,698 | |
| | | | | | | | |
| | |
| | | | Commercial Services & Supplies – 2.3% | | | |
| | 12,694 | | | Ritchie Bros. Auctioneers, Inc. | | | 752,119 | |
| | 4,673 | | | Tetra Tech, Inc. | | | 446,272 | |
| | | | | | | | |
| | | | | | | 1,198,391 | |
| | | | | | | | |
| | |
| | | | Communications Equipment – 0.7% | | | |
| | 9,715 | | | Ciena Corp.(a) | | | 385,588 | |
| | | | | | | | |
| | |
| | | | Distributors – 1.6% | | | |
| | 2,542 | | | POOL CORP. | | | 850,401 | |
| | | | | | | | |
| | |
| | | | Diversified Consumer Services – 1.2% | | | |
| | 9,017 | | | Chegg, Inc.(a) | | | 644,175 | |
| | | | | | | | |
See accompanying notes to financial statements.
Portfolio of Investments – as of September 30, 2020
Loomis Sayles Small/Mid Cap Growth Fund – continued
| | | | | | | | |
Shares | | | Description | | Value (†) | |
| |
| Common Stocks – continued | | | |
| | |
| | | | Electrical Equipment – 1.7% | | | |
| | 4,501 | | | Generac Holdings, Inc.(a) | | $ | 871,574 | |
| | | | | | | | |
| | |
| | | | Electronic Equipment, Instruments & Components – 2.1% | | | |
| | 10,486 | | | FLIR Systems, Inc. | | | 375,923 | |
| | 14,734 | | | Trimble, Inc.(a) | | | 717,546 | |
| | | | | | | | |
| | | | | | | 1,093,469 | |
| | | | | | | | |
| |
| | | | Food & Staples Retailing – 1.2% | |
| | 3,627 | | | Casey’s General Stores, Inc. | | | 644,337 | |
| | | | | | | | |
| | |
| | | | Food Products – 4.4% | | | |
| | 10,966 | | | Freshpet, Inc.(a) | | | 1,224,354 | |
| | 27,000 | | | Nomad Foods Ltd.(a) | | | 687,960 | |
| | 17,503 | | | Simply Good Foods Co. (The)(a) | | | 385,941 | |
| | | | | | | | |
| | | | | | | 2,298,255 | |
| | | | | | | | |
| |
| | | | Health Care Equipment & Supplies – 5.3% | |
| | 10,966 | | | Globus Medical, Inc., Class A(a) | | | 543,036 | |
| | 4,559 | | | Insulet Corp.(a) | | | 1,078,614 | |
| | 2,683 | | | Penumbra, Inc.(a) | | | 521,521 | |
| | 2,332 | | | West Pharmaceutical Services, Inc. | | | 641,067 | |
| | | | | | | | |
| | | | | | | 2,784,238 | |
| | | | | | | | |
| | |
| | | | Health Care Providers & Services – 3.8% | | | |
| | 1,525 | | | Chemed Corp. | | | 732,534 | |
| | 5,322 | | | Encompass Health Corp. | | | 345,823 | |
| | 4,198 | | | LHC Group, Inc.(a) | | | 892,327 | |
| | | | | | | | |
| | | | | | | 1,970,684 | |
| | | | | | | | |
| | |
| | | | Hotels, Restaurants & Leisure – 2.4% | | | |
| | 9,819 | | | Texas Roadhouse, Inc. | | | 596,897 | |
| | 29,859 | | | Wendy’s Co. (The) | | | 665,706 | |
| | | | | | | | |
| | | | | | | 1,262,603 | |
| | | | | | | | |
| | |
| | | | Household Durables – 1.2% | | | |
| | 3,267 | | | Helen of Troy Ltd.(a) | | | 632,230 | |
| | | | | | | | |
| | |
| | | | Insurance – 3.0% | | | |
| | 6,904 | | | Kemper Corp. | | | 461,395 | |
| | 4,339 | | | Kinsale Capital Group, Inc. | | | 825,191 | |
| | 3,514 | | | RLI Corp. | | | 294,227 | |
| | | | | | | | |
| | | | | | | 1,580,813 | |
| | | | | | | | |
| | |
| | | | IT Services – 7.6% | | | |
| | 11,022 | | | Black Knight, Inc.(a) | | | 959,465 | |
| | 9,791 | | | Booz Allen Hamilton Holding Corp. | | | 812,457 | |
| | 5,203 | | | Broadridge Financial Solutions, Inc. | | | 686,796 | |
See accompanying notes to financial statements.
Portfolio of Investments – as of September 30, 2020
Loomis Sayles Small/Mid Cap Growth Fund – continued
| | | | | | | | |
Shares | | | Description | | Value (†) | |
| |
| Common Stocks – continued | | | |
| | |
| | | | IT Services – continued | | | |
| | 3,470 | | | EPAM Systems, Inc.(a) | | $ | 1,121,782 | |
| | 16,633 | | | KBR, Inc. | | | 371,914 | |
| | | | | | | | |
| | | | | | | 3,952,414 | |
| | | | | | | | |
| | |
| | | | Leisure Products – 1.2% | | | |
| | 10,263 | | | Brunswick Corp. | | | 604,593 | |
| | | | | | | | |
| | |
| | | | Life Sciences Tools & Services – 5.2% | | | |
| | 2,293 | | | Bio-Techne Corp. | | | 568,045 | |
| | 2,684 | | | Charles River Laboratories International, Inc.(a) | | | 607,792 | |
| | 3,108 | | | ICON PLC(a) | | | 593,908 | |
| | 5,672 | | | PRA Health Sciences, Inc.(a) | | | 575,367 | |
| | 6,658 | | | Syneos Health, Inc.(a) | | | 353,939 | |
| | | | | | | | |
| | | | | | | 2,699,051 | |
| | | | | | | | |
| | |
| | | | Machinery – 2.4% | | | |
| | 6,570 | | | ESCO Technologies, Inc. | | | 529,279 | |
| | 19,712 | | | Ingersoll Rand, Inc.(a) | | | 701,747 | |
| | | | | | | | |
| | | | | | | 1,231,026 | |
| | | | | | | | |
| | |
| | | | Pharmaceuticals – 3.4% | | | |
| | 11,006 | | | Catalent, Inc.(a) | | | 942,774 | |
| | 10,549 | | | Horizon Therapeutics PLC(a) | | | 819,446 | |
| | | | | | | | |
| | | | | | | 1,762,220 | |
| | | | | | | | |
| | |
| | | | Professional Services – 2.0% | | | |
| | 3,232 | | | FTI Consulting, Inc.(a) | | | 342,495 | |
| | 8,237 | | | TransUnion | | | 692,979 | |
| | | | | | | | |
| | | | | | | 1,035,474 | |
| | | | | | | | |
| | |
| | | | Semiconductors & Semiconductor Equipment – 6.7% | | | |
| | 9,435 | | | Advanced Energy Industries, Inc.(a) | | | 593,839 | |
| | 5,497 | | | MKS Instruments, Inc. | | | 600,437 | |
| | 3,101 | | | Monolithic Power Systems, Inc. | | | 867,071 | |
| | 5,311 | | | Nova Measuring Instruments Ltd.(a) | | | 276,915 | |
| | 10,506 | | | Semtech Corp.(a) | | | 556,398 | |
| | 5,926 | | | Silicon Laboratories, Inc.(a) | | | 579,859 | |
| | | | | | | | |
| | | | | | | 3,474,519 | |
| | | | | | | | |
| | |
| | | | Software – 14.0% | | | |
| | 4,546 | | | Avalara, Inc.(a) | | | 578,888 | |
| | 7,130 | | | Blackline, Inc.(a) | | | 639,062 | |
| | 6,068 | | | Five9, Inc.(a) | | | 786,898 | |
| | 7,316 | | | Guidewire Software, Inc.(a) | | | 762,839 | |
| | 5,067 | | | Paylocity Holding Corp.(a) | | | 817,915 | |
| | 5,694 | | | Pegasystems, Inc. | | | 689,202 | |
See accompanying notes to financial statements.
Portfolio of Investments – as of September 30, 2020
Loomis Sayles Small/Mid Cap Growth Fund – continued
| | | | | | | | |
Shares | | | Description | | Value (†) | |
| |
| Common Stocks – continued | | | |
| | |
| | | | Software – continued | | | |
| | 8,827 | | | Q2 Holdings, Inc.(a) | | $ | 805,552 | |
| | 9,249 | | | Smartsheet, Inc., Class A(a) | | | 457,086 | |
| | 23,093 | | | SVMK, Inc.(a) | | | 510,586 | |
| | 17,254 | | | Tenable Holdings, Inc.(a) | | | 651,338 | |
| | 1,751 | | | Tyler Technologies, Inc.(a) | | | 610,329 | |
| | | | | | | | |
| | | | | | | 7,309,695 | |
| | | | | | | | |
| | |
| | | | Specialty Retail – 1.3% | | | |
| | 9,361 | | | Floor & Decor Holdings, Inc., Class A(a) | | | 700,203 | |
| | | | | | | | |
| | |
| | | | Textiles, Apparel & Luxury Goods – 1.7% | | | |
| | 5,904 | | | Columbia Sportswear Co. | | | 513,530 | |
| | 12,358 | | | Skechers U.S.A., Inc., Class A(a) | | | 373,459 | |
| | | | | | | | |
| | | | | | | 886,989 | |
| | | | | | | | |
| | |
| | | | Trading Companies & Distributors – 2.1% | | | |
| | 8,881 | | | SiteOne Landscape Supply, Inc.(a) | | | 1,083,038 | |
| | | | | | | | |
| | |
| | | | Total Common Stocks
(Identified Cost $40,505,890) | | | 50,488,857 | |
| | | | | | | | |
| | |
| Principal
Amount |
| | | | | | |
| |
| | Short-Term Investments – 3.1% | | | | |
| | |
| $ | 1,648,808 | | | Tri-Party Repurchase Agreement with Fixed Income Clearing Corporation, dated 9/30/2020 at 0.000% to be repurchased at $1,648,808 on 10/01/2020 collateralized by $1,682,000 U.S. Treasury Note, 0.250% due 9/30/2025 valued at $1,681,869 including accrued interest (Note 2 of Notes to Financial Statements) (Identified Cost $1,648,808) | | | 1,648,808 | |
| | | | | | | | |
| | |
| | | | Total Investments – 99.9%
(Identified Cost $42,154,698) | | | 52,137,665 | |
| | |
| | | | Other assets less liabilities – 0.1% | | | 33,810 | |
| | | | | | | | |
| | |
| | | | Net Assets – 100.0% | | $ | 52,171,475 | |
| | | | | | | | |
| |
| | (†) | | | See Note 2 of Notes to Financial Statements. | |
| |
| | (a) | | | Non-income producing security. | |
| |
| | ADR | | | An American Depositary Receipt is a certificate issued by a custodian bank representing the right to receive securities of the foreign issuer described. The values of ADRs may be significantly influenced by trading on exchanges not located in the United States. | |
See accompanying notes to financial statements.
Portfolio of Investments – as of September 30, 2020
Loomis Sayles Small/Mid Cap Growth Fund – continued
Industry Summary at September 30, 2020
| | | | |
Software | | | 14.0 | % |
IT Services | | | 7.6 | |
Biotechnology | | | 7.1 | |
Semiconductors & Semiconductor Equipment | | | 6.7 | |
Health Care Equipment & Supplies | | | 5.3 | |
Life Sciences Tools & Services | | | 5.2 | |
Capital Markets | | | 4.7 | |
Food Products | | | 4.4 | |
Health Care Providers & Services | | | 3.8 | |
Aerospace & Defense | | | 3.5 | |
Pharmaceuticals | | | 3.4 | |
Insurance | | | 3.0 | |
Hotels, Restaurants & Leisure | | | 2.4 | |
Machinery | | | 2.4 | |
Commercial Services & Supplies | | | 2.3 | |
Electronic Equipment, Instruments & Components | | | 2.1 | |
Trading Companies & Distributors | | | 2.1 | |
Professional Services | | | 2.0 | |
Other Investments, less than 2% each | | | 14.8 | |
Short-Term Investments | | | 3.1 | |
| | | | |
Total Investments | | | 99.9 | |
Other assets less liabilities | | | 0.1 | |
| | | | |
Net Assets | | | 100.0 | % |
| | | | |
See accompanying notes to financial statements.
Statements of Assets and Liabilities
September 30, 2020
| | | | | | | | | | | | |
| | | Small Cap
Growth Fund | | | Small Cap
Value Fund | | | Small/Mid Cap
Growth Fund | |
ASSETS | | | | | | | | | | | | |
Investments at cost | | $ | 1,606,999,363 | | | $ | 419,344,531 | | | $ | 42,154,698 | |
Net unrealized appreciation | | | 584,373,356 | | | | 58,389,077 | | | | 9,982,967 | |
| | | | | | | | | | | | |
Investments at value | | | 2,191,372,719 | | | | 477,733,608 | | | | 52,137,665 | |
Cash | | | — | | | | 21,932 | | | | — | |
Receivable for Fund shares sold | | | 14,564,189 | | | | 232,960 | | | | 738 | |
Receivable for securities sold | | | 1,841,143 | | | | 818,207 | | | | 186,910 | |
Dividends and interest receivable | | | 132,194 | | | | 1,045,626 | | | | 11,198 | |
Prepaid expenses (Note 7) | | | 209 | | | | 70 | | | | 5 | |
| | | | | | | | | | | | |
TOTAL ASSETS | | | 2,207,910,454 | | | | 479,852,403 | | | | 52,336,516 | |
| | | | | | | | | | | | |
LIABILITIES | | | | | | | | | | | | |
Payable for securities purchased | | | 2,926,366 | | | | 193,897 | | | | 51,118 | |
Payable for Fund shares redeemed | | | 1,299,174 | | | | 342,353 | | | | 5,867 | |
Management fees payable (Note 5) | | | 1,333,211 | | | | 279,231 | | | | 23,565 | |
Deferred Trustees’ fees (Note 5) | | | 249,236 | | | | 279,244 | | | | 31,787 | |
Administrative fees payable (Note 5) | | | 77,707 | | | | 17,595 | | | | 1,843 | |
Payable to distributor (Note 5d) | | | 16,037 | | | | 4,420 | | | | 29 | |
Other accounts payable and accrued expenses | | | 112,199 | | | | 86,328 | | | | 50,832 | |
| | | | | | | | | | | | |
TOTAL LIABILITIES | | | 6,013,930 | | | | 1,203,068 | | | | 165,041 | |
| | | | | | | | | | | | |
NET ASSETS | | $ | 2,201,896,524 | | | $ | 478,649,335 | | | $ | 52,171,475 | |
| | | | | | | | | | | | |
NET ASSETS CONSIST OF: | | | | | | | | | | | | |
Paid-in capital | | $ | 1,587,610,383 | | | $ | 384,114,548 | | | $ | 42,835,718 | |
Accumulated earnings | | | 614,286,141 | | | | 94,534,787 | | | | 9,335,757 | |
| | | | | | | | | | | | |
NET ASSETS | | $ | 2,201,896,524 | | | $ | 478,649,335 | | | $ | 52,171,475 | |
| | | | | | | | | | | | |
| | | |
COMPUTATION OF NET ASSET VALUE AND OFFERING PRICE: | | | | | | | | | | | | |
Institutional Class: | | | | | | | | | | | | |
Net assets | | $ | 1,037,625,163 | | | $ | 295,006,489 | | | $ | 52,170,254 | |
| | | | | | | | | | | | |
Shares of beneficial interest | | | 36,400,149 | | | | 13,206,714 | | | | 4,419,204 | |
| | | | | | | | | | | | |
Net asset value, offering and redemption price per share | | $ | 28.51 | | | $ | 22.34 | | | $ | 11.81 | |
| | | | | | | | | | | | |
Retail Class: | | | | | | | | | | | | |
Net assets | | $ | 98,204,643 | | | $ | 83,163,321 | | | $ | — | |
| | | | | | | | | | | | |
Shares of beneficial interest | | | 3,825,964 | | | | 3,801,913 | | | | — | |
| | | | | | | | | | | | |
Net asset value, offering and redemption price per share | | $ | 25.67 | | | $ | 21.87 | | | $ | — | |
| | | | | | | | | | | | |
Admin Class shares: | | | | | | | | | | | | |
Net assets | | $ | — | | | $ | 7,661,829 | | | $ | — | |
| | | | | | | | | | | | |
Shares of beneficial interest | | | — | | | | 371,066 | | | | — | |
| | | | | | | | | | | | |
Net asset value, offering and redemption price per share | | $ | — | | | $ | 20.65 | | | $ | — | |
| | | | | | | | | | | | |
Class N shares: | | | | | | | | | | | | |
Net assets | | $ | 1,066,066,718 | | | $ | 92,817,696 | | | $ | 1,221 | |
| | | | | | | | | | | | |
Shares of beneficial interest | | | 37,003,469 | | | | 4,152,550 | | | | 103 | |
| | | | | | | | | | | | |
Net asset value, offering and redemption price per share | | $ | 28.81 | | | $ | 22.35 | | | $ | 11.81 | * |
| | | | | | | | | | | | |
| * | Net asset value calculations have been determined utilizing fractional share and penny amounts. |
See accompanying notes to financial statements.
Statements of Operations
For the Year Ended September 30, 2020
| | | | | | | | | | | | |
| | | Small Cap
Growth Fund | | | Small Cap
Value Fund | | | Small/Mid Cap
Growth Fund | |
INVESTMENT INCOME | | | | | | | | | | | | |
Dividends | | $ | 4,880,817 | | | $ | 7,994,841 | | | $ | 204,514 | |
Interest | | | 317,142 | | | | 39,748 | | | | 6,143 | |
Less net foreign taxes withheld | | | — | | | | (34,033 | ) | | | (1,752 | ) |
| | | | | | | | | | | | |
| | | 5,197,959 | | | | 8,000,556 | | | | 208,905 | |
| | | | | | | | | | | | |
Expenses | | | | | | | | | | | | |
Management fees (Note 5) | | | 13,879,951 | | | | 4,342,299 | | | | 313,390 | |
Service and distribution fees (Note 5) | | | 232,060 | | | | 313,021 | | | | — | |
Administrative fees (Note 5) | | | 817,150 | | | | 255,444 | | | | 18,443 | |
Trustees’ fees and expenses (Note 5) | | | 114,088 | | | | 70,677 | | | | 21,599 | |
Transfer agent fees and expenses (Notes 5 and 6) | | | 1,254,238 | | | | 481,264 | | | | 5,581 | |
Audit and tax services fees | | | 40,311 | | | | 40,800 | | | | 40,281 | |
Custodian fees and expenses | | | 61,088 | | | | 18,999 | | | | 8,738 | |
Legal fees (Note 7) | | | 44,190 | | | | 13,469 | | | | 1,317 | |
Registration fees | | | 106,742 | | | | 75,268 | | | | 65,121 | |
Shareholder reporting expenses | | | 84,397 | | | | 56,629 | | | | 8,096 | |
Miscellaneous expenses (Note 7) | | | 67,012 | | | | 43,031 | | | | 25,270 | |
| | | | | | | | | | | | |
Total expenses | | | 16,701,227 | | | | 5,710,901 | | | | 507,836 | |
Less waiver and/or expense reimbursement (Note 5) | | | — | | | | (242,252 | ) | | | (156,297 | ) |
| | | | | | | | | | | | |
Net expenses | | | 16,701,227 | | | | 5,468,649 | | | | 351,539 | |
| | | | | | | | | | | | |
Net investment income (loss) | | | (11,503,268 | ) | | | 2,531,907 | | | | (142,634 | ) |
| | | | | | | | | | | | |
| | | |
NET REALIZED AND UNREALIZED GAIN (LOSS) ON INVESTMENTS | | | | | | | | | | | | |
Net realized gain on: | | | | | | | | | | | | |
Investments | | | 44,416,635 | | | | 39,651,898 | | | | 478,820 | |
Net change in unrealized appreciation (depreciation) on: | | | | | | | | | | | | |
Investments | | | 311,230,363 | | | | (146,094,001 | ) | | | 7,645,216 | |
| | | | | | | | | | | | |
Net realized and unrealized gain (loss) on investments | | | 355,646,998 | | | | (106,442,103 | ) | | | 8,124,036 | |
| | | | | | | | | | | | |
| | | |
NET INCREASE (DECREASE) IN NET ASSETS RESULTING FROM OPERATIONS | | $ | 344,143,730 | | | $ | (103,910,196 | ) | | $ | 7,981,402 | |
| | | | | | | | | | | | |
See accompanying notes to financial statements.
Statements of Changes in Net Assets
| | | | | | | | | | | | | | | | |
| | | Small Cap Growth Fund | | | Small Cap Value Fund | |
| | | Year Ended
September 30,
2020 | | | Year Ended
September 30,
2019 | | | Year Ended
September 30,
2020 | | | Year Ended
September 30,
2019 | |
FROM OPERATIONS: | |
Net investment income (loss) | | $ | (11,503,268 | ) | | $ | (8,790,650 | ) | | $ | 2,531,907 | | | $ | 2,471,460 | |
Net realized gain on investments | | | 44,416,635 | | | | 155,991,266 | | | | 39,651,898 | | | | 55,538,968 | |
Net change in unrealized appreciation (depreciation) on investments | | | 311,230,363 | | | | (268,064,056 | ) | | | (146,094,001 | ) | | | (109,251,529 | ) |
| | | | | | | | | | | | | | | | |
Net increase (decrease) in net assets resulting from operations | | | 344,143,730 | | | | (120,863,440 | ) | | | (103,910,196 | ) | | | (51,241,101 | ) |
| | | | | | | | | | | | | | | | |
FROM DISTRIBUTIONS TO SHAREHOLDERS: | | | | | | | | | | | | | | | | |
Institutional Class | | | (80,218,616 | ) | | | (74,228,048 | ) | | | (34,882,909 | ) | | | (67,841,584 | ) |
Retail Class | | | (9,162,211 | ) | | | (11,691,827 | ) | | | (10,573,237 | ) | | | (23,416,722 | ) |
Admin Class | | | — | | | | — | | | | (1,107,925 | ) | | | (3,000,140 | ) |
Class N | | | (61,460,368 | ) | | | (45,465,070 | ) | | | (11,045,289 | ) | | | (18,276,952 | ) |
| | | | | | | | | | | | | | | | |
Total distributions | | | (150,841,195 | ) | | | (131,384,945 | ) | | | (57,609,360 | ) | | | (112,535,398 | ) |
| | | | | | | | | | | | | | | | |
NET INCREASE (DECREASE) IN NET ASSETS FROM CAPITAL SHARE TRANSACTIONS (NOTE 10) | | | 374,429,835 | | | | 305,348,898 | | | | (82,803,607 | ) | | | (86,935,502 | ) |
| | | | | | | | | | | | | | | | |
Net increase (decrease) in net assets | | | 567,732,370 | | | | 53,100,513 | | | | (244,323,163 | ) | | | (250,712,001 | ) |
NET ASSETS | | | | | | | | | | | | | | | | |
Beginning of the year | | | 1,634,164,154 | | | | 1,581,063,641 | | | | 722,972,498 | | | | 973,684,499 | |
| | | | | | | | | | | | | | | | |
End of the year | | $ | 2,201,896,524 | | | $ | 1,634,164,154 | | | $ | 478,649,335 | | | $ | 722,972,498 | |
| | | | | | | | | | | | | | | | |
See accompanying notes to financial statements.
Statements of Changes in Net Assets – continued
| | | | | | | | |
| | | Small/Mid Cap Growth Fund | |
| | | Year Ended
September 30,
2020 | | | Year Ended
September 30,
2019 | |
FROM OPERATIONS: | |
Net investment loss | | $ | (142,634 | ) | | $ | (82,902 | ) |
Net realized gain on investments | | | 478,820 | | | | 707,633 | |
Net change in unrealized appreciation (depreciation) on investments | | | 7,645,216 | | | | (112,924 | ) |
| | | | | | | | |
Net increase in net assets resulting from operations | | | 7,981,402 | | | | 511,807 | |
| | | | | | | | |
FROM DISTRIBUTIONS TO SHAREHOLDERS: | | | | | | | | |
Institutional Class | | | (817,090 | ) | | | (4,717,064 | ) |
Class N | | | (24 | ) | | | — | |
| | | | | | | | |
Total distributions | | | (817,114 | ) | | | (4,717,064 | ) |
| | | | | | | | |
NET INCREASE IN NET ASSETS FROM CAPITAL SHARE TRANSACTIONS (NOTE 10) | | | 10,695,219 | | | | 21,017,023 | |
| | | | | | | | |
Net increase in net assets | | | 17,859,507 | | | | 16,811,766 | |
NET ASSETS | | | | | | | | |
Beginning of the year | | | 34,311,968 | | | | 17,500,202 | |
| | | | | | | | |
End of the year | | $ | 52,171,475 | | | $ | 34,311,968 | |
| | | | | | | | |
See accompanying notes to financial statements.
Financial Highlights
For a share outstanding throughout each period.
| | | | | | | | | | | | | | | | | | | | | | | | |
| | | Small Cap Growth Fund—Institutional Class | | | | |
| | | Year Ended
September 30,
2020
| | | Year Ended
September 30,
2019
| | | Year Ended
September 30,
2018
| | | Year Ended
September 30,
2017
| | | Year Ended
September 30,
2016
| | | | |
Net asset value, beginning of the period | | $ | 26.30 | | | $ | 31.55 | | | $ | 27.37 | | | $ | 22.03 | | | $ | 22.22 | | | | | |
| | | | |
INCOME (LOSS) FROM INVESTMENT OPERATIONS: | | | | | | | | | | | | | | | | | | | | | | | | |
Net investment loss(a) | | | (0.17 | ) | | | (0.16 | ) | | | (0.16 | ) | | | (0.12 | ) | | | (0.09 | ) | | | | |
Net realized and unrealized gain (loss) | | | 4.73 | | | | (2.51 | ) | | | 7.54 | | | | 5.46 | | | | 1.59 | | | | | |
| | | | |
Total from Investment Operations | | | 4.56 | | | | (2.67 | ) | | | 7.38 | | | | 5.34 | | | | 1.50 | | | | | |
| | | | |
LESS DISTRIBUTIONS FROM: | | | | | | | | | | | | | | | | | | | | | | | | |
Net realized capital gains | | | (2.35 | ) | | | (2.58 | ) | | | (3.20 | ) | | | — | | | | (1.69 | ) | | | | |
| | | | |
Net asset value, end of the period | | $ | 28.51 | | | $ | 26.30 | | | $ | 31.55 | | | $ | 27.37 | | | $ | 22.03 | | | | | |
| | | | |
Total return | | | 17.98 | % | | | (6.88 | )% | | | 29.77 | % | | | 24.24 | % | | | 6.92 | % | | | | |
RATIOS TO AVERAGE NET ASSETS: | | | | | | | | | | | | | | | | | | | | | | | | |
Net assets, end of the period (000’s) | | $ | 1,037,625 | | | $ | 908,616 | | | $ | 926,914 | | | $ | 824,103 | | | $ | 812,383 | | | | | |
Net expenses | | | 0.94 | % | | | 0.95 | % | | | 0.94 | % | | | 0.95 | % | | | 0.95 | % | | | | |
Gross expenses | | | 0.94 | % | | | 0.95 | % | | | 0.94 | % | | | 0.95 | % | | | 0.95 | % | | | | |
Net investment loss | | | (0.66 | )% | | | (0.62 | )% | | | (0.58 | )% | | | (0.49 | )% | | | (0.41 | )% | | | | |
Portfolio turnover rate | | | 52 | % | | | 67 | % | | | 41 | % | | | 45 | % | | | 56 | % | | | | |
| (a) | Per share net investment loss has been calculated using the average shares outstanding during the period. |
See accompanying notes to financial statements.
Financial Highlights – continued
For a share outstanding throughout each period.
| | | | | | | | | | | | | | | | | | | | | | | | |
| | | Small Cap Growth Fund—Retail Class | | | | |
| | | Year Ended
September 30,
2020
| | | Year Ended
September 30,
2019
| | | Year Ended
September 30,
2018
| | | Year Ended
September 30,
2017
| | | Year Ended
September 30,
2016
| | | | |
Net asset value, beginning of the period | | $ | 23.95 | | | $ | 29.09 | | | $ | 25.53 | | | $ | 20.61 | | | $ | 20.93 | | | | | |
| | | | |
INCOME (LOSS) FROM INVESTMENT OPERATIONS: | | | | | | | | | | | | | | | | | | | | | | | | |
Net investment loss(a) | | | (0.21 | ) | | | (0.21 | ) | | | (0.22 | ) | | | (0.16 | ) | | | (0.13 | ) | | | | |
Net realized and unrealized gain (loss) | | | 4.28 | | | | (2.35 | ) | | | 6.98 | | | | 5.08 | | | | 1.50 | | | | | |
| | | | |
Total from Investment Operations | | | 4.07 | | | | (2.56 | ) | | | 6.76 | | | | 4.92 | | | | 1.37 | | | | | |
| | | | |
LESS DISTRIBUTIONS FROM: | | | | | | | | | | | | | | | | | | | | | | | | |
Net realized capital gains | | | (2.35 | ) | | | (2.58 | ) | | | (3.20 | ) | | | — | | | | (1.69 | ) | | | | |
| | | | |
Net asset value, end of the period | | $ | 25.67 | | | $ | 23.95 | | | $ | 29.09 | | | $ | 25.53 | | | $ | 20.61 | | | | | |
| | | | |
Total return | | | 17.67 | % | | | (7.11 | )%(b) | | | 29.45 | % | | | 23.93 | % | | | 6.61 | % | | | | |
RATIOS TO AVERAGE NET ASSETS: | | | | | | | | | | | | | | | | | | | | | | | | |
Net assets, end of the period (000’s) | | $ | 98,205 | | | $ | 95,635 | | | $ | 136,415 | | | $ | 107,387 | | | $ | 118,670 | | | | | |
Net expenses | | | 1.19 | % | | | 1.19 | %(c) | | | 1.19 | % | | | 1.20 | % | | | 1.20 | % | | | | |
Gross expenses | | | 1.19 | % | | | 1.20 | % | | | 1.19 | % | | | 1.20 | % | | | 1.20 | % | | | | |
Net investment loss | | | (0.91 | )% | | | (0.86 | )% | | | (0.82 | )% | | | (0.73 | )% | | | (0.66 | )% | | | | |
Portfolio turnover rate | | | 52 | % | | | 67 | % | | | 41 | % | | | 45 | % | | | 56 | % | | | | |
| (a) | Per share net investment loss has been calculated using the average shares outstanding during the period. |
| (b) | Had certain expenses not been waived/reimbursed during the period, total returns would have been lower. |
| (c) | The administrator agreed to waive its fees and/or reimburse a portion of the Fund’s expenses during the period. Without this waiver/reimbursement, expenses would have been higher. |
See accompanying notes to financial statements.
Financial Highlights – continued
For a share outstanding throughout each period.
| | | | | | | | | | | | | | | | | | | | | | | | |
| | | Small Cap Growth Fund—Class N | | | | |
| | | Year Ended
September 30,
2020
| | | Year Ended
September 30,
2019
| | | Year Ended
September 30,
2018
| | | Year Ended
September 30,
2017
| | | Year Ended
September 30,
2016
| | | | |
Net asset value, beginning of the period | | $ | 26.53 | | | $ | 31.76 | | | $ | 27.50 | | | $ | 22.11 | | | $ | 22.27 | | | | | |
| | | | |
INCOME (LOSS) FROM INVESTMENT OPERATIONS: | | | | | | | | | | | | | | | | | | | | | | | | |
Net investment loss(a) | | | (0.14 | ) | | | (0.13 | ) | | | (0.12 | ) | | | (0.09 | ) | | | (0.06 | ) | | | | |
Net realized and unrealized gain (loss) | | | 4.77 | | | | (2.52 | ) | | | 7.58 | | | | 5.48 | | | | 1.59 | | | | | |
| | | | |
Total from Investment Operations | | | 4.63 | | | | (2.65 | ) | | | 7.46 | | | | 5.39 | | | | 1.53 | | | | | |
| | | | |
LESS DISTRIBUTIONS FROM: | | | | | | | | | | | | | | | | | | | | | | | | |
Net realized capital gains | | | (2.35 | ) | | | (2.58 | ) | | | (3.20 | ) | | | — | | | | (1.69 | ) | | | | |
| | | | |
Net asset value, end of the period | | $ | 28.81 | | | $ | 26.53 | | | $ | 31.76 | | | $ | 27.50 | | | $ | 22.11 | | | | | |
| | | | |
Total return | | | 18.09 | % | | | (6.76 | )% | | | 29.93 | % | | | 24.38 | % | | | 7.05 | % | | | | |
RATIOS TO AVERAGE NET ASSETS: | | | | | | | | | | | | | | | | | | | | | | | | |
Net assets, end of the period (000’s) | | $ | 1,066,067 | | | $ | 629,914 | | | $ | 517,734 | | | $ | 279,508 | | | $ | 196,733 | | | | | |
Net expenses | | | 0.82 | % | | | 0.82 | % | | | 0.82 | % | | | 0.82 | % | | | 0.83 | % | | | | |
Gross expenses | | | 0.82 | % | | | 0.82 | % | | | 0.82 | % | | | 0.82 | % | | | 0.83 | % | | | | |
Net investment loss | | | (0.54 | )% | | | (0.49 | )% | | | (0.43 | )% | | | (0.39 | )% | | | (0.29 | )% | | | | |
Portfolio turnover rate | | | 52 | % | | | 67 | % | | | 41 | % | | | 45 | % | | | 56 | % | | | | |
| (a) | Per share net investment loss has been calculated using the average shares outstanding during the period. |
See accompanying notes to financial statements.
Financial Highlights – continued
For a share outstanding throughout each period.
| | | | | | | | | | | | | | | | | | | | | | | | |
| | | Small Cap Value Fund—Institutional Class | | | | |
| | | Year Ended
September 30,
2020
| | | Year Ended
September 30,
2019
| | | Year Ended
September 30,
2018
| | | Year Ended
September 30,
2017
| | | Year Ended
September 30,
2016
| | | | |
Net asset value, beginning of the period | | $ | 28.66 | | | $ | 35.27 | | | $ | 37.37 | | | $ | 33.78 | | | $ | 32.19 | | | | | |
| | | | |
INCOME (LOSS) FROM INVESTMENT OPERATIONS: | | | | | | | | | | | | | | | | | | | | | | | | |
Net investment income(a) | | | 0.12 | | | | 0.10 | | | | 0.09 | | | | 0.13 | | | | 0.17 | | | | | |
Net realized and unrealized gain (loss) | | | (4.03 | ) | | | (2.49 | ) | | | 2.11 | | | | 6.36 | | | | 4.82 | | | | | |
| | | | |
Total from Investment Operations | | | (3.91 | ) | | | (2.39 | ) | | | 2.20 | | | | 6.49 | | | | 4.99 | | | | | |
| | | | |
LESS DISTRIBUTIONS FROM: | | | | | | | | | | | | | | | | | | | | | | | | |
Net investment income | | | (0.12 | ) | | | (0.08 | ) | | | (0.05 | ) | | | (0.14 | ) | | | (0.22 | ) | | | | |
Net realized capital gains | | | (2.29 | ) | | | (4.14 | ) | | | (4.25 | ) | | | (2.76 | ) | | | (3.18 | ) | | | | |
| | | | |
Total Distributions | | | (2.41 | ) | | | (4.22 | ) | | | (4.30 | ) | | | (2.90 | ) | | | (3.40 | ) | | | | |
| | | | |
Net asset value, end of the period | | $ | 22.34 | | | $ | 28.66 | | | $ | 35.27 | | | $ | 37.37 | | | $ | 33.78 | | | | | |
| | | | |
Total return(b) | | | (15.31 | )% | | | (4.11 | )% | | | 6.21 | % | | | 19.68 | % | | | 16.75 | % | | | | |
RATIOS TO AVERAGE NET ASSETS: | | | | | | | | | | | | | | | | | | | | | | | | |
Net assets, end of the period (000’s) | | $ | 295,006 | | | $ | 433,360 | | | $ | 587,198 | | | $ | 665,229 | | | $ | 654,501 | | | | | |
Net expenses(c) | | | 0.90 | % | | | 0.90 | % | | | 0.90 | % | | | 0.90 | % | | | 0.90 | % | | | | |
Gross expenses | | | 0.95 | % | | | 0.93 | % | | | 0.92 | % | | | 0.93 | % | | | 0.93 | % | | | | |
Net investment income | | | 0.48 | % | | | 0.36 | % | | | 0.26 | % | | | 0.37 | % | | | 0.52 | % | | | | |
Portfolio turnover rate | | | 23 | % | | | 24 | % | | | 19 | % | | | 25 | % | | | 22 | % | | | | |
| (a) | Per share net investment income has been calculated using the average shares outstanding during the period. |
| (b) | Had certain expenses not been waived/reimbursed during the period, total returns would have been lower. |
| (c) | The investment adviser agreed to waive its fees and/or reimburse a portion of the Fund’s expenses during the period. Without this waiver/reimbursement, expenses would have been higher. |
See accompanying notes to financial statements.
Financial Highlights – continued
For a share outstanding throughout each period.
| | | | | | | | | | | | | | | | | | | | | | | | |
| | | Small Cap Value Fund—Retail Class | | | | |
| | | Year Ended
September 30,
2020
| | | Year Ended
September 30,
2019
| | | Year Ended
September 30,
2018
| | | Year Ended
September 30,
2017
| | | Year Ended
September 30,
2016
| | | | |
Net asset value, beginning of the period | | $ | 28.11 | | | $ | 34.66 | | | $ | 36.83 | | | $ | 33.33 | | | $ | 31.78 | | | | | |
| | | | |
INCOME (LOSS) FROM INVESTMENT OPERATIONS: | | | | | | | | | | | | | | | | | | | | | | | | |
Net investment income(a) | | | 0.05 | | | | 0.03 | | | | 0.00 | (b) | | | 0.04 | | | | 0.08 | | | | | |
Net realized and unrealized gain (loss) | | | (3.96 | ) | | | (2.44 | ) | | | 2.08 | | | | 6.27 | | | | 4.77 | | | | | |
| | | | |
Total from Investment Operations | | | (3.91 | ) | | | (2.41 | ) | | | 2.08 | | | | 6.31 | | | | 4.85 | | | | | |
| | | | |
LESS DISTRIBUTIONS FROM: | | | | | | | | | | | | | | | | | | | | | | | | |
Net investment income | | | (0.04 | ) | | | — | | | | — | | | | (0.05 | ) | | | (0.12 | ) | | | | |
Net realized capital gains | | | (2.29 | ) | | | (4.14 | ) | | | (4.25 | ) | | | (2.76 | ) | | | (3.18 | ) | | | | |
| | | | |
Total Distributions | | | (2.33 | ) | | | (4.14 | ) | | | (4.25 | ) | | | (2.81 | ) | | | (3.30 | ) | | | | |
| | | | |
Net asset value, end of the period | | $ | 21.87 | | | $ | 28.11 | | | $ | 34.66 | | | $ | 36.83 | | | $ | 33.33 | | | | | |
| | | | |
Total return(c) | | | (15.56 | )% | | | (4.33 | )% | | | 5.95 | % | | | 19.38 | % | | | 16.47 | % | | | | |
RATIOS TO AVERAGE NET ASSETS: | | | | | | | | | | | | | | | | | | | | | | | | |
Net assets, end of the period (000’s) | | $ | 83,163 | | | $ | 134,434 | | | $ | 208,310 | | | $ | 251,405 | | | $ | 267,936 | | | | | |
Net expenses(d) | | | 1.15 | % | | | 1.15 | % | | | 1.15 | % | | | 1.15 | % | | | 1.15 | % | | | | |
Gross expenses | | | 1.20 | % | | | 1.18 | % | | | 1.17 | % | | | 1.18 | % | | | 1.18 | % | | | | |
Net investment income | | | 0.23 | % | | | 0.10 | % | | | 0.01 | % | | | 0.12 | % | | | 0.27 | % | | | | |
Portfolio turnover rate | | | 23 | % | | | 24 | % | | | 19 | % | | | 25 | % | | | 22 | % | | | | |
| (a) | Per share net investment income has been calculated using the average shares outstanding during the period. |
| (b) | Amount rounds to less than $0.01 per share. |
| (c) | Had certain expenses not been waived/reimbursed during the period, total returns would have been lower. |
| (d) | The investment adviser agreed to waive its fees and/or reimburse a portion of the Fund’s expenses during the period. Without this waiver/reimbursement, expenses would have been higher. |
See accompanying notes to financial statements.
Financial Highlights – continued
For a share outstanding throughout each period.
| | | | | | | | | | | | | | | | | | | | | | | | |
| | | Small Cap Value Fund—Admin Class | | | | |
| | | Year Ended
September 30,
2020
| | | Year Ended
September 30,
2019
| | | Year Ended
September 30,
2018
| | | Year Ended
September 30,
2017
| | | Year Ended
September 30,
2016
| | | | |
Net asset value, beginning of the period | | $ | 26.68 | | | $ | 33.25 | | | $ | 35.58 | | | $ | 32.31 | | | $ | 30.88 | | | | | |
| | | | |
INCOME (LOSS) FROM INVESTMENT OPERATIONS: | | | | | | | | | | | | | | | | | | | | | | | | |
Net investment income (loss)(a) | | | (0.01 | ) | | | (0.04 | ) | | | (0.08 | ) | | | (0.04 | ) | | | 0.01 | | | | | |
Net realized and unrealized gain (loss) | | | (3.73 | ) | | | (2.39 | ) | | | 2.00 | | | | 6.07 | | | | 4.62 | | | | | |
| | | | |
Total from Investment Operations | | | (3.74 | ) | | | (2.43 | ) | | | 1.92 | | | | 6.03 | | | | 4.63 | | | | | |
| | | | |
LESS DISTRIBUTIONS FROM: | | | | | | | | | | | | | | | | | | | | | | | | |
Net investment income | | | — | | | | — | | | | — | | | | — | | | | (0.02 | ) | | | | |
Net realized capital gains | | | (2.29 | ) | | | (4.14 | ) | | | (4.25 | ) | | | (2.76 | ) | | | (3.18 | ) | | | | |
| | | | |
Total Distributions | | | (2.29 | ) | | | (4.14 | ) | | | (4.25 | ) | | | (2.76 | ) | | | (3.20 | ) | | | | |
| | | | |
Net asset value, end of the period | | $ | 20.65 | | | $ | 26.68 | | | $ | 33.25 | | | $ | 35.58 | | | $ | 32.31 | | | | | |
| | | | |
Total return(b) | | | (15.74 | )% | | | (4.60 | )% | | | 5.68 | % | | | 19.10 | % | | | 16.19 | % | | | | |
RATIOS TO AVERAGE NET ASSETS: | | | | | | | | | | | | | | | | | | | | | | | | |
Net assets, end of the period (000’s) | | $ | 7,662 | | | $ | 13,357 | | | $ | 24,530 | | | $ | 30,533 | | | $ | 43,973 | | | | | |
Net expenses(c) | | | 1.40 | % | | | 1.40 | % | | | 1.40 | % | | | 1.40 | % | | | 1.39 | %(d) | | | | |
Gross expenses | | | 1.45 | % | | | 1.43 | % | | | 1.42 | % | | | 1.43 | % | | | 1.42 | %(d) | | | | |
Net investment income (loss) | | | (0.03 | )% | | | (0.15 | )% | | | (0.24 | )% | | | (0.11 | )% | | | 0.03 | % | | | | |
Portfolio turnover rate | | | 23 | % | | | 24 | % | | | 19 | % | | | 25 | % | | | 22 | % | | | | |
| (a) | Per share net investment income (loss) has been calculated using the average shares outstanding during the period. |
| (b) | Had certain expenses not been waived/reimbursed during the period, total returns would have been lower. |
| (c) | The investment adviser agreed to waive its fees and/or reimburse a portion of the Fund’s expenses during the period. Without this waiver/reimbursement, expenses would have been higher. |
| (d) | Includes refund of prior year service fee of 0.01%. |
See accompanying notes to financial statements.
Financial Highlights – continued
For a share outstanding throughout each period.
| | | | | | | | | | | | | | | | | | | | | | | | |
| | | Small Cap Value Fund—Class N | | | | |
| | | Year Ended
September 30,
2020
| | | Year Ended
September 30,
2019
| | | Year Ended
September 30,
2018
| | | Year Ended
September 30,
2017
| | | Year Ended
September 30,
2016
| | | | |
Net asset value, beginning of the period | | $ | 28.68 | | | $ | 35.31 | | | $ | 37.41 | | | $ | 33.81 | | | $ | 32.22 | | | | | |
| | | | |
INCOME (LOSS) FROM INVESTMENT OPERATIONS: | | | | | | | | | | | | | | | | | | | | | | | | |
Net investment income(a) | | | 0.13 | | | | 0.12 | | | | 0.12 | | | | 0.15 | | | | 0.19 | | | | | |
Net realized and unrealized gain (loss) | | | (4.03 | ) | | | (2.50 | ) | | | 2.11 | | | | 6.37 | | | | 4.83 | | | | | |
| | | | |
Total from Investment Operations | | | (3.90 | ) | | | (2.38 | ) | | | 2.23 | | | | 6.52 | | | | 5.02 | | | | | |
| | | | |
LESS DISTRIBUTIONS FROM: | | | | | | | | | | | | | | | | | | | | | | | | |
Net investment income | | | (0.14 | ) | | | (0.11 | ) | | | (0.08 | ) | | | (0.16 | ) | | | (0.25 | ) | | | | |
Net realized capital gains | | | (2.29 | ) | | | (4.14 | ) | | | (4.25 | ) | | | (2.76 | ) | | | (3.18 | ) | | | | |
| | | | |
Total Distributions | | | (2.43 | ) | | | (4.25 | ) | | | (4.33 | ) | | | (2.92 | ) | | | (3.43 | ) | | | | |
| | | | |
Net asset value, end of the period | | $ | 22.35 | | | $ | 28.68 | | | $ | 35.31 | | | $ | 37.41 | | | $ | 33.81 | | | | | |
| | | | |
Total return | | | (15.28 | )% | | | (4.07 | )% | | | 6.28 | % | | | 19.78 | % | | | 16.84 | % | | | | |
RATIOS TO AVERAGE NET ASSETS: | | | | | | | | | | | | | | | | | | | | | | | | |
Net assets, end of the period (000’s) | | $ | 92,818 | | | $ | 141,821 | | | $ | 153,646 | | | $ | 136,162 | | | $ | 68,332 | | | | | |
Net expenses | | | 0.85 | % | | | 0.83 | % | | | 0.83 | % | | | 0.83 | % | | | 0.83 | % | | | | |
Gross expenses | | | 0.85 | % | | | 0.83 | % | | | 0.83 | % | | | 0.83 | % | | | 0.83 | % | | | | |
Net investment income | | | 0.53 | % | | | 0.43 | % | | | 0.33 | % | | | 0.44 | % | | | 0.61 | % | | | | |
Portfolio turnover rate | | | 23 | % | | | 24 | % | | | 19 | % | | | 25 | % | | | 22 | % | | | | |
| (a) | Per share net investment income has been calculated using the average shares outstanding during the period. |
See accompanying notes to financial statements.
Financial Highlights – continued
For a share outstanding throughout each period.
| | | | | | | | | | | | | | | | | | | | | | | | |
| | | Small/Mid Cap Growth Fund—Institutional Class | | | | |
| | | Year Ended
September 30,
2020
| | | Year Ended
September 30,
2019
| | | Year Ended
September 30,
2018
| | | Year Ended
September 30,
2017
| | | Year Ended
September 30,
2016
| | | | |
Net asset value, beginning of the period | | $ | 10.03 | | | $ | 15.49 | | | $ | 12.31 | | | $ | 9.73 | | | $ | 9.05 | | | | | |
| | | | |
INCOME (LOSS) FROM INVESTMENT OPERATIONS: | | | | | | | | | | | | | | | | | | | | | | | | |
Net investment income (loss)(a) | | | (0.04 | ) | | | (0.04 | ) | | | (0.05 | ) | | | 0.00 | (b) | | | (0.02 | ) | | | | |
Net realized and unrealized gain (loss) | | | 2.06 | | | | (1.55 | )(c) | | | 3.23 | | | | 2.60 | | | | 0.70 | | | | | |
| | | | |
Total from Investment Operations | | | 2.02 | | | | (1.59 | ) | | | 3.18 | | | | 2.60 | | | | 0.68 | | | | | |
| | | | |
LESS DISTRIBUTIONS FROM: | | | | | | | | | | | | | | | | | | | | | | | | |
Net investment income | | | — | | | | — | | | | — | | | | (0.02 | ) | | | — | | | | | |
Net realized capital gains | | | (0.24 | ) | | | (3.87 | ) | | | — | | | | — | | | | — | | | | | |
| | | | |
Total Distributions | | | (0.24 | ) | | | (3.87 | ) | | | — | | | | (0.02 | ) | | | — | | | | | |
| | | | |
Net asset value, end of the period | | $ | 11.81 | | | $ | 10.03 | | | $ | 15.49 | | | $ | 12.31 | | | $ | 9.73 | | | | | |
| | | | |
Total return(d) | | | 20.38 | % | | | (3.27 | )% | | | 25.83 | % | | | 26.74 | % | | | 7.51 | % | | | | |
RATIOS TO AVERAGE NET ASSETS: | | | | | | | | | | | | | | | | | | | | | | | | |
Net assets, end of the period (000’s) | | $ | 52,170 | | | $ | 34,312 | | | $ | 17,500 | | | $ | 14,592 | | | $ | 11,974 | | | | | |
Net expenses(e) | | | 0.84 | % | | | 0.85 | % | | | 0.85 | % | | | 0.85 | % | | | 0.85 | % | | | | |
Gross expenses | | | 1.21 | % | | | 1.30 | % | | | 1.43 | % | | | 1.57 | % | | | 1.75 | % | | | | |
Net investment income (loss) | | | (0.34 | )% | | | (0.35 | )% | | | (0.35 | )% | | | 0.01 | % | | | (0.22 | )% | | | | |
Portfolio turnover rate | | | 60 | % | | | 67 | % | | | 102 | %(f) | | | 49 | % | | | 53 | % | | | | |
| (a) | Per share net investment income (loss) has been calculated using the average shares outstanding during the period. |
| (b) | Amount rounds to less than $0.01. |
| (c) | The amount shown for a share outstanding does not correspond with the aggregate realized and unrealized gain (loss) on investments for the period due to the timing of sales and redemptions of fund shares in relation to fluctuating market values of investments of the Fund. |
| (d) | Had certain expenses not been waived/reimbursed during the period, total returns would have been lower. |
| (e) | The investment adviser agreed to waive its fees and/or reimburse a portion of the Fund’s expenses during the period. Without this waiver/reimbursement, expenses would have been higher. |
| (f) | The variation in the Fund’s turnover rate from 2017 to 2018 was primarily due to significant shareholder flows. |
See accompanying notes to financial statements.
Financial Highlights – continued
For a share outstanding throughout each period.
| | | | | | | | | | | | |
| | | Small/Mid Cap Growth Fund— Class N | | | | |
| | | | | | Period Ended
September 30,
2020*
| | | | |
Net asset value, beginning of the period | | | | | | $ | 9.89 | | | | | |
| | | | | | | | |
INCOME (LOSS) FROM INVESTMENT OPERATIONS: | | | | | | | | | | | | |
Net investment loss(a) | | | | | | | (0.04 | ) | | | | |
Net realized and unrealized gain (loss) | | | | | | | 2.20 | | | | | |
| | | | | | | | |
Total from Investment Operations | | | | | | | 2.16 | | | | | |
| | | | | | | | |
LESS DISTRIBUTIONS FROM: | | | | | | | | | | | | |
Net realized capital gains | | | | | | | (0.24 | ) | | | | |
| | | | | | | | |
Net asset value, end of the period | | | | | | $ | 11.81 | | | | | |
| | | | | | | | |
Total return(b)(c) | | | | | | | 22.08 | % | | | | |
RATIOS TO AVERAGE NET ASSETS: | | | | | | | | | | | | |
Net assets, end of the period (000’s) | | | | | | $ | 1 | | | | | |
Net expenses(d)(e) | | | | | | | 0.83 | % | | | | |
Gross expenses(e) | | | | | | | 107.49 | % | | | | |
Net investment loss(e) | | | | | | | (0.34 | )% | | | | |
Portfolio turnover rate(f) | | | | | | | 60 | % | | | | |
| * | Class operations commenced on October 1, 2019. |
| (a) | Per share net investment loss has been calculated using the average shares outstanding during the period. |
| (b) | Had certain expenses not been waived/reimbursed during the period, total returns would have been lower. |
| (c) | Periods less than one year are not annualized. |
| (d) | The investment adviser agreed to waive its fees and/or reimburse a portion of the Fund’s expenses during the period. Without this waiver/reimbursement, expenses would have been higher. |
| (e) | Computed on an annualized basis for periods less than one year. |
| (f) | Represents the Fund’s portfolio turnover rate for the year ended September 30, 2020. |
See accompanying notes to financial statements.
Notes to Financial Statements
September 30, 2020
1. Organization. Loomis Sayles Funds I and Loomis Sayles Funds II (the “Trusts” and each a “Trust”) are each organized as a Massachusetts business trust. Each Trust is registered under the Investment Company Act of 1940, as amended (the “1940 Act”), as an open-end management investment company. Each Declaration of Trust permits the Board of Trustees to authorize the issuance of an unlimited number of shares of the Trust in multiple series. The financial statements for certain funds of the Trusts are presented in separate reports. The following funds (individually, a “Fund” and collectively, the “Funds”) are included in this report:
Loomis Sayles Funds I:
Loomis Sayles Small Cap Value Fund (the “Small Cap Value Fund”)
Loomis Sayles Funds II:
Loomis Sayles Small Cap Growth Fund (the “Small Cap Growth Fund”)
Loomis Sayles Small/Mid Cap Growth Fund (the “Small/Mid Cap Growth Fund”)
Each Fund is a diversified investment company.
Small Cap Growth Fund offers Institutional Class, Retail Class and Class N shares. Small Cap Value Fund offers Institutional Class, Retail Class, Admin Class and Class N shares. Small/Mid Cap Growth Fund offers Institutional Class and Class N shares (effective October 1, 2019).
Each share class is sold without a sales charge. Retail Class and Admin Class shares pay a Rule 12b-1 fee. Class N shares are offered with an initial minimum investment of $1,000,000. Institutional Class shares are intended for institutional investors with a minimum initial investment of $100,000. Certain categories of investors are exempted from the minimum investment amount for Class N and Institutional Class as outlined in the relevant Fund’s prospectus. Admin Class shares are offered exclusively through intermediaries.
Most expenses can be directly attributed to a Fund. Expenses which cannot be directly attributed to a Fund are generally apportioned based on the relative net assets of each of the funds in Natixis Funds Trust I, Natixis Funds Trust II, Natixis Funds Trust IV and Gateway Trust (“Natixis Funds Trusts”), Loomis Sayles Funds I and Loomis Sayles Funds II (“Loomis Sayles Funds Trusts”), and Natixis ETF Trust and Natixis ETF Trust II (“Natixis ETF Trusts”). Expenses of a Fund are borne pro rata by the holders of each class of shares, except that each class bears expenses unique to that class (such as the Rule 12b-1 fees applicable to Retail Class and Admin Class), and transfer agent fees are borne collectively for Institutional Class, Retail Class and Admin Class, and individually for Class N. In addition, each class votes as a class only with respect to its own Rule 12b-1 Plan. Shares of each class would receive their pro rata share of the net assets of a Fund if the Fund were liquidated. The Trustees approve separate distributions from net investment income on each class of shares.
Notes to Financial Statements – continued
September 30, 2020
2. Significant Accounting Policies. The following is a summary of significant accounting policies consistently followed by each Fund in the preparation of its financial statements. The Funds’ financial statements follow the accounting and reporting guidelines provided for investment companies and are prepared in accordance with accounting principles generally accepted in the United States of America which require the use of management estimates that affect the reported amounts and disclosures in the financial statements. Actual results could differ from those estimates. Management has evaluated the events and transactions subsequent to year-end through the date the financial statements were issued and has determined that there were no material events that would require disclosure in the Funds’ financial statements.
a. Valuation. Fund securities and other investments are valued at market value based on market quotations obtained or determined by independent pricing services recommended by the adviser and approved by the Board of Trustees. Fund securities and other investments for which market quotations are not readily available are valued at fair value as determined in good faith by the adviser pursuant to procedures approved by the Board of Trustees, as described below. Market value is determined as follows:
Listed equity securities (including shares of closed-end investment companies and exchange-traded funds) are valued at the last sale price quoted on the exchange where they are traded most extensively or, if there is no reported sale during the day, the closing bid quotation as reported by an independent pricing service. Securities traded on the NASDAQ Global Select Market, NASDAQ Global Market and NASDAQ Capital Market are valued at the NASDAQ Official Closing Price (“NOCP”), or if lacking an NOCP, at the most recent bid quotations on the applicable NASDAQ Market. Unlisted equity securities (except unlisted preferred equity securities) are valued at the last sale price quoted in the market where they are traded most extensively or, if there is no reported sale during the day, the closing bid quotation as reported by an independent pricing service. If there is no last sale price or closing bid quotation available, unlisted equity securities will be valued using evaluated bids furnished by an independent pricing service, if available. In some foreign markets, an official close price and a last sale price may be available from the foreign exchange or market. In those cases, the official close price is used. Debt securities and unlisted preferred equity securities are valued based on evaluated bids furnished to the Funds by an independent pricing service or bid prices obtained from broker-dealers. Broker-dealer bid prices may be used to value debt and unlisted equity securities where an independent pricing service is unable to price a security or where an independent pricing service does not provide a reliable price for the security.
Fund securities and other investments for which market quotations are not readily available are valued at fair value as determined in good faith by the adviser pursuant to procedures approved by the Board of Trustees. The Funds may also value securities and other investments at fair value in other circumstances such as when extraordinary events occur after the close of a foreign market but prior to the close of the New York Stock
Notes to Financial Statements – continued
September 30, 2020
Exchange. This may include situations relating to a single issuer (such as a declaration of bankruptcy or a delisting of the issuer’s security from the primary market on which it has traded) as well as events affecting the securities markets in general (such as market disruptions or closings and significant fluctuations in U.S. and/or foreign markets). When fair valuing its securities or other investments, the Funds may, among other things, use modeling tools or other processes that may take into account factors such as securities or other market activity and/or significant events that occur after the close of the foreign market and before the time the Fund’s net asset value (“NAV”) is calculated. Fair value pricing may require subjective determinations about the value of a security, and fair values used to determine a Fund’s NAV may differ from quoted or published prices, or from prices that are used by others, for the same securities. In addition, the use of fair value pricing may not always result in adjustments to the prices of securities held by a Fund.
b. Investment Transactions and Related Investment Income. Investment transactions are accounted for on a trade date plus one day basis for daily NAV calculation. However, for financial reporting purposes, investment transactions are reported on trade date. Dividend income (including income reinvested) and foreign withholding tax, if applicable, is recorded on the ex-dividend date, or in the case of certain foreign securities, as soon as a Fund is notified, and interest income is recorded on an accrual basis. Interest income is increased by the accretion of discount and decreased by the amortization of premium, if applicable. Distributions received from investments in securities that represent a return of capital or capital gain are recorded as a reduction of cost of investments or as a realized gain, respectively. The calendar year-end amounts of ordinary income, capital gains and return of capital included in distributions received from the Funds’ investments in real estate investment trusts (“REITs”) are reported to the Funds after the end of the fiscal year; accordingly, the Funds estimate these amounts for accounting purposes until the characterization of REIT distributions is reported to the Funds after the end of the fiscal year. Estimates are based on the most recent REIT distribution information available. In determining net gain or loss on securities sold, the cost of securities has been determined on an identified cost basis. Investment income, non-class specific expenses and realized and unrealized gains and losses are allocated on a pro rata basis to each class based on the relative net assets of each class to the total net assets of the Fund.
c. Foreign Currency Translation. The books and records of the Funds are maintained in U.S. dollars. The values of securities, currencies and other assets and liabilities denominated in currencies other than U.S. dollars, if any, are translated into U.S. dollars based upon foreign exchange rates prevailing at the end of the period. Purchases and sales of investment securities, income and expenses are translated into U.S. dollars on the respective dates of such transactions.
Net realized foreign exchange gains or losses arise from sales of foreign currency, changes in exchange rates between the trade and settlement dates on securities transactions and the difference between the amounts of dividends, interest and foreign withholding taxes
Notes to Financial Statements – continued
September 30, 2020
recorded on the Funds’ books and the U.S. dollar equivalent of the amounts actually received or paid. Net unrealized foreign exchange gains or losses arise from changes in the value of assets and liabilities, other than investment securities, as of the end of the fiscal period, resulting from changes in exchange rates.
The values of investment securities are presented at the foreign exchange rates prevailing at the end of the period for financial reporting purposes. Net realized and unrealized gains or losses on investments reported in the Statements of Operations reflect gains or losses resulting from changes in exchange rates and fluctuations which arise due to changes in market prices of investment securities.
The Funds may use foreign currency exchange contracts to facilitate transactions in foreign-denominated investments. Losses may arise from changes in the value of the foreign currency or if the counterparties do not perform under the contracts’ terms.
d. Federal and Foreign Income Taxes. The Trusts treat each Fund as a separate entity for federal income tax purposes. Each Fund intends to meet the requirements of the Internal Revenue Code of 1986, as amended, applicable to regulated investment companies, and to distribute to its shareholders substantially all of its net investment income and any net realized capital gains at least annually. Management has performed an analysis of each Fund’s tax positions for the open tax years as of September 30, 2020 and has concluded that no provisions for income tax are required. The Funds’ federal tax returns for the prior three fiscal years remain subject to examination by the Internal Revenue Service. Management is not aware of any events that are reasonably possible to occur in the next twelve months that would result in the amounts of any unrecognized tax benefits significantly increasing or decreasing for the Funds. However, management’s conclusions regarding tax positions taken may be subject to review and adjustment at a later date based on factors including, but not limited to, new tax laws and accounting regulations and interpretations thereof.
A Fund may be subject to foreign withholding taxes on investment income and taxes on capital gains on investments that are accrued and paid based upon the Fund’s understanding of the tax rules and regulations that exist in the countries in which the Fund invests. Foreign withholding taxes on dividend and interest income are reflected on the Statements of Operations as a reduction of investment income, net of amounts eligible to be reclaimed. Dividends and interest receivable on the Statements of Assets and Liabilities are net of foreign withholding taxes. Foreign withholding taxes where reclaims have been or will be filed are reflected on the Statements of Assets and Liabilities as tax reclaims receivable. Capital gains taxes paid are included in net realized gain (loss) on investments in the Statements of Operations. Accrued but unpaid capital gains taxes are reflected as foreign taxes payable on the Statements of Assets and Liabilities, if applicable, and reduce unrealized gains on investments. In the event that realized gains on investments are subsequently offset by realized losses, taxes paid on realized gains may be returned to a
Notes to Financial Statements – continued
September 30, 2020
Fund. Such amounts, if applicable, are reflected as foreign tax rebates receivable on the Statements of Assets and Liabilities and are recorded as a realized gain when received.
e. Dividends and Distributions to Shareholders. Dividends and distributions are recorded on the ex-dividend date. The timing and characterization of certain income and capital gain distributions are determined in accordance with federal tax regulations, which may differ from accounting principles generally accepted in the United States of America. Permanent differences are primarily due to differing treatments for book and tax purposes of items such as return of capital distributions received, deferred Trustees’ fees, redemptions-in-kind, capital gain distributions received and net operating losses. Permanent book and tax basis differences relating to shareholder distributions will result in reclassifications to capital accounts reported on the Statements of Assets and Liabilities. Temporary differences between book and tax distributable earnings are primarily due to return of capital distributions received, deferred Trustees’ fees, capital gain distributions received and wash sales. Amounts of income and capital gain available to be distributed on a tax basis are determined annually, and at other times during the Funds’ fiscal year as may be necessary to avoid knowingly declaring and paying a return of capital distribution. Distributions from net investment income and short-term capital gains are reported as distributed from ordinary income for tax purposes.
The tax characterization of distributions is determined on an annual basis. The tax character of distributions paid to shareholders during the years ended September 30, 2020 and 2019 were as follows:
| | | | | | | | | | | | | | | | | | | | | | | | |
| | | 2020 Distributions Paid From: | | | 2019 Distributions Paid From: | |
Fund | | Ordinary
Income | | | Long-Term
Capital Gains | | | Total | | | Ordinary
Income | | | Long-Term
Capital Gains | | | Total | |
Small Cap Growth Fund | | $ | — | | | $ | 150,841,195 | | | $ | 150,841,195 | | | $ | — | | | $ | 131,384,945 | | | $ | 131,384,945 | |
Small Cap Value Fund | | | 2,526,541 | | | | 55,082,819 | | | | 57,609,360 | | | | 1,761,169 | | | | 110,774,229 | | | | 112,535,398 | |
Small/Mid Cap Growth Fund | | | — | | | | 817,114 | | | | 817,114 | | | | — | | | | 4,717,064 | | | | 4,717,064 | |
Distributions paid to shareholders from net investment income and net realized capital gains, based on accounting principles generally accepted in the United States of America, are consolidated and reported on the Statements of Changes in Net Assets as Distributions to Shareholders. Distributions paid to shareholders from net investment income and net realized capital gains expressed in per-share amounts, based on accounting principles generally accepted in the United States of America, are separately stated and reported within the Financial Highlights.
Notes to Financial Statements – continued
September 30, 2020
As of September 30, 2020, the components of distributable earnings on a tax basis were as follows:
| | | | | | | | | | | | |
| | | Small Cap
Growth Fund | | | Small Cap
Value Fund | | | Small/Mid
Cap Growth
Fund | |
Undistributed ordinary income | | $ | — | | | $ | 1,813,776 | | | $ | — | |
Undistributed long-term capital gains | | | 41,523,437 | | | | 35,346,868 | | | | 841 | |
| | | | | | | | | | | | |
Total undistributed earnings | | | 41,523,437 | | | | 37,160,644 | | | | 841 | |
| | | | | | | | | | | | |
Late-year ordinary and post-October capital loss deferrals* | | | (8,252,065 | ) | | | — | | | | (522,399 | ) |
| | | | | | | | | | | | |
Unrealized appreciation | | | 581,264,005 | | | | 57,653,388 | | | | 9,889,102 | |
| | | | | | | | | | | | |
Total accumulated earnings | | $ | 614,535,377 | | | $ | 94,814,032 | | | $ | 9,367,544 | |
| | | | | | | | | | | | |
| * | Under current tax law, net operating losses, capital losses, foreign currency losses, and losses on passive foreign investment companies and contingent payment debt instruments after October 31 or December 31, as applicable, may be deferred and treated as occurring on the first day of the following taxable year. Small Cap Growth Fund and Small/Mid Cap Growth Fund are deferring net operating losses. |
As of September 30, 2020, the tax cost of investments and unrealized appreciation (depreciation) on a federal tax basis were as follows:
| | | | | | | | | | | | |
| | | Small Cap
Growth Fund | | | Small Cap Value
Fund | | | Small/Mid Cap
Growth Fund | |
Federal tax cost | | $ | 1,610,108,714 | | | $ | 420,080,220 | | | $ | 42,248,563 | |
| | | | | | | | | | | | |
Gross tax appreciation | | $ | 627,992,151 | | | $ | 106,990,712 | | | $ | 10,949,590 | |
Gross tax depreciation | | | (46,728,146 | ) | | | (49,337,324 | ) | | | (1,060,488 | ) |
| | | | | | | | | | | | |
Net tax appreciation | | $ | 581,264,005 | | | $ | 57,653,388 | | | $ | 9,889,102 | |
| | | | | | | | | | | | |
f. Repurchase Agreements. Each Fund may enter into repurchase agreements, under the terms of a Master Repurchase Agreement, under which each Fund acquires securities as collateral and agrees to resell the securities at an agreed upon time and at an agreed upon price. It is each Fund’s policy that the market value of the collateral for repurchase agreements be at least equal to 102% of the repurchase price, including interest. Certain repurchase agreements are tri-party arrangements whereby the collateral is held in a segregated account for the benefit of the Fund and on behalf of the counterparty. Repurchase agreements could involve certain risks in the event of default or insolvency of the counterparty, including possible delays or restrictions upon a Fund’s ability to dispose of the underlying securities. As of September 30, 2020, each Fund, as applicable, had investments in repurchase agreements for which the value of the related collateral exceeded the value of the repurchase agreement. The gross value of repurchase agreements is included in the Statements of Assets and Liabilities for financial reporting purposes.
g. Securities Lending. Small Cap Growth Fund and Small Cap Value Fund have entered into an agreement with State Street Bank and Trust Company (“State Street Bank”), as
Notes to Financial Statements – continued
September 30, 2020
agent of the Funds, to lend securities to certain designated borrowers. The loans are collateralized with cash or securities in an amount equal to at least 105% or 102% of the market value (including accrued interest) of the loaned international or domestic securities, respectively, when the loan is initiated. Thereafter, the value of the collateral must remain at least 102% of the market value (including accrued interest) of loaned securities for U.S. equities and U.S. corporate debt; at least 105% of the market value (including accrued interest) of loaned securities for non-U.S. equities; and at least 100% of the market value (including accrued interest) of loaned securities for U.S. Government securities, sovereign debt issued by non-U.S. Governments and non-U.S. corporate debt. In the event that the market value of the collateral falls below the required percentages described above, the borrower will deliver additional collateral on the next business day. As with other extensions of credit, the Funds may bear the risk of loss with respect to the investment of the collateral. The Funds invest cash collateral in short-term investments, a portion of the income from which is remitted to the borrowers and the remainder allocated between the Funds and State Street Bank as lending agent.
For the year ended September 30, 2020, neither Fund had loaned securities under this agreement.
h. Indemnifications. Under the Trusts’ organizational documents, their officers and Trustees are indemnified against certain liabilities arising out of the performance of their duties to the Funds. Additionally, in the normal course of business, the Funds enter into contracts with service providers that contain general indemnification clauses. The Funds’ maximum exposure under these arrangements is unknown as this would involve future claims that may be made against the Funds that have not yet occurred. However, based on experience, the Funds expect the risk of loss to be remote.
i. New Accounting Pronouncement. In August 2018, the Financial Accounting Standards Board issued Accounting Standards Update 2018-13, Fair Value Measurement (Topic 820): Disclosure Framework—Changes to the Disclosure Requirements for Fair Value Measurement (“ASU 2018-13”). The update introduces new fair value disclosure requirements, eliminates some prior fair value disclosure requirements, and modifies certain existing fair value disclosure requirements. ASU 2018-13 is effective for fiscal years beginning after December 15, 2019, including interim periods within those fiscal years. An entity is permitted to early adopt any eliminated or modified disclosures upon issuance of the update and delay adoption of any new disclosures until the required effective date. Management has evaluated the impact of the adoption of ASU 2018-13 and has determined to early adopt the removal of (i) the amount of and reasons for transfers between Level 1 and Level 2 of the fair value hierarchy and (ii) the policy for timing of transfers between levels. Amended disclosures required and permitted for early adoption by ASU 2018-13 have been incorporated in the Funds’ annual financial statements as of September 30, 2020.
Notes to Financial Statements – continued
September 30, 2020
3. Fair Value Measurements. In accordance with accounting standards related to fair value measurements and disclosures, the Funds have categorized the inputs utilized in determining the value of each Fund’s assets or liabilities. These inputs are summarized in the three broad levels listed below:
| | • | | Level 1—quoted prices in active markets for identical assets or liabilities; |
| | • | | Level 2—prices determined using other significant inputs that are observable either directly, or indirectly through corroboration with observable market data (which could include quoted prices for similar assets or liabilities, interest rates, credit risk, etc.); and |
| | • | | Level 3—prices determined using significant unobservable inputs when quoted prices or observable inputs are unavailable such as when there is little or no market activity for an asset or liability (unobservable inputs reflect each Fund’s own assumptions in determining the fair value of assets or liabilities and would be based on the best information available). |
The inputs or methodology used for valuing securities are not necessarily an indication of the risk associated with investing in those securities.
The following is a summary of the inputs used to value the Funds’ investments as of September 30, 2020, at value:
Small Cap Growth Fund
Asset Valuation Inputs
| | | | | | | | | | | | | | | | |
Description | | Level 1 | | | Level 2 | | | Level 3 | | | Total | |
Common Stocks(a) | | $ | 2,101,552,010 | | | $ | — | | | $ | — | | | $ | 2,101,552,010 | |
Short-Term Investments | | | — | | | | 89,820,709 | | | | — | | | | 89,820,709 | |
| | | | | | | | | | | | | | | | |
Total | | $ | 2,101,552,010 | | | $ | 89,820,709 | | | $ | — | | | $ | 2,191,372,719 | |
| | | | | | | | | | | | | | | | |
(a) Details of the major categories of the Fund’s investments are reflected within the Portfolio of Investments.
Small Cap Value Fund
Asset Valuation Inputs
| | | | | | | | | | | | | | | | |
Description | | Level 1 | | | Level 2 | | | Level 3 | | | Total | |
Common Stocks(a) | | $ | 473,309,049 | | | $ | — | | | $ | — | | | $ | 473,309,049 | |
Other Investments(a) | | | — | | | | — | | | | — | | | | — | |
Short-Term Investments | | | — | | | | 4,424,559 | | | | — | | | | 4,424,559 | |
| | | | | | | | | | | | | | | | |
Total | | $ | 473,309,049 | | | $ | 4,424,559 | | | $ | — | | | $ | 477,733,608 | |
| | | | | | | | | | | | | | | | |
(a) Details of the major categories of the Fund’s investments are reflected within the Portfolio of Investments.
Notes to Financial Statements – continued
September 30, 2020
Small/Mid Cap Growth Fund
Asset Valuation Inputs
| | | | | | | | | | | | | | | | |
Description | | Level 1 | | | Level 2 | | | Level 3 | | | Total | |
Common Stocks(a) | | $ | 50,488,857 | | | $ | — | | | $ | — | | | $ | 50,488,857 | |
Short-Term Investments | | | — | | | | 1,648,808 | | | | — | | | | 1,648,808 | |
| | | | | | | | | | | | | | | | |
Total | | $ | 50,488,857 | | | $ | 1,648,808 | | | $ | — | | | $ | 52,137,665 | |
| | | | | | | | | | | | | | | | |
(a) Details of the major categories of the Fund’s investments are reflected within the Portfolio of Investments.
4. Purchases and Sales of Securities. For the year ended September 30, 2020, purchases and sales of securities (excluding short-term investments) were as follows:
| | | | | | | | |
Fund | | Purchases | | | Sales | |
Small Cap Growth Fund | | $ | 1,091,080,281 | | | $ | 924,279,379 | |
Small Cap Value Fund | | | 131,996,209 | | | | 267,405,033 | |
Small/Mid Cap Growth Fund | | | 36,492,481 | | | | 24,550,298 | |
5. Management Fees and Other Transactions with Affiliates.
a. Management Fees. Loomis, Sayles & Company, L.P. (“Loomis Sayles”) serves as investment adviser to each Fund. Loomis Sayles is a limited partnership whose sole general partner, Loomis, Sayles & Company, Inc., is indirectly owned by Natixis Investment Managers, LLC (“Natixis”), which is part of Natixis Investment Managers, an international asset management group based in Paris, France.
Under the terms of the management agreements, each Fund pays a management fee at the following annual rates, calculated daily and payable monthly, based on each Fund’s average daily net assets:
| | | | | | | | |
Fund | | Percentage of
Average Daily Net Assets | | | | |
Small Cap Growth Fund | | | 0.75% | | | | | |
Small Cap Value Fund | | | 0.75% | | | | | |
Small/Mid Cap Growth Fund | | | 0.75% | | | | | |
Loomis Sayles has given binding undertakings to the Funds to waive management fees and/or reimburse certain expenses to limit the Funds’ operating expenses, exclusive of acquired fund fees and expenses, brokerage expenses, interest expense, taxes, organizational and extraordinary expenses such as litigation and indemnification expenses. These undertakings are in effect until January 31, 2021, may be terminated before then only with the consent of the Funds’ Board of Trustees and are reevaluated on an annual basis. Management fees payable, as reflected on the Statements of Assets and Liabilities, is net of waivers and/or expense reimbursements, if any, pursuant to these undertakings. Waivers/ reimbursements that exceed management fees payable are reflected on the Statements of Assets and Liabilities as receivable from investment adviser.
Notes to Financial Statements – continued
September 30, 2020
For the year ended September 30, 2020, the expense limits as a percentage of average daily net assets under the expense limitation agreements were as follows:
| | | | | | | | | | | | | | | | |
| | | Expense Limit as a Percentage of
Average Daily Net Assets | |
Fund | | Institutional Class | | | Retail Class | | | Admin Class | | | Class N | |
Small Cap Growth Fund | | | 1.00% | | | | 1.25% | | | | — | | | | 0.95% | |
Small Cap Value Fund | | | 0.90% | | | | 1.15% | | | | 1.40% | | | | 0.85% | |
Small/Mid Cap Growth Fund | | | 0.85% | | | | — | | | | — | | | | 0.83% | |
Loomis Sayles shall be permitted to recover expenses borne under the expense limitation agreements (whether through waiver of management fees or otherwise) on a class by class basis in later periods to the extent the annual operating expenses of a class fall below a class’ expense limits, provided, however, that a class is not obligated to pay such waived/reimbursed fees or expenses more than one year after the end of the fiscal year in which the fees or expenses were waived/reimbursed.
For the year ended September 30, 2020, the management fees for each Fund were as follows:
| | | | | | | | | | | | | | | | | | | | | | | | |
| | | Gross
Management
Fees | | | Contractual
Waivers of
Management
Fees1 | | | Voluntary
Waivers of
Management
Fees2 | | | Net
Management
Fees | | | Percentage of Average
Daily Net Assets | |
Fund | | Gross | | | Net | |
Small Cap Growth Fund | | $ | 13,879,951 | | | $ | — | | | $ | — | | | $ | 13,879,951 | | | | 0.75% | | | | 0.75% | |
Small Cap Value Fund | | | 4,342,299 | | | | 242,252 | | | | — | | | | 4,100,047 | | | | 0.75% | | | | 0.71% | |
Small/Mid Cap Growth Fund | | | 313,390 | | | | 151,521 | | | | 3,635 | | | | 158,234 | | | | 0.75% | | | | 0.38% | |
| 1 | Contractual management fee waivers are subject to possible recovery until September 30, 2021. |
| 2 | Voluntary management fee waivers are not subject to recovery under the expense limitation agreement described above. |
b. Service and Distribution Fees. Natixis Distribution, L.P. (“Natixis Distribution”), which is a wholly-owned subsidiary of Natixis, has entered into a distribution agreement with the Trusts. Pursuant to this agreement, Natixis Distribution serves as principal underwriter of the Funds of the Trusts.
Pursuant to Rule 12b-1 under the 1940 Act, Small Cap Growth Fund and Small Cap Value Fund have adopted a Distribution Plan relating to each Fund’s Retail Class shares (the “Retail Class Plans”) and Small Cap Value Fund has adopted a Distribution Plan relating to its Admin Class shares (the “Admin Class Plan”).
Under the Retail Class Plans, each Fund pays Natixis Distribution a monthly distribution fee at an annual rate not to exceed 0.25% of the average daily net assets attributable to the Fund’s Retail Class shares, as compensation for services provided by Natixis Distribution
Notes to Financial Statements – continued
September 30, 2020
in connection with the marketing or sale of Retail Class shares or for payments made by Natixis Distribution to securities dealers or other financial intermediaries as commissions, asset-based sales charges or other compensation with respect to the sale of Retail Class shares, or for providing personal services to investors and/or the maintenance of shareholder accounts.
Under the Admin Class Plan, Small Cap Value Fund pays Natixis Distribution a monthly distribution fee at an annual rate not to exceed 0.25% of the average daily net assets attributable to the Fund’s Admin Class shares, as compensation for services provided by Natixis Distribution in connection with the marketing or sale of Admin Class shares or for payments made by Natixis Distribution to securities dealers or other financial intermediaries as commissions, asset-based sales charges or other compensation with respect to the sale of Admin Class shares, or for providing personal services to investors and/or the maintenance of shareholder accounts.
In addition, the Admin Class shares of Small Cap Value Fund may pay Natixis Distribution an administrative service fee, at an annual rate not to exceed 0.25% of the average daily net assets attributable to Admin Class shares. These fees are subsequently paid to securities dealers or financial intermediaries for providing personal services and/or account maintenance for their customers who hold such shares.
For the year ended September 30, 2020, the service and distribution fees for each Fund were as follows:
| | | | | | | | | | | | |
| | | Service Fees | | | Distribution Fees | |
Fund | | Admin Class | | | Retail Class | | | Admin Class | |
Small Cap Growth Fund | | $ | — | | | $ | 232,060 | | | $ | — | |
Small Cap Value Fund | | | 24,910 | | | | 263,201 | | | | 24,910 | |
c. Administrative Fees. Natixis Advisors, L.P. (“Natixis Advisors”) provides certain administrative services for the Funds and contracts with State Street Bank to serve as sub-administrator. Natixis Advisors is a wholly-owned subsidiary of Natixis. Pursuant to an agreement among Natixis Funds Trusts, Loomis Sayles Funds Trusts, Natixis ETF Trusts and Natixis Advisors, each Fund pays Natixis Advisors monthly its pro rata portion of fees equal to an annual rate of 0.0540% of the first $15 billion of the average daily net assets of the Natixis Funds Trusts, Loomis Sayles Funds Trusts and Natixis ETF Trusts, 0.0500% of the next $15 billion, 0.0400% of the next $30 billion, 0.0275% of the next $30 billion and 0.0225% of such assets in excess of $90 billion, subject to an annual aggregate minimum fee for the Natixis Funds Trusts, Loomis Sayles Funds Trusts and Natixis ETF Trusts of $10 million, which is reevaluated on an annual basis.
Notes to Financial Statements – continued
September 30, 2020
For the year ended September 30, 2020, the administrative fees for each Fund were as follows:
| | | | |
Fund | | Administrative Fees | |
Small Cap Growth Fund | | $ | 817,150 | |
Small Cap Value Fund | | | 255,444 | |
Small/Mid Cap Growth Fund | | | 18,443 | |
d. Sub-Transfer Agent Fees. Natixis Distribution has entered into agreements, which include servicing agreements, with financial intermediaries that provide recordkeeping, processing, shareholder communications and other services to customers of the intermediaries that hold positions in the Funds and has agreed to compensate the intermediaries for providing those services. Intermediaries transact with the Funds primarily through the use of omnibus accounts on behalf of their customers who hold positions in the Funds. These services would have been provided by the Funds’ transfer agent and other service providers if the shareholders’ accounts were maintained directly at the Funds’ transfer agent. Accordingly, the Funds have agreed to reimburse Natixis Distribution for all or a portion of the servicing fees paid to these intermediaries. The reimbursement amounts (sub-transfer agent fees) paid to Natixis Distribution are subject to a current per-account equivalent fee limit approved by the Funds’ Board of Trustees, which is based on fees for similar services paid to the Funds’ transfer agent and other service providers. Class N shares do not bear such expenses.
For the year ended September 30, 2020, the sub-transfer agent fees (which are reflected in transfer agent fees and expenses in the Statements of Operations) for each Fund were as follows:
| | | | |
Fund | | Sub-Transfer
Agent Fees | |
Small Cap Growth Fund | | $ | 1,224,338 | |
Small Cap Value Fund | | | 453,300 | |
Small/Mid Cap Growth Fund | | | 1,848 | |
As of September 30, 2020, the Funds owe Natixis Distribution the following reimbursements for sub-transfer agent fees (which are reflected in the Statements of Assets and Liabilities as payable to distributor):
| | | | |
Fund | | Reimbursements
of Sub-Transfer
Agent Fees | |
Small Cap Growth Fund | | $ | 16,037 | |
Small Cap Value Fund | | | 4,420 | |
Small/Mid Cap Growth Fund | | | 29 | |
Sub-transfer agent fees attributable to Institutional Class, Retail Class and Admin Class are allocated on a pro rata basis to each class based on the relative net assets of each class to the total net assets of those classes.
Notes to Financial Statements – continued
September 30, 2020
e. Trustees Fees and Expenses. The Trusts do not pay any compensation directly to their officers or Trustees who are directors, officers or employees of Natixis Advisors, Natixis Distribution, Natixis or their affiliates. The Chairperson of the Board of Trustees receives a retainer fee at the annual rate of $369,000. The Chairperson does not receive any meeting attendance fees for Board of Trustees meetings or committee meetings that he attends. Each Independent Trustee (other than the Chairperson) receives, in the aggregate, a retainer fee at the annual rate of $199,000. Each Independent Trustee also receives a meeting attendance fee of $10,000 for each meeting of the Board of Trustees that he or she attends in person and $5,000 for each meeting of the Board of Trustees that he or she attends telephonically. In addition, the chairperson of the Contract Review Committee, the chairperson of the Audit Committee and the chairperson of the Governance Committee each receive an additional retainer fee at the annual rate of $20,000. Each Contract Review Committee member is compensated $6,000 for each Committee meeting that he or she attends in person and $3,000 for each meeting that he or she attends telephonically. Each Audit Committee member is compensated $6,000 for each Committee meeting that he or she attends in person and $3,000 for each meeting that he or she attends telephonically. These fees are allocated among the funds in the Natixis Funds Trusts, Loomis Sayles Funds Trusts and Natixis ETF Trusts based on a formula that takes into account, among other factors, the relative net assets of each fund. Trustees are reimbursed for travel expenses in connection with attendance at meetings.
Prior to January 1, 2020, the Chairperson of the Board received a retainer fee at the annual rate of $360,000 and each Independent Trustee (other than the Chairperson) received, in the aggregate, a retainer fee at the annual rate of $190,000, and the chairperson of the Governance Committee received an additional retainer fee at the annual rate of $15,000. All other Trustee fees remained unchanged.
A deferred compensation plan (the “Plan”) is available to the Trustees on a voluntary basis. Deferred amounts remain in the Funds until distributed in accordance with the provisions of the Plan. The value of a participating Trustee’s deferral account is based on theoretical investments of deferred amounts, on the normal payment dates, in certain funds of the Natixis Funds Trusts, Loomis Sayles Funds Trusts and Natixis ETF Trusts as designated by the participating Trustees. Changes in the value of participants’ deferral accounts are allocated pro rata among the funds in the Natixis Funds Trusts, Loomis Sayles Funds Trusts and Natixis ETF Trusts, and are normally reflected as Trustees’ fees and expenses in the Statements of Operations. The portions of the accrued obligations allocated to the Funds under the Plan are reflected as Deferred Trustees’ fees in the Statements of Assets and Liabilities.
Certain officers and employees of Natixis Advisors and Loomis Sayles are also officers and/or Trustees of the Trusts.
Notes to Financial Statements – continued
September 30, 2020
f. Affiliated Ownership. As of September 30, 2020, Natixis and affiliates, Loomis Sayles Funded Pension Plan and Trust (“Pension Plan”) and Loomis Sayles Employees’ Profit Sharing Retirement Plan (“Retirement Plan”) held shares of the Funds representing the following percentages of the Funds’ net assets:
| | | | | | | | | | | | | | | | |
Fund | | Natixis | | | Pension
Plan | | | Retirement
Plan | | | Total
Affiliated
Ownership | |
Small Cap Growth Fund | | | — | | | | 0.13% | | | | 1.14% | | | | 1.27% | |
Small Cap Value Fund | | | — | | | | 0.56% | | | | 4.46% | | | | 5.02% | |
Small/Mid Cap Growth Fund | | | Less than 1% | | | | — | | | | — | | | | Less than 1% | |
Investment activities of affiliated shareholders could have material impacts on the Funds.
g. Reimbursement of Transfer Agent Fees and Expenses. Natixis Advisors has given a binding contractual undertaking to Small/Mid Cap Growth Fund to reimburse any and all transfer agency expenses for the Fund’s Class N shares. This undertaking is in effect through January 31, 2021 and is not subject to recovery under the expense limitation agreement described above.
For the year ended September 30, 2020, Natixis Advisors reimbursed Small/Mid Cap Growth Fund $1,141 for transfer agency expenses related to Class N shares.
6. Class-Specific Transfer Agent Fees and Expenses. Transfer agent fees and expenses attributable to Institutional Class, Retail Class and Admin Class are allocated on a pro rata basis to each class based on the relative net assets of each class to the total net assets of those classes. Transfer agent fees and expenses attributable to Class N are allocated to Class N.
For the year ended September 30, 2020, the Funds incurred the following class-specific transfer agent fees and expenses (including sub-transfer agent fees, where applicable):
| | | | | | | | | | | | | | | | |
| | | Transfer Agent Fees and Expenses | |
Fund | | Institutional
Class | | | Retail
Class | | | Admin
Class | | | Class N | |
Small Cap Growth Fund | | $ | 1,134,392 | | | $ | 112,695 | | | $ | — | | | $ | 7,151 | |
Small Cap Value Fund | | | 360,825 | | | | 108,240 | | | | 10,222 | | | | 1,977 | |
Small/Mid Cap Growth Fund | | | 4,440 | | | | — | | | | — | | | | 1,141 | |
7. Line of Credit. Each Fund, together with certain other funds of Natixis Funds Trusts, Loomis Sayles Funds Trusts and Natixis ETF Trusts, entered into a $400,000,000 committed unsecured line of credit provided by State Street Bank. Any one Fund may borrow up to $350,000,000 under the line of credit agreement (as long as all borrowings by all Funds in the aggregate do not exceed the $400,000,000 limit at any time), subject to each Fund’s investment restrictions and its contractual obligations under the line of credit. Interest is charged to the Funds based upon the terms set forth in the agreement. In addition, a commitment fee of 0.15% per annum, payable at the end of each calendar
Notes to Financial Statements – continued
September 30, 2020
quarter, is accrued and apportioned among the participating funds based on their average daily unused portion of the line of credit. The Funds paid an arrangement fee, an upfront fee, and certain other legal fees in connection with the line of credit agreement, which are being amortized over a period of 364 days and are reflected in legal fees and/or miscellaneous expenses on the Statements of Operations. The unamortized balance is reflected as prepaid expenses on the Statements of Assets and Liabilities.
For the year ended September 30, 2020, none of the Funds had borrowings under this agreement.
8. Concentration of Ownership. From time to time, a Fund may have a concentration of one or more accounts constituting a significant percentage of shares outstanding. Investment activities by holders of such accounts could have material impacts on the Funds. As of September 30, 2020, based on management’s evaluation of the shareholder account base, the Funds had accounts representing controlling ownership of more than 5% of the Fund’s total outstanding shares. The number of such accounts, based on accounts that represent more than 5% of an individual class of shares, and the aggregate percentage of net assets represented by such holdings were as follows:
| | | | | | | | | | | | | | | | |
Fund | | Number of 5%
Non- Affiliated
Account Holders | | | Percentage
of Non-
Affiliated
Ownership | | | Percentage of
Affiliated
Ownership
(Note 5f) | | | Total
Percentage of
Ownership | |
Small Cap Value Fund | | | 2 | | | | 19.45% | | | | 5.02% | | | | 24.47% | |
Small/Mid Cap Growth Fund | | | 6 | | | | 78.17% | | | | — | | | | 78.17% | |
Omnibus shareholder accounts for which Natixis Advisors understands that the intermediary has discretion over the underlying shareholder accounts or investment models where a shareholder account may be invested for a non-discretionary customer are included in the table above. For other omnibus accounts, the Funds do not have information on the individual shareholder accounts underlying the omnibus accounts; therefore, there could be other 5% shareholders in addition to those disclosed in the table above.
9. Risk. Global markets have experienced periods of high volatility triggered by the ongoing public health emergency known as coronavirus (“Covid-19”). As the situation continues, the extent and duration of the impact that the Covid-19 outbreak may have on financial markets and the economy as a whole remains highly uncertain. If the effects of the Covid-19 outbreak on financial markets and the economy continue for an extended period of time, the Funds’ future financial and investment results may be adversely affected.
Notes to Financial Statements – continued
September 30, 2020
10. Capital Shares. Each Fund may issue an unlimited number of shares of beneficial interest, without par value. Transactions in capital shares were as follows:
| | | | | | | | | | | | | | | | |
| | | Small Cap Growth Fund | |
| | |
| | | Year Ended
September 30, 2020 | | | Year Ended
September 30, 2019 | |
| | | | |
| Institutional Class | | Shares | | | Amount | | | Shares | | | Amount | |
Issued from the sale of shares | | | 13,167,719 | | | $ | 318,448,815 | | | | 11,579,961 | | | $ | 308,840,843 | |
Issued in connection with the reinvestment of distributions | | | 2,907,753 | | | | 77,404,396 | | | | 3,229,384 | | | | 71,175,640 | |
Redeemed | | | (14,223,727 | ) | | | (360,653,006 | ) | | | (9,640,609 | ) | | | (255,383,227 | ) |
| | | | | | | | | | | | | | | | |
Net change | | | 1,851,745 | | | $ | 35,200,205 | | | | 5,168,736 | | | $ | 124,633,256 | |
| | | | | | | | | | | | | | | | |
|
| Retail Class | |
Issued from the sale of shares | | | 912,597 | | | $ | 20,495,084 | | | | 1,457,788 | | | $ | 35,354,241 | |
Issued in connection with the reinvestment of distributions | | | 379,550 | | | | 9,116,785 | | | | 580,575 | | | | 11,675,362 | |
Redeemed | | | (1,459,375 | ) | | | (33,506,278 | ) | | | (2,734,300 | ) | | | (66,088,287 | ) |
| | | | | | | | | | | | | | | | |
Net change | | | (167,228 | ) | | $ | (3,894,409 | ) | | | (695,937 | ) | | $ | (19,058,684 | ) |
| | | | | | | | | | | | | | | | |
|
| Class N | |
Issued from the sale of shares | | | 17,628,357 | | | $ | 452,596,699 | | | | 14,891,081 | | | $ | 407,213,957 | |
Issued in connection with the reinvestment of distributions | | | 2,249,879 | | | | 60,476,756 | | | | 2,040,644 | | | | 45,322,697 | |
Redeemed | | | (6,620,566 | ) | | | (169,949,416 | ) | | | (9,488,573 | ) | | | (252,762,328 | ) |
| | | | | | | | | | | | | | | | |
Net change | | | 13,257,670 | | | $ | 343,124,039 | | | | 7,443,152 | | | $ | 199,774,326 | |
| | | | | | | | | | | | | | | | |
Increase from capital share transactions | | | 14,942,187 | | | $ | 374,429,835 | | | | 11,915,951 | | | $ | 305,348,898 | |
| | | | | | | | | | | | | | | | |
Notes to Financial Statements – continued
September 30, 2020
10. Capital Shares – continued
| | | | | | | | | | | | | | | | |
| | | Small Cap Value Fund | |
| | |
| | | Year Ended
September 30, 2020 | | | Year Ended
September 30, 2019 | |
| | | | |
| Institutional Class | | Shares | | | Amount | | | Shares | | | Amount | |
Issued from the sale of shares | | | 3,070,880 | | | $ | 72,483,944 | | | | 1,885,997 | | | $ | 52,720,402 | |
Issued in connection with the reinvestment of distributions | | | 1,187,726 | | | | 33,101,927 | | | | 2,757,754 | | | | 64,641,757 | |
Redeemed | | | (6,171,314 | ) | | | (143,712,872 | ) | | | (6,172,550 | ) | | | (172,631,075 | ) |
| | | | | | | | | | | | | | | | |
Net change | | | (1,912,708 | ) | | $ | (38,127,001 | ) | | | (1,528,799 | ) | | $ | (55,268,916 | ) |
| | | | | | | | | | | | | | | | |
|
| Retail Class | |
Issued from the sale of shares | | | 209,646 | | | $ | 4,830,652 | | | | 248,433 | | | $ | 6,930,683 | |
Issued in connection with the reinvestment of distributions | | | 385,444 | | | | 10,541,881 | | | | 1,013,991 | | | | 23,352,213 | |
Redeemed | | | (1,576,219 | ) | | | (38,194,968 | ) | | | (2,489,201 | ) | | | (67,155,838 | ) |
| | | | | | | | | | | | | | | | |
Net change | | | (981,129 | ) | | $ | (22,822,435 | ) | | | (1,226,777 | ) | | $ | (36,872,942 | ) |
| | | | | | | | | | | | | | | | |
|
| Admin Class | |
Issued from the sale of shares | | | 89,240 | | | $ | 2,047,167 | | | | 164,641 | | | $ | 4,244,622 | |
Issued in connection with the reinvestment of distributions | | | 33,393 | | | | 863,879 | | | | 103,280 | | | | 2,261,822 | |
Redeemed | | | (252,153 | ) | | | (5,146,329 | ) | | | (505,156 | ) | | | (12,991,234 | ) |
| | | | | | | | | | | �� | | | | | |
Net change | | | (129,520 | ) | | $ | (2,235,283 | ) | | | (237,235 | ) | | $ | (6,484,790 | ) |
| | | | | | | | | | | | | | | | |
|
| Class N | |
Issued from the sale of shares | | | 606,779 | | | $ | 14,233,156 | | | | 1,949,203 | | | $ | 53,692,224 | |
Issued in connection with the reinvestment of distributions | | | 396,172 | | | | 11,045,289 | | | | 779,733 | | | | 18,276,952 | |
Redeemed | | | (1,794,608 | ) | | | (44,897,333 | ) | | | (2,136,634 | ) | | | (60,278,030 | ) |
| | | | | | | | | | | | | | | | |
Net change | | | (791,657 | ) | | $ | (19,618,888 | ) | | | 592,302 | | | $ | 11,691,146 | |
| | | | | | | | | | | | | | | | |
Decrease from capital share transactions | | | (3,815,014 | ) | | $ | (82,803,607 | ) | | | (2,400,509 | ) | | $ | (86,935,502 | ) |
| | | | | | | | | | | | | | | | |
Notes to Financial Statements – continued
September 30, 2020
10. Capital Shares – continued
| | | | | | | | | | | | | | | | |
| | | Small/Mid Cap Growth Fund | |
| | |
| | | Year Ended
September 30, 2020 | | | Year Ended
September 30, 2019 | |
| | | | |
| Institutional Class | | Shares | | | Amount | | | Shares | | | Amount | |
Issued from the sale of shares | | | 2,299,458 | | | $ | 24,306,399 | | | | 2,433,625 | | | $ | 23,898,389 | |
Issued in connection with the reinvestment of distributions | | | 74,958 | | | | 787,810 | | | | 540,127 | | | | 4,234,598 | |
Redeemed | | | (844,906 | ) | | | (8,799,784 | ) | | | (681,600 | ) | | | (7,115,964 | ) |
Redeemed in-kind (Note 11) | | | (532,341 | ) | | | (5,600,230 | ) | | | — | | | | — | |
| | | | | | | | | | | | | | | | |
Net change | | | 997,169 | | | $ | 10,694,195 | | | | 2,292,152 | | | $ | 21,017,023 | |
| | | | | | | | | | | | | | | | |
|
| Class N(a) | |
Issued from the sale of shares | | | 101 | | | $ | 1,000 | | | | — | | | $ | — | |
Issued in connection with the reinvestment of distributions | | | 2 | | | | 24 | | | | — | | | | — | |
| | | | | | | | | | | | | | | | |
Net change | | | 103 | | | $ | 1,024 | | | | — | | | $ | — | |
| | | | | | | | | | | | | | | | |
Increase from capital share transactions | | | 997,272 | | | $ | 10,695,219 | | | | 2,292,152 | | | $ | 21,017,023 | |
| | | | | | | | | | | | | | | | |
(a) Class operations commenced on October 1, 2019.
11. Redemption In-Kind. In certain circumstances, a Fund may distribute portfolio securities rather than cash as payment for redemption of Fund shares (redemption in-kind). For financial reporting purposes, the Fund will recognize a gain on in-kind redemptions to the extent the value of the distributed securities on the date of redemption exceeds the cost of those securities; the Fund will recognize a loss if the cost exceeds value. Gains and losses realized on redemptions in-kind are not recognized for tax purposes, and are re-classified from realized gain (loss) to paid-in-capital. Small/Mid Cap Growth Fund realized a gain of $779,521 on redemptions in-kind during the year ended September 30, 2020. This amount is included in realized gain (loss) on the Statements of Operations.
Report of Independent Registered Public Accounting Firm
To the Board of Trustees of Loomis Sayles Funds I and Loomis Sayles Funds II and Shareholders of Loomis Sayles Small Cap Value Fund, Loomis Sayles Small Cap Growth Fund and Loomis Sayles Small/Mid Cap Growth Fund:
Opinions on the Financial Statements
We have audited the accompanying statements of assets and liabilities, including the portfolios of investments, of Loomis Sayles Small Cap Value Fund (one of the funds constituting Loomis Sayles Funds I), and Loomis Sayles Small Cap Growth Fund and Loomis Sayles Small/Mid Cap Growth Fund (two of the funds constituting Loomis Sayles Funds II) (hereafter collectively referred to as the “Funds”) as of September 30, 2020, the related statements of operations for the year ended September 30, 2020, the statements of changes in net assets for each of the two years in the period ended September 30, 2020, including the related notes, and the financial highlights for each of the periods indicated therein (collectively referred to as the “financial statements”). In our opinion, the financial statements present fairly, in all material respects, the financial position of each of the Funds as of September 30, 2020, the results of each of their operations for the year then ended, the changes in each of their net assets for each of the two years in the period ended September 30, 2020 and each of the financial highlights for each of the periods indicated therein in conformity with accounting principles generally accepted in the United States of America.
Basis for Opinions
These financial statements are the responsibility of the Funds’ management. Our responsibility is to express an opinion on the Funds’ financial statements based on our audits. We are a public accounting firm registered with the Public Company Accounting Oversight Board (United States) (PCAOB) and are required to be independent with respect to the Funds in accordance with the U.S. federal securities laws and the applicable rules and regulations of the Securities and Exchange Commission and the PCAOB.
We conducted our audits of these financial statements in accordance with the standards of the PCAOB. Those standards require that we plan and perform the audit to obtain reasonable assurance about whether the financial statements are free of material misstatement, whether due to error or fraud.
Our audits included performing procedures to assess the risks of material misstatement of the financial statements, whether due to error or fraud, and performing procedures that respond to those risks. Such procedures included examining, on a test basis, evidence regarding the amounts and disclosures in the financial statements. Our audits also included evaluating the accounting principles used and significant estimates made by management, as well as evaluating the overall presentation of the financial statements. Our procedures included confirmation of securities owned as of September 30, 2020 by correspondence with the custodian and brokers; when replies were not received from brokers, we performed other auditing procedures. We believe that our audits provide a reasonable basis for our opinions.
/s/ PricewaterhouseCoopers LLP
Boston, Massachusetts
November 20, 2020
We have served as the auditor of one or more investment companies in the Natixis Investment Company Complex since at least 1995. We have not determined the specific year we began serving as auditor.
2020 U.S. Tax Distribution Information to Shareholders (Unaudited)
Corporate Dividends Received Deduction. For the fiscal year ended September 30, 2020, a percentage of dividends distributed by the Fund listed below qualifies for the dividends received deduction for corporate shareholders. This percentage is as follows:
| | | | |
Fund | | Qualifying Percentage | |
Small Cap Value Fund | | | 100.00% | |
Capital Gains Distributions. Pursuant to Internal Revenue Section 852(b), the following Funds paid distributions, which have been designated as capital gains distributions for the fiscal year ended September 30, 2020, unless subsequently determined to be different.
| | | | |
Fund | | Amount | |
Small Cap Growth Fund | | $ | 150,841,195 | |
Small Cap Value Fund | | | 55,082,819 | |
Small/Mid Cap Growth Fund | | | 817,114 | |
Qualified Dividend Income. For the fiscal year ended September 30, 2020, the Fund below will designate up to the maximum amount allowable pursuant to the Internal Revenue Code as qualified dividend income eligible for reduced tax rates. These lower rates range from 0% to 20% depending on an individual’s tax bracket. If the Fund pays a distribution during calendar year 2020, complete information will be reported in conjunction with Form 1099-DIV.
Trustee and Officer Information
The tables below provide certain information regarding the trustees and officers of Loomis Sayles Funds I and Loomis Sayles Funds II (the “Trusts”). Unless otherwise indicated, the address of all persons below is 888 Boylston Street, Suite 800, Boston, MA 02199-8197. The Funds’ Statements of Additional Information include additional information about the trustees of the Trusts and are available by calling Loomis Sayles Funds at 800-633-3330.
| | | | | | | | |
| Name and Year of Birth | | Position(s) Held
with the Trusts,
Length of Time
Served and
Term of Office1 | | Principal
Occupation(s)
During Past 5 Years | | Number of
Portfolios in
Fund Complex
Overseen2 and
Other
Directorships Held
During Past 5 Years | | Experience,
Qualifications,
Attributes, Skills
for Board
Membership |
| | |
| INDEPENDENT TRUSTEES | | | | |
| | | | |
Kenneth A. Drucker
(1945) | | Chairperson of the Board of Trustees since January 2017 Trustee since 2008 Ex Officio member of Audit Committee, Contract Review Committee and Governance Committee | | Retired | | 54 None | | Significant experience on the Board and on the boards of other business organizations (including at investment companies); executive experience (including as treasurer of an aerospace, automotive, and metal manufacturing corporation) |
| | | | |
Edmond J. English
(1953) | | Trustee since 2013 Chairperson of Governance Committee and Audit Committee Member | | Executive Chairman of Bob’s Discount Furniture (retail) | | 54 Director, Burlington Stores, Inc. (retail) | | Significant experience on the Board and on the boards of other business organizations (including retail companies and a bank); executive experience (including at a retail company) |
| | | | |
Richard A. Goglia
(1951) | | Trustee since 2015 Contract Review Committee Member and Governance Committee Member | | Retired | | 54 Director of Triumph Group (aerospace industry) | | Significant experience on the Board and executive experience (including his role as vice president and treasurer of a defense company and experience at a financial services company) |
Trustee and Officer Information – continued
| | | | | | | | |
| Name and Year of Birth | | Position(s) Held
with the Trusts,
Length of Time
Served and
Term of Office1 | | Principal
Occupation(s)
During Past 5 Years | | Number of
Portfolios in
Fund Complex
Overseen2 and
Other
Directorships Held
During Past 5 Years | | Experience,
Qualifications,
Attributes, Skills
for Board
Membership |
| | |
| INDEPENDENT TRUSTEES – continued | | | | |
| | | | |
Wendell J. Knox
(1948) | | Trustee since 2009 Chairperson of Contract Review Committee | | Retired | | 54 Director of Abt Associates Inc. (research and consulting); Director, The Hanover Insurance Group (property and casualty insurance); formerly, Director, Eastern Bank (bank) | | Significant experience on the Board and on the boards of other business organizations (including at a bank and at a property and casualty insurance firm); executive experience (including roles as president and chief executive officer of a research and consulting company) |
| | | | |
Martin T. Meehan
(1956) | | Trustee since 2012 Audit Committee Member | | President, University of Massachusetts | | 54 None | | Significant experience on the Board and on the boards of other business organizations; experience as President of the University of Massachusetts; government experience (including as a member of the U.S. House of Representatives); academic experience |
| | | | |
Maureen B. Mitchell
(1951) | | Trustee since 2017 Contract Review Committee Member and Governance Committee Member | | Retired; formerly President, Global Sales and Marketing, GE Asset Management, Inc. (financial services) | | 54 Director, Sterling Bancorp (bank) | | Experience on the Board; financial services industry and executive experience (including role as president of global sales and marketing at a financial services company) |
Trustee and Officer Information – continued
| | | | | | | | |
| Name and Year of Birth | | Position(s) Held
with the Trusts,
Length of Time
Served and
Term of Office1 | | Principal
Occupation(s)
During Past 5 Years | | Number of
Portfolios in
Fund Complex
Overseen2 and
Other
Directorships Held
During Past 5 Years | | Experience,
Qualifications,
Attributes, Skills
for Board
Membership |
| | |
| INDEPENDENT TRUSTEES – continued | | | | |
| | | | |
James P. Palermo
(1955) | | Trustee since 2016 Contract Review Committee Member | | Founding Partner, Breton Capital Management, LLC (private equity); Partner, STEP Partners, LLC (private equity) | | 54 Director, FutureFuel.io (chemicals and biofuels) | | Experience on the Board; financial services industry and executive experience (including roles as chief executive officer of client management and asset servicing for a banking and financial services company) |
| | | | |
Erik R. Sirri
(1958) | | Trustee since 2009 Audit Committee Member | | Professor of Finance at Babson College | | 54 None | | Significant experience on the Board; experience as Director of the Division of Trading and Markets at the Securities and Exchange Commission; academic experience; training as an economist |
| | | | |
Peter J. Smail
(1952) | | Trustee since 2009 Audit Committee Member and Governance Committee Member | | Retired | | 54 None | | Significant experience on the Board; mutual fund industry and executive experience (including roles as president and chief executive officer for an investment adviser) |
| | | | |
Kirk A. Sykes
(1958) | | Trustee since 2019 Contract Review Committee Member | | Managing Director of Accordia Partners, LLC (real estate development); President of Primary Corporation (real estate development); Managing Principal of Merrick Capital Partners (infrastructure finance); formerly, President of Urban Strategy America Fund (real estate fund manager) | | 54 Trustee, Eastern Bank (bank); formerly Director, Ares Commercial Real Estate Corporation (real estate investment trust) | | Experience on the Board and significant experience on the boards of other business organizations (including real estate companies and banks) |
Trustee and Officer Information – continued
| | | | | | | | |
| Name and Year of Birth | | Position(s) Held
with the Trusts,
Length of Time
Served and
Term of Office1 | | Principal
Occupation(s)
During Past 5 Years | | Number of
Portfolios in
Fund Complex
Overseen2 and
Other
Directorships Held
During Past 5 Years | | Experience,
Qualifications,
Attributes, Skills
for Board
Membership |
| | |
| INDEPENDENT TRUSTEES – continued | | | | |
| | | | |
Cynthia L. Walker
(1956) | | Trustee since 2005 Chairperson of the Audit Committee and Governance Committee Member | | Deputy Dean for Finance and Administration, Yale University School of Medicine | | 54 None | | Significant experience on the Board; executive experience in a variety of academic organizations (including roles as dean for finance and administration) |
|
| INTERESTED TRUSTEES |
| | | | |
Kevin P. Charleston3 (1965) One Financial Center Boston, MA 02111 | | Trustee since 2015 President and Chief Executive Officer of Loomis Sayles Fund I since 2015 | | President, Chief Executive Officer and Chairman of the Board of Directors | | 54 None | | Significant experience on the Board; continuing service as President, Chief Executive Officer and Chairman of the Board of Directors of Loomis, Sayles & Company, L.P. |
| | | | |
David L. Giunta4
(1965) | | Trustee since 2011 President of Loomis Sayles Funds II and Executive Vice President of Loomis Sayles Funds I since 2008; Chief Executive Officer of Loomis Sayles Funds II since 2015 | | President and Chief Executive Officer, Natixis Advisors, L.P., Natixis Distribution, L.P., Natixis Distribution Corporation and Chairman of the Board of Natixis Distribution Corporation | | 54
None | | Significant experience on the Board; experience as President and Chief Executive Officer of Natixis Advisors, L.P., Natixis Distribution, L.P., Natixis Distribution Corporation and Chairman of the Board of Natixis Distribution Corporation |
| 1 | Each trustee serves until retirement, resignation or removal from the Board. The current retirement age is 75. The position of Chairperson of the Board is appointed for a three-year term. Mr. Drucker was appointed to serve an additional one year term as the Chairperson of the Board on June 12, 2019. |
| 2 | The trustees of the Trusts serve as trustees of a fund complex that includes all series of the Natixis Funds Trust I, Natixis Funds Trust II, Natixis Funds Trust IV, Gateway Trust, Loomis Sayles Funds I, Loomis Sayles Funds II, Natixis ETF Trust and Natixis ETF Trust II (collectively, the “Fund Complex”). |
| 3 | Mr. Charleston is deemed an “interested person” of the Trusts because he holds the following positions with an affiliated person of the Trusts: President, Chief Executive Officer and Chairman of the Board of Directors of Loomis, Sayles & Company, L.P. |
| 4 | Mr. Giunta is deemed an “interested person” of the Trusts because he holds the following positions with an affiliated person of the Trusts: President and Chief Executive Officer, Natixis Advisors, L.P., Natixis Distribution, L.P., Natixis Distribution Corporation and Chairman of the Board of Natixis Distribution Corporation. |
Trustee and Officer Information – continued
| | | | | | |
| Name and Year of Birth | | Position(s) Held
with the Trusts | | Term of Office1 and
Length of Time Served | | Principal Occupation(s)
During Past 5 Years2 |
|
| OFFICERS OF THE TRUSTS |
| | | |
Daniel J. Fuss
(1933)
One Financial Center Boston, MA 02111 | | Executive Vice President | | Since 2003 | | Vice Chairman and Director, Loomis, Sayles & Company, L.P. |
| | | |
Russell L. Kane
(1969) | | Secretary, Clerk and Chief Legal Officer Chief Compliance Officer and Anti-Money Laundering Officer | | Since 2016 Since 2020 | | Executive Vice President, General Counsel, Secretary and Clerk, Natixis Distribution Corporation, Natixis Advisors, L.P. and Natixis Distribution, L.P.; formerly, Senior Vice President, Deputy General Counsel, Assistant Secretary and Assistant Clerk, Natixis Distribution Corporation, Natixis Advisors, L.P. and Natixis Distribution, L.P. |
| | | |
Michael C. Kardok
(1959) | | Treasurer, Principal Financial and Accounting Officer | | Since 2004 | | Senior Vice President, Natixis Advisors, L.P. and Natixis Distribution, L.P. |
| 1 | Each officer of the Trusts serves for an indefinite term in accordance with the Trusts’ current by-laws until the date his or her successor is elected and qualified, or until he or she sooner dies, retires, is removed or becomes disqualified. |
| 2 | Each person listed above, except as noted, holds the same position(s) with the Fund Complex. Previous positions during the past five years with Natixis Distribution, L.P., Natixis Advisors, L.P. or Loomis, Sayles & Company, L.P. are omitted, if not materially different from an officer’s current position with such entity. |

Loomis Sayles Fixed Income Fund
Loomis Sayles Global Bond Fund
Loomis Sayles Inflation Protected Securities Fund
Loomis Sayles Institutional High Income Fund
Loomis Sayles Investment Grade Fixed Income Fund
Annual Report
September 30, 2020
IMPORTANT NOTICE TO SHAREHOLDERS
Beginning on January 1, 2021, as permitted by regulations adopted by the Securities and Exchange Commission, paper copies of shareholder reports like this one will no longer be sent by mail, unless you specifically request paper copies of the reports from the Fund or from your financial intermediary, such as a broker-dealer or bank. Instead, the reports will be made available on the Funds’ website, and you will be notified by mail each time a report is posted and provided with a website link to access the report. If you wish to continue receiving paper copies of your shareholder reports after January 1, 2021, you can inform the Fund at any time by calling 1-800-633-3330. If you hold your account with a financial intermediary and you wish to continue receiving paper copies after January 1, 2021, you should call your financial intermediary directly. Paper copies are provided free of charge, and your election to receive reports in paper will apply to all funds held with the Natixis Funds complex. If you have already elected to receive shareholder reports electronically, you will not be affected by this change and you need not take any action. You currently may elect to receive shareholder reports and other communications from the Fund or your financial intermediary electronically at www.icsdelivery.com/loomissayles.
LOOMIS SAYLES FIXED INCOME FUND
| | | | |
| Managers | | Symbol | | |
| | |
| Matthew J. Eagan, CFA® | | Institutional Class | | LSFIX |
| | |
| Daniel J. Fuss, CFA®, CIC | | | | |
| | |
| Brian P. Kennedy | | | | |
| | |
| Elaine M. Stokes | | | | |
Investment Objective
The Fund’s investment objective is high total investment return through a combination of current income and capital appreciation.
Market Conditions
The financial markets experienced significant volatility in the past year, as investors grappled with the uncertainty surrounding Covid-19. The bulk of the market disruptions occurred in February and March, when world governments first aimed to contain the virus by locking down broad swaths of their economies. Higher-risk assets were hit hard in the ensuing selloff, while demand for lower-risk investments surged. The US Federal Reserve (Fed) sought to counter the extraordinary developments by cutting the fed funds rate to zero and reinstituting quantitative easing through the purchases of Treasuries and mortgage-backed securities. It revived lending facilities last used in 2008, such as the TALF (Term Asset-Backed Securities Loan Facility), which is a funding backdrop for the asset-backed securities market. It even established facilities never used before, such as the Corporate Credit Facilities, which allowed the Fed to purchase corporate bond assets for the first time in its history. In conjunction with a $2.2 trillion stimulus package passed by the US Congress, the Fed’s response fueled an impressive recovery in higher-risk assets from late March onward.
The uncertain environment worked to the benefit of US Treasuries due to their status as a relative “safe haven.” Longer duration bonds delivered particularly robust gains. The yield on the 10-year note fell to an all-time low in March and remained close to that level thereafter on expectations that the Fed would pursue its low-rate policy indefinitely. (Prices and yields move in opposite directions.)
Investment grade corporates were notable beneficiaries of rising risk appetite and investors’ demand for high-quality alternatives to low-yielding government debt. Despite their downturn in the February-March selloff, corporates outperformed the broader fixed-income market for the full 12-month period.
High yield corporate bonds also delivered positive returns. The category was supported by hopes for an economic recovery, reduced investor risk aversion and accommodative fiscal and monetary policy. However, high yield issues trailed investment-grade securities. Lower-quality debt was generally harder hit in the downturn due to lower market liquidity and the effect of falling oil prices, which weighed on the asset class’s return for the full period.
Securitized assets — including mortgage-backed securities, asset-backed securities and commercial mortgage-backed securities — lagged Treasuries and investment grade corporates, but they nonetheless posted a solid total return thanks to their rally in the second half of the period.
Emerging market bonds also gained ground despite the slowdown in global growth. The asset class was boosted by the combination of investors’ thirst for yield and the pronounced weakness in the US dollar from April through August.
Performance Results
For the 12 months ended September 30, 2020, Institutional Class shares of the Loomis Sayles Fixed Income Fund returned 1.78% at net asset value. The Fund underperformed its benchmark, the Bloomberg Barclays U.S. Government/Credit Bond Index, which returned 8.03%.
Explanation of Fund Performance
The past year has been defined by the widespread impact of the Covid-19 global pandemic. After an extremely turbulent first quarter of 2020, markets snapped back amidst unprecedented central bank actions, lifting of lockdowns and promising news of a potential vaccine. The majority of the Fund’s underperformance was generated in the first quarter of 2020. Performance has since improved as markets rebounded, though not enough to offset the earlier experienced losses. Security selection was the primary source of underperformance. Additionally, the Fund’s shorter-than-benchmark positioning with respect to duration (and corresponding interest rate sensitivity) weighed on return as interest rates declined during the period. High yield and investment grade corporate credit were among the larger detractors from relative performance, driven by holdings in the energy and transportation sectors. Exposure to consumer cyclicals within investment grade corporate credit weighed on return as well. An allocation to equities, particularly in communications and consumer cyclical names, was a laggard. An allocation to non-US-dollar-denominated issues weighed on return, with holdings in the Mexican peso, Canadian dollar and Brazilian real as the main detractors. Additionally, an underweight to US Treasuries and holdings in defensive, reserve-like positions constrained performance.
The Fund’s underweight exposure to emerging market credit was a modest contributor to relative performance for the period.
1 |
Outlook
At this time of writing, which is the end of September 2020, economic and financial market conditions have continued to show encouraging signs of improvement, though the outlook remains uncertain. The Federal Reserve has provided forward guidance that helps ensure monetary policy can remain accommodative for the foreseeable future, which appears to be boosting business and consumer confidence and keeping investor risk appetite strong going into the final quarter of the year. We also believe it is still possible for a limited agreement to be reached that extends the fiscal stimulus package and provides further support to the economy, though ongoing debate by lawmakers on the size and scale of the package has been causing increased anxiety among investors as we get closer to the US election. We continue to assess the immediate and longer-term impacts of the pandemic on the economy, but currently expect a slow and uneven pace of recovery.
The global economy has been showing signs of improvement, with stronger levels of manufacturing and services purchasing manager data in the third quarter of 2020. This trend could continue should our forecasts be accurate for profit growth, gains in employment and a better managed second wave of the virus. We do believe that the economy can normalize with a successful distribution of a vaccine early next year, though a full recovery in GDP growth is not expected in the near term.
We increased our credit exposure during the dislocation in the credit markets earlier this year. We have maintained our allocation to credit with the view that we have entered the credit repair phase of the credit cycle1, exiting from the downturn/recessionary phase. This phase of the cycle is typically characterized by balance sheet improvement, better liquidity conditions and tightening spread levels. We believe this phase could potentially provide attractive returns for fixed income investors.
Valuations in the corporate bond sectors have been less compelling following the strong credit rally that has unfolded since the end of March. However, we believe the low global interest rate environment will likely continue to drive the search for yield and help provide a positive technical backdrop for both investment grade and high yield corporate debt. Also, we have been active and selective in new issues throughout the year, and will continue to look for opportunities in the primary market. The effects of the pandemic have created a need for many companies, across industries, to access capital for liquidity purposes and to potentially refinance debt, a credit positive. New issues generally come at a premium (higher yield than the existing debt of the issuer) to attract investors. Harvesting this new issue “premium” can potentially be an attractive and persistent source of excess return. Recently, there have been modest signs of slowing issuance, given market concerns and some risk aversion. New issuance can provide added liquidity and the ability to extend maturities. However, it can also increase the overall debt level of an issuer. While economic conditions have been improving, the recovery has been uneven and varies by sector. We are still monitoring the potential for fallen angels with expectations for more to possibly occur in specific areas, including consumer cyclical, lodging & leisure, retailers and restaurants. We think default rate risk and fallen angel activity will likely be more moderate than what was experienced in the spring of this year, and there is opportunity to add value in the credit sectors with good security selection.
As we approach the end of 2020, we believe our portfolios are well-positioned to generate excess return potential. We have remained focused on areas where investors are mispricing risk while following our disciplined, value-oriented approach to portfolio construction, a process rooted in fundamental credit analysis and a long-term view of the market.
| 1 | | A credit cycle is a cyclical pattern that follows credit availability and corporate health. |
Hypothetical Growth of $3,000,000 Investment in Institutional Class Shares
September 30, 2010 through September 30, 20202
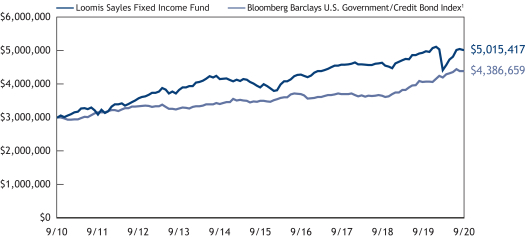
See notes to charts on page 3.
| 2
LOOMIS SAYLES FIXED INCOME FUND
Average Annual Total Returns — September 30, 20202
| | | | | | | | | | | | | | | | | | | | |
| | | | | |
| | | | | | | | | | | | Expense Ratios3 | |
| | | 1 year | | | 5 years | | | 10 years | | | Gross | | | Net | |
| | | | | | |
| Institutional Class (Inception 1/17/95) | | | 1.78 | % | | | 5.18 | % | | | 5.27 | % | | | 0.57 | % | | | 0.57 | % |
| | | | | | |
| Comparative Performance | | | | | | | | | | | | | | | | | | | | |
| Bloomberg Barclays U.S. Government/Credit Bond Index1 | | | 8.03 | | | | 4.66 | | | | 3.87 | | | | | | | | | |
Performance data shown represents past performance and is no guarantee of, and not necessarily indicative of, future results. Total return and value will vary, and you may have a gain or loss when shares are sold. Current performance may be lower or higher than quoted. For most recent month-end performance, visit loomissayles.com. Performance for other share classes will be greater or less than shown based on differences in fees and sales charges. You may not invest directly in an index. Performance for periods less than one year is cumulative, not annualized. Returns reflect changes in share price and reinvestment of dividends and capital gains, if any. The table(s) do not reflect taxes shareholders might owe on any fund distributions or when they redeem their shares.
| 1 | | The Bloomberg Barclays U.S. Government/Credit Bond Index is the non-securitized component of the U.S. Aggregate Index and was the first macro index launched by Barclays Capital. The U.S. Government/Credit Bond Index includes investment grade, U.S. dollar-denominated, fixed-rate Treasuries (i.e., public obligations of the U.S. Treasury that have remaining maturities of more than one year), government-related issues (i.e., agency, sovereign, supranational, and local authority debt), and corporate securities. The U.S. Government/Credit Index was launched on January 1, 1979, with index history backfilled to 1973, and is a subset of the Bloomberg Barclays U.S. Aggregate Index. |
| 2 | | Fund performance has been increased by fee waivers and/or expense reimbursements, if any, without which performance would have been lower. |
| 3 | | Expense ratios are as shown in the Fund’s prospectus in effect as of the date of this report. The expense ratios for the current reporting period can be found in the Financial Highlights section of this report under Ratios to Average Net Assets. Net expenses reflect contractual expense limitations set to expire on 1/31/21. When a Fund’s expenses are below the limitation, gross and net expense ratios will be the same. See Note 6 of the Notes to Financial Statements for more information about the Fund’s expense limitations. |
3 |
LOOMIS SAYLES GLOBAL BOND FUND
| | | | |
| Managers | | Symbols | | |
| | |
| David W. Rolley, CFA® | | Institutional Class | | LSGBX |
| | |
| Lynda L. Schweitzer, CFA® | | Retail Class | | LSGLX |
| | |
| Scott M. Service, CFA® | | Class N | | LSGNX |
Investment Objective
The Fund’s investment objective is high total investment return through a combination of high current income and capital appreciation.
Market Conditions
The Covid-19 pandemic resulted in a swift and dramatic increase in realized volatility for yields, currencies, and equities and the market continues to probe for potential troughs. As the number of confirmed cases in the United States, Germany, and Italy soared in February, position liquidation, the worldwide scramble for US dollars, and exceptional volatility increasingly drove price action and hampered currency and sovereign bond market liquidity.
The pronounced deterioration in risk sentiment resulted in the rapid and significant widening of credit spreads. The option-adjusted spread for the Bloomberg Barclays Global Aggregate Bond Index soared from 98 basis points at year-end 2019 to a high of 326 basis points in mid-March. Essentially, all sectors were affected by the market re-pricing. The leisure, lodging, transportation and energy sectors were particularly hard hit as increased fears of the virus’s spread resulted in postponements or outright cancellations of personal and business travel.
Global central banks announced coordinated monetary easing led by the US Federal Reserve (the “Fed”), which cut rates by 150 basis points at two emergency policy meetings in March. We are pleased to see that policymakers worldwide are taking action and have planted many seeds to help restore confidence. The first phase of doing so is removing uncertainty and worst-case scenarios for key industries, small businesses, and households.
Economies across the globe started to slowly return to work, and the resumption of everyday activities helped lead to moderate declines in applications for jobless benefits, a pickup in restaurant bookings, and greater consumer confidence. Governments passed massive fiscal stimulus packages designed to help tackle the economic damage inflicted by the Covid-19 pandemic. In the US, lawmakers approved the $2.2 trillion CARES Act stimulus program to help the economy recover while the European Commission announced an unprecedented €750 billion economic stimulus plan to tackle the worst recession to hit the continent since after World War II.
Performance Results
For the 12 months ended September 30, 2020, Institutional Class shares of the Loomis Sayles Global Bond Fund returned 8.57% at net asset value. The Fund outperformed its benchmark, the Bloomberg Barclays Global Aggregate Bond Index, which returned 6.24%.
Explanation of Fund Performance
The Fund’s bottom-up derived overweight to the communications industry helped drive outperformance as it significantly outpaced the broader investment grade corporate market. The industry benefited from robust consumer demand for internet connectivity and mobile data. In addition, security selection within the banking sector had a positive impact on performance. Our favored European and US banks were among the top credit picks as their large size, excellent liquidity, broad geographic footprints and diverse business portfolios helped drive results amid a challenging economic environment.
The Fund’s positioning with respect to duration and corresponding interest rate sensitivity proved advantageous, as did positioning along the yield curve (which depicts the relationship among bond yields across the maturity spectrum). In particular, the allocation to interest rates in select local currency emerging markets such as Mexico, South Africa, Indonesia and Brazil added value. Attractive real yields combined with benign inflation pressures in these markets helped deliver outperformance as investors searched for higher yielding alternatives to developed market government bonds.
On the downside, the Fund’s currency allocation dampened results. In particular, an overweight to the Brazilian real weighed on return as it underperformed most Latin American currency peers, in part due to Brazil’s much higher Covid-19 caseload. In addition, the historic rout in crude oil prices was a disadvantage for Brazil given its position as a major oil producer.
The Fund’s risk-adjusted overweight to the transportation sector detracted from performance as it was among the worst performing credit sectors. In particular, the airline industry was severely impacted as domestic and international travel restrictions resulted in major revenue losses for some of the world’s leading carriers.
Currency and yield curve markets experienced slightly higher levels of volatility in the period and this resulted in derivatives driving a higher than typical level of total return. Although in line with the returns posted by the underlying cash bond markets, the fund’s use of forward and duration positions in managing relative exposures increased the derivative contributions to total return.
Finally, an allocation to inflation-indexed treasuries was a drag on relative performance as they underperformed nominal treasuries given the weakened inflation outlook.
| 4
LOOMIS SAYLES GLOBAL BOND FUND
Outlook
We believe the worst of the economic decline is over. Activity may be starting to decelerate in some regions, but purchasing manager index readings remain in expansionary territory (i.e. above 50) in most major countries. Although a second wave of the outbreak is expected as we move into the fall, it will certainly be less of a surprise and countries should be in a much better position to handle it effectively without having to implement another round of lockdowns.
We see opportunity for credit spreads to continue to tighten, albeit at a more gradual pace than we saw in the second quarter of 2020. Corporate credit offers an attractive yield advantage, and our base case is that we are in the repair phase of the credit cycle. The credit repair phase is typically characterized by companies fortifying their balance sheets, reducing leverage and cutting costs. Despite the weakening fundamental picture, corporate credit remains supported by a strong technical backdrop headlined by committed central bank support.
The probability of a multi-year weak dollar regime is rising as we head through the credit repair phase of the cycle. We expect that the US output gap will remain large for another year, reinforcing the Fed’s commitment to keeping rates lower for longer. In addition, European macroeconomic indicators may normalize more quickly, which would increase the probability of a more sustained period of dollar weakness.
Hypothetical Growth of $100,000 Investment in Institutional Class Shares
September 30, 2010 through September 30, 20202
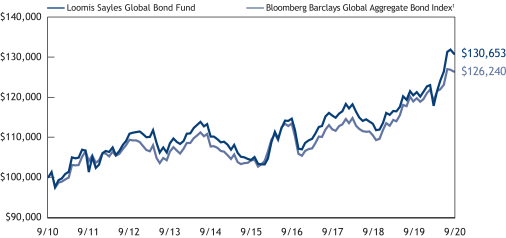
Average Annual Total Returns — September 30, 20202
| | | | | | | | | | | | | | | | | | | | | | | | |
| | | | | | | | | | | | Life of | | | Expense Ratios3 | |
| | | 1 year | | | 5 years | | | 10 years | | | Class N | | | Gross | | | Net | |
| | | | | | | |
| Institutional Class (Inception 5/10/91) | | | 8.57 | % | | | 4.61 | % | | | 2.71 | % | | | — | % | | | 0.76 | % | | | 0.70 | % |
| | | | | | | |
| Retail Class (Inception 12/31/96) | | | 8.32 | | | | 4.35 | | | | 2.45 | | | | — | | | | 1.01 | | | | 0.95 | |
| | | | | | | |
| Class N (Inception 2/1/13) | | | 8.66 | | | | 4.69 | | | | — | | | | 2.28 | | | | 0.66 | | | | 0.65 | |
| | | | | | | |
| Comparative Performance | | | | | | | | | | | | | | | | | | | | | | | | |
| Bloomberg Barclays Global Aggregate Bond Index1 | | | 6.24 | | | | 3.92 | | | | 2.36 | | | | 2.10 | | | | | | | | | |
Performance data shown represents past performance and is no guarantee of, and not necessarily indicative of, future results. Total return and value will vary, and you may have a gain or loss when shares are sold. Current performance may be lower or higher than quoted. For most recent month-end performance, visit loomissayles.com. Performance for other share classes will be greater or less than shown based on differences in fees and sales charges. You may not invest directly in an index. Performance for periods less than one year is cumulative, not annualized. Returns reflect changes in share price and reinvestment of dividends and capital gains, if any. The table(s) do not reflect taxes shareholders might owe on any fund distributions or when they redeem their shares.
| 1 | | Bloomberg Barclays Global Aggregate Bond Index provides a broad-based measure of the global investment-grade fixed income markets. The four major components of this index are the U.S. Aggregate, the Pan-European Aggregate, the Asian-Pacific Aggregate, and the Canadian Aggregate Indices. The Index also includes Eurodollar and Euro-Yen corporate bonds, Canadian government, agency and corporate securities, and USD investment grade 144A securities. |
| 2 | | Fund performance has been increased by fee waivers and/or expense reimbursements, if any, without which performance would have been lower. |
| 3 | | Expense ratios are as shown in the Fund’s prospectus in effect as of the date of this report. The expense ratios for the current reporting period can be found in the Financial Highlights section of this report under Ratios to Average Net Assets. Net expenses reflect contractual expense limitations set to expire on 1/31/21. When a Fund’s expenses are below the limitation, gross and net expense ratios will be the same. See Note 6 of the Notes to Financial Statements for more information about the Fund’s expense limitations. |
5 |
LOOMIS SAYLES INFLATION PROTECTED SECURITIES FUND
| | | | |
| Managers | | Symbols | | |
| | |
| Elaine Kan, CFA® | | Institutional Class | | LSGSX |
| | |
| Kevin P. Kearns | | Retail Class | | LIPRX |
| | |
| | Class N | | LIPNX |
Investment Objective
The Fund’s investment objective is high total investment return through a combination of current income and capital appreciation.
Market Conditions
The financial markets experienced significant volatility in the past year, as investors grappled with the uncertainty surrounding Covid-19. The bulk of the market disruptions occurred in February and March, when world governments first aimed to contain the virus by locking down broad swaths of their economies. Higher-risk assets were hit hard in the ensuing selloff, while demand for lower-risk investments surged. The US Federal Reserve (Fed) sought to counter the extraordinary developments by cutting the fed funds rate to zero and reinstituting quantitative easing through the purchases of US Treasuries and mortgage-backed securities. It revived lending facilities last used in 2008, such as the Term Asset-Backed Securities Loan Facility, which is a funding backdrop for the asset-backed securities market. It even established facilities never used before, such as the Corporate Credit Facilities which allowed the Fed to purchase corporate bond assets for the first time in its history. In conjunction with a $2.2 trillion stimulus package passed by the US Congress, the Fed’s response fueled an impressive recovery in higher-risk assets from late March onward.
The uncertain environment worked to the benefit of US Treasuries due to their status as a relative “safe haven.” Longer duration bonds delivered particularly robust gains. The yield on the 10-year note fell to an all-time low in March and remained close to that level thereafter on expectations that the Fed would pursue its low-rate policy indefinitely (prices and yields move in opposite directions).
Investment-grade corporates were notable beneficiaries of rising risk appetite and investors’ demand for high-quality alternatives to low-yielding government debt. Despite their downturn in the February-March selloff, corporates outperformed the broader fixed-income market for the full, 12-month period.
Performance Results
For the 12 months ended September 30, 2020, Institutional Class shares of the Loomis Sayles Inflation Protected Securities Fund returned 12.20% at net asset value. The Fund outperformed its benchmark, the Bloomberg Barclays U.S. Treasury Inflation Protected Securities (TIPS) Index, which returned 10.08%.
Explanation of Fund Performance
Positioning with respect to the Fund’s core US TIPS allocation boosted performance over the period. An overweight stance with respect to duration (and corresponding interest rate sensitivity) between the Fund’s exposures to corporate credit and TIPS contributed positively as Treasury yields fell over the period. Finally, an out-of-benchmark allocation to investment grade corporate credit positively impacted performance, aided by strong security selection within the sector.
On the downside, an underweight duration stance within the TIPS allocation weighed on return over the period, although this was more than offset by the overweight to duration within the allocations to corporate credit. Within the corporate allocation, exposure to financials detracted from relative performance.
Outlook
While economic and financial market conditions have continued to show encouraging signs of improvement, the outlook remains uncertain. The Fed has provided forward guidance that helps ensure monetary policy can remain accommodative for the foreseeable future, which appears to be boosting business and consumer confidence and keeping investor risk appetite strong going into the final quarter of the year. We also believe it is still possible for a limited agreement to be reached that extends the fiscal stimulus package and provides further support to the economy, though ongoing debate by lawmakers on the size and scale of the package has been causing increased anxiety among investors as we get closer to the US election. We continue to assess the immediate and longer-term impacts of the pandemic on the economy, but currently expect a slow and uneven pace of recovery.
The global economy has been showing signs of improvement, with stronger levels of manufacturing and services purchasing manager data, quarter to date. This trend could continue should our forecasts be accurate for profit growth, gains in employment and a better managed second wave of the virus. We do believe that the economy can normalize with a successful distribution of a vaccine early next year, though a full recovery in GDP growth is not expected in the near term.
| 6
LOOMIS SAYLES INFLATION PROTECTED SECURITIES FUND
As we approach the final quarter of 2020, we believe the Fund is well-positioned to generate excess return potential. We have remained focused on areas where investors are mispricing risk while following our disciplined, value-oriented approach to portfolio construction, a process rooted in fundamental credit analysis and a long-term view of the market.
Hypothetical Growth of $100,000 Investment in Institutional Class Shares
September 30, 2010 through September 30, 20202
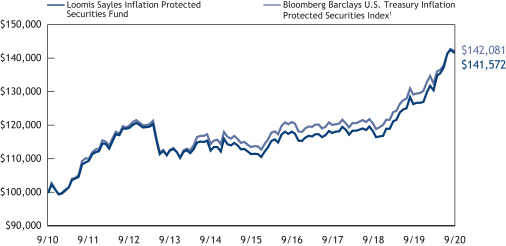
Average Annual Total Returns — September 30, 20202
| | | | | | | | | | | | | | | | | | | | | | | | |
| | | | | | | | | | | | Life of | | | Expense Ratios3 | |
| | | 1 year | | | 5 years | | | 10 years | | | Class N | | | Gross | | | Net | |
| | | | | | | |
| Institutional Class (Inception 5/20/91) | | | 12.20 | % | | | 4.92 | % | | | 3.54 | % | | | — | % | | | 0.96 | % | | | 0.40 | % |
| | | | | | | |
| Retail Class (Inception 5/28/10) | | | 12.09 | | | | 4.63 | | | | 3.27 | | | | — | | | | 1.21 | | | | 0.65 | |
| | | | | | | |
| Class N (Inception 2/1/17) | | | 12.33 | | | | — | | | | — | | | | 5.65 | | | | 0.91 | | | | 0.35 | |
| | | | | | | |
| Comparative Performance | | | | | | | | | | | | | | | | | | | | | | | | |
| Bloomberg Barclays U.S. Treasury Inflation Protected Securities Index1 | | | 10.08 | | | | 4.61 | | | | 3.57 | | | | 4.98 | | | | | | | | | |
Performance data shown represents past performance and is no guarantee of, and not necessarily indicative of, future results. Total return and value will vary, and you may have a gain or loss when shares are sold. Current performance may be lower or higher than quoted. For most recent month-end performance, visit loomissayles.com. Performance for other share classes will be greater or less than shown based on differences in fees and sales charges. You may not invest directly in an index. Performance for periods less than one year is cumulative, not annualized. Returns reflect changes in share price and reinvestment of dividends and capital gains, if any. The table(s) do not reflect taxes shareholders might owe on any fund distributions or when they redeem their shares.
| 1 | | Bloomberg Barclays U.S. Treasury Inflation Protected Securities Index is an unmanaged index that tracks inflation protected securities issued by the U.S. Treasury. On March 1, 1997, Barclays launched the Barclays U.S. Treasury Inflation-Protected Securities (TIPS) Index (Series-L), a rules-based, market value-weighted index that tracks inflation-protected securities issued by the U.S. Treasury. |
| 2 | | Fund performance has been increased by fee waivers and/or expense reimbursements, if any, without which performance would have been lower. |
| 3 | | Expense ratios are as shown in the Fund’s prospectus in effect as of the date of this report. The expense ratios for the current reporting period can be found in the Financial Highlights section of this report under Ratios to Average Net Assets. Net expenses reflect contractual expense limitations set to expire on 1/31/21. When a Fund’s expenses are below the limitation, gross and net expense ratios will be the same. See Note 6 of the Notes to Financial Statements for more information about the Fund’s expense limitations. |
7 |
LOOMIS SAYLES INSTITUTIONAL HIGH INCOME FUND
| | | | |
| Managers | | Symbol | | |
| | |
| Matthew J. Eagan, CFA® | | Institutional Class | | LSHIX |
| | |
| Daniel J. Fuss, CFA®, CIC | | | | |
| | |
| Elaine M. Stokes | | | | |
Investment Objective
The Fund’s investment objective is high total investment return through a combination of current income and capital appreciation.
Market Conditions
The financial markets experienced significant volatility in the past year, as investors grappled with the uncertainty surrounding Covid-19. The bulk of the market disruptions occurred in February and March, when world governments first aimed to contain the virus by locking down broad swaths of their economies. Higher-risk assets were hit hard in the ensuing selloff, while demand for lower-risk investments surged. The US Federal Reserve (Fed) sought to counter the extraordinary developments by cutting the fed funds rate to zero and reinstituting quantitative easing through the purchases of Treasuries and mortgage-backed securities. It revived lending facilities last used in 2008, such as the TALF (Term Asset-Backed Securities Loan Facility), which is a funding backdrop for the asset-backed securities market. It even established facilities never used before, such as the Corporate Credit Facilities, which allowed the Fed to purchase corporate bond assets for the first time in its history. In conjunction with a $2.2 trillion stimulus package passed by the US Congress, the Fed’s response fueled an impressive recovery in higher-risk assets from late March onward.
The uncertain environment worked to the benefit of US Treasuries due to their status as a relative “safe haven.” Longer duration bonds delivered particularly robust gains. The yield on the 10-year note fell to an all-time low in March and remained close to that level thereafter on expectations that the Fed would pursue its low-rate policy indefinitely. (Prices and yields move in opposite directions.)
Investment grade corporates were notable beneficiaries of rising risk appetite and investors’ demand for high-quality alternatives to low-yielding government debt. Despite their downturn in the February-March selloff, corporates outperformed the broader fixed-income market for the full 12-month period.
High yield corporate bonds also delivered positive returns. The category was supported by hopes for an economic recovery, reduced investor risk aversion and accommodative fiscal and monetary policy. However, high yield issues trailed investment-grade securities. Lower-quality debt was generally harder hit in the downturn due to lower market liquidity and the effect of falling oil prices, which weighed on the asset class’s return for the full period.
Securitized assets — including mortgage-backed securities, asset-backed securities and commercial mortgage-backed securities — lagged Treasuries and investment grade corporates, but they nonetheless posted a solid total return thanks to their rally in the second half of the period.
Emerging market bonds also gained ground despite the slowdown in global growth. The asset class was boosted by the combination of investors’ thirst for yield and the pronounced weakness in the US dollar from April through August.
Performance Results
For the 12 months ended September 30, 2020, Institutional Class shares of the Loomis Sayles Institutional High Income Fund returned -0.96% at net asset value. The Fund underperformed its benchmark, the Bloomberg Barclays U.S. Corporate High Yield Bond Index, which returned 3.25%.
Explanation of Fund Performance
The past year has been defined by the widespread impact of the Covid-19 global pandemic. After an extremely turbulent first quarter of 2020, markets snapped back amidst unprecedented central bank actions, lifting of lockdowns and promising news of a potential vaccine. The majority of the Fund’s underperformance was generated in the first quarter of 2020. Performance has since improved as markets rebounded, though not enough to offset the earlier experienced losses. Security selection was the primary source of underperformance for the 12-month period. The Fund’s exposure to high yield corporate credit had the largest negative impact on relative performance, driven by holdings in the energy and communications sectors. An allocation to equities, particularly in communications and consumer cyclical names, lagged as well. Within investment grade credit, energy and transportation securities weighed on return.
Exposure to convertible securities aided relative performance, led by technology and communications issues. Additionally, holdings of defensive, reserve-like positions were positive for performance.
| 8
LOOMIS SAYLES INSTITUTIONAL HIGH INCOME FUND
Outlook
At this time of writing, which is the end of September 2020, economic and financial market conditions have continued to show encouraging signs of improvement, though the outlook remains uncertain. The Federal Reserve has provided forward guidance that helps ensure monetary policy can remain accommodative for the foreseeable future, which appears to be boosting business and consumer confidence and keeping investor risk appetite strong going into the final quarter of the year. We also believe it is still possible for a limited agreement to be reached that extends the fiscal stimulus package and provides further support to the economy, though ongoing debate by lawmakers on the size and scale of the package has been causing increased anxiety among investors as we get closer to the US election. We continue to assess the immediate and longer-term impacts of the pandemic on the economy, but currently expect a slow and uneven pace of recovery.
The global economy has been showing signs of improvement, with stronger levels of manufacturing and services purchasing manager data in the third quarter of 2020. This trend could continue should our forecasts be accurate for profit growth, gains in employment and a better managed second wave of the virus. We do believe that the economy can normalize with a successful distribution of a vaccine early next year, though a full recovery in GDP growth is not expected in the near term.
We increased our credit exposure during the dislocation in the credit markets earlier this year. We have maintained our allocation to credit with the view that we have entered the credit repair phase of the credit cycle1, exiting from the downturn/recessionary phase. This phase of the cycle is typically characterized by balance sheet improvement, better liquidity conditions and tightening spread levels. We believe this phase could potentially provide attractive returns for fixed income investors.
Valuations in the corporate bond sectors have been less compelling following the strong credit rally that has unfolded since the end of March. However, we believe the low global interest rate environment will likely continue to drive the search for yield and help provide a positive technical backdrop for both investment grade and high yield corporate debt. Also, we have been active and selective in new issues throughout the year, and will continue to look for opportunities in the primary market. The effects of the pandemic have created a need for many companies, across industries, to access capital for liquidity purposes and to potentially refinance debt, a credit positive. New issues generally come at a premium (higher yield than the existing debt of the issuer) to attract investors. Harvesting this new issue “premium” can potentially be an attractive and persistent source of excess return. Recently, there have been modest signs of slowing issuance, given market concerns and some risk aversion. New issuance can provide added liquidity and the ability to extend maturities. However, it can also increase the overall debt level of an issuer. While economic conditions have been improving, the recovery has been uneven and varies by sector. We are still monitoring the potential for fallen angels with expectations for more to possibly occur in specific areas, including consumer cyclical, lodging & leisure, retailers and restaurants. We think default rate risk and fallen angel activity will likely be more moderate than what was experienced in the spring of this year, and there is opportunity to add value in the credit sectors with good security selection.
As we approach the end of 2020, we believe our portfolios are well-positioned to generate excess return potential. We have remained focused on areas where investors are mispricing risk while following our disciplined, value-oriented approach to portfolio construction, a process rooted in fundamental credit analysis and a long-term view of the market.
| 1 | | A credit cycle is a cyclical pattern that follows credit availability and corporate health. |
Hypothetical Growth of $3,000,000 Investment in Institutional Class Shares
September 30, 2010 through September 30, 20202
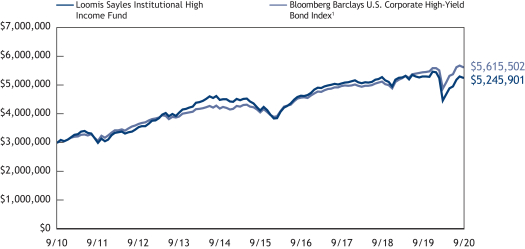
See notes to chart on page 10.
9 |
Average Annual Total Returns — September 30, 20202
| | | | | | | | | | | | | | | | | | | | |
| | | | | |
| | | | | | | | | | | | Expense Ratios3 | |
| | | 1 year4 | | | 5 years | | | 10 years | | | Gross | | | Net | |
| | | | | | |
| Institutional Class (Inception 6/5/96) | | | -0.96 | % | | | 5.00 | % | | | 5.75 | % | | | 0.68 | % | | | 0.68 | % |
| | | | | | |
| Comparative Performance | | | | | | | | | | | | | | | | | | | | |
| Bloomberg Barclays U.S. Corporate High-Yield Bond Index1 | | | 3.25 | | | | 6.79 | | | | 6.47 | | | | | | | | | |
Performance data shown represents past performance and is no guarantee of, and not necessarily indicative of, future results. Total return and value will vary, and you may have a gain or loss when shares are sold. Current performance may be lower or higher than quoted. For most recent month-end performance, visit loomissayles.com. Performance for other share classes will be greater or less than shown based on differences in fees and sales charges. You may not invest directly in an index. Performance for periods less than one year is cumulative, not annualized. Returns reflect changes in share price and reinvestment of dividends and capital gains, if any. The table(s) do not reflect taxes shareholders might owe on any fund distributions or when they redeem their shares.
| 1 | | Bloomberg Barclays U.S. Corporate High-Yield Bond Index measures the market of USD-denominated, non-investment grade, fixed-rate, taxable corporate bonds. Securities are classified as high yield if the middle rating of Moody’s, Fitch, and S&P is Ba1/BB+ /BB+ or below, excluding emerging market debt. Bloomberg Barclays U.S. Corporate High-Yield Bond Index was created in 1986, with history backfilled to July 1, 1983, and rolls up into the Bloomberg Barclays U.S. Universal and Global High-Yield Indices. |
| 2 | | Fund performance has been increased by fee waivers and/or expense reimbursements, if any, without which performance would have been lower. |
| 3 | | Expense ratios are as shown in the Fund’s prospectus in effect as of the date of this report. The expense ratios for the current reporting period can be found in the Financial Highlights section of this report under Ratios to Average Net Assets. Net expenses reflect contractual expense limitations set to expire on 1/31/21. When a Fund’s expenses are below the limitation, gross and net expense ratios will be the same. See Note 6 of the Notes to Financial Statements for more information about the Fund’s expense limitations. |
| 4 | | Generally accepted accounting principles require certain adjustments to be made to the net assets of the Fund for financial reporting purposes only, and as such, the total returns reflected above are different from the total returns reported in the financial highlights. The returns presented in the table above are what an investor would have actually experienced. |
| 10
LOOMIS SAYLES INVESTMENT GRADE FIXED INCOME FUND
| | | | |
| Managers | | Symbols | | |
| | |
| Matthew J. Eagan, CFA® | | Institutional Class | | LSIGX |
| | |
| Daniel J. Fuss, CFA®, CIC | | | | |
| | |
| Brian P. Kennedy | | | | |
| | |
| Elaine M. Stokes | | | | |
Investment Objective
The Fund’s investment objective is above-average total investment return through a combination of current income and capital appreciation.
Market Conditions
The financial markets experienced significant volatility in the past year, as investors grappled with the uncertainty surrounding Covid-19. The bulk of the market disruptions occurred in February and March, when world governments first aimed to contain the virus by locking down broad swaths of their economies. Higher-risk assets were hit hard in the ensuing selloff, while demand for lower-risk investments surged. The US Federal Reserve (Fed) sought to counter the extraordinary developments by cutting the fed funds rate to zero and reinstituting quantitative easing through the purchases of Treasuries and mortgage-backed securities. It revived lending facilities last used in 2008, such as the TALF (Term Asset-Backed Securities Loan Facility), which is a funding backdrop for the asset-backed securities market. It even established facilities never used before, such as the Corporate Credit Facilities, which allowed the Fed to purchase corporate bond assets for the first time in its history. In conjunction with a $2.2 trillion stimulus package passed by the US Congress, the Fed’s response fueled an impressive recovery in higher-risk assets from late March onward.
The uncertain environment worked to the benefit of US Treasuries due to their status as a relative “safe haven.” Longer duration bonds delivered particularly robust gains. The yield on the 10-year note fell to an all-time low in March and remained close to that level thereafter on expectations that the Fed would pursue its low-rate policy indefinitely. (Prices and yields move in opposite directions.)
Investment grade corporates were notable beneficiaries of rising risk appetite and investors’ demand for high-quality alternatives to low-yielding government debt. Despite their downturn in the February-March selloff, corporates outperformed the broader fixed-income market for the full 12-month period.
High yield corporate bonds also delivered positive returns. The category was supported by hopes for an economic recovery, reduced investor risk aversion and accommodative fiscal and monetary policy. However, high yield issues trailed investment-grade securities. Lower-quality debt was generally harder hit in the downturn due to lower market liquidity and the effect of falling oil prices, which weighed on the asset class’s return for the full period.
Securitized assets — including mortgage-backed securities, asset-backed securities and commercial mortgage-backed securities — lagged Treasuries and investment grade corporates, but they nonetheless posted a solid total return thanks to their rally in the second half of the period.
Emerging market bonds also gained ground despite the slowdown in global growth. The asset class was boosted by the combination of investors’ thirst for yield and the pronounced weakness in the US dollar from April through August.
Performance Results
For the 12 months ended September 30, 2020, Institutional Class shares of the Loomis Sayles Investment Grade Fixed Income Fund returned 4.53% at net asset value. The Fund underperformed its benchmark, the Bloomberg Barclays U.S. Government/Credit Bond Index, which returned 8.03%.
Explanation of Fund Performance
The past year has been defined by the widespread impact of the Covid-19 global pandemic. After an extremely turbulent first quarter of 2020, markets snapped back amidst unprecedented central bank actions, lifting of lockdowns and promising news of a potential vaccine. The majority of the Fund’s underperformance was generated in the first quarter of 2020. Performance has since improved as markets rebounded, though not enough to offset the earlier experienced losses. The Fund’s shorter-than-benchmark positioning with respect to duration (and corresponding interest rate risk) was the primary source of underperformance as interest rates declined during the period. An allocation to non-US-dollar-denominated issues weighed on return, with holdings in the Canadian dollar and Mexican peso as the main detractors. Within securitized markets, exposure to asset-backed securities hurt relative performance as this sector lagged corporate credit. Additionally, an underweight to US Treasuries and holdings in defensive, reserve-like positions constrained performance.
Positive contributions to relative performance were led by equities as a result of selected technology exposure. An underweight to emerging market credit had a modest positive impact on return as well.
11 |
Outlook
At this time of writing, which is the end of September 2020, economic and financial market conditions have continued to show encouraging signs of improvement, though the outlook remains uncertain. The Federal Reserve has provided forward guidance that helps ensure monetary policy can remain accommodative for the foreseeable future, which appears to be boosting business and consumer confidence and keeping investor risk appetite strong going into the final quarter of the year. We also believe it is still possible for a limited agreement to be reached that extends the fiscal stimulus package and provides further support to the economy, though ongoing debate by lawmakers on the size and scale of the package has been causing increased anxiety among investors as we get closer to the US election. We continue to assess the immediate and longer-term impacts of the pandemic on the economy, but currently expect a slow and uneven pace of recovery.
The global economy has been showing signs of improvement, with stronger levels of manufacturing and services purchasing manager data in the third quarter of 2020. This trend could continue should our forecasts be accurate for profit growth, gains in employment and a better managed second wave of the virus. We do believe that the economy can normalize with a successful distribution of a vaccine early next year, though a full recovery in GDP growth is not expected in the near term.
We increased our credit exposure during the dislocation in the credit markets earlier this year. We have maintained our allocation to credit with the view that we have entered the credit repair phase of the credit cycle1, exiting from the downturn/recessionary phase. This phase of the cycle is typically characterized by balance sheet improvement, better liquidity conditions and tightening spread levels. We believe this phase could potentially provide attractive returns for fixed income investors.
Valuations in the corporate bond sectors have been less compelling following the strong credit rally that has unfolded since the end of March. However, we believe the low global interest rate environment will likely continue to drive the search for yield and help provide a positive technical backdrop for both investment grade and high yield corporate debt. Also, we have been active and selective in new issues throughout the year, and will continue to look for opportunities in the primary market. The effects of the pandemic have created a need for many companies, across industries, to access capital for liquidity purposes and to potentially refinance debt, a credit positive. New issues generally come at a premium (higher yield than the existing debt of the issuer) to attract investors. Harvesting this new issue “premium” can potentially be an attractive and persistent source of excess return. Recently, there have been modest signs of slowing issuance, given market concerns and some risk aversion. New issuance can provide added liquidity and the ability to extend maturities. However, it can also increase the overall debt level of an issuer. While economic conditions have been improving, the recovery has been uneven and varies by sector. We are still monitoring the potential for fallen angels with expectations for more to possibly occur in specific areas, including consumer cyclical, lodging & leisure, retailers and restaurants. We think default rate risk and fallen angel activity will likely be more moderate than what was experienced in the spring of this year, and there is opportunity to add value in the credit sectors with good security selection.
As we approach the end of 2020, we believe our portfolios are well-positioned to generate excess return potential. We have remained focused on areas where investors are mispricing risk while following our disciplined, value-oriented approach to portfolio construction, a process rooted in fundamental credit analysis and a long-term view of the market.
During periods in which the US dollar appreciates relative to foreign currencies, Funds that hold non-US-dollar-denominated bonds may realize currency losses in connection with the maturity or sale of certain bonds. These realized losses will impact some or all of a Fund’s ordinary income distributions (to the extent that losses are not offset by realized currency gains within the Fund’s fiscal year). A recognized currency loss, in accordance with federal tax rules, decreases the amount of ordinary income a Fund has available to distribute, even though these bonds continue to generate coupon income.
Fund officers have analyzed the Fund’s current portfolio of investments, realized currency gains and losses, schedule of maturities, and the corresponding amounts of unrealized currency losses that may become realized during the current fiscal year. This analysis is performed regularly to determine how realized currency losses may impact periodic ordinary income distributions for the Fund. Based on the most recent quarterly analysis (as of September 30, 2020), Fund officers believe that realized currency losses will have an impact on some of the distributions in the 2021 fiscal year. This analysis is based on certain assumptions including, but not limited to, the level of foreign currency exchange rates, security prices, interest rates, the Fund adviser’s ability to manage realized currency losses, and the net asset level of the Fund. Changes to these assumptions could materially impact the analysis and the amounts of future Fund distributions. Fund officers will continue to monitor these amounts on a regular basis and take the necessary actions required to manage the Fund’s distributions to address realized currency losses while seeking to avoid a return of capital distribution.
| 1 | | A credit cycle is a cyclical pattern that follows credit availability and corporate health. |
| 12
LOOMIS SAYLES INVESTMENT GRADE FIXED INCOME FUND
Hypothetical Growth of $3,000,000 Investment in Institutional Class Shares
September 30, 2010 through September 30, 20202
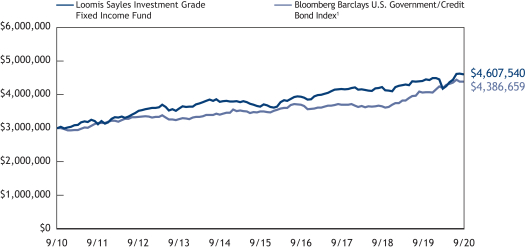
Average Annual Total Returns — September 30, 20202
| | | | | | | | | | | | | | | | | | | | |
| | | | | |
| | | | | | | | | | | | Expense Ratios3 | |
| | | 1 year | | | 5 years | | | 10 years | | | Gross | | | Net | |
| | | | | | |
| Institutional Class (Inception 7/1/94) | | | 4.53 | % | | | 4.83 | % | | | 4.38 | % | | | 0.50 | % | | | 0.50 | % |
| | | | | | |
| Comparative Performance | | | | | | | | | | | | | | | | | | | | |
| Bloomberg Barclays U.S. Government/Credit Bond Index1 | | | 8.03 | | | | 4.66 | | | | 3.87 | | | | | | | | | |
Performance data shown represents past performance and is no guarantee of, and not necessarily indicative of, future results. Total return and value will vary, and you may have a gain or loss when shares are sold. Current performance may be lower or higher than quoted. For most recent month-end performance, visit loomissayles.com. Performance for other share classes will be greater or less than shown based on differences in fees and sales charges. You may not invest directly in an index. Performance for periods less than one year is cumulative, not annualized. Returns reflect changes in share price and reinvestment of dividends and capital gains, if any. The table(s) do not reflect taxes shareholders might owe on any fund distributions or when they redeem their shares.
| 1 | | Bloomberg Barclays U.S. Government/Credit Bond Index is the non-securitized component of the U.S. Aggregate Index and was the first macro index launched by Barclays Capital. The U.S. Government/Credit Bond Index includes investment grade, U.S. dollar-denominated, fixed-rate Treasuries (i.e., public obligations of the U.S. Treasury that have remaining maturities of more than one year), government-related issues (i.e., agency, sovereign, supranational, and local authority debt), and corporate securities. The U.S. Government/Credit Index was launched on January 1, 1979, with index history backfilled to 1973, and is a subset of the Bloomberg Barclays U.S. Aggregate Index. |
| 2 | | Fund performance has been increased by fee waivers and/or expense reimbursements, if any, without which performance would have been lower. |
| 3 | | Expense ratios are as shown in the Fund’s prospectus in effect as of the date of this report. The expense ratios for the current reporting period can be found in the Financial Highlights section of this report under Ratios to Average Net Assets. Net expenses reflect contractual expense limitations set to expire on 1/31/21. When a Fund’s expenses are below the limitation, gross and net expense ratios will be the same. See Note 6 of the Notes to Financial Statements for more information about the Fund’s expense limitations. |
13 |
ADDITIONAL INFORMATION
The views expressed in this report reflect those of the portfolio managers as of the dates indicated. The managers’ views are subject to change at any time without notice based on changes in market or other conditions. References to specific securities or industries should not be regarded as investment advice. Because the Funds are actively managed, there is no assurance that they will continue to invest in the securities or industries mentioned.
All investing involves risk, including the risk of loss. There is no assurance that any investment will meet its performance objectives or that losses will be avoided.
Additional Index Information
This document may contain references to third party copyrights, indexes, and trademarks, each of which is the property of its respective owner. Such owner is not affiliated with Natixis Investment Managers or any of its related or affiliated companies (collectively “Natixis Affiliates”) and does not sponsor, endorse or participate in the provision of any Natixis Affiliates services, funds or other financial products.
The index information contained herein is derived from third parties and is provided on an “as is” basis. The user of this information assumes the entire risk of use of this information. Each of the third party entities involved in compiling, computing or creating index information disclaims all warranties (including, without limitation, any warranties of originality, accuracy, completeness, timeliness, non-infringement, merchantability and fitness for a particular purpose) with respect to such information.
Proxy Voting Information
A description of the Funds’ proxy voting policies and procedures is available without charge, upon request, by calling Loomis Sayles at 800-633-3330; on the Funds’ website at www.loomissayles.com, and on the Securities and Exchange Commission’s (“SEC”) website at www.sec.gov. Information about how the Funds voted proxies relating to portfolio securities during the most recent 12-month period ended June 30 is available on the Funds’ website and the SEC’s website.
Quarterly Portfolio Schedules
The Funds file complete schedules of portfolio holdings with the SEC for the first and third quarters of each fiscal year as an exhibit on Form N-PORT. The Funds’ Form N-PORT reports are available on the SEC’s website at www.sec.gov.
CFA® and Chartered Financial Analyst® are registered trademarks owned by the CFA Institute.
UNDERSTANDING YOUR FUND’S EXPENSES
As a mutual fund shareholder you incur two types of costs: (1) transaction costs, and (2) ongoing costs, including management fees, distribution fees (12b-1 fees), and other fund expenses. Certain exemptions may apply. These costs are described in more detail in each Fund’s prospectus. The following examples are intended to help you understand the ongoing costs of investing in the Funds and help you compare these with the ongoing costs of investing in other mutual funds.
The first line in the table for each class of Fund shares shows the actual amount of Fund expenses you would have paid on a $1,000 investment in the Fund from April 1, 2020 through September 30, 2020. To estimate the expenses you paid over the period, simply divide your account value by $1,000 (for example $8,600 account value divided by $1,000 = 8.60) and multiply the result by the number in the Expenses Paid During Period column as shown below for your class.
The second line in the table for each class of Fund shares provides information about hypothetical account values and hypothetical expenses based on the Fund’s actual expense ratios and an assumed rate of return of 5% per year before expenses, which is not the Fund’s actual return. The hypothetical account values and expenses may not be used to estimate the actual ending account balance or expenses you paid on your investment for the period. You may use this information to compare the ongoing costs of investing in the Fund to other funds. To do so, compare this 5% hypothetical example with the 5% hypothetical examples that appear in the shareholder reports of the other funds.
Please note that the expenses shown reflect ongoing costs only, and do not include any transaction costs. Therefore, the second line in the table is useful in comparing ongoing costs only, and will not help you determine the relative costs of owning different funds. If transaction costs were included, total costs would be higher.
Loomis Sayles Fixed Income Fund
| | | | | | | | | | | | |
Institutional Class | | Beginning
Account Value
4/1/2020 | | | Ending
Account Value
9/30/2020 | | | Expenses Paid
During Period*
4/1/2020 – 9/30/2020 | |
Actual | | | $1,000.00 | | | | $1,136.30 | | | | $3.10 | |
Hypothetical (5% return before expenses) | | | $1,000.00 | | | | $1,022.10 | | | | $2.93 | |
|
* Expenses are equal to the Fund’s annualized expense ratio of 0.58%, multiplied by the average account value over the period, multiplied by the number of days in the most recent fiscal half-year (183), divided by 366 (to reflect the half-year period). | |
| 14
Loomis Sayles Global Bond Fund
| | | | | | | | | | | | |
Institutional Class | | Beginning
Account Value
4/1/2020 | | | Ending
Account Value
9/30/2020 | | | Expenses Paid
During Period*
4/1/2020 – 9/30/2020 | |
Actual | | | $1,000.00 | | | | $1,110.20 | | | | $3.64 | |
Hypothetical (5% return before expenses) | | | $1,000.00 | | | | $1,021.55 | | | | $3.49 | |
|
Retail Class | |
Actual | | | $1,000.00 | | | | $1,109.10 | | | | $4.96 | |
Hypothetical (5% return before expenses) | | | $1,000.00 | | | | $1,020.30 | | | | $4.75 | |
|
Class N | |
Actual | | | $1,000.00 | | | | $1,111.20 | | | | $3.38 | |
Hypothetical (5% return before expenses) | | | $1,000.00 | | | | $1,021.80 | | | | $3.23 | |
|
* Expenses are equal to the Fund’s annualized expense ratio (after waiver/reimbursement): 0.69%, 0.94% and 0.64% for Institutional Class, Retail Class and Class N, respectively, multiplied by the average account value over the period, multiplied by the number of days in the most recent fiscal half-year (183), divided by 366 (to reflect the half-year period). | |
Loomis Sayles Inflation Protected Securities Fund
| | | | | | | | | | | | |
Institutional Class | | Beginning
Account Value
4/1/2020 | | | Ending
Account Value
9/30/2020 | | | Expenses Paid
During Period*
4/1/2020 – 9/30/2020 | |
Actual | | | $1,000.00 | | | | $1,086.20 | | | | $2.09 | |
Hypothetical (5% return before expenses) | | | $1,000.00 | | | | $1,023.00 | | | | $2.02 | |
|
Retail Class | |
Actual | | | $1,000.00 | | | | $1,085.60 | | | | $3.39 | |
Hypothetical (5% return before expenses) | | | $1,000.00 | | | | $1,021.75 | | | | $3.29 | |
|
Class N | |
Actual | | | $1,000.00 | | | | $1,086.20 | | | | $1.83 | |
Hypothetical (5% return before expenses) | | | $1,000.00 | | | | $1,023.25 | | | | $1.77 | |
|
* Expenses are equal to the Fund’s annualized expense ratio (after waiver/reimbursement): 0.40%, 0.65% and 0.35% for Institutional Class, Retail Class and Class N, respectively, multiplied by the average account value over the period, multiplied by the number of days in the most recent fiscal half-year (183), divided by 366 (to reflect the half-year period). | |
Loomis Sayles Institutional High Income Fund
| | | | | | | | | | | | |
Institutional Class | | Beginning
Account Value
4/1/2020 | | | Ending
Account Value
9/30/2020 | | | Expenses Paid
During Period*
4/1/2020 – 9/30/2020 | |
Actual | | | $1,000.00 | | | | $1,176.80 | | | | $3.75 | |
Hypothetical (5% return before expenses) | | | $1,000.00 | | | | $1,021.55 | | | | $3.49 | |
|
* Expenses are equal to the Fund’s annualized expense ratio of 0.69%, multiplied by the average account value over the period, multiplied by the number of days in the most recent fiscal half-year (183), divided by 366 (to reflect the half-year period). | |
Loomis Sayles Investment Grade Fixed Income Fund
| | | | | | | | | | | | |
Institutional Class | | Beginning
Account Value
4/1/2020 | | | Ending
Account Value
9/30/2020 | | | Expenses Paid
During Period*
4/1/2020 – 9/30/2020 | |
Actual | | | $1,000.00 | | | | $1,104.40 | | | | $2.74 | |
Hypothetical (5% return before expenses) | | | $1,000.00 | | | | $1,022.40 | | | | $2.63 | |
|
* Expenses are equal to the Fund’s annualized expense ratio of 0.52%, multiplied by the average account value over the period, multiplied by the number of days in the most recent fiscal half-year (183), divided by 366 (to reflect the half-year period). | |
15 |
BOARD APPROVAL OF THE EXISTING ADVISORY AGREEMENTS
The Board of Trustees of the Trust (the “Board”), including the Independent Trustees, considers matters bearing on each Fund’s advisory agreement (collectively, the “Agreements”) at most of its meetings throughout the year. Each year, usually in the spring, the Contract Review Committee of the Board meets to review the Agreements to determine whether to recommend that the full Board approve the continuation of the Agreements, typically for an additional one-year period. After the Contract Review Committee has made its recommendation, the full Board, including the Independent Trustees, determines whether to approve the continuation of the Agreements.
In connection with these meetings, the Trustees receive materials that the Funds’ investment adviser (the “Adviser”) believes to be reasonably necessary for the Trustees to evaluate the Agreements. These materials generally include, among other items, (i) information on the investment performance of the Funds and the performance of peer groups of funds and the Funds’ performance benchmarks, (ii) information on the Funds’ advisory fees and other expenses, including information comparing the Funds’ advisory fees to the fees charged to institutional accounts with similar strategies managed by the Adviser, if any, and to those of peer groups of funds and information about any applicable expense caps and/or fee “breakpoints,” (iii) sales and redemption data in respect of the Funds, (iv) information about the profitability of the Agreements to the Adviser and (v) information obtained through the completion by the Adviser of a questionnaire distributed on behalf of the Trustees. The Board, including the Independent Trustees, also considers other matters such as (i) each Fund’s investment objective and strategies and the size, education and experience of the Adviser’s investment staff and its use of technology, external research and trading cost measurement tools, (ii) arrangements in respect of the distribution of the Funds’ shares and the related costs, (iii) the allocation of the Funds’ brokerage, if any, including, to the extent applicable, the use of “soft” commission dollars to pay for research and other similar services, (iv) the Adviser’s policies and procedures relating to, among other things, compliance, trading and best execution, proxy voting and valuation, (v) information about amounts invested by the Funds’ portfolio managers in the Funds or in similar accounts that they manage and (vi) the general economic outlook with particular emphasis on the mutual fund industry. Throughout the process, the Trustees are afforded the opportunity to ask questions of and request additional materials from the Adviser.
In addition to the materials requested by the Trustees in connection with their annual consideration of the continuation of the Agreements, the Trustees receive materials in advance of each regular quarterly meeting of the Board that provide detailed information about the Funds’ investment performance and the fees charged to the Funds for advisory and other services. This information generally includes, where available, among other things, an internal performance rating for each Fund based on agreed-upon criteria, graphs showing each Fund’s performance and expense differentials against each Fund’s peer group/category of funds, performance ratings provided by a third-party, total return information for various periods, and third-party performance rankings for various periods comparing a Fund against similarly categorized funds. The portfolio management team for each Fund or other representatives of the Adviser make periodic presentations to the Contract Review Committee and/or the full Board, and Funds identified as presenting possible performance concerns may be subject to more frequent Board or Committee presentations and reviews. In addition, each quarter the Trustees are provided with detailed statistical information about each Fund’s portfolio. The Trustees also receive periodic updates between meetings. These updates have increased in frequency during the Covid-19 crisis.
The Board most recently approved the continuation of the Agreements for a one-year period at its meeting held in June 2020. In considering whether to approve the continuation of the Agreements, the Board, including the Independent Trustees, did not identify any single factor as determinative. Individual Trustees may have evaluated the information presented differently from one another, giving different weights to various factors. Matters considered by the Trustees, including the Independent Trustees, in connection with their approval of the Agreements included, but were not limited to, the factors listed below.
The nature, extent and quality of the services provided to the Funds under the Agreements. The Trustees considered the nature, extent and quality of the services provided by the Adviser and its affiliates to the Funds and the resources dedicated to the Funds by the Adviser and its affiliates.
The Trustees considered not only the advisory services provided by the Adviser to the Funds, but also the monitoring and oversight services provided by Natixis Advisors, L.P. (“Natixis Advisors”). They also considered the administrative and shareholder services provided by Natixis Advisors and its affiliates to the Funds. They also took into consideration increases in the services provided resulting from new regulatory requirements.
For each Fund, the Trustees also considered the benefits to shareholders of investing in a mutual fund that is part of a family of funds that offers shareholders the right to exchange shares of one type of fund for shares of another type of fund, and provides a variety of fund and shareholder services.
After reviewing these and related factors, the Trustees concluded, within the context of their overall conclusions regarding each of the Agreements, that the nature, extent and quality of services provided supported the renewal of the Agreements.
Investment performance of the Funds and the Adviser. As noted above, the Trustees received information about the performance of the Funds over various time periods, including information that compared the performance of the Funds to the performance of peer groups and categories of funds and the Funds’ respective performance benchmarks. In addition, the Trustees reviewed data prepared by an independent third party that analyzed the performance of the Funds using a variety of performance metrics, including metrics that measured the performance of the Funds on a risk adjusted basis.
| 16
The Board noted that, through December 31, 2019, each Fund’s one-, three- and five-year performance, as applicable, stated as percentile rankings within categories selected by the independent third-party data provider, was as follows (where the best performance would be in the first percentile of its category):
| | | | | | | | | | | | |
| | | One-Year | | | Three-Year | | | Five-Year | |
Loomis Sayles Fixed Income Fund | | | 4% | | | | 20% | | | | 54% | |
Loomis Sayles Global Bond Fund | | | 59% | | | | 50% | | | | 52% | |
Loomis Sayles Inflation Protected Securities Fund | | | 35% | | | | 48% | | | | 29% | |
Loomis Sayles Institutional High Income Fund | | | 84% | | | | 83% | | | | 89% | |
Loomis Sayles Investment Grade Fixed Income Fund | | | 49% | | | | 10% | | | | 41% | |
In the case of the Loomis Sayles Fixed Income Fund, Loomis Sayles Global Bond Fund, and Loomis Sayles Institutional High Income Fund, performance lagged that of a relevant category median as determined by the independent third-party for certain (although not necessarily all) periods, the Board concluded that other factors relevant to performance supported renewal of the Agreements. These factors included one or more of the following: (1) that the underperformance was attributable, to a significant extent, to investment decisions (such as security selection or sector allocation) by the Adviser that were reasonable and consistent with the Fund’s investment objective and policies; (2) that the Loomis Sayles Fixed Income Fund and Loomis Sayles Global Bond Fund’s more recent performance had shown improvement relative to its category; and (3) that the Loomis Sayles Institutional High Income Fund’s long-term relative performance remains strong. The Board also considered information about the Funds’ more recent performance, including how that performance had been impacted by the Covid-19 crisis.
The Trustees also considered the Adviser’s performance and reputation generally, the performance of the fund family generally, and the historical responsiveness of the Adviser to Trustee concerns about performance and the willingness of the Adviser to take steps intended to improve performance.
After reviewing these and related factors, the Trustees concluded, within the context of their overall conclusions regarding each of the Agreements, that the performance of the Funds and the Adviser and/or other relevant factors supported the renewal of the Agreements.
The costs of the services to be provided and profits to be realized by the Adviser and its affiliates from their respective relationships with the Funds. The Trustees considered the fees charged to the Funds for advisory and administrative services as well as the total expense levels of the Funds. This information included comparisons (provided both by management and by an independent third party) of the Funds’ advisory fees and total expense levels to those of their peer groups and information about the advisory fees charged by the Adviser to comparable accounts (such as institutional separate accounts), as well as information about differences in such fees and the reasons for any such differences. In considering the fees charged to comparable accounts, the Trustees considered, among other things, management’s representations about the differences between managing mutual funds as compared to other types of accounts, including the additional resources required to effectively manage mutual fund assets, the greater regulatory costs associated with the management of such assets, and the entrepreneurial, regulatory and other risks associated with sponsoring and managing funds. In evaluating each Fund’s advisory fee, the Trustees also took into account the demands, complexity and quality of the investment management of such Fund, as well as the need for the Adviser to offer competitive compensation and the potential need to expend additional resources to the extent the Fund grows in size. The Trustees considered that over the past several years, management had made recommendations regarding reductions in advisory fee rates, implementation of advisory fee breakpoints and the institution of advisory fee waivers and expense caps for various funds in the fund family. They noted that all of the Funds included have expense caps in place, and they considered the amounts waived or reimbursed by the Adviser for the Loomis Sayles Global Bond Fund and Loomis Sayles Inflation Protected Securities Fund under their respective expense cap agreements. The Trustees also considered that the current expenses for Loomis Sayles Fixed Income Fund, Loomis Sayles Institutional High Income Fund and Loomis Sayles Investment Grade Fixed Income Fund were below each Fund’s cap.
The Trustees noted that the Loomis Sayles Institutional High Income Fund had a total advisory fee rate that was above the median of a peer group of funds. In this regard, the Trustees considered the factors that management believed justified the relatively higher advisory fee rate, including (1) that the Fund’s net expense ratio was only one basis point above the median of a peer group of funds and (2) that the Fund has a more flexible investment strategy than its peers.
The Trustees also considered the compensation directly or indirectly received by the Adviser and its affiliates from their relationships with the Funds. The Trustees reviewed information provided by management as to the profitability of the Adviser’s and its affiliates’ relationships with the Funds, and information about how expenses are determined and allocated for purposes of profitability calculations. They also reviewed information provided by management about the effect of distribution costs and changes in asset levels on Adviser profitability, including information regarding resources spent on distribution activities. When reviewing profitability, the Trustees also considered information about court cases in which adviser compensation or profitability were issues, the performance of the Funds, the expense levels of the Funds, whether the Adviser had implemented breakpoints and/or expense caps with respect to such Funds and the overall profit margin of Natixis Investment Managers compared to that of certain other investment managers for which such data was available.
After reviewing these and related factors, the Trustees concluded, within the context of their overall conclusions regarding each of the Agreements, that the advisory fee charged to each of the Funds was fair and reasonable, and that the costs of these services generally and the related profitability of the Adviser and its affiliates in respect of their relationships with the Funds supported the renewal of the Agreements.
17 |
Economies of Scale. The Trustees considered the existence of any economies of scale in the provision of services by the Adviser and whether those economies are shared with the Funds through breakpoints in their investment advisory fees or other means, such as expense caps. The Trustees also considered management’s explanation of the factors that are taken into account with respect to the implementation of breakpoints in investment advisory fees or expense caps. With respect to economies of scale, the Trustees noted that the Loomis Sayles Global Bond Fund has breakpoints in its advisory fee and that each of the Funds was subject to an expense cap. In considering these issues, the Trustees also took note of the costs of the services provided (both on an absolute and on a relative basis) and the profitability to the Adviser and its affiliates of their relationships with the Funds, as discussed above. The Trustees also considered that the Funds have benefitted from the substantial reinvestment the Adviser has made into its business.
After reviewing these and related factors, the Trustees concluded, within the context of their overall conclusions regarding each of the Agreements, that the extent to which economies of scale were shared with the Funds supported the renewal of the Agreements.
The Trustees also considered other factors, which included but were not limited to the following:
| • | | The effect of recent market and economic events, including but not limited to the Covid-19 crisis, on the performance, asset levels and expense ratios of each Fund. |
| • | | Whether each Fund has operated in accordance with its investment objective and the Fund’s record of compliance with its investment restrictions, and the compliance programs of the Funds and the Adviser. They also considered the compliance-related resources the Adviser and its affiliates were providing to the Funds. |
| • | | So-called “fallout benefits” to the Adviser, such as the engagement of affiliates of the Adviser to provide distribution and administrative services to the Funds, and the benefits of research made available to the Adviser by reason of brokerage commissions (if any) generated by the Funds’ securities transactions. The Trustees also considered the benefits to the parent company of Natixis Advisors from the retention of the Adviser. The Trustees considered the possible conflicts of interest associated with these fallout and other benefits, and the reporting, disclosure and other processes in place to disclose and monitor such possible conflicts of interest. |
| • | | The Trustees’ review and discussion of the Funds’ advisory arrangements in prior years, and management’s record of responding to Trustee concerns raised during the year and in prior years. |
Based on their evaluation of all factors that they deemed to be material, including those factors described above, and assisted by the advice of independent counsel, the Trustees, including the Independent Trustees, concluded that each of the existing Agreements should be continued through June 30, 2021.
| 18
LIQUIDITY RISK MANAGEMENT PROGRAM
Annual Report for the Period Commencing on December 1, 2018 and ending December 31, 2019 (including updates through September 30, 2020)
Effective December 1, 2018, the Funds adopted a liquidity risk management program (the “Program”) pursuant to the requirements of Rule 22e-4 under the Investment Company Act of 1940, as amended (the “Rule”). The Rule requires registered open-end funds, including mutual funds and exchange-traded funds to establish liquidity risk management programs in order to effectively manage fund liquidity and mitigate the risk that a fund could not meet redemption requests without significantly diluting the interests of remaining investors.
The rule requires the Funds to assess, manage and review their liquidity risk considering applicable factors during normal and foreseeable stressed conditions. In fulfilling this requirement, each Fund assesses and reviews (where applicable and amongst other matters) its investment strategy, portfolio holdings, possible investment concentrations, use of derivatives, short-term and long-term cash flow projections, use of cash and cash equivalents, as well as borrowing arrangements and other funding sources. Each Program has established a Program Administrator which is the adviser of the Fund.
In accordance with the Program, each of the Funds’ portfolio investments is classified into one of four liquidity categories based on a determination of a reasonable expectation for how long it would take to convert the investment to cash (or sell or dispose of the investment) without significantly changing its market value.
Each Fund is prohibited from acquiring an investment if, after the acquisition, its holdings of illiquid assets will exceed 15% of its net assets. If a Fund does not hold a majority of highly liquid investments in its portfolio, then the Fund is required to establish a highly liquid investment minimum (“HLIM”). Loomis Sayles Fixed Income Fund, Loomis Sayles Global Bond Fund, Loomis Sayles Institutional High Income Fund and Loomis Sayles Investment Grade Fixed Income Fund have established an HLIM.
During the period from December 1, 2018 to December 31, 2019, there were no material changes to the Program and no material events that impacted the operation of the Funds’ Programs. During the period, the Funds held sufficient liquid assets to meet redemptions on a timely basis and did not have any HLIM or illiquid security violations during the period.
During the period January 1, 2020 through September 30, 2020, the Funds held sufficient liquid assets to meet redemptions on a timely basis and did not have any HLIM or illiquid security violations.
Annual Program Assessment and Conclusion
In the opinion of the Program Administrator, the Program of each Fund approved by the Funds’ Board has been implemented effectively. The Program Administrator has also monitored, assessed and managed each Fund’s liquidity risk regularly and has determined that the Program is operating effectively.
Pursuant to the Rule’s requirements, the Board has received and reviewed a written report prepared by each Fund’s Program Administrator that addressed the operation of the Program, assessed its adequacy and effectiveness and described any material changes made to the Program.
19 |
Portfolio of Investments – as of September 30, 2020
Loomis Sayles Fixed Income Fund
| | | | | | | | |
Principal
Amount (‡) | | | Description | | Value (†) | |
|
| | Bonds and Notes – 83.0% of Net Assets | |
|
| | Non-Convertible Bonds – 75.5% | |
| |
| | | | ABS Other – 0.1% | |
| $ | 1,214,010 | | | GCA2014 Holdings Ltd., Series 2014-1, Class C,
6.000%, 1/05/2030, 144A(a)(b)(c)(d) | | $ | 408,927 | |
| | 546,066 | | | GCA2014 Holdings Ltd., Series 2014-1, Class D,
7.500%, 1/05/2030, 144A(a)(b)(c)(d) | | | 62,508 | |
| | 1,855,000 | | | GCA2014 Holdings Ltd., Series 2014-1, Class E,
Zero Coupon, 1/05/2030, 144A(a)(b)(c)(d)(e) | | | — | |
| | 452,475 | | | Global Container Assets Ltd., Series 2015-1A, Class B,
4.500%, 2/05/2030, 144A(a)(c)(f) | | | 388,183 | |
| | | | | | | | |
| | | | | | | 859,618 | |
| | | | | | | | |
| |
| | | | Aerospace & Defense – 3.0% | |
| | 115,000 | | | Boeing Co. (The), 3.100%, 5/01/2026 | | | 114,717 | |
| | 40,000 | | | Boeing Co. (The), 3.250%, 2/01/2035 | | | 37,599 | |
| | 260,000 | | | Boeing Co. (The), 3.550%, 3/01/2038 | | | 236,844 | |
| | 20,000 | | | Boeing Co. (The), 3.625%, 3/01/2048 | | | 17,576 | |
| | 145,000 | | | Boeing Co. (The), 3.750%, 2/01/2050 | | | 132,314 | |
| | 520,000 | | | Boeing Co. (The), 3.850%, 11/01/2048 | | | 476,491 | |
| | 525,000 | | | Boeing Co. (The), 3.950%, 8/01/2059 | | | 475,263 | |
| | 7,865,000 | | | Bombardier, Inc.,
6.000%, 10/15/2022, 144A | | | 7,294,787 | |
| | 175,000 | | | Bombardier, Inc., 7.450%, 5/01/2034, 144A | | | 129,110 | |
| | 1,265,000 | | | Embraer Netherlands Finance BV,
5.400%, 2/01/2027 | | | 1,201,118 | |
| | 807,000 | | | Leonardo U.S. Holdings, Inc.,
6.250%, 1/15/2040, 144A | | | 917,446 | |
| | 722,000 | | | Leonardo U.S. Holdings, Inc.,
7.375%, 7/15/2039, 144A | | | 896,587 | |
| | 1,025,000 | | | TransDigm, Inc., 5.500%, 11/15/2027 | | | 985,076 | |
| | 1,468,000 | | | TransDigm, Inc., 6.500%, 7/15/2024 | | | 1,464,330 | |
| | 75,000 | | | TransDigm, Inc., 7.500%, 3/15/2027 | | | 77,873 | |
| | 4,125,000 | | | TransDigm, Inc.,
8.000%, 12/15/2025, 144A | | | 4,485,938 | |
| | | | | | | | |
| | | | | | | 18,943,069 | |
| | | | | | | | |
| |
| | | | Airlines – 2.8% | |
| | 392,999 | | | Air Canada Pass Through Trust, Series 2013-1, Class B,
5.375%, 11/15/2022, 144A | | | 353,184 | |
| | 25,000 | | | American Airlines Group, Inc.,
3.750%, 3/01/2025, 144A | | | 12,676 | |
| | 7,124,353 | | | American Airlines Pass Through Certificates, Series 2016-1, Class B,
5.250%, 7/15/2025 | | | 4,921,421 | |
| | 653,689 | | | American Airlines Pass Through Certificates, Series 2013-1, Class A,
4.000%, 1/15/2027 | | | 517,434 | |
| | 110,357 | | | American Airlines Pass Through Certificates, Series 2013-1, Class B,
5.625%, 7/15/2022, 144A | | | 99,414 | |
| |
| | | | Airlines – continued | |
| 2,812,339 | | | American Airlines Pass Through Certificates, Series 2016-3, Class B,
3.750%, 4/15/2027 | | | 1,950,666 | |
| | 1,514,888 | | | American Airlines Pass Through Certificates, Series 2017-1B, Class B,
4.950%, 8/15/2026 | | | 1,033,956 | |
| | 1,037,124 | | | American Airlines Pass Through Certificates, Series 2017-2, Class B,
3.700%, 4/15/2027 | | | 659,791 | |
| | 104,541 | | | Continental Airlines Pass Through Certificates, Series 2012-2, Class B,
5.500%, 4/29/2022 | | | 101,577 | |
| | 3,140,000 | | | Mileage Plus Holdings LLC/Mileage Plus Intellectual Property Assets Ltd.,
6.500%, 6/20/2027, 144A | | | 3,269,525 | |
| | 762,369 | | | U.S. Airways Pass Through Trust, Series 2011-1, Class A,
7.125%, 4/22/2025 | | | 635,793 | |
| | 556,840 | | | U.S. Airways Pass Through Trust, Series 2012-1A, Class A,
5.900%, 4/01/2026 | | | 545,554 | |
| | 1,384,261 | | | U.S. Airways Pass Through Trust, Series 2012-2A, Class A,
4.625%, 12/03/2026 | | | 1,147,237 | |
| | 460,290 | | | UAL Pass Through Trust, Series 2007-1, Class A,
6.636%, 1/02/2024 | | | 421,855 | |
| | 1,223,204 | | | United Airlines Pass Through Trust, Series 2014-1, Class A,
4.000%, 10/11/2027 | | | 1,199,818 | |
| | 829,103 | | | United Airlines Pass Through Trust, Series 2016-2, Class B,
3.650%, 4/07/2027 | | | 625,367 | |
| | | | | | | | |
| | | | | | | 17,495,268 | |
| | | | | | | | |
| |
| | | | Automotive – 7.7% | |
| | 1,270,000 | | | Allison Transmission, Inc.,
4.750%, 10/01/2027, 144A | | | 1,306,513 | |
| | 865,000 | | | Dana, Inc., 5.625%, 6/15/2028 | | | 893,658 | |
| | 2,835,000 | | | Ford Motor Co., 5.291%, 12/08/2046 | | | 2,659,584 | |
| | 1,550,000 | | | Ford Motor Co., 6.375%, 2/01/2029 | | | 1,611,535 | |
| | 165,000 | | | Ford Motor Co., 6.625%, 2/15/2028 | | | 173,311 | |
| | 4,230,000 | | | Ford Motor Co., 6.625%, 10/01/2028 | | | 4,557,825 | |
| | 4,955,000 | | | Ford Motor Co., 7.450%, 7/16/2031 | | | 5,716,831 | |
| | 1,645,000 | | | Ford Motor Co., 7.500%, 8/01/2026 | | | 1,791,208 | |
| | 10,375,000 | | | Ford Motor Credit Co. LLC, GMTN,
4.389%, 1/08/2026 | | | 10,256,621 | |
| | 1,735,000 | | | General Motors Co., 5.200%, 4/01/2045 | | | 1,868,881 | |
| | 185,000 | | | General Motors Co., 6.250%, 10/02/2043 | | | 219,237 | |
| | 6,750,000 | | | General Motors Financial Co., Inc.,
3.600%, 6/21/2030 | | | 6,990,349 | |
| | 2,175,000 | | | General Motors Financial Co., Inc.,
4.375%, 9/25/2021 | | | 2,243,883 | |
| | 2,865,000 | | | General Motors Financial Co., Inc.,
5.250%, 3/01/2026 | | | 3,223,286 | |
| | 5,130,000 | | | Goodyear Tire & Rubber Co. (The),
4.875%, 3/15/2027 | | | 4,860,675 | |
| | 375,000 | | | Goodyear Tire & Rubber Co. (The),
7.000%, 3/15/2028 | | | 389,156 | |
| | | | | | | | |
| | | | | | | 48,762,553 | |
| | | | | | | | |
See accompanying notes to financial statements.
| 20
Portfolio of Investments – as of September 30, 2020
Loomis Sayles Fixed Income Fund – continued
| | | | | | | | |
Principal
Amount (‡) | | | Description | | Value (†) | |
|
| | Bonds and Notes – continued | |
| |
| | | | Banking – 5.6% | |
| $ | 1,146,000 | | | Ally Financial, Inc., 8.000%, 11/01/2031 | | $ | 1,569,017 | |
| | 1,130,000 | | | Banco Santander Mexico S.A. Institucion de Banca Multiple Grupo Financiero Santander,
5.375%, 4/17/2025, 144A | | | 1,257,690 | |
| | 4,570,000 | | | Bank of America Corp.,
6.110%, 1/29/2037 | | | 6,451,255 | |
| | 368,000 | | | Bank of America Corp., (fixed rate to 12/20/2027, variable rate thereafter),
3.419%, 12/20/2028 | | | 409,501 | |
| | 1,700,000 | | | Bank of America Corp., Series L, MTN, 4.183%, 11/25/2027 | | | 1,947,720 | |
| | 1,000,000 | | | BNP Paribas S.A., (fixed rate to 6/25/2037, variable rate thereafter),
7.195%, 144A(g) | | | 1,084,717 | |
| | 235,000 | | | Deutsche Bank AG, (fixed rate to 12/01/2027, variable rate thereafter),
4.875%, 12/01/2032 | | | 223,784 | |
| | 6,560,000 | | | Goldman Sachs Group, Inc. (The), Series MPLE, 3.550%, 2/12/2021, (CAD) | | | 4,977,235 | |
| | 7,680,000 | | | Lloyds Banking Group PLC,
4.344%, 1/09/2048 | | | 9,026,364 | |
| | 770,000 | | | Lloyds Banking Group PLC,
5.300%, 12/01/2045 | | | 1,004,164 | |
| | 3,950,000 | | | Morgan Stanley, Series MPLE,
3.125%, 8/05/2021, (CAD) | | | 3,027,963 | |
| | 1,920,000 | | | NatWest Group PLC,
6.000%, 12/19/2023 | | | 2,159,266 | |
| | 2,300,000 | | | NatWest Group PLC, Series U,
3-month LIBOR + 2.320%, 2.540%(g)(h) | | | 2,183,436 | |
| | | | | | | | |
| | | | | | | 35,322,112 | |
| | | | | | | | |
| |
| | | | Brokerage – 1.0% | |
| | 200,000 | | | Jefferies Finance LLC/JFIN Co-Issuer Corp., 7.250%, 8/15/2024, 144A | | | 207,250 | |
| | 3,055,000 | | | Jefferies Group LLC,
6.250%, 1/15/2036 | | | 3,785,974 | |
| | 1,805,000 | | | Jefferies Group LLC, 6.450%, 6/08/2027 | | | 2,200,512 | |
| | | | | | | | |
| | | | | | | 6,193,736 | |
| | | | | | | | |
| |
| | | | Building Materials – 0.5% | |
| | 360,000 | | | JELD-WEN, Inc.,
4.875%, 12/15/2027, 144A | | | 366,858 | |
| | 213,000 | | | Masco Corp., 6.500%, 8/15/2032 | | | 276,120 | |
| | 380,000 | | | Masco Corp., 7.750%, 8/01/2029 | | | 536,158 | |
| | 260,000 | | | Owens Corning, 4.400%, 1/30/2048 | | | 289,561 | |
| | 1,188,000 | | | Owens Corning, 7.000%, 12/01/2036 | | | 1,583,740 | |
| | | | | | | | |
| | | | | | | 3,052,437 | |
| | | | | | | | |
| |
| | | | Cable Satellite – 2.5% | |
| | 1,645,000 | | | CCO Holdings LLC/CCO Holdings Capital Corp.,
5.125%, 5/01/2027, 144A | | | 1,730,902 | |
| | 2,245,000 | | | CSC Holdings LLC,
5.375%, 2/01/2028, 144A | | | 2,371,281 | |
| |
| | | | Cable Satellite – continued | |
| 6,295,000 | | | DISH DBS Corp., 5.000%, 3/15/2023 | | | 6,420,900 | |
| | 270,000 | | | DISH DBS Corp., 7.750%, 7/01/2026 | | | 296,827 | |
| | 375,000 | | | Time Warner Cable LLC,
4.500%, 9/15/2042 | | | 407,350 | |
| | 1,500,000 | | | Time Warner Cable LLC,
6.550%, 5/01/2037 | | | 1,994,194 | |
| | 2,482,000 | | | Ziggo BV, 5.500%, 1/15/2027, 144A | | | 2,599,895 | |
| | | | | | | | |
| | | | | | | 15,821,349 | |
| | | | | | | | |
| |
| | | | Chemicals – 0.2% | |
| | 1,400,000 | | | Minerals Technologies, Inc.,
5.000%, 7/01/2028, 144A | | | 1,439,592 | |
| | | | | | | | |
| |
| | | | Construction Machinery – 0.2% | |
| | 965,000 | | | Toro Co. (The),
6.625%, 5/01/2037(c)(f) | | | 1,188,724 | |
| | 395,000 | | | United Rentals North America, Inc.,
4.875%, 1/15/2028 | | | 414,750 | |
| | | | | | | | |
| | | | | | | 1,603,474 | |
| | | | | | | | |
| |
| | | | Consumer Products – 0.6% | |
| | 880,000 | | | Avon Products, Inc., 8.950%, 3/15/2043 | | | 1,031,140 | |
| | 2,140,000 | | | Whirlpool Corp., 4.600%, 5/15/2050 | | | 2,650,438 | |
| | | | | | | | |
| | | | | | | 3,681,578 | |
| | | | | | | | |
| |
| | | | Diversified Manufacturing – 0.0% | |
| | 45,000 | | | General Electric Co., GMTN,
3.100%, 1/09/2023 | | | 47,223 | |
| | 165,000 | | | General Electric Co., Series D, (fixed rate to 1/21/2021, variable rate thereafter), 5.000%(g) | | | 131,466 | |
| | | | | | | | |
| | | | | | | 178,689 | |
| | | | | | | | |
| |
| | | | Electric – 1.5% | |
| | 1,513,781 | | | Alta Wind Holdings LLC,
7.000%, 6/30/2035, 144A | | | 1,839,682 | |
| | 255,000 | | | Edison International, 4.950%, 4/15/2025 | | | 279,123 | |
| | 1,589,000 | | | Empresa Nacional de Electricidad S.A., 7.875%, 2/01/2027 | | | 1,898,735 | |
| | 3,800,000 | | | Enel Finance International NV,
6.000%, 10/07/2039, 144A | | | 5,165,909 | |
| | 100,000 | | | Enel Finance International NV,
6.800%, 9/15/2037, 144A | | | 140,827 | |
| | | | | | | | |
| | | | | | | 9,324,276 | |
| | | | | | | | |
| |
| | | | Finance Companies – 7.1% | |
| | 1,800,000 | | | AerCap Ireland Capital DAC/AerCap Global Aviation Trust,
3.500%, 5/26/2022 | | | 1,817,944 | |
| | 1,200,000 | | | AerCap Ireland Capital DAC/AerCap Global Aviation Trust,
3.950%, 2/01/2022 | | | 1,214,909 | |
| | 300,000 | | | AGFC Capital Trust I, 3-month LIBOR + 1.750%, 2.025%, 1/15/2067, 144A(a)(c)(d)(h) | | | 96,284 | |
| | 2,815,000 | | | Antares Holdings LP,
6.000%, 8/15/2023, 144A | | | 2,846,689 | |
See accompanying notes to financial statements.
21 |
Portfolio of Investments – as of September 30, 2020
Loomis Sayles Fixed Income Fund – continued
| | | | | | | | |
Principal
Amount (‡) | | | Description | | Value (†) | |
|
| | Bonds and Notes – continued | |
| |
| | | | Finance Companies – continued | |
| $ | 5,590,000 | | | GE Capital Funding LLC,
4.550%, 5/15/2032, 144A | | $ | 6,008,494 | |
| | 1,400,000 | | | GE Capital International Funding Co. Unlimited Co., 4.418%, 11/15/2035 | | | 1,477,782 | |
| | 4,668,000 | | | Navient Corp., 5.500%, 1/25/2023 | | | 4,697,665 | |
| | 3,903,000 | | | Navient Corp., 5.875%, 10/25/2024 | | | 3,881,065 | |
| | 31,725(††) | | | Navient Corp., 6.000%, 12/15/2043 | | | 676,615 | |
| | 5,185,000 | | | Navient Corp., MTN, 5.625%, 8/01/2033 | | | 4,363,826 | |
| | 5,900,000 | | | Navient Corp., MTN, 6.125%, 3/25/2024 | | | 5,944,250 | |
| | 2,595,000 | | | OneMain Finance Corp., 6.875%, 3/15/2025 | | | 2,879,607 | |
| | 6,085,000 | | | Owl Rock Capital Corp.,
4.250%, 1/15/2026 | | | 6,164,288 | |
| | 1,720,000 | | | Quicken Loans LLC,
5.250%, 1/15/2028, 144A | | | 1,812,295 | |
| | 910,000 | | | Quicken Loans LLC,
5.750%, 5/01/2025, 144A | | | 936,845 | |
| | | | | | | | |
| | | | | | | 44,818,558 | |
| | | | | | | | |
| |
| | | | Financial Other – 0.6% | |
| | 1,420,000 | | | Nationstar Mortgage Holdings, Inc.,
5.500%, 8/15/2028, 144A | | | 1,418,225 | |
| | 2,450,000 | | | Nationstar Mortgage Holdings, Inc.,
9.125%, 7/15/2026, 144A | | | 2,627,625 | |
| | | | | | | | |
| | | | | | | 4,045,850 | |
| | | | | | | | |
| |
| | | | Food & Beverage – 0.4% | |
| | 2,635,000 | | | Kraft Heinz Foods Co.,
4.375%, 6/01/2046 | | | 2,703,694 | |
| | | | | | | | |
| |
| | | | Government Owned – No Guarantee – 0.3% | |
| | 1,715,000 | | | Pertamina Persero PT,
6.450%, 5/30/2044, 144A | | | 2,221,632 | |
| | | | | | | | |
| |
| | | | Healthcare – 4.7% | |
| | 2,932,000 | | | HCA, Inc., 7.050%, 12/01/2027 | | | 3,423,110 | |
| | 1,440,000 | | | HCA, Inc., 7.500%, 11/06/2033 | | | 1,915,200 | |
| | 900,000 | | | HCA, Inc., 7.690%, 6/15/2025 | | | 1,057,500 | |
| | 2,220,000 | | | HCA, Inc., 8.360%, 4/15/2024 | | | 2,614,050 | |
| | 2,930,000 | | | HCA, Inc., MTN, 7.580%, 9/15/2025 | | | 3,494,025 | |
| | 430,000 | | | HCA, Inc., MTN, 7.750%, 7/15/2036 | | | 548,250 | |
| | 4,530,000 | | | Tenet Healthcare Corp., 5.125%, 5/01/2025 | | | 4,572,129 | |
| | 6,460,000 | | | Tenet Healthcare Corp.,
6.125%, 10/01/2028, 144A | | | 6,282,350 | |
| | 4,005,000 | | | Tenet Healthcare Corp.,
6.750%, 6/15/2023 | | | 4,205,250 | |
| | 1,775,000 | | | Tenet Healthcare Corp.,
6.875%, 11/15/2031 | | | 1,739,500 | |
| | | | | | | | |
| | | | | | | 29,851,364 | |
| | | | | | | | |
| |
| | | | Home Construction – 0.7% | |
| | 595,000 | | | Beazer Homes USA, Inc.,
7.250%, 10/15/2029 | | | 638,137 | |
| | 3,020,000 | | | PulteGroup, Inc.,
6.375%, 5/15/2033 | | | 3,797,650 | |
| |
| | | | Home Construction – continued | |
| 15,000 | | | TRI Pointe Group, Inc./TRI Pointe Homes, Inc., 5.875%, 6/15/2024 | | | 16,200 | |
| | | | | | | | |
| | | | | | | 4,451,987 | |
| | | | | | | | |
| |
| | | | Independent Energy – 3.0% | |
| | 720,000 | | | Aker BP ASA,
3.750%, 1/15/2030, 144A | | | 698,265 | |
| | 1,898,000 | | | Ascent Resources Utica Holdings LLC/ARU Finance Corp.,
10.000%, 4/01/2022, 144A | | | 1,869,530 | |
| | 3,105,000 | | | Chesapeake Energy Corp.,
4.875%, 4/15/2022(c)(f)(i) | | | 126,187 | |
| | 335,000 | | | Chesapeake Energy Corp.,
5.750%, 3/15/2023(c)(f)(i) | | | 12,563 | |
| | 3,730,000 | | | Chesapeake Energy Corp.,
8.000%, 6/15/2027(c)(f)(i) | | | 125,888 | |
| | 1,880,000 | | | Continental Resources, Inc.,
3.800%, 6/01/2024 | | | 1,734,300 | |
| | 650,000 | | | Continental Resources, Inc.,
4.500%, 4/15/2023 | | | 619,450 | |
| | 22,000 | | | Continental Resources, Inc.,
5.000%, 9/15/2022 | | | 21,837 | |
| | 1,105,000 | | | Montage Resources Corp.,
8.875%, 7/15/2023 | | | 1,122,956 | |
| | 5,955,000 | | | Newfield Exploration Co.,
5.625%, 7/01/2024 | | | 5,776,652 | |
| | 2,395,000 | | | Occidental Petroleum Corp.,
8.875%, 7/15/2030 | | | 2,466,850 | |
| | 345,000 | | | QEP Resources, Inc.,
5.250%, 5/01/2023 | | | 250,987 | |
| | 3,068,000 | | | SM Energy Co.,
10.000%, 1/15/2025, 144A | | | 2,927,823 | |
| | 1,575,000 | | | Vine Oil & Gas LP/Vine Oil & Gas Finance Corp.,
8.750%, 4/15/2023, 144A | | | 1,055,250 | |
| | 265,000 | | | Vine Oil & Gas LP/Vine Oil & Gas Finance Corp.,
9.750%, 4/15/2023, 144A | | | 180,200 | |
| | | | | | | | |
| | | | | | | 18,988,738 | |
| | | | | | | | |
| |
| | | | Life Insurance – 3.4% | |
| | 3,700,000 | | | AXA S.A., (fixed rate to 12/14/2036, variable rate thereafter),
6.379%, 144A(g) | | | 5,022,750 | |
| | 560,000 | | | Brighthouse Financial, Inc.,
4.700%, 6/22/2047 | | | 538,942 | |
| | 2,870,000 | | | Brighthouse Financial, Inc.,
5.625%, 5/15/2030 | | | 3,342,302 | |
| | 4,345,000 | | | Global Atlantic Fin Co.,
8.625%, 4/15/2021, 144A | | | 4,484,832 | |
| | 2,270,000 | | | MetLife, Inc.,
9.250%, 4/08/2068, 144A | | | 3,434,466 | |
| | 1,115,000 | | | MetLife, Inc., 10.750%, 8/01/2069 | | | 1,813,282 | |
| | 1,165,000 | | | Penn Mutual Life Insurance Co. (The), 6.650%, 6/15/2034, 144A | | | 1,523,138 | |
| | 1,000,000 | | | Prudential Financial, Inc., MTN,
3.700%, 3/13/2051 | | | 1,099,420 | |
| | | | | | | | |
| | | | | | | 21,259,132 | |
| | | | | | | | |
See accompanying notes to financial statements.
| 22
Portfolio of Investments – as of September 30, 2020
Loomis Sayles Fixed Income Fund – continued
| | | | | | | | |
Principal
Amount (‡) | | | Description | | Value (†) | |
|
| | Bonds and Notes – continued | |
| |
| | | | Media Entertainment – 0.8% | |
| | 24,000,000 | | | Grupo Televisa SAB, EMTN,
7.250%, 5/14/2043, (MXN) | | $ | 810,659 | |
| | 1,765,000 | | | iHeartCommunications, Inc.,
8.375%, 5/01/2027 | | | 1,738,525 | |
| | 2,365,000 | | | ViacomCBS, Inc., 4.950%, 5/19/2050 | | | 2,774,989 | |
| | | | | | | | |
| | | | | | | 5,324,173 | |
| | | | | | | | |
| |
| | | | Metals & Mining – 2.1% | |
| | 6,630,000 | | | ArcelorMittal S.A., 7.000%, 3/01/2041 | | | 8,188,050 | |
| | 3,300,000 | | | ArcelorMittal S.A., 7.250%, 10/15/2039 | | | 4,165,098 | |
| | 200,000 | | | First Quantum Minerals Ltd.,
7.500%, 4/01/2025, 144A | | | 197,822 | |
| | 1,195,000 | | | United States Steel Corp.,
6.650%, 6/01/2037 | | | 734,925 | |
| | | | | | | | |
| | | | | | | 13,285,895 | |
| | | | | | | | |
| |
| | | | Midstream – 1.9% | |
| | 575,000 | | | DCP Midstream Operating LP,
6.450%, 11/03/2036, 144A | | | 551,011 | |
| | 1,700,000 | | | Enable Midstream Partners LP,
5.000%, 5/15/2044 | | | 1,432,675 | |
| | 1,160,000 | | | Enbridge Energy Partners LP,
7.375%, 10/15/2045 | | | 1,698,405 | |
| | 3,000,000 | | | EnLink Midstream Partners LP,
4.150%, 6/01/2025 | | | 2,583,090 | |
| | 250,000 | | | Kinder Morgan, Inc., GMTN,
7.800%, 8/01/2031 | | | 345,946 | |
| | 1,565,000 | | | New Fortress Energy, Inc.,
6.750%, 9/15/2025, 144A | | | 1,636,207 | |
| | 3,470,000 | | | NGL Energy Partners LP/NGL Energy Finance Corp., 6.125%, 3/01/2025 | | | 2,064,650 | |
| | 1,565,000 | | | NGL Energy Partners LP/NGL Energy Finance Corp., 7.500%, 11/01/2023 | | | 1,042,681 | |
| | 95,000 | | | NGPL PipeCo LLC,
7.768%, 12/15/2037, 144A | | | 120,926 | |
| | 115,000 | | | ONEOK Partners LP,
6.200%, 9/15/2043 | | | 121,836 | |
| | 1,295,000 | | | Summit Midstream Partners LP, Series A, (fixed rate to 12/15/2022, variable rate thereafter),
9.500%(c)(f)(g)(i) | | | 163,597 | |
| | | | | | | | |
| | | | | | | 11,761,024 | |
| | | | | | | | |
| |
| | | | Oil Field Services – 0.8% | |
| | 225,000 | | | Shelf Drilling Holdings Ltd.,
8.250%, 2/15/2025, 144A | | | 88,875 | |
| | 4,660,500 | | | Transocean Proteus Ltd.,
6.250%, 12/01/2024, 144A | | | 4,159,496 | |
| | 160,000 | | | Transocean, Inc., 7.500%, 4/15/2031 | | | 21,600 | |
| | 1,452,000 | | | Transocean, Inc.,
11.500%, 1/30/2027, 144A | | | 595,611 | |
| | | | | | | | |
| | | | | | | 4,865,582 | |
| | | | | | | | |
| |
| | | | Packaging – 2.1% | |
| | 11,450,000 | | | Owens-Brockway Glass Container, Inc., 5.375%, 1/15/2025, 144A | | | 12,079,750 | |
| |
| | | | Packaging – continued | |
| 905,000 | | | Owens-Brockway Glass Container, Inc., 6.625%, 5/13/2027, 144A | | | 980,228 | |
| | | | | | | | |
| | | | | | | 13,059,978 | |
| | | | | | | | |
| |
| | | | Paper – 1.6% | |
| | 5,492,000 | | | Georgia-Pacific LLC,
7.750%, 11/15/2029 | | | 8,210,710 | |
| | 350,000 | | | WestRock MWV LLC,
7.950%, 2/15/2031 | | | 496,804 | |
| | 1,035,000 | | | WestRock MWV LLC,
8.200%, 1/15/2030 | | | 1,458,410 | |
| | | | | | | | |
| | | | | | | 10,165,924 | |
| | | | | | | | |
| |
| | | | Property & Casualty Insurance – 1.7% | |
| | 1,630,000 | | | MBIA Insurance Corp., 3-month LIBOR + 11.260%, 11.535%, 1/15/2033, 144A(e)(h) | | | 570,500 | |
| | 995,000 | | | MGIC Investment Corp.,
5.250%, 8/15/2028 | | | 1,026,268 | |
| | 7,295,000 | | | Nationwide Mutual Insurance Co.,
4.350%, 4/30/2050, 144A | | | 7,815,067 | |
| | 840,000 | | | Radian Group, Inc.,
4.500%, 10/01/2024 | | | 833,868 | |
| | 485,000 | | | Radian Group, Inc.,
4.875%, 3/15/2027 | | | 485,000 | |
| | | | | | | | |
| | | | | | | 10,730,703 | |
| | | | | | | | |
| |
| | | | REITs – Diversified – 0.1% | |
| | 385,000 | | | iStar, Inc., 4.750%, 10/01/2024 | | | 372,488 | |
| | | | | | | | |
| |
| | | | REITs – Hotels – 0.2% | |
| | 60,000 | | | Service Properties Trust,
3.950%, 1/15/2028 | | | 49,800 | |
| | 635,000 | | | Service Properties Trust,
4.350%, 10/01/2024 | | | 574,675 | |
| | 180,000 | | | Service Properties Trust,
4.500%, 6/15/2023 | | | 176,522 | |
| | 100,000 | | | Service Properties Trust,
4.650%, 3/15/2024 | | | 93,000 | |
| | 80,000 | | | Service Properties Trust,
4.750%, 10/01/2026 | | | 71,146 | |
| | 290,000 | | | Service Properties Trust,
4.950%, 2/15/2027 | | | 258,100 | |
| | | | | | | | |
| | | | | | | 1,223,243 | |
| | | | | | | | |
| |
| | | | Retailers – 0.3% | |
| | 1,025,000 | | | Dillard’s, Inc., 7.750%, 7/15/2026 | | | 1,075,153 | |
| | 540,000 | | | Hanesbrands, Inc.,
5.375%, 5/15/2025, 144A | | | 569,700 | |
| | 793,000 | | | J.C. Penney Corp., Inc.,
6.375%, 10/15/2036(c)(f)(i) | | | 3,791 | |
| | | | | | | | |
| | | | | | | 1,648,644 | |
| | | | | | | | |
| |
| | | | Supermarkets – 0.1% | |
| | 552,000 | | | Albertson’s Cos. LLC/Safeway, Inc./New Albertson’s LP/Albertson’s LLC,
5.750%, 3/15/2025 | | | 569,416 | |
| | | | | | | | |
| |
| | | | Technology – 1.3% | |
| | 2,095,000 | | | Hewlett Packard Enterprise Co.,
6.350%, 10/15/2045 | | | 2,670,280 | |
See accompanying notes to financial statements.
23 |
Portfolio of Investments – as of September 30, 2020
Loomis Sayles Fixed Income Fund – continued
| | | | | | | | |
Principal
Amount (‡) | | | Description | | Value (†) | |
|
| | Bonds and Notes – continued | |
| |
| | | | Technology – continued | |
| $ | 3,680,000 | | | Iron Mountain, Inc.,
4.875%, 9/15/2029, 144A | | $ | 3,744,400 | |
| | 463,200 | | | Samsung Electronics Co. Ltd.,
7.700%, 10/01/2027, 144A | | | 573,196 | |
| | 689,000 | | | Seagate HDD Cayman,
4.091%, 6/01/2029, 144A | | | 749,074 | |
| | 637,000 | | | Seagate HDD Cayman,
4.875%, 6/01/2027 | | | 713,564 | |
| | | | | | | | |
| | | | | | | 8,450,514 | |
| | | | | | | | |
| |
| | | | Transportation Services – 0.3% | |
| | 2,500,000 | | | Fenix Marine Service Holdings Ltd.,
8.000%, 1/15/2024(c)(f) | | | 2,075,825 | |
| | | | | | | | |
| |
| | | | Treasuries – 14.0% | |
| | 424,300(†††) | | | Mexican Fixed Rate Bonds, Series M,
6.500%, 6/10/2021, (MXN) | | | 1,944,068 | |
| | 200,000(†††) | | | Mexican Fixed Rate Bonds, Series M,
7.750%, 5/29/2031, (MXN) | | | 1,019,732 | |
| | 847,500(†††) | | | Mexican Fixed Rate Bonds, Series M,
8.000%, 12/07/2023, (MXN) | | | 4,204,480 | |
| | 595,000(†††) | | | Mexican Fixed Rate Bonds, Series M-20,
7.500%, 6/03/2027, (MXN) | | | 2,990,971 | |
| | 150,000(†††) | | | Mexican Fixed Rate Bonds, Series M-20,
8.500%, 5/31/2029, (MXN) | | | 802,110 | |
| | 1,455,000(†††) | | | Mexican Fixed Rate Bonds, Series M-20,
10.000%, 12/05/2024, (MXN) | | | 7,820,210 | |
| | 10,220,000 | | | Norway Government Bond, Series 474,
3.750%, 5/25/2021, 144A, (NOK) | | | 1,122,251 | |
| | 10,150,000 | | | Republic of Brazil,
8.500%, 1/05/2024, (BRL) | | | 1,986,641 | |
| | 14,635,000 | | | Republic of Brazil,
10.250%, 1/10/2028, (BRL) | | | 3,067,671 | |
| | 19,835,000 | | | U.S. Treasury Bond, 1.250%, 5/15/2050 | | | 18,855,647 | |
| | 25,650,000 | | | U.S. Treasury Bond,
1.375%, 8/15/2050 | | | 25,173,070 | |
| | 14,300,000 | | | U.S. Treasury Bond,
3.000%, 8/15/2048 | | | 19,535,699 | |
| | | | | | | | |
| | | | | | | 88,522,550 | |
| | | | | | | | |
| |
| | | | Wireless – 0.5% | |
| | 72,400,000 | | | America Movil SAB de CV,
6.450%, 12/05/2022, (MXN) | | | 3,322,119 | |
| | | | | | | | |
| |
| | | | Wirelines – 1.8% | |
| | 1,900,000 | | | AT&T, Inc., 3.650%, 9/15/2059, 144A | | | 1,866,464 | |
| | 1,001,000 | | | AT&T, Inc., 4.500%, 3/09/2048 | | | 1,148,762 | |
| | 210,000 | | | Bell Canada, Inc., MTN,
6.100%, 3/16/2035, 144A, (CAD) | | | 213,260 | |
| | 195,000 | | | Bell Canada, Inc., MTN,
6.550%, 5/01/2029, 144A, (CAD) | | | 196,725 | |
| | 690,000 | | | Bell Canada, Inc., MTN,
7.300%, 2/23/2032, 144A, (CAD) | | | 742,255 | |
| |
| | | | Wirelines – continued | |
| 695,000 | | | CenturyLink, Inc.,
5.625%, 4/01/2025 | | | 742,512 | |
| | 145,000 | | | Cincinnati Bell, Inc.,
8.000%, 10/15/2025, 144A | | | 153,156 | |
| | 1,015,000 | | | Qwest Corp., 7.250%, 9/15/2025 | | | 1,165,863 | |
| | 1,790,000 | | | Telecom Italia Capital S.A.,
6.000%, 9/30/2034 | | | 2,076,400 | |
| | 1,010,000 | | | Telecom Italia Capital S.A.,
6.375%, 11/15/2033 | | | 1,201,900 | |
| | 600,000 | | | Telecom Italia SpA, EMTN,
5.250%, 3/17/2055, (EUR) | | | 821,191 | |
| | 750,000 | | | Telefonica Emisiones S.A., EMTN,
5.375%, 2/02/2026, (GBP) | | | 1,173,340 | |
| | | | | | | | |
| | | | | | | 11,501,828 | |
| | | | | | | | |
| | |
| | | | Total Non-Convertible Bonds | | | | |
| | |
| | | | (Identified Cost $479,053,945) | | | 477,898,612 | |
| | | | | | | | |
|
| | Convertible Bonds – 6.6% | |
| |
| | | | Cable Satellite – 2.5% | |
| | 13,430,000 | | | DISH Network Corp.,
2.375%, 3/15/2024 | | | 12,086,326 | |
| | 4,045,000 | | | DISH Network Corp.,
3.375%, 8/15/2026 | | | 3,713,296 | |
| | | | | | | | |
| | | | | | | 15,799,622 | |
| | | | | | | | |
| |
| | | | Energy – 0.0% | |
| | 8,530,000 | | | Chesapeake Energy Corp.,
5.500%, 9/15/2026(c)(f)(i) | | | 285,755 | |
| | | | | | | | |
| |
| | | | Pharmaceuticals – 0.1% | |
| | 400,000 | | | BioMarin Pharmaceutical, Inc.,
0.599%, 8/01/2024 | | | 419,741 | |
| | 125,000 | | | BioMarin Pharmaceutical, Inc.,
1.250%, 5/15/2027, 144A | | | 122,249 | |
| | | | | | | | |
| | | | | | | 541,990 | |
| | | | | | | | |
| |
| | | | REITs – Diversified – 0.3% | |
| | 1,530,000 | | | iStar, Inc., 3.125%, 9/15/2022 | | | 1,627,242 | |
| | | | | | | | |
| |
| | | | Technology – 3.7% | |
| | 4,095,000 | | | Booking Holdings, Inc.,
0.900%, 9/15/2021 | | | 4,357,508 | |
| | 80,000 | | | Evolent Health, Inc.,
3.500%, 12/01/2024, 144A | | | 78,400 | |
| | 1,235,000 | | | Nuance Communications, Inc.,
1.000%, 12/15/2035 | | | 1,806,114 | |
| | 1,365,000 | | | Nuance Communications, Inc.,
1.250%, 4/01/2025 | | | 2,431,106 | |
| | 8,194,000 | | | Nuance Communications, Inc.,
1.500%, 11/01/2035 | | | 13,468,622 | |
| | 1,705,000 | | | Western Digital Corp.,
1.500%, 2/01/2024 | | | 1,618,720 | |
| | | | | | | | |
| | | | | | | 23,760,470 | |
| | | | | | | | |
| | |
| | | | Total Convertible Bonds | | | | |
| | |
| | | | (Identified Cost $42,091,640) | | | 42,015,079 | |
| | | | | | | | |
See accompanying notes to financial statements.
| 24
Portfolio of Investments – as of September 30, 2020
Loomis Sayles Fixed Income Fund – continued
| | | | | | | | |
Principal
Amount (‡) | | | Description | | Value (†) | |
|
| | Bonds and Notes – continued | |
|
| | Municipals – 0.9% | |
| |
| | | | Michigan – 0.2% | |
| $ | 1,450,000 | | | Michigan Tobacco Settlement Finance Authority, Series A,
7.309%, 6/01/2034 | | $ | 1,480,885 | |
| | | | | | | | |
| |
| | | | Virginia – 0.7% | |
| | 4,080,000 | | | Tobacco Settlement Financing Corp., Series A-1, 6.706%, 6/01/2046 | | | 4,211,090 | |
| | | | | | | | |
| | |
| | | | Total Municipals | | | | |
| | |
| | | | (Identified Cost $5,512,984) | | | 5,691,975 | |
| | | | | | | | |
| | |
| | | | Total Bonds and Notes | | | | |
| | |
| | | | (Identified Cost $526,658,569) | | | 525,605,666 | |
| | | | | | | | |
| | |
| | Shares | | | | | | | |
|
| | Common Stocks – 10.0% | |
| |
| | | | Automobiles – 0.4% | |
| | 341,305 | | | Ford Motor Co. | | | 2,273,091 | |
| | | | | | | | |
| |
| | | | Chemicals – 0.2% | |
| | 159,649 | | | Hexion Holdings Corp., Class B(e) | | | 1,586,592 | |
| | | | | | | | |
| |
| | | | Diversified Telecommunication Services – 3.8% | |
| | 836,745 | | | AT&T, Inc. | | | 23,855,600 | |
| | | | | | | | |
| |
| | | | Electronic Equipment, Instruments &
Components – 1.9% | |
| | 375,812 | | | Corning, Inc. | | | 12,180,067 | |
| | | | | | | | |
| |
| | | | Media – 0.0% | |
| | 97,654 | | | Clear Channel Outdoor Holdings, Inc.(e) | | | 97,654 | |
| | 4,700 | | | iHeartMedia, Inc., Class A(e) | | | 38,164 | |
| | | | | | | | |
| | | | | | | 135,818 | |
| | | | | | | | |
| |
| | | | Oil, Gas & Consumable Fuels – 0.1% | |
| | 939 | | | Battalion Oil Corp.(e) | | | 7,418 | |
| | 271 | | | Chesapeake Energy Corp.(e) | | | 1,103 | |
| | 11,108 | | | Paragon Offshore Ltd., Litigation Units, Class A(a)(b)(c)(d)(e) | | | — | |
| | 16,662 | | | Paragon Offshore Ltd., Litigation Units, Class B(b)(e) | | | 83,310 | |
| | 31,317 | | | Whiting Petroleum Corp.(e) | | | 541,471 | |
| | | | | | | | |
| | | | | | | 633,302 | |
| | | | | | | | |
| |
| | | | Pharmaceuticals – 3.6% | |
| | 377,213 | | | Bristol-Myers Squibb Co. | | | 22,742,172 | |
| | | | | | | | |
| | |
| | | | Total Common Stocks | | | | |
| | |
| | | | (Identified Cost $70,251,132) | | | 63,406,642 | |
| | | | | | | | |
|
| | Preferred Stocks – 1.5% | |
|
| | Convertible Preferred Stocks – 1.4% | |
| |
| | | | Banking – 0.7% | |
| | 2,844 | | | Bank of America Corp., Series L, 7.250% | | | 4,231,872 | |
| | | | | | | | |
| |
| | | | Energy – 0.0% | |
| | 10,213 | | | Chesapeake Energy Corp.,
4.500%(a)(c)(d)(e) | | | — | |
| | 14,180 | | | Chesapeake Energy Corp.,
5.000%(a)(c)(d)(e) | | | — | |
| | 660 | | | Chesapeake Energy Corp.,
5.750%, 144A(a)(c)(d)(e) | | | — | |
| | | | | | | | |
| | | | | | | — | |
| | | | | | | | |
| |
| | | | Midstream – 0.7% | |
| | 96,065 | | | El Paso Energy Capital Trust I, 4.750% | | | 4,492,960 | |
| | | | | | | | |
| | |
| | | | Total Convertible Preferred Stocks | | | | |
| | |
| | | | (Identified Cost $8,653,390) | | | 8,724,832 | |
| | | | | | | | |
|
| | Non-Convertible Preferred Stocks – 0.1% | |
| |
| | | | Electric – 0.1% | |
| | 4,670 | | | Union Electric Co., 4.500% (Identified Cost $246,342) | | | 483,345 | |
| | | | | | | | |
| | |
| | | | Total Preferred Stocks | | | | |
| | |
| | | | (Identified Cost $8,899,732) | | | 9,208,177 | |
| | | | | | | | |
|
| | Warrants – 0.0% | |
| | 35,319 | | | iHeartMedia, Inc., Expiration on 5/1/2039(e)
(Identified Cost $857,522) | | | 278,137 | |
| | | | | | | | |
| | |
| Principal
Amount (‡) |
| | | | | | |
|
| | Short-Term Investments – 1.9% | |
| | |
| | 645,083,591 | | | Central Bank of Iceland,
0.000%, (ISK)(h)(j) | | | 4,662,862 | |
| | |
| | 7,078,224 | | | Tri-Party Repurchase Agreement with Fixed Income Clearing Corporation, dated 9/30/2020 at 0.000% to be repurchased at $7,078,224 on 10/01/2020 collateralized by $6,936,200 U.S. Treasury Note, 1.125% due 2/28/2025 valued at $7,219,844 including accrued interest (Note 2 of Notes to Financial Statements) | | | 7,078,224 | |
| | | | | | | | |
| | |
| | | | Total Short-Term Investments | | | | |
| | |
| | | | (Identified Cost $12,328,783) | | | 11,741,086 | |
| | | | | | | | |
| | |
| | | | Total Investments – 96.4% | | | | |
| | |
| | | | (Identified Cost $618,995,738) | | | 610,239,708 | |
| | |
| | | | Other assets less liabilities—3.6% | | | 22,820,467 | |
| | | | | | | | |
| | |
| | | | Net Assets – 100.0% | | $ | 633,060,175 | |
| | | | | | | | |
See accompanying notes to financial statements.
25 |
Portfolio of Investments – as of September 30, 2020
Loomis Sayles Fixed Income Fund – continued
| | | | | | |
| | (‡) | | | Principal Amount stated in U.S. dollars unless otherwise noted. |
| |
| | (†) | | | See Note 2 of Notes to Financial Statements. |
| |
| | (††) | | | Amount shown represents units. One unit represents a principal amount of 25. |
| |
| | (†††) | | | Amount shown represents units. One unit represents a principal amount of 100. |
| |
| | (a) | | | Level 3 security. Value has been determined using significant unobservable inputs. See Note 3 of Notes to Financial Statements. |
| |
| | (b) | | | Securities subject to restriction on resale. At September 30, 2020, the restricted securities held by the Fund are as follows: |
| | | | | | | | | | | | | | |
| | | Acquisition
Date | | Acquisition
Cost | | | Value | | | % of
Net Assets | |
| | | | |
| GCA2014 Holdings Ltd., Series 2014-1, Class C | | 12/18/2014 | | $ | 1,214,010 | | | $ | 408,927 | | | | 0.1% | |
| | | | |
| GCA2014 Holdings Ltd., Series 2014-1, Class D | | 12/18/2014 | | | 546,066 | | | | 62,508 | | | | Less than 0.1% | |
| | | | |
| GCA2014 Holdings Ltd., Series 2014-1, Class E | | 12/18/2014 | | | 1,445,707 | | | | — | | | | — | |
| | | | |
| Paragon Offshore Ltd., Litigation Units, Class A | | 7/18/2017 | | | 73,304 | | | | — | | | | — | |
| | | | |
| Paragon Offshore Ltd., Litigation Units, Class B | | 7/18/2017 | | | 1,466,032 | | | | 83,310 | | | | Less than 0.1% | |
| | | | | | |
| |
| | (c) | | | Illiquid security. (Unaudited) |
| |
| | (d) | | | Fair valued by the Fund’s adviser. At September 30, 2020, the value of these securities amounted to $567,719 or 0.1% of net assets. See Note 2 of Notes to Financial Statements. |
| |
| | (e) | | | Non-income producing security. |
| |
| | (f) | | | Securities classified as fair valued pursuant to the Fund’s pricing policies and procedures. At September 30, 2020, the value of these securities amounted to $4,370,513 or 0.7% of net assets. See Note 2 of Notes to Financial Statements. |
| |
| | (g) | | | Perpetual bond with no specified maturity date. |
| |
| | (h) | | | Variable rate security. Rate as of September 30, 2020 is disclosed. |
| |
| | (i) | | | The issuer is in default with respect to interest and/or principal payments. Income is not being accrued. |
| |
| | (j) | | | Security callable by issuer at any time. No specified maturity date. |
| |
| | 144A | | | All or a portion of these securities are exempt from registration under Rule 144A of the Securities Act of 1933. These securities may be resold in transactions exempt from registration, normally to qualified institutional buyers. At September 30, 2020, the value of Rule 144A holdings amounted to $122,202,717 or 19.3% of net assets. |
| | ABS | | | Asset-Backed Securities |
| | EMTN | | | Euro Medium Term Note |
| | GMTN | | | Global Medium Term Note |
| | LIBOR | | | London Interbank Offered Rate |
| | MTN | | | Medium Term Note |
| | REITs | | | Real Estate Investment Trusts |
| |
| | BRL | | | Brazilian Real |
| | CAD | | | Canadian Dollar |
| | EUR | | | Euro |
| | GBP | | | British Pound |
| | ISK | | | Icelandic Krona |
| | MXN | | | Mexican Peso |
| | NOK | | | Norwegian Krone |
Industry Summary at September 30, 2020
| | | | |
Treasuries | | | 14.0 | % |
Automotive | | | 7.7 | |
Finance Companies | | | 7.1 | |
Banking | | | 6.3 | |
Technology | | | 5.0 | |
Cable Satellite | | | 5.0 | |
Healthcare | | | 4.7 | |
Diversified Telecommunication Services | | | 3.8 | |
Pharmaceuticals | | | 3.7 | |
Life Insurance | | | 3.4 | |
Independent Energy | | | 3.0 | |
Aerospace & Defense | | | 3.0 | |
Airlines | | | 2.8 | |
Midstream | | | 2.6 | |
Metals & Mining | | | 2.1 | |
Packaging | | | 2.1 | |
Other Investments, less than 2% each | | | 18.2 | |
Short-Term Investments | | | 1.9 | |
| | | | |
Total Investments | | | 96.4 | |
Other assets less liabilities | | | 3.6 | |
| | | | |
Net Assets | | | 100.0 | % |
| | | | |
See accompanying notes to financial statements.
| 26
Portfolio of Investments – as of September 30, 2020
Loomis Sayles Global Bond Fund
| | | | | | | | |
Principal
Amount (‡) | | | Description | | Value (†) | |
|
| | Bonds and Notes – 96.2% of Net Assets | |
| |
| | | | Australia – 1.6% | |
| | 4,845,000 | | | New South Wales Treasury Corp., Series 26, 4.000%, 5/20/2026, (AUD)(a) | | $ | 4,132,374 | |
| | 9,190,000 | | | Queensland Treasury Corp., Series 27, 2.750%, 8/20/2027, 144A, (AUD)(a) | | | 7,472,917 | |
| | | | | | | | |
| | | | | | | 11,605,291 | |
| | | | | | | | |
| |
| | | | Belgium – 1.6% | |
| | 4,530,000 | | | Anheuser-Busch Cos. LLC/Anheuser-Busch InBev Worldwide, Inc., 4.700%, 2/01/2036(a) | | | 5,472,331 | |
| | 305,000 | | | Anheuser-Busch InBev Finance, Inc., 4.700%, 2/01/2036 | | | 361,114 | |
| | 1,775,000 | | | Anheuser-Busch InBev S.A., EMTN, 2.000%, 1/23/2035, (EUR)(a) | | | 2,260,501 | |
| | 1,645,000 | | | Anheuser-Busch InBev Worldwide, Inc., 4.500%, 6/01/2050(a) | | | 1,971,625 | |
| | 1,150,000 | | | Anheuser-Busch InBev Worldwide, Inc., 4.750%, 1/23/2029(a) | | | 1,403,482 | |
| | | | | | | | |
| | | | | | | 11,469,053 | |
| | | | | | | | |
| |
| | | | Bermuda – 0.4% | |
| | 1,935,000 | | | XLIT Ltd., (fixed rate to 6/29/2027, variable rate thereafter), 3.250%, 6/29/2047, (EUR)(a) | | | 2,504,203 | |
| | | | | | | | |
| |
| | | | Brazil – 3.5% | |
| | 3,245,000 | | | Banco Bradesco S.A.,
2.850%, 1/27/2023, 144A | | | 3,293,058 | |
| | 23,233(††) | | | Brazil Notas do Tesouro Nacional, Series F, 10.000%, 1/01/2027, (BRL) | | | 4,709,748 | |
| | 16,075(††) | | | Brazil Notas do Tesouro Nacional, Series F, 10.000%, 1/01/2029, (BRL) | | | 3,305,500 | |
| | 3,525,000 | | | Brazilian Government International Bond, 4.625%, 1/13/2028 | | | 3,821,135 | |
| | 3,045,000 | | | Embraer Netherlands Finance BV,
5.050%, 6/15/2025 | | | 2,923,200 | |
| | 530,000 | | | Embraer Netherlands Finance BV,
5.400%, 2/01/2027 | | | 503,235 | |
| | 2,705,000 | | | Itau Unibanco Holding S.A.,
2.900%, 1/24/2023, 144A | | | 2,735,783 | |
| | 1,780,000 | | | Republic of Brazil,
2.875%, 4/01/2021, (EUR) | | | 2,103,435 | |
| | 1,660,000 | | | Ultrapar International S.A,
5.250%, 6/06/2029, 144A | | | 1,720,607 | |
| | | | | | | | |
| | | | | | | 25,115,701 | |
| | | | | | | | |
| |
| | | | Canada – 1.5% | |
| | 2,150,000 | | | Alimentation Couche-Tard, Inc.,
1.875%, 5/06/2026, (EUR)(a) | | | 2,692,633 | |
| | 4,745,000 | | | Canadian Government Bond,
2.000%, 6/01/2028, (CAD)(a) | | | 3,979,201 | |
| |
| | | | Canada – continued | |
| | 2,585,000 | | | Fairstone Financial Issuance Trust I, Series 2019-1A, Class A,
3.948%, 3/21/2033, 144A, (CAD)(a) | | | 1,943,074 | |
| | 750,000 | | | Ford Auto Securitization Trust, Series 2019-AA, Class A3,
2.552%, 9/15/2024, 144A, (CAD)(a) | | | 580,050 | |
| | 760,000 | | | Ford Auto Securitization Trust, Series 2019-BA, Class A2,
2.321%, 10/15/2023, 144A, (CAD)(a) | | | 578,537 | |
| | 1,260,000 | | | Province of Manitoba Canada, MTN, 4.400%, 9/05/2025, (CAD)(a) | | | 1,111,048 | |
| | | | | | | | |
| | | | | | | 10,884,543 | |
| | | | | | | | |
| |
| | | | Chile – 0.3% | |
| | 2,235,000 | | | Engie Energia Chile S.A.,
3.400%, 1/28/2030(a) | | | 2,413,800 | |
| | | | | | | | |
| |
| | | | China – 5.8% | |
| | 77,630,000 | | | China Government Bond,
1.990%, 4/09/2025, (CNY)(a) | | | 10,953,902 | |
| | 16,600,000 | | | China Government Bond,
2.680%, 5/21/2030, (CNY)(a) | | | 2,352,188 | |
| | 22,000,000 | | | China Government Bond,
3.390%, 3/16/2050, (CNY)(a) | | | 2,970,964 | |
| | 27,700,000 | | | China Government Bond, Series 1906, 3.290%, 5/23/2029,
(CNY)(a) | | | 4,109,875 | |
| | 31,000,000 | | | China Government Bond, Series 1906, 3.290%, 5/23/2029,
(CNY)(a) | | | 4,599,499 | |
| | 33,630,000 | | | China Government Bond, Series 1907, 3.250%, 6/06/2026,
(CNY)(a) | | | 5,009,334 | |
| | 17,000,000 | | | China Government Bond, Series 1907, 3.250%, 6/06/2026,
(CNY)(a) | | | 2,532,223 | |
| | 58,890,000 | | | China Government Bond, Series 1916, 3.120%, 12/05/2026,
(CNY)(a) | | | 8,691,386 | |
| | | | | | | | |
| | | | | | | 41,219,371 | |
| | | | | | | | |
| |
| | | | Colombia – 1.0% | |
| | 730,000 | | | Colombia Telecomunicaciones S.A. E.S.P., 4.950%, 7/17/2030, 144A | | | 759,200 | |
| | 19,798,100,000 | | | Titulos De Tesoreria, Series B,
7.500%, 8/26/2026, (COP)(a) | | | 5,960,706 | |
| | | | | | | | |
| | | | | | | 6,719,906 | |
| | | | | | | | |
| |
| | | | Czech – 0.6% | |
| | 85,110,000 | | | Czech Republic Government Bond, 2.400%, 9/17/2025, (CZK)(a) | | | 4,030,652 | |
| | | | | | | | |
| |
| | | | Denmark – 0.8% | |
| | 33,175,000 | | | Denmark Government Bond,
1.750%, 11/15/2025, (DKK)(a) | | | 5,854,799 | |
| | | | | | | | |
| |
| | | | Finland��– 0.3% | |
| | 2,015,000 | | | Nokia OYJ, 4.375%, 6/12/2027(a) | | | 2,139,678 | |
| | | | | | | | |
See accompanying notes to financial statements.
27 |
Portfolio of Investments – as of September 30, 2020
Loomis Sayles Global Bond Fund – continued
| | | | | | | | |
Principal
Amount (‡) | | | Description | | Value (†) | |
|
| | Bonds and Notes – continued | |
| |
| | | | France – 1.1% | |
| $ | 1,840,000 | | | BNP Paribas S.A.,
4.375%, 5/12/2026, 144A(a) | | $ | 2,060,994 | |
| | 250,000 | | | Credit Agricole S.A.,
3.250%, 1/14/2030, 144A(a) | | | 267,767 | |
| | 4,700,000 | | | Unibail-Rodamco-Westfield SE, EMTN, 1.750%, 2/27/2034, (EUR)(a) | | | 5,585,270 | |
| | | | | | | | |
| | | | | | | 7,914,031 | |
| | | | | | | | |
| |
| | | | Germany – 0.9% | |
| | 300,000 | | | Allianz SE, (fixed rate to 9/25/2029, variable rate thereafter), 1.301%, 9/25/2049, (EUR)(a) | | | 349,779 | |
| | 1,740,000 | | | Bundesrepublik Deutschland Bundesanleihe, Zero Coupon, 8/15/2026, (EUR) | | | 2,127,341 | |
| | 2,630,000 | | | Deutsche Bank AG, (fixed rate to 9/18/2030, variable rate thereafter), 3.547%, 9/18/2031 | | | 2,657,453 | |
| | 235,000 | | | Deutsche Telekom AG, EMTN,
1.750%, 12/09/2049, (EUR)(a) | | | 292,791 | |
| | 520,000 | | | Volkswagen Financial Services AG, EMTN, 3.375%, 4/06/2028, (EUR)(a) | | | 707,101 | |
| | | | | | | | |
| | | | | | | 6,134,465 | |
| | | | | | | | |
| |
| | | | India – 0.5% | |
| | 3,455,000 | | | Bharti Airtel Ltd.,
4.375%, 6/10/2025, 144A(a) | | | 3,642,850 | |
| | | | | | | | |
| |
| | | | Indonesia – 1.0% | |
| | 93,413,000,000 | | | Indonesia Treasury Bond,
8.250%, 5/15/2029, (IDR)(a) | | | 6,835,220 | |
| | | | | | | | |
| |
| | | | Ireland – 0.4% | |
| | 2,560,000 | | | AIB Group PLC,
4.750%, 10/12/2023, 144A(a) | | | 2,780,540 | |
| | | | | | | | |
| |
| | | | Israel – 0.7% | |
| | 14,660,000 | | | State of Israel,
1.000%, 3/31/2030, (ILS) | | | 4,394,903 | |
| | 755,000 | | | Teva Pharmaceutical Finance Netherlands II BV,
1.125%, 10/15/2024, (EUR) | | | 763,264 | |
| | | | | | | | |
| | | | | | | 5,158,167 | |
| | | | | | | | |
| |
| | | | Italy – 6.1% | |
| | 985,000 | | | Atlantia SpA, EMTN,
1.625%, 2/03/2025, (EUR) | | | 1,093,182 | |
| | 2,045,000 | | | Atlantia SpA, EMTN,
1.875%, 7/13/2027, (EUR) | | | 2,237,520 | |
| | 1,600,000 | | | Enel Finance International NV,
6.000%, 10/07/2039, 144A(a) | | | 2,175,120 | |
| | 620,000 | | | Intesa Sanpaolo SpA,
5.017%, 6/26/2024, 144A | | | 651,578 | |
| | 3,670,000 | | | Intesa Sanpaolo SpA,
5.710%, 1/15/2026, 144A | | | 4,001,286 | |
| | 1,250,000 | | | Intesa Sanpaolo SpA, Series XR,
4.000%, 9/23/2029, 144A(a) | | | 1,354,870 | |
| |
| | | | Italy – continued | |
| | 18,045,000 | | | Italy Buoni Poliennali Del Tesoro, 1.350%, 4/01/2030, (EUR)(a) | | | 22,247,196 | |
| | 850,000 | | | Leonardo U.S. Holdings, Inc.,
7.375%, 7/15/2039, 144A | | | 1,055,539 | |
| | 380,000 | | | Telecom Italia SpA,
5.303%, 5/30/2024, 144A | | | 411,350 | |
| | 605,000 | | | UniCredit SpA, (fixed rate to 4/02/2029, variable rate thereafter), 7.296%, 4/02/2034, 144A | | | 696,168 | |
| | 350,000 | | | UniCredit SpA,
6.572%, 1/14/2022, 144A(a) | | | 371,426 | |
| | 300,000 | | | UniCredit SpA, (fixed rate to 1/15/2027, variable rate thereafter), 2.731%, 1/15/2032, (EUR) | | | 331,510 | |
| | 340,000 | | | UniCredit SpA, (fixed rate to 2/20/2024, variable rate thereafter), EMTN,
4.875%, 2/20/2029, (EUR) | | | 422,029 | |
| | 1,465,000 | | | UniCredit SpA, (fixed rate to 6/19/2027, variable rate thereafter), 5.861%, 6/19/2032, 144A(a) | | | 1,558,321 | |
| | 4,095,000 | | | UniCredit SpA, (fixed rate to 9/23/2024, variable rate thereafter), EMTN,
2.000%, 9/23/2029, (EUR)(a) | | | 4,525,114 | |
| | | | | | | | |
| | | | | | | 43,132,209 | |
| | | | | | | | |
| |
| | | | Japan – 6.5% | |
| | 1,971,175,581(†††) | | | Japan Government CPI Linked Bond, 0.100%, 3/10/2029, (JPY)(a) | | | 18,675,293 | |
| | 678,411,256(†††) | | | Japan Government CPI Linked Bond, Series 23,
0.100%, 3/10/2028, (JPY)(a) | | | 6,426,175 | |
| | 271,150,000 | | | Japan Government Thirty Year Bond, Series 26,
2.400%, 3/20/2037, (JPY)(a) | | | 3,435,415 | |
| | 572,450,000 | | | Japan Government Thirty Year Bond, Series 41,
1.700%, 12/20/2043, (JPY)(a) | | | 6,887,801 | |
| | 480,200,000 | | | Japan Government Thirty Year Bond, Series 51,
0.300%, 6/20/2046, (JPY)(a) | | | 4,312,534 | |
| | 724,400,000 | | | Japan Government Thirty Year Bond, Series 62,
0.500%, 3/20/2049, (JPY)(a) | | | 6,738,194 | |
| | | | | | | | |
| | | | | | | 46,475,412 | |
| | | | | | | | |
| |
| | | | Malaysia – 1.2% | |
| | 28,630,000 | | | Malaysia Government Bond, Series 0119, 3.906%, 7/15/2026, (MYR)(a) | | | 7,442,952 | |
| | 5,040,000 | | | Malaysia Government Bond, Series 0215, 3.795%, 9/30/2022, (MYR)(a) | | | 1,258,108 | |
| | | | | | | | |
| | | | | | | 8,701,060 | |
| | | | | | | | |
See accompanying notes to financial statements.
| 28
Portfolio of Investments – as of September 30, 2020
Loomis Sayles Global Bond Fund – continued
| | | | | | | | |
Principal
Amount (‡) | | | Description | | Value (†) | |
|
| | Bonds and Notes – continued | |
| |
| | | | Mexico – 3.9% | |
| $ | 2,120,000 | | | America Movil SAB de CV,
2.875%, 5/07/2030(a) | | $ | 2,296,214 | |
| | 3,255,000 | | | America Movil SAB de CV,
3.625%, 4/22/2029(a) | | | 3,683,911 | |
| | 405,000 | | | Cemex SAB de CV,
5.200%, 9/17/2030, 144A | | | 406,985 | |
| | 880,000 | | | Cemex SAB de CV,
5.450%, 11/19/2029, 144A | | | 889,900 | |
| | 200,000 | | | Cemex SAB de CV,
5.450%, 11/19/2029 | | | 202,250 | |
| | 250,000 | | | Cemex SAB de CV,
5.700%, 1/11/2025 | | | 255,241 | |
| | 2,584,000 | | | Fomento Economico Mexicano SAB de CV, 3.500%, 1/16/2050(a) | | | 2,748,751 | |
| | 665,000 | | | Grupo Bimbo SAB de CV,
4.000%, 9/06/2049(a) | | | 698,157 | |
| | 200,000 | | | Grupo Bimbo SAB de CV,
4.700%, 11/10/2047(a) | | | 233,290 | |
| | 234,271(††††) | | | Mexican Fixed Rate Bonds, Series M, 6.500%, 6/10/2021, (MXN)(a) | | | 1,073,388 | |
| | 1,368,435(††††) | | | Mexican Fixed Rate Bonds, Series M 20, 8.500%, 5/31/2029, (MXN)(a) | | | 7,317,567 | |
| | 1,025,000 | | | Orbia Advance Corp. SAB de CV,
5.875%, 9/17/2044, 144A(a) | | | 1,194,125 | |
| | 190,000 | | | Petroleos Mexicanos,
5.625%, 1/23/2046(a) | | | 139,080 | |
| | 465,000 | | | Petroleos Mexicanos,
6.350%, 2/12/2048(a) | | | 349,913 | |
| | 910,000 | | | Petroleos Mexicanos,
6.750%, 9/21/2047(a) | | | 706,342 | |
| | 2,060,000 | | | Sigma Alimentos S.A. de CV,
4.125%, 5/02/2026(a) | | | 2,192,870 | |
| | 2,165,000 | | | Sigma Alimentos S.A. de CV,
4.125%, 5/02/2026, 144A(a) | | | 2,304,643 | |
| | 655,000 | | | Sigma Finance Netherlands BV,
4.875%, 3/27/2028 | | | 722,144 | |
| | | | | | | | |
| | | | | | | 27,414,771 | |
| | | | | | | | |
| |
| | | | Netherlands – 0.5% | |
| | 440,000 | | | NXP BV/NXP Funding LLC/NXP USA, Inc., 3.400%, 5/01/2030, 144A(a) | | | 481,672 | |
| | 2,765,000 | | | NXP BV/NXP Funding LLC/NXP USA, Inc., 4.300%, 6/18/2029, 144A(a) | | | 3,187,300 | |
| | | | | | | | |
| | | | | | | 3,668,972 | |
| | | | | | | | |
| |
| | | | New Zealand – 0.1% | |
| | 1,045,000 | | | New Zealand Government Bond, Series 0423, 5.500%, 4/15/2023, (NZD)(a) | | | 787,710 | |
| | | | | | | | |
| |
| | | | Norway – 1.8% | |
| | 320,000 | | | Aker BP ASA,
3.750%, 1/15/2030, 144A | | | 310,340 | |
| | 2,520,000 | | | Aker BP ASA,
4.000%, 1/15/2031, 144A | | | 2,478,355 | |
| |
| | | | Norway – continued | |
| | 45,000,000 | | | City of Oslo, Norway,
3.550%, 2/12/2021, (NOK)(a) | | | 4,880,938 | |
| | 38,675,000 | | | Norway Government Bond, Series 475, 2.000%, 5/24/2023, 144A, (NOK)(a) | | | 4,344,835 | |
| | 9,420,000 | | | Norway Government Bond, Series 477, 1.750%, 3/13/2025, 144A, (NOK)(a) | | | 1,074,451 | |
| | | | | | | | |
| | | | | | | 13,088,919 | |
| | | | | | | | |
| |
| | | | Poland – 0.7% | |
| | 16,435,000 | | | Republic of Poland Government Bond, Series 0726,
2.500%, 7/25/2026, (PLN)(a) | | | 4,658,728 | |
| | | | | | | | |
| |
| | | | Portugal – 0.3% | |
| | 420,000 | | | EDP Finance BV,
1.710%, 1/24/2028, 144A | | | 417,707 | |
| | 1,040,000 | | | EDP Finance BV,
3.625%, 7/15/2024, 144A | | | 1,131,088 | |
| | 350,000 | | | EDP Finance BV, EMTN,
0.375%, 9/16/2026, (EUR) | | | 412,737 | |
| | 125,000 | | | EDP Finance BV, EMTN,
1.625%, 1/26/2026, (EUR) | | | 157,306 | |
| | | | | | | | |
| | | | | | | 2,118,838 | |
| | | | | | | | |
| |
| | | | South Africa – 1.6% | |
| | 730,000 | | | Anglo American Capital PLC,
5.375%, 4/01/2025, 144A(a) | | | 839,139 | |
| | 1,035,000 | | | Anglo American Capital PLC,
5.625%, 4/01/2030, 144A(a) | | | 1,270,380 | |
| | 190,570,000 | | | Republic of South Africa, Series R213, 7.000%, 2/28/2031, (ZAR) | | | 9,250,656 | |
| | | | | | | | |
| | | | | | | 11,360,175 | |
| | | | | | | | |
| |
| | | | Spain – 3.5% | |
| | 3,400,000 | | | Banco Bilbao Vizcaya Argentaria S.A., GMTN, (fixed rate to 1/16/2025, variable rate thereafter), 1.000%, 1/16/2030, (EUR)(a) | | | 3,798,294 | |
| | 600,000 | | | Banco Santander S.A.,
4.250%, 4/11/2027(a) | | | 678,338 | |
| | 2,600,000 | | | Banco Santander S.A.,
5.179%, 11/19/2025(a) | | | 2,945,124 | |
| | 1,700,000 | | | CaixaBank S.A., (fixed rate to 4/17/2025, variable rate thereafter), EMTN, 2.250%, 4/17/2030, (EUR) | | | 2,012,171 | |
| | 400,000 | | | CaixaBank S.A., (fixed rate to 7/14/2023, variable rate thereafter), EMTN, 2.750%, 7/14/2028, (EUR) | | | 481,988 | |
| | 1,420,000 | | | Grifols S.A., 1.625%, 2/15/2025, (EUR) | | | 1,642,476 | |
| | 2,460,000 | | | Spain Government Bond,
1.950%, 7/30/2030, 144A, (EUR)(a) | | | 3,373,968 | |
| | 2,835,000 | | | Spain Government Bond,
2.700%, 10/31/2048, 144A, (EUR)(a) | | | 4,692,502 | |
See accompanying notes to financial statements.
29 |
Portfolio of Investments – as of September 30, 2020
Loomis Sayles Global Bond Fund – continued
| | | | | | | | |
Principal
Amount (‡) | | | Description | | Value (†) | |
|
| | Bonds and Notes – continued | |
| |
| | | | Spain – continued | |
| | 2,835,000 | | | Spain Government Bond,
4.200%, 1/31/2037, 144A, (EUR)(a) | | $ | 5,187,510 | |
| | | | | | | | |
| | | | | | | 24,812,371 | |
| | | | | | | | |
| |
| | | | Supranationals – 0.7% | |
| | 2,665,000 | | | Inter-American Development Bank,
4.400%, 1/26/2026, (CAD)(a) | | | 2,385,281 | |
| | 37,000,000,000 | | | International Bank for Reconstruction & Development, EMTN, 8.400%, 10/12/2021, (IDR)(a) | | | 2,559,763 | |
| | | | | | | | |
| | | | | | | 4,945,044 | |
| | | | | | | | |
| |
| | | | Sweden – 0.5% | |
| | 27,455,000 | | | Sweden Government Bond, Series 1057, 1.500%, 11/13/2023, 144A, (SEK)(a) | | | 3,243,184 | |
| | | | | | | | |
| |
| | | | Switzerland – 0.4% | |
| | 105,000 | | | Argentum Netherlands BV for Zurich Insurance Co. Ltd., EMTN, (fixed rate to 10/01/2026, variable rate thereafter),
3.500%, 10/01/2046, (EUR)(a) | | | 139,186 | |
| | 285,000 | | | Cloverie PLC for Zurich Insurance Co. Ltd., EMTN, (fixed rate to 6/24/2026, variable rate thereafter), 5.625%, 6/24/2046(a) | | | 329,817 | |
| | 1,765,000 | | | Credit Suisse Group AG, (fixed rate to 4/01/2030, variable rate thereafter), 4.194%, 4/01/2031, 144A(a) | | | 2,037,675 | |
| | 510,000 | | | Willow No. 2 (Ireland) PLC for Zurich Insurance Co. Ltd., EMTN, (fixed rate to 10/01/2025, variable rate thereafter),
4.250%, 10/01/2045(a) | | | 546,946 | |
| | | | | | | | |
| | | | | | | 3,053,624 | |
| | | | | | | | |
| |
| | | | Thailand – 0.3% | |
| | 74,870,000 | | | Thailand Government Bond,
1.600%, 12/17/2029, (THB)(a) | | | 2,413,434 | |
| | | | | | | | |
| |
| | | | United Arab Emirates – 0.6% | |
| | 735,000 | | | DP World Crescent Ltd., MTN,
4.848%, 9/26/2028(a) | | | 813,719 | |
| | 1,180,000 | | | DP World PLC, MTN,
4.700%, 9/30/2049(a) | | | 1,191,800 | |
| | 1,755,000 | | | DP World PLC, MTN,
5.625%, 9/25/2048(a) | | | 2,000,700 | |
| | | | | | | | |
| | | | | | | 4,006,219 | |
| | | | | | | | |
| |
| | | | United Kingdom – 7.9% | |
| | 1,120,000 | | | Aviva PLC, (fixed rate to 3/03/2035, variable rate thereafter),
4.000%, 6/03/2055, (GBP)(a) | | | 1,514,618 | |
| | 1,300,000 | | | Aviva PLC, EMTN, (fixed rate to 12/04/2025, variable rate thereafter),
3.375%, 12/04/2045, (EUR)(a) | | | 1,637,919 | |
| |
| | | | United Kingdom – continued | |
| | 360,000 | | | Aviva PLC, EMTN, (fixed rate to 9/12/2029, variable rate thereafter),
4.375%, 9/12/2049, (GBP) | | $ | 515,186 | |
| | 1,425,000 | | | Barclays PLC, 4.337%, 1/10/2028(a) | | | 1,586,823 | |
| | 1,050,000 | | | Barclays PLC, (fixed rate to 9/23/2030, variable rate thereafter),
3.564%, 9/23/2035 | | | 1,037,652 | |
| | 1,680,000 | | | Barclays PLC, EMTN, (fixed rate to 1/24/2025, variable rate thereafter),
1.375%, 1/24/2026, (EUR) | | | 2,006,159 | |
| | 1,080,000 | | | Barclays PLC, EMTN, (fixed rate to 2/07/2023, variable rate thereafter),
2.000%, 2/07/2028, (EUR)(a) | | | 1,256,268 | |
| | 1,580,506 | | | Brass PLC, Series 8A, Class A1,
3-month LIBOR + 0.700%, 0.980%, 11/16/2066, 144A(a)(b) | | | 1,584,407 | |
| | 3,490,000 | | | British Telecommunications PLC,
3.250%, 11/08/2029, 144A(a) | | | 3,736,489 | |
| | 1,535,000 | | | British Telecommunications PLC,
5.125%, 12/04/2028(a) | | | 1,849,942 | |
| | 100,000 | | | British Telecommunications PLC, EMTN, 1.125%, 9/12/2029, (EUR) | | | 117,506 | |
| | 1,370,000 | | | Channel Link Enterprises Finance PLC, Series A7, (fixed rate to 6/20/2022, variable rate thereafter),
1.761%, 6/30/2050, (EUR)(a) | | | 1,593,695 | |
| | 1,055,000 | | | Channel Link Enterprises Finance PLC, Series A8, (fixed rate to 6/20/2027, variable rate thereafter),
2.706%, 6/30/2050, (EUR)(a) | | | 1,270,938 | |
| | 3,350,000 | | | CK Hutchison International 19 Ltd., 3.625%, 4/11/2029, 144A(a) | | | 3,796,455 | |
| | 2,268,000 | | | Co-Operative Bank PLC (The),
4.750%, 11/11/2021, (GBP)(a) | | | 3,043,976 | |
| | 840,393 | | | Gosforth Funding PLC, Series 2018-1A, Class A1,
3-month LIBOR + 0.450%, 0.700%, 8/25/2060, 144A(a)(b) | | | 840,243 | |
| | 2,360,000 | | | Heathrow Funding Ltd., EMTN,
1.875%, 3/14/2036, (EUR)(a) | | | 2,569,358 | |
| | 2,030,000 | | | Lanark Master Issuer PLC, Series 2019-2A, Class 1A,
2.710%, 12/22/2069, 144A(a)(c) | | | 2,069,831 | |
| | 1,070,000 | | | Lanark Master Issuer PLC, Series 2020-1A, Class 1A,
2.277%, 12/22/2069, 144A(a)(c) | | | 1,089,613 | |
| | 190,000 | | | Lanark Master Issuer PLC, Series 2020-1A, Class 2A,
3-month SONIA + 0.570%, 0.633%, 12/22/2069, 144A, (GBP)(a)(b) | | | 243,350 | |
| | 2,250,000 | | | Lloyds Banking Group PLC, (fixed rate to 7/09/2024, variable rate thereafter), 3.870%, 7/09/2025(a) | | | 2,448,843 | |
| | 460,000 | | | Lloyds Banking Group PLC, (fixed rate to 3/18/2025, variable rate thereafter), EMTN,
4.500%, 3/18/2030, (EUR)(a) | | | 596,075 | |
See accompanying notes to financial statements.
| 30
Portfolio of Investments – as of September 30, 2020
Loomis Sayles Global Bond Fund – continued
| | | | | | | | |
Principal
Amount (‡) | | | Description | | Value (†) | |
|
| | Bonds and Notes – continued | |
| |
| | | | United Kingdom – continued | |
| | 130,000 | | | Lloyds Banking Group PLC, (fixed rate to 9/07/2023, variable rate thereafter), EMTN,
1.750%, 9/07/2028, (EUR) | | $ | 153,082 | |
| | 1,405,000 | | | Nationwide Building Society, (fixed rate to 7/25/2024, variable rate thereafter), EMTN,
2.000%, 7/25/2029, (EUR)(a) | | | 1,683,104 | |
| | 1,660,000 | | | NatWest Group PLC,
5.125%, 5/28/2024(a) | | | 1,820,435 | |
| | 305,000 | | | Network Rail Infrastructure Finance PLC, EMTN, 4.750%, 1/22/2024, (GBP)(a) | | | 452,661 | |
| | 1,225,000 | | | Penarth Master Issuer PLC, Series 2019-1A, Class A1,
1-month LIBOR + 0.540%, 0.690%, 7/18/2023, 144A(a)(b) | | | 1,224,343 | |
| | 225,000 | | | Standard Chartered PLC, (fixed rate to 4/01/2030, variable rate thereafter), 4.644%, 4/01/2031, 144A(a) | | | 258,993 | |
| | 435,000 | | | United Kingdom Gilt,
1.500%, 7/22/2047, (GBP)(a) | | | 660,776 | |
| | 4,995,000 | | | United Kingdom Gilt,
3.500%, 1/22/2045, (GBP)(a) | | | 10,365,774 | |
| | 350,000 | | | United Kingdom Gilt,
4.500%, 9/07/2034, (GBP)(a) | | | 697,706 | |
| | 2,035,000 | | | Vodafone Group PLC,
5.250%, 5/30/2048(a) | | | 2,630,894 | |
| | | | | | | | |
| | | | | | | 56,353,114 | |
| | | | | | | | |
| |
| | | | United States – 37.6% | |
| | 565,000 | | | AEP Transmission Co. LLC, Series M, 3.650%, 4/01/2050(a) | | | 658,869 | |
| | 560,000 | | | AES Corp. (The),
3.950%, 7/15/2030, 144A(a) | | | 618,778 | |
| | 290,000,000 | | | Aflac, Inc.,
0.932%, 1/25/2027, (JPY)(a) | | | 2,779,342 | |
| | 390,000,000 | | | Aflac, Inc., (fixed rate to 10/23/2027, variable rate thereafter), 2.108%, 10/23/2047, (JPY)(a) | | | 3,886,429 | |
| | 155,000 | | | Air Lease Corp.,
2.250%, 1/15/2023(a) | | | 155,983 | |
| | 25,000 | | | Air Lease Corp.,
3.250%, 3/01/2025 | | | 25,432 | |
| | 263,000 | | | Air Lease Corp.,
3.250%, 10/01/2029(a) | | | 249,474 | |
| | 90,000 | | | Air Lease Corp.,
4.625%, 10/01/2028 | | | 93,018 | |
| | 845,000 | | | Air Lease Corp., MTN,
3.000%, 2/01/2030(a) | | | 786,900 | |
| | 275,000 | | | Ally Financial, Inc.,
3.875%, 5/21/2024 | | | 293,066 | |
| | 590,000 | | | Ally Financial, Inc.,
4.625%, 3/30/2025 | | | 648,083 | |
| | 360,000 | | | Ally Financial, Inc.,
5.800%, 5/01/2025 | | | 415,210 | |
| | 2,980,000 | | | American Tower Corp.,
2.400%, 3/15/2025(a) | | | 3,149,339 | |
| |
| | | | United States – continued | |
| $ | 717,000 | | | AT&T, Inc.,
3.550%, 9/15/2055, 144A | | | 694,897 | |
| | 3,390,000 | | | AT&T, Inc., 3.650%, 6/01/2051(a) | | | 3,419,325 | |
| | 269,000 | | | AT&T, Inc.,
3.650%, 9/15/2059, 144A | | | 264,252 | |
| | 222,000 | | | AT&T, Inc., 4.350%, 6/15/2045 | | | 248,733 | |
| | 1,390,000 | | | AT&T, Inc., 4.500%, 3/09/2048 | | | 1,595,184 | |
| | 2,050,000 | | | Avis Budget Rental Car Funding AESOP LLC, Series 2016-1A, Class A, 2.990%, 6/20/2022, 144A(a) | | | 2,066,509 | |
| | 1,290,000 | | | Avis Budget Rental Car Funding AESOP LLC, Series 2019-1A, Class A, 3.450%, 3/20/2023, 144A(a) | | | 1,320,066 | |
| | 1,805,000 | | | Bank of America Corp., (fixed rate to 2/13/2030, variable rate thereafter), MTN,
2.496%, 2/13/2031(a) | | | 1,897,697 | |
| | 2,825,000 | | | Bank of America Corp., (fixed rate to 4/29/2030, variable rate thereafter), 2.592%, 4/29/2031(a) | | | 3,005,577 | |
| | 406,944 | | | Bayview Opportunity Master Fund IVa Trust, Series 2016-SPL1, Class A, 4.000%, 4/28/2055, 144A(a) | | | 417,945 | |
| | 798,736 | | | Bayview Opportunity Master Fund IVb Trust, Series 2019-RN4, Class A1, 3.278%, 10/28/2034, 144A(a)(c) | | | 796,161 | |
| | 85,000 | | | Boeing Co. (The), 2.250%, 6/15/2026 | | | 82,737 | |
| | 160,000 | | | Boeing Co. (The),
3.100%, 5/01/2026(a) | | | 159,606 | |
| | 10,000 | | | Boeing Co. (The),
3.250%, 2/01/2035 | | | 9,400 | |
| | 120,000 | | | Boeing Co. (The),
3.550%, 3/01/2038(a) | | | 109,313 | |
| | 40,000 | | | Boeing Co. (The),
3.625%, 3/01/2048 | | | 35,152 | |
| | 485,000 | | | Boeing Co. (The),
3.750%, 2/01/2050(a) | | | 442,567 | |
| | 195,000 | | | Boeing Co. (The),
3.825%, 3/01/2059(a) | | | 171,876 | |
| | 235,000 | | | Boeing Co. (The),
3.850%, 11/01/2048(a) | | | 215,337 | |
| | 560,000 | | | Boeing Co. (The),
3.950%, 8/01/2059(a) | | | 506,947 | |
| | 210,000 | | | Boeing Co. (The),
5.805%, 5/01/2050(a) | | | 254,054 | |
| | 2,270,000 | | | Boston Scientific Corp.,
0.625%, 12/01/2027, (EUR)(a) | | | 2,646,051 | |
| | 94,000 | | | Broadcom Corp./Broadcom Cayman Finance Ltd.,
3.500%, 1/15/2028 | | | 101,563 | |
| | 300,000 | | | Broadcom Corp./Broadcom Cayman Finance Ltd.,
3.875%, 1/15/2027 | | | 332,372 | |
| | 1,635,000 | | | Broadcom, Inc.,
4.300%, 11/15/2032 | | | 1,867,809 | |
See accompanying notes to financial statements.
31 |
Portfolio of Investments – as of September 30, 2020
Loomis Sayles Global Bond Fund – continued
| | | | | | | | |
Principal
Amount (‡) | | | Description | | Value (†) | |
|
| | Bonds and Notes – continued | |
| |
| | | | United States – continued | |
| $ | 265,000 | | | Broadcom, Inc.,
4.750%, 4/15/2029 | | $ | 308,740 | |
| | 3,735,000 | | | Broadcom, Inc.,
5.000%, 4/15/2030(a) | | | 4,405,796 | |
| | 625,000 | | | CCO Holdings LLC/CCO Holdings Capital Corp.,
4.500%, 5/01/2032, 144A | | | 652,344 | |
| | 2,290,000 | | | Centene Corp.,
3.375%, 2/15/2030 | | | 2,375,875 | |
| | 4,051,000 | | | Centene Corp.,
4.625%, 12/15/2029(a) | | | 4,369,652 | |
| | 2,910,000 | | | Centene Corp.,
3.000%, 10/15/2030 | | | 2,968,782 | |
| | 400,000 | | | Charter Communications Operating LLC/Charter Communications Operating Capital Corp.,
2.800%, 4/01/2031 | | | 416,006 | |
| | 805,000 | | | Charter Communications Operating LLC/Charter Communications Operating Capital Corp.,
3.700%, 4/01/2051 | | | 795,574 | |
| | 1,090,000 | | | Charter Communications Operating LLC/Charter Communications Operating Capital Corp.,
4.800%, 3/01/2050 | | | 1,239,476 | |
| | 3,525,000 | | | Charter Communications Operating LLC/Charter Communications Operating Capital Corp.,
5.050%, 3/30/2029(a) | | | 4,225,007 | |
| | 905,000 | | | Charter Communications Operating LLC/Charter Communications Operating Capital Corp.,
5.125%, 7/01/2049 | | | 1,049,305 | |
| | 1,860,000 | | | Chevron Phillips Chemical Co. LLC/Chevron Phillips Chemical Co. LP, 5.125%, 4/01/2025, 144A(a) | | | 2,187,657 | |
| | 1,667,516 | | | Citigroup Mortgage Loan Trust, Series 2019-E, Class A1,
3.228%, 11/25/2070, 144A(a)(c) | | | 1,686,221 | |
| | 1,162,594 | | | Citigroup Mortgage Loan Trust, Series 2018-A, Class A1,
4.000%, 1/25/2068, 144A(a)(c) | | | 1,167,775 | |
| | 4,047,495 | | | Citigroup Mortgage Loan Trust, Series 2018-C, Class A1,
4.125%, 3/25/2059, 144A(a)(c) | | | 4,115,245 | |
| | 1,688,799 | | | Citigroup Mortgage Loan Trust, Series 2019-B, Class A1,
3.258%, 4/25/2066, 144A(a)(c) | | | 1,707,968 | |
| | 1,945,000 | | | Citigroup, Inc., (fixed rate to 3/31/2030, variable rate thereafter), 4.412%, 3/31/2031(a) | | | 2,331,523 | |
| | 2,930,000 | | | Citigroup, Inc., Series MPLE,
4.090%, 6/09/2025, (CAD)(a) | | | 2,405,458 | |
| |
| | | | United States – continued | |
| 2,570,000 | | | Commercial Mortgage Trust, Series 2013-GAM, Class A2,
3.367%, 2/10/2028, 144A(a) | | | 2,462,815 | |
| | 3,475,000 | | | Constellation Brands, Inc.,
3.150%, 8/01/2029(a) | | | 3,793,313 | |
| | 405,000 | | | Constellation Brands, Inc.,
3.750%, 5/01/2050(a) | | | 452,214 | |
| | 600,000,000 | | | Corning, Inc.,
0.698%, 8/09/2024, (JPY)(a) | | | 5,642,213 | |
| | 1,933,320 | | | Credit Suisse Mortgage Trust, Series 2018-RPL2, Class A1,
4.311%, 8/25/2062, 144A(a)(c) | | | 1,948,119 | |
| | 1,377,834 | | | Credit Suisse Mortgage Trust, Series 2019-RP10, Class A1,
3.120%, 12/26/2059, 144A(a)(c) | | | 1,321,369 | |
| | 660,000 | | | CVS Health Corp.,
3.250%, 8/15/2029(a) | | | 726,005 | |
| | 885,000 | | | CVS Health Corp.,
4.100%, 3/25/2025(a) | | | 999,723 | |
| | 475,000 | | | Dell International LLC/EMC Corp., 5.300%, 10/01/2029, 144A | | | 544,777 | |
| | 2,755,000 | | | Dell International LLC/EMC Corp., 6.200%, 7/15/2030, 144A(a) | | | 3,300,638 | |
| | 1,675,000 | | | Delta Air Lines, Inc./SkyMiles IP Ltd., 4.500%, 10/20/2025, 144A | | | 1,719,978 | |
| | 355,509 | | | Diamond Resorts Owner Trust, Series 2018-1, Class A,
3.700%, 1/21/2031, 144A(a) | | | 368,884 | |
| | 5,240,000 | | | Diamondback Energy, Inc.,
3.500%, 12/01/2029(a) | | | 5,079,785 | |
| | 1,180,000 | | | Dominion Energy, Inc., Class C,
3.375%, 4/01/2030(a) | | | 1,330,485 | |
| | 745,000 | | | Duke Realty LP,
2.875%, 11/15/2029(a) | | | 812,677 | |
| | 1,300,000 | | | Energy Transfer Operating LP,
5.150%, 3/15/2045(a) | | | 1,177,013 | |
| | 1,255,000 | | | Enterprise Products Operating LLC, 2.800%, 1/31/2030(a) | | | 1,335,893 | |
| | 295,000 | | | Enterprise Products Operating LLC, 3.125%, 7/31/2029(a) | | | 321,202 | |
| | 160,000 | | | Enterprise Products Operating LLC, 3.700%, 1/31/2051(a) | | | 157,780 | |
| | 300,000 | | | Enterprise Products Operating LLC, 4.150%, 10/16/2028(a) | | | 350,917 | |
| | 130,000 | | | FedEx Corp.,
4.050%, 2/15/2048(a) | | | 149,288 | |
| | 585,000 | | | Ferguson Finance PLC,
3.250%, 6/02/2030, 144A(a) | | | 635,839 | |
| | 2,367,862 | | | FHLMC, 4.000%, with various maturities from 2046 to 2048(a)(d) | | | 2,575,616 | |
| | 889,548 | | | FHLMC, 4.500%, with various maturities from 2044 to 2048(a)(d) | | | 992,138 | |
| | 775,000 | | | Fidelity National Information Services, Inc.,
1.000%, 12/03/2028, (EUR)(a) | | | 931,710 | |
| | 582,220 | | | FNMA, 3.000%, 11/01/2046(a) | | | 611,983 | |
| | 2,106,552 | | | FNMA, 3.500%, with various maturities from 2045 to 2048(a)(d) | | | 2,257,071 | |
| | 496,626 | | | FNMA, 4.000%, 10/01/2047(a) | | | 534,670 | |
See accompanying notes to financial statements.
| 32
Portfolio of Investments – as of September 30, 2020
Loomis Sayles Global Bond Fund – continued
| | | | | | | | |
Principal
Amount (‡) | | | Description | | Value (†) | |
|
| | Bonds and Notes – continued | |
| |
| | | | United States – continued | |
| $ | 1,742,754 | | | FNMA, 4.500%, with various maturities from 2043 to 2047(a)(d) | | $ | 1,928,701 | |
| | 955,000 | | | Freeport-McMoRan, Inc.,
4.125%, 3/01/2028 | | | 966,937 | |
| | 990,000 | | | Freeport-McMoRan, Inc.,
4.250%, 3/01/2030 | | | 1,014,750 | |
| | 125,000 | | | Freeport-McMoRan, Inc.,
5.000%, 9/01/2027 | | | 130,569 | |
| | 615,000 | | | GATX Corp.,
4.000%, 6/30/2030(a) | | | 708,439 | |
| | 976,364 | | | GCAT LLC, Series 2020-1, Class A1, 2.981%, 1/26/2060, 144A(a)(c) | | | 960,356 | |
| | 1,415,000 | | | GE Capital Funding LLC,
4.550%, 5/15/2032, 144A(a) | | | 1,520,933 | |
| | 2,080,000 | | | General Electric Co.,
4.350%, 5/01/2050(a) | | | 2,120,790 | |
| | 2,995,000 | | | General Motors Co. ,
6.125%, 10/01/2025(a) | | | 3,479,168 | |
| | 315,000 | | | General Motors Financial Co., Inc., EMTN, 0.955%, 9/07/2023, (EUR)(a) | | | 368,049 | |
| | 1,010,798 | | | GNMA, 1-month LIBOR + 1.770%, 1.948%, 5/20/2064(a)(b) | | | 1,058,303 | |
| | 864,541 | | | GNMA, 1-month LIBOR + 2.002%, 2.180%, 11/20/2064(a)(b) | | | 926,775 | |
| | 1,064,495 | | | GNMA, 1-month LIBOR + 2.057%, 2.235%, 11/20/2064(a)(b) | | | 1,135,789 | |
| | 1,993,350 | | | GNMA, 1-month LIBOR + 2.313%, 2.491%, 10/20/2063(a)(b) | | | 2,101,826 | |
| | 1,839 | | | GNMA, 3.890%, 6/20/2062(a)(c) | | | 1,845 | |
| | 148,536 | | | GNMA, 3.905%, 1/20/2063(a)(c) | | | 152,015 | |
| | 225,987 | | | GNMA, 4.481%, 4/20/2065(a)(c) | | | 253,251 | |
| | 1,481,928 | | | GNMA, 4.567%, 2/20/2065(a)(c) | | | 1,643,739 | |
| | 5,062 | | | GNMA, 4.630%, 12/20/2061(a)(c) | | | 5,180 | |
| | 1,291,409 | | | GNMA, 4.644%, 7/20/2064(a)(c) | | | 1,420,404 | |
| | 1,381,468 | | | GNMA, 4.654%, 7/20/2064(a)(c) | | | 1,524,826 | |
| | 2,539,079 | | | GNMA, 4.664%, 5/20/2064(a)(c) | | | 2,784,502 | |
| | 260,000 | | | HCA, Inc., 3.500%, 9/01/2030 | | | 264,909 | |
| | 800,000 | | | IQVIA, Inc., 2.250%, 1/15/2028, (EUR) | | | 916,668 | |
| | 715,000 | | | Keurig Dr Pepper, Inc.,
3.430%, 6/15/2027(a) | | | 796,088 | |
| | 2,085,000 | | | Keurig Dr Pepper, Inc.,
3.800%, 5/01/2050(a) | | | 2,398,835 | |
| | 90,000 | | | Kinder Morgan, Inc.,
5.050%, 2/15/2046(a) | | | 101,608 | |
| | 3,660,000 | | | Kraft Heinz Foods Co.,
3.750%, 4/01/2030, 144A(a) | | | 3,866,085 | |
| | 845,000 | | | Kraft Heinz Foods Co.,
4.375%, 6/01/2046 | | | 867,029 | |
| | 2,438,476 | | | Legacy Mortgage Asset Trust, Series 2019-GS7, Class A1,
3.250%, 11/25/2059, 144A(a)(c) | | | 2,438,493 | |
| | 2,205,539 | | | Legacy Mortgage Asset Trust, Series 2020-GS1, Class A1,
2.882%, 10/25/2059, 144A(a)(c) | | | 2,211,129 | |
| | 60,000 | | | Lennar Corp., 5.000%, 6/15/2027 | | | 67,800 | |
| |
| | | | United States – continued | |
| 920,000 | | | Nutrition & Biosciences, Inc.,
2.300%, 11/01/2030, 144A | | | 927,744 | |
| | 1,825,000 | | | Nutrition & Biosciences, Inc.,
3.468%, 12/01/2050, 144A | | | 1,842,661 | |
| | 1,356,678 | | | OSW Structured Asset Trust, Series 2020-RPL1, Class A1,
3.072%, 12/26/2059, 144A(a)(c) | | | 1,377,007 | |
| | 895,000 | | | Owens Corning,
3.875%, 6/01/2030(a) | | | 1,013,097 | |
| | 906,116 | | | Preston Ridge Partners Mortgage LLC, Series 2019-3A, Class A1,
3.351%, 7/25/2024, 144A(a)(c) | | | 903,443 | |
| | 1,335,850 | | | Preston Ridge Partners Mortgage LLC, Series 2019-4A, Class A1,
3.351%, 11/25/2024, 144A(a)(c) | | | 1,337,704 | |
| | 771,639 | | | Preston Ridge Partners Mortgage LLC, Series 2020-1A, Class A1,
2.981%, 2/25/2025, 144A(a)(c) | | | 768,854 | |
| | 1,595,000 | | | Prologis Euro Finance LLC,
0.250%, 9/10/2027, (EUR)(a) | | | 1,867,335 | |
| | 530,000 | | | Prologis Euro Finance LLC,
0.375%, 2/06/2028, (EUR)(a) | | | 624,611 | |
| | 515,000 | | | Prologis LP, 2.125%, 10/15/2050 | | | 463,730 | |
| | 530,000,000 | | | Prologis Yen Finance LLC,
0.972%, 9/25/2028, (JPY)(a) | | | 5,069,085 | |
| | 670,000 | | | Quicken Loans LLC,
5.250%, 1/15/2028, 144A | | | 705,952 | |
| | 115,000 | | | Quicken Loans LLC/Quicken Loans Co-Issuer, Inc.,
3.625%, 3/01/2029, 144A | | | 113,994 | |
| | 510,000 | | | Quicken Loans LLC/Quicken Loans Co-Issuer, Inc.,
3.875%, 3/01/2031, 144A | | | 503,625 | |
| | 11,915 | | | RCO V Mortgage LLC, Series 2019-1, Class A1,
3.721%, 5/24/2024, 144A(a)(c) | | | 12,009 | |
| | 1,885,000 | | | Regency Centers LP,
3.700%, 6/15/2030(a) | | | 2,069,281 | |
| | 575,000 | | | Sabine Pass Liquefaction LLC,
4.500%, 5/15/2030, 144A | | | 647,710 | |
| | 1,585,000 | | | Santander Drive Auto Receivables Trust, Series 2019-2, Class C,
2.900%, 10/15/2024(a) | | | 1,629,522 | |
| | 875,000 | | | Santander Holdings USA, Inc.,
3.244%, 10/05/2026(a) | | | 936,320 | |
| | 730,000 | | | Simon Property Group LP,
2.450%, 9/13/2029(a) | | | 724,861 | |
| | 535,000 | | | Simon Property Group LP,
3.250%, 9/13/2049(a) | | | 490,657 | |
| | 68,798 | | | SoFi Professional Loan Program LLC, Series 2018-C, Class A1FX,
3.080%, 1/25/2048, 144A(a) | | | 69,154 | |
| | 4,110,000 | | | T-Mobile USA, Inc.,
3.875%, 4/15/2030, 144A(a) | | | 4,663,288 | |
| | 1,645,000 | | | T-Mobile USA, Inc.,
4.375%, 4/15/2040, 144A(a) | | | 1,928,220 | |
| | 865,000 | | | Thermo Fisher Scientific, Inc., EMTN, 1.875%, 10/01/2049, (EUR)(a) | | | 1,020,406 | |
See accompanying notes to financial statements.
33 |
Portfolio of Investments – as of September 30, 2020
Loomis Sayles Global Bond Fund – continued
| | | | | | | | |
Principal
Amount (‡) | | | Description | | Value (†) | |
|
| | Bonds and Notes – continued | |
| |
| | | | United States – continued | |
| $ | 649,019 | | | Towd Point HE Trust, Series 2019-HE1, Class A1,
1-month LIBOR + 0.900%, 1.048%, 4/25/2048, 144A(a)(b) | | $ | 646,535 | |
| | 2,220,000 | | | U.S. Treasury Bond,
1.250%, 5/15/2050 | | | 2,110,387 | |
| | 5,040,000 | | | U.S. Treasury Bond,
2.875%, 5/15/2043(a)(e) | | | 6,592,753 | |
| | 12,080,000 | | | U.S. Treasury Note,
0.125%, 5/31/2022(a) | | | 12,079,056 | |
| | 3,485,000 | | | U.S. Treasury Note,
0.125%, 7/31/2022 | | | 3,485,000 | |
| | 5,665,000 | | | U.S. Treasury Note,
0.250%, 8/31/2025 | | | 5,660,574 | |
| | 14,195,000 | | | U.S. Treasury Note,
0.625%, 5/15/2030(a) | | | 14,152,859 | |
| | 13,675,000 | | | U.S. Treasury Note,
1.500%, 8/31/2021(a) | | | 13,845,937 | |
| | 420,000 | | | U.S. Treasury Note,
1.500%, 2/15/2030 | | | 453,337 | |
| | 700,000 | | | UMBS® (TBA),
2.500%, 11/01/2050(f) | | | 733,265 | |
| | 1,005,926 | | | United Airlines Pass Through Trust, Series 2016-1, Class B,
3.650%, 7/07/2027(a) | | | 766,042 | |
| | 1,284,913 | | | United Airlines Pass Through Trust, Series 2016-2, Class B,
3.650%, 4/07/2027(a) | | | 969,171 | |
| | 565,000 | | | Upjohn Finance BV,
1.362%, 6/23/2027, (EUR) | | | 679,133 | |
| | 2,660,000 | | | Upjohn Finance BV,
1.908%, 6/23/2032, (EUR)(a) | | | 3,253,133 | |
| | 991,000 | | | Valvoline, Inc.,
4.250%, 2/15/2030, 144A | | | 1,010,820 | |
| | 2,005,704 | | | Vericrest Opportunity Loan Trust, Series 2019-NPL5, Class A1A,
3.352%, 9/25/2049, 144A(a)(c) | | | 2,008,001 | |
| | 965,318 | | | Vericrest Opportunity Loan Trust, Series 2019-NPL9, Class A1A,
3.327%, 11/26/2049, 144A(a)(c) | | | 967,725 | |
| | 392,291 | | | Vericrest Opportunity Loan Trust, Series 2020-NPL1, Class A1A,
3.228%, 1/25/2050, 144A(a)(c) | | | 393,038 | |
| | 861,160 | | | Vericrest Opportunity Loan Trust, Series 2020-NPL2, Class A1A,
2.981%, 2/25/2050, 144A(a)(c) | | | 861,160 | |
| | 2,303,166 | | | Vericrest Opportunity Loan Trust, Series 2020-NPL3, Class A1A,
2.981%, 2/25/2050, 144A(a)(c) | | | 2,303,166 | |
| | 570,000,000 | | | Walmart, Inc.,
0.183%, 7/15/2022, (JPY)(a) | | | 5,383,785 | |
| |
| | | | United States – continued | |
| 260,000 | | | Walt Disney Co. (The),
3.600%, 1/13/2051(a) | | | 292,996 | |
| | | | | | | | |
| | | | | | | 267,857,506 | |
| | | | | | | | |
| | |
| | | | Total Bonds and Notes | | | | |
| | |
| | | | (Identified Cost $650,772,749) | | | 684,513,560 | |
| | | | | | | | |
| | |
| | | | Total Purchased Options – 0.0% | | | | |
| | |
| | | | (Identified Cost $106,272) (see detail below) | | | 37,204 | |
| | | | | | | | |
|
| | Short-Term Investments – 1.9% | |
| | |
| | 12,786,095 | | | Tri-Party Repurchase Agreement with Fixed Income Clearing Corporation, dated 9/30/2020 at 0.000% to be repurchased at $12,786,095 on 10/01/2020 collateralized by $13,042,900 U.S. Treasury Note, 0.250% due 9/30/2025 valued at $13,041,883 including accrued interest (Note 2 of Notes to Financial Statements) | | | 12,786,095 | |
| | 710,000 | | | U.S. Treasury Bills,
0.114%, 1/07/2021(g) | | | 709,814 | |
| | | | | | | | |
| | |
| | | | Total Short-Term Investments | | | | |
| | |
| | | | (Identified Cost $13,495,874) | | | 13,495,909 | |
| | | | | | | | |
| | |
| | | | Total Investments – 98.1% | | | | |
| | |
| | | | (Identified Cost $664,374,895) | | | 698,046,673 | |
| | |
| | | | Other assets less liabilities—1.9% | | | 13,682,136 | |
| | | | | | | | |
| | |
| | | | Net Assets – 100.0% | | $ | 711,728,809 | |
| | | | | | | | |
| | | | | | | | | | | | | | | | | | | | | | | | |
|
Purchased Options – 0.0% | |
Description | | Expiration
Date | | | Exercise
Price | | | Units of
Currency | | | Notional
Amount | | | Cost | | | Value (†) | |
|
| Over-the-Counter Options on Currency – 0.0% | |
| | | | | | |
| EUR Call(h)(i) | | | 10/15/2020 | | | | 1.19 | | | | 5,824,000 | | | $ | 8,125,734 | | | $ | 70,142 | | | $ | 7,750 | |
| | | | | | |
| JPY Call(i)(j) | | | 2/16/2021 | | | | 97.00 | | | | 9,010,000 | | | | 8,286,825 | | | | 36,130 | | | | 29,454 | |
| | | | | | | | | | | | | | | | | | | | | | | | |
| | | | | | |
| Total | | | | | | | | | | | | | | | | | | $ | 106,272 | | | $ | 37,204 | |
| | | | | | | | | | | | | | | | | | | | | | | | |
| | | | | | | | | | | | | | | | | | | | | | | | |
Written Options – (0.0%) | |
Description | | Expiration
Date | | | Exercise
Price | | | Units of
Currency | | | Notional
Amount | | | Premiums
(Received) | | | Value (†) | |
|
| Over-the-Counter Options on Currency – (0.0%) | |
| | | | | | |
| EUR Call(h) | | | 10/15/2020 | | | | 1.2125 | | | | (5,824,000 | ) | | $ | (8,279,371) | | | $ | (32,227) | | | $ | (1,086) | |
| | | | | | | | | | | | | | | | | | | | | | | | |
| | | | | | |
| |
| | (‡) | | | Principal Amount stated in U.S. dollars unless otherwise noted. |
| |
| | (†) | | | See Note 2 of Notes to Financial Statements. |
| |
| | (††) | | | Amount shown represents units. One unit represents a principal amount of 1,000. |
| |
| | (†††) | | | Amount shown represents principal amount including inflation adjustments. |
| |
| | (††††) | | | Amount shown represents units. One unit represents a principal amount of 100. |
See accompanying notes to financial statements.
| 34
Portfolio of Investments – as of September 30, 2020
Loomis Sayles Global Bond Fund – continued
| | | | | | |
| |
| | (a) | | | Security (or a portion thereof) has been designated to cover the Fund’s obligations under open derivative contracts or TBA transactions. |
| |
| | (b) | | | Variable rate security. Rate as of September 30, 2020 is disclosed. |
| |
| | (c) | | | Variable rate security. The interest rate adjusts periodically based on; (i) changes in current interest rates and/or prepayments on underlying pools of assets, if applicable, (ii) reference to a base lending rate plus or minus a margin, and/or (iii) reference to a base lending rate adjusted by a multiplier and/or subject to certain floors or caps. Rate as of September 30, 2020 is disclosed. |
| |
| | (d) | | | The Fund’s investment in mortgage related securities of Federal Home Loan Mortgage Corporation and Federal National Mortgage Association are interests in separate pools of mortgages. All separate investments in securities of each issuer which have the same coupon rate have been aggregated for the purpose of presentation in the Portfolio of Investments. |
| |
| | (e) | | | Security (or a portion thereof) has been pledged as collateral for open derivative contracts. |
| |
| | (f) | | | When-issued/delayed delivery. See Note 2 of Notes to Financial Statements. |
| |
| | (g) | | | Interest rate represents discount rate at time of purchase; not a coupon rate. |
| |
| | (h) | | | Counterparty is HSBC Bank USA. |
| |
| | (i) | | | Non-income producing security. |
| |
| | (j) | | | Counterparty is Credit Suisse International. |
| |
| | 144A | | | All or a portion of these securities are exempt from registration under Rule 144A of the Securities Act of 1933. These securities may be resold in transactions exempt from registration, normally to qualified institutional buyers. At September 30, 2020, the value of Rule 144A holdings amounted to $158,807,561 or 22.3% of net assets. |
| |
| | ABS | | | Asset-Backed Securities |
| | CPI | | | Consumer Price Index |
| | EMTN | | | Euro Medium Term Note |
| | FHLMC | | | Federal Home Loan Mortgage Corp. |
| | FNMA | | | Federal National Mortgage Association |
| | GMTN | | | Global Medium Term Note |
| | GNMA | | | Government National Mortgage Association |
| | LIBOR | | | London Interbank Offered Rate |
| | MTN | | | Medium Term Note |
| | SONIA | | | Sterling Overnight Index |
| | TBA | | | To Be Announced |
| | UMBS® | | | Uniform Mortgage-Backed Securities |
| |
| | AUD | | | Australian Dollar |
| | BRL | | | Brazilian Real |
| | CAD | | | Canadian Dollar |
| | CHF | | | Swiss Franc |
| | CNY | | | Chinese Yuan Renminbi |
| | COP | | | Colombian Peso |
| | CZK | | | Czech Koruna |
| | DKK | | | Danish Krone |
| | EUR | | | Euro |
| | GBP | | | British Pound |
| | IDR | | | Indonesian Rupiah |
| | ILS | | | Israeli Shekel |
| | JPY | | | Japanese Yen |
| | KRW | | | South Korean Won |
| | MXN | | | Mexican Peso |
| | MYR | | | Malaysian Ringgit |
| | NOK | | | Norwegian Krone |
| | NZD | | | New Zealand Dollar |
| | PLN | | | Polish Zloty |
| | SEK | | | Swedish Krona |
| | SGD | | | Singapore Dollar |
| | THB | | | Thai Baht |
| | ZAR | | | South African Rand |
At September 30, 2020, the Fund had the following open forward foreign currency contracts:
| | | | | | | | | | | | | | | | | | | | | | | | |
Counterparty | | Delivery
Date | | Currency
Bought/
Sold
(B/S) | | Units of Currency | | | In Exchange for | | | Notional
Value | | | Unrealized
Appreciation
(Depreciation) | |
Bank of America, N.A. | | 12/02/2020 | | BRL | | | S | | | | 33,596,000 | | | $ | 6,031,706 | | | $ | 5,971,772 | | | $ | 59,934 | |
Citibank N.A. | | 12/17/2020 | | ZAR | | | S | | | | 72,730,000 | | | | 4,323,479 | | | | 4,303,386 | | | | 20,093 | |
Credit Suisse International | | 12/16/2020 | | CHF | | | B | | | | 3,258,000 | | | | 3,576,031 | | | | 3,545,248 | | | | (30,783 | ) |
Credit Suisse International | | 12/16/2020 | | JPY | | | B | | | | 2,987,384,000 | | | | 28,167,668 | | | | 28,354,468 | | | | 186,800 | |
Credit Suisse International | | 12/16/2020 | | JPY | | | S | | | | 30,024,000 | | | | 283,899 | | | | 284,970 | | | | (1,071 | ) |
Credit Suisse International | | 12/16/2020 | | KRW | | | B | | | | 9,280,531,000 | | | | 7,800,732 | | | | 7,935,910 | | | | 135,178 | |
HSBC Bank USA | | 12/16/2020 | | CAD | | | B | | | | 5,496,000 | | | | 4,180,612 | | | | 4,128,894 | | | | (51,718 | ) |
HSBC Bank USA | | 12/16/2020 | | COP | | | S | | | | 14,472,575,000 | | | | 3,885,516 | | | | 3,766,994 | | | | 118,522 | |
HSBC Bank USA | | 12/16/2020 | | SGD | | | B | | | | 6,526,000 | | | | 4,768,254 | | | | 4,781,246 | | | | 12,992 | |
Morgan Stanley Capital Services, Inc. | | 12/16/2020 | | GBP | | | B | | | | 9,228,000 | | | | 11,835,325 | | | | 11,912,963 | | | | 77,638 | |
Standard Chartered Bank | | 12/16/2020 | | EUR | | | B | | | | 41,903,000 | | | | 49,416,795 | | | | 49,211,967 | | | | (204,828 | ) |
UBS AG | | 12/16/2020 | | AUD | | | B | | | | 1,797,000 | | | | 1,266,317 | | | | 1,287,360 | | | | 21,043 | |
| | | | | | | | | | | | | | | | | | | | | | | | |
Total | | | $ | 343,800 | |
| | | | | | | | | | | | | | | | | | | | | | | | |
See accompanying notes to financial statements.
35 |
Portfolio of Investments – as of September 30, 2020
Loomis Sayles Global Bond Fund – continued
At September 30, 2020, the Fund had the following open forward cross currency contracts:
| | | | | | | | | | | | | | | | | | | | | | | | | | |
Counterparty | | Settlement
Date | | Deliver/Units of Currency | | | Receive/Units of Currency | | | Notional
Value | | | Unrealized
Appreciation
(Depreciation) | |
BNP Paribas S.A. | | 12/16/2020 | | | SEK | | | | 3,770,000 | | | | EUR | | | | 363,195 | | | $ | 426,545 | | | $ | 5,199 | |
Credit Suisse International | | 12/16/2020 | | | IDR | | | | 21,947,060,000 | | | | JPY | | | | 155,201,612 | | | | 1,473,081 | | | | 8,292 | |
Credit Suisse International | | 12/16/2020 | | | PLN | | | | 13,192,000 | | | | EUR | | | | 2,907,072 | | | | 3,414,140 | | | | 582 | |
HSBC Bank USA | | 12/16/2020 | | | NOK | | | | 32,000,000 | | | | EUR | | | | 3,013,418 | | | | 3,539,036 | | | | 107,662 | |
UBS AG | | 12/17/2020 | | | ZAR | | | | 80,905,000 | | | | EUR | | | | 4,070,202 | | | | 4,780,295 | | | | (6,800 | ) |
| | | | | | | | | | | | | | | | | | | | | | | | | | |
Total | | | $ | 114,935 | |
| | | | | | | | | | | | | | | | | | | | | | | | | | |
At September 30, 2020, open long futures contracts were as follows:
| | | | | | | | | | | | | | | | | | | | | | | | |
Financial Futures | | Expiration
Date | | | Contracts | | | Notional
Amount | | | Value | | | Unrealized
Appreciation
(Depreciation) | |
5 Year U.S. Treasury Note | | | 12/31/2020 | | | | 129 | | | $ | 16,255,228 | | | $ | 16,258,031 | | | $ | 2,803 | |
10 Year Japan Government Bond | | | 12/14/2020 | | | | 17 | | | | 24,476,905 | | | | 24,518,750 | | | | 41,845 | |
Euro-Buxl® 30 Year Bond | | | 12/08/2020 | | | | 39 | | | | 10,095,348 | | | | 10,182,164 | | | | 86,816 | |
German Euro BOBL | | | 12/08/2020 | | | | 157 | | | | 24,864,547 | | | | 24,881,366 | | | | 16,819 | |
UK Long Gilt | | | 12/29/2020 | | | | 101 | | | | 17,700,930 | | | | 17,738,573 | | | | 37,643 | |
Ultra Long U.S. Treasury Bond | | | 12/21/2020 | | | | 20 | | | | 4,482,691 | | | | 4,436,250 | | | | (46,441 | ) |
| | | | | | | | | | | | | | | | | | | | | | | | |
Total | | | $ | 139,485 | |
| | | | | | | | | | | | | | | | | | | | | | | | |
At September 30, 2020, open short futures contracts were as follows:
| | | | | | | | | | | | | | | | | | | | | | | | |
Financial Futures | | Expiration
Date | | | Contracts | | | Notional
Amount | | | Value | | | Unrealized
Appreciation
(Depreciation) | |
10 Year U.S. Treasury Note | | | 12/21/2020 | | | | 79 | | | $ | 11,024,046 | | | $ | 11,022,969 | | | $ | 1,077 | |
30 Year U.S. Treasury Bond | | | 12/21/2020 | | | | 149 | | | | 26,292,561 | | | | 26,265,906 | | | | 26,655 | |
German Euro Bund | | | 12/08/2020 | | | | 26 | | | | 5,311,741 | | | | 5,320,014 | | | | (8,273 | ) |
Ultra 10 Year U.S. Treasury Note | | | 12/21/2020 | | | | 219 | | | | 34,998,231 | | | | 35,022,891 | | | | (24,660 | ) |
| | | | | | | | | | | | | | | | | | | | | | | | |
Total | | | $ | (5,201 | ) |
| | | | | | | | | | | | | | | | | | | | | | | | |
Industry Summary at September 30, 2020
| | | | |
Treasuries | | | 39.2 | % |
Banking | | | 9.4 | |
ABS Home Equity | | | 5.0 | |
Food & Beverage | | | 4.4 | |
Technology | | | 3.3 | |
Mortgage Related | | | 3.3 | |
Wireless | | | 3.1 | |
Local Authorities | | | 2.4 | |
Other Investments, less than 2% each | | | 26.1 | |
Short-Term Investments | | | 1.9 | |
| | | | |
Total Investments | | | 98.1 | |
Other assets less liabilities (including open written options, forward foreign currency and futures contracts) | | | 1.9 | |
| | | | |
Net Assets | | | 100.0 | % |
| | | | |
See accompanying notes to financial statements.
| 36
Portfolio of Investments – as of September 30, 2020
Loomis Sayles Global Bond Fund – continued
Currency Exposure Summary at September 30, 2020
| | | | |
United States Dollar | | | 50.7 | % |
Euro | | | 13.8 | |
Japanese Yen | | | 9.8 | |
Yuan Renminbi | | | 5.8 | |
British Pound | | | 2.5 | |
Other, less than 2% each | | | 15.5 | |
| | | | |
Total Investments | | | 98.1 | |
Other assets less liabilities (including open written options, forward foreign currency and futures contracts) | | | 1.9 | |
| | | | |
Net Assets | | | 100.0 | % |
| | | | |
See accompanying notes to financial statements.
37 |
Portfolio of Investments – as of September 30, 2020
Loomis Sayles Inflation Protected Securities Fund
| | | | | | | | |
Principal
Amount | | | Description | | Value (†) | |
|
| | Bonds and Notes – 97.6% of Net Assets | |
| |
| | | | Aerospace & Defense – 0.3% | |
| $ | 190,000 | | | General Dynamics Corp., 3.500%, 4/01/2027 | | $ | 218,442 | |
| | 115,000 | | | Raytheon Technologies Corp., 3.125%, 7/01/2050 | | | 122,657 | |
| | | | | | | | |
| | | | | | | 341,099 | |
| | | | | | | | |
| |
| | | | Airlines – 0.5% | |
| | 445,000 | | | Air Canada Pass Through Trust, Series 2020-2A, 5.250%, 10/01/2030, 144A | | | 456,343 | |
| | 210,000 | | | Southwest Airlines Co., 5.125%, 6/15/2027 | | | 229,554 | |
| | | | | | | | |
| | | | | | | 685,897 | |
| | | | | | | | |
| |
| | | | Automotive – 0.7% | |
| | 35,000 | | | Ford Motor Co., 4.750%, 1/15/2043 | | | 31,690 | |
| | 85,000 | | | Ford Motor Co., 5.291%, 12/08/2046 | | | 79,741 | |
| | 45,000 | | | Ford Motor Co., 7.450%, 7/16/2031 | | | 51,919 | |
| | 40,000 | | | General Motors Co., 5.200%, 4/01/2045 | | | 43,086 | |
| | 360,000 | | | General Motors Co., 5.950%, 4/01/2049 | | | 421,825 | |
| | 115,000 | | | General Motors Co., 6.250%, 10/02/2043 | | | 136,282 | |
| | 110,000 | | | General Motors Co., 6.800%, 10/01/2027 | | | 133,974 | |
| | | | | | | | |
| | | | | | | 898,517 | |
| | | | | | | | |
| |
| | | | Banking – 3.3% | |
| | 345,000 | | | Bank of America Corp., (fixed rate to 7/23/2030, variable rate thereafter), MTN, 1.898%, 7/23/2031 | | | 342,933 | |
| | 335,000 | | | Barclays PLC, (fixed rate to 6/24/2030, variable rate thereafter), 2.645%, 6/24/2031 | | | 334,615 | |
| | 370,000 | | | Barclays PLC, (fixed rate to 9/23/2030, variable rate thereafter), 3.564%, 9/23/2035 | | | 365,649 | |
| | 365,000 | | | BNP Paribas S.A., (fixed rate to 8/12/2030, variable rate thereafter), 2.588%, 8/12/2035, 144A | | | 354,196 | |
| | 250,000 | | | Credit Suisse Group AG, (fixed rate to 4/01/2030, variable rate thereafter), 4.194%, 4/01/2031, 144A | | | 288,622 | |
| | 1,000,000 | | | Deutsche Bank AG, (fixed rate to 10/30/2025, variable rate thereafter), 6.000%(a) | | | 863,450 | |
| | 260,000 | | | Deutsche Bank AG, (fixed rate to 4/08/2030, variable rate thereafter), 5.882%, 7/08/2031 | | | 268,036 | |
| | 210,000 | | | Deutsche Bank AG, (fixed rate to 9/18/2030, variable rate thereafter), 3.547%, 9/18/2031 | | | 212,192 | |
| | 445,000 | | | Natwest Group PLC, (fixed rate to 8/28/2030, variable rate thereafter), 3.032%, 11/28/2035 | | | 426,946 | |
| | 200,000 | | | Santander Holdings USA, Inc., 3.450%, 6/02/2025 | | | 213,880 | |
| | 355,000 | | | Societe Generale S.A., (fixed rate to 7/08/2030, variable rate thereafter), 3.653%, 7/08/2035, 144A | | | 357,181 | |
| |
| | | | Banking – continued | |
| 200,000 | | | UniCredit SpA, (fixed rate to 6/30/2030, variable rate thereafter), 5.459%, 6/30/2035, 144A | | | 203,750 | |
| | | | | | | | |
| | | | | | | 4,231,450 | |
| | | | | | | | |
| |
| | | | Brokerage – 0.9% | |
| | 355,000 | | | BGC Partners, Inc., 4.375%, 12/15/2025, 144A | | | 360,261 | |
| | 495,000 | | | Brookfield Finance, Inc., 3.500%, 3/30/2051 | | | 489,098 | |
| | 265,000 | | | KKR Group Finance Co. VIII LLC, 3.500%, 8/25/2050, 144A | | | 270,045 | |
| | | | | | | | |
| | | | | | | 1,119,404 | |
| | | | | | | | |
| |
| | | | Diversified Manufacturing – 0.1% | |
| | 35,000 | | | General Electric Co., 3.625%, 5/01/2030 | | | 36,246 | |
| | 65,000 | | | General Electric Co., 4.350%, 5/01/2050 | | | 66,275 | |
| | | | | | | | |
| | | | | | | 102,521 | |
| | | | | | | | |
| |
| | | | Electric – 0.1% | |
| | 80,000 | | | Southern Co. (The), (fixed rate to 10/15/2025, variable rate thereafter), 4.000%, 1/15/2051 | | | 80,268 | |
| | | | | | | | |
| |
| | | | Finance Companies – 0.2% | |
| | 245,000 | | | AerCap Ireland Capital DAC/AerCap Global Aviation Trust, 4.500%, 9/15/2023 | | | 252,485 | |
| | 50,000 | | | GATX Corp., 4.000%, 6/30/2030 | | | 57,597 | |
| | | | | | | | |
| | | | | | | 310,082 | |
| | | | | | | | |
| |
| | | | Food & Beverage – 0.3% | |
| | 330,000 | | | Mondelez International, Inc., 1.875%, 10/15/2032 | | | 329,224 | |
| | | | | | | | |
| |
| | | | Health Insurance – 0.3% | |
| | 220,000 | | | Anthem, Inc., 3.125%, 5/15/2050 | | | 224,228 | |
| | 85,000 | | | Humana, Inc., 3.950%, 8/15/2049 | | | 101,639 | |
| | | | | | | | |
| | | | | | | 325,867 | |
| | | | | | | | |
| |
| | | | Healthcare – 0.8% | |
| | 30,000 | | | Cigna Corp., 2.400%, 3/15/2030 | | | 31,114 | |
| | 75,000 | | | Cigna Corp., 3.200%, 3/15/2040 | | | 79,506 | |
| | 115,000 | | | CVS Health Corp., 3.250%, 8/15/2029 | | | 126,501 | |
| | 730,000 | | | Fresenius Medical Care U.S. Finance III, Inc., 2.375%, 2/16/2031, 144A | | | 721,759 | |
| | | | | | | | |
| | | | | | | 958,880 | |
| | | | | | | | |
| |
| | | | Integrated Energy – 0.2% | |
| | 45,000 | | | Chevron Corp., 3.078%, 5/11/2050 | | | 48,106 | |
| | 150,000 | | | Exxon Mobil Corp., 3.452%, 4/15/2051 | | | 164,813 | |
| | | | | | | | |
| | | | | | | 212,919 | |
| | | | | | | | |
| |
| | | | Life Insurance – 0.5% | |
| | 210,000 | | | Athene Holding Ltd., 6.150%, 4/03/2030 | | | 249,380 | |
| | 250,000 | | | Belrose Funding Trust, 2.330%, 8/15/2030, 144A | | | 247,065 | |
See accompanying notes to financial statements.
| 38
Portfolio of Investments – as of September 30, 2020
Loomis Sayles Inflation Protected Securities Fund – continued
| | | | | | | | |
Principal
Amount | | | Description | | Value (†) | |
|
| | Bonds and Notes – continued | |
| |
| | | | Life Insurance – continued | |
| $ | 160,000 | | | Empower Finance LP, 3.075%, 9/17/2051, 144A | | $ | 166,148 | |
| | | | | | | | |
| | |
| | | | | | | 662,593 | |
| | | | | | | | |
| |
| | | | Media Entertainment – 0.2% | |
| | 90,000 | | | ViacomCBS, Inc., 4.950%, 1/15/2031 | | | 108,221 | |
| | 175,000 | | | ViacomCBS, Inc., 4.950%, 5/19/2050 | | | 205,338 | |
| | | | | | | | |
| | | | | | | 313,559 | |
| | | | | | | | |
| |
| | | | Metals & Mining – 0.4% | |
| | 200,000 | | | Anglo American Capital PLC, 3.950%, 9/10/2050, 144A | | | 204,386 | |
| | 330,000 | | | Glencore Funding LLC, 2.500%, 9/01/2030, 144A | | | 320,849 | |
| | | | | | | | |
| | | | | | | 525,235 | |
| | | | | | | | |
| |
| | | | Midstream – 0.7% | |
| | 195,000 | | | Boardwalk Pipelines LP, 3.400%, 2/15/2031 | | | 191,130 | |
| | 60,000 | | | Enterprise Products Operating LLC, 3.200%, 2/15/2052 | | | 55,446 | |
| | 365,000 | | | MPLX LP, 2.650%, 8/15/2030 | | | 356,263 | |
| | 35,000 | | | Plains All American Pipeline LP/PAA Finance Corp., 3.800%, 9/15/2030 | | | 33,939 | |
| | 175,000 | | | Sabine Pass Liquefaction LLC, 4.500%, 5/15/2030, 144A | | | 197,129 | |
| | | | | | | | |
| | | | | | | 833,907 | |
| | | | | | | | |
| |
| | | | Pharmaceuticals – 0.4% | |
| | 500,000 | | | Gilead Sciences, Inc., 2.800%, 10/01/2050 | | | 494,121 | |
| | | | | | | | |
| |
| | | | Property & Casualty Insurance – 0.2% | |
| | 245,000 | | | Fidelity National Financial, Inc., 2.450%, 3/15/2031 | | | 243,004 | |
| | | | | | | | |
| |
| | | | Railroads – 0.0% | |
| | 15,000 | | | Canadian Pacific Railway Co., 2.050%, 3/05/2030 | | | 15,627 | |
| | | | | | | | |
| |
| | | | Refining – 0.1% | |
| | 100,000 | | | HollyFrontier Corp., 4.500%, 10/01/2030 | | | 97,014 | |
| | | | | | | | |
| |
| | | | REITs – Regional Malls – 0.1% | |
| | 125,000 | | | Simon Property Group LP, 3.800%, 7/15/2050 | | | 126,914 | |
| | | | | | | | |
| |
| | | | REITs – Single Tenant – 0.1% | |
| | 170,000 | | | Spirit Realty LP, 3.200%, 2/15/2031 | | | 165,900 | |
| | | | | | | | |
| |
| | | | Retailers – 0.1% | |
| | 165,000 | | | Home Depot, Inc. (The), 2.500%, 4/15/2027 | | | 179,343 | |
| | 10,000 | | | Home Depot, Inc. (The), 3.350%, 4/15/2050 | | | 11,576 | |
| | | | | | | | |
| | | | | | | 190,919 | |
| | | | | | | | |
| |
| | | | Sovereigns – 0.7% | |
| | 225,000 | | | Abu Dhabi Government International Bond, 2.700%, 9/02/2070, 144A | | | 218,635 | |
| |
| | | | Sovereigns – continued | |
| 200,000 | | | Abu Dhabi Government International Bond, 3.875%, 4/16/2050, 144A | | | 244,000 | |
| | 485,000 | | | Panama Government International Bond, 2.252%, 9/29/2032 | | | 488,637 | |
| | | | | | | | |
| | | | | | | 951,272 | |
| | | | | | | | |
| |
| | | | Technology – 1.3% | |
| | 60,000 | | | Apple, Inc., 1.650%, 5/11/2030 | | | 62,152 | |
| | 235,000 | | | Broadcom, Inc., 5.000%, 4/15/2030 | | | 277,205 | |
| | 100,000 | | | Dell International LLC/EMC Corp., 6.200%, 7/15/2030, 144A | | | 119,805 | |
| | 535,000 | | | Dell International LLC/EMC Corp., 8.350%, 7/15/2046, 144A | | | 706,849 | |
| | 80,000 | | | Jabil, Inc., 3.000%, 1/15/2031 | | | 81,677 | |
| | 110,000 | | | Microchip Technology, Inc., 4.250%, 9/01/2025, 144A | | | 114,131 | |
| | 310,000 | | | Micron Technology, Inc., 2.497%, 4/24/2023 | | | 321,921 | |
| | | | | | | | |
| | | | | | | 1,683,740 | |
| | | | | | | | |
| |
| | | | Transportation Services – 0.3% | |
| | 115,000 | | | FedEx Corp., 5.250%, 5/15/2050 | | | 155,372 | |
| | 175,000 | | | Penske Truck Leasing Co. LP/PTL Finance Corp., 4.000%, 7/15/2025, 144A | | | 197,143 | |
| | | | | | | | |
| | | | | | | 352,515 | |
| | | | | | | | |
| |
| | | | Treasuries – 84.1% | |
| | 5,340,439 | | | U.S. Treasury Inflation Indexed Bond, 0.250%, 2/15/2050(b) | | | 6,312,288 | |
| | 772,690 | | | U.S. Treasury Inflation Indexed Bond, 0.875%, 2/15/2047(b) | | | 1,029,438 | |
| | 682,845 | | | U.S. Treasury Inflation Indexed Bond, 1.000%, 2/15/2048(b) | | | 943,286 | |
| | 6,125,525 | | | U.S. Treasury Inflation Indexed Bond, 1.000%, 2/15/2049(b) | | | 8,560,501 | |
| | 2,320,573 | | | U.S. Treasury Inflation Indexed Bond, 3.375%, 4/15/2032(b) | | | 3,524,869 | |
| | 5,965,232 | | | U.S. Treasury Inflation Indexed Note, 0.125%, 4/15/2022(b) | | | 6,071,022 | |
| | 33,086,661 | | | U.S. Treasury Inflation Indexed Note, 0.125%, 4/15/2025(b) | | | 35,214,460 | |
| | 1,740,008 | | | U.S. Treasury Inflation Indexed Note, 0.125%, 7/15/2026(b) | | | 1,887,568 | |
| | 18,355,605 | | | U.S. Treasury Inflation Indexed Note, 0.125%, 1/15/2030(b) | | | 20,291,547 | |
| | 1,716,628 | | | U.S. Treasury Inflation Indexed Note, 0.250%, 7/15/2029(b) | | | 1,920,724 | |
| | 14,611,995 | | | U.S. Treasury Inflation Indexed Note, 0.375%, 1/15/2027(b) | | | 16,079,473 | |
| | 1,867,615 | | | U.S. Treasury Inflation Indexed Note, 0.625%, 1/15/2026(b) | | | 2,059,009 | |
| | 2,234,345 | | | U.S. Treasury Inflation Indexed Note, 0.750%, 7/15/2028(b) | | | 2,574,792 | |
| | 789,989 | | | U.S. Treasury Inflation Indexed Note, 0.875%, 1/15/2029(b) | | | 920,492 | |
| | | | | | | | |
| | | | | | | 107,389,469 | |
| | | | | | | | |
| |
| | | | Wireless – 0.7% | |
| | 740,000 | | | T-Mobile USA, Inc., 2.550%, 2/15/2031, 144A | | | 765,611 | |
See accompanying notes to financial statements.
39 |
Portfolio of Investments – as of September 30, 2020
Loomis Sayles Inflation Protected Securities Fund – continued
| | | | | | | | |
Principal
Amount | | | Description | | Value (†) | |
|
| | Bonds and Notes – continued | |
| |
| | | | Wireless – continued | |
| $ | 75,000 | | | T-Mobile USA, Inc., 4.500%, 4/15/2050, 144A | | $ | 89,976 | |
| | | | | | | | |
| | | | | | | 855,587 | |
| | | | | | | | |
| |
| | | | Wirelines – 0.0% | |
| | 30,000 | | | Verizon Communications, Inc., 4.000%, 3/22/2050 | | | 36,934 | |
| | | | | | | | |
| | |
| | | | Total Bonds and Notes | | | | |
| | |
| | | | (Identified Cost $120,038,140) | | | 124,534,438 | |
| | | | | | | | |
|
| | Short-Term Investments – 2.8% | |
| | |
| | 3,571,908 | | | Tri-Party Repurchase Agreement with Fixed Income Clearing Corporation, dated 9/30/2020 at 0.000% to be repurchased at $3,571,908 on 10/01/2020 collateralized by $3,643,700 U.S. Treasury Note, 0.250% due 9/30/2025 valued at $3,643,416 including accrued interest (Note 2 of Notes to Financial Statements)
(Identified Cost $3,571,908) | | | 3,571,908 | |
| | | | | | | | |
| | |
| | | | Total Investments – 100.4% | | | | |
| | |
| | | | (Identified Cost $123,610,048) | | | 128,106,346 | |
| | |
| | | | Other assets less liabilities—(0.4)% | | | (460,767 | ) |
| | | | | | | | |
| | |
| | | | Net Assets – 100.0% | | $ | 127,645,579 | |
| | | | | | | | |
| |
| | (†) | | | See Note 2 of Notes to Financial Statements. | |
| |
| | (a) | | | Perpetual bond with no specified maturity date. | |
| |
| | (b) | | | Treasury Inflation Protected Security (TIPS). | |
| |
| | 144A | | | All or a portion of these securities are exempt from registration under Rule 144A of the Securities Act of 1933. These securities may be resold in transactions exempt from registration, normally to qualified institutional buyers. At September 30, 2020, the value of Rule 144A holdings amounted to $6,603,884 or 5.2% of net assets. | |
| | MTN | | | Medium Term Note | |
| | REITs | | | Real Estate Investment Trusts | |
Industry Summary at September 30, 2020
| | | | |
Treasuries | | | 84.1 | % |
Banking | | | 3.3 | |
Other Investments, less than 2% each | | | 10.2 | |
Short-Term Investments | | | 2.8 | |
| | | | |
Total Investments | | | 100.4 | |
Other assets less liabilities | | | (0.4 | ) |
| | | | |
Net Assets | | | 100.0 | % |
| | | | |
See accompanying notes to financial statements.
| 40
Portfolio of Investments – as of September 30, 2020
Loomis Sayles Institutional High Income Fund
| | | | | | | | |
Principal
Amount (‡) | | | Description | | Value (†) | |
|
| | Bonds and Notes – 82.3% of Net Assets | |
|
| | Non-Convertible Bonds – 74.3% | |
| |
| | | | Aerospace & Defense – 3.5% | |
| $ | 85,000 | | | Boeing Co. (The), 3.100%, 5/01/2026 | | $ | 84,791 | |
| | 30,000 | | | Boeing Co. (The), 3.250%, 2/01/2035 | | | 28,199 | |
| | 195,000 | | | Boeing Co. (The), 3.550%, 3/01/2038 | | | 177,633 | |
| | 15,000 | | | Boeing Co. (The), 3.625%, 3/01/2048 | | | 13,182 | |
| | 110,000 | | | Boeing Co. (The), 3.750%, 2/01/2050 | | | 100,376 | |
| | 390,000 | | | Boeing Co. (The), 3.850%, 11/01/2048 | | | 357,369 | |
| | 770,000 | | | Boeing Co. (The), 3.950%, 8/01/2059 | | | 697,053 | |
| | 135,000 | | | Bombardier, Inc., 7.350%, 12/22/2026, 144A, (CAD) | | | 74,586 | |
| | 1,930,000 | | | Bombardier, Inc., 7.450%, 5/01/2034, 144A | | | 1,423,896 | |
| | 4,535,000 | | | Bombardier, Inc., 7.875%, 4/15/2027, 144A | | | 3,439,525 | |
| | 115,000 | | | Embraer Netherlands Finance BV,
5.400%, 2/01/2027 | | | 109,193 | |
| | 1,165,000 | | | Huntington Ingalls Industries, Inc.,
5.000%, 11/15/2025, 144A | | | 1,197,441 | |
| | 1,072,000 | | | Leonardo U.S. Holdings, Inc.,
6.250%, 1/15/2040, 144A | | | 1,218,714 | |
| | 2,209,000 | | | Leonardo U.S. Holdings, Inc.,
7.375%, 7/15/2039, 144A | | | 2,743,158 | |
| | 2,610,000 | | | Textron Financial Corp.,
3-month LIBOR + 1.735%, 2.015%, 2/15/2067, 144A(a) | | | 1,814,629 | |
| | 770,000 | | | TransDigm, Inc., 5.500%, 11/15/2027 | | | 740,008 | |
| | 625,000 | | | TransDigm, Inc., 6.500%, 5/15/2025 | | | 623,047 | |
| | 55,000 | | | TransDigm, Inc., 7.500%, 3/15/2027 | | | 57,107 | |
| | 3,020,000 | | | TransDigm, Inc., 8.000%, 12/15/2025, 144A | | | 3,284,250 | |
| | | | | | | | |
| | | | | | | 18,184,157 | |
| | | | | | | | |
| |
| | | | Airlines – 2.0% | |
| | 217,776 | | | Air Canada Pass Through Trust, Series 2013-1, Class B,
5.375%, 11/15/2022, 144A | | | 195,713 | |
| | 80,000 | | | American Airlines Group, Inc.,
3.750%, 3/01/2025, 144A | | | 40,562 | |
| | 3,570,000 | | | American Airlines Group, Inc.,
5.000%, 6/01/2022, 144A | | | 2,427,600 | |
| | 592,071 | | | American Airlines Pass Through Certificates, Series 2016-3, Class B,
3.750%, 4/15/2027 | | | 410,667 | |
| | 1,707,265 | | | American Airlines Pass Through Certificates, Series 2017-2, Class B,
3.700%, 4/15/2027 | | | 1,086,117 | |
| | 2,605,000 | | | American Airlines, Inc.,
11.750%, 7/15/2025, 144A | | | 2,513,825 | |
| | |
| | | | Airlines – continued | | | | |
| $ | 21,712 | | | Continental Airlines Pass Through Certificates, Series 2000-2, Class A-1, 7.707%, 10/02/2022 | | $ | 21,507 | |
| | 2,230,000 | | | Mileage Plus Holdings LLC/Mileage Plus Intellectual Property Assets Ltd., 6.500%, 6/20/2027, 144A | | | 2,321,988 | |
| | 1,565,672 | | | U.S. Airways Pass Through Trust, Series 2013-1, Class B,
5.375%, 5/15/2023 | | | 1,276,164 | |
| | 209,834 | | | United Airlines Pass Through Trust, Series 2014-1, Class B,
4.750%, 10/11/2023 | | | 192,737 | |
| | | | | | | | |
| | | | | | | 10,486,880 | |
| | | | | | | | |
| |
| | | | Automotive – 2.9% | |
| | 1,000,000 | | | Dana, Inc., 5.375%, 11/15/2027 | | | 1,025,000 | |
| | 5,860,000 | | | Ford Motor Co., 4.750%, 1/15/2043 | | | 5,305,790 | |
| | 240,000 | | | Ford Motor Co., 5.291%, 12/08/2046 | | | 225,150 | |
| | 400,000 | | | General Motors Co., 5.200%, 4/01/2045 | | | 430,866 | |
| | 185,000 | | | General Motors Co., 6.250%, 10/02/2043 | | | 219,237 | |
| | 2,700,000 | | | Goodyear Tire & Rubber Co. (The),
4.875%, 3/15/2027 | | | 2,558,250 | |
| | 3,375,000 | | | Goodyear Tire & Rubber Co. (The),
5.000%, 5/31/2026 | | | 3,279,217 | |
| | 2,090,000 | | | Goodyear Tire & Rubber Co. (The),
7.000%, 3/15/2028 | | | 2,168,898 | |
| | | | | | | | |
| | | | | | | 15,212,408 | |
| | | | | | | | |
| |
| | | | Banking – 1.3% | |
| | 3,345,000 | | | Banco Santander Mexico S.A. Institucion de Banca Multiple Grupo Financiero Santander,
5.375%, 4/17/2025, 144A | | | 3,722,985 | |
| | 1,145,000 | | | Deutsche Bank AG, (fixed rate to 12/01/2027, variable rate thereafter),
4.875%, 12/01/2032 | | | 1,090,349 | |
| | 1,780,000 | | | UniCredit SpA, (fixed rate to 6/30/2030, variable rate thereafter),
5.459%, 6/30/2035, 144A | | | 1,813,375 | |
| | | | | | | | |
| | | | | | | 6,626,709 | |
| | | | | | | | |
| |
| | | | Brokerage – 0.5% | |
| | 350,000 | | | Jefferies Finance LLC/JFIN Co-Issuer Corp., 7.250%, 8/15/2024, 144A | | | 362,688 | |
| | 1,615,000 | | | Jefferies Group LLC,
6.250%, 1/15/2036 | | | 2,001,423 | |
| | | | | | | | |
| | | | | | | 2,364,111 | |
| | | | | | | | |
| |
| | | | Building Materials – 0.8% | |
| | 3,350,000 | | | American Woodmark Corp.,
4.875%, 3/15/2026, 144A | | | 3,391,875 | |
| | 525,000 | | | JELD-WEN, Inc.,
4.875%, 12/15/2027, 144A | | | 535,001 | |
| | 178,000 | | | Masco Corp., 6.500%, 8/15/2032 | | | 230,749 | |
| | | | | | | | |
| | | | | | | 4,157,625 | |
| | | | | | | | |
See accompanying notes to financial statements.
41 |
Portfolio of Investments – as of September 30, 2020
Loomis Sayles Institutional High Income Fund – continued
| | | | | | | | |
Principal
Amount (‡) | | | Description | | Value (†) | |
|
| | Bonds and Notes – continued | |
| |
| | | | Cable Satellite – 3.3% | |
| $ | 1,865,000 | | | CCO Holdings LLC/CCO Holdings Capital Corp., 5.125%, 5/01/2027, 144A | | $ | 1,962,390 | |
| | 70,000 | | | CCO Holdings LLC/CCO Holdings Capital Corp., 5.375%, 5/01/2025, 144A | | | 72,013 | |
| | 300,000 | | | CCO Holdings LLC/CCO Holdings Capital Corp., 5.875%, 5/01/2027, 144A | | | 314,970 | |
| | 3,215,000 | | | CSC Holdings LLC, 5.250%, 6/01/2024 | | | 3,448,087 | |
| | 370,000 | | | CSC Holdings LLC, 5.375%, 2/01/2028, 144A | | | 390,813 | |
| | 2,205,000 | | | DISH DBS Corp., 5.000%, 3/15/2023 | | | 2,249,100 | |
| | 2,686,000 | | | DISH DBS Corp., 5.875%, 11/15/2024 | | | 2,754,493 | |
| | 1,720,000 | | | DISH DBS Corp., 7.750%, 7/01/2026 | | | 1,890,899 | |
| | 170,000 | | | Time Warner Cable LLC, 4.500%, 9/15/2042 | | | 184,665 | |
| | 3,718,000 | | | Ziggo BV, 5.500%, 1/15/2027, 144A | | | 3,894,605 | |
| | | | | | | | |
| | | | | | | 17,162,035 | |
| | | | | | | | |
| |
| | | | Chemicals – 1.5% | |
| | 1,025,000 | | | Aruba Investments, Inc., 8.750%, 2/15/2023, 144A | | | 1,035,250 | |
| | 4,738,000 | | | Hercules LLC, 6.500%, 6/30/2029 | | | 4,750,935 | |
| | 750,000 | | | Koppers, Inc., 6.000%, 2/15/2025, 144A | | | 760,313 | |
| | 1,330,000 | | | Minerals Technologies, Inc., 5.000%, 7/01/2028, 144A | | | 1,367,612 | |
| | | | | | | | |
| | | | | | | 7,914,110 | |
| | | | | | | | |
| |
| | | | Construction Machinery – 0.3% | |
| | 330,000 | | | United Rentals North America, Inc., 4.875%, 1/15/2028 | | | 346,500 | |
| | 1,140,000 | | | United Rentals North America, Inc., 5.875%, 9/15/2026 | | | 1,201,275 | |
| | | | | | | | |
| | | | | | | 1,547,775 | |
| | | | | | | | |
| |
| | | | Consumer Cyclical Services – 0.4% | |
| | 1,902,000 | | | ServiceMaster Co. LLC (The), 7.450%, 8/15/2027 | | | 2,075,557 | |
| | | | | | | | |
| |
| | | | Diversified Manufacturing – 0.0% | |
| | 260,000 | | | General Electric Co., Series D, (fixed rate to 1/21/2021, variable rate thereafter), 5.000%(b) | | | 207,158 | |
| | | | | | | | |
| |
| | | | Electric – 0.6% | |
| | 185,000 | | | AES Corp. (The), 5.500%, 4/15/2025 | | | 190,709 | |
| | 190,000 | | | Edison International, 4.950%, 4/15/2025 | | | 207,974 | |
| | 2,430,000 | | | NRG Energy, Inc., 7.250%, 5/15/2026 | | | 2,586,176 | |
| | | | | | | | |
| | | | | | | 2,984,859 | |
| | | | | | | | |
| |
| | | | Finance Companies – 7.2% | |
| $ | 1,000,000 | | | AGFC Capital Trust I, 3-month LIBOR + 1.750%, 2.025%, 1/15/2067, 144A(a)(c)(d)(e) | | $ | 320,948 | |
| | 2,240,000 | | | GE Capital International Funding Co. Unlimited Co., 4.418%, 11/15/2035 | | | 2,364,452 | |
| | 17,880,000 | | | Navient Corp., MTN, 5.625%, 8/01/2033 | | | 15,048,255 | |
| | 5,345,000 | | | Navient Corp., MTN, 6.125%, 3/25/2024 | | | 5,385,087 | |
| | 325,000 | | | Navient Corp., MTN, 7.250%, 1/25/2022 | | | 333,125 | |
| | 1,725,000 | | | OneMain Finance Corp., 6.875%, 3/15/2025 | | | 1,914,189 | |
| | 1,535,000 | | | OneMain Finance Corp., 7.125%, 3/15/2026 | | | 1,714,902 | |
| | 805,000 | | | OneMain Finance Corp., 8.250%, 10/01/2023 | | | 893,550 | |
| | 4,320,000 | | | Owl Rock Capital Corp., 4.250%, 1/15/2026 | | | 4,376,290 | |
| | 4,815,000 | | | Quicken Loans LLC, 5.250%, 1/15/2028, 144A | | | 5,073,373 | |
| | | | | | | | |
| | | | | | | 37,424,171 | |
| | | | | | | | |
| |
| | | | Financial Other – 1.4% | |
| | 2,020,000 | | | Nationstar Mortgage Holdings, Inc., 5.500%, 8/15/2028, 144A | | | 2,017,475 | |
| | 5,010,000 | | | Nationstar Mortgage Holdings, Inc., 9.125%, 7/15/2026, 144A | | | 5,373,225 | |
| | | | | | | | |
| | | | | | | 7,390,700 | |
| | | | | | | | |
| |
| | | | Food & Beverage – 0.4% | |
| | 2,005,000 | | | Kraft Heinz Foods Co., 4.375%, 6/01/2046 | | | 2,057,270 | |
| | | | | | | | |
| |
| | | | Gaming – 0.3% | |
| | 1,570,000 | | | International Game Technology PLC, 6.250%, 1/15/2027, 144A | | | 1,683,825 | |
| | | | | | | | |
| |
| | | | Government Owned – No Guarantee – 0.1% | |
| | 75,000(††) | | | Petroleos Mexicanos, 7.650%, 11/24/2021, 144A, (MXN) | | | 336,002 | |
| | | | | | | | |
| |
| | | | Healthcare – 9.5% | |
| | 1,000,000 | | | CHS/Community Health Systems, Inc., 6.625%, 2/15/2025, 144A | | | 967,500 | |
| | 2,825,000 | | | HCA, Inc., 5.875%, 5/01/2023 | | | 3,075,140 | |
| | 1,065,000 | | | HCA, Inc., 7.050%, 12/01/2027 | | | 1,243,388 | |
| | 4,660,000 | | | HCA, Inc., 7.500%, 11/06/2033 | | | 6,197,800 | |
| | 620,000 | | | HCA, Inc., 7.690%, 6/15/2025 | | | 728,500 | |
| | 375,000 | | | HCA, Inc., 8.360%, 4/15/2024 | | | 441,563 | |
| | 2,945,000 | | | HCA, Inc., MTN, 7.580%, 9/15/2025 | | | 3,511,912 | |
| | 3,875,000 | | | HCA, Inc., MTN, 7.750%, 7/15/2036 | | | 4,940,625 | |
| | 4,745,000 | | | Tenet Healthcare Corp., 5.125%, 5/01/2025 | | | 4,789,128 | |
| | 4,810,000 | | | Tenet Healthcare Corp., 6.125%, 10/01/2028, 144A | | | 4,677,725 | |
| | 5,520,000 | | | Tenet Healthcare Corp., 6.750%, 6/15/2023 | | | 5,796,000 | |
| | 10,334,000 | | | Tenet Healthcare Corp., 6.875%, 11/15/2031 | | | 10,127,320 | |
See accompanying notes to financial statements.
| 42
Portfolio of Investments – as of September 30, 2020
Loomis Sayles Institutional High Income Fund – continued
| | | | | | | | |
Principal
Amount (‡) | | | Description | | Value (†) | |
|
| | Bonds and Notes – continued | |
| |
| | | | Healthcare – continued | |
| $ | 910,000 | | | Tenet Healthcare Corp., 7.000%, 8/01/2025 | | $ | 936,663 | |
| | 1,395,000 | | | Tenet Healthcare Corp., 8.125%, 4/01/2022 | | | 1,551,100 | |
| | | | | | | | |
| | | | | | | 48,984,364 | |
| | | | | | | | |
| |
| | | | Home Construction – 1.5% | |
| | 2,820,000 | | | Beazer Homes USA, Inc., 5.875%, 10/15/2027 | | | 2,855,250 | |
| | 1,120,000 | | | Beazer Homes USA, Inc., 7.250%, 10/15/2029 | | | 1,201,200 | |
| | 400,000 | | | PulteGroup, Inc., 6.000%, 2/15/2035 | | | 494,000 | |
| | 1,970,000 | | | TRI Pointe Group, Inc., 5.250%, 6/01/2027 | | | 2,102,975 | |
| | 1,000,000 | | | TRI Pointe Group, Inc./TRI Pointe Homes, Inc., 5.875%, 6/15/2024 | | | 1,080,000 | |
| | | | | | | | |
| | | | | | | 7,733,425 | |
| | | | | | | | |
| |
| | | | Independent Energy – 8.5% | |
| | 1,846,000 | | | Ascent Resources Utica Holdings LLC/ARU Finance Corp., 10.000%, 4/01/2022, 144A | | | 1,818,310 | |
| | 870,000 | | | Baytex Energy Corp., 5.625%, 6/01/2024, 144A | | | 491,550 | |
| | 1,000,000 | | | Chesapeake Energy Corp., 4.875%, 4/15/2022(c)(f)(g) | | | 40,640 | |
| | 2,835,000 | | | Chesapeake Energy Corp., 8.000%, 1/15/2025(c)(f)(g) | | | 104,668 | |
| | 4,250,000 | | | Chesapeake Energy Corp., 8.000%, 6/15/2027(c)(f)(g) | | | 143,438 | |
| | 1,885,000 | | | Continental Resources, Inc., 3.800%, 6/01/2024 | | | 1,738,912 | |
| | 2,095,000 | | | Continental Resources, Inc., 4.500%, 4/15/2023 | | | 1,996,535 | |
| | 1,289,000 | | | Continental Resources, Inc., 5.000%, 9/15/2022 | | | 1,279,436 | |
| | 3,690,000 | | | Lonestar Resources America, Inc., 11.250%, 1/01/2023, 144A(c)(f)(g) | | | 627,300 | |
| | 5,499,000 | | | MEG Energy Corp., 7.000%, 3/31/2024, 144A | | | 5,114,070 | |
| | 1,540,000 | | | Mesquite Energy, Inc., 6.125%, 1/15/2023(c)(f)(g) | | | 7,392 | |
| | 7,305,000 | | | Montage Resources Corp., 8.875%, 7/15/2023 | | | 7,423,706 | |
| | 3,410,000 | | | Occidental Petroleum Corp., 8.875%, 7/15/2030 | | | 3,512,300 | |
| | 565,000 | | | QEP Resources, Inc., 5.250%, 5/01/2023 | | | 411,038 | |
| | 430,000 | | | Range Resources Corp., 4.875%, 5/15/2025 | | | 388,118 | |
| | 5,560,000 | | | Seven Generations Energy Ltd., 5.375%, 9/30/2025, 144A | | | 5,268,100 | |
| | 2,991,000 | | | SM Energy Co.,
10.000%, 1/15/2025, 144A | | | 2,854,341 | |
| | 6,345,000 | | | Southwestern Energy Co., 6.450%, 1/23/2025 | | | 6,146,719 | |
| | 6,905,000 | | | Vine Oil & Gas LP/Vine Oil & Gas Finance Corp., 8.750%, 4/15/2023, 144A | | | 4,626,350 | |
| |
| | | | Independent Energy – continued | |
| $ | 90,000 | | | Vine Oil & Gas LP/Vine Oil & Gas Finance Corp., 9.750%, 4/15/2023, 144A | | $ | 61,200 | |
| | | | | | | | |
| | | | | | | 44,054,123 | |
| | | | | | | | |
| |
| | | | Life Insurance – 0.6% | |
| | 280,000 | | | MetLife, Inc., 9.250%, 4/08/2068, 144A | | | 423,634 | |
| | 1,530,000 | | | MetLife, Inc., 10.750%, 8/01/2069 | | | 2,488,181 | |
| | | | | | | | |
| | | | | | | 2,911,815 | |
| | | | | | | | |
| |
| | | | Media Entertainment – 0.7% | |
| | 1,740,000 | | | iHeartCommunications, Inc., 8.375%, 5/01/2027 | | | 1,713,900 | |
| | 1,810,000 | | | ViacomCBS, Inc., 4.950%, 5/19/2050 | | | 2,123,776 | |
| | | | | | | | |
| | | | | | | 3,837,676 | |
| | | | | | | | |
| |
| | | | Metals & Mining – 4.4% | |
| | 2,520,000 | | | Allegheny Technologies, Inc., 7.875%, 8/15/2023 | | | 2,576,977 | |
| | 5,720,000 | | | Carpenter Technology Corp., 6.375%, 7/15/2028 | | | 5,986,690 | |
| | 3,894,000 | | | Commercial Metals Co., 5.375%, 7/15/2027 | | | 4,107,002 | |
| | 1,660,000 | | | First Quantum Minerals Ltd., 6.875%, 3/01/2026, 144A | | | 1,599,825 | |
| | 4,530,000 | | | First Quantum Minerals Ltd., 7.250%, 5/15/2022, 144A | | | 4,534,077 | |
| | 200,000 | | | First Quantum Minerals Ltd., 7.500%, 4/01/2025, 144A | | | 197,822 | |
| | 1,690,000 | | | Kaiser Aluminum Corp., 6.500%, 5/01/2025, 144A | | | 1,742,035 | |
| | 3,055,000 | | | United States Steel Corp., 6.650%, 6/01/2037 | | | 1,878,825 | |
| | | | | | | | |
| | | | | | | 22,623,253 | |
| | | | | | | | |
| |
| | | | Midstream – 2.7% | |
| | 800,000 | | | Blue Racer Midstream LLC/Blue Racer Finance Corp.,
6.125%, 11/15/2022, 144A | | | 780,440 | |
| | 5,415,000 | | | Energy Transfer Partners LP/Regency Energy Finance Corp., 5.000%, 10/01/2022 | | | 5,698,911 | |
| | 4,635,000 | | | New Fortress Energy, Inc., 6.750%, 9/15/2025, 144A | | | 4,845,893 | |
| | 200,000 | | | NGL Energy Partners LP/NGL Energy Finance Corp., 6.125%, 3/01/2025 | | | 119,000 | |
| | 3,465,000 | | | NGL Energy Partners LP/NGL Energy Finance Corp., 7.500%, 11/01/2023 | | | 2,308,556 | |
| | 885,000 | | | Summit Midstream Partners LP, Series A, (fixed rate to 12/15/2022, variable rate thereafter), 9.500%(b)(c)(f)(g) | | | 111,802 | |
| | | | | | | | |
| | | | | | | 13,864,602 | |
| | | | | | | | |
| |
| | | | Oil Field Services – 0.4% | |
| | 285,000 | | | Noble Holding International Ltd., 7.750%, 1/15/2024(c)(f)(g) | | | 1,630 | |
See accompanying notes to financial statements.
43 |
Portfolio of Investments – as of September 30, 2020
Loomis Sayles Institutional High Income Fund – continued
| | | | | | | | |
Principal
Amount (‡) | | | Description | | Value (†) | |
|
| | Bonds and Notes – continued | |
| |
| | | | Oil Field Services – continued | |
| $ | 250,000 | | | Noble Holding International Ltd., 7.875%, 2/01/2026, 144A(f) | | $ | 60,788 | |
| | 3,410,000 | | | Shelf Drilling Holdings Ltd., 8.250%, 2/15/2025, 144A | | | 1,346,950 | |
| | 3,760,000 | | | Transocean, Inc., 6.800%, 3/15/2038(c)(g) | | | 498,200 | |
| | 250,000 | | | Transocean, Inc., 7.500%, 4/15/2031 | | | 33,750 | |
| | 1,805,000 | | | Valaris PLC, 7.750%, 2/01/2026(c)(f)(g) | | | 91,459 | |
| | | | | | | | |
| | | | | | | 2,032,777 | |
| | | | | | | | |
| |
| | | | Packaging – 0.7% | |
| | 1,375,000 | | | Owens-Brockway Glass Container, Inc., 6.625%, 5/13/2027, 144A | | | 1,489,297 | |
| | 1,830,000 | | | Sealed Air Corp., 5.500%, 9/15/2025, 144A | | | 2,022,150 | |
| | | | | | | | |
| | | | | | | 3,511,447 | |
| | | | | | | | |
| |
| | | | Property & Casualty Insurance – 2.3% | |
| | 1,920,000 | | | MBIA Insurance Corp.,
3-month LIBOR + 11.260%, 11.535%, 1/15/2033, 144A(a)(h) | | | 672,000 | |
| | 2,835,000 | | | MGIC Investment Corp., 5.250%, 8/15/2028 | | | 2,924,090 | |
| | 7,955,000 | | | Radian Group, Inc., 6.625%, 3/15/2025 | | | 8,392,525 | |
| | | | | | | | |
| | | | | | | 11,988,615 | |
| | | | | | | | |
| |
| | | | REITs – Diversified – 0.1% | |
| | 275,000 | | | iStar, Inc., 4.750%, 10/01/2024 | | | 266,063 | |
| | | | | | | | |
| |
| | | | REITs – Health Care – 0.4% | |
| | 1,815,000 | | | MPT Operating Partnership LP/MPT Finance Corp., 5.000%, 10/15/2027 | | | 1,892,500 | |
| | | | | | | | |
| |
| | | | REITs – Hotels – 0.2% | |
| | 45,000 | | | Service Properties Trust, 3.950%, 1/15/2028 | | | 37,350 | |
| | 470,000 | | | Service Properties Trust, 4.350%, 10/01/2024 | | | 425,350 | |
| | 135,000 | | | Service Properties Trust, 4.500%, 6/15/2023 | | | 132,392 | |
| | 75,000 | | | Service Properties Trust, 4.650%, 3/15/2024 | | | 69,750 | |
| | 60,000 | | | Service Properties Trust, 4.750%, 10/01/2026 | | | 53,359 | |
| | 215,000 | | | Service Properties Trust, 4.950%, 2/15/2027 | | | 191,350 | |
| | | | | | | | |
| | | | | | | 909,551 | |
| | | | | | | | |
| |
| | | | Retailers – 1.4% | |
| | 855,000 | | | Hanesbrands, Inc., 5.375%, 5/15/2025, 144A | | | 902,025 | |
| | 165,000 | | | J.C. Penney Corp., Inc., 6.375%, 10/15/2036(c)(f)(g) | | | 789 | |
| | 5,685,000 | | | L Brands, Inc., 5.250%, 2/01/2028 | | | 5,500,237 | |
| | 740,000 | | | Michaels Stores, Inc., 8.000%, 7/15/2027, 144A | | | 773,300 | |
| | | | | | | | |
| | | | | | | 7,176,351 | |
| | | | | | | | |
| |
| | | | Supermarkets – 0.1% | |
| $ | 524,000 | | | Albertson’s Cos. LLC/Safeway, Inc./New Albertson’s LP/Albertson’s LLC, 5.750%, 3/15/2025 | | $ | 540,532 | |
| | 155,000 | | | Safeway, Inc., 7.250%, 2/01/2031 | | | 174,375 | |
| | | | | | | | |
| | | | | | | 714,907 | |
| | | | | | | | |
| |
| | | | Technology – 0.5% | |
| | 2,685,000 | | | Iron Mountain, Inc., 4.875%, 9/15/2029, 144A | | | 2,731,987 | |
| | | | | | | | |
| |
| | | | Transportation Services – 1.2% | |
| | 70,000 | | | Avis Budget Car Rental LLC/Avis Budget Finance, Inc., 5.750%, 7/15/2027, 144A | | | 63,136 | |
| | 3,285,000 | | | Fenix Marine Service Holdings Ltd., 8.000%, 1/15/2024(c)(g) | | | 2,727,634 | |
| | 3,270,000 | | | Penske Truck Leasing Co. LP/PTL Finance Corp., 4.000%, 7/15/2025, 144A | | | 3,683,749 | |
| | | | | | | | |
| | | | | | | 6,474,519 | |
| | | | | | | | |
| |
| | | | Treasuries – 10.8% | |
| | 110,000(††) | | | Mexican Fixed Rate Bonds, Series M, 7.750%, 5/29/2031, (MXN) | | | 560,853 | |
| | 1,595,000(††) | | | Mexican Fixed Rate Bonds, Series M, 8.000%, 12/07/2023, (MXN) | | | 7,912,856 | |
| | 310,000(††) | | | Mexican Fixed Rate Bonds, Series M-20, 7.500%, 6/03/2027, (MXN) | | | 1,558,321 | |
| | 75,000(††) | | | Mexican Fixed Rate Bonds, Series M-20, 8.500%, 5/31/2029, (MXN) | | | 401,055 | |
| | 490,000(††) | | | Mexican Fixed Rate Bonds, Series M-20, 10.000%, 12/05/2024, (MXN) | | | 2,633,610 | |
| | 1,575,000 | | | Norway Government Bond, Series 474, 3.750%, 5/25/2021, 144A, (NOK) | | | 172,950 | |
| | 4,170,000 | | | Republic of Brazil, 10.250%, 1/10/2028, (BRL) | | | 874,082 | |
| | 25,410,000 | | | U.S. Treasury Bond, 1.250%, 5/15/2050 | | | 24,155,381 | |
| | 11,165,000 | | | U.S. Treasury Bond, 3.000%, 8/15/2048 | | | 15,252,873 | |
| | 2,030,000 | | | U.S. Treasury Note, 1.500%, 11/30/2021 | | | 2,061,877 | |
| | | | | | | | |
| | | | | | | 55,583,858 | |
| | | | | | | | |
| |
| | | | Wireless – 0.3% | |
| | 29,970,000 | | | America Movil SAB de CV, 6.450%, 12/05/2022, (MXN) | | | 1,375,192 | |
| | | | | | | | |
| |
| | | | Wirelines – 1.5% | |
| | 205,000 | | | CenturyLink, Inc., 5.625%, 4/01/2025 | | | 219,014 | |
| | 1,180,000 | | | Cincinnati Bell Telephone Co. LLC, 6.300%, 12/01/2028 | | | 1,202,149 | |
| | 1,115,000 | | | Cincinnati Bell, Inc., 8.000%, 10/15/2025, 144A | | | 1,177,719 | |
| | 540,000 | | | Qwest Corp., 7.250%, 9/15/2025 | | | 620,262 | |
| | 2,213,000 | | | Telecom Italia Capital S.A., 6.000%, 9/30/2034 | | | 2,567,080 | |
See accompanying notes to financial statements.
| 44
Portfolio of Investments – as of September 30, 2020
Loomis Sayles Institutional High Income Fund – continued
| | | | | | | | |
Principal
Amount (‡) | | | Description | | Value (†) | |
|
| | Bonds and Notes – continued | |
| |
| | | | Wirelines – continued | |
| $ | 1,550,000 | | | Telecom Italia Capital S.A., 6.375%, 11/15/2033 | | $ | 1,844,500 | |
| | | | | | | | |
| | | | | | | 7,630,724 | |
| | | | | | | | |
| | |
| | | | Total Non-Convertible Bonds | | | | |
| | |
| | | | (Identified Cost $396,953,110) | | | 384,113,101 | |
| | | | | | | | |
|
| | Convertible Bonds – 8.0% | |
| |
| | | | Cable Satellite – 2.7% | |
| | 3,815,000 | | | DISH Network Corp., 2.375%, 3/15/2024 | | | 3,433,309 | |
| | 11,145,000 | | | DISH Network Corp., 3.375%, 8/15/2026 | | | 10,231,071 | |
| | | | | | | | |
| | | | | | | 13,664,380 | |
| | | | | | | | |
| |
| | | | Energy – 0.0% | |
| | 4,610,000 | | | Chesapeake Energy Corp., 5.500%, 9/15/2026(c)(f)(g) | | | 154,435 | |
| | | | | | | | |
| |
| | | | Oil Field Services – 0.4% | |
| | 3,271,000 | | | Pioneer Energy Services Corp., 5.000% PIK or 5.000% Cash, 11/15/2025, 144A(c)(d)(e)(i)(j) | | | 2,008,394 | |
| | | | | | | | |
| |
| | | | Pharmaceuticals – 1.1% | |
| | 440,000 | | | BioMarin Pharmaceutical, Inc., 0.599%, 8/01/2024 | | | 461,715 | |
| | 4,660,000 | | | BioMarin Pharmaceutical, Inc., 1.250%, 5/15/2027, 144A | | | 4,557,439 | |
| | 750,000 | | | Intercept Pharmaceuticals, Inc., 3.250%, 7/01/2023 | | | 602,980 | |
| | | | | | | | |
| | | | | | | 5,622,134 | |
| | | | | | | | |
| |
| | | | REITs – Diversified – 0.2% | |
| | 755,000 | | | iStar, Inc., 3.125%, 9/15/2022 | | | 802,986 | |
| | | | | | | | |
| |
| | | | Technology – 3.6% | |
| | 245,000 | | | Evolent Health, Inc., 3.500%, 12/01/2024, 144A | | | 240,100 | |
| | 10,395,000 | | | Nuance Communications, Inc., 1.000%, 12/15/2035 | | | 15,202,064 | |
| | 1,080,000 | | | Nuance Communications, Inc., 1.250%, 4/01/2025 | | | 1,923,512 | |
| | 877,000 | | | Nuance Communications, Inc., 1.500%, 11/01/2035 | | | 1,441,540 | |
| | | | | | | | |
| | | | | | | 18,807,216 | |
| | | | | | | | |
| | |
| | | | Total Convertible Bonds | | | | |
| | |
| | | | (Identified Cost $41,248,776) | | | 41,059,545 | |
| | | | | | | | |
| | |
| | | | Total Bonds and Notes | | | | |
| | |
| | | | (Identified Cost $438,201,886) | | | 425,172,646 | |
| | | | | | | | |
|
| | Senior Loans – 0.0% | |
| |
| | | | Technology – 0.0% | |
| | 128,399 | | | IQOR U.S., Inc., 2nd Lien Term Loan, Zero Coupon, 4/01/2022(c)(f)(g) (Identified Cost $126,250) | | | 2,696 | |
| | | | | | | | |
|
| | Common Stocks – 14.2% | |
| |
| | | | Automobiles – 1.1% | |
| | 876,900 | | | Ford Motor Co. | | $ | 5,840,154 | |
| | | | | | | | |
| |
| | | | Chemicals – 0.2% | |
| | 98,456 | | | Hexion Holdings Corp., Class B(h) | | | 978,456 | |
| | | | | | | | |
| |
| | | | Diversified Telecommunication Services – 3.2% | |
| | 580,365 | | | AT&T, Inc. | | | 16,546,206 | |
| | | | | | | | |
| |
| | | | Electronic Equipment, Instruments & Components – 4.6% | |
| | 735,766 | | | Corning, Inc. | | | 23,846,176 | |
| | | | | | | | |
| |
| | | | Media – 0.1% | |
| | 67,175 | | | Clear Channel Outdoor Holdings, Inc.(h) | | | 67,175 | |
| | 20,777 | | | iHeartMedia, Inc., Class A(h) | | | 168,709 | |
| | | | | | | | |
| | | | | | | 235,884 | |
| | | | | | | | |
| |
| | | | Oil Field Services – 0.0% | |
| | 19,954 | | | Pioneer Energy Services Corp.(c)(d)(e)(h)(i) | | | — | |
| | | | | | | | |
| |
| | | | Oil, Gas & Consumable Fuels – 0.3% | |
| | 50,400 | | | Battalion Oil Corp.(h) | | | 398,160 | |
| | 14 | | | Chesapeake Energy Corp.(h) | | | 57 | |
| | 1,176 | | | Frontera Energy Corp. | | | 1,881 | |
| | 11,183 | | | Paragon Offshore Ltd., Litigation Units, Class A(c)(d)(e)(h)(i) | | | — | |
| | 16,774 | | | Paragon Offshore Ltd., Litigation Units, Class B(h)(i) | | | 83,870 | |
| | 68,275 | | | Whiting Petroleum Corp.(h) | | | 1,180,475 | |
| | | | | | | | |
| | | | | | | 1,664,443 | |
| | | | | | | | |
| |
| | | | Pharmaceuticals – 4.0% | |
| | 345,208 | | | Bristol-Myers Squibb Co. | | | 20,812,591 | |
| | | | | | | | |
| |
| | | | REITs – Diversified – 0.7% | |
| | 296,558 | | | iStar, Inc. | | | 3,502,350 | |
| | | | | | | | |
| | |
| | | | Total Common Stocks | | | | |
| | |
| | | | (Identified Cost $83,496,081) | | | 73,426,260 | |
| | | | | | | | |
|
| | Preferred Stocks – 1.2% | |
|
| | Convertible Preferred Stocks – 1.0% | |
| |
| | | | Energy – 0.0% | |
| | 15,716 | | | Chesapeake Energy Corp., 5.000%(c)(d)(e)(h) | | | — | |
| | 3,000 | | | Chesapeake Energy Corp., 5.750%, 144A(c)(d)(e)(h) | | | — | |
| | 160 | | | Chesapeake Energy Corp., 5.750%, 144A(c)(d)(e)(h) | | | — | |
| | 30 | | | Chesapeake Energy Corp.,
5.750%(c)(d)(e)(h) | | | — | |
| | 2,954 | | | Chesapeake Energy Corp.,
5.750%(c)(d)(e)(h) | | | — | |
| | | | | | | | |
| | | | | | | — | |
| | | | | | | | |
See accompanying notes to financial statements.
45 |
Portfolio of Investments – as of September 30, 2020
Loomis Sayles Institutional High Income Fund – continued
| | | | | | | | |
Shares | | | Description | | Value (†) | |
|
| | Preferred Stocks – continued | |
| |
| | | | Midstream – 1.0% | |
| | 116,254 | | | El Paso Energy Capital Trust I, 4.750% | | $ | 5,437,200 | |
| | | | | | | | |
| | |
| | | | Total Convertible Preferred Stocks | | | | |
| | |
| | | | (Identified Cost $10,813,621) | | | 5,437,200 | |
| | | | | | | | |
|
| | Non-Convertible Preferred Stocks – 0.2% | |
| |
| | | | Finance Companies – 0.0% | |
| | 2,575 | | | iStar, Inc., Series G, 7.650% | | | 62,778 | |
| | | | | | | | |
| |
| | | | Home Construction – 0.1% | |
| | 96,887 | | | Hovnanian Enterprises, Inc., 7.625%(h) | | | 687,898 | |
| | | | | | | | |
| |
| | | | REITs – Warehouse/Industrials – 0.1% | |
| | 3,363 | | | Prologis, Inc., Series Q, 8.540% | | | 264,500 | |
| | | | | | | | |
| |
| | | | Total Non-Convertible Preferred Stocks | |
| | |
| | | | (Identified Cost $857,979) | | | 1,015,176 | |
| | | | | | | | |
| | |
| | | | Total Preferred Stocks | | | | |
| | |
| | | | (Identified Cost $11,671,600) | | | 6,452,376 | |
| | | | | | | | |
|
| | Warrants – 0.0% | |
| | 6,752 | | | iHeartMedia, Inc., Expiration on 5/1/2039(h) | | | | |
| | |
| | | | (Identified Cost $153,515) | | | 53,172 | |
| | | | | | | | |
| | |
| Principal
Amount (‡) |
| | | | | | |
|
| | Short-Term Investments – 1.2% | |
| | |
| | 120,226,126 | | | Central Bank of Iceland,
0.000%, (ISK)(a)(k) | | | 869,031 | |
| | |
| | 5,346,382 | | | Tri-Party Repurchase Agreement with Fixed Income Clearing Corporation, dated 9/30/2020 at 0.000% to be repurchased at $5,346,382 on 10/01/2020 collateralized by $5,453,800 U.S. Treasury Note, 0.250% due 9/30/2025 valued at $5,453,375 including accrued interest (Note 2 of Notes to Financial Statements) | | | 5,346,382 | |
| | | | | | | | |
| | |
| | | | Total Short-Term Investments | | | | |
| | |
| | | | (Identified Cost $6,324,944) | | | 6,215,413 | |
| | | | | | | | |
| | |
| | | | Total Investments – 98.9% | | | | |
| | |
| | | | (Identified Cost $539,974,276) | | | 511,322,563 | |
| | |
| | | | Other assets less liabilities—1.1% | | | 5,492,850 | |
| | | | | | | | |
| | |
| | | | Net Assets – 100.0% | | $ | 516,815,413 | |
| | | | | | | | |
| |
| | (‡) | | | Principal Amount stated in U.S. dollars unless otherwise noted. |
| |
| | (†) | | | See Note 2 of Notes to Financial Statements. |
| |
| | (††) | | | Amount shown represents units. One unit represents a principal amount of 100. |
| |
| | (a) | | | Variable rate security. Rate as of September 30, 2020 is disclosed. |
| |
| | (b) | | | Perpetual bond with no specified maturity date. |
| |
| | (c) | | | Illiquid security. (Unaudited) |
| |
| | (d) | | | Fair valued by the Fund’s adviser. At September 30, 2020, the value of these securities amounted to $2,329,342 or 0.5% of net assets. See Note 2 of Notes to Financial Statements. |
| |
| | (e) | | | Level 3 security. Value has been determined using significant unobservable inputs. See Note 3 of Notes to Financial Statements. |
| |
| | (f) | | | The issuer is in default with respect to interest and/or principal payments. Income is not being accrued. |
| |
| | (g) | | | Securities classified as fair valued pursuant to the Fund’s pricing policies and procedures. At September 30, 2020, the value of these securities amounted to $4,512,083 or 0.9% of net assets. See Note 2 of Notes to Financial Statements. |
| |
| | (h) | | | Non-income producing security. |
| |
| | (i) | | | Securities subject to restriction on resale. At September 30, 2020, the restricted securities held by the Fund are as follows: |
| | | | | | | | | | | | | | |
| | | Acquisition
Date | | Acquisition
Cost | | | Value | | | % of
Net Assets | |
| | | | |
| Paragon Offshore Ltd., Litigation Units, Class A | | 7/18/2017 | | $ | 85,478 | | | $ | — | | | | — | |
| | | | |
| Paragon Offshore Ltd., Litigation Units, Class B | | 7/18/2017 | | | 1,709,463 | | | | 83,870 | | | | Less than 0.1% | |
| | | | |
| Pioneer Energy Services Corp., 5.000% PIK or 5.000% Cash | | 5/29/2020 | | | 3,029,000 | | | | 2,008,394 | | | | 0.4% | |
| | | | |
| Pioneer Energy Services Corp. | | 5/29/2020 | | | 5,792,979 | | | | — | | | | — | |
| | | | | | |
| |
| | (j) | | | Payment-in-kind security for which the issuer, at each interest payment date, may make interest payments in cash and/or additional principal. No payments were received during the period. |
| |
| | (k) | | | Security callable by issuer at any time. No specified maturity date. |
| |
| | 144A | | | All or a portion of these securities are exempt from registration under Rule 144A of the Securities Act of 1933. These securities may be resold in transactions exempt from registration, normally to qualified institutional buyers. At September 30, 2020, the value of Rule 144A holdings amounted to $119,656,781 or 23.2% of net assets. |
| |
| | LIBOR | | | London Interbank Offered Rate |
| |
| | MTN | | | Medium Term Note |
| |
| | PIK | | | Payment-in-Kind |
| |
| | REITs | | | Real Estate Investment Trusts |
| |
| | BRL | | | Brazilian Real |
| |
| | CAD | | | Canadian Dollar |
| |
| | ISK | | | Icelandic Krona |
| |
| | MXN | | | Mexican Peso |
| |
| | NOK | | | Norwegian Krone |
See accompanying notes to financial statements.
| 46
Portfolio of Investments – as of September 30, 2020
Loomis Sayles Institutional High Income Fund – continued
Industry Summary at September 30, 2020
| | | | |
Treasuries | | | 10.8 | % |
Healthcare | | | 9.5 | |
Independent Energy | | | 8.5 | |
Finance Companies | | | 7.2 | |
Cable Satellite | | | 6.0 | |
Pharmaceuticals | | | 5.1 | |
Electronic Equipment, Instruments & Components | | | 4.6 | |
Metals & Mining | | | 4.4 | |
Technology | | | 4.1 | |
Midstream | | | 3.7 | |
Aerospace & Defense | | | 3.5 | |
Diversified Telecommunication Services | | | 3.2 | |
Automotive | | | 2.9 | |
Property & Casualty Insurance | | | 2.3 | |
Airlines | | | 2.0 | |
Other Investments, less than 2% each | | | 19.9 | |
Short-Term Investments | | | 1.2 | |
| | | | |
Total Investments | | | 98.9 | |
Other assets less liabilities | | | 1.1 | |
| | | | |
Net Assets | | | 100.0 | % |
| | | | |
See accompanying notes to financial statements.
47 |
Portfolio of Investments – as of September 30, 2020
Loomis Sayles Investment Grade Fixed Income Fund
| | | | | | | | |
Principal
Amount (‡) | | | Description | | Value (†) | |
|
| | Bonds and Notes – 82.5% of Net Assets | |
|
| | Non-Convertible Bonds – 80.2% | |
| |
| | | | ABS Home Equity – 0.0% | |
| $ | 11,585 | | | Morgan Stanley Mortgage Loan Trust, Series 2005-3AR, Class 5A,
3.344%, 7/25/2035(a)(b)(c) | | $ | 9,826 | |
| | | | | | | | |
| |
| | | | ABS Other – 0.5% | |
| | 2,090,502 | | | FAN Engine Securitization Ltd., Series 2013-1A, Class 1A,
4.625%, 10/15/2043, 144A(b)(d)(e) | | | 1,149,776 | |
| | | | | | | | |
| |
| | | | Aerospace & Defense – 0.7% | |
| | 85,000 | | | Boeing Co. (The), 3.100%, 5/01/2026 | | | 84,791 | |
| | 15,000 | | | Boeing Co. (The), 3.250%, 2/01/2035 | | | 14,100 | |
| | 100,000 | | | Boeing Co. (The), 3.550%, 3/01/2038 | | | 91,094 | |
| | 15,000 | | | Boeing Co. (The), 3.625%, 3/01/2048 | | | 13,182 | |
| | 50,000 | | | Boeing Co. (The), 3.750%, 2/01/2050 | | | 45,625 | |
| | 390,000 | | | Boeing Co. (The), 3.850%, 11/01/2048 | | | 357,369 | |
| | 395,000 | | | Boeing Co. (The), 3.950%, 8/01/2059 | | | 357,579 | |
| | 376,000 | | | Embraer Netherlands Finance BV,
5.400%, 2/01/2027 | | | 357,012 | |
| | 195,000 | | | TransDigm, Inc., 8.000%, 12/15/2025, 144A | | | 212,062 | |
| | | | | | | | |
| | | | | | | 1,532,814 | |
| | | | | | | | |
| |
| | | | Airlines – 2.2% | |
| | 149,189 | | | Air Canada Pass Through Trust, Series 2013-1, Class B, 5.375%, 11/15/2022, 144A | | | 134,075 | |
| | 1,490,000 | | | Air Canada Pass Through Trust, Series 2020-2A, 5.250%, 10/01/2030, 144A | | | 1,527,980 | |
| | 1,535,000 | | | American Airlines Group, Inc.,
5.000%, 6/01/2022, 144A | | | 1,043,800 | |
| | 256,573 | | | American Airlines Pass Through Certificates, Series 2013-1, Class A,
4.000%, 1/15/2027 | | | 203,093 | |
| | 58,428 | | | American Airlines Pass Through Certificates, Series 2016-3, Class B,
3.750%, 4/15/2027 | | | 40,526 | |
| | 12,948 | | | Continental Airlines Pass Through Certificates, Series 2000-2, Class A-1,
7.707%, 10/02/2022 | | | 12,825 | |
| | 395,855 | | | Continental Airlines Pass Through Certificates, Series 2007-1, Class A,
5.983%, 10/19/2023 | | | 388,225 | |
| | 38,127 | | | Continental Airlines Pass Through Certificates, Series 2012-2, Class B,
5.500%, 4/29/2022 | | | 37,046 | |
| | 288,401 | | | Delta Air Lines Pass Through Trust, Series 2007-1, Class B,
8.021%, 2/10/2024 | | | 271,312 | |
| | 455,000 | | | Mileage Plus Holdings LLC/Mileage Plus Intellectual Property Assets Ltd.,
6.500%, 6/20/2027, 144A | | | 473,769 | |
| | 236,884 | | | U.S. Airways Pass Through Trust, Series 2011-1, Class A,
7.125%, 4/22/2025 | | | 197,554 | |
| |
| | | | Airlines – continued | |
| $ | 495,097 | | | U.S. Airways Pass Through Trust, Series 2012-2A, Class A,
4.625%, 12/03/2026 | | $ | 410,322 | |
| | 275,058 | | | United Airlines Pass Through Trust, Series 2016-2, Class B,
3.650%, 4/07/2027 | | | 207,468 | |
| | | | | | | | |
| | | | | | | 4,947,995 | |
| | | | | | | | |
| |
| | | | Automotive – 5.3% | |
| | 659,000 | | | Cummins, Inc., 5.650%, 3/01/2098 | | | 798,879 | |
| | 8,576,000 | | | Ford Motor Credit Co. LLC, GMTN,
4.389%, 1/08/2026 | | | 8,478,148 | |
| | 869,000 | | | General Motors Co., 5.200%, 4/01/2045 | | | 936,056 | |
| | 250,000 | | | General Motors Co., 6.250%, 10/02/2043 | | | 296,266 | |
| | 1,625,000 | | | General Motors Financial Co., Inc.,
3.600%, 6/21/2030 | | | 1,682,862 | |
| | | | | | | | |
| | | | | | | 12,192,211 | |
| | | | | | | | |
| |
| | | | Banking – 6.5% | |
| | 2,255,000 | | | Ally Financial, Inc., 4.125%, 2/13/2022 | | | 2,336,856 | |
| | 420,000 | | | Banco Santander Mexico S.A. Institucion de Banca Multiple Grupo Financiero Santander, 5.375%, 4/17/2025, 144A | | | 467,460 | |
| | 635,000 | | | Bank of America Corp., (fixed rate to 12/20/2022, variable rate thereafter), 3.004%, 12/20/2023 | | | 666,620 | |
| | 1,244,000 | | | Bank of America Corp., (fixed rate to 12/20/2027, variable rate thereafter), 3.419%, 12/20/2028 | | | 1,384,293 | |
| | 314,000 | | | Bank of America Corp., MTN,
4.250%, 10/22/2026 | | | 363,589 | |
| | 536,000 | | | Bank of America Corp., Series L, MTN, 4.183%, 11/25/2027 | | | 614,105 | |
| | 3,224,000 | | | JPMorgan Chase & Co.,
4.125%, 12/15/2026 | | | 3,746,020 | |
| | 482,000 | | | Morgan Stanley, 3.950%, 4/23/2027 | | | 546,382 | |
| | 659,000 | | | Morgan Stanley, 5.750%, 1/25/2021 | | | 670,261 | |
| | 953,000 | | | Morgan Stanley, GMTN,
4.350%, 9/08/2026 | | | 1,103,098 | |
| | 1,727,000 | | | Morgan Stanley, MTN,
6.250%, 8/09/2026 | | | 2,193,285 | |
| | 710,000 | | | NatWest Group PLC, 6.000%, 12/19/2023 | | | 798,479 | |
| | | | | | | | |
| | | | | | | 14,890,448 | |
| | | | | | | | |
| |
| | | | Brokerage – 1.8% | |
| | 2,528,000 | | | Jefferies Group LLC, 5.125%, 1/20/2023 | | | 2,755,575 | |
| | 733,000 | | | Jefferies Group LLC, 6.250%, 1/15/2036 | | | 908,386 | |
| | 343,000 | | | Jefferies Group LLC, 6.450%, 6/08/2027 | | | 418,158 | |
| | | | | | | | |
| | | | | | | 4,082,119 | |
| | | | | | | | |
| |
| | | | Building Materials – 0.6% | |
| | 211,000 | | | Masco Corp., 6.500%, 8/15/2032 | | | 273,527 | |
| | 104,000 | | | Masco Corp., 7.750%, 8/01/2029 | | | 146,738 | |
See accompanying notes to financial statements.
| 48
Portfolio of Investments – as of September 30, 2020
Loomis Sayles Investment Grade Fixed Income Fund – continued
| | | | | | | | |
Principal
Amount (‡) | | | Description | | Value (†) | |
|
| | Bonds and Notes – continued | |
| |
| | | | Building Materials – continued | |
| $ | 778,000 | | | Owens Corning, 7.000%, 12/01/2036 | | $ | 1,037,163 | |
| | | | | | | | |
| | | | | | | 1,457,428 | |
| | | | | | | | |
| |
| | | | Cable Satellite – 0.1% | |
| | 12,000 | | | Cox Communications, Inc.,
4.800%, 2/01/2035, 144A | | | 15,093 | |
| | 145,000 | | | Time Warner Cable LLC,
5.500%, 9/01/2041 | | | 175,651 | |
| | | | | | | | |
| | | | | | | 190,744 | |
| | | | | | | | |
| |
| | | | Collateralized Mortgage Obligations – 0.1% | |
| | 239,001 | | | Federal Home Loan Mortgage Corp., REMIC, Series 2912, Class EH,
5.500%, 1/15/2035 | | | 281,699 | |
| | | | | | | | |
| |
| | | | Consumer Products – 0.6% | |
| | 360,000 | | | Hasbro, Inc., 6.600%, 7/15/2028 | | | 425,133 | |
| | 805,000 | | | Whirlpool Corp., 4.600%, 5/15/2050 | | | 997,010 | |
| | | | | | | | |
| | | | | | | 1,422,143 | |
| | | | | | | | |
| |
| | | | Diversified Manufacturing – 0.1% | |
| | 51,000 | | | General Electric Co., GMTN,
3.100%, 1/09/2023 | | | 53,519 | |
| | 224,000 | | | General Electric Co., Series A, MTN,
3-month LIBOR + 0.300%, 0.575%, 5/13/2024(f) | | | 214,481 | |
| | | | | | | | |
| | | | | | | 268,000 | |
| | | | | | | | |
| |
| | | | Electric – 0.9% | |
| | 95,000 | | | Edison International, 4.950%, 4/15/2025 | | | 103,987 | |
| | 1,037,000 | | | Enel Finance International NV,
6.000%, 10/07/2039, 144A | | | 1,409,749 | |
| | 416,000 | | | Enel Finance International NV,
6.800%, 9/15/2037, 144A | | | 585,838 | |
| | | | | | | | |
| | | | | | | 2,099,574 | |
| | | | | | | | |
| |
| | | | Finance Companies – 4.1% | |
| | 1,840,000 | | | GE Capital Funding LLC,
4.550%, 5/15/2032, 144A | | | 1,977,751 | |
| | 15,000 | | | Navient Corp., 5.000%, 3/15/2027 | | | 14,085 | |
| | 3,370,000 | | | Navient Corp., 5.500%, 1/25/2023 | | | 3,391,416 | |
| | 95,000 | | | Navient Corp., 5.875%, 10/25/2024 | | | 94,466 | |
| | 110,000 | | | Navient Corp., 6.750%, 6/15/2026 | | | 109,725 | |
| | 891,000 | | | Navient Corp., MTN, 5.625%, 8/01/2033 | | | 749,888 | |
| | 691,000 | | | Navient Corp., MTN, 6.125%, 3/25/2024 | | | 696,183 | |
| | 398,000 | | | Navient Corp., MTN, 7.250%, 1/25/2022 | | | 407,950 | |
| | 1,920,000 | | | Owl Rock Capital Corp.,
4.250%, 1/15/2026 | | | 1,945,018 | |
| | | | | | | | |
| | | | | | | 9,386,482 | |
| | | | | | | | |
| |
| | | | Food & Beverage – 0.4% | |
| | 1,000,000 | | | Coca-Cola Co. (The),
1.550%, 9/01/2021 | | | 1,011,596 | |
| | | | | | | | |
| |
| | | | Government Owned – No Guarantee – 0.4% | |
| | 780,000 | | | Pertamina Persero PT,
6.450%, 5/30/2044, 144A | | | 1,010,422 | |
| | | | | | | | |
| |
| | | | Healthcare – 0.7% | |
| 10,000 | | | Cigna Corp., 7.875%, 5/15/2027 | | | 13,579 | |
| | 1,192,000 | | | HCA, Inc., 4.500%, 2/15/2027 | | | 1,338,846 | |
| | 182,000 | | | HCA, Inc., MTN, 7.750%, 7/15/2036 | | | 232,050 | |
| | | | | | | | |
| | | | | | | 1,584,475 | |
| | | | | | | | |
| |
| | | | Home Construction – 1.6% | |
| | 1,989,000 | | | PulteGroup, Inc., 6.000%, 2/15/2035 | | | 2,456,415 | |
| | 867,000 | | | PulteGroup, Inc., 6.375%, 5/15/2033 | | | 1,090,253 | |
| | | | | | | | |
| | | | | | | 3,546,668 | |
| | | | | | | | |
| |
| | | | Hybrid ARMs – 0.0% | |
| | 5,061 | | | FNMA,
6-month LIBOR + 1.558%, 1.963%, 2/01/2037(f) | | | 5,214 | |
| | 10,867 | | | FNMA,
12-month LIBOR + 1.883%, 3.113%, 9/01/2036(f) | | | 11,468 | |
| | | | | | | | |
| | | | | | | 16,682 | |
| | | | | | | | |
| |
| | | | Independent Energy – 1.0% | |
| | 840,000 | | | Chesapeake Energy Corp.,
8.000%, 6/15/2027(d)(e)(g) | | | 28,350 | |
| | 353,000 | | | Continental Resources, Inc.,
3.800%, 6/01/2024 | | | 325,642 | |
| | 63,000 | | | Continental Resources, Inc.,
4.500%, 4/15/2023 | | | 60,039 | |
| | 1,416,000 | | | Noble Energy, Inc.,
3.900%, 11/15/2024 | | | 1,549,333 | |
| | 605,000 | | | SM Energy Co.,
6.625%, 1/15/2027 | | | 268,735 | |
| | | | | | | | |
| | | | | | | 2,232,099 | |
| | | | | | | | |
| |
| | | | Industrial Other – 0.9% | |
| | 2,757,000 | | | Original Wempi, Inc., Series B1,
4.309%, 2/13/2024, (CAD)(d)(e) | | | 2,075,302 | |
| | | | | | | | |
| |
| | | | Integrated Energy – 0.2% | |
| | 500,000 | | | Reliance Industries Ltd.,
5.400%, 2/14/2022, 144A | | | 526,801 | |
| | | | | | | | |
| |
| | | | Life Insurance – 2.7% | |
| | 39,000 | | | American International Group, Inc.,
4.125%, 2/15/2024 | | | 43,192 | |
| | 56,000 | | | American International Group, Inc.,
4.875%, 6/01/2022 | | | 60,029 | |
| | 205,000 | | | Brighthouse Financial, Inc.,
4.700%, 6/22/2047 | | | 197,291 | |
| | 1,402,000 | | | Global Atlantic Fin Co.,
8.625%, 4/15/2021, 144A | | | 1,447,120 | |
| | 1,488,000 | | | National Life Insurance Co.,
10.500%, 9/15/2039, 144A(d)(e) | | | 2,397,436 | |
| | 1,560,000 | | | NLV Financial Corp.,
7.500%, 8/15/2033, 144A(d)(e) | | | 2,052,586 | |
| | | | | | | | |
| | | | | | | 6,197,654 | |
| | | | | | | | |
| |
| | | | Media Entertainment – 1.7% | |
| | 1,170,000 | | | Discovery Communications LLC,
3.950%, 3/20/2028 | | | 1,330,991 | |
| | 14,290,000 | | | Grupo Televisa SAB, EMTN,
7.250%, 5/14/2043, (MXN) | | | 482,680 | |
| | 39,000 | | | ViacomCBS, Inc., 4.375%, 3/15/2043 | | | 41,458 | |
| | 825,000 | | | ViacomCBS, Inc., 4.950%, 5/19/2050 | | | 968,020 | |
| | 663,000 | | | ViacomCBS, Inc., 5.250%, 4/01/2044 | | | 770,505 | |
See accompanying notes to financial statements.
49 |
Portfolio of Investments – as of September 30, 2020
Loomis Sayles Investment Grade Fixed Income Fund – continued
| | | | | | | | |
Principal
Amount (‡) | | | Description | | Value (†) | |
|
| | Bonds and Notes – continued | |
| |
| | | | Media Entertainment – continued | |
| $ | 239,000 | | | ViacomCBS, Inc., 5.850%, 9/01/2043 | | $ | 303,170 | |
| | | | | | | | |
| | | | | | | 3,896,824 | |
| | | | | | | | |
| |
| | | | Metals & Mining – 0.9% | |
| | 1,373,000 | | | ArcelorMittal S.A., 7.000%, 3/01/2041 | | | 1,695,655 | |
| | 304,000 | | | ArcelorMittal S.A., 7.250%, 10/15/2039 | | | 383,694 | |
| | | | | | | | |
| | | | | | | 2,079,349 | |
| | | | | | | | |
| |
| | | | Midstream – 3.0% | |
| | 125,000 | | | DCP Midstream Operating LP,
6.450%, 11/03/2036, 144A | | | 119,785 | |
| | 588,000 | | | Enable Midstream Partners LP,
5.000%, 5/15/2044 | | | 495,537 | |
| | 404,000 | | | Enbridge Energy Partners LP,
7.375%, 10/15/2045 | | | 591,513 | |
| | 858,000 | | | EnLink Midstream Partners LP,
4.150%, 6/01/2025 | | | 738,764 | |
| | 330,000 | | | EnLink Midstream Partners LP,
5.050%, 4/01/2045 | | | 209,550 | |
| | 735,000 | | | EnLink Midstream Partners LP,
5.450%, 6/01/2047 | | | 463,050 | |
| | 850,000 | | | EnLink Midstream Partners LP,
5.600%, 4/01/2044 | | | 546,125 | |
| | 2,949,000 | | | ONEOK Partners LP,
4.900%, 3/15/2025 | | | 3,231,591 | |
| | 43,000 | | | ONEOK Partners LP,
6.200%, 9/15/2043 | | | 45,556 | |
| | 27,000 | | | Plains All American Pipeline LP/PAA Finance Corp., 2.850%, 1/31/2023 | | | 27,461 | |
| | 392,000 | | | Williams Cos., Inc. (The),
3.350%, 8/15/2022 | | | 406,655 | |
| | | | | | | | |
| | | | | | | 6,875,587 | |
| | | | | | | | |
| |
| | | | Non-Agency Commercial Mortgage-Backed Securities – 0.0% | |
| | 13,664 | | | Commercial Mortgage Pass Through Certificates, Series 2014-UBS4, Class A2, 2.963%, 8/10/2047 | | | 13,740 | |
| | 94,890 | | | WFRBS Commercial Mortgage Trust, Series 2011-C3, Class D,
5.853%, 3/15/2044, 144A(c) | | | 58,923 | |
| | | | | | | | |
| | | | | | | 72,663 | |
| | | | | | | | |
| | |
| | | | Oil Field Services – 0.1% | | | | |
| | 680,000 | | | Transocean, Inc., 6.800%, 3/15/2038 | | | 90,100 | |
| | 110,000 | | | Transocean, Inc., 7.500%, 4/15/2031 | | | 14,850 | |
| | | | | | | | |
| | | | | | | 104,950 | |
| | | | | | | | |
| | |
| | | | Packaging – 0.6% | | | | |
| | 1,302,000 | | | Sealed Air Corp.,
5.500%, 9/15/2025, 144A | | | 1,438,710 | |
| | | | | | | | |
| | |
| | | | Paper – 0.5% | | | | |
| | 552,000 | | | Georgia-Pacific LLC, 7.250%, 6/01/2028 | | | 730,340 | |
| | 137,000 | | | WestRock MWV LLC, 7.550%, 3/01/2047(d)(e) | | | 196,157 | |
| | |
| | | | Paper – continued | | | | |
| $ | 104,000 | | | WestRock MWV LLC,
8.200%, 1/15/2030 | | $ | 146,546 | |
| | | | | | | | |
| | | | | | | 1,073,043 | |
| | | | | | | | |
| |
| | | | Property & Casualty Insurance – 1.9% | |
| | 87,000 | | | MBIA Insurance Corp.,
3-month LIBOR + 11.260%, 11.535%, 1/15/2033, 144A(f)(h) | | | 30,450 | |
| | 2,715,000 | | | Nationwide Mutual Insurance Co.,
4.350%, 4/30/2050, 144A | | | 2,908,555 | |
| | 1,286,000 | | | Old Republic International Corp.,
4.875%, 10/01/2024 | | | 1,459,814 | |
| | | | | | | | |
| | | | | | | 4,398,819 | |
| | | | | | | | |
| | |
| | | | Retailers – 0.0% | | | | |
| | 52,000 | | | J.C. Penney Corp., Inc.,
6.375%, 10/15/2036(d)(e)(g) | | | 249 | |
| | | | | | | | |
| | |
| | | | Sovereigns – 1.5% | | | | |
| | 1,452,000 | | | U.S. Department of Housing and Urban Development, Series A,
2.350%, 8/01/2021 | | | 1,477,367 | |
| | 1,760,000 | | | U.S. Department of Housing and Urban Development, Series A,
2.450%, 8/01/2022 | | | 1,829,608 | |
| | | | | | | | |
| | | | | | | 3,306,975 | |
| | | | | | | | |
| | |
| | | | Supermarkets – 0.0% | | | | |
| | 39,000 | | | Koninklijke Ahold Delhaize NV,
5.700%, 10/01/2040 | | | 55,422 | |
| | | | | | | | |
| | |
| | | | Technology – 0.5% | | | | |
| | 776,000 | | | KLA Corp., 5.650%, 11/01/2034 | | | 1,036,797 | |
| | 152,000 | | | Samsung Electronics Co. Ltd.,
7.700%, 10/01/2027, 144A | | | 188,095 | |
| | | | | | | | |
| | | | | | | 1,224,892 | |
| | | | | | | | |
| | |
| | | | Transportation Services – 0.4% | | | | |
| | 562,000 | | | ERAC USA Finance LLC,
6.700%, 6/01/2034, 144A | | | 776,227 | |
| | 60,000 | | | Fenix Marine Service Holdings Ltd.,
8.000%, 1/15/2024(d)(e) | | | 49,820 | |
| | | | | | | | |
| | | | | | | 826,047 | |
| | | | | | | | |
| | |
| | | | Treasuries – 32.1% | | | | |
| | 200,000(††) | | | Mexican Fixed Rate Bonds, Series M,
7.750%, 5/29/2031, (MXN) | | | 1,019,732 | |
| | 578,400(††) | | | Mexican Fixed Rate Bonds, Series M,
8.000%, 12/07/2023, (MXN) | | | 2,869,465 | |
| | 207,800(††) | | | Mexican Fixed Rate Bonds, Series M-20, 7.500%, 6/03/2027, (MXN) | | | 1,044,578 | |
| | 137,300(††) | | | Mexican Fixed Rate Bonds, Series M-20, 8.500%, 5/31/2029, (MXN) | | | 734,198 | |
| | 913,700(††) | | | Mexican Fixed Rate Bonds, Series M-20, 10.000%, 12/05/2024, (MXN) | | | 4,910,877 | |
| | 8,546,000 | | | Norway Government Bond, Series 474, 3.750%, 5/25/2021, 144A, (NOK) | | | 938,430 | |
| | 3,126,000 | | | Republic of Brazil, 8.500%, 1/05/2024, (BRL) | | | 611,846 | |
See accompanying notes to financial statements.
| 50
Portfolio of Investments – as of September 30, 2020
Loomis Sayles Investment Grade Fixed Income Fund – continued
| | | | | | | | |
Principal
Amount (‡) | | | Description | | Value (†) | |
|
| | Bonds and Notes – continued | |
| | |
| | | | Treasuries – continued | | | | |
| $ | 21,285,000 | | | U.S. Treasury Bond, 1.250%, 5/15/2050 | | $ | 20,234,053 | |
| | 11,325,000 | | | U.S. Treasury Bond, 1.375%, 8/15/2050 | | | 11,114,426 | |
| | 2,105,000 | | | U.S. Treasury Bond, 3.000%, 8/15/2048 | | | 2,875,710 | |
| | 10,490,000 | | | U.S. Treasury Note, 1.500%, 9/30/2021 | | | 10,632,598 | |
| | 2,835,000 | | | U.S. Treasury Note, 1.500%, 10/31/2021 | | | 2,876,860 | |
| | 13,460,000 | | | U.S. Treasury Note, 1.500%, 11/30/2021 | | | 13,671,364 | |
| | | | | | | | |
| | | | | | | 73,534,137 | |
| | | | | | | | |
| | |
| | | | Wireless – 0.2% | | | | |
| | 8,340,000 | | | America Movil SAB de CV,
6.450%, 12/05/2022, (MXN) | | | 382,686 | |
| | | | | | | | |
| | |
| | | | Wirelines – 5.4% | | | | |
| | 598,000 | | | AT&T, Inc.,
3.650%, 9/15/2059, 144A | | | 587,445 | |
| | 2,841,000 | | | AT&T, Inc., 4.300%, 2/15/2030 | | | 3,367,523 | |
| | 317,000 | | | AT&T, Inc., 4.500%, 3/09/2048 | | | 363,794 | |
| | 876,000 | | | Telecom Italia Capital S.A.,
6.000%, 9/30/2034 | | | 1,016,160 | |
| | 589,000 | | | Telefonica Emisiones S.A., EMTN,
5.375%, 2/02/2026, (GBP) | | | 921,463 | |
| | 5,077,000 | | | Verizon Communications, Inc.,
4.329%, 9/21/2028 | | | 6,163,478 | |
| | | | | | | | |
| | | | | | | 12,419,863 | |
| | | | | | | | |
| | |
| | | | Total Non-Convertible Bonds | | | | |
| | |
| | | | (Identified Cost $182,702,750) | | | 183,803,174 | |
| | | | | | | | |
| |
| | Convertible Bonds – 1.6% | | | | |
| | |
| | | | Cable Satellite – 0.1% | | | | |
| | 280,000 | | | DISH Network Corp.,
3.375%, 8/15/2026 | | | 257,039 | |
| | | | | | | | |
| | |
| | | | Energy – 0.0% | | | | |
| | 1,470,000 | | | Chesapeake Energy Corp.,
5.500%, 9/15/2026(d)(e)(g) | | | 49,245 | |
| | | | | | | | |
| | |
| | | | REITs – Diversified – 0.2% | | | | |
| | 329,000 | | | iStar, Inc., 3.125%, 9/15/2022 | | | 349,910 | |
| | | | | | | | |
| | |
| | | | Technology – 1.3% | | | | |
| | 2,051,000 | | | Booking Holdings, Inc.,
0.900%, 9/15/2021 | | | 2,182,479 | |
| | 326,000 | | | Nuance Communications, Inc.,
1.000%, 12/15/2035 | | | 476,755 | |
| | 224,000 | | | Nuance Communications, Inc.,
1.250%, 4/01/2025 | | | 398,951 | |
| | 8,000 | | | Nuance Communications, Inc.,
1.500%, 11/01/2035 | | | 13,150 | |
| | | | | | | | |
| | | | | | | 3,071,335 | |
| | | | | | | | |
| | |
| | | | Total Convertible Bonds | | | | |
| | |
| | | | (Identified Cost $4,147,308) | | | 3,727,529 | |
| | | | | | | | |
| |
| | Municipals – 0.7% | | | | |
| | |
| | | | Illinois – 0.1% | | | | |
| 245,000 | | | State of Illinois, 5.100%, 6/01/2033 | | | 247,594 | |
| | | | | | | | |
| | |
| | | | Michigan – 0.2% | | | | |
| | 380,000 | | | Michigan Tobacco Settlement Finance Authority, Series A,
7.309%, 6/01/2034 | | | 388,094 | |
| | | | | | | | |
| | |
| | | | Virginia – 0.4% | | | | |
| | 875,000 | | | Tobacco Settlement Financing Corp., Series A-1, 6.706%, 6/01/2046 | | | 903,114 | |
| | | | | | | | |
| | |
| | | | Total Municipals | | | | |
| | |
| | | | (Identified Cost $1,447,092) | | | 1,538,802 | |
| | | | | | | | |
| | |
| | | | Total Bonds and Notes | | | | |
| | |
| | | | (Identified Cost $188,297,150) | | | 189,069,505 | |
| | | | | | | | |
| | |
| | Shares | | | | | | | |
| |
| | Common Stocks – 9.7% | | | | |
| | |
| | | | Automobiles – 0.2% | | | | |
| | 71,933 | | | Ford Motor Co. | | | 479,073 | |
| | | | | | | | |
| |
| | | | Diversified Telecommunication Services – 1.1% | |
| | 88,190 | | | AT&T, Inc. | | | 2,514,297 | |
| | | | | | | | |
| |
| | | | Electronic Equipment, Instruments & Components – 8.0% | |
| | 565,646 | | | Corning, Inc. | | | 18,332,587 | |
| | | | | | | | |
| | |
| | | | Pharmaceuticals – 0.4% | | | | |
| | 13,089 | | | Bristol-Myers Squibb Co. | | | 789,136 | |
| | | | | | | | |
| | |
| | | | Total Common Stocks | | | | |
| | |
| | | | (Identified Cost $11,119,244) | | | 22,115,093 | |
| | | | | | | | |
| |
| | Preferred Stocks – 0.8% | | | | |
| |
| | Convertible Preferred Stocks – 0.7% | | | | |
| | |
| | | | Banking – 0.5% | | | | |
| | 714 | | | Bank of America Corp., Series L,
7.250% | | | 1,062,432 | |
| | | | | | | | |
| | |
| | | | Energy – 0.0% | | | | |
| | 3,453 | | | Chesapeake Energy Corp.,
5.000%(a)(b)(d)(h) | | | — | |
| | | | | | | | |
| | |
| | | | Midstream – 0.2% | | | | |
| | 12,375 | | | El Paso Energy Capital Trust I,
4.750% | | | 578,779 | |
| | | | | | | | |
| | |
| | | | Total Convertible Preferred Stocks | | | | |
| | |
| | | | (Identified Cost $1,446,924) | | | 1,641,211 | |
| | | | | | | | |
See accompanying notes to financial statements.
51 |
Portfolio of Investments – as of September 30, 2020
Loomis Sayles Investment Grade Fixed Income Fund – continued
| | | | | | | | |
Shares | | | Description | | Value (†) | |
| |
| | Non-Convertible Preferred Stocks – 0.1% | | | | |
| | |
| | | | Electric – 0.1% | | | | |
| | 213 | | | Connecticut Light & Power Co. (The), Series 1949, 2.200% | | $ | 11,033 | |
| | 1,860 | | | Union Electric Co., 4.500% | | | 192,510 | |
| | | | | | | | |
| | | | | | | 203,543 | |
| | | | | | | | |
| |
| | | | Total Non-Convertible Preferred Stocks | |
| | |
| | | | (Identified Cost $104,764) | | | 203,543 | |
| | | | | | | | |
| | |
| | | | Total Preferred Stocks | | | | |
| | |
| | | | (Identified Cost $1,551,688) | | | 1,844,754 | |
| | | | | | | | |
| | |
| Principal
Amount (‡) |
| | | | | | |
| |
| | Short-Term Investments – 6.4% | | | | |
| | |
| | 187,477,471 | | | Central Bank of Iceland,
0.000%, (ISK)(f)(i) | | | 1,355,144 | |
| | |
| | 2,474,272 | | | Tri-Party Repurchase Agreement with Fixed Income Clearing Corporation, dated 9/30/2020 at 0.000% to be repurchased at $2,474,272 on 10/01/2020 collateralized by $2,524,000 U.S. Treasury Note, 0.250% due 9/30/2025 valued at $2,523,803 including accrued interest (Note 2 of Notes to Financial Statements) | | | 2,474,272 | |
| | |
| | 10,900,000 | | | U.S. Treasury Bills,
0.106%, 12/10/2020(j) | | | 10,897,987 | |
| | | | | | | | |
| | |
| | | | Total Short-Term Investments | | | | |
| | |
| | | | (Identified Cost $14,897,959) | | | 14,727,403 | |
| | | | | | | | |
| | |
| | | | Total Investments – 99.4% | | | | |
| | |
| | | | (Identified Cost $215,866,041) | | | 227,756,755 | |
| | |
| | | | Other assets less liabilities—0.6% | | | 1,372,399 | |
| | | | | | | | |
| | |
| | | | Net Assets – 100.0% | | $ | 229,129,154 | |
| | | | | | | | |
| |
| | (‡) | | | Principal Amount stated in U.S. dollars unless otherwise noted. | |
| |
| | (†) | | | See Note 2 of Notes to Financial Statements. | |
| |
| | (††) | | | Amount shown represents units. One unit represents a principal amount of 100. | |
| |
| | (a) | | | Fair valued by the Fund’s adviser. At September 30, 2020, the value of these securities amounted to $9,826 or less than 0.1% of net assets. See Note 2 of Notes to Financial Statements. | |
| |
| | (b) | | | Level 3 security. Value has been determined using significant unobservable inputs. See Note 3 of Notes to Financial Statements. | |
| |
| | (c) | | | Variable rate security. The interest rate adjusts periodically based on; (i) changes in current interest rates and/or prepayments on underlying pools of assets, if applicable, (ii) reference to a base lending rate plus or minus a margin, and/or (iii) reference to a base lending rate adjusted by a multiplier and/or subject to certain floors or caps. Rate as of September 30, 2020 is disclosed. | |
| |
| | (d) | | | Illiquid security. (Unaudited) | |
| |
| | (e) | | | Securities classified as fair valued pursuant to the Fund’s pricing policies and procedures. At September 30, 2020, the value of these securities amounted to $7,998,921 or 3.5% of net assets. See Note 2 of Notes to Financial Statements. | |
| |
| | (f) | | | Variable rate security. Rate as of September 30, 2020 is disclosed. |
| |
| | (g) | | | The issuer is in default with respect to interest and/or principal payments. Income is not being accrued. |
| |
| | (h) | | | Non-income producing security. |
| |
| | (i) | | | Security callable by issuer at any time. No specified maturity date. |
| |
| | (j) | | | Interest rate represents discount rate at time of purchase; not a coupon rate. |
| |
| | 144A | | | All or a portion of these securities are exempt from registration under Rule 144A of the Securities Act of 1933. These securities may be resold in transactions exempt from registration, normally to qualified institutional buyers. At September 30, 2020, the value of Rule 144A holdings amounted to $23,478,338 or 10.2% of net assets. |
| |
| | ABS | | | Asset-Backed Securities |
| |
| | ARMs | | | Adjustable Rate Mortgages |
| |
| | EMTN | | | Euro Medium Term Note |
| |
| | FNMA | | | Federal National Mortgage Association |
| |
| | GMTN | | | Global Medium Term Note |
| |
| | LIBOR | | | London Interbank Offered Rate |
| |
| | MTN | | | Medium Term Note |
| |
| | REITs | | | Real Estate Investment Trusts |
| |
| | REMIC | | | Real Estate Mortgage Investment Conduit |
| |
| | BRL | | | Brazilian Real |
| |
| | CAD | | | Canadian Dollar |
| |
| | GBP | | | British Pound |
| |
| | ISK | | | Icelandic Krona |
| |
| | MXN | | | Mexican Peso |
| |
| | NOK | | | Norwegian Krone |
Industry Summary at September 30, 2020
| | | | |
Treasuries | | | 32.1 | % |
Electronic Equipment, Instruments & Components | | | 8.0 | |
Banking | | | 7.0 | |
Wirelines | | | 5.4 | |
Automotive | | | 5.3 | |
Finance Companies | | | 4.1 | |
Midstream | | | 3.2 | |
Life Insurance | | | 2.7 | |
Airlines | | | 2.2 | |
Other Investments, less than 2% each | | | 23.0 | |
Short-Term Investments | | | 6.4 | |
| | | | |
Total Investments | | | 99.4 | |
Other assets less liabilities | | | 0.6 | |
| | | | |
Net Assets | | | 100.0 | % |
| | | | |
Currency Exposure Summary at September 30, 2020
| | | | |
United States Dollar | | | 91.8 | % |
Mexican Peso | | | 5.0 | |
Other, less than 2% each | | | 2.6 | |
| | | | |
Total Investments | | | 99.4 | |
Other assets less liabilities | | | 0.6 | |
| | | | |
Net Assets | | | 100.0 | % |
| | | | |
See accompanying notes to financial statements.
| 52
Statements of Assets and Liabilities
September 30, 2020
| | | | | | | | | | | | |
| | | Fixed Income
Fund | | | Global Bond
Fund | | | Inflation
Protected
Securities Fund | |
ASSETS | |
Investments at cost | | $ | 618,995,738 | | | $ | 664,374,895 | | | $ | 123,610,048 | |
Net unrealized appreciation (depreciation) | | | (8,756,030 | ) | | | 33,671,778 | | | | 4,496,298 | |
| | | | | | | | | | | | |
Investments at value | | | 610,239,708 | | | | 698,046,673 | | | | 128,106,346 | |
Cash | | | 567 | | | | 602,762 | | | | — | |
Due from brokers (Note 2) | | | — | | | | 300,000 | | | | 143,000 | |
Foreign currency at value (identified cost $0, $9,387,324 and $0, respectively) | | | — | | | | 9,343,975 | | | | — | |
Receivable for Fund shares sold | | | — | | | | 1,603,432 | | | | 415,775 | |
Receivable for securities sold | | | 22,437,029 | | | | 2,250,637 | | | | 105,499 | |
Receivable for when-issued/delayed delivery securities sold (Note 2) | | | — | | | | 1,468,885 | | | | — | |
Collateral received for open forward foreign currency and option contracts (Notes 2 and 4) | | | — | | | | 630,000 | | | | — | |
Dividends and interest receivable | | | 7,044,875 | | | | 5,673,905 | | | | 247,830 | |
Unrealized appreciation on forward foreign currency contracts (Note 2) | | | — | | | | 753,935 | | | | — | |
Tax reclaims receivable | | | — | | | | 55,145 | | | | — | |
Receivable for variation margin on futures contracts (Note 2) | | | — | | | | 47,757 | | | | — | |
Prepaid expenses (Note 8) | | | 85 | | | | 86 | | | | 5 | |
| | | | | | | | | | | | |
TOTAL ASSETS | | | 639,722,264 | | | | 720,777,192 | | | | 129,018,455 | |
| | | | | | | | | | | | |
|
| LIABILITIES | |
Options written, at value (premiums received $0, $32,227 and $0, respectively) (Note 2) | | | — | | | | 1,086 | | | | — | |
Payable for securities purchased | | | — | | | | 4,764,860 | | | | 1,106,524 | |
Payable for when-issued/delayed delivery securities purchased (Note 2) | | | — | | | | 2,203,463 | | | | — | |
Payable for Fund shares redeemed | | | 6,011,454 | | | | 319,955 | | | | 68,161 | |
Unrealized depreciation on forward foreign currency contracts (Note 2) | | | — | | | | 295,200 | | | | — | |
Foreign taxes payable (Note 2) | | | — | | | | 36,059 | | | | — | |
Due to brokers (Note 2) | | | — | | | | 630,000 | | | | — | |
Management fees payable (Note 6) | | | 292,875 | | | | 284,949 | | | | 10,949 | |
Deferred Trustees’ fees (Note 6) | | | 257,065 | | | | 368,674 | | | | 122,749 | |
Administrative fees payable (Note 6) | | | 25,675 | | | | 25,474 | | | | 3,711 | |
Payable to distributor (Note 6d) | | | — | | | | 5,677 | | | | 1,036 | |
Other accounts payable and accrued expenses | | | 75,020 | | | | 112,986 | | | | 59,746 | |
| | | | | | | | | | | | |
TOTAL LIABILITIES | | | 6,662,089 | | | | 9,048,383 | | | | 1,372,876 | |
| | | | | | | | | | | | |
NET ASSETS | | $ | 633,060,175 | | | $ | 711,728,809 | | | $ | 127,645,579 | |
| | | | | | | | | | | | |
NET ASSETS CONSIST OF: | |
Paid-in capital | | $ | 618,675,931 | | | $ | 652,527,747 | | | $ | 124,127,323 | |
Accumulated earnings | | | 14,384,244 | | | | 59,201,062 | | | | 3,518,256 | |
| | | | | | | | | | | | |
NET ASSETS | | $ | 633,060,175 | | | $ | 711,728,809 | | | $ | 127,645,579 | |
| | | | | | | | | | | | |
|
| COMPUTATION OF NET ASSET VALUE AND OFFERING PRICE: | |
|
Institutional Class: | |
Net assets | | $ | 633,060,175 | | | $ | 375,500,744 | | | $ | 116,549,443 | |
| | | | | | | | | | | | |
Shares of beneficial interest | | | 48,071,616 | | | | 20,482,468 | | | | 9,892,387 | |
| | | | | | | | | | | | |
Net asset value, offering and redemption price per share | | $ | 13.17 | | | $ | 18.33 | | | $ | 11.78 | |
| | | | | | | | | | | | |
|
Retail Class: | |
Net assets | | $ | — | | | $ | 178,886,948 | | | $ | 7,805,232 | |
| | | | | | | | | | | | |
Shares of beneficial interest | | | — | | | | 9,939,282 | | | | 663,371 | |
| | | | | | | | | | | | |
Net asset value, offering and redemption price per share | | $ | — | | | $ | 18.00 | | | $ | 11.77 | |
| | | | | | | | | | | | |
|
Class N shares: | |
Net assets | | $ | — | | | $ | 157,341,117 | | | $ | 3,290,904 | |
| | | | | | | | | | | | |
Shares of beneficial interest | | | — | | | | 8,557,628 | | | | 279,115 | |
| | | | | | | | | | | | |
Net asset value, offering and redemption price per share | | $ | — | | | $ | 18.39 | | | $ | 11.79 | |
| | | | | | | | | | | | |
See accompanying notes to financial statements.
53 |
Statements of Assets and Liabilities – continued
September 30, 2020
| | | | | | | | |
| | | Institutional
High Income
Fund | | | Investment
Grade Fixed
Income Fund | |
ASSETS | |
Investments at cost | | $ | 539,974,276 | | | $ | 215,866,041 | |
Net unrealized appreciation (depreciation) | | | (28,651,713 | ) | | | 11,890,714 | |
| | | | | | | | |
Investments at value | | | 511,322,563 | | | | 227,756,755 | |
Cash | | | 192,868 | | | | — | |
Foreign currency at value (identified cost $11 and $0, respectively) | | | 11 | | | | — | |
Dividends and interest receivable | | | 5,847,702 | | | | 1,709,729 | |
Prepaid expenses (Note 8) | | | 62 | | | | 32 | |
| | | | | | | | |
TOTAL ASSETS | | | 517,363,206 | | | | 229,466,516 | |
| | | | | | | | |
|
| LIABILITIES | |
Management fees payable (Note 6) | | | 270,021 | | | | 80,047 | |
Deferred Trustees’ fees (Note 6) | | | 189,187 | | | | 180,465 | |
Administrative fees payable (Note 6) | | | 19,729 | | | | 8,773 | |
Payable to distributor (Note 6d) | | | 68 | | | | — | |
Other accounts payable and accrued expenses | | | 68,788 | | | | 68,077 | |
| | | | | | | | |
TOTAL LIABILITIES | | | 547,793 | | | | 337,362 | |
| | | | | | | | |
NET ASSETS | | $ | 516,815,413 | | | $ | 229,129,154 | |
| | | | | | | | |
NET ASSETS CONSIST OF: | |
Paid-in capital | | $ | 554,938,130 | | | $ | 216,288,593 | |
Accumulated earnings (loss) | | | (38,122,717 | ) | | | 12,840,561 | |
| | | | | | | | |
NET ASSETS | | $ | 516,815,413 | | | $ | 229,129,154 | |
| | | | | | | | |
|
| COMPUTATION OF NET ASSET VALUE AND OFFERING PRICE: | |
|
Institutional Class: | |
Net assets | | $ | 516,815,413 | | | $ | 229,129,154 | |
| | | | | | | | |
Shares of beneficial interest | | | 86,235,079 | | | | 18,366,373 | |
| | | | | | | | |
Net asset value, offering and redemption price per share | | $ | 5.99 | | | $ | 12.48 | |
| | | | | | | | |
See accompanying notes to financial statements.
| 54
Statements of Operations
For the Year Ended September 30, 2020
| | | | | | | | | | | | |
| | | Fixed Income Fund | | | Global Bond Fund | | | Inflation
Protected
Securities Fund | |
INVESTMENT INCOME | |
Interest | | $ | 30,891,461 | | | $ | 18,419,417 | | | $ | 737,135 | |
Dividends | | | 3,577,898 | | | | — | | | | — | |
Less net foreign taxes withheld | | | (10,668 | ) | | | (127,943 | ) | | | — | |
| | | | | | | | | | | | |
| | | 34,458,691 | | | | 18,291,474 | | | | 737,135 | |
| | | | | | | | | | | | |
Expenses | |
Management fees (Note 6) | | | 3,585,115 | | | | 3,882,400 | | | | 131,076 | |
Service and distribution fees (Note 6) | | | — | | | | 470,965 | | | | 8,984 | |
Administrative fees (Note 6) | | | 316,698 | | | | 311,890 | | | | 23,181 | |
Trustees’ fees and expenses (Note 6) | | | 72,580 | | | | 85,690 | | | | 33,005 | |
Transfer agent fees and expenses (Notes 6 and 7) | | | 3,379 | | | | 510,090 | | | | 39,639 | |
Audit and tax services fees | | | 56,784 | | | | 54,535 | | | | 45,672 | |
Custodian fees and expenses | | | 33,333 | | | | 119,628 | | | | 7,457 | |
Legal fees (Note 8) | | | 16,706 | | | | 16,752 | | | | 1,403 | |
Registration fees | | | 24,638 | | | | 73,343 | | | | 53,222 | |
Shareholder reporting expenses | | | 2,855 | | | | 57,866 | | | | 6,842 | |
Miscellaneous expenses (Note 8) | | | 42,798 | | | | 68,814 | | | | 25,882 | |
| | | | | | | | | | | | |
Total expenses | | | 4,154,886 | | | | 5,651,973 | | | | 376,363 | |
Less waiver and/or expense reimbursement (Note 6) | | | — | | | | (369,601 | ) | | | (158,821 | ) |
| | | | | | | | | | | | |
Net expenses | | | 4,154,886 | | | | 5,282,372 | | | | 217,542 | |
| | | | | | | | | | | | |
Net investment income | | | 30,303,805 | | | | 13,009,102 | | | | 519,593 | |
| | | | | | | | | | | | |
| | | |
| NET REALIZED AND UNREALIZED GAIN (LOSS) ON INVESTMENTS, FUTURES CONTRACTS, OPTIONS WRITTEN, FORWARD FOREIGN CURRENCY CONTRACTS AND FOREIGN CURRENCY TRANSACTIONS | | | | | | | | | | | | |
Net realized gain (loss) on: | |
Investments | | | 10,682,024 | | | | 16,205,634 | | | | 1,544,807 | |
Futures contracts | | | — | | | | 4,321,383 | | | | 18,674 | |
Forward foreign currency contracts (Note 2d) | | | — | | | | 4,107,724 | | | | — | |
Foreign currency transactions (Note 2c) | | | (74,942 | ) | | | 45,447 | | | | — | |
Net change in unrealized appreciation (depreciation) on: | |
Investments | | | (26,106,565 | ) | | | 14,520,465 | | | | 3,879,568 | |
Futures contracts | | | — | | | | (501,086 | ) | | | — | |
Options written | | | — | | | | 31,141 | | | | — | |
Forward foreign currency contracts (Note 2d) | | | — | | | | 492,206 | | | | — | |
Foreign currency translations (Note 2c) | | | 24,399 | | | | 616,063 | | | | — | |
| | | | | | | | | | | | |
Net realized and unrealized gain (loss) on investments, futures contracts, options written, forward foreign currency contracts and foreign currency transactions | | | (15,475,084 | ) | | | 39,838,977 | | | | 5,443,049 | |
| | | | | | | | | | | | |
| | | |
| NET INCREASE IN NET ASSETS RESULTING FROM OPERATIONS | | $ | 14,828,721 | | | $ | 52,848,079 | | | $ | 5,962,642 | |
| | | | | | | | | | | | |
See accompanying notes to financial statements.
55 |
Statements of Operations – continued
For the Year Ended September 30, 2020
| | | | | | | | |
| | | Institutional
High Income Fund | | | Investment Grade Fixed Income Fund | |
INVESTMENT INCOME | |
Interest | | $ | 26,275,630 | | | $ | 7,994,472 | |
Dividends | | | 3,213,236 | | | | 812,252 | |
Less net foreign taxes withheld | | | (5,136 | ) | | | (2,017 | ) |
| | | | | | | | |
| | | 29,483,730 | | | | 8,804,707 | |
| | | | | | | | |
Expenses | |
Management fees (Note 6) | | | 3,201,401 | | | | 1,020,718 | |
Administrative fees (Note 6) | | | 235,670 | | | | 112,717 | |
Trustees’ fees and expenses (Note 6) | | | 58,156 | | | | 47,003 | |
Transfer agent fees and expenses (Notes 6 and 7) | | | 10,376 | | | | 2,207 | |
Audit and tax services fees | | | 52,400 | | | | 56,274 | |
Custodian fees and expenses | | | 22,107 | | | | 16,520 | |
Legal fees (Note 8) | | | 12,891 | | | | 6,497 | |
Registration fees | | | 25,445 | | | | 24,104 | |
Shareholder reporting expenses | | | 3,739 | | | | 2,260 | |
Miscellaneous expenses (Note 8) | | | 40,998 | | | | 30,851 | |
| | | | | | | | |
Total expenses | | | 3,663,183 | | | | 1,319,151 | |
| | | | | | | | |
Net investment income | | | 25,820,547 | | | | 7,485,556 | |
| | | | | | | | |
| | |
| NET REALIZED AND UNREALIZED GAIN (LOSS) ON INVESTMENTS AND FOREIGN CURRENCY TRANSACTIONS | | | | | | | | |
Net realized gain (loss) on: | |
Investments | | | (19,083,602 | ) | | | 1,645,902 | |
Foreign currency transactions (Note 2c) | | | (13,078 | ) | | | (38,480 | ) |
Net change in unrealized appreciation (depreciation) on: | |
Investments | | | (10,299,650 | ) | | | (245,035 | ) |
Foreign currency translations (Note 2c) | | | 7,683 | | | | 11,051 | |
| | | | | | | | |
Net realized and unrealized gain (loss) on investments and foreign currency transactions | | | (29,388,647 | ) | | | 1,373,438 | |
| | | | | | | | |
| | |
| NET INCREASE (DECREASE) IN NET ASSETS RESULTING FROM OPERATIONS | | $ | (3,568,100 | ) | | $ | 8,858,994 | |
| | | | | | | | |
See accompanying notes to financial statements.
| 56
Statements of Changes in Net Assets
| | | | | | | | | | | | | | | | |
| | | Fixed Income Fund | | | Global Bond Fund | |
| | | Year Ended
September 30, 2020 | | | Year Ended
September 30, 2019 | | | Year Ended
September 30, 2020 | | | Year Ended
September 30, 2019 | |
| FROM OPERATIONS: | |
Net investment income | | $ | 30,303,805 | | | $ | 36,670,498 | | | $ | 13,009,102 | | | $ | 16,719,532 | |
Net realized gain (loss) on investments, futures contracts, forward foreign currency contracts and foreign currency transactions | | | 10,607,082 | | | | (4,605,490 | ) | | | 24,680,188 | | | | (13,485,266 | ) |
Net change in unrealized appreciation (depreciation) on investments, futures contracts, options written, forward foreign currency contracts and foreign currency translations | | | (26,082,166 | ) | | | 16,408,827 | | | | 15,158,789 | | | | 47,488,486 | |
| | | | | | | | | | | | | | | | |
Net increase in net assets resulting from operations | | | 14,828,721 | | | | 48,473,835 | | | | 52,848,079 | | | | 50,722,752 | |
| | | | | | | | | | | | | | | | |
| FROM DISTRIBUTIONS TO SHAREHOLDERS: | |
Institutional Class | | | (30,736,093 | ) | | | (44,056,634 | ) | | | (3,765,595 | ) | | | (2,580,426 | ) |
Retail Class | | | — | | | | — | | | | (1,676,149 | ) | | | (840,780 | ) |
Class N | | | — | | | | — | | | | (2,148,456 | ) | | | (1,931,839 | ) |
| | | | | | | | | | | | | | | | |
Total distributions | | | (30,736,093 | ) | | | (44,056,634 | ) | | | (7,590,200 | ) | | | (5,353,045 | ) |
| | | | | | | | | | | | | | | | |
| | | | |
| NET DECREASE IN NET ASSETS FROM CAPITAL SHARE TRANSACTIONS (NOTE 11) | | | (127,844,177 | ) | | | (90,364,289 | ) | | | (141,045,611 | ) | | | (212,037,849 | ) |
| | | | | | | | | | | | | | | | |
Net decrease in net assets | | | (143,751,549 | ) | | | (85,947,088 | ) | | | (95,787,732 | ) | | | (166,668,142 | ) |
| NET ASSETS | |
Beginning of the year | | | 776,811,724 | | | | 862,758,812 | | | | 807,516,541 | | | | 974,184,683 | |
| | | | | | | | | | | | | | | | |
End of the year | | $ | 633,060,175 | | | $ | 776,811,724 | | | $ | 711,728,809 | | | $ | 807,516,541 | |
| | | | | | | | | | | | | | | | |
See accompanying notes to financial statements.
57 |
Statements of Changes in Net Assets – continued
| | | | | | | | | | | | | | | | |
| | | Inflation Protected Securities Fund | | | Institutional High Income Fund | |
| | | Year Ended
September 30, 2020 | | | Year Ended
September 30, 2019 | | | Year Ended
September 30, 2020 | | | Year Ended
September 30, 2019 | |
| FROM OPERATIONS: | |
Net investment income | | $ | 519,593 | | | $ | 534,332 | | | $ | 25,820,547 | | | $ | 34,889,194 | |
Net realized gain (loss) on investments, futures contracts and foreign currency transactions | | | 1,563,481 | | | | (261,604 | ) | | | (19,096,680 | ) | | | 3,860,840 | |
Net change in unrealized appreciation (depreciation) on investments and foreign currency translations | | | 3,879,568 | | | | 1,491,492 | | | | (10,291,967 | ) | | | (36,794,413 | ) |
| | | | | | | | | | | | | | | | |
Net increase (decrease) in net assets resulting from operations | | | 5,962,642 | | | | 1,764,220 | | | | (3,568,100 | ) | | | 1,955,621 | |
| | | | | | | | | | | | | | | | |
| FROM DISTRIBUTIONS TO SHAREHOLDERS: | |
Institutional Class | | | (524,380 | ) | | | (509,430 | ) | | | (35,578,052 | ) | | | (46,893,344 | ) |
Retail Class | | | (39,438 | ) | | | (17,313 | ) | | | — | | | | — | |
Class N | | | (23,179 | ) | | | (35,387 | ) | | | — | | | | — | |
| | | | | | | | | | | | | | | | |
Total distributions | | | (586,997 | ) | | | (562,130 | ) | | | (35,578,052 | ) | | | (46,893,344 | ) |
| | | | | | | | | | | | | | | | |
| | | | |
| NET INCREASE (DECREASE) IN NET ASSETS FROM CAPITAL SHARE TRANSACTIONS (NOTE 11) | | | 95,339,671 | | | | (2,856,864 | ) | | | (16,431,121 | ) | | | (55,444,608 | ) |
| | | | | | | | | | | | | | | | |
Net increase (decrease) in net assets | | | 100,715,316 | | | | (1,654,774 | ) | | | (55,577,273 | ) | | | (100,382,331 | ) |
| NET ASSETS | |
Beginning of the year | | | 26,930,263 | | | | 28,585,037 | | | | 572,392,686 | | | | 672,775,017 | |
| | | | | | | | | | | | | | | | |
End of the year | | $ | 127,645,579 | | | $ | 26,930,263 | | | $ | 516,815,413 | | | $ | 572,392,686 | |
| | | | | | | | | | | | | | | | |
See accompanying notes to financial statements.
| 58
Statements of Changes in Net Assets – continued
| | | | | | | | |
| | | Investment Grade Fixed Income Fund | |
| | | Year Ended
September 30, 2020 | | | Year Ended
September 30, 2019 | |
| FROM OPERATIONS: | |
Net investment income | | $ | 7,485,556 | | | $ | 9,010,579 | |
Net realized gain (loss) on investments and foreign currency transactions | | | 1,607,422 | | | | (2,404,099 | ) |
Net change in unrealized appreciation (depreciation) on investments and foreign currency translations | | | (233,984 | ) | | | 5,430,056 | |
| | | | | | | | |
Net increase in net assets resulting from operations | | | 8,858,994 | | | | 12,036,536 | |
| | | | | | | | |
| FROM DISTRIBUTIONS TO SHAREHOLDERS: | | | | | | | | |
Institutional Class | | | (7,664,904 | ) | | | (9,558,974 | ) |
| | | | | | | | |
| | |
| NET INCREASE (DECREASE) IN NET ASSETS FROM CAPITAL SHARE TRANSACTIONS (NOTE 11) | | | (61,121,051 | ) | | | 13,853,887 | |
| | | | | | | | |
Net increase (decrease) in net assets | | | (59,926,961 | ) | | | 16,331,449 | |
| NET ASSETS | | | | | | | | |
Beginning of the year | | | 289,056,115 | | | | 272,724,666 | |
| | | | | | | | |
End of the year | | $ | 229,129,154 | | | $ | 289,056,115 | |
| | | | | | | | |
See accompanying notes to financial statements.
59 |
Financial Highlights
For a share outstanding throughout each period.
| | | | | | | | | | | | | | | | | | | | |
| | | Fixed Income Fund – Institutional Class | |
| | | Year Ended
September 30,
2020
| | | Year Ended
September 30,
2019
| | | Year Ended
September 30,
2018
| | | Year Ended
September 30,
2017
| | | Year Ended
September 30,
2016
| |
Net asset value, beginning of the period | | $ | 13.49 | | | $ | 13.40 | | | $ | 13.96 | | | $ | 13.52 | | | $ | 13.16 | |
| | | | |
INCOME (LOSS) FROM INVESTMENT OPERATIONS: | | | | | | | | | | | | | | | | | | | | |
Net investment income(a) | | | 0.55 | | | | 0.59 | | | | 0.54 | | | | 0.57 | | | | 0.58 | |
Net realized and unrealized gain (loss) | | | (0.31 | ) | | | 0.19 | | | | (0.35 | ) | | | 0.34 | | | | 0.61 | |
| | | | |
Total from Investment Operations | | | 0.24 | | | | 0.78 | | | | 0.19 | | | | 0.91 | | | | 1.19 | |
| | | | |
LESS DISTRIBUTIONS FROM: | | | | | | | | | | | | | | | | | | | | |
Net investment income | | | (0.56 | ) | | | (0.59 | ) | | | (0.52 | ) | | | (0.46 | ) | | | (0.61 | ) |
Net realized capital gains | | | — | | | | (0.10 | ) | | | (0.23 | ) | | | (0.01 | ) | | | (0.22 | ) |
| | | | |
Total Distributions | | | (0.56 | ) | | | (0.69 | ) | | | (0.75 | ) | | | (0.47 | ) | | | (0.83 | ) |
| | | | |
Net asset value, end of the period | | $ | 13.17 | | | $ | 13.49 | | | $ | 13.40 | | | $ | 13.96 | | | $ | 13.52 | |
| | | | |
Total return | | | 1.78 | % | | | 6.29 | % | | | 1.39 | % | | | 6.96 | % | | | 9.72 | % |
RATIOS TO AVERAGE NET ASSETS: | | | | | | | | | | | | | | | | | | | | |
Net assets, end of the period (000’s) | | $ | 633,060 | | | $ | 776,812 | | | $ | 862,759 | | | $ | 1,093,422 | | | $ | 1,201,509 | |
Net expenses | | | 0.58 | % | | | 0.57 | % | | | 0.57 | % | | | 0.57 | % | | | 0.57 | % |
Gross expenses | | | 0.58 | % | | | 0.57 | % | | | 0.57 | % | | | 0.57 | % | | | 0.57 | % |
Net investment income | | | 4.23 | % | | | 4.51 | % | | | 3.99 | % | | | 4.22 | % | | | 4.48 | % |
Portfolio turnover rate | | | 29 | % | | | 14 | % | | | 11 | % | | | 10 | % | | | 14 | % |
| (a) | | Per share net investment income has been calculated using the average shares outstanding during the period. | |
| | | | | | | | | | | | | | | | | | | | |
| | | Global Bond Fund – Institutional Class | |
| | | Year Ended
September 30,
2020
| | | Year Ended
September 30,
2019
| | | Year Ended
September 30,
2018
| | | Year Ended
September 30,
2017
| | | Year Ended
September 30,
2016
| |
Net asset value, beginning of the period | | $ | 17.07 | | | $ | 16.16 | | | $ | 16.51 | | | $ | 16.47 | | | $ | 15.00 | |
| | | | |
INCOME (LOSS) FROM INVESTMENT OPERATIONS: | | | | | | | | | | | | | | | | | | | | |
Net investment
income(a) | | | 0.33 | | | | 0.33 | | | | 0.35 | | | | 0.30 | | | | 0.33 | |
Net realized and unrealized gain (loss) | | | 1.12 | | | | 0.69 | | | | (0.66 | ) | | | (0.18 | ) | | | 1.14 | |
| | | | |
Total from Investment Operations | | | 1.45 | | | | 1.02 | | | | (0.31 | ) | | | 0.12 | | | | 1.47 | |
| | | | |
LESS DISTRIBUTIONS FROM: | | | | | | | | | | | | | | | | | | | | |
Net investment income | | | (0.08 | ) | | | (0.05 | ) | | | — | | | | (0.06 | ) | | | — | |
Net realized capital gains | | | (0.11 | ) | | | (0.06 | ) | | | (0.04 | ) | | | (0.02 | ) | | | — | |
| | | | |
Total Distributions | | | (0.19 | ) | | | (0.11 | ) | | | (0.04 | ) | | | (0.08 | ) | | | — | |
| | | | |
Net asset value, end of the period | | $ | 18.33 | | | $ | 17.07 | | | $ | 16.16 | | | $ | 16.51 | | | $ | 16.47 | |
| | | | |
Total return(b) | | | 8.57 | % | | | 6.27 | % | | | (1.85 | )% | | | 0.74 | % | | | 9.80 | % |
RATIOS TO AVERAGE NET ASSETS: | | | | | | | | | | | | | | | | | | | | |
Net assets, end of the period (000’s) | | $ | 375,501 | | | $ | 353,872 | | | $ | 450,376 | | | $ | 509,080 | | | $ | 822,993 | |
Net expenses(c) | | | 0.69 | % | | | 0.70 | %(d) | | | 0.72 | %(e) | | | 0.75 | %(f) | | | 0.75 | % |
Gross expenses | | | 0.76 | % | | | 0.76 | %(d) | | | 0.77 | % | | | 0.80 | % | | | 0.83 | % |
Net investment income | | | 1.90 | % | | | 2.00 | % | | | 2.10 | % | | | 1.88 | % | | | 2.13 | % |
Portfolio turnover rate | | | 273 | %(g) | | | 215 | %(g) | | | 218 | %(g) | | | 163 | % | | | 120 | % |
| (a) | | Per share net investment income has been calculated using the average shares outstanding during the period. | |
| (b) | | Had certain expenses not been waived/reimbursed during the period, total returns would have been lower. | |
| (c) | | The investment adviser agreed to waive its fees and/or reimburse a portion of the Fund’s expenses during the period. Without this waiver/reimbursement, expenses would have been higher. | |
| (d) | | Includes interest expense. Without this expense the ratio of net expenses would have been 0.69% and the ratio of gross expenses would have been 0.75%. | |
| (e) | | Effective July 1, 2018, the expense limit decreased to 0.69%. | |
| (f) | | Effective July 1, 2017, the expense limit decreased to 0.72%. | |
| (g) | | The variation in the Fund’s turnover rate from 2017 to 2018 was primarily due to a repositioning of the portfolio. During 2019 and 2020, turnover has remained high due to an increase in the volume of U.S. Treasury securities related to certain trading strategies and, additionally for 2020, a repositioning of the portfolio. | |
See accompanying notes to financial statements.
| 60
Financial Highlights – continued
For a share outstanding throughout each period.
| | | | | | | | | | | | | | | | | | | | |
| | | Global Bond Fund – Retail Class | |
| | | Year Ended
September 30,
2020
| | | Year Ended
September 30,
2019
| | | Year Ended
September 30,
2018
| | | Year Ended
September 30,
2017
| | | Year Ended
September 30,
2016
| |
Net asset value, beginning of the period | | $ | 16.76 | | | $ | 15.86 | | | $ | 16.24 | | | $ | 16.23 | | | $ | 14.82 | |
| | | | |
INCOME (LOSS) FROM INVESTMENT OPERATIONS: | | | | | | | | | | | | | | | | | | | | |
Net investment
income(a) | | | 0.28 | | | | 0.28 | | | | 0.30 | | | | 0.26 | | | | 0.29 | |
Net realized and unrealized gain (loss) | | | 1.10 | | | | 0.68 | | | | (0.64 | ) | | | (0.19 | ) | | | 1.12 | |
| | | | |
Total from Investment Operations | | | 1.38 | | | | 0.96 | | | | (0.34 | ) | | | 0.07 | | | | 1.41 | |
| | | | |
LESS DISTRIBUTIONS FROM: | | | | | | | | | | | | | | | | | | | | |
Net investment income | | | (0.03 | ) | | | (0.00 | )(b) | | | — | | | | (0.04 | ) | | | — | |
Net realized capital gains | | | (0.11 | ) | | | (0.06 | ) | | | (0.04 | ) | | | (0.02 | ) | | | — | |
| | | | |
Total Distributions | | | (0.14 | ) | | | (0.06 | ) | | | (0.04 | ) | | | (0.06 | ) | | | — | |
| | | | |
Net asset value, end of the period | | $ | 18.00 | | | $ | 16.76 | | | $ | 15.86 | | | $ | 16.24 | | | $ | 16.23 | |
| | | | |
Total return(c) | | | 8.32 | % | | | 6.08 | % | | | (2.12 | )% | | | 0.48 | % | | | 9.51 | % |
RATIOS TO AVERAGE NET ASSETS: | | | | | | | | | | | | | | | | | | | | |
Net assets, end of the period (000’s) | | $ | 178,887 | | | $ | 207,251 | | | $ | 247,119 | | | $ | 288,479 | | | $ | 350,915 | |
Net expenses(d) | | | 0.94 | % | | | 0.95 | %(e) | | | 0.97 | %(f) | | | 1.00 | %(g) | | | 1.00 | % |
Gross expenses | | | 1.01 | % | | | 1.01 | %(e) | | | 1.02 | % | | | 1.05 | % | | | 1.08 | % |
Net investment income | | | 1.65 | % | | | 1.75 | % | | | 1.85 | % | | | 1.67 | % | | | 1.87 | % |
Portfolio turnover rate | | | 273 | %(h) | | | 215 | %(h) | | | 218 | %(h) | | | 163 | % | | | 120 | % |
| (a) | | Per share net investment income has been calculated using the average shares outstanding during the period. | |
| (b) | | Amount rounds to less than $0.01 per share. | |
| (c) | | Had certain expenses not been waived/reimbursed during the period, total returns would have been lower. | |
| (d) | | The investment adviser agreed to waive its fees and/or reimburse a portion of the Fund’s expenses during the period. Without this waiver/reimbursement, expenses would have been higher. | |
| (e) | | Includes interest expense. Without this expense the ratio of net expenses would have been 0.94% and the ratio of gross expenses would have been 1.00%. | |
| (f) | | Effective July 1, 2018, the expense limit decreased to 0.94%. | |
| (g) | | Effective July 1, 2017, the expense limit decreased to 0.97%. | |
| (h) | | The variation in the Fund’s turnover rate from 2017 to 2018 was primarily due to a repositioning of the portfolio. During 2019 and 2020, turnover has remained high due to an increase in the volume of U.S. Treasury securities related to certain trading strategies and, additionally for 2020, a repositioning of the portfolio. | |
See accompanying notes to financial statements.
61 |
Financial Highlights – continued
For a share outstanding throughout each period.
| | | | | | | | | | | | | | | | | | | | |
| | | Global Bond Fund – Class N | |
| | | Year Ended
September 30,
2020
| | | Year Ended
September 30,
2019
| | | Year Ended
September 30,
2018
| | | Year Ended
September 30,
2017
| | | Year Ended
September 30,
2016
| |
Net asset value, beginning of the period | | $ | 17.12 | | | $ | 16.21 | | | $ | 16.55 | | | $ | 16.50 | | | $ | 15.01 | |
| | | | |
INCOME (LOSS) FROM INVESTMENT OPERATIONS: | | | | | | | | | | | | | | | | | | | | |
Net investment
income(a) | | | 0.33 | | | | 0.34 | | | | 0.36 | | | | 0.33 | | | | 0.34 | |
Net realized and unrealized gain (loss) | | | 1.14 | | | | 0.69 | | | | (0.66 | ) | | | (0.20 | ) | | | 1.15 | |
| | | | |
Total from Investment Operations | | | 1.47 | | | | 1.03 | | | | (0.30 | ) | | | 0.13 | | | | 1.49 | |
| | | | |
LESS DISTRIBUTIONS FROM: | | | | | | | | | | | | | | | | | | | | |
Net investment income | | | (0.09 | ) | | | (0.06 | ) | | | — | | | | (0.06 | ) | | | — | |
Net realized capital gains | | | (0.11 | ) | | | (0.06 | ) | | | (0.04 | ) | | | (0.02 | ) | | | — | |
| | | | |
Total Distributions | | | (0.20 | ) | | | (0.12 | ) | | | (0.04 | ) | | | (0.08 | ) | | | — | |
| | | | |
Net asset value, end of the period | | $ | 18.39 | | | $ | 17.12 | | | $ | 16.21 | | | $ | 16.55 | | | $ | 16.50 | |
| | | | |
Total return | | | 8.66 | %(b) | | | 6.31 | %(b) | | | (1.78 | )%(b) | | | 0.81 | % | | | 9.93 | % |
RATIOS TO AVERAGE NET ASSETS: | | | | | | | | | | | | | | | | | | | | |
Net assets, end of the period (000’s) | | $ | 157,341 | | | $ | 246,394 | | | $ | 276,690 | | | $ | 256,939 | | | $ | 47,895 | |
Net expenses | | | 0.64 | %(c) | | | 0.65 | %(c)(d) | | | 0.67 | %(c)(e) | | | 0.69 | %(f) | | | 0.66 | % |
Gross expenses | | | 0.66 | % | | | 0.66 | %(d) | | | 0.68 | % | | | 0.69 | % | | | 0.66 | % |
Net investment income | | | 1.93 | % | | | 2.06 | % | | | 2.15 | % | | | 2.09 | % | | | 2.19 | % |
Portfolio turnover rate | | | 273 | %(g) | | | 215 | %(g) | | | 218 | %(g) | | | 163 | % | | | 120 | % |
| (a) | | Per share net investment income has been calculated using the average shares outstanding during the period. | |
| (b) | | Had certain expenses not been waived/reimbursed during the period, total returns would have been lower. | |
| (c) | | The investment adviser agreed to waive its fees and/or reimburse a portion of the Fund’s expenses during the period. Without this waiver/reimbursement, expenses would have been higher. | |
| (d) | | Includes interest expense. Without this expense the ratio of net expenses would have been 0.64% and the ratio of gross expenses would have been 0.65%. | |
| (e) | | Effective July 1, 2018, the expense limit decreased to 0.64%. | |
| (f) | | Effective July 1, 2017, the expense limit decreased to 0.67%. | |
| (g) | | The variation in the Fund’s turnover rate from 2017 to 2018 was primarily due to a repositioning of the portfolio. During 2019 and 2020, turnover has remained high due to an increase in the volume of U.S. Treasury securities related to certain trading strategies and, additionally for 2020, a repositioning of the portfolio. | |
See accompanying notes to financial statements.
| 62
Financial Highlights – continued
For a share outstanding throughout each period.
| | | | | | | | | | | | | | | | | | | | |
| | | Inflation Protected Securities Fund – Institutional Class | |
| | | Year Ended
September 30,
2020
| | | Year Ended
September 30,
2019
| | | Year Ended
September 30,
2018
| | | Year Ended
September 30,
2017
| | | Year Ended
September 30,
2016
| |
Net asset value, beginning of the period | | $ | 10.59 | | | $ | 10.13 | | | $ | 10.41 | | | $ | 10.64 | | | $ | 10.17 | |
| | | | |
INCOME (LOSS) FROM INVESTMENT OPERATIONS: | | | | | | | | | | | | | | | | | | | | |
Net investment income(a) | | | 0.11 | | | | 0.20 | | | | 0.30 | | | | 0.18 | | | | 0.12 | |
Net realized and unrealized gain (loss) | | | 1.18 | | | | 0.48 | | | | (0.25 | ) | | | (0.22 | ) | | | 0.49 | |
| | | | |
Total from Investment Operations | | | 1.29 | | | | 0.68 | | | | 0.05 | | | | (0.04 | ) | | | 0.61 | |
| | | | |
LESS DISTRIBUTIONS FROM: | | | | | | | | | | | | | | | | | | | | |
Net investment income | | | (0.10 | ) | | | (0.22 | ) | | | (0.33 | ) | | | (0.19 | ) | | | (0.13 | ) |
Paid-in capital | | | — | | | | — | | | | — | | | | — | | | | (0.01 | ) |
| | | | |
Total Distributions | | | (0.10 | ) | | | (0.22 | ) | | | (0.33 | ) | | | (0.19 | ) | | | (0.14 | ) |
| | | | |
Net asset value, end of the period | | $ | 11.78 | | | $ | 10.59 | | | $ | 10.13 | | | $ | 10.41 | | | $ | 10.64 | |
| | | | |
Total return(b) | | | 12.20 | % | | | 6.73 | % | | | 0.49 | % | | | (0.33 | )% | | | 6.00 | % |
RATIOS TO AVERAGE NET ASSETS: | | | | | | | | | | | | | | | | | | | | |
Net assets, end of the period (000’s) | | $ | 116,549 | | | $ | 24,076 | | | $ | 25,914 | | | $ | 26,972 | | | $ | 29,655 | |
Net expenses(c) | | | 0.40 | % | | | 0.40 | % | | | 0.40 | % | | | 0.40 | % | | | 0.40 | % |
Gross expenses | | | 0.70 | % | | | 0.96 | % | | | 0.94 | % | | | 0.81 | % | | | 0.86 | % |
Net investment income | | | 1.00 | % | | | 1.92 | % | | | 2.90 | % | | | 1.73 | % | | | 1.16 | % |
Portfolio turnover rate | | | 82 | % | | | 246 | % | | | 324 | %(d) | | | 354 | %(d) | | | 61 | % |
| (a) | | Per share net investment income has been calculated using the average shares outstanding during the period. | |
| (b) | | Had certain expenses not been waived/reimbursed during the period, total returns would have been lower. | |
| (c) | | The investment adviser agreed to waive its fees and/or reimburse a portion of the Fund’s expenses during the period. Without this waiver/reimbursement, expenses would have been higher. | |
| (d) | | The variation in the Fund’s turnover rate from 2016 to 2017 was primarily due to significant shareholder flows. During 2018, turnover has remained high due to certain trading strategies. | |
See accompanying notes to financial statements.
63 |
Financial Highlights – continued
For a share outstanding throughout each period.
| | | | | | | | | | | | | | | | | | | | |
| | | Inflation Protected Securities Fund – Retail Class | |
| | | Year Ended
September 30,
2020 | | | Year Ended
September 30,
2019 | | | Year Ended
September 30,
2018 | | | Year Ended
September 30,
2017 | | | Year Ended
September 30,
2016 | |
Net asset value, beginning of the period | | $ | 10.57 | | | $ | 10.11 | | | $ | 10.39 | | | $ | 10.62 | | | $ | 10.14 | |
| | | | |
INCOME (LOSS) FROM INVESTMENT OPERATIONS: | | | | | | | | | | | | | | | | | | | | |
Net investment income (loss)(a) | | | 0.10 | | | | 0.18 | | | | 0.28 | | | | 0.14 | | | | (0.05 | ) |
Net realized and unrealized gain (loss) | | | 1.17 | | | | 0.47 | | | | (0.26 | ) | | | (0.20 | ) | | | 0.60 | |
| | | | |
Total from Investment Operations | | | 1.27 | | | | 0.65 | | | | 0.02 | | | | (0.06 | ) | | | 0.55 | |
| | | | |
LESS DISTRIBUTIONS FROM: | | | | | | | | | | | | | | | | | | | | |
Net investment income | | | (0.07 | ) | | | (0.19 | ) | | | (0.30 | ) | | | (0.17 | ) | | | (0.07 | ) |
Paid-in capital | | | — | | | | — | | | | — | | | | — | | | | (0.00 | )(b) |
| | | | |
Total Distributions | | | (0.07 | ) | | | (0.19 | ) | | | (0.30 | ) | | | (0.17 | ) | | | (0.07 | ) |
| | | | |
Net asset value, end of the period | | $ | 11.77 | | | $ | 10.57 | | | $ | 10.11 | | | $ | 10.39 | | | $ | 10.62 | |
| | | | |
Total return(c) | | | 12.09 | % | | | 6.47 | % | | | 0.23 | % | | | (0.59 | )% | | | 5.47 | % |
RATIOS TO AVERAGE NET ASSETS: | | | | | | | | | | | | | | | | | | | | |
Net assets, end of the period (000’s) | | $ | 7,805 | | | $ | 1,076 | | | $ | 967 | | | $ | 1,144 | | | $ | 1,522 | |
Net expenses(d) | | | 0.65 | % | | | 0.65 | % | | | 0.65 | % | | | 0.65 | % | | | 0.65 | % |
Gross expenses | | | 0.95 | % | | | 1.21 | % | | | 1.19 | % | | | 1.06 | % | | | 1.07 | % |
Net investment income (loss) | | | 0.91 | % | | | 1.77 | % | | | 2.69 | % | | | 1.37 | % | | | (0.47 | )% |
Portfolio turnover rate | | | 82 | % | | | 246 | % | | | 324 | %(e) | | | 354 | %(e) | | | 61 | % |
| (a) | | Per share net investment income (loss) has been calculated using the average shares outstanding during the period. | |
| (b) | | Amount rounds to less than $0.01 per share. | |
| (c) | | Had certain expenses not been waived/reimbursed during the period, total returns would have been lower. | |
| (d) | | The investment adviser agreed to waive its fees and/or reimburse a portion of the Fund’s expenses during the period. Without this waiver/reimbursement, expenses would have been higher. | |
| (e) | | The variation in the Fund’s turnover rate from 2016 to 2017 was primarily due to significant shareholder flows. During 2018, turnover has remained high due to certain trading strategies. | |
| | | | | | | | | | | | | | | | |
| | | Inflation Protected Securities Fund – Class N | |
| | | Year Ended
September 30,
2020 | | | Year Ended
September 30,
2019 | | | Year Ended
September 30,
2018 | | | Period Ended
September 30,
2017* | |
Net asset value, beginning of the period | | $ | 10.59 | | | $ | 10.13 | | | $ | 10.41 | | | $ | 10.43 | |
| | | | |
INCOME (LOSS) FROM INVESTMENT OPERATIONS: | | | | | | | | | | | | | | | | |
Net investment income(a) | | | 0.10 | | | | 0.21 | | | | 0.32 | | | | 0.15 | |
Net realized and unrealized gain (loss) | | | 1.20 | | | | 0.47 | | | | (0.26 | ) | | | (0.01 | ) |
| | | | |
Total from Investment Operations | | | 1.30 | | | | 0.68 | | | | 0.06 | | | | 0.14 | |
| | | | |
LESS DISTRIBUTIONS FROM: | | | | | | | | | | | | | | | | |
Net investment income | | | (0.10 | ) | | | (0.22 | ) | | | (0.34 | ) | | | (0.16 | ) |
| | | | |
Net asset value, end of the period | | $ | 11.79 | | | $ | 10.59 | | | $ | 10.13 | | | $ | 10.41 | |
| | | | |
Total return(b) | | | 12.33 | % | | | 6.78 | % | | | 0.53 | % | | | 1.40 | %(c) |
RATIOS TO AVERAGE NET ASSETS: | | | | | | | | | | | | | | | | |
Net assets, end of the period (000’s) | | $ | 3,291 | | | $ | 1,779 | | | $ | 1,704 | | | $ | 1,339 | |
Net expenses(d) | | | 0.35 | % | | | 0.35 | % | | | 0.35 | % | | | 0.35 | %(e) |
Gross expenses | | | 0.68 | % | | | 0.91 | % | | | 0.87 | % | | | 0.77 | %(e) |
Net investment income | | | 0.90 | % | | | 2.09 | % | | | 3.09 | % | | | 2.18 | %(e) |
Portfolio turnover rate | | | 82 | % | | | 246 | % | | | 324 | %(f) | | | 354 | %(g) |
| * | | From commencement of Class operations on February 1, 2017 through September 30, 2017. | |
| (a) | | Per share net investment income has been calculated using the average shares outstanding during the period. | |
| (b) | | Had certain expenses not been waived/reimbursed during the period, total returns would have been lower. | |
| (c) | | Periods less than one year are not annualized. | |
| (d) | | The investment adviser agreed to waive its fees and/or reimburse a portion of the Fund’s expenses during the period. Without this waiver/reimbursement, expenses would have been higher. | |
| (e) | | Computed on an annualized basis for periods less than one year. | |
| (f) | | During 2018, turnover has remained high due to certain trading strategies. | |
| (g) | | Represents the Fund’s portfolio turnover rate for the year ended September 30, 2017. | |
See accompanying notes to financial statements.
| 64
Financial Highlights – continued
For a share outstanding throughout each period.
| | | | | | | | | | | | | | | | | | | | |
| | | Institutional High Income Fund – Institutional Class | |
| | | Year Ended
September 30,
2020 | | | Year Ended
September 30,
2019 | | | Year Ended
September 30,
2018 | | | Year Ended
September 30,
2017 | | | Year Ended
September 30,
2016 | |
Net asset value, beginning of the period | | $ | 6.44 | | | $ | 6.90 | | | $ | 7.01 | | | $ | 6.81 | | | $ | 6.72 | |
| | | | |
INCOME (LOSS) FROM INVESTMENT OPERATIONS: | | | | | | | | | | | | | | | | | | | | |
Net investment income(a) | | | 0.29 | | | | 0.34 | | | | 0.36 | | | | 0.35 | | | | 0.37 | |
Net realized and unrealized gain (loss) | | | (0.32 | ) | | | (0.35 | ) | | | (0.07 | ) | | | 0.25 | | | | 0.36 | |
| | | | |
Total from Investment Operations | | | (0.03 | ) | | | (0.01 | ) | | | 0.29 | | | | 0.60 | | | | 0.73 | |
| | | | |
LESS DISTRIBUTIONS FROM: | | | | | | | | | | | | | | | | | | | | |
Net investment income | | | (0.37 | ) | | | (0.37 | ) | | | (0.38 | ) | | | (0.38 | ) | | | (0.42 | ) |
Net realized capital gains | | | (0.05 | ) | | | (0.08 | ) | | | (0.02 | ) | | | (0.02 | ) | | | (0.22 | ) |
| | | | |
Total Distributions | | | (0.42 | ) | | | (0.45 | ) | | | (0.40 | ) | | | (0.40 | ) | | | (0.64 | ) |
| | | | |
Net asset value, end of the period | | $ | 5.99 | | | $ | 6.44 | | | $ | 6.90 | | | $ | 7.01 | | | $ | 6.81 | |
| | | | |
Total return | | | (0.67 | )%(b) | | | 0.20 | % | | | 4.31 | % | | | 9.19 | % | | | 12.53 | % |
RATIOS TO AVERAGE NET ASSETS: | | | | | | | | | | | | | | | | | | | | |
Net assets, end of the period (000’s) | | $ | 516,815 | | | $ | 572,393 | | | $ | 672,775 | | | $ | 731,042 | | | $ | 714,188 | |
Net expenses | | | 0.69 | % | | | 0.68 | % | | | 0.68 | % | | | 0.68 | % | | | 0.68 | % |
Gross expenses | | | 0.69 | % | | | 0.68 | % | | | 0.68 | % | | | 0.68 | % | | | 0.68 | % |
Net investment income | | | 4.84 | % | | | 5.33 | % | | | 5.26 | % | | | 5.17 | % | | | 5.87 | % |
Portfolio turnover rate | | | 25 | % | | | 23 | % | | | 14 | % | | | 17 | % | | | 17 | % |
| (a) | | Per share net investment income has been calculated using the average shares outstanding during the period. | |
| (b) | | Generally accepted accounting principles require certain adjustments to be made to the net assets of the Fund for financial reporting purposes only, and as such, the total returns based on the adjusted net asset values per share may differ from the total returns reported in the average annual total return table. | |
| | | | | | | | | | | | | | | | | | | | |
| | | Investment Grade Fixed Income Fund – Institutional Class | |
| | | Year Ended
September 30,
2020
| | | Year Ended
September 30,
2019
| | | Year Ended
September 30,
2018
| | | Year Ended
September 30,
2017
| | | Year Ended
September 30,
2016
| |
Net asset value, beginning of the period | | $ | 12.30 | | | $ | 12.20 | | | $ | 12.43 | | | $ | 12.42 | | | $ | 11.81 | |
| | | | |
INCOME (LOSS) FROM INVESTMENT OPERATIONS: | | | | | | | | | | | | | | | | | | | | |
Net investment income(a) | | | 0.36 | | | | 0.39 | | | | 0.37 | | | | 0.46 | | | | 0.45 | |
Net realized and unrealized gain (loss) | | | 0.18 | | | | 0.14 | | | | (0.22 | ) | | | 0.22 | | | | 0.50 | |
| | | | |
Total from Investment Operations | | | 0.54 | | | | 0.53 | | | | 0.15 | | | | 0.68 | | | | 0.95 | |
| | | | |
LESS DISTRIBUTIONS FROM: | | | | | | | | | | | | | | | | | | | | |
Net investment income | | | (0.32 | ) | | | (0.24 | ) | | | (0.30 | ) | | | (0.42 | ) | | | (0.22 | ) |
Net realized capital gains | | | (0.04 | ) | | | (0.19 | ) | | | (0.08 | ) | | | (0.25 | ) | | | (0.12 | ) |
| | | | |
Total Distributions | | | (0.36 | ) | | | (0.43 | ) | | | (0.38 | ) | | | (0.67 | ) | | | (0.34 | ) |
| | | | |
Net asset value, end of the period | | $ | 12.48 | | | $ | 12.30 | | | $ | 12.20 | | | $ | 12.43 | | | $ | 12.42 | |
| | | | |
Total return | | | 4.53 | % | | | 4.46 | % | | | 1.27 | % | | | 5.73 | % | | | 8.27 | % |
RATIOS TO AVERAGE NET ASSETS: | | | | | | | | | | | | | | | | | | | | |
Net assets, end of the period (000’s) | | $ | 229,129 | | | $ | 289,056 | | | $ | 272,725 | | | $ | 412,235 | | | $ | 461,429 | |
Net expenses | | | 0.52 | % | | | 0.50 | % | | | 0.49 | % | | | 0.49 | % | | | 0.48 | % |
Gross expenses | | | 0.52 | % | | | 0.50 | % | | | 0.49 | % | | | 0.49 | % | | | 0.48 | % |
Net investment income | | | 2.93 | % | | | 3.26 | % | | | 3.03 | % | | | 3.79 | % | | | 3.72 | % |
Portfolio turnover rate | | | 29 | % | | | 11 | % | | | 1 | % | | | 3 | % | | | 23 | % |
| (a) | | Per share net investment income has been calculated using the average shares outstanding during the period. | |
See accompanying notes to financial statements.
65 |
Notes to Financial Statements
September 30, 2020
1. Organization. Loomis Sayles Funds I (the “Trust”) is organized as a Massachusetts business trust. The Trust is registered under the Investment Company Act of 1940, as amended (the “1940 Act”) as an open-end management investment company. The Declaration of Trust permits the Board of Trustees to authorize the issuance of an unlimited number of shares of the Trust in multiple series. The financial statements for certain funds of the Trust are presented in separate reports. The following funds (individually, a “Fund” and collectively, the “Funds”) are included in this report:
Loomis Sayles Fixed Income Fund (the “Fixed Income Fund”)
Loomis Sayles Global Bond Fund (the “Global Bond Fund”)
Loomis Sayles Inflation Protected Securities Fund (the “Inflation Protected Securities Fund”)
Loomis Sayles Institutional High Income Fund (the “Institutional High Income Fund”)
Loomis Sayles Investment Grade Fixed Income Fund (the “Investment Grade Fixed Income Fund”)
Effective July 15, 2020, Fixed Income Fund’s investment strategies were revised to allow the Fund to invest up to 20% of its assets in common stocks, from 10% previously.
Each Fund is a diversified investment company.
Each Fund offers Institutional Class shares. Global Bond Fund and Inflation Protected Securities Fund also offer Retail Class shares and Class N shares.
Each share class is sold without a sales charge. Retail Class shares pay a Rule 12b-1 fee. Class N shares are offered with an initial minimum investment of $1,000,000. Institutional Class shares are intended for institutional investors with a minimum initial investment of $100,000 for Global Bond Fund and Inflation Protected Securities Fund and $3,000,000 for Fixed Income Fund, Institutional High Income Fund and Investment Grade Fixed Income Fund. Certain categories of investors are exempted from the minimum investment amounts for Class N and Institutional Class as outlined in the relevant Fund’s prospectus.
Most expenses can be directly attributed to a Fund. Expenses which cannot be directly attributed to a Fund are generally apportioned based on the relative net assets of each of the funds in Natixis Funds Trust I, Natixis Funds Trust II, Natixis Funds Trust IV, and Gateway Trust (“Natixis Funds Trusts”) and Loomis Sayles Funds I and Loomis Sayles Funds II (“Loomis Sayles Funds Trusts”), and Natixis ETF Trust and Natixis ETF Trust II (“Natixis ETF Trusts”). Expenses of a Fund are borne pro rata by the holders of each class of shares, except that each class bears expenses unique to that class (such as the Rule 12b-1 fees applicable to Retail Class), and transfer agent fees are borne collectively for Institutional Class and Retail Class, and individually for Class N. In addition, each class votes as a class only with respect to its own Rule 12b-1 Plan. Shares of each class would receive their pro rata share of the net assets of a Fund if the Fund were liquidated. The Trustees approve separate distributions from net investment income on each class of shares.
2. Significant Accounting Policies. The following is a summary of significant accounting policies consistently followed by each Fund in the preparation of its financial statements. The Funds’ financial statements follow the accounting and reporting guidelines provided for investment companies and are prepared in accordance with accounting principles generally accepted in the United States of America which require the use of management estimates that affect the reported amounts and disclosures in the financial statements. Actual results could differ from those estimates. Management has evaluated the events and transactions subsequent to year-end through the date the financial statements were issued and has determined that there were no material events that would require disclosure in the Funds’ financial statements.
a. Valuation. Fund securities and other investments are valued at market value based on market quotations obtained or determined by independent pricing services recommended by the adviser and approved by the Board of Trustees. Fund securities and other investments for which market quotations are not readily available are valued at fair value as determined in good faith by the adviser pursuant to procedures approved by the Board of Trustees, as described below. Market value is determined as follows:
Debt securities and unlisted preferred equity securities are valued based on evaluated bids furnished to the Funds by an independent pricing service or bid prices obtained from broker-dealers. Senior loans are valued at bid prices supplied by an independent pricing service, if available. Listed equity securities (including shares of closed-end investment companies and exchange-traded funds) are valued at the last sale price quoted on the exchange where they are traded most extensively or, if there is no reported sale during the day, the closing bid quotation as reported by an independent pricing service. Securities traded on the NASDAQ Global Select Market, NASDAQ Global Market and NASDAQ Capital Market are valued at the NASDAQ Official Closing Price (“NOCP”), or if lacking an NOCP, at the most recent bid quotations on the applicable NASDAQ Market. Unlisted equity securities (except unlisted preferred equity securities) are valued at the last sale price quoted in the market where they are traded most extensively or, if there is no reported sale during the day, the closing bid quotation as reported by an independent pricing service. If there is no last sale price or closing bid quotation available, unlisted equity securities will be valued using evaluated bids furnished by an independent pricing service, if available. In some foreign markets, an official close price and a last sale price may be available from the foreign exchange or market. In those cases, the official close price is used. Broker-dealer bid prices may be used to value debt and unlisted equity securities and senior loans where an independent pricing service is unable to price a security or where an independent pricing service does not provide a reliable price for the security. Forward foreign currency contracts are valued utilizing
| 66
Notes to Financial Statements – continued
September 30, 2020
interpolated rates determined based on information provided by an independent pricing service. Futures contracts are valued at the most recent settlement price on the exchange on which the adviser believes that, over time, they are traded most extensively. Over-the-counter (“OTC”) currency options and swaptions are valued at mid prices (between the bid and the ask price) supplied by an independent pricing service, if available. Other OTC option contracts (including currency options and swaptions not priced through an independent pricing service) are valued based on quotations obtained from broker-dealers. Centrally cleared credit default swap agreements are valued at settlement prices of the clearing house on which the contracts were traded or prices obtained from broker-dealers. Bilateral credit default swaps are valued based on mid prices (between the bid price and the ask price) supplied by an independent pricing service.
Fund securities and other investments for which market quotations are not readily available are valued at fair value as determined in good faith by the adviser pursuant to procedures approved by the Board of Trustees. The Funds may also value securities and other investments at fair value in other circumstances such as when extraordinary events occur after the close of a foreign market but prior to the close of the New York Stock Exchange. This may include situations relating to a single issuer (such as a declaration of bankruptcy or a delisting of the issuer’s security from the primary market on which it has traded) as well as events affecting the securities markets in general (such as market disruptions or closings and significant fluctuations in U.S. and/or foreign markets). When fair valuing its securities or other investments, the Funds may, among other things, use modeling tools or other processes that may take into account factors such as securities or other market activity and/or significant events that occur after the close of the foreign market and before the time the Fund’s net asset value (“NAV”) is calculated. Fair value pricing may require subjective determinations about the value of a security, and fair values used to determine a Fund’s NAV may differ from quoted or published prices, or from prices that are used by others, for the same securities. In addition, the use of fair value pricing may not always result in adjustments to the prices of securities held by a Fund.
Illiquid securities for which market quotations are readily available and have been evaluated by the adviser are considered and classified as fair valued securities pursuant to the Funds’ pricing policies and procedures.
As of September 30, 2020, securities held by the Funds were fair valued as follows:
| | | | | | | | | | | | | | | | |
Fund | | Securities
classified as
fair valued | | | Percentage of
Net Assets | | | Securities fair
valued by the
Fund’s adviser | | | Percentage of
Net Assets | |
Fixed Income Fund | | $ | 4,370,513 | | | | 0.7% | | | $ | 567,719 | | | | 0.1% | |
Institutional High Income Fund | | | 4,512,083 | | | | 0.9% | | | | 2,329,342 | | | | 0.5% | |
Investment Grade Fixed Income Fund | | | 7,998,921 | | | | 3.5% | | | | 9,826 | | | | Less than 0.1% | |
b. Investment Transactions and Related Investment Income. Investment transactions are accounted for on a trade date plus one day basis for daily NAV calculation. However, for financial reporting purposes, investment transactions are reported on trade date. Dividend income (including income reinvested) and foreign withholding tax, if applicable, is recorded on the ex-dividend date, or in the case of certain foreign securities, as soon as a Fund is notified, and interest income is recorded on an accrual basis. Interest income is increased by the accretion of discount and decreased by the amortization of premium, if applicable. Periodic principal adjustments for inflation-protected securities are recorded to interest income. Negative principal adjustments (in the event of deflation) are recorded as reductions of interest income to the extent of interest income earned, not to exceed the amount of positive principal adjustments on a cumulative basis. Distributions received from investments in securities that represent a return of capital or capital gain are recorded as a reduction of cost of investments or as a realized gain, respectively. The calendar year-end amounts of ordinary income, capital gains, and return of capital included in distributions received from the Funds’ investments in real estate investment trusts (“REITs”) are reported to the Funds after the end of the fiscal year; accordingly, the Funds estimate these amounts for accounting purposes until the characterization of REIT distributions is reported to the Funds after the end of the fiscal year. Estimates are based on the most recent REIT distribution information available. In determining net gain or loss on securities sold, the cost of securities has been determined on an identified cost basis. Investment income, non-class-specific expenses and realized and unrealized gains and losses are allocated on a pro rata basis to each class based on the relative net assets of each class to the total net assets of the Fund.
c. Foreign Currency Translation. The books and records of the Funds are maintained in U.S. dollars. The values of securities, currencies and other assets and liabilities denominated in currencies other than U.S. dollars, if any, are translated into U.S. dollars based upon foreign exchange rates prevailing at the end of the period. Purchases and sales of investment securities, income and expenses are translated into U.S. dollars on the respective dates of such transactions.
Net realized foreign exchange gains or losses arise from sales of foreign currency, changes in exchange rates between the trade and settlement dates on securities transactions and the difference between the amounts of dividends, interest and foreign withholding taxes recorded on the Funds’ books and the U.S. dollar equivalent of the amounts actually received or paid. Net unrealized foreign exchange gains or losses arise from changes in the value of assets and liabilities, other than investment securities, as of the end of the fiscal period, resulting from changes in exchange rates. Net realized foreign exchange gains or losses and the net change in unrealized foreign exchange gains or losses are disclosed in the Statements of Operations. For federal income tax purposes, net realized foreign exchange gains or losses are characterized as ordinary income and may, if the Funds have net losses, reduce or eliminate the amount of income available to be distributed by the Funds.
67 |
Notes to Financial Statements – continued
September 30, 2020
The values of investment securities are presented at the foreign exchange rates prevailing at the end of the period for financial reporting purposes. Net realized and unrealized gains or losses on investments reported in the Statements of Operations reflect gains or losses resulting from changes in exchange rates and fluctuations which arise due to changes in market prices of investment securities. For federal income tax purposes, a portion of the net realized gain or loss on investments arising from changes in exchange rates, which is reflected in the Statements of Operations, may be characterized as ordinary income and may, if the Funds have net losses, reduce or eliminate the amount of income available to be distributed by the Funds.
For the year ended September 30, 2020, the amount of income available to be distributed has been reduced by the following amounts as a result of losses arising from changes in exchange rates:
| | | | |
Fixed Income Fund | | $ | 150,130 | |
Global Bond Fund | | | 3,282,843 | |
Institutional High Income Fund | | | 291,617 | |
Investment Grade Fixed Income Fund | | | 643,535 | |
The Funds may use foreign currency exchange contracts to facilitate transactions in foreign-denominated investments. Losses may arise from changes in the value of the foreign currency or if the counterparties do not perform under the contracts’ terms.
d. Forward Foreign Currency Contracts. Certain Funds may enter into forward foreign currency contracts, including forward foreign cross currency contracts, to acquire exposure to foreign currencies or to hedge the Funds’ investments against currency fluctuation. A contract can also be used to offset a previous contract. These contracts involve market risk in excess of the unrealized appreciation (depreciation) reflected in the Funds’ Statements of Assets and Liabilities. The U.S. dollar value of the currencies a Fund has committed to buy or sell represents the aggregate exposure to each currency a Fund has acquired or hedged through currency contracts outstanding at period end. Gains or losses are recorded for financial statement purposes as unrealized until settlement date. Contracts are traded over-the-counter directly with a counterparty. Risks may arise upon entering into these contracts from the potential inability of counterparties to meet the terms of their contracts and from unanticipated movements in the value of a foreign currency relative to the U.S. dollar. Certain contracts may require the movement of cash and/or securities as collateral for the Funds’ or counterparty’s net obligations under the contracts.
e. Futures Contracts. The Funds may enter into futures contracts. Futures contracts are agreements between two parties to buy and sell a particular instrument or index for a specified price on a specified future date.
When a Fund enters into a futures contract, it is required to deposit with (or for the benefit of) its broker an amount of cash or short-term high-quality securities as “initial margin.” As the value of the contract changes, the value of the futures contract position increases or declines. Subsequent payments, known as “variation margin,” are made or received by a Fund, depending on the price fluctuations in the fair value of the contract and the value of cash or securities on deposit with the broker. The aggregate principal amounts of the contracts are not recorded in the financial statements. Daily fluctuations in the value of the contracts are recorded in the Statements of Assets and Liabilities as a receivable (payable) and in the Statements of Operations as unrealized appreciation (depreciation) until the contracts are closed, when they are recorded as realized gains (losses). Realized gain or loss on a futures position is equal to the difference between the value of the contract at the time it was opened and the value at the time it was closed, minus brokerage commissions. When a Fund enters into a futures contract certain risks may arise, such as illiquidity in the futures market, which may limit a Fund’s ability to close out a futures contract prior to settlement date, and unanticipated movements in the value of securities or interest rates.
Futures contracts are exchange-traded. Exchange-traded futures contracts are standardized and are settled through a clearing house with fulfillment supported by the credit of the exchange. Therefore, counterparty credit risks to the Funds are reduced; however, in the event that a counterparty enters into bankruptcy, a Fund’s claim against initial/variation margin on deposit with the counterparty may be subject to terms of a final settlement in bankruptcy court.
f. Option Contracts. The Funds may enter into option contracts. When a Fund purchases an option, it pays a premium and the option is subsequently marked-to-market to reflect current value. Premiums paid for purchasing options which expire are treated as realized losses. Premiums paid for purchasing options which are exercised are added to the cost or deducted from the proceeds on the underlying instrument to determine the realized gain or loss. If the Fund enters into a closing sale transaction, the difference between the premium paid and the proceeds of the closing sale transaction is treated as a realized gain or loss. The risk associated with purchasing options is limited to the premium paid.
When a Fund writes an option, an amount equal to the net premium received (the premium less commission) is recorded as a liability and is subsequently adjusted to the current value. Net premiums received for written options which expire are treated as realized gains. Net premiums received for written options which are exercised are deducted from the cost or added to the proceeds on the underlying instrument to determine the realized gain or loss. If the Fund enters into a closing purchase transaction, the difference between the net premium received and any amount paid on effecting a closing purchase transaction, including commissions, is treated as a realized gain or, if the net premium received is less than the amount paid, as a realized loss. The Fund, as writer of a written option, bears the risk of an unfavorable change in the market value of the instrument or index underlying the written option.
| 68
Notes to Financial Statements – continued
September 30, 2020
Exchange-traded options contracts are standardized and are settled through a clearing house with fulfillment supported by the credit of the exchange. Therefore, counterparty credit risks to the Funds are reduced. OTC options are subject to the risk that the counterparty is unable or unwilling to meet its obligations under the option.
g. Swaptions. Certain Funds may enter into interest rate swaptions. An interest rate swaption gives the holder the right, but not the obligation, to enter into or cancel an interest rate swap agreement at a future date. Interest rate swaptions may be either purchased or written. The buyer of an interest rate swaption may purchase either the right to receive a fixed rate in the underlying swap (known as a “receiver swaption”) or to pay a fixed rate (known as a “payer swaption”), based on the notional amount of the swap agreement, in exchange for a floating rate. The notional amounts of swaptions are not recorded in the financial statements.
When a Fund purchases an interest rate swaption, it pays a premium and the swaption is subsequently marked-to-market to reflect current value. Premiums paid for purchasing interest rate swaptions which expire are treated as realized losses. Premiums paid for purchasing interest rate swaptions which are exercised are added to the cost or deducted from the proceeds on the underlying swap to determine the realized gain or loss. If a Fund enters into a closing sale transaction, the difference between the premium paid and the proceeds of the closing sale transaction is treated as a realized gain or loss. The risk associated with purchasing interest rate swaptions is limited to the premium paid.
When a Fund writes an interest rate swaption, an amount equal to the premium received is recorded as a liability and is subsequently adjusted to the current value. Premiums received for written interest rate swaptions which expire are treated as realized gains. Premiums received for written interest rate swaptions which are exercised are deducted from the cost or added to the proceeds on the underlying swap to determine the realized gain or loss. If a Fund enters into a closing purchase transaction, the difference between the premium received and any amount paid on effecting a closing purchase transaction, including commission, is treated as a realized gain or, if the premium received is less than the amount paid, as a realized loss. A Fund, as writer of a written interest rate swaption, bears the risk of an unfavorable change in the market value of the swap underlying the written interest rate swaption.
Over-the-counter interest rate swaptions are subject to the risk that the counterparty is unable or unwilling to meet its obligations under the swaption.
No swaptions were held by the Funds during the year ended September 30, 2020.
h. Swap Agreements. The Funds may enter into credit default and interest rate swaps. A credit default swap is an agreement between two parties (the “protection buyer” and “protection seller”) to exchange the credit risk of an issuer (“reference obligation”) for a specified time period. The reference obligation may be one or more debt securities or an index of such securities. The Funds may be either the protection buyer or the protection seller. As a protection buyer, the Funds have the ability to hedge the downside risk of an issuer or group of issuers. As a protection seller, the Funds have the ability to gain exposure to an issuer or group of issuers whose bonds are unavailable or in short supply in the cash bond market, as well as realize additional income in the form of fees paid by the protection buyer. The protection buyer is obligated to pay the protection seller a stream of payments (“fees”) over the term of the contract, provided that no credit event, such as a default or a downgrade in credit rating, occurs on the reference obligation. The Funds may also pay or receive upfront premiums. If a credit event occurs, the protection seller must pay the protection buyer the difference between the agreed upon notional value and market value of the reference obligation. Market value in this case is determined by a facilitated auction whereby a minimum number of allowable broker bids, together with a specified valuation method, are used to calculate the value. The maximum potential amount of undiscounted future payments that a Fund as the protection seller could be required to make under a credit default swap agreement would be an amount equal to the notional amount of the agreement.
An interest rate swap is an agreement with another party to receive or pay interest (e.g., an exchange of fixed rate payments for floating rate payments) to protect themselves from interest rate fluctuations. This type of swap is an agreement that obligates two parties to exchange a series of cash flows at specified intervals based upon or calculated by reference to a specified interest rate(s) for a specified notional amount. The payment flows are usually netted against each other, with the difference being paid by one party to the other.
The notional amounts of swap agreements are not recorded in the financial statements. Swap agreements are valued daily and fluctuations in the value are recorded in the Statements of Operations as change in unrealized appreciation (depreciation) on swap agreements. Fees are accrued in accordance with the terms of the agreement and are recorded as part of unrealized appreciation (depreciation) on swap agreements. When received or paid, fees are recorded in the Statements of Operations as realized gain or loss. Upfront premiums paid or received by the Funds are amortized or accreted over the term of the agreement and recorded as realized gain or loss. Payments made or received by the Funds as a result of a credit event or termination of the agreement are recorded as realized gain or loss.
Swap agreements are privately negotiated in the over-the-counter market and may be entered into as a bilateral contract or centrally cleared (“centrally cleared swaps”). Bilateral swap agreements are traded between counterparties and, as such, are subject to the risk that a party to the agreement will not be able to meet its obligations. In a centrally cleared swap, immediately following execution of the swap agreement, the swap agreement is novated to a central counterparty (the “CCP”) and the Funds face the CCP through a broker. Upon entering into a centrally cleared swap, the Funds are required to deposit initial margin with the broker in the form of cash or securities in an amount that
69 |
Notes to Financial Statements – continued
September 30, 2020
varies depending on the size and risk profile of the particular swap. Subsequent payments, known as “variation margin,” are made or received by the Funds based on the daily change in the value of the centrally cleared swap agreement. For centrally cleared swaps, the Funds’ counterparty credit risk is reduced as the CCP stands between the Funds and the counterparty. The Funds cover their net obligations under outstanding swap agreements by segregating or earmarking cash or securities.
No swap agreements were held by the Funds during the year ended September 30, 2020.
i. When-Issued and Delayed Delivery Transactions. The Funds may enter into when-issued or delayed delivery transactions. When-issued refers to transactions made conditionally because a security, although authorized, has not been issued. Delayed delivery refers to transactions for which delivery or payment will occur at a later date, beyond the normal settlement period. The price of when-issued and delayed delivery securities and the date when the securities will be delivered and paid for are fixed at the time the transaction is negotiated. The security and the obligation to pay for it are recorded by the Funds at the time the commitment is entered into. The value of the security may vary with market fluctuations during the time before the Funds take delivery of the security. No interest accrues to the Funds until the transaction settles.
Delayed delivery transactions include those designated as To Be Announced (“TBAs”) in the Portfolios of Investments. For TBAs, the actual security that will be delivered to fulfill the transaction is not designated at the time of the trade. The security is “to be announced” 48 hours prior to the established trade settlement date. Certain transactions require the Funds or counterparty to post cash and/or securities as collateral for the net mark-to-market exposure to the other party. The Funds cover their net obligations under outstanding delayed delivery commitments by segregating or earmarking cash or securities at the custodian.
Purchases of when-issued or delayed delivery securities may have a similar effect on the Funds’ NAV as if the Funds’ had created a degree of leverage in the portfolio. Risks may arise upon entering into such transactions from the potential inability of counterparties to meet their obligations under the transactions. Additionally, losses may arise due to changes in the value of the underlying securities.
j. Federal and Foreign Income Taxes. The Trust treats each Fund as a separate entity for federal income tax purposes. Each Fund intends to meet the requirements of the Internal Revenue Code of 1986, as amended, applicable to regulated investment companies, and to distribute to its shareholders substantially all of its net investment income and any net realized capital gains at least annually. Management has performed an analysis of each Fund’s tax positions for the open tax years as of September 30, 2020 and has concluded that no provisions for income tax are required. The Funds’ federal tax returns for the prior three fiscal years remain subject to examination by the Internal Revenue Service. Management is not aware of any events that are reasonably possible to occur in the next twelve months that would result in the amounts of any unrecognized tax benefits significantly increasing or decreasing for the Funds. However, management’s conclusions regarding tax positions taken may be subject to review and adjustment at a later date based on factors including, but not limited to, new tax laws and accounting regulations and interpretations thereof.
A Fund may be subject to foreign withholding taxes on investment income and taxes on capital gains on investments that are accrued and paid based upon the Fund’s understanding of the tax rules and regulations that exist in the countries in which the Fund invests. Foreign withholding taxes on dividend and interest income are reflected on the Statements of Operations as a reduction of investment income, net of amounts eligible to be reclaimed. Dividends and interest receivable on the Statements of Assets and Liabilities are net of foreign withholding taxes. Foreign withholding taxes where reclaims have been or will be filed are reflected on the Statements of Assets and Liabilities as tax reclaims receivable. Capital gains taxes paid are included in net realized gain (loss) on investments in the Statements of Operations. Accrued but unpaid capital gains taxes are reflected as foreign taxes payable on the Statements of Assets and Liabilities, if applicable, and reduce unrealized gains on investments. In the event that realized gains on investments are subsequently offset by realized losses, taxes paid on realized gains may be returned to a Fund. Such amounts, if applicable, are reflected as foreign tax rebates receivable on the Statements of Assets and Liabilities and are recorded as a realized gain when received.
k. Dividends and Distributions to Shareholders. Dividends and distributions are recorded on the ex-dividend date. The timing and characterization of certain income and capital gain distributions are determined in accordance with federal tax regulations, which may differ from accounting principles generally accepted in the United States of America. Permanent differences are primarily due to differing treatments for book and tax purposes of items such as distribution re-designations, foreign currency gains and losses, convertible bonds, paydown gains and losses, premium amortization, return of capital distributions received, defaulted and/or non-income producing securities, capital gains taxes, contingent payment debt instruments, treasury inflation-protected bonds, forward foreign currency contract mark-to-market, futures contract mark-to-market, capital gain distributions received, trust preferred securities and deferred Trustees’ fees. Permanent book and tax basis differences relating to shareholder distributions will result in reclassifications to capital accounts reported on the Statements of Assets and Liabilities. Temporary differences between book and tax distributable earnings are primarily due to deferred Trustees’ fees, wash sales, convertible bonds, premium amortization, forward foreign currency contract mark-to-market, futures contract mark-to-market, trust preferred securities, return of capital distributions received, contingent payment debt instruments, capital gain distributions received, capital gains taxes, foreign currency gains and losses, paydown gains and losses, treasury inflation-protected bonds and defaulted and/or non-income producing securities. Amounts of income and capital gain available to be distributed on a tax basis are determined annually, and at other times during
| 70
Notes to Financial Statements – continued
September 30, 2020
the Funds’ fiscal year as may be necessary to avoid knowingly declaring and paying a return of capital distribution. Distributions from net investment income and net realized short-term capital gains are reported as distributed from ordinary income for tax purposes.
The tax characterization of distributions is determined on an annual basis. The tax character of distributions paid to shareholders during the years ended September 30, 2020 and 2019 were as follows:
| | | | | | | | | | | | |
| | | 2020 Distributions Paid From: | | 2019 Distributions Paid From: |
Fund | | Ordinary
Income | | Long-Term
Capital Gains | | Total | | Ordinary
Income | | Long-Term
Capital Gains | | Total |
Fixed Income Fund | | $30,736,093 | | $ — | | $30,736,093 | | $37,783,514 | | $6,273,120 | | $44,056,634 |
Global Bond Fund | | 5,806,837 | | 1,783,363 | | 7,590,200 | | 2,303,295 | | 3,049,750 | | 5,353,045 |
Inflation Protected Securities Fund | | 586,997 | | — | | 586,997 | | 562,130 | | — | | 562,130 |
Institutional High Income Fund | | 32,074,233 | | 3,503,819 | | 35,578,052 | | 39,012,284 | | 7,881,060 | | 46,893,344 |
Investment Grade Fixed Income Fund | | 6,726,290 | | 938,614 | | 7,664,904 | | 5,468,364 | | 4,090,610 | | 9,558,974 |
Distributions paid to shareholders from net investment income and net realized capital gains, based on accounting principles generally accepted in the United States of America, are consolidated and reported on the Statements of Changes in Net Assets as Distributions to Shareholders. Distributions paid to shareholders from net investment income and net realized capital gains expressed in per-share amounts, based on accounting principles generally accepted in the United States of America, are separately stated and reported within the Financial Highlights.
As of September 30, 2020, the components of distributable earnings on a tax basis were as follows:
| | | | | | | | | | | | | | | | | | | | |
| | | Fixed Income
Fund | | | Global
Bond Fund | | | Inflation Protected
Securities Fund | | | Institutional High
Income Fund | | | Investment
Grade Fixed
Income Fund | |
Undistributed ordinary income | | $ | 25,684,855 | | | $ | 19,964,840 | | | $ | 128,274 | | | $ | 20,037,856 | | | $ | 983,109 | |
Undistributed long-term capital gains | | | 5,950,391 | | | | 9,021,794 | | | | — | | | | — | | | | 1,780,882 | |
| | | | | | | | | | | | | | | | | | | | |
Total undistributed earnings | | | 31,635,246 | | | | 28,986,634 | | | | 128,274 | | | | 20,037,856 | | | | 2,763,991 | |
| | | | | | | | | | | | | | | | | | | | |
Capital loss carryforward: | | | | | | | | | | | | | | | | | | | | |
Long-term: | | | | | | | | | | | | | | | | | | | | |
No expiration date | | | — | | | | — | | | | (801,093 | ) | | | (20,209,692 | ) | | | — | |
| | | | | | | | | | | | | | | | | | | | |
Unrealized appreciation (depreciation) | | | (14,854,084 | ) | | | 30,583,102 | | | | 4,313,824 | | | | (34,900,786 | ) | | | 10,408,145 | |
| | | | | | | | | | | | | | | | | | | | |
Total accumulated earnings (losses) | | $ | 16,781,162 | | | $ | 59,569,736 | | | $ | 3,641,005 | | | $ | (35,072,622 | ) | | $ | 13,172,136 | |
| | | | | | | | | | | | | | | | | | | | |
Capital loss carryforward utilized in the current year | | $ | — | | | $ | — | | | $ | 1,499,215 | | | $ | — | | | $ | — | |
| | | | | | | | | | | | | | | | | | | | |
As of September 30, 2020, unrealized appreciation (depreciation) as a component of distributable earnings was as follows:
| | | | | | | | | | | | | | | | | | | | |
| | | Fixed Income
Fund | | | Global
Bond Fund | | | Inflation Protected
Securities Fund | | | Institutional High
Income Fund | | | Investment
Grade Fixed
Income Fund | |
Unrealized appreciation (depreciation) Investments | | $ | 12,062,662 | | | $ | 29,540,585 | | | $ | 4,313,824 | | | $ | (22,354,243 | ) | | $ | 20,990,507 | |
Foreign currency translations | | | (26,916,746 | ) | | | 1,042,517 | | | | — | | | | (12,546,543 | ) | | | (10,582,362 | ) |
| | | | | | | | | | | | | | | | | | | | |
Total unrealized appreciation (depreciation) | | $ | (14,854,084 | ) | | $ | 30,583,102 | | | $ | 4,313,824 | | | $ | (34,900,786 | ) | | $ | 10,408,145 | |
| | | | | | | | | | | | | | | | | | | | |
71 |
Notes to Financial Statements – continued
September 30, 2020
As of September 30, 2020, the tax cost of investments (including derivatives, if applicable) and unrealized appreciation (depreciation) on a federal tax basis were as follows:
| | | | | | | | | | | | | | | | | | | | |
| | | Fixed Income
Fund | | | Global
Bond Fund | | | Inflation Protected
Securities Fund | | | Institutional High
Income Fund | | | Investment
Grade Fixed
Income Fund | |
Federal tax cost | | $ | 625,091,549 | | | $ | 667,519,528 | | | $ | 123,792,522 | | | $ | 546,223,189 | | | $ | 217,349,049 | |
| | | | | | | | | | | | | | | | | | | | |
Gross tax appreciation | | $ | 73,106,242 | | | $ | 39,865,503 | | | $ | 4,476,226 | | | $ | 58,931,919 | | | $ | 26,581,878 | |
Gross tax depreciation | | | (87,958,083 | ) | | | (9,280,146 | ) | | | (162,402 | ) | | | (93,832,545 | ) | | | (16,174,172 | ) |
| | | | | | | | | | | | | | | | | | | | |
Net tax appreciation (depreciation) | | $ | (14,851,841 | ) | | $ | 30,585,357 | | | $ | 4,313,824 | | | $ | (34,900,626 | ) | | $ | 10,407,706 | |
| | | | | | | | | | | | | | | | | | | | |
The difference between these amounts and those reported in the preceding table are primarily attributable to foreign currency mark-to-market.
l. Senior Loans. Each Fund may invest in senior loans to corporate, governmental or other borrowers. Senior loans, which include both secured and unsecured loans made by banks and other financial institutions to corporate customers, typically hold the most senior position in a borrower’s capital structure, may be secured by the borrower’s assets and have interest rates that reset frequently. Senior Loans can include term loans, revolving credit facility loans and second lien loans. A senior loan is often administered by a bank or other financial institution that acts as agent for all holders. The agent administers the terms of the senior loan, as specified in the loan agreement. Large loans may be shared or syndicated among several lenders. A Fund may enter into the primary syndicate for a loan or it may also purchase all or a portion of loans from other lenders (sometimes referred to as loan assignments), in either case becoming a direct lender. Senior loans outstanding at the end of the period, if any, are listed in each applicable Fund’s Portfolio of Investments.
m. Loan Participations. A Fund’s investments in senior loans may be in the form of participations in loans. When investing in a loan participation, a Fund has the right to receive payments of principal, interest and any fees to which it is entitled only from the party from whom the Fund has purchased the participation and only upon receipt by that party of payments from the borrower. A Fund generally has no right to enforce compliance by the borrower with the terms of the loan agreement or to vote on matters arising under the loan agreement. Thus, a Fund may be subject to credit risk from both the party from whom it purchased the loan participation and the borrower. Additionally, a Fund may have minimal control over the terms of any loan modification. Loan participations outstanding at the end of the period, if any, are listed in each applicable Fund’s Portfolio of Investments.
There were no loan participations held by the Funds as of September 30, 2020.
n. Repurchase Agreements. Each Fund may enter into repurchase agreements, under the terms of a Master Repurchase Agreement, under which each Fund acquires securities as collateral and agrees to resell the securities at an agreed upon time and at an agreed upon price. It is each Fund’s policy that the market value of the collateral for repurchase agreements be at least equal to 102% of the repurchase price, including interest. Certain repurchase agreements are tri-party arrangements whereby the collateral is held in a segregated account for the benefit of the Fund and on behalf of the counterparty. Repurchase agreements could involve certain risks in the event of default or insolvency of the counterparty, including possible delays or restrictions upon a Fund’s ability to dispose of the underlying securities. As of September 30, 2020, each Fund, as applicable, had investments in repurchase agreements for which the value of the related collateral exceeded the value of the repurchase agreement. The gross value of repurchase agreements is included in the Statements of Assets and Liabilities for financial reporting purposes.
o. Due to/from Brokers. Transactions and positions in certain options, futures, and forward foreign currency contracts are maintained and cleared by registered U.S. broker/dealers pursuant to customer agreements between a Fund and the various broker/dealers. The due from brokers balance in the Statements of Assets and Liabilities for Global Bond Fund and Inflation Protected Securities Fund represents cash pledged as initial margin for futures contracts. The due to brokers balance in the Statements of Assets and Liabilities for Global Bond Fund represents cash received as collateral for options and forward foreign currency contracts. In certain circumstances a Fund’s use of cash and/or securities held at brokers is restricted by regulation or broker mandated limits.
p. Securities Lending. The Funds have entered into an agreement with State Street Bank and Trust Company (“State Street Bank”), as agent of the Funds, to lend securities to certain designated borrowers. The loans are collateralized with cash or securities in an amount equal to at least 105% or 102% of the market value (including accrued interest) of the loaned international or domestic securities, respectively, when the loan is initiated. Thereafter, the value of the collateral must remain at least 102% of the market value (including accrued interest) of loaned securities for U.S. equities and U.S. corporate debt; at least 105% of the market value (including accrued interest) of loaned securities for non-U.S. equities; and at least 100% of the market value (including accrued interest) of loaned securities for U.S. Government securities, sovereign debt issued by non-U.S. Governments and non-U.S. corporate debt. In the event that the market value of the collateral falls below the required percentages described above, the borrower will deliver additional collateral on the next business day. As with other extensions of
| 72
Notes to Financial Statements – continued
September 30, 2020
credit, the Funds may bear the risk of loss with respect to the investment of the collateral. The Funds invest cash collateral in short-term investments, a portion of the income from which is remitted to the borrowers and the remainder allocated between the Funds and State Street Bank as lending agent.
For the year ended September 30, 2020, none of the Funds had loaned securities under this agreement.
q. Indemnifications. Under the Trust’s organizational documents, its officers and Trustees are indemnified against certain liabilities arising out of the performance of their duties to the Funds. Additionally, in the normal course of business, the Funds enter into contracts with service providers that contain general indemnification clauses. The Funds’ maximum exposure under these arrangements is unknown as this would involve future claims that may be made against the Funds that have not yet occurred. However, based on experience, the Funds expect the risk of loss to be remote.
r. New Accounting Pronouncement. In August 2018, the Financial Accounting Standards Board (“FASB”) issued Accounting Standards Update 2018-13, Fair Value Measurement (Topic 820): Disclosure Framework — Changes to the Disclosure Requirements for Fair Value Measurement (“ASU 2018-13”). The update introduces new fair value disclosure requirements, eliminates some prior fair value disclosure requirements, and modifies certain existing fair value disclosure requirements. ASU 2018-13 is effective for fiscal years beginning after December 15, 2019, including interim periods within those fiscal years. An entity is permitted to early adopt any eliminated or modified disclosures upon issuance of the update and delay adoption of any new disclosures until the required effective date. Management has evaluated the impact of the adoption of ASU 2018-13 and has determined to early adopt the removal of (i) the amount of and reasons for transfers between Level 1 and Level 2 of the fair value hierarchy and (ii) the policy for timing of transfers between levels. Amended disclosures required and permitted for early adoption by ASU 2018-13 have been incorporated in the Funds’ annual financial statements as of September 30, 2020.
In March 2020, the FASB issued Accounting Standard Update 2020-04, Reference Rate Reform (Topic 848) (“ASU 2020-04”). In response to concerns about structural risks of interbank offered rates, and particularly the risk of cessation of the London Interbank Offered Rate (“LIBOR”), which is expected to occur no later than December 31, 2021, regulators have undertaken reference rate reform initiatives to identify alternative reference rates that are more observable or transaction based and less susceptible to manipulation. ASU 2020-04 provides temporary guidance to ease the potential burden in accounting for (or recognizing the effects of) reference rate reform on financial reporting. ASU 2020-04 is elective and applies to all entities, subject to meeting certain criteria, that have contracts that reference LIBOR or another reference rate expected to be discontinued because of reference rate reform. ASU 2020-04 amendments offer optional expedients for contract modifications that would allow an entity to account for such modifications by prospectively adjusting the effective interest rate, instead of evaluating each contract, in accordance with existing accounting standards, as to whether reference rate modifications constitute the establishment of new contracts or the continuation of existing contracts. ASU 2020-04 amendments are currently effective and an entity may elect to apply its provisions as of any date from the beginning of an interim period that includes or is subsequent to March 12, 2020. No Fund contracts have yet been impacted by reference rate reform. Management expects to apply the optional expedients when appropriate.
3. Fair Value Measurements. In accordance with accounting standards related to fair value measurements and disclosures, the Funds have categorized the inputs utilized in determining the value of each Fund’s assets or liabilities. These inputs are summarized in the three broad levels listed below:
| | • | | Level 1—quoted prices in active markets for identical assets or liabilities; |
| | • | | Level 2—prices determined using other significant inputs that are observable either directly, or indirectly through corroboration with observable market data (which could include quoted prices for similar assets or liabilities, interest rates, credit risk, etc.); and |
| | • | | Level 3—prices determined using significant unobservable inputs when quoted prices or observable inputs are unavailable such as when there is little or no market activity for an asset or liability (unobservable inputs reflect each Fund’s own assumptions in determining the fair value of assets or liabilities and would be based on the best information available). |
The inputs or methodology used for valuing securities are not necessarily an indication of the risk associated with investing in those securities.
The Funds’ pricing policies and procedures are recommended by the adviser and approved by the Board of Trustees. Debt securities are valued based on evaluated bids furnished to the Funds by an independent pricing service. Broker-dealer bid prices may be used if an independent pricing service either is unable to price a security or does not provide a reliable price for a security. The Funds’ adviser may use internally developed models to validate broker-dealer bid prices that are only available from a single broker or market maker. Such securities are considered and classified as fair valued. Broker-dealer bid prices for which the Funds do not have knowledge of the inputs used by the broker-dealer are categorized in Level 3. Securities for which market quotations are not readily available are valued at fair value as determined in good faith by the Funds’ adviser pursuant to procedures approved by the Board of Trustees. Fair valued securities may be categorized in Level 3.
73 |
Notes to Financial Statements – continued
September 30, 2020
The following is a summary of the inputs used to value the Funds’ investments as of September 30, 2020, at value:
Fixed Income Fund
Asset Valuation Inputs
| | | | | | | | | | | | | | | | |
Description | | Level 1 | | | Level 2 | | | Level 3 | | | Total | |
Bonds and Notes | | | | | | | | | | | | | | | | |
Non-Convertible Bonds | | | | | | | | | | | | | | | | |
ABS Other | | $ | — | | | $ | — | | | $ | 859,618 | (b)(c) | | $ | 859,618 | |
Finance Companies | | | 676,615 | | | | 44,045,659 | | | | 96,284 | (d) | | | 44,818,558 | |
All Other Non-Convertible Bonds(a) | | | — | | | | 432,220,436 | | | | — | | | | 432,220,436 | |
| | | | | | | | | | | | | | | | |
Total Non-Convertible Bonds | | | 676,615 | | | | 476,266,095 | | | | 955,902 | | | | 477,898,612 | |
| | | | | | | | | | | | | | | | |
Convertible Bonds(a) | | | — | | | | 42,015,079 | | | | — | | | | 42,015,079 | |
Municipals(a) | | | — | | | | 5,691,975 | | | | — | | | | 5,691,975 | |
| | | | | | | | | | | | | | | | |
Total Bonds and Notes | | | 676,615 | | | | 523,973,149 | | | | 955,902 | | | | 525,605,666 | |
| | | | | | | | | | | | | | | | |
Common Stocks | | | | | | | | | | | | | | | | |
Chemicals | | | — | | | | 1,586,592 | | | | — | | | | 1,586,592 | |
Oil, Gas & Consumable Fuels | | | 549,992 | | | | 83,310 | | | | — | (c) | | | 633,302 | |
All Other Common Stocks(a) | | | 61,186,748 | | | | — | | | | — | | | | 61,186,748 | |
| | | | | | | | | | | | | | | | |
Total Common Stocks | | | 61,736,740 | | | | 1,669,902 | | | | — | | | | 63,406,642 | |
| | | | | | | | | | | | | | | | |
Preferred Stocks | | | | | | | | | | | | | | | | |
Convertible Preferred Stocks | | | | | | | | | | | | | | | | |
Energy | | | — | | | | — | | | | — | (c) | | | — | |
All Other Convertible Preferred Stocks(a) | | | 8,724,832 | | | | — | | | | — | | | | 8,724,832 | |
| | | | | | | | | | | | | | | | |
Total Convertible Preferred Stocks | | | 8,724,832 | | | | — | | | | — | | | | 8,724,832 | |
| | | | | | | | | | | | | | | | |
Non-Convertible Preferred Stocks(a) | | | — | | | | 483,345 | | | | — | | | | 483,345 | |
| | | | | | | | | | | | | | | | |
Total Preferred Stocks | | | 8,724,832 | | | | 483,345 | | | | — | | | | 9,208,177 | |
| | | | | | | | | | | | | | | | |
Warrants | | | — | | | | 278,137 | | | | — | | | | 278,137 | |
Short-Term Investments | | | — | | | | 11,741,086 | | | | — | | | | 11,741,086 | |
| | | | | | | | | | | | | | | | |
Total | | $ | 71,138,187 | | | $ | 538,145,619 | | | $ | 955,902 | | | $ | 610,239,708 | |
| | | | | | | | | | | | | | | | |
(a) Details of the major categories of the Fund’s investments are reflected within the Portfolio of Investments.
(b) Valued using broker-dealer bid prices ($388,183) or fair valued by the Fund’s adviser using a broker-dealer bid price provided by a single market maker ($471,435).
(c) Includes a security fair valued at zero by the Fund’s adviser using Level 3 inputs.
(d) Fair valued by the Fund’s adviser.
Global Bond Fund
Asset Valuation Inputs
| | | | | | | | | | | | | | | | |
Description | | Level 1 | | | Level 2 | | | Level 3 | | | Total | |
Bonds and Notes(a) | | $ | — | | | $ | 684,513,560 | | | $ | — | | | $ | 684,513,560 | |
Short-Term Investments | | | — | | | | 13,495,909 | | | | — | | | | 13,495,909 | |
Purchased Options | | | — | | | | 37,204 | | | | — | | | | 37,204 | |
| | | | | | | | | | | | | | | | |
Total Investments | | | — | | | | 698,046,673 | | | | — | | | | 698,046,673 | |
| | | | | | | | | | | | | | | | |
Forward Foreign Currency Contracts (unrealized appreciation) | | | — | | | | 753,935 | | | | — | | | | 753,935 | |
Futures Contracts (unrealized appreciation) | | | 213,658 | | | | — | | | | — | | | | 213,658 | |
| | | | | | | | | | | | | | | | |
Total | | $ | 213,658 | | | $ | 698,800,608 | | | $ | — | | | $ | 699,014,266 | |
| | | | | | | | | | | | | | | | |
Liability Valuation Inputs
| | | | | | | | | | | | | | | | |
Description | | Level 1 | | | Level 2 | | | Level 3 | | | Total | |
Written Options | | $ | — | | | $ | (1,086 | ) | | $ | — | | | $ | (1,086 | ) |
Forward Foreign Currency Contracts (unrealized depreciation) | | | — | | | | (295,200 | ) | | | — | | | | (295,200 | ) |
Futures Contracts (unrealized depreciation) | | | (79,374 | ) | | | — | | | | — | | | | (79,374 | ) |
| | | | | | | | | | | | | | | | |
Total | | $ | (79,374 | ) | | $ | (296,286 | ) | | $ | — | | | $ | (375,660 | ) |
| | | | | | | | | | | | | | | | |
(a) Details of the major categories of the Fund’s investments are reflected within the Portfolio of Investments.
| 74
Notes to Financial Statements – continued
September 30, 2020
Inflation Protected Securities Fund
Asset Valuation Inputs
| | | | | | | | | | | | | | | | |
Description | | Level 1 | | | Level 2 | | | Level 3 | | | Total | |
Bonds and Notes(a) | | $ | — | | | $ | 124,534,438 | | | $ | — | | | $ | 124,534,438 | |
Short-Term Investments | | | — | | | | 3,571,908 | | | | — | | | | 3,571,908 | |
| | | | | | | | | | | | | | | | |
Total | | $ | — | | | $ | 128,106,346 | | | $ | — | | | $ | 128,106,346 | |
| | | | | | | | | | | | | | | | |
(a) Details of the major categories of the Fund’s investments are reflected within the Portfolio of Investments.
Institutional High Income Fund
Asset Valuation Inputs
| | | | | | | | | | | | | | | | |
Description | | Level 1 | | | Level 2 | | | Level 3 | | | Total | |
Bonds and Notes | | | | | | | | | | | | | | | | |
Non-Convertible Bonds | | | | | | | | | | | | | | | | |
Finance Companies | | $ | — | | | $ | 37,103,223 | | | $ | 320,948 | (b) | | $ | 37,424,171 | |
All Other Non-Convertible Bonds(a) | | | — | | | | 346,688,930 | | | | — | | | | 346,688,930 | |
| | | | | | | | | | | | | | | | |
Total Non-Convertible Bonds | | | — | | | | 383,792,153 | | | | 320,948 | | | | 384,113,101 | |
| | | | | | | | | | | | | | | | |
Convertible Bonds | | | | | | | | | | | | | | | | |
Oil Field Services | | | — | | | | — | | | | 2,008,394 | (b) | | | 2,008,394 | |
All Other Convertible Bonds(a) | | | — | | | | 39,051,151 | | | | — | | | | 39,051,151 | |
| | | | | | | | | | | | | | | | |
Total Convertible Bonds | | | — | | | | 39,051,151 | | | | 2,008,394 | | | | 41,059,545 | |
| | | | | | | | | | | | | | | | |
Total Bonds and Notes | | | — | | | | 422,843,304 | | | | 2,329,342 | | | | 425,172,646 | |
| | | | | | | | | | | | | | | | |
Senior Loans(a) | | | — | | | | 2,696 | | | | — | | | | 2,696 | |
Common Stocks | | | | | | | | | | | | | | | | |
Chemicals | | | — | | | | 978,456 | | | | — | | | | 978,456 | |
Oil, Field Services | | | — | | | | — | | | | — | (c) | | | — | |
Oil, Gas & Consumable Fuels | | | 1,580,573 | | | | 83,870 | | | | — | (c) | | | 1,664,443 | |
All Other Common Stocks(a) | | | 70,783,361 | | | | — | | | | — | | | | 70,783,361 | |
| | | | | | | | | | | | | | | | |
Total Common Stocks | | | 72,363,934 | | | | 1,062,326 | | | | — | | | | 73,426,260 | |
| | | | | | | | | | | | | | | | |
Preferred Stocks | | | | | | | | | | | | | | | | |
Convertible Preferred Stocks | | | | | | | | | | | | | | | | |
Energy | | | — | | | | — | | | | — | (c) | | | — | |
Midstream | | | 5,437,200 | | | | — | | | | — | | | | 5,437,200 | |
| | | | | | | | | | | | | | | | |
Total Convertible Preferred Stocks | | | 5,437,200 | | | | — | | | | — | | | | 5,437,200 | |
| | | | | | | | | | | | | | | | |
Non-Convertible Preferred Stocks | | | | | | | | | | | | | | | | |
REITs—Warehouse/Industrials | | | — | | | | 264,500 | | | | — | | | | 264,500 | |
All Other Non-Convertible Preferred Stocks(a) | | | 750,676 | | | | — | | | | — | | | | 750,676 | |
| | | | | | | | | | | | | | | | |
Total Non-Convertible Preferred Stocks | | | 750,676 | | | | 264,500 | | | | — | | | | 1,015,176 | |
| | | | | | | | | | | | | | | | |
Total Preferred Stocks | | | 6,187,876 | | | | 264,500 | | | | — | | | | 6,452,376 | |
| | | | | | | | | | | | | | | | |
Warrants | | | — | | | | 53,172 | | | | — | | | | 53,172 | |
Short-Term Investments | | | — | | | | 6,215,413 | | | | — | | | | 6,215,413 | |
| | | | | | | | | | | | | | | | |
Total | | $ | 78,551,810 | | | $ | 430,441,411 | | | $ | 2,329,342 | | | $ | 511,322,563 | |
| | | | | | | | | | | | | | | | |
(a) Details of the major categories of the Fund’s investments are reflected within the Portfolio of Investments.
(b) Fair valued by the Fund’s adviser.
(c) Includes a security fair valued at zero by the Fund’s adviser using Level 3 inputs
75 |
Notes to Financial Statements – continued
September 30, 2020
Investment Grade Fixed Income Fund
Asset Valuation Inputs
| | | | | | | | | | | | | | | | |
Description | | Level 1 | | | Level 2 | | | Level 3 | | | Total | |
Bonds and Notes | | | | | | | | | | | | | | | | |
Non-Convertible Bonds | | | | | | | | | | | | | | | | |
ABS Home Equity | | $ | — | | | $ | — | | | $ | 9,826 | (b) | | $ | 9,826 | |
ABS Other | | | — | | | | — | | | | 1,149,776 | (c) | | | 1,149,776 | |
All Other Non-Convertible Bonds(a) | | | — | | | | 182,643,572 | | | | — | | | | 182,643,572 | |
| | | | | | | | | | | | | | | | |
Total Non-Convertible Bonds | | | — | | | | 182,643,572 | | | | 1,159,602 | | | | 183,803,174 | |
| | | | | | | | | | | | | | | | |
Convertible Bonds(a) | | | — | | | | 3,727,529 | | | | — | | | | 3,727,529 | |
Municipals(a) | | | — | | | | 1,538,802 | | | | — | | | | 1,538,802 | |
| | | | | | | | | | | | | | | | |
Total Bonds and Notes | | | — | | | | 187,909,903 | | | | 1,159,602 | | | | 189,069,505 | |
| | | | | | | | | | | | | | | | |
Common Stocks(a) | | | 22,115,093 | | | | — | | | | — | | | | 22,115,093 | |
Preferred Stocks | | | | | | | | | | | | | | | | |
Convertible Preferred Stocks | | | | | | | | | | | | | | | | |
Energy | | | — | | | | — | | | | — | (d) | | | — | |
All Other Convertible Preferred Stocks(a) | | | 1,641,211 | | | | — | | | | — | | | | 1,641,211 | |
| | | | | | | | | | | | | | | | |
Total Convertible Preferred Stocks | | | 1,641,211 | | | | — | | | | — | | | | 1,641,211 | |
| | | | | | | | | | | | | | | | |
Non-Convertible Preferred Stocks(a) | | | — | | | | 203,543 | | | | — | | | | 203,543 | |
| | | | | | | | | | | | | | | | |
Total Preferred Stocks | | | 1,641,211 | | | | 203,543 | | | | — | | | | 1,844,754 | |
| | | | | | | | | | | | | | | | |
Short-Term Investments | | | — | | | | 14,727,403 | | | | — | | | | 14,727,403 | |
| | | | | | | | | | | | | | | | |
Total | | $ | 23,756,304 | | | $ | 202,840,849 | | | $ | 1,159,602 | | | $ | 227,756,755 | |
| | | | | | | | | | | | | | | | |
(a) Details of the major categories of the Fund’s investments are reflected within the Portfolio of Investments.
(b) Fair valued by the Fund’s adviser.
(c) Valued using broker-dealer bid prices.
(d) Includes a security fair valued at zero by the Fund’s adviser using Level 3 inputs.
The following is a reconciliation of Level 3 investments for which significant unobservable inputs were used to determine fair value as of September 30, 2019 and/or September 30, 2020:
Fixed Income Fund
Asset Valuation Inputs
| | | | | | | | | | | | | | | | | | | | | | | | | | | | | | | | | | | | | | | | |
Investments in Securities | | Balance as of
September 30,
2019 | | | Accrued
Discounts
(Premiums) | | | Realized
Gain
(Loss) | | | Change in
Unrealized
Appreciation
(Depreciation) | | | Purchases | | | Sales | | | Transfers
into
Level 3 | | | Transfers
out of
Level 3 | | | Balance as of
September 30,
2020 | | | Change in
Unrealized
Appreciation
(Depreciation)
from
Investments
Still Held at
September 30,
2020 | |
Bonds and Notes | | | | | | | | | | | | | | | | | | | | | | | | | | | | | | | | | | | | | | | | |
Non-Convertible Bonds | | | | | | | | | | | | | | | | | | | | | | | | | | | | | | | | | | | | | | | | |
ABS Other | | $ | 1,221,216 | (a) | | $ | — | | | $ | 47 | | | $ | (898,671 | ) | | $ | 98,932 | | | $ | (145,037 | ) | | $ | 583,131 | | | $ | — | | | $ | 859,618 | (a) | | $ | (888,812 | ) |
Finance Companies | | | 146,303 | | | | 148 | | | | — | | | | (50,167 | ) | | | — | | | | — | | | | — | | | | — | | | | 96,284 | | | | (50,167 | ) |
Independent Energy | | | 55,800 | (a) | | | 3,622 | | | | (162,996 | ) | | | 103,574 | | | | — | | | | — | | | | — | | | | — | | | | — | | | | — | |
Common Stocks | | | | | | | | | | | | | | | | | | | | | | | | | | | | | | | | | | | | | | | | |
Oil, Gas & Consumable Fuels | | | 111 | (a) | | | — | | | | (46,880 | ) | | | 46,769 | | | | — | | | | — | | | | — | | | | — | | | | — | (a) | | | (111 | ) |
Preferred Stocks | | | | | | | | | | | | | | | | | | | | | | | | | | | | | | | | | | | | | | | | |
Energy | | | 231,178 | | | | — | | | | — | | | | (1,208,564 | ) | | | — | | | | — | | | | 977,386 | | | | — | | | | — | (a) | | | (1,208,564 | ) |
| | | | | | | | | | | | | | | | | | | | | | | | | | | | | | | | | | | | | | | | |
Total | | $ | 1,654,608 | | | $ | 3,770 | | | $ | (209,829 | ) | | $ | (2,007,059 | ) | | $ | 98,932 | | | $ | (145,037 | ) | | $ | 1,560,517 | | | $ | — | | | $ | 955,902 | | | $ | (2,147,654 | ) |
| | | | | | | | | | | | | | | | | | | | | | | | | | | | | | | | | | | | | | | | |
(a) Includes a security fair valued at zero by the Fund’s adviser using Level 3 inputs.
| 76
Notes to Financial Statements – continued
September 30, 2020
A debt security valued at $583,131 was transferred from Level 2 to Level 3 during the period ended September 30, 2020. At September 30, 2019, this security was valued on the basis of evaluated bids furnished to the Fund by an independent pricing service in accordance with the Fund’s valuation policies. At September 30, 2020, this security was valued using broker-dealer bid prices based on inputs unobservable to the Fund as an independent pricing service did not provide a reliable price for the security.
A preferred stock valued at $438,546 was transferred from Level 1 to Level 3 during the period ended September 30, 2020. At September 30, 2019, this security was valued at the closing bid quotation in accordance with the Fund’s valuation policies. At September 30, 2020, this security was valued at fair value as determined in good faith by the Fund’s adviser as an independent pricing service did not provide a reliable price for the security.
A preferred stock valued at $538,840 was transferred from Level 2 to Level 3 during the period ended September 30, 2020. At September 30, 2019, this security was valued on the basis of evaluated bids furnished to the Fund by an independent pricing service in accordance with the Fund’s valuation policies. At September 30, 2020, this security was valued at fair value as determined in good faith by the Fund’s adviser as an independent pricing service did not provide a reliable price for the security.
Global Bond Fund
Asset Valuation Inputs
| | | | | | | | | | | | | | | | | | | | | | | | | | | | | | | | | | | | | | | | |
Investments in Securities | | Balance as of
September 30,
2019 | | | Accrued
Discounts
(Premiums) | | | Realized
Gain
(Loss) | | | Change in
Unrealized
Appreciation
(Depreciation) | | | Purchases | | | Sales | | | Transfers
into
Level 3 | | | Transfers
out of
Level 3 | | | Balance as of
September 30,
2020 | | | Change in
Unrealized
Appreciation
(Depreciation)
from
Investments
Still Held at
September 30,
2020 | |
Bonds and Notes | | | | | | | | | | | | | | | | | | | | | | | | | | | | | | | | | | | | | | | | |
Canada | | $ | 2,008 | | | $ | — | | | $ | 7 | | | $ | 12 | | | $ | — | | | $ | (2,027 | ) | | $ | — | | | $ | — | | | $ | — | | | $ | — | |
| | | | | | | | | | | | | | | | | | | | | | | | | | | | | | | | | | | | | | | | |
Institutional High Income Fund
Asset Valuation Inputs
| | | | | | | | | | | | | | | | | | | | | | | | | | | | | | | | | | | | | | | | |
Investments in Securities | | Balance as of
September 30,
2019 | | | Accrued
Discounts
(Premiums) | | | Realized
Gain
(Loss) | | | Change in
Unrealized
Appreciation
(Depreciation) | | | Purchases | | | Sales | | | Transfers
into
Level 3 | | | Transfers
out of
Level 3 | | | Balance as of
September 30,
2020 | | | Change in
Unrealized
Appreciation
(Depreciation)
from
Investments
Still Held at
September 30,
2020 | |
Bonds and Notes | | | | | | | | | | | | | | | | | | | | | | | | | | | | | | | | | | | | | | | | |
Non-Convertible Bonds | | | | | | | | | | | | | | | | | | | | | | | | | | | | | | | | | | | | | | | | |
Finance Companies | | $ | 487,678 | | | $ | 483 | | | $ | — | | | $ | (167,213 | ) | | $ | — | | | $ | — | | | $ | — | | | $ | — | | | $ | 320,948 | | | $ | (167,213 | ) |
Independent Energy | | | 1,051,200 | (a) | | | 68,464 | | | | (3,075,780 | ) | | | 1,956,116 | | | | — | | | | — | | | | — | | | | — | | | | — | | | | — | |
Convertible Bonds | | | | | | | | | | | | | | | | | | | | | | | | | | | | | | | | | | | | | | | | |
Oil Field Services | | | — | | | | 12,731 | | | | — | | | | (1,033,337 | ) | | | 3,029,000 | | | | — | | | | — | | | | — | | | | 2,008,394 | | | | (1,033,337 | ) |
Common Stocks | | | | | | | | | | | | | | | | | | | | | | | | | | | | | | | | | | | | | | | | |
Oil Field Services | | | — | | | | — | | | | — | | | | (5,792,979 | ) | | | 5,792,979 | | | | — | | | | — | | | | — | | | | — | (a) | | | (5,792,979 | ) |
Oil, Gas & Consumable Fuels | | | 112 | (a) | | | — | | | | (882,919 | ) | | | 882,807 | | | | — | | | | — | | | | — | | | | — | | | | — | (a) | | | (112 | ) |
Preferred Stocks | | | | | | | | | | | | | | | | | | | | | | | | | | | | | | | | | | | | | | | | |
Convertible Preferred Stocks | | | | | | | | | | | | | | | | | | | | | | | | | | | | | | | | | | | | | | | | |
Energy | | | 2,152,090 | | | | — | | | | — | | | | (2,749,298 | ) | | | — | | | | — | | | | 597,208 | | | | — | | | | — | (a) | | | (2,749,298 | ) |
| | | | | | | | | | | | | | | | | | | | | | | | | | | | | | | | | | | | | | | | |
Total | | $ | 3,691,080 | | | $ | 81,678 | | | $ | (3,958,699 | ) | | $ | (6,903,904 | ) | | $ | 8,821,979 | | | $ | — | | | $ | 597,208 | | | $ | — | | | $ | 2,329,342 | | | $ | (9,742,939 | ) |
| | | | | | | | | | | | | | | | | | | | | | | | | | | | | | | | | | | | | | | | |
(a) Includes securities fair valued at zero by the Fund’s adviser using Level 3 inputs.
A preferred stock valued at $597,208 was transferred from Level 2 to Level 3 during the period ended September 30, 2020. At September 30, 2019, this security was valued on the basis of evaluated bids furnished to the Fund by an independent pricing service in accordance with the Fund’s valuation policies. At September 30, 2020, this security was valued at fair value as determined in good faith by the Fund’s adviser as an independent pricing service did not provide a reliable price for the security.
77 |
Notes to Financial Statements – continued
September 30, 2020
Investment Grade Fixed Income Fund
Asset Valuation Inputs
| | | | | | | | | | | | | | | | | | | | | | | | | | | | | | | | | | | | | | | | |
Investments in Securities | | Balance as of
September 30,
2019 | | | Accrued
Discounts
(Premiums) | | | Realized
Gain
(Loss) | | | Change in
Unrealized
Appreciation
(Depreciation) | | | Purchases | | | Sales | | | Transfers
into
Level 3 | | | Transfers
out of
Level 3 | | | Balance as of
September 30,
2020 | | | Change in
Unrealized
Appreciation
(Depreciation)
from
Investments
Still Held at
September 30,
2020 | |
Bonds and Notes | | | | | | | | | | | | | | | | | | | | | | | | | | | | | | | | | | | | | | | | |
Non-Convertible Bonds | | | | | | | | | | | | | | | | | | | | | | | | | | | | | | | | | | | | | | | | |
ABS Home Equity | | $ | 11,066 | | | $ | — | | | $ | 20 | | | $ | (254 | ) | | $ | — | | | $ | (1,006 | ) | | $ | — | | | $ | — | | | $ | 9,826 | | | $ | (356 | ) |
ABS Other | | | 2,175,944 | | | | — | | | | 179 | | | | (826,382 | ) | | | — | | | | (199,965 | ) | | | — | | | | — | | | | 1,149,776 | | | | (836,200 | ) |
Collateralized Mortgage Obligations | | | 61 | | | | — | | | | (1 | ) | | | 2 | | | | — | | | | (62 | ) | | | — | | | | — | | | | — | | | | — | |
Preferred Stocks | | | | | | | | | | | | | | | | | | | | | | | | | | | | | | | | | | | | | | | | |
Convertible Preferred Stocks | | | | | | | | | | | | | | | | | | | | | | | | | | | | | | | | | | | | | |
Energy | | | — | | | | — | | | | — | | | | (131,214 | ) | | | — | | | | — | | | | 131,214 | | | | — | | | | — | (a) | | | (131,214 | ) |
| | | | | | | | | | | | | | | | | | | | | | | | | | | | | | | | | | | | | | | | |
Total | | $ | 2,187,071 | | | $ | — | | | $ | 198 | | | $ | (957,848 | ) | | $ | — | | | $ | (201,033 | ) | | $ | 131,214 | | | $ | — | | | $ | 1,159,602 | | | $ | (967,770 | ) |
| | | | | | | | | | | | | | | | | | | | | | | | | | | | | | | | | | | | | | | | |
(a) Includes a security fair valued at zero by the Fund’s adviser using Level 3 inputs.
A preferred stock valued at $131,214 was transferred from Level 2 to Level 3 during the period ended September 30, 2020. At September 30, 2019, this security was valued on the basis of evaluated bids furnished to the Fund by an independent pricing service in accordance with the Fund’s valuation policies. At September 30, 2020, this security was valued at fair value as determined in good faith by the Fund’s adviser as an independent pricing service did not provide a reliable price for the security.
4. Derivatives. Derivative instruments are defined as financial instruments whose value and performance are based on the value and performance of an underlying asset, reference rate or index. Derivative instruments that Global Bond Fund and Inflation Protected Securities Fund used during the period include forward foreign currency contracts, futures contracts and option contracts.
Global Bond Fund is subject to the risk that changes in foreign currency exchange rates will have an unfavorable effect on the value of Fund assets denominated in foreign currencies. The Fund may enter into forward foreign currency exchange contracts and option contracts for hedging purposes to protect the value of the Funds’ holdings of foreign securities. The Fund may also use forward foreign currency contracts and option contracts to gain exposure to foreign currencies, regardless of whether securities denominated in such currencies are held in the Fund. During the year ended September 30, 2020, Global Bond Fund engaged in forward foreign currency contracts and option contracts for hedging purposes and to gain exposure to foreign currencies.
Global Bond Fund and Inflation Protected Securities Fund are subject to the risk that changes in interest rates will affect the value of the Funds’ investments in fixed-income securities. A Fund will be subject to increased interest rate risk to the extent that it invests in fixed-income securities with longer maturities or durations, as compared to investing in fixed-income securities with shorter maturities or durations. The Funds may use futures contracts to hedge against changes in interest rates and to manage duration without having to buy or sell portfolio securities. Inflation Protected Securities Fund may use futures contracts to gain investment exposure. During the year ended September 30, 2020, Global Bond Fund and Inflation Protected Securities Fund used futures contracts for hedging purposes and to manage duration.
The following is a summary of derivative instruments for Global Bond Fund as of September 30, 2020, as reflected within the Statements of Assets and Liabilities:
| | | | | | | | | | | | |
Assets | | Investments
at value1 | | | Unrealized
appreciation on
forward foreign
currency contracts | | | Unrealized
appreciation
on futures
contracts2 | |
Over-the-counter asset derivatives | | | | | | | | | | | | |
Foreign exchange contracts | | $ | 37,204 | | | $ | 753,935 | | | $ | — | |
Exchange-traded asset derivatives | |
Interest rate contracts | | $ | — | | | $ | — | | | $ | 213,658 | |
| | | | | | | | | | | | |
Total asset derivatives | | $ | 37,204 | | | $ | 753,935 | | | $ | 213,658 | |
| | | | | | | | | | | | |
| 78
Notes to Financial Statements – continued
September 30, 2020
| | | | | | | | | | | | |
Liabilities | | Options
written
at value | | | Unrealized
depreciation on
forward foreign
currency contracts | | | Unrealized
depreciation
on futures
contracts2 | |
Over-the-counter liability derivatives | | | | | | | | | | | | |
Foreign exchange contracts | | $ | (1,086 | ) | | $ | (295,200 | ) | | $ | — | |
Exchange-traded liability derivatives | |
Interest rate contracts | | $ | — | | | $ | — | | | $ | (79,374 | ) |
| | | | | | | | | | | | |
Total liability derivatives | | $ | (1,086 | ) | | $ | (295,200 | ) | | $ | (79,374 | ) |
| | | | | | | | | | | | |
1 Represents purchased options, at value.
2 Represents cumulative unrealized appreciation (depreciation) on futures contracts. Only the current day’s variation margin on futures contracts is reported within the Statements of Assets and Liabilities as receivable or payable for variation margin, as applicable.
Transactions in derivative instruments for Global Bond Fund during the year ended September 30, 2020, as reflected within the Statements of Operations, were as follows:
| | | | | | | | | | | | | | | | |
Net Realized Gain (Loss) on: | | Forward foreign
currency contracts | | | Futures
contracts | | | | | | | |
Interest rate contracts | | $ | — | | | $ | 4,321,383 | | | | | | | | | |
Foreign exchange contracts | | | 4,107,724 | | | | — | | | | | | | | | |
| | | | | | | | | | | | | | | | |
Total | | $ | 4,107,724 | | | $ | 4,321,383 | | | | | | | | | |
| | | | | | | | | | | | | | | | |
| | | | | | | | | | | | | | | | |
Net Change in Unrealized
Appreciation (Depreciation) on: | | Investments3 | | | Forward foreign
currency contracts | | | Futures
contract | | | Options
written | |
Interest rate contracts | | $ | — | | | $ | — | | | $ | (501,086 | ) | | $ | — | |
Foreign exchange contracts | | | (69,068 | ) | | | 492,206 | | | | — | | | | 31,141 | |
| | | | | | | | | | | | | | | | |
Total | | $ | (69,068 | ) | | $ | 492,206 | | | $ | (501,086 | ) | | $ | 31,141 | |
| | | | | | | | | | | | | | | | |
3 Represents change in unrealized appreciation (depreciation), for purchased options during the period.
Transactions in derivative instruments for Inflation Protected Securities Fund during the year ended September 30, 2020, as reflected within the Statements of Operations, were as follows:
| | | | |
Net Realized Gain (Loss) on: | | Futures
contracts | |
Interest rate contracts | | $ | 18,674 | |
As the Funds value their derivatives at fair value and recognize changes in fair value through the Statements of Operations, they do not qualify for hedge accounting under authoritative guidance for derivative instruments. The Funds’ investments in derivatives may represent an economic hedge; however, they are considered to be non-hedge transactions for the purpose of these disclosures.
The volume of forward foreign currency contract and futures contract activity, as a percentage of net assets for Global Bond Fund and Inflation Protected Securities Fund based on gross month-end or daily (as applicable) notional amounts outstanding during the period, including long and short positions at absolute value, was as follows for the year ended September 30, 2020:
| | | | | | | | |
Global Bond Fund | | Forwards | | | Futures | |
Average Notional Amount Outstanding | | | 22.33% | | | | 21.64% | |
Highest Notional Amount Outstanding | | | 37.10% | | | | 25.99% | |
Lowest Notional Amount Outstanding | | | 14.59% | | | | 16.58% | |
Notional Amount Outstanding as of September 30, 2020 | | | 21.45% | | | | 24.68% | |
| | |
Inflation Protected Securities Fund | | Futures |
Average Notional Amount Outstanding | | 2.10% |
Highest Notional Amount Outstanding | | 8.49% |
Lowest Notional Amount Outstanding | | 0.00% |
Notional Amount Outstanding as of September 30, 2020 | | 0.00% |
Notional amounts outstanding at the end of the prior period, if applicable, are included in the average notional amount outstanding.
79 |
Notes to Financial Statements – continued
September 30, 2020
Unrealized gain and/or loss on open forwards and futures is recorded in the Statements of Assets and Liabilities. The aggregate notional values of forward and futures contracts are not recorded in the Statements of Assets and Liabilities, and therefore are not included in the Funds’ net assets.
The volume of option contract activity, as a percentage of net assets for Global Bond Fund, based on the month-end market values of instruments underlying purchased and written options, at absolute value, was as follows for the year ended September 30, 2020:
| | | | | | | | |
Global Bond Fund | | Call Options
Purchased* | | | Call Options
Written* | |
Average Market Value of Underlying Instruments | | | 0.36% | | | | 0.18% | |
Highest Market Value of Underlying Instruments | | | 2.33% | | | | 1.19% | |
Lowest Market Value of Underlying Instruments | | | 0.00% | | | | 0.00% | |
Market Value of Underlying Instruments as of September 30, 2020 | | | 2.31% | | | | 1.16% | |
| * | Market value of underlying instruments is determined as follows: for currencies by multiplying par value by the strike price and dividing by the foreign currency exchange rate. |
Over-the-counter derivatives, including forward foreign currency contracts and options contracts, are entered into pursuant to International Swaps and Derivatives Association, Inc. (“ISDA”) agreements negotiated between the Funds and their counterparties. ISDA agreements typically contain, among other things, terms for the posting of collateral and master netting provisions in the event of a default or other termination event. Collateral is posted by a Fund or the counterparty to the extent of the net mark-to-market exposure to the other party of all open contracts under the agreement, subject to minimum transfer requirements. Master netting provisions allow the Funds and the counterparty, in the event of a default or other termination event, to offset amounts owed by each related to derivative contracts, including any posted collateral, to one net amount payable by either the Funds or the counterparty. The Funds’ ISDA agreements typically contain provisions that allow a counterparty to terminate open contracts early if the NAV of a Fund declines beyond a certain threshold. For financial reporting purposes, the Funds do not offset derivative assets and liabilities, and any related collateral received or pledged, on the Statements of Assets and Liabilities.
As of September 30, 2020, gross amounts of over-the-counter derivative assets and liabilities not offset in the Statements of Assets and Liabilities and the related net amounts after taking into account master netting arrangements, by counterparty, are as follows:
Global Bond Fund
| | | | | | | | | | | | | | | | | | | | |
Counterparty | | Gross Amounts of
Assets | | | Offset
Amount | | | Net Asset
Balance | | | Collateral
(Received)/
Pledged | | | Net
Amount | |
Bank of America, N.A. | | $ | 59,934 | | | $ | — | | | $ | 59,934 | | | $ | — | | | $ | 59,934 | |
BNP Paribas S.A | | | 5,199 | | | | — | | | | 5,199 | | | | — | | | | 5,199 | |
Citibank N.A. | | | 20,093 | | | | — | | | | 20,093 | | | | (20,093 | ) | | | — | |
Credit Suisse International | | | 360,306 | | | | (31,854 | ) | | | 328,452 | | | | (230,000 | ) | | | 98,452 | |
HSBC Bank USA | | | 246,926 | | | | (52,804 | ) | | | 194,122 | | | | (194,122 | ) | | | — | |
Morgan Stanley Capital | | | | | | | | | | | | | | | | | | | | |
Services, Inc. | | | 77,638 | | | | — | | | | 77,638 | | | | — | | | | 77,638 | |
UBS AG | | | 21,043 | | | | (6,800 | ) | | | 14,243 | | | | — | | | | 14,243 | |
| | | | | | | | | | | | | | | | | | | | |
| | $ | 791,139 | | | $ | (91,458 | ) | | $ | 699,681 | | | $ | (444,215 | ) | | $ | 255,466 | |
| | | | | | | | | | | | | | | | | | | | |
| | | | | |
Counterparty | | Gross Amounts of
Liabilities | | | Offset
Amount | | | Net Liability
Balance | | | Collateral
(Received)/
Pledged | | | Net
Amount | |
Credit Suisse International | | $ | (31,854 | ) | | $ | 31,854 | | | $ | — | | | $ | — | | | $ | — | |
HSBC Bank USA | | | (52,804 | ) | | | 52,804 | | | | — | | | | — | | | | — | |
Standard Chartered Bank | | | (204,828 | ) | | | — | | | | (204,828 | ) | | | — | | | | (204,828 | ) |
UBS AG | | | (6,800 | ) | | | 6,800 | | | | — | | | | — | | | | — | |
| | | | | | | | | | | | | | | | | | | | |
| | $ | (296,286 | ) | | $ | 91,458 | | | $ | (204,828 | ) | | $ | — | | | $ | (204,828 | ) |
| | | | | | | | | | | | | | | | | | | | |
The actual collateral received or pledged, if any, may exceed the amounts shown in the table due to overcollateralization. Timing differences may exist between when contracts under the ISDA agreements are marked-to-market and when collateral moves. The ISDA agreements include tri-party control agreements under which collateral is held for the benefit of the secured party at a third party custodian, State Street Bank.
Counterparty risk is managed based on policies and procedures established by each Fund’s adviser. Such policies and procedures may include, but are not limited to, minimum counterparty credit rating requirements, monitoring of counterparty credit default swap spreads and posting
| 80
Notes to Financial Statements – continued
September 30, 2020
of collateral. A Fund’s risk of loss from counterparty credit risk on over-the-counter derivatives is generally limited to the Fund’s aggregated unrealized gains and the amount of any collateral pledged to the counterparty, which may be offset by any collateral posted to the Fund by the counterparty. ISDA master agreements can help to manage counterparty risk by specifying collateral posting arrangements at pre-arranged exposure levels. Under these ISDA agreements, collateral is routinely transferred if the total net exposure in respect of certain transactions, net of existing collateral already in place, exceeds a specified amount (typically $250,000, depending on the counterparty). With exchange-traded derivatives, there is minimal counterparty credit risk to the Fund because the exchange’s clearing house, as counterparty to these instruments, stands between the buyer and the seller of the contract. Credit risk still exists in exchange-traded derivatives with respect to initial and variation margin that is held in a broker’s customer accounts. While brokers are required to segregate customer margin from their own assets, in the event that a broker becomes insolvent or goes into bankruptcy and at that time there is a shortfall in the aggregate amount of margin held by the broker for all its clients, U.S. bankruptcy laws will typically allocate that shortfall on a pro rata basis across all of the broker’s customers, potentially resulting in losses to the Fund. Based on balances reflected on each Fund’s Statement of Assets and Liabilities, the following table shows (i) the maximum amount of loss due to credit risk that, based on the gross fair value of the financial instrument, the Fund would incur if parties (including OTC derivative counterparties and brokers holding margin for exchange-traded derivatives) to the relevant financial instruments failed completely to perform according to the terms of the contracts and the collateral or other security, if any, for the amount due proved to be of no value to the Fund, and (ii) the amount of loss that the Fund would incur after taking into account master netting provisions pursuant to ISDA agreements, as of September 30, 2020:
| | | | | | | | |
Fund | | Maximum Amount
of Loss – Gross | | | Maximum Amount
of Loss – Net | |
Global Bond Fund | | $ | 7,679,326 | | | $ | 7,143,653 | |
Inflation Protected Securities Fund | | | 143,000 | | | | 143,000 | |
Net loss amount reflects cash received as collateral for Global Bond Fund of $630,000, which is recorded on the Statements of Assets and Liabilities.
5. Purchases and Sales of Securities. For the year ended September 30, 2020, purchases and sales of securities (excluding short-term investments and including paydowns) were as follows:
| | | | | | | | | | | | | | | | |
| | | U.S. Government/Agency
Securities | | | Other Securities | |
Fund | | Purchases | | | Sales | | | Purchases | | | Sales | |
Fixed Income Fund | | $ | 111,757,284 | | | $ | 68,363,018 | | | $ | 77,625,012 | | | $ | 163,789,684 | |
Global Bond Fund | | | 1,376,653,110 | | | | 1,407,532,928 | | | | 500,799,591 | | | | 601,417,728 | |
Inflation Protected Securities Fund | | | 106,569,461 | | | | 29,390,349 | | | | 30,415,554 | | | | 14,917,931 | |
Institutional High Income Fund | | | 56,719,282 | | | | 30,954,972 | | | | 104,729,431 | | | | 90,772,552 | |
Investment Grade Fixed Income Fund | | | 64,754,999 | | | | 18,977,544 | | | | 16,937,973 | | | | 41,207,106 | |
6. Management Fees and Other Transactions with Affiliates.
a. Management Fees. Loomis, Sayles & Company, L.P. (“Loomis Sayles”) serves as investment adviser to each Fund. Loomis Sayles is a limited partnership whose sole general partner, Loomis, Sayles & Company, Inc., is indirectly owned by Natixis Investment Managers, LLC (“Natixis”), which is part of Natixis Investment Managers, an international asset management group based in Paris, France.
Under the terms of the management agreements, each Fund pays a management fee at the following annual rates, calculated daily and payable monthly, based on each Fund’s average daily net assets:
| | | | | | | | | | | | | | | | | | | | |
| | | Percentage of Average Daily Net Assets | |
Fund | | First
$1 Billion | | | Next
$1 Billion | | | Next
$3 Billion | | | Next
$5 Billion | | | Over
$10 Billion | |
Fixed Income Fund | | | 0.50% | | | | 0.50% | | | | 0.50% | | | | 0.50% | | | | 0.50% | |
Global Bond Fund | | | 0.55% | | | | 0.50% | | | | 0.48% | | | | 0.45% | | | | 0.40% | |
Inflation Protected Securities Fund | | | 0.25% | | | | 0.25% | | | | 0.25% | | | | 0.25% | | | | 0.25% | |
Institutional High Income Fund | | | 0.60% | | | | 0.60% | | | | 0.60% | | | | 0.60% | | | | 0.60% | |
Investment Grade Fixed Income Fund | | | 0.40% | | | | 0.40% | | | | 0.40% | | | | 0.40% | | | | 0.40% | |
Loomis Sayles has given binding undertakings to the Funds to waive management fees and/or reimburse certain expenses to limit the Funds’ operating expenses, exclusive of acquired fund fees and expenses, brokerage expenses, interest expense, taxes, organizational and extraordinary expenses such as litigation and indemnification expenses. These undertakings are in effect until January 31, 2021, may be terminated before then only with the consent of the Funds’ Board of Trustees, and are reevaluated on an annual basis. Management fees payable, as reflected on the Statements of Assets and Liabilities, are net of waivers and/or expense reimbursements, if any, pursuant to these undertakings. Waivers/reimbursements that exceed management fees payable are reflected on the Statements of Assets and Liabilities as receivable from investment adviser.
81 |
Notes to Financial Statements – continued
September 30, 2020
For the year ended September 30, 2020, the expense limits as a percentage of average daily net assets under the expense limitation agreements were as follows:
| | | | | | | | | | | | |
| | | Expense Limit as a Percentage of
Average Daily Net Assets | |
Fund | | Institutional
Class | | | Retail
Class | | | Class N | |
Fixed Income Fund | | | 0.65% | | | | — | | | | — | |
Global Bond Fund | | | 0.69% | | | | 0.94% | | | | 0.64% | |
Inflation Protected Securities Fund | | | 0.40% | | | | 0.65% | | | | 0.35% | |
Institutional High Income Fund | | | 0.75% | | | | — | | | | — | |
Investment Grade Fixed Income Fund | | | 0.55% | | | | — | | | | — | |
Loomis Sayles shall be permitted to recover expenses borne under the expense limitation agreements (whether through waiver of management fees or otherwise) on a class by class basis in later periods to the extent the annual operating expenses of a class fall below a class’ expense limits, provided, however, that a class is not obligated to pay such waived/reimbursed fees or expenses more than one year after the end of the fiscal year in which the fees or expenses were waived/reimbursed.
For the year ended September 30, 2020, the management fees and waivers of management fees for each Fund were as follows:
| | | | | | | | | | | | | | | | | | | | |
Fund | | Gross
Management
Fees | | | Contractual
Waivers of
Management
Fees1 | | | Net
Management
Fees | | | Percentage of
Average Daily
Net Assets | |
| | Gross | | | Net | |
Fixed Income Fund | | $ | 3,585,115 | | | $ | — | | | $ | 3,585,115 | | | | 0.50% | | | | 0.50% | |
Global Bond Fund | | | 3,882,400 | | | | 369,601 | | | | 3,512,799 | | | | 0.55% | | | | 0.50% | |
Inflation Protected Securities Fund | | | 131,076 | | | | 131,076 | | | | — | | | | 0.25% | | | | —% | |
Institutional High Income Fund | | | 3,201,401 | | | | — | | | | 3,201,401 | | | | 0.60% | | | | 0.60% | |
Investment Grade Fixed Income Fund | | | 1,020,718 | | | | — | | | | 1,020,718 | | | | 0.40% | | | | 0.40% | |
1 Management fee waiver is subject to possible recovery until September 30, 2021.
Loomis Sayles reimbursed non-class specific expenses of Inflation Protected Securities Fund in the amount of $26,324. Expense reimbursements are subject to possible recovery until September 30, 2021.
No expenses were recovered for any of the Funds during the year ended September 30, 2020 under the terms of the expense limitation agreements.
b. Distribution Fees. Natixis Distribution, L.P. (“Natixis Distribution”), which is a wholly-owned subsidiary of Natixis, has entered into a distribution agreement with the Trust. Pursuant to this agreement, Natixis Distribution serves as principal underwriter of the Funds of the Trust.
Pursuant to Rule 12b-1 under the 1940 Act, Global Bond Fund and Inflation Protected Securities Fund have adopted a Distribution Plan relating to each Fund’s Retail Class shares (the “Retail Class Plans”).
Under the Retail Class Plans, each Fund pays Natixis Distribution a monthly distribution fee at an annual rate not to exceed 0.25% of the average daily net assets attributable to the Fund’s Retail Class shares, as compensation for services provided by Natixis Distribution in connection with the marketing or sale of Retail Class shares or for payments made by Natixis Distribution to securities dealers or other financial intermediaries as commissions, asset-based sales charges or other compensation with respect to the sale of Retail Class shares, or for providing personal services to investors and/or the maintenance of shareholder accounts.
For the year ended September 30, 2020, the distribution fees for each Fund were as follows:
| | | | |
Fund | | Retail Class | |
Global Bond Fund | | $ | 470,965 | |
Inflation Protected Securities Fund | | | 8,984 | |
c. Administrative Fees. Natixis Advisors, L.P. (“Natixis Advisors”) provides certain administrative services for the Funds and contracts with State Street Bank to serve as sub-administrator. Natixis Advisors is a wholly-owned subsidiary of Natixis. Pursuant to an agreement among Natixis Funds Trusts, Loomis Sayles Funds Trusts, Natixis ETF Trusts and Natixis Advisors, each Fund pays Natixis Advisors monthly its pro rata portion of fees equal to an annual rate of 0.0540% of the first $15 billion of the average daily net assets of the Natixis Funds Trusts, Loomis Sayles Funds Trusts and Natixis ETF Trusts, 0.0500% of the next $15 billion, 0.0400% of the next $30 billion, 0.0275% of the next
| 82
Notes to Financial Statements – continued
September 30, 2020
$30 billion and 0.0225% of such assets in excess of $90 billion, subject to an annual aggregate minimum fee for the Natixis Funds Trusts, Loomis Sayles Funds Trusts and Natixis ETF Trusts of $10 million, which is reevaluated on an annual basis.
For the year ended September 30, 2020, the administrative fees for each Fund were as follows:
| | | | |
Fund | | Administrative Fees | |
Fixed Income Fund | | $ | 316,698 | |
Global Bond Fund | | | 311,890 | |
Inflation Protected Securities Fund | | | 23,181 | |
Institutional High Income Fund | | | 235,670 | |
Investment Grade Fixed Income Fund | | | 112,717 | |
d. Sub-Transfer Agent Fees. Natixis Distribution has entered into agreements, which include servicing agreements, with financial intermediaries that provide recordkeeping, processing, shareholder communications and other services to customers of the intermediaries that hold positions in the Funds and has agreed to compensate the intermediaries for providing those services. Intermediaries transact with the Funds primarily through the use of omnibus accounts on behalf of their customers who hold positions in the Funds. These services would have been provided by the Funds’ transfer agent and other service providers if the shareholders’ accounts were maintained directly at the Funds’ transfer agent. Accordingly, the Funds have agreed to reimburse Natixis Distribution for all or a portion of the servicing fees paid to these intermediaries. The reimbursement amounts (sub-transfer agent fees) paid to Natixis Distribution are subject to a current per-account equivalent fee limit approved by the Funds’ Board of Trustees, which is based on fees for similar services paid to the Funds’ transfer agent and other service providers. Class N shares do not bear such expenses.
For the year ended September 30, 2020, the sub-transfer agent fees (which are reflected in transfer agent fees and expenses in the Statements of Operations) for each Fund were as follows:
| | | | |
Fund | | Sub-Transfer
Agent Fees | |
Global Bond Fund | | $ | 472,715 | |
Inflation Protected Securities Fund | | | 32,893 | |
Institutional High Income Fund | | | 5,723 | |
As of September 30, 2020, the Funds owe Natixis Distribution the following reimbursements for sub-transfer agent fees (which are reflected in the Statements of Assets and Liabilities as payable to distributor):
| | | | |
Fund | | Reimbursements of
Sub-Transfer Agent Fees | |
Global Bond Fund | | $ | 5,677 | |
Inflation Protected Securities Fund | | | 1,036 | |
Institutional High Income Fund | | | 68 | |
Sub-transfer agent fees attributable to Institutional Class and Retail Class are allocated on a pro rata basis to each class based on the relative net assets of each class to the total net assets of those classes.
e. Trustees Fees and Expenses. The Trust does not pay any compensation directly to its officers or Trustees who are directors, officers or employees of Natixis Advisors, Natixis Distribution, Natixis or their affiliates. The Chairperson of the Board of Trustees receives a retainer fee at the annual rate of $369,000. The Chairperson does not receive any meeting attendance fees for Board of Trustees meetings or committee meetings that he attends. Each Independent Trustee (other than the Chairperson) receives, in the aggregate, a retainer fee at the annual rate of $199,000. Each Independent Trustee also receives a meeting attendance fee of $10,000 for each meeting of the Board of Trustees that he or she attends in person and $5,000 for each meeting of the Board of Trustees that he or she attends telephonically. In addition, the chairperson of the Contract Review Committee, the chairperson of the Audit Committee and the chairperson of the Governance Committee each receive an additional retainer fee at the annual rate of $20,000. Each Contract Review Committee member is compensated $6,000 for each Committee meeting that he or she attends in person and $3,000 for each meeting that he or she attends telephonically. Each Audit Committee member is compensated $6,000 for each Committee meeting that he or she attends in person and $3,000 for each meeting that he or she attends telephonically. These fees are allocated among the funds in the Natixis Funds Trusts, Loomis Sayles Funds Trusts and Natixis ETF Trusts based on a formula that takes into account, among other factors, the relative net assets of each fund. Trustees are reimbursed for travel expenses in connection with attendance at meetings.
Prior to January 1, 2020, the Chairperson of the Board received a retainer fee at the annual rate of $360,000 and each Independent Trustee (other than the Chairperson) received, in the aggregate, a retainer fee at the annual rate of $190,000, and the chairperson of the Governance Committee received an additional retainer fee at the annual rate of $15,000. All other Trustee fees remained unchanged.
83 |
Notes to Financial Statements – continued
September 30, 2020
A deferred compensation plan (the “Plan”) is available to the Trustees on a voluntary basis. Deferred amounts remain in the Funds until distributed in accordance with the provisions of the Plan. The value of a participating Trustee’s deferral account is based on theoretical investments of deferred amounts, on the normal payment dates, in certain funds of the Natixis Funds Trusts, Loomis Sayles Funds Trusts and Natixis ETF Trusts as designated by the participating Trustees. Changes in the value of participants’ deferral accounts are allocated pro rata among the funds in the Natixis Funds Trusts, Loomis Sayles Funds Trusts and Natixis ETF Trusts, and are normally reflected as Trustees’ fees and expenses in the Statements of Operations. The portions of the accrued obligations allocated to the Funds under the Plan are reflected as Deferred Trustees’ fees in the Statements of Assets and Liabilities.
Certain officers and employees of Natixis Advisors and Loomis Sayles are also officers and/or Trustees of the Trust.
f. Affiliated Ownership. As of September 30, 2020, the percentage of each Fund’s net assets owned by affiliates is as follows:
| | | | |
Inflation Protected Securities Fund | | Percentage of
Net Assets | |
Loomis Sayles Employees’ Profit Sharing Retirement Plan | | | 5.10% | |
Loomis Sayles Trust | | | 2.62% | |
Natixis Sustainable Future 2015 Fund | | | 0.72% | |
Natixis Sustainable Future 2020 Fund | | | 0.34% | |
Natixis Sustainable Future 2025 Fund | | | 0.27% | |
Natixis Sustainable Future 2030 Fund | | | 0.27% | |
Natixis Sustainable Future 2035 Fund | | | 0.21% | |
Natixis Sustainable Future 2040 Fund | | | 0.14% | |
Natixis Sustainable Future 2045 Fund | | | 0.05% | |
| | | | |
| | | 9.72% | |
| | | | |
Institutional High Income Fund | | Percentage of
Net Assets | |
Loomis Sayles Employees’ Profit Sharing Retirement Plan | | | 3.92% | |
Loomis Sayles Non-Qualified Retirement Plans | | | 4.22% | |
Loomis Sayles Employees | | | 12.19% | |
| | | | |
| | | 20.33% | |
Investment activities of affiliated shareholders could have material impacts on the Funds.
g. Reimbursement of Transfer Agent Fees and Expenses. Natixis Advisors has given a binding contractual undertaking to Inflation Protected Securities Fund to reimburse any and all transfer agency expenses for the Funds’ Class N shares. This undertaking is in effect through January 31, 2021 and is not subject to recovery under the expense limitation agreement described above.
For the year ended September 30, 2020, Natixis Advisors reimbursed the Fund $1,421 for transfer agency expenses related to Class N shares.
h. Payment by Affiliates. For the year ended September 30, 2020, Loomis Sayles reimbursed Global Bond Fund $26,309 in connection with a trading error.
7. Class-Specific Transfer Agent Fees and Expenses. Transfer agent fees and expenses for Global Bond Fund and Inflation Protected Securities Fund attributable to Institutional Class and Retail Class are allocated on a pro rata basis to each class based on the relative net assets of each class to the total net assets of those classes. Transfer agent fees and expenses attributable to Class N are allocated to Class N.
All other Funds in this report allocate transfer agent fees and expenses on a pro rata basis based on the relative net assets of each class to the total net assets of those classes.
For the year ended September 30, 2020, Global Bond Fund and Inflation Protected Securities Fund incurred the following class-specific transfer agent fees and expenses (including sub-transfer agent fees, where applicable):
| | | | | | | | | | | | |
| | | Transfer Agent Fees and Expenses | |
Fund | | Institutional
Class | | | Retail
Class | | | Class N | |
Global Bond Fund | | $ | 328,934 | | | $ | 178,316 | | | $ | 2,840 | |
Inflation Protected Securities Fund | | | 35,566 | | | | 2,652 | | | | 1,421 | |
8. Line of Credit. Each Fund, together with certain other funds of Natixis Funds Trusts, Loomis Sayles Funds Trusts and Natixis ETF Trusts, entered into a $400,000,000 committed unsecured line of credit provided by State Street Bank. Any one Fund may borrow up to $350,000,000 under the line of credit agreement (as long as all borrowings by all Funds in the aggregate do not exceed the $400,000,000 limit at any time), subject to each Fund’s investment restrictions and its contractual obligations under the line of credit. Interest is charged to
| 84
Notes to Financial Statements – continued
September 30, 2020
the Funds based upon the terms set forth in the agreement. In addition, a commitment fee of 0.15% per annum, payable at the end of each calendar quarter, is accrued and apportioned among the participating funds based on their average daily unused portion of the line of credit. The Funds paid an arrangement fee, an upfront fee, and certain other legal fees in connection with the line of credit agreement, which are being amortized over a period of 364 days and are reflected in legal fees and/or miscellaneous expenses on the Statements of Operations. The unamortized balance is reflected as prepaid expenses on the Statements of Assets and Liabilities.
For the year ended September 30, 2020, none of the Funds had borrowings under this agreement.
9. Risk. Certain Funds’ investments in foreign securities may be subject to greater political, economic, environmental, credit/counterparty and information risks. The Funds’ investments in foreign securities also are subject to foreign currency fluctuations and other foreign currency-related risks. Foreign securities may be subject to higher volatility than U.S. securities, varying degrees of regulation and limited liquidity.
Global markets have experienced periods of high volatility triggered by the ongoing public health emergency known as coronavirus (“Covid-19”). As the situation continues, the extent and duration of the impact that the Covid-19 outbreak may have on financial markets and the economy as a whole remains highly uncertain. If the effects of the Covid-19 outbreak on financial markets and the economy continue for an extended period of time, the Funds’ future financial and investment results may be adversely affected.
10. Concentration of Ownership. From time to time, a Fund may have a concentration of one or more accounts constituting a significant percentage of shares outstanding. Investment activities by holders of such accounts could have material impacts on the Funds. As of September 30, 2020, based on management’s evaluation of the shareholder account base, the Funds had accounts representing controlling ownership of more than 5% of the Fund’s total outstanding shares. The number of such accounts, based on accounts that represent more than 5% of an individual class of shares, and the aggregate percentage of net assets represented by such holdings were as follows:
| | | | | | | | | | | | | | | | |
Fund | | Number of 5%
Non- Affiliated
Account Holders | | | Percentage of
Non- Affiliated
Ownership | | | Percentage of
Affiliated Ownership
(Note 6f) | | | Total
Percentage of
Ownership | |
Fixed Income Fund | | | 5 | | | | 44.25% | | | | — | | | | 44.25% | |
Global Bond Fund | | | 1 | | | | 6.17% | | | | — | | | | 6.17% | |
Inflation Protected Securities Fund | | | 6 | | | | 54.35% | | | | 9.72% | | | | 64.07% | |
Institutional High Income Fund | | | 2 | | | | 33.84% | | | | 20.33% | | | | 54.17% | |
Investment Grade Fixed Income Fund | | | 8 | | | | 64.16% | | | | — | | | | 64.16% | |
Omnibus shareholder accounts for which Natixis Advisors understands that the intermediary has discretion over the underlying shareholder accounts or investment models where a shareholder account may be invested for a non-discretionary customer are included in the table above. For other omnibus accounts, the Funds do not have information on the individual shareholder accounts underlying the omnibus accounts; therefore, there could be other 5% shareholders in addition to those disclosed in the table above.
11. Capital Shares. Each Fund may issue an unlimited number of shares of beneficial interest, without par value. Transactions in capital shares were as follows:
| | | | | | | | | | | | | | | | |
| | | Fixed Income Fund | |
| | |
| | | Year Ended September 30, 2020 | | | Year Ended September 30, 2019 | |
| | | | |
| Institutional Class | | Shares | | | Amount | | | Shares | | | Amount | |
Issued from the sale of shares | | | 7,020,185 | | | $ | 89,016,804 | | | | 3,176,253 | | | $ | 41,541,043 | |
Issued in connection with the reinvestment of distributions | | | 2,287,100 | | | | 30,326,949 | | | | 3,432,838 | | | | 42,326,890 | |
Redeemed | | | (18,814,579 | ) | | | (247,187,930 | ) | | | (13,399,912 | ) | | | (174,232,222 | ) |
| | | | | | | | | | | | | | | | |
Net change | | | (9,507,294 | ) | | $ | (127,844,177 | ) | | | (6,790,821 | ) | | $ | (90,364,289 | ) |
| | | | | | | | | | | | | | | | |
Decrease from capital share transactions | | | (9,507,294 | ) | | $ | (127,844,177 | ) | | | (6,790,821 | ) | | $ | (90,364,289 | ) |
| | | | | | | | | | | | | | | | |
85 |
Notes to Financial Statements – continued
September 30, 2020
| | | | | | | | | | | | | | | | |
| | | Global Bond Fund | |
| | |
| | | Year Ended September 30, 2020 | | | Year Ended September 30, 2019 | |
| | | | |
| Institutional Class | | Shares | | | Amount | | | Shares | | | Amount | |
Issued from the sale of shares | | | 5,555,213 | | | $ | 98,607,712 | | | | 3,226,387 | | | $ | 52,953,887 | |
Issued in connection with the reinvestment of distributions | | | 210,661 | | | | 3,568,605 | | | | 149,219 | | | | 2,377,054 | |
Redeemed | | | (6,015,735 | ) | | | (104,179,498 | ) | | | (10,504,657 | ) | | | (171,704,843 | ) |
| | | | | | | | | | | | | | | | |
Net change | | | (249,861 | ) | | $ | (2,003,181 | ) | | | (7,129,051 | ) | | $ | (116,373,902 | ) |
| | | | | | | | | | | | | | | | |
|
| Retail Class | |
Issued from the sale of shares | | | 1,635,100 | | | $ | 28,315,669 | | | | 1,121,678 | | | $ | 18,246,576 | |
Issued in connection with the reinvestment of distributions | | | 98,162 | | | | 1,635,375 | | | | 52,412 | | | | 821,302 | |
Redeemed | | | (4,162,003 | ) | | | (71,128,394 | ) | | | (4,382,868 | ) | | | (70,560,176 | ) |
| | | | | | | | | | | | | | | | |
Net change | | | (2,428,741 | ) | | $ | (41,177,350 | ) | | | (3,208,778 | ) | | $ | (51,492,298 | ) |
| | | | | | | | | | | | | | | | |
|
| Class N | |
Issued from the sale of shares | | | 3,194,087 | | | $ | 56,906,307 | | | | 2,749,713 | | | $ | 45,412,287 | |
Issued in connection with the reinvestment of distributions | | | 115,413 | | | | 1,959,710 | | | | 114,580 | | | | 1,829,843 | |
Redeemed | | | (9,144,235 | ) | | | (156,731,097 | ) | | | (5,536,193 | ) | | | (91,413,779 | ) |
| | | | | | | | | | | | | | | | |
Net change | | | (5,834,735 | ) | | $ | (97,865,080 | ) | | | (2,671,900 | ) | | $ | (44,171,649 | ) |
| | | | | | | | | | | | | | | | |
Decrease from capital share transactions | | | (8,513,337 | ) | | $ | (141,045,611 | ) | | | (13,009,729 | ) | | $ | (212,037,849 | ) |
| | | | | | | | | | | | | | | | |
| |
| | | Inflation Protected Securities Fund | |
| | |
| | | Year Ended September 30, 2020 | | | Year Ended September 30, 2019 | |
| | | | |
| Institutional Class | | Shares | | | Amount | | | Shares | | | Amount | |
Issued from the sale of shares | | | 9,022,178 | | | $ | 103,538,509 | | | | 460,302 | | | $ | 4,704,593 | |
Issued in connection with the reinvestment of distributions | | | 45,669 | | | | 521,720 | | | | 48,376 | | | | 502,779 | |
Redeemed | | | (1,449,225 | ) | | | (16,384,767 | ) | | | (794,259 | ) | | | (8,132,100 | ) |
| | | | | | | | | | | | | | | | |
Net change | | | 7,618,622 | | | $ | 87,675,462 | | | | (285,581 | ) | | $ | (2,924,728 | ) |
| | | | | | | | | | | | | | | | |
|
| Retail Class | |
Issued from the sale of shares | | | 1,085,988 | | | $ | 12,070,759 | | | | 35,398 | | | $ | 364,690 | |
Issued in connection with the reinvestment of distributions | | | 3,540 | | | | 39,438 | | | | 1,664 | | | | 17,313 | |
Redeemed | | | (527,901 | ) | | | (5,682,597 | ) | | | (30,929 | ) | | | (313,268 | ) |
| | | | | | | | | | | | | | | | |
Net change | | | 561,627 | | | $ | 6,427,600 | | | | 6,133 | | | $ | 68,735 | |
| | | | | | | | | | | | | | | | |
|
| Class N | |
Issued from the sale of shares | | | 181,985 | | | $ | 2,024,376 | | | | 97,933 | | | $ | 1,010,452 | |
Issued in connection with the reinvestment of distributions | | | 2,074 | | | | 23,179 | | | | 3,401 | | | | 35,387 | |
Redeemed | | | (72,853 | ) | | | (810,946 | ) | | | (101,642 | ) | | | (1,046,710 | ) |
| | | | | | | | | | | | | | | | |
Net change | | | 111,206 | | | $ | 1,236,609 | | | | (308 | ) | | $ | (871 | ) |
| | | | | | | | | | | | | | | | |
Increase (decrease) from capital share transactions | | | 8,291,455 | | | $ | 95,339,671 | | | | (279,756 | ) | | $ | (2,856,864 | ) |
| | | | | | | | | | | | | | | | |
| 86
Notes to Financial Statements – continued
September 30, 2020
| | | | | | | | | | | | | | | | |
| | | Institutional High Income Fund | |
| | |
| | | Year Ended September 30, 2020 | | | Year Ended September 30, 2019 | |
| | | | |
| Institutional Class | | Shares | | | Amount | | | Shares | | | Amount | |
Issued from the sale of shares | | | 9,292,795 | | | $ | 54,082,337 | | | | 8,868,671 | | | $ | 58,735,035 | |
Issued in connection with the reinvestment of distributions | | | 5,480,189 | | | | 33,922,368 | | | | 7,226,648 | | | | 44,516,153 | |
Redeemed | | | (17,398,541 | ) | | | (104,435,826 | ) | | | (24,694,958 | ) | | | (158,695,796 | ) |
| | | | | | | | | | | | | | | | |
Net change | | | (2,625,557 | ) | | $ | (16,431,121 | ) | | | (8,599,639 | ) | | $ | (55,444,608 | ) |
| | | | | | | | | | | | | | | | |
Decrease from capital share transactions | | | (2,625,557 | ) | | $ | (16,431,121 | ) | | | (8,599,639 | ) | | $ | (55,444,608 | ) |
| | | | | | | | | | | | | | | | |
| |
| | | Investment Grade Fixed Income Fund | |
| | |
| | | Year Ended September 30, 2020 | | | Year Ended September 30, 2019 | |
| | | | |
| Institutional Class | | Shares | | | Amount | | | Shares | | | Amount | |
Issued from the sale of shares | | | 2,019,833 | | | $ | 25,209,066 | | | | 3,715,904 | | | $ | 44,596,334 | |
Issued in connection with the reinvestment of distributions | | | 586,707 | | | | 7,179,359 | | | | 744,228 | | | | 8,846,688 | |
Redeemed | | | (7,736,662 | ) | | | (93,509,476 | ) | | | (3,321,935 | ) | | | (39,589,135 | ) |
| | | | | | | | | | | | | | | | |
Net change | | | (5,130,122 | ) | | $ | (61,121,051 | ) | | | 1,138,197 | | | $ | 13,853,887 | |
| | | | | | | | | | | | | | | | |
Increase (decrease) from capital share transactions | | | (5,130,122 | ) | | $ | (61,121,051 | ) | | | 1,138,197 | | | $ | 13,853,887 | |
| | | | | | | | | | | | | | | | |
87 |
Report of Independent Registered Public Accounting Firm
To the Board of Trustees of Loomis Sayles Funds I and Shareholders of Loomis Sayles Fixed Income Fund, Loomis Sayles Global Bond Fund, Loomis Sayles Inflation Protected Securities Fund, Loomis Sayles Institutional High Income Fund and Loomis Sayles Investment Grade Fixed Income Fund:
Opinions on the Financial Statements
We have audited the accompanying statements of assets and liabilities, including the portfolios of investments, of Loomis Sayles Fixed Income Fund, Loomis Sayles Global Bond Fund, Loomis Sayles Inflation Protected Securities Fund, Loomis Sayles Institutional High Income Fund and Loomis Sayles Investment Grade Fixed Income Fund (five of the funds constituting Loomis Sayles Funds I, hereafter collectively referred to as the “Funds”) as of September 30, 2020, the related statements of operations for the year ended September 30, 2020, the statements of changes in net assets for each of the two years in the period ended September 30, 2020, including the related notes, and the financial highlights for each of the periods indicated therein (collectively referred to as the “financial statements”). In our opinion, the financial statements present fairly, in all material respects, the financial position of each of the Funds as of September 30, 2020, the results of each of their operations for the year then ended, the changes in each of their net assets for each of the two years in the period ended September 30, 2020 and each of the financial highlights for each of the periods indicated therein in conformity with accounting principles generally accepted in the United States of America.
Basis for Opinions
These financial statements are the responsibility of the Funds’ management. Our responsibility is to express an opinion on the Funds’ financial statements based on our audits. We are a public accounting firm registered with the Public Company Accounting Oversight Board (United States) (PCAOB) and are required to be independent with respect to the Funds in accordance with the U.S. federal securities laws and the applicable rules and regulations of the Securities and Exchange Commission and the PCAOB.
We conducted our audits of these financial statements in accordance with the standards of the PCAOB. Those standards require that we plan and perform the audit to obtain reasonable assurance about whether the financial statements are free of material misstatement, whether due to error or fraud.
Our audits included performing procedures to assess the risks of material misstatement of the financial statements, whether due to error or fraud, and performing procedures that respond to those risks. Such procedures included examining, on a test basis, evidence regarding the amounts and disclosures in the financial statements. Our audits also included evaluating the accounting principles used and significant estimates made by management, as well as evaluating the overall presentation of the financial statements. Our procedures included confirmation of securities owned as of September 30, 2020 by correspondence with the custodian, agent banks and brokers; when replies were not received from brokers, we performed other auditing procedures. We believe that our audits provide a reasonable basis for our opinions.
/s/ PricewaterhouseCoopers LLP
Boston, Massachusetts
November 20, 2020
We have served as the auditor of one or more investment companies in the Natixis Investment Company Complex since at least 1995. We have not determined the specific year we began serving as auditor.
| 88
2020 U.S. Tax Distribution Information to Shareholders (unaudited)
Corporate Dividends Received Deduction. For the fiscal year ended September 30, 2020, a percentage of dividends distributed by the Funds listed below qualify for the dividends received deduction for corporate shareholders. These percentages are as follows:
| | | | |
Fund | | Qualifying Percentage | |
Fixed Income Fund | | | 9.21% | |
Institutional High Income Fund | | | 10.24% | |
Investment Grade Fixed Income Fund | | | 10.68% | |
Capital Gains Distributions. Pursuant to Internal Revenue Section 852(b), the following Funds paid distributions, which have been designated as capital gains distributions for the fiscal year ended September 30, 2020, unless subsequently determined to be different.
| | | | |
Fund | | Amount | |
Global Bond Fund | | $ | 1,783,363 | |
Institutional High Income Fund | | | 3,503,819 | |
Investment Grade Fixed Income Fund | | | 938,614 | |
Qualified Dividend Income. For the fiscal year ended September 30, 2020, the Funds below will designate up to the maximum amount allowable pursuant to the Internal Revenue Code as qualified dividend income eligible for reduced tax rates. These lower rates range from 0% to 20% depending on an individual’s tax bracket. If the Funds pay a distribution during calendar year 2020, complete information will be reported in conjunction with Form 1099-DIV.
| | | | |
Fund | | | |
Fixed Income Fund | | | | |
Institutional High Income Fund | | | | |
Investment Grade Fixed Income Fund | | | | |
Foreign Tax Credit. For the year ended September 30, 2020, the Fund intends to pass through foreign tax credits and have derived gross income from sources within foreign countries amounting to:
| | | | | | | | |
Fund | | Foreign Tax Credit
Pass-Through | | | Foreign Source
Income | |
Global Bond Fund | | $ | 114,879 | | | $ | 12,185,530 | |
89 |
Trustee and Officer Information
The tables below provide certain information regarding the trustees and officers of Loomis Sayles Funds I (the “Trust”). Unless otherwise indicated, the address of all persons below is 888 Boylston Street, Suite 800, Boston, MA 02199-8197. The Funds’ Statement of Additional Information includes additional information about the trustees of the Trust and is available by calling Loomis Sayles Funds at 800-633-3330.
| | | | | | | | |
| Name and Year of Birth | | Position(s)
Held with
the Trust, Length
of Time Served and Term of Office1 | | Principal Occupation(s)
During Past 5 Years | | Number of Portfolios in
Fund Complex Overseen2 and Other Directorships
Held During
Past 5 Years | | Experience,
Qualifications,
Attributes, Skills
for Board
Membership |
|
Independent Trustees |
Kenneth A. Drucker (1945) | | Chairperson of the Board of Trustees since January 2017 Trustee since 2008 Ex Officio member of Audit Committee, Contract Review Committee and Governance Committee | | Retired | | 54 None | | Significant experience on the Board and on the boards of other business organizations (including at investment companies); executive experience (including as treasurer of an aerospace, automotive, and metal manufacturing corporation) |
| | | | |
Edmond J. English (1953) | | Trustee since 2013 Chairperson of Governance Committee and Audit Committee Member | | Executive Chairman of Bob’s Discount Furniture (retail) | | 54 Director, Burlington Stores, Inc. (retail) | | Significant experience on the Board and on the boards of other business organizations (including retail companies and a bank); executive experience (including at a retail company) |
| | | | |
Richard A. Goglia (1951) | | Trustee since 2015 Contract Review Committee Member and Governance Committee Member | | Retired | | 54 Director of Triumph Group (aerospace industry) | | Significant experience on the Board and executive experience (including his role as vice president and treasurer of a defense company and experience at a financial services company) |
| | | | |
Wendell J. Knox (1948) | | Trustee since 2009 Chairperson of Contract Review Committee | | Retired | | 54 Director of Abt Associates Inc. (research and consulting); Director, The Hanover Insurance Group (property and casualty insurance); formerly, Director, Eastern Bank (bank) | | Significant experience on the Board and on the boards of other business organizations (including at a bank and at a property and casualty insurance firm); executive experience (including roles as president and chief executive officer of a research and consulting company) |
| 90
| | | | | | | | |
| Name and Year of Birth | | Position(s)
Held with
the Trust, Length
of Time Served and Term of Office1 | | Principal Occupation(s)
During Past 5 Years | | Number of Portfolios in
Fund Complex Overseen2 and Other Directorships
Held During
Past 5 Years | | Experience,
Qualifications,
Attributes, Skills
for Board
Membership |
Martin T. Meehan (1956) | | Trustee since 2012 Audit Committee Member | | President, University of Massachusetts | | 54 None | | Significant experience on the Board and on the boards of other business organizations; experience as President of the University of Massachusetts; government experience (including as a member of the U.S. House of Representatives); academic experience |
| | | | |
Maureen B. Mitchell (1951) | | Trustee since 2017 Contract Review Committee Member and Governance Committee Member | | Retired; formerly President, Global Sales and Marketing, GE Asset Management, Inc. (financial services) | | 54 Director, Sterling Bancorp (bank) | | Experience on the Board; financial services industry and executive experience (including role as president of global sales and marketing at a financial services company) |
| | | | |
James P. Palermo (1955) | | Trustee since 2016 Contract Review Committee Member | | Founding Partner, Breton Capital Management, LLC (private equity); Partner, STEP Partners, LLC (private equity) | | 54 Director, FutureFuel.io (chemicals and biofuels) | | Experience on the Board; financial services industry and executive experience (including roles as chief executive officer of client management and asset servicing for a banking and financial services company) |
| | | | |
Erik R. Sirri (1958) | | Trustee since 2009 Audit Committee Member | | Professor of Finance at Babson College | | 54 None | | Significant experience on the Board; experience as Director of the Division of Trading and Markets at the Securities and Exchange Commission; academic experience; training as an economist |
| | | | |
Peter J. Smail (1952) | | Trustee since 2009 Audit Committee Member and Governance Committee Member | | Retired | | 54 None | | Significant experience on the Board; mutual fund industry and executive experience (including roles as president and chief executive officer for an investment adviser) |
91 |
| | | | | | | | |
| Name and Year of Birth | | Position(s)
Held with
the Trust, Length
of Time Served and Term of Office1 | | Principal Occupation(s)
During Past 5 Years | | Number of Portfolios in
Fund Complex Overseen2 and Other Directorships
Held During
Past 5 Years | | Experience,
Qualifications,
Attributes, Skills
for Board
Membership |
Kirk A. Sykes (1958) | | Trustee since 2019 Contract Review Committee Member | | Managing Director of Accordia Partners, LLC (real estate development); President of Primary Corporation (real estate development); Managing Principal of Merrick Capital Partners (infrastructure finance); formerly, President of Urban Strategy America Fund (real estate fund manager) | | 54 Trustee, Eastern Bank (bank); formerly Director, Ares Commercial Real Estate Corporation (real estate investment trust) | | Experience on the Board and significant experience on the boards of other business organizations (including real estate companies and banks) |
| | | | |
Cynthia L. Walker (1956) | | Trustee since 2005 Chairperson of the Audit Committee and Governance Committee Member | | Deputy Dean for Finance and Administration, Yale University School of Medicine | | 54 None | | Significant experience on the Board; executive experience in a variety of academic organizations (including roles as dean for finance and administration) |
|
Interested Trustees |
Kevin P. Charleston3 (1965) One Financial Center Boston, MA 02111 | | Trustee since 2015 President and Chief Executive Officer since 2015 | | President, Chief Executive Officer and Chairman of the Board of Directors | | 54 None | | Significant experience on the Board; continuing service as President, Chief Executive Officer and Chairman of the Board of Directors of Loomis, Sayles & Company, L.P. |
| | | | |
David L. Giunta4
(1965) | | Trustee since 2011 Executive Vice President since 2008 | | President and Chief Executive Officer, Natixis Advisors, L.P., Natixis Distribution, L.P., Natixis Distribution Corporation and Chairman of the Board of Natixis Distribution Corporation | | 54 None | | Significant experience on the Board; experience as President and Chief Executive Officer of Natixis Advisors, L.P., Natixis Distribution, L.P., Natixis Distribution Corporation and Chairman of the Board of Natixis Distribution Corporation |
| 1 | Each trustee serves until retirement, resignation or removal from the Board. The current retirement age is 75. The position of Chairperson of the Board is appointed for a three-year term. Mr. Drucker was appointed to serve an additional one year term as the Chairperson of the Board on June 12, 2019. |
| 2 | The trustees of the Trust serve as trustees of a fund complex that includes all series of the Natixis Funds Trust I, Natixis Funds Trust II, Natixis Funds Trust IV, Gateway Trust, Loomis Sayles Funds I, Loomis Sayles Funds II, Natixis ETF Trust and Natixis ETF Trust II (collectively, the “Fund Complex”). |
| 3 | Mr. Charleston is deemed an “interested person” of the Trust because he holds the following positions with an affiliated person of the Trust: President, Chief Executive Officer and Chairman of the Board of Directors of Loomis, Sayles & Company, L.P. |
| 4 | Mr. Giunta is deemed an “interested person” of the Trust because he holds the following positions with an affiliated person of the Trust: President and Chief Executive Officer, Natixis Advisors, L.P., Natixis Distribution, L.P., Natixis Distribution Corporation and Chairman of the Board of Natixis Distribution Corporation. |
| 92
| | | | | | |
| Name and Year of Birth | | Position(s)
Held with
the Trust | | Term of Office1
and Length of
Time Served | | Principal Occupation(s)
During Past 5 Years2 |
|
Officers of the Trust |
Daniel J. Fuss (1933) One Financial Center Boston, MA 02111 | | Executive Vice President | | Since 2003 | | Vice Chairman and Director, Loomis, Sayles & Company, L.P. |
| | | |
Russell L. Kane (1969) | | Secretary, Clerk and Chief Legal Officer Chief Compliance Officer and Anti-Money Laundering Officer | | Since 2016 Since 2020 | | Executive Vice President, General Counsel, Secretary and Clerk, Natixis Distribution Corporation, Natixis Advisors, L.P. and Natixis Distribution, L.P.; formerly, Senior Vice President, Deputy General Counsel, Assistant Secretary and Assistant Clerk, Natixis Distribution Corporation, Natixis Advisors, L.P. and Natixis Distribution, L.P. |
| | | |
Michael C. Kardok (1959) | | Treasurer, Principal Financial and Accounting Officer | | Since 2004 | | Senior Vice President, Natixis Advisors, L.P. and Natixis Distribution, L.P. |
| 1 | Each officer of the Trust serves for an indefinite term in accordance with the Trust’s current by-laws until the date his or her successor is elected and qualified, or until he or she sooner dies, retires, is removed or becomes disqualified. |
| 2 | Each person listed above, except as noted, holds the same position(s) with the Fund Complex. Previous positions during the past five years with Natixis Distribution, L.P., Natixis Advisors, L.P. or Loomis, Sayles & Company, L.P. are omitted, if not materially different from an officer’s current position with such entity. |
93 |

Loomis Sayles High Income Opportunities Fund
Loomis Sayles Securitized Asset Fund
Annual Report
September 30, 2020
IMPORTANT NOTICE TO SHAREHOLDERS
Beginning on January 1, 2021, as permitted by regulations adopted by the Securities and Exchange Commission, paper copies of shareholder reports like this one will no longer be sent by mail, unless you specifically request paper copies of the reports from the Fund or from your financial intermediary, such as a broker-dealer or bank. Instead, the reports will be made available on the Funds’ website, and you will be notified by mail each time a report is posted and provided with a website link to access the report. If you wish to continue receiving paper copies of your shareholder reports after January 1, 2021, you can inform the Fund at any time by calling 1-800-633-3330. If you hold your account with a financial intermediary and you wish to continue receiving paper copies after January 1, 2021, you should call your financial intermediary directly. Paper copies are provided free of charge, and your election to receive reports in paper will apply to all funds held with the Natixis Funds complex. If you have already elected to receive shareholder reports electronically, you will not be affected by this change and you need not take any action. You currently may elect to receive shareholder reports and other communications from the Fund or your financial intermediary electronically at www.icsdelivery.com/loomissayles.
LOOMIS SAYLES HIGH INCOME OPPORTUNITIES FUND
| | | | |
| Managers | | Symbol | | |
| | |
| Matthew J. Eagan, CFA® | | Institutional Class | | LSIOX |
| | |
| Daniel J. Fuss, CFA®, CIC | | | | |
| | |
| Brian P. Kennedy | | | | |
| | |
| Elaine M. Stokes | | | | |
| | |
| Todd P. Vandam, CFA® | | | | |
Investment Objective
The Fund’s investment objective is high current income. Capital appreciation is the Fund’s secondary objective.
Market Conditions
The financial markets experienced significant volatility in the past year, as investors grappled with the uncertainty surrounding Covid-19. The bulk of the market disruptions occurred in February and March, when world governments first aimed to contain the virus by locking down broad swaths of their economies. Higher-risk assets were hit hard in the ensuing selloff, while demand for lower-risk investments surged. The US Federal Reserve (Fed) sought to counter the extraordinary developments by cutting the fed funds rate to zero and reinstituting quantitative easing through the purchases of Treasuries and mortgage-backed securities. It revived lending facilities last used in 2008, such as the TALF (Term Asset-Backed Securities Loan Facility), which is a funding backdrop for the ABS (asset-backed securities) market. It even established facilities never used before, such as the Corporate Credit Facilities which allowed the Fed to purchase corporate bond assets for the first time in its history. In conjunction with a $2.2 trillion stimulus package passed by the US Congress, the Fed’s response fueled an impressive recovery in higher-risk assets from late March onward.
The uncertain environment worked to the benefit of US Treasuries due to their status as a relative “safe haven.” Longer duration bonds delivered particularly robust gains. The yield on the 10-year note fell to an all-time low in March and remained close to that level thereafter on expectations that the Fed would pursue its low-rate policy indefinitely. (Prices and yields move in opposite directions.)
Investment grade corporates were notable beneficiaries of rising risk appetite and investors’ demand for high-quality alternatives to low-yielding government debt. Despite their downturn in the February-March selloff, corporates outperformed the broader fixed income market for the full 12-month period.
High yield corporate bonds also delivered positive returns. The category was supported by hopes for an economic recovery, reduced investor risk aversion and accommodative fiscal and monetary policy. However, high yield issues trailed investment grade securities. Lower-quality debt was generally harder hit in the downturn due to lower market liquidity and the effect of falling oil prices, which weighed on the asset class’ return for the full period.
Securitized assets — including mortgage-backed securities, asset-backed securities and commercial mortgage-backed securities — lagged Treasuries and investment grade corporates, but they nonetheless posted a solid total return thanks to their rally in the second half of the period.
Performance Results
For the 12 months ended September 30, 2020, Institutional Class shares of the Loomis Sayles High Income Opportunities Fund returned 4.28% at net asset value. The Fund outperformed its benchmark, the Bloomberg Barclays U.S. Corporate High-Yield Bond Index, which returned 3.25%.
Explanation of Fund Performance
The past year has been defined by the widespread impact of the Covid-19 global pandemic. After an extremely turbulent first quarter of 2020, markets snapped back amidst unprecedented central bank actions, lifting of lockdowns and promising news of a potential vaccine. Security selection within investment grade corporate credit was a positive contributor to relative performance, aided by holdings in the consumer cyclical, capital goods and technology sectors. The Fund’s longer-than-benchmark positioning with respect to duration (and corresponding interest rate sensitivity) within high yield corporate credit helped relative return as interest rates declined during the period. Additionally, allocations to cash reserves and US Treasuries were positive for performance.
Exposure to securitized assets detracted as this sector did not keep pace with high yield credit. Within convertible securities, selected energy holdings weighed on return.
Outlook
At this time of writing, which is the end of September 2020, economic and financial market conditions have continued to show encouraging signs of improvement, though the outlook remains uncertain. The Federal Reserve has provided forward guidance that helps ensure monetary
1 |
policy can remain accommodative for the foreseeable future, which appears to be boosting business and consumer confidence and keeping investor risk appetite strong going into the final quarter of the year. We also believe it is still possible for a limited agreement to be reached that extends the fiscal stimulus package and provides further support to the economy, though ongoing debate by lawmakers on the size and scale of the package has been causing increased anxiety among investors as we get closer to the US election. We continue to assess the immediate and longer-term impacts of the pandemic on the economy, but currently expect a slow and uneven pace of recovery.
The global economy has been showing signs of improvement, with stronger levels of manufacturing and services purchasing manager data in the third quarter of 2020. This trend could continue should our forecasts be accurate for profit growth, gains in employment and a better managed second wave of the virus. We do believe that the economy can normalize with a successful distribution of a vaccine early next year, though a full recovery in GDP growth is not expected in the near term.
We increased our credit exposure during the dislocation in the credit markets earlier this year. We have maintained our allocation to credit with the view that we have entered the credit repair phase of the credit cycle1, exiting from the downturn/recessionary phase. This phase of the cycle is typically characterized by balance sheet improvement, better liquidity conditions and tightening spread levels. We believe this phase could potentially provide attractive returns for fixed income investors.
Valuations in the corporate bond sectors have been less compelling following the strong credit rally that has unfolded since the end of March. However, we believe the low global interest rate environment will likely continue to drive the search for yield and help provide a positive technical backdrop for both investment grade and high yield corporate debt. Also, we have been active and selective in new issues throughout the year, and will continue to look for opportunities in the primary market. The effects of the pandemic have created a need for many companies, across industries, to access capital for liquidity purposes and to potentially refinance debt, a credit positive. New issues generally come at a premium (higher yield than the existing debt of the issuer) to attract investors. Harvesting this new issue “premium” can potentially be an attractive and persistent source of excess return. Recently, there have been modest signs of slowing issuance, given market concerns and some risk aversion. New issuance can provide added liquidity and the ability to extend maturities. However, it can also increase the overall debt level of an issuer. While economic conditions have been improving, the recovery has been uneven and varies by sector. We are still monitoring the potential for fallen angels with expectations for more to possibly occur in specific areas, including consumer cyclical, lodging & leisure, retailers and restaurants. We think default rate risk and fallen angel activity will likely be more moderate than what was experienced in the spring of this year, and there is opportunity to add value in the credit sectors with good security selection.
As we approach the end of 2020, we believe our portfolios are well-positioned to generate excess return potential. We have remained focused on areas where investors are mispricing risk while following our disciplined, value-oriented approach to portfolio construction, a process rooted in fundamental credit analysis and a long-term view of the market.
| 1 | | A credit cycle is a cyclical pattern that follows credit availability and corporate health. |
| 2
LOOMIS SAYLES HIGH INCOME OPPORTUNITIES FUND
Hypothetical Growth of $10,000 Investment in Institutional Class Shares
September 30, 2010 through September 30, 2020
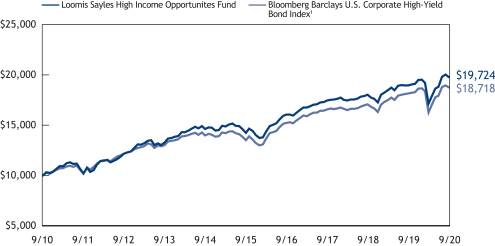
Average Annual Total Returns — September 30, 2020
| | | | | | | | | | | | | | | | | | | | |
| | | | | |
| | | 1 year | | | 5 years | | | 10 years | | | Expense Ratios2 | |
| | Gross | | | Net | |
| | | | | | |
| Institutional Class (Inception 4/12/04) | | | 4.28 | % | | | 6.78 | % | | | 7.02 | % | | | 0.00 | % | | | 0.00 | % |
| | | | | | |
| Comparative Performance | | | | | | | | | | | | | | | | | | | | |
| Bloomberg Barclays U.S. Corporate High-Yield Bond Index1 | | | 3.25 | | | | 6.79 | | | | 6.47 | | | | | | | | | |
Performance data shown represents past performance and is no guarantee of, and not necessarily indicative of, future results. Total return and value will vary, and you may have a gain or loss when shares are sold. Current performance may be lower or higher than quoted. Performance for other share classes will be greater or less than shown based on differences in fees and sales charges. You may not invest directly in an index. Performance for periods less than one year is cumulative, not annualized. Returns reflect changes in share price and reinvestment of dividends and capital gains, if any. The table(s) do not reflect taxes shareholders might owe on any fund distributions or when they redeem their shares.
| 1 | | Bloomberg Barclays U.S. Corporate High-Yield Bond Index measures the market of USD-denominated, non-investment grade, fixed-rate, taxable corporate bonds. Securities are classified as high yield if the middle rating of Moody’s, Fitch, and S&P is Ba1/BB+/BB+ or below, excluding emerging market debt. The U.S. Corporate High-Yield Bond Index was created in 1986, with history backfilled to July 1, 1983, and rolls up into the Barclays U.S. Universal and Global High-Yield Indices. |
| 2 | | The amount shown under Gross and Net Expense Ratio is 0.00% to reflect the fact that the Fund does not pay any advisory, administration or distribution and service fees, and that Loomis Sayles has agreed to pay certain expenses of the Fund. All fees are paid by investors indirectly through separately negotiated advisory relationships with the Fund’s Adviser or through “wrap fee” programs sponsored by broker dealers and investment advisers that may be affiliated or unaffiliated with the Fund, Loomis Sayles or Natixis Advisors, L.P. |
3 |
LOOMIS SAYLES SECURITIZED ASSET FUND
| | | | |
| Managers | | Symbol | | |
| | |
| Ian Anderson | | Institutional Class | | LSSAX |
| | |
| Alessandro Pagani, CFA® | | | | |
| | |
| Clifton V. Rowe, CFA® | | | | |
Investment Objective
The Fund’s investment objective is to seek a high level of current income consistent with capital preservation.
Market Conditions
The financial markets experienced significant volatility in the past year, as investors grappled with the uncertainty surrounding Covid-19. The bulk of the market disruptions occurred in February and March, when world governments first aimed to contain the virus by locking down broad swaths of their economies. Higher-risk assets were hit hard in the ensuing selloff, while demand for lower-risk investments surged. The US Federal Reserve (Fed) sought to counter the extraordinary developments by cutting the fed funds rate to zero and reinstituting quantitative easing through the purchases of Treasuries and mortgage-backed securities. It revived lending facilities last used in 2008, such as the term asset-backed securities loan facility (TALF), which is a funding backdrop for the asset-backed securities (ABS) market. It even established facilities never used before, such as the Corporate Credit Facilities which allowed the Fed to purchase corporate bond assets for the first time in its history. In conjunction with a $2.2 trillion stimulus package passed by the US Congress, the Fed’s response fueled an impressive recovery in higher-risk assets from late March onward.
The uncertain environment worked to the benefit of US Treasuries due to their status as a relative “safe haven.” Longer duration bonds delivered particularly robust gains. The yield on the 10-year note fell to an all-time low in March and remained close to that level thereafter on expectations that the Fed would pursue its low-rate policy indefinitely; prices and yields move in opposite directions.
Securitized assets — including mortgage-backed securities, asset-backed securities and commercial mortgage-backed securities — lagged Treasuries and investment grade corporates, but they nonetheless posted a solid total return thanks to their rally in the second half of the period.
Performance Results
For the 12 months ended September 30, 2020, Institutional Class shares of the Loomis Sayles Securitized Asset Fund returned 4.13% at net asset value. The Fund underperformed its benchmark, the Bloomberg Barclays U.S. Securitized Bond Index, which returned 4.52%.
Explanation of Fund Performance
The Fund’s holdings of agency collateralized mortgage obligation (CMO) and agency commercial mortgage-backed securities (CMBS) detracted from relative return, with exposure to agency mortgage-backed securities (MBS) and agency CMBS derivatives, respectively, driving the underperformance. The strategy aims to be duration neutral versus its benchmark and we use interest rate futures and swaps in our effort to achieve this objective. Given the rally in rates during the year, the derivative positions detracted from returns.
The Fund’s positioning with respect to agency pass through securities was the largest positive contributor to relative performance. Holdings of residential mortgage-backed securities (RMBS) also contributed significantly to relative return, primarily due to exposure to re-performing loans and single-family rental loans. The Fund’s positioning with respect to collateralized loan obligations and collateralized debt obligations (CLO/CDO) contributed to relative performance for the period, with exposure to AAA and senior mezzanine loans driving the outperformance.
Outlook
We are overweight in MBS versus Treasuries, as agency MBS currently offers favorable risk-adjusted forecasted returns in spite of the elevated supply levels. With the Fed reaffirming its pace of MBS net purchases at $40 billion per month for the foreseeable future, we believe the environment remains favorable for mortgages, which offer a strong carry proposition for patient investors over the short to medium term. While fundamentals continue to be challenged with prepayment speeds remaining elevated, we find the convexity profile of the mortgage universe attractive, with limited duration contraction risk as the vast majority of loans have an incentive to refinance. While the Fed remains the dominant driver of demand, banks have also started to add MBS exposure more meaningfully in Q3 and we expect them to remain the second largest source of demand into year-end.
Consumer ABS fundamentals were stable during the quarter despite continued high unemployment and uncertainty. Meanwhile, losses remain flat at pre-Covid crisis levels and similar to those seen during 2019. We believe consumers are still benefiting from smaller forms of stimulus (i.e. FEMA payments), increased savings and less discretionary spending. The consumer also entered this downturn with a healthy balance sheet contributing to their ability to continue to pay their debt. However, recognizing there is still much uncertainty about economic
| 4
recovery and declining unemployment, we remain cautious. When investing down in credit, we are focusing on strong structures and sophisticated sponsors that can weather the proverbial “storm.” Otherwise, with spreads having reverted close to pre-Covid levels, we favor staying up in quality.
Spreads for CMBS widened dramatically during the Covid-related selloff, but have retraced much of the move with credit bonds following the AAA sector tighter. AAA legacy bonds were initially supported by a TALF backstop, but strong crossover demand from corporate credit markets (benefiting from direct government purchases) resulted in both a decline as well as a flattening of the credit curve. Despite the summer rally, most CMBS spreads are still at fair/attractive long-term levels.
We believe shelter, and single family housing in particular, will benefit in the long term as the consequences of the current crisis unfold. We are therefore positive on the long-term fundamentals of US housing. US house prices rose 3.5% in 2019. Looking ahead, we have reduced our expectation for home price growth to between -2% and 0% given the broader deterioration in the macro economy. In securities, we favor those which are fundamentally best prepared to weather the ongoing economic challenges and changes driven by the current health crisis, preferring to extend duration where possible to realize the best possible total returns.
Hypothetical Growth of $10,000 Investment in Institutional Class Shares
September 30, 2010 through September 30, 2020
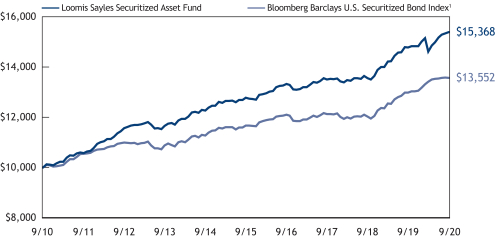
Average Annual Total Returns — September 30, 2020
| | | | | | | | | | | | | | | | | | | | |
| | | | | |
| | | | | | | | | | | | Expense Ratios2 | |
| | 1 year | | | 5 years | | | 10 years | | | Gross | | | Net | |
| | | | | | |
| Institutional Class (Inception 3/2/06) | | | 4.13 | % | | | 3.79 | % | | | 4.39 | % | | | 0.00 | % | | | 0.00 | % |
| | | | | | |
| Comparative Performance | | | | | | | | | | | | | | | | | | | | |
| Bloomberg Barclays U.S. Securitized Bond Index1 | | | 4.52 | | | | 3.06 | | | | 3.09 | | | | | | | | | |
Performance data shown represents past performance and is no guarantee of, and not necessarily indicative of, future results. Total return and value will vary, and you may have a gain or loss when shares are sold. Performance for other share classes will be greater or less than shown based on differences in fees and sales charges. You may not invest directly in an index. Performance for periods less than one year is cumulative, not annualized. Returns reflect changes in share price and reinvestment of dividends and capital gains, if any. The table(s) do not reflect taxes shareholders might owe on any fund distributions or when they redeem their shares.
| 1 | | Bloomberg Barclays U.S. Securitized Bond Index is an unmanaged index of asset-backed securities, collateralized mortgage-backed securities (ERISA eligible), and fixed-rate mortgage-backed securities. |
| 2 | | The amount shown under Gross and Net Expense Ratio is 0.00% to reflect the fact that the Fund does not pay any advisory, administration or distribution and service fees, and that Loomis Sayles has agreed to pay certain expenses of the Fund. All fees are paid by investors indirectly through separately negotiated advisory relationships with the Fund’s Adviser or through “wrap fee” programs sponsored by broker dealers and investment advisers that may be affiliated or unaffiliated with the Fund, Loomis Sayles or Natixis Advisors, L.P. |
5 |
ADDITIONAL INFORMATION
The views expressed in this report reflect those of the portfolio managers as of the dates indicated. The managers’ views are subject to change at any time without notice based on changes in market or other conditions. References to specific securities or industries should not be regarded as investment advice. Because the Fund is actively managed, there is no assurance that they will continue to invest in the securities or industries mentioned.
All investing involves risk, including the risk of loss. There is no assurance that any investment will meet its performance objectives or that losses will be avoided.
Additional Index Information
This document may contain references to third party copyrights, indexes, and trademarks, each of which is the property of its respective owner. Such owner is not affiliated with Natixis Investment Managers or any of its related or affiliated companies (collectively “Natixis Affiliates”) and does not sponsor, endorse or participate in the provision of any Natixis Affiliates services, funds or other financial products.
The index information contained herein is derived from third parties and is provided on an “as is” basis. The user of this information assumes the entire risk of use of this information. Each of the third party entities involved in compiling, computing or creating index information disclaims all warranties (including, without limitation, any warranties of originality, accuracy, completeness, timeliness, non-infringement, merchantability and fitness for a particular purpose) with respect to such information.
Proxy Voting Information
A description of the Funds’ proxy voting policies and procedures is available without charge, upon request by calling Loomis Sayles at 800-633-3330; on the Funds’ website at www.loomissayles.com, and on the Securities and Exchange Commission’s (“SEC’s”) website at www.sec.gov. Information about how the Funds voted proxies relating to portfolio securities during the most recent 12-month period ended June 30 is available on the Funds’ website and the SEC’s website.
Quarterly Portfolio Schedules
The Funds file complete schedules of portfolio holdings with the SEC for the first and third quarters of each fiscal year as an exhibit on Form N-PORT. The Funds’ Form N-PORT reports are available on the SEC’s website at www.sec.gov.
CFA® and Chartered Financial Analyst® are registered trademarks owned by the CFA Institute.
UNDERSTANDING FUND EXPENSES
Typically, mutual fund shareholders incur two types of costs: (1) transaction costs; and (2) ongoing costs, including management fees, distribution fees (12b-1 fees), and other fund expenses. However, the Funds are unlike other mutual funds; they do not charge any fees or expenses.
You should be aware that shares in the Funds are available only to institutional investment advisory clients of Loomis, Sayles & Company, L.P. (“Loomis Sayles”) and Natixis Advisors, L.P. (“Natixis Advisors”) and to participants in “wrap fee” programs sponsored by broker-dealers and investment advisers that may be affiliated or unaffiliated with the Funds, Loomis Sayles or Natixis Advisors. The institutional investment advisory clients of Loomis Sayles and Natixis Advisors pay Loomis Sayles or Natixis Advisors a fee for their investment advisory services, while participants in “wrap fee” programs pay a “wrap fee” to the program’s sponsor. The “wrap fee” program sponsors, in turn, pay a fee to Natixis Advisors. “Wrap fee” program participants should read carefully the wrap fee brochure provided to them by their program’s sponsor and the fees paid by such sponsor to Natixis Advisors. Shareholders pay no additional fees or expenses to purchase shares of the Funds. However, shareholders will indirectly pay a proportionate share of those costs, such as brokerage commissions, taxes and extraordinary expenses, that are borne by the Funds through a reduction in each Fund’s net asset value.
The first line in each Fund’s table shows the actual amount of Fund expenses ($0) you would have paid on a $1,000 investment in the Fund from April 1, 2020 through September 30, 2020.
The second line in each Fund’s table provides information about hypothetical account values and hypothetical expenses based on the Fund’s actual expense ratio (0%) and an assumed rate of return of 5% per year before expenses, which is not the Fund’s actual return. The hypothetical account values and expenses may not be used to estimate the actual ending account balance or expenses you paid on your investment for the period. You may use this information to compare the ongoing costs of investing in the Funds to other funds. To do so, compare this 5% hypothetical example with the 5% hypothetical examples that appear in the shareholder reports of the other funds.
Please note that the expenses shown reflect ongoing costs only, and do not include any transaction costs. Therefore, the second line in the table is useful in comparing ongoing costs only, and will not help you determine the relative costs of owning different funds. If transaction costs were included, total costs would be higher.
| 6
Loomis Sayles High Income Opportunities Fund
| | | | | | | | | | | | |
Institutional Class | | Beginning
Account Value
4/1/2020 | | | Ending
Account Value
9/30/2020 | | | Expenses Paid
During Period*
4/1/2020 – 9/30/2020 | |
Actual | | | $1,000.00 | | | | $1,152.90 | | | | $0.00 | |
Hypothetical (5% return before expenses) | | | $1,000.00 | | | | $1,025.00 | | | | $0.00 | |
|
* Expenses are equal to the Fund’s annualized expense ratio of 0.00%, multiplied by the average account value over the period, multiplied by the number of days in the most recent fiscal half-year (183), divided by 366 (to reflect the half-year period). | |
Loomis Sayles Securitized Asset Fund
| | | | | | | | | | | | |
Institutional Class | | Beginning
Account Value
4/1/2020 | | | Ending
Account Value
9/30/2020 | | | Expenses Paid
During Period*
4/1/2020 – 9/30/2020 | |
Actual | | | $1,000.00 | | | | $1,052.80 | | | | $0.00 | |
Hypothetical (5% return before expenses) | | | $1,000.00 | | | | $1,025.00 | | | | $0.00 | |
|
* Expenses are equal to the Fund’s annualized expense ratio of 0.00%, multiplied by the average account value over the period, multiplied by the number of days in the most recent fiscal half-year (183), divided by 366 (to reflect the half-year period). | |
7 |
BOARD APPROVAL OF THE EXISTING ADVISORY AGREEMENTS
The Board of Trustees of the Trust (the “Board”), including the Independent Trustees, considers matters bearing on each Fund’s advisory agreement (collectively, the “Agreements”) at most of its meetings throughout the year. Each year, usually in the spring, the Contract Review Committee of the Board meets to review the Agreements to determine whether to recommend that the full Board approve the continuation of the Agreements, typically for an additional one-year period. After the Contract Review Committee has made its recommendation, the full Board, including the Independent Trustees, determines whether to approve the continuation of the Agreements.
In connection with these meetings, the Trustees receive materials that the Funds’ investment adviser (the “Adviser”) believes to be reasonably necessary for the Trustees to evaluate the Agreements. These materials generally include, among other items, (i) information on the investment performance of the Funds and the performance of peer groups of funds and the Funds’ performance benchmarks, (ii) information on the Funds’ advisory fees and other expenses, (iii) sales and redemption data in respect of the Funds, (iv) information about the profitability of the Agreements to the Adviser and (v) information obtained through the completion by the Adviser of a questionnaire distributed on behalf of the Trustees. The Board, including the Independent Trustees, also considers other matters such as (i) each Fund’s investment objective and strategies and the size, education and experience of the Adviser’s investment staff and its use of technology, external research and trading cost measurement tools, (ii) arrangements in respect of the distribution of the Funds’ shares and the related costs, (iii) the allocation of the Funds’ brokerage, if any, including, to the extent applicable, the use of “soft” commission dollars to pay for research and other similar services, (iv) the Adviser’s policies and procedures relating to, among other things, compliance, trading and best execution, proxy voting and valuation, (v) information about amounts invested by the Funds’ portfolio managers in the Funds or in similar accounts that they manage and (vi) the general economic outlook with particular emphasis on the mutual fund industry. Throughout the process, the Trustees are afforded the opportunity to ask questions of and request additional materials from the Adviser.
In addition to the materials requested by the Trustees in connection with their annual consideration of the continuation of the Agreements, the Trustees receive materials in advance of each regular quarterly meeting of the Board that provide detailed information about the Funds’ investment performance. This information generally includes, among other things, an internal performance rating for each Fund based on agreed-upon criteria, a graph showing each Fund’s performance against each Fund’s peer group/category, performance ratings provided by a third-party, total return information for various periods, and third-party performance rankings for various periods comparing a Fund against similarly categorized funds. The portfolio management team for each Fund or other representatives of the Adviser make periodic presentations to the Contract Review Committee and/or the full Board, and Funds identified as presenting possible performance concerns may be subject to more frequent Board or Committee presentations and reviews. In addition, each quarter the Trustees are provided with detailed statistical information about each Fund’s portfolio. The Trustees also receive periodic updates between meetings. These updates have increased in frequency during the COVID-19 crisis.
The Board most recently approved the continuation of the Agreements for a one-year period at its meeting held in June 2020. In considering whether to approve the continuation of the Agreements, the Board, including the Independent Trustees, did not identify any single factor as determinative. Individual Trustees may have evaluated the information presented differently from one another, giving different weights to various factors. Matters considered by the Trustees, including the Independent Trustees, in connection with their approval of the Agreements included, but were not limited to, the factors listed below.
The nature, extent and quality of the services provided to the Funds under the Agreements. The Trustees considered the nature, extent and quality of the services provided by the Adviser and its affiliates to the Funds and the resources dedicated to the Funds by the Adviser and its affiliates.
The Trustees considered not only the advisory services provided by the Adviser to the Funds, but also the monitoring and oversight services provided by Natixis Advisors, L.P. (“Natixis Advisors”). They also considered the administrative and shareholder services provided by Natixis Advisors and its affiliates to the Funds. They also took into consideration increases in the services provided resulting from new regulatory requirements. The Trustees also considered that the Funds are generally only available to institutional clients of Loomis Sayles and participants in certain “wrap programs.”
After reviewing these and related factors, the Trustees concluded, within the context of their overall conclusions regarding each of the Agreements, that the nature, extent and quality of services provided supported the renewal of the Agreements.
Investment performance of the Funds and the Adviser. As noted above, the Trustees received information about the performance of the Funds over various time periods, including information that compared the performance of the Funds to the performance of peer groups and categories of funds and the Funds’ respective performance benchmarks. In addition, the Trustees reviewed data prepared by an independent third party that analyzed the performance of the Funds using a variety of performance metrics, including metrics that measured the performance of the Funds on a risk adjusted basis.
The Board noted that through December 31, 2019, each Fund’s one-, three- and five-year performance stated as percentile rankings within categories selected by the independent third-party data provider, was as follows (where the best performance would be in the first percentile of its category):
| | | | | | | | | | | | |
| | | One-Year | | | Three-Year | | | Five-Year | |
Loomis Sayles High Income Opportunities Fund | | | 64% | | | | 18% | | | | 17% | |
Loomis Sayles Securitized Asset Fund | | | 86% | | | | 25% | | | | 6% | |
| 8
In the case of a Fund that had performance that lagged that of a relevant category median as determined by the independent third-party for certain (although not necessarily all) periods, the Board concluded that other factors relevant to performance supported renewal of the Agreements. These factors included one or more of the following: (1) that the underperformance was attributable, to a significant extent, to investment decisions (such as security selection or sector allocation) by the Adviser that were reasonable and consistent with the Fund’s investment objective and policies; (2) that the Fund’s more recent performance had shown improvement relative to its category; and (3) that the Fund’s longer term performance was strong. The Board also considered information about the Funds’ more recent performance, including how that performance had been impacted by the COVID-19 crisis.
The Trustees also considered the Adviser’s performance and reputation generally, the performance of the fund family generally, and the historical responsiveness of the Adviser to Trustee concerns about performance and the willingness of the Adviser to take steps intended to improve performance.
After reviewing these and related factors, the Trustees concluded, within the context of their overall conclusions regarding each of the Agreements, that the performance of the Funds and the Adviser and/or other relevant factors supported the renewal of the Agreements.
The costs of the services to be provided and profits to be realized by the Adviser and its affiliates from their respective relationships with the Funds. Under the terms of the Agreements, the Adviser does not charge the Funds an investment advisory fee or any other fee for services. The Adviser also bears most of the Funds’ expenses. The Trustees considered that, although the Funds do not compensate the Adviser directly for services under the Agreements, the Adviser will typically receive an advisory fee from its advisory clients who have invested in the Funds or from the sponsors of “wrap programs,” who in turn charge the programs’ participants, although the Trustees are not involved in setting or reviewing those fees. Because the Funds do not charge an advisory fee, the Trustees did not consider the profitability of the Adviser’s relationship to the Funds.
After reviewing these and related factors, the Trustees concluded, within the context of their overall conclusions regarding each of the Agreements, that each Fund’s advisory fee of 0% was fair and reasonable and supported the renewal of the Agreements.
Economies of Scale. The Trustees noted that because the Adviser has borne most of the Funds’ expenses, economies of scale were not relevant to these Funds.
The Trustees also considered other factors, which included but were not limited to the following:
| • | | The effect of recent market and economic events, including but not limited to the COVID-19 crisis, on the performance, asset levels and expense ratios of each Fund. |
| • | | Whether each Fund has operated in accordance with its investment objective and each Fund’s record of compliance with its investment restrictions, and the compliance programs of the Funds and the Adviser. They also considered the compliance-related resources the Adviser and its affiliates were providing to the Funds. |
| • | | So-called “fallout benefits” to the Adviser, such as the financial and other benefits to the Adviser from being able to offer the Funds to its advisory clients and investors in certain “wrap” programs and engagement of affiliates of the Adviser to provide distribution and administrative services to the Funds, and the benefits of research made available to the Adviser by reason of brokerage commissions (if any) generated by the Funds’ securities transactions. The Trustees also considered the benefits to the parent company of Natixis Advisors from the retention of the Adviser. The Trustees considered the possible conflicts of interest associated with these fallout and other benefits, and the reporting, disclosure and other processes in place to disclose and monitor such possible conflicts of interest. |
| • | | The Trustees’ review and discussion of the Funds’ advisory arrangements in prior years, and management’s record of responding to Trustee concerns raised during the year and in prior years. |
Based on their evaluation of all factors that they deemed to be material, including those factors described above, and assisted by the advice of independent counsel, the Trustees, including the Independent Trustees, concluded that each of the existing Agreements should be continued through June 30, 2021.
9 |
LIQUIDITY RISK MANAGEMENT PROGRAM
Annual Report for the Period Commencing on December 1, 2018 and ending December 31, 2019 (including updates through September 30, 2020)
Effective December 1, 2018, the Funds adopted a liquidity risk management program (the “Program”) pursuant to the requirements of Rule 22e-4 under the Investment Company Act of 1940, as amended (the “Rule”). The Rule requires registered open-end funds, including mutual funds and exchange-traded funds to establish liquidity risk management programs in order to effectively manage fund liquidity and mitigate the risk that a fund could not meet redemption requests without significantly diluting the interests of remaining investors.
The rule requires the Funds to assess, manage and review their liquidity risk considering applicable factors during normal and foreseeable stressed conditions. In fulfilling this requirement, each Fund assesses and reviews (where applicable and amongst other matters) its investment strategy, portfolio holdings, possible investment concentrations, use of derivatives, short-term and long-term cash flow projections, use of cash and cash equivalents, as well as borrowing arrangements and other funding sources. Each Program has established a Program Administrator which is the adviser of the Fund.
In accordance with the Program, each of the Funds’ portfolio investments is classified into one of four liquidity categories based on a determination of a reasonable expectation for how long it would take to convert the investment to cash (or sell or dispose of the investment) without significantly changing its market value.
Each Fund is prohibited from acquiring an investment if, after the acquisition, its holdings of illiquid assets will exceed 15% of its net assets. If a Fund does not hold a majority of highly liquid investments in its portfolio, then the Fund is required to establish a highly liquid investment minimum (“HLIM”). Loomis Sayles High Income Opportunities Fund has established an HLIM.
During the period from December 1, 2018 to December 31, 2019, there were no material changes to the Program and no material events that impacted the operation of the Funds’ Programs. During the period, the Funds held sufficient liquid assets to meet redemptions on a timely basis and did not have any HLIM or illiquid security violations during the period.
During the period January 1, 2020 through September 30, 2020, the Funds held sufficient liquid assets to meet redemptions on a timely basis and did not have any HLIM or illiquid security violations.
Annual Program Assessment and Conclusion
In the opinion of the Program Administrator, the Program of each Fund approved by the Funds’ Board has been implemented effectively. The Program Administrator has also monitored, assessed and managed each Fund’s liquidity risk regularly and has determined that the Program is operating effectively.
Pursuant to the Rule’s requirements, the Board has received and reviewed a written report prepared by each Fund’s Program Administrator that addressed the operation of the Program, assessed its adequacy and effectiveness and described any material changes made to the Program.
| 10
Portfolio of Investments – as of September 30, 2020
Loomis Sayles High Income Opportunities Fund
| | | | | | | | |
Principal
Amount | | | Description | | Value (†) | |
|
| | Bonds and Notes – 92.0% of Net Assets | |
|
| | Non-Convertible Bonds – 88.7% | |
| |
| | | | ABS Car Loan – 0.1% | |
| $ | 150,000 | | | Prestige Auto Receivables Trust,
Series 2019-1A, Class E,
3.900%, 5/15/2026, 144A | | $ | 151,631 | |
| | | | | | | | |
| |
| | | | ABS Home Equity – 0.3% | |
| | 595,000 | | | Credit Suisse Mortgage Trust,
Series 2018-RPL8, Class A2,
4.167%, 7/25/2058, 144A(a) | | | 594,275 | |
| | 123,117 | | | DSLA Mortgage Loan Trust, Series 2005-AR5, Class 2A1A,
1-month LIBOR + 0.330%,
0.486%, 9/19/2045(b) | | | 91,822 | |
| | | | | | | | |
| | | | | | | 686,097 | |
| | | | | | | | |
| |
| | | | Aerospace & Defense – 4.8% | |
| | 80,000 | | | Boeing Co. (The), 3.250%, 2/01/2035 | | | 75,197 | |
| | 455,000 | | | Boeing Co. (The), 3.375%, 6/15/2046 | | | 389,956 | |
| | 15,000 | | | Boeing Co. (The), 3.500%, 3/01/2039 | | | 13,626 | |
| | 50,000 | | | Boeing Co. (The), 3.550%, 3/01/2038 | | | 45,547 | |
| | 265,000 | | | Boeing Co. (The), 3.625%, 3/01/2048 | | | 232,883 | |
| | 90,000 | | | Boeing Co. (The), 3.650%, 3/01/2047 | | | 79,464 | |
| | 290,000 | | | Boeing Co. (The), 3.750%, 2/01/2050 | | | 264,628 | |
| | 50,000 | | | Boeing Co. (The), 3.825%, 3/01/2059 | | | 44,071 | |
| | 20,000 | | | Boeing Co. (The), 3.850%, 11/01/2048 | | | 18,327 | |
| | 250,000 | | | Boeing Co. (The), 3.900%, 5/01/2049 | | | 230,421 | |
| | 1,215,000 | | | Boeing Co. (The), 5.150%, 5/01/2030 | | | 1,365,671 | |
| | 95,000 | | | Boeing Co. (The), 5.705%, 5/01/2040 | | | 111,998 | |
| | 1,985,000 | | | Boeing Co. (The), 5.805%, 5/01/2050 | | | 2,401,414 | |
| | 230,000 | | | Boeing Co. (The), 5.930%, 5/01/2060 | | | 284,657 | |
| | 960,000 | | | Bombardier, Inc., 6.000%, 10/15/2022, 144A | | | 890,400 | |
| | 735,000 | | | Bombardier, Inc., 6.125%, 1/15/2023, 144A | | | 628,425 | |
| | 200,000 | | | Embraer Netherlands Finance BV, 5.050%, 6/15/2025 | | | 192,000 | |
| | 145,000 | | | Embraer Netherlands Finance BV, 5.400%, 2/01/2027 | | | 137,677 | |
| | 606,000 | | | Leonardo U.S. Holdings, Inc., 6.250%, 1/15/2040, 144A | | | 688,937 | |
| | 170,000 | | | Leonardo U.S. Holdings, Inc., 7.375%, 7/15/2039, 144A | | | 211,108 | |
| | 70,000 | | | Moog, Inc., 4.250%, 12/15/2027, 144A | | | 71,578 | |
| | 650,000 | | | Spirit AeroSystems, Inc., 4.600%, 6/15/2028 | | | 533,390 | |
| | 1,030,000 | | | Spirit AeroSystems, Inc., 7.500%, 4/15/2025, 144A | | | 1,044,152 | |
| | 30,000 | | | TransDigm, Inc., 5.500%, 11/15/2027 | | | 28,831 | |
| | 790,000 | | | TransDigm, Inc., 6.250%, 3/15/2026, 144A | | | 824,993 | |
| | 1,405,000 | | | TransDigm, Inc., 6.375%, 6/15/2026 | | | 1,410,522 | |
| | 85,000 | | | Wolverine Escrow LLC, 9.000%, 11/15/2026, 144A | | | 70,125 | |
| | | | | | | | |
| | | | | | | 12,289,998 | |
| | | | | | | | |
| |
| | | | Airlines – 0.5% | |
| | 40,000 | | | American Airlines Group, Inc., 5.000%, 6/01/2022, 144A | | | 27,200 | |
| | 505,000 | | | American Airlines, Inc., 11.750%, 7/15/2025, 144A | | | 487,325 | |
| |
| | | | Airlines – continued | |
| 510,000 | | | Delta Air Lines, Inc., 7.375%, 1/15/2026 | | | 534,655 | |
| | 485,000 | | | Latam Finance Ltd., 7.000%, 3/01/2026, 144A(c) | | | 179,916 | |
| | | | | | | | |
| | | | | | | 1,229,096 | |
| | | | | | | | |
| |
| | | | Automotive – 4.2% | |
| | 565,000 | | | Clarios Global LP/Clarios U.S. Finance Co., 8.500%, 5/15/2027, 144A | | | 583,363 | |
| | 2,700,000 | | | Ford Motor Co., 8.500%, 4/21/2023 | | | 2,943,000 | |
| | 1,620,000 | | | Ford Motor Co., 9.000%, 4/22/2025 | | | 1,857,346 | |
| | 200,000 | | | Ford Motor Credit Co. LLC, 3.219%, 1/09/2022 | | | 199,740 | |
| | 200,000 | | | Ford Motor Credit Co. LLC, 4.250%, 9/20/2022 | | | 201,732 | |
| | 200,000 | | | Ford Motor Credit Co. LLC, 4.542%, 8/01/2026 | | | 199,526 | |
| | 200,000 | | | Ford Motor Credit Co. LLC, 5.113%, 5/03/2029 | | | 205,000 | |
| | 400,000 | | | Ford Motor Credit Co. LLC, GMTN, 4.389%, 1/08/2026 | | | 395,436 | |
| | 90,000 | | | General Motors Co., 5.000%, 4/01/2035 | | | 97,502 | |
| | 100,000 | | | General Motors Co., 5.150%, 4/01/2038 | | | 106,197 | |
| | 250,000 | | | General Motors Co., 5.200%, 4/01/2045 | | | 269,291 | |
| | 910,000 | | | General Motors Co., 6.250%, 10/02/2043 | | | 1,078,408 | |
| | 1,370,000 | | | General Motors Co., 6.600%, 4/01/2036 | | | 1,667,373 | |
| | 220,000 | | | General Motors Co., 6.750%, 4/01/2046 | | | 270,815 | |
| | 65,000 | | | Goodyear Tire & Rubber Co. (The), 5.000%, 5/31/2026 | | | 63,155 | |
| | 60,000 | | | Goodyear Tire & Rubber Co. (The), 5.125%, 11/15/2023 | | | 60,000 | |
| | 320,000 | | | Goodyear Tire & Rubber Co. (The), 7.000%, 3/15/2028 | | | 332,080 | |
| | 305,000 | | | PM General Purchaser LLC, 9.500%, 10/01/2028, 144A | | | 316,346 | |
| | | | | | | | |
| | | | | | | 10,846,310 | |
| | | | | | | | |
| |
| | | | Banking – 1.7% | |
| | 1,890,000 | | | Ally Financial, Inc., 5.750%, 11/20/2025 | | | 2,119,040 | |
| | 1,035,000 | | | Deutsche Bank AG, (fixed rate to 12/01/2027, variable rate thereafter), 4.875%, 12/01/2032 | | | 985,600 | |
| | 740,000 | | | Intesa Sanpaolo SpA, 5.017%, 6/26/2024, 144A | | | 777,690 | |
| | 355,000 | | | UniCredit SpA, (fixed rate to 6/30/2030, variable rate thereafter), 5.459%, 6/30/2035, 144A | | | 361,656 | |
| | | | | | | | |
| | | | | | | 4,243,986 | |
| | | | | | | | |
| |
| | | | Brokerage – 0.1% | |
| | 140,000 | | | Jefferies Group LLC, 6.250%, 1/15/2036 | | | 173,498 | |
| | | | | | | | |
| |
| | | | Building Materials – 2.1% | |
| | 125,000 | | | American Woodmark Corp., 4.875%, 3/15/2026, 144A | | | 126,563 | |
See accompanying notes to financial statements.
11 |
Portfolio of Investments – as of September 30, 2020
Loomis Sayles High Income Opportunities Fund – continued
| | | | | | | | |
Principal
Amount | | | Description | | Value (†) | |
|
| | Bonds and Notes – continued | |
| |
| | | | Building Materials – continued | |
| $ | 45,000 | | | Boise Cascade Co., 4.875%, 7/01/2030, 144A | | $ | 48,375 | |
| | 315,000 | | | Builders FirstSource, Inc., 5.000%, 3/01/2030, 144A | | | 326,025 | |
| | 375,000 | | | Builders FirstSource, Inc., 6.750%, 6/01/2027, 144A | | | 401,719 | |
| | 300,000 | | | Cemex SAB de CV, 5.700%, 1/11/2025, 144A | | | 306,290 | |
| | 300,000 | | | Cemex SAB de CV, 7.750%, 4/16/2026, 144A | | | 316,125 | |
| | 380,000 | | | Cornerstone Building Brands, Inc., 6.125%, 1/15/2029, 144A | | | 384,898 | |
| | 1,250,000 | | | James Hardie International Finance DAC, 5.000%, 1/15/2028, 144A | | | 1,303,125 | |
| | 105,000 | | | JELD-WEN, Inc., 4.625%, 12/15/2025, 144A | | | 105,525 | |
| | 350,000 | | | JELD-WEN, Inc., 4.875%, 12/15/2027, 144A | | | 356,667 | |
| | 415,000 | | | Masonite International Corp., 5.375%, 2/01/2028, 144A | | | 442,571 | |
| | 100,000 | | | Summit Materials LLC/Summit Materials Finance Corp., 5.250%, 1/15/2029, 144A | | | 104,125 | |
| | 425,000 | | | U.S. Concrete, Inc., 5.125%, 3/01/2029, 144A | | | 426,062 | |
| | 609,000 | | | U.S. Concrete, Inc., 6.375%, 6/01/2024 | | | 628,031 | |
| | | | | | | | |
| | | | | | | 5,276,101 | |
| | | | | | | | |
| |
| | | | Cable Satellite – 5.3% | |
| | 665,000 | | | Altice Financing S.A., 5.000%, 1/15/2028, 144A | | | 645,881 | |
| | 95,000 | | | Block Communications, Inc., 4.875%, 3/01/2028, 144A | | | 96,900 | |
| | 615,000 | | | CCO Holdings LLC/CCO Holdings Capital Corp., 4.250%, 2/01/2031, 144A | | | 635,670 | |
| | 280,000 | | | CCO Holdings LLC/CCO Holdings Capital Corp., 4.500%, 8/15/2030, 144A | | | 294,013 | |
| | 205,000 | | | CCO Holdings LLC/CCO Holdings Capital Corp., 4.500%, 5/01/2032, 144A | | | 213,969 | |
| | 3,485,000 | | | CCO Holdings LLC/CCO Holdings Capital Corp., 4.750%, 3/01/2030, 144A | | | 3,689,744 | |
| | 690,000 | | | Connect Finco S.a.r.l./Connect U.S. Finco LLC, 6.750%, 10/01/2026, 144A | | | 692,173 | |
| | 520,000 | | | CSC Holdings LLC, 4.125%, 12/01/2030, 144A | | | 530,010 | |
| | 520,000 | | | CSC Holdings LLC, 4.625%, 12/01/2030, 144A | | | 523,900 | |
| | 710,000 | | | CSC Holdings LLC, 6.500%, 2/01/2029, 144A | | | 787,212 | |
| | 175,000 | | | DISH DBS Corp., 7.375%, 7/01/2028 | | | 180,250 | |
| | 875,000 | | | DISH DBS Corp., 7.750%, 7/01/2026 | | | 961,940 | |
| | 480,000 | | | Radiate Holdco LLC/Radiate Finance, Inc., 6.500%, 9/15/2028, 144A | | | 491,886 | |
| | 600,000 | | | Sirius XM Radio, Inc., 4.125%, 7/01/2030, 144A | | | 611,250 | |
| | 1,200,000 | | | Telenet Finance Luxembourg Notes S.a.r.l., 5.500%, 3/01/2028, 144A | | | 1,257,048 | |
| |
| | | | Cable Satellite – continued | |
| 555,000 | | | ViaSat, Inc., 6.500%, 7/15/2028, 144A | | | 555,805 | |
| | 250,000 | | | Virgin Media Finance PLC, 5.000%, 7/15/2030, 144A | | | 248,750 | |
| | 630,000 | | | Virgin Media Secured Finance PLC, 5.500%, 5/15/2029, 144A | | | 676,274 | |
| | 325,000 | | | Ziggo BV, 4.875%, 1/15/2030, 144A | | | 336,336 | |
| | | | | | | | |
| | | | | | | 13,429,011 | |
| | | | | | | | |
| |
| | | | Chemicals – 1.2% | |
| | 460,000 | | | Avient Corp., 5.750%, 5/15/2025, 144A | | | 487,600 | |
| | 200,000 | | | Braskem Netherlands Finance BV, 4.500%, 1/31/2030, 144A | | | 186,750 | |
| | 595,000 | | | Chemours Co. (The), 5.375%, 5/15/2027 | | | 589,050 | |
| | 25,000 | | | Chemours Co. (The), 7.000%, 5/15/2025 | | | 25,312 | |
| | 805,000 | | | Hercules LLC, 6.500%, 6/30/2029 | | | 807,198 | |
| | 290,000 | | | Hexion, Inc., 7.875%, 7/15/2027, 144A | | | 289,913 | |
| | 45,000 | | | Methanex Corp., 5.250%, 12/15/2029 | | | 44,494 | |
| | 225,000 | | | Methanex Corp., 5.650%, 12/01/2044 | | | 203,062 | |
| | 490,000 | | | Olin Corp., 5.000%, 2/01/2030 | | | 460,600 | |
| | 85,000 | | | Olin Corp., 5.125%, 9/15/2027 | | | 84,150 | |
| | 20,000 | | | Olin Corp., 5.625%, 8/01/2029 | | | 19,650 | |
| | | | | | | | |
| | | | | | | 3,197,779 | |
| | | | | | | | |
| |
| | | | Construction Machinery – 0.1% | |
| | 215,000 | | | United Rentals North America, Inc., 4.000%, 7/15/2030 | | | 220,375 | |
| | | | | | | | |
| |
| | | | Consumer Cyclical Services – 5.0% | |
| | 345,000 | | | ANGI Group LLC, 3.875%, 8/15/2028, 144A | | | 341,550 | |
| | 1,705,000 | | | Expedia Group, Inc., 3.250%, 2/15/2030 | | | 1,642,785 | |
| | 385,000 | | | Expedia Group, Inc., 4.625%, 8/01/2027, 144A | | | 404,027 | |
| | 910,000 | | | Expedia Group, Inc., 6.250%, 5/01/2025, 144A | | | 1,003,647 | |
| | 465,000 | | | Expedia Group, Inc., 7.000%, 5/01/2025, 144A | | | 502,929 | |
| | 1,355,000 | | | Prime Security Services Borrower LLC/Prime Finance, Inc., 6.250%, 1/15/2028, 144A | | | 1,371,937 | |
| | 20,000 | | | QVC, Inc., 4.450%, 2/15/2025 | | | 20,550 | |
| | 20,000 | | | QVC, Inc., 4.850%, 4/01/2024 | | | 20,902 | |
| | 495,000 | | | Realogy Group LLC/Realogy Co-Issuer Corp., 7.625%, 6/15/2025, 144A | | | 518,513 | |
| | 295,000 | | | ServiceMaster Co. LLC (The), 7.450%, 8/15/2027 | | | 321,919 | |
| | 525,000 | | | Staples, Inc., 7.500%, 4/15/2026, 144A | | | 485,184 | |
| | 155,000 | | | Uber Technologies, Inc., 6.250%, 1/15/2028, 144A | | | 159,216 | |
| | 730,000 | | | Uber Technologies, Inc., 7.500%, 9/15/2027, 144A | | | 781,100 | |
| | 4,765,000 | | | Uber Technologies, Inc., 8.000%, 11/01/2026, 144A | | | 5,078,489 | |
| | | | | | | | |
| | | | | | | 12,652,748 | |
| | | | | | | | |
| |
| | | | Consumer Products – 0.5% | |
| | 200,000 | | | Valvoline, Inc., 4.375%, 8/15/2025 | | | 205,750 | |
| | 210,000 | | | Prestige Brands, Inc., 5.125%, 1/15/2028, 144A | | | 216,825 | |
See accompanying notes to financial statements.
| 12
Portfolio of Investments – as of September 30, 2020
Loomis Sayles High Income Opportunities Fund – continued
| | | | | | | | |
Principal
Amount | | | Description | | Value (†) | |
|
| | Bonds and Notes – continued | |
| |
| | | | Consumer Products – continued | |
| $ | 140,000 | | | Mattel, Inc., 5.875%, 12/15/2027, 144A | | $ | 150,675 | |
| | 435,000 | | | Energizer Holdings, Inc., 4.375%, 3/31/2029, 144A | | | 439,350 | |
| | 150,000 | | | Newell Brands, Inc., 4.875%, 6/01/2025 | | | 161,812 | |
| | | | | | | | |
| | | | | | | 1,174,412 | |
| | | | | | | | |
| |
| | | | Diversified Manufacturing – 0.5% | |
| | 390,000 | | | Vertical U.S. Newco, Inc., 5.250%, 7/15/2027, 144A | | | 405,313 | |
| | 355,000 | | | WESCO Distribution, Inc., 7.125%, 6/15/2025, 144A | | | 386,702 | |
| | 490,000 | | | WESCO Distribution, Inc., 7.250%, 6/15/2028, 144A | | | 536,881 | |
| | | | | | | | |
| | | | | | | 1,328,896 | |
| | | | | | | | |
| |
| | | | Electric – 1.4% | |
| | 1,285,000 | | | Calpine Corp., 5.125%, 3/15/2028, 144A | | | 1,329,975 | |
| | 925,000 | | | Enel SpA, (fixed rate to 9/24/2023, variable rate thereafter), 8.750%, 9/24/2073, 144A | | | 1,079,641 | |
| | 105,000 | | | NRG Energy, Inc., 5.250%, 6/15/2029, 144A | | | 114,188 | |
| | 135,000 | | | NRG Energy, Inc., 5.750%, 1/15/2028 | | | 145,631 | |
| | 130,000 | | | Pattern Energy Operations LP/Pattern Energy Operations, Inc., 4.500%, 8/15/2028, 144A | | | 134,875 | |
| | 320,000 | | | PG&E Corp., 5.000%, 7/01/2028 | | | 310,400 | |
| | 315,000 | | | PG&E Corp., 5.250%, 7/01/2030 | | | 304,763 | |
| | 200,000 | | | Talen Energy Supply LLC, 10.500%, 1/15/2026, 144A | | | 152,000 | |
| | | | | | | | |
| | | | | | | 3,571,473 | |
| | | | | | | | |
| |
| | | | Finance Companies – 3.9% | |
| | 415,000 | | | AerCap Ireland Capital DAC/AerCap Global Aviation Trust, 6.500%, 7/15/2025 | | | 448,020 | |
| | 720,000 | | | Aviation Capital Group LLC, 5.500%, 12/15/2024, 144A | | | 742,850 | |
| | 1,000,000 | | | Navient Corp., 5.000%, 3/15/2027 | | | 939,030 | |
| | 245,000 | | | Navient Corp., 5.500%, 1/25/2023 | | | 246,557 | |
| | 980,000 | | | Navient Corp., 6.500%, 6/15/2022 | | | 999,600 | |
| | 1,110,000 | | | OneMain Finance Corp., 5.375%, 11/15/2029 | | | 1,154,400 | |
| | 150,000 | | | OneMain Finance Corp., 6.875%, 3/15/2025 | | | 166,451 | |
| | 1,110,000 | | | OneMain Finance Corp., 7.125%, 3/15/2026 | | | 1,240,092 | |
| | 410,000 | | | Provident Funding Associates LP/PFG Finance Corp., 6.375%, 6/15/2025, 144A | | | 396,675 | |
| | 2,315,000 | | | Quicken Loans LLC, 5.250%, 1/15/2028, 144A | | | 2,439,223 | |
| | 335,000 | | | Quicken Loans LLC/Quicken Loans Co-Issuer, Inc., 3.625%, 3/01/2029, 144A | | | 332,069 | |
| | 335,000 | | | Quicken Loans LLC/Quicken Loans Co-Issuer, Inc., 3.875%, 3/01/2031, 144A | | | 330,812 | |
| |
| | | | Finance Companies – continued | |
| 685,000 | | | Unifin Financiera SAB de CV, 7.250%, 9/27/2023, 144A | | | 589,723 | |
| | | | | | | | |
| | | | | | | 10,025,502 | |
| | | | | | | | |
| |
| | | | Financial Other – 1.9% | |
| | 1,805,000 | | | Icahn Enterprises LP/Icahn Enterprises Finance Corp., 4.750%, 9/15/2024 | | | 1,827,562 | |
| | 1,405,000 | | | Icahn Enterprises LP/Icahn Enterprises Finance Corp., 5.250%, 5/15/2027 | | | 1,463,729 | |
| | 135,000 | | | Icahn Enterprises LP/Icahn Enterprises Finance Corp., 6.250%, 5/15/2026 | | | 140,738 | |
| | 1,180,000 | | | Nationstar Mortgage Holdings, Inc., 6.000%, 1/15/2027, 144A | | | 1,202,845 | |
| | 270,000 | | | Nationstar Mortgage Holdings, Inc., 9.125%, 7/15/2026, 144A | | | 289,575 | |
| | | | | | | | |
| | | | | | | 4,924,449 | |
| | | | | | | | |
| |
| | | | Food & Beverage – 3.3% | |
| | 60,000 | | | Aramark Services, Inc., 4.750%, 6/01/2026 | | | 60,708 | |
| | 80,000 | | | Aramark Services, Inc., 5.000%, 2/01/2028, 144A | | | 80,600 | |
| | 695,000 | | | Aramark Services, Inc., 6.375%, 5/01/2025, 144A | | | 723,964 | |
| | 395,000 | | | Herbalife Nutrition Ltd./HLF Financing, Inc., 7.875%, 9/01/2025, 144A | | | 424,131 | |
| | 225,000 | | | JBS USA LUX S.A./JBS USA Finance, Inc., 5.750%, 6/15/2025, 144A | | | 231,930 | |
| | 65,000 | | | JBS USA LUX S.A./JBS USA Food Co./JBS USA Finance, Inc., 6.500%, 4/15/2029, 144A | | | 72,148 | |
| | 1,205,000 | | | Kraft Heinz Foods Co., 4.375%, 6/01/2046 | | | 1,236,414 | |
| | 735,000 | | | Kraft Heinz Foods Co., 4.875%, 10/01/2049, 144A | | | 775,658 | |
| | 650,000 | | | Kraft Heinz Foods Co., 4.875%, 10/01/2049 | | | 685,956 | |
| | 385,000 | | | Kraft Heinz Foods Co., 5.000%, 6/04/2042 | | | 421,622 | |
| | 35,000 | | | Kraft Heinz Foods Co., 5.200%, 7/15/2045 | | | 38,263 | |
| | 245,000 | | | Kraft Heinz Foods Co., 5.500%, 6/01/2050, 144A | | | 280,784 | |
| | 155,000 | | | Lamb Weston Holdings, Inc., 4.875%, 5/15/2028, 144A | | | 167,400 | |
| | 635,000 | | | NBM U.S Holdings, Inc., 7.000%, 5/14/2026, 144A | | | 672,141 | |
| | 510,000 | | | Performance Food Group, Inc., 5.500%, 10/15/2027, 144A | | | 525,300 | |
| | 180,000 | | | Pilgrim’s Pride Corp., 5.750%, 3/15/2025, 144A | | | 183,375 | |
| | 440,000 | | | Pilgrim’s Pride Corp., 5.875%, 9/30/2027, 144A | | | 454,300 | |
| | 590,000 | | | Post Holdings, Inc., 4.625%, 4/15/2030, 144A | | | 606,963 | |
| | 20,000 | | | Post Holdings, Inc., 5.500%, 12/15/2029, 144A | | | 21,400 | |
| | 310,000 | | | Post Holdings, Inc., 5.750%, 3/01/2027, 144A | | | 325,888 | |
| | 325,000 | | | TreeHouse Foods, Inc., 4.000%, 9/01/2028 | | | 328,699 | |
| | | | | | | | |
| | | | | | | 8,317,644 | |
| | | | | | | | |
See accompanying notes to financial statements.
13 |
Portfolio of Investments – as of September 30, 2020
Loomis Sayles High Income Opportunities Fund – continued
| | | | | | | | |
Principal
Amount | | | Description | | Value (†) | |
|
| | Bonds and Notes – continued | |
| |
| | | | Gaming – 3.5% | |
| $ | 980,000 | | | Boyd Gaming Corp., 4.750%, 12/01/2027 | | $ | 961,625 | |
| | 150,000 | | | Boyd Gaming Corp., 6.375%, 4/01/2026 | | | 156,179 | |
| | 510,000 | | | Caesars Entertainment, Inc., 6.250%, 7/01/2025, 144A | | | 533,075 | |
| | 640,000 | | | Caesars Entertainment, Inc., 8.125%, 7/01/2027, 144A | | | 678,400 | |
| | 225,000 | | | Caesars Resort Collection LLC/CRC Finco, Inc., 5.250%, 10/15/2025, 144A | | | 217,688 | |
| | 230,000 | | | Caesars Resort Collection LLC/CRC Finco, Inc., 5.750%, 7/01/2025, 144A | | | 237,187 | |
| | 200,000 | | | International Game Technology PLC, 5.250%, 1/15/2029, 144A | | | 202,250 | |
| | 351,000 | | | International Game Technology PLC, 6.250%, 2/15/2022, 144A | | | 358,459 | |
| | 400,000 | | | International Game Technology PLC, 6.250%, 1/15/2027, 144A | | | 429,000 | |
| | 500,000 | | | MGM Growth Properties Operating Partnership LP/MGP Finance Co-Issuer, Inc., 4.500%, 1/15/2028 | | | 509,375 | |
| | 790,000 | | | MGM Resorts International, 5.500%, 4/15/2027 | | | 825,550 | |
| | 370,000 | | | Scientific Games International, Inc., 7.000%, 5/15/2028, 144A | | | 370,906 | |
| | 190,000 | | | Scientific Games International, Inc., 7.250%, 11/15/2029, 144A | | | 192,850 | |
| | 630,000 | | | Studio City Finance Ltd., 6.000%, 7/15/2025, 144A | | | 644,049 | |
| | 540,000 | | | Studio City Finance Ltd., 6.500%, 1/15/2028, 144A | | | 564,300 | |
| | 180,000 | | | VICI Properties LP/VICI Note Co., Inc., 3.750%, 2/15/2027, 144A | | | 176,990 | |
| | 315,000 | | | VICI Properties LP/VICI Note Co., Inc., 4.125%, 8/15/2030, 144A | | | 309,881 | |
| | 1,090,000 | | | Wynn Las Vegas LLC/Wynn Las Vegas Capital Corp., 5.500%, 3/01/2025, 144A | | | 1,028,687 | |
| | 290,000 | | | Wynn Macau Ltd., 5.125%, 12/15/2029, 144A | | | 278,248 | |
| | 420,000 | | | Wynn Resorts Finance LLC/Wynn Resorts Capital Corp., 5.125%, 10/01/2029, 144A | | | 400,050 | |
| | | | | | | | |
| | | | | | | 9,074,749 | |
| | | | | | | | |
| |
| | | | Government Owned – No Guarantee – 0.4% | |
| | 600,000 | | | Petroleos Mexicanos, 5.950%, 1/28/2031, 144A | | | 506,700 | |
| | 285,000 | | | Petroleos Mexicanos, 6.625%, 6/15/2035 | | | 236,677 | |
| | 640,000 | | | YPF S.A., 6.950%, 7/21/2027, 144A | | | 427,200 | |
| | | | | | | | |
| | | | | | | 1,170,577 | |
| | | | | | | | |
| |
| | | | Healthcare – 4.9% | |
| | 655,000 | | | Avantor Funding, Inc., 4.625%, 7/15/2028, 144A | | | 679,562 | |
| | 80,000 | | | CHS/Community Health Systems, Inc., 6.250%, 3/31/2023 | | | 78,200 | |
| | 2,050,000 | | | CHS/Community Health Systems, Inc., 6.625%, 2/15/2025, 144A | | | 1,983,375 | |
| |
| | | | Healthcare – continued | |
| 845,000 | | | CHS/Community Health Systems, Inc., 8.000%, 3/15/2026, 144A | | | 830,635 | |
| | 610,000 | | | DaVita, Inc., 3.750%, 2/15/2031, 144A | | | 587,766 | |
| | 610,000 | | | Encompass Health Corp., 4.500%, 2/01/2028 | | | 613,050 | |
| | 930,000 | | | Encompass Health Corp., 4.750%, 2/01/2030 | | | 943,522 | |
| | 430,000 | | | HCA, Inc., 7.050%, 12/01/2027 | | | 502,025 | |
| | 35,000 | | | HCA, Inc., 7.500%, 12/15/2023 | | | 39,900 | |
| | 790,000 | | | HCA, Inc., 7.500%, 11/06/2033 | | | 1,050,700 | |
| | 40,000 | | | HCA, Inc., 7.690%, 6/15/2025 | | | 47,000 | |
| | 40,000 | | | HCA, Inc., 8.360%, 4/15/2024 | | | 47,100 | |
| | 205,000 | | | HCA, Inc., MTN, 7.580%, 9/15/2025 | | | 244,463 | |
| | 20,000 | | | HCA, Inc., MTN, 7.750%, 7/15/2036 | | | 25,500 | |
| | 105,000 | | | Hill-Rom Holdings, Inc., 4.375%, 9/15/2027, 144A | | | 108,670 | |
| | 665,000 | | | MPH Acquisition Holdings LLC, 7.125%, 6/01/2024, 144A | | | 683,188 | |
| | 290,000 | | | Polaris Intermediate Corp., 9.250% PIK or 8.500% Cash, 12/01/2022, 144A(d) | | | 295,075 | |
| | 115,000 | | | Select Medical Corp., 6.250%, 8/15/2026, 144A | | | 119,600 | |
| | 265,000 | | | Surgery Center Holdings, Inc., 6.750%, 7/01/2025, 144A | | | 263,675 | |
| | 170,000 | | | Tenet Healthcare Corp., 4.625%, 6/15/2028, 144A | | | 172,448 | |
| | 1,325,000 | | | Tenet Healthcare Corp., 5.125%, 5/01/2025 | | | 1,337,322 | |
| | 1,855,000 | | | Tenet Healthcare Corp., 6.125%, 10/01/2028, 144A | | | 1,803,987 | |
| | | | | | | | |
| | | | | | | 12,456,763 | |
| | | | | | | | |
| |
| | | | Home Construction – 1.0% | |
| | 255,000 | | | Brookfield Residential Properties, Inc./Brookfield Residential U.S Corp., 4.875%, 2/15/2030, 144A | | | 238,685 | |
| | 200,000 | | | Corporacion GEO SAB de CV, 8.875%, 3/27/2022, 144A(c)(e)(f)(g) | | | — | |
| | 275,000 | | | KB Home, 4.800%, 11/15/2029 | | | 303,187 | |
| | 300,000 | | | Mattamy Group Corp., 4.625%, 3/01/2030, 144A | | | 303,174 | |
| | 720,000 | | | PulteGroup, Inc., 6.000%, 2/15/2035 | | | 889,200 | |
| | 465,000 | | | Taylor Morrison Communities, Inc., 5.125%, 8/01/2030, 144A | | | 495,225 | |
| | 205,000 | | | Taylor Morrison Communities, Inc., 5.750%, 1/15/2028, 144A | | | 222,938 | |
| | 205,000 | | | TRI Pointe Group, Inc., 5.700%, 6/15/2028 | | | 224,475 | |
| | | | | | | | |
| | | | | | | 2,676,884 | |
| | | | | | | | |
| |
| | | | Independent Energy – 5.9% | |
| | 480,000 | | | Apache Corp., 4.250%, 1/15/2030 | | | 432,444 | |
| | 225,000 | | | Apache Corp., 4.250%, 1/15/2044 | | | 191,250 | |
| | 225,000 | | | Centennial Resource Production LLC, 8.000%, 6/01/2025, 144A | | | 182,376 | |
| | 300,000 | | | Comstock Resources, Inc., 9.750%, 8/15/2026 | | | 307,560 | |
| | 365,000 | | | Continental Resources, Inc., 3.800%, 6/01/2024 | | | 336,712 | |
| | 605,000 | | | Continental Resources, Inc., 4.375%, 1/15/2028 | | | 524,081 | |
See accompanying notes to financial statements.
| 14
Portfolio of Investments – as of September 30, 2020
Loomis Sayles High Income Opportunities Fund – continued
| | | | | | | | |
Principal
Amount | | | Description | | Value (†) | |
|
| | Bonds and Notes – continued | |
| |
| | | | Independent Energy – continued | |
| $ | 285,000 | | | Continental Resources, Inc., 4.500%, 4/15/2023 | | $ | 271,605 | |
| | 410,000 | | | Continental Resources, Inc., 4.900%, 6/01/2044 | | | 308,800 | |
| | 35,000 | | | Diamondback Energy, Inc., 3.500%, 12/01/2029 | | | 33,930 | |
| | 90,000 | | | Endeavor Energy Resources LP/EER Finance, Inc., 5.500%, 1/30/2026, 144A | | | 89,325 | |
| | 140,000 | | | Endeavor Energy Resources LP/EER Finance, Inc., 6.625%, 7/15/2025, 144A | | | 143,850 | |
| | 75,000 | | | EQT Corp., 7.875%, 2/01/2025 | | | 83,134 | |
| | 595,000 | | | EQT Corp., 8.750%, 2/01/2030 | | | 702,100 | |
| | 210,000 | | | Leviathan Bond Ltd., 6.125%, 6/30/2025, 144A | | | 216,926 | |
| | 300,000 | | | Leviathan Bond Ltd., 6.500%, 6/30/2027, 144A | | | 311,022 | |
| | 300,000 | | | MEG Energy Corp., 7.125%, 2/01/2027, 144A | | | 269,049 | |
| | 255,000 | | | Montage Resources Corp., 8.875%, 7/15/2023 | | | 259,144 | |
| | 300,000 | | | Murphy Oil Corp., 6.375%, 12/01/2042 | | | 235,500 | |
| | 510,000 | | | Newfield Exploration Co., 5.375%, 1/01/2026 | | | 478,956 | |
| | 276,000 | | | Occidental Petroleum Corp., 2.700%, 2/15/2023 | | | 252,540 | |
| | 2,130,000 | | | Occidental Petroleum Corp., 2.900%, 8/15/2024 | | | 1,807,156 | |
| | 90,000 | | | Occidental Petroleum Corp., 3.000%, 2/15/2027 | | | 70,582 | |
| | 80,000 | | | Occidental Petroleum Corp., 3.200%, 8/15/2026 | | | 63,450 | |
| | 55,000 | | | Occidental Petroleum Corp., 3.400%, 4/15/2026 | | | 43,862 | |
| | 825,000 | | | Occidental Petroleum Corp., 3.500%, 6/15/2025 | | | 684,750 | |
| | 1,575,000 | | | Occidental Petroleum Corp., 3.500%, 8/15/2029 | | | 1,206,765 | |
| | 10,000 | | | Occidental Petroleum Corp., 4.200%, 3/15/2048 | | | 6,875 | |
| | 415,000 | | | Occidental Petroleum Corp., 4.400%, 8/15/2049 | | | 290,544 | |
| | 200,000 | | | Occidental Petroleum Corp., 5.550%, 3/15/2026 | | | 181,182 | |
| | 590,000 | | | Occidental Petroleum Corp., 5.875%, 9/01/2025 | | | 540,711 | |
| | 260,000 | | | Occidental Petroleum Corp., 8.500%, 7/15/2027 | | | 262,005 | |
| | 240,000 | | | Occidental Petroleum Corp., 8.875%, 7/15/2030 | | | 247,200 | |
| | 435,000 | | | Ovintiv, Inc., 6.500%, 8/15/2034 | | | 405,080 | |
| | 100,000 | | | Ovintiv, Inc., 6.625%, 8/15/2037 | | | 91,458 | |
| | 445,000 | | | Parsley Energy LLC/Parsley Finance Corp., 5.250%, 8/15/2025, 144A | | | 440,550 | |
| | 185,000 | | | Parsley Energy LLC/Parsley Finance Corp., 5.375%, 1/15/2025, 144A | | | 184,537 | |
| | 450,000 | | | Parsley Energy LLC/Parsley Finance Corp., 5.625%, 10/15/2027, 144A | | | 447,750 | |
| |
| | | | Independent Energy – continued | |
| 79,000 | | | Range Resources Corp., 5.000%, 3/15/2023 | | | 75,050 | |
| | 385,000 | | | Range Resources Corp., 9.250%, 2/01/2026, 144A | | | 395,587 | |
| | 600,000 | | | Seven Generations Energy Ltd., 5.375%, 9/30/2025, 144A | | | 568,500 | |
| | 256,000 | | | SM Energy Co., 10.000%, 1/15/2025, 144A | | | 244,303 | |
| | 465,000 | | | Southwestern Energy Co., 6.450%, 1/23/2025 | | | 450,469 | |
| | 60,000 | | | Southwestern Energy Co., 7.500%, 4/01/2026 | | | 58,650 | |
| | 45,000 | | | Southwestern Energy Co., 7.750%, 10/01/2027 | | | 43,763 | |
| | 340,000 | | | Vine Oil & Gas LP/Vine Oil & Gas Finance Corp., 9.750%, 4/15/2023, 144A | | | 231,200 | |
| | 90,000 | | | WPX Energy, Inc., 5.250%, 10/15/2027 | | | 91,350 | |
| | 265,000 | | | WPX Energy, Inc., 5.875%, 6/15/2028 | | | 276,925 | |
| | | | | | | | |
| | | | | | | 15,040,558 | |
| | | | | | | | |
| |
| | | | Industrial Other – 0.5% | |
| | 145,000 | | | Hillenbrand, Inc., 5.750%, 6/15/2025 | | | 154,606 | |
| | 975,000 | | | HTA Group Ltd. Co., 7.000%, 12/18/2025, 144A | | | 1,018,631 | |
| | 150,000 | | | Installed Building Products, Inc., 5.750%, 2/01/2028, 144A | | | 157,875 | |
| | | | | | | | |
| | | | | | | 1,331,112 | |
| | | | | | | | |
| |
| | | | Integrated Energy – 0.3% | |
| | 70,000 | | | Cenovus Energy, Inc., 4.250%, 4/15/2027 | | | 63,286 | |
| | 45,000 | | | Cenovus Energy, Inc., 5.250%, 6/15/2037 | | | 38,815 | |
| | 235,000 | | | Cenovus Energy, Inc., 5.375%, 7/15/2025 | | | 226,173 | |
| | 450,000 | | | Cenovus Energy, Inc., 5.400%, 6/15/2047 | | | 380,181 | |
| | | | | | | | |
| | | | | | | 708,455 | |
| | | | | | | | |
| |
| | | | Internet & Data – 0.1% | |
| | 210,000 | | | Cablevision Lightpath LLC, 5.625%, 9/15/2028, 144A | | | 213,087 | |
| | | | | | | | |
| |
| | | | Leisure – 1.1% | |
| | 360,000 | | | Carnival Corp., 9.875%, 8/01/2027, 144A | | | 381,452 | |
| | 275,000 | | | Cedar Fair LP/Canada’s Wonderland Co./Magnum Management Corp., 5.375%, 6/01/2024 | | | 263,142 | |
| | 1,025,000 | | | Live Nation Entertainment, Inc., 4.750%, 10/15/2027, 144A | | | 959,974 | |
| | 380,000 | | | Royal Caribbean Cruises Ltd., 11.500%, 6/01/2025, 144A | | | 440,821 | |
| | 280,000 | | | Six Flags Entertainment Corp., 4.875%, 7/31/2024, 144A | | | 263,388 | |
| | 585,000 | | | Speedway Motorsports LLC/Speedway Funding II, Inc., 4.875%, 11/01/2027, 144A | | | 561,425 | |
| | | | | | | | |
| | | | | | | 2,870,202 | |
| | | | | | | | |
See accompanying notes to financial statements.
15 |
Portfolio of Investments – as of September 30, 2020
Loomis Sayles High Income Opportunities Fund – continued
| | | | | | | | |
Principal
Amount | | | Description | | Value (†) | |
|
| | Bonds and Notes – continued | |
| |
| | | | Lodging – 2.0% | |
| $ | 720,000 | | | Marriott Ownership Resorts, Inc., 4.750%, 1/15/2028 | | $ | 676,800 | |
| | 545,000 | | | Marriott Ownership Resorts, Inc., 6.125%, 9/15/2025, 144A | | | 561,350 | |
| | 1,460,000 | | | Marriott Ownership Resorts, Inc./ILG LLC, 6.500%, 9/15/2026 | | | 1,499,011 | |
| | 975,000 | | | Wyndham Destinations, Inc., 3.900%, 3/01/2023 | | | 955,500 | |
| | 300,000 | | | Wyndham Destinations, Inc., 4.625%, 3/01/2030, 144A | | | 289,500 | |
| | 665,000 | | | Wyndham Destinations, Inc., 5.625%, 3/01/2021 | | | 666,663 | |
| | 515,000 | | | Wyndham Destinations, Inc., 6.625%, 7/31/2026, 144A | | | 539,519 | |
| | | | | | | | |
| | | | | | | 5,188,343 | |
| | | | | | | | |
| |
| | | | Media Entertainment – 4.2% | |
| | 230,000 | | | Clear Channel International BV, 6.625%, 8/01/2025, 144A | | | 235,244 | |
| | 745,000 | | | Clear Channel Worldwide Holdings, Inc., 9.250%, 2/15/2024 | | | 722,203 | |
| | 970,000 | | | Diamond Sports Group LLC/Diamond Sports Finance Co., 5.375%, 8/15/2026, 144A | | | 686,275 | |
| | 360,000 | | | Diamond Sports Group LLC/Diamond Sports Finance Co., 6.625%, 8/15/2027, 144A | | | 187,425 | |
| | 335,000 | | | iHeartCommunications, Inc., 4.750%, 1/15/2028, 144A | | | 315,720 | |
| | 165,000 | | | iHeartCommunications, Inc., 6.375%, 5/01/2026 | | | 171,893 | |
| | 3,360,000 | | | iHeartCommunications, Inc., 8.375%, 5/01/2027 | | | 3,309,600 | |
| | 800,000 | | | Lamar Media Corp., 3.750%, 2/15/2028, 144A | | | 796,000 | |
| | 150,000 | | | Lamar Media Corp., 4.000%, 2/15/2030, 144A | | | 150,000 | |
| | 575,000 | | | Meredith Corp., 6.875%, 2/01/2026 | | | 480,125 | |
| | 1,085,000 | | | Netflix, Inc., 4.875%, 6/15/2030, 144A | | | 1,236,900 | |
| | 415,000 | | | Netflix, Inc., 5.375%, 11/15/2029, 144A | | | 489,140 | |
| | 115,000 | | | Nexstar Broadcasting, Inc., 5.625%, 7/15/2027, 144A | | | 120,794 | |
| | 490,000 | | | Nielsen Finance LLC/Nielsen Finance Co., 5.625%, 10/01/2028, 144A | | | 506,807 | |
| | 470,000 | | | Nielsen Finance LLC/Nielsen Finance Co., 5.875%, 10/01/2030, 144A | | | 488,616 | |
| | 370,000 | | | Outfront Media Capital LLC/Outfront Media Capital Corp., 6.250%, 6/15/2025, 144A | | | 381,100 | |
| | 200,000 | | | Terrier Media Buyer, Inc., 8.875%, 12/15/2027, 144A | | | 201,500 | |
| | 230,000 | | | Univision Communications, Inc., 6.625%, 6/01/2027, 144A | | | 224,537 | |
| | | | | | | | |
| | | | | | | 10,703,879 | |
| | | | | | | | |
| |
| | | | Metals & Mining – 4.7% | |
| | 825,000 | | | ABJA Investment Co. Pte Ltd., 5.450%, 1/24/2028 | | | 797,783 | |
| | 485,000 | | | Alcoa Nederland Holding BV, 5.500%, 12/15/2027, 144A | | | 505,467 | |
| |
| | | | Metals & Mining – continued | |
| 75,000 | | | Allegheny Technologies, Inc., 5.875%, 12/01/2027 | | | 72,071 | |
| | 560,000 | | | ArcelorMittal S.A., 7.000%, 3/01/2041 | | | 691,600 | |
| | 145,000 | | | ArcelorMittal S.A., 7.250%, 10/15/2039 | | | 183,012 | |
| | 55,000 | | | Carpenter Technology Corp., 6.375%, 7/15/2028 | | | 57,564 | |
| | 85,000 | | | Cleveland-Cliffs, Inc., 6.750%, 3/15/2026, 144A | | | 86,488 | |
| | 550,000 | | | Cleveland-Cliffs, Inc., 9.875%, 10/17/2025, 144A | | | 613,938 | |
| | 545,000 | | | Commercial Metals Co., 4.875%, 5/15/2023 | | | 566,800 | |
| | 460,000 | | | First Quantum Minerals Ltd., 6.500%, 3/01/2024, 144A | | | 441,025 | |
| | 2,560,000 | | | First Quantum Minerals Ltd., 6.875%, 3/01/2026, 144A | | | 2,467,200 | |
| | 615,000 | | | First Quantum Minerals Ltd., 7.250%, 4/01/2023, 144A | | | 614,231 | |
| | 600,000 | | | First Quantum Minerals Ltd., 7.500%, 4/01/2025, 144A | | | 593,466 | |
| | 565,000 | | | Freeport-McMoRan, Inc., 4.125%, 3/01/2028 | | | 572,063 | |
| | 955,000 | | | Freeport-McMoRan, Inc., 4.250%, 3/01/2030 | | | 978,875 | |
| | 85,000 | | | Freeport-McMoRan, Inc., 4.375%, 8/01/2028 | | | 87,886 | |
| | 65,000 | | | Freeport-McMoRan, Inc., 4.625%, 8/01/2030 | | | 68,344 | |
| | 190,000 | | | Freeport-McMoRan, Inc., 5.000%, 9/01/2027 | | | 198,465 | |
| | 935,000 | | | Mineral Resources Ltd., 8.125%, 5/01/2027, 144A | | | 1,014,671 | |
| | 960,000 | | | Novelis Corp., 4.750%, 1/30/2030, 144A | | | 942,931 | |
| | 390,000 | | | United States Steel Corp., 6.250%, 3/15/2026 | | | 264,225 | |
| | 95,000 | | | United States Steel Corp., 6.875%, 8/15/2025 | | | 69,832 | |
| | | | | | | | |
| | | | | | | 11,887,937 | |
| | | | | | | | |
| |
| | | | Midstream – 4.9% | |
| | 185,000 | | | Buckeye Partners LP, 5.600%, 10/15/2044 | | | 164,089 | |
| | 130,000 | | | Buckeye Partners LP, 5.850%, 11/15/2043 | | | 120,425 | |
| | 95,000 | | | DCP Midstream Operating LP, 5.125%, 5/15/2029 | | | 93,575 | |
| | 160,000 | | | DCP Midstream Operating LP, 5.375%, 7/15/2025 | | | 164,973 | |
| | 540,000 | | | DCP Midstream Operating LP, 5.625%, 7/15/2027 | | | 550,827 | |
| | 95,000 | | | Enable Midstream Partners LP, 4.400%, 3/15/2027 | | | 91,046 | |
| | 195,000 | | | Enable Midstream Partners LP, 4.950%, 5/15/2028 | | | 190,383 | |
| | 1,715,000 | | | Energy Transfer Operating LP, Series A, (fixed rate to 2/15/2023, variable rate thereafter), 6.250%(h) | | | 1,119,038 | |
| | 785,000 | | | EnLink Midstream Partners LP, 4.850%, 7/15/2026 | | | 679,111 | |
See accompanying notes to financial statements.
| 16
Portfolio of Investments – as of September 30, 2020
Loomis Sayles High Income Opportunities Fund – continued
| | | | | | | | |
Principal
Amount | | | Description | | Value (†) | |
|
| | Bonds and Notes – continued | |
| |
| | | | Midstream – continued | |
| $ | 90,000 | | | EnLink Midstream Partners LP, 5.050%, 4/01/2045 | | $ | 57,150 | |
| | 490,000 | | | EnLink Midstream Partners LP, 5.450%, 6/01/2047 | | | 308,700 | |
| | 250,000 | | | EnLink Midstream Partners LP, 5.600%, 4/01/2044 | | | 160,625 | |
| | 455,000 | | | EQM Midstream Partners LP, 6.000%, 7/01/2025, 144A | | | 469,219 | |
| | 470,000 | | | EQM Midstream Partners LP, 6.500%, 7/01/2027, 144A | | | 498,209 | |
| | 100,000 | | | EQM Midstream Partners LP, Series 10Y, 5.500%, 7/15/2028 | | | 100,705 | |
| | 625,000 | | | Genesis Energy LP/Genesis Energy Finance Corp., 7.750%, 2/01/2028 | | | 543,031 | |
| | 260,000 | | | Harvest Midstream I LP, 7.500%, 9/01/2028, 144A | | | 258,700 | |
| | 2,095,000 | | | Hess Midstream Operations LP, 5.625%, 2/15/2026, 144A | | | 2,134,239 | |
| | 545,000 | | | New Fortress Energy, Inc., 6.750%, 9/15/2025, 144A | | | 569,798 | |
| | 80,000 | | | NGL Energy Partners LP/NGL Energy Finance Corp., 6.125%, 3/01/2025 | | | 47,600 | |
| | 540,000 | | | NGPL PipeCo LLC, 4.875%, 8/15/2027, 144A | | | 585,977 | |
| | 370,000 | | | NuStar Logistics LP, 5.750%, 10/01/2025 | | | 382,136 | |
| | 85,000 | | | Tallgrass Energy Partners LP/Tallgrass Energy Finance Corp., 5.500%, 9/15/2024, 144A | | | 79,900 | |
| | 90,000 | | | Tallgrass Energy Partners LP/Tallgrass Energy Finance Corp., 5.500%, 1/15/2028, 144A | | | 81,000 | |
| | 395,000 | | | Tallgrass Energy Partners LP/Tallgrass Energy Finance Corp., 6.000%, 3/01/2027, 144A | | | 361,425 | |
| | 1,250,000 | | | Targa Resources Partners LP/Targa Resources Partners Finance Corp., 5.500%, 3/01/2030, 144A | | | 1,251,312 | |
| | 735,000 | | | Western Midstream Operating LP, 5.050%, 2/01/2030 | | | 715,350 | |
| | 50,000 | | | Western Midstream Operating LP, 5.300%, 3/01/2048 | | | 40,250 | |
| | 345,000 | | | Western Midstream Operating LP, 5.450%, 4/01/2044 | | | 294,975 | |
| | 345,000 | | | Western Midstream Operating LP, 6.250%, 2/01/2050 | | | 319,556 | |
| | | | | | | | |
| | | | | | | 12,433,324 | |
| | | | | | | | |
| |
| | | | Non-Agency Commercial Mortgage-Backed Securities – 0.5% | |
| | 100,000 | | | CG-CCRE Commercial Mortgage Trust, Series 2014-FL2, Class COL1, 1-month LIBOR + 3.500%, 3.652%, 11/15/2031, 144A(b)(e)(i) | | | 70,337 | |
| | 180,000 | | | CG-CCRE Commercial Mortgage Trust, Series 2014-FL2, Class COL2, 1-month LIBOR + 4.500%, 4.652%, 11/15/2031, 144A(b)(e)(i) | | | 113,821 | |
| |
| | | | Non-Agency Commercial Mortgage-Backed Securities – continued | |
| 795,000 | | | Credit Suisse Mortgage Trust, Series 2014-USA, Class E, 4.373%, 9/15/2037, 144A(e)(i) | | | 540,967 | |
| | 5,000 | | | GS Mortgage Securities Trust, Series 2011-GC5, Class D, 5.555%, 8/10/2044, 144A(a)(e)(i) | | | 3,980 | |
| | 275,000 | | | Morgan Stanley Capital I Trust, Series 2011-C2, Class E, 5.661%, 6/15/2044, 144A(a) | | | 158,371 | |
| | 320,000 | | | Starwood Retail Property Trust, Series 2014-STAR, Class D,
1-month LIBOR + 3.500%, 3.652%, 11/15/2027, 144A(b)(e)(f)(g) | | | 197,762 | |
| | 350,000 | | | Starwood Retail Property Trust, Series 2014-STAR, Class E,
1-month LIBOR + 4.400%, 4.552%, 11/15/2027, 144A(b)(e)(f)(g) | | | 116,676 | |
| | 100,000 | | | WFRBS Commercial Mortgage Trust, Series 2012-C7, Class E, 4.965%, 6/15/2045, 144A(a) | | | 38,548 | |
| | | | | | | | |
| | | | | | | 1,240,462 | |
| | | | | | | | |
| |
| | | | Oil Field Services – 0.4% | |
| | 1,400,000 | | | Shelf Drilling Holdings Ltd., 8.250%, 2/15/2025, 144A | | | 553,000 | |
| | 639,600 | | | Transocean Guardian Ltd., 5.875%, 1/15/2024, 144A | | | 412,542 | |
| | 87,750 | | | Transocean Proteus Ltd., 6.250%, 12/01/2024, 144A | | | 78,317 | |
| | | | | | | | |
| | | | | | | 1,043,859 | |
| | | | | | | | |
| |
| | | | Packaging – 1.6% | |
| | 1,300,000 | | | ARD Finance S.A., 7.250% PIK or 6.500% Cash, 6/30/2027, 144A(d) | | | 1,293,240 | |
| | 1,155,000 | | | Ardagh Packaging Finance PLC/Ardagh Holdings USA, Inc., 5.250%, 8/15/2027, 144A | | | 1,176,945 | |
| | 170,000 | | | Graham Packaging Co., Inc., 7.125%, 8/15/2028, 144A | | | 177,013 | |
| | 220,000 | | | Intelligent Packaging Ltd Finco, Inc./Intelligent Packaging Ltd. Co-Issuer LLC, 6.000%, 9/15/2028, 144A | | | 223,091 | |
| | 610,000 | | | Mauser Packaging Solutions Holding Co., 7.250%, 4/15/2025, 144A | | | 574,162 | |
| | 665,000 | | | OI European Group BV, 4.000%, 3/15/2023, 144A | | | 674,975 | |
| | | | | | | | |
| | | | | | | 4,119,426 | |
| | | | | | | | |
| |
| | | | Pharmaceuticals – 3.6% | |
| | 215,000 | | | Bausch Health Americas, Inc., 9.250%, 4/01/2026, 144A | | | 236,500 | |
| | 180,000 | | | Bausch Health Cos., Inc., 5.000%, 1/30/2028, 144A | | | 174,825 | |
| | 1,260,000 | | | Bausch Health Cos., Inc., 5.250%, 1/30/2030, 144A | | | 1,241,100 | |
| | 885,000 | | | Bausch Health Cos., Inc., 6.250%, 2/15/2029, 144A | | | 910,276 | |
| | 185,000 | | | Bausch Health Cos., Inc., 7.250%, 5/30/2029, 144A | | | 199,338 | |
| | 835,000 | | | Bausch Health Cos., Inc., 9.000%, 12/15/2025, 144A | | | 908,313 | |
See accompanying notes to financial statements.
17 |
Portfolio of Investments – as of September 30, 2020
Loomis Sayles High Income Opportunities Fund – continued
| | | | | | | | |
Principal
Amount | | | Description | | Value (†) | |
|
| | Bonds and Notes – continued | |
| |
| | | | Pharmaceuticals – continued | |
| $ | 165,000 | | | Catalent Pharma Solutions, Inc., 5.000%, 7/15/2027, 144A | | $ | 171,600 | |
| | 555,000 | | | Endo Dac/Endo Finance LLC/Endo Finco, Inc., 6.000%, 6/30/2028, 144A | | | 407,925 | |
| | 363,000 | | | Endo Dac/Endo Finance LLC/Endo Finco, Inc., 9.500%, 7/31/2027, 144A | | | 379,335 | |
| | 390,000 | | | Jaguar Holding Co. II/PPD Development LP, 5.000%, 6/15/2028, 144A | | | 407,063 | |
| | 136,000 | | | Par Pharmaceutical, Inc., 7.500%, 4/01/2027, 144A | | | 142,484 | |
| | 170,000 | | | Teva Pharmaceutical Finance Netherlands III BV, 2.800%, 7/21/2023 | | | 162,479 | |
| | 650,000 | | | Teva Pharmaceutical Finance Netherlands III BV, 3.150%, 10/01/2026 | | | 573,436 | |
| | 3,740,000 | | | Teva Pharmaceutical Finance Netherlands III BV, 4.100%, 10/01/2046 | | | 3,110,558 | |
| | 295,000 | | | Teva Pharmaceutical Finance Netherlands III BV, 7.125%, 1/31/2025 | | | 309,750 | |
| | | | | | | | |
| | | | | | | 9,334,982 | |
| | | | | | | | |
| |
| | | | Property & Casualty Insurance – 0.2% | |
| | 150,000 | | | AmWINS Group, Inc., 7.750%, 7/01/2026, 144A | | | 160,500 | |
| | 265,000 | | | Ardonagh Midco 2 PLC, 11.500%, 1/15/2027, 144A | | | 267,650 | |
| | | | | | | | |
| | | | | | | 428,150 | |
| | | | | | | | |
| |
| | | | Refining – 0.5% | |
| | 540,000 | | | Parkland Corp., 5.875%, 7/15/2027, 144A | | | 567,675 | |
| | 715,000 | | | Parkland Corp., 6.000%, 4/01/2026, 144A | | | 748,962 | |
| | | | | | | | |
| | | | | | | 1,316,637 | |
| | | | | | | | |
| |
| | | | REITs – Hotels – 0.5% | |
| | 430,000 | | | Host Hotels & Resorts LP, 3.500%, 9/15/2030 | | | 411,600 | |
| | 380,000 | | | Service Properties Trust, 4.750%, 10/01/2026 | | | 337,942 | |
| | 645,000 | | | Service Properties Trust, 4.350%, 10/01/2024 | | | 583,725 | |
| | | | | | | | |
| | | | | | | 1,333,267 | |
| | | | | | | | |
| |
| | | | REITs – Mortgage – 1.2% | |
| | 525,000 | | | Ladder Capital Finance Holdings LLLP/Ladder Capital Finance Corp., 4.250%, 2/01/2027, 144A | | | 454,125 | |
| | 610,000 | | | Ladder Capital Finance Holdings LLLP/Ladder Capital Finance Corp., 5.250%, 3/15/2022, 144A | | | 597,983 | |
| | 615,000 | | | Ladder Capital Finance Holdings LLLP/Ladder Capital Finance Corp., 5.250%, 10/01/2025, 144A | | | 569,644 | |
| | 1,365,000 | | | Ladder Capital Finance Holdings LLLP/Ladder Capital Finance Corp., 5.875%, 8/01/2021, 144A | | | 1,363,293 | |
| | | | | | | | |
| | | | | | | 2,985,045 | |
| | | | | | | | |
| |
| | | | REITs – Regional Malls – 0.4% | |
| 1,215,000 | | | Brookfield Property REIT, Inc./BPR Cumulus LLC/BPR Nimbus LLC/GGSI Sellco LLC, 5.750%, 5/15/2026, 144A | | | 957,505 | |
| | | | | | | | |
| |
| | | | Restaurants – 0.9% | |
| | 1,280,000 | | | 1011778 BC ULC/New Red Finance, Inc., 4.000%, 10/15/2030, 144A | | | 1,289,869 | |
| | 805,000 | | | Yum! Brands, Inc., 3.625%, 3/15/2031 | | | 805,000 | |
| | 125,000 | | | Yum! Brands, Inc., 4.750%, 1/15/2030, 144A | | | 135,000 | |
| | | | | | | | |
| | | | | | | 2,229,869 | |
| | | | | | | | |
| |
| | | | Retailers – 2.1% | |
| | 91,000 | | | Asbury Automotive Group, Inc., 4.500%, 3/01/2028, 144A | | | 91,569 | |
| | 99,000 | | | Asbury Automotive Group, Inc., 4.750%, 3/01/2030, 144A | | | 99,743 | |
| | 120,000 | | | AutoNation, Inc., 4.750%, 6/01/2030 | | | 141,386 | |
| | 1,085,000 | | | Carvana Co., 5.625%, 10/01/2025, 144A | | | 1,070,418 | |
| | 1,085,000 | | | Carvana Co., 5.875%, 10/01/2028, 144A | | | 1,072,164 | |
| | 480,000 | | | Dillard’s, Inc., 7.000%, 12/01/2028 | | | 492,442 | |
| | 80,000 | | | Group 1 Automotive, Inc., 4.000%, 8/15/2028, 144A | | | 78,600 | |
| | 130,000 | | | Ken Garff Automotive LLC, 4.875%, 9/15/2028, 144A | | | 127,887 | |
| | 185,000 | | | L Brands, Inc., 5.250%, 2/01/2028 | | | 178,987 | |
| | 215,000 | | | L Brands, Inc., 6.625%, 10/01/2030, 144A | | | 218,762 | |
| | 150,000 | | | L Brands, Inc., 6.750%, 7/01/2036 | | | 147,000 | |
| | 455,000 | | | L Brands, Inc., 6.875%, 11/01/2035 | | | 448,314 | |
| | 270,000 | | | Lithia Motors, Inc., 4.375%, 1/15/2031, 144A | | | 270,000 | |
| | 115,000 | | | Murphy Oil USA, Inc., 4.750%, 9/15/2029 | | | 122,475 | |
| | 580,000 | | | PetSmart, Inc., 7.125%, 3/15/2023, 144A | | | 585,075 | |
| | 50,000 | | | PetSmart, Inc., 8.875%, 6/01/2025, 144A | | | 51,873 | |
| | 135,000 | | | William Carter Co. (The), 5.625%, 3/15/2027, 144A | | | 140,906 | |
| | | | | | | | |
| | | | | | | 5,337,601 | |
| | | | | | | | |
| |
| | | | Supermarkets – 0.3% | |
| | 755,000 | | | Albertsons Cos., Inc./Safeway, Inc./New Albertsons LP/Albertsons LLC, 4.875%, 2/15/2030, 144A | | | 787,087 | |
| | | | | | | | |
| |
| | | | Technology – 4.1% | |
| | 240,000 | | | BY Crown Parent LLC/BY Bond Finance, Inc., 4.250%, 1/31/2026, 144A | | | 244,350 | |
| | 415,000 | | | Camelot Finance S.A., 4.500%, 11/01/2026, 144A | | | 423,300 | |
| | 2,475,000 | | | CommScope Technologies LLC, 5.000%, 3/15/2027, 144A | | | 2,376,000 | |
| | 373,000 | | | CommScope Technologies LLC, 6.000%, 6/15/2025, 144A | | | 378,054 | |
| | 575,000 | | | CommScope, Inc., 7.125%, 7/01/2028, 144A | | | 590,812 | |
See accompanying notes to financial statements.
| 18
Portfolio of Investments – as of September 30, 2020
Loomis Sayles High Income Opportunities Fund – continued
| | | | | | | | |
Principal
Amount | | | Description | | Value (†) | |
|
| | Bonds and Notes – continued | |
| |
| | | | Technology – continued | |
| $ | 39,000 | | | Dun & Bradstreet Corp. (The), 6.875%, 8/15/2026, 144A | | $ | 41,888 | |
| | 1,390,000 | | | Iron Mountain, Inc., 4.875%, 9/15/2029, 144A | | | 1,414,325 | |
| | 250,000 | | | Logan Merger Sub, Inc., 5.500%, 9/01/2027, 144A | | | 252,888 | |
| | 195,000 | | | NCR Corp., 5.000%, 10/01/2028, 144A | | | 195,156 | |
| | 210,000 | | | NCR Corp., 5.250%, 10/01/2030, 144A | | | 210,000 | |
| | 75,000 | | | NCR Corp., 8.125%, 4/15/2025, 144A | | | 82,894 | |
| | 930,000 | | | Nokia OYJ, 4.375%, 6/12/2027 | | | 987,544 | |
| | 515,000 | | | Open Text Corp., 3.875%, 2/15/2028, 144A | | | 519,918 | |
| | 20,000 | | | Open Text Corp., 5.875%, 6/01/2026, 144A | | | 20,750 | |
| | 130,000 | | | Presidio Holdings, Inc., 4.875%, 2/01/2027, 144A | | | 131,300 | |
| | 130,000 | | | Presidio Holdings, Inc., 8.250%, 2/01/2028, 144A | | | 136,175 | |
| | 205,000 | | | PTC, Inc., 3.625%, 2/15/2025, 144A | | | 208,075 | |
| | 290,000 | | | PTC, Inc., 4.000%, 2/15/2028, 144A | | | 298,069 | |
| | 335,000 | | | Sabre GLBL, Inc., 5.250%, 11/15/2023, 144A | | | 327,463 | |
| | 175,000 | | | Sabre GLBL, Inc., 7.375%, 9/01/2025, 144A | | | 176,750 | |
| | 65,000 | | | Sabre GLBL, Inc., 9.250%, 4/15/2025, 144A | | | 71,537 | |
| | 20,000 | | | Science Applications International Corp., 4.875%, 4/01/2028, 144A | | | 20,306 | |
| | 130,000 | | | Seagate HDD Cayman, 4.125%, 1/15/2031, 144A | | | 140,295 | |
| | 195,000 | | | Sensata Technologies, Inc., 3.750%, 2/15/2031, 144A | | | 193,781 | |
| | 140,000 | | | SS&C Technologies, Inc., 5.500%, 9/30/2027, 144A | | | 148,781 | |
| | 260,000 | | | Veritas U.S., Inc./Veritas Bermuda Ltd., 7.500%, 9/01/2025, 144A | | | 268,125 | |
| | 255,000 | | | Xerox Holdings Corp., 5.000%, 8/15/2025, 144A | | | 252,009 | |
| | 255,000 | | | Xerox Holdings Corp., 5.500%, 8/15/2028, 144A | | | 251,232 | |
| | | | | | | | |
| | | | | | | 10,361,777 | |
| | | | | | | | |
| |
| | | | Transportation Services – 0.1% | |
| | 410,000 | | | Avis Budget Car Rental LLC/Avis Budget Finance, Inc., 5.750%, 7/15/2027, 144A | | | 369,086 | |
| | | | | | | | |
| |
| | | | Wireless – 1.2% | |
| | 1,070,000 | | | Altice France Holding S.A., 10.500%, 5/15/2027, 144A | | | 1,189,294 | |
| | 810,000 | | | Altice France S.A., 5.125%, 1/15/2029, 144A | | | 806,962 | |
| | 770,000 | | | Kenbourne Invest S.A., 6.875%, 11/26/2024, 144A | | | 803,688 | |
| | 200,000 | | | Millicom International Cellular S.A., 5.125%, 1/15/2028, 144A | | | 207,668 | |
| | 100,000 | | | Sprint Capital Corp., 6.875%, 11/15/2028 | | | 125,000 | |
| | | | | | | | |
| | | | | | | 3,132,612 | |
| | | | | | | | |
| |
| | | | Wirelines – 0.7% | |
| 30,000 | | | CenturyLink, Inc., 5.125%, 12/15/2026, 144A | | | 30,822 | |
| | 420,000 | | | CenturyLink, Inc., 5.625%, 4/01/2025 | | | 448,712 | |
| | 220,000 | | | Cincinnati Bell Telephone Co. LLC, 6.300%, 12/01/2028 | | | 224,130 | |
| | 100,000 | | | Telecom Italia Capital S.A., 6.000%, 9/30/2034 | | | 116,000 | |
| | 155,000 | | | Telecom Italia Capital S.A., 7.200%, 7/18/2036 | | | 195,486 | |
| | 165,000 | | | Uniti Group LP/Uniti Fiber Holdings, Inc./CSL Capital LLC, 7.875%, 2/15/2025, 144A | | | 174,851 | |
| | 275,000 | | | Uniti Group LP/Uniti Group Finance, Inc./CSL Capital LLC, 8.250%, 10/15/2023 | | | 270,875 | |
| | 260,000 | | | Windstream Escrow LLC/Windstream Escrow Finance Corp., 7.750%, 8/15/2028, 144A | | | 255,450 | |
| | | | | | | | |
| | | | | | | 1,716,326 | |
| | | | | | | | |
| | |
| | | | Total Non-Convertible Bonds | | | | |
| | |
| | | | (Identified Cost $215,878,507) | | | 226,188,567 | |
| | | | | | | | |
|
| | Convertible Bonds – 3.3% | |
| |
| | | | Cable Satellite – 1.6% | |
| | 960,000 | | | DISH Network Corp., 2.375%, 3/15/2024 | | | 863,952 | |
| | 3,400,000 | | | DISH Network Corp., 3.375%, 8/15/2026 | | | 3,121,188 | |
| | | | | | | | |
| | | | | | | 3,985,140 | |
| | | | | | | | |
| |
| | | | Diversified Manufacturing – 0.2% | |
| | 435,000 | | | Greenbrier Cos., Inc. (The), 2.875%, 2/01/2024 | | | 397,913 | |
| | | | | | | | |
| |
| | | | Energy – 0.0% | |
| | 805,000 | | | Chesapeake Energy Corp., 5.500%, 9/15/2026(c)(e)(i) | | | 26,968 | |
| | | | | | | | |
| |
| | | | Healthcare – 0.3% | |
| | 685,000 | | | Integra LifeSciences Holdings Corp., 0.500%, 8/15/2025, 144A | | | 645,880 | |
| | | | | | | | |
| |
| | | | Industrial Other – 0.0% | |
| | 115,000 | | | Chegg, Inc., Zero Coupon, 9/01/2026, 144A | | | 114,597 | |
| | | | | | | | |
| |
| | | | Oil Field Services – 0.1% | |
| | 375,000 | | | Nabors Industries, Inc., 0.750%, 1/15/2024 | | | 84,247 | |
| | 445,000 | | | Oil States International, Inc., 1.500%, 2/15/2023 | | | 252,382 | |
| | | | | | | | |
| | | | | | | 336,629 | |
| | | | | | | | |
| |
| | | | Pharmaceuticals – 1.1% | |
| | 410,000 | | | Aerie Pharmaceuticals, Inc., 1.500%, 10/01/2024 | | | 330,160 | |
| | 540,000 | | | BioMarin Pharmaceutical, Inc., 0.599%, 8/01/2024 | | | 566,650 | |
| | 1,640,000 | | | BioMarin Pharmaceutical, Inc., 1.250%, 5/15/2027, 144A | | | 1,603,906 | |
See accompanying notes to financial statements.
19 |
Portfolio of Investments – as of September 30, 2020
Loomis Sayles High Income Opportunities Fund – continued
| | | | | | | | |
Principal
Amount | | | Description | | Value (†) | |
| |
| | Bonds and Notes – continued | | | | |
| | |
| | | | Pharmaceuticals – continued | | | | |
| $ | 340,000 | | | Flexion Therapeutics, Inc., 3.375%, 5/01/2024 | | $ | 268,928 | |
| | | | | | | | |
| | | | | | | 2,769,644 | |
| | | | | | | | |
| | |
| | | | Total Convertible Bonds | | | | |
| | |
| | | | (Identified Cost $9,401,434) | | | 8,276,771 | |
| | | | | | | | |
| | |
| | | | Total Bonds and Notes | | | | |
| | |
| | | | (Identified Cost $225,279,941) | | | 234,465,338 | |
| | | | | | | | |
|
| | Senior Loans – 0.0% | |
| |
| | | | Chemicals – 0.0% | |
| | 97,112 | | | Chemours Co. (The), 2018 USD Term Loan B, 1-month LIBOR + 1.750%, 1.900%, 4/03/2025(b)
(Identified Cost $96,955) | | | 93,471 | |
| | | | | | | | |
|
| | Collateralized Loan Obligations – 0.4% | |
| | |
| | 250,000 | | | Ballyrock CLO Ltd., Series 2019-1A, Class C, 3-month LIBOR + 3.700%, 3.975%, 7/15/2032, 144A(b) | | | 247,299 | |
| | 390,000 | | | Carlyle Global Market Strategies CLO Ltd., Series 2015-2A, Class CR, 3-month LIBOR + 2.250%, 2.495%, 4/27/2027, 144A(b) | | | 374,947 | |
| | 260,000 | | | Symphony CLO XX Ltd., Series 2018-20A, Class D,
3-month LIBOR + 3.860%, 4.131%, 1/16/2032, 144A(b) | | | 258,652 | |
| | | | | | | | |
| | |
| | | | Total Collateralized Loan Obligations | | | | |
| | |
| | | | (Identified Cost $799,263) | | | 880,898 | |
| | | | | | | | |
| | |
| | Shares | | | | | | | |
|
| | Preferred Stocks – 1.7% | |
| |
| | | | Banking – 0.4% | |
| | 222 | | | Bank of America Corp., Series L, 7.250% | | | 330,336 | |
| | 476 | | | Wells Fargo & Co., Class A, Series L, 7.500% | | | 638,816 | |
| | | | | | | | |
| | | | | | | 969,152 | |
| | | | | | | | |
| |
| | | | Energy – 0.0% | |
| | 641 | | | Chesapeake Energy Corp., 5.750%(e)(f)(g)(j) | | | — | |
| | 13 | | | Chesapeake Energy Corp., 5.750%, 144A(e)(f)(g)(j) | | | — | |
| | 90 | | | Chesapeake Energy Corp., 5.750%(e)(f)(g)(j) | | | — | |
| | | | | | | | |
| | | | | | | — | |
| | | | | | | | |
| |
| | | | Food & Beverage – 1.3% | |
| | 36,048 | | | Bunge Ltd., 4.875% | | | 3,452,543 | |
| | | | | | | | |
| | |
| | | | Total Preferred Stocks | | | | |
| | |
| | | | (Identified Cost $4,874,495) | | | 4,421,695 | |
| | | | | | | | |
|
| | Common Stocks – 0.4% | |
| |
| | | | Chemicals – 0.1% | |
| | 12,926 | | | Hexion Holdings Corp., Class B(j) | | | 128,459 | |
| | | | | | | | |
| |
| | | | Diversified Telecommunication Services – 0.2% | |
| | 18,412 | | | AT&T, Inc. | | | 524,926 | |
| | | | | | | | |
| |
| | | | Energy Equipment & Services – 0.0% | |
| | 11,343 | | | McDermott International Ltd.(j) | | | 27,223 | |
| | | | | | | | |
| |
| | | | Oil, Gas & Consumable Fuels – 0.1% | |
| | 2,801 | | | Battalion Oil Corp.(j) | | | 22,128 | |
| | 20,454 | | | Whiting Petroleum Corp.(j) | | | 353,649 | |
| | | | | | | | |
| | | | | | | 375,777 | |
| | | | | | | | |
| | |
| | | | Total Common Stocks | | | | |
| | |
| | | | (Identified Cost $2,619,002) | | | 1,056,385 | |
| | | | | | | | |
|
| | Warrants – 0.0% | |
| | |
| | 22,710 | | | McDermott International Ltd., Expiration on 5/1/2024(f)(g)(j) | | | 21,348 | |
| | 25,233 | | | McDermott International Ltd., Expiration on 5/1/2024(f)(g)(j) | | | 13,878 | |
| | 7,285 | | | Stearns Holdings LLC, Expiration on 11/5/2039(e)(f)(g)(j) | | | — | |
| | | | | | | | |
| | |
| | | | Total Warrants | | | | |
| | |
| | | | (Identified Cost $35,226) | | | 35,226 | |
| | | | | | | | |
| | |
| Principal
Amount |
| | | | | | |
|
| | Short-Term Investments – 5.7% | |
| | |
| $ | 14,512,598 | | | Tri-Party Repurchase Agreement with Fixed Income Clearing Corporation, dated 9/30/2020 at 0.000% to be repurchased at $14,512,598 on 10/01/2020 collateralized by $14,804,100 U.S. Treasury Note, 0.250% due 9/30/2025 valued at $14,802,945 including accrued interest (Note 2 of Notes to Financial Statements) (Identified Cost $14,512,598) | | | 14,512,598 | |
| | | | | | | | |
| | |
| | | | Total Investments – 100.2% | | | | |
| | |
| | | | (Identified Cost $248,217,480) | | | 255,465,611 | |
| | |
| | | | Other assets less liabilities—(0.2)% | | | (447,046 | ) |
| | | | | | | | |
| | |
| | | | Net Assets – 100.0% | | $ | 255,018,565 | |
| | | | | | | | |
| |
| | (†) | | | See Note 2 of Notes to Financial Statements. | |
| |
| | (a) | | | Variable rate security. The interest rate adjusts periodically based on; (i) changes in current interest rates and/or prepayments on underlying pools of assets, if applicable, (ii) reference to a base lending rate plus or minus a margin, and/or (iii) reference to a base lending rate adjusted by a multiplier and/or subject to certain floors or caps. Rate as of September 30, 2020 is disclosed. | |
| |
| | (b) | | | Variable rate security. Rate as of September 30, 2020 is disclosed. | |
| |
| | (c) | | | The issuer is in default with respect to interest and/or principal payments. Income is not being accrued. | |
| |
| | (d) | | | Payment-in-kind security for which the issuer, at each interest payment date, may make interest payments in cash and/or additional principal. For the period ended September 30, 2020, interest payments were made in cash. | |
See accompanying notes to financial statements.
| 20
Portfolio of Investments – as of September 30, 2020
Loomis Sayles High Income Opportunities Fund – continued
| | | | | | |
| |
| | (e) | | | Illiquid security. (Unaudited) |
| |
| | (f) | | | Level 3 security. Value has been determined using significant unobservable inputs. See Note 3 of Notes to Financial Statements. |
| |
| | (g) | | | Fair valued by the Fund’s adviser. At September 30, 2020, the value of these securities amounted to $349,664 or 0.1% of net assets. See Note 2 of Notes to Financial Statements. |
| |
| | (h) | | | Perpetual bond with no specified maturity date. |
| |
| | (i) | | | Securities classified as fair valued pursuant to the Fund’s pricing policies and procedures. At September 30, 2020, the value of these securities amounted to $756,073 or 0.3% of net assets. See Note 2 of Notes to Financial Statements. |
| |
| | (j) | | | Non-income producing security. |
| |
| | 144A | | | All or a portion of these securities are exempt from registration under Rule 144A of the Securities Act of 1933. These securities may be resold in transactions exempt from registration, normally to qualified institutional buyers. At September 30, 2020, the value of Rule 144A holdings amounted to $138,062,350 or 54.1% of net assets. |
| | ABS | | | Asset-Backed Securities |
| | GMTN | | | Global Medium Term Note |
| | LIBOR | | | London Interbank Offered Rate |
| | MTN | | | Medium Term Note |
| | PIK | | | Payment-in-Kind |
| | REITs | | | Real Estate Investment Trusts |
Industry Summary at September 30, 2020
| | | | |
Cable Satellite | | | 6.9 | % |
Independent Energy | | | 5.9 | |
Healthcare | | | 5.2 | |
Consumer Cyclical Services | | | 5.0 | |
Midstream | | | 4.9 | |
Aerospace & Defense | | | 4.8 | |
Pharmaceuticals | | | 4.7 | |
Metals & Mining | | | 4.7 | |
Food & Beverage | | | 4.6 | |
Automotive | | | 4.2 | |
Media Entertainment | | | 4.2 | |
Technology | | | 4.1 | |
Finance Companies | | | 3.9 | |
Gaming | | | 3.5 | |
Retailers | | | 2.1 | |
Building Materials | | | 2.1 | |
Banking | | | 2.1 | |
Lodging | | | 2.0 | |
Other Investments, less than 2% each | | | 19.2 | |
Short-Term Investments | | | 5.7 | |
Collateralized Loan Obligations | | | 0.4 | |
| | | | |
Total Investments | | | 100.2 | |
Other assets less liabilities | | | (0.2 | ) |
| | | | |
Net Assets | | | 100.0 | % |
| | | | |
See accompanying notes to financial statements.
21 |
Portfolio of Investments – as of September 30, 2020
Loomis Sayles Securitized Asset Fund
| | | | | | | | |
Principal
Amount | | | Description | | Value (†) | |
|
| | Bonds and Notes – 90.9% of Net Assets | |
| |
| | | | ABS Car Loan – 9.3% | |
| $ | 1,195,000 | | | American Credit Acceptance Receivables Trust, Series 2020-2, Class C, 3.880%, 4/13/2026, 144A | | $ | 1,276,738 | |
| | 1,525,000 | | | American Credit Acceptance Receivables Trust, Series 2019-4, Class C, 2.690%, 12/12/2025, 144A | | | 1,559,614 | |
| | 4,500,000 | | | American Credit Acceptance Receivables Trust, Series 2020-1A, Class C, 2.190%, 3/13/2026, 144A | | | 4,549,077 | |
| | 2,000,000 | | | AmeriCredit Automobile Receivables Trust, Series 2018-3, Class C, 3.740%, 10/18/2024 | | | 2,115,891 | |
| | 1,500,000 | | | AmeriCredit Automobile Receivables Trust, Series 2019-1, Class C, 3.360%, 2/18/2025 | | | 1,583,092 | |
| | 370,000 | | | AmeriCredit Automobile Receivables Trust, Series 2020-2, Class C, 1.480%, 2/18/2026 | | | 374,722 | |
| | 126,361 | | | Avid Automobile Receivables Trust, Series 2018-1, Class A, 2.840%, 8/15/2023, 144A | | | 126,553 | |
| | 600,000 | | | Avis Budget Rental Car Funding AESOP LLC, Series 2018-2A, Class A, 4.000%, 3/20/2025, 144A | | | 641,811 | |
| | 900,000 | | | Avis Budget Rental Car Funding AESOP LLC, Series 2019-2A, Class A, 3.350%, 9/22/2025, 144A | | | 950,464 | |
| | 6,040,000 | | | Avis Budget Rental Car Funding AESOP LLC, Series 2019-3A, Class A, 2.360%, 3/20/2026, 144A | | | 6,168,529 | |
| | 615,000 | | | Avis Budget Rental Car Funding AESOP LLC, Series 2020-1A, Class A, 2.330%, 8/20/2026, 144A | | | 633,395 | |
| | 2,880,000 | | | Avis Budget Rental Car Funding AESOP LLC, Series 2020-1A, Class B, 2.680%, 8/20/2026, 144A | | | 2,888,016 | |
| | 3,860,000 | | | Avis Budget Rental Car Funding AESOP LLC, Series 2020-2A, Class A, 2.020%, 2/20/2027, 144A | | | 3,893,679 | |
| | 2,750,000 | | | Bank of The West Auto Trust,
Series 2019-1, Class B, 2.760%, 1/15/2025, 144A | | | 2,855,194 | |
| | 3,100,000 | | | California Republic Auto Receivables Trust, Series 2017-1, Class C, 3.760%, 12/15/2023 | | | 3,149,262 | |
| | 3,950,000 | | | California Republic Auto Receivables Trust, Series 2018-1, Class C, 3.870%, 10/16/2023 | | | 4,078,898 | |
| | 1,370,000 | | | Canadian Pacer Auto Receivables Trust, Series 2018-2A, Class C, 4.070%, 3/19/2025, 144A | | | 1,407,662 | |
| | 1,655,000 | | | CarMax Auto Owner Trust,
Series 2017-4, Class D,
3.300%, 5/15/2024 | | | 1,697,310 | |
| | 1,655,000 | | | CarMax Auto Owner Trust,
Series 2018-1, Class C,
2.950%, 11/15/2023 | | | 1,706,261 | |
| | 1,050,000 | | | CarMax Auto Owner Trust,
Series 2018-1, Class D,
3.370%, 7/15/2024 | | | 1,078,457 | |
| |
| | | | ABS Car Loan – continued | |
| 1,285,000 | | | CarMax Auto Owner Trust,
Series 2018-2, Class D,
3.990%, 4/15/2025 | | | 1,338,191 | |
| | 1,465,000 | | | CarMax Auto Owner Trust,
Series 2019-4, Class B,
2.320%, 7/15/2025 | | | 1,530,168 | |
| | 500,000 | | | CarMax Auto Owner Trust,
Series 2020-3, Class C,
1.690%, 4/15/2026 | | | 507,532 | |
| | 499,707 | | | CIG Auto Receivables Trust,
Series 2019-1A, Class A,
3.330%, 8/15/2024, 144A | | | 505,629 | |
| | 622,949 | | | CPS Auto Receivables Trust,
Series 2016-A, Class D,
5.000%, 12/15/2021, 144A | | | 626,717 | |
| | 1,675,000 | | | CPS Auto Receivables Trust,
Series 2019-C, Class B,
2.630%, 8/15/2023, 144A | | | 1,694,644 | |
| | 2,035,000 | | | CPS Auto Receivables Trust,
Series 2020-A, Class B,
2.360%, 2/15/2024, 144A | | | 2,075,149 | |
| | 3,696,910 | | | CPS Auto Trust, Series 2016-D, Class D, 4.530%, 1/17/2023, 144A | | | 3,735,871 | |
| | 1,771,826 | | | Credit Acceptance Auto Loan Trust, Series 2018-3A, Class A,
3.550%, 8/15/2027, 144A(a) | | | 1,796,966 | |
| | 2,360,000 | | | Credit Acceptance Auto Loan Trust, Series 2019-3A, Class B,
2.860%, 1/16/2029, 144A | | | 2,456,753 | |
| | 910,000 | | | Credit Acceptance Auto Loan Trust, Series 2020-1A, Class B,
2.390%, 4/16/2029, 144A | | | 924,193 | |
| | 1,245,000 | | | Credit Acceptance Auto Loan Trust, Series 2020-2A, Class A,
1.370%, 7/16/2029, 144A | | | 1,260,137 | |
| | 2,800,000 | | | Drive Auto Receivables Trust,
Series 2018-5, Class C,
3.990%, 1/15/2025 | | | 2,889,171 | |
| | 1,000,000 | | | Drive Auto Receivables Trust,
Series 2019-2, Class C,
3.420%, 6/16/2025 | | | 1,029,147 | |
| | 1,775,000 | | | DT Auto Owner Trust,
Series 2018-3A, Class C,
3.790%, 7/15/2024, 144A | | | 1,810,896 | |
| | 1,200,000 | | | DT Auto Owner Trust, Series 2018-2A, Class D,
4.150%, 3/15/2024, 144A | | | 1,238,785 | |
| | 1,260,000 | | | DT Auto Owner Trust,
Series 2020-3A, Class C,
1.470%, 6/15/2026, 144A | | | 1,263,868 | |
| | 3,360,000 | | | First Investors Auto Owner Trust, Series 2019-2A, Class C,
2.710%, 12/15/2025, 144A | | | 3,465,738 | |
| | 2,188,636 | | | First Investors Auto Owner Trust, Series 2017-1A, Class C,
2.950%, 4/17/2023, 144A | | | 2,202,207 | |
| | 1,329,000 | | | Flagship Credit Auto Trust,
Series 2018-3, Class B,
3.590%, 12/16/2024, 144A | | | 1,357,231 | |
| | 2,800,000 | | | Flagship Credit Auto Trust,
Series 2018-4, Class B,
3.880%, 10/16/2023, 144A | | | 2,883,703 | |
See accompanying notes to financial statements.
| 22
Portfolio of Investments – as of September 30, 2020
Loomis Sayles Securitized Asset Fund – continued
| | | | | | | | |
Principal
Amount | | | Description | | Value (†) | |
|
| | Bonds and Notes – continued | |
| |
| | | | ABS Car Loan – continued | |
| $ | 1,826,000 | | | Flagship Credit Auto Trust,
Series 2019-4, Class C,
2.770%, 12/15/2025, 144A | | $ | 1,893,616 | |
| | 3,500,000 | | | Flagship Credit Auto Trust,
Series 2020-1, Class C,
2.240%, 1/15/2026, 144A | | | 3,578,626 | |
| | 750,000 | | | Flagship Credit Auto Trust,
Series 2020-2, Class C,
3.800%, 4/15/2026, 144A | | | 796,777 | |
| | 3,335,000 | | | Ford Credit Auto Owner Trust,
Series 2020-A, Class C, 3.490%, 10/15/2026 | | | 3,545,121 | |
| | 3,025,000 | | | Ford Credit Auto Owner Trust,
Series 2020-A, Class A,
2.040%, 8/15/2031, 144A | | | 3,171,186 | |
| | 1,650,000 | | | Ford Credit Auto Owner Trust,
Series 2020-B, Class C, 2.040%, 12/15/2026 | | | 1,675,757 | |
| | 2,250,000 | | | Foursight Capital Automobile Receivables Trust, Series 2020-1, Class B, 2.270%, 2/18/2025, 144A | | | 2,320,229 | |
| | 394,374 | | | GLS Auto Receivables Trust,
Series 2018-1A, Class A,
2.820%, 7/15/2022, 144A | | | 395,277 | |
| | 2,270,000 | | | GLS Auto Receivables Trust,
Series 2020-1A, Class B,
2.430%, 11/15/2024, 144A | | | 2,327,467 | |
| | 1,725,000 | | | GM Financial Consumer Automobile Receivables Trust, Series 2020-3, Class D, 1.910%, 9/16/2027 | | | 1,742,864 | |
| | 565,000 | | | GMF Floorplan Owner Revolving Trust, Series 2020-1, Class C,
1.480%, 8/15/2025, 144A | | | 564,779 | |
| | 800,000 | | | Hyundai Auto Receivables Trust, Series 2020-B, Class C,
1.600%, 12/15/2026 | | | 813,706 | |
| | 1,670,000 | | | NextGear Floorplan Master Owner Trust, Series 2018-1A, Class A1, 1-month LIBOR + 0.640%, 0.792%, 2/15/2023, 144A(b) | | | 1,670,784 | |
| | 1,705,000 | | | NextGear Floorplan Master Owner Trust, Series 2018-2A, Class A2,
3.690%, 10/15/2023, 144A | | | 1,760,141 | |
| | 1,100,000 | | | NextGear Floorplan Master Owner Trust, Series 2019-1A, Class A2,
3.210%, 2/15/2024, 144A | | | 1,139,678 | |
| | 5,300,000 | | | NextGear Floorplan Master Owner Trust, Series 2019-2A, Class A1, 1-month LIBOR + 0.700%, 0.852%, 10/15/2024, 144A(b) | | | 5,187,337 | |
| | 5,000,000 | | | NextGear Floorplan Master Owner Trust, Series 2020-1A, Class A2,
1.550%, 2/15/2025, 144A | | | 5,008,848 | |
| | 2,000,000 | | | Prestige Auto Receivables Trust, Series 2018-1A, Class C,
3.750%, 10/15/2024, 144A | | | 2,052,959 | |
| | 770,000 | | | Santander Consumer Auto Receivables Trust, Series 2020-AA, Class C, 3.710%, 2/17/2026, 144A | | | 825,572 | |
| |
| | | | ABS Car Loan – continued | |
| 4,450,000 | | | Santander Drive Auto Receivables Trust, Series 2020-1, Class D, 5.350%, 3/15/2028 | | | 4,957,865 | |
| | 2,830,000 | | | Santander Drive Auto Receivables Trust, Series 2018-3, Class D, 4.070%, 8/15/2024 | | | 2,948,735 | |
| | 2,220,000 | | | Santander Drive Auto Receivables Trust, Series 2018-5, Class C, 3.810%, 12/16/2024 | | | 2,254,412 | |
| | 1,265,000 | | | Santander Drive Auto Receivables Trust, Series 2020-2, Class C, 1.460%, 9/15/2025 | | | 1,277,061 | |
| | 2,340,000 | | | Santander Drive Auto Receivables Trust, Series 2020-3, Class C, 1.120%, 1/15/2026 | | | 2,339,286 | |
| | 1,680,000 | | | United Auto Credit Securitization Trust, Series 2019-1, Class C,
3.160%, 8/12/2024, 144A | | | 1,696,044 | |
| | 2,260,000 | | | United Auto Credit Securitization Trust, Series 2020-1, Class C,
2.150%, 2/10/2025, 144A | | | 2,284,067 | |
| | 150,000 | | | Westlake Automobile Receivables Trust, Series 2020-2A, Class C,
2.010%, 7/15/2025, 144A | | | 152,254 | |
| | 530,000 | | | World Omni Auto Receivables Trust, Series 2020-B, Class B, 1.220%, 3/16/2026 | | | 537,180 | |
| | 1,490,000 | | | World Omni Select Auto Trust,
Series 2020-A, Class C, 1.250%, 10/15/2026 | | | 1,489,374 | |
| | | | | | | | |
| | | | | | | 139,734,323 | |
| | | | | | | | |
| |
| | | | ABS Credit Card – 1.1% | |
| | 3,930,000 | | | Delamare Cards MTN Issuer PLC, Series 2018-1A, Class A1, 1-month LIBOR + 0.700%, 0.856%, 11/19/2025, 144A(a)(b) | | | 3,930,161 | |
| | 4,100,000 | | | World Financial Network Credit Card Master Trust, Series 2019-B, Class A, 2.490%, 4/15/2026 | | | 4,226,397 | |
| | 2,695,000 | | | World Financial Network Credit Card Master Trust, Series 2019-C, Class A, 2.210%, 7/15/2026 | | | 2,770,165 | |
| | 5,275,000 | | | World Financial Network Credit Card Master Trust, Series 2019-C, Class M, 2.710%, 7/15/2026 | | | 5,415,321 | |
| | | | | | | | |
| | | | | | | 16,342,044 | |
| | | | | | | | |
| |
| | | | ABS Home Equity – 5.9% | |
| | 3,393,630 | | | Ajax Mortgage Loan Trust,
Series 2019-D, Class A1,
2.956%, 9/25/2065, 144A(c) | | | 3,437,028 | |
| | 2,016,100 | | | Bayview Koitere Fund Trust,
Series 2017-SPL3, Class B1,
4.250%, 11/28/2053, 144A(c) | | | 2,156,715 | |
| | 1,089,224 | | | Bayview Opportunity Master Fund IVa Trust, Series 2016-SPL1, Class A, 4.000%, 4/28/2055, 144A(a) | | | 1,118,670 | |
| | 966,240 | | | Bayview Opportunity Master Fund IVa Trust, Series 2017-RT1, Class A1, 3.000%, 3/28/2057, 144A(a)(c) | | | 990,935 | |
See accompanying notes to financial statements.
23 |
Portfolio of Investments – as of September 30, 2020
Loomis Sayles Securitized Asset Fund – continued
| | | | | | | | |
Principal
Amount | | | Description | | Value (†) | |
|
| | Bonds and Notes – continued | |
| |
| | | | ABS Home Equity – continued | |
| $ | 969,013 | | | Bayview Opportunity Master Fund IVb Trust, Series 2016-SPL2, Class A,
4.000%, 6/28/2053, 144A(a)(c) | | $ | 991,666 | |
| | 1,385,000 | | | Bayview Opportunity Master Fund IVb Trust, Series 2017-SPL2, Class B1, 4.250%, 6/28/2054, 144A(c) | | | 1,472,771 | |
| | 1,552,292 | | | Bayview Opportunity Master Fund IVb Trust, Series 2017-SPL4, Class A,
3.500%, 1/28/2055, 144A(a)(c) | | | 1,582,910 | |
| | 1,448,850 | | | Citigroup Mortgage Loan Trust, Series 2019-RP1, Class M2,
4.000%, 1/25/2066, 144A(c) | | | 1,589,823 | |
| | 516,965 | | | CoreVest American Finance Trust, Series 2017-1, Class A,
2.968%, 10/15/2049, 144A | | | 527,107 | |
| | 1,429,792 | | | CoreVest American Finance Trust, Series 2018-1, Class A,
3.804%, 6/15/2051, 144A | | | 1,502,481 | |
| | 1,953,490 | | | CoreVest American Finance Trust, Series 2019-2, Class A,
2.835%, 6/15/2052, 144A | | | 2,058,339 | |
| | 2,707,248 | | | CoreVest American Finance Trust, Series 2019-3, Class A,
2.705%, 10/15/2052, 144A | | | 2,807,920 | |
| | 2,877,531 | | | CoreVest American Finance Trust, Series 2020-2, Class A,
3.376%, 5/15/2052, 144A | | | 3,139,884 | |
| | 27,154 | | | Countrywide Asset-Backed Certificates, Series 2004-S1, Class A3,
5.115%, 2/25/2035(c)(d)(e) | | | 26,849 | |
| | 910,000 | | | FirstKey Homes Trust,
Series 2020-SRF1, Class B,
1.740%, 9/17/2025, 144A | | | 913,892 | |
| | 2,297,448 | | | GCAT Trust, Series 2019-RPL1, Class A1, 2.650%, 10/25/2068, 144A(c) | | | 2,389,577 | |
| | 721,963 | | | Gosforth Funding PLC, Series 2018-1A, Class A1, 3-month LIBOR + 0.450%,
0.700%, 8/25/2060, 144A(b) | | | 721,835 | |
| | 1,407,788 | | | HarborView Mortgage Loan Trust, Series 2004-3, Class 1A, 3.993%, 5/19/2034(c) | | | 1,435,290 | |
| | 6,000,000 | | | Invitation Homes Trust, Series 2018-SFR3, Class B,
1-month LIBOR + 1.150%,
1.301%, 7/17/2037, 144A(b) | | | 5,985,922 | |
| | 5,975,000 | | | Invitation Homes Trust, Series 2018-SFR4, Class B,
1-month LIBOR + 1.250%,
1.401%, 1/17/2038, 144A(b) | | | 5,978,728 | |
| | 49,029,685 | | | JPMorgan Mortgage Trust, Series 2017-4, Class AX1, IO,
0.432%, 11/25/2048, 144A(c)(d)(e)(f)(g) | | | 247,551 | |
| | 539,187 | | | Mill City Mortgage Loan Trust,
Series 2018-2, Class M1,
3.750%, 5/25/2058, 144A(c) | | | 576,383 | |
| |
| | | | ABS Home Equity – continued | |
| 1,646,966 | | | Mill City Mortgage Loan Trust,
Series 2019-1, Class M1,
3.500%, 10/25/2069, 144A(c) | | | 1,808,631 | |
| | 183,955 | | | Mill City Mortgage Loan Trust,
Series 2016-1, Class A1,
2.500%, 4/25/2057, 144A(c) | | | 186,462 | |
| | 1,614,448 | | | Mill City Mortgage Loan Trust,
Series 2018-3, Class A1,
3.500%, 8/25/2058, 144A(a)(c) | | | 1,720,594 | |
| | 3,371,467 | | | Mill City Mortgage Loan Trust,
Series 2019-GS1, Class A1,
2.750%, 7/25/2059, 144A(c) | | | 3,522,667 | |
| | 4,006,000 | | | Mill City Mortgage Trust,
Series 2015-2, Class B1,
3.701%, 9/25/2057, 144A(c) | | | 4,422,166 | |
| | 48,020 | | | Morgan Stanley Mortgage Loan Trust, Series 2005-3AR, Class 5A,
3.344%, 7/25/2035(c)(d)(e) | | | 40,732 | |
| | 903,426 | | | Onslow Bay Financial LLC,
Series 2018-EXP1, Class 1A3,
4.000%, 4/25/2048, 144A(c) | | | 939,633 | |
| | 1,397,197 | | | Onslow Bay Financial LLC,
Series 2019-EXP1, Class 1A3,
4.000%, 1/25/2059, 144A(c) | | | 1,451,417 | |
| | 399,257 | | | Progress Residential Trust,
Series 2017-SFR2, Class A,
2.897%, 12/17/2034, 144A | | | 400,596 | |
| | 1,647,995 | | | Progress Residential Trust,
Series 2018-SFR1, Class A,
3.255%, 3/17/2035, 144A | | | 1,661,704 | |
| | 2,270,000 | | | Progress Residential Trust,
Series 2019-SFR2, Class B,
3.446%, 5/17/2036, 144A | | | 2,340,639 | |
| | 585,000 | | | Progress Residential Trust,
Series 2020-SFR2, Class A,
2.078%, 6/17/2037, 144A | | | 596,670 | |
| | 1,120,000 | | | Progress Residential Trust, Series 2020-SFR3, Class B,
1.495%, 10/17/2027, 144A | | | 1,120,060 | |
| | 9,862 | | | Residential Accredit Loans, Inc., Trust, Series 2006-QS13, Class 2A1,
5.750%, 9/25/2021(d)(e) | | | 8,737 | |
| | 84,956 | | | Residential Accredit Loans, Inc., Trust, Series 2006-QS18, Class 3A3,
5.750%, 12/25/2021(d)(e) | | | 79,619 | |
| | 2,118 | | | Residential Accredit Loans, Inc., Trust, Series 2006-QS6, Class 2A1,
6.000%, 6/25/2021(d)(e) | | | 1,992 | |
| | 1,112,174 | | | Sequoia Mortgage Trust,
Series 2019-CH2, Class A1,
4.500%, 8/25/2049, 144A(c) | | | 1,144,245 | |
| | 2,167,000 | | | Towd Point Mortgage Trust,
Series 2017-5, Class M2, 1-month LIBOR + 1.500%, 1.648%, 2/25/2057, 144A(b) | | | 2,129,658 | |
| | 408,325 | | | Towd Point Mortgage Trust,
Series 2015-2, Class 1A12,
2.750%, 11/25/2060, 144A(a)(c) | | | 412,569 | |
| | 627,591 | | | Towd Point Mortgage Trust,
Series 2016-3, Class A1,
2.250%, 4/25/2056, 144A(a)(c) | | | 635,141 | |
See accompanying notes to financial statements.
| 24
Portfolio of Investments – as of September 30, 2020
Loomis Sayles Securitized Asset Fund – continued
| | | | | | | | |
Principal
Amount | | | Description | | Value (†) | |
|
| | Bonds and Notes – continued | |
| |
| | | | ABS Home Equity – continued | |
| $ | 5,570,000 | | | Towd Point Mortgage Trust, Series 2017-3, Class A2,
3.000%, 7/25/2057, 144A(c) | | $ | 5,943,789 | |
| | 4,036,054 | | | Towd Point Mortgage Trust,
Series 2017-4, Class A2,
3.000%, 6/25/2057, 144A(c) | | | 4,347,633 | |
| | 1,539,242 | | | Towd Point Mortgage Trust,
Series 2018-3, Class A1,
3.750%, 5/25/2058, 144A(a)(c) | | | 1,664,841 | |
| | 2,325,000 | | | Towd Point Mortgage Trust,
Series 2018-4, Class A2,
3.000%, 6/25/2058, 144A(c) | | | 2,450,646 | |
| | 1,010,000 | | | Towd Point Mortgage Trust,
Series 2019-2, Class A2,
3.750%, 12/25/2058, 144A(c) | | | 1,103,708 | |
| | 1,275,000 | | | Tricon American Homes,
Series 2020-SFR1, Class C,
2.249%, 7/17/2038, 144A | | | 1,290,003 | |
| | 3,015,896 | | | Tricon American Homes Trust,
Series 2017-SFR2, Class A,
2.928%, 1/17/2036, 144A(a) | | | 3,123,019 | |
| | 1,700,000 | | | Tricon American Homes Trust,
Series 2019-SFR1, Class A,
2.750%, 3/17/2038, 144A | | | 1,788,900 | |
| | 1,362,202 | | | WaMu Mortgage Pass Through Certificates, Series 2007-HY2, Class 2A2, 3.123%, 11/25/2036(c) | | | 1,245,374 | |
| | | | | | | | |
| | | | | | | 89,234,121 | |
| | | | | | | | |
| |
| | | | ABS Other – 6.2% | |
| | 3,442,739 | | | Accelerated Assets LLC, Series 2018-1, Class A,
3.870%, 12/02/2033, 144A | | | 3,564,777 | |
| | 325,000 | | | Ascentium Equipment Receivables Trust, Series 2017-2A, Class C,
2.870%, 8/10/2022, 144A | | | 330,403 | |
| | 1,564,792 | | | Blackbird Capital Aircraft Lease Securitization Ltd., Series 2016-1A, Class A, 4.213%, 12/16/2041, 144A(c) | | | 1,392,539 | |
| | 3,740,000 | | | CAL Funding IV Ltd., Series 2020-1A, Class A,
2.220%, 9/25/2045, 144A | | | 3,753,000 | |
| | 2,152,976 | | | Castlelake Aircraft Structured Trust, Series 2019-1A, Class A,
3.967%, 4/15/2039, 144A | | | 1,992,488 | |
| | 1,051,000 | | | CCG Receivables Trust, Series 2018-1, Class B,
3.090%, 6/16/2025, 144A | | | 1,066,172 | |
| | 1,155,000 | | | CCG Receivables Trust, Series 2019-1, Class B,
3.220%, 9/14/2026, 144A | | | 1,202,445 | |
| | 620,621 | | | Chesapeake Funding II LLC,
Series 2017-4A, Class A1,
2.120%, 11/15/2029, 144A | | | 625,242 | |
| | 4,000,000 | | | Chesapeake Funding II LLC,
Series 2018-1A, Class B,
3.450%, 4/15/2030, 144A | | | 4,091,349 | |
| |
| | | | ABS Other – continued | |
| 550,000 | | | Chesapeake Funding II LLC,
Series 2020-1A, Class C,
2.140%, 8/16/2032, 144A | | | 554,668 | |
| | 660,000 | | | CNH Equipment Trust, Series 2020-A, Class A4,
1.510%, 4/15/2027 | | | 681,611 | |
| | 1,000,000 | | | Dell Equipment Finance Trust,
Series 2020-1, Class C,
4.260%, 6/22/2023, 144A | | | 1,055,858 | |
| | 740,000 | | | Dell Equipment Finance Trust,
Series 2020-2, Class C,
1.370%, 1/22/2024, 144A | | | 745,880 | |
| | 1,580,925 | | | Diamond Resorts Owner Trust,
Series 2018-1, Class A,
3.700%, 1/21/2031, 144A(a) | | | 1,640,400 | |
| | 2,677,755 | | | Diamond Resorts Owner Trust,
Series 2019-1, Class A,
2.890%, 2/20/2032, 144A | | | 2,760,547 | |
| | 687,795 | | | Hilton Grand Vacations Trust,
Series 2020-AA, Class A,
2.740%, 2/25/2039, 144A | | | 720,134 | |
| | 3,488,403 | | | Horizon Aircraft Finance I Ltd.,
Series 2018-1, Class A,
4.458%, 12/15/2038, 144A | | | 3,295,445 | |
| | 707,184 | | | Horizon Aircraft Finance II Ltd.,
Series 2019-1, Class A, 3.721%, 7/15/2039, 144A | | | 660,293 | |
| | 2,210,220 | | | Kestrel Aircraft Funding Ltd.,
Series 2018-1A, Class A,
4.250%, 12/15/2038, 144A | | | 1,918,638 | |
| | 724,763 | | | Lending Point Asset Securitization Trust, Series 2020-1, Class A, 2.512%, 2/10/2026, 144A | | | 724,855 | |
| | 1,171,710 | | | MAPS Ltd., Series 2018-1A, Class A,
4.212%, 5/15/2043, 144A | | | 1,078,204 | |
| | 234,033 | | | Merlin Aviation Holdings DAC,
Series 2016-1, Class A,
4.500%, 12/15/2032, 144A(c) | | | 208,234 | |
| | 305,000 | | | MMAF Equipment Finance LLC,
Series 2020-A, Class A5,
1.560%, 10/09/2042, 144A | | | 320,182 | |
| | 1,620,000 | | | OneMain Financial Issuance Trust, Series 2019-1A, Class B,
3.790%, 2/14/2031, 144A | | | 1,636,639 | |
| | 5,950,000 | | | OneMain Financial Issuance Trust, Series 2020-1A, Class A,
3.840%, 5/14/2032, 144A | | | 6,258,490 | |
| | 5,970,000 | | | OneMain Financial Issuance Trust, Series 2020-2A, Class A,
1.750%, 9/14/2035, 144A | | | 6,014,924 | |
| | 2,118,743 | | | Orange Lake Timeshare Trust,
Series 2018-A, Class A,
3.100%, 11/08/2030, 144A(a) | | | 2,183,125 | |
| | 2,030,000 | | | PFS Financing Corp., Series 2020-A, Class A, 1.270%, 6/15/2025, 144A | | | 2,046,618 | |
| | 1,680,000 | | | PFS Financing Corp., Series 2020-E, Class A, 1.000%, 10/15/2025, 144A | | | 1,686,476 | |
See accompanying notes to financial statements.
25 |
Portfolio of Investments – as of September 30, 2020
Loomis Sayles Securitized Asset Fund – continued
| | | | | | | | |
Principal
Amount | | | Description | | Value (†) | |
|
| | Bonds and Notes – continued | |
| |
| | | | ABS Other – continued | |
| $ | 4,185,052 | | | S-Jets Ltd., Series 2017-1, Class A,
3.967%, 8/15/2042, 144A | | $ | 3,790,204 | |
| | 3,955,000 | | | SCF Equipment Trust LLC,
Series 2018-1A, Class B,
3.970%, 12/20/2025, 144A | | | 4,008,326 | |
| | 665,661 | | | Sierra Timeshare Receivables Funding LLC, Series 2018-2A, Class A,
3.500%, 6/20/2035, 144A | | | 691,960 | |
| | 4,348,648 | | | Sierra Timeshare Receivables Funding LLC, Series 2019-2A, Class A,
2.590%, 5/20/2036, 144A | | | 4,468,098 | |
| | 1,069,615 | | | Sierra Timeshare Receivables Funding LLC, Series 2020-2A, Class B,
2.320%, 7/20/2037, 144A | | | 1,075,964 | |
| | 260,000 | | | SLM Private Credit Student Loan Trust, Series 2003-C, Class A3, 28-day ARS, 3.652%, 9/15/2032(b) | | | 255,113 | |
| | 225,000 | | | SLM Private Credit Student Loan Trust, Series 2003-C, Class A4, 28-day ARS, 3.230%, 9/15/2032(b) | | | 220,770 | |
| | 2,010,871 | | | SoFi Consumer Loan Program Trust, Series 2018-3, Class A2,
3.670%, 8/25/2027, 144A | | | 2,030,787 | |
| | 249,972 | | | SoFi Consumer Loan Program Trust, Series 2019-2, Class A, 3.010%, 4/25/2028, 144A | | | 252,820 | |
| | 822,978 | | | SoFi Consumer Loan Program Trust, Series 2019-3, Class A, 2.900%, 5/25/2028, 144A | | | 832,555 | |
| | 4,235,000 | | | SoFi Consumer Loan Program Trust, Series 2021-B, Class B,
2.250%, 1/25/2029, 144A | | | 4,259,618 | |
| | 5,950,000 | | | SpringCastle America Funding LLC, Series 2020-AA, Class A,
1.970%, 9/25/2037, 144A | | | 5,973,675 | |
| | 710,321 | | | Sprite Ltd., Series 2017-1, Class A,
4.250%, 12/15/2037, 144A | | | 646,300 | |
| | 694,114 | | | Textainer Marine Containers VII Ltd., Series 2020-1A, Class A,
2.730%, 8/21/2045, 144A | | | 711,017 | |
| | 2,106,750 | | | Tif Funding II LLC, Series 2020-1A, Class A, 2.090%, 8/20/2045, 144A | | | 2,106,988 | |
| | 4,371,326 | | | Wave LLC, Series 2017-1A, Class A,
3.844%, 11/15/2042, 144A | | | 3,955,385 | |
| | 2,308,154 | | | Welk Resorts LLC, Series 2019-AA, Class A, 2.800%, 6/15/2038, 144A | | | 2,369,636 | |
| | 930,000 | | | Wheels SPV 2 LLC, Series 2018-1A, Class A4, 3.410%, 4/20/2027, 144A | | | 948,167 | |
| | 901,471 | | | Wheels SPV 2 LLC, Series 2019-1A, Class A2, 2.300%, 5/22/2028, 144A | | | 911,501 | |
| | | | | | | | |
| | | | | | | 93,718,520 | |
| | | | | | | | |
| |
| | | | ABS Student Loan – 2.8% | |
| | 1,309,226 | | | Commonbond Student Loan Trust,
Series 2020, Class A, 1.980%, 8/25/2050, 144A | | | 1,342,011 | |
| |
| | | | ABS Student Loan – continued | |
| 402,137 | | | Earnest Student Loan Program LLC, Series 2017-A, Class A2,
2.650%, 1/25/2041, 144A | | | 407,748 | |
| | 3,663,991 | | | Education Funding Trust,
Series 2020-A, Class A,
2.790%, 7/25/2041, 144A | | | 3,818,451 | |
| | 2,316,170 | | | Massachusetts Educational Financing Authority, Series 2018-A, Class A, 3.850%, 5/25/2033 | | | 2,492,361 | |
| | 3,135,000 | | | Navient Private Education Refi Loan Trust, Series 2019-CA, Class A2,
3.130%, 2/15/2068, 144A | | | 3,237,329 | |
| | 3,299,788 | | | Navient Private Education Refi Loan Trust, Series 2019-GA, Class A,
2.400%, 10/15/2068, 144A | | | 3,378,147 | |
| | 1,480,000 | | | Navient Private Education Refi Loan Trust, Series 2020-BA, Class A2,
2.120%, 1/15/2069, 144A | | | 1,520,007 | |
| | 653,363 | | | Navient Private Education Refi Loan Trust, Series 2020-DA, Class A,
1.690%, 5/15/2069, 144A | | | 661,235 | |
| | 1,565,000 | | | Navient Private Education Refi Loan Trust, Series 2020-DA, Class B,
3.330%, 5/15/2069, 144A | | | 1,610,582 | |
| | 515,000 | | | Navient Private Education Refi Loan Trust, Series 2020-GA, Class A,
1.170%, 9/16/2069, 144A | | | 516,071 | |
| | 890,000 | | | SLM Private Credit Student Loan Trust, Series 2003-A, Class A3, 28-day ARS, 3.150%, 6/15/2032(b) | | | 872,205 | |
| | 141,000 | | | SLM Private Credit Student Loan Trust, Series 2003-A, Class A4, 28-day ARS, 3.170%, 6/15/2032(b) | | | 138,181 | |
| | 278,000 | | | SLM Private Credit Student Loan Trust, Series 2003-B, Class A3, 28-day ARS, 3.180%, 3/15/2033(b) | | | 272,412 | |
| | 4,132,000 | | | SLM Private Credit Student Loan Trust, Series 2003-B, Class A4, 28-day ARS, 3.200%, 3/15/2033(b) | | | 4,048,943 | |
| | 2,663,003 | | | SMB Private Education Loan Trust, Series 2018-A, Class A2B, 1-month LIBOR + 0.800%, 0.952%, 2/15/2036, 144A(a)(b) | | | 2,649,715 | |
| | 2,236,529 | | | SMB Private Education Loan Trust, Series 2018-B, Class A2A,
3.600%, 1/15/2037, 144A(a) | | | 2,379,055 | |
| | 1,680,375 | | | SoFi Professional Loan Program LLC, Series 2015-C, Class B,
3.580%, 8/25/2036, 144A(a) | | | 1,694,804 | |
| | 1,008,007 | | | SoFi Professional Loan Program LLC, Series 2016-B, Class A2B,
2.740%, 10/25/2032, 144A(a) | | | 1,027,555 | |
| | 2,029,671 | | | SoFi Professional Loan Program LLC, Series 2017-F, Class A2FX,
2.840%, 1/25/2041, 144A(a) | | | 2,085,799 | |
| | 1,592,920 | | | SoFi Professional Loan Program Trust, Series 2020-C, Class AFX,
1.950%, 2/15/2046, 144A | | | 1,629,274 | |
| | 5,715,000 | | | SoFi Professional Loan Program Trust, Series 2020-A, Class A2FX,
2.540%, 5/15/2046, 144A | | | 5,931,353 | |
| | | | | | | | |
| | | | | | | 41,713,238 | |
| | | | | | | | |
See accompanying notes to financial statements.
| 26
Portfolio of Investments – as of September 30, 2020
Loomis Sayles Securitized Asset Fund – continued
| | | | | | | | |
Principal
Amount | | | Description | | Value (†) | |
|
| | Bonds and Notes – continued | |
| |
| | | | ABS Whole Business – 2.0% | |
| $ | 2,696,720 | | | Adams Outdoor Advertising LP,
Series 2018-1, Class A,
4.810%, 11/15/2048, 144A | | $ | 2,805,882 | |
| | 3,250,800 | | | Coinstar Funding LLC,
Series 2017-1A, Class A2,
5.216%, 4/25/2047, 144A | | | 3,084,353 | |
| | 1,802,790 | | | DB Master Finance LLC,
Series 2019-1A, Class A23, 4.352%, 5/20/2049, 144A | | | 1,961,706 | |
| | 3,949,400 | | | Planet Fitness Master Issuer LLC, Series 2018-1A, Class A2II,
4.666%, 9/05/2048, 144A | | | 3,951,335 | |
| | 4,001,760 | | | Planet Fitness Master Issuer LLC, Series 2019-1A, Class A2,
3.858%, 12/05/2049, 144A | | | 3,753,531 | |
| | 2,563,754 | | | Stack Infrastructure Issuer LLC, Series 2019-1A, Class A2,
4.540%, 2/25/2044, 144A | | | 2,762,692 | |
| | 1,719,375 | | | Taco Bell Funding LLC,
Series 2018-1A, Class A2II,
4.940%, 11/25/2048, 144A | | | 1,856,839 | |
| | 5,380,000 | | | Triton Container Finance VIII LLC, Series 2020-1A, Class A,
2.110%, 9/20/2045, 144A | | | 5,399,572 | |
| | 3,603,113 | | | Wendy’s Funding LLC,
Series 2018-1A, Class A2II,
3.884%, 3/15/2048, 144A | | | 3,792,780 | |
| | | | | | | | |
| | | | | | | 29,368,690 | |
| | | | | | | | |
| |
| | | | Agency Commercial Mortgage-Backed Securities – 6.0% | |
| | 19,310,365 | | | Federal National Mortgage Association, REMIC, Series 2020-M37, Class X, IO,
1.227%, 4/25/2032(c)(f) | | | 1,624,871 | |
| | 261,164 | | | Federal National Mortgage Association, Series 2015-M17, Class FA, 1-month LIBOR + 0.930%, 1.110%, 11/25/2022(b) | | | 261,339 | |
| | 24,929,284 | | | Federal National Mortgage Association, Series 2019-M17, Class X, 0.317%, 8/25/2034(c)(f) | | | 641,672 | |
| | 20,635,101 | | | Federal National Mortgage Association, Series 2020-M33, Class X, IO, 2.055%, 6/25/2028(c)(f) | | | 2,230,427 | |
| | 20,570,000 | | | Federal National Mortgage Association, Series 2020-M43, Class X1, IO, 2.140%, 8/25/2034(c)(f) | | | 3,138,591 | |
| | 3,422,233 | | | FHLMC Multifamily Structured Pass Through Certificates, Series K-1513, Class X1, IO, 0.999%, 8/25/2034(c)(f) | | | 293,477 | |
| | 18,390,459 | | | FHLMC Multifamily Structured Pass Through Certificates, Series K-103, Class X1, 0.756%, 11/25/2029(c)(f) | | | 909,794 | |
| |
| | | | Agency Commercial Mortgage-Backed Securities – continued | |
| 13,745,000 | | | FHLMC Multifamily Structured Pass Through Certificates, Series K-108, Class X1, 1.810%, 3/25/2030(c)(f) | | | 1,895,188 | |
| | 20,926,963 | | | FHLMC Multifamily Structured Pass Through Certificates, Series K-1514, Class X1, 0.703%, 10/25/2034(c)(f) | | | 1,299,732 | |
| | 2,565,000 | | | FHLMC Multifamily Structured Pass Through Certificates, Series K-1517, Class X1, IO,
1.331%, 7/25/2035(c)(f) | | | 371,274 | |
| | 9,203,472 | | | FHLMC Multifamily Structured Pass Through Certificates, Series K017, Class X1, 1.433%, 12/25/2021(c)(d)(e)(f) | | | 91,743 | |
| | 370,766,221 | | | FHLMC Multifamily Structured Pass Through Certificates, Series K028, Class X1,
0.379%, 2/25/2023(a)(c)(f) | | | 1,922,868 | |
| | 77,877,295 | | | FHLMC Multifamily Structured Pass Through Certificates, Series K031, Class X1,
0.320%, 4/25/2023(a)(c)(d)(e)(f) | | | 371,145 | |
| | 32,057,175 | | | FHLMC Multifamily Structured Pass Through Certificates, Series K036, Class X1, 0.867%, 10/25/2023(c)(f) | | | 626,054 | |
| | 33,626,503 | | | FHLMC Multifamily Structured Pass Through Certificates, Series K038, Class X1, 1.275%, 3/25/2024(c)(f) | | | 1,101,463 | |
| | 37,653,340 | | | FHLMC Multifamily Structured Pass Through Certificates, Series K040, Class X1, 0.851%, 9/25/2024(a)(c)(f) | | | 915,488 | |
| | 72,182,733 | | | FHLMC Multifamily Structured Pass Through Certificates, Series K047, Class X1,
0.257%, 5/25/2025(c)(d)(e)(f) | | | 451,847 | |
| | 36,167,290 | | | FHLMC Multifamily Structured Pass Through Certificates, Series K049, Class X1,
0.723%, 7/25/2025(c)(f) | | | 904,486 | |
| | 41,644,344 | | | FHLMC Multifamily Structured Pass Through Certificates, Series K051, Class X1,
0.677%, 9/25/2025(a)(c)(f) | | | 978,301 | |
| | 16,923,593 | | | FHLMC Multifamily Structured Pass Through Certificates, Series K052, Class X1,
0.790%, 11/25/2025(c)(f) | | | 495,333 | |
| | 9,568,599 | | | FHLMC Multifamily Structured Pass Through Certificates, Series K053, Class X1,
1.024%, 12/25/2025(c)(d)(e)(f) | | | 388,340 | |
| | 16,713,603 | | | FHLMC Multifamily Structured Pass Through Certificates, Series K054, Class X1,
1.309%, 1/25/2026(c)(f) | | | 907,614 | |
See accompanying notes to financial statements.
27 |
Portfolio of Investments – as of September 30, 2020
Loomis Sayles Securitized Asset Fund – continued
| | | | | | | | |
Principal
Amount | | | Description | | Value (†) | |
|
| | Bonds and Notes – continued | |
| |
| | | | Agency Commercial Mortgage-Backed Securities – continued | |
| $ | 7,532,653 | | | FHLMC Multifamily Structured Pass Through Certificates, Series K055, Class X1,
1.497%, 3/25/2026(c)(f) | | $ | 484,284 | |
| | 27,761,634 | | | FHLMC Multifamily Structured Pass Through Certificates, Series K057, Class X1,
1.323%, 7/25/2026(c)(f) | | | 1,620,283 | |
| | 8,580,802 | | | FHLMC Multifamily Structured Pass Through Certificates, Series K058, Class X1,
1.053%, 8/25/2026(c)(f) | | | 412,098 | |
| | 25,592,961 | | | FHLMC Multifamily Structured Pass Through Certificates, Series K059, Class X1,
0.432%, 9/25/2026(c)(f) | | | 424,208 | |
| | 93,034,125 | | | FHLMC Multifamily Structured Pass Through Certificates, Series K060, Class X1,
0.194%, 10/25/2026(c)(f) | | | 498,272 | |
| | 17,549,417 | | | FHLMC Multifamily Structured Pass Through Certificates, Series K105, Class X1,
1.645%, 1/25/2030(c)(f) | | | 2,128,042 | |
| | 11,632,984 | | | FHLMC Multifamily Structured Pass Through Certificates, Series K107, Class X1, IO, 1.592%, 1/25/2030(c)(f) | | | 1,470,712 | |
| | 15,011,807 | | | FHLMC Multifamily Structured Pass Through Certificates, Series K152, Class X1,
1.102%, 1/25/2031(c)(f) | | | 1,141,481 | |
| | 2,474,889 | | | FHLMC Multifamily Structured Pass Through Certificates, Series KS01, Class X1,
1.336%, 1/25/2023(c)(d)(e)(f) | | | 39,528 | |
| | 48,372,504 | | | FHLMC Multifamily Structured Pass Through Certificates, Series KS03, Class X,
0.407%, 8/25/2025(c)(d)(e)(f) | | | 292,476 | |
| | 33,249,919 | | | FHLMC Multifamily Structured Pass Through Certificates, Series KW02, Class X1,
0.440%, 12/25/2026(c)(f) | | | 385,879 | |
| | 6,148,753 | | | FNMA, 3.880%, 6/01/2033(a) | | | 7,360,039 | |
| | 43,855,357 | | | Government National Mortgage Association, Series 2017-90, Class IO,
0.735%, 1/16/2059(c)(f) | | | 2,409,843 | |
| | 5,081,377 | | | Government National Mortgage Association, Series 2003-87, Class E,
4.673%, 8/16/2043(c) | | | 5,262,030 | |
| | 4,433,146 | | | Government National Mortgage Association, Series 2006-46, Class IO,
0.484%, 4/16/2046(c)(d)(e)(f) | | | 49,296 | |
| | 2,047,543 | | | Government National Mortgage Association, Series 2006-51, Class IO,
0.971%, 8/16/2046(a)(c)(d)(e)(f) | | | 56,816 | |
| |
| | | | Agency Commercial Mortgage-Backed Securities – continued | |
| 4,000,000 | | | Government National Mortgage Association, Series 2008-52, Class E,
6.041%, 8/16/2042(a)(c) | | | 4,894,025 | |
| | 1,301,866 | | | Government National Mortgage Association, Series 2008-80, Class E,
5.674%, 8/16/2042(a)(c) | | | 1,408,024 | |
| | 4,369,624 | | | Government National Mortgage Association, Series 2009-114, Class IO, 0.039%, 10/16/2049(c)(d)(e)(f) | | | 421 | |
| | 3,938,190 | | | Government National Mortgage Association, Series 2010-124, Class X,
0.292%, 12/16/2052(a)(c)(d)(e)(f) | | | 34,518 | |
| | 256,834 | | | Government National Mortgage Association, Series 2010-49, Class IA,
1.450%, 10/16/2052(c)(d)(e)(f) | | | 11,373 | |
| | 2,686,226 | | | Government National Mortgage Association, Series 2011-119, Class IO, 0.317%, 8/16/2051(c)(d)(e)(f) | | | 17,489 | |
| | 13,381,044 | | | Government National Mortgage Association, Series 2011-121, Class IO, 0.122%, 6/16/2043(a)(c)(d)(e)(f) | | | 45,372 | |
| | 2,688,239 | | | Government National Mortgage Association, Series 2011-121, Class ZA, 6.500%, 8/16/2051(a) | | | 3,627,832 | |
| | 12,938,845 | | | Government National Mortgage Association, Series 2011-161, Class IO, 0.241%, 4/16/2045(c)(d)(e)(f) | | | 96,828 | |
| | 2,936,148 | | | Government National Mortgage Association, Series 2011-38, Class IO,
0.242%, 4/16/2053(a)(c)(d)(e)(f) | | | 69,686 | |
| | 446,964 | | | Government National Mortgage Association, Series 2011-53, Class IO,
1.360%, 5/16/2051(a)(c)(d)(e)(f) | | | 274 | |
| | 4,131,791 | | | Government National Mortgage Association, Series 2012-100, Class IC, 1.504%, 9/16/2050(c)(d)(e)(f) | | | 94,982 | |
| | 3,141,410 | | | Government National Mortgage Association, Series 2012-111, Class IC, 1.404%, 9/16/2050(c)(d)(e)(f) | | | 67,623 | |
| | 42,737,306 | | | Government National Mortgage Association, Series 2012-142, Class IO, 0.751%, 4/16/2054(a)(c)(f) | | | 744,736 | |
| | 9,169,013 | | | Government National Mortgage Association, Series 2012-23, Class IO,
0.275%, 6/16/2053(a)(c)(d)(e)(f) | | | 90,652 | |
| | 16,945,687 | | | Government National Mortgage Association, Series 2012-55, Class IO,
0.209%, 4/16/2052(a)(c)(d)(e)(f) | | | 84,414 | |
| | 11,202,567 | | | Government National Mortgage Association, Series 2012-70, Class IO,
0.326%, 8/16/2052(a)(c)(d)(e)(f) | | | 80,783 | |
| | 11,673,341 | | | Government National Mortgage Association, Series 2012-79, Class IO,
0.538%, 3/16/2053(c)(d)(e)(f) | | | 252,540 | |
See accompanying notes to financial statements.
| 28
Portfolio of Investments – as of September 30, 2020
Loomis Sayles Securitized Asset Fund – continued
| | | | | | | | |
Principal
Amount | | | Description | | Value (†) | |
|
| | Bonds and Notes – continued | |
| |
| | | | Agency Commercial Mortgage-Backed Securities – continued | |
| $ | 52,346,468 | | | Government National Mortgage Association, Series 2012-85, Class IO,
0.757%, 9/16/2052(a)(c)(f) | | $ | 1,580,340 | |
| | 3,223,453 | | | Government National Mortgage Association, Series 2013-175, Class IO, 0.519%, 5/16/2055(c)(d)(e)(f) | | | 63,070 | |
| | 6,870,373 | | | Government National Mortgage Association, Series 2014-101, Class IO, 0.815%, 4/16/2056(c)(f) | | | 235,063 | |
| | 29,337,739 | | | Government National Mortgage Association, Series 2014-130, Class IB, 0.817%, 8/16/2054(a)(c)(f) | | | 948,178 | |
| | 22,249,371 | | | Government National Mortgage Association, Series 2014-24, Class IX,
0.524%, 1/16/2054(a)(c)(d)(e)(f) | | | 346,917 | |
| | 16,377,035 | | | Government National Mortgage Association, Series 2014-70, Class IO,
0.655%, 3/16/2049(a)(c)(f) | | | 596,730 | |
| | 10,485,615 | | | Government National Mortgage Association, Series 2014-86, Class IO,
0.630%, 4/16/2056(c)(f) | | | 313,773 | |
| | 25,872,075 | | | Government National Mortgage Association, Series 2015-120, Class IO, 0.771%, 3/16/2057(a)(c)(f) | | | 926,039 | |
| | 50,794,261 | | | Government National Mortgage Association, Series 2015-146, Class IB, 0.823%, 7/16/2055(a)(c)(f) | | | 2,071,608 | |
| | 11,883,598 | | | Government National Mortgage Association, Series 2015-171, Class IO, 0.866%, 11/16/2055(c)(f) | | | 561,682 | |
| | 21,782,228 | | | Government National Mortgage Association, Series 2015-189, Class IG, 0.901%, 1/16/2057(a)(c)(f) | | | 1,139,849 | |
| | 10,366,862 | | | Government National Mortgage Association, Series 2015-21, Class IO,
0.870%, 7/16/2056(c)(f) | | | 444,701 | |
| | 26,661,549 | | | Government National Mortgage Association, Series 2015-32, Class IO,
0.792%, 9/16/2049(a)(c)(f) | | | 993,228 | |
| | 9,019,779 | | | Government National Mortgage Association, Series 2015-68, Class IO,
0.699%, 7/16/2057(c)(d)(e)(f) | | | 341,203 | |
| | 27,273,838 | | | Government National Mortgage Association, Series 2015-70, Class IO,
0.838%, 12/16/2049(a)(c)(f) | | | 915,133 | |
| | 23,153,536 | | | Government National Mortgage Association, Series 2015-73, Class IO,
0.717%, 11/16/2055(a)(c)(f) | | | 926,567 | |
| | 41,889,673 | | | Government National Mortgage Association, Series 2016-132, Class IO, IO, 0.911%, 7/16/2056(c)(f) | | | 2,051,337 | |
| | 21,746,600 | | | Government National Mortgage Association, Series 2016-143, Class IO, 0.893%, 10/16/2056(a)(f) | | | 1,422,010 | |
| |
| | | | Agency Commercial Mortgage-Backed Securities – continued | |
| 38,750,415 | | | Government National Mortgage Association, Series 2016-6, Class IO,
0.649%, 2/16/2051(a)(c)(f) | | | 1,375,601 | |
| | 44,805,767 | | | Government National Mortgage Association, Series 2017-168, Class IO, 0.624%, 12/16/2059(a)(c)(f) | | | 2,379,424 | |
| | 20,403,371 | | | Government National Mortgage Association, Series 2018-133, Class IO, 0.677%, 6/16/2058(c)(f) | | | 1,517,011 | |
| | 20,081,993 | | | Government National Mortgage Association, Series 2018-2, Class IO,
0.735%, 12/16/2059(c)(f) | | | 1,142,804 | |
| | 75,808,731 | | | Government National Mortgage Association, Series 2018-82, Class IO,
0.501%, 5/16/2058(c)(f) | | | 3,698,283 | |
| | 31,773,799 | | | Government National Mortgage Association, Series 2018-96, Class IO,
0.487%, 8/16/2060(c)(f) | | | 1,647,344 | |
| | 34,751,536 | | | Government National Mortgage Association, Series 2019-75, Class IO,
0.923%, 12/16/2060(c)(f) | | | 2,584,517 | |
| | 32,876,142 | | | Government National Mortgage Association, Series 2019-94, Class IO,
0.928%, 8/16/2061(c)(f) | | | 2,491,804 | |
| | | | | | | | |
| | | | | | | 90,192,122 | |
| | | | | | | | |
| |
| | | | Collateralized Mortgage Obligations – 21.2% | |
| | 37,841 | | | Federal Home Loan Mortgage Corp., REMIC, Series 1673, Class SE,
8.390%, 2/15/2024(c)(d)(e) | | | 40,132 | |
| | 44,009 | | | Federal Home Loan Mortgage Corp., REMIC, Series 2060, Class ZA,
6.000%, 4/15/2028(a)(d)(e) | | | 49,160 | |
| | 325,562 | | | Federal Home Loan Mortgage Corp., REMIC, Series 2626, Class SQ,
14.619%, 6/15/2023(c)(d)(e) | | | 360,135 | |
| | 419,750 | | | Federal Home Loan Mortgage Corp., REMIC, Series 2646, Class MH,
5.000%, 7/15/2033(d)(e) | | | 458,055 | |
| | 110,783 | | | Federal Home Loan Mortgage Corp., REMIC, Series 2649, Class IM,
7.000%, 7/15/2033(a)(d)(e)(f) | | | 23,095 | |
| | 85,827 | | | Federal Home Loan Mortgage Corp., REMIC, Series 2725, Class SC,
8.842%, 11/15/2033(c)(d)(e) | | | 93,046 | |
| | 123,540 | | | Federal Home Loan Mortgage Corp., REMIC, Series 2882, Class TF, 1-month LIBOR + 0.250%, 0.402%, 10/15/2034(a)(b)(d)(e) | | | 122,649 | |
| | 4,608,412 | | | Federal Home Loan Mortgage Corp., REMIC, Series 2912, Class EH, 5.500%, 1/15/2035(a) | | | 5,431,712 | |
| | 1,452,584 | | | Federal Home Loan Mortgage Corp., REMIC, Series 3013, Class AS,
18.144%, 5/15/2035(a)(c) | | | 1,956,979 | |
| | 4,533,780 | | | Federal Home Loan Mortgage Corp., REMIC, Series 3149, Class LS,
7.048%, 5/15/2036(a)(c)(f) | | | 1,121,290 | |
See accompanying notes to financial statements.
29 |
Portfolio of Investments – as of September 30, 2020
Loomis Sayles Securitized Asset Fund – continued
| | | | | | | | |
Principal
Amount | | | Description | | Value (†) | |
|
| | Bonds and Notes – continued | |
| |
| | | | Collateralized Mortgage Obligations – continued | |
| $ | 1,334,769 | | | Federal Home Loan Mortgage Corp., REMIC, Series 3229, Class BI,
6.468%, 10/15/2036(c)(d)(e)(f) | | $ | 296,357 | |
| | 1,465,099 | | | Federal Home Loan Mortgage Corp., REMIC, Series 3416, Class BI,
6.098%, 2/15/2038(c)(d)(e)(f) | | | 318,045 | |
| | 806,516 | | | Federal Home Loan Mortgage Corp., REMIC, Series 3417, Class VS,
17.299%, 2/15/2038(a)(c) | | | 1,168,382 | |
| | 758,968 | | | Federal Home Loan Mortgage Corp., REMIC, Series 3417, Class WS,
15.601%, 2/15/2038(a)(c) | | | 1,020,971 | |
| | 1,182,137 | | | Federal Home Loan Mortgage Corp., REMIC, Series 3459, Class MB,
5.000%, 6/15/2038 | | | 1,349,983 | |
| | 859,169 | | | Federal Home Loan Mortgage Corp., REMIC, Series 3561, Class W, IO,
2.797%, 6/15/2048(a)(c)(f) | | | 921,376 | |
| | 1,785,000 | | | Federal Home Loan Mortgage Corp., REMIC, Series 3599, Class DY,
4.500%, 11/15/2029 | | | 2,057,899 | |
| | 473,566 | | | Federal Home Loan Mortgage Corp., REMIC, Series 3605, Class NC,
5.500%, 6/15/2037(d)(e) | | | 548,451 | |
| | 879,040 | | | Federal Home Loan Mortgage Corp., REMIC, Series 3620, Class AT, IO,
3.857%, 12/15/2036(a)(c)(f) | | | 952,038 | |
| | 2,048,276 | | | Federal Home Loan Mortgage Corp., REMIC, Series 3641, Class PB,
5.000%, 3/15/2040 | | | 2,231,161 | |
| | 3,017,675 | | | Federal Home Loan Mortgage Corp., REMIC, Series 3747, Class CS,
6.348%, 10/15/2040(c)(d)(e)(f) | | | 566,785 | |
| | 1,937,290 | | | Federal Home Loan Mortgage Corp., REMIC, Series 3785, Class LS,
9.595%, 1/15/2041(a)(c) | | | 2,494,400 | |
| | 186,172 | | | Federal Home Loan Mortgage Corp., REMIC, Series 3792, Class DF, 1-month LIBOR + 0.400%, 0.552%, 11/15/2040(b)(d)(e) | | | 184,180 | |
| | 7,500,000 | | | Federal Home Loan Mortgage Corp., REMIC, Series 3805, Class PB,
4.500%, 2/15/2041(a) | | | 8,697,924 | |
| | 360,817 | | | Federal Home Loan Mortgage Corp., REMIC, Series 3808, Class SH,
8.890%, 2/15/2041(c) | | | 463,667 | |
| | 105,831 | | | Federal Home Loan Mortgage Corp., REMIC, Series 3828, Class EF, 1-month LIBOR + 0.400%, 0.552%, 5/15/2037(a)(b)(d)(e) | | | 105,334 | |
| | 4,639,000 | | | Federal Home Loan Mortgage Corp., REMIC, Series 3848, Class WX,
5.000%, 4/15/2041(a) | | | 5,483,062 | |
| | 2,850,022 | | | Federal Home Loan Mortgage Corp., REMIC, Series 3922, Class SH,
5.748%, 9/15/2041(c)(d)(e)(f) | | | 476,939 | |
| | 7,634,374 | | | Federal Home Loan Mortgage Corp., REMIC, Series 4034, Class GB,
4.500%, 4/15/2032(a) | | | 8,758,249 | |
| |
| | | | Collateralized Mortgage Obligations – continued | |
| 1,800,000 | | | Federal Home Loan Mortgage Corp., REMIC, Series 4041, Class ES,
23.238%, 8/15/2040(a)(c) | | | 3,419,084 | |
| | 2,026,558 | | | Federal Home Loan Mortgage Corp., REMIC, Series 4097, Class US,
5.998%, 8/15/2032(c)(d)(e)(f) | | | 290,551 | |
| | 1,820,000 | | | Federal Home Loan Mortgage Corp., REMIC, Series 4204, Class QP,
3.000%, 5/15/2043(a) | | | 2,032,257 | |
| | 2,170,761 | | | Federal Home Loan Mortgage Corp., REMIC, Series 4268, Class DL,
2.500%, 11/15/2028(a) | | | 2,336,593 | |
| | 1,655,138 | | | Federal Home Loan Mortgage Corp., REMIC, Series 4290, Class QB,
2.500%, 1/15/2029 | | | 1,764,412 | |
| | 6,614,122 | | | Federal Home Loan Mortgage Corp., REMIC, Series 4321, Class BS,
2.675%, 6/15/2039(c)(d)(e)(f) | | | 379,840 | |
| | 800,000 | | | Federal Home Loan Mortgage Corp., REMIC, Series 4395, Class PE,
2.500%, 4/15/2037 | | | 831,121 | |
| | 322,713 | | | Federal Home Loan Mortgage Corp., REMIC, Series 4460, Class NT, 6.500%, 8/15/2043(c)(d)(e) | | | 372,095 | |
| | 383,542 | | | Federal Home Loan Mortgage Corp., REMIC, Series 4460, Class TN,
5.000%, 8/15/2043(c)(d)(e) | | | 407,433 | |
| | 1,399,000 | | | Federal Home Loan Mortgage Corp., REMIC, Series 4480, Class NB, 3.500%, 6/15/2045 | | | 1,673,859 | |
| | 3,229,697 | | | Federal Home Loan Mortgage Corp., REMIC, Series 4512, Class IE, 4.500%, 3/15/2044(f) | | | 457,131 | |
| | 9,807,355 | | | Federal Home Loan Mortgage Corp., REMIC, Series 4672, Class SP, 5.948%, 4/15/2047(c)(f) | | | 1,445,543 | |
| | 4,437,695 | | | Federal Home Loan Mortgage Corp., REMIC, Series 4749, Class IO, 4.000%, 12/15/2047(f) | | | 401,162 | |
| | 2,791,936 | | | Federal Home Loan Mortgage Corp., REMIC, Series 4840, Class KY, 4.500%, 11/15/2048 | | | 3,512,877 | |
| | 2,223,211 | | | Federal Home Loan Mortgage Corp., REMIC, Series 4860, Class CY, 3.500%, 8/15/2047 | | | 2,583,243 | |
| | 6,435,568 | | | Federal Home Loan Mortgage Corp., REMIC, Series 4930, Class PY, 3.500%, 11/25/2049(a) | | | 7,579,063 | |
| | 2,751,785 | | | Federal Home Loan Mortgage Corp., REMIC, Series 4949, Class BP, 3.000%, 2/25/2050 | | | 3,158,546 | |
| | 348,140 | | | Federal Home Loan Mortgage Corp.,
Series 224, Class IO,
6.000%, 3/01/2033(a)(d)(e)(f) | | | 59,885 | |
| | 3,836,321 | | | Federal Home Loan Mortgage Corp.,
Series 353, Class 300, 3.000%, 12/15/2046(a) | | | 4,130,748 | |
| | 2,751,014 | | | Federal National Mortgage Association, REMIC, Series 2012-14, Class MS, 6.352%, 3/25/2042(c)(f) | | | 632,402 | |
See accompanying notes to financial statements.
| 30
Portfolio of Investments – as of September 30, 2020
Loomis Sayles Securitized Asset Fund – continued
| | | | | | | | |
Principal
Amount | | | Description | | Value (†) | |
|
| | Bonds and Notes – continued | |
| |
| | | | Collateralized Mortgage Obligations – continued | |
| $ | 2,548,180 | | | Federal National Mortgage Association, REMIC, Series 2012-21, Class SB, 5.802%, 3/25/2042(c)(d)(e)(f) | | $ | 314,850 | |
| | 3,964,062 | | | Federal National Mortgage Association, REMIC, Series 2013-117, Class S,
6.452%, 11/25/2043(c)(f) | | | 862,566 | |
| | 622,000 | | | Federal National Mortgage Association , REMIC, Series 2019-55, Class PL, 3.500%, 10/25/2049(d)(e) | | | 701,771 | |
| | 77,329 | | | Federal National Mortgage Association, REMIC, Series 1996-45, Class SC, 7.102%, 1/25/2024(c)(d)(e)(f) | | | 7,350 | |
| | 986,762 | | | Federal National Mortgage Association, REMIC, Series 2005-22, Class DG, 6.810%, 4/25/2035(a)(c) | | | 1,093,912 | |
| | 2,084,818 | | | Federal National Mortgage Association, REMIC, Series 2005-45, Class DA, 23.877%, 6/25/2035(a)(c) | | | 3,492,714 | |
| | 2,257,401 | | | Federal National Mortgage Association, REMIC, Series 2005-62, Class GZ, 5.750%, 7/25/2035(a) | | | 2,750,796 | |
| | 1,637,197 | | | Federal National Mortgage Association, REMIC, Series 2006-46, Class SK, 23.657%, 6/25/2036(a)(c) | | | 2,818,909 | |
| | 73,799 | | | Federal National Mortgage Association, REMIC, Series 2006-69, Class KI, 7.152%, 8/25/2036(c)(d)(e)(f) | | | 13,514 | |
| | 449,374 | | | Federal National Mortgage Association, REMIC, Series 2008-15, Class AS, 32.259%, 8/25/2036(c) | | | 911,055 | |
| | 1,089,933 | | | Federal National Mortgage Association, REMIC, Series 2008-86, Class LA, 3.502%, 8/25/2038(a)(c) | | | 1,171,258 | |
| | 288,125 | | | Federal National Mortgage Association, REMIC, Series 2008-87, Class LD, 4.175%, 11/25/2038(c)(d)(e) | | | 317,413 | |
| | 1,243,050 | | | Federal National Mortgage Association, REMIC, Series 2009-11, Class VP, 2.458%, 3/25/2039(a)(c) | | | 1,304,893 | |
| | 1,517,181 | | | Federal National Mortgage Association, REMIC, Series 2009-63, Class LM, 5.000%, 8/25/2039 | | | 1,651,420 | |
| | 29,269 | | | Federal National Mortgage Association, REMIC, Series 2009-71, Class MB, 4.500%, 9/25/2024(d)(e) | | | 29,916 | |
| | 108,252 | | | Federal National Mortgage Association, REMIC, Series 2010-75, Class MT, 2.311%, 12/25/2039(c)(d)(e) | | | 112,762 | |
| | 2,343,095 | | | Federal National Mortgage Association, REMIC, Series 2010-80, Class PZ, 5.000%, 7/25/2040(a) | | | 2,922,259 | |
| |
| | | | Collateralized Mortgage Obligations – continued | |
| 458,025 | | | Federal National Mortgage Association, REMIC, Series 2011-100, Class SH,
7.545%, 11/25/2040(c) | | | 593,265 | |
| | 3,338,879 | | | Federal National Mortgage Association, REMIC, Series 2011-109, Class PZ,
4.500%, 8/25/2041 | | | 4,096,822 | |
| | 2,939,643 | | | Federal National Mortgage Association, REMIC, Series 2011-51, Class SM, 5.702%, 6/25/2041(c)(d)(e)(f) | | | 517,579 | |
| | 1,936,101 | | | Federal National Mortgage Association, REMIC, Series 2011-60, Class ZB, 5.000%, 7/25/2041 | | | 2,297,618 | |
| | 7,885,572 | | | Federal National Mortgage Association, REMIC, Series 2012-97, Class SB, 5.852%, 9/25/2042(c)(f) | | | 1,531,133 | |
| | 1,500,000 | | | Federal National Mortgage Association, REMIC, Series 2013-109, Class US,
11.783%, 7/25/2043(a)(c) | | | 2,137,418 | |
| | 232,510 | | | Federal National Mortgage Association, REMIC, Series 2013-23, Class TS, 5.917%, 3/25/2043(c)(d)(e) | | | 235,663 | |
| | 2,938,103 | | | Federal National Mortgage Association, REMIC, Series 2013-34, Class PS, 6.002%, 8/25/2042(a)(c)(d)(e)(f) | | | 472,096 | |
| | 3,918,202 | | | Federal National Mortgage Association, REMIC, Series 2013-62, Class PY, 2.500%, 6/25/2043 | | | 4,204,219 | |
| | 24,335,265 | | | Federal National Mortgage Association, REMIC, Series 2014-15, Class SA, 5.902%, 4/25/2044(c)(f) | | | 4,691,080 | |
| | 3,161,114 | | | Federal National Mortgage Association, REMIC, Series 2014-28, Class SD, 5.902%, 5/25/2044(c)(d)(e)(f) | | | 593,201 | |
| | 41,502 | | | Federal National Mortgage Association, REMIC, Series 2014-67, Class PT, 6.000%, 10/25/2044(c)(d)(e) | | | 42,326 | |
| | 1,063,946 | | | Federal National Mortgage Association, REMIC, Series 2015-1, Class SN, 6.000%, 7/25/2043(a)(c) | | | 1,240,614 | |
| | 687,206 | | | Federal National Mortgage Association, REMIC, Series 2015-55, Class KT, 5.500%, 5/25/2041(c) | | | 794,546 | |
| | 13,785,979 | | | Federal National Mortgage Association, REMIC, Series 2016-22, Class ST, IO, 5.952%, 4/25/2046(a)(c)(f) | | | 2,703,417 | |
| | 2,646,592 | | | Federal National Mortgage Association, REMIC, Series 2016-26, Class KL, 4.500%, 11/25/2042(a)(c) | | | 2,830,651 | |
| | 15,636,302 | | | Federal National Mortgage Association, REMIC, Series 2016-32, Class SA, 5.952%, 10/25/2034(a)(c)(f) | | | 2,891,595 | |
See accompanying notes to financial statements.
31 |
Portfolio of Investments – as of September 30, 2020
Loomis Sayles Securitized Asset Fund – continued
| | | | | | | | |
Principal
Amount | | | Description | | Value (†) | |
|
| | Bonds and Notes – continued | |
| |
| | | | Collateralized Mortgage Obligations – continued | |
| $ | 18,913,243 | | | Federal National Mortgage Association, REMIC, Series 2016-60, Class ES, 5.952%, 9/25/2046(a)(c)(f) | | $ | 3,643,163 | |
| | 12,657,503 | | | Federal National Mortgage Association, REMIC, Series 2016-60, Class QS, 5.952%, 9/25/2046(a)(c)(f) | | | 2,568,463 | |
| | 7,921,766 | | | Federal National Mortgage Association, REMIC, Series 2016-82, Class SC, 5.952%, 11/25/2046(c)(f) | | | 1,581,533 | |
| | 7,601,698 | | | Federal National Mortgage Association, REMIC, Series 2016-82, Class SG, 5.952%, 11/25/2046(c)(f) | | | 1,564,636 | |
| | 9,413,157 | | | Federal National Mortgage Association, REMIC, Series 2016-93, Class SL, 6.502%, 12/25/2046(a)(c)(f) | | | 1,934,505 | |
| | 12,365,242 | | | Federal National Mortgage Association, REMIC, Series 2017-26, Class SA, 6.002%, 4/25/2047(a)(c)(f) | | | 2,499,066 | |
| | 63,119,129 | | | Federal National Mortgage Association, REMIC, Series 2017-57, Class SD, IO, 2.750%, 8/25/2047(a)(c)(f) | | | 5,711,252 | |
| | 17,119,813 | | | Federal National Mortgage Association, REMIC, Series 2019-20, Class LY, 3.500%, 10/25/2048(a) | | | 18,563,582 | |
| | 3,792,367 | | | Federal National Mortgage Association, REMIC, Series 2019-42, Class PT, 3.000%, 8/25/2049 | | | 3,983,202 | |
| | 1,578,000 | | | Federal National Mortgage Association, REMIC, Series 2019-64, Class ML, 3.500%, 11/25/2049 | | | 1,799,597 | |
| | 3,600,000 | | | Federal National Mortgage Association, REMIC, Series 2020-72, Class LI, IO, 5.000%, 12/25/2040(e)(f) | | | 1,072,125 | |
| | 463,928 | | | Federal National Mortgage Association, Series 334, Class 11,
6.000%, 3/25/2033(a)(d)(e)(f) | | | 78,028 | |
| | 119,215 | | | Federal National Mortgage Association, Series 334, Class 19,
7.000%, 2/25/2033(a)(c)(d)(e)(f) | | | 30,841 | |
| | 487,833 | | | Federal National Mortgage Association, Series 339, Class 13,
6.000%, 6/25/2033(a)(d)(e)(f) | | | 99,245 | |
| | 320,003 | | | Federal National Mortgage Association, Series 339, Class 7,
5.500%, 11/25/2033(d)(e)(f) | | | 58,464 | |
| | 1,081,919 | | | Federal National Mortgage Association, Series 356, Class 13,
5.500%, 6/25/2035(a)(d)(e)(f) | | | 197,371 | |
| | 442,308 | | | Federal National Mortgage Association, Series 359, Class 17,
6.000%, 7/25/2035(a)(d)(e)(f) | | | 95,865 | |
| | 242,014 | | | Federal National Mortgage Association, Series 374, Class 18,
6.500%, 8/25/2036(a)(d)(e)(f) | | | 53,803 | |
| | 551,189 | | | Federal National Mortgage Association, Series 374, Class 20,
6.500%, 9/25/2036(a)(d)(e)(f) | | | 124,600 | |
| |
| | | | Collateralized Mortgage Obligations – continued | |
| 242,266 | | | Federal National Mortgage Association, Series 374, Class 22,
7.000%, 10/25/2036(a)(d)(e)(f) | | | 62,181 | |
| | 284,144 | | | Federal National Mortgage Association, Series 374, Class 23,
7.000%, 10/25/2036(a)(d)(e)(f) | | | 61,535 | |
| | 351,477 | | | Federal National Mortgage Association, Series 374, Class 24,
7.000%, 6/25/2037(a)(d)(e)(f) | | | 93,302 | |
| | 344,661 | | | Federal National Mortgage Association, Series 381, Class 12,
6.000%, 11/25/2035(a)(d)(e)(f) | | | 69,097 | |
| | 172,532 | | | Federal National Mortgage Association, Series 381, Class 13,
6.000%, 11/25/2035(a)(c)(d)(e)(f) | | | 33,712 | |
| | 201,831 | | | Federal National Mortgage Association, Series 381, Class 18,
7.000%, 3/25/2037(a)(d)(e)(f) | | | 43,937 | |
| | 134,902 | | | Federal National Mortgage Association, Series 381, Class 19,
7.000%, 3/25/2037(a)(c)(d)(e)(f) | | | 28,886 | |
| | 38,453 | | | Federal National Mortgage Association, Series 383, Class 32,
6.000%, 1/25/2038(d)(e)(f) | | | 8,040 | |
| | 1,177,926 | | | Federal National Mortgage Association, Series 384, Class 20,
5.500%, 5/25/2036(a)(c)(d)(e)(f) | | | 232,300 | |
| | 429,178 | | | Federal National Mortgage Association, Series 384, Class 31,
6.500%, 7/25/2037(a)(d)(e)(f) | | | 99,696 | |
| | 318,766 | | | Federal National Mortgage Association, Series 384, Class 36,
7.000%, 7/25/2037(a)(c)(d)(e)(f) | | | 56,280 | |
| | 338,083 | | | Federal National Mortgage Association, Series 384, Class 4,
4.500%, 9/25/2036(a)(c)(d)(e)(f) | | | 31,755 | |
| | 183,977 | | | Federal National Mortgage Association, Series 385, Class 23,
7.000%, 7/25/2037(a)(d)(e)(f) | | | 47,408 | |
| | 31,922 | | | Federal National Mortgage Association, Series 386, Class 25,
7.000%, 3/25/2038(c)(d)(e)(f) | | | 8,440 | |
| | 304,959 | | | Government National Mortgage Association, Series 2009-65, Class NZ, 5.500%, 8/20/2039(d)(e) | | | 371,164 | |
| | 347,303 | | | Government National Mortgage Association, Series 2010-H02, Class FA, 1-month LIBOR + 0.680%, 0.850%, 2/20/2060(b) | | | 349,235 | |
| | 662,895 | | | Government National Mortgage Association, Series 2010-H22, Class FE, 1-month LIBOR + 0.350%, 0.505%, 5/20/2059(a)(b) | | | 662,249 | |
| | 198,380 | | | Government National Mortgage Association, Series 2010-H24, Class FA, 1-month LIBOR + 0.350%, 0.505%, 10/20/2060(b) | | | 197,961 | |
See accompanying notes to financial statements.
| 32
Portfolio of Investments – as of September 30, 2020
Loomis Sayles Securitized Asset Fund – continued
| | | | | | | | |
Principal
Amount | | | Description | | Value (†) | |
|
| | Bonds and Notes – continued | |
| |
| | | | Collateralized Mortgage Obligations – continued | |
| $ | 174,284 | | | Government National Mortgage Association, Series 2011-H05, Class FB, 1-month LIBOR + 0.500%, 0.655%, 12/20/2060(b) | | $ | 174,625 | |
| | 88,247 | | | Government National Mortgage Association, Series 2011-H11, Class FA, 1-month LIBOR + 0.500%, 0.655%, 3/20/2061(b) | | | 88,411 | |
| | 122,186 | | | Government National Mortgage Association, Series 2011-H21, Class FA, 1-month LIBOR + 0.600%, 0.755%, 10/20/2061(b)(d)(e) | | | 122,061 | |
| | 331,293 | | | Government National Mortgage Association, Series 2011-H21, Class FT, 1-year CMT + 0.700%, 0.830%, 10/20/2061(b)(d)(e) | | | 328,568 | |
| | 57,948 | | | Government National Mortgage Association, Series 2012-H11, Class BA, 2.000%, 5/20/2062(a)(d)(e) | | | 58,744 | |
| | 156,580 | | | Government National Mortgage Association, Series 2012-H16, Class HA,
2.000%, 7/20/2062 | | | 160,018 | |
| | 407,039 | | | Government National Mortgage Association, Series 2012-H22, Class HD, 5.298%, 1/20/2061(c)(d)(e) | | | 454,223 | |
| | 6,948 | | | Government National Mortgage Association, Series 2012-H24, Class FE, 1-month LIBOR + 0.600%, 0.755%, 10/20/2062(b)(d)(e) | | | 6,946 | |
| | 717,725 | | | Government National Mortgage Association, Series 2013-H01, Class JA, 1-month LIBOR + 0.320%, 0.475%, 1/20/2063(b)(d)(e) | | | 712,532 | |
| | 427,645 | | | Government National Mortgage Association, Series 2013-H10, Class LA, 2.500%, 4/20/2063 | | | 430,668 | |
| | 526,888 | | | Government National Mortgage Association, Series 2013-H11, Class JA, 3.500%, 4/20/2063 | | | 535,442 | |
| | 1,751,549 | | | Government National Mortgage Association, Series 2013-H13, Class SI, 1.325%, 6/20/2063(c)(d)(e)(f) | | | 99,619 | |
| | 16,185,399 | | | Government National Mortgage Association, Series 2013-H16, Class AI, 1.626%, 7/20/2063(c)(d)(e)(f) | | | 536,020 | |
| | 10,068,043 | | | Government National Mortgage Association, Series 2013-H18, Class EI, 1.726%, 7/20/2063(c)(d)(e)(f) | | | 485,112 | |
| | 1,489,646 | | | Government National Mortgage Association, Series 2013-H18, Class JI, 1.361%, 8/20/2063(c)(d)(e)(f) | | | 51,616 | |
| |
| | | | Collateralized Mortgage Obligations – continued | |
| 433,678 | | | Government National Mortgage Association, Series 2013-H20, Class FA, 1-month LIBOR + 0.600%, 0.755%, 8/20/2063(b)(d)(e) | | | 433,011 | |
| | 9,527,667 | | | Government National Mortgage Association, Series 2014-H12, Class HZ, 4.601%, 6/20/2064(a)(c) | | | 10,512,135 | |
| | 21,417,989 | | | Government National Mortgage Association, Series 2014-H24, Class HI, 0.959%, 9/20/2064(c)(e)(f) | | | 713,219 | |
| | 6,193,780 | | | Government National Mortgage Association, Series 2015-152, Class PI, IO, 4.000%, 10/20/2045(f) | | | 610,100 | |
| | 14,856,195 | | | Government National Mortgage Association, Series 2015-H01, Class XZ, 4.594%, 10/20/2064(a)(c) | | | 16,951,354 | |
| | 787,425 | | | Government National Mortgage Association, Series 2015-H04, Class HA, 3.500%, 11/20/2064(c)(d)(e) | | | 831,606 | |
| | 21,329 | | | Government National Mortgage Association, Series 2015-H05, Class FA, 1-month LIBOR + 0.300%, 0.455%, 4/20/2061(a)(b)(d)(e) | | | 21,177 | |
| | 2,981,546 | | | Government National Mortgage Association, Series 2015-H10, Class JA, 2.250%, 4/20/2065(a) | | | 3,043,128 | |
| | 44,378 | | | Government National Mortgage Association, Series 2015-H13, Class FL, 1-month LIBOR + 0.280%, 0.435%, 5/20/2063(a)(b)(d)(e) | | | 44,044 | |
| | 21,070 | | | Government National Mortgage Association, Series 2015-H19, Class FA, 1-month LIBOR + 0.200%, 0.355%, 4/20/2063(a)(b)(d)(e) | | | 20,781 | |
| | 390,544 | | | Government National Mortgage Association, Series 2015-H28, Class JZ, 5.007%, 3/20/2065(c)(d)(e) | | | 425,927 | |
| | 26,274 | | | Government National Mortgage Association, Series 2015-H29, Class FA, 1-month LIBOR + 0.700%, 0.855%, 10/20/2065(a)(b)(d)(e) | | | 26,238 | |
| | 124,774 | | | Government National Mortgage Association, Series 2015-H29, Class HZ, 4.586%, 9/20/2065(c)(d)(e) | | | 153,587 | |
| | 8,037 | | | Government National Mortgage Association, Series 2015-H30, Class FA, 1-month LIBOR + 0.680%, 0.835%, 8/20/2061(b)(d)(e) | | | 8,023 | |
| | 1,770,000 | | | Government National Mortgage Association, Series 2016-17, Class GT,
5.000%, 8/20/2045(c) | | | 2,063,342 | |
| | 846,757 | | | Government National Mortgage Association, Series 2016-23, Class PA,
5.648%, 7/20/2037(a)(c)(d)(e) | | | 977,776 | |
| | 15,730,420 | | | Government National Mortgage Association, Series 2016-H01, Class AI, 3.181%, 1/20/2066(a)(c)(f) | | | 1,206,791 | |
See accompanying notes to financial statements.
33 |
Portfolio of Investments – as of September 30, 2020
Loomis Sayles Securitized Asset Fund – continued
| | | | | | | | |
Principal
Amount | | | Description | | Value (†) | |
|
| | Bonds and Notes – continued | |
| |
| | | | Collateralized Mortgage Obligations – continued | |
| $ | 23,180,586 | | | Government National Mortgage Association, Series 2016-H09, Class JI,
2.882%, 4/20/2066(a)(c)(f) | | $ | 2,009,965 | |
| | 603,528 | | | Government National Mortgage Association, Series 2016-H14, Class JZ, 4.067%, 8/20/2063(c)(d)(e) | | | 635,708 | |
| | 597,057 | | | Government National Mortgage Association, Series 2016-H19, Class CZ, 4.361%, 8/20/2066(c)(d)(e) | | | 656,030 | |
| | 266,661 | | | Government National Mortgage Association, Series 2016-H19, Class EZ, 4.885%, 6/20/2061(c)(d)(e) | | | 271,307 | |
| | 277,626 | | | Government National Mortgage Association, Series 2016-H19, Class FC, 1-month LIBOR + 0.400%, 0.555%, 8/20/2066(a)(b) | | | 277,552 | |
| | 114,855 | | | Government National Mortgage Association, Series 2016-H19, Class FJ, 1-month LIBOR + 0.400%, 0.555%, 9/20/2063(a)(b)(d)(e) | | | 114,248 | |
| | 21,520,762 | | | Government National Mortgage Association, Series 2017-128, Class IO, IO, 0.855%, 12/16/2056(c)(f) | | | 1,272,112 | |
| | 3,076,790 | | | Government National Mortgage Association, Series 2017-H05, Class AI, IO, 3.866%, 1/20/2067(c)(d)(e)(f) | | | 310,200 | |
| | 22,368,080 | | | Government National Mortgage Association, Series 2018-110, Class IO, 0.675%, 1/16/2060(c)(f) | | | 1,378,865 | |
| | 2,312,775 | | | Government National Mortgage Association, Series 2018-124, Class KY, 3.500%, 9/20/2048 | | | 2,622,653 | |
| | 31,229,729 | | | Government National Mortgage Association, Series 2018-129, Class IO, 0.616%, 7/16/2060(c)(f) | | | 1,978,466 | |
| | 29,993,341 | | | Government National Mortgage Association, Series 2018-143, Class IO, 0.648%, 10/16/2060(c)(f) | | | 2,051,760 | |
| | 3,915,232 | | | Government National Mortgage Association, Series 2018-160 Class BY, 4.000%, 11/20/2048 | | | 4,464,499 | |
| | 466,446 | | | Government National Mortgage Association, Series 2018-H02, Class FJ, 1-month LIBOR + 0.200%, 0.355%, 10/20/2064(a)(b) | | | 465,790 | |
| | 447,115 | | | Government National Mortgage Association, Series 2018-H10, Class FJ, 1-month LIBOR + 0.250%, 0.405%, 6/20/2068(a)(b) | | | 446,139 | |
| | 3,940,875 | | | Government National Mortgage Association, Series 2018-H16, Class CZ, 4.256%, 5/20/2068(c) | | | 5,064,117 | |
| | 2,530,309 | | | Government National Mortgage Association, Series 2019-1 Class CY, 4.000%, 1/20/2049 | | | 3,020,492 | |
| |
| | | | Collateralized Mortgage Obligations – continued | |
| 280,000 | | | Government National Mortgage Association, Series 2019-111, Class LP, 3.500%, 9/20/2049(d)(e) | | | 301,216 | |
| | 31,368,778 | | | Government National Mortgage Association, Series 2019-116, Class IO, 0.848%, 12/16/2061(c)(f) | | | 2,504,543 | |
| | 324,000 | | | Government National Mortgage Association, Series 2019-132, Class LP, 3.500%, 10/20/2049(d)(e) | | | 352,160 | |
| | 8,447,001 | | | Government National Mortgage Association, Series 2019-152, Class LI, 5.394%, 2/20/2044(c)(f) | | | 2,766,709 | |
| | 2,503,752 | | | Government National Mortgage Association, Series 2019-31, Class HD, 3.500%, 3/20/2049 | | | 2,738,902 | |
| | 1,000,000 | | | Government National Mortgage Association, Series 2019-31, Class V, 3.500%, 2/20/2039 | | | 1,087,600 | |
| | 10,502,569 | | | Government National Mortgage Association, Series 2019-44, Class BS,
5.894%, 4/20/2049(c)(f) | | | 1,328,518 | |
| | 5,553,104 | | | Government National Mortgage Association, Series 2019-61, Class M, 3.500%, 3/20/2049 | | | 6,227,650 | |
| | 12,280,000 | | | Government National Mortgage Association, Series 2019-70, Class SK,
5.844%, 8/20/2043(c)(f) | | | 3,286,678 | |
| | 4,075,853 | | | Government National Mortgage Association, Series 2019-71, Class JY, 3.000%, 6/20/2049 | | | 4,445,656 | |
| | 1,895,239 | | | Government National Mortgage Association, Series 2019-H02, Class BZ, 4.289%, 1/20/2069(c) | | | 2,521,983 | |
| | 8,374,816 | | | Government National Mortgage Association, Series 2019-H04, Class NA, 3.500%, 9/20/2068(a) | | | 9,141,476 | |
| | 21,582,250 | | | Government National Mortgage Association, Series 2019-H17, Class HA, 3.000%, 3/20/2069(a) | | | 23,042,977 | |
| | 11,096,300 | | | Government National Mortgage Association, Series 2020-47, Class IQ,
3.500%, 3/20/2050(f) | | | 3,732,529 | |
| | | | | | | | |
| | | | | | | 318,491,765 | |
| | | | | | | | |
| |
| | | | Hybrid ARMs – 0.4% | |
| | 57,723 | | | FHLMC, 1-year CMT + 2.258%, 3.152%, 1/01/2035(a)(b) | | | 60,917 | |
| | 1,048,140 | | | FHLMC, 1-year CMT + 2.213%, 3.197%, 6/01/2035(a)(b) | | | 1,102,064 | |
| | 92,702 | | | FHLMC, 1-year CMT + 2.279%, 3.700%, 1/01/2036(a)(b) | | | 93,344 | |
| | 453,755 | | | FHLMC, 12-month LIBOR + 2.190%, 4.190%, 2/01/2037(a)(b) | | | 485,919 | |
| | 163,313 | | | FNMA, 6-month LIBOR + 1.558%, 1.963%, 2/01/2037(a)(b) | | | 168,276 | |
| | 201,994 | | | FNMA, 1-year CMT + 2.045%, 2.295%, 10/01/2035(a)(b) | | | 202,445 | |
| | 177,668 | | | FNMA, 12-month LIBOR + 1.883%, 3.113%, 9/01/2036(a)(b) | | | 187,488 | |
| | 409,138 | | | FNMA, 1-year CMT + 2.137%, 3.328%, 9/01/2034(a)(b) | | | 429,354 | |
See accompanying notes to financial statements.
| 34
Portfolio of Investments – as of September 30, 2020
Loomis Sayles Securitized Asset Fund – continued
| | | | | | | | |
Principal
Amount | | | Description | | Value (†) | |
|
| | Bonds and Notes – continued | |
| |
| | | | Hybrid ARMs – continued | |
| $ | 1,341,209 | | | FNMA, 12-month LIBOR + 1.732%, 3.362%, 9/01/2037(a)(b) | | $ | 1,412,247 | |
| | 294,928 | | | FNMA, 12-month LIBOR + 1.677%, 3.521%, 8/01/2038(a)(b) | | | 300,025 | |
| | 1,014,889 | | | FNMA, 1-year CMT + 2.223%, 3.733%, 6/01/2034(a)(b) | | | 1,067,715 | |
| | | | | | | | |
| | | | | | | 5,509,794 | |
| | | | | | | | |
| |
| | | | Mortgage Related – 22.9% | |
| | 11,268,461 | | | FHLMC, 2.000%, with various maturities in 2050(h) | | | 11,703,511 | |
| | 8,279,013 | | | FHLMC, 2.500%, 9/01/2050 | | | 8,699,628 | |
| | 4,569,012 | | | FHLMC, 4.000%, 8/01/2048 | | | 4,869,638 | |
| | 9,121,451 | | | FHLMC, 4.500%, with various maturities from 2048 to 2050(h) | | | 9,876,280 | |
| | 7,887,896 | | | FHLMC, 5.000%, with various maturities from 2035 to 2050(h) | | | 8,639,238 | |
| | 35,600,239 | | | FNMA, 2.000%, with various maturities in 2050(h) | | | 36,915,655 | |
| | 33,053,114 | | | FNMA, 2.500%, with various maturities in 2050(a)(h) | | | 34,854,907 | |
| | 10,847,069 | | | FNMA, 3.000%, with various maturities from 2047 to 2049(h) | | | 11,360,833 | |
| | 64,054,798 | | | FNMA, 4.000%, with various maturities from 2045 to 2052(h) | | | 68,340,404 | |
| | 18,146,519 | | | FNMA, 4.500%, with various maturities from 2048 to 2049(h) | | | 19,622,111 | |
| | 10,161,946 | | | FNMA, 5.000%, with various maturities from 2048 to 2049(h) | | | 11,131,660 | |
| | 281,074 | | | FNMA, 5.500%, 8/01/2034(a) | | | 331,197 | |
| | 3,211 | | | FNMA, 6.000%, 10/01/2034 | | | 3,803 | |
| | 732,973 | | | GNMA, 1-month LIBOR + 0.532%, 0.710%, 8/20/2063(b) | | | 741,136 | |
| | 304,329 | | | GNMA, 1-month LIBOR + 1.735%, 1.913%, 7/20/2060(b) | | | 317,844 | |
| | 227,624 | | | GNMA, 1-month LIBOR + 1.787%, 1.965%, 9/20/2060(b) | | | 238,579 | |
| | 722,633 | | | GNMA, 1-month LIBOR + 2.311%, 2.489%, 6/20/2065(b) | | | 779,237 | |
| | 10,785 | | | GNMA, 3.355%, 8/20/2062(c) | | | 10,889 | |
| | 12,559 | | | GNMA, 3.695%, 2/20/2063(c) | | | 12,839 | |
| | 129,639 | | | GNMA, 3.819%, 6/20/2063(c) | | | 135,510 | |
| | 3,945 | | | GNMA, 3.890%, with various maturities in 2062(c)(h) | | | 3,956 | |
| | 460,998 | | | GNMA, 3.946%, with various maturities from 2062 to 2063(a)(c)(h) | | | 467,142 | |
| | 4,698 | | | GNMA, 3.954%, 3/20/2063(c) | | | 4,803 | |
| | 316,685 | | | GNMA, 3.961%, 5/20/2063(a)(c) | | | 327,584 | |
| | 28,565 | | | GNMA, 3.968%, 7/20/2062(c) | | | 29,131 | |
| | 685 | | | GNMA, 3.990%, 11/20/2062(c) | | | 713 | |
| | 1,671 | | | GNMA, 3.992%, 5/20/2062(c) | | | 1,806 | |
| | 40,443 | | | GNMA, 4.013%, 1/20/2064(c) | | | 41,333 | |
| | 2,294 | | | GNMA, 4.031%, 12/20/2063(c) | | | 2,342 | |
| | 4,064 | | | GNMA, 4.043%, 10/20/2062(c) | | | 4,256 | |
| | 234,440 | | | GNMA, 4.047%, 4/20/2063(a)(c) | | | 239,305 | |
| | 162,223 | | | GNMA, 4.079%, 3/20/2063(a)(c) | | | 165,186 | |
| | 169,970 | | | GNMA, 4.111%, 3/20/2063(c) | | | 177,049 | |
| | 221,979 | | | GNMA, 4.122%, 2/20/2063(a)(c) | | | 227,615 | |
| | 17,113 | | | GNMA, 4.140%, 12/20/2061(a)(c) | | | 18,778 | |
| | 126,018 | | | GNMA, 4.147%, 1/20/2067(a)(c) | | | 128,362 | |
| |
| | | | Mortgage Related – continued | |
| 75,329 | | | GNMA, 4.158%, 7/20/2063(a)(c) | | | 78,380 | |
| | 3,915 | | | GNMA, 4.179%, 3/20/2063(c) | | | 3,937 | |
| | 935 | | | GNMA, 4.194%, 12/20/2063(c) | | | 972 | |
| | 10,257 | | | GNMA, 4.204%, 1/20/2063(c) | | | 10,419 | |
| | 16,077 | | | GNMA, 4.221%, 11/20/2063(c) | | | 16,789 | |
| | 2,630 | | | GNMA, 4.256%, 3/20/2063(c) | | | 2,675 | |
| | 9,365 | | | GNMA, 4.266%, 12/20/2062(c) | | | 9,757 | |
| | 723,966 | | | GNMA, 4.294%, 6/20/2063(a)(c) | | | 739,426 | |
| | 1,775 | | | GNMA, 4.310%, 12/20/2060(c) | | | 1,995 | |
| | 9,516 | | | GNMA, 4.312%, 1/20/2063(c) | | | 9,727 | |
| | 36,147 | | | GNMA, 4.361%, 7/20/2063(c) | | | 36,560 | |
| | 3,027 | | | GNMA, 4.390%, with various maturities in 2062(c)(h) | | | 3,106 | |
| | 8,612 | | | GNMA, 4.411%, 8/20/2062(c) | | | 9,175 | |
| | 34,411 | | | GNMA, 4.418%, 2/20/2067(c) | | | 39,405 | |
| | 175,633 | | | GNMA, 4.420%, 8/20/2063(c) | | | 177,382 | |
| | 660,711 | | | GNMA, 4.454%, 7/20/2061(c) | | | 686,906 | |
| | 34,009 | | | GNMA, 4.455%, 1/20/2067(c) | | | 39,232 | |
| | 46,824 | | | GNMA, 4.500%, 9/20/2060(c) | | | 47,302 | |
| | 1,904,227 | | | GNMA, 4.503%, 2/20/2067(a)(c) | | | 2,184,645 | |
| | 19,057 | | | GNMA, 4.516%, 9/20/2062(c) | | | 20,043 | |
| | 52,011 | | | GNMA, 4.519%, 6/20/2063(c) | | | 52,629 | |
| | 3,985,645 | | | GNMA, 4.523%, with various maturities from 2063 to 2064(a)(c)(h) | | | 4,369,715 | |
| | 2,090,389 | | | GNMA, 4.529%, 12/20/2066(a)(c) | | | 2,401,942 | |
| | 886,776 | | | GNMA, 4.542%, 4/20/2066(a)(c) | | | 963,345 | |
| | 995,843 | | | GNMA, 4.545%, 7/20/2067(c) | | | 1,154,918 | |
| | 2,117,038 | | | GNMA, 4.548%, 4/20/2067(a)(c) | | | 2,475,008 | |
| | 1,051,941 | | | GNMA, 4.551%, 2/20/2067(c) | | | 1,206,164 | |
| | 429,216 | | | GNMA, 4.558%, 2/20/2066(c) | | | 474,225 | |
| | 12,061,382 | | | GNMA, 4.559%, 6/20/2067(a)(c) | | | 13,935,816 | |
| | 1,021,972 | | | GNMA, 4.564%, 2/20/2068(c) | | | 1,130,458 | |
| | 1,395,552 | | | GNMA, 4.577%, 12/20/2063(c) | | | 1,518,726 | |
| | 2,815,582 | | | GNMA, 4.578%, 4/20/2067(a)(c) | | | 3,258,412 | |
| | 4,056,488 | | | GNMA, 4.580%, with various maturities from 2064 to 2065(a)(c)(h) | | | 4,454,405 | |
| | 5,291,017 | | | GNMA, 4.590%, 7/20/2065(a)(c) | | | 5,900,740 | |
| | 815,563 | | | GNMA, 4.593%, 7/20/2067(c) | | | 936,918 | |
| | 5,521,788 | | | GNMA, 4.602%, with various maturities from 2063 to 2067(a)(c)(h) | | | 6,290,214 | |
| | 1,254,912 | | | GNMA, 4.604%, 1/20/2067(a)(c) | | | 1,451,583 | |
| | 2,449,607 | | | GNMA, 4.606%, with various maturities in 2067(c)(h) | | | 2,744,238 | |
| | 4,019,940 | | | GNMA, 4.607%, 8/20/2067(a)(c) | | | 4,728,939 | |
| | 6,814 | | | GNMA, 4.614%, 4/20/2067(c) | | | 7,367 | |
| | 9,007,338 | | | GNMA, 4.615%, 7/20/2067(a)(c) | | | 10,328,461 | |
| | 1,414,455 | | | GNMA, 4.620%, 5/20/2067(a)(c) | | | 1,650,831 | |
| | 669,696 | | | GNMA, 4.621%, 4/20/2067(c) | | | 742,501 | |
| | 14,208 | | | GNMA, 4.630%, with various maturities from 2061 to 2062(a)(c)(h) | | | 14,457 | |
| | 112,751 | | | GNMA, 4.632%, 4/20/2062(c) | | | 116,825 | |
| | 732,159 | | | GNMA, 4.634%, 9/20/2063(c) | | | 793,986 | |
| | 36,057 | | | GNMA, 4.637%, 1/20/2064(c) | | | 39,629 | |
| | 12,556 | | | GNMA, 4.640%, 3/20/2062(c) | | | 13,223 | |
| | 2,890,349 | | | GNMA, 4.643%, 6/20/2066(a)(c) | | | 3,262,366 | |
| | 10,248,899 | | | GNMA, 4.647%, with various maturities from 2066 to 2067(a)(c)(h) | | | 11,853,051 | |
| | 1,159 | | | GNMA, 4.650%, 1/20/2061(c) | | | 1,243 | |
| | 3,422,545 | | | GNMA, 4.657%, 3/20/2067(a)(c) | | | 4,107,103 | |
| | 45,229 | | | GNMA, 4.663%, 9/20/2063(c) | | | 48,691 | |
| | 978,611 | | | GNMA, 4.665%, 10/20/2064(c) | | | 1,080,126 | |
See accompanying notes to financial statements.
35 |
Portfolio of Investments – as of September 30, 2020
Loomis Sayles Securitized Asset Fund – continued
| | | | | | | | |
Principal
Amount | | | Description | | Value (†) | |
|
| | Bonds and Notes – continued | |
| |
| | | | Mortgage Related – continued | |
| $ | 716,575 | | | GNMA, 4.670%, with various maturities from 2063 to 2067(c)(h) | | $ | 786,199 | |
| | 1,190,619 | | | GNMA, 4.684%, 5/20/2064(a)(c) | | | 1,299,770 | |
| | 2,933 | | | GNMA, 4.690%, 6/20/2062(c) | | | 2,989 | |
| | 190,980 | | | GNMA, 4.700%, with various maturities from 2061 to 2062(c)(h) | | | 197,687 | |
| | 1,188 | | | GNMA, 4.720%, 3/20/2061(c) | | | 1,193 | |
| | 586,553 | | | GNMA, 4.730%, 12/20/2063(c) | | | 636,930 | |
| | 11 | | | GNMA, 4.740%, 10/20/2060(c) | | | 13 | |
| | 555 | | | GNMA, 4.752%, 3/20/2062(c) | | | 604 | |
| | 5,602 | | | GNMA, 4.810%, with various maturities from 2060 to 2061(c)(h) | | | 6,540 | |
| | 3,337 | | | GNMA, 4.868%, 1/20/2062(c) | | | 3,460 | |
| | 262,447 | | | GNMA, 4.887%, 12/20/2061(a)(c) | | | 296,745 | |
| | 8,879 | | | GNMA, 5.027%, 6/20/2061(a)(c) | | | 9,004 | |
| | 422 | | | GNMA, 5.118%, 2/20/2062(c) | | | 456 | |
| | 6,255 | | | GNMA, 5.140%, 5/20/2060(c) | | | 6,303 | |
| | 212 | | | GNMA, 5.175%, 9/20/2063(c) | | | 239 | |
| | 1,117 | | | GNMA, 5.196%, 1/20/2062(c) | | | 1,127 | |
| | 242 | | | GNMA, 5.222%, 3/20/2064(c) | | | 252 | |
| | 930 | | | GNMA, 5.223%, with various maturities from 2061 to 2062(c)(h) | | | 974 | |
| | 457 | | | GNMA, 5.240%, 5/20/2060(c) | | | 468 | |
| | 297 | | | GNMA, 5.250%, 11/20/2063(c) | | | 303 | |
| | 2,029 | | | GNMA, 5.460%, 7/20/2059(c) | | | 2,342 | |
| | 96 | | | GNMA, 5.470%, with various maturities in 2059(c)(h) | | | 101 | |
| | 3,141 | | | GNMA, 5.500%, with various maturities from 2058 to 2059(c)(h) | | | 3,613 | |
| | 366 | | | GNMA, 5.523%, 6/20/2061(c) | | | 379 | |
| | 7,258 | | | GNMA, 5.585%, 11/20/2059(c) | | | 8,588 | |
| | 336 | | | GNMA, 5.625%, 12/20/2059(c) | | | 336 | |
| | 397 | | | GNMA, 5.661%, 9/20/2059(c) | | | 450 | |
| | 3,195 | | | GNMA, 5.668%, 6/20/2059(c) | | | 3,779 | |
| | 110,003 | | | Government National Mortgage Association, Series 2018-H12, Class HZ, 4.596%, 8/20/2068(c)(d)(e) | | | 140,675 | |
| | 4,613,463 | | | Government National Mortgage Association, Series 2019-HO2, Class JA, 3.500%, 12/20/2068 | | | 5,041,919 | |
| | 9,563,379 | | | Government National Mortgage Association, Series BMOC-9821, Class IO1, 3.000%, 9/01/2050(e)(f)(i) | | | 3,117,064 | |
| | 2,568,000 | | | UMBS® (TBA), 2.000%, 11/01/2050(i) | | | 2,650,614 | |
| | 2,011,000 | | | UMBS® (TBA), 2.500%, 11/01/2050(i) | | | 2,106,567 | |
| | | | | | | | |
| | | | | | | 344,378,031 | |
| | | | | | | | |
| |
| | | | Non-Agency Commercial Mortgage-Backed Securities – 13.1% | |
| | 1,000,000 | | | Banc of America Commercial Mortgage Trust, Series 2016-UB10, Class A4, 3.170%, 7/15/2049 | | | 1,093,059 | |
| | 4,155,000 | | | BANK, Series 2019-BN19, Class A3, 3.183%, 8/15/2061 | | | 4,705,066 | |
| | 3,525,000 | | | BANK, Series 2019-BN22, Class A4, 2.978%, 11/15/2062 | | | 3,945,524 | |
| |
| | | | Non-Agency Commercial Mortgage-Backed Securities – continued | |
| 3,720,000 | | | BANK, Series 2019-BN20, Class A3, 3.011%, 9/15/2062 | | | 4,163,596 | |
| | 1,770,000 | | | BANK, Series 2020-BN25, Class A5, 2.649%, 1/15/2063 | | | 1,941,272 | |
| | 3,649,000 | | | BANK, Series 2020-BN26, Class A4, 2.403%, 3/15/2063 | | | 3,916,721 | |
| | 785,000 | | | BANK, Series 2020-BN28, Class AS, 2.140%, 3/15/2063 | | | 806,661 | |
| | 4,630,000 | | | Benchmark Mortgage Trust, Series 2019-B11, Class A5,
3.542%, 5/15/2052 | | | 5,355,917 | |
| | 3,330,000 | | | Benchmark Mortgage Trust, Series 2019-B10, Class A4,
3.717%, 3/15/2062 | | | 3,892,409 | |
| | 5,185,000 | | | Benchmark Mortgage Trust, Series 2019-B13, Class A4,
2.952%, 8/15/2057 | | | 5,775,566 | |
| | 510,000 | | | Cali Mortgage Trust, Series 2019-101C, Class A,
3.957%, 3/10/2039, 144A | | | 597,122 | |
| | 4,355,000 | | | Citigroup Commercial Mortgage Trust, Series 2019-GC43, Class A4,
3.038%, 11/10/2052 | | | 4,879,790 | |
| | 6,000,000 | | | Citigroup Commercial Mortgage Trust, Series 2020-GC46, Class A5,
2.717%, 2/15/2053 | | | 6,544,194 | |
| | 2,424,000 | | | Commercial Mortgage Pass Through Certificates, Series 2012-LTRT, Class A2, 3.400%, 10/05/2030, 144A(a) | | | 2,352,085 | |
| | 2,572,000 | | | Commercial Mortgage Pass Through Certificates, Series 2013-CR13, Class A4, 4.194%, 11/10/2046(a)(c) | | | 2,812,249 | |
| | 2,605,000 | | | Commercial Mortgage Pass Through Certificates, Series 2013-CR6, Class A4, 3.101%, 3/10/2046(a) | | | 2,701,688 | |
| | 5,595,000 | | | Commercial Mortgage Pass Through Certificates, Series 2013-WWP, Class A2, 3.424%, 3/10/2031, 144A | | | 5,909,003 | |
| | 378,831 | | | Commercial Mortgage Pass Through Certificates, Series 2014-CR14, Class A2, 3.147%, 2/10/2047 | | | 382,103 | |
| | 1,968,404 | | | Commercial Mortgage Pass Through Certificates, Series 2014-CR16, Class ASB, 3.653%, 4/10/2047(a) | | | 2,046,313 | |
| | 1,220,000 | | | Commercial Mortgage Pass Through Certificates, Series 2014-UBS2, Class A4, 3.691%, 3/10/2047 | | | 1,315,173 | |
| | 1,300,000 | | | Commercial Mortgage Pass Through Certificates, Series 2014-UBS2, Class A5, 3.961%, 3/10/2047 | | | 1,419,466 | |
| | 2,520,000 | | | Commercial Mortgage Pass Through Certificates, Series 2014-UBS5, Class A4, 3.838%, 9/10/2047(a) | | | 2,772,173 | |
| | 3,110,000 | | | Commercial Mortgage Pass Through Certificates, Series 2015-DC1, Class A5, 3.350%, 2/10/2048(a) | | | 3,387,578 | |
| | 1,200,000 | | | Commercial Mortgage Pass Through Certificates, Series 2016-DC2, Class ASB, 3.550%, 2/10/2049 | | | 1,284,104 | |
See accompanying notes to financial statements.
| 36
Portfolio of Investments – as of September 30, 2020
Loomis Sayles Securitized Asset Fund – continued
| | | | | | | | |
Principal
Amount | | | Description | | Value (†) | |
|
| | Bonds and Notes – continued | |
| |
| | | | Non-Agency Commercial Mortgage-Backed Securities – continued | |
| $ | 2,250,000 | | | Credit Suisse Commercial Mortgage Securities Corp., Series 2019-SKLZ, Class B, 1-month LIBOR + 1.900%, 2.052%, 1/15/2034, 144A(b) | | $ | 2,149,241 | |
| | 6,160,000 | | | Credit Suisse Mortgage Capital Certificates, Series 2014-USA, Class A2, 3.953%, 9/15/2037, 144A | | | 6,278,226 | |
| | 695,000 | | | Credit Suisse Mortgage Capital Certificates, Series 2014-USA, Class B, 4.185%, 9/15/2037, 144A | | | 625,709 | |
| | 2,045,000 | | | Credit Suisse Mortgage Capital Certificates, Series 2014-USA, Class C, 4.336%, 9/15/2037, 144A | | | 1,738,749 | |
| | 5,000,000 | | | CSAIL Commercial Mortgage Trust, Series 2019-C17, Class A5, 3.016%, 9/15/2052 | | | 5,535,940 | |
| | 2,405,000 | | | CSAIL Commercial Mortgage Trust, Series 2019-C18, Class A4, 2.968%, 12/15/2052 | | | 2,653,581 | |
| | 5,775,000 | | | GS Mortgage Securities Corp. Trust,
Series 2013-PEMB, Class A,
3.668%, 3/05/2033, 144A(a)(c) | | | 5,383,787 | |
| | 3,461,000 | | | GS Mortgage Securities Trust,
Series 2013-GC16, Class B,
5.161%, 11/10/2046(a)(c) | | | 3,649,118 | |
| | 2,930,000 | | | GS Mortgage Securities Trust, Series 2014-GC18, Class A4,
4.074%, 1/10/2047(a) | | | 3,174,662 | |
| | 5,100,000 | | | GS Mortgage Securities Trust,
Series 2014-GC18, Class AS,
4.383%, 1/10/2047 | | | 5,437,398 | |
| | 1,416,000 | | | GS Mortgage Securities Trust,
Series 2014-GC20, Class A5,
3.998%, 4/10/2047 | | | 1,538,074 | |
| | 5,000,000 | | | GS Mortgage Securities Trust,
Series 2019-GSA1, Class A4,
3.048%, 11/10/2052 | | | 5,583,555 | |
| | 2,555,000 | | | GS Mortgage Securities Trust,
Series 2020-GC45, Class A5,
2.911%, 2/13/2053 | | | 2,854,193 | |
| | 2,008,003 | | | HPLY Trust, Series 2019-HIT, Class B, 1-month LIBOR + 1.350%, 1.502%, 11/15/2036, 144A(b) | | | 1,909,804 | |
| | 5,885,000 | | | Hudsons Bay Simon JV Trust,
Series 2015-HB10, Class A10,
4.155%, 8/05/2034, 144A(a) | | | 5,113,671 | |
| | 2,405,000 | | | JPMorgan Chase Commercial Mortgage Securities Trust, Series 2014-C19, Class AS,
4.243%, 4/15/2047(c) | | | 2,617,322 | |
| | 1,099,622 | | | JPMorgan Chase Commercial Mortgage Securities Trust, Series 2014-C19, Class ASB,
3.584%, 4/15/2047(a) | | | 1,146,059 | |
| | 2,735,000 | | | Morgan Stanley Bank of America Merrill Lynch Trust, Series 2013-C8, Class A4, 3.134%, 12/15/2048(a) | | | 2,858,907 | |
| |
| | | | Non-Agency Commercial Mortgage-Backed Securities – continued | |
| 2,225,000 | | | Morgan Stanley Bank of America Merrill Lynch Trust, Series 2013-C9, Class AS, 3.456%, 5/15/2046 | | | 2,322,135 | |
| | 1,339,934 | | | Morgan Stanley Bank of America Merrill Lynch Trust, Series 2014-C14, Class A3,
3.669%, 2/15/2047(a) | | | 1,344,190 | |
| | 1,000,000 | | | Morgan Stanley Capital I Trust,
Series 2011-C2, Class D,
5.661%, 6/15/2044, 144A(c) | | | 803,279 | |
| | 3,135,000 | | | Morgan Stanley Capital I Trust,
Series 2013-ALTM, Class A2,
3.828%, 2/05/2035, 144A(a)(c) | | | 3,092,830 | |
| | 5,780,000 | | | Morgan Stanley Capital I Trust,
Series 2019-L3, Class A4,
3.127%, 11/15/2052 | | | 6,472,124 | |
| | 2,056,274 | | | Motel 6 Trust, Series 2017-MTL6, Class A, 1-month LIBOR + 0.920%,
1.072%, 8/15/2034, 144A(b) | | | 2,020,142 | |
| | 3,475,000 | | | RBS Commercial Funding, Inc., Trust, Series 2013-SMV, Class C,
3.704%, 3/11/2031, 144A(c) | | | 2,909,646 | |
| | 1,861,317 | | | Starwood Retail Property Trust,
Series 2014-STAR, Class A, 1-month LIBOR + 1.470%,
1.622%, 11/15/2027, 144A(b) | | | 1,331,628 | |
| | 6,500,000 | | | Starwood Retail Property Trust,
Series 2014-STAR, Class B, 1-month LIBOR + 1.900%,
2.052%, 11/15/2027, 144A(b)(d)(e)(g) | | | 4,886,172 | |
| | 1,350,000 | | | UBS Commercial Mortgage Trust, Series 2019-C16, Class A4,
3.605%, 4/15/2052 | | | 1,533,400 | |
| | 5,000,000 | | | Wells Fargo Commercial Mortgage Trust, Series 2018-C48, Class A5,
4.302%, 1/15/2052 | | | 5,947,542 | |
| | 4,000,000 | | | Wells Fargo Commercial Mortgage Trust, Series 2014-LC16, Class AS,
4.020%, 8/15/2050 | | | 4,279,107 | |
| | 3,745,890 | | | Wells Fargo Commercial Mortgage Trust, Series 2015-C29, Class ASB,
3.400%, 6/15/2048(a) | | | 3,945,998 | |
| | 5,607,153 | | | Wells Fargo Commercial Mortgage Trust, Series 2019-C49, Class A5,
4.023%, 3/15/2052 | | | 6,600,255 | |
| | 5,012,000 | | | Wells Fargo Commercial Mortgage Trust, Series 2019-C54, Class A4,
3.146%, 12/15/2052 | | | 5,648,098 | |
| | 1,875,000 | | | WFRBS Commercial Mortgage Trust, Series 2013-C15, Class AS,
4.358%, 8/15/2046(c) | | | 1,971,873 | |
| | 1,446,824 | | | WFRBS Commercial Mortgage Trust, Series 2014-C20, Class A4,
3.723%, 5/15/2047 | | | 1,532,963 | |
| | 1,635,000 | | | WFRBS Commercial Mortgage Trust, Series 2014-C20, Class A5,
3.995%, 5/15/2047 | | | 1,766,528 | |
See accompanying notes to financial statements.
37 |
Portfolio of Investments – as of September 30, 2020
Loomis Sayles Securitized Asset Fund – continued
| | | | | | | | |
Principal
Amount | | | Description | | Value (†) | |
|
| | Bonds and Notes – continued | |
| |
| | | | Non-Agency Commercial Mortgage-Backed Securities – continued | |
| $ | 3,382,313 | | | WFRBS Commercial Mortgage Trust, Series 2014-C20, Class ASB,
3.638%, 5/15/2047(a) | | $ | 3,534,398 | |
| | | | | | | | |
| | | | | | | 196,189,136 | |
| | | | | | | | |
| | |
| | | | Total Bonds and Notes | | | | |
| | |
| | | | (Identified Cost $1,365,215,728) | | | 1,364,871,784 | |
| | | | | | | | |
|
| | Collateralized Loan Obligations – 4.0% | |
| | 3,497,500 | | | Hayfin Kingsland VIII Ltd., Series 2018-8A, Class B, 3-month LIBOR + 1.480%,
1.752%, 4/20/2031, 144A(b) | | | 3,430,384 | |
| | 1,057,224 | | | Hull Street CLO Ltd., Series 2014-1A, Class AR, 3-month LIBOR + 1.220%, 1.492%, 10/18/2026, 144A(b) | | | 1,056,936 | |
| | 4,000,000 | | | Allegro CLO Ltd., Series 2017-1A, Class B, 3-month LIBOR + 1.650%,
1.921%, 10/16/2030, 144A(b) | | | 3,909,531 | |
| | 5,000,000 | | | Jamestown CLO VII Ltd., Series 2015-7A, Class A2R, 3-month LIBOR + 1.300%,
1.545%, 7/25/2027, 144A(b) | | | 4,872,640 | |
| | 4,000,000 | | | Trinitas CLO Ltd., Series 2017-6A, Class B, 3-month LIBOR + 1.850%,
2.095%, 7/25/2029, 144A(b) | | | 3,950,200 | |
| | 3,000,000 | | | AGL CLO 3 Ltd., Series 2020-3A, Class A, 3-month LIBOR + 1.300%,
1.575%, 1/15/2033, 144A(b) | | | 2,977,516 | |
| | 525,000 | | | Burnham Park CLO Ltd., Series 2016-1A, Class CR, 3-month LIBOR + 2.150%,
2.422%, 10/20/2029, 144A(b) | | | 495,594 | |
| | 6,000,000 | | | Magnetite XVIII Ltd., Series 2016-18A, Class AR, 3-month LIBOR + 1.080%,
1.360%, 11/15/2028, 144A(b) | | | 5,985,983 | |
| | 2,960,000 | | | Marble Point CLO XIV Ltd., Series 2018-2A, Class A1, 3-month LIBOR + 1.330%,
1.602%, 1/20/2032, 144A(b) | | | 2,931,020 | |
| | 3,000,000 | | | Vibrant CLO Ltd., Series 2018-10A, Class A1, 3-month LIBOR + 1.200%,
1.472%, 10/20/2031, 144A(b) | | | 2,965,998 | |
| | 595,000 | | | Allegro CLO VIII Ltd.,
Series 2018-2A, Class B1, 3-month LIBOR + 1.670%, 1.945%, 7/15/2031, 144A(b) | | | 580,839 | |
| | 4,380,000 | | | Ares XLIII CLO Ltd., Series 2017-43A, Class A, 3-month LIBOR + 1.220%,
1.495%, 10/15/2029, 144A(b) | | | 4,358,093 | |
| | 2,000,000 | | | CarVal CLO III Ltd., Series 2019-2A, Class A, 3-month LIBOR + 1.350%,
1.622%, 7/20/2032, 144A(b) | | | 1,990,373 | |
|
| | Collateralized Loan Obligations – continued | |
| 1,750,000 | | | Madison Park Funding XXVI Ltd., Series 2007-4A, Class AR, 3-month LIBOR + 1.200%, 1.470%, 7/29/2030, 144A(b) | | | 1,733,059 | |
| | 400,000 | | | Marble Point CLO X Ltd., Series 2017-1A, Class B, 3-month LIBOR + 1.800%, 2.075%, 10/15/2030, 144A(b) | | | 392,838 | |
| | 1,492,090 | | | Race Point IX CLO Ltd., Series 2015-9A, Class A1AR, 3-month LIBOR + 1.210%,
1.485%, 10/15/2030, 144A(b) | | | 1,489,861 | |
| | 1,315,000 | | | Voya CLO Ltd., Series 2013-3A, Class A2RR, 3-month LIBOR + 1.700%, 1.972%, 10/18/2031, 144A(b) | | | 1,283,826 | |
| | 2,560,000 | | | Trinitas CLO VI Ltd.,
Series 2017-6A, Class AR, 3-month LIBOR + 1.170%, 1.415%, 7/25/2029, 144A(b) | | | 2,539,340 | |
| | 1,170,000 | | | Madison Park Funding XVI Ltd., Series 2015-16A, Class A2R, 3-month LIBOR + 1.900%, 2.172%, 4/20/2026, 144A(b) | | | 1,161,632 | |
| | 4,500,000 | | | Race Point CLO Ltd.,
Series 2013-8A, Class BR2, 3-month LIBOR + 1.500%, 1.753%, 2/20/2030, 144A(b) | | | 4,356,587 | |
| | 5,900,000 | | | TICP CLO VII Ltd., Series 2017-7A, Class BR, 3-month LIBOR + 1.700%,
1.975%, 4/15/2033, 144A(b) | | | 5,863,410 | |
| | 2,000,000 | | | CBAM CLO Management,
Series 2019-10A, Class A1A, 3-month LIBOR + 1.420%, 1.692%, 4/20/2032, 144A(b) | | | 1,999,994 | |
| | | | | | | | |
| | |
| | | | Total Collateralized Loan Obligations | | | | |
| | |
| | | | (Identified Cost $59,405,406) | | | 60,325,654 | |
| | | | | | | | |
|
| | Loan Participations – 0.2% | |
| |
| | | | ABS Other – 0.2% | |
| | 2,857,353 | | | Harbour Aircraft Investments Ltd.,
Series 2017-1, Class A, 4.000%, 11/15/2037 (Identified Cost $2,841,632) | | | 2,657,001 | |
| | | | | | | | |
|
| | Short-Term Investments – 6.0% | |
| | |
| | 54,225,782 | | | Tri-Party Repurchase Agreement with Fixed Income Clearing Corporation, dated 9/30/2020 at 0.000% to be repurchased at $54,225,782 on 10/01/2020 collateralized by $49,649,800 U.S. Treasury Note, 0.250% due 9/30/2025 valued at $49,645,927; $2,131,200 U.S. Treasury Note, 2.625% due 6/15/2021 valued at $2,185,184; $2,979,800 U.S. Treasury Inflation Indexed Note, 0.625% due 7/15/2021 valued at $3,479,278 including accrued interest (Note 2 of Notes to Financial Statements) | | | 54,225,782 | |
See accompanying notes to financial statements.
| 38
Portfolio of Investments – as of September 30, 2020
Loomis Sayles Securitized Asset Fund – continued
| | | | | | | | |
Principal
Amount | | | Description | | Value (†) | |
|
| | Short-Term Investments – continued | |
| | |
| $ | 10,000,000 | | | U.S. Treasury Bills, 0.102%, 3/25/2021(j) | | $ | 9,994,774 | |
| | |
| | 14,680,000 | | | U.S. Treasury Bills, 0.116%, 2/18/2021(j)(k) | | | 14,674,291 | |
| | |
| | 10,555,000 | | | U.S. Treasury Bills, 0.139%, 10/08/2020(j)(k) | | | 10,554,869 | |
| | | | | | | | |
| | |
| | | | Total Short-Term Investments | | | | |
| | |
| | | | (Identified Cost $89,448,915) | | | 89,449,716 | |
| | | | | | | | |
| | |
| | | | Total Investments – 101.1% | | | | |
| | |
| | | | (Identified Cost $1,516,911,681) | | | 1,517,304,155 | |
| | |
| | | | Other assets less liabilities—(1.1)% | | | (16,623,792 | ) |
| | | | | | | | |
| | |
| | | | Net Assets – 100.0% | | $ | 1,500,680,363 | |
| | | | | | | | |
| |
| | (†) | | | See Note 2 of Notes to Financial Statements. | |
| |
| | (a) | | | Security (or a portion thereof) has been designated to cover the Fund’s obligations under open derivative contracts or TBA transactions. | |
| |
| | (b) | | | Variable rate security. Rate as of September 30, 2020 is disclosed. | |
| |
| | (c) | | | Variable rate security. The interest rate adjusts periodically based on; (i) changes in current interest rates and/or prepayments on underlying pools of assets, if applicable, (ii) reference to a base lending rate plus or minus a margin, and/or (iii) reference to a base lending rate adjusted by a multiplier and/or subject to certain floors or caps. Rate as of September 30, 2020 is disclosed. | |
| |
| | (d) | | | Fair valued by the Fund’s adviser. At September 30, 2020, the value of these securities amounted to $27,806,701 or 1.9% of net assets. See Note 2 of Notes to Financial Statements. | |
| |
| | (e) | | | Level 3 security. Value has been determined using significant unobservable inputs. See Note 3 of Notes to Financial Statements. | |
| |
| | (f) | | | Interest only security. Security represents right to receive monthly interest payments on an underlying pool of mortgages. Principal shown is the outstanding par amount of the pool held as of the end of the period. |
| |
| | (g) | | | Illiquid security. (Unaudited) |
| |
| | (h) | | | The Fund’s investment in mortgage related securities of Federal Home Loan Mortgage Corporation, Federal National Mortgage Association and Government National Mortgage Association are interests in separate pools of mortgages. All separate investments in securities of each issuer which have the same coupon rate have been aggregated for the purpose of presentation in the Portfolio of Investments. |
| |
| | (i) | | | When-issued/delayed delivery. See Note 2 of Notes to Financial Statements. |
| |
| | (j) | | | Interest rate represents discount rate at time of purchase; not a coupon rate. |
| |
| | (k) | | | Security (or a portion thereof) has been pledged as collateral for open derivative contracts. |
| |
| | 144A | | | All or a portion of these securities are exempt from registration under Rule 144A of the Securities Act of 1933. These securities may be resold in transactions exempt from registration, normally to qualified institutional buyers. At September 30, 2020, the value of Rule 144A holdings amounted to $446,646,149 or 29.8% of net assets. |
| | ABS | | | Asset-Backed Securities |
| | ARMs | | | Adjustable Rate Mortgages |
| | ARS | | | Auction Rate Security |
| | CMT | | | Constant Maturity Treasury |
| | FHLMC | | | Federal Home Loan Mortgage Corp. |
| | FNMA | | | Federal National Mortgage Association |
| | GNMA | | | Government National Mortgage Association |
| | LIBOR | | | London Interbank Offered Rate |
| | MTN | | | Medium Term Note |
| | REMIC | | | Real Estate Mortgage Investment Conduit |
| | SLM | | | Sallie Mae |
| | TBA | | | To Be Announced |
| | UMBS® | | | Uniform Mortgage-Backed Securities |
At September 30, 2020, open short futures contracts were as follows:
| | | | | | | | | | | | | | | | | | | | |
Financial Futures | | Expiration
Date | | | Contracts | | | Notional
Amount | | | Value | | | Unrealized
Appreciation
(Depreciation) | |
2 Year U.S. Treasury Note | | | 12/31/2020 | | | | 44 | | | $ | 9,717,731 | | | $ | 9,722,281 | | | $ | (4,550 | ) |
5 Year U.S. Treasury Note | | | 12/31/2020 | | | | 440 | | | | 55,377,065 | | | | 55,453,750 | | | | (76,685 | ) |
10 Year U.S. Treasury Note | | | 12/21/2020 | | | | 599 | | | | 83,339,201 | | | | 83,579,219 | | | | (240,018 | ) |
Ultra 10 Year U.S. Treasury Note | | | 12/21/2020 | | | | 432 | | | | 68,830,603 | | | | 69,086,250 | | | | (255,647 | ) |
| | | | | | | | | | | | | | | | | | | | |
Total | | | $ | (576,900 | ) |
| | | | | | | | | | | | | | | | | | | | |
At September 30, 2020, the Fund had the following open centrally cleared interest rate swap agreements:
| | | | | | | | | | | | | | | | | | | | | | | | |
Notional
Value | | Currency | | | Expiration
Date | | | Fund Pays1 | | | Fund Receives2 | | | Market Value | | | Unrealized
Appreciation
(Depreciation) | |
63,000,000 | | | USD | | | | 3/04/2024 | | | | 2.564 | % | | | 3-month LIBOR | | | $ | (5,097,896 | ) | | $ | (5,097,896 | ) |
50,000,000 | | | USD | | | | 5/23/2024 | | | | 2.222 | % | | | 3-month LIBOR | | | | (3,941,217 | ) | | | (3,941,217 | ) |
35,000,000 | | | USD | | | | 12/16/2029 | | | | 1.804 | % | | | 3-month LIBOR | | | | (3,833,478 | ) | | | (3,833,478 | ) |
15,000,000 | | | USD | | | | 1/07/2030 | | | | 1.763 | % | | | 3-month LIBOR | | | | (1,564,412 | ) | | | (1,564,412 | ) |
| | | | | | | | | | | | | | | | | | | | | | | | |
Total | | | $ | (14,437,003 | ) | | $ | (14,437,003 | ) |
| | | | | | | | | | | | | | | | | | | | | | | | |
1 Payments are made semiannually.
2 Payments are made quarterly.
See accompanying notes to financial statements.
39 |
Portfolio of Investments – as of September 30, 2020
Loomis Sayles Securitized Asset Fund – continued
Industry Summary at September 30, 2020
| | | | |
Mortgage Related | | | 22.9 | % |
Collateralized Mortgage Obligations | | | 21.2 | |
Non-Agency Commercial Mortgage-Backed Securities | | | 13.1 | |
ABS Car Loan | | | 9.3 | |
ABS Other | | | 6.4 | |
Agency Commercial Mortgage-Backed Securities | | | 6.0 | |
ABS Home Equity | | | 5.9 | |
ABS Student Loan | | | 2.8 | |
ABS Whole Business | | | 2.0 | |
Other Investments, less than 2% each | | | 1.5 | |
Short-Term Investments | | | 6.0 | |
Collateralized Loan Obligations | | | 4.0 | |
| | | | |
Total Investments | | | 101.1 | |
Other assets less liabilities (including swap agreements and futures contracts) | | | (1.1 | ) |
| | | | |
Net Assets | | | 100.0 | % |
| | | | |
See accompanying notes to financial statements.
| 40
Statements of Assets and Liabilities
September 30, 2020
| | | | | | | | |
| | | High Income
Opportunities
Fund | | | Securitized
Asset Fund | |
ASSETS | |
Investments at cost | | $ | 248,217,480 | | | $ | 1,516,911,681 | |
Net unrealized appreciation | | | 7,248,131 | | | | 392,474 | |
| | | | | | | | |
Investments at value | | | 255,465,611 | | | | 1,517,304,155 | |
Cash | | | 994 | | | | — | |
Due from brokers (Note 2) | | | — | | | | 4,393,000 | |
Receivable for Fund shares sold | | | 75,934 | | | | 1,262,118 | |
Receivable for securities sold | | | 2,215,029 | | | | 13,567,379 | |
Receivable for when-issued/delayed delivery securities sold (Note 2) | | | — | | | | 13,285,752 | |
Collateral received for delayed delivery securities (Note 2) | | | — | | | | 18,955 | |
Dividends and interest receivable | | | 3,345,803 | | | | 5,031,670 | |
Tax reclaims receivable | | | 1,304 | | | | — | |
Receivable for variation margin on futures contracts (Note 2) | | | — | | | | 397,308 | |
Receivable for variation margin on centrally cleared swap agreements (Note 2) | | | — | | | | 156,656 | |
| | | | | | | | |
TOTAL ASSETS | | | 261,104,675 | | | | 1,555,416,993 | |
| | | | | | | | |
|
| LIABILITIES | |
Payable for securities purchased | | | 5,965,117 | | | | 36,381,837 | |
Payable for when-issued/delayed delivery securities purchased (Note 2) | | | — | | | | 18,034,941 | |
Payable for Fund shares redeemed | | | 120,993 | | | | 300,897 | |
Due to brokers (Note 2) | | | — | | | | 18,955 | |
| | | | | | | | |
TOTAL LIABILITIES | | | 6,086,110 | | | | 54,736,630 | |
| | | | | | | | |
NET ASSETS | | $ | 255,018,565 | | | $ | 1,500,680,363 | |
| | | | | | | | |
NET ASSETS CONSIST OF: | |
Paid-in capital | | $ | 251,808,876 | | | $ | 1,590,837,830 | |
Accumulated earnings (loss) | | | 3,209,689 | | | | (90,157,467 | ) |
| | | | | | | | |
NET ASSETS | | $ | 255,018,565 | | | $ | 1,500,680,363 | |
| | | | | | | | |
|
| COMPUTATION OF NET ASSET VALUE AND OFFERING PRICE: | |
|
Institutional Class: | |
Net assets | | $ | 255,018,565 | | | $ | 1,500,680,363 | |
| | | | | | | | |
Shares of beneficial interest | | | 24,777,151 | | | | 153,622,390 | |
| | | | | | | | |
Net asset value, offering and redemption price per share | | $ | 10.29 | | | $ | 9.77 | |
| | | | | | | | |
See accompanying notes to financial statements.
41 |
Statements of Operations
For the Year Ended September 30, 2020
| | | | | | | | |
| | | High Income
Opportunities
Fund | | | Securitized
Asset Fund | |
INVESTMENT INCOME | |
Interest | | $ | 11,854,808 | | | $ | 49,064,919 | |
Dividends | | | 223,003 | | | | — | |
Less net foreign taxes withheld | | | — | | | | (1,880 | ) |
| | | | | | | | |
Investment income | | | 12,077,811 | | | | 49,063,039 | |
| | | | | | | | |
| | |
| NET REALIZED AND UNREALIZED GAIN (LOSS) ON INVESTMENTS, FUTURES CONTRACTS AND SWAP AGREEMENTS | | | | | | | | |
Net realized gain (loss) on: | | | | | | | | |
Investments | | | (2,768,626 | ) | | | 19,165,858 | |
Futures contracts | | | — | | | | (17,942,925 | ) |
Swap agreements | | | (978,007 | ) | | | (1,123,541 | ) |
Net change in unrealized appreciation (depreciation) on: | | | | | | | | |
Investments | | | 7,246,994 | | | | 17,842,451 | |
Futures contracts | | | — | | | | (971,291 | ) |
Swap agreements | | | — | | | | (9,707,501 | ) |
| | | | | | | | |
Net realized and unrealized gain on investments, futures contracts and swap agreements | | | 3,500,361 | | | | 7,263,051 | |
| | | | | | | | |
| | |
| NET INCREASE IN NET ASSETS RESULTING FROM OPERATIONS | | $ | 15,578,172 | | | $ | 56,326,090 | |
| | | | | | | | |
See accompanying notes to financial statements.
| 42
Statements of Changes in Net Assets
| | | | | | | | | | | | | | | | |
| | | High Income
Opportunities Fund | | | Securitized Asset Fund | |
| | | Year Ended
September 30, 2020 | | | Year Ended
September 30, 2019 | | | Year Ended
September 30, 2020 | | | Year Ended
September 30, 2019 | |
| FROM OPERATIONS: | |
Investment income | | $ | 12,077,811 | | | $ | 8,822,034 | | | $ | 49,063,039 | | | $ | 45,959,088 | |
Net realized gain (loss) on investments, futures contracts and swap agreements | | | (3,746,633 | ) | | | (749,555 | ) | | | 99,392 | | | | 15,583,759 | |
Net change in unrealized appreciation (depreciation) on investments, futures contracts and swap agreements | | | 7,246,994 | | | | (44,613 | ) | | | 7,163,659 | | | | 37,056,613 | |
| | | | | | | | | | | | | | | | |
Net increase in net assets resulting from operations | | | 15,578,172 | | | | 8,027,866 | | | | 56,326,090 | | | | 98,599,460 | |
| | | | | | | | | | | | | | | | |
| FROM DISTRIBUTIONS TO SHAREHOLDERS: | | | | | | | | | | | | | | | | |
Institutional Class | | | (11,897,771 | ) | | | (10,688,805 | ) | | | (80,151,712 | ) | | | (64,801,602 | ) |
| | | | | | | | | | | | | | | | |
| | | | |
| NET INCREASE IN NET ASSETS FROM CAPITAL SHARE TRANSACTIONS (NOTE 10) | | | 77,235,559 | | | | 37,343,416 | | | | 285,370,951 | | | | 55,883,032 | |
| | | | | | | | | | | | | | | | |
Net increase in net assets | | | 80,915,960 | | | | 34,682,477 | | | | 261,545,329 | | | | 89,680,890 | |
| NET ASSETS | |
Beginning of the year | | | 174,102,605 | | | | 139,420,128 | | | | 1,239,135,034 | | | | 1,149,454,144 | |
| | | | | | | | | | | | | | | | |
End of the year | | $ | 255,018,565 | | | $ | 174,102,605 | | | $ | 1,500,680,363 | | | $ | 1,239,135,034 | |
| | | | | | | | | | | | | | | | |
See accompanying notes to financial statements.
43 |
Financial Highlights
For a share outstanding throughout each period.
| | | | | | | | | | | | | | | | | | | | |
| | | High Income Opportunities Fund – Institutional Class | |
| | | Year Ended
September 30,
2020 | | | Year Ended
September 30,
2019 | | | Year Ended
September 30,
2018 | | | Year Ended
September 30,
2017 | | | Year Ended
September 30,
2016 | |
Net asset value, beginning of the period | | $ | 10.45 | | | $ | 10.69 | | | $ | 10.95 | | | $ | 10.66 | | | $ | 10.11 | |
| | | | |
INCOME (LOSS) FROM INVESTMENT OPERATIONS: | | | | | | | | | | | | | | | | | | | | |
Investment income(a) | | | 0.58 | | | | 0.60 | | | | 0.58 | | | | 0.62 | | | | 0.60 | |
Net realized and unrealized gain (loss) | | | (0.16 | )(b) | | | (0.08 | ) | | | (0.24 | ) | | | 0.30 | | | | 0.60 | |
| | | | |
Total from Investment Operations | | | 0.42 | | | | 0.52 | | | | 0.34 | | | | 0.92 | | | | 1.20 | |
| | | | |
LESS DISTRIBUTIONS FROM: | | | | | | | | | | | | | | | | | | | | |
Investment income | | | (0.58 | ) | | | (0.62 | ) | | | (0.60 | ) | | | (0.63 | ) | | | (0.62 | ) |
Net realized capital gains | | | — | | | | (0.14 | ) | | | — | | | | — | | | | (0.03 | ) |
| | | | |
Total Distributions | | | (0.58 | ) | | | (0.76 | ) | | | (0.60 | ) | | | (0.63 | ) | | | (0.65 | ) |
| | | | |
Net asset value, end of the period | | $ | 10.29 | | | $ | 10.45 | | | $ | 10.69 | | | $ | 10.95 | | | $ | 10.66 | |
| | | | |
Total return | | | 4.28 | % | | | 5.14 | % | | | 3.21 | % | | | 8.91 | % | | | 12.55 | % |
RATIOS TO AVERAGE NET ASSETS: | | | | | | | | | | | | | | | | | | | | |
Net assets, end of the period (000’s) | | $ | 255,019 | | | $ | 174,103 | | | $ | 139,420 | | | $ | 142,373 | | | $ | 135,706 | |
Net expenses(c) | | | — | | | | — | | | | — | | | | — | | | | — | |
Gross expenses(c) | | | — | | | | — | | | | — | | | | — | | | | — | |
Net investment income | | | 5.76 | % | | | 5.78 | % | | | 5.45 | % | | | 5.74 | % | | | 5.94 | % |
Portfolio turnover rate | | | 96 | %(d) | | | 48 | % | | | 42 | % | | | 37 | % | | | 36 | % |
| (a) | | Per share net investment income has been calculated using the average shares outstanding during the period. | |
| (b) | | The amount shown for a share outstanding does not correspond with the aggregate realized and unrealized gain (loss) on investments for the period due to the timing of sales and redemptions of fund shares in relation to fluctuating market values of investments of the Fund. | |
| (c) | | Loomis Sayles has agreed to pay, without reimbursement from the Fund, all expenses associated with the operations of the Fund. | |
| (d) | | The variation in the Fund’s turnover rate from 2019 to 2020 was primarily due to significant shareholder flows and repositioning of the portfolio. | |
| | | | | | | | | | | | | | | | | | | | |
| | | Securitized Asset Fund – Institutional Class | |
| | | Year Ended
September 30,
2020 | | | Year Ended
September 30,
2019 | | | Year Ended
September 30,
2018 | | | Year Ended
September 30,
2017 | | | Year Ended
September 30,
2016 | |
Net asset value, beginning of the period | | $ | 9.94 | | | $ | 9.65 | | | $ | 10.16 | | | $ | 10.57 | | | $ | 10.62 | |
| | | | |
INCOME (LOSS) FROM INVESTMENT OPERATIONS: | | | | | | | | | | | | | | | | | | | | |
Investment income(a) | | | 0.34 | | | | 0.39 | | | | 0.37 | | | | 0.39 | | | | 0.40 | |
Net realized and unrealized gain (loss) | | | 0.06 | | | | 0.45 | | | | (0.33 | ) | | | (0.25 | ) | | | 0.04 | |
| | | | |
Total from Investment Operations | | | 0.40 | | | | 0.84 | | | | 0.04 | | | | 0.14 | | | | 0.44 | |
| | | | |
LESS DISTRIBUTIONS FROM: | | | | | | | | | | | | | | | | | | | | |
Investment income | | | (0.57 | ) | | | (0.55 | ) | | | (0.55 | ) | | | (0.55 | ) | | | (0.49 | ) |
| | | | |
Net asset value, end of the period | | $ | 9.77 | | | $ | 9.94 | | | $ | 9.65 | | | $ | 10.16 | | | $ | 10.57 | |
| | | | |
Total return | | | 4.13 | % | | | 8.97 | % | | | 0.39 | % | | | 1.40 | % | | | 4.27 | % |
RATIOS TO AVERAGE NET ASSETS: | | | | | | | | | | | | | | | | | | | | |
Net assets, end of the period (000’s) | | $ | 1,500,680 | | | $ | 1,239,135 | | | $ | 1,149,454 | | | $ | 1,133,638 | | | $ | 1,015,859 | |
Net expenses(b) | | | — | | | | — | | | | — | | | | — | | | | — | |
Gross expenses(b) | | | — | | | | — | | | | — | | | | — | | | | — | |
Net investment income | | | 3.50 | % | | | 3.98 | % | | | 3.81 | % | | | 3.78 | % | | | 3.84 | % |
Portfolio turnover rate | | | 283 | % | | | 369 | %(c) | | | 259 | % | | | 313 | % | | | 306 | % |
| (a) | | Per share net investment income has been calculated using the average shares outstanding during the period. | |
| (b) | | Loomis Sayles has agreed to pay, without reimbursement from the Fund, all expenses associated with the operations of the Fund. | |
| (c) | | The variation in the Fund’s turnover rate from 2018 to 2019 is due to an increase in the volume of TBA securities (see Note 2 of Notes to Financial Statements). | |
See accompanying notes to financial statements.
| 44
Notes to Financial Statements
September 30, 2020
1. Organization. Loomis Sayles Funds I (the “Trust”) is organized as a Massachusetts business trust. The Trust is registered under the Investment Company Act of 1940, as amended (the “1940 Act”), as an open-end management investment company. The Declaration of Trust permits the Board of Trustees to authorize the issuance of an unlimited number of shares of the Trust in multiple series. The financial statements for certain funds of the Trust are presented in separate reports. The following funds (individually, a “Fund” and collectively, the “Funds”) are included in this report:
Loomis Sayles High Income Opportunities Fund (the “High Income Opportunities Fund”)
Loomis Sayles Securitized Asset Fund (the “Securitized Asset Fund”)
Each Fund is a diversified investment company.
Each Fund offers Institutional Class shares. The Funds’ shares are offered exclusively to investors in “wrap fee” programs approved by Natixis Advisors, L.P. (“Natixis Advisors”) and/or Loomis, Sayles & Company, L.P. (“Loomis Sayles”) and to institutional advisory clients of Natixis Advisors or Loomis Sayles that, in each case, meet the Funds’ policies as established by Loomis Sayles.
2. Significant Accounting Policies. The following is a summary of significant accounting policies consistently followed by each Fund in the preparation of its financial statements. The Funds’ financial statements follow the accounting and reporting guidelines provided for investment companies and are prepared in accordance with accounting principles generally accepted in the United States of America which require the use of management estimates that affect the reported amounts and disclosures in the financial statements. Actual results could differ from those estimates. Management has evaluated the events and transactions subsequent to year-end through the date the financial statements were issued and has determined that there were no material events that would require disclosure in the Funds’ financial statements.
a. Valuation. Fund securities and other investments are valued at market value based on market quotations obtained or determined by independent pricing services recommended by the adviser and approved by the Board of Trustees. Fund securities and other investments for which market quotations are not readily available are valued at fair value as determined in good faith by the adviser pursuant to procedures approved by the Board of Trustees, as described below. Market value is determined as follows:
Debt securities and unlisted preferred equity securities are valued based on evaluated bids furnished to the Funds by an independent pricing service or bid prices obtained from broker-dealers. Senior loans and collateralized loan obligations are valued at bid prices supplied by an independent pricing service, if available. Listed equity securities (including shares of closed-end investment companies and exchange-traded funds) are valued at the last sale price quoted on the exchange where they are traded most extensively or, if there is no reported sale during the day, the closing bid quotation as reported by an independent pricing service. Securities traded on the NASDAQ Global Select Market, NASDAQ Global Market and NASDAQ Capital Market are valued at the NASDAQ Official Closing Price (“NOCP”), or if lacking an NOCP, at the most recent bid quotations on the applicable NASDAQ Market. Unlisted equity securities (except unlisted preferred equity securities) are valued at the last sale price quoted in the market where they are traded most extensively or, if there is no reported sale during the day, the closing bid quotation as reported by an independent pricing service. If there is no last sale price or closing bid quotation available, unlisted equity securities will be valued using evaluated bids furnished by an independent pricing service, if available. In some foreign markets, an official close price and a last sale price may be available from the foreign exchange or market. In those cases, the official close price is used. Broker-dealer bid prices may be used to value debt and unlisted equity securities and senior loans and collateralized loan obligations where an independent pricing service is unable to price a security or where an independent pricing service does not provide a reliable price for the security. Forward foreign currency contracts are valued utilizing interpolated rates determined based on information provided by an independent pricing service. Futures contracts are valued at the most recent settlement price on the exchange on which the adviser believes that, over time, they are traded most extensively. Centrally cleared credit default swap agreements are valued at settlement prices of the clearing house on which the contracts were traded or prices obtained from broker-dealers. Bilateral credit default swaps are valued based on mid prices (between the bid price and the ask price) supplied by an independent pricing service. Centrally cleared swap agreements are valued at settlement prices of the clearing house on which the contracts were traded or prices obtained from broker-dealers.
Fund securities and other investments for which market quotations are not readily available are valued at fair value as determined in good faith by the adviser pursuant to procedures approved by the Board of Trustees. The Funds may also value securities and other investments at fair value in other circumstances such as when extraordinary events occur after the close of a foreign market but prior to the close of the New York Stock Exchange. This may include situations relating to a single issuer (such as a declaration of bankruptcy or a delisting of the issuer’s security from the primary market on which it has traded) as well as events affecting the securities markets in general (such as market disruptions or closings and significant fluctuations in U.S. and/or foreign markets). When fair valuing its securities or other investments, the Funds may, among other things, use modeling tools or other processes that may take into account factors such as securities or other market activity and/or significant events that occur after the close of the foreign market and before the time the Fund’s net asset value (“NAV”) is calculated. Fair value pricing may require subjective determinations about the value of a security, and fair values used to determine a Fund’s NAV may differ from quoted or published prices, or from prices that are used by others, for the same securities. In addition, the use of fair value pricing may not always result in adjustments to the prices of securities held by a Fund.
45 |
Notes to Financial Statements – continued
September 30, 2020
Illiquid securities for which market quotations are readily available and have been evaluated by the adviser are considered and classified as fair valued securities pursuant to the Funds’ pricing policies and procedures.
As of September 30, 2020, securities held by the Funds were fair valued as follows:
| | | | | | | | | | | | | | | | |
Fund | | Securities
classified as
fair valued | | | Percentage
of Net
Assets | | | Securities fair
valued by the
Fund’s adviser | | | Percentage of
Net Assets | |
High Income Opportunities Fund | | $ | 756,073 | | | | 0.3% | | | $ | 349,664 | | | | 0.1% | |
Securitized Asset Fund | | | — | | | | — | | | | 27,806,701 | | | | 1.9% | |
b. Investment Transactions and Related Investment Income. Investment transactions are accounted for on a trade date plus one day basis for daily NAV calculation. However, for financial reporting purposes, investment transactions are reported on trade date. Dividend income (including income reinvested) and foreign withholding tax, if applicable, is recorded on the ex-dividend date, or in the case of certain foreign securities, as soon as a Fund is notified, and interest income is recorded on an accrual basis. Interest income is increased by the accretion of discount and decreased by the amortization of premium, if applicable. Principal paydowns are recorded as income. In determining net gain or loss on securities sold, the cost of securities has been determined on an identified cost basis.
c. Foreign Currency Translation. The books and records of the Funds are maintained in U.S. dollars. The values of securities, currencies and other assets and liabilities denominated in currencies other than U.S. dollars, if any, are translated into U.S. dollars based upon foreign exchange rates prevailing at the end of the period. Purchases and sales of investment securities, income and expenses are translated into U.S. dollars on the respective dates of such transactions.
Net realized foreign exchange gains or losses arise from sales of foreign currency, changes in exchange rates between the trade and settlement dates on securities transactions and the difference between the amounts of dividends, interest and foreign withholding taxes recorded on the Funds’ books and the U.S. dollar equivalent of the amounts actually received or paid. Net unrealized foreign exchange gains or losses arise from changes in the value of assets and liabilities, other than investment securities, as of the end of the fiscal period, resulting from changes in exchange rates. Net realized foreign exchange gains or losses and the net change in unrealized foreign exchange gains or losses are disclosed in the Statements of Operations.
The values of investment securities are presented at the foreign exchange rates prevailing at the end of the period for financial reporting purposes. Net realized and unrealized gains or losses on investments reported in the Statements of Operations reflect gains or losses resulting from changes in exchange rates and fluctuations which arise due to changes in market prices of investment securities. For federal income tax purposes, a portion of the net realized gain or loss on investments arising from changes in exchange rates, which is reflected in the Statements of Operations, may be characterized as ordinary income and may, if the Funds have net losses, reduce the amount of income available to be distributed by the Funds.
The Funds may use foreign currency exchange contracts to facilitate transactions in foreign-denominated investments. Losses may arise from changes in the value of the foreign currency or if the counterparties do not perform under the contracts’ terms.
d. Forward Foreign Currency Contracts. The Funds may enter into forward foreign currency contracts, including forward foreign cross currency contracts, to acquire exposure to foreign currencies or to hedge the Funds’ investments against currency fluctuation. A contract can also be used to offset a previous contract. These contracts involve market risk in excess of the unrealized appreciation (depreciation) reflected in the Funds’ Statements of Assets and Liabilities. The U.S. dollar value of the currencies a Fund has committed to buy or sell represents the aggregate exposure to each currency a Fund has acquired or hedged through currency contracts outstanding at period end. Gains or losses are recorded for financial statement purposes as unrealized until settlement date. Contracts are traded over-the-counter directly with a counterparty. Risks may arise upon entering into these contracts from the potential inability of counterparties to meet the terms of their contracts and from unanticipated movements in the value of a foreign currency relative to the U.S. dollar. Certain contracts may require the movement of cash and/or securities as collateral for the Funds’ or counterparty’s net obligations under the contracts.
No forward foreign currency contracts were held by the Funds during the year ended September 30, 2020.
e. Futures Contracts. The Funds may enter into futures contracts. Futures contracts are agreements between two parties to buy and sell a particular instrument or index for a specified price on a specified future date.
When a Fund enters into a futures contract, it is required to deposit with (or for the benefit of) its broker an amount of cash or short-term high-quality securities as “initial margin.” As the value of the contract changes, the value of the futures contract position increases or declines. Subsequent payments, known as “variation margin,” are made or received by a Fund, depending on the price fluctuations in the fair value of the contract and the value of cash or securities on deposit with the broker. The aggregate principal amounts of the contracts are not recorded in the financial statements. Daily fluctuations in the value of the contracts are recorded in the Statements of Assets and Liabilities as a receivable (payable) and in the Statements of Operations as unrealized appreciation (depreciation) until the contracts are closed, when they are
| 46
Notes to Financial Statements – continued
September 30, 2020
recorded as realized gains (losses). Realized gain or loss on a futures position is equal to the difference between the value of the contract at the time it was opened and the value at the time it was closed, minus brokerage commissions. When a Fund enters into a futures contract certain risks may arise, such as illiquidity in the futures market, which may limit a Fund’s ability to close out a futures contract prior to settlement date, and unanticipated movements in the value of securities or interest rates.
Futures contracts are exchange-traded. Exchange-traded futures contracts are standardized and are settled through a clearing house with fulfillment supported by the credit of the exchange. Therefore, counterparty credit risks to the Funds are reduced; however, in the event that a counterparty enters into bankruptcy, a Fund’s claim against initial/variation margin on deposit with the counterparty may be subject to terms of a final settlement in bankruptcy court.
f. Swap Agreements. The Funds may enter into credit default and interest rate swaps. A credit default swap is an agreement between two parties (the “protection buyer” and “protection seller”) to exchange the credit risk of an issuer (“reference obligation”) for a specified time period. The reference obligation may be one or more debt securities or an index of such securities. The Funds may be either the protection buyer or the protection seller. As a protection buyer, the Funds have the ability to hedge the downside risk of an issuer or group of issuers. As a protection seller, the Funds have the ability to gain exposure to an issuer or group of issuers whose bonds are unavailable or in short supply in the cash bond market, as well as realize additional income in the form of fees paid by the protection buyer. The protection buyer is obligated to pay the protection seller a stream of payments (“fees”) over the term of the contract, provided that no credit event, such as a default or a downgrade in credit rating, occurs on the reference obligation. The Funds may also pay or receive upfront premiums. If a credit event occurs, the protection seller must pay the protection buyer the difference between the agreed upon notional value and market value of the reference obligation. Market value in this case is determined by a facilitated auction whereby a minimum number of allowable broker bids, together with a specified valuation method, are used to calculate the value. The maximum potential amount of undiscounted future payments that a Fund as the protection seller could be required to make under a credit default swap agreement would be an amount equal to the notional amount of the agreement.
Implied credit spreads, represented in absolute terms, are disclosed in the Portfolio of Investments for those agreements for which the Fund is the protection seller. Implied credit spreads serve as an indicator of the current status of the payment/performance risk and represent the likelihood or risk of default for the credit derivative. The implied credit spread of a particular reference entity reflects the cost of buying/selling protection and may include upfront payments required to be made to enter into the agreement. Wider credit spreads represent a deterioration of the reference entity’s credit soundness and a greater likelihood or risk of default or other credit event occurring as defined under the terms of the agreement.
An interest rate swap is an agreement with another party to receive or pay interest (e.g., an exchange of fixed rate payments for floating rate payments) to protect themselves from interest rate fluctuations. This type of swap is an agreement that obligates two parties to exchange a series of cash flows at specified intervals based upon or calculated by reference to a specified interest rate(s) for a specified notional amount. The payment flows are usually netted against each other, with the difference being paid by one party to the other.
The notional amounts of swap agreements are not recorded in the financial statements. Swap agreements are valued daily, and fluctuations in value are recorded in the Statements of Operations as change in unrealized appreciation (depreciation) on swap agreements. Fees are accrued in accordance with the terms of the agreement and are recorded as part of unrealized appreciation (depreciation) on swap agreements. When received or paid, fees are recorded in the Statements of Operations as realized gain or loss. Upfront premiums paid or received by the Funds are amortized or accreted over the term of the agreement and recorded as realized gain or loss. Payments made or received by the Funds as a result of a credit event or termination of the agreement are recorded as realized gain or loss.
Swap agreements are privately negotiated in the over-the-counter market and may be entered into as a bilateral contract or centrally cleared (“centrally cleared swaps”). Bilateral swap agreements are traded between counterparties and, as such, are subject to the risk that a party to the agreement will not be able to meet its obligations. In a centrally cleared swap, immediately following execution of the swap agreement, the swap agreement is novated to a central counterparty (the “CCP”) and the Funds face the CCP through a broker. Upon entering into a centrally cleared swap, the Funds are required to deposit initial margin with the broker in the form of cash or securities in an amount that varies depending on the size and risk profile of the particular swap. Subsequent payments, known as “variation margin,” are made or received by the Funds based on the daily change in the value of the centrally cleared swap agreement. For centrally cleared swaps, the Funds’ counterparty credit risk is reduced as the CCP stands between the Funds and the counterparty. The Funds cover their net obligations under outstanding swap agreements by segregating or earmarking cash or securities.
g. When-Issued and Delayed Delivery Transactions. The Funds may enter into when-issued or delayed delivery transactions. When-issued refers to transactions made conditionally because a security, although authorized, has not been issued. Delayed delivery refers to transactions for which delivery or payment will occur at a later date, beyond the normal settlement period. The price of when-issued and delayed delivery securities and the date when the securities will be delivered and paid for are fixed at the time the transaction is negotiated. The security and the obligation to pay for it are recorded by the Funds at the time the commitment is entered into. The value of the security may vary with market fluctuations during the time before the Funds take delivery of the security. No interest accrues to the Funds until the transaction settles.
47 |
Notes to Financial Statements – continued
September 30, 2020
Delayed delivery transactions include those designated as To Be Announced (“TBAs”) in the Portfolios of Investments. For TBAs, the actual security that will be delivered to fulfill the transaction is not designated at the time of the trade. The security is “to be announced” 48 hours prior to the established trade settlement date. Certain transactions require the Funds or counterparty to post cash and/or securities as collateral for the net mark-to-market exposure to the other party. The Funds cover their net obligations under outstanding delayed delivery commitments by segregating or earmarking cash or securities at the custodian.
Purchases of when-issued or delayed delivery securities may have a similar effect on the Funds’ NAV as if the Funds’ had created a degree of leverage in the portfolio. Risks may arise upon entering into such transactions from the potential inability of counterparties to meet their obligations under the transactions. Additionally, losses may arise due to changes in the value of the underlying securities.
h. Stripped Securities. Each Fund may invest in stripped securities, which are usually structured with two or more classes that receive different proportions of the interest and principal distribution on a pool of U.S. or foreign government securities or mortgage assets. In some cases, one class will receive all of the interest (the interest-only or “IO” class), while the other class will receive all of the principal (the principal-only or “PO” class). Stripped securities commonly have greater market volatility than other types of fixed-income securities. In the case of stripped mortgage securities, if the underlying mortgage assets experience greater than anticipated prepayments of principal, a Fund may fail to recoup fully its investments in IOs.
i. Federal and Foreign Income Taxes. The Trust treats each Fund as a separate entity for federal income tax purposes. Each Fund intends to meet the requirements of the Internal Revenue Code of 1986, as amended, applicable to regulated investment companies, and to distribute to its shareholders substantially all of its investment income and any net realized capital gains at least annually. Management has performed an analysis of each Fund’s tax positions for the open tax years as of September 30, 2020 and has concluded that no provisions for income tax are required. The Funds’ federal tax returns for the prior three fiscal years remain subject to examination by the Internal Revenue Service. Management is not aware of any events that are reasonably possible to occur in the next twelve months that would result in the amounts of any unrecognized tax benefits significantly increasing or decreasing for the Funds. However, management’s conclusions regarding tax positions taken may be subject to review and adjustment at a later date based on factors including, but not limited to, new tax laws and accounting regulations and interpretations thereof.
A Fund may be subject to foreign withholding taxes on investment income and taxes on capital gains on investments that are accrued and paid based upon the Fund’s understanding of the tax rules and regulations that exist in the countries in which the Fund invests. Foreign withholding taxes on dividend and interest income are reflected on the Statements of Operations as a reduction of investment income, net of amounts eligible to be reclaimed. Dividends and interest receivable on the Statements of Assets and Liabilities are net of foreign withholding taxes. Foreign withholding taxes where reclaims have been or will be filed are reflected on the Statements of Assets and Liabilities as tax reclaims receivable. Capital gains taxes paid are included in net realized gain (loss) on investments in the Statements of Operations. Accrued but unpaid capital gains taxes are reflected as foreign taxes payable on the Statements of Assets and Liabilities, if applicable, and reduce unrealized gains on investments. In the event that realized gains on investments are subsequently offset by realized losses, taxes paid on realized gains may be returned to a Fund. Such amounts, if applicable, are reflected as foreign tax rebates receivable on the Statements of Assets and Liabilities and are recorded as a realized gain when received.
j. Dividends and Distributions to Shareholders. Dividends and distributions are recorded on the ex-dividend date. The timing and characterization of certain income and capital gain distributions are determined in accordance with federal tax regulations, which may differ from accounting principles generally accepted in the United States of America. Permanent differences are primarily due to differing treatments for book and tax purposes of items such as premium amortization, contingent payment debt instruments, defaulted and/or non-income producing securities, convertible bonds, futures contracts mark-to-market, swap adjustments and paydown gains and losses. Permanent book and tax basis differences relating to shareholder distributions will result in reclassifications to capital accounts reported on the Statements of Assets and Liabilities. Temporary differences between book and tax distributable earnings are primarily due to wash sales, premium amortization, defaulted and/or non-income producing securities, contingent payment debt instruments, convertible bonds, futures contracts mark-to-market, paydown gains and losses and swap adjustments. Amounts of income and capital gain available to be distributed on a tax basis are determined annually, and at other times during the Funds’ fiscal year as may be necessary to avoid knowingly declaring and paying a return of capital distribution. Distributions from net investment income and net realized short-term capital gains are reported as distributed from ordinary income for tax purposes.
The tax characterization of distributions is determined on an annual basis. The tax character of distributions paid to shareholders during the years ended September 30, 2020 and 2019 were as follows:
| | | | | | | | | | | | | | | | | | | | | | | | |
| | | 2020 Distributions Paid From: | | | 2019 Distributions Paid From: | |
Fund | | Ordinary
Income | | | Long-Term
Capital Gains | | | Total | | | Ordinary
Income | | | Long-Term
Capital Gains | | | Total | |
High Income Opportunities Fund | | $ | 11,897,771 | | | $ | — | | | $ | 11,897,771 | | | $ | 9,838,729 | | | $ | 850,076 | | | $ | 10,688,805 | |
Securitized Asset Fund | | | 80,151,712 | | | | — | | | | 80,151,712 | | | | 64,801,602 | | | | — | | | | 64,801,602 | |
| 48
Notes to Financial Statements – continued
September 30, 2020
Distributions paid to shareholders from net investment income and net realized capital gains, based on accounting principles generally accepted in the United States of America, are consolidated and reported on the Statements of Changes in Net Assets as Distributions to Shareholders. Distributions paid to shareholders from net investment income and net realized capital gains expressed in per-share amounts, based on accounting principles generally accepted in the United States of America, are separately stated and reported within the Financial Highlights.
As of September 30, 2020, the components of distributable earnings on a tax basis were as follows:
| | | | | | | | |
| | | High Income
Opportunities Fund | | | Securitized
Asset Fund | |
Undistributed ordinary income | | $ | 1,412,673 | | | $ | 6,715,071 | |
| | | | | | | | |
Capital loss carryforward: | |
Short-term: | |
No expiration date | | | (262,059 | ) | | | (5,005,948 | ) |
Long-term: | |
No expiration date | | | (4,652,543 | ) | | | (78,538,028 | ) |
| | | | | | | | |
Total capital loss carryforward | | | (4,914,602 | ) | | | (83,543,976 | ) |
| | | | | | | | |
Unrealized appreciation (depreciation) | | | 6,803,877 | | | | (13,328,562 | ) |
| | | | | | | | |
Total accumulated earnings (losses) | | $ | 3,301,948 | | | $ | (90,157,467 | ) |
| | | | | | | | |
As of September 30, 2020, the tax cost of investments (including derivatives) and unrealized appreciation (depreciation) on a federal tax basis were as follows:
| | | | | | | | |
| | | High Income
Opportunities Fund | | | Securitized
Asset Fund | |
Federal tax cost | | $ | 248,661,734 | | | $ | 1,516,911,681 | |
| | | | | | | | |
Gross tax appreciation | | $ | 14,450,926 | | | $ | 52,078,334 | |
Gross tax depreciation | | | (7,647,049 | ) | | | (65,406,896 | ) |
| | | | | | | | |
Net tax appreciation (depreciation) | | $ | 6,803,877 | | | $ | (13,328,562 | ) |
| | | | | | | | |
k. Senior Loans. Each Fund may invest in senior loans to corporate, governmental or other borrowers. Senior loans, which include both secured and unsecured loans made by banks and other financial institutions to corporate customers, typically hold the most senior position in a borrower’s capital structure, may be secured by the borrower’s assets and have interest rates that reset frequently. Senior Loans can include term loans, revolving credit facility loans and second lien loans. A senior loan is often administered by a bank or other financial institution that acts as agent for all holders. The agent administers the terms of the senior loan, as specified in the loan agreement. Large loans may be shared or syndicated among several lenders. A Fund may enter into the primary syndicate for a loan or it may also purchase all or a portion of loans from other lenders (sometimes referred to as loan assignments), in either case becoming a direct lender. Senior loans outstanding at the end of the period, if any, are listed in each applicable Fund’s Portfolio of Investments.
l. Loan Participations. A Fund’s investments in senior loans may be in the form of participations in loans. When investing in a loan participation, a Fund has the right to receive payments of principal, interest and any fees to which it is entitled only from the party from whom the Fund has purchased the participation and only upon receipt by that party of payments from the borrower. A Fund generally has no right to enforce compliance by the borrower with the terms of the loan agreement or to vote on matters arising under the loan agreement. Thus, a Fund may be subject to credit risk from both the party from whom it purchased the loan participation and the borrower. Additionally, a Fund may have minimal control over the terms of any loan modification. Loan participations outstanding at the end of the period, if any, are listed in each applicable Fund’s Portfolio of Investments.
m. Collateralized Loan Obligations. Each Fund may invest in collateralized loan obligations (“CLOs”). A CLO is a type of asset-backed security designed to redirect the cash flows from a pool of leveraged loans to investors based on their risk preferences. Cash flows from a CLO are split into two or more portions, called tranches, varying in risk and yield. The risk of an investment in a CLO depends largely on the type of the collateral securities and the class of the instrument in which a Fund invests. The intent of the Funds when investing in CLOs is to purchase only higher level, investment grade level select tranches. CLOs outstanding at the end of the period, if any, are listed in each applicable Fund’s Portfolio of Investments.
n. Repurchase Agreements. Each Fund may enter into repurchase agreements, under the terms of a Master Repurchase Agreement, under which each Fund acquires securities as collateral and agrees to resell the securities at an agreed upon time and at an agreed upon price. It is each Fund’s policy that the market value of the collateral for repurchase agreements be at least equal to 102% of the repurchase price,
49 |
Notes to Financial Statements – continued
September 30, 2020
including interest. Certain repurchase agreements are tri-party arrangements whereby the collateral is held in a segregated account for the benefit of the Fund and on behalf of the counterparty. Repurchase agreements could involve certain risks in the event of default or insolvency of the counterparty, including possible delays or restrictions upon a Fund’s ability to dispose of the underlying securities. As of September 30, 2020, each Fund, as applicable, had investments in repurchase agreements for which the value of the related collateral exceeded the value of the repurchase agreement. The gross value of repurchase agreements is included in the Statements of Assets and Liabilities for financial reporting purposes.
o. Due to/from Brokers. Transactions and positions in certain futures contracts, swap agreements and delayed delivery commitments are maintained and cleared by registered U.S. broker/dealers pursuant to customer agreements between the Funds and the various broker/dealers. The due from brokers balance for Securitized Asset Fund represents cash pledged as initial margin for futures contracts and centrally cleared swap agreements. The due to brokers balance for Securitized Asset Fund represents cash received as collateral for delayed delivery securities. In certain circumstances the Fund’s use of cash held at brokers is restricted by regulation or broker mandated limits.
p. Securities Lending. The Funds have entered into an agreement with State Street Bank and Trust Company (“State Street Bank”), as agent of the Funds, to lend securities to certain designated borrowers. The loans are collateralized with cash or securities in an amount equal to at least 105% or 102% of the market value (including accrued interest) of the loaned international or domestic securities, respectively, when the loan is initiated. Thereafter, the value of the collateral must remain at least 102% of the market value (including accrued interest) of loaned securities for U.S. equities and U.S. corporate debt; at least 105% of the market value (including accrued interest) of loaned securities for non-U.S. equities; and at least 100% of the market value (including accrued interest) of loaned securities for U.S. Government securities, sovereign debt issued by non-U.S. Governments and non-U.S. corporate debt. In the event that the market value of the collateral falls below the required percentages described above, the borrower will deliver additional collateral on the next business day. As with other extensions of credit, the Funds may bear the risk of loss with respect to the investment of the collateral. The Funds invest cash collateral in short-term investments, a portion of the income from which is remitted to the borrowers and the remainder allocated between the Funds and State Street Bank as lending agent.
For the year ended September 30, 2020, neither Fund had loaned securities under this agreement.
q. Indemnifications. Under the Trust’s organizational documents, its officers and Trustees are indemnified against certain liabilities arising out of the performance of their duties to the Funds. Additionally, in the normal course of business, the Funds enter into contracts with service providers that contain general indemnification clauses. The Funds’ maximum exposure under these arrangements is unknown as this would involve future claims that may be made against the Funds that have not yet occurred. However, based on experience, the Funds expect the risk of loss to be remote.
r. New Accounting Pronouncement. In August 2018, the Financial Accounting Standards Board (“FASB”) issued Accounting Standards Update 2018-13, Fair Value Measurement (Topic 820): Disclosure Framework — Changes to the Disclosure Requirements for Fair Value Measurement (“ASU 2018-13”). The update introduces new fair value disclosure requirements, eliminates some prior fair value disclosure requirements, and modifies certain existing fair value disclosure requirements. ASU 2018-13 is effective for fiscal years beginning after December 15, 2019, including interim periods within those fiscal years. An entity is permitted to early adopt any eliminated or modified disclosures upon issuance of the update and delay adoption of any new disclosures until the required effective date. Management has evaluated the impact of the adoption of ASU 2018-13 and has determined to early adopt the removal of (i) the amount of and reasons for transfers between Level 1 and Level 2 of the fair value hierarchy and (ii) the policy for timing of transfers between levels. Amended disclosures required and permitted for early adoption by ASU 2018-13 have been incorporated in the Funds’ annual financial statements as of September 30, 2020.
In March 2020, the FASB issued Accounting Standard Update 2020-04, Reference Rate Reform (Topic 848) (“ASU 2020-04”). In response to concerns about structural risks of interbank offered rates, and particularly the risk of cessation of the London Interbank Offered Rate (“LIBOR”), which is expected to occur no later than December 31, 2021, regulators have undertaken reference rate reform initiatives to identify alternative reference rates that are more observable or transaction based and less susceptible to manipulation. ASU 2020-04 provides temporary guidance to ease the potential burden in accounting for (or recognizing the effects of) reference rate reform on financial reporting. ASU 2020-04 is elective and applies to all entities, subject to meeting certain criteria, that have contracts that reference LIBOR or another reference rate expected to be discontinued because of reference rate reform. ASU 2020-04 amendments offer optional expedients for contract modifications that would allow an entity to account for such modifications by prospectively adjusting the effective interest rate, instead of evaluating each contract, in accordance with existing accounting standards, as to whether reference rate modifications constitute the establishment of new contracts or the continuation of existing contracts. ASU 2020-04 amendments are currently effective and an entity may elect to apply its provisions as of any date from the beginning of an interim period that includes or is subsequent to March 12, 2020. No Fund contracts have yet been impacted by reference rate reform. Management expects to apply the optional expedients when appropriate.
| 50
Notes to Financial Statements – continued
September 30, 2020
3. Fair Value Measurements. In accordance with accounting standards related to fair value measurements and disclosures, the Funds have categorized the inputs utilized in determining the value of each Fund’s assets or liabilities. These inputs are summarized in the three broad levels listed below:
| | • | | Level 1—quoted prices in active markets for identical assets or liabilities; |
| | • | | Level 2—prices determined using other significant inputs that are observable either directly, or indirectly through corroboration with observable market data (which could include quoted prices for similar assets or liabilities, interest rates, credit risk, etc.); and |
| | • | | Level 3—prices determined using significant unobservable inputs when quoted prices or observable inputs are unavailable such as when there is little or no market activity for an asset or liability (unobservable inputs reflect each Fund’s own assumptions in determining the fair value of assets or liabilities and would be based on the best information available). |
The inputs or methodology used for valuing securities are not necessarily an indication of the risk associated with investing in those securities.
The Funds’ pricing policies and procedures are recommended by the adviser and approved by the Board of Trustees. Debt securities are valued based on evaluated bids furnished to the Funds by an independent pricing service. Broker-dealer bid prices may be used if an independent pricing service either is unable to price a security or does not provide a reliable price for a security. The Funds’ adviser may use internally developed models to validate broker-dealer bid prices that are only available from a single broker or market maker. Such securities are considered and classified as fair valued. Broker-dealer bid prices for which the Funds do not have knowledge of the inputs used by the broker-dealer are categorized in Level 3. Securities for which market quotations are not readily available are valued at fair value as determined in good faith by the Funds’ adviser pursuant to procedures approved by the Board of Trustees. Fair valued securities may be categorized in Level 3.
The following is a summary of the inputs used to value the Funds’ investments as of September 30, 2020, at value:
High Income Opportunities Fund
Asset Valuation Inputs
| | | | | | | | | | | | | | | | |
Description | | Level 1 | | | Level 2 | | | Level 3 | | | Total | |
Bonds and Notes | | | | | | | | | | | | | | | | |
Non-Convertible Bonds | | | | | | | | | | | | | | | | |
Home Construction | | $ | — | | | $ | 2,676,884 | | | $ | — | (b) | | $ | 2,676,884 | |
Non-Agency Commercial Mortgage-Backed Securities | | | — | | | | 926,024 | | | | 314,438 | (c) | | | 1,240,462 | |
All Other Non-Convertible Bonds(a) | | | — | | | | 222,271,221 | | | | — | | | | 222,271,221 | |
| | | | |
Total Non-Convertible Bonds | | | — | | | | 225,874,129 | | | | 314,438 | | | | 226,188,567 | |
| | | | |
Convertible Bonds(a) | | | — | | | | 8,276,771 | | | | — | | | | 8,276,771 | |
| | | | |
Total Bonds and Notes | | | — | | | | 234,150,900 | | | | 314,438 | | | | 234,465,338 | |
| | | | |
Senior Loans(a) | | | — | | | | 93,471 | | | | — | | | | 93,471 | |
Collateralized Loan Obligations | | | — | | | | 880,898 | | | | — | | | | 880,898 | |
Preferred Stocks | | | | | | | | | | | | | | | | |
Banking | | | 969,152 | | | | — | | | | — | | | | 969,152 | |
Energy | | | — | | | | — | | | | — | (b) | | | — | |
Food & Beverage | | | — | | | | 3,452,543 | | | | — | | | | 3,452,543 | |
| | | | |
Total Preferred Stocks | | | 969,152 | | | | 3,452,543 | | | | — | | | | 4,421,695 | |
| | | | |
Common Stocks | | | | | | | | | | | | | | | | |
Chemicals | | | — | | | | 128,459 | | | | — | | | | 128,459 | |
All Other Common Stocks(a) | | | 927,926 | | | | — | | | | — | | | | 927,926 | |
| | | | |
Total Common Stocks | | | 927,926 | | | | 128,459 | | | | — | | | | 1,056,385 | |
| | | | |
Warrants | | | — | | | | — | | | | 35,226 | (b)(c) | | | 35,226 | |
Short-Term Investments | | | — | | | | 14,512,598 | | | | — | | | | 14,512,598 | |
| | | | |
Total | | $ | 1,897,078 | | | $ | 253,218,869 | | | $ | 349,664 | | | $ | 255,465,611 | |
| | | | |
(a) Details of the major categories of the Fund’s investments are reflected within the Portfolio of Investments.
(b) Includes a security fair valued at zero by the Fund’s adviser using Level 3 inputs.
(c) Fair valued by the Fund’s adviser.
51 |
Notes to Financial Statements – continued
September 30, 2020
Securitized Asset Fund
Asset Valuation Inputs
| | | | | | | | | | | | | | | | |
Description | | Level 1 | | | Level 2 | | | Level 3 | | | Total | |
Bonds and Notes | | | | | | | | | | | | | | | | |
ABS Home Equity | | $ | — | | | $ | 88,828,641 | | | $ | 405,480 | (b) | | $ | 89,234,121 | |
Agency Commercial Mortgage-Backed Securities | | | — | | | | 86,752,786 | | | | 3,439,336 | (b) | | | 90,192,122 | |
Collateralized Mortgage Obligations | | | — | | | | 297,771,383 | | | | 20,720,382 | (c) | | | 318,491,765 | |
Mortgage Related | | | — | | | | 341,120,292 | | | | 3,257,739 | (d) | | | 344,378,031 | |
Non-Agency Commercial Mortgage-Backed Securities | | | — | | | | 191,302,964 | | | | 4,886,172 | (b) | | | 196,189,136 | |
All Other Bonds and Notes(a) | | | — | | | | 326,386,609 | | | | — | | | | 326,386,609 | |
| | | | |
Total Bonds and Notes | | | — | | | | 1,332,162,675 | | | | 32,709,109 | | | | 1,364,871,784 | |
| | | | |
Collateralized Loan Obligations | | | — | | | | 60,325,654 | | | | — | | | | 60,325,654 | |
Loan Participations(a) | | | — | | | | 2,657,001 | | | | — | | | | 2,657,001 | |
Short-Term Investments | | | — | | | | 89,449,716 | | | | — | | | | 89,449,716 | |
| | | | |
Total | | $ | — | | | $ | 1,484,595,046 | | | $ | 32,709,109 | | | $ | 1,517,304,155 | |
| | | | |
Liability Valuation Inputs
| | | | | | | | | | | | | | | | |
Description | | Level 1 | | | Level 2 | | | Level 3 | | | Total | |
Futures Contracts (unrealized depreciation) | | $ | (576,900 | ) | | $ | — | | | $ | — | | | $ | (576,900 | ) |
Centrally Cleared Interest Rate Swap Agreements (unrealized depreciation) | | | — | | | | (14,437,003 | ) | | | — | | | | (14,437,003 | ) |
| | | | |
Total | | $ | (576,900 | ) | | $ | (14,437,003 | ) | | $ | — | | | $ | (15,013,903 | ) |
| | | | |
(a) Details of the major categories of the Fund’s investments are reflected within the Portfolio of Investments.
(b) Fair valued by the Fund’s adviser.
(c) Fair valued by the Fund’s adviser ($18,935,038) and valued using broker-dealer bid prices ($1,785,344).
(d) Fair valued by the Fund’s adviser ($140,675) and valued using broker-dealer bid prices ($3,117,064).
The following is a reconciliation of Level 3 investments for which significant unobservable inputs were used to determine fair value as of September 30, 2019 and/or September 30, 2020:
High Income Opportunities Fund
Asset Valuation Inputs
| | | | | | | | | | | | | | | | | | | | | | | | | | | | | | | | | | | | | | | | |
Investments in Securities | | Balance as of
September 30,
2019 | | | Accrued
Discounts
(Premiums) | | | Realized
Gain
(Loss) | | | Change in
Unrealized
Appreciation
(Depreciation) | | | Purchases | | | Sales | | | Transfers
into
Level 3 | | | Transfers
out of
Level 3 | | | Balance as of
September 30,
2020 | | | Change in
Unrealized
Appreciation
(Depreciation)
from
Investments
Still Held at
September 30,
2020 | |
Bonds and Notes | | | | | | | | | | | | | | | | | | | | | | | | | | | | | | | | | | | | | | | | |
Non-Convertible Bonds | | | | | | | | | | | | | | | | | | | | | | | | | | | | | | | | | | | | | | | | |
Finance Companies | | $ | 35,640 | | | $ | — | | | $ | (63,816 | ) | | $ | 63,360 | | | $ | — | | | $ | (35,184 | ) | | $ | — | | | $ | — | | | $ | — | | | $ | — | |
Home Construction | | | — | | | | — | | | | — | | | | — | | | | — | | | | — | | | | — | | | | — | | | | — | (a) | | | — | |
Non-Agency Commercial Mortgage-Backed Securities | | | 89,787 | | | | — | | | | — | | | | (235,180 | ) | | | — | | | | — | | | | 549,618 | | | | (89,787 | ) | | | 314,438 | | | | (235,180 | ) |
Preferred Stocks | | | | | | | | | | | | | | | | | | | | | | | | | | | | | | | | | | | | | | | | |
Energy | | | 260,608 | | | | — | | | | — | | | | (260,608 | ) | | | — | | | | — | | | | — | | | | — | | | | — | (a) | | | (260,608 | ) |
Warrants | | | — | | | | — | | | | — | | | | — | | | | 35,226 | | | | — | | | | — | | | | — | | | | 35,226 | (a) | | | — | |
| | | | | | | | | | | | | | | | | | | | | | | | | | | | | | | | | | | | | | | | |
Total | | $ | 386,035 | | | $ | — | | | $ | (63,816 | ) | | $ | (432,428 | ) | | $ | 35,226 | | | $ | (35,184) | | | $ | 549,618 | | | $ | (89,787 | ) | | $ | 349,664 | | | $ | (495,788 | ) |
| | | | | | | | | | | | | | | | | | | | | | | | | | | | | | | | | | | | | | | | |
| (a) | | Includes a security fair valued at zero by the Fund’s adviser using level 3 inputs. | |
Debt securities valued at $549,618 were transferred from Level 2 to Level 3 during the period ended September 30, 2020. At September 30, 2019, these securities were valued on the basis of evaluated bids furnished to the Fund by an independent pricing service in accordance with the Fund’s valuation policies. At September 30, 2020 these securities were valued at fair value as determined in good faith by the Fund’s adviser as an independent pricing service did not provide a reliable price for the securities.
| 52
Notes to Financial Statements – continued
September 30, 2020
A debt security valued at $89,787 was transferred from Level 3 to Level 2 during the period ended September 30, 2020. At September 30, 2019, this security was valued using broker-dealer bid prices based on inputs unobservable to the Fund as an independent pricing service did not provide a reliable price for the security. At September 30, 2020, this security was valued on the basis of evaluated bids furnished to the Fund by an independent pricing service in accordance with the Fund’s valuation policies.
Securitized Asset Fund
Asset Valuation Inputs
| | | | | | | | | | | | | | | | | | | | | | | | | | | | | | | | | | | | | | | | |
Investments in Securities | | Balance as of
September 30,
2019 | | | Accrued
Discounts
(Premiums) | | | Realized
Gain
(Loss) | | | Change in
Unrealized
Appreciation
(Depreciation) | | | Purchases | | | Sales | | | Transfers
into
Level 3 | | | Transfers
out of
Level 3 | | | Balance as of
September 30,
2020 | | | Change in
Unrealized
Appreciation
(Depreciation)
from
Investments
Still Held at
September 30,
2020 | |
Bonds and Notes | | | | | | | | | | | | | | | | | | | | | | | | | | | | | | | | | | | | | | | | |
ABS Home Equity | | $ | 2,026,262 | | | $ | — | | | $ | (1,000,611 | ) | | $ | 207,989 | | | $ | — | | | $ | (168,173 | ) | | $ | 1,040,116 | | | $ | (1,700,103 | ) | | $ | 405,480 | | | $ | 202,706 | |
ABS Other | | | 484,855 | | | | — | | | | — | | | | — | | | | — | | | | — | | | | — | | | | (484,855 | ) | | | — | | | | — | |
ABS Student Loan | | | 7,075,876 | | | | — | | | | — | | | | — | | | | — | | | | — | | | | — | | | | (7,075,876 | ) | | | — | | | | — | |
Agency Commercial Mortgage-Backed Securities | | | 5,042,467 | | | | — | | | | (4,895,334 | ) | | | 1,904,611 | | | | — | | | | — | | | | 1,387,592 | | | | — | | | | 3,439,336 | | | | 1,904,611 | |
Collateralized Mortgage Obligations | | | 16,317,990 | | | | 6,204 | | | | (2,295,876 | ) | | | 1,019,772 | | | | 6,274,961 | | | | (6,736,779 | ) | | | 8,293,789 | | | | (2,159,679 | ) | | | 20,720,382 | | | | 869,040 | |
Mortgage Related | | | — | | | | — | | | | — | | | | 6,038 | | | | 3,251,701 | | | | — | | | | — | | | | — | | | | 3,257,739 | | | | 6,038 | |
Non-Agency Commercial Mortgage-Backed Securities | | | 4,310,241 | | | | — | | | | — | | | | (1,603,890 | ) | | | — | | | | — | | | | 6,490,062 | | | | (4,310,241 | ) | | | 4,886,172 | | | | (1,603,890 | ) |
Loan Participations | | | | | | | | | | | | | | | | | | | | | | | | | | | | | | | | | | | | | | | | |
ABS Other | | | 4,421,731 | | | | — | | | | — | | | | — | | | | — | | | | — | | | | — | | | | (4,421,731 | ) | | | — | | | | — | |
| | | | | | | | | | | | | | | | | | | | | | | | | | | | | | | | | | | | | | | | |
Total | | $ | 39,679,422 | | | $ | 6,204 | | | $ | (8,191,821 | ) | | $ | 1,534,520 | | | $ | 9,526,662 | | | $ | (6,904,952 | ) | | $ | 17,211,559 | | | $ | (20,152,485 | ) | | $ | 32,709,109 | | | $ | 1,378,505 | |
| | | | | | | | | | | | | | | | | | | | | | | | | | | | | | | | | | | | | | | | |
Debt securities valued at $17,211,559 were transferred from Level 2 to Level 3 during the period ended September 30, 2020. At September 30, 2019, these securities were valued on the basis of evaluated bids furnished to the Fund by an independent pricing service in accordance with the Fund’s valuation policies. At September 30, 2020 these securities were valued at fair value as determined in good faith by the Fund’s adviser as an independent pricing service did not provide a reliable price for the securities.
Debt securities valued at $15,730,754 were transferred from Level 3 to Level 2 during the period ended September 30, 2020. At September 30, 2019, these securities were valued using broker-dealer bid prices based on inputs unobservable to the Fund as an independent pricing service was unable to price the securities. At September 30, 2020 these securities were valued on the basis of evaluated bids furnished to the Fund by an independent pricing service in accordance with the Fund’s valuation policies.
A debt security valued at $4,421,731 was transferred from Level 3 to Level 2 during the period ended September 30, 2020. At September 30, 2019, this security was valued using broker-dealer bid prices based on inputs unobservable to the Fund as an independent pricing service was unable to price the security. At September 30, 2020 this security was valued at a bid price furnished to the Fund by an independent pricing service in accordance with the Fund’s valuation policies.
The significant unobservable inputs used for those securities fair valued by the adviser and categorized in Level 3 as of September 30, 2020, were as follows:
| | | | | | | | | | | | | | | | | | |
Description | | Valuation
Technique(s) | | | Unobservable
Input | | | Unobservable
Input Value(s) | | | Value | |
Bonds and Notes | | | | | | | | | | | | | | | | |
| | | ABS Home Equity1 | | | Market Discount | | | | Discount Rate | | | | 1.00% - 3.00% | | | $ | 405,480 | |
| | Agency Commercial Mortgage-Backed Securities1 | | | Market Discount | | | | Discount Rate | | | | 1.00% - 2.00% | | | | 3,439,336 | |
| | Collateralized Mortgage Obligations1 | | | Market Discount | | | | Discount Rate | | | | 0.50% - 2.00% | | | | 18,935,038 | |
| | Mortgage Related1 | | | Market Discount | | | | Discount Rate | | | | 1.00% | | | | 140,675 | |
| | Non-Agency Commercial Mortgage-Backed Securities2 | | | Discounted Cash Flows | | |
| Constant Default Rate
Loss Severity Lag Time Loss Adjusted Spread |
| |
| 100%
39% 24 Months 13% |
| | | 4,886,172 | |
| | | | | | | | | | | | | | | | | | |
Total | | | | | | | | | | | | | | $ | 27,806,701 | |
| | | | | | | | | | | | | | | | | | |
1 “Odd lot” securities (those with current principal below the normal trading size) are valued using a discount to the “round lot” price for the same security. The significant unobservable input used in the fair value measurement is the discount rate. Discount rates are set at a specific fixed rate depending on the size of the odd lot. The Unobservable
53 |
Notes to Financial Statements – continued
September 30, 2020
Input Value(s) noted above reflect a range due to the fact that there are multiple odd lot securities within each asset type that have had different discount rates applied. A significant change in the discount rate could have a material effect on the fair value measurement. There is an inverse relationship between the discount rate and the fair value measurement, meaning a significant increase in the discount rate would result in a lower fair value measurement, and vice versa.
2 Security is valued using a discounted cash flow model. The significant unobservable inputs used in the fair value measurement are the constant default rate, loss severity, lag time, and loss adjusted spread. Significant changes in input values could have a material effect on the fair value measurement. There is an inverse relationship between the loss severity, lag time, and loss adjusted spread and the fair value measurement, meaning a significant increase in any of those input values in isolation would have resulted in a lower fair value measurement, and vice versa. The constant default rate of 100% is based on the fact that the underlying loan is in default.
4. Derivatives. Derivative instruments are defined as financial instruments whose value and performance are based on the value and performance of an underlying asset, reference rate or index. Derivative instruments that the Funds used during the period include futures contracts and swap agreements.
High Income Opportunities Fund is subject to the risk that companies in which the Fund invests will fail financially or otherwise be unwilling or unable to meet their obligations to the Fund. The Fund may use credit default swaps, as a protection buyer, to hedge its credit exposure to issuers of bonds it holds without having to sell the bonds. The Fund may also use credit default swaps, as a protection seller, to gain investment exposure. During the year ended September 30, 2020, the Fund engaged in credit default swap transactions (as a protection seller) to gain investment exposure.
Securitized Asset Fund is subject to the risk that changes in interest rates will affect the value of the Fund’s investments in fixed-income securities. The Fund will be subject to increased interest rate risk to the extent that it invests in fixed-income securities with longer maturities or durations, as compared to investing in fixed-income securities with shorter maturities or durations. The Fund may use futures contracts and interest rate swaps to hedge against changes in interest rates and to manage duration without having to buy or sell portfolio securities. During the year ended September 30, 2020, Securitized Asset Fund used futures contracts to hedge against changes in interest rates and manage duration. The Fund used interest rate swaps for investment exposure.
Transactions in derivative instruments for High Income Opportunities Fund during the year ended September 30, 2020 as reflected in the Statements of Operations were as follows:
| | |
Net Realized Gain (Loss) on: | | Swap
agreements |
Credit contracts | | $(978,007) |
The following is a summary of derivative instruments for Securitized Asset Fund as of September 30, 2020, as reflected within the Statements of Assets and Liabilities:
| | | | |
Liabilities | | Unrealized depreciation
on futures contracts1 | | Swap agreements
at value2 |
Exchange-traded/cleared liability derivatives Interest rate contracts | | $(576,900) | | $(14,437,003) |
1 Represents cumulative unrealized appreciation (depreciation) on futures contracts. Only the current day’s variation margin on futures contracts is reported within the Statements of Assets and Liabilities as receivable or payable for variation margin, as applicable.
2 Represents swap agreements, at value. Only the current day’s variation margin on swap agreements is reported within the Statements of Assets and Liabilities as receivable or payable for variation margin, as applicable.
Transactions in derivative instruments for Securitized Asset Fund during the year ended September 30, 2020 as reflected in the Statements of Operations were as follows:
| | | | |
Net Realized Gain (Loss) on: | | Futures
contracts | | Swap
agreements |
Interest rate contracts | | $(17,942,925) | | $(1,123,541) |
| | |
Net Change in Unrealized
Appreciation (Depreciation) on: | | Futures
contracts | | Swap
agreements |
Interest rate contracts | | $(971,291) | | $(9,707,501) |
As the Funds value their derivatives at fair value and recognize changes in fair value through the Statements of Operations, they do not qualify for hedge accounting under authoritative guidance for derivative instruments. The Funds’ investments in derivatives may represent an economic hedge; however, they are considered to be non-hedge transactions for the purpose of these disclosures.
| 54
Notes to Financial Statements – continued
September 30, 2020
The volume of futures contract and swap agreement activity, as a percentage of net assets, based on gross month-end notional amounts outstanding during the period, including long and short positions at absolute value, was as follows for the year ended September 30, 2020:
| | | | | | | | |
High Income Opportunities Fund | | | | | Credit Default
Swaps | |
Average Notional Amount Outstanding | | | | | | | 2.49% | |
Highest Notional Amount Outstanding | | | | | | | 16.56% | |
Lowest Notional Amount Outstanding | | | | | | | 0.00% | |
Notional Amount Outstanding as of September 30, 2020 | | | | | | | 0.00% | |
| | |
Securitized Asset Fund | | Futures | | | Interest Rate
Swaps | |
Average Notional Amount Outstanding | | | 13.85% | | | | 10.75% | |
Highest Notional Amount Outstanding | | | 20.71% | | | | 12.79% | |
Lowest Notional Amount Outstanding | | | 6.07% | | | | 8.95% | |
Notional Amount Outstanding as of September 30, 2020 | | | 14.52% | | | | 10.86% | |
Notional amounts outstanding at the end of the prior period, if applicable, are included in the averages above.
Unrealized gain and/or loss on open futures and swaps is recorded in the Statements of Assets and Liabilities. The aggregate notional values of futures and swap contracts are not recorded in the Statements of Assets and Liabilities, and therefore are not included in the Funds’ net assets.
Counterparty risk is managed based on policies and procedures established by the Fund’s adviser. Such policies and procedures may include, but are not limited to, minimum counterparty credit rating requirements, monitoring of counterparty credit default swap spreads and posting of collateral. With exchange-traded derivatives, there is minimal counterparty credit risk to the Fund because the exchange’s clearing house, as counterparty to these instruments, stands between the buyer and the seller of the contract. Credit risk still exists in exchange-traded derivatives with respect to initial and variation margin that is held in a broker’s customer accounts. While brokers are required to segregate customer margin from their own assets, in the event that a broker becomes insolvent or goes into bankruptcy and at that time there is a shortfall in the aggregate amount of margin held by the broker for all its clients, U.S. bankruptcy laws will typically allocate that shortfall on a pro rata basis across all of the broker’s customers, potentially resulting in losses to the Fund. Based on balances reflected on each Fund’s Statement of Assets and Liabilities, the following table shows the maximum amount of loss due to credit risk that, based on the gross fair value of the financial instrument, the applicable Fund would incur if parties (including brokers holding margin for exchange-traded derivatives) to the relevant financial instruments failed completely to perform according to the terms of the contracts and the collateral or other security, if any, for the amount due proved to be of no value to the Fund:
| | | | | | | | |
Fund | | Maximum
Amount of
Loss — Gross | | | Maximum
Amount of
Loss — Net | |
Securitized Asset Fund | | $ | 10,252,296 | | | $ | 10,252,296 | |
5. Purchases and Sales of Securities. For the year ended September 30, 2020, purchases and sales of securities (excluding short-term investments and including paydowns) were as follows:
| | | | | | | | | | | | | | | | |
| | | U.S. Government/Agency
Securities | | | Other Securities | |
Fund | | Purchases | | | Sales | | | Purchases | | | Sales | |
High Income Opportunities Fund | | $ | 36,031,996 | | | $ | 38,432,244 | | | $ | 230,806,638 | | | $ | 148,861,280 | |
Securitized Asset Fund | | | 3,465,545,149 | | | | 3,548,811,938 | | | | 756,142,884 | | | | 677,600,064 | |
6. Management Fees and Other Transactions with Affiliates.
a. Management Fees. Loomis Sayles has agreed to pay, without reimbursement from the Funds or the Trust, the following expenses of the Funds: compensation to Trustees of the Trust who are not “interested persons” (as defined in the 1940 Act) of the Trust; registration, filing and other fees in connection with requirements of regulatory authorities; the charges and expenses of any entity appointed by the Funds for custodial, paying agent, shareholder servicing and plan agent services; charges and expenses of the independent registered public accounting firm retained by the Funds; charges and expenses of any transfer agents and registrars appointed by the Funds; any cost of certificates representing shares of the Funds; legal fees and expenses in connection with the day-to-day affairs of the Funds, including registering and qualifying its shares with Federal and State regulatory authorities; expenses of meetings of shareholders and Trustees of the Trust; the costs of services, including services of counsel, required in connection with the preparation of the Funds’ registration statements and prospectuses, including amendments and revisions thereto, annual, semi-annual and other periodic reports of the Funds, and notices and proxy solicitation
55 |
Notes to Financial Statements – continued
September 30, 2020
material furnished to shareholders of the Funds or regulatory authorities, and any costs of printing or mailing these items; and the Funds’ expenses of bookkeeping, accounting and financial reporting, including related clerical expenses and all other expenses incurred; and other operating expenses of the Funds, as applicable.
Loomis Sayles serves as investment adviser to each Fund. Loomis Sayles is a limited partnership whose sole general partner, Loomis, Sayles & Company, Inc., is indirectly owned by Natixis Investment Managers, LLC (“Natixis”), which is part of Natixis Investment Managers, an international asset management group based in Paris, France. Under the terms of each management agreement, Loomis Sayles does not charge the Funds an investment advisory fee, also known as a management fee, or any other fee for those services or for bearing those expenses. Although the Funds do not compensate Loomis Sayles directly for services under the advisory agreement, Loomis Sayles will typically receive an advisory fee from the sponsors of “wrap programs,” who in turn charge the programs’ participants.
b. Service and Distribution Fees. Natixis Distribution, L.P. (“Natixis Distribution”), which is a wholly-owned subsidiary of Natixis, has entered into a distribution agreement with the Trust. Pursuant to this agreement, Natixis Distribution serves as principal underwriter of the Funds of the Trust. Natixis Distribution currently is not paid a fee for serving as distributor for the Funds. Loomis Sayles has agreed to reimburse Natixis Distribution to the extent that Natixis Distribution incurs expenses in connection with any redemption of Fund shares.
c. Administrative Fees. Natixis Advisors provides certain administrative services for the Funds and contracts with State Street Bank to serve as sub-administrator. Natixis Advisors is a wholly-owned subsidiary of Natixis. Loomis Sayles has agreed to pay, without reimbursement from the Trust or Funds, fees to Natixis Advisors for services to the Funds.
d. Trustees Fees and Expenses. The Trust does not pay any compensation directly to its officers or Trustees who are directors, officers or employees of Natixis Advisors, Natixis Distribution, Natixis or their affiliates. The Chairperson of the Board of Trustees receives a retainer fee at the annual rate of $369,000. The Chairperson does not receive any meeting attendance fees for Board of Trustees meetings or committee meetings that he attends. Each Independent Trustee (other than the Chairperson) receives, in the aggregate, a retainer fee at the annual rate of $199,000. Each Independent Trustee also receives a meeting attendance fee of $10,000 for each meeting of the Board of Trustees that he or she attends in person and $5,000 for each meeting of the Board of Trustees that he or she attends telephonically. In addition, the chairperson of the Contract Review Committee, the chairperson of the Audit Committee and the chairperson of the Governance Committee each receive an additional retainer fee at the annual rate of $20,000. Each Contract Review Committee member is compensated $6,000 for each Committee meeting that he or she attends in person and $3,000 for each meeting that he or she attends telephonically. Each Audit Committee member is compensated $6,000 for each Committee meeting that he or she attends in person and $3,000 for each meeting that he or she attends telephonically. These fees are allocated among the funds in the Natixis Funds Trusts, Loomis Sayles Funds Trusts and Natixis ETF Trusts based on a formula that takes into account, among other factors, the relative net assets of each fund. Trustees are reimbursed for travel expenses in connection with attendance at meetings. Loomis Sayles has agreed to pay, without reimbursement from the Trust or Funds, Trustees fees and expenses allocable to the Funds.
Prior to January 1, 2020, the Chairperson of the Board received a retainer fee at the annual rate of $360,000 and each Independent Trustee (other than the Chairperson) received, in the aggregate, a retainer fee at the annual rate of $190,000, and the chairperson of the Governance Committee received an additional retainer fee at the annual rate of $15,000. All other Trustee fees remained unchanged.
A deferred compensation plan (the “Plan”) is available to the Trustees on a voluntary basis. Deferred amounts remain in the Funds until distributed in accordance with the provisions of the Plan. The value of a participating Trustee’s deferral account is based on theoretical investments of deferred amounts, on the normal payment dates, in certain funds of the Natixis Funds Trusts, Loomis Sayles Funds Trusts and Natixis ETF Trusts as designated by the participating Trustees. Changes in the value of participants’ deferral accounts are allocated pro rata among the funds in the Natixis Funds Trusts, Loomis Sayles Funds Trusts and Natixis ETF Trusts, and are normally reflected as Trustees’ fees and expenses in the Statements of Operations. The portions of the accrued obligations allocated to the Funds under the Plan are reflected as Deferred Trustees’ fees in the Statements of Assets and Liabilities.
Certain officers and employees of Natixis Advisors and Loomis Sayles are also officers and/or Trustees of the Trust.
7. Line of Credit. Each Fund, together with certain other funds of Natixis Funds Trusts, Loomis Sayles Funds Trusts and Natixis ETF Trusts, entered into a $400,000,000 committed unsecured line of credit provided by State Street Bank. Any one Fund may borrow up to $350,000,000 under the line of credit agreement (as long as all borrowings by all Funds in the aggregate do not exceed the $400,000,000 limit at any time), subject to each Fund’s investment restrictions and its contractual obligations under the line of credit. Interest is charged to the Funds based upon the terms set forth in the agreement. In addition, a commitment fee of 0.15% per annum, payable at the end of each calendar quarter, is accrued and apportioned among the participating funds (applicable allocations to the Funds are paid by Loomis Sayles) based on their average daily unused portion of the line of credit. Loomis Sayles, on behalf of the Funds, paid an arrangement fee, an upfront fee, and certain other legal fees in connection with the line of credit agreement.
For the year ended September 30, 2020, neither Fund had borrowings under this agreement.
| 56
Notes to Financial Statements – continued
September 30, 2020
8. Risk. Securitized Asset Fund’s investments in mortgage-related and asset-backed securities are subject to certain risks not associated with investments in other securities. Mortgage-related and asset-backed securities are subject to the risk that unexpected changes in interest rates will have a direct effect on expected maturity. A shortened maturity may result in the reinvestment of prepaid amounts in securities with lower yields than the original obligations. An extended maturity may result in a reduction of a security’s value.
Global markets have experienced periods of high volatility triggered by the ongoing public health emergency known as coronavirus (“Covid-19”). As the situation continues, the extent and duration of the impact that the Covid-19 outbreak may have on financial markets and the economy as a whole remains highly uncertain. If the effects of the Covid-19 outbreak on financial markets and the economy continue for an extended period of time, the Funds’ future financial and investment results may be adversely affected.
9. Concentration of Ownership. From time to time, a Fund may have a concentration of one or more accounts constituting a significant percentage of shares outstanding. Investment activities by holders of such accounts could have material impacts on the Funds. As of September 30, 2020, based on management’s evaluation of the shareholder account base, the Funds had accounts representing controlling ownership of more than 5% of the Fund’s total outstanding shares. The number of such accounts, based on accounts that represent more than 5% of an individual class of shares, and the aggregate percentage of net assets represented by such holdings were as follows:
| | | | | | | | |
Fund | | Number of 5%
Account Holders | | | Percentage of
Ownership | |
High Income Opportunities Fund | | | 3 | | | | 92.35% | |
Securitized Asset Fund | | | 4 | | | | 97.45% | |
Omnibus shareholder accounts for which Natixis Advisors understands that the intermediary has discretion over the underlying shareholder accounts or investment models where a shareholder account may be invested for a non-discretionary customer are included in the table above.
10. Capital Shares. Each Fund may issue an unlimited number of shares of beneficial interest, without par value. Transactions in capital shares were as follows:
| | | | | | | | | | | | | | | | |
| | | High Income Opportunities Fund | |
| | |
| | | Year Ended
September 30, 2020 | | | Year Ended
September 30, 2019 | |
| | | | |
| Institutional Class | | Shares | | | Amount | | | Shares | | | Amount | |
Issued from the sale of shares | | | 13,827,277 | | | $ | 135,298,503 | | | | 5,368,732 | | | $ | 55,556,767 | |
Issued in connection with the reinvestment of distributions | | | 557,919 | | | | 5,643,632 | | | | 593,934 | | | | 6,147,496 | |
Redeemed | | | (6,262,810 | ) | | | (63,706,576 | ) | | | (2,346,806 | ) | | | (24,360,847 | ) |
| | | | | | | | | | | | | | | | |
Increase from capital share transactions | | | 8,122,386 | | | $ | 77,235,559 | | | | 3,615,860 | | | $ | 37,343,416 | |
| | | | | | | | | | | | | | | | |
| |
| | | Securitized Asset Fund | |
| | |
| | | Year Ended
September 30, 2020 | | | Year Ended
September 30, 2019 | |
| | | | |
| Institutional Class | | Shares | | | Amount | | | Shares | | | Amount | |
Issued from the sale of shares | | | 60,284,606 | | | $ | 590,577,942 | | | | 32,004,897 | | | $ | 312,974,724 | |
Issued in connection with the reinvestment of distributions | | | 2,080,565 | | | | 20,316,755 | | | | 1,503,724 | | | | 14,632,987 | |
Redeemed | | | (33,407,601 | ) | | | (325,523,746 | ) | | | (27,921,888 | ) | | | (271,724,679 | ) |
| | | | | | | | | | | | | | | | |
Increase from capital share transactions | | | 28,957,570 | | | $ | 285,370,951 | | | | 5,586,733 | | | $ | 55,883,032 | |
| | | | | | | | | | | | | | | | |
57 |
Report of Independent Registered Public Accounting Firm
To the Board of Trustees of Loomis Sayles Funds I and Shareholders of Loomis Sayles High Income Opportunities Fund and Loomis Sayles Securitized Asset Fund:
Opinions on the Financial Statements
We have audited the accompanying statements of assets and liabilities, including the portfolios of investments, of Loomis Sayles High Income Opportunities Fund and Loomis Sayles Securitized Asset Fund (two of the funds constituting Loomis Sayles Funds I, hereafter collectively referred to as the “Funds”) as of September 30, 2020, the related statements of operations for the year ended September 30, 2020, the statements of changes in net assets for each of the two years in the period ended September 30, 2020, including the related notes, and the financial highlights for each of the five years in the period ended September 30, 2020 (collectively referred to as the “financial statements”). In our opinion, the financial statements present fairly, in all material respects, the financial position of each of the Funds as of September 30, 2020, the results of each of their operations for the year then ended, the changes in each of their net assets for each of the two years in the period ended September 30, 2020 and each of the financial highlights for each of the five years in the period ended September 30, 2020 in conformity with accounting principles generally accepted in the United States of America.
Basis for Opinions
These financial statements are the responsibility of the Funds’ management. Our responsibility is to express an opinion on the Funds’ financial statements based on our audits. We are a public accounting firm registered with the Public Company Accounting Oversight Board (United States) (PCAOB) and are required to be independent with respect to the Funds in accordance with the U.S. federal securities laws and the applicable rules and regulations of the Securities and Exchange Commission and the PCAOB.
We conducted our audits of these financial statements in accordance with the standards of the PCAOB. Those standards require that we plan and perform the audit to obtain reasonable assurance about whether the financial statements are free of material misstatement, whether due to error or fraud.
Our audits included performing procedures to assess the risks of material misstatement of the financial statements, whether due to error or fraud, and performing procedures that respond to those risks. Such procedures included examining, on a test basis, evidence regarding the amounts and disclosures in the financial statements. Our audits also included evaluating the accounting principles used and significant estimates made by management, as well as evaluating the overall presentation of the financial statements. Our procedures included confirmation of securities owned as of September 30, 2020 by correspondence with the custodian, agent banks and brokers; when replies were not received from brokers, we performed other auditing procedures. We believe that our audits provide a reasonable basis for our opinions.
/s/PricewaterhouseCoopers LLP
Boston, Massachusetts
November 20, 2020
We have served as the auditor of one or more investment companies in the Natixis Investment Company Complex since at least 1995. We have not determined the specific year we began serving as auditor.
| 58
2020 U.S. Tax Distribution Information to Shareholders (Unaudited)
Corporate Dividends Received Deduction. For the fiscal year ended September 30, 2020, a percentage of dividends distributed by the Fund listed below qualifies for the dividends received deduction for corporate shareholders. This percentage is as follows:
| | | | |
Fund | | Qualifying Percentage | |
High Income Opportunities Fund | | | 0.46% | |
Qualified Dividend Income. For the fiscal year ended September 30, 2020, the Fund below will designate up to the maximum amount allowable pursuant to the Internal Revenue Code as qualified dividend income eligible for reduced tax rates. These lower rates range from 0% to 20% depending on an individual’s tax bracket. If the Fund pays a distribution during calendar year 2020, complete information will be reported in conjunction with Form 1099-DIV.
| | | | |
Fund | | | |
High Income Opportunities Fund | | | | |
59 |
Trustee and Officer Information
The tables below provide certain information regarding the trustees and officers of Loomis Sayles Funds I (the “Trust”). Unless otherwise indicated, the address of all persons below is 888 Boylston Street, Suite 800, Boston, MA 02199-8197. The Funds’ Statement of Additional Information includes additional information about the trustees of the Trust and is available by calling Loomis Sayles Funds at 800-633-3330.
| | | | | | | | |
| Name and Year of Birth | | Position(s)
Held with
the Trust, Length
of Time Served and
Term of Office1 | | Principal Occupation(s)
During Past 5 Years | | Number of Portfolios in
Fund Complex Overseen2
and Other Directorships
Held During
Past 5 Years | | Experience,
Qualifications,
Attributes, Skills
for Board
Membership |
| | |
Independent Trustees | | | | |
Kenneth A. Drucker (1945) | | Chairperson of the Board of Trustees since January 2017 Trustee since 2008 Ex Officio member of Audit Committee, Contract Review Committee and Governance Committee | | Retired | | 54 None | | Significant experience on the Board and on the boards of other business organizations (including at investment companies); executive experience (including as treasurer of an aerospace, automotive, and metal manufacturing corporation) |
| | | | |
Edmond J. English (1953) | | Trustee since 2013 Chairperson of Governance Committee and Audit Committee Member | | Executive Chairman of Bob’s Discount Furniture (retail) | | 54 Director, Burlington Stores, Inc. (retail) | | Significant experience on the Board and on the boards of other business organizations (including retail companies and a bank); executive experience (including at a retail company) |
| | | | |
Richard A. Goglia (1951) | | Trustee since 2015 Contract Review Committee Member and Governance Committee Member | | Retired | | 54 Director of Triumph Group (aerospace industry) | | Significant experience on the Board and executive experience (including his role as vice president and treasurer of a defense company and experience at a financial services company) |
| | | | |
Wendell J. Knox (1948) | | Trustee since 2009 Chairperson of Contract Review Committee | | Retired | | 54 Director of Abt Associates Inc. (research and consulting); Director, The Hanover Insurance Group (property and casualty insurance); formerly, Director, Eastern Bank (bank) | | Significant experience on the Board and on the boards of other business organizations (including at a bank and at a property and casualty insurance firm); executive experience (including roles as president and chief executive officer of a research and consulting company) |
| | | | |
Martin T. Meehan (1956) | | Trustee since 2012 Audit Committee Member | | President, University of Massachusetts | | 54 None | | Significant experience on the Board and on the boards of other business organizations; experience as President of the University of Massachusetts; government experience (including as a member of the U.S. House of Representatives); academic experience |
| 60
| | | | | | | | |
| Name and Year of Birth | | Position(s)
Held with
the Trust, Length
of Time Served and
Term of Office1 | | Principal Occupation(s)
During Past 5 Years | | Number of Portfolios in
Fund Complex Overseen2
and Other Directorships
Held During
Past 5 Years | | Experience,
Qualifications,
Attributes, Skills
for Board
Membership |
Maureen B. Mitchell (1951) | | Trustee since 2017 Contract Review Committee Member and Governance Committee Member | | Retired; formerly President, Global Sales and Marketing, GE Asset Management, Inc. (financial services) | | 54 Director, Sterling Bancorp (bank) | | Experience on the Board; financial services industry and executive experience (including role as president of global sales and marketing at a financial services company) |
| | | | |
James P. Palermo (1955) | | Trustee since 2016 Contract Review Committee Member | | Founding Partner, Breton Capital Management, LLC (private equity); Partner, STEP Partners, LLC (private equity) | | 54 Director, FutureFuel.io (chemicals and biofuels) | | Experience on the Board; financial services industry and executive experience (including roles as chief executive officer of client management and asset servicing for a banking and financial services company) |
| | | | |
Erik R. Sirri (1958) | | Trustee since 2009 Audit Committee Member | | Professor of Finance at Babson College | | 54
None | | Significant experience on the Board; experience as Director of the Division of Trading and Markets at the Securities and Exchange Commission; academic experience; training as an economist |
| | | | |
Peter J. Smail (1952) | | Trustee since 2009 Audit Committee Member and Governance Committee Member | | Retired | | 54
None | | Significant experience on the Board; mutual fund industry and executive experience (including roles as president and chief executive officer for an investment adviser) |
| | | | |
Kirk A. Sykes (1958) | | Trustee since 2019 Contract Review Committee Member | | Managing Director of Accordia Partners, LLC (real estate development); President of Primary Corporation (real estate development); Managing Principal of Merrick Capital Partners (infrastructure finance); formerly, President of Urban Strategy America Fund (real estate fund manager) | | 54
Trustee, Eastern Bank (bank); formerly Director, Ares Commercial Real Estate Corporation (real estate investment trust) | | Experience on the Board and significant experience on the boards of other business organizations (including real estate companies and banks) |
| | | | |
Cynthia L. Walker (1956) | | Trustee since 2005 Chairperson of the Audit Committee and Governance Committee Member | | Deputy Dean for Finance and Administration, Yale University School of Medicine | | 54
None | | Significant experience on the Board; executive experience in a variety of academic organizations (including roles as dean for finance and administration) |
61 |
| | | | | | | | |
| Name and Year of Birth | | Position(s)
Held with
the Trust, Length
of Time Served and
Term of Office1 | | Principal Occupation(s)
During Past 5 Years | | Number of Portfolios in
Fund Complex Overseen2
and Other Directorships
Held During
Past 5 Years | | Experience,
Qualifications,
Attributes, Skills
for Board
Membership |
| | | |
Interested Trustees | | | | | | |
Kevin P. Charleston3 (1965) One Financial Center Boston, MA 02111 | | Trustee since 2015 President and Chief Executive Officer since 2015 | | President, Chief Executive Officer and Chairman of the Board of Directors; formerly, Chief Financial Officer, Loomis, Sayles & Company, L.P. | | 54
None | | Significant experience on the Board; continuing service as President, Chief Executive Officer and Chairman of the Board of Directors of Loomis, Sayles & Company, L.P. |
| | | | |
David L. Giunta4 (1965) | | Trustee since 2011 Executive Vice President since 2008 | | President and Chief Executive Officer, Natixis Advisors, L.P., Natixis Distribution, L.P., Natixis Distribution Corporation and Chairman of the Board of Natixis Distribution Corporation | | 54
None | | Significant experience on the Board; experience as President and Chief Executive Officer of Natixis Advisors, L.P., Natixis Distribution, L.P., Natixis Distribution Corporation and Chairman of the Board of Natixis Distribution Corporation |
| 1 | Each trustee serves until retirement, resignation or removal from the Board. The current retirement age is 75. The position of Chairperson of the Board is appointed for a three-year term. Mr. Drucker was appointed to serve an additional one year term as the Chairperson of the Board on June 12, 2019. |
| 2 | The trustees of the Trust serve as trustees of a fund complex that includes all series of the Trust, Natixis Funds Trust I, Natixis Funds Trust II, Natixis Funds Trust IV, Gateway Trust, Loomis Sayles Funds II, Natixis ETF Trust and Natixis ETF Trust II (collectively, the “Fund Complex”). |
| 3 | Mr. Charleston is deemed an “interested person” of the Trust because he holds the following positions with an affiliated person of the Trust: President, Chief Executive Officer and Chairman of the Board of Directors of Loomis, Sayles & Company, L.P. |
| 4 | Mr. Giunta is deemed an “interested person” of the Trust because he holds the following positions with an affiliated person of the Trust: President and Chief Executive Officer, Natixis Advisors, L.P., Natixis Distribution, L.P., Natixis Distribution Corporation and Chairman of the Board of Natixis Distribution Corporation. |
| | | | | | |
| Name and Year of Birth | | Position(s)
Held with
the Trust | | Term of Office1
and Length of
Time Served | | Principal Occupation(s)
During Past 5 Years2 |
|
Officers of the Trust |
Daniel J. Fuss (1933) One Financial Center Boston, MA 02111 | | Executive Vice President | | Since 2003 | | Vice Chairman and Director, Loomis, Sayles & Company, L.P. |
| | | |
Russell L. Kane (1969) | | Secretary, Clerk and Chief Legal Officer Chief Compliance Officer and Anti-Money Laundering Officer | | Since 2016 Since 2020 | | Executive Vice President, General Counsel, Secretary and Clerk, Natixis Distribution Corporation, Natixis Advisors, L.P. and Natixis Distribution, L.P.; formerly, Chief Compliance Officer for Mutual Funds, Senior Vice President, Deputy General Counsel, Assistant Secretary and Assistant Clerk, Natixis Distribution Corporation, Natixis Advisors, L.P. and Natixis Distribution, L.P. |
| | | |
Michael C. Kardok (1959) | | Treasurer, Principal Financial and Accounting Officer | | Since 2004 | | Senior Vice President, Natixis Advisors, L.P. and Natixis Distribution, L.P. |
| 1 | Each officer of the Trust serves for an indefinite term in accordance with the Trust’s current by-laws until the date his or her successor is elected and qualified, or until he or she sooner dies, retires, is removed or becomes disqualified. |
| 2 | Each person listed above, except as noted, holds the same position(s) with the Fund Complex. Previous positions during the past five years with Natixis Distribution, L.P., Natixis Advisors, L.P. or Loomis, Sayles & Company, L.P. are omitted, if not materially different from an officer’s current position with such entity. |
| 62

Loomis Sayles Bond Fund
Annual Report
September 30, 2020
IMPORTANT NOTICE TO SHAREHOLDERS
Beginning on January 1, 2021, as permitted by regulations adopted by the Securities and Exchange Commission, paper copies of shareholder reports like this one will no longer be sent by mail, unless you specifically request paper copies of the reports from the Fund or from your financial intermediary, such as a broker-dealer or bank. Instead, the reports will be made available on the Funds’ website, and you will be notified by mail each time a report is posted and provided with a website link to access the report. If you wish to continue receiving paper copies of your shareholder reports after January 1, 2021, you can inform the Fund at any time by calling 1-800-633-3330. If you hold your account with a financial intermediary and you wish to continue receiving paper copies after January 1, 2021, you should call your financial intermediary directly. Paper copies are provided free of charge, and your election to receive reports in paper will apply to all funds held with the Natixis Funds complex. If you have already elected to receive shareholder reports electronically, you will not be affected by this change and you need not take any action. You currently may elect to receive shareholder reports and other communications from the Fund or your financial intermediary electronically at www.icsdelivery.com/loomissayles.
LOOMIS SAYLES BOND FUND
| | | | |
| Managers | | Symbols | | |
| Matthew J. Eagan, CFA® | | Institutional Class | | LSBDX |
| Daniel J. Fuss, CFA®, CIC | | Retail Class | | LSBRX |
| Brian P. Kennedy | | Admin Class | | LBFAX |
| Elaine M. Stokes | | Class N | | LSBNX |
Investment Objective
The Fund’s investment objective is high total investment return through a combination of current income and capital appreciation.
Market Conditions
The financial markets experienced significant volatility in the past year, as investors grappled with the uncertainty surrounding Covid-19. The bulk of the market disruptions occurred in February and March, when world governments first aimed to contain the virus by locking down broad swaths of their economies. Higher-risk assets were hit hard in the ensuing selloff, while demand for lower-risk investments surged. The US Federal Reserve (Fed) sought to counter the extraordinary developments by cutting the Fed Funds Rate to zero and reinstituting Quantitative Easing through the purchases of Treasuries and mortgage-backed securities. It revived lending facilities last used in 2008, such as the TALF (Term Asset-Backed Securities Loan Facility), which is a funding backdrop for the ABS (asset-backed securities) market. It even established facilities never used before, such as the Corporate Credit Facilities, which allowed the Fed to purchase corporate bond assets for the first time in its history. In conjunction with a $2.2 trillion stimulus package passed by the US Congress, the Fed’s response fueled an impressive recovery in higher-risk assets from late-March onward.
The uncertain environment worked to the benefit of US Treasuries due to their status as a relative “safe haven.” Longer duration bonds delivered particularly robust gains. The yield on the 10-year note fell to an all-time low in March and remained close to that level thereafter on expectations that the Fed would pursue its low-rate policy indefinitely. (Prices and yields move in opposite directions.)
Investment grade corporates were notable beneficiaries of rising risk appetite and investors’ demand for high-quality alternatives to low-yielding government debt. Despite their downturn in the February-March selloff, corporates outperformed the broader fixed-income market for the full, 12-month period.
High yield corporate bonds also delivered positive returns. The category was supported by hopes for an economic recovery, reduced investor risk aversion and accommodative fiscal and monetary policy. However, high yield issues trailed investment-grade securities. Lower-quality debt was generally harder hit in the downturn due to lower market liquidity and the effect of falling oil prices, which weighed on the asset class’ return for the full period.
1 |
Securitized assets — including mortgage-backed securities, asset-backed securities and commercial mortgage backed securities — lagged Treasuries and investment grade corporates, but they nonetheless posted a solid total return thanks to their rally in the second half of the period.
Emerging market bonds also gained ground despite the slowdown in global growth. The asset class was boosted by the combination of investors’ thirst for yield and the pronounced weakness in the US dollar from April through August.
Portfolio Results
For the 12 months ended September 30, 2020, Institutional Class shares of the Loomis Sayles Bond Fund returned -0.73% at net asset value. The Fund underperformed its benchmark, the Bloomberg Barclays U.S. Government/Credit Bond Index, which returned 8.03%.
Explanation of Fund Performance
The past year has been defined by the widespread impact of the Covid-19 global pandemic. After an extremely turbulent first quarter of 2020, markets snapped back amidst unprecedented central bank actions, lifting of lockdowns and promising news of a potential vaccine. The majority of the Fund’s underperformance was generated in the first quarter of 2020. Performance has since improved as markets rebounded, though not enough to offset the earlier experienced losses. Security selection was the primary source of underperformance. The Fund’s shorter-than-benchmark positioning with respect to duration (and corresponding interest rate sensitivity) also weighed on return as interest rates declined during the period. Exposure to high yield corporate credit had the largest negative impact on relative performance, driven by holdings in the energy sector; energy exposure within convertible securities lagged as well. An allocation to equities, particularly in communications and consumer cyclical names, detracted from returns. An allocation to non-US-dollar-denominated issues weighed on return, with holdings in the Mexican peso, Canadian dollar and Brazilian real as the main detractors. Additionally, an underweight to US Treasuries and holdings in cash reserves constrained performance.
Positive contributors to relative performance for the 12 months included underweight allocations to both investment grade and emerging market corporate credit.
Outlook
At this time of writing, which is the end of September 2020, economic and financial market conditions have continued to show encouraging signs of improvement, though the outlook remains uncertain. The Fed has provided forward guidance that helps ensure monetary policy can remain accommodative for the foreseeable future, which appears to be boosting business and consumer confidence and keeping investor risk appetite strong going into the final quarter of the year. We also believe it is still possible for a limited agreement to be reached that extends the fiscal stimulus package and provides further support to the economy, though ongoing debate by lawmakers on the size and scale of the
LOOMIS SAYLES BOND FUND
package has been causing increased anxiety among investors as we get closer to the US election. We continue to assess the immediate and longer-term impacts of the pandemic on the economy, but currently expect a slow and uneven pace of recovery.
The global economy has been showing signs of improvement, with stronger levels of manufacturing and services purchasing manager data in the third quarter of 2020. This trend could continue should our forecasts be accurate for profit growth, gains in employment and a better managed second wave of the virus. We do believe that the economy can normalize with a successful distribution of a vaccine early next year, though a full recovery in GDP growth is not expected in the near term.
We increased our credit exposure during the dislocation in the credit markets earlier this year. We have maintained our allocation to credit with the view that we have entered the credit repair phase of the credit cycle1, exiting from the downturn/recessionary phase. This phase of the cycle is typically characterized by balance sheet improvement, better liquidity conditions and tightening spread levels. We believe this phase could potentially provide attractive returns for fixed income investors.
Valuations in the corporate bond sectors have been less compelling following the strong credit rally that has unfolded since the end of March. However, we believe the low global interest rate environment will likely continue to drive the search for yield and help provide a positive technical backdrop for both investment grade and high yield corporate debt. Also, we have been active and selective in new issues throughout the year, and will continue to look for opportunities in the primary market. The effects of the pandemic have created a need for many companies, across industries, to access capital for liquidity purposes and to potentially refinance debt, a credit positive. New issues generally come at a premium (higher yield than the existing debt of the issuer) to attract investors. Harvesting this new issue “premium” can potentially be an attractive and persistent source of excess return. Recently, there have been modest signs of slowing issuance, given market concerns and some risk aversion. New issuance can provide added liquidity and the ability to extend maturities. However, it can also increase the overall debt level of an issuer. While economic conditions have been improving, the recovery has been uneven and varies by sector. We are still monitoring the potential for fallen angels with expectations for more to possibly occur in specific areas, including consumer cyclical, lodging & leisure, retailers and restaurants. We think default rate risk and fallen angel activity will likely be more moderate than what was experienced in the spring of this year, and there is opportunity to add value in the credit sectors with good security selection.
As we approach the end of 2020, we believe our portfolios are well-positioned to generate excess return potential. We have remained focused on areas where investors are mispricing risk while following our disciplined, value-oriented approach to portfolio construction, a process rooted in fundamental credit analysis and a long-term view of the market.
| 1 | | A credit cycle is a cyclical pattern that follows credit availability and corporate health. |
During periods in which the US dollar appreciates relative to foreign currencies, Funds that hold non-US dollar-denominated bonds may realize currency losses in connection with the maturity or sale of certain bonds. These realized losses will impact some or all of a Fund’s ordinary income distributions (to the extent that losses are not offset by realized currency gains within the Fund’s fiscal year). A recognized currency loss, in accordance with federal tax rules, decreases the amount of ordinary income a Fund has available to distribute, even though these bonds continue to generate coupon income.
Fund officers have analyzed the Fund’s current portfolio of investments, realized currency gains and losses, schedule of maturities, and the corresponding amounts of unrealized currency losses that may become realized during the current fiscal year. This analysis is performed regularly to determine how realized currency losses may impact periodic ordinary income distributions for the Fund. Based on the most recent quarterly analysis (as of September 30, 2020), Fund officers believe that realized currency losses will have an impact on some of the distributions in the 2021 fiscal year. This analysis is based on certain assumptions including, but not limited to, the level of foreign currency exchange rates, security prices, interest rates, the fund advisers’ ability to manage realized currency losses, and the net asset level of the Fund. Changes to these assumptions could materially impact the analysis and the amounts of future Fund distributions. Fund officers will continue to monitor these amounts on a regular basis and take the necessary actions required to manage the Fund’s distributions to address realized currency losses while seeking to avoid a return of capital distribution.
Hypothetical Growth of $100,000 Investment in Institutional Class Shares
September 30, 2010 through September 30, 20202
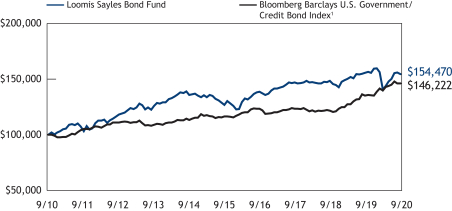
See notes to charts on page 5.
LOOMIS SAYLES BOND FUND
Average Annual Total Returns — September 30, 20202
| | | | | | | | | | | | | | | | | | | | | | | | |
| | | | | | | | | | | | | | | Expense Ratios3 | |
| | | 1 Year | | | 5 Years | | | 10 Years | | | Life of
Class N | | | Gross | | | Net | |
| | | | | | | |
Institutional Class
(Inception 5/16/91) | | | -0.73 | % | | | 4.00 | % | | | 4.45 | % | | | — | % | | | 0.67 | % | | | 0.67 | % |
| | | | | | | |
Retail Class
(Inception 12/31/96) | | | -0.99 | | | | 3.74 | | | | 4.17 | | | | — | | | | 0.92 | | | | 0.92 | |
| | | | | | | |
Admin Class
(Inception 1/2/98) | | | -1.24 | | | | 3.48 | | | | 3.91 | | | | — | | | | 1.17 | | | | 1.17 | |
Class N
(Inception 2/1/13) | | | -0.66 | | | | 4.06 | | | | — | | | | 2.96 | | | | 0.59 | | | | 0.59 | |
| | | | | | | |
| Comparative Performance | | | | | | | | | | | | | | | | | | | | | | | | |
| Bloomberg Barclays U.S. Government/Credit Bond Index1 | | | 8.03 | | | | 4.66 | | | | 3.87 | | | | 3.72 | | | | | | | | | |
Performance data shown represents past performance and is no guarantee of, and not necessarily indicative of, future results. Total return and value will vary, and you may have a gain or loss when shares are sold. Current performance may be lower or higher than quoted. For most recent month-end performance, visit loomissayles.com. Performance for other share classes will be greater or less than shown based on differences in fees and sales charges. You may not invest directly in an index. Performance for periods less than one year is cumulative, not annualized. Returns reflect changes in share price and reinvestment of dividends and capital gains, if any. The table(s) do not reflect taxes shareholders might owe on any fund distributions or when they redeem their shares.
| 1 | | Bloomberg Barclays U.S. Government/Credit Bond Index is the non-securitized component of the U.S. Aggregate Index and was the first macro index launched by Barclays Capital. The U.S. Government/Credit Bond Index includes investment grade, U.S. dollar-denominated, fixed rate Treasuries (i.e., public obligations of the U.S. Treasury that have remaining maturities of more than one year), government-related issues (i.e., agency, sovereign, supranational, and local authority debt), and corporate securities. The U.S. Government/Credit Index was launched on January 1, 1979, with index history backfilled to 1973, and is a subset of the U.S. Aggregate Index. |
| 2 | | Fund performance has been increased by fee waivers and/or expense reimbursements, if any, without which performance would have been lower. |
| 3 | | Expense ratios are as shown in the Fund’s prospectus in effect as of the date of this report. The expense ratios for the current reporting period can be found in the Financial Highlights section of this report under Ratios to Average Net Assets. Net expenses reflect contractual expense limitations set to expire on 1/31/21. When a Fund’s expenses are below the limitation, gross and net expense ratios will be the same. See Note 5 of the Notes to Financial Statements for more information about the Fund’s expense limitations. |
ADDITIONAL INFORMATION
The views expressed in this report reflect those of the portfolio managers as of the dates indicated. The managers’ views are subject to change at any time without notice based on changes in market or other conditions. References to specific securities or industries should not be regarded as investment advice. Because the Fund is actively managed, there is no assurance that they will continue to invest in the securities or industries mentioned.
All investing involves risk, including the risk of loss. There is no assurance that any investment will meet its performance objectives or that losses will be avoided.
Additional Index Information
This document may contain references to third party copyrights, indexes, and trademarks, each of which is the property of its respective owner. Such owner is not affiliated with Natixis Investment Managers or any of its related or affiliated companies (collectively “Natixis Affiliates”) and does not sponsor, endorse or participate in the provision of any Natixis Affiliates services, funds or other financial products.
The index information contained herein is derived from third parties and is provided on an “as is” basis. The user of this information assumes the entire risk of use of this information. Each of the third party entities involved in compiling, computing or creating index information disclaims all warranties (including, without limitation, any warranties of originality, accuracy, completeness, timeliness, non-infringement, merchantability and fitness for a particular purpose) with respect to such information.
Proxy Voting Information
A description of the Fund’s proxy voting policies and procedures is available without charge upon request, by calling Loomis Sayles Funds at 800-633-3330; on the Fund’s website at www.loomissayles.com, and on the Securities and Exchange Commission’s (“SEC’s”) website at www.sec.gov. Information about how the Fund voted proxies relating to portfolio securities during the most recent 12-month period ended June 30 is available on the Fund’s website and the SEC’s website.
Quarterly Portfolio Schedules
The Fund files a complete schedule of portfolio holdings with the SEC for the first and third quarters of each fiscal year as an exhibit on Form N-PORT. The Fund’s Form N-PORT is available on the SEC’s website at www.sec.gov.
CFA® and Chartered Financial Analyst® are registered trademarks owned by the CFA Institute.
UNDERSTANDING YOUR FUND’S EXPENSES
As a mutual fund shareholder you incur two types of costs: (1) transaction costs, and (2) ongoing costs, including management fees, distribution and/or service fees (12b-1 fees), and other fund expenses. Certain exemptions may apply. These costs are described in more detail in the Fund’s prospectus. The following examples are intended to help you understand the ongoing costs of investing in the Fund and help you compare these with the ongoing costs of investing in other mutual funds.
The first line in the table for each class of Fund shares shows the actual amount of Fund expenses you would have paid on a $1,000 investment in the Fund from April 1, 2020 through September 30, 2020. To estimate the expenses you paid over the period, simply divide your account value by $1,000 (for example $8,600 account value divided by $1,000 = 8.6) and multiply the result by the number in the Expenses Paid During Period column as shown below for your class.
The second line in the table for each class of Fund shares provides information about hypothetical account values and hypothetical expenses based on the Fund’s actual expense ratios and an assumed rate of return of 5% per year before expenses, which is not the Fund’s actual return. The hypothetical account values and expenses may not be used to estimate the actual ending account balance or expenses you paid on your investment for the period. You may use this information to compare the ongoing costs of investing in the Fund to other funds. To do so, compare this 5% hypothetical example with the 5% hypothetical examples that appear in the shareholder reports of the other funds.
Please note that the expenses shown reflect ongoing costs only, and do not include any transaction costs. Therefore, the second line in the table is useful in comparing ongoing costs only, and will not help you determine the relative costs of owning different funds. If transaction costs were included, total costs would be higher.
Loomis Sayles Bond Fund
| | | | | | | | | | | | |
| Institutional Class | | Beginning
Account Value
4/1/2020 | | | Ending
Account Value
9/30/2020 | | | Expenses Paid
During Period*
4/1/2020 – 9/30/2020 | |
Actual | | | $1,000.00 | | | | $1,098.60 | | | | $3.52 | |
Hypothetical (5% return before expenses) | | | $1,000.00 | | | | $1,021.65 | | | | $3.39 | |
| | | |
Retail Class | | | | | | | | | |
Actual | | | $1,000.00 | | | | $1,096.80 | | | | $4.82 | |
Hypothetical (5% return before expenses) | | | $1,000.00 | | | | $1,020.40 | | | | $4.65 | |
| | | |
Admin Class | | | | | | | | | |
Actual | | | $1,000.00 | | | | $1,094.90 | | | | $6.13 | |
Hypothetical (5% return before expenses) | | | $1,000.00 | | | | $1,019.15 | | | | $5.91 | |
| | | |
Class N | | | | | | | | | |
Actual | | | $1,000.00 | | | | $1,098.20 | | | | $3.15 | |
Hypothetical (5% return before expenses) | | | $1,000.00 | | | | $1,022.00 | | | | $3.03 | |
|
* Expenses are equal to the Fund’s annualized expense ratio: 0.67%, 0.92%, 1.17% and 0.60% for Institutional Class, Retail Class, Admin Class and Class N, respectively, multiplied by the average account value over the period, multiplied by the number of days in the most recent fiscal half-year (183), divided by 366 (to reflect the half-year period). | |
BOARD APPROVAL OF THE EXISTING ADVISORY AGREEMENT
The Board of Trustees of the Trust (the “Board”), including the Independent Trustees, considers matters bearing on the Fund’s advisory agreement (the “Agreement”) at most of its meetings throughout the year. Each year, usually in the spring, the Contract Review Committee of the Board meets to review the Agreement to determine whether to recommend that the full Board approve the continuation of the Agreement, typically for an additional one-year period. After the Contract Review Committee has made its recommendation, the full Board, including the Independent Trustees, determines whether to approve the continuation of the Agreement.
In connection with these meetings, the Trustees receive materials that the Fund’s investment adviser (the “Adviser”) believes to be reasonably necessary for the Trustees to evaluate the Agreement. These materials generally include, among other items, (i) information on the investment performance of the Fund and the performance of a peer group of funds and the Fund’s performance benchmark, (ii) information on the Fund’s advisory fee and other expenses, including information comparing the Fund’s advisory fee to the fees charged to institutional accounts with similar strategies managed by the Adviser, if any, and to those of a peer group of funds and information about any applicable expense caps and/or fee “breakpoints,” (iii) sales and redemption data in respect of the Fund, (iv) information about the profitability of the Agreement to the Adviser and (v) information obtained through the completion by the Adviser of a questionnaire distributed on behalf of the Trustees. The Board, including the Independent Trustees, also considers other matters such as (i) the Fund’s investment objective and strategies and the size, education and experience of the Adviser’s investment staff and its use of technology, external research and trading cost measurement tools, (ii) arrangements in respect of the distribution of the Fund’s shares and the related costs, (iii) the allocation of the Fund’s brokerage, if any, including, to the extent applicable, the use of “soft” commission dollars to pay for research and other similar services, (iv) the Adviser’s policies and procedures relating to, among other things, compliance, trading and best execution, proxy voting and valuation, (v) information about amounts invested by the Fund’s portfolio managers in the Fund or in similar accounts that they manage and (vi) the general economic outlook with particular emphasis on the mutual fund industry. Throughout the process, the Trustees are afforded the opportunity to ask questions of and request additional materials from the Adviser.
In addition to the materials requested by the Trustees in connection with their annual consideration of the continuation of the Agreement, the Trustees receive materials in advance of each regular quarterly meeting of the Board that provide detailed information about the Fund’s investment performance and the fees charged to the Fund for advisory and other services. This information generally includes, among other things, an internal performance rating for the Fund based on agreed-upon criteria, graphs showing the Fund’s performance and expense differentials against the Fund’s peer group/category, performance ratings provided by a third-party, total return information for various periods, and third-party performance rankings for various periods comparing the Fund against similarly
categorized funds. The portfolio management team for the Fund or other representatives of the Adviser make periodic presentations to the Contract Review Committee and/or the full Board, and if the Fund is identified as presenting possible performance concerns it may be subject to more frequent Board and Committee presentations and reviews. In addition, each quarter the Trustees are provided with detailed statistical information about the Fund’s portfolio. The Trustees also receive periodic updates between meetings. These updates have increased in frequency during the Covid-19 crisis.
The Board most recently approved the continuation of the Agreement for a one-year period at its meeting held in June 2020. In considering whether to approve the continuation of the Agreement, the Board, including the Independent Trustees, did not identify any single factor as determinative. Individual Trustees may have evaluated the information presented differently from one another, giving different weights to various factors. Matters considered by the Trustees, including the Independent Trustees, in connection with their approval of the Agreement included, but were not limited to, the factors listed below.
The nature, extent and quality of the services provided to the Fund under the Agreement. The Trustees considered the nature, extent and quality of the services provided by the Adviser and its affiliates to the Fund and the resources dedicated to the Fund by the Adviser and its affiliates.
The Trustees considered not only the advisory services provided by the Adviser to the Fund, but also the monitoring and oversight services provided by Natixis Advisors, L.P. (“Natixis Advisors”). They also considered the administrative and shareholder services provided by Natixis Advisors and its affiliates to the Fund. They also took into consideration increases in the services provided resulting from new regulatory requirements.
The Trustees also considered the benefits to shareholders of investing in a mutual fund that is part of a family of funds that offers shareholders the right to exchange shares of one type of fund for shares of another type of fund, and provides a variety of fund and shareholder services.
After reviewing these and related factors, the Trustees concluded, within the context of their overall conclusions regarding the Agreement, that the nature, extent and quality of services provided supported the renewal of the Agreement.
Investment performance of the Fund and the Adviser. As noted above, the Trustees received information about the performance of the Fund over various time periods, including information that compared the performance of the Fund to the performance of a peer group and category of funds and the Fund’s performance benchmark. In addition, the Trustees reviewed data prepared by an independent third party that analyzed the performance of the Fund using a variety of performance metrics, including metrics that measured the performance of the Fund on a risk adjusted basis.
The Board noted that through December 31, 2019, the Fund’s one-, three- and five-year performance, stated as percentile rankings within categories selected by the independent third-party data provider, was as follows (where the best performance would be in the first percentile of its category):
| | | | | | | | | | | | |
| | | One-Year | | | Three-Year | | | Five-Year | |
Loomis Sayles Bond Fund | | | 39% | | | | 51% | | | | 79% | |
The Board noted that the Fund’s performance lagged that of the Fund’s category group median as determined by the independent third party for certain periods. The Board concluded that other factors relevant to performance supported renewal of the Agreement, including: (1) that the underperformance was attributable, to a significant extent, to investment decisions (such as security selection or sector allocation) by the Adviser that were reasonable and consistent with the Fund’s investment objective and policies; and (2) that the Fund’s shorter-term performance has been strong relative to its category. The Board also considered information about the Fund’s more recent performance, including how that performance had been impacted by the Covid-19 crisis.
The Trustees also considered the Adviser’s performance and reputation generally, the performance of the fund family generally, and the historical responsiveness of the Adviser to Trustee concerns about performance and the willingness of the Adviser to take steps intended to improve performance.
After reviewing these and related factors, the Trustees concluded, within the context of their overall conclusions regarding the Agreement, that the performance of the Fund and the Adviser and/or other relevant factors supported the renewal of the Agreement.
The costs of the services to be provided and profits to be realized by the Adviser and its affiliates from their respective relationships with the Fund. The Trustees considered the fees charged to the Fund for advisory and administrative services as well as the total expense level of the Fund. This information included comparisons (provided both by management and by an independent third party) of the Fund’s advisory fee and total expense level to those of its peer group and information about the advisory fees charged by the Adviser to comparable accounts (such as institutional separate accounts), as well as information about differences in such fees and the reasons for any such differences. In considering the fees charged to comparable accounts, the Trustees considered, among other things, management’s representations about the differences between managing mutual funds as compared to other types of accounts, including the additional resources required to effectively manage mutual fund assets, the greater regulatory costs associated with the management of such assets, and the entrepreneurial, regulatory and other risks associated with sponsoring and managing mutual funds. In evaluating the Fund’s advisory fee, the Trustees also took into account the demands, complexity and quality of the investment management of the Fund, as well as the need for the Adviser to offer competitive compensation and the potential need to expend additional resources to the extent the Fund grows in size. The Trustees considered that over the past several years, management had made recommendations regarding reductions in advisory fee rates, implementation of advisory fee breakpoints and the institution of advisory fee waivers and expense caps for various funds in the fund family. They noted that the Fund has an expense cap in place, and that the current
expenses are below the cap. They also considered the material terms of the Fund’s expense cap agreement. The Trustees further noted that the Fund’s total advisory fee rate was below the median of a peer group of funds.
The Trustees also considered the compensation directly or indirectly received by the Adviser and its affiliates from their relationships with the Fund. The Trustees reviewed information provided by management as to the profitability of the Adviser’s and its affiliates’ relationships with the Fund, and information about how expenses are determined and allocated for purposes of profitability calculations. They also reviewed information provided by management about the effect of distribution costs and changes in asset levels on Adviser profitability, including information regarding resources spent on distribution activities. When reviewing profitability, the Trustees also considered information about court cases in which adviser compensation or profitability were issues, the performance of the Fund, the expense levels of the Fund, whether the Adviser had implemented breakpoints and/or expense caps with respect to the Fund and the overall profit margin of Natixis Investment Managers compared to that of certain other investment managers for which such data was available.
After reviewing these and related factors, the Trustees concluded, within the context of their overall conclusions regarding the Agreement, that the advisory fee charged to the Fund was fair and reasonable, and that the costs of these services generally and the related profitability of the Adviser and its affiliates in respect of their relationships with the Fund supported the renewal of the Agreement.
Economies of Scale. The Trustees considered the existence of any economies of scale in the provision of services by the Adviser and whether those economies are shared with the Fund through breakpoints in its investment advisory fee or other means, such as expense caps. The Trustees also considered management’s explanation of the factors that are taken into account with respect to the implementation of breakpoints in investment advisory fees or expense caps. With respect to economies of scale, the Trustees noted that the Fund had breakpoints in its advisory fee and was subject to an expense cap. In considering these issues, the Trustees also took note of the costs of the services provided (both on an absolute and on a relative basis) and the profitability to the Adviser and its affiliates of their relationships with the Fund, as discussed above. The Trustees also considered that the Fund has benefitted from the substantial reinvestment the Adviser has made into its business.
After reviewing these and related factors, the Trustees concluded, within the context of their overall conclusions regarding the Agreement, that the extent to which economies of scale were shared with the Fund supported the renewal of the Agreement.
The Trustees also considered other factors, which included but were not limited to the following:
| • | | The effect of recent market and economic events, including but not limited to the Covid-19 crisis, on the performance, asset levels and expense ratios of the Fund. |
| • | | Whether the Fund has operated in accordance with its investment objective and the Fund’s record of compliance with its investment restrictions, and the compliance |
| | programs of the Fund and the Adviser. They also considered the compliance-related resources the Adviser and its affiliates were providing to the Fund. |
| • | | So-called “fallout benefits” to the Adviser, such as the engagement of affiliates of the Adviser to provide distribution and administrative services to the Fund, and the benefits of research made available to the Adviser by reason of brokerage commissions (if any) generated by the Fund’s securities transactions. The Trustees also considered the benefits to the parent company of Natixis Advisors from the retention of the Adviser. The Trustees considered the possible conflicts of interest associated with these fallout and other benefits, and the reporting, disclosure and other processes in place to disclose and monitor such possible conflicts of interest. |
| • | | The Trustees’ review and discussion of the Fund’s advisory arrangements in prior years, and management’s record of responding to Trustee concerns raised during the year and in prior years. |
Based on their evaluation of all factors that they deemed to be material, including those factors described above, and assisted by the advice of independent counsel, the Trustees, including the Independent Trustees, concluded that the existing Agreement should be continued through June 30, 2021.
LIQUIDITY RISK MANAGEMENT PROGRAM
Annual Report for the Period Commencing on December 1, 2018 and ending December 31, 2019 (including updates through September 30, 2020)
Effective December 1, 2018, the Fund adopted a liquidity risk management program (the “Program”) pursuant to the requirements of Rule 22e-4 under the Investment Company Act of 1940, as amended (the “Rule”). The Rule requires registered open-end funds, including mutual funds and exchange-traded funds to establish liquidity risk management programs in order to effectively manage fund liquidity and mitigate the risk that a fund could not meet redemption requests without significantly diluting the interests of remaining investors.
The rule requires the Fund to assess, manage and review its liquidity risk considering applicable factors during normal and foreseeable stressed conditions. In fulfilling this requirement, the Fund assesses and reviews (where applicable and amongst other matters) its investment strategy, portfolio holdings, possible investment concentrations, use of derivatives, short-term and long-term cash flow projections, use of cash and cash equivalents, as well as borrowing arrangements and other funding sources. The Program has established a Program Administrator which is the adviser of the Fund.
In accordance with the Program, the Fund’s portfolio investments are classified into one of four liquidity categories based on a determination of a reasonable expectation for how long it would take to convert the investment to cash (or sell or dispose of the investment) without significantly changing its market value.
The Fund is prohibited from acquiring an investment if, after the acquisition, its holdings of illiquid assets will exceed 15% of its net assets. If the Fund does not hold a majority of highly liquid investments in its portfolio, then the Fund is required to establish a highly liquid investment minimum (“HLIM”). Loomis Sayles Bond Fund has established an HLIM.
During the period from December 1, 2018 to December 31, 2019, there were no material changes to the Program and no material events that impacted the operation of the Fund’s Program. During the period, the Fund held sufficient liquid assets to meet redemptions on a timely basis and did not have any HLIM or illiquid security violations during the period.
During the period January 1, 2020 through September 30, 2020, the Fund held sufficient liquid assets to meet redemptions on a timely basis and did not have any HLIM or illiquid security violations.
Annual Program Assessment and Conclusion
In the opinion of the Program Administrator, the Program the Fund approved by the Fund’s Board has been implemented effectively. The Program Administrator has also monitored, assessed and managed the Fund’s liquidity risk regularly and has determined that the Program is operating effectively.
Pursuant to the Rule’s requirements, the Board has received and reviewed a written report prepared by the Fund’s Program Administrator that addressed the operation of the Program, assessed its adequacy and effectiveness and described any material changes made to the Program.
Portfolio of Investments – as of September 30, 2020
Loomis Sayles Bond Fund
| | | | | | | | |
Principal
Amount (‡) | | | Description | | Value (†) | |
|
| Bonds and Notes – 84.1% of Net Assets | |
|
| | Non-Convertible Bonds – 78.8% | |
| |
| | | | ABS Other – 0.3% | |
| $ | 21,324,711 | | | FAN Engine Securitization Ltd., Series 2013-1A, Class 1A, 4.625%, 10/15/2043, 144A(a)(b)(c) | | $ | 11,728,591 | |
| | 20,724,545 | | | GCA2014 Holdings Ltd., Series 2014-1, Class C, 6.000%, 1/05/2030, 144A(a)(b)(d)(e) | | | 6,980,856 | |
| | 9,318,741 | | | GCA2014 Holdings Ltd., Series 2014-1, Class D, 7.500%, 1/05/2030, 144A(a)(b)(d)(e) | | | 1,066,716 | |
| | 32,585,000 | | | GCA2014 Holdings Ltd., Series 2014-1, Class E, Zero Coupon, 1/05/2030, 144A(a)(b)(d)(e)(f) | | | — | |
| | 7,822,682 | | | Global Container Assets Ltd., Series 2015-1A, Class B, 4.500%, 2/05/2030, 144A(a)(b)(c) | | | 6,711,157 | |
| | | | | | | | |
| | | | | | | 26,487,320 | |
| | | | | | | | |
| |
| | | | Aerospace & Defense – 1.7% | |
| | 260,000 | | | Boeing Co. (The), 3.100%, 5/01/2026 | | | 259,361 | |
| | 560,000 | | | Boeing Co. (The), 3.250%, 2/01/2035 | | | 526,382 | |
| | 3,715,000 | | | Boeing Co. (The), 3.550%, 3/01/2038 | | | 3,384,138 | |
| | 45,000 | | | Boeing Co. (The), 3.625%, 3/01/2048 | | | 39,546 | |
| | 2,050,000 | | | Boeing Co. (The), 3.750%, 2/01/2050 | | | 1,870,646 | |
| | 1,200,000 | | | Boeing Co. (The), 3.850%, 11/01/2048 | | | 1,099,595 | |
| | 7,515,000 | | | Boeing Co. (The), 3.950%, 8/01/2059 | | | 6,803,053 | |
| | 26,680,000 | | | Bombardier, Inc., 6.000%, 10/15/2022, 144A | | | 24,745,700 | |
| | 1,510,000 | | | Bombardier, Inc., 7.350%, 12/22/2026, 144A, (CAD) | | | 834,262 | |
| | 11,844,000 | | | Bombardier, Inc., 7.450%, 5/01/2034, 144A | | | 8,738,148 | |
| | 10,075,000 | | | Bombardier, Inc., 7.875%, 4/15/2027, 144A | | | 7,641,283 | |
| | 4,055,000 | | | Embraer Netherlands Finance BV, 5.400%, 2/01/2027 | | | 3,850,223 | |
| | 10,576,000 | | | Leonardo U.S. Holdings, Inc., 6.250%, 1/15/2040, 144A | | | 12,023,431 | |
| | 10,821,000 | | | Leonardo U.S. Holdings, Inc., 7.375%, 7/15/2039, 144A | | | 13,437,626 | |
| | 328,000 | | | Leonardo U.S. Holdings, Inc., 7.375%, 7/15/2039 | | | 407,314 | |
| | 6,995,000 | | | Textron Financial Corp., 3-month LIBOR + 1.735%, 2.015%, 2/15/2067, 144A(g) | | | 4,863,344 | |
| | 9,030,000 | | | TransDigm, Inc., 5.500%, 11/15/2027 | | | 8,678,281 | |
| | 25,941,000 | | | TransDigm, Inc., 6.500%, 7/15/2024 | | | 25,876,147 | |
| | 400,000 | | | TransDigm, Inc., 7.500%, 3/15/2027 | | | 415,324 | |
| | 29,130,000 | | | TransDigm, Inc., 8.000%, 12/15/2025, 144A | | | 31,678,875 | |
| | | | | | | | |
| | | | | | | 157,172,679 | |
| | | | | | | | |
| |
| | | | Airlines – 1.4% | |
| | 29,160,000 | | | Air Canada Pass Through Trust, Series 2020-2A, 5.250%, 10/01/2030, 144A | | | 29,903,288 | |
| | 345,000 | | | American Airlines Group, Inc., 3.750%, 3/01/2025, 144A | | | 174,925 | |
| | 29,295,000 | | | American Airlines Group, Inc., 5.000%, 6/01/2022, 144A | | | 19,920,600 | |
| | 4,062,700 | | | American Airlines Pass Through Certificates, Series 2016-3, Class B, 3.750%, 4/15/2027 | | | 2,817,929 | |
See accompanying notes to financial statements.
Portfolio of Investments – as of September 30, 2020
Loomis Sayles Bond Fund – continued
| | | | | | | | |
Principal
Amount (‡) | | | Description | | Value (†) | |
|
| Bonds and Notes – continued | |
| |
| | | | Airlines – continued | |
| $ | 3,913,148 | | | American Airlines Pass Through Certificates, Series 2017-2, Class B, 3.700%, 4/15/2027 | | $ | 2,489,441 | |
| | 18,745,000 | | | American Airlines, Inc., 11.750%, 7/15/2025, 144A | | | 18,088,925 | |
| | 284,489 | | | Continental Airlines Pass Through Certificates, Series 2001-1, Class A-1, 6.703%, 12/15/2022 | | | 272,601 | |
| | 2,027,265 | | | Continental Airlines Pass Through Certificates, Series 2012-2, Class B, 5.500%, 4/29/2022 | | | 1,969,792 | |
| | 41,995,000 | | | Mileage Plus Holdings LLC/Mileage Plus Intellectual Property Assets Ltd., 6.500%, 6/20/2027, 144A | | | 43,727,294 | |
| | 5,005,001 | | | United Airlines Pass Through Trust, Series 2014-1, Class A, 4.000%, 10/11/2027 | | | 4,909,313 | |
| | | | | | | | |
| | | | | | | 124,274,108 | |
| | | | | | | | |
| |
| | | | Automotive – 2.7% | |
| | 3,641,000 | | | Allison Transmission, Inc., 4.750%, 10/01/2027, 144A | | | 3,745,679 | |
| | 3,172,000 | | | Cummins, Inc., 6.750%, 2/15/2027 | | | 4,079,856 | |
| | 1,000,000 | | | Dana, Inc., 5.625%, 6/15/2028 | | | 1,033,130 | |
| | 30,125,000 | | | Ford Motor Co., 4.750%, 1/15/2043 | | | 27,275,928 | |
| | 2,440,000 | | | Ford Motor Co., 5.291%, 12/08/2046 | | | 2,289,025 | |
| | 1,560,000 | | | Ford Motor Co., 6.625%, 2/15/2028 | | | 1,638,577 | |
| | 1,580,000 | | | Ford Motor Co., 7.500%, 8/01/2026 | | | 1,720,430 | |
| | 6,430,000 | | | Ford Motor Credit Co. LLC, 5.125%, 6/16/2025 | | | 6,630,938 | |
| | 26,145,000 | | | Ford Motor Credit Co. LLC, 5.596%, 1/07/2022 | | | 26,733,263 | |
| | 3,505,000 | | | General Motors Co., 5.200%, 4/01/2045 | | | 3,775,463 | |
| | 3,170,000 | | | General Motors Co., 6.250%, 10/02/2043 | | | 3,756,652 | |
| | 88,950,000 | | | General Motors Financial Co., Inc., 3.600%, 6/21/2030 | | | 92,117,264 | |
| | 37,875,000 | | | General Motors Financial Co., Inc., 4.375%, 9/25/2021 | | | 39,074,519 | |
| | 20,094,000 | | | Goodyear Tire & Rubber Co. (The), 4.875%, 3/15/2027 | | | 19,039,065 | |
| | 2,365,000 | | | Goodyear Tire & Rubber Co. (The), 5.000%, 5/31/2026 | | | 2,297,881 | |
| | 6,201,000 | | | Goodyear Tire & Rubber Co. (The), 7.000%, 3/15/2028 | | | 6,435,088 | |
| | | | | | | | |
| | | | | | | 241,642,758 | |
| | | | | | | | |
| |
| | | | Banking – 5.7% | |
| | 4,423,000 | | | Bank of America Corp., (fixed rate to 12/20/2027, variable rate thereafter), 3.419%, 12/20/2028 | | | 4,921,807 | |
| | 59,285,000 | | | Bank of America Corp., Series L, MTN, 4.183%, 11/25/2027 | | | 67,923,884 | |
| | 22,200,000 | | | BNP Paribas S.A., (fixed rate to 6/25/2037, variable rate thereafter), 7.195%, 144A(h) | | | 24,080,723 | |
| | 7,340,000 | | | Citigroup, Inc., 4.500%, 1/14/2022 | | | 7,714,256 | |
| | 4,045,000 | | | Cooperatieve Rabobank UA, 3.950%, 11/09/2022 | | | 4,298,167 | |
| | 2,275,000 | | | Deutsche Bank AG, (fixed rate to 12/01/2027, variable rate thereafter), 4.875%, 12/01/2032 | | | 2,166,414 | |
| | 27,405,000 | | | Goldman Sachs Group, Inc. (The), Series MPLE, 3.550%, 2/12/2021, (CAD) | | | 20,792,853 | |
| | 26,445,000 | | | Intesa Sanpaolo SpA, 5.017%, 6/26/2024, 144A | | | 27,791,920 | |
See accompanying notes to financial statements.
Portfolio of Investments – as of September 30, 2020
Loomis Sayles Bond Fund – continued
| | | | | | | | |
Principal
Amount (‡) | | | Description | | Value (†) | |
|
| Bonds and Notes – continued | |
| |
| | | | Banking – continued | |
| $ | 6,600,000 | | | Morgan Stanley, 3.950%, 4/23/2027 | | $ | 7,481,576 | |
| | 47,205,000 | | | Morgan Stanley, GMTN, 4.350%, 9/08/2026 | | | 54,639,828 | |
| | 75,000,000 | | | Morgan Stanley, GMTN, 5.000%, 9/30/2021, (AUD) | | | 55,947,441 | |
| | 139,740,000 | | | Morgan Stanley, MTN, 4.100%, 5/22/2023 | | | 151,362,223 | |
| | 15,000,000 | | | Morgan Stanley, MTN, 6.250%, 8/09/2026 | | | 19,049,959 | |
| | 68,800,000 | | | Morgan Stanley, Series MPLE, 3.125%, 8/05/2021, (CAD) | | | 52,740,208 | |
| | 2,250,000 | | | National Australia Bank Ltd., 5.000%, 3/11/2024, (AUD) | | | 1,852,119 | |
| | 15,445,000 | | | UniCredit SpA, (fixed rate to 6/30/2030, variable rate thereafter), 5.459%, 6/30/2035, 144A | | | 15,734,592 | |
| | | | | | | | |
| | | | | | | 518,497,970 | |
| | | | | | | | |
| |
| | | | Brokerage – 1.2% | |
| | 2,010,000 | | | Jefferies Finance LLC/JFIN Co-Issuer Corp., 7.250%, 8/15/2024, 144A | | | 2,082,863 | |
| | 51,270,000 | | | Jefferies Group LLC, 5.125%, 1/20/2023 | | | 55,885,417 | |
| | 21,725,000 | | | Jefferies Group LLC, 6.250%, 1/15/2036 | | | 26,923,170 | |
| | 22,428,000 | | | Jefferies Group LLC, 6.450%, 6/08/2027 | | | 27,342,432 | |
| | | | | | | | |
| | | | | | | 112,233,882 | |
| | | | | | | | |
| |
| | | | Building Materials – 0.4% | |
| | 7,794,000 | | | American Woodmark Corp., 4.875%, 3/15/2026, 144A | | | 7,891,425 | |
| | 4,835,000 | | | JELD-WEN, Inc., 4.875%, 12/15/2027, 144A | | | 4,927,107 | |
| | 4,057,000 | | | Masco Corp., 6.500%, 8/15/2032 | | | 5,259,250 | |
| | 4,534,000 | | | Masco Corp., 7.750%, 8/01/2029 | | | 6,397,208 | |
| | 650,000 | | | Owens Corning, 4.400%, 1/30/2048 | | | 723,904 | |
| | 6,344,000 | | | Owens Corning, 7.000%, 12/01/2036 | | | 8,457,276 | |
| | | | | | | | |
| | | | | | | 33,656,170 | |
| | | | | | | | |
| |
| | | | Cable Satellite – 0.9% | |
| | 24,710,000 | | | CSC Holdings LLC, 5.375%, 2/01/2028, 144A | | | 26,099,938 | |
| | 9,330,000 | | | DISH DBS Corp., 5.000%, 3/15/2023 | | | 9,516,600 | |
| | 8,654,000 | | | DISH DBS Corp., 7.750%, 7/01/2026 | | | 9,513,861 | |
| | 6,190,000 | | | Time Warner Cable LLC, 4.500%, 9/15/2042 | | | 6,723,979 | |
| | 535,000 | | | Time Warner Cable LLC, 5.875%, 11/15/2040 | | | 666,651 | |
| | 15,800,000 | | | Videotron Ltd., 5.625%, 6/15/2025, 144A, (CAD) | | | 12,774,796 | |
| | 17,637,000 | | | Ziggo BV, 5.500%, 1/15/2027, 144A | | | 18,474,758 | |
| | | | | | | | |
| | | | | | | 83,770,583 | |
| | | | | | | | |
| |
| | | | Chemicals – 0.1% | |
| | 9,275,000 | | | Minerals Technologies, Inc., 5.000%, 7/01/2028, 144A | | | 9,537,297 | |
| | | | | | | | |
| |
| | | | Construction Machinery – 0.4% | |
| | 27,030,000 | | | Toro Co. (The), 6.625%, 5/01/2037(a)(c) | | | 33,296,598 | |
| | 3,280,000 | | | United Rentals North America, Inc., 4.875%, 1/15/2028 | | | 3,444,000 | |
| | | | | | | | |
| | | | | | | 36,740,598 | |
| | | | | | | | |
See accompanying notes to financial statements.
Portfolio of Investments – as of September 30, 2020
Loomis Sayles Bond Fund – continued
| | | | | | | | |
Principal
Amount (‡) | | | Description | | Value (†) | |
|
| Bonds and Notes – continued | |
| |
| | | | Consumer Cyclical Services – 0.1% | |
| $ | 8,919,000 | | | ServiceMaster Co. LLC (The), 7.450%, 8/15/2027 | | $ | 9,732,859 | |
| | | | | | | | |
| |
| | | | Consumer Products – 0.2% | |
| | 15,473,000 | | | Avon Products, Inc., 8.950%, 3/15/2043 | | | 18,130,488 | |
| | 3,435,000 | | | Whirlpool Corp., 4.600%, 5/15/2050 | | | 4,254,324 | |
| | | | | | | | |
| | | | | | | 22,384,812 | |
| | | | | | | | |
| |
| | | | Diversified Manufacturing – 0.2% | |
| | 8,950,000 | | | General Electric Co., 4.500%, 3/11/2044 | | | 9,245,032 | |
| | 11,695,000 | | | General Electric Co., Series A, MTN, 3-month LIBOR + 0.300%, 0.575%, 5/13/2024(g) | | | 11,197,997 | |
| | 2,080,000 | | | General Electric Co., Series D, (fixed rate to 1/21/2021, variable rate thereafter), 5.000%(h) | | | 1,657,268 | |
| | | | | | | | |
| | | | | | | 22,100,297 | |
| | | | | | | | |
| |
| | | | Electric – 0.6% | |
| | 36,874,233 | | | Alta Wind Holdings LLC, 7.000%, 6/30/2035, 144A | | | 44,812,881 | |
| | 1,230,000 | | | Edison International, 4.950%, 4/15/2025 | | | 1,346,356 | |
| | 8,663,000 | | | Empresa Nacional de Electricidad S.A., 7.875%, 2/01/2027 | | | 10,351,633 | |
| | | | | | | | |
| | | | | | | 56,510,870 | |
| | | | | | | | |
| |
| | | | Finance Companies – 5.6% | |
| | 3,100,000 | | | AGFC Capital Trust I, 3-month LIBOR + 1.750%, 2.025%, 1/15/2067, 144A(a)(b)(e)(g) | | | 994,938 | |
| | 15,585,000 | | | Antares Holdings LP, 6.000%, 8/15/2023, 144A | | | 15,760,443 | |
| | 27,210,000 | | | Antares Holdings LP, 8.500%, 5/18/2025, 144A | | | 28,696,116 | |
| | 42,435,000 | | | GE Capital Funding LLC, 4.550%, 5/15/2032, 144A | | | 45,611,883 | |
| | 445,000 | | | Navient Corp., 5.000%, 3/15/2027 | | | 417,868 | |
| | 27,420,000 | | | Navient Corp., 5.500%, 1/25/2023 | | | 27,594,254 | |
| | 5,365,000 | | | Navient Corp., 5.875%, 10/25/2024 | | | 5,334,849 | |
| | 150,996(††) | | | Navient Corp., 6.000%, 12/15/2043 | | | 3,220,367 | |
| | 38,431,000 | | | Navient Corp., 6.750%, 6/15/2026 | | | 38,334,922 | |
| | 58,523,000 | | | Navient Corp., MTN, 5.625%, 8/01/2033 | | | 49,254,420 | |
| | 75,452,000 | | | Navient Corp., MTN, 6.125%, 3/25/2024 | | | 76,017,890 | |
| | 2,950,000 | | | Navient Corp., MTN, 7.250%, 1/25/2022 | | | 3,023,750 | |
| | 31,410,000 | | | OneMain Finance Corp., 6.875%, 3/15/2025 | | | 34,854,892 | |
| | 10,145,000 | | | OneMain Finance Corp., 7.125%, 3/15/2026 | | | 11,333,994 | |
| | 36,085,000 | | | OneMain Finance Corp., 7.750%, 10/01/2021 | | | 37,742,204 | |
| | 77,845,000 | | | OneMain Finance Corp., 8.250%, 10/01/2023 | | | 86,407,950 | |
| | 14,750,000 | | | Owl Rock Capital Corp., 4.250%, 1/15/2026 | | | 14,942,193 | |
| | 13,420,000 | | | Owl Rock Technology Finance Corp., 4.750%, 12/15/2025, 144A | | | 13,260,749 | |
| | 10,870,000 | | | Quicken Loans LLC, 5.250%, 1/15/2028, 144A | | | 11,453,284 | |
| | | | | | | | |
| | | | | | | 504,256,966 | |
| | | | | | | | |
See accompanying notes to financial statements.
Portfolio of Investments – as of September 30, 2020
Loomis Sayles Bond Fund – continued
| | | | | | | | |
Principal
Amount (‡) | | | Description | | Value (†) | |
|
| Bonds and Notes – continued | |
| |
| | | | Financial Other – 0.6% | |
| $ | 14,125,000 | | | Nationstar Mortgage Holdings, Inc., 5.500%, 8/15/2028, 144A | | $ | 14,107,344 | |
| | 35,775,000 | | | Nationstar Mortgage Holdings, Inc., 9.125%, 7/15/2026, 144A | | | 38,368,687 | |
| | | | | | | | |
| | | | | | | 52,476,031 | |
| | | | | | | | |
| |
| | | | Food & Beverage – 0.3% | |
| | 1,500,000 | | | Fonterra Co-operative Group Ltd., MTN, 4.500%, 6/30/2021, (AUD) | | | 1,104,660 | |
| | 23,500,000 | | | Kraft Heinz Foods Co., 4.375%, 6/01/2046 | | | 24,112,645 | |
| | | | | | | | |
| | | | | | | 25,217,305 | |
| | | | | | | | |
| |
| | | | Gaming – 0.2% | |
| | 17,635,000 | | | International Game Technology PLC, 6.250%, 1/15/2027, 144A | | | 18,913,538 | |
| | | | | | | | |
| |
| | | | Government Owned – No Guarantee – 0.1% | |
| | 8,465,000 | | | Pertamina Persero PT, 6.450%, 5/30/2044, 144A | | | 10,965,666 | |
| | | | | | | | |
| |
| | | | Healthcare – 4.1% | |
| | 3,000,000 | | | CHS/Community Health Systems, Inc., 6.625%, 2/15/2025, 144A | | | 2,902,500 | |
| | 5,175,000 | | | HCA, Inc., 5.375%, 9/01/2026 | | | 5,716,150 | |
| | 27,204,000 | | | HCA, Inc., 7.050%, 12/01/2027 | | | 31,760,670 | |
| | 27,545,000 | | | HCA, Inc., 7.500%, 11/06/2033 | | | 36,634,850 | |
| | 45,324,000 | | | HCA, Inc., 8.360%, 4/15/2024 | | | 53,369,010 | |
| | 6,944,000 | | | HCA, Inc., MTN, 7.580%, 9/15/2025 | | | 8,280,720 | |
| | 12,446,000 | | | HCA, Inc., MTN, 7.750%, 7/15/2036 | | | 15,868,650 | |
| | 46,555,000 | | | Tenet Healthcare Corp., 5.125%, 5/01/2025 | | | 46,987,962 | |
| | 64,945,000 | | | Tenet Healthcare Corp., 6.125%, 10/01/2028, 144A | | | 63,159,012 | |
| | 54,975,000 | | | Tenet Healthcare Corp., 6.750%, 6/15/2023 | | | 57,723,750 | |
| | 49,062,000 | | | Tenet Healthcare Corp., 6.875%, 11/15/2031 | | | 48,080,760 | |
| | 990,000 | | | Tenet Healthcare Corp., 8.125%, 4/01/2022 | | | 1,100,781 | |
| | | | | | | | |
| | | | | | | 371,584,815 | |
| | | | | | | | |
| |
| | | | Home Construction – 0.8% | |
| | 8,225,000 | | | Beazer Homes USA, Inc., 7.250%, 10/15/2029 | | | 8,821,312 | |
| | 52,605,000 | | | PulteGroup, Inc., 6.000%, 2/15/2035 | | | 64,967,175 | |
| | | | | | | | |
| | | | | | | 73,788,487 | |
| | | | | | | | |
| |
| | | | Independent Energy – 2.7% | |
| | 6,177,000 | | | Aker BP ASA, 3.750%, 1/15/2030, 144A | | | 5,990,531 | |
| | 24,372,000 | | | Ascent Resources Utica Holdings LLC/ARU Finance Corp., 10.000%, 4/01/2022, 144A | | | 24,006,420 | |
| | 6,507,000 | | | Baytex Energy Corp., 5.625%, 6/01/2024, 144A | | | 3,676,455 | |
| | 1,835,000 | | | Chesapeake Energy Corp., 4.875%, 4/15/2022(a)(c)(i) | | | 74,574 | |
| | 24,610,000 | | | Chesapeake Energy Corp., 8.000%, 1/15/2025(a)(c)(i) | | | 908,601 | |
| | 64,710,000 | | | Chesapeake Energy Corp., 8.000%, 6/15/2027(a)(c)(i) | | | 2,183,963 | |
| | 19,891,000 | | | Continental Resources, Inc., 3.800%, 6/01/2024 | | | 18,349,448 | |
| | 8,832,000 | | | Continental Resources, Inc., 4.500%, 4/15/2023 | | | 8,416,896 | |
| | 418,000 | | | Continental Resources, Inc., 5.000%, 9/15/2022 | | | 414,898 | |
| | 3,480,000 | | | Diamondback Energy, Inc., 3.500%, 12/01/2029 | | | 3,373,598 | |
See accompanying notes to financial statements.
Portfolio of Investments – as of September 30, 2020
Loomis Sayles Bond Fund – continued
| | | | | | | | |
Principal
Amount (‡) | | | Description | | Value (†) | |
|
| Bonds and Notes – continued | |
| |
| | | | Independent Energy – continued | |
| $ | 20,735,000 | | | Lonestar Resources America, Inc., 11.250%, 1/01/2023, 144A(a)(c)(i) | | $ | 3,524,950 | |
| | 10,098,000 | | | MEG Energy Corp., 7.000%, 3/31/2024, 144A | | | 9,391,140 | |
| | 27,050,000 | | | Mesquite Energy, Inc., 6.125%, 1/15/2023(a)(c)(i) | | | 129,840 | |
| | 12,420,000 | | | Mesquite Energy, Inc., 7.750%, 6/15/2021(a)(c)(i) | | | 59,616 | |
| | 4,700,000 | | | Montage Resources Corp., 8.875%, 7/15/2023 | | | 4,776,375 | |
| | 2,770,000 | | | Occidental Petroleum Corp., 4.500%, 7/15/2044 | | | 1,989,442 | |
| | 49,025,000 | | | Occidental Petroleum Corp., 6.625%, 9/01/2030 | | | 45,225,562 | |
| | 30,495,000 | | | Occidental Petroleum Corp., 8.875%, 7/15/2030 | | | 31,409,850 | |
| | 93,333 | | | Pan American Energy LLC, 7.875%, 5/07/2021, 144A | | | 91,000 | |
| | 7,215,000 | | | Parsley Energy LLC/Parsley Finance Corp., 4.125%, 2/15/2028, 144A | | | 6,782,100 | |
| | 4,270,000 | | | QEP Resources, Inc., 5.250%, 5/01/2023 | | | 3,106,425 | |
| | 190,000 | | | Range Resources Corp., 4.875%, 5/15/2025 | | | 171,494 | |
| | 46,032,000 | | | SM Energy Co., 10.000%, 1/15/2025, 144A | | | 43,928,798 | |
| | 25,660,000 | | | Vine Oil & Gas LP/Vine Oil & Gas Finance Corp., 8.750%, 4/15/2023, 144A | | | 17,192,200 | |
| | 3,615,000 | | | Vine Oil & Gas LP/Vine Oil & Gas Finance Corp., 9.750%, 4/15/2023, 144A | | | 2,458,200 | |
| | 9,140,000 | | | WPX Energy, Inc., 4.500%, 1/15/2030 | | | 8,985,854 | |
| | | | | | | | |
| | | | | | | 246,618,230 | |
| | | | | | | | |
| |
| | | | Life Insurance – 3.6% | |
| | 6,212,000 | | | American International Group, Inc., 4.875%, 6/01/2022 | | | 6,658,924 | |
| | 67,930,000 | | | AXA S.A., (fixed rate to 12/14/2036, variable rate thereafter), 6.379%, 144A(h) | | | 92,214,975 | |
| | 7,878,000 | | | Brighthouse Financial, Inc., 4.700%, 6/22/2047 | | | 7,581,766 | |
| | 20,335,000 | | | Brighthouse Financial, Inc., 5.625%, 5/15/2030 | | | 23,681,432 | |
| | 15,000,000 | | | Global Atlantic Fin Co., 8.625%, 4/15/2021, 144A | | | 15,482,734 | |
| | 2,030,000 | | | MetLife, Inc., 9.250%, 4/08/2068, 144A | | | 3,071,350 | |
| | 10,175,000 | | | MetLife, Inc., 10.750%, 8/01/2069 | | | 16,547,216 | |
| | 57,985,000 | | | Mutual of Omaha Insurance Co., 6.800%, 6/15/2036, 144A | | | 74,906,881 | |
| | 38,476,000 | | | National Life Insurance Co., 10.500%, 9/15/2039, 144A(a)(c) | | | 61,991,762 | |
| | 12,950,000 | | | NLV Financial Corp., 7.500%, 8/15/2033, 144A(a)(c) | | | 17,039,092 | |
| | 2,500,000 | | | Prudential Financial, Inc., MTN, 3.700%, 3/13/2051 | | | 2,748,550 | |
| | | | | | | | |
| | | | | | | 321,924,682 | |
| | | | | | | | |
| |
| | | | Local Authorities – 0.8% | |
| | 99,500,000 | | | New South Wales Treasury Corp., 4.000%, 4/08/2021, (AUD) | | | 72,685,351 | |
| | 1,507,000 | | | Ontario Hydro, 6.042%, 11/27/2020, (CAD)(j) | | | 1,131,243 | |
| | | | | | | | |
| | | | | | | 73,816,594 | |
| | | | | | | | |
| |
| | | | Media Entertainment – 0.6% | |
| | 164,410,000 | | | Grupo Televisa SAB, EMTN, 7.250%, 5/14/2043, (MXN) | | | 5,553,350 | |
| | 6,440,000 | | | iHeartCommunications, Inc., 8.375%, 5/01/2027 | | | 6,343,400 | |
| | 33,670,000 | | | ViacomCBS, Inc., 4.950%, 5/19/2050 | | | 39,506,934 | |
| | | | | | | | |
| | | | | | | 51,403,684 | |
| | | | | | | | |
See accompanying notes to financial statements.
Portfolio of Investments – as of September 30, 2020
Loomis Sayles Bond Fund – continued
| | | | | | | | |
Principal
Amount (‡) | | | Description | | Value (†) | |
|
| Bonds and Notes – continued | |
| |
| | | | Metals & Mining – 1.3% | |
| $ | 35,180,000 | | | ArcelorMittal S.A., 7.000%, 3/01/2041 | | $ | 43,447,300 | |
| | 3,635,000 | | | ArcelorMittal S.A., 7.250%, 10/15/2039 | | | 4,587,919 | |
| | 3,950,000 | | | Barrick Gold Corp., Series A, 5.800%, 11/15/2034 | | | 4,955,324 | |
| | 5,370,000 | | | Barrick North America Finance LLC, 5.750%, 5/01/2043 | | | 7,819,436 | |
| | 12,096,000 | | | Commercial Metals Co., 5.375%, 7/15/2027 | | | 12,757,651 | |
| | 5,000,000 | | | First Quantum Minerals Ltd., 6.875%, 3/01/2026, 144A | | | 4,818,750 | |
| | 16,650,000 | | | First Quantum Minerals Ltd., 7.250%, 5/15/2022, 144A | | | 16,664,985 | |
| | 1,445,000 | | | First Quantum Minerals Ltd., 7.500%, 4/01/2025, 144A | | | 1,429,264 | |
| | 2,570,000 | | | Kaiser Aluminum Corp., 6.500%, 5/01/2025, 144A | | | 2,649,130 | |
| | 11,965,000 | | | Russel Metals, Inc., 6.000%, 4/19/2022, 144A, (CAD) | | | 8,985,769 | |
| | 11,640,000 | | | United States Steel Corp., 6.650%, 6/01/2037 | | | 7,158,600 | |
| | | | | | | | |
| | | | | | | 115,274,128 | |
| | | | | | | | |
| |
| | | | Midstream – 0.9% | |
| | 755,000 | | | Blue Racer Midstream LLC/Blue Racer Finance Corp., 6.125%, 11/15/2022, 144A | | | 736,540 | |
| | 9,050,000 | | | DCP Midstream Operating LP, 6.450%, 11/03/2036, 144A | | | 8,672,434 | |
| | 7,325,000 | | | Energy Transfer Partners LP/Regency Energy Finance Corp., 4.500%, 11/01/2023 | | | 7,793,606 | |
| | 1,455,000 | | | Energy Transfer Partners LP/Regency Energy Finance Corp., 5.000%, 10/01/2022 | | | 1,531,286 | |
| | 19,580,000 | | | New Fortress Energy, Inc., 6.750%, 9/15/2025, 144A | | | 20,470,890 | |
| | 17,922,000 | | | NGL Energy Partners LP/NGL Energy Finance Corp., 6.125%, 3/01/2025 | | | 10,663,590 | |
| | 11,555,000 | | | NGL Energy Partners LP/NGL Energy Finance Corp., 7.500%, 11/01/2023 | | | 7,698,519 | |
| | 205,000 | | | NGPL PipeCo LLC, 7.768%, 12/15/2037, 144A | | | 260,945 | |
| | 16,100,000 | | | Summit Midstream Partners LP, Series A, (fixed rate to 12/15/2022, variable rate thereafter), 9.500%(a)(c)(h)(i) | | | 2,033,913 | |
| | 18,753,000 | | | Williams Cos., Inc. (The), 3.350%, 8/15/2022 | | | 19,454,055 | |
| | | | | | | | |
| | | | | | | 79,315,778 | |
| | | | | | | | |
| |
| | | | Mortgage Related – 0.0% | |
| | 20,357 | | | FHLMC, 5.000%, 12/01/2031 | | | 22,333 | |
| | | | | | | | |
| |
| | | | Oil Field Services – 0.6% | |
| | 13,165,000 | | | Noble Holding International Ltd., 7.875%, 2/01/2026, 144A(i) | | | 3,201,070 | |
| | 2,710,000 | | | Shelf Drilling Holdings Ltd., 8.250%, 2/15/2025, 144A | | | 1,070,450 | |
| | 23,959,000 | | | Transocean Proteus Ltd., 6.250%, 12/01/2024, 144A | | | 21,383,407 | |
| | 4,030,000 | | | Transocean, Inc., 7.500%, 4/15/2031 | | | 544,050 | |
| | 67,054,000 | | | Transocean, Inc., 11.500%, 1/30/2027, 144A | | | 27,505,551 | |
| | 15,500,000 | | | Valaris PLC, 7.750%, 2/01/2026(a)(c)(i) | | | 785,385 | |
| | | | | | | | |
| | | | | | | 54,489,913 | |
| | | | | | | | |
| |
| | | | Packaging – 0.2% | |
| | 12,925,000 | | | Owens-Brockway Glass Container, Inc., 6.625%, 5/13/2027, 144A | | | 13,999,391 | |
| | | | | | | | |
See accompanying notes to financial statements.
Portfolio of Investments – as of September 30, 2020
Loomis Sayles Bond Fund – continued
| | | | | | | | |
Principal
Amount (‡) | | | Description | | Value (†) | |
|
| Bonds and Notes – continued | |
| |
| | | | Paper – 1.6% | |
| $ | 38,882,000 | | | Georgia-Pacific LLC, 7.750%, 11/15/2029 | | $ | 58,129,797 | |
| | 9,625,000 | | | International Paper Co., 8.700%, 6/15/2038 | | | 14,849,101 | |
| | 8,214,000 | | | WestRock MWV LLC, 7.950%, 2/15/2031 | | | 11,659,274 | |
| | 25,138,000 | | | WestRock MWV LLC, 8.200%, 1/15/2030 | | | 35,421,746 | |
| | 4,127,000 | | | Weyerhaeuser Co., 6.950%, 10/01/2027 | | | 5,205,368 | |
| | 14,035,000 | | | Weyerhaeuser Co., 7.375%, 3/15/2032 | | | 20,461,926 | |
| | | | | | | | |
| | | | | | | 145,727,212 | |
| | | | | | | | |
| |
| | | | Property & Casualty Insurance – 0.9% | |
| | 13,985,000 | | | MBIA Insurance Corp., 3-month LIBOR + 11.260%, 11.535%, 1/15/2033, 144A(f)(g) | | | 4,894,750 | |
| | 80,000 | | | MBIA Insurance Corp., 3-month LIBOR + 11.260%, 11.535%, 1/15/2033(f)(g) | | | 28,000 | |
| | 2,300,000 | | | MGIC Investment Corp., 5.250%, 8/15/2028 | | | 2,372,278 | |
| | 28,955,000 | | | Nationwide Mutual Insurance Co., 4.350%, 4/30/2050, 144A | | | 31,019,228 | |
| | 4,810,000 | | | Radian Group, Inc., 4.500%, 10/01/2024 | | | 4,774,887 | |
| | 2,825,000 | | | Radian Group, Inc., 4.875%, 3/15/2027 | | | 2,825,000 | |
| | 33,290,000 | | | Radian Group, Inc., 6.625%, 3/15/2025 | | | 35,120,950 | |
| | | | | | | | |
| | | | | | | 81,035,093 | |
| | | | | | | | |
| |
| | | | REITs – Diversified – 0.0% | |
| | 1,020,000 | | | iStar, Inc., 4.750%, 10/01/2024 | | | 986,850 | |
| | | | | | | | |
| |
| | | | REITs – Hotels – 0.2% | |
| | 821,000 | | | Service Properties Trust, 3.950%, 1/15/2028 | | | 681,430 | |
| | 8,807,000 | | | Service Properties Trust, 4.350%, 10/01/2024 | | | 7,970,335 | |
| | 2,507,000 | | | Service Properties Trust, 4.500%, 6/15/2023 | | | 2,458,565 | |
| | 1,400,000 | | | Service Properties Trust, 4.650%, 3/15/2024 | | | 1,302,000 | |
| | 1,146,000 | | | Service Properties Trust, 4.750%, 10/01/2026 | | | 1,019,160 | |
| | 4,085,000 | | | Service Properties Trust, 4.950%, 2/15/2027 | | | 3,635,650 | |
| | | | | | | | |
| | | | | | | 17,067,140 | |
| | | | | | | | |
| |
| | | | Retailers – 0.5% | |
| | 4,680,000 | | | Dillard’s, Inc., 7.000%, 12/01/2028 | | | 4,801,306 | |
| | 7,182,000 | | | Dillard’s, Inc., 7.750%, 7/15/2026 | | | 7,533,415 | |
| | 2,250,000 | | | Dillard’s, Inc., 7.750%, 5/15/2027 | | | 2,298,600 | |
| | 1,795,000 | | | Hanesbrands, Inc., 5.375%, 5/15/2025, 144A | | | 1,893,725 | |
| | 36,970,000 | | | J.C. Penney Corp., Inc., 6.375%, 10/15/2036(a)(c)(i) | | | 176,717 | |
| | 3,515,000 | | | J.C. Penney Corp., Inc., 7.625%, 3/01/2097(a)(c)(i) | | | 22,109 | |
| | 9,245,000 | | | Marks & Spencer PLC, 7.125%, 12/01/2037, 144A | | | 9,830,208 | |
| | 13,820,000 | | | Michaels Stores, Inc., 8.000%, 7/15/2027, 144A | | | 14,441,900 | |
| | | | | | | | |
| | | | | | | 40,997,980 | |
| | | | | | | | |
See accompanying notes to financial statements.
Portfolio of Investments – as of September 30, 2020
Loomis Sayles Bond Fund – continued
| | | | | | | | |
Principal
Amount (‡) | | | Description | | Value (†) | |
|
| Bonds and Notes – continued | |
| |
| | | | Supermarkets – 0.2% | |
| $ | 11,988,000 | | | Albertson’s Cos. LLC/Safeway, Inc./New Albertson’s LP/Albertson’s LLC, 5.750%, 3/15/2025 | | $ | 12,366,221 | |
| | 2,705,000 | | | Safeway, Inc., 7.250%, 2/01/2031 | | | 3,043,125 | |
| | | | | | | | |
| | | | | | | 15,409,346 | |
| | | | | | | | |
| |
| | | | Technology – 1.5% | |
| | 49,820,000 | | | Iron Mountain, Inc., 4.875%, 9/15/2029, 144A | | | 50,691,850 | |
| | 35,206,000 | | | KLA Corp., 4.650%, 11/01/2024 | | | 40,202,083 | |
| | 12,970,000 | | | KLA Corp., 5.650%, 11/01/2034 | | | 17,328,940 | |
| | 5,205,000 | | | Micron Technology, Inc., 4.975%, 2/06/2026 | | | 6,033,875 | |
| | 2,024,000 | | | Samsung Electronics Co. Ltd., 7.700%, 10/01/2027, 144A | | | 2,504,639 | |
| | 9,561,000 | | | Seagate HDD Cayman, 4.091%, 6/01/2029, 144A | | | 10,394,624 | |
| | 8,816,000 | | | Seagate HDD Cayman, 4.875%, 6/01/2027 | | | 9,875,639 | |
| | | | | | | | |
| | | | | | | 137,031,650 | |
| | | | | | | | |
| |
| | | | Transportation Services – 0.6% | |
| | 1,215,000 | | | Avis Budget Car Rental LLC/Avis Budget Finance, Inc., 5.750%, 7/15/2027, 144A | | | 1,095,857 | |
| | 20,994,000 | | | Fenix Marine Service Holdings Ltd., 8.000%, 1/15/2024(a)(c) | | | 17,431,948 | |
| | 31,370,000 | | | Penske Truck Leasing Co. LP/PTL Finance Corp., 4.000%, 7/15/2025, 144A | | | 35,339,204 | |
| | | | | | | | |
| | | | | | | 53,867,009 | |
| | | | | | | | |
| |
| | | | Treasuries – 29.8% | |
| | 8,600,000(†††) | | | Mexican Fixed Rate Bonds, Series M, 5.750%, 3/05/2026, (MXN) | | | 39,817,127 | |
| | 4,579,595(†††) | | | Mexican Fixed Rate Bonds, Series M, 7.750%, 5/29/2031, (MXN) | | | 23,349,794 | |
| | 39,547,655(†††) | | | Mexican Fixed Rate Bonds, Series M, 8.000%, 12/07/2023, (MXN) | | | 196,197,434 | |
| | 10,160,320(†††) | | | Mexican Fixed Rate Bonds, Series M-20, 7.500%, 6/03/2027, (MXN) | | | 51,074,316 | |
| | 3,288,446(†††) | | | Mexican Fixed Rate Bonds, Series M-20, 8.500%, 5/31/2029, (MXN) | | | 17,584,631 | |
| | 113,749(†††) | | | Mexican Fixed Rate Bonds, Series M-20, 10.000%, 12/05/2024, (MXN) | | | 611,368 | |
| | 34,470,000(†††) | | | Mexican Fixed Rate Bonds, Series M-20, 10.000%, 12/05/2024, (MXN) | | | 185,266,409 | |
| | 128,565,000 | | | New Zealand Government Bond, Series 0521, 6.000%, 5/15/2021, (NZD) | | | 88,108,924 | |
| | 764,599,000 | | | Norway Government Bond, Series 474, 3.750%, 5/25/2021, 144A, (NOK) | | | 83,960,094 | |
| | 253,010,000 | | | Republic of Brazil, 8.500%, 1/05/2024, (BRL) | | | 49,521,192 | |
| | 97,345,000 | | | Republic of Brazil, 10.250%, 1/10/2028, (BRL) | | | 20,404,680 | |
| | 848,230,000 | | | U.S. Treasury Bond, 1.250%, 5/15/2050 | | | 806,348,644 | |
| | 421,670,000 | | | U.S. Treasury Bond, 1.375%, 8/15/2050 | | | 413,829,573 | |
| | 55,870,000 | | | U.S. Treasury Bond, 2.000%, 2/15/2050 | | | 63,386,261 | |
| | 203,945,000 | | | U.S. Treasury Bond, 3.000%, 8/15/2048 | | | 278,615,956 | |
| | 91,840,000 | | | U.S. Treasury Note, 1.500%, 10/31/2021 | | | 93,196,074 | |
| | 279,500,000 | | | U.S. Treasury Note, 1.500%, 11/30/2021 | | | 283,889,022 | |
| | | | | | | | |
| | | | | | | 2,695,161,499 | |
| | | | | | | | |
See accompanying notes to financial statements.
Portfolio of Investments – as of September 30, 2020
Loomis Sayles Bond Fund – continued
| | | | | | | | |
Principal
Amount (‡) | | | Description | | Value (†) | |
|
| Bonds and Notes – continued | |
| |
| | | | Wireless – 0.2% | |
| | 281,500,000 | | | America Movil SAB de CV, 6.450%, 12/05/2022, (MXN) | | $ | 12,916,804 | |
| | 143,600,000 | | | America Movil SAB de CV, 8.460%, 12/18/2036, (MXN) | | | 6,762,575 | |
| | | | | | | | |
| | | | | | | 19,679,379 | |
| | | | | | | | |
| |
| | | | Wirelines – 5.0% | |
| | 25,684,000 | | | AT&T, Inc., 3.650%, 9/15/2059, 144A | | | 25,230,665 | |
| | 137,303,000 | | | AT&T, Inc., 4.300%, 2/15/2030 | | | 162,749,401 | |
| | 13,480,000 | | | AT&T, Inc., 4.500%, 3/09/2048 | | | 15,469,847 | |
| | 10,946,000 | | | Bell Canada, Inc., MTN, 6.100%, 3/16/2035, 144A, (CAD) | | | 11,115,918 | |
| | 5,790,000 | | | Bell Canada, Inc., MTN, 6.550%, 5/01/2029, 144A, (CAD) | | | 5,841,223 | |
| | 3,695,000 | | | Bell Canada, Inc., MTN, 7.300%, 2/23/2032, 144A, (CAD) | | | 3,974,827 | |
| | 1,875,000 | | | CenturyLink, Inc., 5.625%, 4/01/2025 | | | 2,003,180 | |
| | 1,700,000 | | | CenturyLink, Inc., Series S, 6.450%, 6/15/2021 | | | 1,744,625 | |
| | 11,795,000 | | | CenturyLink, Inc., Series W, 6.750%, 12/01/2023 | | | 12,930,269 | |
| | 3,825,000 | | | Cincinnati Bell Telephone Co. LLC, 6.300%, 12/01/2028 | | | 3,896,795 | |
| | 3,036,000 | | | Cincinnati Bell, Inc., 8.000%, 10/15/2025, 144A | | | 3,206,775 | |
| | 8,990,000 | | | Qwest Corp., 7.250%, 9/15/2025 | | | 10,326,213 | |
| | 49,543,000 | | | Telecom Italia Capital S.A., 6.000%, 9/30/2034 | | | 57,469,880 | |
| | 23,485,000 | | | Telecom Italia Capital S.A., 6.375%, 11/15/2033 | | | 27,947,150 | |
| | 13,590,000 | | | Telefonica Emisiones S.A., EMTN, 5.375%, 2/02/2026, (GBP) | | | 21,260,920 | |
| | 71,128,000 | | | Verizon Communications, Inc., 4.329%, 9/21/2028 | | | 86,349,392 | |
| | | | | | | | |
| | | | | | | 451,517,080 | |
| | | | | | | | |
| | |
| | | | Total Non-Convertible Bonds
(Identified Cost $7,534,349,939) | | | 7,127,289,982 | |
| | | | | | | | |
| |
| | Convertible Bonds – 3.8% | | | | |
| | |
| | | | Cable Satellite – 2.4% | | | |
| | 48,505,000 | | | DISH Network Corp., 2.375%, 3/15/2024 | | | 43,652,064 | |
| | 184,765,000 | | | DISH Network Corp., 3.375%, 8/15/2026 | | | 169,613,629 | |
| | | | | | | | |
| | | | | | | 213,265,693 | |
| | | | | | | | |
| |
| | | | Energy – 0.0% | |
| | 92,990,000 | | | Chesapeake Energy Corp., 5.500%, 9/15/2026(a)(c)(i) | | | 3,115,165 | |
| | | | | | | | |
| |
| | | | Pharmaceuticals – 0.1% | |
| | 4,102,000 | | | BioMarin Pharmaceutical, Inc., 0.599%, 8/01/2024 | | | 4,304,446 | |
| | 1,263,000 | | | BioMarin Pharmaceutical, Inc., 1.250%, 5/15/2027, 144A | | | 1,235,203 | |
| | | | | | | | |
| | | | | | | 5,539,649 | |
| | | | | | | | |
| |
| | | | REITs – Diversified – 0.2% | |
| | 18,765,000 | | | iStar, Inc., 3.125%, 9/15/2022 | | | 19,957,649 | |
| | | | | | | | |
| |
| | | | Technology – 1.1% | |
| | 13,345,000 | | | Booking Holdings, Inc., 0.900%, 9/15/2021 | | | 14,200,476 | |
| | 1,000,000 | | | Evolent Health, Inc., 3.500%, 12/01/2024, 144A | | | 980,000 | |
See accompanying notes to financial statements.
Portfolio of Investments – as of September 30, 2020
Loomis Sayles Bond Fund – continued
| | | | | | | | |
Principal
Amount (‡) | | | Description | | Value (†) | |
|
| Bonds and Notes – continued | |
| |
| | | | Technology – continued | |
| $ | 26,148,000 | | | Nuance Communications, Inc., 1.000%, 12/15/2035 | | $ | 38,239,881 | |
| | 14,263,000 | | | Nuance Communications, Inc., 1.250%, 4/01/2025 | | | 25,402,831 | |
| | 1,363,000 | | | Nuance Communications, Inc., 1.500%, 11/01/2035 | | | 2,240,387 | |
| | 23,950,000 | | | Western Digital Corp., 1.500%, 2/01/2024 | | | 22,738,029 | |
| | | | | | | | |
| | | | | | | 103,801,604 | |
| | | | | | | | |
| | |
| | | | Total Convertible Bonds
(Identified Cost $408,819,589) | | | 345,679,760 | |
| | | | | | | | |
| |
| | Municipals – 1.5% | | | | |
| | |
| | | | Illinois – 0.3% | | | |
| | 25,725,000 | | | State of Illinois, 5.100%, 6/01/2033 | | | 25,997,428 | |
| | | | | | | | |
| |
| | | | Michigan – 0.1% | |
| | 12,215,000 | | | Michigan Tobacco Settlement Finance Authority, Series A, 7.309%, 6/01/2034 | | | 12,475,179 | |
| | | | | | | | |
| |
| | | | Virginia – 1.1% | |
| | 94,480,000 | | | Tobacco Settlement Financing Corp., Series A-1, 6.706%, 6/01/2046 | | | 97,515,642 | |
| | | | | | | | |
| | |
| | | | Total Municipals
(Identified Cost $126,873,890) | | | 135,988,249 | |
| | | | | | | | |
| | |
| | | | Total Bonds and Notes
(Identified Cost $8,070,043,418) | | | 7,608,957,991 | |
| | | | | | | | |
| |
| | Senior Loans – 0.0% | | | | |
| | |
| | | | Technology – 0.0% | | | |
| | 7,048,927 | | | IQOR U.S., Inc., 2nd Lien Term Loan, Zero Coupon, 4/01/2022(a)(c)(i) (Identified Cost $6,931,282) | | | 148,028 | |
| | | | | | | | |
| | |
| | Shares | | | | | | | |
|
| Common Stocks – 10.9% | |
| |
| | | | Automobiles – 1.6% | |
| | 21,480,222 | | | Ford Motor Co. | | | 143,058,278 | |
| | | | | | | | |
| |
| | | | Chemicals – 0.1% | |
| | 733,495 | | | Hexion Holdings Corp., Class B(f) | | | 7,289,473 | |
| | | | | | | | |
| |
| | | | Diversified Telecommunication Services – 3.5% | |
| | 11,115,698 | | | AT&T, Inc. | | | 316,908,550 | |
| | | | | | | | |
| |
| | | | Electronic Equipment, Instruments & Components – 1.5% | |
| | 4,304,382 | | | Corning, Inc. | | | 139,505,021 | |
| | | | | | | | |
See accompanying notes to financial statements.
Portfolio of Investments – as of September 30, 2020
Loomis Sayles Bond Fund – continued
| | | | | | | | |
Shares | | | Description | | Value (†) | |
|
| Common Stocks – continued | |
| |
| | | | Media – 0.0% | |
| | 1,740,413 | | | Clear Channel Outdoor Holdings, Inc.(f) | | $ | 1,740,413 | |
| | 83,772 | | | iHeartMedia, Inc., Class A(f) | | | 680,229 | |
| | | | | | | | |
| | | | | | | 2,420,642 | |
| | | | | | | | |
| |
| | | | Oil, Gas & Consumable Fuels – 0.3% | |
| | 93,585 | | | Battalion Oil Corp.(f) | | | 739,321 | |
| | 5,167 | | | Chesapeake Energy Corp.(f) | | | 21,030 | |
| | 2,354 | | | Frontera Energy Corp. | | | 3,766 | |
| | 209,391 | | | Paragon Offshore Ltd., Litigation Units, Class A(a)(b)(d)(e)(f) | | | — | |
| | 299,302 | | | Paragon Offshore Ltd., Litigation Units, Class B(d)(f) | | | 1,496,510 | |
| | 2,021 | | | Southcross Holdings Group LLC(d)(f) | | | — | |
| | 2,021 | | | Southcross Holdings LP, Class A(a)(b)(d)(e)(f) | | | 133,992 | |
| | 1,271,624 | | | Whiting Petroleum Corp.(f) | | | 21,986,372 | |
| | | | | | | | |
| | | | | | | 24,380,991 | |
| | | | | | | | |
| |
| | | | Pharmaceuticals – 3.9% | |
| | 5,822,378 | | | Bristol-Myers Squibb Co. | | | 351,031,170 | |
| | | | | | | | |
| | |
| | | | Total Common Stocks
(Identified Cost $1,121,773,989) | | | 984,594,125 | |
| | | | | | | | |
|
| Preferred Stocks – 0.6% | |
|
| | Convertible Preferred Stocks – 0.4% | |
| | |
| | | | Banking – 0.2% | | | |
| | 11,443 | | | Bank of America Corp., Series L, 7.250% | | | 17,027,184 | |
| | | | | | | | |
| | |
| | | | Communications – 0.0% | | | |
| | 4,982 | | | Cincinnati Bell, Inc., Series B, 6.750% | | | 241,627 | |
| | | | | | | | |
| | |
| | | | Energy – 0.0% | | | |
| | 257,387 | | | Chesapeake Energy Corp., 4.500%(a)(b)(e)(f) | | | — | |
| | 503,052 | | | Chesapeake Energy Corp., 5.000%(a)(b)(e)(f) | | | — | |
| | 50,481 | | | Chesapeake Energy Corp., 5.750%(a)(b)(e)(f) | | | — | |
| | 3,044 | | | Chesapeake Energy Corp., 5.750%(a)(b)(e)(f) | | | — | |
| | 39,322 | | | Chesapeake Energy Corp., 5.750%, 144A(a)(b)(e)(f) | | | — | |
| | 16,454 | | | Chesapeake Energy Corp., 5.750%, 144A(a)(b)(e)(f) | | | — | |
| | | | | | | | |
| | | | | | | — | |
| | | | | | | | |
| | |
| | | | Midstream – 0.2% | | | |
| | 433,942 | | | El Paso Energy Capital Trust I, 4.750% | | | 20,295,467 | |
| | | | | | | | |
| | |
| | | | Total Convertible Preferred Stocks
(Identified Cost $174,382,772) | | | 37,564,278 | |
| | | | | | | | |
|
| Non-Convertible Preferred Stocks – 0.2% | |
| |
| | | | Electric – 0.0% | |
| | 2,925 | | | Connecticut Light & Power Co. (The), Series 1947, 1.900% | | | 139,084 | |
| | | | | | | | |
See accompanying notes to financial statements.
Portfolio of Investments – as of September 30, 2020
Loomis Sayles Bond Fund – continued
| | | | | | | | |
Shares | | | Description | | Value (†) | |
|
| Non-Convertible Preferred Stocks – continued | |
| |
| | | | Finance Companies – 0.0% | |
| | 16,004 | | | iStar, Inc., Series G, 7.650% | | $ | 390,177 | |
| | | | | | | | |
| |
| | | | Home Construction – 0.0% | |
| | 52,867 | | | Hovnanian Enterprises, Inc., 7.625%(f) | | | 375,356 | |
| | | | | | | | |
| |
| | | | REITs – Office Property – 0.0% | |
| | 2,318 | | | Highwoods Properties, Inc., Series A, 8.625% | | | 2,897,500 | |
| | | | | | | | |
| |
| | | | REITs – Warehouse/Industrials – 0.2% | |
| | 169,007 | | | Prologis, Inc., Series Q, 8.540% | | | 13,292,401 | |
| | | | | | | | |
| | |
| | | | Total Non-Convertible Preferred Stocks
(Identified Cost $11,111,452) | | | 17,094,518 | |
| | | | | | | | |
| | |
| | | | Total Preferred Stocks
(Identified Cost $185,494,224) | | | 54,658,796 | |
| | | | | | | | |
|
| Closed-End Investment Companies – 0.0% | |
| | 170,002 | | | NexPoint Strategic Opportunities Fund
(Identified Cost $9,807,937) | | | 1,472,217 | |
| | | | | | | | |
|
| Warrants – 0.1% | |
| | 629,465 | | | iHeartMedia, Inc., Expiration on 5/1/2039(f) | | | 4,957,037 | |
| | 2,721,374 | | | SM Energy Co., Expiration on 6/30/2023(a)(b)(e)(f) | | | 8,436 | |
| | | | | | | | |
| | |
| | | | Total Warrants
(Identified Cost $15,358,279) | | | 4,965,473 | |
| | | | | | | | |
| | |
| Principal
Amount (‡) |
| | | | | | |
| |
| Short-Term Investments – 3.4% | | | |
| | |
| | 16,704,156,763 | | | Central Bank of Iceland, 0.000%, (ISK)(g)(k) | | | 120,742,757 | |
| | |
| | 65,236,287 | | | Tri-Party Repurchase Agreement with Fixed Income Clearing Corporation, 9/30/2020 at 0.000% to be repurchased at $65,236,287 on 10/01/2020 collateralized by $66,546,300 U.S. Treasury Notes, 0.250% due 9/30/2025 valued at $66,541,109 including accrued interest (Note 2 of Notes to Financial Statements) | | | 65,236,287 | |
| | |
| | 125,000,000 | | | U.S. Treasury Bills, 0.096%, 11/27/2020(l) | | | 124,981,198 | |
| | | | | | | | |
| | |
| | | | Total Short-Term Investments
(Identified Cost $326,178,192) | | | 310,960,242 | |
| | | | | | | | |
| | |
| | | | Total Investments – 99.1%
(Identified Cost $9,735,587,321) | | | 8,965,756,872 | |
| | |
| | | | Other assets less liabilities—0.9% | | | 81,638,622 | |
| | | | | | | | |
| | |
| | | | Net Assets – 100.0% | | $ | 9,047,395,494 | |
| | | | | | | | |
See accompanying notes to financial statements.
Portfolio of Investments – as of September 30, 2020
Loomis Sayles Bond Fund – continued
| | | | | | |
| |
| | (†) | | | See Note 2 of Notes to Financial Statements. |
| |
| | (‡) | | | Principal Amount stated in U.S. dollars unless otherwise noted. |
| |
| | (††) | | | Amount shown represents units. One unit represents a principal amount of 25. |
| |
| | (†††) | | | Amount shown represents units. One unit represents a principal amount of 100. |
| |
| | (a) | | | Illiquid security. (Unaudited) |
| |
| | (b) | | | Level 3 security. Value has been determined using significant unobservable inputs. See Note 3 of Notes to Financial Statements. |
| |
| | (c) | | | Securities classified as fair valued pursuant to the Fund’s pricing policies and procedures. At September 30, 2020, the value of these securities amounted to $161,362,009 or 1.8% of net assets. See Note 2 of Notes to Financial Statements. |
| |
| | (d) | | | Securities subject to restriction on resale. At September 30, 2020, the restricted securities held by the Fund are as follows: |
| | | | | | | | | | | | | | |
| | | Acquisition
Date | | Acquisition
Cost | | | Value | | | % of
Net Assets | |
| | | | |
| GCA2014 Holdings Ltd., Series 2014-1, Class C | | 12/18/2014 | | $ | 20,724,545 | | | $ | 6,980,856 | | | | 0.1% | |
| | | | |
| GCA2014 Holdings Ltd., Series 2014-1, Class D | | 12/18/2014 | | | 9,318,741 | | | | 1,066,716 | | | | Less than 0.1% | |
| | | | |
| GCA2014 Holdings Ltd., Series 2014-1, Class E | | 12/18/2014 | | | 25,395,339 | | | | — | | | | — | |
| | | | |
| Paragon Offshore Ltd., Litigation Units, Class A | | 7/18/2017 | | | 1,451,033 | | | | — | | | | — | |
| | | | |
| Paragon Offshore Ltd., Litigation Units, Class B | | 7/18/2017 | | | 28,157,326 | | | | 1,496,510 | | | | Less than 0.1% | |
| | | | |
| Southcross Holdings Group LLC | | 4/29/2016 | | | — | | | | — | | | | — | |
| | | | |
| Southcross Holdings LP, Class A | | 4/29/2016 | | | 2,950,992 | | | | 133,992 | | | | Less than 0.1% | |
| | | | | | |
| | (e) | | | Fair valued by the Fund’s adviser. At September 30, 2020, the value of these securities amounted to $9,184,938 or 0.1% of net assets. See Note 2 of Notes to Financial Statements. |
| |
| | (f) | | | Non-income producing security. |
| |
| | (g) | | | Variable rate security. Rate as of September 30, 2020 is disclosed. |
| |
| | (h) | | | Perpetual bond with no specified maturity date. |
| |
| | (i) | | | The issuer is in default with respect to interest and/or principal payments. Income is not being accrued. |
| |
| | (j) | | | Interest rate represents annualized yield at time of purchase; not a coupon rate. |
| |
| | (k) | | | Security callable by issuer at any time. No specified maturity date. |
| |
| | (l) | | | Interest rate represents discount rate at time of purchase; not a coupon rate. |
| |
| | 144A | | | All or a portion of these securities are exempt from registration under Rule 144A of the Securities Act of 1933. These securities may be resold in transactions exempt from registration, normally to qualified institutional buyers. At September 30, 2020, the value of Rule 144A holdings amounted to $1,515,661,014 or 16.8% of net assets. |
| |
| | ABS | | | Asset-Backed Securities |
| |
| | EMTN | | | Euro Medium Term Note |
| |
| | FHLMC | | | Federal Home Loan Mortgage Corp. |
| |
| | GMTN | | | Global Medium Term Note |
| |
| | LIBOR | | | London Interbank Offered Rate |
| |
| | MTN | | | Medium Term Note |
| |
| | REITs | | | Real Estate Investment Trusts |
| |
| | AUD | | | Australian Dollar |
| |
| | BRL | | | Brazilian Real |
| |
| | CAD | | | Canadian Dollar |
| |
| | GBP | | | British Pound |
| |
| | ISK | | | Icelandic Krona |
| |
| | MXN | | | Mexican Peso |
| |
| | NOK | | | Norwegian Krone |
| |
| | NZD | | | New Zealand Dollar |
See accompanying notes to financial statements.
Portfolio of Investments – as of September 30, 2020
Loomis Sayles Bond Fund – continued
Industry Summary at September 30, 2020
| | | | |
Treasuries | | | 29.8 | % |
Banking | | | 5.9 | |
Finance Companies | | | 5.6 | |
Wirelines | | | 5.0 | |
Healthcare | | | 4.1 | |
Pharmaceuticals | | | 4.0 | |
Life Insurance | | | 3.6 | |
Diversified Telecommunication Services | | | 3.5 | |
Cable Satellite | | | 3.3 | |
Independent Energy | | | 2.7 | |
Automotive | | | 2.7 | |
Technology | | | 2.6 | |
Other Investments, less than 2% each | | | 22.9 | |
Short-Term Investments | | | 3.4 | |
Closed-End Investment Companies | | | 0.0 | * |
| | | | |
Total Investments | | | 99.1 | |
Other assets less liabilities | | | 0.9 | |
| | | | |
Net Assets | | | 100.0 | % |
| | | | |
* Less than 0.1%
Currency Exposure Summary at September 30, 2020
| | | | |
United States Dollar | | | 86.2 | % |
Mexican Peso | | | 6.1 | |
Other, less than 2% each | | | 6.8 | |
| | | | |
Total Investments | | | 99.1 | |
Other assets less liabilities | | | 0.9 | |
| | | | |
Net Assets | | | 100.0 | % |
| | | | |
See accompanying notes to financial statements.
Statement of Assets and Liabilities
September 30, 2020
| | | | |
ASSETS | |
Investments at cost | | $ | 9,735,587,321 | |
Net unrealized depreciation | | | (769,830,449 | ) |
| | | | |
Investments at value | | | 8,965,756,872 | |
Cash | | | 353,430 | |
Foreign currency at value
(identified cost $1,336,407) | | | 1,342,969 | |
Receivable for Fund shares sold | | | 7,577,328 | |
Dividends and interest receivable | | | 88,777,864 | |
Prepaid expenses (Note 7) | | | 1,197 | |
| | | | |
TOTAL ASSETS | | | 9,063,809,660 | |
| | | | |
LIABILITIES | |
Payable for Fund shares redeemed | | | 9,450,994 | |
Management fees payable (Note 5) | | | 3,908,671 | |
Deferred Trustees’ fees (Note 5) | | | 2,218,249 | |
Administrative fees payable (Note 5) | | | 329,587 | |
Payable to distributor (Note 5d) | | | 74,266 | |
Other accounts payable and accrued expenses | | | 432,399 | |
| | | | |
TOTAL LIABILITIES | | | 16,414,166 | |
| | | | |
NET ASSETS | | $ | 9,047,395,494 | |
| | | | |
NET ASSETS CONSIST OF: | |
Paid-in capital | | $ | 10,039,331,824 | |
Accumulated loss | | | (991,936,330 | ) |
| | | | |
NET ASSETS | | $ | 9,047,395,494 | |
| | | | |
|
COMPUTATION OF NET ASSET VALUE AND OFFERING PRICE: | |
Institutional Class: | |
Net assets | | $ | 6,668,480,946 | |
| | | | |
Shares of beneficial interest | | | 509,077,501 | |
| | | | |
Net asset value, offering and redemption price per share | | $ | 13.10 | |
| | | | |
Retail Class: | |
Net assets | | $ | 1,474,316,035 | |
| | | | |
Shares of beneficial interest | | | 113,176,028 | |
| | | | |
Net asset value, offering and redemption price per share | | $ | 13.03 | |
| | | | |
Admin Class shares: | |
Net assets | | $ | 51,039,592 | |
| | | | |
Shares of beneficial interest | | | 3,934,419 | |
| | | | |
Net asset value, offering and redemption price per share | | $ | 12.97 | |
| | | | |
Class N shares: | |
Net assets | | $ | 853,558,921 | |
| | | | |
Shares of beneficial interest | | | 65,242,402 | |
| | | | |
Net asset value, offering and redemption price per share | | $ | 13.08 | |
| | | | |
See accompanying notes to financial statements.
Statement of Operations
For the Year Ended September 30, 2020
| | | | |
INVESTMENT INCOME | |
Interest from unaffiliated investments | | $ | 367,682,907 | |
Interest from affiliated investments (Note 5) | | | 293,904 | |
Dividends | | | 52,213,085 | |
Less net foreign taxes withheld | | | (87,681 | ) |
| | | | |
| | | 420,102,215 | |
| | | | |
Expenses | |
Management fees (Note 5) | | | 51,666,632 | |
Service and distribution fees (Note 5) | | | 4,690,456 | |
Administrative fees (Note 5) | | | 4,299,300 | |
Trustees’ fees and expenses (Note 5) | | | 627,157 | |
Transfer agent fees and expenses (Notes 5 and 6) | | | 6,820,982 | |
Audit and tax services fees | | | 64,256 | |
Custodian fees and expenses | | | 478,242 | |
Legal fees (Note 7) | | | 241,946 | |
Registration fees | | | 199,834 | |
Shareholder reporting expenses | | | 350,707 | |
Miscellaneous expenses (Note 7) | | | 284,950 | |
| | | | |
Total expenses | | | 69,724,462 | |
Less waiver and/or expense reimbursement (Note 5) | | | (319,980 | ) |
| | | | |
Net expenses | | | 69,404,482 | |
| | | | |
Net investment income | | | 350,697,733 | |
| | | | |
| |
NET REALIZED AND UNREALIZED GAIN (LOSS) ON INVESTMENTS AND FOREIGN CURRENCY TRANSACTIONS | | | | |
Net realized loss on: | |
Unaffiliated investments | | | (115,264,136 | ) |
Affiliated investments (Note 5) | | | (16,997,878 | ) |
Foreign currency transactions (Note 2c) | | | (2,467,204 | ) |
Net change in unrealized appreciation (depreciation) on: | |
Unaffiliated investments | | | (336,314,465 | ) |
Affiliated investments (Note 5) | | | 12,188,974 | |
Foreign currency translations (Note 2c) | | | 657,173 | |
| | | | |
Net realized and unrealized loss on investments and foreign currency transactions | | | (458,197,536 | ) |
| | | | |
| |
NET DECREASE IN NET ASSETS RESULTING FROM OPERATIONS | | $ | (107,499,803 | ) |
| | | | |
See accompanying notes to financial statements.
Statement of Changes in Net Assets
| | | | | | | | |
| | | Year Ended
September 30,
2020 | | | Year Ended
September 30,
2019 | |
FROM OPERATIONS: | |
Net investment income | | $ | 350,697,733 | | | $ | 448,515,423 | |
Net realized gain (loss) on investments and foreign currency transactions | | | (134,729,218 | ) | | | 24,576,670 | |
Net change in unrealized appreciation (depreciation) on investments and foreign currency translations | | | (323,468,318 | ) | | | 7,816,158 | |
| | | | | | | | |
Net increase (decrease) in net assets resulting from operations | | | (107,499,803 | ) | | | 480,908,251 | |
| | | | | | | | |
FROM DISTRIBUTIONS TO SHAREHOLDERS: | |
Institutional Class | | | (254,323,638 | ) | | | (334,548,005 | ) |
Retail Class | | | (57,798,889 | ) | | | (81,827,929 | ) |
Admin Class | | | (2,055,462 | ) | | | (3,617,633 | ) |
Class N | | | (27,248,637 | ) | | | (18,399,820 | ) |
| | | | | | | | |
Total distributions | | | (341,426,626 | ) | | | (438,393,387 | ) |
| | | | | | | | |
NET DECREASE IN NET ASSETS FROM CAPITAL SHARE TRANSACTIONS (NOTE 9) | | | (1,148,728,878 | ) | | | (1,508,711,343 | ) |
| | | | | | | | |
Net decrease in net assets | | | (1,597,655,307 | ) | | | (1,466,196,479 | ) |
NET ASSETS | |
Beginning of the year | | | 10,645,050,801 | | | | 12,111,247,280 | |
| | | | | | | | |
End of the year | | $ | 9,047,395,494 | | | $ | 10,645,050,801 | |
| | | | | | | | |
See accompanying notes to financial statements.
Financial Highlights
For a share outstanding throughout each period.
| | | | | | | | | | | | | | | | | | | | | | | | |
| | | Institutional Class | | | | |
| | | Year Ended
September 30,
2020 | | | Year Ended
September 30,
2019 | | | Year Ended
September 30,
2018 | | | Year Ended
September 30,
2017 | | | Year Ended
September 30,
2016 | | | | |
Net asset value, beginning of the period | | $ | 13.66 | | | $ | 13.57 | | | $ | 14.28 | | | $ | 14.04 | | | $ | 13.65 | | | | | |
| | | | |
INCOME (LOSS) FROM INVESTMENT OPERATIONS: | | | | | | | | | | | | | | | | | | | | | | | | |
Net investment income(a) | | | 0.48 | | | | 0.55 | | | | 0.49 | | | | 0.53 | | | | 0.56 | | | | | |
Net realized and unrealized gain (loss) | | | (0.57 | ) | | | 0.08 | | | | (0.37 | ) | | | 0.28 | | | | 0.62 | | | | | |
| | | | |
Total from Investment Operations | | | (0.09 | ) | | | 0.63 | | | | 0.12 | | | | 0.81 | | | | 1.18 | | | | | |
| | | | |
LESS DISTRIBUTIONS FROM: | | | | | | | | | | | | | | | | | | | | | | | | |
Net investment income | | | (0.45 | ) | | | (0.50 | ) | | | (0.54 | ) | | | (0.43 | ) | | | (0.29 | ) | | | | |
Net realized capital gains | | | (0.02 | ) | | | (0.04 | ) | | | (0.29 | ) | | | (0.14 | ) | | | (0.50 | ) | | | | |
| | | | |
Total Distributions | | | (0.47 | ) | | | (0.54 | ) | | | (0.83 | ) | | | (0.57 | ) | | | (0.79 | ) | | | | |
| | | | |
Net asset value, end of the period | | $ | 13.10 | | | $ | 13.66 | | | $ | 13.57 | | | $ | 14.28 | | | $ | 14.04 | | | | | |
| | | | |
Total return | | | (0.73 | )% | | | 4.88 | % | | | 0.97 | % | | | 5.99 | % | | | 9.17 | % | | | | |
RATIOS TO AVERAGE NET ASSETS: | | | | | | | | | | | | | | | | | | | | | | | | |
Net assets, end of the period (000’s) | | $ | 6,668,481 | | | $ | 8,071,961 | | | $ | 9,025,850 | | | $ | 9,785,854 | | | $ | 10,045,427 | | | | | |
Net expenses | | | 0.67 | % | | | 0.67 | % | | | 0.66 | % | | | 0.66 | % | | | 0.66 | % | | | | |
Gross expenses | | | 0.67 | % | | | 0.67 | % | | | 0.66 | % | | | 0.66 | % | | | 0.66 | % | | | | |
Net investment income | | | 3.65 | % | | | 4.12 | % | | | 3.59 | % | | | 3.80 | % | | | 4.21 | % | | | | |
Portfolio turnover rate | | | 25 | % | | | 17 | % | | | 7 | % | | | 9 | % | | | 13 | % | | | | |
| (a) | Per share net investment income has been calculated using the average shares outstanding during the period. |
See accompanying notes to financial statements.
Financial Highlights – continued
For a share outstanding throughout each period.
| | | | | | | | | | | | | | | | | | | | | | | | |
| | | Retail Class | | | | |
| | | Year Ended
September 30,
2020 | | | Year Ended
September 30,
2019 | | | Year Ended
September 30,
2018 | | | Year Ended
September 30,
2017 | | | Year Ended
September 30,
2016 | | | | |
Net asset value, beginning of the period | | $ | 13.59 | | | $ | 13.49 | | | $ | 14.21 | | | $ | 13.97 | | | $ | 13.59 | | | | | |
| | | | |
INCOME (LOSS) FROM INVESTMENT OPERATIONS: | | | | | | | | | | | | | | | | | | | | | | | | |
Net investment income(a) | | | 0.45 | | | | 0.52 | | | | 0.46 | | | | 0.50 | | | | 0.53 | | | | | |
Net realized and unrealized gain (loss) | | | (0.57 | ) | | | 0.08 | | | | (0.38 | ) | | | 0.28 | | | | 0.61 | | | | | |
| | | | |
Total from Investment Operations | | | (0.12 | ) | | | 0.60 | | | | 0.08 | | | | 0.78 | | | | 1.14 | | | | | |
| | | | |
LESS DISTRIBUTIONS FROM: | | | | | | | | | | | | | | | | | | | | | | | | |
Net investment income | | | (0.42 | ) | | | (0.46 | ) | | | (0.51 | ) | | | (0.40 | ) | | | (0.26 | ) | | | | |
Net realized capital gains | | | (0.02 | ) | | | (0.04 | ) | | | (0.29 | ) | | | (0.14 | ) | | | (0.50 | ) | | | | |
| | | | |
Total Distributions | | | (0.44 | ) | | | (0.50 | ) | | | (0.80 | ) | | | (0.54 | ) | | | (0.76 | ) | | | | |
| | | | |
Net asset value, end of the period | | $ | 13.03 | | | $ | 13.59 | | | $ | 13.49 | | | $ | 14.21 | | | $ | 13.97 | | | | | |
| | | | |
Total return | | | (0.99 | )% | | | 4.72 | %(b) | | | 0.64 | % | | | 5.75 | % | | | 8.86 | % | | | | |
RATIOS TO AVERAGE NET ASSETS: | | | | | | | | | | | | | | | | | | | | | | | | |
Net assets, end of the period (000’s) | | $ | 1,474,316 | | | $ | 2,019,828 | | | $ | 2,520,105 | | | $ | 3,496,126 | | | $ | 4,495,997 | | | | | |
Net expenses | | | 0.92 | % | | | 0.91 | %(c) | | | 0.91 | % | | | 0.91 | % | | | 0.91 | % | | | | |
Gross expenses | | | 0.92 | % | | | 0.92 | % | | | 0.91 | % | | | 0.91 | % | | | 0.91 | % | | | | |
Net investment income | | | 3.41 | % | | | 3.88 | % | | | 3.33 | % | | | 3.56 | % | | | 3.97 | % | | | | |
Portfolio turnover rate | | | 25 | % | | | 17 | % | | | 7 | % | | | 9 | % | | | 13 | % | | | | |
| (a) | Per share net investment income has been calculated using the average shares outstanding during the period. |
| (b) | Had certain expenses not been waived/reimbursed during the period, total returns would have been lower. |
| (c) | The administrator agreed to waive its fees and/or reimburse a portion of the Fund’s expenses during the period. Without this waiver/reimbursement, expenses would have been higher. |
See accompanying notes to financial statements.
Financial Highlights – continued
For a share outstanding throughout each period.
| | | | | | | | | | | | | | | | | | | | | | | | |
| | | Admin Class | | | | |
| | | Year Ended
September 30,
2020 | | | Year Ended
September 30,
2019 | | | Year Ended
September 30,
2018 | | | Year Ended
September 30,
2017 | | | Year Ended
September 30,
2016 | | | | |
Net asset value, beginning of the period | | $ | 13.53 | | | $ | 13.44 | | | $ | 14.16 | | | $ | 13.92 | | | $ | 13.54 | | | | | |
| | | | |
INCOME (LOSS) FROM INVESTMENT OPERATIONS: | | | | | | | | | | | | | | | | | | | | | | | | |
Net investment income(a) | | | 0.42 | | | | 0.48 | | | | 0.42 | | | | 0.46 | | | | 0.49 | | | | | |
Net realized and unrealized gain (loss) | | | (0.58 | ) | | | 0.08 | | | | (0.38 | ) | | | 0.28 | | | | 0.62 | | | | | |
| | | | |
Total from Investment Operations | | | (0.16 | ) | | | 0.56 | | | | 0.04 | | | | 0.74 | | | | 1.11 | | | | | |
| | | | |
LESS DISTRIBUTIONS FROM: | | | | | | | | | | | | | | | | | | | | | | | | |
Net investment income | | | (0.38 | ) | | | (0.43 | ) | | | (0.47 | ) | | | (0.36 | ) | | | (0.23 | ) | | | | |
Net realized capital gains | | | (0.02 | ) | | | (0.04 | ) | | | (0.29 | ) | | | (0.14 | ) | | | (0.50 | ) | | | | |
| | | | |
Total Distributions | | | (0.40 | ) | | | (0.47 | ) | | | (0.76 | ) | | | (0.50 | ) | | | (0.73 | ) | | | | |
| | | | |
Net asset value, end of the period | | $ | 12.97 | | | $ | 13.53 | | | $ | 13.44 | | | $ | 14.16 | | | $ | 13.92 | | | | | |
| | | | |
Total return | | | (1.24 | )% | | | 4.40 | %(b) | | | 0.38 | % | | | 5.51 | % | | | 8.64 | % | | | | |
RATIOS TO AVERAGE NET ASSETS: | | | | | | | | | | | | | | | | | | | | | | | | |
Net assets, end of the period (000’s) | | $ | 51,040 | | | $ | 84,028 | | | $ | 121,683 | | | $ | 170,436 | | | $ | 185,902 | | | | | |
Net expenses | | | 1.17 | % | | | 1.16 | %(c) | | | 1.16 | % | | | 1.16 | % | | | 1.16 | % | | | | |
Gross expenses | | | 1.17 | % | | | 1.17 | % | | | 1.16 | % | | | 1.16 | % | | | 1.16 | % | | | | |
Net investment income | | | 3.19 | % | | | 3.63 | % | | | 3.08 | % | | | 3.31 | % | | | 3.72 | % | | | | |
Portfolio turnover rate | | | 25 | % | | | 17 | % | | | 7 | % | | | 9 | % | | | 13 | % | | | | |
| (a) | Per share net investment income has been calculated using the average shares outstanding during the period. |
| (b) | Had certain expenses not been waived/reimbursed during the period, total returns would have been lower. |
| (c) | The administrator agreed to waive its fees and/or reimburse a portion of the Fund’s expenses during the period. Without this waiver/reimbursement, expenses would have been higher. |
See accompanying notes to financial statements.
Financial Highlights – continued
For a share outstanding throughout each period.
| | | | | | | | | | | | | | | | | | | | | | | | |
| | | Class N | | | | |
| | | Year Ended
September 30,
2020 | | | Year Ended
September 30,
2019 | | | Year Ended
September 30,
2018 | | | Year Ended
September 30,
2017 | | | Year Ended
September 30,
2016 | | | | |
Net asset value, beginning of the period | | $ | 13.64 | | | $ | 13.55 | | | $ | 14.27 | | | $ | 14.02 | | | $ | 13.64 | | | | | |
| | | | |
INCOME (LOSS) FROM INVESTMENT OPERATIONS: | | | | | | | | | | | | | | | | | | | | | | | | |
Net investment income(a) | | | 0.48 | | | | 0.56 | | | | 0.50 | | | | 0.54 | | | | 0.57 | | | | | |
Net realized and unrealized gain (loss) | | | (0.56 | ) | | | 0.08 | | | | (0.38 | ) | | | 0.29 | | | | 0.61 | | | | | |
| | | | |
Total from Investment Operations | | | (0.08 | ) | | | 0.64 | | | | 0.12 | | | | 0.83 | | | | 1.18 | | | | | |
| | | | |
LESS DISTRIBUTIONS FROM: | | | | | | | | | | | | | | | | | | | | | | | | |
Net investment income | | | (0.46 | ) | | | (0.51 | ) | | | (0.55 | ) | | | (0.44 | ) | | | (0.30 | ) | | | | |
Net realized capital gains | | | (0.02 | ) | | | (0.04 | ) | | | (0.29 | ) | | | (0.14 | ) | | | (0.50 | ) | | | | |
| | | | |
Total Distributions | | | (0.48 | ) | | | (0.55 | ) | | | (0.84 | ) | | | (0.58 | ) | | | (0.80 | ) | | | | |
| | | | |
Net asset value, end of the period | | $ | 13.08 | | | $ | 13.64 | | | $ | 13.55 | | | $ | 14.27 | | | $ | 14.02 | | | | | |
| | | | |
Total return | | | (0.66 | )% | | | 4.97 | % | | | 0.97 | % | | | 6.14 | % | | | 9.18 | % | | | | |
RATIOS TO AVERAGE NET ASSETS: | | | | | | | | | | | | | | | | | | | | | | | | |
Net assets, end of the period (000’s) | | $ | 853,559 | | | $ | 469,234 | | | $ | 443,609 | | | $ | 224,074 | | | $ | 113,335 | | | | | |
Net expenses | | | 0.60 | % | | | 0.59 | % | | | 0.59 | % | | | 0.59 | % | | | 0.58 | % | | | | |
Gross expenses | | | 0.60 | % | | | 0.59 | % | | | 0.59 | % | | | 0.59 | % | | | 0.58 | % | | | | |
Net investment income | | | 3.65 | % | | | 4.20 | % | | | 3.68 | % | | | 3.83 | % | | | 4.28 | % | | | | |
Portfolio turnover rate | | | 25 | % | | | 17 | % | | | 7 | % | | | 9 | % | | | 13 | % | | | | |
| (a) | Per share net investment income has been calculated using the average shares outstanding during the period. |
See accompanying notes to financial statements.
Notes to Financial Statements
September 30, 2020
1. Organization. Loomis Sayles Funds I (the “Trust”) is organized as a Massachusetts business trust. The Trust is registered under the Investment Company Act of 1940, as amended (the “1940 Act”) as an open-end management investment company. The Declaration of Trust permits the Board of Trustees to authorize the issuance of an unlimited number of shares of the Trust in multiple series. The financial statements for certain funds of the Trust are presented in separate reports. Information presented in these financial statements pertains to Loomis Sayles Bond Fund (the “Fund”).
Effective July 15, 2020, the Fund’s investment strategies were revised to allow the Fund to invest up to 20% of its assets in common stocks, from 10% previously.
The Fund is a diversified investment company.
The Fund offers Institutional Class, Retail Class, Admin Class and Class N shares.
Each share class is sold without a sales charge. Retail Class and Admin Class shares pay a Rule 12b-1 fee. Admin Class shares are primarily intended for employer-sponsored retirement plans and are offered exclusively through intermediaries. Class N shares do not pay a front-end sales charge, a contingent deferred sales charge (“CDSC”) or Rule 12b-1 fees. Class N shares are offered with an initial minimum investment of $1,000,000. Institutional Class shares are intended for institutional investors with a minimum initial investment of $100,000. Certain categories of investors are exempted from the minimum investment amounts for Class N and Institutional Class as outlined in the Fund’s prospectus.
Most expenses can be directly attributed to a Fund. Expenses which cannot be directly attributed to a Fund are generally apportioned based on the relative net assets of each of the funds in Natixis Funds Trust I, Natixis Funds Trust II, Natixis Funds Trust IV, and Gateway Trust (“Natixis Funds Trusts”), and Loomis Sayles Funds I and Loomis Sayles Funds II (“Loomis Sayles Funds Trusts”), and Natixis ETF Trust and Natixis ETF Trust II (“Natixis ETF Trusts”). Expenses of the Fund are borne pro rata by the holders of each class of shares, except that each class bears expenses unique to that class (such as the Rule 12b-1 fees applicable to Retail Class and Admin Class) and transfer agent fees are borne collectively for Institutional Class, Retail Class, and Admin Class, and individually for Class N. In addition, each class votes as a class only with respect to its own Rule 12b-1 Plan. Shares of each class would receive their pro rata share of the net assets of the Fund if the Fund were liquidated. The Trustees approve separate distributions from net investment income on each class of shares.
2. Significant Accounting Policies. The following is a summary of significant accounting policies consistently followed by the Fund in the preparation of its financial statements. The Fund’s financial statements follow the accounting and reporting guidelines provided for investment companies and are prepared in accordance with accounting principles generally accepted in the United States of America which require the use of management estimates that affect the reported amounts and disclosures in the financial statements.
Notes to Financial Statements – continued
September 30, 2020
Actual results could differ from those estimates. Management has evaluated the events and transactions subsequent to year-end through the date the financial statements were issued and has determined that there were no material events that would require disclosure in the Fund’s financial statements.
a. Valuation. Fund securities and other investments are valued at market value based on market quotations obtained or determined by independent pricing services recommended by the adviser and approved by the Board of Trustees. Fund securities and other investments for which market quotations are not readily available are valued at fair value as determined in good faith by the adviser pursuant to procedures approved by the Board of Trustees, as described below. Market value is determined as follows:
Debt securities and unlisted preferred equity securities are valued based on evaluated bids furnished to the Fund by an independent pricing service or bid prices obtained from broker-dealers. Senior loans are valued at bid prices supplied by an independent pricing service, if available. Listed equity securities (including shares of closed-end investment companies and exchange-traded funds) are valued at the last sale price quoted on the exchange where they are traded most extensively or, if there is no reported sale during the day, the closing bid quotation as reported by an independent pricing service. Securities traded on the NASDAQ Global Select Market, NASDAQ Global Market and NASDAQ Capital Market are valued at the NASDAQ Official Closing Price (“NOCP”), or if lacking an NOCP, at the most recent bid quotations on the applicable NASDAQ Market. Unlisted equity securities (except unlisted preferred equity securities) are valued at the last sale price quoted in the market where they are traded most extensively or, if there is no reported sale during the day, the closing bid quotation as reported by an independent pricing service. If there is no last sale price or closing bid quotation available, unlisted equity securities will be valued using evaluated bids furnished by an independent pricing service, if available. In some foreign markets, an official close price and a last sale price may be available from the foreign exchange or market. In those cases, the official close price is used. Broker-dealer bid prices may be used to value debt and unlisted equity securities and senior loans where an independent pricing service is unable to price a security or where an independent pricing service does not provide a reliable price for the security.
Fund securities and other investments for which market quotations are not readily available are valued at fair value as determined in good faith by the adviser pursuant to procedures approved by the Board of Trustees. The Fund may also value securities and other investments at fair value in other circumstances such as when extraordinary events occur after the close of a foreign market but prior to the close of the New York Stock Exchange. This may include situations relating to a single issuer (such as a declaration of bankruptcy or a delisting of the issuer’s security from the primary market on which it has traded) as well as events affecting the securities markets in general (such as market disruptions or closings and significant fluctuations in U.S. and/or foreign markets). When fair valuing its securities or other investments, the Fund may, among other things, use
Notes to Financial Statements – continued
September 30, 2020
modeling tools or other processes that may take into account factors such as securities or other market activity and/or significant events that occur after the close of the foreign market and before the time the Fund’s net asset value (“NAV”) is calculated. Fair value pricing may require subjective determinations about the value of a security, and fair values used to determine a Fund’s NAV may differ from quoted or published prices, or from prices that are used by others, for the same securities. In addition, the use of fair value pricing may not always result in adjustments to the prices of securities held by the Fund.
Illiquid securities for which market quotations are readily available and have been evaluated by the adviser are considered and classified as fair valued securities pursuant to the Fund’s pricing policies and procedures.
As of September 30, 2020, securities held by the Fund were fair valued as follows:
| | | | | | |
Securities
classified as
fair valued | | Percentage of
Net Assets | | Securities fair
valued by the
Fund’s adviser | | Percentage of
Net Assets |
| $161,362,009 | | 1.8% | | $9,184,938 | | 0.1% |
b. Investment Transactions and Related Investment Income. Investment transactions are accounted for on a trade date plus one day basis for daily NAV calculation. However, for financial reporting purposes, investment transactions are reported on trade date. Dividend income (including income reinvested) and foreign withholding tax, if applicable, is recorded on the ex-dividend date, or in the case of certain foreign securities, as soon as the Fund is notified, and interest income is recorded on an accrual basis. Interest income is increased by the accretion of discount and decreased by the amortization of premium, if applicable. Distributions received from investments in securities that represent a return of capital or capital gain are recorded as a reduction of cost of investments or as a realized gain, respectively. In determining net gain or loss on securities sold, the cost of securities has been determined on an identified cost basis. Investment income, non-class specific expenses and realized and unrealized gains and losses are allocated on a pro rata basis to each class based on the relative net assets of each class to the total net assets of the Fund.
c. Foreign Currency Translation. The books and records of the Fund are maintained in U.S. dollars. The values of securities, currencies and other assets and liabilities denominated in currencies other than U.S. dollars, if any, are translated into U.S. dollars based upon foreign exchange rates prevailing at the end of the period. Purchases and sales of investment securities, income and expenses are translated into U.S. dollars on the respective dates of such transactions.
Net realized foreign exchange gains or losses arise from sales of foreign currency, changes in exchange rates between the trade and settlement dates on securities transactions and the difference between the amounts of dividends, interest and foreign withholding taxes recorded on the Fund’s books and the U.S. dollar equivalent of the amounts actually received or paid. Net unrealized foreign exchange gains or losses arise from changes in the value of assets and liabilities, other than investment securities, as of the end of the fiscal
Notes to Financial Statements – continued
September 30, 2020
period, resulting from changes in exchange rates. Net realized foreign exchange gains or losses and the net change in unrealized foreign exchange gains or losses are disclosed in the Statement of Operations. For federal income tax purposes, net realized foreign exchange gains or losses are characterized as ordinary income and may, if the Fund has net losses, reduce the amount of income available to be distributed by the Fund.
The values of investment securities are presented at the foreign exchange rates prevailing at the end of the period for financial reporting purposes. Net realized and unrealized gains or losses on investments reported in the Statement of Operations reflect gains or losses resulting from changes in exchange rates and fluctuations which arise due to changes in market prices of investment securities. For federal income tax purposes, a portion of the net realized gain or loss on investments arising from changes in exchange rates, which is reflected in the Statement of Operations, may be characterized as ordinary income and may, if the Fund has net losses, reduce the amount of income available to be distributed by the Fund.
During the year ended September 30, 2020, the amount of income available to be distributed by the Fund has been reduced by $51,566,142 as a result of losses arising from changes in exchange rates.
The Fund may use foreign currency exchange contracts to facilitate transactions in foreign-denominated investments. Losses may arise from changes in the value of the foreign currency or if the counterparties do not perform under the contracts’ terms.
d. When-Issued and Delayed Delivery Transactions. The Fund may enter into when-issued or delayed delivery transactions. When-issued refers to transactions made conditionally because a security, although authorized, has not been issued. Delayed delivery refers to transactions for which delivery or payment will occur at a later date, beyond the normal settlement period. The price of when-issued and delayed delivery securities and the date when the securities will be delivered and paid for are fixed at the time the transaction is negotiated. The security and the obligation to pay for it are recorded by the Fund at the time the commitment is entered into. The value of the security may vary with market fluctuations during the time before the Fund takes delivery of the security. No interest accrues to the Fund until the transaction settles.
Delayed delivery transactions include those designated as To Be Announced (“TBAs”) in the Portfolios of Investments. For TBAs, the actual security that will be delivered to fulfill the transaction is not designated at the time of the trade. The security is “to be announced” 48 hours prior to the established trade settlement date. Certain transactions require the Fund or counterparty to post cash and/or securities as collateral for the net mark-to-market exposure to the other party. The Fund covers its net obligations under outstanding delayed delivery commitments by segregating or earmarking cash or securities at the custodian.
Notes to Financial Statements – continued
September 30, 2020
Purchases of when-issued or delayed delivery securities may have a similar effect on the Fund’s NAV as if the Fund had created a degree of leverage in the portfolio. Risks may arise upon entering into such transactions from the potential inability of counterparties to meet their obligations under the transactions. Additionally, losses may arise due to changes in the value of the underlying securities.
There were no when-issued or delayed delivery securities held by the Fund as of September 30, 2020.
e. Federal and Foreign Income Taxes. The Fund intends to meet the requirements of the Internal Revenue Code of 1986, as amended, applicable to regulated investment companies, and to distribute to its shareholders substantially all of its net investment income and any net realized capital gains at least annually. Management has performed an analysis of the Fund’s tax positions for the open tax years as of September 30, 2020 and has concluded that no provisions for income tax are required. The Fund’s federal tax returns for the prior three fiscal years remain subject to examination by the Internal Revenue Service. Management is not aware of any events that are reasonably possible to occur in the next twelve months that would result in the amounts of any unrecognized tax benefits significantly increasing or decreasing for the Fund. However, management’s conclusions regarding tax positions taken may be subject to review and adjustment at a later date based on factors including, but not limited to, new tax laws and accounting regulations and interpretations thereof.
The Fund may be subject to foreign withholding taxes on investment income and taxes on capital gains on investments that are accrued and paid based upon the Fund’s understanding of the tax rules and regulations that exist in the countries in which the Fund invests. Foreign withholding taxes on dividend and interest income are reflected on the Statement of Operations as a reduction of investment income, net of amounts eligible to be reclaimed. Dividends and interest receivable on the Statement of Assets and Liabilities are net of foreign withholding taxes. Foreign withholding taxes where reclaims have been or will be filed are reflected on the Statement of Assets and Liabilities as tax reclaims receivable. Capital gains taxes paid are included in net realized gain (loss) on investments in the Statement of Operations. Accrued but unpaid capital gains taxes are reflected as foreign taxes payable on the Statement of Assets and Liabilities, if applicable, and reduce unrealized gains on investments. In the event that realized gains on investments are subsequently offset by realized losses, taxes paid on realized gains may be returned to the Fund. Such amounts, if applicable, are reflected as foreign tax rebates receivable on the Statement of Assets and Liabilities and are recorded as a realized gain when received.
f. Dividends and Distributions to Shareholders. Dividends and distributions are recorded on the ex-dividend date. The timing and characterization of certain income and capital gain distributions are determined in accordance with federal tax regulations, which may differ from accounting principles generally accepted in the United States of America. Permanent differences are primarily due to differing treatments for book and tax purposes
Notes to Financial Statements – continued
September 30, 2020
of items such as foreign currency gains and losses, defaulted and/or non-income producing securities, deferred Trustees’ fees, partnership basis adjustments, premium amortization, convertible bonds, contingent payment debt instruments, corporate actions, distribution re-designations, return of capital distributions received, capital gain distributions received, trust preferred securities and paydown gains and losses. Permanent book and tax basis differences relating to shareholder distributions, net investment income and net realized gains will result in reclassifications to capital accounts reported on the Statements of Assets and Liabilities. Temporary differences between book and tax distributable earnings are primarily due to deferred Trustees’ fees, wash sales, premium amortization, convertible bonds, defaulted and/or non-income producing securities, return of capital distributions received, trust preferred securities, partnership basis adjustments, corporate actions, paydown gains and losses, capital gain distributions received, foreign currency gains and losses and contingent payment debt instruments. Amounts of income and capital gain available to be distributed on a tax basis are determined annually, and at other times during the Funds’ fiscal year as may be necessary to avoid knowingly declaring and paying a return of capital distribution. Distributions from net investment income and net realized short-term capital gains are reported as distributed from ordinary income for tax purposes.
The tax characterization of distributions is determined on an annual basis. The tax character of distributions paid to shareholders during the years ended September 30, 2020 and 2019 were as follows:
| | | | | | | | | | |
2020 Distributions Paid From: | | 2019 Distributions Paid From: |
Ordinary
Income | | Long-Term
Capital Gains | | Total | | Ordinary
Income | | Long-Term
Capital Gains | | Total |
| $329,048,727 | | $12,377,899 | | $341,426,626 | | $402,223,224 | | $36,170,163 | | $438,393,387 |
Distributions paid to shareholders from net investment income and net realized capital gains, based on accounting principles generally accepted in the United States of America, are consolidated and reported on the Statement of Changes in Net Assets as Distributions to Shareholders. Distributions paid to shareholders from net investment income and net realized capital gains expressed in per-share amounts, based on accounting principles generally accepted in the United States of America, are separately stated and reported within the Financial Highlights.
As of September 30, 2020, the components of distributable earnings on a tax basis were as follows:
| | | | |
Undistributed ordinary income | | $ | 16,616,635 | |
| | | | |
Capital loss carryforward: | |
Long-term: | |
No expiration date | | | (110,979,143 | ) |
| | | | |
Unrealized depreciation | | | (869,873,008 | ) |
| | | | |
Total accumulated losses | | $ | (964,235,516 | ) |
| | | | |
Notes to Financial Statements – continued
September 30, 2020
As of September 30, 2020, unrealized appreciation (depreciation) as a component of distributable earnings was as follows:
| | | | |
Unrealized appreciation (depreciation) | | | | |
Investments | | $ | (257,328,024 | ) |
Foreign currency translations | | | (612,544,984 | ) |
| | | | |
Total unrealized depreciation | | $ | (869,873,008 | ) |
| | | | |
As of September 30, 2020, the tax cost of investments and unrealized appreciation (depreciation) on a federal tax basis were as follows:
| | | | |
Federal tax cost | | $ | 9,835,692,510 | |
| | | | |
Gross tax appreciation | | $ | 851,122,461 | |
Gross tax depreciation | | | (1,721,058,099 | ) |
| | | | |
Net tax depreciation | | $ | (869,935,638 | ) |
| | | | |
The difference between these amounts and those reported in the preceding table are primarily attributable to foreign currency mark-to-market.
g. Senior Loans. The Fund may invest in senior loans to corporate, governmental or other borrowers. Senior loans, which include both secured and unsecured loans made by banks and other financial institutions to corporate customers, typically hold the most senior position in a borrower’s capital structure, may be secured by the borrower’s assets and have interest rates that reset frequently. Senior Loans can include term loans, revolving credit facility loans and second lien loans. A senior loan is often administered by a bank or other financial institution that acts as agent for all holders. The agent administers the terms of the senior loan, as specified in the loan agreement. Large loans may be shared or syndicated among several lenders. The Fund may enter into the primary syndicate for a loan or it may also purchase all or a portion of loans from other lenders (sometimes referred to as loan assignments), in either case becoming a direct lender. Senior loans outstanding at the end of the period are listed in the Fund’s Portfolio of Investments.
h. Repurchase Agreements. The Fund may enter into repurchase agreements, under the terms of a Master Repurchase Agreement, under which the Fund acquires securities as collateral and agrees to resell the securities at an agreed upon time and at an agreed upon price. It is the Fund’s policy that the market value of the collateral for repurchase agreements be at least equal to 102% of the repurchase price, including interest. Certain repurchase agreements are tri-party arrangements whereby the collateral is held in a segregated account for the benefit of the Fund and on behalf of the counterparty. Repurchase agreements could involve certain risks in the event of default or insolvency of the counterparty, including possible delays or restrictions upon the Fund’s ability to dispose of the underlying securities. As of September 30, 2020, the Fund had investments in repurchase agreements for which the value of the related collateral exceeded the value of
Notes to Financial Statements – continued
September 30, 2020
the repurchase agreement. The gross value of repurchase agreements is included in the Statement of Assets and Liabilities for financial reporting purposes.
i. Securities Lending. The Fund has entered into an agreement with State Street Bank and Trust Company (“State Street Bank”), as agent of the Fund, to lend securities to certain designated borrowers. The loans are collateralized with cash or securities in an amount equal to at least 105% or 102% of the market value (including accrued interest) of the loaned international or domestic securities, respectively, when the loan is initiated. Thereafter, the value of the collateral must remain at least 102% of the market value (including accrued interest) of loaned securities for U.S. equities and U.S. corporate debt; at least 105% of the market value (including accrued interest) of loaned securities for non-U.S. equities; and at least 100% of the market value (including accrued interest) of loaned securities for U.S. Government securities, sovereign debt issued by non-U.S. Governments and non-U.S. corporate debt. In the event that the market value of the collateral falls below the required percentages described above, the borrower will deliver additional collateral on the next business day. As with other extensions of credit, the Fund may bear the risk of loss with respect to the investment of the collateral. The Fund invests cash collateral in short-term investments, a portion of the income from which is remitted to the borrowers and the remainder allocated between the Fund and State Street Bank as lending agent.
For the year ended September 30, 2020, the Fund did not loan securities under this agreement.
j. Indemnifications. Under the Trust’s organizational documents, its officers and Trustees are indemnified against certain liabilities arising out of the performance of their duties to the Fund. Additionally, in the normal course of business, the Fund enters into contracts with service providers that contain general indemnification clauses. The Fund’s maximum exposure under these arrangements is unknown as this would involve future claims that may be made against the Fund that have not yet occurred. However, based on experience, the Fund expects the risk of loss to be remote.
k. New Accounting Pronouncement. In August 2018, the Financial Accounting Standards Board (“FASB”) issued Accounting Standards Update 2018-13, Fair Value Measurement (Topic 820): Disclosure Framework — Changes to the Disclosure Requirements for Fair Value Measurement (“ASU 2018-13”). The update introduces new fair value disclosure requirements, eliminates some prior fair value disclosure requirements, and modifies certain existing fair value disclosure requirements. ASU 2018-13 is effective for fiscal years beginning after December 15, 2019, including interim periods within those fiscal years. An entity is permitted to early adopt any eliminated or modified disclosures upon issuance of the update and delay adoption of any new disclosures until the required effective date. Management has evaluated the impact of the adoption of ASU 2018-13 and has determined to early adopt the removal of (i) the amount of and reasons for transfers between Level 1 and Level 2 of the fair value hierarchy and (ii) the policy for timing of
Notes to Financial Statements – continued
September 30, 2020
transfers between levels. Amended disclosures required and permitted for early adoption by ASU 2018-13 have been incorporated in the Fund’s annual financial statements as of September 30, 2020.
In March 2020, the FASB issued Accounting Standard Update 2020-04, Reference Rate Reform (Topic 848) (“ASU 2020-04”). In response to concerns about structural risks of interbank offered rates, and particularly the risk of cessation of the London Interbank Offered Rate (“LIBOR”), which is expected to occur no later than December 31, 2021, regulators have undertaken reference rate reform initiatives to identify alternative reference rates that are more observable or transaction based and less susceptible to manipulation. ASU 2020-04 provides temporary guidance to ease the potential burden in accounting for (or recognizing the effects of) reference rate reform on financial reporting. ASU 2020-04 is elective and applies to all entities, subject to meeting certain criteria, that have contracts that reference LIBOR or another reference rate expected to be discontinued because of reference rate reform. ASU 2020-04 amendments offer optional expedients for contract modifications that would allow an entity to account for such modifications by prospectively adjusting the effective interest rate, instead of evaluating each contract, in accordance with existing accounting standards, as to whether reference rate modifications constitute the establishment of new contracts or the continuation of existing contracts. ASU 2020-04 amendments are currently effective and an entity may elect to apply its provisions as of any date from the beginning of an interim period that includes or is subsequent to March 12, 2020. No Fund contracts have yet been impacted by reference rate reform. Management expects to apply the optional expedients when appropriate.
3. Fair Value Measurements. In accordance with accounting standards related to fair value measurements and disclosures, the Fund has categorized the inputs utilized in determining the value of the Fund’s assets or liabilities. These inputs are summarized in the three broad levels listed below:
| | • | | Level 1—quoted prices in active markets for identical assets or liabilities; |
| | • | | Level 2—prices determined using other significant inputs that are observable either directly, or indirectly through corroboration with observable market data (which could include quoted prices for similar assets or liabilities, interest rates, credit risk, etc.); and |
| | • | | Level 3—prices determined using significant unobservable inputs when quoted prices or observable inputs are unavailable such as when there is little or no market activity for an asset or liability (unobservable inputs reflect the Fund’s own assumptions in determining the fair value of assets or liabilities and would be based on the best information available). |
The inputs or methodology used for valuing securities are not necessarily an indication of the risk associated with investing in those securities.
Notes to Financial Statements – continued
September 30, 2020
The Fund’s pricing policies and procedures are recommended by the adviser and approved by the Board of Trustees. Debt securities are valued based on evaluated bids furnished to the Fund by an independent pricing service. Broker-dealer bid prices may be used if an independent pricing service either is unable to price a security or does not provide a reliable price for a security. The Fund’s adviser may use internally developed models to validate broker-dealer bid prices that are only available from a single broker or market maker. Such securities are considered and classified as fair valued. Broker-dealer bid prices for which the Fund does not have knowledge of the inputs used by the broker-dealer are categorized in Level 3. Securities for which market quotations are not readily available are valued at fair value as determined in good faith by the Fund’s adviser pursuant to procedures approved by the Board of Trustees. Fair valued securities may be categorized in Level 3.
The following is a summary of the inputs used to value the Fund’s investments as of September 30, 2020, at value:
Asset Valuation Inputs
| | | | | | | | | | | | | | | | |
Description | | Level 1 | | | Level 2 | | | Level 3 | | | Total | |
Bonds and Notes | | | | | | | | | | | | | | | | |
Non-Convertible Bonds | | | | | | | | | | | | | | | | |
ABS Other | | $ | — | | | $ | — | | | $ | 26,487,320 | (b)(c) | | $ | 26,487,320 | |
Finance Companies | | | 3,220,367 | | | | 500,041,661 | | | | 994,938 | (d) | | | 504,256,966 | |
All Other Non-Convertible Bonds(a) | | | — | | | | 6,596,545,696 | | | | — | | | | 6,596,545,696 | |
| | | | | | | | | | | | | | | | |
Total Non-Convertible Bonds | | | 3,220,367 | | | | 7,096,587,357 | | | | 27,482,258 | | | | 7,127,289,982 | |
| | | | | | | | | | | | | | | | |
Convertible Bonds(a) | | | — | | | | 345,679,760 | | | | — | | | | 345,679,760 | |
Municipals(a) | | | — | | | | 135,988,249 | | | | — | | | | 135,988,249 | |
| | | | | | | | | | | | | | | | |
Total Bonds and Notes | | | 3,220,367 | | | | 7,578,255,366 | | | | 27,482,258 | | | | 7,608,957,991 | |
| | | | | | | | | | | | | | | | |
Senior Loans(a) | | | — | | | | 148,028 | | | | — | | | | 148,028 | |
Common Stocks | | | | | | | | | | | | | | | | |
Chemicals | | | — | | | | 7,289,473 | | | | — | | | | 7,289,473 | |
Oil, Gas & Consumable Fuels | | | 22,750,489 | | | | 1,496,510 | | | | 133,992 | (c)(d) | | | 24,380,991 | |
All Other Common Stocks(a) | | | 952,923,661 | | | | — | | | | — | | | | 952,923,661 | |
| | | | | | | | | | | | | | | | |
Total Common Stocks | | | 975,674,150 | | | | 8,785,983 | | | | 133,992 | | | | 984,594,125 | |
| | | | | | | | | | | | | | | | |
Preferred Stocks | | | | | | | | | | | | | | | | |
Convertible Preferred Stocks | | | | | | | | | | | | | | | | |
Energy | | | — | | | | — | | | | — | (c) | | | — | |
All Other Convertible Preferred Stocks(a) | | | 37,564,278 | | | | — | | | | — | | | | 37,564,278 | |
| | | | | | | | | | | | | | | | |
Total Convertible Preferred Stocks | | | 37,564,278 | | | | — | | | | — | | | | 37,564,278 | |
| | | | | | | | | | | | | | | | |
Notes to Financial Statements – continued
September 30, 2020
Asset Valuation Inputs – continued
| | | | | | | | | | | | | | | | |
Description | | Level 1 | | | Level 2 | | | Level 3 | | | Total | |
Non-Convertible Preferred Stocks | | | | | | | | | | | | | | | | |
Electric | | $ | — | | | $ | 139,084 | | | $ | — | | | $ | 139,084 | |
REITs - Office Property | | | — | | | | 2,897,500 | | | | — | | | | 2,897,500 | |
REITs - Warehouse/Industrials | | | — | | | | 13,292,401 | | | | — | | | | 13,292,401 | |
All Other Non-Convertible Preferred Stocks(a) | | | 765,533 | | | | — | | | | — | | | | 765,533 | |
| | | | | | | | | | | | | | | | |
Total Non-Convertible Preferred Stocks | | | 765,533 | | | | 16,328,985 | | | | — | | | | 17,094,518 | |
| | | | | | | | | | | | | | | | |
Total Preferred Stocks | | | 38,329,811 | | | | 16,328,985 | | | | — | | | | 54,658,796 | |
| | | | | | | | | | | | | | | | |
Closed-End Investment Companies | | | 1,472,217 | | | | — | | | | — | | | | 1,472,217 | |
Warrants | | | — | | | | 4,957,037 | | | | 8,436 | (d) | | | 4,965,473 | |
Short-Term Investments | | | — | | | | 310,960,242 | | | | — | | | | 310,960,242 | |
| | | | | | | | | | | | | | | | |
Total | | $ | 1,018,696,545 | | | $ | 7,919,435,641 | | | $ | 27,624,686 | | | $ | 8,965,756,872 | |
| | | | | | | | | | | | | | | | |
(a) Details of the major categories of the Fund’s investments are reflected within the Portfolio of Investments.
(b) Valued using broker-dealer bid prices ($18,439,748) or fair valued by the Fund’s adviser using a broker-dealer bid price provided by a single market maker ($8,047,572).
(c) Includes a security fair valued at zero by the Fund’s adviser using Level 3 inputs.
(d) Fair valued by the Fund’s adviser.
The following is a reconciliation of Level 3 investments for which significant unobservable inputs were used to determine fair value as of September 30, 2019 and/or September 30, 2020:
Asset Valuation Inputs
| | | | | | | | | | | | | | | | |
Investments in Securities | | Balance as of
September 30,
2019 | | | Accrued
Discounts
(Premiums) | | | Realized
Gain
(Loss) | | | Change in
Unrealized
Appreciation
(Depreciation) | |
Bonds and Notes | | | | | | | | | | | | | | | | |
Non-Convertible Bonds | | | | | | | | | | | | | | | | |
ABS Other | | $ | 43,042,193 | (a) | | $ | — | | | $ | 2,627 | | | $ | (23,781,906 | ) |
Finance Companies | | | 1,511,802 | | | | 1,531 | | | | — | | | | (518,395 | ) |
Independent Energy | | | 4,515,000 | (a) | | | 293,905 | | | | (13,207,484 | ) | | | 8,398,579 | |
Common Stocks | | | | | | | | | | | | | | | | |
Oil, Gas & Consumable Fuels | | | 2,094 | (a) | | | — | | | | (3,790,394 | ) | | | 3,012,842 | |
Preferred Stocks | | | | | | | | | | | | | | | | |
Convertible Preferred Stocks | | | | | | | | | | | | | | | | |
Energy | | | 38,285,284 | | | | — | | | | — | | | | (68,453,458 | ) |
Warrants | | | — | | | | — | | | | — | | | | (73,477 | ) |
| | | | | | | | | | | | | | | | |
Total | | $ | 87,356,373 | | | $ | 295,436 | | | $ | (16,995,251 | ) | | $ | (81,415,815 | ) |
| | | | | | | | | | | | | | | | |
Notes to Financial Statements – continued
September 30, 2020
Asset Valuation Inputs – continued
| | | | | | | | | | | | | | | | |
Investments in Securities – continued | | Purchases | | | Sales | | | Transfers
into
Level 3 | | | Transfers
out of
Level 3 | |
Bonds and Notes – continued | | | | | | | | | | | | | | | | |
Non-Convertible Bonds | | | | | | | | | | | | | | | | |
ABS Other | | $ | 1,688,655 | | | $ | (4,545,799 | ) | | $ | 10,081,550 | | | $ | — | |
Finance Companies | | | — | | | | — | | | | — | | | | — | |
Independent Energy | | | — | | | | — | | | | — | | | | — | |
Common Stocks | | | | | | | | | | | | | | | | |
Oil, Gas & Consumable Fuels | | | — | | | | — | | | | 909,450 | | | | — | |
Preferred Stocks | | | | | | | | | | | | | | | | |
Convertible Preferred Stocks | | | | | | | | | | | | | | | | |
Energy | | | — | | | | — | | | | 30,168,174 | | | | — | |
Warrants | | | 81,913 | | | | — | | | | — | | | | — | |
| | | | | | | | | | | | | | | | |
Total | | $ | 1,770,568 | | | $ | (4,545,799 | ) | | $ | 41,159,174 | | | $ | — | |
| | | | | | | | | | | | | | | | |
| | | | | | | | |
Investments in Securities – continued | | Balance as of
September 30,
2020 | | | Change in
Unrealized
Appreciation
(Depreciation)
from Investments
Still Held at
September 30,
2020 | |
Bonds and Notes – continued | | | | | | | | |
Non-Convertible Bonds | | | | | | | | |
ABS Other | | $ | 26,487,320 | (a) | | $ | (23,713,764 | ) |
Finance Companies | | | 994,938 | | | | (518,395 | ) |
Independent Energy | | | — | | | | — | |
Common Stocks | | | | | | | | |
Oil, Gas & Consumable Fuels | | | 133,992 | (a) | | | (777,552 | ) |
Preferred Stocks | | | | | | | | |
Convertible Preferred Stocks | | | | | | | | |
Energy | | | — | (a) | | | (68,453,458 | ) |
Warrants | | | 8,436 | | | | (73,477 | ) |
| | | | | | | | |
Total | | $ | 27,624,686 | | | $ | (93,536,646 | ) |
| | | | | | | | |
(a) Includes a security fair valued at zero by the Fund’s adviser using Level 3 Inputs.
A debt security valued at $10,081,550 was transferred from Level 2 to Level 3 during the period ended September 30, 2020. At September 30, 2019, this security was valued on the basis of evaluated bids furnished to the Fund by an independent pricing service in accordance with the Fund’s valuation policies. At September 30, 2020, this security was valued using broker-dealer bid prices based on inputs unobservable to the Fund as an independent pricing service did not provide a reliable price for the security.
Notes to Financial Statements – continued
September 30, 2020
A common stock valued at $909,450 was transferred from Level 2 to Level 3 during the period ended September 30, 2020. At September 30, 2019, this security was valued on the basis of evaluated bids furnished to the Fund by an independent pricing service in accordance with the Fund’s valuation policies. At September 30, 2020, this security was valued at fair value as determined in good faith by the Fund’s adviser as an independent pricing service was unable to price the security.
A preferred stock valued at $11,052,198 was transferred from Level 1 to Level 3 during the period ended September 30, 2020. At September 30, 2019, this security was valued at the closing bid quotation in accordance with the Fund’s valuation policies. At September 30, 2020, this security was valued at fair value as determined in good faith by the Fund’s adviser as an independent pricing service did not provide a reliable price for the security.
A preferred stock valued at $19,115,976 was transferred from Level 2 to Level 3 during the period ended September 30, 2020. At September 30, 2019, this security was valued on the basis of evaluated bids furnished to the Fund by an independent pricing service in accordance with the Fund’s valuation policies. At September 30, 2020, this security was valued at fair value as determined in good faith by the Fund’s adviser as an independent pricing service did not provide a reliable price for the security.
4. Purchases and Sales of Securities. For the year ended September 30, 2020, purchases and sales of securities (excluding short-term investments and U.S. Government/Agency securities and including paydowns) were $857,396,619 and $1,430,390,190, respectively. Purchases and sales of U.S. Government/Agency securities (excluding short-term investments and including paydowns) were $2,303,373,151 and $651,775,547, respectively.
5. Management Fees and Other Transactions with Affiliates.
a. Management Fees. Loomis, Sayles & Company, L.P. (“Loomis Sayles”) serves as investment adviser to the Fund. Loomis Sayles is a limited partnership whose sole general partner, Loomis, Sayles & Company, Inc., is indirectly owned by Natixis Investment Managers, LLC (“Natixis”), which is part of Natixis Investment Managers, an international asset management group based in Paris, France.
Under the terms of the management agreement, the Fund pays a management fee at the following annual rates, calculated daily and payable monthly, based on the Fund’s average daily net assets:
| | | | | | |
| Percentage of Average Daily Net Assets |
First
$3 billion | | Next
$12 billion | | Next
$10 billion | | Over
$25 billion |
| 0.60% | | 0.50% | | 0.49% | | 0.48% |
Loomis Sayles has given a binding undertaking to the Fund to waive management fees and/or reimburse certain expenses to limit the Fund’s operating expenses, exclusive of
Notes to Financial Statements – continued
September 30, 2020
acquired fund fees and expenses, brokerage expenses, interest expense, taxes, organizational and extraordinary expenses such as litigation and indemnification expenses. This undertaking is in effect until January 31, 2021, may be terminated before then only with the consent of the Fund’s Board of Trustees and is reevaluated on an annual basis. Management fees payable, as reflected on the Statement of Assets and Liabilities, is net of waivers and/or expense reimbursements, if any, pursuant to this undertaking. Waivers/reimbursements that exceed management fees payable are reflected on the Statement of Assets and Liabilities as receivable from investment adviser.
For the year ended September 30, 2020, the expense limits as a percentage of average daily net assets under the expense limitation agreement were as follows:
| | | | | | |
| Expense Limit as a Percentage of Average Daily Net Assets |
Institutional
Class | | Retail
Class | | Admin
Class | | Class N |
| 0.67% | | 0.92% | | 1.17% | | 0.62% |
Loomis Sayles shall be permitted to recover expenses borne under the expense limitation agreement (whether through waiver of management fees or otherwise) on a class by class basis in later periods to the extent the annual operating expenses of a class fall below a class’ expense limits, provided, however, that a class is not obligated to pay such waived/reimbursed fees or expenses more than one year after the end of the fiscal year in which the fees or expenses were waived/reimbursed.
For the year ended September 30, 2020, the management fees for the Fund were $51,666,632 (effective rate of 0.53% of average daily net assets).
For the year ended September 30, 2020, class-specific expenses have been reimbursed as follows:
| | | | | | | | |
| Reimbursement1 |
Institutional
Class | | Retail
Class | | Admin
Class | | Class N | | Total |
| $261,545 | | $56,914 | | $1,521 | | $ — | | $319,980 |
1 Waiver/expense reimbursements are subject to possible recovery until September 30, 2021.
Amounts represent less than 0.01% of net assets for each share class.
No expenses were recovered during the year ended September 30, 2020 under the terms of the expense limitation agreement.
b. Service and Distribution Fees. Natixis Distribution, L.P. (“Natixis Distribution”) which is a wholly-owned subsidiary of Natixis, has entered into a distribution agreement with the Trust. Pursuant to this agreement, Natixis Distribution serves as principal underwriter of the Funds of the Trust.
Pursuant to Rule 12b-1 under the 1940 Act, the Trust has adopted Distribution Plans relating to the Fund’s Retail Class shares (the “Retail Class Plan”) and Admin Class shares (the “Admin Class Plan”).
Notes to Financial Statements – continued
September 30, 2020
Under the Retail Class Plan, the Fund pays Natixis Distribution a monthly distribution fee at an annual rate not to exceed 0.25% of the average daily net assets attributable to the Fund’s Retail Class shares, as compensation for services provided by Natixis Distribution in connection with the marketing or sale of Retail Class shares or for payments made by Natixis Distribution to securities dealers or other financial intermediaries as commissions, asset-based sales charges or other compensation with respect to the sale of Retail Class shares, or for providing personal services to investors and/or the maintenance of shareholder accounts.
Under the Admin Class Plan, the Fund pays Natixis Distribution a monthly distribution fee at an annual rate not to exceed 0.25% of the average daily net assets attributable to the Fund’s Admin Class shares, as compensation for services provided by Natixis Distribution in connection with the marketing or sale of Admin Class shares or for payments made by Natixis Distribution to securities dealers or other financial intermediaries as commissions, asset-based sales charges or other compensation with respect to the sales of Admin Class shares, or for providing personal services to investors and/or the maintenance of shareholder accounts.
In addition, the Admin Class shares of the Fund may pay Natixis Distribution an administrative service fee, at an annual rate not to exceed 0.25% of the average daily net assets attributable to Admin Class shares. These fees are subsequently paid to securities dealers or financial intermediaries for providing personal services and/or account maintenance for their customers who hold such shares.
For the year ended September 30, 2020, the service and distribution fees for the Fund were as follows:
| | | | |
| Service Fees | | Distribution Fees |
Admin
Class | | Retail
Class | | Admin
Class |
| $165,025 | | $4,360,406 | | $165,025 |
c. Administrative Fees. Natixis Advisors, L.P. (“Natixis Advisors”) provides certain administrative services for the Fund and contracts with State Street Bank to serve as sub-administrator. Natixis Advisors is a wholly-owned subsidiary of Natixis. Pursuant to an agreement among Natixis Funds Trusts, Loomis Sayles Funds Trusts, Natixis ETF Trusts and Natixis Advisors, each Fund pays Natixis Advisors monthly its pro rata portion of fees equal to an annual rate of 0.0540% of the first $15 billion of the average daily net assets of the Natixis Funds Trusts, Loomis Sayles Funds Trusts and Natixis ETF Trusts, 0.0500% of the next $15 billion, 0.0400% of the next $30 billion, 0.0275% of the next $30 billion and 0.0225% of such assets in excess of $90 billion, subject to an annual aggregate minimum fee for the Natixis Funds Trusts, Loomis Sayles Funds Trusts and Natixis ETF Trusts of $10 million, which is reevaluated on an annual basis.
Notes to Financial Statements – continued
September 30, 2020
For the year ended September 30, 2020, the administrative fees were as follows:
|
| Administrative Fees |
| $4,299,300 |
d. Sub-Transfer Agent Fees. Natixis Distribution has entered into agreements, which include servicing agreements, with financial intermediaries that provide recordkeeping, processing, shareholder communications and other services to customers of the intermediaries that hold positions in the Fund and has agreed to compensate the intermediaries for providing those services. Intermediaries transact with the Fund primarily through the use of omnibus accounts on behalf of their customers who hold positions in the Fund. These services would have been provided by the Fund’s transfer agent and other service providers if the shareholders’ accounts were maintained directly at the Fund’s transfer agent. Accordingly, the Fund has agreed to reimburse Natixis Distribution for all or a portion of the servicing fees paid to these intermediaries. The reimbursement amounts (sub-transfer agent fees) paid to Natixis Distribution are subject to a current per-account equivalent fee limit approved by the Fund’s Board of Trustees, which is based on fees for similar services paid to the Fund’s transfer agent and other service providers. Class N shares do not bear such expenses.
For the year ended September 30, 2020, the sub-transfer agent fees (which are reflected in transfer agent fees and expenses in the Statement of Operations) for the Fund were $6,480,617.
As of September 30, 2020, the Fund owes Natixis Distribution $74,266 in reimbursements for sub-transfer agent fees (which are reflected in the Statement of Assets and Liabilities as payable to distributor).
Sub-transfer agent fees attributable to Institutional Class, Retail Class and Admin Class are allocated on a pro rata basis to each class based on the relative net assets of each class to the total net assets of those classes.
e. Trustees Fees and Expenses. The Trust does not pay any compensation directly to its officers or Trustees who are directors, officers or employees of Natixis Advisors, Natixis Distribution, Natixis or their affiliates. The Chairperson of the Board of Trustees receives a retainer fee at the annual rate of $369,000. The Chairperson does not receive any meeting attendance fees for Board of Trustees meetings or committee meetings that he attends. Each Independent Trustee (other than the Chairperson) receives, in the aggregate, a retainer fee at the annual rate of $199,000. Each Independent Trustee also receives a meeting attendance fee of $10,000 for each meeting of the Board of Trustees that he or she attends in person and $5,000 for each meeting of the Board of Trustees that he or she attends telephonically. In addition, the chairperson of the Contract Review Committee, the chairperson of the Audit Committee and the chairperson of the Governance Committee each receive an additional retainer fee at the annual rate of $20,000. Each Contract Review Committee member is compensated $6,000 for each Committee meeting
Notes to Financial Statements – continued
September 30, 2020
that he or she attends in person and $3,000 for each meeting that he or she attends telephonically. Each Audit Committee member is compensated $6,000 for each Committee meeting that he or she attends in person and $3,000 for each meeting that he or she attends telephonically. These fees are allocated among the funds in the Natixis Funds Trusts, Loomis Sayles Funds Trusts and Natixis ETF Trusts based on a formula that takes into account, among other factors, the relative net assets of each fund. Trustees are reimbursed for travel expenses in connection with attendance at meetings.
Prior to January 1, 2020, the Chairperson of the Board received a retainer fee at the annual rate of $360,000 and each Independent Trustee (other than the Chairperson) received, in the aggregate, a retainer fee at the annual rate of $190,000, and the chairperson of the Governance Committee received an additional retainer fee at the annual rate of $15,000. All other Trustee fees remained unchanged.
A deferred compensation plan (the “Plan”) is available to the Trustees on a voluntary basis. Deferred amounts remain in the Fund until distributed in accordance with the provisions of the Plan. The value of a participating Trustee’s deferral account is based on theoretical investments of deferred amounts, on the normal payment dates, in certain funds of the Natixis Funds Trusts, Loomis Sayles Funds Trusts and Natixis ETF Trusts as designated by the participating Trustees. Changes in the value of participants’ deferral accounts are allocated pro rata among the funds in the Natixis Funds Trusts, Loomis Sayles Funds Trusts and Natixis ETF Trusts, and are normally reflected as Trustees’ fees and expenses in the Statement of Operations. The portions of the accrued obligations allocated to the Fund under the Plan are reflected as Deferred Trustees’ fees in the Statement of Assets and Liabilities.
Certain officers and employees of Natixis Advisors and Loomis Sayles are also officers and/or Trustees of the Trust.
f. Affiliated Ownership. As of September 30, 2020, Loomis Sayles Employees’ Profit Sharing Retirement Plan held shares of the Fund representing 0.36% of the Fund’s net assets.
Investment activities of affiliated shareholders could have material impacts on the Fund.
g. Affiliated Transactions. As a result of a business restructuring, the Fund received common shares of Bellatrix Exploration Ltd. (the “Company”) constituting more than 5% of the voting securities of the Company. As such, the Company was considered to be an
Notes to Financial Statements – continued
September 30, 2020
affiliate at September 30, 2019. These securities were written-off as worthless during the year ended September 30, 2020. A summary of affiliated transactions for the year ended September 30, 2020, is as follows:
| | | | | | | | | | | | | | | | |
| | | Beginning
Value | | | Purchase
Cost | | | Sales
Proceeds | | | Accrued
Discounts
(Premiums) | |
Bellatrix Exploration Ltd., 8.500% | | $ | 4,515,000 | | | $ | — | | | $ | — | | | $ | 21,266 | |
Bellatrix Exploration Ltd., 12.500% (9.500% PIK, 3.000% Cash) | | | — | | | | — | | | | — | | | | 272,638 | |
Bellatrix Exploration Ltd. | | | — | | | | — | | | | — | | | | — | |
| | | | | | | | | | | | | | | | |
| | $ | 4,515,000 | | | $ | — | | | $ | — | | | $ | 293,904 | |
| | | | | | | | | | | | | | | | |
| | | | | | | | | | | | | | | | |
| | | Realized
Gain (Loss) | | | Change in
Unrealized
Gain (Loss) | | | Ending
Value | | | Investment
Income | |
Bellatrix Exploration Ltd., 8.500% | | $ | (7,405,404 | ) | | $ | 2,869,138 | | | $ | — | | | $ | — | |
Bellatrix Exploration Ltd., 12.500% (9.500% PIK, 3.000% Cash) | | | (5,802,080 | ) | | | 5,529,442 | | | | — | | | | — | |
Bellatrix Exploration Ltd. | | | (3,790,394 | ) | | | 3,790,394 | | | | — | | | | — | |
| | | | | | | | | | | | | | | | |
| | $ | (16,997,878 | ) | | $ | 12,188,974 | | | $ | — | | | $ | — | |
| | | | | | | | | | | | | | | | |
6. Class-Specific Transfer Agent Fees and Expenses. Transfer agent fees and expenses attributable to Institutional Class, Retail Class and Admin Class are allocated on a pro rata basis to each class based on relative net assets of each class to the total net assets of those classes. Transfer agent fees and expenses attributable to Class N are allocated to Class N.
For the year ended September 30, 2020, the Fund incurred the following class-specific transfer agent fees and expenses (including sub-transfer agent fees, where applicable):
| | | | | | |
| Transfer Agent Fees and Expenses |
Institutional
Class | | Retail
Class | | Admin
Class | | Class N |
| $5,434,098 | | $1,320,121 | | $49,981 | | $16,782 |
7. Line of Credit. The Fund, together with certain other funds of Natixis Funds Trusts, Loomis Sayles Funds Trusts and Natixis ETF Trusts, entered into a $400,000,000 committed unsecured line of credit provided by State Street Bank. Any one Fund may borrow up to $350,000,000 under the line of credit agreement (as long as all borrowings by all Funds in the aggregate do not exceed the $400,000,000 limit at any time), subject to each Fund’s investment restrictions and its contractual obligations under the line of credit. Interest is charged to the Funds based upon the terms set forth in the agreement. In addition, a commitment fee of 0.15% per annum, payable at the end of each calendar quarter, is accrued and apportioned among the participating funds based on their average daily unused portion of the line of credit. The Funds paid an arrangement fee, an upfront fee, and certain other legal fees in connection with the line of credit agreement, which are
Notes to Financial Statements – continued
September 30, 2020
being amortized over a period of 364 days and are reflected in legal fees and/or miscellaneous expenses on the Statement of Operations. The unamortized balance is reflected as prepaid expenses on the Statement of Assets and Liabilities.
For the year ended September 30, 2020, the Fund had no borrowings under this agreement.
8. Risk. The Fund’s investments in foreign securities may be subject to greater political, economic, environmental, credit/counterparty and information risks. The Fund’s investments in foreign securities also are subject to foreign currency fluctuations and other foreign currency-related risks. Foreign securities may be subject to higher volatility than U.S. securities, varying degrees of regulation and limited liquidity.
Global markets have experienced periods of high volatility triggered by the ongoing public health emergency known as coronavirus (“Covid-19”). As the situation continues, the extent and duration of the impact that the Covid-19 outbreak may have on financial markets and the economy as a whole remains highly uncertain. If the effects of the Covid-19 outbreak on financial markets and the economy continue for an extended period of time, the Funds’ future financial and investment results may be adversely affected.
9. Capital Shares. The Fund may issue an unlimited number of shares of beneficial interest, without par value. Transactions in capital shares were as follows:
| | | | | | | | | | | | | | | | |
| | |
| | | Year Ended
September 30, 2020 | | | Year Ended
September 30, 2019 | |
| | | | |
| Institutional Class | | Shares | | | Amount | | | Shares | | | Amount | |
Issued from the sale of shares | | | 120,708,487 | | | $ | 1,570,749,463 | | | | 114,880,589 | | | $ | 1,536,762,571 | |
Issued in connection with the reinvestment of distributions | | | 17,523,667 | | | | 232,268,672 | | | | 22,980,553 | | | | 307,097,798 | |
Redeemed | | | (220,002,206 | ) | | | (2,875,026,445 | ) | | | (212,391,166 | ) | | | (2,831,530,285 | ) |
| | | | | | | | | | | | | | | | |
Net change | | | (81,770,052 | ) | | $ | (1,072,008,310 | ) | | | (74,530,024 | ) | | $ | (987,669,916 | ) |
| | | | | | | | | | | | | | | | |
|
| Retail Class | |
Issued from the sale of shares | | | 14,844,566 | | | $ | 195,224,157 | | | | 15,929,615 | | | $ | 212,676,780 | |
Issued in connection with the reinvestment of distributions | | | 4,247,554 | | | | 56,079,112 | | | | 6,000,286 | | | | 79,721,992 | |
Redeemed | | | (54,570,868 | ) | | | (707,245,691 | ) | | | (60,037,841 | ) | | | (797,894,770 | ) |
| | | | | | | | | | | | | | | | |
Net change | | | (35,478,748 | ) | | $ | (455,942,422 | ) | | | (38,107,940 | ) | | $ | (505,495,998 | ) |
| | | | | | | | | | | | | | | | |
Notes to Financial Statements – continued
September 30, 2020
9. Capital Shares – continued
| | | | | | | | | | | | | | | | |
| | |
| | | Year Ended
September 30, 2020 | | | Year Ended
September 30, 2019 | |
| | | | |
| Admin Class | | Shares | | | Amount | | | Shares | | | Amount | |
Issued from the sale of shares | | | 988,190 | | | $ | 12,986,806 | | | | 1,157,656 | | | $ | 15,385,127 | |
Issued in connection with the reinvestment of distributions | | | 153,962 | | | | 2,026,396 | | | | 264,817 | | | | 3,500,482 | |
Redeemed | | | (3,417,499 | ) | | | (43,720,128 | ) | | | (4,266,412 | ) | | | (56,394,526 | ) |
| | | | | | | | | | | | | | | | |
Net change | | | (2,275,347 | ) | | $ | (28,706,926 | ) | | | (2,843,939 | ) | | $ | (37,508,917 | ) |
| | | | | | | | | | | | | | | | |
|
| Class N | |
Issued from the sale of shares | | | 44,607,296 | | | $ | 587,746,459 | | | | 10,314,319 | | | $ | 138,677,808 | |
Issued in connection with the reinvestment of distributions | | | 2,000,372 | | | | 26,407,717 | | | | 1,364,601 | | | | 18,225,344 | |
Redeemed | | | (15,755,871 | ) | | | (206,225,396 | ) | | | (10,030,579 | ) | | | (134,939,664 | ) |
| | | | | | | | | | | | | | | | |
Net change | | | 30,851,797 | | | $ | 407,928,780 | | | | 1,648,341 | | | $ | 21,963,488 | |
| | | | | | | | | | | | | | | | |
Decrease from capital share transactions | | | (88,672,350 | ) | | $ | (1,148,728,878 | ) | | | (113,833,562 | ) | | $ | (1,508,711,343 | ) |
| | | | | | | | | | | | | | | | |
Report of Independent Registered Public Accounting Firm
To the Board of Trustees of Loomis Sayles Funds I and Shareholders of Loomis Sayles Bond Fund:
Opinion on the Financial Statements
We have audited the accompanying statement of assets and liabilities, including the portfolio of investments, of Loomis Sayles Bond Fund (one of the funds constituting Loomis Sayles Funds I, referred to hereafter as the “Fund”) as of September 30, 2020, the related statement of operations for the year ended September 30, 2020, the statement of changes in net assets for each of the two years in the period ended September 30, 2020, including the related notes, and the financial highlights for each of the five years in the period ended September 30, 2020 (collectively referred to as the “financial statements”). In our opinion, the financial statements present fairly, in all material respects, the financial position of the Fund as of September 30, 2020, the results of its operations for the year then ended, the changes in its net assets for each of the two years in the period ended September 30, 2020 and the financial highlights for each of the five years in the period ended September 30, 2020 in conformity with accounting principles generally accepted in the United States of America.
Basis for Opinion
These financial statements are the responsibility of the Fund’s management. Our responsibility is to express an opinion on the Fund’s financial statements based on our audit. We are a public accounting firm registered with the Public Company Accounting Oversight Board (United States) (PCAOB) and are required to be independent with respect to the Fund in accordance with the U.S. federal securities laws and the applicable rules and regulations of the Securities and Exchange Commission and the PCAOB.
We conducted our audit of these financial statements in accordance with the standards of the PCAOB. Those standards require that we plan and perform the audit to obtain reasonable assurance about whether the financial statements are free of material misstatement, whether due to error or fraud.
Our audit included performing procedures to assess the risks of material misstatement of the financial statements, whether due to error or fraud, and performing procedures that respond to those risks. Such procedures included examining, on a test basis, evidence regarding the amounts and disclosures in the financial statements. Our audit also included evaluating the accounting principles used and significant estimates made by management, as well as evaluating the overall presentation of the financial statements. Our procedures included confirmation of securities owned as of September 30, 2020 by correspondence with the custodian, agent banks and brokers; when replies were not received from brokers, we performed other auditing procedures. We believe that our audit provides a reasonable basis for our opinion.
/s/PricewaterhouseCoopers LLP
Boston, Massachusetts
November 20, 2020
We have served as the auditor of one or more investment companies in the Natixis Investment Company Complex since at least 1995. We have not determined the specific year we began serving as auditor.
2020 U.S. Tax Distribution Information to Shareholders (Unaudited)
Corporate Dividends Received Deduction. For the fiscal year ended September 30, 2020, 15.10% of dividends distributed by Bond Fund qualify for the dividends received deduction for corporate shareholders.
Capital Gains Distributions. Pursuant to Internal Revenue Section 852(b), the Bond Fund designated $12,377,899 as capital gains distributions for the fiscal year ended September 30, 2020, unless subsequently determined to be different.
Qualified Dividend Income. For the fiscal year ended September 30, 2020, the Bond Fund will designate up to the maximum amount allowable pursuant to the Internal Revenue Code as qualified dividend income eligible for reduced tax rates. These lower rates range from 0% to 20% depending on an individual’s tax bracket. If the Fund pays a distribution during calendar year 2020, complete information will be reported in conjunction with Form 1099-DIV.
Trustee and Officer Information
The tables below provide certain information regarding the trustees and officers of Loomis Sayles Funds I (the “Trust”). Unless otherwise indicated, the address of all persons below is 888 Boylston Street, Suite 800, Boston, MA 02199-8197. The Fund’s Statement of Additional Information includes additional information about the trustees of the Trust and is available by calling Loomis Sayles Funds at 800-633-3330.
| | | | | | | | |
| Name and Year of Birth | | Position(s) Held
with the Trust,
Length of Time
Served and
Term of Office1 | | Principal
Occupation(s)
During Past 5 Years | | Number of
Portfolios in
Fund Complex
Overseen2 and
Other
Directorships Held
During Past 5 Years | | Experience,
Qualifications,
Attributes, Skills
for Board
Membership |
| | |
| INDEPENDENT TRUSTEES | | | | |
| | | | |
Kenneth A. Drucker
(1945) | | Chairperson of the Board of Trustees since January 2017 Trustee since 2008 Ex Officio member of Audit Committee, Contract Review Committee and Governance Committee | | Retired | | 54
None | | Significant experience on the Board and on the boards of other business organizations (including at investment companies); executive experience (including as treasurer of an aerospace, automotive, and metal manufacturing corporation) |
| | | | |
Edmond J. English
(1953) | | Trustee since 2013 Chairperson of Governance Committee and Audit Committee Member | | Executive Chairman of Bob’s Discount Furniture (retail) | | 54
Director, Burlington Stores, Inc. (retail) | | Significant experience on the Board and on the boards of other business organizations (including retail companies and a bank); executive experience (including at a retail company) |
| | | | |
Richard A. Goglia
(1951) | | Trustee since 2015 Contract Review Committee Member and Governance Committee Member | | Retired | | 54
Director of Triumph Group (aerospace industry) | | Significant experience on the Board and executive experience (including his role as vice president and treasurer of a defense company and experience at a financial services company) |
Trustee and Officer Information – continued
| | | | | | | | |
| Name and Year of Birth | | Position(s) Held
with the Trust,
Length of Time
Served and
Term of Office1 | | Principal
Occupation(s)
During Past 5 Years | | Number of
Portfolios in
Fund Complex
Overseen2 and
Other
Directorships Held
During Past 5 Years | | Experience,
Qualifications,
Attributes, Skills
for Board
Membership |
| | |
| INDEPENDENT TRUSTEES – continued | | | | |
| | | | |
Wendell J. Knox
(1948) | | Trustee since 2009 Chairperson of Contract Review Committee | | Retired | | 54
Director of Abt Associates Inc. (research and consulting); Director, The Hanover Insurance Group (property and casualty insurance); formerly, Director, Eastern Bank (bank) | | Significant experience on the Board and on the boards of other business organizations (including at a bank and at a property and casualty insurance firm); executive experience (including roles as president and chief executive officer of a research and consulting company) |
| | | | |
Martin T. Meehan
(1956) | | Trustee since 2012 Audit Committee Member | | President, University of Massachusetts | | 54
None | | Significant experience on the Board and on the boards of other business organizations; experience as President of the University of Massachusetts; government experience (including as a member of the U.S. House of Representatives); academic experience |
| | | | |
Maureen B. Mitchell
(1951) | | Trustee since 2017 Contract Review Committee Member and Governance Committee Member | | Retired; formerly President, Global Sales and Marketing, GE Asset Management, Inc. (financial services) | | 54
Director, Sterling Bancorp (bank) | | Experience on the Board; financial services industry and executive experience (including role as president of global sales and marketing at a financial services company) |
Trustee and Officer Information – continued
| | | | | | | | |
| Name and Year of Birth | | Position(s) Held
with the Trust,
Length of Time
Served and
Term of Office1 | | Principal
Occupation(s)
During Past 5 Years | | Number of
Portfolios in
Fund Complex
Overseen2 and
Other
Directorships Held
During Past 5 Years | | Experience,
Qualifications,
Attributes, Skills
for Board
Membership |
| | |
| INDEPENDENT TRUSTEES – continued | | | | |
| | | | |
James P. Palermo
(1955) | | Trustee since 2016 Contract Review Committee Member | | Founding Partner, Breton Capital Management, LLC (private equity); Partner, STEP Partners, LLC (private equity) | | 54
Director, FutureFuel.io (chemicals and biofuels) | | Experience on the Board; financial services industry and executive experience (including roles as chief executive officer of client management and asset servicing for a banking and financial services company) |
| | | | |
Erik R. Sirri
(1958) | | Trustee since 2009 Audit Committee Member | | Professor of Finance at Babson College | | 54
None | | Significant experience on the Board; experience as Director of the Division of Trading and Markets at the Securities and Exchange Commission; academic experience; training as an economist |
| | | | |
Peter J. Smail
(1952) | | Trustee since 2009 Audit Committee Member and Governance Committee Member | | Retired | | 54
None | | Significant experience on the Board; mutual fund industry and executive experience (including roles as president and chief executive officer for an investment adviser) |
| | | | |
Kirk A. Sykes
(1958) | | Trustee since 2019 Contract Review Committee Member | | Managing Director of Accordia Partners, LLC (real estate development); President of Primary Corporation (real estate development); Managing Principal of Merrick Capital Partners (infrastructure finance); formerly, President of Urban Strategy America Fund (real estate fund manager) | | 54
Trustee, Eastern Bank (bank); formerly Director, Ares Commercial Real Estate Corporation (real estate investment trust) | | Experience on the Board and significant experience on the boards of other business organizations (including real estate companies and banks) |
Trustee and Officer Information – continued
| | | | | | | | |
| Name and Year of Birth | | Position(s) Held
with the Trust,
Length of Time
Served and
Term of Office1 | | Principal
Occupation(s)
During Past 5 Years | | Number of
Portfolios in
Fund Complex
Overseen2 and
Other
Directorships Held
During Past 5 Years | | Experience,
Qualifications,
Attributes, Skills
for Board
Membership |
| | |
| INDEPENDENT TRUSTEES – continued | | | | |
| | | | |
Cynthia L. Walker
(1956) | | Trustee since 2005 Chairperson of the Audit Committee and Governance Committee Member | | Deputy Dean for Finance and Administration, Yale University School of Medicine | | 54
None | | Significant experience on the Board; executive experience in a variety of academic organizations (including roles as dean for finance and administration) |
| | | |
| INTERESTED TRUSTEES | | | | | | |
| | | | |
Kevin P. Charleston3 (1965) One Financial Center Boston, MA 02111 | | Trustee since 2015 President and Chief Executive Officer since 2015 | | President, Chief Executive Officer and Chairman of the Board of Directors; formerly, Chief Financial Officer, Loomis, Sayles & Company, L.P. | | 54
None | | Significant experience on the Board; continuing service as President, Chief Executive Officer and Chairman of the Board of Directors of Loomis, Sayles & Company, L.P. |
| | | | |
David L. Giunta4
(1965) | | Trustee since 2011 Executive Vice President since 2008 | | President and Chief Executive Officer, Natixis Advisors, L.P., Natixis Distribution, L.P., Natixis Distribution Corporation and Chairman of the Board of Natixis Distribution Corporation | | 54
None | | Significant experience on the Board; experience as President and Chief Executive Officer of Natixis Advisors, L.P., Natixis Distribution, L.P., Natixis Distribution Corporation and Chairman of the Board of Natixis Distribution Corporation |
| 1 | Each trustee serves until retirement, resignation or removal from the Board. The current retirement age is 75. The position of Chairperson of the Board is appointed for a three-year term. Mr. Drucker was appointed to serve an additional one year term as the Chairperson of the Board on June 12, 2019. |
| 2 | The trustees of the Trust serve as trustees of a fund complex that includes all series of the Trust, Natixis Funds Trust I, Natixis Funds Trust II, Natixis Funds Trust IV, Gateway Trust, Loomis Sayles Funds II, Natixis ETF Trust and Natixis ETF Trust II (collectively, the “Fund Complex”). |
| 3 | Mr. Charleston is deemed an “interested person” of the Trust because he holds the following positions with an affiliated person of the Trust: President, Chief Executive Officer and Chairman of the Board of Directors of Loomis, Sayles & Company, L.P. |
| 4 | Mr. Giunta is deemed an “interested person” of the Trust because he holds the following positions with an affiliated person of the Trust: President and Chief Executive Officer, Natixis Advisors, L.P., Natixis Distribution, L.P., Natixis Distribution Corporation and Chairman of the Board of Natixis Distribution Corporation. |
Trustee and Officer Information – continued
| | | | | | |
| Name and Year of Birth | | Position(s) Held
with the Trust | | Term of Office1 and
Length of Time Served | | Principal Occupation(s)
During Past 5 Years2 |
|
| OFFICERS OF THE TRUST |
| | | |
Daniel J. Fuss
(1933) One Financial Center Boston, MA 02111 | | Executive Vice President | | Since 2003 | | Vice Chairman and Director, Loomis, Sayles & Company, L.P. |
| | | |
Russell L. Kane
(1969) | | Secretary, Clerk and Chief Legal Officer Chief Compliance Officer and Anti-Money Laundering Officer | | Since 2016 Since 2020 | | Executive Vice President, General Counsel, Secretary and Clerk, Natixis Distribution Corporation, Natixis Advisors, L.P. and Natixis Distribution, L.P.; formerly, Senior Vice President, Deputy General Counsel, Assistant Secretary and Assistant Clerk, Natixis Distribution Corporation, Natixis Advisors, L.P. and Natixis Distribution, L.P. |
| | | |
Michael C. Kardok
(1959) | | Treasurer, Principal Financial and Accounting Officer | | Since 2004 | | Senior Vice President, Natixis Advisors, L.P. and Natixis Distribution, L.P. |
| 1 | Each officer of the Trust serves for an indefinite term in accordance with the Trust’s current by-laws until the date his or her successor is elected and qualified, or until he or she sooner dies, retires, is removed or becomes disqualified. |
| 2 | Each person listed above, except as noted, holds the same position(s) with the Fund Complex. Previous positions during the past five years with Natixis Distribution, L.P., Natixis Advisors, L.P. or Loomis, Sayles & Company, L.P. are omitted, if not materially different from an officer’s current position with such entity. |


Annual Report
September 30, 2020
Loomis Sayles Credit Income Fund
Loomis Sayles Intermediate Duration Bond Fund
Loomis Sayles Limited Term Government and Agency Fund
Table of Contents
IMPORTANT NOTICE TO SHAREHOLDERS
Beginning on January 1, 2021, as permitted by regulations adopted by the Securities and Exchange Commission, paper copies of shareholder reports like this one will no longer be sent by mail, unless you specifically request paper copies of the reports from the Fund or from your financial intermediary, such as a broker-dealer or bank. Instead, the reports will be made available on the Funds’ website, and you will be notified by mail each time a report is posted and provided with a website link to access the report. If you wish to continue receiving paper copies of your shareholder reports after January 1, 2021, you can inform the Fund at any time by calling 1-800-225-5478. If you hold your account with a financial intermediary and you wish to continue receiving paper copies after January 1, 2021, you should call your financial intermediary directly. Paper copies are provided free of charge, and your election to receive reports in paper will apply to all funds held with the Natixis Funds complex. If you have already elected to receive shareholder reports electronically, you will not be affected by this change and you need not take any action. You currently may elect to receive shareholder reports and other communications from the Fund or your financial intermediary electronically at www.icsdelivery.com/natixisfunds.
LOOMIS SAYLES CREDIT INCOME FUND
| | |
| |
| Managers | | Symbols |
| |
| Matthew J. Eagan, CFA® | | Class A LOCAX |
| |
| Elaine M. Stokes | | Class C LOCCX |
| |
Brain P. Kennedy | | Class N LOCNX |
| |
| | Class Y LOCYX |
|
| Loomis, Sayles & Company, L.P. |
Investment Goal
The Fund seeks high current income with a secondary objective of capital growth.
Market Conditions
The financial markets experienced significant volatility in the past year, as investors grappled with the uncertainty surrounding Covid-19. The bulk of the market disruptions occurred in February and March, when world governments first aimed to contain the virus by locking down broad swaths of their economies. Higher-risk assets were hit hard in the ensuing sell-off, while demand for lower-risk investments surged. Markets snapped back after the first quarter of 2020 amidst unprecedented central bank actions, lifting of lockdowns and promising news of a potential vaccine.
Performance Results
The Loomis Sayles Credit Income Fund was launched on September 29, 2020. For the period ending September 30, 2020, Class Y shares of the Fund returned -0.30% at net asset value. The Fund underperformed its benchmark, the Bloomberg Barclays U.S. Credit Index, which returned -0.19%.
Explanation of Fund Performance
The trading costs to launch and transition the portfolio from cash to full investment were the largest detractor from Fund performance. Allocation to cash detracted from performance. Due to the newness of the Fund, cash levels were higher than we would typically expect.
The Fund’s allocations to investment grade and high yield corporate credit were the main contributors to performance, aided by exposure to the consumer non-cyclical sector.
Outlook
While economic and financial market conditions have continued to show encouraging signs of improvement, the outlook remains uncertain. The Federal Reserve has provided forward guidance that helps ensure monetary policy can remain accommodative for the foreseeable future, which appears to be boosting business and consumer confidence and keeping investor risk appetite strong going into the final quarter of the year. We also believe it is still possible for a limited agreement to be reached that extends the fiscal stimulus package and provides further support to the economy, though ongoing debate by lawmakers on the size and scale of the package has been causing increased anxiety among
investors as we get closer to the US election. We continue to assess the immediate and longer-term impacts of the pandemic on the economy, but currently expect a slow and uneven pace of recovery.
Valuations in the corporate bond sectors have been less compelling following the strong credit rally that has unfolded since the end of March. However, we believe the low global interest rate environment will likely continue to drive the search for yield and help provide a positive technical backdrop for both investment grade and high yield corporate debt. Also, we have been active and selective in new issues throughout the year, and will continue to look for opportunities in the primary market.
LOOMIS SAYLES CREDIT INCOME FUND
Total Returns — September 30, 20203
| | | | | | | | | | | | |
| | | | | | Expense Ratios4 | |
| | | Life of Fund | | | Gross | | | Net | |
| | | | |
| Class Y (Inception 9/29/20) | | | | | | | | | | | | |
| NAV | | | -0.30 | % | | | 1.11 | % | | | 0.57 | % |
| | | | |
| Class A (Inception 9/29/20) | | | | | | | | | | | | |
| NAV | | | -0.30 | | | | 1.36 | | | | 0.82 | |
| With 4.25% Maximum Sales Charge | | | -4.50 | | | | | | | | | |
| | | | |
| Class C (Inception 9/29/20) | | | | | | | | | | | | |
| NAV | | | -0.30 | | | | 2.11 | | | | 1.57 | |
| With CDSC1 | | | -1.30 | | | | | | | | | |
| | | | |
| Class N (Inception 9/29/20) | | | | | | | | | | | | |
| NAV | | | -0.30 | | | | 1.42 | | | | 0.52 | |
| | | | |
| Comparative Performance | | | | | | | | | | | | |
| Bloomberg Barclays U.S. Credit Index2 | | | -0.19 | | | | | | | | | |
Performance data shown represents past performance and is no guarantee of, and not necessarily indicative of, future results. Total return and value will vary, and you may have a gain or loss when shares are sold. Current performance may be lower or higher than quoted. For most recent month-end performance, visit im.natixis.com. Performance for other share classes will be greater or less than shown based on differences in fees and sales charges. You may not invest directly in an index. Performance for periods less than one year is cumulative, not annualized. Returns reflect changes in share price and reinvestment of dividends and capital gains, if any. The table(s) do not reflect taxes shareholders might owe on any fund distributions or when they redeem their shares.
| 1 | Class C shares performance assumes a 1% CDSC applied when you sell shares within one year of purchase. |
| 2 | The Bloomberg Barclays U.S. Credit Index measures the investment grade, U.S. dollar-denominated, fixed-rate, taxable corporate and government-related bond markets. It is composed of the U.S. Corporate Index and a non-corporate component that includes non-U.S. agencies, sovereigns, supranationals and local authorities. The U.S. Credit Index was called the U.S. Corporate Index until July 2000, when it was renamed to reflect its inclusion of both corporate and non-corporate issuers. The U.S. Credit Index is a subset of the U.S. Government/Credit Index and U.S. Aggregate Index. Indexes are unmanaged. It is not possible to invest directly in an index. |
| 3 | Fund performance has been increased by fee waivers and/or expense reimbursements, if any, without which performance would have been lower. |
| 4 | Expense ratios are as shown in the Fund’s prospectus in effect as of the date of this report. The expense ratios for the current reporting period can be found in the Financial Highlights section of this report under Ratios to Average Net Assets. Net expenses reflect contractual expense limitations set to expire on 1/31/22. When a Fund’s expenses are below the limitation, gross and net expense ratios will be the same. See Note 6 of the Notes to Financial Statements for more information about the Fund’s expense limitations. |
LOOMIS SAYLES INTERMEDIATE DURATION BOND FUND
| | |
| |
| Managers | | Symbols |
| |
| Daniel Conklin, CFA® | | Class A LSDRX |
| |
| Christopher T. Harms | | Class C LSCDX |
| |
| Clifton V. Rowe, CFA® | | Class N LSDNX |
| |
| | Class Y LSDIX |
|
| Loomis, Sayles & Company, L.P. |
Investment Goal
The Fund’s investment objective is above-average total return through a combination of current income and capital appreciation.
Market Conditions
The financial markets experienced significant volatility over the 12-month period, as investors grappled with the uncertainty surrounding Covid-19. The bulk of the market disruptions occurred in February and March, when world governments first aimed to contain the virus by locking down broad swaths of their economies. Higher-risk assets were hit hard in the ensuing selloff, while demand for lower-risk investments surged. The US Federal Reserve (Fed) sought to counter the extraordinary developments by cutting the fed funds rate to zero and reinstituting quantitative easing through the purchases of Treasuries and mortgage-backed securities. The Fed also revived lending facilities last used in 2008, such as the TALF, which is a funding backstop for the asset-backed securities (ABS) market. The central bank even established facilities never used before, such as the Corporate Credit Facilities which allowed the Fed to purchase corporate bond assets for the first time in its history. In conjunction with a $2.2 trillion stimulus package passed by the US Congress, the Fed’s response fueled an impressive recovery in higher-risk assets from late March onward.
The uncertain environment worked to the benefit of US Treasuries due to their status as a relative “safe haven.” Longer duration bonds delivered particularly robust gains. The yield on the 10-year Treasury note fell to an all-time low in March and remained close to that level thereafter on expectations that the Fed would pursue its low-rate policy indefinitely. (Prices and yields move in opposite directions.)
Investment grade corporates were notable beneficiaries of rising risk appetite and investors’ demand for high-quality alternatives to low-yielding government debt. Despite their downturn in the February-March selloff, corporates outperformed the broader fixed income market for the full 12-month period.
Securitized assets, including ABS, mortgage-backed securities (MBS) and commercial mortgage-backed securities (CMBS), lagged Treasuries and investment grade corporates, but nonetheless posted a solid total return as they rallied in the second half of the period.
LOOMIS SAYLES INTERMEDIATE DURATION BOND FUND
Performance Results
For the 12 months ended September 30, 2020, Class Y shares of the Loomis Sayles Intermediate Duration Bond Fund returned 7.33% at net asset value. The Fund outperformed its benchmark, the Bloomberg Barclays U.S. Intermediate Government/Credit Bond Index, which returned 6.32%.
Explanation of Fund Performance
The Fund’s positioning to risk assets like corporate bonds and underweight US Treasuries proved beneficial to performance relative to the benchmark as the sector underperformed risk assets during the period.
Corporate bond exposure and selection within the asset class was a large positive contributor to relative performance over the period as corporates outperformed US Treasuries of comparable duration (and corresponding interest rate sensitivity). Positive contributions within the Fund’s allocation to corporates were led by an overweight to financials, particularly within the banking segment. Additionally, security selection within industrial segments such as technology and electric companies contributed to performance.
Our underweight positioning and selection within the government-related sector also proved to be beneficial over the twelve months.
On the downside, select names within agency securitized assets detracted from performance over the period year. Security selection within non-agency securitized credit slightly detracted as well. Within corporates, selection within energy names proved to be a drag on performance.
Outlook
We expect the Fed’s benchmark fed funds rate to remain unchanged at the zero lower bound and the front end of the Treasury yield curve to remain anchored for the foreseeable future. We do not anticipate the Fed bringing rates into negative territory on the view that negative policy rates are broadly disruptive to a nation’s financial system. We believe US Treasury yields will trade in a fairly tight range through the US presidential election, but may respond more acutely in the days following depending on the result and whether the result is contested. Once the results are determined, however, we see more potential for yields to rise as we move through 2021. In particular, improving prospects for a vaccine rollout could be a catalyst for rising intermediate and longer maturity Treasury yields, while the front end remains anchored. With the demand side of the equation improving, we believe there will likely be pockets of inflation as supply remains disrupted and we continue to see ultra-accommodative monetary policy and ample fiscal support.
Our base case expectation is that we are in the credit repair phase of the credit cycle1 and are starting to push towards recovery in some segments of the US economy. Credit sector valuations have trended toward levels observed prior to the first quarter of 2020, but still present a potential opportunity to obtain an attractive yield advantage over duration-matched government bonds. We believe corporate credit spreads may continue to tighten, albeit much more gradually than what we saw in the second quarter of 2020. Despite the weakened fundamental picture in the post-Covid environment, we believe corporate credit
remains supported by a strong technical backdrop headlined by committed central bank support and strong investor demand for incremental yield.
We continue to follow our process in building diversified exposures by asset class, industry and issuer. We are favoring sectors offering higher yield potential than Treasuries and remain underweight government bonds given the low yield environment. Corporate bond risk in the Fund was elevated during the early part of the third quarter of 2020 as we found continued opportunities in the primary market through new issues with favorable concessions. As valuations became less attractive during the recent quarter, corporate bond risk was modestly reduced in those issues and industries that appeared to be trading at levels closer to what we consider fair value. We continue to hold select high yield corporate names which we view as inexpensive.
We remain overweight both agency and non-agency CMBS, particularly senior parts of the capital stack. While residential MBS valuations have improved somewhat, we remain focused on securities with limited prepayment risk. We believe the high-quality ABS sector remains attractive relative to government bonds, and favor auto loans and credit card receivables within the sector.
| 1 | A credit cycle is a cyclical pattern that follows credit availability and corporate health |
Hypothetical Growth of $100,000 Investment in Class Y Shares1,4
September 30, 2010 through September 30, 2020
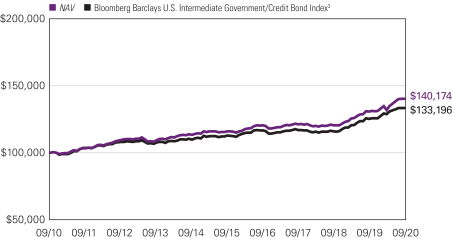
See notes to chart on page 7.
LOOMIS SAYLES INTERMEDIATE DURATION BOND FUND
Average Annual Total Returns — September 30, 20204
| | | | | | | | | | | | | | | | | | | | | | | | |
| | | | | | |
| | | | | | | | | | | | Life of | | | Expense Ratios5 | |
| | | 1 Year | | | 5 Years | | | 10 Years | | | Class N | | | Gross | | | Net | |
| | | | | | | |
| Class Y (Inception 1/28/98)1 | | | | | | | | | | | | | | | | | | | | | | | | |
| NAV | | | 7.33 | % | | | 3.88 | % | | | 3.43 | % | | | — | % | | | 0.48 | % | | | 0.40 | % |
| | | | | | | |
| Class A (Inception 5/28/10)1 | | | | | | | | | | | | | | | | | | | | | | | | |
| NAV | | | 7.06 | | | | 3.62 | | | | 3.16 | | | | — | | | | 0.72 | | | | 0.65 | |
| With 4.25% Maximum Sales Charge | | | 2.48 | | | | 2.73 | | | | 2.71 | | | | — | | | | | | | | | |
| | | | | | | |
| Class C (Inception 8/31/16)1 | | | | | | | | | | | | | | | | | | | | | | | | |
| NAV | | | 6.27 | | | | 2.85 | | | | 2.33 | | | | — | | | | 1.48 | | | | 1.40 | |
| With CDSC2 | | | 5.27 | | | | 2.85 | | | | 2.33 | | | | — | | | | | | | | | |
| | | | | | | |
| Class N (Inception 2/01/19) | | | | | | | | | | | | | | | | | | | | | | | | |
| NAV | | | 7.39 | | | | — | | | | — | | | | 8.23 | | | | 0.42 | | | | 0.35 | |
| | | | | | | |
| Comparative Performance | | | | | | | | | | | | | | | | | | | | | | | | |
Bloomberg Barclays U.S. Intermediate Government/Credit Bond Index3 | | | 6.32 | | | | 3.39 | | | | 2.91 | | | | 7.26 | | | | | | | | | |
Performance data shown represents past performance and is no guarantee of, and not necessarily indicative of, future results. Total return and value will vary, and you may have a gain or loss when shares are sold. Current performance may be lower or higher than quoted. For most recent month-end performance, visit im.natixis.com. Performance for other share classes will be greater or less than shown based on differences in fees and sales charges. You may not invest directly in an index. Performance for periods less than one year is cumulative, not annualized. Returns reflect changes in share price and reinvestment of dividends and capital gains, if any. The table(s) do not reflect taxes shareholders might owe on any fund distributions or when they redeem their shares.
| 1 | As of August 31, 2016, the Fund’s Retail Class shares and Institutional Class shares were redesignated as Class A shares and Class Y shares, respectively. Accordingly, the returns shown in the table for Class A shares prior to August 31, 2016 are those of Retail Class shares, restated to reflect the sales loads of Class A shares, and the returns in the table for Class Y shares prior to August 31, 2016 are those of Institutional Class shares. |
| 2 | Class C shares performance assumes a 1% CDSC applied when you sell shares within one year of purchase. |
| 3 | The Bloomberg Barclays U.S. Intermediate Government/Credit Bond Index includes securities in the intermediate maturity range within the Government and Credit Indices. The Government Index includes treasuries (i.e., public obligations of the U.S. Treasury that have remaining maturities of more than one year) and agencies (i.e., publicly issued debt of U.S. Government agencies, quasi-federal corporations, and corporate or foreign debt guaranteed by the U.S. Government). The Credit Index includes publicly issued U.S. corporate and foreign debentures and secured notes that meet specified maturity, liquidity, and quality requirements. |
| 4 | Fund performance has been increased by fee waivers and/or expense reimbursements, if any, without which performance would have been lower. |
| 5 | Expense ratios are as shown in the Fund’s prospectus in effect as of the date of this report. The expense ratios for the current reporting period can be found in the Financial Highlights section of this report under Ratios to Average Net Assets. Net expenses reflect contractual expense limitations set to expire on 1/31/21. When a Fund’s expenses are below the limitation, gross and net expense ratios will be the same. See Note 6 of the Notes to Financial Statements for more information about the Fund’s expense limitations. |
LOOMIS SAYLES LIMITED TERM GOVERNMENT AND AGENCY FUND
| | |
| |
| Managers | | Symbols |
| |
| Daniel Conklin, CFA® | | Class A NEFLX |
| |
| Christopher T. Harms | | Class C NECLX |
| |
| Clifton V. Rowe, CFA® | | Class N LGANX |
| |
| | Class Y NELYX |
|
| Loomis, Sayles & Company, L.P. |
Investment Goal
The Fund seeks high current return consistent with preservation of capital.
Market Conditions
The financial markets experienced significant volatility in the past year, as investors grappled with the uncertainty surrounding Covid-19. The bulk of the market disruptions occurred in February and March, when world governments first aimed to contain the virus by locking down broad swaths of their economies. Higher-risk assets were hit hard in the ensuing selloff, while demand for lower-risk investments surged. The US Federal Reserve (Fed) sought to counter the extraordinary developments by cutting the fed funds rate to zero and reinstituting quantitative easing through the purchases of Treasuries and mortgage-backed securities. The Fed revived lending facilities last used in 2008, such as the TALF, which is a funding backdrop for the asset-backed securities (ABS) market. The central bank even established facilities never used before, such as the Corporate Credit Facilities which allowed the Fed to purchase corporate bond assets for the first time in its history. In conjunction with a $2.2 trillion stimulus package passed by the US Congress, the Fed’s response fueled an impressive recovery in higher-risk assets from late March onward.
The uncertain environment worked to the benefit of US Treasuries due to their status as a relative “safe haven.” Longer duration bonds delivered particularly robust gains. The yield on the 10-year note fell to an all-time low in March and remained close to that level thereafter on expectations that the Fed would pursue its low-rate policy indefinitely. (Prices and yields move in opposite directions.)
Securitized assets, including ABS, mortgage-backed securities (MBS) and commercial mortgage-backed securities (CMBS), lagged Treasuries and investment grade corporates, but nonetheless posted a solid total return as they rallied in the second half of the period.
Performance Review
For the 12 months ended September 30, 2020, Class Y shares of the Loomis Sayles Limited Term Government and Agency Fund returned 3.35%, at net asset value. The Fund underperformed its benchmark, the Bloomberg Barclays U.S. 1-5 Year Government Bond Index, which returned 4.68%.
LOOMIS SAYLES LIMITED TERM GOVERNMENT AND AGENCY FUND
Explanation of Fund Performance
The Fund’s positioning along the yield curve (which depicts the relationship among bond yields across the maturity spectrum) was the main detractor from relative return. The portfolio’s slightly shorter-than-benchmark stance with respect to duration (a gauge of interest rate sensitivity) also weighed on results, as Treasury yields fell over the period. Bond selection within non-agency CMBS weighed on performance during the period. Within agency mortgage-backed securities, exposure to both pass-through securities and collateralized mortgage obligations detracted from relative performance.
The Fund’s security selection within securitized agency sectors was a positive source of relative performance during the period. Security selection within US Treasuries also aided performance during the period. Within securitized agency assets, the Fund’s allocation to commercial mortgage-backed securities (CMBS) was a positive source of relative performance. Within non-agency securitized assets, the Fund’s allocation to asset-backed securities, such as those backed by auto loans, contributed positively.
Outlook
Agency mortgage-backed security (MBS) spreads (the difference in yield between agency MBS and Treasuries of similar maturity) have become more attractive with valuations near longer-term averages. Mortgages issued in recent years are relatively high quality compared with those issued in prior years. However, these securities are valued with premiums and have prepayment risk as borrowers refinance to lower rate mortgages. Therefore, we prefer MBS sectors less likely to face refinancing and extension risk, such as low loan balance mortgages and home equity conversion mortgages.
Within the commercial real estate sector, we have focused on agency commercial mortgage-backed security (CMBS) opportunities, adding to those exposures during the quarter.
Non-agency issued securitized exposures remain steady, but we have marginally adjusted exposures to asset-backed securities (ABS) versus CMBS. The ABS market has recovered faster than CMBS, and we continue to find opportunities which offer strong credit quality and enhanced yield.
Hypothetical Growth of $100,000 Investment in Class Y Shares3
September 30, 2010 through September 30, 2020
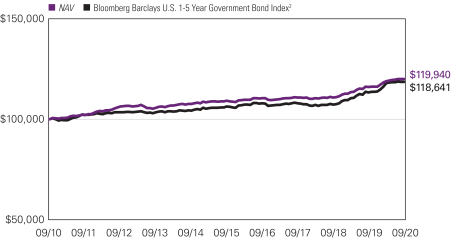
See notes to chart on page 11.
LOOMIS SAYLES LIMITED TERM GOVERNMENT AND AGENCY FUND
Average Annual Total Returns — September 30, 20203
| | | | | | | | | | | | | | | | | | | | | | | | |
| | | | | | |
| | | | | | | | | | | | Life of | | | Expense Ratios4 | |
| | | 1 Year | | | 5 Years | | | 10 Years | | | Class N | | | Gross | | | Net | |
| | | | | | | |
| Class Y (Inception 3/31/94) | | | | | | | | | | | | | | | | | | | | | | | | |
| NAV | | | 3.35 | % | | | 1.89 | % | | | 1.83 | % | | | — | % | | | 0.50 | % | | | 0.50 | % |
| | | | | | | |
| Class A (Inception 1/3/89) | | | | | | | | | | | | | | | | | | | | | | | | |
| NAV | | | 3.19 | | | | 1.65 | | | | 1.57 | | | | — | | | | 0.75 | | | | 0.75 | |
| With 2.25% Maximum Sales Charge | | | 0.88 | | | | 1.18 | | | | 1.34 | | | | — | | | | | | | | | |
| | | | | | | |
| Class C (Inception 12/30/94) | | | | | | | | | | | | | | | | | | | | | | | | |
| NAV | | | 2.34 | | | | 0.88 | | | | 0.81 | | | | — | | | | 1.50 | | | | 1.50 | |
| With CDSC1 | | | 1.34 | | | | 0.88 | | | | 0.81 | | | | — | | | | | | | | | |
| | | | | | | |
| Class N (Inception 2/1/17) | | | | | | | | | | | | | | | | | | | | | | | | |
| NAV | | | 3.53 | | | | — | | | | — | | | | 2.58 | | | | 0.43 | | | | 0.41 | |
| | | | | | | |
| Comparative Performance | | | | | | | | | | | | | | | | | | | | | | | | |
| Bloomberg Barclays U.S. 1-5 Year Government Bond Index2 | | | 4.68 | | | | 2.21 | | | | 1.72 | | | | 2.88 | | | | | | | | | |
Performance data shown represents past performance and is no guarantee of, and not necessarily indicative of, future results. Total return and value will vary, and you may have a gain or loss when shares are sold. Current performance may be lower or higher than quoted. For most recent month-end performance, visit im.natixis.com. Performance for other share classes will be greater or less than shown based on differences in fees and sales charges. You may not invest directly in an index. Performance for periods less than one year is cumulative, not annualized. Returns reflect changes in share price and reinvestment of dividends and capital gains, if any. The table(s) do not reflect taxes shareholders might owe on any fund distributions or when they redeem their shares.
| 1 | Class C shares performance assumes a 1% CDSC applied when you sell shares within one year of purchase. |
| 2 | The Bloomberg Barclays U.S. 1-5 Year Government Bond Index is a subindex of the Bloomberg Barclays U.S. Government Index, which is comprised of the Bloomberg Barclays U.S. Treasury and U.S. Agency Indices. The Bloomberg Barclays U.S. Government Index includes Treasuries (public obligations of the U.S. Treasury that have remaining maturities of more than one year) and U.S. agency debentures (publicly issued debt of U.S. government agencies, quasi-federal corporations, and corporate or foreign debt guaranteed by the U.S. government). The Bloomberg Barclays U.S. Government Index is a component of the Bloomberg Barclays U.S. Government/Credit Index and the Bloomberg Barclays U.S. Aggregate Bond Index. |
| 3 | Fund performance has been increased by fee waivers and/or expense reimbursements, if any, without which performance would have been lower. |
| 4 | Expense ratios are as shown in the Fund’s prospectus in effect as of the date of this report. The expense ratios for the current reporting period can be found in the Financial Highlights section of this report under Ratios to Average Net Assets. Net expenses reflect contractual expense limitations set to expire on 1/31/22. When a Fund’s expenses are below the limitation, gross and net expense ratios will be the same. See Note 6 of the Notes to Financial Statements for more information about the Fund’s expense limitations. |
ADDITIONAL INFORMATION
The views expressed in this report reflect those of the portfolio managers as of the dates indicated. The managers’ views are subject to change at any time without notice based on changes in market or other conditions. References to specific securities or industries should not be regarded as investment advice. Because the Fund is actively managed, there is no assurance that they will continue to invest in the securities or industries mentioned.
All investing involves risk, including the risk of loss. There is no assurance that any investment will meet its performance objectives or that losses will be avoided.
ADDITIONAL INDEX INFORMATION
This document may contain references to third party copyrights, indexes, and trademarks, each of which is the property of its respective owner. Such owner is not affiliated with Natixis Investment Managers or any of its related or affiliated companies (collectively “Natixis Affiliates”) and does not sponsor, endorse or participate in the provision of any Natixis Affiliates services, funds or other financial products.
The index information contained herein is derived from third parties and is provided on an “as is” basis. The user of this information assumes the entire risk of use of this information. Each of the third party entities involved in compiling, computing or creating index information disclaims all warranties (including, without limitation, any warranties of originality, accuracy, completeness, timeliness, non-infringement, merchantability and fitness for a particular purpose) with respect to such information.
PROXY VOTING INFORMATION
A description of the Natixis Funds’ proxy voting policies and procedures is available without charge, upon request, by calling Natixis Funds at 800-225-5478; on the Natixis Funds’ website at im.natixis.com; and on the Securities and Exchange Commission’s (“SEC”) website at www.sec.gov. Information regarding how the funds voted proxies relating to portfolio securities the most recent 12-month period ended June 30 is available from the Natixis Funds’ website and the SEC’s website.
QUARTERLY PORTFOLIO SCHEDULES
The Natixis Funds file complete schedules of portfolio holdings with the SEC for the first and third quarters of each fiscal year as an exhibit on Form N-PORT. The Funds’ Form N-PORT reports are available on the SEC’s website at www.sec.gov.
CFA® and Chartered Financial Analyst® are registered trademarks owned by the CFA Institute.
UNDERSTANDING FUND EXPENSES
As a mutual fund shareholder, you incur different costs: transaction costs, including sales charges (loads) on purchases and contingent deferred sales charges on redemptions, and ongoing costs, including management fees, distribution and/or service fees (12b-1 fees), and other fund expenses. Certain exemptions may apply. These costs are described in more detail in the Funds’ prospectus. The following examples are intended to help you understand the ongoing costs of investing in the Funds and help you compare these with the ongoing costs of investing in other mutual funds.
The first line in the table of each class of Fund shares shows the actual account values and actual Fund expenses you would have paid on a $1,000 investment in the Fund from April 1, 2020 through September 30, 2020. To estimate the expenses you paid over the period, simply divide your account value by $1,000 (for example $8,600 account value divided by $1,000 = 8.6) and multiply the result by the number in the Expenses Paid During Period column as shown below for your class.
The second line in the table of each class of Fund shares provides information about hypothetical account values and hypothetical expenses based on the Fund’s actual expense ratios and an assumed rate of return of 5% per year before expenses, which is not the Fund’s actual return. The hypothetical account values and expenses may not be used to estimate the actual ending account balance or expenses you paid on your investment for the period. You may use this information to compare the ongoing costs of investing in the Fund to other funds. To do so, compare this 5% hypothetical example with the 5% hypothetical examples that appear in the shareholder reports of the other funds.
Please note that the expenses shown reflect ongoing costs only, and do not include any transaction costs, such as sales charges. Therefore, the second line in the table of each fund is useful in comparing ongoing costs only, and will not help you determine the relative costs of owning different funds. If transaction costs were included, total costs would be higher.
| | | | | | | | | | | | |
| LOOMIS SAYLES CREDIT INCOME FUND | | BEGINNING
ACCOUNT VALUE
4/1/20201 | | | ENDING
ACCOUNT VALUE
9/30/2020 | | | EXPENSES PAID
DURING PERIOD
4/1/20201 – 9/30/2020 | |
| Class A | | | | | | | | | | | | |
| Actual | | | $1,000.00 | | | | $997.00 | | | | $0.02 | 1 |
| Hypothetical (5% return before expenses) | | | $1,000.00 | | | | $1,020.90 | | | | $4.14 | * |
| Class C | | | | | | | | | | | | |
| Actual | | | $1,000.00 | | | | $997.00 | | | | $0.04 | 1 |
| Hypothetical (5% return before expenses) | | | $1,000.00 | | | | $1,017.15 | | | | $7.92 | * |
| Class N | | | | | | | | | | | | |
| Actual | | | $1,000.00 | | | | $997.00 | | | | $0.01 | 1 |
| Hypothetical (5% return before expenses) | | | $1,000.00 | | | | $1,022.40 | | | | $2.63 | * |
| Class Y | | | | | | | | | | | | |
| Actual | | | $1,000.00 | | | | $997.00 | | | | $0.02 | 1 |
| Hypothetical (5% return before expenses) | | | $1,000.00 | | | | $1,022.15 | | | | $2.88 | * |
| * | Expenses are equal to the Fund’s annualized expense ratio (after waiver/reimbursement): 0.82%, 1.57%, 0.52% and 0.57% for Class A, C, N and Y, respectively, multiplied by the average account value over the period, multiplied by the number of days in the most recent fiscal half-year (183), divided by 366 (to reflect the half-year period). |
| 1 | Fund commenced operations on September 29, 2020. Actual expenses are equal to the Fund’s annualized expense ratio (after waiver/reimbursement) of 0.82%, 1.57%, 0.52% and 0.57% for Class A, C, N and Y, respectively, multiplied by the average account value over the period, multiplied by the number of days in the most recent fiscal period (1), divided by 366 (to reflect the partial period). |
| | | | | | | | | | | | |
LOOMIS SAYLES INTERMEDIATE
DURATION BOND FUND | | BEGINNING
ACCOUNT VALUE
4/1/2020 | | | ENDING
ACCOUNT VALUE
9/30/2020 | | | EXPENSES PAID
DURING PERIOD*
4/1/2020 – 9/30/2020 | |
| Class A | | | | | | | | | | | | |
| Actual | | | $1,000.00 | | | | $1,062.30 | | | | $3.35 | |
| Hypothetical (5% return before expenses) | | | $1,000.00 | | | | $1,021.75 | | | | $3.29 | |
| Class C | | | | | | | | | | | | |
| Actual | | | $1,000.00 | | | | $1,058.20 | | | | $7.20 | |
| Hypothetical (5% return before expenses) | | | $1,000.00 | | | | $1,018.00 | | | | $7.06 | |
| Class N | | | | | | | | | | | | |
| Actual | | | $1,000.00 | | | | $1,063.90 | | | | $1.81 | |
| Hypothetical (5% return before expenses) | | | $1,000.00 | | | | $1,023.25 | | | | $1.77 | |
| Class Y | | | | | | | | | | | | |
| Actual | | | $1,000.00 | | | | $1,063.60 | | | | $2.06 | |
| Hypothetical (5% return before expenses) | | | $1,000.00 | | | | $1,023.00 | | | | $2.02 | |
| * | Expenses are equal to the Fund’s annualized expense ratio (after waiver/reimbursement): 0.65%, 1.40%, 0.35% and 0.40% for Class A, C, N and Y, respectively, multiplied by the average account value over the period, multiplied by the number of days in the most recent fiscal half-year (183), divided by 366 (to reflect the half-year period). |
| | | | | | | | | | | | |
LOOMIS SAYLES LIMITED TERM
GOVERNMENT AND AGENCY FUND | | BEGINNING
ACCOUNT VALUE
4/1/2020 | | | ENDING
ACCOUNT VALUE
9/30/2020 | | | EXPENSES PAID
DURING PERIOD*
4/1/2020 – 9/30/2020 | |
| Class A | | | | | | | | | | | | |
| Actual | | | $1,000.00 | | | | $1,008.50 | | | | $3.82 | |
| Hypothetical (5% return before expenses) | | | $1,000.00 | | | | $1,021.20 | | | | $3.84 | |
| Class C | | | | | | | | | | | | |
| Actual | | | $1,000.00 | | | | $1,003.90 | | | | $7.61 | |
| Hypothetical (5% return before expenses) | | | $1,000.00 | | | | $1,017.40 | | | | $7.67 | |
| Class N | | | | | | | | | | | | |
| Actual | | | $1,000.00 | | | | $1,009.30 | | | | $2.16 | |
| Hypothetical (5% return before expenses) | | | $1,000.00 | | | | $1,022.85 | | | | $2.17 | |
| Class Y | | | | | | | | | | | | |
| Actual | | | $1,000.00 | | | | $1,008.80 | | | | $2.61 | |
| Hypothetical (5% return before expenses) | | | $1,000.00 | | | | $1,022.40 | | | | $2.63 | |
| * | Expenses are equal to the Fund’s annualized expense ratio (after waiver/reimbursement): 0.76%, 1.52%, 0.43% and 0.52% for Class A, C, N and Y, respectively, multiplied by the average account value over the period, multiplied by the number of days in the most recent fiscal half-year (183), divided by 366 (to reflect the half-year period). |
BOARD APPROVAL OF THE INITIAL ADVISORY AGREEMENT FOR LOOMIS SAYLES CREDIT INCOME FUND
The Investment Company Act of 1940, as amended (the “1940 Act”), requires that both the full Board of Trustees of the Trust (the “Board”) and a majority of the Trustees who are not “interested persons” (as defined in the 1940 Act) of the Trust (the “Independent Trustees”), voting separately, initially approve any new investment advisory agreements for a registered investment company, including a newly formed fund such as the Loomis Sayles Credit Income Fund (the “Fund”). The Trustees, including the Independent Trustees, unanimously approved, for an initial two-year term, the proposed investment advisory agreement (the “Agreement”) for the Fund at a meeting held on September 10, 2020.
In connection with this review, Fund management and other representatives of the Fund’s adviser, Loomis, Sayles & Company, L.P. (the “Adviser”), distributed to the Trustees materials including, among other items, information regarding (i) the Fund’s investment objective, strategies and risks, (ii) the proposed advisory fees and other expenses to be charged to the Fund, including information comparing the Fund’s expenses to those of peer groups and categories of funds and information on fees charged to other funds and accounts advised by the Adviser and the proposed expense cap, (iii) the size, education and experience of the Adviser’s investment staff and the investment strategies proposed to be used in managing the Fund, (iv) proposed arrangements for the distribution of the Fund’s shares, (v) information about the Adviser’s performance, and (vi) the general economic outlook with particular emphasis on the mutual fund industry.
The Trustees also considered the fact that they oversee other funds advised by the Adviser as well as information about the Adviser they had received in connection with their oversight of those other funds. Because the Fund is newly formed and had not commenced operations at the time of the Trustees’ review, certain information, including data relating to Fund performance, was not available, and therefore could not be distributed to the Trustees. Throughout the process, the Trustees were afforded the opportunity to ask questions of, and request additional materials from, the Adviser.
In considering whether to initially approve the Agreement, the Board, including the Independent Trustees, did not identify any single factor as determinative. Individual Trustees may have evaluated the information presented differently from one another, giving different weights to various factors. Matters considered by the Trustees, including the Independent Trustees, in connection with their approval of the Agreement included, but were not limited to, the factors listed below.
The nature, extent and quality of the services to be provided to the Fund under the Agreement. The Trustees considered the nature, extent and quality of the services to be provided by the Adviser and its affiliates to the Fund and the resources to be dedicated to the Fund by the Adviser and its affiliates. The Trustees considered their experience with other funds advised by the Adviser, as well as the affiliation between the Adviser and Natixis Investment Managers, LLC, whose affiliates provide investment advisory services to other funds in the same family of mutual funds. In this regard, the Trustees considered not only the advisory services proposed to be provided by the Adviser to the Fund, but also the
monitoring and oversight services proposed to be provided by Natixis Advisors, L.P. (“Natixis Advisors”). They also considered the administrative and shareholder services proposed to be provided by Natixis Advisors and its affiliates to the Fund.
The Trustees also considered the benefits to shareholders of investing in a mutual fund that is part of a family of funds that offers shareholders the right to exchange shares of one type of fund for shares of another type of fund, and provides a variety of fund and shareholder services.
After reviewing these and related factors, the Trustees concluded, within the context of their overall conclusions regarding the Agreement, that the scope of the services to be provided to the Fund under the Agreement seemed consistent with the Fund’s operational requirements, and that the Adviser had the capabilities, resources and personnel necessary to provide the advisory services that would be required by the Fund. The Trustees determined that the nature, extent and quality of services proposed to be provided under the Agreement supported approval of the Agreement.
Investment performance of the Fund and the Adviser. Because the Fund had not yet commenced operations, performance information for the Fund was not considered; however, the Board considered the performance of other funds and accounts managed by the Adviser.
The Trustees also considered the Adviser’s performance and reputation generally, the performance of the fund family generally, and the historical responsiveness of the Adviser to Trustee concerns about performance and the willingness of the Adviser to take steps intended to improve performance.
After reviewing these and related factors, the Trustees concluded, within the context of their overall conclusions regarding the Agreement, that these relevant factors supported approval of the Agreement.
The costs of the services to be provided by the Adviser and profits to be realized by the Adviser and its affiliates from their respective relationships with the Fund. Although the Fund had not yet commenced operations at the time of the Trustees’ review of the Agreement, the Trustees reviewed information comparing the proposed advisory fees and estimated total expenses of the Fund’s share classes with the fees and expenses of comparable share classes of comparable funds identified by the Adviser, including information about how those funds were selected and information about differences in such fees. In evaluating the Fund’s proposed advisory fee, the Trustees also took into account the demands, complexity and quality of the investment management of the Fund. The Trustees also noted that the Fund would have an expense limitation in place. In addition, the Trustees considered information regarding the administrative and distribution fees to be paid by the Fund to the Adviser’s affiliates.
Because the Fund had not yet commenced operations, historical profitability information with respect to the Fund was not considered. However, the Trustees noted the information provided in court cases in which adviser profitability was an issue, the estimated expense level of the Fund, and that the Fund would be subject to an expense limitation.
After reviewing these and related factors, the Trustees concluded, within the context of their overall conclusions regarding the Agreement, that the advisory fee and expenses proposed to be charged to the Fund were fair and reasonable, and supported the approval of the Agreement.
Economies of scale. The Trustees considered the extent to which the Adviser may realize economies of scale in the provision of services by the Adviser, and whether those economies could be shared with the Fund through breakpoints in its investment advisory fee or other means, such as expense limitations. The Trustees noted that the Fund will be subject to an expense limitation. After reviewing these and related factors, the Trustees concluded, within the context of their overall conclusions regarding the Agreement, that the extent to which economies of scale might be shared with the Fund supported the approval of the Agreement.
The Trustees also considered other factors, which included but were not limited to the following:
| · | | The compliance-related resources the Adviser and its affiliates would provide to the Fund. |
| · | | The nature, quality, cost and extent of administrative and shareholder services to be performed by the Adviser and its affiliates, both under the Agreement and under separate agreements covering administrative services. |
| · | | So-called “fallout benefits” to the Adviser, such as the engagement of affiliates of the Adviser to provide distribution and administrative services to the Fund, and the benefits of research made available to the Adviser by reason of brokerage commissions (if any) generated by the Fund’s securities transactions. The Trustees also considered the benefits to the parent company of Natixis Advisors from the retention of the Adviser. The Trustees considered the possible conflicts of interest associated with these fallout and other benefits, and the reporting, disclosure and other processes in place to disclose and monitor such possible conflicts of interest. |
Based on their evaluation of all factors that they deemed to be material, including those factors described above, and assisted by the advice of independent counsel, the Trustees, including the Independent Trustees, concluded that the Agreement should be approved.
Loomis Sayles Intermediate Duration Bond Fund and Loomis Sayles Limited Term Government and Agency Fund
BOARD APPROVAL OF THE EXISTING ADVISORY AGREEMENTS
The Board of Trustees of the Trusts (the “Board”), including the Independent Trustees, considers matters bearing on each Fund’s advisory agreement (collectively, the “Agreements”) at most of its meetings throughout the year. Each year, usually in the spring, the Contract Review Committee of the Board meets to review the Agreements to determine whether to recommend that the full Board approve the continuation of the Agreements, typically for an additional one-year period. After the Contract Review Committee has made its recommendation, the full Board, including the Independent Trustees, determines whether to approve the continuation of the Agreements.
In connection with these meetings, the Trustees receive materials that the Funds’ investment adviser (the “Adviser”) believes to be reasonably necessary for the Trustees to evaluate the Agreements. These materials generally include, among other items, (i) information on the investment performance of the Funds and the performance of peer groups of funds and the Funds’ performance benchmarks, (ii) information on the Funds’ advisory fees and other expenses, including information comparing the Funds’ advisory fees to the fees charged to institutional accounts with similar strategies managed by the Adviser, if any, and to those of peer groups of funds and information about any applicable expense limitations and/or fee “breakpoints,” (iii) sales and redemption data in respect of the Funds, (iv) information about the profitability of the Agreements to the Adviser and (v) information obtained through the completion by the Adviser of a questionnaire distributed on behalf of the Trustees. The Board, including the Independent Trustees, also considers other matters such as (i) each Fund’s investment objective and strategies and the size, education and experience of the Adviser’s investment staff and its use of technology, external research and trading cost measurement tools, (ii) arrangements in respect of the distribution of the Funds’ shares and the related costs, (iii) the allocation of the Funds’ brokerage, if any, including, to the extent applicable, the use of “soft” commission dollars to pay for research and other similar services, (iv) each Adviser’s policies and procedures relating to, among other things, compliance, trading and best execution, proxy voting and valuation, (v) information about amounts invested by the Funds’ portfolio managers in the Funds or in similar accounts that they manage and (vi) the general economic outlook with particular emphasis on the mutual fund industry. Throughout the process, the Trustees are afforded the opportunity to ask questions of and request additional materials from the Adviser.
In addition to the materials requested by the Trustees in connection with their annual consideration of the continuation of the Agreements, the Trustees receive materials in advance of each regular quarterly meeting of the Board that provide detailed information about the Funds’ investment performance and the fees charged to the Funds for advisory and other services. This information generally includes, among other things, an internal performance rating for each Fund based on agreed-upon criteria, graphs showing each Fund’s performance and expense differentials against each Fund’s peer group/category of
funds, performance ratings provided by a third-party, total return information for various periods, and third-party performance rankings for various periods comparing a Fund against similarly categorized funds. The portfolio management team for each Fund or other representatives of the Adviser make periodic presentations to the Contract Review Committee and/or the full Board, and Funds identified as presenting possible performance concerns may be subject to more frequent Board or Committee presentations and reviews. In addition, each quarter the Trustees are provided with detailed statistical information about each Fund’s portfolio. The Trustees also receive periodic updates between meetings. These updates have increased in frequency during the COVID-19 crisis.
The Board most recently approved the continuation of the Agreements for a one-year period at its meeting held in June 2020. In the case of Loomis Sayles Limited Term Government and Agency Fund, the Board approved the Agreement with an amendment that reduced the Fund’s advisory fee effective on July 1, 2020. In considering whether to approve the continuation of the Agreements, the Board, including the Independent Trustees, did not identify any single factor as determinative. Individual Trustees may have evaluated the information presented differently from one another, giving different weights to various factors. Matters considered by the Trustees, including the Independent Trustees, in connection with their approval of the Agreements included, but were not limited to, the factors listed below.
The nature, extent and quality of the services provided to the Funds under the Agreements. The Trustees considered the nature, extent and quality of the services provided by the Adviser and its affiliates to the Funds and the resources dedicated to the Funds by the Adviser and its affiliates.
The Trustees considered not only the advisory services provided by the Adviser to the Funds, but also the monitoring and oversight services provided by Natixis Advisors, L.P. (“Natixis Advisors”). They also considered the administrative and shareholder services provided by Natixis Advisors and its affiliates to the Funds. They also took into consideration increases in the services provided resulting from new regulatory requirements.
For each Fund, the Trustees also considered the benefits to shareholders of investing in a mutual fund that is part of a family of funds that offers shareholders the right to exchange shares of one type of fund for shares of another type of fund, and provides a variety of fund and shareholder services.
After reviewing these and related factors, the Trustees concluded, within the context of their overall conclusions regarding each of the Agreements, that the nature, extent and quality of services provided supported the renewal of the Agreements.
Investment performance of the Funds and the Adviser. As noted above, the Trustees received information about the performance of the Funds over various time periods, including information that compared the performance of the Funds to the performance of peer groups and categories of funds and the Funds’ respective performance benchmarks. In addition, the Trustees reviewed data prepared by an independent third party that analyzed the performance of the Funds using a variety of performance metrics, including metrics that measured the performance of the Funds on a risk adjusted basis.
The Board noted that through December 31, 2019, each Fund’s one-, three- and five-year performance, stated as percentile rankings within categories selected by the independent third-party data provider was as follows (where the best performance would be in the first percentile of its category):
| | | | | | | | | | | | |
| | | One-Year | | | Three-Year | | | Five-Year | |
Loomis Sayles Intermediate Duration Bond Fund | | | 71 | % | | | 77 | % | | | 67 | % |
Loomis Sayles Limited Term Government and Agency Fund | | | 43 | % | | | 20 | % | | | 20 | % |
In the case of a Intermediate Duration Bond Fund that had performance that lagged that of a relevant category group median as determined by the independent third-party for certain (although not necessarily all) periods, the Board concluded that other factors relevant to performance supported renewal of the Agreement, including: (1) that the underperformance was attributable, to a significant extent, to investment decisions (such as security selection or sector allocation) by the Adviser that were reasonable and consistent with the Fund’s investment objective and policies and (2) that the Fund had outperformed its relevant performance benchmark for all periods. The Board also considered information about the Funds’ more recent performance, including how that performance had been impacted by the COVID-19 crisis.
The Trustees also considered the Adviser’s performance and reputation generally, the performance of the fund family generally, and the historical responsiveness of the Adviser to Trustee concerns about performance and the willingness of the Adviser to take steps intended to improve performance.
After reviewing these and related factors, the Trustees concluded, within the context of their overall conclusions regarding each of the Agreements, that the performance of the Funds and the Adviser and/or other relevant factors supported the renewal of the Agreements.
The costs of the services to be provided and profits to be realized by the Adviser and its affiliates from their respective relationships with the Funds. The Trustees considered the fees charged to the Funds for advisory and administrative services as well as the total expense levels of the Funds. This information included comparisons (provided both by management and by an independent third party) of the Funds’ advisory fees and total expense levels to those of their peer groups and information about the advisory fees charged by the Adviser to comparable accounts (such as institutional separate accounts), as well as information about differences in such fees and the reasons for any such differences. In considering the fees charged to comparable accounts, the Trustees considered, among other things, management’s representations about the differences between managing mutual funds as compared to other types of accounts, including the additional resources required to effectively manage mutual fund assets, the greater regulatory costs associated with the management of such assets, and the entrepreneurial, regulatory and other risks associated with sponsoring and managing mutual funds. In evaluating each Fund’s advisory fee, the Trustees also took into account the demands, complexity and quality of the investment management of such Fund, as well as the need for the Adviser to offer competitive compensation and the potential need to expend additional resources to the extent the Fund grows in size. The Trustees considered that over the past several years, management had
made recommendations regarding reductions in advisory fee rates, implementation of advisory fee breakpoints and the institution of advisory fee waivers and expense limitations for various funds in the fund family. They noted that both of the Funds have expense limitations in place, and they considered the amounts waived or reimbursed by the Adviser for Loomis Sayles Intermediate Duration Bond Fund under its expense limitation agreement. The Trustees also considered that Loomis Sayles Limited Term Government and Agency Fund’s current expenses are below its limitation. They further noted that management had proposed to reduce the expense limitation for Loomis Sayles Limited Term Government and Agency Fund on all share classes, effective as of July 1, 2020. The Trustees noted that the total advisory fee rates for the Funds were below the medians of their respective peer group of funds. They further noted that management had proposed to reduce the advisory fee rate for Loomis Sayles Limited Term Government and Agency Fund.
The Trustees also considered the compensation directly or indirectly received by the Adviser and its affiliates from their relationships with the Funds. The Trustees reviewed information provided by management as to the profitability of the Adviser’s and its affiliates’ relationships with the Funds, and information about how expenses are determined and allocated for purposes of profitability calculations. They also reviewed information provided by management about the effect of distribution costs and changes in asset levels on Adviser profitability, including information regarding resources spent on distribution activities. When reviewing profitability, the Trustees also considered information about court cases in which adviser compensation or profitability were issues, the performance of the Funds, the expense levels of the Funds, whether the Adviser had implemented breakpoints and/or expense limitations with respect to such Funds and the overall profit margin of Natixis Investment Managers compared to that of certain other investment managers for which such data was available.
After reviewing these and related factors, the Trustees concluded, within the context of their overall conclusions regarding each of the Agreements, that the advisory fee charged to each of the Funds was fair and reasonable, and that the costs of these services generally and the related profitability of the Adviser and its affiliates in respect of their relationships with the Funds supported the renewal of the Agreements.
Economies of Scale. The Trustees considered the existence of any economies of scale in the provision of services by the Adviser and whether those economies are shared with the Funds through breakpoints in their investment advisory fees or other means, such as expense limitations. The Trustees also considered management’s explanation of the factors that are taken into account with respect to the implementation of breakpoints in investment advisory fees or expense limitations. With respect to economies of scale, the Trustees noted that Loomis Sayles Limited Term Government and Agency Fund had breakpoints in its advisory fee and that each of the Funds was subject to an expense limitation. The Trustees also considered management’s proposal to reduce the expense limitation for Loomis Sayles Limited Term Government and Agency Fund. In considering these issues, the Trustees also took note of the costs of the services provided (both on an absolute and on a relative basis) and the profitability to the Adviser and its affiliates of their relationships with the Funds, as discussed above. The Trustees also considered that the Funds have benefitted from the substantial reinvestment the Adviser has made into its business.
After reviewing these and related factors, the Trustees concluded, within the context of their overall conclusions regarding each of the Agreements, that the extent to which economies of scale were shared with the Funds supported the renewal of the Agreements.
The Trustees also considered other factors, which included but were not limited to the following:
| · | | The effect of recent market and economic events, including but not limited to the COVID-19 crisis, on the performance, asset levels and expense ratios of each Fund. |
| · | | Whether each Fund has operated in accordance with its investment objective and the Fund’s record of compliance with its investment restrictions, and the compliance programs of the Funds and the Adviser. They also considered the compliance-related resources the Adviser and its affiliates were providing to the Funds. |
| · | | So-called “fallout benefits” to the Adviser, such as the engagement of affiliates of the Adviser to provide distribution and administrative services to the Funds, and the benefits of research made available to the Adviser by reason of brokerage commissions (if any) generated by the Funds’ securities transactions. The Trustees also considered the benefits to the parent company of Natixis Advisors from the retention of the Adviser. The Trustees considered the possible conflicts of interest associated with these fallout and other benefits, and the reporting, disclosure and other processes in place to disclose and monitor such possible conflicts of interest. |
| · | | The Trustees’ review and discussion of the Funds’ advisory arrangements in prior years, and management’s record of responding to Trustee concerns raised during the year and in prior years. |
Based on their evaluation of all factors that they deemed to be material, including those factors described above, and assisted by the advice of independent counsel, the Trustees, including the Independent Trustees, concluded that each of the existing Agreements, with the reduction of the advisory fee for Loomis Sayles Limited Term Government and Agency Fund, should be continued through June 30, 2021.
LIQUIDITY RISK MANAGEMENT PROGRAM
Annual Report for the Period Commencing on December 1, 2018 and ending December 31, 2019 (including updates through September 30, 2020)
Effective December 1, 2018, (September 29, 2020 for Credit Income Fund), the Funds adopted a liquidity risk management program (the “Program”) pursuant to the requirements of Rule 22e-4 under the Investment Company Act of 1940, as amended (the “Rule”). The Rule requires registered open-end funds, including mutual funds and exchange-traded funds to establish liquidity risk management programs in order to effectively manage fund liquidity and mitigate the risk that a fund could not meet redemption requests without significantly diluting the interests of remaining investors.
The rule requires the Funds to assess, manage and review their liquidity risk considering applicable factors during normal and foreseeable stressed conditions. In fulfilling this requirement, each Fund assesses and reviews (where applicable and amongst other matters) its investment strategy, portfolio holdings, possible investment concentrations, use of derivatives, short-term and long-term cash flow projections, use of cash and cash equivalents, as well as borrowing arrangements and other funding sources. Each Program has established a Program Administrator which is the adviser of the Fund.
In accordance with the Program, each of the Fund’s portfolio investments is classified into one of four liquidity categories based on a determination of a reasonable expectation for how long it would take to convert the investment to cash (or sell or dispose of the investment) without significantly changing its market value.
Each Fund is prohibited from acquiring an investment if, after the acquisition, its holdings of illiquid assets will exceed 15% of its net assets. If a Fund does not hold a majority of highly liquid investments in its portfolio, then the Fund is required to establish a highly liquid investment minimum (“HLIM”). Loomis Sayles Intermediate Duration Bond Fund has established an HLIM.
During the period from December 1, 2018 to December 31, 2019, there were no material changes to the Program and no material events that impacted the operation of the Funds’ Programs. During the period, the Funds held sufficient liquid assets to meet redemptions on a timely basis and did not have any HLIM or illiquid security violations during the period.
During the period January 1, 2020 through September 30, 2020, the Funds held sufficient liquid assets to meet redemptions on a timely basis and did not have any HLIM or illiquid security violations.
Annual Program Assessment and Conclusion
In the opinion of the Program Administrator, the Program of each Fund approved by the Funds’ Board has been implemented effectively. The Program Administrator has also monitored, assessed and managed each Fund’s liquidity risk regularly and has determined that the Program is operating effectively.
Pursuant to the Rule’s requirements, the Board has received and reviewed a written report prepared by each Fund’s Program Administrator that addressed the operation of the Program, assessed its adequacy and effectiveness and described any material changes made to the Program.
Portfolio of Investments – as of September 30, 2020
Loomis Sayles Credit Income Fund
| | | | | | | | |
Principal
Amount | | | Description | | Value (†) | |
| | Bonds and Notes — 93.9% of Net Assets | |
| | Non-Convertible Bonds — 91.8% | |
| | | | Aerospace & Defense — 2.9% | |
| $ | 20,000 | | | Boeing Co. (The), 2.250%, 6/15/2026 | | $ | 19,467 | |
| | 20,000 | | | Boeing Co. (The), 2.950%, 2/01/2030 | | | 19,356 | |
| | 5,000 | | | Boeing Co. (The), 3.100%, 5/01/2026 | | | 4,988 | |
| | 10,000 | | | Boeing Co. (The), 3.200%, 3/01/2029 | | | 9,848 | |
| | 5,000 | | | Boeing Co. (The), 3.250%, 2/01/2035 | | | 4,700 | |
| | 5,000 | | | Boeing Co. (The), 3.375%, 6/15/2046 | | | 4,285 | |
| | 5,000 | | | Boeing Co. (The), 3.500%, 3/01/2039 | | | 4,542 | |
| | 15,000 | | | Boeing Co. (The), 3.550%, 3/01/2038 | | | 13,664 | |
| | 5,000 | | | Boeing Co. (The), 3.625%, 3/01/2048 | | | 4,394 | |
| | 35,000 | | | Boeing Co. (The), 3.750%, 2/01/2050 | | | 31,938 | |
| | 10,000 | | | Boeing Co. (The), 3.850%, 11/01/2048 | | | 9,163 | |
| | 20,000 | | | Boeing Co. (The), 3.950%, 8/01/2059 | | | 18,105 | |
| | 70,000 | | | Boeing Co. (The), 5.150%, 5/01/2030 | | | 78,681 | |
| | 70,000 | | | Boeing Co. (The), 5.805%, 5/01/2050 | | | 84,685 | |
| | 30,000 | | | Huntington Ingalls Industries, Inc., 3.844%, 5/01/2025, 144A | | | 32,964 | |
| | 20,000 | | | Huntington Ingalls Industries, Inc., 4.200%, 5/01/2030, 144A | | | 22,956 | |
| | 125,000 | | | Raytheon Technologies Corp., 2.800%, 3/15/2022, 144A | | | 128,880 | |
| | 5,000 | | | Spirit AeroSystems, Inc., 4.600%, 6/15/2028 | | | 4,103 | |
| | 30,000 | | | Spirit AeroSystems, Inc., 7.500%, 4/15/2025, 144A | | | 30,412 | |
| | 125,000 | | | Textron, Inc., 3.000%, 6/01/2030 | | | 131,657 | |
| | 60,000 | | | TransDigm, Inc., 6.250%, 3/15/2026, 144A | | | 62,658 | |
| | | | | | | | |
| | | | | | | 721,446 | |
| | | | | | | | |
| | | | Automotive — 2.3% | |
| | 30,000 | | | Ford Motor Co., 8.500%, 4/21/2023 | | | 32,700 | |
| | 40,000 | | | Ford Motor Co., 9.000%, 4/22/2025 | | | 45,861 | |
| | 5,000 | | | Ford Motor Co., 9.625%, 4/22/2030 | | | 6,456 | |
| | 170,000 | | | General Motors Co., 5.200%, 4/01/2045 | | | 183,118 | |
| | 255,000 | | | General Motors Co., 6.250%, 10/02/2043 | | | 302,191 | |
| | | | | | | | |
| | | | | | | 570,326 | |
| | | | | | | | |
| | | | Banking — 12.3% | |
| | 165,000 | | | Ally Financial, Inc., 5.125%, 9/30/2024 | | | 183,892 | |
| | 110,000 | | | Ally Financial, Inc., 5.750%, 11/20/2025 | | | 123,330 | |
| | 270,000 | | | Bank of America Corp., MTN, 4.250%, 10/22/2026 | | | 312,641 | |
| | 200,000 | | | Barclays PLC, (fixed rate to 9/23/2030, variable rate thereafter), 3.564%, 9/23/2035 | | | 197,648 | |
| | 215,000 | | | Citigroup, Inc., 4.450%, 9/29/2027 | | | 249,313 | |
| | 250,000 | | | Credit Agricole S.A., (fixed rate to 1/10/2028, variable rate thereafter), 4.000%, 1/10/2033, 144A | | | 274,220 | |
| | 150,000 | | | Deutsche Bank AG, (fixed rate to 9/18/2030, variable rate thereafter), 3.547%, 9/18/2031 | | | 151,566 | |
| | 210,000 | | | Goldman Sachs Group, Inc. (The), 4.250%, 10/21/2025 | | | 238,917 | |
| | 155,000 | | | JPMorgan Chase & Co., (fixed rate to 3/24/2030, variable rate thereafter), 4.493%, 3/24/2031 | | | 189,153 | |
| | 390,000 | | | Morgan Stanley, 3.625%, 1/20/2027 | | | 441,971 | |
| | | | |
| 25 | | | See accompanying notes to financial statements. | | |
Portfolio of Investments – as of September 30, 2020
Loomis Sayles Credit Income Fund – (continued)
| | | | | | | | |
Principal
Amount | | | Description | | Value (†) | |
| | | | Banking — continued | |
| $ | 115,000 | | | Santander Holdings USA, Inc., 3.244%, 10/05/2026 | | $ | 123,059 | |
| | 30,000 | | | Santander Holdings USA, Inc., 3.500%, 6/07/2024 | | | 32,178 | |
| | 200,000 | | | Societe Generale S.A., (fixed rate to 7/08/2030, variable rate thereafter), 3.653%, 7/08/2035, 144A | | | 201,229 | |
| | 200,000 | | | Standard Chartered PLC, (fixed rate to 4/01/2030, variable rate thereafter), 4.644%, 4/01/2031, 144A | | | 230,216 | |
| | 115,000 | | | Synchrony Financial, 4.375%, 3/19/2024 | | | 124,435 | |
| | | | | | | | |
| | | | | | | 3,073,768 | |
| | | | | | | | |
| | | | Brokerage — 1.0% | |
| | 15,000 | | | Jefferies Group LLC, 6.250%, 1/15/2036 | | | 18,589 | |
| | 180,000 | | | Jefferies Group LLC, 6.500%, 1/20/2043 | | | 226,428 | |
| | | | | | | | |
| | | | | | | 245,017 | |
| | | | | | | | |
| | | | Building Materials — 1.5% | |
| | 45,000 | | | Builders FirstSource, Inc., 6.750%, 6/01/2027, 144A | | | 48,206 | |
| | 200,000 | | | Cemex SAB de CV, 7.750%, 4/16/2026, 144A | | | 210,750 | |
| | 55,000 | | | JELD-WEN, Inc., 4.875%, 12/15/2027, 144A | | | 56,048 | |
| | 45,000 | | | Standard Industries, Inc., 4.375%, 7/15/2030, 144A | | | 46,137 | |
| | 20,000 | | | Vulcan Materials Co., 3.500%, 6/01/2030 | | | 22,398 | |
| | | | | | | | |
| | | | | | | 383,539 | |
| | | | | | | | |
| | | | Cable Satellite — 4.5% | |
| | 120,000 | | | CCO Holdings LLC/CCO Holdings Capital Corp., 4.250%, 2/01/2031, 144A | | | 124,033 | |
| | 120,000 | | | CCO Holdings LLC/CCO Holdings Capital Corp., 4.500%, 8/15/2030, 144A | | | 126,005 | |
| | 220,000 | | | Charter Communications Operating LLC/Charter Communications Operating Capital Corp., 4.800%, 3/01/2050 | | | 250,169 | |
| | 110,000 | | | Cox Communications, Inc., 4.800%, 2/01/2035, 144A | | | 138,347 | |
| | 5,000 | | | Sirius XM Radio, Inc., 4.625%, 7/15/2024, 144A | | | 5,172 | |
| | 30,000 | | | Sirius XM Radio, Inc., 5.000%, 8/01/2027, 144A | | | 31,275 | |
| | 10,000 | | | Sirius XM Radio, Inc., 5.375%, 7/15/2026, 144A | | | 10,407 | |
| | 5,000 | | | Sirius XM Radio, Inc., 5.500%, 7/01/2029, 144A | | | 5,363 | |
| | 200,000 | | | Time Warner Cable LLC, 4.500%, 9/15/2042 | | | 217,253 | |
| | 200,000 | | | Virgin Media Secured Finance PLC, 5.500%, 8/15/2026, 144A | | | 208,500 | |
| | | | | | | | |
| | | | | | | 1,116,524 | |
| | | | | | | | |
| | | | Chemicals — 0.9% | |
| | 70,000 | | | CF Industries, Inc., 4.500%, 12/01/2026, 144A | | | 81,229 | |
| | 15,000 | | | FMC Corp., 3.450%, 10/01/2029 | | | 16,705 | |
| | 5,000 | | | FMC Corp., 4.500%, 10/01/2049 | | | 6,216 | |
| | 60,000 | | | Hercules LLC, 6.500%, 6/30/2029 | | | 60,164 | |
| | 35,000 | | | LYB International Finance III LLC, 4.200%, 10/15/2049 | | | 38,546 | |
| | 30,000 | | | Westlake Chemical Corp., 3.600%, 8/15/2026 | | | 32,955 | |
| | | | | | | | |
| | | | | | | 235,815 | |
| | | | | | | | |
| | | | Construction Machinery — 0.5% | |
| | 60,000 | | | United Rentals North America, Inc., 5.250%, 1/15/2030 | | | 65,475 | |
| | 60,000 | | | United Rentals North America, Inc., 5.500%, 5/15/2027 | | | 63,675 | |
| | | | | | | | |
| | | | | | | 129,150 | |
| | | | | | | | |
| | | | |
| | See accompanying notes to financial statements. | | | 26 |
Portfolio of Investments – as of September 30, 2020
Loomis Sayles Credit Income Fund – (continued)
| | | | | | | | |
Principal
Amount | | | Description | | Value (†) | |
| | | | Consumer Cyclical Services — 4.4% | |
| $ | 245,000 | | | Amazon.com, Inc., 2.500%, 6/03/2050 | | $ | 249,905 | |
| | 155,000 | | | Booking Holdings, Inc., 4.625%, 4/13/2030 | | | 186,216 | |
| | 55,000 | | | eBay, Inc., 4.000%, 7/15/2042 | | | 61,468 | |
| | 300,000 | | | Expedia Group, Inc., 3.250%, 2/15/2030 | | | 289,053 | |
| | 55,000 | | | IHS Markit Ltd., 4.250%, 5/01/2029 | | | 63,804 | |
| | 115,000 | | | Uber Technologies, Inc., 7.500%, 5/15/2025, 144A | | | 122,543 | |
| | 115,000 | | | Uber Technologies, Inc., 8.000%, 11/01/2026, 144A | | | 122,566 | |
| | | | | | | | |
| | | | | | | 1,095,555 | |
| | | | | | | | |
| | | | Diversified Manufacturing — 0.5% | |
| | 70,000 | | | Carrier Global Corp., 2.722%, 2/15/2030, 144A | | | 73,223 | |
| | 45,000 | | | Carrier Global Corp., 3.577%, 4/05/2050, 144A | | | 47,805 | |
| | | | | | | | |
| | | | | | | 121,028 | |
| | | | | | | | |
| | | | Electric — 3.6% | |
| | 5,000 | | | AES Corp. (The), 3.950%, 7/15/2030, 144A | | | 5,525 | |
| | 70,000 | | | AES Corp. (The), 5.125%, 9/01/2027 | | | 74,557 | |
| | 40,000 | | | Calpine Corp., 5.125%, 3/15/2028, 144A | | | 41,400 | |
| | 210,000 | | | FirstEnergy Corp., Series C, 3.400%, 3/01/2050 | | | 203,716 | |
| | 20,000 | | | IPALCO Enterprises, Inc., 4.250%, 5/01/2030, 144A | | | 22,629 | |
| | 35,000 | | | NRG Energy, Inc., 4.450%, 6/15/2029, 144A | | | 38,565 | |
| | 35,000 | | | NRG Energy, Inc., 5.250%, 6/15/2029, 144A | | | 38,062 | |
| | 140,000 | | | Pacific Gas & Electric Co., 3.500%, 8/01/2050 | | | 126,227 | |
| | 125,000 | | | Southern California Edison Co., 3.650%, 2/01/2050 | | | 129,167 | |
| | 90,000 | | | Vistra Operations Co. LLC, 3.700%, 1/30/2027, 144A | | | 94,650 | |
| | 115,000 | | | Vistra Operations Co. LLC, 4.300%, 7/15/2029, 144A | | | 125,525 | |
| | | | | | | | |
| | | | | | | 900,023 | |
| | | | | | | | |
| | | | Finance Companies — 4.0% | |
| | 150,000 | | | AerCap Ireland Capital DAC/AerCap Global Aviation Trust, 3.875%, 1/23/2028 | | | 138,259 | |
| | 205,000 | | | Air Lease Corp., MTN, 3.000%, 2/01/2030 | | | 190,905 | |
| | 125,000 | | | Aircastle Ltd., 4.125%, 5/01/2024 | | | 123,201 | |
| | 200,000 | | | GE Capital Funding LLC, 4.400%, 5/15/2030, 144A | | | 214,782 | |
| | 80,000 | | | Navient Corp., 5.000%, 3/15/2027 | | | 75,122 | |
| | 85,000 | | | OneMain Finance Corp., 5.375%, 11/15/2029 | | | 88,400 | |
| | 35,000 | | | OneMain Finance Corp., 7.125%, 3/15/2026 | | | 39,102 | |
| | 130,000 | | | Quicken Loans LLC/Quicken Loans Co-Issuer, Inc., 3.875%, 3/01/2031, 144A | | | 128,375 | |
| | | | | | | | |
| | | | | | | 998,146 | |
| | | | | | | | |
| | | | Financial Other — 0.5% | |
| | 115,000 | | | Icahn Enterprises LP/Icahn Enterprises Finance Corp., 5.250%, 5/15/2027 | | | 119,807 | |
| | | | | | | | |
| | | | Food & Beverage — 4.8% | |
| | 205,000 | | | Anheuser-Busch InBev Worldwide, Inc., 4.500%, 6/01/2050 | | | 245,704 | |
| | 240,000 | | | Coca-Cola Co. (The), 1.750%, 9/06/2024 | | | 250,822 | |
| | 150,000 | | | Fomento Economico Mexicano SAB de CV, 3.500%, 1/16/2050 | | | 159,564 | |
| | 145,000 | | | Kraft Heinz Foods Co., 4.375%, 6/01/2046 | | | 148,780 | |
| | 95,000 | | | Kraft Heinz Foods Co., 4.875%, 10/01/2049, 144A | | | 100,255 | |
| | 35,000 | | | Lamb Weston Holdings, Inc., 4.875%, 5/15/2028, 144A | | | 37,800 | |
| | | | |
| 27 | | | See accompanying notes to financial statements. | | |
Portfolio of Investments – as of September 30, 2020
Loomis Sayles Credit Income Fund – (continued)
| | | | | | | | |
Principal
Amount | | | Description | | Value (†) | |
| | | | Food & Beverage — continued | |
| $ | 50,000 | | | Pilgrim’s Pride Corp., 5.875%, 9/30/2027, 144A | | $ | 51,625 | |
| | 190,000 | | | Smithfield Foods, Inc., 3.000%, 10/15/2030, 144A | | | 190,410 | |
| | | | | | | | |
| | | | | | | 1,184,960 | |
| | | | | | | | |
| | | | Health Insurance — 0.0% | |
| | 5,000 | | | Centene Corp., 4.625%, 12/15/2029 | | | 5,393 | |
| | | | | | | | |
| | | | Healthcare — 4.0% | |
| | 75,000 | | | Cigna Corp., 4.375%, 10/15/2028 | | | 89,217 | |
| | 55,000 | | | CVS Health Corp., 3.250%, 8/15/2029 | | | 60,500 | |
| | 5,000 | | | Encompass Health Corp., 4.750%, 2/01/2030 | | | 5,073 | |
| | 165,000 | | | HCA, Inc., 4.125%, 6/15/2029 | | | 186,623 | |
| | 100,000 | | | HCA, Inc., 5.250%, 6/15/2049 | | | 122,414 | |
| | 270,000 | | | HCA, Inc., MTN, 7.750%, 7/15/2036 | | | 344,250 | |
| | 90,000 | | | Hologic, Inc., 3.250%, 2/15/2029, 144A | | | 90,563 | |
| | 25,000 | | | Tenet Healthcare Corp., 4.625%, 6/15/2028, 144A | | | 25,360 | |
| | 40,000 | | | Tenet Healthcare Corp., 5.125%, 5/01/2025 | | | 40,372 | |
| | 30,000 | | | Tenet Healthcare Corp., 6.125%, 10/01/2028, 144A | | | 29,175 | |
| | | | | | | | |
| | | | | | | 993,547 | |
| | | | | | | | |
| | | | Home Construction — 0.8% | |
| | 90,000 | | | Lennar Corp., 4.750%, 11/29/2027 | | | 102,758 | |
| | 70,000 | | | PulteGroup, Inc., 6.000%, 2/15/2035 | | | 86,450 | |
| | | | | | | | |
| | | | | | | 189,208 | |
| | | | | | | | |
| | | | Independent Energy — 1.9% | |
| | 150,000 | | | Aker BP ASA, 4.000%, 1/15/2031, 144A | | | 147,521 | |
| | 10,000 | | | Cimarex Energy Co., 4.375%, 6/01/2024 | | | 10,733 | |
| | 95,000 | | | Continental Resources, Inc., 3.800%, 6/01/2024 | | | 87,638 | |
| | 55,000 | | | Hess Corp., 4.300%, 4/01/2027 | | | 57,446 | |
| | 60,000 | | | Hess Corp., 5.600%, 2/15/2041 | | | 64,757 | |
| | 45,000 | | | Newfield Exploration Co., 5.375%, 1/01/2026 | | | 42,261 | |
| | 20,000 | | | Newfield Exploration Co., 5.625%, 7/01/2024 | | | 19,401 | |
| | 5,000 | | | Occidental Petroleum Corp., 2.700%, 8/15/2022 | | | 4,672 | |
| | 15,000 | | | Occidental Petroleum Corp., 2.900%, 8/15/2024 | | | 12,727 | |
| | 10,000 | | | Occidental Petroleum Corp., 3.500%, 6/15/2025 | | | 8,300 | |
| | 30,000 | | | Occidental Petroleum Corp., 5.550%, 3/15/2026 | | | 27,177 | |
| | | | | | | | |
| | | | | | | 482,633 | |
| | | | | | | | |
| | | | Industrial Other — 0.1% | |
| | 30,000 | | | CBRE Services, Inc., 4.875%, 3/01/2026 | | | 35,123 | |
| | | | | | | | |
| | | | Life Insurance — 0.6% | |
| | 115,000 | | | American International Group, Inc., 3.400%, 6/30/2030 | | | 127,347 | |
| | 30,000 | | | CNO Financial Group, Inc., 5.250%, 5/30/2029 | | | 34,694 | |
| | | | | | | | |
| | | | | | | 162,041 | |
| | | | | | | | |
| | | | Lodging — 0.6% | |
| | 5,000 | | | Hyatt Hotels Corp., 5.375%, 4/23/2025 | | | 5,383 | |
| | 15,000 | | | Hyatt Hotels Corp., 5.750%, 4/23/2030 | | | 17,224 | |
| | 20,000 | | | Marriott International, Inc., Series EE, 5.750%, 5/01/2025 | | | 22,320 | |
| | | | |
| | See accompanying notes to financial statements. | | | 28 |
Portfolio of Investments – as of September 30, 2020
Loomis Sayles Credit Income Fund – (continued)
| | | | | | | | |
Principal
Amount | | | Description | | Value (†) | |
| | | | Lodging — continued | |
| $ | 25,000 | | | Marriott International, Inc., 4.625%, 6/15/2030 | | $ | 26,774 | |
| | 70,000 | | | Wyndham Destinations, Inc., 4.625%, 3/01/2030, 144A | | | 67,550 | |
| | | | | | | | |
| | | | | | | 139,251 | |
| | | | | | | | |
| | | | Media Entertainment — 2.4% | |
| | 60,000 | | | Clear Channel Worldwide Holdings, Inc., 5.125%, 8/15/2027, 144A | | | 57,615 | |
| | 30,000 | | | Discovery Communications LLC, 3.950%, 3/20/2028 | | | 34,128 | |
| | 80,000 | | | Discovery Communications LLC, 5.000%, 9/20/2037 | | | 95,355 | |
| | 65,000 | | | iHeartCommunications, Inc., 5.250%, 8/15/2027, 144A | | | 63,375 | |
| | 35,000 | | | iHeartCommunications, Inc., 8.375%, 5/01/2027 | | | 34,475 | |
| | 25,000 | | | Lamar Media Corp., 3.750%, 2/15/2028, 144A | | | 24,875 | |
| | 30,000 | | | Lamar Media Corp., 4.000%, 2/15/2030, 144A | | | 30,000 | |
| | 5,000 | | | Lamar Media Corp., 5.750%, 2/01/2026 | | | 5,162 | |
| | 110,000 | | | Netflix, Inc., 4.875%, 6/15/2030, 144A | | | 125,400 | |
| | 115,000 | | | ViacomCBS, Inc., 4.375%, 3/15/2043 | | | 122,248 | |
| | | | | | | | |
| | | | | | | 592,633 | |
| | | | | | | | |
| | | | Metals & Mining — 3.8% | |
| | 45,000 | | | Allegheny Technologies, Inc., 5.875%, 12/01/2027 | | | 43,243 | |
| | 200,000 | | | Anglo American Capital PLC, 4.500%, 3/15/2028, 144A | | | 228,790 | |
| | 50,000 | | | ArcelorMittal S.A., 7.250%, 10/15/2039 | | | 63,107 | |
| | 200,000 | | | First Quantum Minerals Ltd., 6.875%, 10/15/2027, 144A | | | 192,750 | |
| | 60,000 | | | Freeport-McMoRan, Inc., 4.625%, 8/01/2030 | | | 63,087 | |
| | 135,000 | | | Glencore Funding LLC, 3.875%, 10/27/2027, 144A | | | 147,460 | |
| | 20,000 | | | Glencore Funding LLC, 4.000%, 3/27/2027, 144A | | | 21,840 | |
| | 45,000 | | | Glencore Funding LLC, 4.125%, 3/12/2024, 144A | | | 48,762 | |
| | 115,000 | | | Glencore Funding LLC, 4.625%, 4/29/2024, 144A | | | 126,690 | |
| | | | | | | | |
| | | | | | | 935,729 | |
| | | | | | | | |
| | | | Midstream — 2.8% | |
| | 115,000 | | | Cheniere Corpus Christi Holdings LLC, 5.125%, 6/30/2027 | | | 128,011 | |
| | 55,000 | | | Energy Transfer Operating LP, 5.000%, 5/15/2050 | | | 50,925 | |
| | 185,000 | | | EnLink Midstream Partners LP, 5.450%, 6/01/2047 | | | 116,550 | |
| | 65,000 | | | EQM Midstream Partners LP, Series 10Y, 5.500%, 7/15/2028 | | | 65,458 | |
| | 50,000 | | | Hess Midstream Operations LP, 5.625%, 2/15/2026, 144A | | | 50,937 | |
| | 20,000 | | | NGPL PipeCo LLC, 4.375%, 8/15/2022, 144A | | | 20,761 | |
| | 80,000 | | | NGPL PipeCo LLC, 4.875%, 8/15/2027, 144A | | | 86,812 | |
| | 120,000 | | | Sunoco Logistics Partners Operations LP, 4.000%, 10/01/2027 | | | 122,627 | |
| | 60,000 | | | Valero Energy Partners LP, 4.500%, 3/15/2028 | | | 67,205 | |
| | | | | | | | |
| | | | | | | 709,286 | |
| | | | | | | | |
| | | | Paper — 0.4% | |
| | 70,000 | | | Weyerhaeuser Co., 4.000%, 4/15/2030 | | | 82,765 | |
| | 20,000 | | | WRKCo, Inc., 3.000%, 6/15/2033 | | | 21,756 | |
| | | | | | | | |
| | | | | | | 104,521 | |
| | | | | | | | |
| | | | Pharmaceuticals — 5.5% | |
| | 50,000 | | | Bausch Health Cos., Inc., 6.250%, 2/15/2029, 144A | | | 51,428 | |
| | 230,000 | | | GlaxoSmithKline Capital PLC, 3.000%, 6/01/2024 | | | 248,729 | |
| | 245,000 | | | Merck & Co., Inc., 2.350%, 2/10/2022 | | | 252,282 | |
| | | | |
| 29 | | | See accompanying notes to financial statements. | | |
Portfolio of Investments – as of September 30, 2020
Loomis Sayles Credit Income Fund – (continued)
| | | | | | | | |
Principal
Amount | | | Description | | Value (†) | |
| | | | Pharmaceuticals — continued | |
| $ | 155,000 | | | Merck & Co., Inc., 2.450%, 6/24/2050 | | $ | 155,588 | |
| | 120,000 | | | Mylan NV, 5.250%, 6/15/2046 | | | 148,932 | |
| | 200,000 | | | Perrigo Finance UnLtd. Co., 3.150%, 6/15/2030 | | | 206,514 | |
| | 70,000 | | | Teva Pharmaceutical Finance Netherlands III BV, 3.150%, 10/01/2026 | | | 61,755 | |
| | 220,000 | | | Teva Pharmaceutical Finance Netherlands III BV, 4.100%, 10/01/2046 | | | 182,974 | |
| | 55,000 | | | Upjohn, Inc., 4.000%, 6/22/2050, 144A | | | 58,701 | |
| | | | | | | | |
| | | | | | | 1,366,903 | |
| | | | | | | | |
| | | | Property & Casualty Insurance — 0.7% | |
| | 175,000 | | | Fidelity National Financial, Inc., 2.450%, 3/15/2031 | | | 173,575 | |
| | | | | | | | |
| | | | REITs – Health Care — 0.5% | |
| | 110,000 | | | Welltower, Inc., 4.250%, 4/01/2026 | | | 126,009 | |
| | | | | | | | |
| | | | REITs – Hotels — 0.5% | |
| | 130,000 | | | Host Hotels & Resorts LP, Series E, 4.000%, 6/15/2025 | | | 134,962 | |
| | | | | | | | |
| | | | REITs – Mortgage — 1.0% | |
| | 115,000 | | | Ladder Capital Finance Holdings LLLP/Ladder Capital Finance Corp., 4.250%, 2/01/2027, 144A | | | 99,475 | |
| | 70,000 | | | Ladder Capital Finance Holdings LLLP/Ladder Capital Finance Corp., 5.250%, 3/15/2022, 144A | | | 68,621 | |
| | 80,000 | | | Ladder Capital Finance Holdings LLLP/Ladder Capital Finance Corp., 5.250%, 10/01/2025, 144A | | | 74,100 | |
| | | | | | �� | | |
| | | | | | | 242,196 | |
| | | | | | | | |
| | | | REITs – Shopping Centers — 0.8% | |
| | 115,000 | | | Brixmor Operating Partnership LP, 4.050%, 7/01/2030 | | | 123,003 | |
| | 75,000 | | | SITE Centers Corp., 3.625%, 2/01/2025 | | | 76,637 | |
| | | | | | | | |
| | | | | | | 199,640 | |
| | | | | | | | |
| | | | Restaurants — 0.8% | |
| | 65,000 | | | 1011778 B.C. ULC/New Red Finance, Inc., 4.375%, 1/15/2028, 144A | | | 66,287 | |
| | 55,000 | | | McDonald’s Corp., MTN, 3.625%, 9/01/2049 | | | 61,757 | |
| | 60,000 | | | Yum! Brands, Inc., 4.750%, 1/15/2030, 144A | | | 64,800 | |
| | | | | | | | |
| | | | | | | 192,844 | |
| | | | | | | | |
| | | | Retailers — 1.5% | |
| | 45,000 | | | AutoZone, Inc., 3.625%, 4/15/2025 | | | 50,179 | |
| | 70,000 | | | AutoZone, Inc., 4.000%, 4/15/2030 | | | 83,023 | |
| | 55,000 | | | Carvana Co., 5.625%, 10/01/2025, 144A | | | 54,261 | |
| | 96,911 | | | CVS Pass-Through Trust, Series 2014, 4.163%, 8/11/2036, 144A | | | 101,684 | |
| | 55,000 | | | Dollar General Corp., 3.500%, 4/03/2030 | | | 62,599 | |
| | 10,000 | | | Lithia Motors, Inc., 4.375%, 1/15/2031, 144A | | | 10,000 | |
| | | | | | | | |
| | | | | | | 361,746 | |
| | | | | | | | |
| | | | Technology — 9.6% | |
| | 260,000 | | | Alphabet, Inc., 1.900%, 8/15/2040 | | | 250,137 | |
| | 85,000 | | | Avnet, Inc., 4.625%, 4/15/2026 | | | 95,072 | |
| | 375,000 | | | Broadcom, Inc., 4.300%, 11/15/2032 | | | 428,397 | |
| | 35,000 | | | CDW LLC/CDW Finance Corp., 4.125%, 5/01/2025 | | | 36,138 | |
| | 130,000 | | | CommScope Technologies LLC, 5.000%, 3/15/2027, 144A | | | 124,800 | |
| | | | |
| | See accompanying notes to financial statements. | | | 30 |
Portfolio of Investments – as of September 30, 2020
Loomis Sayles Credit Income Fund – (continued)
| | | | | | | | |
Principal
Amount | | | Description | | Value (†) | |
| | | | Technology — continued | |
| $ | 60,000 | | | CommScope, Inc., 6.000%, 3/01/2026, 144A | | $ | 62,550 | |
| | 40,000 | | | Equifax, Inc., 3.100%, 5/15/2030 | | | 43,578 | |
| | 185,000 | | | Equinix, Inc., 2.150%, 7/15/2030 | | | 187,289 | |
| | 60,000 | | | Iron Mountain, Inc., 5.250%, 7/15/2030, 144A | | | 62,550 | |
| | 20,000 | | | Keysight Technologies, Inc., 3.000%, 10/30/2029 | | | 21,863 | |
| | 145,000 | | | Microchip Technology, Inc., 4.333%, 6/01/2023 | | | 156,051 | |
| | 265,000 | | | Micron Technology, Inc., 4.663%, 2/15/2030 | | | 311,218 | |
| | 240,000 | | | Microsoft Corp., 2.525%, 6/01/2050 | | | 250,997 | |
| | 215,000 | | | Oracle Corp., 3.600%, 4/01/2050 | | | 242,341 | |
| | 40,000 | | | Qorvo, Inc., 3.375%, 4/01/2031, 144A | | | 40,650 | |
| | 10,000 | | | Sabre GLBL, Inc., 9.250%, 4/15/2025, 144A | | | 11,006 | |
| | 35,000 | | | SS&C Technologies, Inc., 5.500%, 9/30/2027, 144A | | | 37,195 | |
| | 35,000 | | | Verisk Analytics, Inc., 4.125%, 3/15/2029 | | | 41,275 | |
| | | | | | | | |
| | | | | | | 2,403,107 | |
| | | | | | | | |
| | | | Transportation Services — 0.7% | |
| | 5,000 | | | FedEx Corp., 4.050%, 2/15/2048 | | | 5,742 | |
| | 15,000 | | | FedEx Corp., 4.100%, 2/01/2045 | | | 17,166 | |
| | 20,000 | | | FedEx Corp., 5.250%, 5/15/2050 | | | 27,021 | |
| | 115,000 | | | United Parcel Service, Inc., 2.500%, 4/01/2023 | | | 120,812 | |
| | | | | | | | |
| | | | 170,741 | |
| | | | | | | | |
| | | | Treasuries — 3.5% | |
| | 135,000 | | | U.S. Treasury Bond, 1.125%, 8/15/2040 | | | 132,743 | |
| | 95,000 | | | U.S. Treasury Bond, 2.000%, 2/15/2050 | | | 107,780 | |
| | 620,000 | | | U.S. Treasury Note, 0.125%, 9/30/2022 | | | 619,976 | |
| | | | | | | | |
| | | | 860,499 | |
| | | | | | | | |
| | | | Wireless — 2.6% | |
| | 55,000 | | | American Tower Corp., 2.100%, 6/15/2030 | | | 55,356 | |
| | 230,000 | | | Crown Castle International Corp., 3.300%, 7/01/2030 | | | 251,522 | |
| | 30,000 | | | Sprint Capital Corp., 6.875%, 11/15/2028 | | | 37,500 | |
| | 265,000 | | | T-Mobile USA, Inc., 3.875%, 4/15/2030, 144A | | | 300,674 | |
| | | | | | | | |
| | | | 645,052 | |
| | | | | | | | |
| | | | Wirelines — 3.0% | |
| | 550,000 | | | AT&T, Inc., 3.650%, 6/01/2051 | | | 554,758 | |
| | 150,000 | | | Telefonica Emisiones S.A., 5.520%, 3/01/2049 | | | 186,942 | |
| | | | | | | | |
| | | | 741,700 | |
| | | | | | | | |
| | | | Total Non-Convertible Bonds
(Identified Cost $22,943,104) | | | 22,863,443 | |
| | | | | | | | |
| | | | | | | | |
| | Convertible Bonds — 2.1% | |
| | | | Cable Satellite — 1.0% | |
| | 270,000 | | | DISH Network Corp., 3.375%, 8/15/2026 | | | 247,859 | |
| | | | | | | | |
| | | | Electric — 0.0% | |
| | 10,000 | | | NRG Energy, Inc., 2.750%, 6/01/2048 | | | 10,357 | |
| | | | | | | | |
| | | | |
| 31 | | | See accompanying notes to financial statements. | | |
Portfolio of Investments – as of September 30, 2020
Loomis Sayles Credit Income Fund – (continued)
| | | | | | | | |
Principal
Amount | | | Description | | Value (†) | |
| | | | Industrial Other — 0.1% | |
| $ | 15,000 | | | Chegg, Inc., Zero Coupon, 9/01/2026, 144A | | $ | 14,948 | |
| | | | | | | | |
| | | | Pharmaceuticals — 0.9% | |
| | 230,000 | | | BioMarin Pharmaceutical, Inc., 1.250%, 5/15/2027, 144A | | | 224,938 | |
| | | | | | | | |
| | | | Technology — 0.1% | |
| | 35,000 | | | Palo Alto Networks, Inc., 0.375%, 6/01/2025, 144A | | | 37,057 | |
| | | | | | | | |
| | | | Total Convertible Bonds
(Identified Cost $537,270) | | | 535,159 | |
| | | | | | | | |
| | | | | | | | |
| | | | Total Bonds and Notes
(Identified Cost $23,480,374) | | | 23,398,602 | |
| | | | | | | | |
| | | | | | | | |
| Shares | | | | | | |
| | Preferred Stocks — 1.3% | |
| | | | Banking — 0.5% | |
| | 40 | | | Bank of America Corp., Series L, 7.250% | | | 59,520 | |
| | 50 | | | Wells Fargo & Co., Class A, Series L, 7.500% | | | 67,102 | |
| | | | | | | | |
| | | | 126,622 | |
| | | | | | | | |
| | | | Food & Beverage — 0.8% | |
| | 1,950 | | | Bunge Ltd., 4.875% | | | 186,764 | |
| | | | | | | | |
| | | | Total Preferred Stocks
(Identified Cost $316,708) | | | 313,386 | |
| | | | | | | | |
| | | | | | | | |
| | | | Total Investments — 95.2%
(Identified Cost $23,797,082) | | | 23,711,988 | |
| | | | Other assets less liabilities — 4.8% | | | 1,206,292 | |
| | | | | | | | |
| | | | Net Assets — 100.0% | | $ | 24,918,280 | |
| | | | | | | | |
| | | | | | | | |
| | (†) | | | See Note 2 of Notes to Financial Statements. | |
| | | | | | | | |
| | 144A | | | All or a portion of these securities are exempt from registration under Rule 144A of the Securities Act of 1933. These securities may be resold in transactions exempt from registration, normally to qualified institutional buyers. At September 30, 2020, the value of Rule 144A holdings amounted to $6,682,708 or 26.8% of net assets. | |
| | | | | | | | |
| | MTN | | | Medium Term Note | |
| | REITs | | | Real Estate Investment Trusts | | | | |
| | | | |
| | See accompanying notes to financial statements. | | | 32 |
Portfolio of Investments – as of September 30, 2020
Loomis Sayles Credit Income Fund – (continued)
Industry Summary at September 30, 2020
| | | | |
Banking | | | 12.8 | % |
Technology | | | 9.7 | |
Pharmaceuticals | | | 6.4 | |
Food & Beverage | | | 5.6 | |
Cable Satellite | | | 5.5 | |
Consumer Cyclical Services | | | 4.4 | |
Finance Companies | | | 4.0 | |
Healthcare | | | 4.0 | |
Metals & Mining | | | 3.8 | |
Electric | | | 3.6 | |
Treasuries | | | 3.5 | |
Wirelines | | | 3.0 | |
Aerospace & Defense | | | 2.9 | |
Midstream | | | 2.8 | |
Wireless | | | 2.6 | |
Media Entertainment | | | 2.4 | |
Automotive | | | 2.3 | |
Other Investments, less than 2% each | | | 15.9 | |
| | | | |
Total Investments | | | 95.2 | |
Other assets less liabilities | | | 4.8 | |
| | | | |
Net Assets | | | 100.0 | % |
| | | | |
| | | | |
| 33 | | | See accompanying notes to financial statements. | | |
Portfolio of Investments – as of September 30, 2020
Loomis Sayles Intermediate Duration Bond Fund
| | | | | | | | |
Principal
Amount | | | Description | | Value (†) | |
| | Bonds and Notes — 98.3% of Net Assets | | | | |
| | | | ABS Car Loan — 10.5% | |
| $ | 90,000 | | | American Credit Acceptance Receivables Trust, Series 2020-2, Class B, 2.480%, 9/13/2024, 144A | | $ | 92,565 | |
| | 845,000 | | | American Credit Acceptance Receivables Trust, Series 2019-4, Class C, 2.690%, 12/12/2025, 144A | | | 864,180 | |
| | 135,000 | | | American Credit Acceptance Receivables Trust, Series 2020-3, Class B, 1.150%, 8/13/2024, 144A | | | 135,420 | |
| | 53,520 | | | AmeriCredit Automobile Receivables Trust, Series 2016-3, Class C, 2.240%, 4/08/2022 | | | 53,642 | |
| | 510,000 | | | AmeriCredit Automobile Receivables Trust, Series 2018-3, Class B, 3.580%, 10/18/2024 | | | 531,070 | |
| | 480,000 | | | AmeriCredit Automobile Receivables Trust, Series 2019-2, Class B, 2.540%, 7/18/2024 | | | 494,393 | |
| | 695,000 | | | AmeriCredit Automobile Receivables Trust, Series 2019-3, Class A3, 2.060%, 4/18/2024 | | | 709,461 | |
| | 385,000 | | | AmeriCredit Automobile Receivables Trust, Series 2020-1, Class A3, 1.110%, 8/19/2024 | | | 389,006 | |
| | 110,000 | | | AmeriCredit Automobile Receivables Trust, Series 2020-2, Class A3, 0.660%, 12/18/2024 | | | 110,365 | |
| | 265,000 | | | AmeriCredit Automobile Receivables Trust, Series 2020-2, Class B, 0.970%, 2/18/2026 | | | 266,726 | |
| | 360,000 | | | Avis Budget Rental Car Funding AESOP LLC, Series 2016-1A, Class A, 2.990%, 6/20/2022, 144A(a) | | | 362,899 | |
| | 100,000 | | | Avis Budget Rental Car Funding AESOP LLC, Series 2019-1A, Class A, 3.450%, 3/20/2023, 144A | | | 102,331 | |
| | 140,000 | | | Avis Budget Rental Car Funding AESOP LLC, Series 2019-2A, Class A, 3.350%, 9/22/2025, 144A | | | 147,850 | |
| | 97,499 | | | Bank of The West Auto Trust, Series 2017-1, Class A3, 2.110%, 1/15/2023, 144A | | | 98,075 | |
| | 450,000 | | | Bank of The West Auto Trust, Series 2019-1, Class A3, 2.430%, 4/15/2024, 144A | | | 460,393 | |
| | 110,015 | | | California Republic Auto Receivables Trust, Series 2017-1, Class A4, 2.280%, 6/15/2022(a) | | | 110,316 | |
| | 565,000 | | | Capital One Prime Auto Receivables Trust, Series 2019-2, Class A3, 1.920%, 5/15/2024 | | | 577,311 | |
| | 425,861 | | | CarMax Auto Owner Trust, Series 2019-4, Class A2A, 2.010%, 3/15/2023 | | | 429,196 | |
| | 102,862 | | | CarMax Auto Owner Trust, Series 2017-2, Class A3, 1.930%, 3/15/2022(a) | | | 103,102 | |
| | 510,000 | | | CarMax Auto Owner Trust, Series 2020-2, Class A3, 1.700%, 11/15/2024 | | | 522,397 | |
| | 485,000 | | | CarMax Auto Owner Trust, Series 2020-3, Class A3, 0.620%, 3/17/2025 | | | 486,854 | |
| | 660,000 | | | Carvana Auto Receivables Trust, Series 2019-3A, Class A3, 2.340%, 6/15/2023, 144A | | | 666,315 | |
| | 330,266 | | | CPS Auto Receivables Trust, Series 2018-D, Class B, 3.610%, 11/15/2022, 144A | | | 331,713 | |
| | 145,000 | | | CPS Auto Receivables Trust, Series 2020-A, Class B, 2.360%, 2/15/2024, 144A | | | 147,861 | |
| | 595,000 | | | Credit Acceptance Auto Loan Trust, Series 2019-3A, Class A, 2.380%, 11/15/2028, 144A | | | 611,928 | |
| | 435,000 | | | Credit Acceptance Auto Loan Trust, Series 2020-1A, Class A, 2.010%, 2/15/2029, 144A | | | 445,296 | |
| | 585,000 | | | Credit Acceptance Auto Loan Trust, Series 2020-1A, Class B, 2.390%, 4/16/2029, 144A | | | 594,124 | |
| | | | |
| | See accompanying notes to financial statements. | | | 34 |
Portfolio of Investments – as of September 30, 2020
Loomis Sayles Intermediate Duration Bond Fund – (continued)
| | | | | | | | |
Principal
Amount | | | Description | | Value (†) | |
| | | | ABS Car Loan — continued | |
| $ | 315,000 | | | Credit Acceptance Auto Loan Trust, Series 2020-2A, Class A, 1.370%, 7/16/2029, 144A | | $ | 318,830 | |
| | 478,822 | | | Drive Auto Receivables Trust, Series 2018-5, Class B, 3.680%, 7/15/2023 | | | 481,524 | |
| | 215,000 | | | Drive Auto Receivables Trust, Series 2019-3, Class B, 2.650%, 2/15/2024 | | | 218,898 | |
| | 28,985 | | | DT Auto Owner Trust, Series 2018-2A, Class C, 3.670%, 3/15/2024, 144A | | | 29,178 | |
| | 285,000 | | | DT Auto Owner Trust, Series 2019-1A, Class C, 3.610%, 11/15/2024, 144A | | | 292,330 | |
| | 270,000 | | | DT Auto Owner Trust, Series 2019-2A, Class C, 3.180%, 2/18/2025, 144A | | | 276,223 | |
| | 105,000 | | | DT Auto Owner Trust, Series 2019-4A, Class B, 2.360%, 1/16/2024, 144A | | | 106,431 | |
| | 157,917 | | | DT Auto Owner Trust, Series 2020-2A, Class A, 1.140%, 1/16/2024, 144A | | | 158,942 | |
| | 320,000 | | | DT Auto Owner Trust, Series 2020-2A, Class C, 3.280%, 3/16/2026, 144A | | | 334,430 | |
| | 143,606 | | | Exeter Automobile Receivables Trust, Series 2019-2A, Class B, 3.060%, 5/15/2023, 144A | | | 144,791 | |
| | 170,000 | | | Exeter Automobile Receivables Trust, Series 2020-1A, Class B, 2.260%, 4/15/2024, 144A | | | 173,001 | |
| | 172,857 | | | Exeter Automobile Receivables Trust, Series 2020-2A, Class A, 1.130%, 8/15/2023, 144A | | | 173,484 | |
| | 440,000 | | | Exeter Automobile Receivables Trust, Series 2020-2A, Class C, 3.280%, 5/15/2025, 144A | | | 462,016 | |
| | 3,869 | | | First Investors Auto Owner Trust, Series 2018-2A, Class A1, 3.230%, 12/15/2022, 144A | | | 3,874 | |
| | 283,864 | | | First Investors Auto Owner Trust, Series 2019-2A, Class A, 2.210%, 9/16/2024, 144A | | | 287,680 | |
| | 800,000 | | | Flagship Credit Auto Trust, Series 2018-4, Class B, 3.880%, 10/16/2023, 144A | | | 823,915 | |
| | 647,999 | | | Flagship Credit Auto Trust, Series 2020-1, Class A, 1.900%, 8/15/2024, 144A(a) | | | 657,246 | |
| | 915,000 | | | Flagship Credit Auto Trust, Series 2020-1, Class B, 2.050%, 2/17/2025, 144A | | | 934,936 | |
| | 175,000 | | | Ford Credit Auto Owner Trust, Series 2020-A, Class A3, 1.040%, 8/15/2024 | | | 177,170 | |
| | 705,000 | | | Ford Credit Auto Owner Trust, Series 2016-2, Class A, 2.030%, 12/15/2027, 144A(a) | | | 713,150 | |
| | 595,000 | | | Ford Credit Auto Owner Trust, Series 2018-1, Class A, 3.190%, 7/15/2031, 144A(a) | | | 655,522 | |
| | 785,000 | | | Ford Credit Auto Owner Trust, Series 2020-B, Class A3, 0.560%, 10/15/2024 | | | 788,780 | |
| | 635,000 | | | Ford Credit Floorplan Master Owner Trust, Series 2019-1, Class A, 2.840%, 3/15/2024 | | | 656,531 | |
| | 220,764 | | | GLS Auto Receivables Issuer Trust, Series 2019-2A, Class A, 3.060%, 4/17/2023, 144A | | | 222,866 | |
| | 260,000 | | | GLS Auto Receivables Issuer Trust, Series 2019-4A, Class B, 2.780%, 9/16/2024, 144A | | | 267,176 | |
| | 209,256 | | | GLS Auto Receivables Issuer Trust, Series 2020-2A, Class A, 1.580%, 8/15/2024, 144A | | | 211,337 | |
| | 265,000 | | | GLS Auto Receivables Trust, Series 2018-3A, Class B, 3.780%, 8/15/2023, 144A | | | 269,708 | |
| | 300,000 | | | GLS Auto Receivables Trust, Series 2020-3A, Class B, 1.380%, 8/15/2024, 144A | | | 303,426 | |
| | 140,000 | | | GM Financial Automobile Leasing Trust, Series 2020-2, Class A3, 0.800%, 7/20/2023 | | | 140,838 | |
| | 145,000 | | | GM Financial Consumer Automobile Receivables Trust, Series 2020-2, Class A3, 1.490%, 12/16/2024 | | | 147,891 | |
| | 109,441 | | | GM Financial Consumer Automobile Receivables Trust, Series 2017-3A, Class A3, 1.970%, 5/16/2022, 144A(a) | | | 109,803 | |
| | 450,000 | | | GM Financial Consumer Automobile Receivables Trust, Series 2019-3, Class A3, 2.180%, 4/16/2024 | | | 459,923 | |
| | | | |
| 35 | | | See accompanying notes to financial statements. | | |
Portfolio of Investments – as of September 30, 2020
Loomis Sayles Intermediate Duration Bond Fund – (continued)
| | | | | | | | |
Principal
Amount | | | Description | | Value (†) | |
| | | | ABS Car Loan — continued | |
| $ | 180,000 | | | GMF Floorplan Owner Revolving Trust, Series 2020-1, Class A, 0.680%, 8/15/2025, 144A | | $ | 180,329 | |
| | 485,000 | | | Honda Auto Receivables Owner Trust, Series 2020-2, Class A2, 0.740%, 11/15/2022 | | | 486,332 | |
| | 455,000 | | | Honda Auto Receivables Owner Trust, Series 2020-2, Class A3, 0.820%, 7/15/2024 | | | 459,224 | |
| | 420,000 | | | Hyundai Auto Receivables Trust, Series 2019-B, Class A3, 1.940%, 2/15/2024 | | | 429,172 | |
| | 170,000 | | | Hyundai Auto Receivables Trust, Series 2020-A, Class A3, 1.410%, 11/15/2024 | | | 173,712 | |
| | 290,000 | | | Mercedes-Benz Auto Receivables Trust, Series 2020-1, Class A3, 0.550%, 2/18/2025 | | | 291,214 | |
| | 150,000 | | | NextGear Floorplan Master Owner Trust, Series 2017-2A, Class A2, 2.560%, 10/17/2022, 144A | | | 150,084 | |
| | 125,000 | | | NextGear Floorplan Master Owner Trust, Series 2018-1A, Class A2, 3.220%, 2/15/2023, 144A | | | 126,140 | |
| | 310,000 | | | NextGear Floorplan Master Owner Trust, Series 2018-2A, Class A2, 3.690%, 10/15/2023, 144A | | | 320,026 | |
| | 865,000 | | | NextGear Floorplan Master Owner Trust, Series 2020-1A, Class A2, 1.550%, 2/15/2025, 144A(a) | | | 866,531 | |
| | 1,045,000 | | | Prestige Auto Receivables Trust, Series 2019-1A, Class A3, 2.450%, 5/15/2023, 144A(a) | | | 1,057,744 | |
| | 210,000 | | | Santander Consumer Auto Receivables Trust, Series 2020-AA, Class C, 3.710%, 2/17/2026, 144A | | | 225,156 | |
| | 300,000 | | | Santander Consumer Auto Receivables Trust, Series 2020-BA, Class A3, 0.460%, 8/15/2024, 144A | | | 300,317 | |
| | 370,000 | | | Santander Drive Auto Receivables Trust, Series 2019-2, Class C, 2.900%, 10/15/2024 | | | 380,393 | |
| | 140,000 | | | Santander Drive Auto Receivables Trust, Series 2020-1, Class A3, 2.030%, 2/15/2024 | | | 143,360 | |
| | 460,000 | | | Santander Drive Auto Receivables Trust, Series 2018-5, Class C, 3.810%, 12/16/2024 | | | 467,130 | |
| | 655,000 | | | Santander Drive Auto Receivables Trust, Series 2019-3, Class A3, 2.160%, 11/15/2022 | | | 657,651 | |
| | 175,000 | | | Santander Drive Auto Receivables Trust, Series 2020-2, Class A3, 0.670%, 4/15/2024 | | | 175,608 | |
| | 520,000 | | | Santander Drive Auto Receivables Trust, Series 2020-2, Class B, 0.960%, 11/15/2024 | | | 522,286 | |
| | 615,000 | | | Santander Drive Auto Receivables Trust, Series 2020-3, Class C, 1.120%, 1/15/2026 | | | 614,812 | |
| | 440,000 | | | Toyota Auto Loan Extended Note Trust, Series 2020-1A, Class A, 1.350%, 5/25/2033, 144A | | | 451,867 | |
| | 200,000 | | | Toyota Auto Receivables Owner Trust, Series 2020-B, Class A3, 1.360%, 8/15/2024 | | | 203,758 | |
| | 225,000 | | | Westlake Automobile Receivables Trust, Series 2019-3A, Class B, 2.410%, 10/15/2024, 144A | | | 228,580 | |
| | 515,000 | | | Westlake Automobile Receivables Trust, Series 2019-1A, Class B, 3.260%, 10/17/2022, 144A | | | 520,615 | |
| | 830,000 | | | Westlake Automobile Receivables Trust, Series 2019-2A, Class B, 2.620%, 7/15/2024, 144A | | | 842,732 | |
| | | | |
| | See accompanying notes to financial statements. | | | 36 |
Portfolio of Investments – as of September 30, 2020
Loomis Sayles Intermediate Duration Bond Fund – (continued)
| | | | | | | | |
Principal
Amount | | | Description | | Value (†) | |
| | | | ABS Car Loan — continued | |
| $ | 835,000 | | | Westlake Automobile Receivables Trust, Series 2020-2A, Class A2A, 0.930%, 2/15/2024, 144A | | $ | 838,272 | |
| | 400,000 | | | Westlake Automobile Receivables Trust, Series 2020-2A, Class C, 2.010%, 7/15/2025, 144A | | | 406,012 | |
| | 47,078 | | | World Omni Auto Receivables Trust, Series 2017-B, Class A3, 1.950%, 2/15/2023 | | | 47,455 | |
| | 635,000 | | | World Omni Auto Receivables Trust, Series 2020-B, Class A3, 0.630%, 5/15/2025 | | | 635,377 | |
| | 310,000 | | | World Omni Select Auto Trust, Series 2020-A, Class A3, 0.550%, 7/15/2025 | | | 310,669 | |
| | | | | | | | |
| | | | | | | 33,359,197 | |
| | | | | | | | |
| | | | ABS Credit Card — 0.8% | |
| | 620,000 | | | American Express Credit Account Master Trust, Series 2019-1, Class A, 2.870%, 10/15/2024 | | | 643,869 | |
| | 925,000 | | | Barclays Dryrock Issuance Trust, Series 2019-1, Class A, 1.960%, 5/15/2025(a) | | | 950,827 | |
| | 260,000 | | | Citibank Credit Card Issuance Trust, Series 2014-A1, Class A1, 2.880%, 1/23/2023 | | | 262,111 | |
| | 585,000 | | | World Financial Network Credit Card Master Trust, Series 2019-C, Class A, 2.210%, 7/15/2026 | | | 601,316 | |
| | | | | | | | |
| | | | | | | 2,458,123 | |
| | | | | | | | |
| | | | ABS Home Equity — 0.1% | |
| | 176,631 | | | Bayview Opportunity Master Fund IVa Trust, Series 2016-SPL1, Class A, 4.000%, 4/28/2055, 144A | | | 181,406 | |
| | 115,523 | | | CoreVest American Finance Trust, Series 2017-1, Class A, 2.968%, 10/15/2049, 144A | | | 117,789 | |
| | 3,684 | | | Countrywide Asset-Backed Certificates, Series 2004-S1, Class A3, 5.115%, 2/25/2035(b)(c)(d) | | | 3,643 | |
| | 56,039 | | | Mill City Mortgage Loan Trust, Series 2016-1, Class A1,
2.500%, 4/25/2057, 144A(d) | | | 56,803 | |
| | 35,993 | | | Towd Point Mortgage Trust, Series 2015-2, Class 1A12, 2.750%, 11/25/2060, 144A(d) | | | 36,367 | |
| | | | | | | | |
| | | | | | | 396,008 | |
| | | | | | | | |
| | | | ABS Other — 1.9% | |
| | 337,105 | | | Chesapeake Funding II LLC, Series 2020-1A, Class A1, 0.870%, 8/16/2032, 144A | | | 338,396 | |
| | 610,000 | | | CNH Equipment Trust, Series 2020-A, Class A2, 1.080%, 7/17/2023 | | | 613,199 | |
| | 250,000 | | | CNH Equipment Trust, Series 2020-A, Class A3, 1.160%, 6/16/2025 | | | 253,656 | |
| | 135,054 | | | Diamond Resorts Owner Trust, Series 2018-1, Class A, 3.700%, 1/21/2031, 144A | | | 140,135 | |
| | 7,720 | | | John Deere Owner Trust, Series 2017-B, Class A3, 1.820%, 10/15/2021 | | | 7,724 | |
| | 255,000 | | | Kubota Credit Owner Trust, Series 2020-1A, Class A3, 1.960%, 3/15/2024, 144A | | | 264,440 | |
| | 174,909 | | | Merlin Aviation Holdings DAC, Series 2016-1, Class A,
4.500%, 12/15/2032, 144A(d) | | | 155,627 | |
| | 169,387 | | | MVW LLC, Series 2020-1A, Class A, 1.740%, 10/20/2037, 144A | | | 171,259 | |
| | 555,000 | | | OneMain Financial Issuance Trust, Series 2018-1A, Class A, 3.300%, 3/14/2029, 144A(a) | | | 569,799 | |
| | 269,123 | | | S-Jets Ltd., Series 2017-1, Class A, 3.967%, 8/15/2042, 144A | | | 243,732 | |
| | 145,602 | | | SCF Equipment Leasing LLC, Series 2018-1A, Class A2, 3.630%, 10/20/2024, 144A(a) | | | 146,690 | |
| | 42,483 | | | Sierra Timeshare Conduit Receivables Funding LLC, Series 2017-1A, Class A, 2.910%, 3/20/2034, 144A | | | 43,207 | |
| | | | |
| 37 | | | See accompanying notes to financial statements. | | |
Portfolio of Investments – as of September 30, 2020
Loomis Sayles Intermediate Duration Bond Fund – (continued)
| | | | | | | | |
Principal
Amount | | | Description | | Value (†) | |
| | | | ABS Other — continued | |
| $ | 270,969 | | | Sierra Timeshare Receivables Funding LLC, Series 2020-2A, Class A, 1.330%, 7/20/2037, 144A | | $ | 271,162 | |
| | 220,301 | | | SoFi Consumer Loan Program Trust, Series 2018-2, Class A2,
3.350%, 4/26/2027, 144A | | | 221,449 | |
| | 209,288 | | | SoFi Consumer Loan Program Trust, Series 2018-4, Class A,
3.540%, 11/26/2027, 144A | | | 210,751 | |
| | 2,180,000 | | | Verizon Owner Trust, Series 2019-B, Class A1A, 2.330%, 12/20/2023(a) | | | 2,232,208 | |
| | 244,888 | | | Wheels SPV 2 LLC, Series 2019-1A, Class A2, 2.300%, 5/22/2028, 144A | | | 247,612 | |
| | | | | | | | |
| | | | | | | 6,131,046 | |
| | | | | | | | |
| | | | ABS Student Loan — 0.5% | |
| | 47,375 | | | Earnest Student Loan Program LLC, Series 2017-A, Class A2,
2.650%, 1/25/2041, 144A | | | 48,036 | |
| | 234,747 | | | Massachusetts Educational Financing Authority, Series 2018-A, Class A, 3.850%, 5/25/2033 | | | 252,604 | |
| | 879,509 | | | Navient Private Education Refi Loan Trust, Series 2020-BA, Class A1, 1.800%, 1/15/2069, 144A(a) | | | 883,463 | |
| | 180,000 | | | Navient Private Education Refi Loan Trust, Series 2020-GA, Class A, 1.170%, 9/16/2069, 144A | | | 180,374 | |
| | 60,413 | | | North Carolina State Education Assistance Authority, Series 2011-2, Class A2, 3-month LIBOR + 0.800%, 1.045%, 7/25/2025(e) | | | 60,449 | |
| | 92,348 | | | SoFi Professional Loan Program LLC, Series 2016-B, Class A2B, 2.740%, 10/25/2032, 144A | | | 94,139 | |
| | 159,445 | | | SoFi Professional Loan Program LLC, Series 2017-E, Class A2B, 2.720%, 11/26/2040, 144A | | | 162,080 | |
| | | | | | | | |
| | | | | | | 1,681,145 | |
| | | | | | | | |
| | | | ABS Whole Business — 0.2% | |
| | 524,300 | | | Planet Fitness Master Issuer LLC, Series 2018-1A, Class A2II,
4.666%, 9/05/2048, 144A | | | 524,557 | |
| | | | | | | | |
| | | | Aerospace & Defense — 0.2% | |
| | 80,000 | | | Huntington Ingalls Industries, Inc., 4.200%, 5/01/2030, 144A | | | 91,823 | |
| | 29,000 | | | Raytheon Technologies Corp., 3.650%, 8/16/2023 | | | 31,336 | |
| | 450,000 | | | Rolls-Royce PLC, 2.375%, 10/14/2020, 144A | | | 448,794 | |
| | | | | | | | |
| | | | | | | 571,953 | |
| | | | | | | | |
| | | | Agency Commercial Mortgage-Backed Securities — 1.0% | |
| | 1,175,000 | | | FHLMC Multifamily Structured Pass Through Certificates, Series KJ26, Class A2, 2.606%, 7/25/2027(a) | | | 1,274,549 | |
| | 573,105 | | | FHLMC Multifamily Structured Pass Through Certificates, Series K013, Class A2, 3.974%, 1/25/2021(a)(d) | | | 576,769 | |
| | 509,476 | | | FHLMC Multifamily Structured Pass Through Certificates, Series K029, Class A2, 3.320%, 2/25/2023(a) | | | 540,245 | |
| | 701,647 | | | FHLMC Multifamily Structured Pass Through Certificates, Series K042, Class A2, 2.670%, 12/25/2024(a) | | | 757,638 | |
| | 90,606 | | | FHLMC Multifamily Structured Pass Through Certificates, Series KJ28, Class A1, 1.766%, 2/25/2025 | | | 92,247 | |
| | | | | | | | |
| | | | | | | 3,241,448 | |
| | | | | | | | |
| | | | |
| | See accompanying notes to financial statements. | | | 38 |
Portfolio of Investments – as of September 30, 2020
Loomis Sayles Intermediate Duration Bond Fund – (continued)
| | | | | | | | |
Principal
Amount | | | Description | | Value (†) | |
| | | | Airlines — 0.3% | |
| $ | 430,000 | | | Delta Air Lines, Inc., 2.900%, 10/28/2024 | | $ | 383,451 | |
| | 560,000 | | | Southwest Airlines Co., 5.125%, 6/15/2027 | | | 612,145 | |
| | | | | | | | |
| | | | | | | 995,596 | |
| | | | | | | | |
| | | | Automotive — 3.1% | |
| | 1,440,000 | | | American Honda Finance Corp., MTN, 0.875%, 7/07/2023 | | | 1,451,847 | |
| | 245,000 | | | American Honda Finance Corp., MTN, 3.625%, 10/10/2023 | | | 266,831 | |
| | 290,000 | | | BMW U.S. Capital LLC, 1.850%, 9/15/2021, 144A | | | 293,536 | |
| | 160,000 | | | Daimler Finance North America LLC, 3.350%, 2/22/2023, 144A | | | 169,387 | |
| | 670,000 | | | Ford Motor Credit Co. LLC, 2.979%, 8/03/2022 | | | 659,950 | |
| | 200,000 | | | Ford Motor Credit Co. LLC, 3.810%, 1/09/2024 | | | 198,000 | |
| | 360,000 | | | General Motors Financial Co., Inc., 4.150%, 6/19/2023 | | | 382,147 | |
| | 295,000 | | | Harley-Davidson Financial Services, Inc., 3.350%, 6/08/2025, 144A | | | 308,598 | |
| | 220,000 | | | Harley-Davidson Financial Services, Inc., 4.050%, 2/04/2022, 144A | | | 227,361 | |
| | 195,000 | | | Hyundai Capital America, 2.375%, 2/10/2023, 144A | | | 200,195 | |
| | 95,000 | | | Hyundai Capital America, 3.000%, 6/20/2022, 144A | | | 97,946 | |
| | 400,000 | | | Hyundai Capital America, 3.000%, 2/10/2027, 144A | | | 413,309 | |
| | 585,000 | | | Nissan Motor Acceptance Corp., 3.450%, 3/15/2023, 144A | | | 600,132 | |
| | 940,000 | | | Nissan Motor Co. Ltd., 4.345%, 9/17/2027, 144A | | | 941,641 | |
| | 240,000 | | | PACCAR Financial Corp., MTN, 0.800%, 6/08/2023 | | | 241,697 | |
| | 160,000 | | | PACCAR Financial Corp., MTN, 1.800%, 2/06/2025 | | | 167,363 | |
| | 955,000 | | | PACCAR Financial Corp., MTN, 1.900%, 2/07/2023 | | | 986,943 | |
| | 335,000 | | | Toyota Motor Credit Corp., 1.150%, 8/13/2027 | | | 334,413 | |
| | 250,000 | | | Toyota Motor Credit Corp., MTN, 1.150%, 5/26/2022 | | | 253,164 | |
| | 295,000 | | | Toyota Motor Credit Corp., MTN, 1.800%, 10/07/2021 | | | 299,208 | |
| | 285,000 | | | Toyota Motor Credit Corp., MTN, 1.800%, 2/13/2025 | | | 297,760 | |
| | 275,000 | | | Volkswagen Group of America Finance LLC, 3.350%, 5/13/2025, 144A | | | 300,285 | |
| | 615,000 | | | Volkswagen Group of America Finance LLC, 4.250%, 11/13/2023, 144A | | | 675,753 | |
| | | | | | | | |
| | | | | | | 9,767,466 | |
| | | | | | | | |
| | | | Banking — 18.3% | |
| | 100,000 | | | Ally Financial, Inc., 1.450%, 10/02/2023 | | | 99,889 | |
| | 1,335,000 | | | Ally Financial, Inc., 3.050%, 6/05/2023 | | | 1,387,228 | |
| | 495,000 | | | American Express Co., 3.700%, 8/03/2023 | | | 537,356 | |
| | 625,000 | | | ANZ New Zealand International Ltd., 1.900%, 2/13/2023, 144A | | | 643,670 | |
| | 1,190,000 | | | Australia & New Zealand Banking Group Ltd., MTN, 2.050%, 11/21/2022 | | | 1,231,797 | |
| | 1,600,000 | | | Banco Bilbao Vizcaya Argentaria S.A., 0.875%, 9/18/2023 | | | 1,599,152 | |
| | 975,000 | | | Bank of America Corp., (fixed rate to 6/19/2025, variable rate thereafter), MTN, 1.319%, 6/19/2026 | | | 982,347 | |
| | 395,000 | | | Bank of Ireland Group PLC, 4.500%, 11/25/2023, 144A | | | 426,830 | |
| | 695,000 | | | Bank of Montreal, MTN, 1.850%, 5/01/2025 | | | 725,906 | |
| | 725,000 | | | Bank of Montreal, MTN, 2.050%, 11/01/2022 | | | 749,308 | |
| | 655,000 | | | Bank of New York Mellon Corp. (The), MTN, 1.600%, 4/24/2025 | | | 680,828 | |
| | 1,235,000 | | | Bank of New Zealand, 2.000%, 2/21/2025, 144A | | | 1,292,945 | |
| | 1,515,000 | | | Bank of Nova Scotia (The), 0.550%, 9/15/2023 | | | 1,514,220 | |
| | 460,000 | | | Bank of Nova Scotia (The), 1.300%, 6/11/2025 | | | 468,855 | |
| | 870,000 | | | Bank of Nova Scotia (The), 2.000%, 11/15/2022 | | | 898,412 | |
| | 200,000 | | | Banque Federative du Credit Mutuel S.A., 2.375%, 11/21/2024, 144A | | | 211,529 | |
| | | | |
| 39 | | | See accompanying notes to financial statements. | | |
Portfolio of Investments – as of September 30, 2020
Loomis Sayles Intermediate Duration Bond Fund – (continued)
| | | | | | | | |
Principal
Amount | | | Description | | Value (†) | |
| | | | Banking — continued | |
| $ | 460,000 | | | Banque Federative du Credit Mutuel S.A., 2.700%, 7/20/2022, 144A | | $ | 477,049 | |
| | 485,000 | | | Banque Federative du Credit Mutuel S.A., 3.750%, 7/20/2023, 144A | | | 526,111 | |
| | 795,000 | | | Barclays PLC, (fixed rate to 5/16/2023, variable rate thereafter), 4.338%, 5/16/2024 | | | 853,469 | |
| | 300,000 | | | BNP Paribas S.A, (fixed rate to 1/13/2030, variable rate thereafter), 3.052%, 1/13/2031, 144A | | | 321,739 | |
| | 675,000 | | | BNP Paribas S.A, (fixed rate to 6/09/2025, variable rate thereafter), 2.219%, 6/09/2026, 144A | | | 696,053 | |
| | 510,000 | | | BNP Paribas S.A., (fixed rate to 11/19/2024, variable rate thereafter), 2.819%, 11/19/2025, 144A | | | 537,448 | |
| | 160,000 | | | Capital One Financial Corp., 3.750%, 3/09/2027 | | | 177,655 | |
| | 510,000 | | | Citigroup, Inc., (fixed rate to 4/08/2025, variable rate thereafter), 3.106%, 4/08/2026 | | | 551,992 | |
| | 940,000 | | | Citigroup, Inc., (fixed rate to 11/04/2021, variable rate thereafter), 2.312%, 11/04/2022 | | | 957,217 | |
| | 160,000 | | | Citizens Financial Group, Inc., 3.250%, 4/30/2030 | | | 176,616 | |
| | 225,000 | | | Comerica, Inc., 3.700%, 7/31/2023 | | | 243,703 | |
| | 660,000 | | | Cooperatieve Rabobank U.A. (NY), 2.750%, 1/10/2023 | | | 694,247 | |
| | 750,000 | | | Credit Agricole S.A, (fixed rate to 6/16/2025, variable rate thereafter), 1.907%, 6/16/2026, 144A | | | 766,154 | |
| | 925,000 | | | Credit Agricole S.A., 3.750%, 4/24/2023, 144A | | | 991,259 | |
| | 405,000 | | | Credit Suisse AG, 2.100%, 11/12/2021 | | | 412,663 | |
| | 895,000 | | | Credit Suisse Group AG, (fixed rate to 6/05/2025, variable rate thereafter), 2.193%, 6/05/2026, 144A | | | 921,885 | |
| | 940,000 | | | Danske Bank A/S, 3.875%, 9/12/2023, 144A | | | 1,012,062 | |
| | 215,000 | | | Deutsche Bank AG, 3.150%, 1/22/2021 | | | 216,301 | |
| | 395,000 | | | Deutsche Bank AG, (fixed rate to 11/26/2024, variable rate thereafter), 3.961%, 11/26/2025 | | | 419,979 | |
| | 390,000 | | | Deutsche Bank AG, (fixed rate to 9/18/2030, variable rate thereafter), 3.547%, 9/18/2031 | | | 394,071 | |
| | 865,000 | | | DNB Bank ASA, 2.150%, 12/02/2022, 144A | | | 895,373 | |
| | 1,255,000 | | | DNB Bank ASA, (fixed rate to 9/16/2025, variable rate thereafter), 1.127%, 9/16/2026, 144A | | | 1,252,051 | |
| | 520,000 | | | Goldman Sachs Group, Inc. (The), (fixed rate to 10/31/2021, variable rate thereafter), 2.876%, 10/31/2022 | | | 532,464 | |
| | 740,000 | | | HSBC Holdings PLC, (fixed rate to 8/18/2030, variable rate thereafter), 2.357%, 8/18/2031 | | | 728,563 | |
| | 520,000 | | | HSBC Holdings PLC, (fixed rate to 9/12/2025, variable rate thereafter), 4.292%, 9/12/2026 | | | 580,575 | |
| | 360,000 | | | JPMorgan Chase & Co., (fixed rate to 5/13/2030, variable rate thereafter), 2.956%, 5/13/2031 | | | 386,245 | |
| | 535,000 | | | JPMorgan Chase & Co., (fixed rate to 4/01/2022, variable rate thereafter), 3.207%, 4/01/2023 | | | 555,913 | |
| | 1,335,000 | | | JPMorgan Chase & Co., (fixed rate to 6/01/2023, variable rate thereafter), 1.514%, 6/01/2024 | | | 1,362,515 | |
| | 770,000 | | | KeyCorp, MTN, 2.250%, 4/06/2027 | | | 815,735 | |
| | 375,000 | | | Lloyds Banking Group PLC, (fixed rate to 7/09/2024, variable rate thereafter), 3.870%, 7/09/2025 | | | 408,141 | |
| | | | |
| | See accompanying notes to financial statements. | | | 40 |
Portfolio of Investments – as of September 30, 2020
Loomis Sayles Intermediate Duration Bond Fund – (continued)
| | | | | | | | |
Principal
Amount | | | Description | | Value (†) | |
| | | | Banking — continued | |
| $ | 495,000 | | | Lloyds Banking Group PLC, 4.050%, 8/16/2023 | | $ | 535,680 | |
| | 1,195,000 | | | Macquarie Bank Ltd., 2.100%, 10/17/2022, 144A | | | 1,233,412 | |
| | 65,000 | | | Macquarie Bank Ltd., 2.300%, 1/22/2025, 144A | | | 68,828 | |
| | 930,000 | | | National Australia Bank Ltd., 3.700%, 11/04/2021 | | | 963,085 | |
| | 625,000 | | | National Bank of Canada, 2.150%, 10/07/2022, 144A | | | 644,519 | |
| | 1,135,000 | | | National Bank of Canada, 2.200%, 11/02/2020 | | | 1,135,000 | |
| | 620,000 | | | Nationwide Building Society, (fixed rate to 3/08/2023, variable rate thereafter), 3.766%, 3/08/2024, 144A | | | 658,851 | |
| | 425,000 | | | Natwest Group PLC, (fixed rate to 5/22/2027, variable rate thereafter), 3.073%, 5/22/2028 | | | 446,622 | |
| | 1,020,000 | | | NatWest Markets PLC, 3.625%, 9/29/2022, 144A | | | 1,070,663 | |
| | 315,000 | | | Northern Trust Corp., (fixed rate to 5/08/2027, variable rate thereafter), 3.375%, 5/08/2032 | | | 344,492 | |
| | 615,000 | | | Santander Holdings USA, Inc., 3.244%, 10/05/2026 | | | 658,099 | |
| | 690,000 | | | Santander Holdings USA, Inc., 3.450%, 6/02/2025 | | | 737,887 | |
| | 70,000 | | | Santander Holdings USA, Inc., 3.500%, 6/07/2024 | | | 75,083 | |
| | 350,000 | | | Santander UK PLC, 2.125%, 11/03/2020 | | | 350,582 | |
| | 580,000 | | | Santander UK PLC, 2.875%, 6/18/2024 | | | 619,242 | |
| | 890,000 | | | Societe Generale S.A., 1.375%, 7/08/2025, 144A | | | 904,056 | |
| | 840,000 | | | Societe Generale S.A., 2.625%, 10/16/2024, 144A | | | 870,249 | |
| | 820,000 | | | Standard Chartered PLC, (fixed rate to 1/30/2025, variable rate thereafter), 2.819%, 1/30/2026, 144A | | | 849,557 | |
| | 530,000 | | | Standard Chartered PLC, (fixed rate to 5/21/2024, variable rate thereafter), 3.785%, 5/21/2025, 144A | | | 563,546 | |
| | 245,000 | | | State Street Corp., (fixed rate to 3/30/2025, variable rate thereafter), 2.901%, 3/30/2026, 144A | | | 266,402 | |
| | 305,000 | | | State Street Corp., (fixed rate to 5/15/2022, variable rate thereafter), 2.653%, 5/15/2023 | | | 315,782 | |
| | 545,000 | | | Sumitomo Mitsui Financial Group, Inc., 2.696%, 7/16/2024 | | | 579,871 | |
| | 235,000 | | | Sumitomo Mitsui Financial Group, Inc., 2.784%, 7/12/2022 | | | 244,218 | |
| | 515,000 | | | Svenska Handelsbanken AB, 3.900%, 11/20/2023 | | | 568,342 | |
| | 1,400,000 | | | Swedbank AB, 1.300%, 6/02/2023, 144A | | | 1,424,570 | |
| | 1,140,000 | | | Synchrony Bank, 3.650%, 5/24/2021 | | | 1,157,281 | |
| | 75,000 | | | Synchrony Financial, 4.250%, 8/15/2024 | | | 81,499 | |
| | 1,510,000 | | | Toronto-Dominion Bank (The), 0.750%, 9/11/2025 | | | 1,505,832 | |
| | 700,000 | | | Toronto-Dominion Bank (The), MTN, 1.900%, 12/01/2022 | | | 722,599 | |
| | 1,105,000 | | | Truist Financial Corp., MTN, 1.125%, 8/03/2027 | | | 1,101,926 | |
| | 295,000 | | | Truist Financial Corp., MTN, 1.950%, 6/05/2030 | | | 303,384 | |
| | 340,000 | | | Truist Financial Corp., MTN, 2.500%, 8/01/2024 | | | 361,921 | |
| | 770,000 | | | Truist Financial Corp., MTN, 3.050%, 6/20/2022 | | | 802,466 | |
| | 665,000 | | | UniCredit SpA, 3.750%, 4/12/2022, 144A | | | 689,477 | |
| | 335,000 | | | UniCredit SpA, (fixed rate to 6/30/2030, variable rate thereafter), 5.459%, 6/30/2035, 144A | | | 341,281 | |
| | 585,000 | | | UniCredit SpA, (fixed rate to 9/22/2025, variable rate thereafter), 2.569%, 9/22/2026, 144A | | | 579,783 | |
| | 340,000 | | | Wells Fargo & Co., (fixed rate to 4/30/2025, variable rate thereafter), 2.188%, 4/30/2026 | | | 354,630 | |
| | | | |
| 41 | | | See accompanying notes to financial statements. | | |
Portfolio of Investments – as of September 30, 2020
Loomis Sayles Intermediate Duration Bond Fund – (continued)
| | | | | | | | |
Principal
Amount | | | Description | | Value (†) | |
| | | | Banking — continued | |
| $ | 500,000 | | | Wells Fargo & Co., (fixed rate to 6/02/2027, variable rate thereafter), MTN, 2.393%, 6/02/2028 | | $ | 521,640 | |
| | 1,030,000 | | | Wells Fargo Bank NA, 3.625%, 10/22/2021 | | | 1,062,040 | |
| | 195,000 | | | Westpac Banking Corp., 2.800%, 1/11/2022 | | | 201,267 | |
| | | | | | | | |
| | | | | | | 58,231,184 | |
| | | | | | | | |
| | | | Brokerage — 0.8% | |
| | 415,000 | | | Ameriprise Financial, Inc., 3.000%, 3/22/2022 | | | 430,629 | |
| | 210,000 | | | Brookfield Finance LLC, 3.450%, 4/15/2050 | | | 205,483 | |
| | 465,000 | | | Intercontinental Exchange, Inc., 2.100%, 6/15/2030 | | | 480,047 | |
| | 1,300,000 | | | National Securities Clearing Corp., 1.200%, 4/23/2023, 144A | | | 1,322,958 | |
| | | | | | | | |
| | | | | | | 2,439,117 | |
| | | | | | | | |
| | | | Chemicals — 1.2% | |
| | 430,000 | | | Air Products & Chemicals, Inc., 2.050%, 5/15/2030 | | | 451,351 | |
| | 360,000 | | | Cabot Corp., 4.000%, 7/01/2029 | | | 382,173 | |
| | 460,000 | | | DuPont de Nemours, Inc., 2.169%, 5/01/2023 | | | 464,745 | |
| | 255,000 | | | DuPont de Nemours, Inc., 3.766%, 11/15/2020 | | | 256,046 | |
| | 9,000 | | | Eastman Chemical Co., 4.500%, 1/15/2021 | | | 9,013 | |
| | 960,000 | | | Nutrien Ltd., 1.900%, 5/13/2023 | | | 990,989 | |
| | 1,145,000 | | | Nutrition & Biosciences, Inc., 1.832%, 10/15/2027, 144A | | | 1,150,191 | |
| | 75,000 | | | PPG Industries, Inc., 2.550%, 6/15/2030 | | | 79,856 | |
| | | | | | | | |
| | | | | | | 3,784,364 | |
| | | | | | | | |
| | | | Collateralized Mortgage Obligations — 2.1% | |
| | 484,639 | | | Government National Mortgage Association, Series 2010-H02, Class FA, 1-month LIBOR + 0.680%, 0.850%, 2/20/2060(e) | | | 487,335 | |
| | 276,066 | | | Government National Mortgage Association, Series 2010-H03, Class FA, 1-month LIBOR + 0.550%, 0.720%, 3/20/2060(e) | | | 276,824 | |
| | 152,718 | | | Government National Mortgage Association, Series 2014-H14, Class FA, 1-month LIBOR + 0.500%, 0.664%, 7/20/2064(e) | | | 152,880 | |
| | 114,730 | | | Government National Mortgage Association, Series 2014-H15, Class FA, 1-month LIBOR + 0.500%, 0.655%, 7/20/2064(e) | | | 115,039 | |
| | 4,037 | | | Government National Mortgage Association, Series 2015-H09, Class HA, 1.750%, 3/20/2065(b)(c) | | | 4,042 | |
| | 286,039 | | | Government National Mortgage Association, Series 2015-H10, Class JA, 2.250%, 4/20/2065(a) | | | 291,947 | |
| | 468,229 | | | Government National Mortgage Association, Series 2016-H06, Class FC, 1-month LIBOR + 0.920%, 1.075%, 2/20/2066(a)(e) | | | 475,619 | |
| | 91,213 | | | Government National Mortgage Association, Series 2016-H10, Class FJ, 1-month LIBOR + 0.600%, 0.755%, 4/20/2066(a)(e) | | | 91,269 | |
| | 1,689,812 | | | Government National Mortgage Association, Series 2018-H17, Class JA, 3.750%, 9/20/2068(a)(d) | | | 1,912,871 | |
| | 362,916 | | | Government National Mortgage Association, Series 2019-H01, Class FL, 1-month LIBOR + 0.450%, 0.605%, 12/20/2068(e) | | | 362,658 | |
| | 1,253,824 | | | Government National Mortgage Association, Series 2019-H01, Class FT, 1-month LIBOR + 0.400%, 0.555%, 10/20/2068(a)(e) | | | 1,253,201 | |
| | 1,139,041 | | | Government National Mortgage Association, Series 2019-H10, Class FM, 1-month LIBOR + 0.400%, 0.555%, 5/20/2069(a)(e) | | | 1,138,800 | |
| | | | | | | | |
| | | | | | | 6,562,485 | |
| | | | | | | | |
| | | | |
| | See accompanying notes to financial statements. | | | 42 |
Portfolio of Investments – as of September 30, 2020
Loomis Sayles Intermediate Duration Bond Fund – (continued)
| | | | | | | | |
Principal
Amount | | | Description | | Value (†) | |
| | | | Construction Machinery — 1.2% | |
| $ | 275,000 | | | Caterpillar Financial Services Corp., MTN, 0.950%, 5/13/2022 | | $ | 277,529 | |
| | 1,435,000 | | | Caterpillar Financial Services Corp., 0.650%, 7/07/2023 | | | 1,441,835 | |
| | 300,000 | | | Caterpillar Financial Services Corp., MTN, 3.150%, 9/07/2021 | | | 308,152 | |
| | 265,000 | | | Caterpillar Financial Services Corp., Series I, 2.650%, 5/17/2021 | | | 268,881 | |
| | 300,000 | | | CNH Industrial Capital LLC, 1.950%, 7/02/2023 | | | 305,625 | |
| | 1,090,000 | | | John Deere Capital Corp., MTN, 0.700%, 7/05/2023 | | | 1,102,433 | |
| | 110,000 | | | John Deere Capital Corp., MTN, 2.600%, 3/07/2024 | | | 117,611 | |
| | | | | | | | |
| | | | | | | 3,822,066 | |
| | | | | | | | |
| | | | Consumer Cyclical Services — 0.6% | |
| | 465,000 | | | Automatic Data Processing, Inc., 1.250%, 9/01/2030 | | | 458,745 | |
| | 350,000 | | | eBay, Inc., 1.900%, 3/11/2025 | | | 364,771 | |
| | 375,000 | | | Expedia Group, Inc., 6.250%, 5/01/2025, 144A | | | 413,591 | |
| | 495,000 | | | Western Union Co. (The), 4.250%, 6/09/2023 | | | 534,441 | |
| | | | | | | | |
| | | | | | | 1,771,548 | |
| | | | | | | | |
| | | | Consumer Products — 0.1% | |
| | 420,000 | | | Hasbro, Inc., 3.550%, 11/19/2026 | | | 445,015 | |
| | | | | | | | |
| | | | Diversified Manufacturing — 0.4% | |
| | 135,000 | | | Amphenol Corp., 2.050%, 3/01/2025 | | | 141,567 | |
| | 455,000 | | | Kennametal, Inc., 4.625%, 6/15/2028 | | | 507,993 | |
| | 105,000 | | | Roper Technologies, Inc., 1.400%, 9/15/2027 | | | 106,070 | |
| | 265,000 | | | Timken Co. (The), 4.500%, 12/15/2028 | | | 293,779 | |
| | 275,000 | | | WW Grainger, Inc., 1.850%, 2/15/2025 | | | 288,049 | |
| | | | | | | | |
| | | | | | | 1,337,458 | |
| | | | | | | | |
| | | | Electric — 4.4% | |
| | 435,000 | | | AES Corp. (The), 3.300%, 7/15/2025, 144A | | | 463,432 | |
| | 720,000 | | | Alliant Energy Finance LLC, 4.250%, 6/15/2028, 144A | | | 837,027 | |
| | 120,000 | | | Consolidated Edison Co. of New York, Inc., Series B, 2.900%, 12/01/2026 | | | 130,656 | |
| | 225,000 | | | Dominion Energy, Inc., 3.071%, 8/15/2024 | | | 242,189 | |
| | 120,000 | | | Dominion Energy, Inc., Series B, 3.600%, 3/15/2027 | | | 136,488 | |
| | 270,000 | | | DTE Energy Co., 2.250%, 11/01/2022 | | | 279,151 | |
| | 540,000 | | | DTE Energy Co., Series F, 1.050%, 6/01/2025 | | | 539,701 | |
| | 1,135,000 | | | Duke Energy Carolinas LLC, 3.050%, 3/15/2023 | | | 1,204,955 | |
| | 850,000 | | | Duke Energy Corp., 0.900%, 9/15/2025 | | | 850,121 | |
| | 605,000 | | | Entergy Corp., 0.900%, 9/15/2025 | | | 602,573 | |
| | 265,000 | | | Entergy Corp., 2.800%, 6/15/2030 | | | 286,487 | |
| | 330,000 | | | Eversource Energy, Series R, 1.650%, 8/15/2030 | | | 326,981 | |
| | 451,000 | | | Exelon Corp., 2.450%, 4/15/2021 | | | 454,904 | |
| | 116,000 | | | Exelon Generation Co. LLC, 4.250%, 6/15/2022 | | | 122,482 | |
| | 220,000 | | | FirstEnergy Corp., Series B, 2.250%, 9/01/2030 | | | 215,167 | |
| | 260,000 | | | ITC Holdings Corp., 2.950%, 5/14/2030, 144A | | | 279,588 | |
| | 285,000 | | | Liberty Utilities Finance GP, 2.050%, 9/15/2030, 144A | | | 280,964 | |
| | 188,000 | | | National Rural Utilities Cooperative Finance Corp., (fixed rate to 4/30/2023, variable rate thereafter), 4.750%, 4/30/2043 | | | 193,646 | |
| | 210,000 | | | NextEra Energy Capital Holdings, Inc., 2.250%, 6/01/2030 | | | 217,461 | |
| | 435,000 | | | NextEra Energy Capital Holdings, Inc., 2.403%, 9/01/2021 | | | 443,271 | |
| | | | |
| 43 | | | See accompanying notes to financial statements. | | |
Portfolio of Investments – as of September 30, 2020
Loomis Sayles Intermediate Duration Bond Fund – (continued)
| | | | | | | | |
Principal
Amount | | | Description | | Value (†) | |
| | | | Electric — continued | |
| $ | 1,115,000 | | | PNM Resources, Inc., 3.250%, 3/09/2021 | | $ | 1,127,678 | |
| | 370,000 | | | PSEG Power LLC, 3.850%, 6/01/2023 | | | 398,073 | |
| | 135,000 | | | Public Service Co. of Colorado, Series 35, 1.900%, 1/15/2031 | | | 140,374 | |
| | 235,000 | | | Public Service Enterprise Group, Inc., 2.875%, 6/15/2024 | | | 251,439 | |
| | 450,000 | | | San Diego Gas & Electric Co., Series VVV, 1.700%, 10/01/2030 | | | 448,222 | |
| | 180,000 | | | Southern California Edison Co., 2.250%, 6/01/2030 | | | 180,610 | |
| | 510,000 | | | Southern California Edison Co., Series 20C, 1.200%, 2/01/2026 | | | 507,277 | |
| | 720,000 | | | Southern Power Co., Series E, 2.500%, 12/15/2021 | | | 737,007 | |
| | 600,000 | | | Vistra Operations Co. LLC, 3.550%, 7/15/2024, 144A | | | 639,175 | |
| | 1,540,000 | | | WEC Energy Group, Inc., 0.550%, 9/15/2023 | | | 1,542,766 | |
| | | | | | | | |
| | | | | | | 14,079,865 | |
| | | | | | | | |
| | | | Energy — 0.2% | |
| | 640,000 | | | Pioneer Natural Resources Co., 1.900%, 8/15/2030 | | | 600,269 | |
| | | | | | | | |
| | | | Finance Companies — 1.6% | |
| | 735,000 | | | AerCap Ireland Capital DAC/AerCap Global Aviation Trust, 3.150%, 2/15/2024 | | | 727,770 | |
| | 310,000 | | | Air Lease Corp., 3.250%, 10/01/2029 | | | 294,057 | |
| | 705,000 | | | Ares Capital Corp., 3.250%, 7/15/2025 | | | 698,331 | |
| | 380,000 | | | Ares Capital Corp., 3.875%, 1/15/2026 | | | 387,007 | |
| | 305,000 | | | Aviation Capital Group LLC, 3.875%, 5/01/2023, 144A | | | 301,837 | |
| | 225,000 | | | Aviation Capital Group LLC, 4.375%, 1/30/2024, 144A | | | 223,627 | |
| | 375,000 | | | Avolon Holdings Funding Ltd., 3.625%, 5/01/2022, 144A | | | 368,493 | |
| | 460,000 | | | FS KKR Capital Corp., 4.125%, 2/01/2025 | | | 457,115 | |
| | 970,000 | | | GE Capital Funding LLC, 4.050%, 5/15/2027, 144A | | | 1,045,370 | |
| | 150,000 | | | Oaktree Specialty Lending Corp., 3.500%, 2/25/2025 | | | 150,824 | |
| | 565,000 | | | Owl Rock Capital Corp., 4.250%, 1/15/2026 | | | 572,362 | |
| | | | | | | | |
| | | | | | | 5,226,793 | |
| | | | | | | | |
| | | | Financial Other — 0.4% | |
| | 470,000 | | | LeasePlan Corp NV, 2.875%, 10/24/2024, 144A | | | 485,048 | |
| | 410,000 | | | Mitsubishi UFJ Lease & Finance Co. Ltd., 2.652%, 9/19/2022, 144A | | | 421,989 | |
| | 185,000 | | | ORIX Corp., 3.250%, 12/04/2024 | | | 200,533 | |
| | | | | | | | |
| | | | | | | 1,107,570 | |
| | | | | | | | |
| | | | Food & Beverage — 2.0% | |
| | 835,000 | | | Bacardi Ltd., 4.700%, 5/15/2028, 144A | | | 970,376 | |
| | 120,000 | | | Brown-Forman Corp., 3.500%, 4/15/2025 | | | 133,606 | |
| | 525,000 | | | Bunge Ltd. Finance Corp., 4.350%, 3/15/2024 | | | 578,498 | |
| | 160,000 | | | Campbell Soup Co., 3.125%, 4/24/2050 | | | 161,731 | |
| | 1,100,000 | | | Coca-Cola Co. (The), 1.375%, 3/15/2031 | | | 1,094,642 | |
| | 1,095,000 | | | General Mills, Inc., 2.600%, 10/12/2022 | | | 1,139,421 | |
| | 220,000 | | | Hershey Co. (The), 0.900%, 6/01/2025 | | | 221,141 | |
| | 370,000 | | | Mondelez International, Inc., 2.750%, 4/13/2030 | | | 402,348 | |
| | 565,000 | | | Mondelez International, Inc., 1.875%, 10/15/2032 | | | 563,672 | |
| | 1,065,000 | | | Pernod Ricard International Finance LLC, 1.250%, 4/01/2028, 144A | | | 1,056,224 | |
| | | | | | | | |
| | | | | | | 6,321,659 | |
| | | | | | | | |
| | | | |
| | See accompanying notes to financial statements. | | | 44 |
Portfolio of Investments – as of September 30, 2020
Loomis Sayles Intermediate Duration Bond Fund – (continued)
| | | | | | | | |
Principal
Amount | | | Description | | Value (†) | |
| | | | Health Insurance — 0.6% | |
| $ | 1,575,000 | | | Centene Corp., 3.000%, 10/15/2030 | | $ | 1,606,815 | |
| | 310,000 | | | Humana, Inc., 2.500%, 12/15/2020 | | | 311,296 | |
| | | | | | | | |
| | | | | | | 1,918,111 | |
| | | | | | | | |
| | | | Healthcare — 0.9% | |
| | 575,000 | | | AmerisourceBergen Corp., 2.800%, 5/15/2030 | | | 614,764 | |
| | 419,000 | | | Cigna Corp., 3.750%, 7/15/2023 | | | 454,059 | |
| | 95,000 | | | Cigna Corp., 4.500%, 2/25/2026 | | | 110,980 | |
| | 420,000 | | | CVS Health Corp., 4.300%, 3/25/2028 | | | 491,598 | |
| | 510,000 | | | DH Europe Finance II S.a.r.l., 2.200%, 11/15/2024 | | | 538,885 | |
| | 395,000 | | | Stryker Corp., 1.950%, 6/15/2030 | | | 403,157 | |
| | 355,000 | | | Universal Health Services, Inc., 2.650%, 10/15/2030, 144A | | | 353,317 | |
| | | | | | | | |
| | | | | | | 2,966,760 | |
| | | | | | | | |
| | | | Hybrid ARMs — 0.0% | |
| | 35,029 | | | FHLMC, 1-year CMT + 2.258%, 3.152%, 1/01/2035(e) | | | 36,968 | |
| | 73,063 | | | FHLMC, 1-year CMT + 2.500%, 3.783%, 5/01/2036(e) | | | 77,650 | |
| | | | | | | | |
| | | | | | | 114,618 | |
| | | | | | | | |
| | | | Independent Energy — 0.4% | |
| | 400,000 | | | Aker BP ASA, 3.750%, 1/15/2030, 144A | | | 387,925 | |
| | 380,000 | | | Canadian Natural Resources Ltd., 2.950%, 7/15/2030 | | | 382,818 | |
| | 545,000 | | | Diamondback Energy, Inc., 4.750%, 5/31/2025 | | | 587,912 | |
| | | | | | | | |
| | | | | | | 1,358,655 | |
| | | | | | | | |
| | | | Integrated Energy — 0.9% | |
| | 355,000 | | | Chevron Corp., 2.236%, 5/11/2030 | | | 376,710 | |
| | 635,000 | | | Exxon Mobil Corp., 3.482%, 3/19/2030 | | | 732,216 | |
| | 1,060,000 | | | Shell International Finance BV, 2.750%, 4/06/2030 | | | 1,159,100 | |
| | 660,000 | | | Suncor Energy, Inc., 2.800%, 5/15/2023 | | | 691,763 | |
| | | | | | | | |
| | | | | | | 2,959,789 | |
| | | | | | | | |
| | | | Life Insurance — 5.9% | |
| | 1,385,000 | | | AIG Global Funding, 0.800%, 7/07/2023, 144A | | | 1,392,262 | |
| | 535,000 | | | AIG Global Funding, 0.900%, 9/22/2025, 144A | | | 531,583 | |
| | 195,000 | | | Athene Global Funding, 2.500%, 1/14/2025, 144A | | | 200,999 | |
| | 785,000 | | | Athene Global Funding, 2.800%, 5/26/2023, 144A | | | 818,617 | |
| | 330,000 | | | Brighthouse Financial, Inc., 3.700%, 6/22/2027 | | | 342,330 | |
| | 710,000 | | | Equitable Financial Life Global Funding, 1.400%, 8/27/2027, 144A | | | 712,650 | |
| | 675,000 | | | Five Corners Funding Trust II, 2.850%, 5/15/2030, 144A | | | 725,127 | |
| | 325,000 | | | Global Atlantic Finance Co., 4.400%, 10/15/2029, 144A | | | 338,605 | |
| | 665,000 | | | Great-West Lifeco U.S. Finance LP, 0.904%, 8/12/2025, 144A | | | 663,511 | |
| | 1,370,000 | | | Guardian Life Global Funding, 1.100%, 6/23/2025, 144A | | | 1,381,386 | |
| | 155,000 | | | Jackson National Life Global Funding, 3.875%, 6/11/2025, 144A | | | 174,827 | |
| | 345,000 | | | Manulife Financial Corp., 2.484%, 5/19/2027 | | | 369,211 | |
| | 1,400,000 | | | MassMutual Global Funding II, 0.850%, 6/09/2023, 144A | | | 1,414,811 | |
| | 795,000 | | | Metropolitan Life Global Funding I, 0.900%, 6/08/2023, 144A | | | 803,559 | |
| | 700,000 | | | Metropolitan Life Global Funding I, 0.950%, 7/02/2025, 144A | | | 706,636 | |
| | 505,000 | | | Metropolitan Life Global Funding I, 2.400%, 6/17/2022, 144A | | | 521,639 | |
| | 1,400,000 | | | New York Life Global Funding, 0.950%, 6/24/2025, 144A(a) | | | 1,413,865 | |
| | | | |
| 45 | | | See accompanying notes to financial statements. | | |
Portfolio of Investments – as of September 30, 2020
Loomis Sayles Intermediate Duration Bond Fund – (continued)
| | | | | | | | |
Principal
Amount | | | Description | | Value (†) | |
| | | | Life Insurance — continued | |
| $ | 1,070,000 | | | New York Life Global Funding, 2.875%, 4/10/2024, 144A(a) | | $ | 1,149,354 | |
| | 915,000 | | | New York Life Global Funding, 2.950%, 1/28/2021, 144A(a) | | | 922,933 | |
| | 645,000 | | | Principal Life Global Funding II, 1.250%, 6/23/2025, 144A | | | 656,991 | |
| | 1,360,000 | | | Protective Life Global Funding, 1.082%, 6/09/2023, 144A | | | 1,379,240 | |
| | 655,000 | | | Reliance Standard Life Global Funding II, 2.750%, 5/07/2025, 144A | | | 691,531 | |
| | 565,000 | | | Reliance Standard Life Global Funding II, 3.850%, 9/19/2023, 144A | | | 608,463 | |
| | 700,000 | | | Unum Group, 4.500%, 3/15/2025 | | | 777,547 | |
| | | | | | | | |
| | | | | | | 18,697,677 | |
| | | | | | | | |
| | | | Lodging — 0.2% | |
| | 125,000 | | | Choice Hotels International, Inc., 3.700%, 1/15/2031 | | | 131,544 | |
| | 350,000 | | | Marriott International, Inc., Series Z, 4.150%, 12/01/2023 | | | 370,001 | |
| | | | | | | | |
| | | | | | | 501,545 | |
| | | | | | | | |
| | | | Media Entertainment — 0.0% | |
| | 130,000 | | | Interpublic Group of Cos., Inc. (The), 3.500%, 10/01/2020 | | | 130,000 | |
| | | | | | | | |
| | | | Metals & Mining — 0.4% | |
| | 345,000 | | | Anglo American Capital PLC, 2.625%, 9/10/2030, 144A | | | 344,062 | |
| | 730,000 | | | Glencore Funding LLC, 2.500%, 9/01/2030, 144A | | | 709,757 | |
| | 155,000 | | | Glencore Funding LLC, 4.125%, 3/12/2024, 144A | | | 167,956 | |
| | 65,000 | | | Reliance Steel & Aluminum Co., 2.150%, 8/15/2030 | | | 63,599 | |
| | | | | | | | |
| | | | | | | 1,285,374 | |
| | | | | | | | |
| | | | Midstream — 0.3% | |
| | 25,000 | | | Energy Transfer Operating LP, 4.250%, 3/15/2023 | | | 25,994 | |
| | 50,000 | | | Gray Oak Pipeline LLC, 3.450%, 10/15/2027, 144A | | | 51,087 | |
| | 440,000 | | | Midwest Connector Capital Co. LLC, 3.625%, 4/01/2022, 144A | | | 443,280 | |
| | 185,000 | | | ONEOK, Inc., 5.850%, 1/15/2026 | | | 212,768 | |
| | 70,000 | | | Plains All American Pipeline LP/PAA Finance Corp., 3.800%, 9/15/2030 | | | 67,878 | |
| | | | | | | | |
| | | | | | | 801,007 | |
| | | | | | | | |
| | | | Mortgage Related — 1.4% | |
| | 1,948 | | | FHLMC, 3.000%, 10/01/2026 | | | 2,048 | |
| | 155 | | | FHLMC, 6.500%, 1/01/2024 | | | 173 | |
| | 41 | | | FHLMC, 8.000%, 7/01/2025 | | | 45 | |
| | 21,847 | | | GNMA, 3.676%, 2/20/2063(a)(d) | | | 22,499 | |
| | 33,710 | | | GNMA, 3.705%, 2/20/2063(d) | | | 34,609 | |
| | 5,913 | | | GNMA, 3.890%, 5/20/2062(d) | | | 5,930 | |
| | 9,232 | | | GNMA, 3.992%, 5/20/2062(d) | | | 9,977 | |
| | 15,437 | | | GNMA, 4.043%, 10/20/2062(d) | | | 16,166 | |
| | 25,298 | | | GNMA, 4.059%, 4/20/2063(a)(d) | | | 27,005 | |
| | 28,537 | | | GNMA, 4.111%, 4/20/2063(d) | | | 28,881 | |
| | 16,902 | | | GNMA, 4.188%, 2/20/2063(d) | | | 17,058 | |
| | 21,620 | | | GNMA, 4.194%, 11/20/2064(d) | | | 22,517 | |
| | 9,469 | | | GNMA, 4.343%, 3/20/2063(d) | | | 9,580 | |
| | 56,761 | | | GNMA, 4.372%, 6/20/2066(d) | | | 63,938 | |
| | 218,489 | | | GNMA, 4.435%, 10/20/2066(d) | | | 249,387 | |
| | 108,397 | | | GNMA, 4.438%, 9/20/2066(d) | | | 122,722 | |
| | 62,363 | | | GNMA, 4.445%, 11/20/2066(d) | | | 70,151 | |
| | | | |
| | See accompanying notes to financial statements. | | | 46 |
Portfolio of Investments – as of September 30, 2020
Loomis Sayles Intermediate Duration Bond Fund – (continued)
| | | | | | | | |
Principal
Amount | | | Description | | Value (†) | |
| | | | Mortgage Related — continued | |
| $ | 105,005 | | | GNMA, 4.485%, 11/20/2066(d) | | $ | 120,073 | |
| | 184,723 | | | GNMA, 4.517%, 9/20/2066(d) | | | 211,085 | |
| | 85,682 | | | GNMA, 4.521%, 10/20/2066(d) | | | 98,132 | |
| | 112,575 | | | GNMA, 4.525%, 10/20/2066(d) | | | 128,057 | |
| | 1,017,960 | | | GNMA, 4.539%, 4/20/2067(a)(d) | | | 1,168,158 | |
| | 58,005 | | | GNMA, 4.542%, 8/20/2066(d) | | | 65,515 | |
| | 467,668 | | | GNMA, 4.545%, 7/20/2067(a)(d) | | | 542,373 | |
| | 815,559 | | | GNMA, 4.578%, 1/20/2067(a)(d) | | | 935,443 | |
| | 2,106 | | | GNMA, 4.630%, 7/20/2062(d) | | | 2,225 | |
| | 375,650 | | | GNMA, 4.684%, 5/20/2064(a)(d) | | | 410,087 | |
| | 706 | | | GNMA, 4.700%, 8/20/2061(d) | | | 787 | |
| | 509 | | | GNMA, 6.500%, 12/15/2023 | | | 562 | |
| | | | | | | | |
| | | | | | | 4,385,183 | |
| | | | | | | | |
| | | | Natural Gas — 0.4% | |
| | 820,000 | | | Atmos Energy Corp., 1.500%, 1/15/2031 | | | 816,685 | |
| | 385,000 | | | NiSource, Inc., 1.700%, 2/15/2031 | | | 378,477 | |
| | | | | | | | |
| | | | | | | 1,195,162 | |
| | | | | | | | |
| | | | Non-Agency Commercial Mortgage-Backed Securities — 5.0% | |
| | 230,000 | | | BANK, Series 2019-BN24, Class A3, 2.960%, 11/15/2062 | | | 257,296 | |
| | 270,000 | | | BANK, Series 2020-BN25, Class A5, 2.649%, 1/15/2063 | | | 296,126 | |
| | 565,000 | | | Barclays Commercial Mortgage Securities Trust, Series 2017-C1, Class A2, 3.189%, 2/15/2050(a) | | | 580,293 | |
| | 285,000 | | | Benchmark Mortgage Trust, Series 2020-B16, Class A5, 2.732%, 2/15/2053 | | | 312,960 | |
| | 491,600 | | | CFCRE Commercial Mortgage Trust, Series 2016-C3, Class A3, 3.865%, 1/10/2048(a) | | | 551,066 | |
| | 361,996 | | | CFCRE Commercial Mortgage Trust, Series 2016-C4, Class A4, 3.283%, 5/10/2058 | | | 392,483 | |
| | 992,138 | | | Citigroup Commercial Mortgage Trust, Series 2016-GC37, Class A4, 3.314%, 4/10/2049(a) | | | 1,097,325 | |
| | 540,000 | | | Citigroup Commercial Mortgage Trust, Series 2019-C7, Class A4, 3.102%, 12/15/2072 | | | 608,806 | |
| | 263,676 | | | Commercial Mortgage Pass Through Certificates, Series 2013-CR8, Class A5, 3.612%, 6/10/2046(d) | | | 280,718 | |
| | 535,000 | | | Commercial Mortgage Pass Through Certificates, Series 2012-LTRT, Class A2, 3.400%, 10/05/2030, 144A(a) | | | 519,128 | |
| | 26,367 | | | Commercial Mortgage Pass Through Certificates, Series 2014-CR14, Class A2, 3.147%, 2/10/2047 | | | 26,595 | |
| | 68,558 | | | Commercial Mortgage Pass Through Certificates, Series 2014-CR15, Class A2, 2.928%, 2/10/2047 | | | 69,432 | |
| | 151,558 | | | Commercial Mortgage Pass Through Certificates, Series 2014-CR16, Class ASB, 3.653%, 4/10/2047 | | | 157,557 | |
| | 478,193 | | | Commercial Mortgage Pass Through Certificates, Series 2014-LC17, Class A3, 3.723%, 10/10/2047(a) | | | 483,305 | |
| | 280,000 | | | Commercial Mortgage Pass Through Certificates, Series 2014-UBS3, Class A4, 3.819%, 6/10/2047 | | | 306,136 | |
| | 280,000 | | | Commercial Mortgage Pass Through Certificates, Series 2015-DC1, Class A5, 3.350%, 2/10/2048 | | | 304,991 | |
| | | | |
| 47 | | | See accompanying notes to financial statements. | | |
Portfolio of Investments – as of September 30, 2020
Loomis Sayles Intermediate Duration Bond Fund – (continued)
| | | | | | | | |
Principal
Amount | | | Description | | Value (†) | |
| | | | Non-Agency Commercial Mortgage-Backed Securities — continued | |
| $ | 520,299 | | | Commercial Mortgage Pass Through Certificates, Series 2016-DC2, Class A5, 3.765%, 2/10/2049(a) | | $ | 584,791 | |
| | 640,000 | | | Credit Suisse Mortgage Capital Certificates, Series 2014-USA, Class A2, 3.953%, 9/15/2037, 144A(a) | | | 652,283 | |
| | 84,913 | | | CSAIL Commercial Mortgage Trust, Series 2015-C4, Class ASB, 3.617%, 11/15/2048 | | | 90,508 | |
| | 470,000 | | | CSAIL Commercial Mortgage Trust, Series 2019-C18, Class A4, 2.968%, 12/15/2052 | | | 518,579 | |
| | 340,000 | | | GS Mortgage Securities Corp. Trust, Series 2013-PEMB, Class A, 3.668%, 3/05/2033, 144A(d) | | | 316,968 | |
| | 330,000 | | | GS Mortgage Securities Trust, Series 2014-GC18, Class A4, 4.074%, 1/10/2047 | | | 357,556 | |
| | 245,000 | | | GS Mortgage Securities Trust, Series 2020-GC45, Class A5, 2.911%, 2/13/2053 | | | 273,690 | |
| | 180,000 | | | Hudsons Bay Simon JV Trust, Series 2015-HB10, Class A10, 4.155%, 8/05/2034, 144A | | | 156,408 | |
| | 355,000 | | | Hudsons Bay Simon JV Trust, Series 2015-HB7, Class A7, 3.914%, 8/05/2034, 144A | | | 314,195 | |
| | 850,000 | | | JPMDB Commercial Mortgage Securities Trust, Series 2019-COR6, Class A4, 3.057%, 11/13/2052 | | | 953,006 | |
| | 81,502 | | | JPMorgan Chase Commercial Mortgage Securities Trust, Series 2014-C19, Class ASB, 3.584%, 4/15/2047 | | | 84,944 | |
| | 575,000 | | | JPMorgan Chase Commercial Mortgage Securities Trust, Series 2019-COR5, Class A4, 3.386%, 6/13/2052(a) | | | 656,722 | |
| | 240,000 | | | Morgan Stanley Bank of America Merrill Lynch Trust, Series 2013-C10, Class A4, 4.218%, 7/15/2046(d) | | | 258,101 | |
| | 104,221 | | | Morgan Stanley Bank of America Merrill Lynch Trust, Series 2014-C14, Class A3, 3.669%, 2/15/2047 | | | 104,552 | |
| | 129,604 | | | Morgan Stanley Bank of America Merrill Lynch Trust, Series 2015-C22, Class A4, 3.306%, 4/15/2048 | | | 140,717 | |
| | 550,000 | | | Morgan Stanley Capital I Trust, Series 2020-L4, Class A3, 2.698%, 2/15/2053 | | | 598,552 | |
| | 194,995 | | | Starwood Retail Property Trust, Series 2014-STAR, Class A, 1-month LIBOR + 1.470%, 1.622%, 11/15/2027, 144A(e) | | | 139,504 | |
| | 505,000 | | | UBS-Barclays Commercial Mortgage Trust, Series 2012-TFT, Class A, 2.892%, 6/05/2030, 144A(a) | | | 478,958 | |
| | 565,000 | | | UBS-Barclays Commercial Mortgage Trust, Series 2013-C6, Class A4, 3.244%, 4/10/2046(a) | | | 591,739 | |
| | 201,109 | | | Wells Fargo Commercial Mortgage Trust, Series 2016-C33, Class A4, 3.426%, 3/15/2059 | | | 223,299 | |
| | 1,277,244 | | | Wells Fargo Commercial Mortgage Trust, Series 2017-RC1, Class A2, 3.118%, 1/15/2060(a) | | | 1,305,423 | |
| | 152,101 | | | WFRBS Commercial Mortgage Trust, Series 2014-C19, Class A3, 3.660%, 3/15/2047 | | | 152,845 | |
| | 325,000 | | | WFRBS Commercial Mortgage Trust, Series 2014-C19, Class A5, 4.101%, 3/15/2047 | | | 354,963 | |
| | 254,542 | | | WFRBS Commercial Mortgage Trust, Series 2014-C20, Class ASB, 3.638%, 5/15/2047(a) | | | 265,987 | |
| | | | | | | | |
| | | | | | | 15,818,507 | |
| | | | | | | | |
| | | | |
| | See accompanying notes to financial statements. | | | 48 |
Portfolio of Investments – as of September 30, 2020
Loomis Sayles Intermediate Duration Bond Fund – (continued)
| | | | | | | | |
Principal
Amount | | | Description | | Value (†) | |
| | | | Oil Field Services — 0.5% | |
| $ | 980,000 | | | Baker Hughes a GE Co. LLC/Baker Hughes Co-Obligor, Inc., 2.773%, 12/15/2022 | | $ | 1,024,715 | |
| | 365,000 | | | National Oilwell Varco, Inc., 3.600%, 12/01/2029 | | | 354,514 | |
| | 130,000 | | | Schlumberger Investment S.A., 2.650%, 6/26/2030 | | | 131,239 | |
| | | | | | | | |
| | | | | | | 1,510,468 | |
| | | | | | | | |
| | | | Packaging — 0.0% | |
| | 95,000 | | | CCL Industries, Inc., 3.050%, 6/01/2030, 144A | | | 101,401 | |
| | | | | | | | |
| | | | Pharmaceuticals — 1.1% | |
| | 335,000 | | | AbbVie, Inc., 2.600%, 11/21/2024, 144A | | | 354,934 | |
| | 235,000 | | | Bayer U.S. Finance II LLC, 3.375%, 7/15/2024, 144A | | | 254,620 | |
| | 800,000 | | | Gilead Sciences, Inc., 1.650%, 10/01/2030 | | | 798,609 | |
| | 525,000 | | | Pfizer, Inc., 3.200%, 9/15/2023 | | | 566,830 | |
| | 390,000 | | | Royalty Pharma PLC, 1.750%, 9/02/2027, 144A | | | 391,018 | |
| | 325,000 | | | Takeda Pharmaceutical Co. Ltd., 2.050%, 3/31/2030 | | | 328,199 | |
| | 825,000 | | | Upjohn, Inc., 2.700%, 6/22/2030, 144A | | | 854,173 | |
| | | | | | | | |
| | | | | | | 3,548,383 | |
| | | | | | | | |
| | | | Property & Casualty Insurance — 0.3% | |
| | 645,000 | | | American Financial Group, Inc., 3.500%, 8/15/2026 | | | 698,283 | |
| | 180,000 | | | Assurant, Inc., 4.200%, 9/27/2023 | | | 192,673 | |
| | | | | | | | |
| | | | | | | 890,956 | |
| | | | | | | | |
| | | | Railroads — 0.1% | |
| | 215,000 | | | Union Pacific Corp., 3.646%, 2/15/2024 | | | 234,302 | |
| | | | | | | | |
| | | | Refining — 0.1% | |
| | 460,000 | | | Valero Energy Corp., 2.150%, 9/15/2027 | | | 458,143 | |
| | | | | | | | |
| | | | REITs – Apartments — 0.1% | |
| | 155,000 | | | Essex Portfolio LP, 2.650%, 3/15/2032 | | | 163,681 | |
| | | | | | | | |
| | | | REITs – Health Care — 0.4% | |
| | 255,000 | | | Healthpeak Properties, Inc., 3.000%, 1/15/2030 | | | 274,826 | |
| | 615,000 | | | Omega Healthcare Investors, Inc., 4.500%, 1/15/2025 | | | 653,074 | |
| | 200,000 | | | Welltower, Inc., 2.750%, 1/15/2031 | | | 206,093 | |
| | | | | | | | |
| | | | | | | 1,133,993 | |
| | | | | | | | |
| | | | REITs – Office Property — 0.8% | |
| | 385,000 | | | Alexandria Real Estate Equities, Inc., 1.875%, 2/01/2033 | | | 377,046 | |
| | 290,000 | | | Office Properties Income Trust, 4.250%, 5/15/2024 | | | 289,939 | |
| | 1,295,000 | | | Office Properties Income Trust, 4.500%, 2/01/2025 | | | 1,310,238 | |
| | 590,000 | | | Piedmont Operating Partnership LP, 3.150%, 8/15/2030 | | | 577,979 | |
| | | | | | | | |
| | | | | | | 2,555,202 | |
| | | | | | | | |
| | | | REITs – Regional Malls — 0.1% | |
| | 390,000 | | | Simon Property Group LP, 3.500%, 9/01/2025 | | | 427,506 | |
| | | | | | | | |
| | | | REITs – Shopping Centers — 0.1% | |
| | 55,000 | | | Brixmor Operating Partnership LP, 4.050%, 7/01/2030 | | | 58,827 | |
| | 110,000 | | | Federal Realty Investment Trust, 3.500%, 6/01/2030 | | | 119,015 | |
| | | | | | | | |
| | | | | | 177,842 | |
| | | | | | | | |
| | | | |
| 49 | | | See accompanying notes to financial statements. | | |
Portfolio of Investments – as of September 30, 2020
Loomis Sayles Intermediate Duration Bond Fund – (continued)
| | | | | | | | |
Principal
Amount | | | Description | | Value (†) | |
| | | | REITs – Single Tenant — 0.1% | |
| $ | 320,000 | | | Spirit Realty LP, 3.200%, 2/15/2031 | | $ | 312,283 | |
| | | | | | | | |
| | | | Restaurants — 0.6% | |
| | 1,280,000 | | | McDonald’s Corp., MTN, 2.625%, 1/15/2022 | | | 1,317,367 | |
| | 420,000 | | | McDonald’s Corp., MTN, 3.350%, 4/01/2023 | | | 448,550 | |
| | | | | | | | |
| | | | | | | 1,765,917 | |
| | | | | | | | |
| | | | Retailers — 0.9% | |
| | 345,000 | | | AutoNation, Inc., 3.500%, 11/15/2024 | | | 366,879 | |
| | 290,000 | | | AutoNation, Inc., 4.500%, 10/01/2025 | | | 322,401 | |
| | 130,000 | | | Best Buy Co., Inc., 4.450%, 10/01/2028 | | | 154,159 | |
| | 475,000 | | | Home Depot, Inc. (The), 2.500%, 4/15/2027 | | | 516,290 | |
| | 270,000 | | | Home Depot, Inc. (The), 2.950%, 6/15/2029 | | | 304,852 | |
| | 425,000 | | | PVH Corp., 4.625%, 7/10/2025, 144A | | | 443,063 | |
| | 850,000 | | | Seven & i Holdings Co. Ltd., 3.350%, 9/17/2021, 144A | | | 871,019 | |
| | | | | | | | |
| | | | | | | 2,978,663 | |
| | | | | | | | |
| | | | Technology — 3.1% | |
| | 125,000 | | | Apple, Inc., 3.350%, 2/09/2027 | | | 142,967 | |
| | 485,000 | | | Broadcom, Inc., 4.150%, 11/15/2030 | | | 544,822 | |
| | 110,000 | | | DXC Technology Co., 4.125%, 4/15/2025 | | | 118,853 | |
| | 145,000 | | | Equinix, Inc., 1.800%, 7/15/2027 | | | 146,355 | |
| | 515,000 | | | Flex Ltd., 3.750%, 2/01/2026 | | | 562,493 | |
| | 470,000 | | | Flex Ltd., 4.875%, 6/15/2029 | | | 540,266 | |
| | 450,000 | | | Genpact Luxembourg S.a.r.l., 3.700%, 4/01/2022 | | | 460,684 | |
| | 395,000 | | | Hewlett Packard Enterprise Co., 4.650%, 10/01/2024 | | | 446,666 | |
| | 290,000 | | | Hewlett Packard Enterprise Co., 3-month LIBOR + 0.680%, 0.929%, 3/12/2021(e) | | | 290,590 | |
| | 295,000 | | | Hewlett Packard Enterprise Co., 1.450%, 4/01/2024 | | | 298,381 | |
| | 400,000 | | | HP, Inc., 3.000%, 6/17/2027 | | | 432,438 | |
| | 315,000 | | | Infor, Inc., 1.450%, 7/15/2023, 144A | | | 319,331 | |
| | 470,000 | | | International Business Machines Corp., 1.700%, 5/15/2027 | | | 485,900 | |
| | 530,000 | | | International Business Machines Corp., 2.850%, 5/13/2022 | | | 551,808 | |
| | 115,000 | | | Jabil, Inc., 3.000%, 1/15/2031 | | | 117,411 | |
| | 175,000 | | | Marvell Technology Group Ltd., 4.200%, 6/22/2023 | | | 188,939 | |
| | 460,000 | | | Microchip Technology, Inc., 2.670%, 9/01/2023, 144A | | | 476,115 | |
| | 140,000 | | | Microchip Technology, Inc., 3.922%, 6/01/2021 | | | 143,099 | |
| | 755,000 | | | Micron Technology, Inc., 2.497%, 4/24/2023 | | | 784,033 | |
| | 285,000 | | | NetApp, Inc., 1.875%, 6/22/2025 | | | 295,202 | |
| | 565,000 | | | Panasonic Corp., 2.536%, 7/19/2022, 144A | | | 583,054 | |
| | 925,000 | | | PayPal Holdings, Inc., 1.350%, 6/01/2023 | | | 944,831 | |
| | 205,000 | | | Seagate HDD Cayman, 4.875%, 3/01/2024 | | | 223,330 | |
| | 565,000 | | | ServiceNow, Inc., 1.400%, 9/01/2030 | | | 551,933 | |
| | 130,000 | | | Texas Instruments, Inc., 2.250%, 9/04/2029 | | | 139,450 | |
| | | | | | | | |
| | | | | | | 9,788,951 | |
| | | | | | | | |
| | | | Tobacco — 0.7% | |
| | 135,000 | | | Altria Group, Inc., 2.350%, 5/06/2025 | | | 142,643 | |
| | 1,060,000 | | | BAT Capital Corp., 2.259%, 3/25/2028 | | | 1,065,258 | |
| | 565,000 | | | BAT Capital Corp., 3.215%, 9/06/2026 | | | 607,217 | |
| | 460,000 | | | BAT Capital Corp., 4.700%, 4/02/2027 | | | 527,726 | |
| | | | | | | | |
| | | | | | | 2,342,844 | |
| | | | | | | | |
| | | | |
| | See accompanying notes to financial statements. | | | 50 |
Portfolio of Investments – as of September 30, 2020
Loomis Sayles Intermediate Duration Bond Fund – (continued)
| | | | | | | | |
Principal
Amount | | | Description | | Value (†) | |
| | | | Transportation Services — 0.8% | |
| $ | 450,000 | | | Element Fleet Management Corp., 3.850%, 6/15/2025, 144A | | $ | 473,633 | |
| | 175,000 | | | Penske Truck Leasing Co. LP/PTL Finance Corp., 4.000%, 7/15/2025, 144A | | | 197,143 | |
| | 695,000 | | | Penske Truck Leasing Co. LP/PTL Finance Corp., 4.125%, 8/01/2023, 144A | | | 754,930 | |
| | 135,000 | | | Penske Truck Leasing Co. LP/PTL Finance Corp., 4.450%, 1/29/2026, 144A | | | 154,527 | |
| | 255,000 | | | Ryder System, Inc., MTN, 3.750%, 6/09/2023 | | | 274,102 | |
| | 275,000 | | | Ryder System, Inc., MTN, 3.875%, 12/01/2023 | | | 299,984 | |
| | 370,000 | | | Ryder System, Inc., MTN, 4.625%, 6/01/2025 | | | 425,179 | |
| | | | | | | | |
| | | | | | | 2,579,498 | |
| | | | | | | | |
| | | | Treasuries — 19.6% | |
| | 2,970,000 | | | U.S. Treasury Note, 1.750%, 12/31/2024 | | | 3,161,310 | |
| | 15,620,000 | | | U.S. Treasury Note, 0.500%, 3/31/2025 | | | 15,801,216 | |
| | 3,130,000 | | | U.S. Treasury Note, 0.250%, 4/15/2023 | | | 3,138,436 | |
| | 14,340,000 | | | U.S. Treasury Note, 0.250%, 8/31/2025 | | | 14,328,797 | |
| | 3,935,000 | | | U.S. Treasury Note, 0.625%, 5/15/2030 | | | 3,923,318 | |
| | 2,875,000 | | | U.S. Treasury Note, 0.250%, 6/15/2023 | | | 2,882,637 | |
| | 1,510,000 | | | U.S. Treasury Note, 0.250%, 6/30/2025 | | | 1,509,469 | |
| | 7,860,000 | | | U.S. Treasury Note, 0.125%, 7/15/2023 | | | 7,854,474 | |
| | 6,445,000 | | | U.S. Treasury Note, 0.250%, 7/31/2025 | | | 6,440,468 | |
| | 3,275,000 | | | U.S. Treasury Note, 0.625%, 8/15/2030 | | | 3,258,625 | |
| | | | | | | | |
| | | | | | | 62,298,750 | |
| | | | | | | | |
| | | | Wireless — 0.2% | |
| | 200,000 | | | SK Telecom Co. Ltd., 3.750%, 4/16/2023, 144A | | | 214,168 | |
| | 535,000 | | | T-Mobile USA, Inc., 3.300%, 2/15/2051, 144A | | | 530,030 | |
| | | | | | | | |
| | | | | | | 744,198 | |
| | | | | | | | |
| | | | Wirelines — 0.4% | |
| | 720,000 | | | AT&T, Inc., 2.250%, 2/01/2032 | | | 720,143 | |
| | 345,000 | | | AT&T, Inc., 2.300%, 6/01/2027 | | | 361,316 | |
| | 205,000 | | | British Telecommunications PLC, 4.500%, 12/04/2023 | | | 226,850 | |
| | | | | | | | |
| | | | 1,308,309 | |
| | | | | | | | |
| | | | Total Bonds and Notes (Identified Cost $304,280,542) | | | 312,309,610 | |
| | | | | | | | |
| | | | | | | | |
| | Short-Term Investments — 2.2% | | | | |
| | 6,885,577 | | | Tri-Party Repurchase Agreement with Fixed Income Clearing Corporation, dated 9/30/2020 at 0.000% to be repurchased at $6,885,577 on 10/01/2020 collateralized by $6,747,400 U.S. Treasury Note, 1.125% due 2/28/2025 valued at $7,023,324 including accrued interest (Note 2 of Notes to Financial Statements) (Identified Cost $6,885,577) | | | 6,885,577 | |
| | | | | | | | |
| | | | | | | | |
| | | | Total Investments — 100.5% (Identified Cost $311,166,119) | | | 319,195,187 | |
| | | | Other assets less liabilities — (0.5)% | | | (1,680,825 | ) |
| | | | | | | | |
| | | | Net Assets — 100.0% | | $ | 317,514,362 | |
| | | | | | | | |
| | | | |
| 51 | | | See accompanying notes to financial statements. | | |
Portfolio of Investments – as of September 30, 2020
Loomis Sayles Intermediate Duration Bond Fund – (continued)
| | | | | | | | |
| | | | | | | | |
| | (†) | | | See Note 2 of Notes to Financial Statements. | |
| | (a) | | | Security (or a portion thereof) has been designated to cover the Fund’s obligations under open derivative contracts. | |
| | (b) | | | Level 3 security. Value has been determined using significant unobservable inputs. See Note 3 of Notes to Financial Statements. | |
| | (c) | | | Fair valued by the Fund’s adviser. At September 30, 2020, the value of these securities amounted to $7,685 or less than 0.1% of net assets. See Note 2 of Notes to Financial Statements. | |
| | (d) | | | Variable rate security. The interest rate adjusts periodically based on; (i) changes in current interest rates and/or prepayments on underlying pools of assets, if applicable, (ii) reference to a base lending rate plus or minus a margin, and/or (iii) reference to a base lending rate adjusted by a multiplier and/or subject to certain floors or caps. Rate as of September 30, 2020 is disclosed. | |
| | (e) | | | Variable rate security. Rate as of September 30, 2020 is disclosed. | |
| | | | | | | | |
| | 144A | | | All or a portion of these securities are exempt from registration under Rule 144A of the Securities Act of 1933. These securities may be resold in transactions exempt from registration, normally to qualified institutional buyers. At September 30, 2020, the value of Rule 144A holdings amounted to $90,197,501 or 28.4% of net assets. | |
| | | | | |
| | ABS | | | Asset-Backed Securities | |
| | ARMs | | | Adjustable Rate Mortgages | |
| | CMT | | | Constant Maturity Treasury | |
| | FHLMC | | | Federal Home Loan Mortgage Corp. | |
| | GNMA | | | Government National Mortgage Association | |
| | LIBOR | | | London Interbank Offered Rate | |
| | MTN | | | Medium Term Note | |
| | REITs | | | Real Estate Investment Trusts | |
At September 30, 2020, open long futures contracts were as follows:
| | | | | | | | | | | | | | | | | | |
| Financial Futures | | Expiration
Date | | | Contracts | | Notional
Amount | | | Value | | | Unrealized
Appreciation
(Depreciation) | |
5 Year U.S. Treasury Note | | | 12/31/2020 | | | 174 | | $ | 21,901,931 | | | $ | 21,929,438 | | | $ | 27,507 | |
| | | | | | | | | | | | | | | | | | |
At September 30, 2020, open short futures contracts were as follows:
| | | | | | | | | | | | | | | | | | |
| Financial Futures | | Expiration
Date | | | Contracts | | Notional
Amount | | | Value | | | Unrealized
Appreciation
(Depreciation) | |
Ultra 10 Year U.S. Treasury Note | | | 12/21/2020 | | | 20 | | $ | 3,184,090 | | | $ | 3,198,438 | | | $ | (14,348 | ) |
| | | | | | | | | | | | | | | | | | |
| | | | |
| | See accompanying notes to financial statements. | | | 52 |
Portfolio of Investments – as of September 30, 2020
Loomis Sayles Intermediate Duration Bond Fund – (continued)
Industry Summary at September 30, 2020
| | | | |
Treasuries | | | 19.6 | % |
Banking | | | 18.3 | |
ABS Car Loan | | | 10.5 | |
Life Insurance | | | 5.9 | |
Non-Agency Commercial Mortgage-Backed Securities | | | 5.0 | |
Electric | | | 4.4 | |
Technology | | | 3.1 | |
Automotive | | | 3.1 | |
Collateralized Mortgage Obligations | | | 2.1 | |
Food & Beverage | | | 2.0 | |
Other Investments, less than 2% each | | | 24.3 | |
Short-Term Investments | | | 2.2 | |
| | | | |
Total Investments | | | 100.5 | |
Other assets less liabilities (including futures contracts) | | | (0.5 | ) |
| | | | |
Net Assets | | | 100.0 | % |
| | | | |
| | | | |
| 53 | | | See accompanying notes to financial statements. | | |
Portfolio of Investments – as of September 30, 2020
Loomis Sayles Limited Term Government and Agency Fund
| | | | | | | | |
Principal
Amount | | | Description | | Value (†) | |
| | Bonds and Notes — 91.2% of Net Assets | | | | |
| | | | ABS Car Loan — 3.2% | |
| $ | 559,543 | | | Ally Auto Receivables Trust, Series 2018-2, Class A3, 2.920%, 11/15/2022 | | $ | 566,049 | |
| | 395,000 | | | AmeriCredit Automobile Receivables Trust, Series 2020-2, Class A3, 0.660%, 12/18/2024 | | | 396,311 | |
| | 1,550,000 | | | Avis Budget Rental Car Funding AESOP LLC, Series 2016-1A, Class A, 2.990%, 6/20/2022, 144A | | | 1,562,482 | |
| | 840,000 | | | Avis Budget Rental Car Funding AESOP LLC, Series 2019-1A, Class A, 3.450%, 3/20/2023, 144A | | | 859,578 | |
| | 1,710,000 | | | CarMax Auto Owner Trust, Series 2020-2, Class A3, 1.700%, 11/15/2024 | | | 1,751,567 | |
| | 385,963 | | | CPS Auto Receivables Trust, Series 2019-C, Class A, 2.550%, 9/15/2022, 144A | | | 387,085 | |
| | 1,955,000 | | | Credit Acceptance Auto Loan Trust, Series 2019-3A, Class A, 2.380%, 11/15/2028, 144A | | | 2,010,622 | |
| | 214,610 | | | Exeter Automobile Receivables Trust, Series 2019-3A, Class A, 2.590%, 9/15/2022, 144A | | | 215,191 | |
| | 13,405 | | | First Investors Auto Owner Trust, Series 2018-2A, Class A1, 3.230%, 12/15/2022, 144A | | | 13,420 | |
| | 765,375 | | | Flagship Credit Auto Trust, Series 2020-2, Class A, 1.490%, 7/15/2024, 144A | | | 772,439 | |
| | 1,008,566 | | | Flagship Credit Auto Trust, Series 2020-3, Class A, 0.700%, 4/15/2025, 144A | | | 1,011,310 | |
| | 595,000 | | | Ford Credit Auto Owner Trust, Series 2020-A, Class A3, 1.040%, 8/15/2024 | | | 602,379 | |
| | 1,604,317 | | | Foursight Capital Automobile Receivables Trust, Series 2018-2, Class A3, 3.640%, 5/15/2023, 144A | | | 1,622,138 | |
| | 475,000 | | | GM Financial Automobile Leasing Trust, Series 2020-2, Class A3, 0.800%, 7/20/2023 | | | 477,845 | |
| | 970,000 | | | GM Financial Consumer Automobile Receivables Trust, Series 2019-4, Class A3, 1.750%, 7/16/2024 | | | 988,187 | |
| | 500,000 | | | GM Financial Consumer Automobile Receivables Trust, Series 2020-2, Class A3, 1.490%, 12/16/2024 | | | 509,969 | |
| | 1,475,000 | | | GM Financial Consumer Automobile Receivables Trust, Series 2019-3, Class A3, 2.180%, 4/16/2024 | | | 1,507,524 | |
| | 1,170,000 | | | GM Financial Consumer Automobile Receivables Trust, Series 2020-1, Class A3, 1.840%, 9/16/2024 | | | 1,194,748 | |
| | 189,000 | | | Honda Auto Receivables Owner Trust, Series 2019-2, Class A3, 2.520%, 6/21/2023 | | | 193,739 | |
| | 410,000 | | | Honda Auto Receivables Owner Trust, Series 2020-1, Class A3, 1.610%, 4/22/2024 | | | 419,661 | |
| | 585,000 | | | Hyundai Auto Receivables Trust, Series 2020-A, Class A3, 1.410%, 11/15/2024 | | | 597,775 | |
| | 685,000 | | | NextGear Floorplan Master Owner Trust, Series 2017-2A, Class A2, 2.560%, 10/17/2022, 144A | | | 685,382 | |
| | 1,805,000 | | | Nissan Auto Receivables Owner Trust, Series 2020-A, Class A3, 1.380%, 12/16/2024 | | | 1,839,990 | |
| | 2,385,786 | | | Santander Consumer Auto Receivables Trust, Series 2020-AA, Class A, 1.370%, 10/15/2024, 144A | | | 2,408,475 | |
| | 630,000 | | | Santander Drive Auto Receivables Trust, Series 2020-2, Class A3, 0.670%, 4/15/2024 | | | 632,190 | |
| | 765,000 | | | Toyota Auto Loan Extended Note Trust, Series 2020-1A, Class A, 1.350%, 5/25/2033, 144A | | | 785,632 | |
| | | | |
| | See accompanying notes to financial statements. | | | 54 |
Portfolio of Investments – as of September 30, 2020
Loomis Sayles Limited Term Government and Agency Fund – (continued)
| | | | | | | | |
Principal
Amount | | | Description | | Value (†) | |
| | | | ABS Car Loan — continued | |
| $ | 1,610,000 | | | Toyota Auto Receivables Owner Trust, Series 2017-C, Class A4, 1.980%, 12/15/2022 | | $ | 1,625,566 | |
| | 1,255,000 | | | Toyota Auto Receivables Owner Trust, Series 2019-A, Class A3, 2.910%, 7/17/2023 | | | 1,282,743 | |
| | 450,000 | | | Toyota Auto Receivables Owner Trust, Series 2020-A, Class A3 MTN, 1.660%, 5/15/2024 | | | 459,765 | |
| | 670,000 | | | Toyota Auto Receivables Owner Trust, Series 2020-B, Class A3, 1.360%, 8/15/2024 | | | 682,591 | |
| | 875,213 | | | United Auto Credit Securitization Trust, Series 2020-1, Class A, 0.850%, 5/10/2022, 144A | | | 877,269 | |
| | 2,940,000 | | | Westlake Automobile Receivables Trust, Series 2020-2A, Class A2A, 0.930%, 2/15/2024, 144A | | | 2,951,519 | |
| | 765,000 | | | World Omni Auto Receivables Trust, Series 2019-B, Class A3, 2.590%, 7/15/2024 | | | 783,333 | |
| | | | | | | | |
| | | | | | | 32,674,474 | |
| | | | | | | | |
| | | | ABS Home Equity — 0.1% | |
| | 670,033 | | | CoreVest American Finance Trust, Series 2017-1, Class A, 2.968%, 10/15/2049, 144A | | | 683,178 | |
| | 328,976 | | | Towd Point Mortgage Trust, Series 2015-2, Class 1A12, 2.750%, 11/25/2060, 144A(a) | | | 332,395 | |
| | | | | | | | |
| | | | | | | 1,015,573 | |
| | | | | | | | |
| | | | ABS Other — 0.8% | |
| | 1,157,884 | | | Chesapeake Funding II LLC, Series 2020-1A, Class A1, 0.870%, 8/16/2032, 144A | | | 1,162,315 | |
| | 430,000 | | | CNH Equipment Trust, Series 2020-A, Class A3, 1.160%, 6/16/2025 | | | 436,287 | |
| | 508,438 | | | Diamond Resorts Owner Trust, Series 2018-1, Class A, 3.700%, 1/21/2031, 144A | | | 527,566 | |
| | 805,000 | | | Kubota Credit Owner Trust, Series 2020-1A, Class A3, 1.960%, 3/15/2024, 144A | | | 834,802 | |
| | 963,086 | | | MVW LLC, Series 2020-1A, Class A, 1.740%, 10/20/2037, 144A | | | 973,731 | |
| | 1,873,015 | | | Sierra Timeshare Receivables Funding LLC, Series 2020-2A, Class A, 1.330%, 7/20/2037, 144A | | | 1,874,348 | |
| | 726,484 | | | SoFi Consumer Loan Program Trust, Series 2018-4, Class A, 3.540%, 11/26/2027, 144A | | | 731,564 | |
| | 1,820,571 | | | Welk Resorts LLC, Series 2019-AA, Class A, 2.800%, 6/15/2038, 144A | | | 1,869,066 | |
| | | | | | | | |
| | | | | | | 8,409,679 | |
| | | | | | | | |
| | | | ABS Student Loan — 0.6% | |
| | 4,000,000 | | | Navient Private Education Refi Loan Trust, Series 2019-FA, Class A2, 2.600%, 8/15/2068, 144A | | | 4,140,011 | |
| | 1,476,968 | | | Navient Private Education Refi Loan Trust, Series 2020-DA, Class A, 1.690%, 5/15/2069, 144A | | | 1,494,764 | |
| | 50,353 | | | SoFi Professional Loan Program LLC, Series 2016-D, Class A1, 1-month LIBOR + 0.950%,
1.098%, 1/25/2039, 144A(b) | | | 50,372 | |
| | | | | | | | |
| | | | | | | 5,685,147 | |
| | | | | | | | |
| | | | |
| 55 | | | See accompanying notes to financial statements. | | |
Portfolio of Investments – as of September 30, 2020
Loomis Sayles Limited Term Government and Agency Fund – (continued)
| | | | | | | | |
Principal
Amount | | | Description | | Value (†) | |
| | | | Agency Commercial Mortgage-Backed Securities — 29.1% | |
| $ | 6,958,761 | | | Federal National Mortgage Association, Series 2014-M2, Class A2, 3.513%, 12/25/2023(a) | | $ | 7,452,181 | |
| | 1,073,383 | | | Federal National Mortgage Association, Series 2015-M17, Class FA,
1-month LIBOR + 0.930%, 1.110%, 11/25/2022(b) | | | 1,074,105 | |
| | 528,586 | | | Federal National Mortgage Association, Series 2016-M3, Class ASQ2, 2.263%, 2/25/2023 | | | 536,702 | |
| | 5,843,579 | | | Federal National Mortgage Association, Series 2020-M5, Class FA,
1-month LIBOR + 0.460%, 0.615%, 1/25/2027(b) | | | 5,885,834 | |
| | 9,996,611 | | | FHLMC Multifamily Structured Pass Through Certificates, Series KF74, Class AS, 1-month Average Compounded SOFR + 0.530%, 0.636%, 1/25/2027(b) | | | 10,014,621 | |
| | 16,776,773 | | | FHLMC Multifamily Structured Pass Through Certificates, Series KF77, Class AL, 1-month LIBOR + 0.700%, 0.857%, 2/25/2027(b) | | | 16,928,682 | |
| | 22,065,756 | | | FHLMC Multifamily Structured Pass Through Certificates, Series KF77, Class AS, 30-day Average SOFR + 0.900%, 1.006%, 2/25/2027(b) | | | 22,090,249 | |
| | 31,425,000 | | | FHLMC Multifamily Structured Pass Through Certificates, Series KF78, Class AL, 1-month LIBOR + 0.800%, 0.957%, 3/25/2030(b) | | | 31,483,105 | |
| | 31,425,000 | | | FHLMC Multifamily Structured Pass Through Certificates, Series KF78, Class AS, 30-day Average SOFR + 1.000%, 1.106%, 3/25/2030(b) | | | 31,480,654 | |
| | 7,720,000 | | | FHLMC Multifamily Structured Pass Through Certificates, Series KJ26, Class A2, 2.606%, 7/25/2027 | | | 8,374,062 | |
| | 8,515,000 | | | FHLMC Multifamily Structured Pass Through Certificates, Series KS12, Class A, 1-month LIBOR + 0.650%, 0.795%, 8/25/2029(b) | | | 8,543,467 | |
| | 13,445,000 | | | FHLMC Multifamily Structured Pass Through Certificates, Series KJ20, Class A2, 3.799%, 12/25/2025 | | | 15,173,134 | |
| | 4,072,659 | | | FHLMC Multifamily Structured Pass Through Certificates, Series K014, Class A2, 3.871%, 4/25/2021 | | | 4,100,711 | |
| | 3,762,218 | | | FHLMC Multifamily Structured Pass Through Certificates, Series K015, Class A2, 3.230%, 7/25/2021 | | | 3,825,660 | |
| | 5,946,941 | | | FHLMC Multifamily Structured Pass Through Certificates, Series K017, Class A2, 2.873%, 12/25/2021 | | | 6,095,329 | |
| | 7,900,000 | | | FHLMC Multifamily Structured Pass Through Certificates, Series K034, Class A2, 3.531%, 7/25/2023(a) | | | 8,506,754 | |
| | 7,835,000 | | | FHLMC Multifamily Structured Pass Through Certificates, Series K035, Class A2, 3.458%, 8/25/2023(a) | | | 8,437,949 | |
| | 7,500,000 | | | FHLMC Multifamily Structured Pass Through Certificates, Series K038, Class A2, 3.389%, 3/25/2024 | | | 8,164,247 | |
| | 2,580,000 | | | FHLMC Multifamily Structured Pass Through Certificates, Series K064, Class A2, 3.224%, 3/25/2027 | | | 2,945,833 | |
| | 2,003,141 | | | FHLMC Multifamily Structured Pass Through Certificates, Series K725, Class A1, 2.666%, 5/25/2023 | | | 2,062,362 | |
| | 8,000,000 | | | FHLMC Multifamily Structured Pass Through Certificates, Series KC06, Class A2, 2.541%, 8/25/2026 | | | 8,599,831 | |
| | 218,731 | | | FHLMC Multifamily Structured Pass Through Certificates, Series KF06, Class A, 1-month LIBOR + 0.330%, 0.487%, 11/25/2021(b) | | | 218,208 | |
| | 966,849 | | | FHLMC Multifamily Structured Pass Through Certificates, Series KF14, Class A, 1-month LIBOR + 0.650%, 0.807%, 1/25/2023(b) | | | 967,559 | |
| | 3,867,157 | | | FHLMC Multifamily Structured Pass Through Certificates, Series KF53, Class A, 1-month LIBOR + 0.390%, 0.547%, 10/25/2025(b) | | | 3,875,396 | |
| | | | |
| | See accompanying notes to financial statements. | | | 56 |
Portfolio of Investments – as of September 30, 2020
Loomis Sayles Limited Term Government and Agency Fund – (continued)
| | | | | | | | |
Principal
Amount | | | Description | | Value (†) | |
| | | | Agency Commercial Mortgage-Backed Securities — continued | |
| $ | 12,792,303 | | | FHLMC Multifamily Structured Pass Through Certificates, Series KF72, Class A, 1-month LIBOR + 0.500%, 0.657%, 11/25/2026(b) | | $ | 12,865,684 | |
| | 4,854,372 | | | FHLMC Multifamily Structured Pass Through Certificates, Series KF79, Class AL, 1-month LIBOR + 0.470%, 0.627%, 5/25/2030(b) | | | 4,884,756 | |
| | 4,479,420 | | | FHLMC Multifamily Structured Pass Through Certificates, Series KF79, Class AS, 30-day Average SOFR + 0.580%, 0.686%, 5/25/2030(b) | | | 4,486,091 | |
| | 8,810,000 | | | FHLMC Multifamily Structured Pass Through Certificates, Series KF80, Class AL, 1-month LIBOR + 0.440%, 0.588%, 6/25/2030(b) | | | 8,820,532 | |
| | 4,950,000 | | | FHLMC Multifamily Structured Pass Through Certificates, Series KF80, Class AS, 30-day Average SOFR + 0.510%, 0.616%, 6/25/2030(b) | | | 4,956,047 | |
| | 3,319,783 | | | FHLMC Multifamily Structured Pass Through Certificates, Series KF81, Class AL, 1-month LIBOR + 0.360%, 0.517%, 6/25/2027(b) | | | 3,336,414 | |
| | 2,489,837 | | | FHLMC Multifamily Structured Pass Through Certificates, Series KF81, Class AS, 30-day Average SOFR + 0.400%, 0.506%, 6/25/2027(b) | | | 2,491,403 | |
| | 1,890,000 | | | FHLMC Multifamily Structured Pass Through Certificates, Series KF84, Class AL, 1-month LIBOR + 0.300%, 0.457%, 7/25/2030(b) | | | 1,879,439 | |
| | 1,590,000 | | | FHLMC Multifamily Structured Pass Through Certificates, Series KF84, Class AS, 30-day Average SOFR + 0.320%, 0.405%, 7/25/2030(b) | | | 1,581,098 | |
| | 1,855,000 | | | FHLMC Multifamily Structured Pass Through Certificates, Series KF85, Class AL, 1-month LIBOR + 0.300%, 0.457%, 8/25/2030(b) | | | 1,855,000 | |
| | 4,945,000 | | | FHLMC Multifamily Structured Pass Through Certificates, Series KF85, Class AS, 30-day Average SOFR + 0.330%, 0.415%, 8/25/2030(b) | | | 4,945,000 | |
| | 130,159 | | | FHLMC Multifamily Structured Pass Through Certificates, Series KI01, Class A, 1-month LIBOR + 0.160%, 0.317%, 9/25/2022(b) | | | 130,145 | |
| | 175,887 | | | FHLMC Multifamily Structured Pass Through Certificates, Series KI02, Class A, 1-month LIBOR + 0.200%, 0.357%, 2/25/2023(b) | | | 175,842 | |
| | 10,261,000 | | | FHLMC Multifamily Structured Pass Through Certificates, Series KJ21, Class A2, 3.700%, 9/25/2026 | | | 11,541,077 | |
| | 1,010,973 | | | FHLMC Multifamily Structured Pass Through Certificates, Series KJ28, Class A1, 1.766%, 2/25/2025 | | | 1,029,284 | |
| | 2,855,000 | | | FHLMC Multifamily Structured Pass Through Certificates, Series KS14, Class AL, 1-month LIBOR + 0.340%, 0.497%, 4/25/2030(b) | | | 2,864,270 | |
| | 3,140,000 | | | FHLMC Multifamily Structured Pass Through Certificates, Series KS14, Class AS, 30-day Average SOFR + 0.370%, 0.455%, 4/25/2030(b) | | | 3,150,208 | |
| | 3,062,407 | | | FHLMC Multifamily Structured Pass Through Certificates, Series Q008, Class A, 1-month LIBOR + 0.390%, 0.547%, 10/25/2045(b) | | | 3,065,908 | |
| | 5,200,000 | | | FNMA, 3.580%, 1/01/2026 | | | 5,845,966 | |
| | 122,936 | | | Government National Mortgage Association, Series 2003-72, Class Z, 5.292%, 11/16/2045(a) | | | 135,522 | |
| | 19,150 | | | Government National Mortgage Association, Series 2003-88, Class Z, 5.443%, 3/16/2046(a) | | | 20,735 | |
| | | | | | | | |
| | | | | | | 296,897,056 | |
| | | | | | | | |
| | | | Collateralized Mortgage Obligations — 18.2% | |
| | 19,944 | | | Federal Home Loan Mortgage Corp., REMIC, Series 1500, Class FD,
7-year CMT – 0.200%, 0.250%, 5/15/2023(b)(c)(d) | | | 19,559 | |
| | 16,095 | | | Federal Home Loan Mortgage Corp., REMIC, Series 1552, Class I,
10-year CMT – 0.650%, 0.020%, 8/15/2023(b)(c)(d) | | | 15,693 | |
| | | | |
| 57 | | | See accompanying notes to financial statements. | | |
Portfolio of Investments – as of September 30, 2020
Loomis Sayles Limited Term Government and Agency Fund – (continued)
| | | | | | | | |
Principal
Amount | | | Description | | Value (†) | |
| | | | Collateralized Mortgage Obligations — continued | |
| $ | 92,119 | | | Federal Home Loan Mortgage Corp., REMIC, Series 2131, Class ZB, 6.000%, 3/15/2029(c)(d) | | $ | 101,509 | |
| | 753,592 | | | Federal Home Loan Mortgage Corp., REMIC, Series 2978, Class JG, 5.500%, 5/15/2035 | | | 853,742 | |
| | 1,174,747 | | | Federal Home Loan Mortgage Corp., REMIC, Series 3036, Class NE, 5.000%, 9/15/2035 | | | 1,356,692 | |
| | 570,126 | | | Federal Home Loan Mortgage Corp., REMIC, Series 3412, Class AY, 5.500%, 2/15/2038 | | | 641,867 | |
| | 941,301 | | | Federal Home Loan Mortgage Corp., REMIC, Series 3561, Class W, IO, 2.797%, 6/15/2048(a)(e) | | | 1,009,455 | |
| | 1,030,534 | | | Federal Home Loan Mortgage Corp., REMIC, Series 3620, Class AT, IO, 3.857%, 12/15/2036(a)(e) | | | 1,116,114 | |
| | 544,002 | | | Federal Home Loan Mortgage Corp., REMIC, Series 4212, Class FW, 2.252%, 6/15/2043(a) | | | 561,252 | |
| | 904,919 | | | Federal National Mortgage Association, REMIC, Series 2003-48, Class GH, 5.500%, 6/25/2033 | | | 1,051,638 | |
| | 4,437,605 | | | Federal National Mortgage Association, Series 2012-58, Class KF,
1-month LIBOR + 0.550%, 0.698%, 6/25/2042(b) | | | 4,487,383 | |
| | 6,697,537 | | | Federal National Mortgage Association, Series 2012-83, Class LF,
1-month LIBOR + 0.510%, 0.658%, 8/25/2042(b) | | | 6,758,217 | |
| | 9,587 | | | Federal National Mortgage Association, REMIC, Series 1992-162, Class FB, 7-year CMT – 0.050%, 0.420%, 9/25/2022(b)(c)(d) | | | 9,453 | |
| | 17,351 | | | Federal National Mortgage Association, REMIC, Series 1994-42, Class FD, 10-year CMT – 0.500%, 0.170%, 4/25/2024(b)(c)(d) | | | 16,895 | |
| | 7,338 | | | Federal National Mortgage Association, REMIC, Series 2002-W10, Class A7, 4.346%, 8/25/2042(a)(c)(d) | | | 7,854 | |
| | 261,333 | | | Federal National Mortgage Association, REMIC, Series 2005-100, Class BQ, 5.500%, 11/25/2025(c)(d) | | | 272,649 | |
| | 546,894 | | | Federal National Mortgage Association, REMIC, Series 2007-73, Class A1, 1-month LIBOR + 0.060%, 0.235%, 7/25/2037(b) | | | 537,945 | |
| | 946,258 | | | Federal National Mortgage Association, REMIC, Series 2008-86, Class LA, 3.502%, 8/25/2038(a) | | | 1,016,863 | |
| | 2,573,473 | | | Federal National Mortgage Association, REMIC, Series 2012-56, Class FK, 1-month LIBOR + 0.450%, 0.598%, 6/25/2042(b) | | | 2,589,509 | |
| | 5,412,360 | | | Federal National Mortgage Association, REMIC, Series 2013-67, Class NF, 1-month LIBOR + 1.000%, 1.148%, 7/25/2043(b) | | | 5,258,290 | |
| | 6,857,513 | | | Federal National Mortgage Association, REMIC, Series 2015-4, Class BF, 1-month LIBOR + 0.400%, 0.548%, 2/25/2045(b) | | | 6,889,255 | |
| | 12,055,310 | | | Federal National Mortgage Association, Series 2020-35, Class FA,
1-month LIBOR + 0.500%, 0.656%, 6/25/2050(b) | | | 12,166,544 | |
| | 7,004 | | | FHLMC Structured Pass Through Securities, Series T-60, Class 2A1, 3.943%, 3/25/2044(a)(c)(d) | | | 8,334 | |
| | 429,446 | | | FHLMC Structured Pass Through Securities, Series T-62, Class 1A1, 12-month MTA + 1.200%, 2.219%, 10/25/2044(b)(c)(d) | | | 439,498 | |
| | 3,663,238 | | | Government National Mortgage Association, Series 2017-H05, Class FC, 1-month LIBOR + 0.750%, 0.905%, 2/20/2067(b) | | | 3,706,098 | |
| | 4,066,430 | | | Government National Mortgage Association, Series 2019-H13, Class FT, 1-year CMT + 0.450%, 0.580%, 8/20/2069(b) | | | 4,062,624 | |
| | | | |
| | See accompanying notes to financial statements. | | | 58 |
Portfolio of Investments – as of September 30, 2020
Loomis Sayles Limited Term Government and Agency Fund – (continued)
| | | | | | | | |
Principal
Amount | | | Description | | Value (†) | |
| | | | Collateralized Mortgage Obligations — continued | |
| $ | 5,621,586 | | | Government National Mortgage Association, Series 2020-H02, Class FG, 1-month LIBOR + 0.600%, 0.755%, 1/20/2070(b) | | $ | 5,664,824 | |
| | 1,630,674 | | | Government National Mortgage Association, Series 2005-18, Class F, 1-month LIBOR + 0.200%,
0.356%, 2/20/2035(b) | | | 1,626,583 | |
| | 1,232,381 | | | Government National Mortgage Association, Series 2007-59, Class FM, 1-month LIBOR + 0.520%, 0.676%, 10/20/2037(b) | | | 1,239,382 | |
| | 513,811 | | | Government National Mortgage Association, Series 2009-H01, Class FA, 1-month LIBOR + 1.150%, 1.306%, 11/20/2059(b)(c)(d) | | | 515,600 | |
| | 1,041,679 | | | Government National Mortgage Association, Series 2010-H20, Class AF, 1-month LIBOR + 0.330%, 0.485%, 10/20/2060(b) | | | 1,039,197 | |
| | 857,993 | | | Government National Mortgage Association, Series 2010-H24, Class FA, 1-month LIBOR + 0.350%, 0.505%, 10/20/2060(b) | | | 856,183 | |
| | 482,787 | | | Government National Mortgage Association, Series 2010-H27, Class FA, 1-month LIBOR + 0.380%, 0.535%, 12/20/2060(b) | | | 482,171 | |
| | 54,039 | | | Government National Mortgage Association, Series 2011- H20, Class FA, 1-month LIBOR + 0.550%, 0.705%, 9/20/2061(b) | | | 54,203 | |
| | 684,851 | | | Government National Mortgage Association, Series 2011-H06, Class FA, 1-month LIBOR + 0.450%, 0.605%, 2/20/2061(b) | | | 685,251 | |
| | 52,458 | | | Government National Mortgage Association, Series 2011-H08, Class FA, 1-month LIBOR + 0.600%, 0.755%, 2/20/2061(b) | | | 52,642 | |
| | 82,857 | | | Government National Mortgage Association, Series 2011-H23, Class HA, 3.000%, 12/20/2061(c)(d) | | | 84,624 | |
| | 38,129 | | | Government National Mortgage Association, Series 2012-124, Class HT, 6.500%, 7/20/2032(a)(c)(d) | | | 37,363 | |
| | 3,521,829 | | | Government National Mortgage Association, Series 2012-18, Class FM, 1-month LIBOR + 0.250%, 0.406%, 9/20/2038(b) | | | 3,519,768 | |
| | 1,901 | | | Government National Mortgage Association, Series 2012-H15, Class FA, 1-month LIBOR + 0.450%, 0.605%, 5/20/2062(b)(c)(d) | | | 1,883 | |
| | 659,506 | | | Government National Mortgage Association, Series 2012-H18, Class NA, 1-month LIBOR + 0.520%, 0.675%, 8/20/2062(b) | | | 660,908 | |
| | 1,925,883 | | | Government National Mortgage Association, Series 2012-H20, Class PT, 1.011%, 7/20/2062(a) | | | 1,923,599 | |
| | 141,595 | | | Government National Mortgage Association, Series 2012-H29, Class HF, 1-month LIBOR + 0.500%, 0.655%, 10/20/2062(b)(c)(d) | | | 140,959 | |
| | 47,800 | | | Government National Mortgage Association, Series 2013-H02, Class GF, 1-month LIBOR + 0.500%, 0.655%, 12/20/2062(b)(c)(d) | | | 47,408 | |
| | 2,727,952 | | | Government National Mortgage Association, Series 2013-H08, Class FA, 1-month LIBOR + 0.350%, 0.505%, 3/20/2063(b) | | | 2,723,992 | |
| | 1,826,736 | | | Government National Mortgage Association, Series 2013-H10, Class FA, 1-month LIBOR + 0.400%, 0.555%, 3/20/2063(b) | | | 1,825,645 | |
| | 310,859 | | | Government National Mortgage Association, Series 2013-H14, Class FG, 1-month LIBOR + 0.470%, 0.625%, 5/20/2063(b) | | | 311,155 | |
| | 6,772,653 | | | Government National Mortgage Association, Series 2013-H22, Class FT, 1-year CMT + 0.650%,
0.780%, 4/20/2063(b) | | | 6,746,653 | |
| | 4,597,451 | | | Government National Mortgage Association, Series 2014-H14, Class FA, 1-month LIBOR + 0.500%, 0.664%, 7/20/2064(b) | | | 4,602,343 | |
| | 3,409,553 | | | Government National Mortgage Association, Series 2014-H15, Class FA, 1-month LIBOR + 0.500%, 0.655%, 7/20/2064(b) | | | 3,418,735 | |
| | | | |
| 59 | | | See accompanying notes to financial statements. | | |
Portfolio of Investments – as of September 30, 2020
Loomis Sayles Limited Term Government and Agency Fund – (continued)
| | | | | | | | |
Principal
Amount | | | Description | | Value (†) | |
| | | | Collateralized Mortgage Obligations — continued | |
| $ | 2,805,598 | | | Government National Mortgage Association, Series 2015-H04, Class FL, 1-month LIBOR + 0.470%, 0.625%, 2/20/2065(b) | | $ | 2,805,826 | |
| | 21,457 | | | Government National Mortgage Association, Series 2015-H05, Class FA, 1-month LIBOR + 0.300%, 0.455%, 4/20/2061(b)(c)(d) | | | 21,304 | |
| | 107,858 | | | Government National Mortgage Association, Series 2015-H09, Class HA, 1.750%, 3/20/2065(c)(d) | | | 107,971 | |
| | 311,842 | | | Government National Mortgage Association, Series 2015-H10, Class FC, 1-month LIBOR + 0.480%, 0.635%, 4/20/2065(b) | | | 312,448 | |
| | 4,834,421 | | | Government National Mortgage Association, Series 2015-H10, Class JA, 2.250%, 4/20/2065 | | | 4,934,272 | |
| | 20,784 | | | Government National Mortgage Association, Series 2015-H11, Class FA, 1-month LIBOR + 0.250%, 0.405%, 4/20/2065(b)(c)(d) | | | 20,644 | |
| | 3,625,303 | | | Government National Mortgage Association, Series 2015-H12, Class FL, 1-month LIBOR + 0.230%, 0.385%, 5/20/2065(b) | | | 3,608,824 | |
| | 258,605 | | | Government National Mortgage Association, Series 2015-H19, Class FH, 1-month LIBOR + 0.300%, 0.455%, 7/20/2065(b)(c)(d) | | | 256,951 | |
| | 27,285 | | | Government National Mortgage Association, Series 2015-H29, Class FA, 1-month LIBOR + 0.700%, 0.855%, 10/20/2065(b)(c)(d) | | | 27,247 | |
| | 7,191 | | | Government National Mortgage Association, Series 2015-H30, Class FA, 1-month LIBOR + 0.680%, 0.835%, 8/20/2061(b)(c)(d) | | | 7,179 | |
| | 5,129,863 | | | Government National Mortgage Association, Series 2016-H06, Class FC, 1-month LIBOR + 0.920%, 1.075%, 2/20/2066(b) | | | 5,210,828 | |
| | 340,094 | | | Government National Mortgage Association, Series 2016-H10, Class FJ, 1-month LIBOR + 0.600%, 0.755%, 4/20/2066(b) | | | 340,300 | |
| | 343,034 | | | Government National Mortgage Association, Series 2016-H19, Class FJ, 1-month LIBOR + 0.400%, 0.555%, 9/20/2063(b)(c)(d) | | | 341,221 | |
| | 1,599,005 | | | Government National Mortgage Association, Series 2016-H20, Class FB, 1-month LIBOR + 0.550%, 0.705%, 9/20/2066(b) | | | 1,604,907 | |
| | 233,301 | | | Government National Mortgage Association, Series 2017-H24, Class FJ, 1-month LIBOR + 0.250%, 0.405%, 10/20/2067(b) | | | 233,212 | |
| | 279,501 | | | Government National Mortgage Association, Series 2018-H02, Class FJ, 1-month LIBOR + 0.200%, 0.355%, 10/20/2064(b) | | | 279,108 | |
| | 7,239,128 | | | Government National Mortgage Association, Series 2018-H11, Class FJ, 12-month LIBOR + 0.080%, 0.718%, 6/20/2068(b) | | | 7,171,776 | |
| | 163,283 | | | Government National Mortgage Association, Series 2018-H14, Class FG, 1-month LIBOR + 0.350%, 0.505%, 9/20/2068(b) | | | 163,007 | |
| | 12,199,960 | | | Government National Mortgage Association, Series 2019-H04, Class NA, 3.500%, 9/20/2068 | | | 13,316,787 | |
| | 3,809,213 | | | Government National Mortgage Association, Series 2020-30, Class F, 1-month LIBOR + 0.400%,
0.557%, 4/20/2048(b) | | | 3,813,575 | |
| | 6,925,225 | | | Government National Mortgage Association, Series 2020-53, Class NF, 1-month LIBOR + 0.450%, 0.607%, 5/20/2046(b) | | | 6,916,097 | |
| | 5,952,533 | | | Government National Mortgage Association, Series 2020-H04, Class FP, 1-month LIBOR + 0.500%, 0.655%, 6/20/2069(b) | | | 5,971,167 | |
| | 12,684,567 | | | Government National Mortgage Association, Series 2020-H07, Class FL, 1-month LIBOR + 0.650%, 0.806%, 4/20/2070(b) | | | 12,728,532 | |
| | 14,164,359 | | | Government National Mortgage Association, Series 2020-H10, Class FD, 1-month LIBOR + 0.400%, 0.556%, 5/20/2070(b) | | | 14,006,653 | |
| | | | |
| | See accompanying notes to financial statements. | | | 60 |
Portfolio of Investments – as of September 30, 2020
Loomis Sayles Limited Term Government and Agency Fund – (continued)
| | | | | | | | |
Principal
Amount | | | Description | | Value (†) | |
| | | | Collateralized Mortgage Obligations — continued | |
| $ | 6,538,268 | | | Government National Mortgage Association, Series 2020-HO1, Class FT, 1-year CMT + 0.500%,
2.036%, 1/20/2070(b) | | $ | 6,537,640 | |
| | 168,737 | | | NCUA Guaranteed Notes, Series 2010-A1, Class A, 1-month LIBOR + 0.350%, 0.506%, 12/07/2020(b) | | | 168,761 | |
| | 193,482 | | | NCUA Guaranteed Notes, Series 2010-R1, Class 1A, 1-month LIBOR + 0.450%, 0.605%, 10/07/2020(b) | | | 193,462 | |
| | 727,213 | | | NCUA Guaranteed Notes, Series 2010-R3, Class 1A, 1-month LIBOR + 0.560%, 0.715%, 12/08/2020(b) | | | 727,387 | |
| | 48,554 | | | NCUA Guaranteed Notes, Series 2010-R3, Class 2A, 1-month LIBOR + 0.560%, 0.715%, 12/08/2020(b) | | | 48,554 | |
| | | | | | | | |
| | | | | | | 185,091,643 | |
| | | | | | | | |
| | | | Hybrid ARMs — 3.9% | |
| | 715,398 | | | FHLMC, 12-month LIBOR + 1.761%, 2.536%, 9/01/2035(b) | | | 750,129 | |
| | 569,023 | | | FHLMC, 1-year CMT + 2.220%, 2.595%, 7/01/2033(b) | | | 573,044 | |
| | 148,887 | | | FHLMC, 12-month LIBOR + 1.645%, 2.692%, 11/01/2038(b) | | | 150,275 | |
| | 3,668,989 | | | FHLMC, 12-month LIBOR + 1.841%, 2.786%, 1/01/2046(b) | | | 3,789,881 | |
| | 432,085 | | | FHLMC, 1-year CMT + 2.247%, 2.840%, 9/01/2038(b) | | | 455,075 | |
| | 343,425 | | | FHLMC, 6-month LIBOR + 1.685%, 3.136%, 6/01/2037(b) | | | 344,910 | |
| | 465,175 | | | FHLMC, 1-year CMT + 2.165%, 3.334%, 4/01/2036(b) | | | 467,178 | |
| | 2,104,107 | | | FHLMC, 1-year CMT + 2.248%, 3.392%, 3/01/2037(b) | | | 2,219,486 | |
| | 224,138 | | | FHLMC, 12-month LIBOR + 1.932%, 3.520%, 12/01/2034(b) | | | 226,822 | |
| | 177,653 | | | FHLMC, 12-month LIBOR + 1.833%, 3.523%, 11/01/2038(b) | | | 181,109 | |
| | 213,205 | | | FHLMC, 12-month LIBOR + 1.767%, 3.559%, 3/01/2038(b) | | | 216,438 | |
| | 58,020 | | | FHLMC, 12-month LIBOR + 1.744%, 3.593%, 12/01/2037(b) | | | 58,429 | |
| | 138,580 | | | FHLMC, 1-year CMT + 2.209%, 3.640%, 9/01/2038(b) | | | 139,360 | |
| | 1,115,800 | | | FHLMC, 12-month LIBOR + 1.894%, 3.640%, 9/01/2041(b) | | | 1,168,801 | |
| | 212,880 | | | FHLMC, 1-year CMT + 1.942%, 3.648%, 9/01/2038(b) | | | 213,762 | |
| | 500,188 | | | FHLMC, 1-year CMT + 2.245%, 3.732%, 3/01/2036(b) | | | 529,999 | |
| | 806,361 | | | FHLMC, 12-month LIBOR + 1.738%, 3.738%, 4/01/2037(b) | | | 817,407 | |
| | 198,870 | | | FHLMC, 1-year CMT + 2.250%, 3.759%, 2/01/2035(b) | | | 210,448 | |
| | 210,298 | | | FHLMC, 12-month LIBOR + 1.724%, 3.784%, 4/01/2037(b) | | | 220,945 | |
| | 1,136,541 | | | FHLMC, 1-year CMT + 2.254%, 3.791%, 2/01/2036(b) | | | 1,197,868 | |
| | 803,164 | | | FHLMC, 1-year CMT + 2.286%, 4.023%, 2/01/2036(b) | | | 848,107 | |
| | 154,452 | | | FHLMC, 12-month LIBOR + 2.180%, 4.180%, 3/01/2037(b) | | | 156,176 | |
| | 61,920 | | | FNMA, 6-month LIBOR + 1.558%, 1.963%, 2/01/2037(b) | | | 63,802 | |
| | 910,061 | | | FNMA, 12-month LIBOR + 1.595%, 2.313%, 9/01/2037(b) | | | 948,446 | |
| | 171,078 | | | FNMA, 12-month LIBOR + 1.560%, 2.340%, 8/01/2035(b) | | | 172,072 | |
| | 501,459 | | | FNMA, 12-month LIBOR + 1.703%, 2.453%, 8/01/2034(b) | | | 508,485 | |
| | 141,105 | | | FNMA, 1-year CMT + 2.145%, 2.480%, 9/01/2036(b) | | | 144,321 | |
| | 354,833 | | | FNMA, 1-year CMT + 2.223%, 2.499%, 8/01/2035(b) | | | 356,426 | |
| | 356,547 | | | FNMA, 12-month LIBOR + 1.657%, 2.537%, 8/01/2038(b) | | | 360,095 | |
| | 540,438 | | | FNMA, 6-month LIBOR + 1.540%, 2.542%, 7/01/2035(b) | | | 559,156 | |
| | 400,790 | | | FNMA, 12-month LIBOR + 1.637%, 2.619%, 7/01/2038(b) | | | 408,491 | |
| | 1,004,037 | | | FNMA, 1-year CMT + 2.273%, 2.648%, 6/01/2037(b) | | | 1,059,498 | |
| | 513,511 | | | FNMA, 1-year CMT + 2.287%, 2.676%, 6/01/2033(b) | | | 514,662 | |
| | 112,014 | | | FNMA, 12-month LIBOR + 1.801%, 2.796%, 7/01/2041(b) | | | 112,989 | |
| | 62,447 | | | FNMA, 1-year CMT + 2.440%, 2.815%, 8/01/2033(b) | | | 62,901 | |
| | | | |
| 61 | | | See accompanying notes to financial statements. | | |
Portfolio of Investments – as of September 30, 2020
Loomis Sayles Limited Term Government and Agency Fund – (continued)
| | | | | | | | |
Principal
Amount | | | Description | | Value (†) | |
| | | | Hybrid ARMs — continued | |
| $ | 1,349,310 | | | FNMA, 1-year CMT + 2.177%, 2.974%, 12/01/2040(b) | | $ | 1,416,773 | |
| | 1,293,309 | | | FNMA, 1-year CMT + 2.173%, 3.019%, 11/01/2033(b) | | | 1,355,997 | |
| | 2,635,243 | | | FNMA, 1-year CMT + 2.201%, 3.021%, 10/01/2034(b) | | | 2,768,339 | |
| | 236,367 | | | FNMA, 12-month LIBOR + 1.679%, 3.059%, 11/01/2036(b) | | | 247,448 | |
| | 1,281,545 | | | FNMA, 12-month LIBOR + 1.586%, 3.067%, 4/01/2037(b) | | | 1,336,513 | |
| | 819,982 | | | FNMA, 12-month LIBOR + 1.597%, 3.128%, 7/01/2035(b) | | | 853,543 | |
| | 508,293 | | | FNMA, 1-year CMT + 2.160%, 3.180%, 6/01/2036(b) | | | 535,159 | |
| | 195,211 | | | FNMA, 1-year CMT + 2.185%, 3.307%, 12/01/2034(b) | | | 195,428 | |
| | 281,745 | | | FNMA, 1-year CMT + 2.137%, 3.328%, 9/01/2034(b) | | | 295,668 | |
| | 311,171 | | | FNMA, 12-month LIBOR + 2.473%, 3.348%, 6/01/2035(b) | | | 315,231 | |
| | 978,275 | | | FNMA, 12-month LIBOR + 1.732%, 3.362%, 9/01/2037(b) | | | 1,030,090 | |
| | 679,207 | | | FNMA, 6-month LIBOR + 2.169%, 3.437%, 7/01/2037(b) | | | 720,284 | |
| | 255,520 | | | FNMA, 12-month LIBOR + 1.650%, 3.502%, 10/01/2033(b) | | | 266,296 | |
| | 388,526 | | | FNMA, 12-month LIBOR + 1.609%, 3.572%, 4/01/2037(b) | | | 393,147 | |
| | 232,503 | | | FNMA, 1-year CMT + 2.287%, 3.574%, 10/01/2033(b) | | | 234,120 | |
| | 349,703 | | | FNMA, 1-year CMT + 2.213%, 3.594%, 4/01/2034(b) | | | 354,733 | |
| | 1,550,919 | | | FNMA, 1-year CMT + 2.224%, 3.639%, 4/01/2034(b) | | | 1,625,498 | |
| | 183,540 | | | FNMA, 1-year CMT + 2.500%, 3.681%, 8/01/2036(b) | | | 195,854 | |
| | 163,634 | | | FNMA, 1-year CMT + 2.188%, 3.688%, 4/01/2033(b) | | | 164,484 | |
| | 149,448 | | | FNMA, 12-month LIBOR + 1.731%, 3.697%, 11/01/2035(b) | | | 156,612 | |
| | 1,234,974 | | | FNMA, 12-month LIBOR + 1.800%, 3.740%, 10/01/2041(b) | | | 1,289,157 | |
| | 463,327 | | | FNMA, 12-month LIBOR + 1.765%, 3.765%, 2/01/2037(b) | | | 465,916 | |
| | 46,319 | | | FNMA, 12-month LIBOR + 1.754%, 3.795%, 1/01/2037(b) | | | 47,021 | |
| | 163,166 | | | FNMA, 12-month LIBOR + 1.800%, 3.800%, 3/01/2034(b) | | | 171,786 | |
| | 1,072,143 | | | FNMA, 12-month LIBOR + 1.797%, 3.800%, 3/01/2037(b) | | | 1,132,677 | |
| | 351,756 | | | FNMA, 12-month LIBOR + 1.800%, 3.800%, 12/01/2041(b) | | | 353,771 | |
| | 422,569 | | | FNMA, 1-year CMT + 2.185%, 3.810%, 1/01/2036(b) | | | 439,241 | |
| | 1,003,998 | | | FNMA, 12-month LIBOR + 1.820%, 3.820%, 2/01/2047(b) | | | 1,069,449 | |
| | 200,400 | | | FNMA, 1-year CMT + 2.501%, 4.191%, 5/01/2035(b) | | | 211,791 | |
| | | | | | | | |
| | | | | | | 39,849,019 | |
| | | | | | | | |
| | | | Mortgage Related — 2.6% | |
| | 39,774 | | | FHLMC, 3.000%, 10/01/2026 | | | 41,820 | |
| | 297,896 | | | FHLMC, 4.000%, with various maturities from 2024 to 2042(f) | | | 324,396 | |
| | 126,438 | | | FHLMC, 4.500%, with various maturities from 2025 to 2034(f) | | | 133,490 | |
| | 37,375 | | | FHLMC, 5.500%, 10/01/2023 | | | 38,813 | |
| | 4,660 | | | FHLMC, COFI + 1.250%, 5.923%, 10/01/2020(b) | | | 4,662 | |
| | 11,369 | | | FHLMC, COFI + 1.250%, 5.955%, 11/01/2020(b) | | | 11,362 | |
| | 185,155 | | | FHLMC, 6.500%, 12/01/2034 | | | 214,565 | |
| | 96 | | | FHLMC, 7.500%, 6/01/2026 | | | 104 | |
| | 107,675 | | | FNMA, 3.000%, 3/01/2042 | | | 117,285 | |
| | 1,010,937 | | | FNMA, 5.000%, with various maturities from 2037 to 2038(f) | | | 1,161,537 | |
| | 423,864 | | | FNMA, 5.500%, with various maturities from 2023 to 2033(f) | | | 467,668 | |
| | 244,414 | | | FNMA, 6.000%, with various maturities from 2021 to 2022(f) | | | 252,716 | |
| | 157,283 | | | FNMA, 6.500%, with various maturities from 2032 to 2037(f) | | | 177,095 | |
| | 52,848 | | | FNMA, 7.500%, with various maturities from 2030 to 2032(f) | | | 58,542 | |
| | 2,343,330 | | | GNMA, 1-month LIBOR + 1.741%, 1.878%, 2/20/2061(b) | | | 2,437,572 | |
| | 1,836,235 | | | GNMA, 1-month LIBOR + 1.890%, 2.068%, 2/20/2063(b) | | | 1,908,719 | |
| | | | |
| | See accompanying notes to financial statements. | | | 62 |
Portfolio of Investments – as of September 30, 2020
Loomis Sayles Limited Term Government and Agency Fund – (continued)
| | | | | | | | |
Principal
Amount | | | Description | | Value (†) | |
| | | | Mortgage Related — continued | |
| $ | 2,200,215 | | | GNMA, 1-month LIBOR + 2.158%, 2.339%, 3/20/2063(b) | | $ | 2,281,846 | |
| | 748,273 | | | GNMA, 1-month LIBOR + 2.247%, 2.426%, 6/20/2065(b) | | | 805,903 | |
| | 747,210 | | | GNMA, 1-month LIBOR + 2.279%, 2.457%, 5/20/2065(b) | | | 804,010 | |
| | 1,073,504 | | | GNMA, 1-month LIBOR + 2.353%, 2.533%, 2/20/2063(b) | | | 1,123,460 | |
| | 256,549 | | | GNMA, 3.916%, 3/20/2063(a) | | | 259,587 | |
| | 185,713 | | | GNMA, 4.005%, 12/20/2062(a) | | | 189,728 | |
| | 148,172 | | | GNMA, 4.071%, 2/20/2063(a) | | | 149,861 | |
| | 769,072 | | | GNMA, 4.085%, 6/20/2063(a) | | | 789,489 | |
| | 236,831 | | | GNMA, 4.111%, 11/20/2062(a) | | | 239,946 | |
| | 23,853 | | | GNMA, 4.140%, 12/20/2061(a) | | | 26,173 | |
| | 82,287 | | | GNMA, 4.284%, 4/20/2063(a) | | | 87,966 | |
| | 13,372 | | | GNMA, 4.326%, 8/20/2061(a) | | | 14,939 | |
| | 9,736 | | | GNMA, 4.411%, 8/20/2062(a) | | | 10,373 | |
| | 3,253,361 | | | GNMA, 4.475%, 10/20/2065(a) | | | 3,667,269 | |
| | 373,702 | | | GNMA, 4.578%, 7/20/2063(a) | | | 411,310 | |
| | 1,730,142 | | | GNMA, 4.599%, 2/20/2066(a) | | | 1,910,216 | |
| | 2,030,139 | | | GNMA, 4.624%, 3/20/2064(a) | | | 2,209,901 | |
| | 25,000 | | | GNMA, 4.630%, with various maturities from 2061 to 2062(a)(f) | | | 25,636 | |
| | 305,564 | | | GNMA, 4.637%, 1/20/2064(a) | | | 335,841 | |
| | 13,825 | | | GNMA, 4.644%, 2/20/2062(a) | | | 14,498 | |
| | 14,317 | | | GNMA, 4.652%, 4/20/2061(a) | | | 14,709 | |
| | 1,708,734 | | | GNMA, 4.670%, 11/20/2063(a) | | | 1,871,960 | |
| | 1,236,809 | | | GNMA, 4.684%, 5/20/2064(a) | | | 1,350,194 | |
| | 64,803 | | | GNMA, 4.700%, with various maturities from 2061 to 2062(a)(f) | | | 68,673 | |
| | 12,330 | | | GNMA, 4.720%, 3/20/2061(a) | | | 12,374 | |
| | 9,327 | | | GNMA, 6.000%, 12/15/2031 | | | 10,901 | |
| | 36,503 | | | GNMA, 6.500%, 5/15/2031 | | | 43,345 | |
| | 44,045 | | | GNMA, 7.000%, 10/15/2028 | | | 49,608 | |
| | | | | | | | |
| | | | | | | 26,130,062 | |
| | | | | | | | |
| | | | Non-Agency Commercial Mortgage-Backed Securities — 1.6% | |
| | 1,595,000 | | | BANK, Series 2020-BN25, Class A5, 2.649%, 1/15/2063 | | | 1,749,338 | |
| | 1,310,000 | | | Commercial Mortgage Pass Through Certificates, Series 2012-LTRT, Class A2, 3.400%, 10/05/2030, 144A | | | 1,271,135 | |
| | 1,488,000 | | | Commercial Mortgage Pass Through Certificates, Series 2014-UBS2, Class A5, 3.961%, 3/10/2047 | | | 1,624,743 | |
| | 4,282,000 | | | Commercial Mortgage Pass Through Certificates, Series 2016-DC2, Class ASB, 3.550%, 2/10/2049 | | | 4,582,111 | |
| | 1,270,480 | | | DBUBS Mortgage Trust, Series 2011-LC2A, Class A4, 4.537%, 7/10/2044, 144A | | | 1,285,398 | |
| | 2,600,000 | | | Hudsons Bay Simon JV Trust, Series 2015-HB7, Class A7,
3.914%, 8/05/2034, 144A | | | 2,301,145 | |
| | 1,040,000 | | | Morgan Stanley Bank of America Merrill Lynch Trust, Series 2013-C8, Class A4, 3.134%, 12/15/2048 | | | 1,087,116 | |
| | 3,279,464 | | | Starwood Retail Property Trust, Series 2014-STAR, Class A, 1-month LIBOR + 1.470%,
1.622%, 11/15/2027, 144A(b) | | | 2,346,202 | |
| | | | | | | | |
| | | | 16,247,188 | |
| | | | | | | | |
| | | | |
| 63 | | | See accompanying notes to financial statements. | | |
Portfolio of Investments – as of September 30, 2020
Loomis Sayles Limited Term Government and Agency Fund – (continued)
| | | | | | | | |
Principal
Amount | | | Description | | Value (†) | |
| | | | Treasuries — 31.1% | |
| $ | 14,485,000 | | | U.S. Treasury Note, 0.125%, 5/31/2022 | | $ | 14,483,868 | |
| | 26,535,000 | | | U.S. Treasury Note, 0.125%, 9/30/2022 | | | 26,533,964 | |
| | 18,650,000 | | | U.S. Treasury Note, 0.250%, 6/30/2025 | | | 18,643,443 | |
| | 12,500,000 | | | U.S. Treasury Note, 0.250%, 9/30/2025 | | | 12,486,328 | |
| | 47,425,000 | | | U.S. Treasury Note, 0.375%, 4/30/2025 | | | 47,704,734 | |
| | 4,600,000 | | | U.S. Treasury Note, 0.500%, 3/31/2025 | | | 4,653,367 | |
| | 20,945,000 | | | U.S. Treasury Note, 1.250%, 7/31/2023 | | | 21,593,804 | |
| | 19,720,000 | | | U.S. Treasury Note, 1.625%, 8/31/2022 | | | 20,284,639 | |
| | 8,460,000 | | | U.S. Treasury Note, 1.750%, 6/30/2022 | | | 8,699,590 | |
| | 12,480,000 | | | U.S. Treasury Note, 1.750%, 7/15/2022 | | | 12,842,700 | |
| | 12,605,000 | | | U.S. Treasury Note, 1.750%, 9/30/2022 | | | 13,012,693 | |
| | 1,755,000 | | | U.S. Treasury Note, 1.875%, 4/30/2022 | | | 1,803,400 | |
| | 11,470,000 | | | U.S. Treasury Note, 2.000%, 2/15/2025 | | | 12,348,620 | |
| | 6,000,000 | | | U.S. Treasury Note, 2.125%, 5/15/2022 | | | 6,194,531 | |
| | 6,915,000 | | | U.S. Treasury Note, 2.250%, 1/31/2024 | | | 7,391,757 | |
| | 3,340,000 | | | U.S. Treasury Note, 2.250%, 10/31/2024 | | | 3,616,202 | |
| | 67,520,000 | | | U.S. Treasury Note, 2.875%, 10/31/2023 | | | 73,137,875 | |
| | 9,955,000 | | | U.S. Treasury Note, 2.875%, 7/31/2025 | | | 11,201,708 | |
| | | | | | | | |
| | | | 316,633,223 | |
| | | | | | | | |
| | | | Total Bonds and Notes (Identified Cost $912,317,179) | | | 928,633,064 | |
| | | | | | | | |
| | | | | | | | |
| | Short-Term Investments — 6.3% | | | | |
| | 11,570,000 | | | Federal Home Loan Bank Discount Notes, 0.020%, 10/07/2020(g) | | | 11,569,884 | |
| | 7,210,647 | | | Tri-Party Repurchase Agreement with Fixed Income Clearing Corporation, dated 9/30/2020 at 0.000% to be repurchased at $7,210,647 on 10/01/2020 collateralized by $7,355,500 U.S. Treasury Note, 0.250% due 9/30/2025 valued at $7,354,926 including accrued interest (Note 2 of Notes to Financial Statements) | | | 7,210,647 | |
| | 4,315,000 | | | U.S. Treasury Bills, 0.065%, 10/01/2020(g) | | | 4,315,000 | |
| | 6,900,000 | | | U.S. Treasury Bills, 0.070%, 10/08/2020(g) | | | 6,899,914 | |
| | 12,015,000 | | | U.S. Treasury Bills, 0.080%, 12/10/2020(g) | | | 12,012,781 | |
| | 12,055,000 | | | U.S. Treasury Bills, 0.085%-0.105%, 11/05/2020(g)(h) | | | 12,053,975 | |
| | 10,030,000 | | | U.S. Treasury Bills, 0.098%, 10/29/2020(g) | | | 10,029,279 | |
| | | | | | | | |
| | | | Total Short-Term Investments (Identified Cost $64,091,772) | | | 64,091,480 | |
| | | | | | | | |
| | | | | | | | |
| | | | Total Investments — 97.5% (Identified Cost $976,408,951) | | | 992,724,544 | |
| | | | Other assets less liabilities — 2.5% | | | 25,771,220 | |
| | | | | | | | |
| | | | Net Assets — 100.0% | | $ | 1,018,495,764 | |
| | | | | | | | |
| | | | | | | | |
| | | | |
| | See accompanying notes to financial statements. | | | 64 |
Portfolio of Investments – as of September 30, 2020
Loomis Sayles Limited Term Government and Agency Fund – (continued)
| | | | | | | | |
| | | | | | | | |
| | (†) | | | See Note 2 of Notes to Financial Statements. | | | | |
| | (a) | | | Variable rate security. The interest rate adjusts periodically based on; (i) changes in current interest rates and/or prepayments on underlying pools of assets, if applicable, (ii) reference to a base lending rate plus or minus a margin, and/or (iii) reference to a base lending rate adjusted by a multiplier and/or subject to certain floors or caps. Rate as of September 30, 2020 is disclosed. | |
| | (b) | | | Variable rate security. Rate as of September 30, 2020 is disclosed. | | | | |
| | (c) | | | Fair valued by the Fund's adviser. At September 30, 2020, the value of these securities amounted to $2,501,798 or 0.2% of net assets. See Note 2 of Notes to Financial Statements. | |
| | (d) | | | Level 3 security. Value has been determined using significant unobservable inputs. See Note 3 of Notes to Financial Statements. | |
| | (e) | | | Interest only security. Security represents right to receive monthly interest payments on an underlying pool of mortgages. Principal shown is the outstanding par amount of the pool held as of the end of the period. | |
| | (f) | | | The Fund’s investment in mortgage related securities of Federal Home Loan Mortgage Corporation, Federal National Mortgage Association and Government National Mortgage Association are interests in separate pools of mortgages. All separate investments in securities of each issuer which have the same coupon rate have been aggregated for the purpose of presentation in the Portfolio of Investments. | |
| | (g) | | | Interest rate represents discount rate at time of purchase; not a coupon rate. | | | | |
| | (h) | | | The Fund's investment in U.S. Government/Agency securities is comprised of various lots with differing discount rates. These separate investments, which have the same maturity date, have been aggregated for the purpose of presentation in the Portfolio of Investments. | |
| | | | | | | | |
| | 144A | | | All or a portion of these securities are exempt from registration under Rule 144A of the Securities Act of 1933. These securities may be resold in transactions exempt from registration, normally to qualified institutional buyers. At September 30, 2020, the value of Rule 144A holdings amounted to $38,040,534 or 3.7% of net assets. | |
| | ABS | | | Asset-Backed Securities | | | | |
| | ARMs | | | Adjustable Rate Mortgages | | | | |
| | CMT | | | Constant Maturity Treasury | | | | |
| | COFI | | | Cost Of Funds Index | | | | |
| | FHLMC | | | Federal Home Loan Mortgage Corp. | | | | |
| | FNMA | | | Federal National Mortgage Association | | | | |
| | GNMA | | | Government National Mortgage Association | | | | |
| | LIBOR | | | London Interbank Offered Rate | | | | |
| | MTA | | | Monthly Treasury Average Interest | | | | |
| | MTN | | | Medium Term Note | | | | |
| | REMIC | | | Real Estate Mortgage Investment Conduit | | | | |
| | SOFR | | | Secured Overnight Financing Rate | | | | |
| | | | |
| 65 | | | See accompanying notes to financial statements. | | |
Portfolio of Investments – as of September 30, 2020
Loomis Sayles Limited Term Government and Agency Fund – (continued)
Industry Summary at September 30, 2020
| | | | |
Treasuries | | | 31.1 | % |
Agency Commercial Mortgage-Backed Securities | | | 29.1 | |
Collateralized Mortgage Obligations | | | 18.2 | |
Hybrid ARMs | | | 3.9 | |
ABS Car Loan | | | 3.2 | |
Mortgage Related | | | 2.6 | |
Other Investments, less than 2% each | | | 3.1 | |
Short-Term Investments | | | 6.3 | |
| | | | |
Total Investments | | | 97.5 | |
Other assets less liabilities | | | 2.5 | |
| | | | |
Net Assets | | | 100.0 | % |
| | | | |
| | | | |
| | See accompanying notes to financial statements. | | | 66 |
Statements of Assets and Liabilities
September 30, 2020
| | | | | | | | | | | | |
| | | Credit Income
Fund | | | Intermediate
Duration Bond
Fund | | | Limited Term
Government
and Agency
Fund | |
ASSETS | |
Investments at cost | | $ | 23,797,082 | | | $ | 311,166,119 | | | $ | 976,408,951 | |
Net unrealized appreciation (depreciation) | | | (85,094 | ) | | | 8,029,068 | | | | 16,315,593 | |
| | | | | | | | | | | | |
Investments at value | | | 23,711,988 | | | | 319,195,187 | | | | 992,724,544 | |
Cash | | | 24,894,158 | | | | — | | | | — | |
Due from brokers (Note 2) | | | — | | | | 165,000 | | | | — | |
Receivable for Fund shares sold | | | — | | | | 1,870,525 | | | | 3,399,642 | |
Receivable from investment adviser (Note 6) | | | 18,435 | | | | — | | | | — | |
Receivable for securities sold | | | — | | | | 777,428 | | | | 32,969,877 | |
Dividends and interest receivable | | | 204,468 | | | | 1,283,074 | | | | 2,606,410 | |
Prepaid expenses (Note 8) | | | — | | | | 31 | | | | 101 | |
| | | | | | | | | | | | |
TOTAL ASSETS | | | 48,829,049 | | | | 323,291,245 | | | | 1,031,700,574 | |
| | | | | | | | | | | | |
LIABILITIES | |
Payable for securities purchased | | | 23,891,979 | | | | 5,058,705 | | | | 11,569,961 | |
Payable for Fund shares redeemed | | | — | | | | 423,733 | | | | 599,773 | |
Payable for variation margin on futures contracts (Note 2) | | | — | | | | 8,342 | | | | — | |
Distributions payable | | | — | | | | — | | | | 154,251 | |
Management fees payable (Note 6) | | | — | | | | 55,259 | | | | 268,765 | |
Deferred Trustees’ fees (Note 6) | | | 43 | | | | 135,821 | | | | 401,775 | |
Administrative fees payable (Note 6) | | | 30 | | | | 11,305 | | | | 35,734 | |
Payable to distributor (Note 6d) | | | — | | | | 2,517 | | | | 12,954 | |
Other accounts payable and accrued expenses | | | 18,717 | | | | 81,201 | | | | 161,597 | |
| | | | | | | | | | | | |
TOTAL LIABILITIES | | | 23,910,769 | | | | 5,776,883 | | | | 13,204,810 | |
| | | | | | | | | | | | |
NET ASSETS | | $ | 24,918,280 | | | $ | 317,514,362 | | | $ | 1,018,495,764 | |
| | | | | | | | | | | | |
NET ASSETS CONSIST OF: | |
Paid-in capital | | $ | 25,002,998 | | | $ | 301,049,850 | | | $ | 1,033,300,396 | |
Accumulated earnings (loss) | | | (84,718 | ) | | | 16,464,512 | | | | (14,804,632 | ) |
| | | | | | | | | | | | |
NET ASSETS | | $ | 24,918,280 | | | $ | 317,514,362 | | | $ | 1,018,495,764 | |
| | | | | | | | | | | | |
| | | | |
| 67 | | | See accompanying notes to financial statements. | | |
Statements of Assets and Liabilities (continued)
September 30, 2020
| | | | | | | | | | | | |
| | | Credit Income
Fund | | | Intermediate
Duration Bond
Fund | | | Limited Term
Government
and Agency
Fund | |
COMPUTATION OF NET ASSET VALUE AND OFFERING PRICE: | | | | | | | | | | | | |
Class A shares: | |
Net assets | | $ | 997 | | | $ | 19,961,686 | | | $ | 296,216,546 | |
| | | | | | | | | | | | |
Shares of beneficial interest | | | 100 | | | | 1,816,111 | | | | 25,677,422 | |
| | | | | | | | | | | | |
Net asset value and redemption price per share | | $ | 9.97 | | | $ | 10.99 | | | $ | 11.54 | |
| | | | | | | | | | | | |
Offering price per share (100/[100-maximum sales charge] of net asset value) (Note 1) | | $ | 10.41 | | | $ | 11.48 | | | $ | 11.81 | |
| | | | | | | | | | | | |
Class C shares: (redemption price per share is equal to net asset value less any applicable contingent deferred sales charge) (Note 1) | | | | | | | | | | | | |
Net assets | | $ | 997 | | | $ | 668,120 | | | $ | 19,628,212 | |
| | | | | | | | | | | | |
Shares of beneficial interest | | | 100 | | | | 60,640 | | | | 1,700,515 | |
| | | | | | | | | | | | |
Net asset value and offering price per share | | $ | 9.97 | | | $ | 11.02 | | | $ | 11.54 | |
| | | | | | | | | | | | |
Class N shares: | |
Net assets | | $ | 24,915,289 | | | $ | 3,307,406 | | | $ | 11,035,494 | |
| | | | | | | | | | | | |
Shares of beneficial interest | | | 2,500,000 | | | | 301,234 | | | | 953,928 | |
| | | | | | | | | | | | |
Net asset value, offering and redemption price per share | | $ | 9.97 | | | $ | 10.98 | | | $ | 11.57 | |
| | | | | | | | | | | | |
Class Y shares: | |
Net assets | | $ | 997 | | | $ | 293,577,150 | | | $ | 691,615,512 | |
| | | | | | | | | | | | |
Shares of beneficial interest | | | 100 | | | | 26,717,982 | | | | 59,761,112 | |
| | | | | | | | | | | | |
Net asset value, offering and redemption price per share | | $ | 9.97 | | | $ | 10.99 | | | $ | 11.57 | |
| | | | | | | | | | | | |
| | | | |
| | See accompanying notes to financial statements. | | | 68 |
Statements of Operations
For the Year Ended September 30, 2020
| | | | | | | | | | | | |
| | | Credit Income
Fund(a) | | | Intermediate
Duration Bond
Fund | | | Limited Term
Government
and Agency
Fund | |
INVESTMENT INCOME | | | | | | | | | | | | |
Interest | | $ | 5 | | | $ | 6,439,435 | | | $ | 14,708,731 | |
Dividends | | | 724 | | | | — | | | | — | |
| | | | | | | | | | | | |
| | | 729 | | | | 6,439,435 | | | | 14,708,731 | |
| | | | | | | | | | | | |
Expenses | | | | | | | | | | | | |
Management fees (Note 6) | | | 287 | | | | 666,934 | | | | 3,080,893 | |
Service and distribution fees (Note 6) | | | — | | | | 58,913 | | | | 989,793 | |
Administrative fees (Note 6) | | | 30 | | | | 117,918 | | | | 390,053 | |
Trustees’ fees and expenses (Note 6) | | | 180 | | | | 42,137 | | | | 95,181 | |
Transfer agent fees and expenses (Notes 6 and 7) | | | 12 | | | | 192,428 | | | | 738,991 | |
Audit and tax services fees | | | 18,000 | | | | 51,986 | | | | 56,323 | |
Custodian fees and expenses | | | — | | | | 22,668 | | | | 39,991 | |
Legal fees (Note 8) | | | — | | | | 6,801 | | | | 21,469 | |
Registration fees | | | 100 | | | | 88,735 | | | | 136,052 | |
Shareholder reporting expenses | | | 130 | | | | 19,289 | | | | 57,114 | |
Miscellaneous expenses (Note 8) | | | 338 | | | | 31,634 | | | | 45,581 | |
| | | | | | | | | | | | |
Total expenses | | | 19,077 | | | | 1,299,443 | | | | 5,651,441 | |
Fee/expense recovery (Note 6) | | | — | | | | — | | | | 13,326 | |
Less waiver and/or expense reimbursement (Note 6) | | | (18,722 | ) | | | (175,130 | ) | | | (1,425 | ) |
| | | | | | | | | | | | |
Net expenses | | | 355 | | | | 1,124,313 | | | | 5,663,342 | |
| | | | | | | | | | | | |
Net investment income | | | 374 | | | | 5,315,122 | | | | 9,045,389 | |
| | | | | | | | | | | | |
NET REALIZED AND UNREALIZED GAIN (LOSS) ON INVESTMENTS AND FUTURES CONTRACTS | | | | | | | | | | | | |
Net realized gain on: | | | | | | | | | | | | |
Investments | | | — | | | | 8,040,203 | | | | 9,395,293 | |
Futures contracts | | | — | | | | 897,346 | | | | — | |
Net change in unrealized appreciation (depreciation) on: | | | | | | | | | | | | |
Investments | | | (85,094 | ) | | | 4,393,337 | | | | 8,389,983 | |
Futures contracts | | | — | | | | 127,503 | | | | — | |
| | | | | | | | | | | | |
Net realized and unrealized gain (loss) on investments and futures contracts | | | (85,094 | ) | | | 13,458,389 | | | | 17,785,276 | |
| | | | | | | | | | | | |
NET INCREASE (DECREASE) IN NET ASSETS RESULTING FROM OPERATIONS | | $ | (84,720 | ) | | $ | 18,773,511 | | | $ | 26,830,665 | |
| | | | | | | | | | | | |
| (a) | From commencement of operations on September 29, 2020 through September 30, 2020. |
| | | | |
| 69 | | | See accompanying notes to financial statements. | | |
Statements of Changes in Net Assets
| | | | | | | | | | | | |
| | | Credit Income
Fund | | | Intermediate Duration
Bond Fund | |
| | | Period Ended
September 30,
2020(a) | | | Year Ended
September 30,
2020 | | | Year Ended
September 30,
2019 | |
FROM OPERATIONS: | | | | | | | | | | | | |
Net investment income | | $ | 374 | | | $ | 5,315,122 | | | $ | 5,737,366 | |
Net realized gain on investments and futures contracts | | | — | | | | 8,937,549 | | | | 5,241,457 | |
Net change in unrealized appreciation (depreciation) on investments and futures contracts | | | (85,094 | ) | | | 4,520,840 | | | | 6,546,482 | |
| | | | | | | | | | | | |
Net increase (decrease) in net assets resulting from operations | | | (84,720 | ) | | | 18,773,511 | | | | 17,525,305 | |
| | | | | | | | | | | | |
FROM DISTRIBUTIONS TO SHAREHOLDERS: | | | | | | | | | | | | |
Class A | | | — | | | | (502,738 | ) | | | (489,457 | ) |
Class C | | | — | | | | (8,696 | ) | | | (4,669 | ) |
Class N | | | — | | | | (94,763 | ) | | | (14,658 | ) |
Class Y | | | — | | | | (6,108,309 | ) | | | (5,477,745 | ) |
| | | | | | | | | | | | |
Total distributions | | | — | | | | (6,714,506 | ) | | | (5,986,529 | ) |
| | | | | | | | | | | | |
NET INCREASE IN NET ASSETS FROM CAPITAL SHARE TRANSACTIONS (NOTE 11) | | | 25,003,000 | | | | 64,275,136 | | | | 62,370,471 | |
| | | | | | | | | | | | |
Net increase in net assets | | | 24,918,280 | | | | 76,334,141 | | | | 73,909,247 | |
NET ASSETS | | | | | | | | | | | | |
Beginning of the year | | | — | | | | 241,180,221 | | | | 167,270,974 | |
| | | | | | | | | | | | |
End of the year | | $ | 24,918,280 | | | $ | 317,514,362 | | | $ | 241,180,221 | |
| | | | | | | | | | | | |
| (a) | From commencement of operations on September 29, 2020 through September 30, 2020. |
| | | | |
| | See accompanying notes to financial statements. | | | 70 |
Statements of Changes in Net Assets (continued)
| | | | | | | | |
| | | Limited Term Government and
Agency Fund | |
| | | Year Ended
September 30,
2020 | | | Year Ended
September 30,
2019 | |
FROM OPERATIONS: | | | | | | | | |
Net investment income | | $ | 9,045,389 | | | $ | 10,657,761 | |
Net realized gain (loss) on investments | | | 9,395,293 | | | | (805,903 | ) |
Net change in unrealized appreciation (depreciation) on investments | | | 8,389,983 | | | | 23,250,762 | |
| | | | | | | | |
Net increase in net assets resulting from operations | | | 26,830,665 | | | | 33,102,620 | |
| | | | | | | | |
FROM DISTRIBUTIONS TO SHAREHOLDERS: | | | | | | | | |
Class A | | | (4,298,464 | ) | | | (6,888,790 | ) |
Class C | | | (141,631 | ) | | | (335,648 | ) |
Class N | | | (149,308 | ) | | | (117,078 | ) |
Class Y | | | (8,468,385 | ) | | | (9,249,815 | ) |
| | | | | | | | |
Total distributions | | | (13,057,788 | ) | | | (16,591,331 | ) |
| | | | | | | | |
NET INCREASE IN NET ASSETS FROM CAPITAL SHARE TRANSACTIONS (NOTE 11) | | | 211,874,926 | | | | 54,497,302 | |
| | | | | | | | |
Net increase in net assets | | | 225,647,803 | | | | 71,008,591 | |
NET ASSETS | | | | | | | | |
Beginning of the year | | | 792,847,961 | | | | 721,839,370 | |
| | | | | | | | |
End of the year | | $ | 1,018,495,764 | | | $ | 792,847,961 | |
| | | | | | | | |
| | | | |
| 71 | | | See accompanying notes to financial statements. | | |
Financial Highlights
For a share outstanding throughout each period.
| | | | |
| | | Credit Income Fund—Class A | |
| | | Period Ended
September 30,
2020* | |
Net asset value, beginning of the period | | $ | 10.00 | |
| | | | |
INCOME (LOSS) FROM INVESTMENT OPERATIONS: | | | | |
Net investment loss(a) | | | (0.00 | )(b) |
Net realized and unrealized gain (loss) | | | (0.03 | ) |
| | | | |
Total from Investment Operations | | | (0.03 | ) |
| | | | |
Net asset value, end of the period | | $ | 9.97 | |
| | | | |
Total return(c)(d)(e) | | | (0.30 | )% |
RATIOS TO AVERAGE NET ASSETS: | | | | |
Net assets, end of the period (000’s) | | $ | 1 | |
Net expenses(f)(g) | | | 0.82 | % |
Gross expenses(g) | | | 125.79 | % |
Net investment loss(g) | | | (0.82 | )% |
Portfolio turnover rate | | | 0 | % |
| * | From commencement of operations on September 29, 2020 through September 30, 2020. |
| (a) | Per share net investment loss has been calculated using the average shares outstanding during the period. |
| (b) | Amount rounds to less than $0.01 per share. |
| (c) | A sales charge for Class A shares is not reflected in total return calculations. |
| (d) | Had certain expenses not been waived/reimbursed during the period, total returns would have been lower. |
| (e) | Periods less than one year are not annualized. |
| (f) | The investment adviser agreed to waive its fees and/or reimburse a portion of the Fund’s expenses during the period. Without this waiver/reimbursement, expenses would have been higher. |
| (g) | Computed on an annualized basis for periods less than one year. |
| | | | |
| | See accompanying notes to financial statements. | | | 72 |
Financial Highlights (continued)
For a share outstanding throughout each period.
| | | | |
| | | Credit Income Fund—Class C | |
| | | Period Ended
September 30,
2020*
| |
Net asset value, beginning of the period | | $ | 10.00 | |
| | | | |
INCOME (LOSS) FROM INVESTMENT OPERATIONS: | | | | |
Net investment loss(a) | | | (0.00 | )(b) |
Net realized and unrealized gain (loss) | | | (0.03 | ) |
| | | | |
Total from Investment Operations | | | (0.03 | ) |
| | | | |
Net asset value, end of the period | | $ | 9.97 | |
| | | | |
Total return(c)(d)(e) | | | (0.30 | )% |
RATIOS TO AVERAGE NET ASSETS: | | | | |
Net assets, end of the period (000’s) | | $ | 1 | |
Net expenses(f)(g) | | | 1.57 | % |
Gross expenses(g) | | | 126.54 | % |
Net investment loss(g) | | | (1.57 | )% |
Portfolio turnover rate | | | 0 | % |
| * | From commencement of operations on September 29, 2020 through September 30, 2020. |
| (a) | Per share net investment loss has been calculated using the average shares outstanding during the period. |
| (b) | Amount rounds to less than $0.01 per share. |
| (c) | A contingent deferred sales charge for Class C shares is not reflected in total return calculations. |
| (d) | Had certain expenses not been waived/reimbursed during the period, total returns would have been lower. |
| (e) | Periods less than one year are not annualized. |
| (f) | The investment adviser agreed to waive its fees and/or reimburse a portion of the Fund’s expenses during the period. Without this waiver/reimbursement, expenses would have been higher. |
| (g) | Computed on an annualized basis for periods less than one year. |
| | | | |
| 73 | | | See accompanying notes to financial statements. | | |
Financial Highlights (continued)
For a share outstanding throughout each period.
| | | | |
| | | Credit Income Fund—Class N | |
| | | Period Ended
September 30,
2020*
| |
Net asset value, beginning of the period | | $ | 10.00 | |
| | | | |
INCOME (LOSS) FROM INVESTMENT OPERATIONS: | | | | |
Net investment income(a) | | | 0.00 | (b) |
Net realized and unrealized gain (loss) | | | (0.03 | ) |
| | | | |
Total from Investment Operations | | | (0.03 | ) |
| | | | |
Net asset value, end of the period | | $ | 9.97 | |
| | | | |
Total return(c)(d) | | | (0.30 | )% |
RATIOS TO AVERAGE NET ASSETS: | | | | |
Net assets, end of the period (000’s) | | $ | 24,915 | |
Net expenses(e)(f) | | | 0.52 | % |
Gross expenses(f) | | | 27.91 | % |
Net investment income(f) | | | 0.55 | % |
Portfolio turnover rate | | | 0 | % |
| * | From commencement of operations on September 29, 2020 through September 30, 2020. |
| (a) | Per share net investment income has been calculated using the average shares outstanding during the period. |
| (b) | Amount rounds to less than $0.01 per share. |
| (c) | Had certain expenses not been waived/reimbursed during the period, total returns would have been lower. |
| (d) | Periods less than one year are not annualized. |
| (e) | The investment adviser agreed to waive its fees and/or reimburse a portion of the Fund’s expenses during the period. Without this waiver/reimbursement, expenses would have been higher. |
| (f) | Computed on an annualized basis for periods less than one year. |
| | | | |
| | See accompanying notes to financial statements. | | | 74 |
Financial Highlights (continued)
For a share outstanding throughout each period.
| | | | |
| | | Credit Income Fund—Class Y | |
| | | Period Ended
September 30,
2020*
| |
Net asset value, beginning of the period | | $ | 10.00 | |
| | | | |
INCOME (LOSS) FROM INVESTMENT OPERATIONS: | | | | |
Net investment loss(a) | | | (0.00 | )(b) |
Net realized and unrealized gain (loss) | | | (0.03 | ) |
| | | | |
Total from Investment Operations | | | (0.03 | ) |
| | | | |
Net asset value, end of the period | | $ | 9.97 | |
| | | | |
Total return(c)(d) | | | (0.30 | )% |
RATIOS TO AVERAGE NET ASSETS: | | | | |
Net assets, end of the period (000’s) | | $ | 1 | |
Net expenses(e)(f) | | | 0.57 | % |
Gross expenses(f) | | | 125.54 | % |
Net investment loss(f) | | | (0.57 | )% |
Portfolio turnover rate | | | 0 | % |
| * | From commencement of operations on September 29, 2020 through September 30, 2020. |
| (a) | Per share net investment loss has been calculated using the average shares outstanding during the period. |
| (b) | Amount rounds to less than $0.01 per share. |
| (c) | Had certain expenses not been waived/reimbursed during the period, total returns would have been lower. |
| (d) | Periods less than one year are not annualized. |
| (e) | The investment adviser agreed to waive its fees and/or reimburse a portion of the Fund’s expenses during the period. Without this waiver/reimbursement, expenses would have been higher. |
| (f) | Computed on an annualized basis for periods less than one year. |
| | | | |
| 75 | | | See accompanying notes to financial statements. | | |
Financial Highlights (continued)
For a share outstanding throughout each period.
| | | | | | | | | | | | | | | | | | | | |
| | | Intermediate Duration Bond Fund—Class A* | |
| | | Year Ended
September 30,
2020 | | | Year Ended
September 30,
2019 | | | Year Ended
September 30,
2018 | | | Year Ended
September 30,
2017 | | | Year Ended
September 30,
2016 | |
Net asset value, beginning of the period | | $ | 10.51 | | | $ | 9.97 | | | $ | 10.29 | | | $ | 10.52 | | | $ | 10.39 | |
| | | | | | | | | | | | | | | | | | | | |
INCOME (LOSS) FROM INVESTMENT OPERATIONS: | | | | | | | | | | | | | | | | | | | | |
Net investment income(a) | | | 0.19 | | | | 0.25 | | | | 0.22 | | | | 0.17 | | | | 0.20 | |
Net realized and unrealized gain (loss) | | | 0.54 | | | | 0.55 | | | | (0.31 | ) | | | (0.12 | ) | | | 0.17 | |
| | | | | | | | | | | | | | | | | | | | |
Total from Investment Operations | | | 0.73 | | | | 0.80 | | | | (0.09 | ) | | | 0.05 | | | | 0.37 | |
| | | | | | | | | | | | | | | | | | | | |
LESS DISTRIBUTIONS FROM: | | | | | | | | | | | | | | | | | | | | |
Net investment income | | | (0.20 | ) | | | (0.26 | ) | | | (0.23 | ) | | | (0.20 | ) | | | (0.21 | ) |
Net realized capital gains | | | (0.05 | ) | | | — | | | | — | | | | (0.08 | ) | | | (0.03 | ) |
| | | | | | | | | | | | | | | | | | | | |
Total Distributions | | | (0.25 | ) | | | (0.26 | ) | | | (0.23 | ) | | | (0.28 | ) | | | (0.24 | ) |
| | | | | | | | | | | | | | | | | | | | |
Net asset value, end of the period | | $ | 10.99 | | | $ | 10.51 | | | $ | 9.97 | | | $ | 10.29 | | | $ | 10.52 | |
| | | | | | | | | | | | | | | | | | | | |
Total return(b)(c) | | | 7.06 | % | | | 8.11 | % | | | (0.85 | )% | | | 0.44 | % | | | 3.64 | % |
RATIOS TO AVERAGE NET ASSETS: | | | | | | | | | | | | | | | | | | | | |
Net assets, end of the period (000’s) | | $ | 19,962 | | | $ | 21,415 | | | $ | 19,149 | | | $ | 21,828 | | | $ | 19,327 | |
Net expenses(d) | | | 0.65 | % | | | 0.65 | % | | | 0.65 | % | | | 0.65 | % | | | 0.65 | % |
Gross expenses | | | 0.72 | % | | | 0.72 | % | | | 0.70 | % | | | 0.72 | % | | | 0.72 | % |
Net investment income | | | 1.78 | % | | | 2.42 | % | | | 2.17 | % | | | 1.69 | % | | | 1.89 | % |
Portfolio turnover rate | | | 123 | % | | | 135 | % | | | 152 | % | | | 216 | % | | | 151 | % |
| * | Effective August 31, 2016, Retail Class shares were redesignated as Class A shares. |
| (a) | Per share net investment income has been calculated using the average shares outstanding during the period. |
| (b) | A sales charge for Class A shares is not reflected in total return calculations. |
| (c) | Had certain expenses not been waived/reimbursed during the period, total returns would have been lower. |
| (d) | The investment adviser agreed to waive its fees and/or reimburse a portion of the Fund’s expenses during the period. Without this waiver/reimbursement, expenses would have been higher. |
| | | | |
| | See accompanying notes to financial statements. | | | 76 |
Financial Highlights (continued)
For a share outstanding throughout each period.
| | | | | | | | | | | | | | | | | | | | |
| | | Intermediate Duration Bond Fund—Class C | |
| | | Year Ended
September 30,
2020
| | | Year Ended
September 30,
2019
| | | Year Ended
September 30,
2018
| | | Year Ended
September 30,
2017
| | | Period Ended
September 30,
2016*
| |
Net asset value, beginning of the period | | $ | 10.54 | | | $ | 10.00 | | | $ | 10.30 | | | $ | 10.53 | | | $ | 10.53 | |
| | | | | | | | | | | | | | | | | | | | |
INCOME (LOSS) FROM INVESTMENT OPERATIONS: | | | | | | | | | | | | | | | | | | | | |
Net investment income(a) | | | 0.11 | | | | 0.17 | | | | 0.13 | | | | 0.10 | | | | 0.01 | |
Net realized and unrealized gain (loss) | | | 0.54 | | | | 0.55 | | | | (0.31 | ) | | | (0.13 | ) | | | 0.00 | (b) |
| | | | | | | | | | | | | | | | | | | | |
Total from Investment Operations | | | 0.65 | | | | 0.72 | | | | (0.18 | ) | | | (0.03 | ) | | | 0.01 | |
| | | | | | | | | | | | | | | | | | | | |
LESS DISTRIBUTIONS FROM: | | | | | | | | | | | | | | | | | | | | |
Net investment income | | | (0.12 | ) | | | (0.18 | ) | | | (0.12 | ) | | | (0.12 | ) | | | (0.01 | ) |
Net realized capital gains | | | (0.05 | ) | | | — | | | | — | | | | (0.08 | ) | | | — | |
| | | | | | | | | | | | | | | | | | | | |
Total Distributions | | | (0.17 | ) | | | (0.18 | ) | | | (0.12 | ) | | | (0.20 | ) | | | (0.01 | ) |
| | | | | | | | | | | | | | | | | | | | |
Net asset value, end of the period | | $ | 11.02 | | | $ | 10.54 | | | $ | 10.00 | | | $ | 10.30 | | | $ | 10.53 | |
| | | | | | | | | | | | | | | | | | | | |
Total return(c)(d) | | | 6.27 | % | | | 7.28 | % | | | (1.71 | )% | | | (0.29 | )% | | | 0.08 | %(e) |
RATIOS TO AVERAGE NET ASSETS: | | | | | | | | | | | | | | | | | | | | |
Net assets, end of the period (000’s) | | $ | 668 | | | $ | 467 | | | $ | 2 | | | $ | 3,225 | | | $ | 3,088 | |
Net expenses(f) | | | 1.40 | % | | | 1.40 | % | | | 1.40 | % | | | 1.40 | % | | | 1.40 | %(g) |
Gross expenses | | | 1.46 | % | | | 1.48 | % | | | 1.45 | % | | | 1.48 | % | | | 1.56 | %(g) |
Net investment income | | | 1.00 | % | | | 1.64 | % | | | 1.31 | % | | | 0.95 | % | | | 0.86 | %(g) |
Portfolio turnover rate | | | 123 | % | | | 135 | % | | | 152 | % | | | 216 | % | | | 151 | % |
| * | From commencement of Class operations on August 31, 2016 through September 30, 2016. |
| (a) | Per share net investment income has been calculated using the average shares outstanding during the period. |
| (b) | Amount rounds to less than $0.01 per share. |
| (c) | A contingent deferred sales charge for Class C shares is not reflected in total return calculations. |
| (d) | Had certain expenses not been waived/reimbursed during the period, total returns would have been lower. |
| (e) | Periods less than one year are not annualized. |
| (f) | The investment adviser agreed to waive its fees and/or reimburse a portion of the Fund’s expenses during the period. Without this waiver/reimbursement, expenses would have been higher. |
| (g) | Computed on an annualized basis for periods less than one year. |
| | | | |
| 77 | | | See accompanying notes to financial statements. | | |
Financial Highlights (continued)
For a share outstanding throughout each period.
| | | | | | | | |
| | | Intermediate Duration Bond
Fund—Class N | |
| | | Year Ended
September 30,
2020 | | | Period Ended
September 30,
2019* | |
Net asset value, beginning of the period | | $ | 10.50 | | | $ | 10.07 | |
| | | | | | | | |
INCOME (LOSS) FROM INVESTMENT OPERATIONS: | | | | | | | | |
Net investment income(a) | | | 0.22 | | | | 0.17 | |
Net realized and unrealized gain (loss) | | | 0.54 | | | | 0.45 | |
| | | | | | | | |
Total from Investment Operations | | | 0.76 | | | | 0.62 | |
| | | | | | | | |
LESS DISTRIBUTIONS FROM: | | | | | | | | |
Net investment income | | | (0.23 | ) | | | (0.19 | ) |
Net realized capital gains | | | (0.05 | ) | | | — | |
| | | | | | | | |
Total Distributions | | | (0.28 | ) | | | (0.19 | ) |
| | | | | | | | |
Net asset value, end of the period | | $ | 10.98 | | | $ | 10.50 | |
| | | | | | | | |
Total return(b) | | | 7.39 | % | | | 6.19 | %(c) |
RATIOS TO AVERAGE NET ASSETS: | | | | | | | | |
Net assets, end of the period (000’s) | | $ | 3,307 | | | $ | 3,546 | |
Net expenses(d) | | | 0.35 | % | | | 0.35 | %(e) |
Gross expenses | | | 0.43 | % | | | 0.42 | %(e) |
Net investment income | | | 2.09 | % | | | 2.54 | %(e) |
Portfolio turnover rate | | | 123 | % | | | 135 | %(f) |
| * | From commencement of Class operations on February 1, 2019 through September 30, 2019. |
| (a) | Per share net investment income has been calculated using the average shares outstanding during the period. |
| (b) | Had certain expenses not been waived/reimbursed during the period, total returns would have been lower. |
| (c) | Periods less than one year are not annualized. |
| (d) | The investment adviser agreed to waive its fees and/or reimburse a portion of the Fund’s expenses during the period. Without this waiver/reimbursement, expenses would have been higher. |
| (e) | Computed on an annualized basis for periods less than one year. |
| (f) | Represents the Fund’s portfolio turnover rate for year ended September 30, 2019. |
| | | | |
| | See accompanying notes to financial statements. | | | 78 |
Financial Highlights (continued)
For a share outstanding throughout each period.
| | | | | | | | | | | | | | | | | | | | |
| | | Intermediate Duration Bond Fund—Class Y* | |
| | | Year Ended
September 30,
2020
| | | Year Ended
September 30,
2019
| | | Year Ended
September 30,
2018
| | | Year Ended
September 30,
2017
| | | Year Ended
September 30,
2016
| |
Net asset value, beginning of the period | | $ | 10.51 | | | $ | 9.97 | | | $ | 10.29 | | | $ | 10.52 | | | $ | 10.39 | |
| | | | | | | | | | | | | | | | | | | | |
INCOME (LOSS) FROM INVESTMENT OPERATIONS: | | | | | | | | | | | | | | | | | | | | |
Net investment income(a) | | | 0.21 | | | | 0.27 | | | | 0.25 | | | | 0.20 | | | | 0.22 | |
Net realized and unrealized gain (loss) | | | 0.54 | | | | 0.55 | | | | (0.31 | ) | | | (0.13 | ) | | | 0.18 | |
| | | | | | | | | | | | | | | | | | | | |
Total from Investment Operations | | | 0.75 | | | | 0.82 | | | | (0.06 | ) | | | 0.07 | | | | 0.40 | |
| | | | | | | | | | | | | | | | | | | | |
LESS DISTRIBUTIONS FROM: | | | | | | | | | | | | | | | | | | | | |
Net investment income | | | (0.22 | ) | | | (0.28 | ) | | | (0.26 | ) | | | (0.22 | ) | | | (0.24 | ) |
Net realized capital gains | | | (0.05 | ) | | | — | | | | — | | | | (0.08 | ) | | | (0.03 | ) |
| | | | | | | | | | | | | | | | | | | | |
Total Distributions | | | (0.27 | ) | | | (0.28 | ) | | | (0.26 | ) | | | (0.30 | ) | | | (0.27 | ) |
| | | | | | | | | | | | | | | | | | | | |
Net asset value, end of the period | | $ | 10.99 | | | $ | 10.51 | | | $ | 9.97 | | | $ | 10.29 | | | $ | 10.52 | |
| | | | | | | | | | | | | | | | | | | | |
Total return(b) | | | 7.33 | % | | | 8.38 | % | | | (0.60 | )% | | | 0.69 | % | | | 3.90 | % |
RATIOS TO AVERAGE NET ASSETS: | | | | | | | | | | | | | | | | | | | | |
Net assets, end of the period (000’s) | | $ | 293,577 | | | $ | 215,752 | | | $ | 148,119 | | | $ | 154,668 | | | $ | 139,398 | |
Net expenses(c) | | | 0.40 | % | | | 0.40 | % | | | 0.40 | % | | | 0.40 | % | | | 0.40 | % |
Gross expenses | | | 0.47 | % | | | 0.48 | % | | | 0.45 | % | | | 0.47 | % | | | 0.47 | % |
Net investment income | | | 2.01 | % | | | 2.67 | % | | | 2.43 | % | | | 1.93 | % | | | 2.11 | % |
Portfolio turnover rate | | | 123 | % | | | 135 | % | | | 152 | % | | | 216 | % | | | 151 | % |
| * | Effective August 31, 2016, Institutional Class shares were redesignated as Class Y shares. |
| (a) | Per share net investment income has been calculated using the average shares outstanding during the period. |
| (b) | Had certain expenses not been waived/reimbursed during the period, total returns would have been lower. |
| (c) | The investment adviser agreed to waive its fees and/or reimburse a portion of the Fund’s expenses during the period. Without this waiver/reimbursement, expenses would have been higher. |
| | | | |
| 79 | | | See accompanying notes to financial statements. | | |
Financial Highlights (continued)
For a share outstanding throughout each period.
| | | | | | | | | | | | | | | | | | | | |
| | | Limited Term Government and Agency Fund—Class A | |
| | | Year Ended
September 30,
2020
| | | Year Ended
September 30,
2019
| | | Year Ended
September 30,
2018
| | | Year Ended
September 30,
2017
| | | Year Ended
September 30,
2016
| |
Net asset value, beginning of the period | | $ | 11.34 | | | $ | 11.09 | | | $ | 11.32 | | | $ | 11.51 | | | $ | 11.57 | |
| | | | | | | | | | | | | | | | | | | | |
INCOME (LOSS) FROM INVESTMENT OPERATIONS: | | | | | | | | | | | | | | | | | | | | |
Net investment income(a) | | | 0.11 | | | | 0.15 | | | | 0.11 | | | | 0.08 | | | | 0.11 | |
Net realized and unrealized gain (loss) | | | 0.25 | | | | 0.34 | | | | (0.13 | ) | | | (0.09 | ) | | | 0.00 | (b) |
| | | | | | | | | | | | | | | | | | | | |
Total from Investment Operations | | | 0.36 | | | | 0.49 | | | | (0.02 | ) | | | (0.01 | ) | | | 0.11 | |
| | | | | | | | | | | | | | | | | | | | |
LESS DISTRIBUTIONS FROM: | | | | | | | | | | | | | | | | | | | | |
Net investment income | | | (0.16 | ) | | | (0.24 | ) | | | (0.21 | ) | | | (0.18 | ) | | | (0.17 | ) |
| | | | | | | | | | | | | | | | | | | | |
Net asset value, end of the period | | $ | 11.54 | | | $ | 11.34 | | | $ | 11.09 | | | $ | 11.32 | | | $ | 11.51 | |
| | | | | | | | | | | | | | | | | | | | |
Total return(c) | | | 3.19 | % | | | 4.42 | % | | | (0.17 | )% | | | (0.04 | )% | | | 0.93 | % |
RATIOS TO AVERAGE NET ASSETS: | | | | | | | | | | | | | | | | | | | | |
Net assets, end of the period (000’s) | | $ | 296,217 | | | $ | 308,186 | | | $ | 328,475 | | | $ | 336,227 | | | $ | 442,671 | |
Net expenses | | | 0.78 | %(d) | | | 0.80 | % | | | 0.80 | % | | | 0.80 | % | | | 0.77 | % |
Gross expenses | | | 0.78 | % | | | 0.80 | % | | | 0.80 | % | | | 0.80 | % | | | 0.77 | % |
Net investment income | | | 0.93 | % | | | 1.31 | % | | | 1.02 | % | | | 0.67 | % | | | 0.96 | % |
Portfolio turnover rate | | | 319 | %(e) | | | 527 | %(e) | | | 157 | % | | | 126 | % | | | 109 | % |
| (a) | Per share net investment income has been calculated using the average shares outstanding during the period. |
| (b) | Amount rounds to less than $0.01 per share. |
| (c) | A sales charge for Class A shares is not reflected in total return calculations. |
| (d) | Effective July 1, 2020, the expense limit decreased from 0.80% to 0.75%. |
| (e) | The variation in the Fund’s turnover rate from 2018 to 2020 is due to changes in volume of U.S. Treasury securities related to certain trading strategies. |
| | | | |
| | See accompanying notes to financial statements. | | | 80 |
Financial Highlights (continued)
For a share outstanding throughout each period.
| | | | | | | | | | | | | | | | | | | | |
| | | Limited Term Government and Agency Fund—Class C | |
| | | Year Ended
September 30,
2020
| | | Year Ended
September 30,
2019
| | | Year Ended
September 30,
2018
| | | Year Ended
September 30,
2017
| | | Year Ended
September 30,
2016
| |
Net asset value, beginning of the period | | $ | 11.35 | | | $ | 11.10 | | | $ | 11.33 | | | $ | 11.52 | | | $ | 11.58 | |
| | | | | | | | | | | | | | | | | | | | |
INCOME (LOSS) FROM INVESTMENT OPERATIONS: | | | | | | | | | | | | | | | | | | | | |
Net investment income
(loss)(a) | | | 0.02 | | | | 0.06 | | | | 0.03 | | | | (0.01 | ) | | | 0.02 | |
Net realized and unrealized gain (loss) | | | 0.24 | | | | 0.34 | | | | (0.13 | ) | | | (0.08 | ) | | | 0.00 | (b) |
| | | | | | | | | | | | | | | | | | | | |
Total from Investment Operations | | | 0.26 | | | | 0.40 | | | | (0.10 | ) | | | (0.09 | ) | | | 0.02 | |
| | | | | | | | | | | | | | | | | | | | |
LESS DISTRIBUTIONS FROM: | | | | | | | | | | | | | | | | | | | | |
Net investment income | | | (0.07 | ) | | | (0.15 | ) | | | (0.13 | ) | | | (0.10 | ) | | | (0.08 | ) |
| | | | | | | | | | | | | | | | | | | | |
Net asset value, end of the period | | $ | 11.54 | | | $ | 11.35 | | | $ | 11.10 | | | $ | 11.33 | | | $ | 11.52 | |
| | | | | | | | | | | | | | | | | | | | |
Total return(c) | | | 2.34 | % | | | 3.64 | % | | | (0.91 | )% | | | (0.79 | )% | | | 0.18 | % |
RATIOS TO AVERAGE NET ASSETS: | | | | | | | | | | | | | | | | | | | | |
Net assets, end of the period (000’s) | | $ | 19,628 | | | $ | 22,142 | | | $ | 23,341 | | | $ | 43,319 | | | $ | 73,027 | |
Net expenses | | | 1.53 | %(d) | | | 1.55 | % | | | 1.55 | % | | | 1.55 | % | | | 1.52 | % |
Gross expenses | | | 1.53 | % | | | 1.55 | % | | | 1.55 | % | | | 1.55 | % | | | 1.52 | % |
Net investment income (loss) | | | 0.18 | % | | | 0.57 | % | | | 0.24 | % | | | (0.09 | )% | | | 0.21 | % |
Portfolio turnover rate | | | 319 | %(e) | | | 527 | %(e) | | | 157 | % | | | 126 | % | | | 109 | % |
| (a) | Per share net investment income (loss) has been calculated using the average shares outstanding during the period. |
| (b) | Amount rounds to less than $0.01 per share. |
| (c) | A contingent deferred sales charge for Class C shares is not reflected in total return calculations. |
| (d) | Effective July 1, 2020, the expense limit decreased from 1.55% to 1.50%. |
| (e) | The variation in the Fund’s turnover rate from 2018 to 2020 is due to changes in volume of U.S. Treasury securities related to certain trading strategies. |
| | | | |
| 81 | | | See accompanying notes to financial statements. | | |
Financial Highlights (continued)
For a share outstanding throughout each period.
| | | | | | | | | | | | | | | | |
| | | Limited Term Government and Agency Fund—Class N | |
| | | Year Ended
September 30,
2020 | | | Year Ended
September 30,
2019 | | | Year Ended
September 30,
2018 | | | Period Ended
September 30,
2017* | |
Net asset value, beginning of the period | | $ | 11.37 | | | $ | 11.12 | | | $ | 11.36 | | | $ | 11.39 | |
| | | | | | | | | | | | | | | | |
INCOME (LOSS) FROM INVESTMENT OPERATIONS: | | | | | | | | | | | | | | | | |
Net investment income(a) | | | 0.14 | | | | 0.19 | | | | 0.15 | | | | 0.05 | |
Net realized and unrealized gain (loss) | | | 0.26 | | | | 0.33 | | | | (0.14 | ) | | | 0.08 | (b) |
| | | | | | | | | | | | | | | | |
Total from Investment Operations | | | 0.40 | | | | 0.52 | | | | 0.01 | | | | 0.13 | |
| | | | | | | | | | | | | | | | |
LESS DISTRIBUTIONS FROM: | | | | | | | | | | | | | | | | |
Net investment income | | | (0.20 | ) | | | (0.27 | ) | | | (0.25 | ) | | | (0.16 | ) |
| | | | | | | | | | | | | | | | |
Net asset value, end of the period | | $ | 11.57 | | | $ | 11.37 | | | $ | 11.12 | | | $ | 11.36 | |
| | | | | | | | | | | | | | | | |
Total return(c) | | | 3.53 | % | | | 4.77 | % | | | 0.09 | % | | | 1.12 | %(d) |
RATIOS TO AVERAGE NET ASSETS: | | | | | | | | | | | | | | | | |
Net assets, end of the period (000’s) | | $ | 11,035 | | | $ | 5,272 | | | $ | 3,176 | | | $ | 1,900 | |
Net expenses(e) | | | 0.45 | %(f) | | | 0.46 | % | | | 0.46 | % | | | 0.47 | %(g) |
Gross expenses | | | 0.46 | % | | | 0.48 | % | | | 0.48 | % | | | 0.50 | %(g) |
Net investment income | | | 1.20 | % | | | 1.65 | % | | | 1.37 | % | | | 0.64 | %(g) |
Portfolio turnover rate | | | 319 | %(h) | | | 527 | %(h) | | | 157 | % | | | 126 | %(i) |
| * | From commencement of Class operations on February 1, 2017 through September 30, 2017. |
| (a) | Per share net investment income has been calculated using the average shares outstanding during the period. |
| (b) | The amount shown for a share outstanding does not correspond with the aggregate realized and unrealized gain (loss) on investments for the period due to the timing of sales and redemptions of fund shares in relation to fluctuating market values of investments of the Fund. |
| (c) | Had certain expenses not been waived/reimbursed during the period, total returns would have been lower. |
| (d) | Periods less than one year are not annualized. |
| (e) | The investment adviser agreed to waive its fees and/or reimburse a portion of the Fund’s expenses during the period. Without this waiver/reimbursement, expenses would have been higher. |
| (f) | Effective July 1, 2020, the expense limit decreased from 0.50% to 0.45%. |
| (g) | Computed on an annualized basis for periods less than one year. |
| (h) | The variation in the Fund’s turnover rate from 2018 to 2020 is due to changes in volume of U.S. Treasury securities related to certain trading strategies. |
| (i) | Represents the Fund’s portfolio turnover rate for the year ended September 30, 2017. |
| | | | |
| | See accompanying notes to financial statements. | | | 82 |
Financial Highlights (continued)
For a share outstanding throughout each period.
| | | | | | | | | | | | | | | | | | | | |
| | | Limited Term Government and Agency Fund—Class Y | |
| | | Year Ended
September 30,
2020
| | | Year Ended
September 30,
2019
| | | Year Ended
September 30,
2018
| | | Year Ended
September 30,
2017
| | | Year Ended
September 30,
2016
| |
Net asset value, beginning of the period | | $ | 11.38 | | | $ | 11.13 | | | $ | 11.36 | | | $ | 11.55 | | | $ | 11.61 | |
| | | | | | | | | | | | | | | | | | | | |
INCOME (LOSS) FROM INVESTMENT OPERATIONS: | | | | | | | | | | | | | | | | | | | | |
Net investment income(a) | | | 0.13 | | | | 0.17 | | | | 0.14 | | | | 0.11 | | | | 0.14 | |
Net realized and unrealized gain (loss) | | | 0.25 | | | | 0.34 | | | | (0.13 | ) | | | (0.09 | ) | | | 0.00 | (b) |
| | | | | | | | | | | | | | | | | | | | |
Total from Investment Operations | | | 0.38 | | | | 0.51 | | | | 0.01 | | | | 0.02 | | | | 0.14 | |
| | | | | | | | | | | | | | | | | | | | |
LESS DISTRIBUTIONS FROM: | | | | | | | | | | | | | | | | | | | | |
Net investment income | | | (0.19 | ) | | | (0.26 | ) | | | (0.24 | ) | | | (0.21 | ) | | | (0.20 | ) |
| | | | | | | | | | | | | | | | | | | | |
Net asset value, end of the period | | $ | 11.57 | | | $ | 11.38 | | | $ | 11.13 | | | $ | 11.36 | | | $ | 11.55 | |
| | | | | | | | | | | | | | | | | | | | |
Total return | | | 3.35 | % | | | 4.67 | % | | | 0.09 | % | | | 0.22 | % | | | 1.19 | % |
RATIOS TO AVERAGE NET ASSETS: | | | | | | | | | | | | | | | | | | | | |
Net assets, end of the period (000’s) | | $ | 691,616 | | | $ | 457,248 | | | $ | 366,847 | | | $ | 360,322 | | | $ | 411,898 | |
Net expenses | | | 0.53 | %(c) | | | 0.55 | % | | | 0.55 | % | | | 0.55 | % | | | 0.52 | % |
Gross expenses | | | 0.53 | % | | | 0.55 | % | | | 0.55 | % | | | 0.55 | % | | | 0.52 | % |
Net investment income | | | 1.11 | % | | | 1.55 | % | | | 1.26 | % | | | 0.92 | % | | | 1.20 | % |
Portfolio turnover rate | | | 319 | %(d) | | | 527 | %(d) | | | 157 | % | | | 126 | % | | | 109 | % |
| (a) | Per share net investment income has been calculated using the average shares outstanding during the period. |
| (b) | Amount rounds to less than $0.01 per share. |
| (c) | Effective July 1, 2020, the expense limit decreased from 0.55% to 0.50%. |
| (d) | The variation in the Fund’s turnover rate from 2018 to 2020 is due to changes in volume of U.S. Treasury securities related to certain trading strategies. |
| | | | |
| 83 | | | See accompanying notes to financial statements. | | |
Notes to Financial Statements
September 30, 2020
1. Organization. Loomis Sayles Funds I and Loomis Sayles Funds II (the “Trusts” and each a “Trust”) are each organized as a Massachusetts business trust. Each Trust is registered under the Investment Company Act of 1940, as amended (the “1940 Act”), as an open-end management investment company. Each Declaration of Trust permits the Board of Trustees to authorize the issuance of an unlimited number of shares of the Trust in multiple series. The financial statements for certain funds of the Trusts are presented in separate reports. The following funds (individually, a “Fund” and collectively, the “Funds”) are included in this report:
Loomis Sayles Funds I:
Loomis Sayles Intermediate Duration Bond Fund (the “Intermediate Duration Bond Fund”)
Loomis Sayles Funds II:
Loomis Sayles Credit Income Fund (the “Credit Income Fund”)
Loomis Sayles Limited Term Government and Agency Fund (the “Limited Term Government and Agency Fund”)
Credit Income Fund commenced operations on September 29, 2020 via contributions to the Fund by Natixis Investment Managers, LLC (“Natixis”) and affiliates of $25,003,000.
Each Fund is a diversified investment company.
Each Fund offers Class A, Class C, Class N and Class Y shares.
Class A shares of Credit Income Fund and Intermediate Duration Bond Fund are sold with a maximum front-end sales charge of 4.25%. Class A shares of Limited Term Government and Agency Fund are sold with a maximum front-end sales charge of 2.25%. Class C shares do not pay a front-end sales charge, pay higher Rule 12b-1 fees than Class A shares for 10 years (at which point they automatically convert to Class A shares) and may be subject to a contingent deferred sales charge (“CDSC”) of 1.00% if those shares are redeemed within one year of acquisition, except for reinvested distributions. Class N and Class Y shares do not pay a front-end sales charge, a CDSC or Rule 12b-1 fees. Class N shares are offered with an initial minimum investment of $1,000,000. Class Y shares are offered with an initial minimum investment of $100,000. Certain categories of investors are exempted from the minimum investment amounts for Class N and Class Y as outlined in the relevant Funds’ prospectus.
Most expenses can be directly attributed to a Fund. Expenses which cannot be directly attributed to a Fund are generally apportioned based on the relative net assets of each of the funds in Natixis Funds Trust I, Natixis Funds Trust II, Natixis Funds Trust IV and Gateway Trust (“Natixis Funds Trusts”), Loomis Sayles Funds I and Loomis Sayles Funds II (“Loomis Sayles Funds Trusts”), and Natixis ETF Trust and Natixis ETF Trust II (“Natixis ETF Trusts”). Expenses of a Fund are borne pro rata by the holders of each class of shares, except that each class bears expenses unique to that class (such as
Notes to Financial Statements (continued)
September 30, 2020
the Rule 12b-1 fees applicable to Class A and Class C) and transfer agent fees are borne collectively for Class A, Class C and Class Y, and individually for Class N. In addition, each class votes as a class only with respect to its own Rule 12b-1 Plan. Shares of each class would receive their pro rata share of the net assets of a Fund if the Fund were liquidated. The Trustees approve separate distributions from net investment income on each class of shares.
2. Significant Accounting Policies. The following is a summary of significant accounting policies consistently followed by each Fund in the preparation of its financial statements. The Funds’ financial statements follow the accounting and reporting guidelines provided for investment companies and are prepared in accordance with accounting principles generally accepted in the United States of America which require the use of management estimates that affect the reported amounts and disclosures in the financial statements. Actual results could differ from those estimates. Management has evaluated the events and transactions subsequent to year-end through the date the financial statements were issued and has determined that there were no material events that would require disclosure in the Funds’ financial statements.
a. Valuation. Fund securities and other investments are valued at market value based on market quotations obtained or determined by independent pricing services recommended by the adviser and approved by the Board of Trustees. Fund securities and other investments for which market quotations are not readily available are valued at fair value as determined in good faith by the adviser pursuant to procedures approved by the Board of Trustees, as described below. Market value is determined as follows:
Debt securities and unlisted preferred equity securities are valued based on evaluated bids furnished to the Funds by an independent pricing service or bid prices obtained from broker-dealers. Listed equity securities (including shares of closed-end investment companies and exchange-traded funds) are valued at the last sale price quoted on the exchange where they are traded most extensively or, if there is no reported sale during the day, the closing bid quotation as reported by an independent pricing service. Securities traded on the NASDAQ Global Select Market, NASDAQ Global Market and NASDAQ Capital Market are valued at the NASDAQ Official Closing Price (“NOCP”), or if lacking an NOCP, at the most recent bid quotations on the applicable NASDAQ Market. Unlisted equity securities (except unlisted preferred equity securities) are valued at the last sale price quoted in the market where they are traded most extensively or, if there is no reported sale during the day, the closing bid quotation as reported by an independent pricing service. If there is no last sale price or closing bid quotation available, unlisted equity securities will be valued using evaluated bids furnished by an independent pricing service, if available. In some foreign markets, an official close price and a last sale price may be available from the foreign exchange
Notes to Financial Statements (continued)
September 30, 2020
or market. In those cases, the official close price is used. Broker-dealer bid prices may be used to value debt and unlisted equity securities where an independent pricing service is unable to price a security or where an independent pricing service does not provide a reliable price for the security. Futures contracts are valued at the most recent settlement price on the exchange on which the adviser believes that, over time, they are traded most extensively.
Fund securities and other investments for which market quotations are not readily available are valued at fair value as determined in good faith by the adviser pursuant to procedures approved by the Board of Trustees. The Funds may also value securities and other investments at fair value in other circumstances such as when extraordinary events occur after the close of a foreign market but prior to the close of the New York Stock Exchange. This may include situations relating to a single issuer (such as a declaration of bankruptcy or a delisting of the issuer’s security from the primary market on which it has traded) as well as events affecting the securities markets in general (such as market disruptions or closings and significant fluctuations in U.S. and/or foreign markets). When fair valuing its securities or other investments, the Funds may, among other things, use modeling tools or other processes that may take into account factors such as securities or other market activity and/or significant events that occur after the close of the foreign market and before the time the Fund’s net asset value (“NAV”) is calculated. Fair value pricing may require subjective determinations about the value of a security, and fair values used to determine a Fund’s NAV may differ from quoted or published prices, or from prices that are used by others, for the same securities. In addition, the use of fair value pricing may not always result in adjustments to the prices of securities held by a Fund.
Illiquid securities for which market quotations are readily available and have been evaluated by the adviser are considered and classified as fair valued securities pursuant to the Funds’ pricing policies and procedures.
As of September 30, 2020, securities held by the Funds were fair valued as follows:
| | | | | | | | |
Fund | | Securities fair
valued by the
Fund’s adviser | | | Percentage of
Net Assets | |
Intermediate Duration Bond Fund | | $ | 7,685 | | | | Less than 0.1 | % |
Limited Term Government and Agency Fund | | | 2,501,798 | | | | 0.2 | % |
b. Investment Transactions and Related Investment Income. Investment transactions are accounted for on a trade date plus one day basis for daily NAV calculation. However, for financial reporting purposes, investment transactions are reported on trade date. Dividend income (including income reinvested) and foreign withholding tax, if applicable, is recorded on the ex-dividend date, or in the case of certain foreign securities, as soon as a Fund is notified, and interest income is recorded on an accrual
Notes to Financial Statements (continued)
September 30, 2020
basis. Interest income is increased by the accretion of discount and decreased by the amortization of premium, if applicable. Periodic principal adjustments for inflation-protected securities are recorded to interest income. Negative principal adjustments (in the event of deflation) are recorded as reductions of interest income to the extent of interest income earned, not to exceed the amount of positive principal adjustments on a cumulative basis. In determining net gain or loss on securities sold, the cost of securities has been determined on an identified cost basis. Investment income, non-class specific expenses and realized and unrealized gains and losses are allocated on a pro rata basis to each class based on the relative net assets of each class to the total net assets of the Fund.
c. Foreign Currency Translation. The books and records of the Funds are maintained in U.S. dollars. The values of securities, currencies and other assets and liabilities denominated in currencies other than U.S. dollars, if any, are translated into U.S. dollars based upon foreign exchange rates prevailing at the end of the period. Purchases and sales of investment securities, income and expenses are translated into U.S. dollars on the respective dates of such transactions.
Net realized foreign exchange gains or losses arise from sales of foreign currency, changes in exchange rates between the trade and settlement dates on securities transactions and the difference between the amounts of dividends, interest and foreign withholding taxes recorded on the Funds’ books and the U.S. dollar equivalent of the amounts actually received or paid. Net unrealized foreign exchange gains or losses arise from changes in the value of assets and liabilities, other than investment securities, as of the end of the fiscal period, resulting from changes in exchange rates.
The values of investment securities are presented at the foreign exchange rates prevailing at the end of the period for financial reporting purposes. Net realized and unrealized gains or losses on investments reported in the Statements of Operations reflect gains or losses resulting from changes in exchange rates and fluctuations which arise due to changes in market prices of investment securities.
The Funds may use foreign currency exchange contracts to facilitate transactions in foreign-denominated investments. Losses may arise from changes in the value of the foreign currency or if the counterparties do not perform under the contracts’ terms.
d. Futures Contracts. The Funds may enter into futures contracts. Futures contracts are agreements between two parties to buy and sell a particular instrument or index for a specified price on a specified future date.
When a Fund enters into a futures contract, it is required to deposit with (or for the benefit of) its broker an amount of cash or short-term high-quality securities as “initial margin.” As the value of the contract changes, the value of the futures contract position increases or declines. Subsequent payments, known as “variation margin,” are made or received by a Fund, depending on the price fluctuations in the fair value of
Notes to Financial Statements (continued)
September 30, 2020
the contract and the value of cash or securities on deposit with the broker. The aggregate principal amounts of the contracts are not recorded in the financial statements. Daily fluctuations in the value of the contracts are recorded in the Statements of Assets and Liabilities as a receivable (payable) and in the Statements of Operations as unrealized appreciation (depreciation) until the contracts are closed, when they are recorded as realized gains (losses). Realized gain or loss on a futures position is equal to the difference between the value of the contract at the time it was opened and the value at the time it was closed, minus brokerage commissions. When a Fund enters into a futures contract certain risks may arise, such as illiquidity in the futures market, which may limit a Fund’s ability to close out a futures contract prior to settlement date, and unanticipated movements in the value of securities or interest rates.
Futures contracts are exchange-traded. Exchange-traded futures contracts are standardized and are settled through a clearing house with fulfillment supported by the credit of the exchange. Therefore, counterparty credit risks to the Funds are reduced; however, in the event that a counterparty enters into bankruptcy, a Fund’s claim against initial/variation margin on deposit with the counterparty may be subject to terms of a final settlement in bankruptcy court.
e. When-Issued and Delayed Delivery Transactions. The Funds may enter into when-issued or delayed delivery transactions. When-issued refers to transactions made conditionally because a security, although authorized, has not been issued. Delayed delivery refers to transactions for which delivery or payment will occur at a later date, beyond the normal settlement period. The price of when-issued and delayed delivery securities and the date when the securities will be delivered and paid for are fixed at the time the transaction is negotiated. The security and the obligation to pay for it are recorded by the Funds at the time the commitment is entered into. The value of the security may vary with market fluctuations during the time before the Funds take delivery of the security. No interest accrues to the Funds until the transaction settles.
Delayed delivery transactions include those designated as To Be Announced (“TBAs”) in the Portfolios of Investments. For TBAs, the actual security that will be delivered to fulfill the transaction is not designated at the time of the trade. The security is “to be announced” 48 hours prior to the established trade settlement date. Certain transactions require the Funds or counterparty to post cash and/or securities as collateral for the net mark-to-market exposure to the other party. The Funds cover their net obligations under outstanding delayed delivery commitments by segregating or earmarking cash or securities at the custodian.
Purchases of when-issued or delayed delivery securities may have a similar effect on the Funds’ NAV as if the Funds’ had created a degree of leverage in the portfolio. Risks may arise upon entering into such transactions from the potential inability of counterparties to meet their obligations under the transactions. Additionally, losses may arise due to changes in the value of the underlying securities.
Notes to Financial Statements (continued)
September 30, 2020
There were no when-issued or delayed delivery securities held by the Funds as of September 30, 2020.
f. Federal and Foreign Income Taxes. The Trusts treat each Fund as a separate entity for federal income tax purposes. Each Fund intends to meet the requirements of the Internal Revenue Code of 1986, as amended, applicable to regulated investment companies, and to distribute to its shareholders substantially all of its net investment income and any net realized capital gains at least annually. Management has performed an analysis of each Fund’s tax positions for the open tax years as of September 30, 2020 and has concluded that no provisions for income tax are required. The Funds’ federal tax returns for the prior three fiscal years, where applicable, remain subject to examination by the Internal Revenue Service. Management is not aware of any events that are reasonably possible to occur in the next twelve months that would result in the amounts of any unrecognized tax benefits significantly increasing or decreasing for the Funds. However, management’s conclusions regarding tax positions taken may be subject to review and adjustment at a later date based on factors including, but not limited to, new tax laws and accounting regulations and interpretations thereof.
A Fund may be subject to foreign withholding taxes on investment income and taxes on capital gains on investments that are accrued and paid based upon the Fund’s understanding of the tax rules and regulations that exist in the countries in which the Fund invests. Foreign withholding taxes on dividend and interest income are reflected on the Statements of Operations as a reduction of investment income, net of amounts eligible to be reclaimed. Dividends and interest receivable on the Statements of Assets and Liabilities are net of foreign withholding taxes. Foreign withholding taxes where reclaims have been or will be filed are reflected on the Statements of Assets and Liabilities as tax reclaims receivable. Capital gains taxes paid are included in net realized gain (loss) on investments in the Statements of Operations. Accrued but unpaid capital gains taxes are reflected as foreign taxes payable on the Statements of Assets and Liabilities, if applicable, and reduce unrealized gains on investments. In the event that realized gains on investments are subsequently offset by realized losses, taxes paid on realized gains may be returned to a Fund. Such amounts, if applicable, are reflected as foreign tax rebates receivable on the Statements of Assets and Liabilities and are recorded as a realized gain when received.
g. Dividends and Distributions to Shareholders. Dividends and distributions are recorded on the ex-dividend date. The timing and characterization of certain income and capital gain distributions are determined in accordance with federal tax regulations, which may differ from accounting principles generally accepted in the United States of America. Permanent differences are primarily due to differing treatments for book and tax purposes of items such as deferred Trustees’ fees, premium amortization, futures contract mark-to-market and paydown gains and losses.
Notes to Financial Statements (continued)
September 30, 2020
Permanent book and tax basis differences relating to shareholder distributions will result in reclassifications to capital accounts. Temporary differences between book and tax distributable earnings are primarily due to deferred Trustees’ fees, wash sales, premium amortization, dividends payable, paydown gains and losses and futures contract mark-to-market. Amounts of income and capital gain available to be distributed on a tax basis are determined annually, and at other times during the Funds’ fiscal year as may be necessary to avoid knowingly declaring and paying a return of capital distribution. Distributions from net investment income and net realized short-term capital gains are reported as distributed from ordinary income for tax purposes.
The tax characterization of distributions is determined on an annual basis. The tax character of distributions paid to shareholders during the years ended September 30, 2020 and 2019 were as follows:
| | | | | | | | | | | | | | | | | | | | | | | | |
| | | 2020 Distributions Paid From: | | | 2019 Distributions Paid From: | |
Fund | | Ordinary
Income | | | Long-Term
Capital
Gains | | | Total | | | Ordinary
Income | | | Long-Term
Capital
Gains | | | Total | |
Intermediate Duration Bond Fund | | $ | 6,686,899 | | | $ | 27,607 | | | $ | 6,714,506 | | | $ | 5,986,529 | | | $ | — | | | $ | 5,986,529 | |
Limited Term Government and Agency Fund | | | 13,057,788 | | | | — | | | | 13,057,788 | | | | 16,591,331 | | | | — | | | | 16,591,331 | |
Distributions paid to shareholders from net investment income and net realized capital gains, based on accounting principles generally accepted in the United States of America, are consolidated and reported on the Statements of Changes in Net Assets as Distributions to Shareholders. Distributions paid to shareholders from net investment income and net realized capital gains expressed in per-share amounts, based on accounting principles generally accepted in the United States of America, are separately stated and reported within the Financial Highlights.
Notes to Financial Statements (continued)
September 30, 2020
As of September 30, 2020, the components of distributable earnings on a tax basis were as follows:
| | | | | | | | | | | | |
| | | Credit
Income Fund | | | Intermediate
Duration
Bond Fund | | | Limited Term
Government
and Agency
Fund | |
Undistributed ordinary income | | $ | 377 | | | $ | 7,557,084 | | | $ | 324,433 | |
Undistributed long-term capital gains | | | — | | | | 1,063,542 | | | | — | |
| | | | | | | | | | | | |
Total undistributed earnings | | | 377 | | | | 8,620,626 | | | | 324,433 | |
| | | | | | | | | | | | |
Capital loss carryforward: | | | | | | | | | | | | |
Long-term: | | | | | | | | | | | | |
No expiration date | | | — | | | | — | | | | (30,539,386 | ) |
| | | | | | | | | | | | |
Total capital loss carryforward | | | — | | | | — | | | | (30,539,386 | ) |
| | | | | | | | | | | | |
Unrealized appreciation (depreciation) | | | (85,095 | ) | | | 7,979,707 | | | | 15,966,347 | |
| | | | | | | | | | | | |
Total accumulated earnings (losses) | | $ | (84,718 | ) | | $ | 16,600,333 | | | $ | (14,248,606 | ) |
| | | | | | | | | | | | |
Capital loss carryforward utilized in the current year | | $ | — | | | $ | — | | | $ | 5,297,261 | |
| | | | | | | | | | | | |
As of September 30, 2020, the tax cost of investments (including derivatives, if applicable) and unrealized appreciation (depreciation) on a federal tax basis were as follows:
| | | | | | | | | | | | |
| | | Credit
Income Fund | | | Intermediate
Duration
Bond Fund | | | Limited Term
Government
and Agency
Fund | |
Federal tax cost | | $ | 23,797,083 | | | $ | 311,215,480 | | | $ | 976,758,197 | |
| | | | | | | | | | | | |
Gross tax appreciation | | $ | 17,618 | | | $ | 8,562,102 | | | $ | 19,094,186 | |
Gross tax depreciation | | | (102,713 | ) | | | (582,395 | ) | | | (3,127,839 | ) |
| | | | | | | | | | | | |
Net tax appreciation (depreciation) | | $ | (85,095 | ) | | $ | 7,979,707 | | | $ | 15,966,347 | |
| | | | | | | | | | | | |
h. Repurchase Agreements. Each Fund may enter into repurchase agreements, under the terms of a Master Repurchase Agreement, under which each Fund acquires securities as collateral and agrees to resell the securities at an agreed upon time and at an agreed upon price. It is each Fund’s policy that the market value of the collateral for repurchase agreements be at least equal to 102% of the repurchase price, including interest. Certain repurchase agreements are tri-party arrangements whereby the collateral is held in a segregated account for the benefit of the Fund and on behalf of the counterparty. Repurchase agreements could involve certain risks in the event of
Notes to Financial Statements (continued)
September 30, 2020
default or insolvency of the counterparty, including possible delays or restrictions upon a Fund’s ability to dispose of the underlying securities. As of September 30, 2020, Intermediate Duration Bond Fund and Limited Term Government and Agency Fund had investments in repurchase agreements for which the value of the related collateral exceeded the value of the repurchase agreement. The gross value of repurchase agreements is included in the Statements of Assets and Liabilities for financial reporting purposes.
i. Due from Brokers. Transactions and positions in certain futures contracts are maintained and cleared by registered U.S. broker/dealers pursuant to customer agreements between the Funds and the various broker/dealers. The due from broker balance in the Statements of Assets and Liabilities for Intermediate Duration Bond Fund represents cash pledged as initial margin for futures contracts. In certain circumstances the Fund’s use of cash held at brokers is restricted by regulation or broker mandated limits.
j. Securities Lending. Intermediate Duration Bond Fund and Limited Term Government and Agency Fund have entered into an agreement with State Street Bank and Trust Company (“State Street Bank”), as agent of the Funds, to lend securities to certain designated borrowers. The loans are collateralized with cash or securities in an amount equal to at least 105% or 102% of the market value (including accrued interest) of the loaned international or domestic securities, respectively, when the loan is initiated. Thereafter, the value of the collateral must remain at least 102% of the market value (including accrued interest) of loaned securities for U.S. equities and U.S. corporate debt; at least 105% of the market value (including accrued interest) of loaned securities for non-U.S. equities; and at least 100% of the market value (including accrued interest) of loaned securities for U.S. Government securities, sovereign debt issued by non-U.S. Governments and non-U.S. corporate debt. In the event that the market value of the collateral falls below the required percentages described above, the borrower will deliver additional collateral on the next business day. As with other extensions of credit, the Funds may bear the risk of loss with respect to the investment of the collateral. The Funds invest cash collateral in short-term investments, a portion of the income from which is remitted to the borrowers and the remainder allocated between the Funds and State Street Bank as lending agent.
For the year ended September 30, 2020, neither Fund had loaned securities under this agreement.
k. Indemnifications. Under the Trusts’ organizational documents, their officers and Trustees are indemnified against certain liabilities arising out of the performance of their duties to the Funds. Additionally, in the normal course of business, the Funds enter into contracts with service providers that contain general indemnification clauses. The Funds’ maximum exposure under these arrangements is unknown as this would involve future claims that may be made against the Funds that have not yet occurred. However, based on experience, the Funds expect the risk of loss to be remote.
Notes to Financial Statements (continued)
September 30, 2020
l. New Accounting Pronouncement. In August 2018, the Financial Accounting Standards Board (“FASB”) issued Accounting Standards Update 2018-13, Fair Value Measurement (Topic 820): Disclosure Framework — Changes to the Disclosure Requirements for Fair Value Measurement (“ASU 2018-13”). The update introduces new fair value disclosure requirements, eliminates some prior fair value disclosure requirements, and modifies certain existing fair value disclosure requirements. ASU 2018-13 is effective for fiscal years beginning after December 15, 2019, including interim periods within those fiscal years. An entity is permitted to early adopt any eliminated or modified disclosures upon issuance of the update and delay adoption of any new disclosures until the required effective date. Management has evaluated the impact of the adoption of ASU 2018-13 and has determined to early adopt the removal of (i) the amount of and reasons for transfers between Level 1 and Level 2 of the fair value hierarchy and (ii) the policy for timing of transfers between levels. Amended disclosures required and permitted for early adoption by ASU 2018-13 have been incorporated in the Funds’ annual financial statements as of September 30, 2020.
In March 2020, the FASB issued Accounting Standard Update 2020-04, Reference Rate Reform (Topic 848) (“ASU 2020-04”). In response to concerns about structural risks of interbank offered rates, and particularly the risk of cessation of the London Interbank Offered Rate (“LIBOR”), which is expected to occur no later than December 31, 2021, regulators have undertaken reference rate reform initiatives to identify alternative reference rates that are more observable or transaction based and less susceptible to manipulation. ASU 2020-04 provides temporary guidance to ease the potential burden in accounting for (or recognizing the effects of) reference rate reform on financial reporting. ASU 2020-04 is elective and applies to all entities, subject to meeting certain criteria, that have contracts that reference LIBOR or another reference rate expected to be discontinued because of reference rate reform. ASU 2020-04 amendments offer optional expedients for contract modifications that would allow an entity to account for such modifications by prospectively adjusting the effective interest rate, instead of evaluating each contract, in accordance with existing accounting standards, as to whether reference rate modifications constitute the establishment of new contracts or the continuation of existing contracts. ASU 2020-04 amendments are currently effective and an entity may elect to apply its provisions as of any date from the beginning of an interim period that includes or is subsequent to March 12, 2020. No Fund contracts have yet been impacted by reference rate reform. Management expects to apply the optional expedients when appropriate.
3. Fair Value Measurements. In accordance with accounting standards related to fair value measurements and disclosures, the Funds have categorized the inputs utilized in determining the value of each Fund’s assets or liabilities. These inputs are summarized in the three broad levels listed below:
| | • | | Level 1 – quoted prices in active markets for identical assets or liabilities; |
Notes to Financial Statements (continued)
September 30, 2020
| | • | | Level 2 – prices determined using other significant inputs that are observable either directly, or indirectly through corroboration with observable market data (which could include quoted prices for similar assets or liabilities, interest rates, credit risk, etc.); and |
| | • | | Level 3 – prices determined using significant unobservable inputs when quoted prices or observable inputs are unavailable such as when there is little or no market activity for an asset or liability (unobservable inputs reflect each Fund’s own assumptions in determining the fair value of assets or liabilities and would be based on the best information available). |
The inputs or methodology used for valuing securities are not necessarily an indication of the risk associated with investing in those securities.
The Funds’ pricing policies and procedures are recommended by the adviser and approved by the Board of Trustees. Debt securities are valued based on evaluated bids furnished to the Funds by an independent pricing service. Broker-dealer bid prices may be used if an independent pricing service either is unable to price a security or does not provide a reliable price for a security. The Funds’ adviser may use internally developed models to validate broker-dealer bid prices that are only available from a single broker or market maker. Such securities are considered and classified as fair valued. Broker-dealer bid prices for which the Funds do not have knowledge of the inputs used by the broker-dealer are categorized in Level 3. Securities for which market quotations are not readily available are valued at fair value as determined in good faith by the Funds’ adviser pursuant to procedures approved by the Board of Trustees. Fair valued securities may be categorized in Level 3.
The following is a summary of the inputs used to value the Funds’ investments as of September 30, 2020, at value:
Credit Income Fund
Asset Valuation Inputs
| | | | | | | | | | | | | | | | |
Description | | Level 1 | | | Level 2 | | | Level 3 | | | Total | |
Bonds and Notes(a) | | $ | — | | | $ | 23,398,602 | | | $ | — | | | $ | 23,398,602 | |
Preferred Stocks | | | | | | | | | | | | | | | | |
Banking | | | 126,622 | | | | — | | | | — | | | | 126,622 | |
Food & Beverage | | | — | | | | 186,764 | | | | — | | | | 186,764 | |
| | | | | | | | | | | | | | | | |
Total Preferred Stocks | | | 126,622 | | | | 186,764 | | | | — | | | | 313,386 | |
| | | | | | | | | | | | | | | | |
Total | | $ | 126,622 | | | $ | 23,585,366 | | | $ | — | | | $ | 23,711,988 | |
| | | | | | | | | | | | | | | | |
| (a) | Details of the major categories of the Fund's investments are reflected within the Portfolio of Investments. |
Notes to Financial Statements (continued)
September 30, 2020
Intermediate Duration Bond Fund
Asset Valuation Inputs
| | | | | | | | | | | | | | | | |
Description | | Level 1 | | | Level 2 | | | Level 3 | | | Total | |
Bonds and Notes | | | | | | | | | | | | | | | | |
ABS Home Equity | | $ | — | | | $ | 392,365 | | | $ | 3,643 | (b) | | $ | 396,008 | |
Collateralized Mortgage Obligations | | | — | | | | 6,558,443 | | | | 4,042 | (b) | | | 6,562,485 | |
All Other Bonds and Notes(a) | | | — | | | | 305,351,117 | | | | — | | | | 305,351,117 | |
| | | | | | | | | | | | | | | | |
Total Bonds and Notes | | | — | | | | 312,301,925 | | | | 7,685 | | | | 312,309,610 | |
| | | | | | | | | | | | | | | | |
Short-Term Investments | | | — | | | | 6,885,577 | | | | — | | | | 6,885,577 | |
| | | | | | | | | | | | | | | | |
Total Investments | | | — | | | | 319,187,502 | | | | 7,685 | | | | 319,195,187 | |
| | | | | | | | | | | | | | | | |
Futures Contracts (unrealized appreciation) | | | 27,507 | | | | — | | | | — | | | | 27,507 | |
| | | | | | | | | | | | | | | | |
Total | | $ | 27,507 | | | $ | 319,187,502 | | | $ | 7,685 | | | $ | 319,222,694 | |
| | | | | | | | | | | | | | | | |
| | | | |
| Liability Valuation Inputs | | | | | | | | | | | | |
| | | | |
Description | | Level 1 | | | Level 2 | | | Level 3 | | | Total | |
Futures Contracts (unrealized depreciation) | | $ | (14,348 | ) | | $ | — | | | $ | — | | | $ | (14,348 | ) |
| | | | | | | | | | | | | | | | |
| (a) | Details of the major categories of the Fund’s investments are reflected within the Portfolio of Investments. |
| (b) | Fair valued by the Fund’s adviser. |
Limited Term Government and Agency Fund
Asset Valuation Inputs
| | | | | | | | | | | | | | | | |
Description | | Level 1 | | | Level 2 | | | Level 3 | | | Total | |
Bonds and Notes | | | | | | | | | | | | | | | | |
Collateralized Mortgage Obligations | | $ | — | | | $ | 182,589,845 | | | $ | 2,501,798 | (b) | | $ | 185,091,643 | |
All Other Bonds and Notes(a) | | | — | | | | 743,541,421 | | | | — | | | | 743,541,421 | |
| | | | | | | | | | | | | | | | |
Total Bonds and Notes | | | — | | | | 926,131,266 | | | | 2,501,798 | | | | 928,633,064 | |
| | | | | | | | | | | | | | | | |
Short-Term Investments | | | — | | | | 64,091,480 | | | | — | | | �� | 64,091,480 | |
| | | | | | | | | | | | | | | | |
Total | | $ | — | | | $ | 990,222,746 | | | $ | 2,501,798 | | | $ | 992,724,544 | |
| | | | | | | | | | | | | | | | |
| (a) | Details of the major categories of the Fund’s investments are reflected within the Portfolio of Investments. |
| (b) | Fair valued by the Fund’s adviser. |
Notes to Financial Statements (continued)
September 30, 2020
The following is a reconciliation of Level 3 investments for which significant unobservable inputs were used to determine fair value as of September 30, 2019 and/or September 30, 2020:
Intermediate Duration Bond Fund
Asset Valuation Inputs
| | | | | | | | | | | | | | | | | | | | |
Investments in Securities | | Balance as of
September 30,
2019 | | | Accrued
Discounts
(Premiums) | | | Realized
Gain
(Loss) | | | Change in
Unrealized
Appreciation
(Depreciation) | | | Purchases | |
Bonds and Notes | | | | | | | | | | | | | | | | | | | | |
ABS Car Loan | | $ | 660,000 | | | $ | — | | | $ | — | | | $ | — | | | $ | — | |
ABS Home Equity | | | 16,609 | | | | — | | | | (53 | ) | | | 596 | | | | — | |
Collateralized Mortgage Obligations | | | — | | | | — | | | | (223 | ) | | | 352 | | | | — | |
| | | | | | | | | | | | | | | | | | | | |
Total | | $ | 676,609 | | | $ | — | | | $ | (276 | ) | | $ | 948 | | | $ | — | |
| | | | | | | | | | | | | | | | | | | | |
| | | | | |
Investments in Securities | | Sales | | | Transfers
into Level 3 | | | Transfers
out of
Level 3 | | | Balance as of
September 30,
2020 | | | Change in
Unrealized
Appreciation
(Depreciation)
from
Investments
Still Held at
September 30,
2020 | |
Bonds and Notes | | | | | | | | | | | | | | | | | | | | |
ABS Car Loan | | $ | — | | | $ | — | | | $ | (660,000 | ) | | $ | — | | | $ | — | |
ABS Home Equity | | | (13,509 | ) | | | — | | | | — | | | | 3,643 | | | | — | |
Collateralized Mortgage Obligations | | | (19,582 | ) | | | 23,495 | | | | — | | | | 4,042 | | | | 352 | |
| | | | | | | | | | | | | | | | | | | | |
Total | | $ | (33,091 | ) | | $ | 23,495 | | | $ | (660,000 | ) | | $ | 7,685 | | | $ | 352 | |
| | | | | | | | | | | | | | | | | | | | |
A debt security valued at $660,000 was transferred from Level 3 to Level 2 during the period ended September 30, 2020. At September 30, 2019, this security was valued using broker-dealer bid prices based on inputs unobservable to the Fund as an independent pricing service was unable to price the security. At September 30, 2020 this security was valued on the basis of evaluated bids furnished to the Fund by an independent pricing service in accordance with the Fund’s valuation policies.
Notes to Financial Statements (continued)
September 30, 2020
A debt security valued at $23,495 was transferred from Level 2 to Level 3 during the period ended September 30, 2020. At September 30, 2019, this security was valued on the basis of evaluated bids furnished to the Fund by an independent pricing service in accordance with the Fund’s valuation policies. At September 30, 2020 this security was valued at fair value as determined in good faith by the Fund’s adviser as an independent pricing service did not provide a reliable price for the security.
Limited Term Government and Agency Fund
Asset Valuation Inputs
| | | | | | | | | | | | | | | | | | | | |
Investments in Securities | | Balance as of
September 30,
2019 | | | Accrued
Discounts
(Premiums) | | | Realized
Gain
(Loss) | | | Change in
Unrealized
Appreciation
(Depreciation) | | | Purchases | |
Bonds and Notes | | | | | | | | | | | | | | | | | | | | |
Collateralized Mortgage Obligations | | $ | 1,744,293 | | | $ | — | | | $ | (220,975 | ) | | $ | 233,933 | | | $ | 635,051 | |
| | | | | | | | | | | | | | | | | | | | |
| | | | | |
Investments in Securities | | Sales | | | Transfers
into Level 3 | | | Transfers
out of
Level 3 | | | Balance as of
September 30,
2020 | | | Change in
Unrealized
Appreciation
(Depreciation)
from
Investments
Still Held at
September 30,
2020 | |
Bonds and Notes | | | | | | | | | | | | | | | | | | | | |
Collateralized Mortgage Obligations | | $ | (6,090,654 | ) | | $ | 6,200,150 | | | $ | — | | | $ | 2,501,798 | | | $ | 211,625 | |
| | | | | | | | | | | | | | | | | | | | |
Debt securities valued at $6,200,150 were transferred from Level 2 to Level 3 during the period ended September 30, 2020. At September 30, 2019, these securities were valued on the basis of evaluated bids furnished to the Fund by an independent pricing service in accordance with the Fund’s valuation policies. At September 30, 2020 these securities were valued at fair value as determined in good faith by the Fund’s adviser as an independent pricing service did not provide a reliable price for the securities.
4. Derivatives. Derivative instruments are defined as financial instruments whose value and performance are based on the value and performance of an underlying asset, reference rate or index. Derivative instruments that Intermediate Duration Bond Fund used during the period include futures contracts.
Notes to Financial Statements (continued)
September 30, 2020
Intermediate Duration Bond Fund is subject to the risk that changes in interest rates will affect the value of the Fund’s investments in fixed-income securities. A Fund will be subject to increased interest rate risk to the extent that it invests in fixed-income securities with longer maturities or durations, as compared to investing in fixed-income securities with shorter maturities or durations. The Fund may use futures contracts to hedge against changes in interest rates and to manage its duration in order to control interest rate risk without having to buy or sell portfolio securities. During the year ended September 30, 2020, Intermediate Duration Bond Fund used futures contracts to manage duration.
The following is a summary of derivative instruments for Intermediate Duration Bond Fund as of September 30, 2020, as reflected within the Statements of Assets and Liabilities:
| | | | |
Assets | | Unrealized
appreciation
on futures
contracts | |
Exchange-traded asset derivatives | |
Interest rate contracts | | $ | 27,507 | |
| |
Liabilities | | Unrealized
depreciation
on futures
contracts | |
Exchange-traded liability derivatives | |
Interest rate contracts | | | $(14,348) | |
Transactions in derivative instruments for Intermediate Duration Bond Fund during the year ended September 30, 2020, as reflected within the Statements of Operations, were as follows:
| | | | |
Net Realized Gain (Loss) on: | | Futures
contracts | |
Interest rate contracts | | $ | 897,346 | |
| |
Net Change in Unrealized
Appreciation (Depreciation) on: | | Futures
contracts | |
Interest rate contracts | | $ | 127,503 | |
As the Fund values its derivatives at fair value and recognizes changes in fair value through the Statement of Operations, it does not qualify for hedge accounting under authoritative guidance for derivative instruments. The Fund’s investments in derivatives may represent an economic hedge; however, they are considered to be non-hedge transactions for the purpose of these disclosures.
Notes to Financial Statements (continued)
September 30, 2020
The volume of futures contract activity, as a percentage of net assets, based on gross month-end notional amounts outstanding during the period, including long and short positions at absolute value, was as follows for the year ended September 30, 2020:
| | | | |
Intermediate Duration Bond Fund | | Futures | |
Average Notional Amount Outstanding | | | 8.63 | % |
Highest Notional Amount Outstanding | | | 10.58 | % |
Lowest Notional Amount Outstanding | | | 7.91 | % |
Notional Amount Outstanding as of September 30, 2020 | | | 7.91 | % |
Notional amounts outstanding at the end of the prior period are included in the average notional amount outstanding.
Unrealized gain and/or loss on open futures is recorded in the Statements of Assets and Liabilities. The aggregate notional values of futures contracts are not recorded in the Statements of Assets and Liabilities, and therefore are not included in the Funds’ net assets.
Counterparty risk is managed based on policies and procedures established by each Fund’s adviser. Such policies and procedures may include, but are not limited to, minimum counterparty credit rating requirements, monitoring of counterparty credit default swap spreads and posting of collateral. With exchange-traded derivatives, there is minimal counterparty credit risk to the Fund because the exchange’s clearing house, as counterparty to these instruments, stands between the buyer and the seller of the contract. Credit risk still exists in exchange-traded derivatives with respect to initial and variation margin that is held in a broker’s customer accounts. While brokers are required to segregate customer margin from their own assets, in the event that a broker becomes insolvent or goes into bankruptcy and at that time there is a shortfall in the aggregate amount of margin held by the broker for all its clients, U.S. bankruptcy laws will typically allocate that shortfall on a pro rata basis across all of the broker’s customers, potentially resulting in losses to the Fund. Based on balances reflected on each Fund’s Statement of Assets and Liabilities, the following table shows the maximum amount of loss due to credit risk that, based on the gross fair value of the financial instrument, the Fund would incur if parties (including brokers holding margin for exchange-traded derivatives) to the relevant financial instruments failed completely to perform according to the terms of the contracts and the collateral or other security, if any, for the amount due proved to be of no value to the Fund:
| | | | | | | | |
Fund | | Maximum Amount
of Loss - Gross | | | Maximum Amount
of Loss - Net | |
Intermediate Duration Bond Fund | | $ | 165,000 | | | $ | 165,000 | |
Notes to Financial Statements (continued)
September 30, 2020
5. Purchases and Sales of Securities. For the year ended September 30, 2020, purchases and sales of securities (excluding short-term investments and including paydowns) were as follows:
| | | | | | | | | | | | | | | | |
| | | U.S. Government/Agency
Securities | | | Other Securities | |
Fund | | Purchases | | | Sales | | | Purchases | | | Sales | |
Credit Income Fund | | $ | 861,014 | | | $ | — | | | $ | 22,936,069 | | | $ | — | |
Intermediate Duration Bond Fund | | | 126,439,297 | | | | 115,589,112 | | | | 262,167,673 | | | | 208,106,677 | |
Limited Term Government and Agency Fund | | | 2,396,433,481 | | | | 2,470,976,424 | | | | 398,722,091 | | | | 64,212,759 | |
6. Management Fees and Other Transactions with Affiliates.
a. Management Fees. Loomis, Sayles & Company, L.P. (“Loomis Sayles”) serves as investment adviser to each Fund. Loomis Sayles is a limited partnership whose sole general partner, Loomis, Sayles & Company, Inc., is indirectly owned by Natixis, which is part of Natixis Investment Managers, an international asset management group based in Paris, France.
Under the terms of the management agreements, each Fund pays a management fee at the following annual rates, calculated daily and payable monthly, based on each Fund’s average daily net assets:
| | | | | | | | |
| | | Percentage of Average Daily
Net Assets | |
Fund | | First
$500 million | | | Over
$500 million | |
Credit Income Fund | | | 0.4200 | % | | | 0.4200 | % |
Intermediate Duration Bond Fund | | | 0.2500 | % | | | 0.2500 | % |
Limited Term Government and Agency Fund | | | 0.3250 | % | | | 0.3000 | % |
Prior to July 1, 2020, Limited Term Government and Agency Fund paid a management fee at the following annual rates, calculated daily and payable monthly, based on the Fund’s average daily net assets:
| | | | | | | | | | | | |
| | | Percentage of Average Daily
Net Assets | |
Fund | | First
$500 million | | | Next
$1.5 billion | | | Over
$2 billion | |
Limited Term Government and Agency Fund | | | 0.3750 | % | | | 0.3500 | % | | | 0.3000 | % |
Notes to Financial Statements (continued)
September 30, 2020
Loomis Sayles has given binding undertakings to the Funds to waive management fees and/or reimburse certain expenses to limit the Funds’ operating expenses, exclusive of acquired fund fees and expenses, brokerage expenses, interest expense, taxes, organizational and extraordinary expenses such as litigation and indemnification expenses. These undertakings are in effect until January 31, 2022, except for Intermediate Duration Bond Fund, which is in effect until January 31, 2021, may be terminated before then only with the consent of the Funds’ Board of Trustees, and are reevaluated on an annual basis. Management fees payable, as reflected on the Statements of Assets and Liabilities, is net of waivers and/or expense reimbursements, if any, pursuant to these undertakings. Waivers/reimbursements that exceed management fees payable are reflected on the Statements of Assets and Liabilities as receivable from investment adviser.
For the year ended September 30, 2020 the expense limits as a percentage of average daily net assets under the expense limitation agreements were as follows:
| | | | | | | | | | | | | | | | |
| | | Expense Limit as a Percentage of
Average Daily Net Assets | |
Fund | | Class A | | | Class C | | | Class N | | | Class Y | |
Credit Income Fund | | | 0.82 | % | | | 1.57 | % | | | 0.52 | % | | | 0.57 | % |
Intermediate Duration Bond Fund | | | 0.65 | % | | | 1.40 | % | | | 0.35 | % | | | 0.40 | % |
Limited Term Government and Agency Fund | | | 0.75 | % | | | 1.50 | % | | | 0.45 | % | | | 0.50 | % |
Prior to July 1, 2020, the expense limits as a percentage of average daily net assets under the expense limitation agreement for Limited Term Government and Agency Fund were as follows:
| | | | | | | | | | | | | | | | |
| | | Expense Limit as a Percentage of
Average Daily Net Assets | |
Fund | | Class A | | | Class C | | | Class N | | | Class Y | |
Limited Term Government and Agency Fund | | | 0.80 | % | | | 1.55 | % | | | 0.50 | % | | | 0.55 | % |
Loomis Sayles shall be permitted to recover expenses borne under the expense limitation agreements (whether through waiver of management fees or otherwise) on a class by class basis in later periods to the extent the annual operating expenses of a class fall below a class’ expense limits, provided, however, that a class is not obligated to pay such waived/reimbursed fees or expenses more than one year after the end of the fiscal year in which the fees or expenses were waived/reimbursed.
Notes to Financial Statements (continued)
September 30, 2020
For the year ended September 30, 2020, the management fees and waivers of management fees for each Fund were as follows:
| | | | | | | | | | | | | | | | | | | | |
| | | Gross
Management
Fees | | | Contractual
Waivers of
Management
Fees1 | | | Net
Management
Fees | | | Percentage of
Average Daily
Net Assets | |
Fund | | Gross | | | Net | |
Credit Income Fund | | $ | 287 | | | $ | 287 | | | $ | — | | | | 0.42 | % | | | — | % |
Intermediate Duration Bond Fund | | | 666,934 | | | | 173,820 | | | | 493,114 | | | | 0.25 | % | | | 0.18 | % |
Limited Term Government and Agency Fund | | | 3,080,893 | | | | — | | | | 3,080,893 | | | | 0.35 | % | | | 0.35 | % |
| 1 | Waiver/expense reimbursements are subject to possible recovery until September 30, 2021. |
In addition, Loomis Sayles reimbursed non-class specific expenses of Credit Income Fund in the amount of $18,431. Expense reimbursements are subject to possible recovery until September 30, 2021.
For the year ended September 30, 2020, expense reimbursements related to the prior fiscal year were recovered as follows:
| | | | |
Fund | | Recovered Expenses | |
Limited Term Government and Agency Fund | | $ | 13,326 | |
b. Service and Distribution Fees. Natixis Distribution, L.P. (“Natixis Distribution), which is a wholly-owned subsidiary of Natixis, has entered into a distribution agreement with the Trusts. Pursuant to this agreement, Natixis Distribution serves as principal underwriter of the Funds of the Trusts.
Pursuant to Rule 12b-1 under the 1940 Act, the Trusts have adopted a Service Plan relating to each Fund’s Class A shares (the “Class A Plans”) and a Distribution and Service Plan relating to each Fund’s Class C shares (the “Class C Plans”).
Under the Class A Plans, each Fund pays Natixis Distribution a monthly service fee at an annual rate not to exceed 0.25% of the average daily net assets attributable to the Fund’s Class A shares, as reimbursement for expenses incurred by Natixis Distribution in providing personal services to investors in Class A shares and/or the maintenance of shareholder accounts.
Under the Class C Plans, each Fund pays Natixis Distribution a monthly service fee at an annual rate not to exceed 0.25% of the average daily net assets attributable to the Fund’s Class C shares, as compensation for services provided by Natixis Distribution in providing personal services to investors in Class C shares and/or the maintenance of shareholder accounts.
Notes to Financial Statements (continued)
September 30, 2020
Also under the Class C Plans, each Fund pays Natixis Distribution a monthly distribution fee at the annual rate of 0.75% of the average daily net assets attributable to the Fund’s Class C shares, as compensation for services provided by Natixis Distribution in connection with the marketing or sale of Class C shares.
For the year ended September 30, 2020, the service and distribution fees for each Fund were as follows:
| | | | | | | | | | | | |
| | | Service Fees | | | Distribution
Fees | |
Fund | | Class A | | | Class C | | | Class C | |
Credit Income Fund | | $ | — | 1 | | $ | — | 1 | | $ | — | 1 |
Intermediate Duration Bond Fund | | | 53,217 | | | | 1,424 | | | | 4,272 | |
Limited Term Government and Agency Fund | | | 770,258 | | | | 54,884 | | | | 164,651 | |
For the year ended September 30, 2020, Natixis Distribution refunded Limited Term Government and Agency Fund $1,420 of prior year Class A service fees paid to Natixis Distribution in excess of amounts subsequently paid to securities dealers or financial intermediaries. Service and distribution fees on the Statements of Operations have been reduced by these amounts.
c. Administrative Fees. Natixis Advisors, L.P. (“Natixis Advisors”) provides certain administrative services for the Funds and contracts with State Street Bank to serve as sub-administrator. Natixis Advisors is a wholly-owned subsidiary of Natixis. Pursuant to an agreement among Natixis Funds Trusts, Loomis Sayles Funds Trusts, Natixis ETF Trusts and Natixis Advisors, each Fund pays Natixis Advisors monthly its pro rata portion of fees equal to an annual rate of 0.0540% of the first $15 billion of the average daily net assets of the Natixis Funds Trusts, Loomis Sayles Funds Trusts and Natixis ETF Trusts, 0.0500% of the next $15 billion, 0.0400% of the next $30 billion, 0.0275% of the next $30 billion and 0.0225% of such assets in excess of $90 billion, subject to an annual aggregate minimum fee for the Natixis Funds Trusts, Loomis Sayles Funds Trusts and Natixis ETF Trusts of $10 million, which is reevaluated on an annual basis.
For the year ended September 30, 2020, the administrative fees for each Fund were as follows:
| | | | |
Fund | | Administrative
Fees | |
Credit Income Fund | | $ | 30 | |
Intermediate Duration Bond Fund | | | 117,918 | |
Limited Term Government and Agency Fund | | | 390,053 | |
d. Sub-Transfer Agent Fees. Natixis Distribution has entered into agreements, which include servicing agreements, with financial intermediaries that provide
Notes to Financial Statements (continued)
September 30, 2020
recordkeeping, processing, shareholder communications and other services to customers of the intermediaries that hold positions in the Funds and has agreed to compensate the intermediaries for providing those services. Intermediaries transact with the Funds primarily through the use of omnibus accounts on behalf of their customers who hold positions in the Funds. These services would have been provided by the Funds’ transfer agent and other service providers if the shareholders’ accounts were maintained directly at the Funds’ transfer agent. Accordingly, the Funds have agreed to reimburse Natixis Distribution for all or a portion of the servicing fees paid to these intermediaries. The reimbursement amounts (sub-transfer agent fees) paid to Natixis Distribution are subject to a current per-account equivalent fee limit approved by the Funds’ Board of Trustees, which is based on fees for similar services paid to the Funds’ transfer agent and other service providers. Class N shares do not bear such expenses.
For the year ended September 30, 2020, the sub-transfer agent fees (which are reflected in transfer agent fees and expenses in the Statements of Operations) for each Fund were as follows:
| | | | |
Fund | | Sub-Transfer
Agent Fees | |
Intermediate Duration Bond Fund | | $ | 180,962 | |
Limited Term Government and Agency Fund | | | 450,370 | |
As of September 30, 2020, the Funds owe Natixis Distribution the following reimbursements for sub-transfer agent fees (which are reflected in the Statements of Assets and Liabilities as payable to distributor):
| | | | |
Fund | | Reimbursements
of Sub-Transfer
Agent Fees | |
Intermediate Duration Bond Fund | | $ | 2,517 | |
Limited Term Government and Agency Fund | | | 12,954 | |
Sub-transfer agent fees attributable to Class A, Class C and Class Y are allocated on a pro rata basis to each class based on the relative net assets of each class to the total net assets of those classes.
e. Commissions. Commissions (including CDSCs) on Fund shares retained by Natixis Distribution during the year ended September 30, 2020 were as follows:
| | | | |
Fund | | Commissions | |
Limited Term Government and Agency Fund | | $ | 63,379 | |
f. Trustees Fees and Expenses. The Trusts do not pay any compensation directly to their officers or Trustees who are directors, officers or employees of Natixis Advisors, Natixis Distribution, Natixis or their affiliates. The Chairperson of the Board of Trustees
Notes to Financial Statements (continued)
September 30, 2020
receives a retainer fee at the annual rate of $369,000. The Chairperson does not receive any meeting attendance fees for Board of Trustees meetings or committee meetings that he attends. Each Independent Trustee (other than the Chairperson) receives, in the aggregate, a retainer fee at the annual rate of $199,000. Each Independent Trustee also receives a meeting attendance fee of $10,000 for each meeting of the Board of Trustees that he or she attends in person and $5,000 for each meeting of the Board of Trustees that he or she attends telephonically. In addition, the chairperson of the Contract Review Committee, the chairperson of the Audit Committee and the chairperson of the Governance Committee each receive an additional retainer fee at the annual rate of $20,000. Each Contract Review Committee member is compensated $6,000 for each Committee meeting that he or she attends in person and $3,000 for each meeting that he or she attends telephonically. Each Audit Committee member is compensated $6,000 for each Committee meeting that he or she attends in person and $3,000 for each meeting that he or she attends telephonically. These fees are allocated among the funds in the Natixis Funds Trusts, Loomis Sayles Funds Trusts and Natixis ETF Trusts based on a formula that takes into account, among other factors, the relative net assets of each fund. Trustees are reimbursed for travel expenses in connection with attendance at meetings.
Prior to January 1, 2020, the Chairperson of the Board received a retainer fee at the annual rate of $360,000 and each Independent Trustee (other than the Chairperson) received, in the aggregate, a retainer fee at the annual rate of $190,000, and the chairperson of the Governance Committee received an additional retainer fee at the annual rate of $15,000. All other Trustee fees remained unchanged.
A deferred compensation plan (the “Plan”) is available to the Trustees on a voluntary basis. Deferred amounts remain in the Funds until distributed in accordance with the provisions of the Plan. The value of a participating Trustee’s deferral account is based on theoretical investments of deferred amounts, on the normal payment dates, in certain funds of the Natixis Funds Trusts, Loomis Sayles Funds Trusts and Natixis ETF Trusts as designated by the participating Trustees. Changes in the value of participants’ deferral accounts are allocated pro rata among the funds in the Natixis Funds Trusts, Loomis Sayles Funds Trusts and Natixis ETF Trusts, and are normally reflected as Trustees’ fees and expenses in the Statements of Operations. The portions of the accrued obligations allocated to the Funds under the Plan are reflected as Deferred Trustees’ fees in the Statements of Assets and Liabilities.
Certain officers and employees of Natixis Advisors and Loomis Sayles are also officers and/or Trustees of the Trusts.
Notes to Financial Statements (continued)
September 30, 2020
g. Affiliated Ownership. As of September 30, 2020, the percentage of each Fund’s net assets owned by affiliates is as follows:
| | | | |
Credit Income Fund | | Percentage of
Net Assets | |
Natixis and Affiliates | | | 100 | % |
| | | | |
Intermediate Duration Bond Fund | | Percentage of
Net Assets | |
Loomis Sayles Employees’ Profit Sharing Retirement Plan | | | 0.84 | % |
| | | | |
Limited Term Government and Agency Fund | | Percentage of
Net Assets | |
Loomis Sayles Employees’ Profit Sharing Retirement Plan | | | 0.19 | % |
Loomis Sayles Distribution | | | 0.13 | % |
Natixis Sustainable Future 2015 Fund | | | 0.08 | % |
Natixis Sustainable Future 2020 Fund | | | 0.05 | % |
Natixis Sustainable Future 2025 Fund | | | 0.05 | % |
Natixis Sustainable Future 2030 Fund | | | 0.04 | % |
Natixis Sustainable Future 2035 Fund | | | 0.03 | % |
Natixis Sustainable Future 2040 Fund | | | 0.01 | % |
Natixis Sustainable Future 2045 Fund | | | 0.01 | % |
Investment activities of affiliated shareholders could have material impacts on the Funds.
h. Reimbursement of Transfer Agent Fees and Expenses. Natixis Advisors has given a binding contractual undertaking to the Funds to reimburse any and all transfer agency expenses for the Funds’ Class N shares. This undertaking is in effect through January 31, 2021, except for Credit Income Fund, which is in effect until January 31, 2022, and is not subject to recovery under the expense limitation agreement described above.
For the year ended September 30, 2020, Natixis Advisors reimbursed the Funds for transfer agency expenses as follows:
| | | | |
| | | Reimbursement of
Transfer Agency
Expenses | |
Fund | | Class N | |
Credit Income Fund | | $ | 4 | |
Intermediate Duration Bond Fund | | | 1,310 | |
Limited Term Government and Agency Fund | | | 1,425 | |
Notes to Financial Statements (continued)
September 30, 2020
i. Payment by Affiliates. For the year ended September 30, 2020, Loomis Sayles reimbursed Limited Term Government and Agency Fund $25,439 in connection with a trading error. This amount is included in realized gains in the Statement of Operations.
7. Class-Specific Transfer Agent Fees and Expenses. Transfer agent fees and expenses attributable to Class A, Class C, and Class Y are allocated on a pro rata basis to each class based on the relative net assets of each class to the total net assets of those classes. Transfer agent fees and expenses attributable to Class N are allocated to Class N.
For the year ended September 30, 2020, the Funds incurred the following class-specific transfer agent fees and expenses (including sub-transfer agent fees, where applicable):
| | | | | | | | | | | | | | | | |
| | | Transfer Agent Fees and Expenses | |
Fund | | Class A | | | Class C | | | Class N | | | Class Y | |
Credit Income Fund | | $ | 3 | | | $ | 3 | | | $ | 4 | | | $ | 2 | |
Intermediate Duration Bond Fund | | | 15,484 | | | | 409 | | | | 1,310 | | | | 175,225 | |
Limited Term Government and Agency Fund | | | 261,787 | | | | 18,560 | | | | 1,425 | | | | 457,219 | |
8. Line of Credit. Intermediate Duration Bond Fund and Limited Term Government and Agency Fund, together with certain other funds of Natixis Funds Trusts, Loomis Sayles Funds Trusts and Natixis ETF Trusts, entered into a $400,000,000 committed unsecured line of credit provided by State Street Bank. Any one Fund may borrow up to $350,000,000 under the line of credit agreement (as long as all borrowings by all Funds in the aggregate do not exceed the $400,000,000 limit at any time), subject to each Fund’s investment restrictions and its contractual obligations under the line of credit. Interest is charged to the Funds based upon the terms set forth in the agreement. In addition, a commitment fee of 0.15% per annum, payable at the end of each calendar quarter, is accrued and apportioned among the participating funds based on their average daily unused portion of the line of credit. The Funds paid an arrangement fee, an upfront fee, and certain other legal fees in connection with the line of credit agreement, which are being amortized over a period of 364 days and are reflected in legal fees and/or miscellaneous expenses on the Statements of Operations. The unamortized balance is reflected as prepaid expenses on the Statements of Assets and Liabilities.
For the year ended September 30, 2020, neither Fund had borrowings under this agreement.
9. Risk. Limited Term Government and Agency Fund’s investments in mortgage-related and asset-backed securities are subject to certain risks not associated with investments in other securities. Mortgage-related and asset-backed securities are subject to the risk that unexpected changes in interest rates will have a direct effect on expected maturity. A shortened maturity may result in the reinvestment of prepaid
Notes to Financial Statements (continued)
September 30, 2020
amounts in securities with lower yields than the original obligations. An extended maturity may result in a reduction of a security’s value.
Global markets have experienced periods of high volatility triggered by the ongoing public health emergency known as coronavirus (“Covid-19”). As the situation continues, the extent and duration of the impact that the Covid-19 outbreak may have on financial markets and the economy as a whole remains highly uncertain. If the effects of the Covid-19 outbreak on financial markets and the economy continue for an extended period of time, the Funds’ future financial and investment results may be adversely affected.
10. Concentration of Ownership. From time to time, a Fund may have a concentration of one or more accounts constituting a significant percentage of shares outstanding. Investment activities by holders of such accounts could have material impacts on the Funds. As of September 30, 2020, based on management’s evaluation of the shareholder account base, the Funds had accounts representing controlling ownership of more than 5% of the Fund’s total outstanding shares. The number of such accounts, based on accounts that represent more than 5% of an individual class of shares, and the aggregate percentage of net assets represented by such holdings were as follows:
| | | | | | | | |
| | | Number of 5%
Account Holders | | | Percentage of
Ownership | |
Intermediate Duration Bond Fund | | | 5 | | | | 74.66 | % |
Omnibus shareholder accounts for which Natixis Advisors understands that the intermediary has discretion over the underlying shareholder accounts or investment models where a shareholder account may be invested for a non-discretionary customer are included in the table above. For other omnibus accounts, the Funds do not have information on the individual shareholder accounts underlying the omnibus accounts; therefore, there could be other 5% shareholders in addition to those disclosed in the table above.
11. Capital Shares. Each Fund may issue an unlimited number of shares of beneficial interest, without par value. Transactions in capital shares were as follows:
| | | | | | | | |
| |
| Period Ended
September 30, 2020(a) |
|
Credit Income Fund | | | Shares | | | | Amount | |
| Class A | |
Issued from the sale of shares | | | 100 | | | $ | 1,000 | |
| | | | | | | | |
Net change | | | 100 | | | $ | 1,000 | |
| | | | | | | | |
| Class C | |
Issued from the sale of shares | | | 100 | | | $ | 1,000 | |
| | | | | | | | |
Net change | | | 100 | | | $ | 1,000 | |
| | | | | | | | |
Notes to Financial Statements (continued)
September 30, 2020
| | | | | | | | |
| |
| Period Ended
September 30, 2020(a) |
|
Credit Income Fund | | | Shares | | | | Amount | |
| Class N | |
Issued from the sale of shares | | | 2,500,000 | | | $ | 25,000,000 | |
| | | | | | | | |
Net change | | | 2,500,000 | | | $ | 25,000,000 | |
| | | | | | | | |
| Class Y | |
Issued from the sale of shares | | | 100 | | | $ | 1,000 | |
| | | | | | | | |
Net change | | | 100 | | | $ | 1,000 | |
| | | | | | | | |
Increase from capital share transactions | | | 2,500,300 | | | $ | 25,003,000 | |
| | | | | | | | |
| (a) | From commencement of operations on September 29, 2020 through September 30, 2020. |
11. Capital Shares (continued).
| | | | | | | | | | | | | | | | |
| |
| Year Ended
September 30, 2020 |
| |
| Year Ended
September 30, 2019(a) |
|
Intermediate Duration Bond Fund | | | Shares | | | | Amount | | | | Shares | | | | Amount | |
| Class A | |
Issued from the sale of shares | | | 324,729 | | | $ | 3,474,978 | | | | 398,531 | | | $ | 4,099,679 | |
Issued in connection with the reinvestment of distributions | | | 46,350 | | | | 490,629 | | | | 47,051 | | | | 480,510 | |
Redeemed | | | (592,250 | ) | | | (6,368,788 | ) | | | (328,671 | ) | | | (3,334,024 | ) |
| | | | | | | | | | | | | | | | |
Net change | | | (221,171 | ) | | $ | (2,403,181 | ) | | | 116,911 | | | $ | 1,246,165 | |
| | | | | | | | | | | | | | | | |
| Class C | |
Issued from the sale of shares | | | 19,815 | | | $ | 211,443 | | | | 43,629 | | | $ | 442,533 | |
Issued in connection with the reinvestment of distributions | | | 773 | | | | 8,198 | | | | 435 | | | | 4,496 | |
Redeemed | | | (4,252 | ) | | | (45,689 | ) | | | (3 | ) | | | (26 | ) |
| | | | | | | | | | | | | | | | |
Net change | | | 16,336 | | | $ | 173,952 | | | | 44,061 | | | $ | 447,003 | |
| | | | | | | | | | | | | | | | |
| Class N | |
Issued from the sale of shares | | | 8,686 | | | $ | 92,320 | | | | 336,294 | | | $ | 3,517,593 | |
Issued in connection with the reinvestment of distributions | | | 8,959 | | | | 94,763 | | | | 1,393 | | | | 14,658 | |
Redeemed | | | (54,098 | ) | | | (585,173 | ) | | | — | | | | — | |
| | | | | | | | | | | | | | | | |
Net change | | | (36,453 | ) | | $ | (398,090 | ) | | | 337,687 | | | $ | 3,532,251 | |
| | | | | | | | | | | | | | | | |
| Class Y | |
Issued from the sale of shares | | | 12,426,531 | | | $ | 132,862,309 | | | | 10,382,829 | | | $ | 104,956,223 | |
Issued in connection with the reinvestment of distributions | | | 557,209 | | | | 5,914,095 | | | | 500,421 | | | | 5,110,711 | |
Redeemed | | | (6,797,325 | ) | | | (71,873,949 | ) | | | (5,211,508 | ) | | | (52,921,882 | ) |
| | | | | | | | | | | | | | | | |
Net change | | | 6,186,415 | | | $ | 66,902,455 | | | | 5,671,742 | | | $ | 57,145,052 | |
| | | | | | | | | | | | | | | | |
Increase from capital share transactions | | | 5,945,127 | | | $ | 64,275,136 | | | | 6,170,401 | | | $ | 62,370,471 | |
| | | | | | | | | | | | | | | | |
| (a) | From commencement of operations on February 1, 2019 through September 30, 2019 for Class N shares. |
Notes to Financial Statements (continued)
September 30, 2020
11. Capital Shares (continued).
| | | | | | | | | | | | | | | | |
| |
| Year Ended
September 30, 2020 |
| |
| Year Ended
September 30, 2019 |
|
Limited Term Government and Agency Fund | | | Shares | | | | Amount | | | | Shares | | | | Amount | |
| Class A | |
Issued from the sale of shares | | | 8,119,093 | | | $ | 93,051,564 | | | | 6,604,468 | | | $ | 73,758,793 | |
Issued in connection with the reinvestment of distributions | | | 294,326 | | | | 3,364,566 | | | | 468,020 | | | | 5,253,188 | |
Redeemed | | | (9,910,542 | ) | | | (113,643,142 | ) | | | (9,509,963 | ) | | | (106,560,526 | ) |
| | | | | | | | | | | | | | | | |
Net change | | | (1,497,123 | ) | | $ | (17,227,012 | ) | | | (2,437,475 | ) | | $ | (27,548,545 | ) |
| | | | | | | | | | | | | | | | |
| Class C | |
Issued from the sale of shares | | | 1,390,000 | | | $ | 15,896,924 | | | | 1,272,362 | | | $ | 14,195,722 | |
Issued in connection with the reinvestment of distributions | | | 8,812 | | | | 100,557 | | | | 21,420 | | | | 240,567 | |
Redeemed | | | (1,649,132 | ) | | | (18,865,977 | ) | | | (1,445,466 | ) | | | (16,189,983 | ) |
| | | | | | | | | | | | | | | | |
Net change | | | (250,320 | ) | | $ | (2,868,496 | ) | | | (151,684 | ) | | $ | (1,753,694 | ) |
| | | | | | | | | | | | | | | | |
| Class N | |
Issued from the sale of shares | | | 719,991 | | | $ | 8,232,916 | | | | 351,754 | | | $ | 3,935,676 | |
Issued in connection with the reinvestment of distributions | | | 12,962 | | | | 148,889 | | | | 10,232 | | | | 115,280 | |
Redeemed | | | (242,561 | ) | | | (2,793,313 | ) | | | (183,979 | ) | | | (2,066,729 | ) |
| | | | | | | | | | | | | | | | |
Net change | | | 490,392 | | | $ | 5,588,492 | | | | 178,007 | | | $ | 1,984,227 | |
| | | | | | | | | | | | | | | | |
| Class Y | |
Issued from the sale of shares | | | 54,197,489 | | | $ | 624,437,973 | | | | 26,296,159 | | | $ | 295,778,178 | |
Issued in connection with the reinvestment of distributions | | | 574,408 | | | | 6,596,941 | | | | 623,009 | | | | 7,019,684 | |
Redeemed | | | (35,196,219 | ) | | | (404,652,972 | ) | | | (19,697,925 | ) | | | (220,982,548 | ) |
| | | | | | | | | | | | | | | | |
Net change | | | 19,575,678 | | | $ | 226,381,942 | | | | 7,221,243 | | | $ | 81,815,314 | |
| | | | | | | | | | | | | | | | |
Increase from capital share transactions | | | 18,318,627 | | | $ | 211,874,926 | | | | 4,810,091 | | | $ | 54,497,302 | |
| | | | | | | | | | | | | | | | |
Report of Independent Registered Public
Accounting Firm
To the Board of Trustees of Loomis Sayles Funds I and Loomis Sayles Funds II and Shareholders of Loomis Sayles Intermediate Duration Bond Fund, Loomis Sayles Credit Income Fund and Loomis Sayles Limited Term Government and Agency Fund:
Opinions on the Financial Statements
We have audited the accompanying statements of assets and liabilities, including the portfolios of investments, of Loomis Sayles Intermediate Duration Bond Fund (one of the funds constituting Loomis Sayles Funds I), Loomis Sayles Credit Income Fund and Loomis Sayles Limited Term Government and Agency Fund (two of the funds constituting Loomis Sayles Funds II) (hereafter collectively referred to as the “Funds”) as of September 30, 2020, the related statements of operations and of changes in net assets for each of the periods indicated in the table below, including the related notes, and the financial highlights for each of the periods indicated therein (collectively referred to as the “financial statements”). In our opinion, the financial statements present fairly, in all material respects, the financial position of each of the Funds as of September 30, 2020, the results of each of their operations and the changes in each of their net assets for the periods indicated in the table below, and each of the financial highlights for each of the periods indicated therein, in conformity with accounting principles generally accepted in the United States of America.
| | | | |
| Fund Name | | Statements of operation | | Statements of changes in
net assets |
Loomis Sayles Intermediate Duration Bond Fund | | For the year ended September 30, 2020 | | For the years ended September 30, 2020 and 2019 |
Loomis Sayles Credit Income Fund | | For the period from September 29, 2020 (commencement of operations) to September 30, 2020 | | For the period from September 29, 2020 (commencement of operations) to September 30, 2020 |
Loomis Sayles Limited Term Government and Agency Fund | | For the year ended September 30, 2020 | | For the years ended September 30, 2020 and 2019 |
Basis for Opinions
These financial statements are the responsibility of the Funds’ management. Our responsibility is to express an opinion on the Funds’ financial statements based on our audits. We are a public accounting firm registered with the Public Company Accounting Oversight Board (United States) (PCAOB) and are required to be independent with respect to the Funds in accordance with the U.S. federal securities laws and the applicable rules and regulations of the Securities and Exchange Commission and the PCAOB.
Report of Independent Registered Public
Accounting Firm
We conducted our audits of these financial statements in accordance with the standards of the PCAOB. Those standards require that we plan and perform the audit to obtain reasonable assurance about whether the financial statements are free of material misstatement, whether due to error or fraud.
Our audits included performing procedures to assess the risks of material misstatement of the financial statements, whether due to error or fraud, and performing procedures that respond to those risks. Such procedures included examining, on a test basis, evidence regarding the amounts and disclosures in the financial statements. Our audits also included evaluating the accounting principles used and significant estimates made by management, as well as evaluating the overall presentation of the financial statements. Our procedures included confirmation of securities owned as of September 30, 2020 by correspondence with the custodian and brokers; when replies were not received from brokers, we performed other auditing procedures. We believe that our audits provide a reasonable basis for our opinions.
/s/ PricewaterhouseCoopers LLP
Boston, Massachusetts
November 20, 2020
We have served as the auditor of one or more investment companies in the Natixis Investment Company Complex since at least 1995. We have not determined the specific year we began serving as auditor.
2020 U.S. Tax Distribution Information to
Shareholders (Unaudited)
Capital Gains Distributions. Pursuant to Internal Revenue Section 852(b), the following Fund paid distributions, which have been designated as capital gains distributions for the fiscal year ended September 30, 2020, unless subsequently determined to be different.
| | | | |
Fund | | Amount | |
Intermediate Duration Bond Fund | | $ | 27,607 | |
Qualified Dividend Income. For the fiscal year ended September 30, 2020, the Fund below will designate up to the maximum amount allowable pursuant to the Internal Revenue Code as qualified dividend income eligible for reduced tax rates. These lower rates range from 0% to 20% depending on an individual’s tax bracket. If the Fund pays a distribution during calendar year 2020, complete information will be reported in conjunction with Form 1099-DIV.
Trustee and Officer Information
The tables below provide certain information regarding the trustees and officers of Loomis Sayles Funds I and Loomis Sayles Funds II (the “Trusts”). Unless otherwise indicated, the address of all persons below is 888 Boylston Street, Suite 800, Boston, MA 02199-8197. The Funds’ Statement of Additional Information includes additional information about the trustees of the Trusts and is available by calling Natixis Funds at 800-225-5478.
| | | | | | | | |
Name and Year of
Birth | | Position(s) Held
with the Trusts,
Length of Time
Served and Term
of Office1 | | Principal
Occupation(s)
During Past
5 Years | | Number of
Portfolios in
Fund Complex
Overseen2 and Other
Directorships Held
During Past
5 Years | | Experience,
Qualifications,
Attributes, Skills
for Board
Membership |
|
| INDEPENDENT TRUSTEES |
| | | | |
Kenneth A. Drucker (1945) | | Chairperson of the Board of Trustees since January 2017 Ex Officio member of Audit Committee, Contract Review Committee and Governance Committee | | Retired | | 54 None | | Significant experience on the Board and on the boards of other business organizations (including at investment companies); executive experience (including as treasurer of an aerospace, automotive, and metal manufacturing corporation) |
| | | | |
Edmond J. English (1953) | | Trustee since 2013 Chairperson of Governance Committee and Audit Committee Member | | Executive Chairman of Bob’s Discount Furniture (retail) | | 54 Director, Burlington Stores, Inc. (retail) | | Significant experience on the Board and on the boards of other business organizations (including retail companies and a bank); executive experience (including at a retail company) |
Trustee and Officer Information
| | | | | | | | |
Name and Year of
Birth | | Position(s) Held
with the Trusts,
Length of Time
Served and Term
of Office1 | | Principal
Occupation(s)
During Past
5 Years | | Number of
Portfolios in
Fund Complex
Overseen2 and Other
Directorships Held
During Past
5 Years | | Experience,
Qualifications,
Attributes, Skills
for Board
Membership |
|
INDEPENDENT TRUSTEES continued |
| | | | |
Richard A. Goglia (1951) | | Trustee since 2015 Contract Review Committee Member and Governance Committee Member | | Retired; | | 54 Director of Triumph Group (aerospace industry) | | Significant experience on the Board and executive experience (including his role as vice president and treasurer of a defense company and experience at a financial services company) |
| | | | |
Wendell J. Knox (1948) | | Trustee since 2009 Chairperson of Contract Review Committee | | Retired | | 54 Director of Abt Associates Inc. (research and consulting); Director, The Hanover Insurance Group (property and casualty insurance); formerly, Director, Eastern Bank (bank) | | Significant experience on the Board and on the boards of other business organizations (including at a bank and at a property and casualty insurance firm); executive experience (including roles as president and chief executive officer of a research and consulting company) |
Trustee and Officer Information
| | | | | | | | |
Name and Year of
Birth | | Position(s) Held
with the Trusts,
Length of Time
Served and Term
of Office1 | | Principal
Occupation(s)
During Past
5 Years | | Number of
Portfolios in
Fund Complex
Overseen2 and Other
Directorships Held
During Past
5 Years | | Experience,
Qualifications,
Attributes, Skills
for Board
Membership |
|
INDEPENDENT TRUSTEES continued |
| | | | |
Martin T. Meehan (1956) | | Trustee since 2012 Audit Committee Member | | President, University of Massachusetts | | 54 None | | Significant experience on the Board and on the boards of other business organizations; experience as President of the University of Massachusetts; government experience (including as a member of the U.S. House of Representatives); academic experience |
| | | | |
Maureen B. Mitchell (1951) | | Trustee since 2017 Contract Review Committee Member and Governance Committee Member | | Retired; formerly President, Global Sales and Marketing, GE Asset Management, Inc. (financial services) | | 54 Director, Sterling Bancorp (bank) | | Experience on the Board; financial services industry and executive experience (including role as president of global sales and marketing at a financial services company) |
| | | | |
James P. Palermo (1955) | | Trustee since 2016 Contract Review Committee Member | | Founding Partner, Breton Capital Management, LLC (private equity); Partner, STEP Partners, LLC (private equity) | | 54 Director, FutureFuel.io (chemicals and biofuels) | | Experience on the Board; financial services industry and executive experience (including roles as chief executive officer of client management and asset servicing for a banking and financial services company) |
Trustee and Officer Information
| | | | | | | | |
Name and Year of
Birth | | Position(s) Held
with the Trusts,
Length of Time
Served and Term
of Office1 | | Principal
Occupation(s)
During Past
5 Years | | Number of
Portfolios in
Fund Complex
Overseen2 and Other
Directorships Held
During Past
5 Years | | Experience,
Qualifications,
Attributes, Skills
for Board
Membership |
|
INDEPENDENT TRUSTEES continued |
| | | | |
Erik R. Sirri (1958) | | Trustee since 2009 Audit Committee Member | | Professor of Finance at Babson College | | 54 None | | Significant experience on the Board; experience as Director of the Division of Trading and Markets at the Securities and Exchange Commission; academic experience; training as an economist |
| | | | |
Peter J. Smail (1952) | | Trustee since 2009 Audit Committee Member and Governance Committee Member | | Retired | | 54 None | | Significant experience on the Board; mutual fund industry and executive experience (including roles as president and chief executive officer for an investment adviser) |
Trustee and Officer Information
| | | | | | | | |
Name and Year of
Birth | | Position(s) Held
with the Trusts,
Length of Time
Served and Term
of Office1 | | Principal
Occupation(s)
During Past
5 Years | | Number of
Portfolios in
Fund Complex
Overseen2 and Other
Directorships Held
During Past
5 Years | | Experience,
Qualifications,
Attributes, Skills
for Board
Membership |
|
INDEPENDENT TRUSTEES continued |
| | | | |
Kirk A. Sykes (1958) | | Trustee since 2019 Contract Review Committee Member | | Managing Director of Accordia Partners, LLC (real estate development); President of Primary Corporation (real estate development); Managing Principal of Merrick Capital Partners (infrastructure finance); formerly, President of Urban Strategy America Fund (real estate fund manager) | | 54 Trustee, Eastern Bank (bank); formerly Director, Ares Commercial Real Estate Corporation (real estate investment trust) | | Experience on the Board and significant experience on the boards of other business organizations (including real estate companies and banks) |
| | | | |
Cynthia L. Walker (1956) | | Trustee since 2005 Chairperson of the Audit Committee and Governance Committee Member | | Deputy Dean for Finance and Administration, Yale University School of Medicine | | 54 None | | Significant experience on the Board; executive experience in a variety of academic organizations (including roles as dean for finance and administration) |
Trustee and Officer Information
| | | | | | | | |
Name and Year of
Birth | | Position(s) Held
with the Trusts,
Length of Time
Served and Term
of Office1 | | Principal
Occupation(s)
During Past
5 Years | | Number of
Portfolios in
Fund Complex
Overseen2 and Other
Directorships Held
During Past
5 Years | | Experience,
Qualifications,
Attributes, Skills
for Board
Membership |
|
| INTERESTED TRUSTEES |
| | | | |
Kevin P. Charleston3 (1965) One Financial Center Boston, MA 02111 | | Trustee since 2015 President and Chief Executive Officer of Loomis Sayles Funds I since 2015 | | President, Chief Executive Officer and Chairman of the Board of Directors; formerly, Chief Financial Officer, Loomis, Sayles & Company, L.P. | | 54 None | | Significant experience on the Board; continuing service as President, Chief Executive Officer and Chairman of the Board of Directors of Loomis, Sayles & Company, L.P. |
| | | | |
David L. Giunta4 (1965) | | Trustee since 2011 President and Chief Executive Officer of Loomis Sayles Funds II and Executive Vice President of Loomis Sayles Funds I since 2008; Chief Executive Officer of Loomis Sayles Funds II since 2015 | | President and Chief Executive Officer, Natixis Advisors, L.P., Natixis Distribution, L.P., Natixis Distribution Corporation and Chairman of the Board of Natixis Distribution Corporation | | 54 None | | Significant experience on the Board; experience as President and Chief Executive Officer of Natixis Advisors, L.P., Natixis Distribution, L.P., Natixis Distribution Corporation and Chairman of the Board of Natixis Distribution Corporation |
| 1 | Each trustee serves until retirement, resignation or removal from the Board. The current retirement age is 75. The position of Chairperson of the Board is appointed for a three-year term. Mr. Drucker was appointed to serve an additional one year term as the Chairperson of the Board on June 12, 2019. |
| 2 | The trustees of the Trusts serve as trustees of a fund complex that includes all series of the Natixis Funds Trust I, Natixis Funds Trust II, Natixis Funds Trust IV, Gateway Trust, Loomis Sayles Funds I, Loomis Sayles Funds II, Natixis ETF Trust and Natixis ETF Trust II (collectively, the “Fund Complex”). |
| 3 | Mr. Charleston is deemed an “interested person” of the Trusts because he holds the following positions with an affiliated person of the Trusts: President, Chief Executive Officer and Chairman of the Board of Directors of Loomis, Sayles & Company, L.P. |
| 4 | Mr. Giunta is deemed an “interested person” of the Trusts because he holds the following positions with an affiliated person of the Trusts: President and Chief Executive Officer, Natixis Advisors, L.P., Natixis Distribution, L.P., Natixis Distribution Corporation and Chairman of the Board of Natixis Distribution Corporation. |
Trustee and Officer Information
| | | | | | |
Name and Year of Birth | | Position(s) Held with the Trusts | | Term of Office1 and Length of Time Served | | Principal Occupation(s) During Past 5 Years2 |
|
| OFFICERS OF THE TRUSTS |
| | | |
Daniel J. Fuss (1933)
One Financial Center
Boston, MA 02111 | | Executive Vice President of Loomis Sayles Funds I and Loomis Sayles Funds II | | Since 2003 | | Vice Chairman and Director, Loomis, Sayles & Company, L.P. |
| | | |
Russell L. Kane (1969) | | Secretary, Clerk and Chief Legal Officer Chief Compliance Officer and Anti-Money Laundering Officer | | Since 2016 Since 2020 | | Executive Vice President, General Counsel, Secretary and Clerk, Natixis Distribution Corporation, Natixis Advisors, L.P. and Natixis Distribution, L.P.; formerly, Senior Vice President, Deputy General Counsel, Assistant Secretary and Assistant Clerk, Natixis Distribution Corporation, Natixis Advisors, L.P. and Natixis Distribution, L.P. |
| | | |
Michael C. Kardok (1959) | | Treasurer, Principal Financial and Accounting Officer | | Since 2004 | | Senior Vice President, Natixis Advisors, L.P. and Natixis Distribution, L.P. |
| 1 | Each officer of the Trusts serves for an indefinite term in accordance with the Trusts’ current by-laws until the date his or her successor is elected and qualified, or until he or she sooner dies, retires, is removed or becomes disqualified. |
| 2 | Each person listed above, except as noted, holds the same position(s) with the Fund Complex. Previous positions during the past five years with Natixis Distribution, L.P., Natixis Advisors, L.P. or Loomis, Sayles & Company, L.P. are omitted, if not materially different from an officer’s current position with such entity. |
Item 2. Code of Ethics.
The Registrant has adopted a code of ethics that applies to the Registrant’s principal executive officer, principal financial officer and persons performing similar functions. There have been no amendments or waivers of the Registrant’s code of ethics during the period.
Item 3. Audit Committee Financial Expert.
The Board of Trustees of the Registrant has established an audit committee. Mr. Edmond J. English, Mr. Martin T. Meehan, Mr. Peter Smail, Mr. Erik R. Sirri and Ms. Cynthia L. Walker are members of the audit committee and have been designated as “audit committee financial experts” by the Board of Trustees. Each of these individuals is also an Independent Trustee of the Registrant.
Item 4. Principal Accountant Fees and Services.
Fees billed by the Principal Accountant for services rendered to the Registrant.
The table below sets forth fees billed by the principal accountant, PricewaterhouseCoopers LLP, for the past two fiscal years for professional services rendered in connection with a) the audit of the Registrant’s annual financial statements and services provided in connection with regulatory filings; b) audit-related services (including services that are reasonably related to the performance of the audit of the Registrant’s financial statements and but not reported under “Audit Fees”); c) tax compliance, tax advice and tax planning and d) all other fees billed for professional services rendered by the principal accountant to the Registrant, other than the services reported as a part of (a) through (c) of this Item.
| | | | | | | | | | | | | | | | | | | | | | | | | | | | | | | | |
| | | Audit fees | | | Audit-related fees1 | | | Tax fees2 | | | All other fees | |
| | | 10/1/18-
9/30/19 | | | 10/1/19-
9/30/20 | | | 10/1/18-
9/30/19 | | | 10/1/19-
9/30/20 | | | 10/1/18-
9/30/19 | | | 10/1/19-
9/30/20 | | | 10/1/18-
9/30/19 | | | 10/1/19-
9/30/20 | |
Loomis Sayles Funds I | | $ | 442,185 | | | $ | 446,607 | | | $ | 3,035 | | | $ | 2,896 | | | $ | 89,924 | | | $ | 86,682 | | | $ | — | | | $ | — | |
| 1. | Audit-related fees consist of: |
2019 & 2020 - performance of agreed-upon procedures related to the Registrant’s deferred compensation plan.
2019 & 2020 – review of Registrant’s tax returns.
Aggregate fees billed to the Registrant for non-audit services during 2019 and 2020 were $92,959 and $89,578 respectively.
Fees billed by the Principal Accountant for services rendered to the Adviser and Control Affiliates.
The following table sets forth the fees billed by the Registrant’s principal accountant for non-audit services rendered to Loomis, Sayles & Company, L.P. and entities controlling, controlled by or under common control with Loomis, Sayles & Company, L.P. (“Control Affiliates”) that provide ongoing services to the Registrant, for engagements that related directly to the operations and financial reporting of the Registrant for the last two fiscal years.
| | | | | | | | | | | | | | | | | | | | | | | | |
| | | Audit-related fees | | | Tax fees | | | All other fees | |
| | | 10/1/18-
9/30/19 | | | 10/1/19-
9/30/20 | | | 10/1/18-
9/30/19 | | | 10/1/19-
9/30/20 | | | 10/1/18-
9/30/19 | | | 10/1/19-
9/30/20 | |
Control Affiliates | | $ | — | | | $ | — | | | $ | — | | | $ | — | | | $ | — | | | $ | — | |
The following table sets forth the aggregate fees billed by the Registrant’s principal accountant for non-audit services rendered to Loomis, Sayles & Company, L.P. and Control Affiliates that provide ongoing services to the Registrant, for the last two fiscal years, including the fees disclosed in the table above.
| | | | | | | | |
| | | Aggregate Non-Audit Fees | |
| | | 10/1/18-9/30/19 | | | 10/1/19-9/30/20 | |
Control Affiliates | | $ | 32,252 | | | $ | 1,646 | |
None of the services described above were approved pursuant to (c)(7)(i)(C) of Regulation S-X.
Audit Committee Pre Approval Policies.
Annually, the Registrant’s Audit Committee reviews the audit, audit-related, tax and other non-audit services together with the projected fees, for services proposed to be rendered to the Trust and/or other entities for which pre-approval is required during the upcoming year. Any subsequent revisions to already pre-approved services or fees (including fee increases) and requests for pre-approval of new services would be presented for consideration quarterly as needed.
If, in the opinion of management, a proposed engagement by the Registrant’s independent accountants needs to commence before the next regularly scheduled Audit Committee meeting, any member of the Audit Committee who is an Independent Trustee of the Registrant is authorized to pre-approve the engagement, but only for engagements to provide audit, audit related and tax services. This approval is subject to review of the full Audit Committee at its next quarterly meeting. All other engagements require the approval of all the members of the Audit Committee.
Item 5. Audit Committee of Listed Registrants.
Not applicable.
Item 6. Schedule of Investments.
Included as part of the Report to Shareholders filed as Item 1 herewith.
Item 7. Disclosure of Proxy Voting Policies and Procedures for Closed-End Management Investment Companies.
Not applicable.
Item 8. Portfolio Managers of Closed-End Management Investment Companies
Not applicable.
Item 9. Purchases of Equity Securities by Closed-End Management Investment Companies and Affiliated Purchasers.
Not applicable.
Item 10. Submission of Matters to a Vote of Securities Holders.
There were no material changes to the procedures by which shareholders may recommend nominees to the Registrant’s Board of Trustees.
Item 11. Controls and Procedures.
The Registrant’s principal executive officer and principal financial officer have concluded that the Registrant’s disclosure controls and procedures are sufficient to ensure that information required to be disclosed by the Registrant in this Form N-CSR was recorded, processed, summarized and reported within the time periods specified in the Securities and Exchange Commission’s rules and forms, based upon such officers’ evaluation of these controls and procedures as of a date within 90 days of the filing date of the report.
There were no changes in the Registrant’s internal control over financial reporting that occurred during the period covered by the report that have materially affected, or is reasonably likely to materially affect, the Registrant’s internal control over financial reporting.
Item 12. Disclosure of Securities Lending Activities for Closed-End Management Investment Companies.
Not applicable.
Item 13. Exhibits.
SIGNATURES
Pursuant to the requirements of the Securities Exchange Act of 1934 and the Investment Company Act of 1940, the Registrant has duly caused this report to be signed on its behalf by the undersigned, thereunto duly authorized.
| | |
| Loomis Sayles Funds I |
| |
| By: | | /s/ Kevin Charleston |
| Name: | | Kevin Charleston |
| Title: | | President and Chief Executive Officer |
| Date: | | November 23, 2020 |
Pursuant to the requirements of the Securities Exchange Act of 1934 and the Investment Company Act of 1940, this report has been signed by the following persons on behalf of the Registrant and in the capacities and on the dates indicated.
| | |
| By: | | /s/ Kevin Charleston |
| Name: | | Kevin Charleston |
| Title: | | President and Chief Executive Officer |
| Date: | | November 23, 2020 |
| | |
| By: | | /s/ Michael C. Kardok |
| Name: | | Michael C. Kardok |
| Title: | | Treasurer and Principal Financial and Accounting Officer |
| Date: | | November 23, 2020 |