UNITED STATES
SECURITIES AND EXCHANGE COMMISSION
Washington, D.C. 20549
FORM N-CSR
CERTIFIED SHAREHOLDER REPORT OF REGISTERED
MANAGEMENT INVESTMENT COMPANIES
Investment Company Act file number: 811-08314
Schwab Annuity Portfolios
(Exact name of registrant as specified in charter)
211 Main Street, San Francisco, California 94105
(Address of principal executive offices) (Zip code)
Jonathan de St. Paer
Schwab Annuity Portfolios
211 Main Street, San Francisco, California 94105
(Name and address of agent for service)
Registrant’s telephone number, including area code: (415) 636-7000
Date of fiscal year end: December 31
Date of reporting period: December 31, 2021
Item 1: Report(s) to Shareholders.
Annual Report | December 31, 2021
Schwab Government Money Market Portfolio
Proxy Voting Policies, Procedures and Results
A description of the proxy voting policies and procedures used to determine how to vote proxies on behalf of the funds is available without charge, upon request, by visiting the Schwab Fund’s website at www.schwabassetmanagement.com/schwabfunds_prospectus, the SEC’s website at www.sec.gov, or by contacting Schwab Funds at 1-877-824-5615.
Information regarding how a fund voted proxies relating to portfolio securities during the most recent twelve-month period ended June 30 is available, without charge, by visiting Schwab’s website at www.schwabassetmanagement.com/schwabfunds_prospectus or the SEC’s website at www.sec.gov.
Investment Adviser: Charles Schwab Investment Management, Inc., dba Schwab Asset ManagementTM
Schwab Government Money Market Portfolio
 | Linda Klingman, Managing Director and Head of Money Market Strategies for Schwab Asset Management, leads the portfolio management teams for taxable and tax-exempt Schwab Money Funds, and has overall responsibility for all aspects of the management of the fund. Prior to joining Schwab in 1990, she was a senior money market trader with AIM Management, Inc. for five years. She has managed money market funds since 1988. |
 | Lynn Paschen, Senior Portfolio Manager, is responsible for the day-to-day co-management of the fund. Prior to joining Schwab in 2011, Ms. Paschen held a number of positions at American Century Investments. She was most recently a portfolio manager and, from 2000 to 2003, worked as a fixed-income trader. She has managed money market funds since 2003. |
 | Nicole Perret-Gentil, Portfolio Manager, is responsible for the day-to-day co-management of the fund. Prior to joining Schwab in 2016, Ms. Perret-Gentil worked at Freddie Mac for 15 years, most recently as a senior portfolio manager where she managed and executed trades for a fixed-income strategy. Prior to that role, she served as a portfolio manager performing fixed-income analysis, a senior research analyst for investor and dealer relations, a senior securities operations analyst in loan and securities operations, and a lead mortgage securities operations specialist. She also worked at Merrill Lynch for a year as a senior specialist in fixed-income global banking and investments. |
Schwab Government Money Market Portfolio | Annual Report
Schwab Government Money Market Portfolio
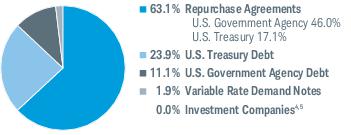
The Schwab Government Money Market Portfolio’s (the fund) goal is to seek the highest current income consistent with stability of capital and liquidity. To pursue its goal, the fund invests in U.S. government securities such as U.S. Treasury bills and notes, other obligations that are issued by the U.S. government, its agencies, or instrumentalities, repurchase agreements that are collateralized fully by cash and/or U.S. government securities, and obligations that are issued by private issuers that are guaranteed as to principal or interest by the U.S. government, its agencies, or instrumentalities. The fund will invest at least 99.5% of its total assets in cash, U.S. government securities and/or repurchase agreements that are collateralized fully by cash and/or U.S. government securities; under normal circumstances, at least 80% of the fund’s net assets (including, for this purpose, any borrowings for investment purposes) will be invested in U.S. government securities, including repurchase agreements that are collateralized fully by U.S. government securities. For more information concerning the fund’s investment objective, strategy, and risks, please see the fund’s prospectus.
Market Highlights. The 12-month reporting period was marked by an imbalance in supply and demand of short-term U.S. Treasuries, with demand remaining high and supply declining as the U.S. Treasury’s borrowing needs decreased. Interest rates remained low, with the U.S. Federal Reserve (Fed) holding the federal funds target rate in a range of 0.00% to 0.25% throughout the reporting period. However, as inflation continued to rise and indicators of economic activity and employment continued to strengthen, the Fed began scaling back its bond-buying program beginning in November 2021. The Fed subsequently accelerated its wind-down in December 2021 to end it altogether by March 2022. The Fed also signaled that interest rates could begin to rise sooner in 2022 than previously anticipated.
To support effective monetary policy implementation and smooth market functioning by helping maintain the federal funds rate within the Fed’s target range, the Fed conducts repurchase agreement and reverse repurchase agreement transactions. Demand for the Fed’s Overnight Reverse Repurchase Agreement Facility drove its usage to an all-time high in December 2021 as a result of significant cash in the market, limited investment options, and the ongoing supply and demand imbalances for U.S. Treasuries.
Outside the U.S., most central banks were similarly accommodative while acknowledging economic improvements and, in some cases, changes in monetary policy. The European Central Bank held its policy rate at 0.00%, unchanged since March 2016. However, in December 2021, it announced that in the first quarter of 2022 it would reduce the pace of its asset purchase program it had instituted to help counter the serious risks posed by the COVID-19 pandemic. The Bank of Japan upheld its short-term interest rate target of -0.1%, also unchanged since 2016, and also announced its plans to taper its corporate debt buying to pre-pandemic levels. In December 2021, the Bank of England raised its key official bank rate from 0.1% to 0.25%, its first rate hike since the onset of the COVID-19 pandemic, citing inflation pressures.
Performance, Positioning, and Strategies. Throughout the reporting period, the fund’s investment adviser remained focused on ensuring liquidity and stability of capital as market conditions evolved, and on continuing a rigorous credit review process and ongoing monitoring for all issuers and regions in which the fund invests. The fund’s weighted average maturity (WAM) was reduced toward the end of the reporting period as the likelihood of imminent interest rate increases rose, beginning the reporting period at 44 days and ending it at 37 days.
Portfolio Composition By Effective Maturity % of Investments1
Portfolio Composition by Security Type % of Investments3
| Weighted Average Maturity2 | 37 Days |
Management views and portfolio holdings may have changed since the report date.
| 1 | Maturity shown is the date the interest rate on those securities is reset, or the date those securities can be redeemed through demand. |
| 2 | Money funds must maintain a dollar-weighted average maturity of no longer than 60 days and cannot invest in any security whose effective maturity is longer than 397 days (approximately 13 months). |
| 3 | The percentage may differ from the Portfolio Holdings because the above calculation is based on a percentage of total investments, whereas the calculation in the Portfolio Holdings is based on a percentage of net assets. |
| 4 | Includes the fund’s position in money market mutual funds registered under the Investment Company Act of 1940, as amended. |
| 5 | Less than 0.05% |
Schwab Government Money Market Portfolio | Annual Report
Schwab Government Money Market Portfolio
Performance and Fund Facts as of December 31, 2021
The performance data quoted represents past performance. Past performance does not guarantee future results. Current performance may be lower or higher than performance data quoted. To obtain more current performance information, please visit www.schwabassetmanagement.com/schwabfunds_prospectus.
Seven-Day Average Yield Trend for Previous 12 Months1
The seven-day yield is the income generated by the fund’s holdings minus the fund’s operating expenses. The seven-day yields are calculated using standard SEC formulas. The effective yield includes the effect of reinvesting daily dividends. Please remember that money market fund yields fluctuate.
| | Schwab Government Money Market Portfolio |
| Ticker Symbol | SWPXX |
| Seven-Day Yield (with waivers)3 | 0.01% |
| Seven-Day Yield (without waivers)3 | -0.18% |
| Seven-Day Effective Yield (with waivers)3 | 0.01% |
You could lose money by investing in the fund. Although the fund seeks to preserve the value of your investment at $1.00 per share, it cannot guarantee it will do so. An investment in the fund is not insured or guaranteed by the Federal Deposit Insurance Corporation or any other government agency. The fund’s sponsor has no legal obligation to provide financial support to the fund, and you should not expect that the sponsor will provide financial support to the fund at any time.
| 1 | Due to a special distribution of ordinary income to shareholders of Schwab Money Funds, the fund’s stated yields temporarily increased. Because this increase was temporary, investors should not rely on these yields for making investment decisions. |
| 2 | Fund yields do not reflect the additional fees and expenses imposed by the insurance company under the variable insurance product contract. If those contract fees and expenses were included, the yields would be less than those shown. Please refer to the variable insurance product prospectus for a complete listing of these expenses. |
| 3 | The Seven-Day Yield (with waivers) is the average income paid out over the previous seven days assuming interest income is not reinvested and it reflects the effect of any applicable waivers. Absent such waivers, the fund’s yield would have been lower. The Seven-Day Yield (without waivers) is the yield without the effect of any applicable waivers. The Seven-Day Effective Yield is the yield with waivers assuming that all interest income is reinvested in additional shares of the fund. For additional details, see financial note 4. |
Schwab Government Money Market Portfolio | Annual Report
Schwab Government Money Market Portfolio
Fund Expenses (Unaudited)
Examples for a $1,000 Investment
As a fund shareholder, you may incur two types of costs: (1) transaction costs; and (2) ongoing costs, including management fees, transfer agent fees, and other fund expenses.
The expense examples below are intended to help you understand your ongoing cost (in dollars) of investing in the fund and to compare this cost with the ongoing cost of investing in other mutual funds. These examples are based on an investment of $1,000 invested for six months beginning July 1, 2021 and held through December 31, 2021.
The Actual Return line in the table below provides information about actual account values and actual expenses. You may use this information, together with the amount you invested, to estimate the expenses that you paid over the period. To do so, simply divide your account value by $1,000 (for example, an $8,600 account value ÷ $1,000 = 8.6), then multiply the result by the number given for the fund under the heading entitled “Expenses Paid During Period.”
The Hypothetical Return line in the table below provides information about hypothetical account values and hypothetical expenses based on the fund’s actual expense ratio and an assumed return of 5% per year before expenses. Because the return used is not an actual return, it may not be used to estimate the actual ending account value or expenses you paid for the period.
You may use this information to compare the ongoing costs of investing in the fund and other funds. To do so, compare this 5% hypothetical example with the 5% hypothetical examples that appear in the shareholder reports of the other funds.
Please note that the expenses shown in the table are meant to highlight your ongoing costs only, and do not reflect any transactional costs. Therefore, the hypothetical return lines of the table are useful in comparing ongoing costs only, and will not help you determine the relative total costs of owning different funds. In addition, if these transactional costs were included, your costs would have been higher.
| | EXPENSE RATIO
(ANNUALIZED) 1,2 | BEGINNING
ACCOUNT VALUE
AT 7/1/21 | ENDING
ACCOUNT VALUE
(NET OF EXPENSES)
AT 12/31/21 | EXPENSES PAID
DURING PERIOD
7/1/21-12/31/213 |
| Schwab Government Money Market Portfolio | | | | |
| Actual Return | 0.06% | $1,000.00 | $1,000.50 | $0.30 |
| Hypothetical 5% Return | 0.06% | $1,000.00 | $1,024.90 | $0.31 |
| 1 | Based on the most recent six-month expense ratio; may differ from the expense ratio provided in the Financial Highlights. |
| 2 | Expense ratio (annualized) reflects the effect of a voluntary yield waiver in excess of the contractual expense limitation. (See financial note 4) |
| 3 | Expenses for each fund are equal to its annualized expense ratio, multiplied by the average account value over the period, multiplied by the 184 days of the period, and divided by the 365 days of the fiscal year. |
Schwab Government Money Market Portfolio | Annual Report
Schwab Government Money Market Portfolio
Financial Statements
FINANCIAL HIGHLIGHTS
| | 1/1/21–
12/31/21 | 1/1/20–
12/31/20 | 1/1/19–
12/31/19 | 1/1/18–
12/31/18 | 1/1/17–
12/31/17 | |
| Per-Share Data |
| Net asset value at beginning of period | $1.00 | $1.00 | $1.00 | $1.00 | $1.00 | |
| Income (loss) from investment operations: | | | | | | |
| Net investment income (loss)1 | 0.00 2 | 0.00 2 | 0.02 | 0.02 | 0.00 2 | |
| Net realized and unrealized gains (losses) | 0.00 2 | 0.00 2 | 0.00 2 | (0.00) 2 | 0.00 2 | |
| Total from investment operations | 0.00 2 | 0.00 2 | 0.02 | 0.02 | 0.00 2 | |
| Less distributions: | | | | | | |
| Distributions from net investment income | (0.00) 2,3 | (0.00) 2 | (0.02) | (0.02) | (0.00) 2 | |
| Net asset value at end of period | $1.00 | $1.00 | $1.00 | $1.00 | $1.00 | |
| Total return | 0.06% 3 | 0.28% | 1.91% | 1.52% | 0.45% | |
| Ratios/Supplemental Data |
| Ratios to average net assets: | | | | | | |
| Net operating expenses | 0.06% 4 | 0.26% 5,6 | 0.35% | 0.35% | 0.46% 7 | |
| Gross operating expenses | 0.27% | 0.41% | 0.47% | 0.48% | 0.50% | |
| Net investment income (loss) | 0.06% | 0.25% | 1.88% | 1.55% | 0.44% | |
| Net assets, end of period (x 1,000,000) | $185 | $185 | $149 | $138 | $95 | |
| 1 | Calculated based on the average shares outstanding during the period. |
| 2 | Per-share amount was less than $0.005. |
| 3 | These amounts include a non-recurring special distribution. The effect on the distributions from net investment income was less than $0.005 and the effect on the total return was 0.05%. |
| 4 | Reflects the effect of a voluntary yield waiver. (See financial note 4) |
| 5 | Effective September 24, 2020, the contractual expense limitation changed. The ratio presented for period ended December 31, 2020 is a blended ratio. |
| 6 | Reflects the effect of a voluntary yield waiver in excess of the contractual expense limitation. (See financial note 4) |
| 7 | Effective October 3, 2017, the contractual expense limitation changed. The ratio presented for period ended December 31, 2017 is a blended ratio. |
Schwab Government Money Market Portfolio | Annual Report
Schwab Government Money Market Portfolio
Portfolio Holdings as of December 31, 2021
This section shows all the securities in the fund’s portfolio and their values as of the report date.
The fund files its complete schedule of portfolio holdings with the U.S. Securities and Exchange Commission (SEC) monthly on Form N-MFP, which is available immediately upon filing. The fund’s Form N-MFP is available on the SEC’s website at www.sec.gov. The fund also makes available its complete schedule of portfolio holdings 5 business days after month end on the fund’s website at www.schwabassetmanagement.com/schwabfunds_prospectus.
For fixed-rate obligations and repurchase agreements, the rate shown is the coupon rate (the rate established when the obligation was issued) and if the coupon rate is not available, the effective yield at the time of purchase is shown. For variable-rate obligations, the rate shown is the interest rate as of the report date based on each security’s rate reset date. The reference rate and spread used is shown parenthetically in the security description, if available; if not, the reference rate is described in a footnote. The date shown in the maturity date column below is either the date on which the principal amount must be paid or the date payment must be made pursuant to a demand feature. If the security’s structure includes one of a number of maturity-shortening provisions set forth in Rule 2a-7, such as an interest rate reset, demand feature or put feature, the effective maturity date is also disclosed. If the effective maturity and maturity date are the same, the date will only appear in the maturity date column.
| Issuer | Footnotes | Rate | Effective
Maturity | Maturity
Date | Face
Amount ($) | Value ($) |
| U.S. GOVERNMENT AGENCY DEBT 11.2% OF NET ASSETS |
| FEDERAL FARM CREDIT BANKS FUNDING CORP | | | | | | |
| (SOFR + 0.08%) | (a) | 0.13% | 01/03/22 | 03/10/22 | 400,000 | 400,000 |
| | | 0.25% | | 05/06/22 | 100,000 | 100,057 |
| | | 0.08% | | 05/09/22 | 100,000 | 99,997 |
| | | 0.06% | | 05/17/22 | 700,000 | 699,993 |
| | | 0.25% | | 06/02/22 | 300,000 | 300,195 |
| | | 0.08% | | 06/03/22 | 100,000 | 99,966 |
| | | 2.20% | | 06/03/22 | 100,000 | 100,880 |
| | | 0.07% | | 07/06/22 | 100,000 | 99,964 |
| (SOFR + 0.04%) | (a) | 0.09% | 01/03/22 | 07/08/22 | 500,000 | 499,987 |
| | | 0.20% | | 07/13/22 | 900,000 | 900,559 |
| | | 0.07% | | 07/19/22 | 300,000 | 299,885 |
| (SOFR + 0.09%) | (a) | 0.14% | 01/03/22 | 07/25/22 | 300,000 | 299,992 |
| | | 0.10% | | 08/02/22 | 400,000 | 400,032 |
| | | 0.09% | | 08/18/22 | 200,000 | 199,887 |
| | | 0.11% | | 08/31/22 | 200,000 | 199,853 |
| (EFFR - 0.02%) | (a) | 0.06% | 01/03/22 | 09/08/22 | 1,100,000 | 1,100,000 |
| | | 1.70% | | 09/19/22 | 100,000 | 101,113 |
| | | 0.19% | | 10/13/22 | 100,000 | 100,000 |
| (SOFR + 0.06%) | (a) | 0.11% | 01/03/22 | 10/21/22 | 600,000 | 600,000 |
| | | 0.15% | | 11/16/22 | 500,000 | 499,903 |
| (3 mo. US TBILL + 0.02%) | (a) | 0.11% | 01/03/22 | 05/01/23 | 700,000 | 700,000 |
| (3 mo. US TBILL + 0.03%) | (a) | 0.11% | 01/04/22 | 07/13/23 | 300,000 | 300,000 |
| (EFFR - 0.01%) | (a) | 0.07% | 01/03/22 | 07/21/23 | 900,000 | 900,000 |
| (SOFR + 0.06%) | (a) | 0.11% | 01/03/22 | 11/07/23 | 200,000 | 200,000 |
| (EFFR + 0.03%) | (a) | 0.11% | 01/03/22 | 12/08/23 | 100,000 | 100,000 |
| (SOFR + 0.12%) | (a) | 0.17% | 01/03/22 | 12/08/23 | 300,000 | 300,351 |
| (SOFR + 0.06%) | (a) | 0.11% | 01/03/22 | 12/13/23 | 200,000 | 200,000 |
| FEDERAL HOME LOAN BANKS | | | | | | |
| (SOFR + 0.12%) | (a) | 0.17% | 01/03/22 | 02/28/22 | 700,000 | 700,000 |
| | | 0.13% | | 08/12/22 | 200,000 | 200,035 |
| | | 3.13% | | 09/09/22 | 100,000 | 102,067 |
| | | 0.21% | | 12/02/22 | 700,000 | 700,000 |
| FEDERAL HOME LOAN MORTGAGE CORPORATION | | 2.38% | | 01/13/22 | 1,000,000 | 1,000,632 |
| (SOFR + 0.15%) | (a) | 0.20% | 01/03/22 | 03/04/22 | 900,000 | 900,000 |
Schwab Government Money Market Portfolio | Annual Report
Schwab Government Money Market Portfolio
Portfolio Holdings as of December 31, 2021 (continued)
| Issuer | Footnotes | Rate | Effective
Maturity | Maturity
Date | Face
Amount ($) | Value ($) |
| (SOFR + 0.20%) | (a) | 0.25% | 01/03/22 | 03/11/22 | 200,000 | 200,000 |
| (SOFR + 0.19%) | (a) | 0.24% | 01/03/22 | 06/02/22 | 500,000 | 500,000 |
| (SOFR + 0.10%) | (a) | 0.15% | 01/03/22 | 08/19/22 | 1,300,000 | 1,300,000 |
| (SOFR + 0.10%) | (a) | 0.15% | 01/03/22 | 09/09/22 | 800,000 | 800,000 |
| FEDERAL NATIONAL MORTGAGE ASSOCIATION | | | | | | |
| (SOFR + 0.35%) | (a) | 0.40% | 01/03/22 | 04/07/22 | 700,000 | 700,039 |
| | | 2.25% | | 04/12/22 | 100,000 | 100,588 |
| (SOFR + 0.39%) | (a) | 0.44% | 01/03/22 | 04/15/22 | 700,000 | 700,000 |
| (SOFR + 0.24%) | (a) | 0.29% | 01/03/22 | 04/29/22 | 500,000 | 500,000 |
| (SOFR + 0.20%) | (a) | 0.25% | 01/03/22 | 05/09/22 | 800,000 | 800,000 |
| (SOFR + 0.19%) | (a) | 0.24% | 01/03/22 | 05/19/22 | 1,200,000 | 1,200,000 |
| (SOFR + 0.19%) | (a) | 0.24% | 01/03/22 | 05/27/22 | 250,000 | 250,000 |
| | | 2.00% | | 08/26/22 | 100,000 | 101,229 |
| | | 1.38% | | 09/06/22 | 100,000 | 100,857 |
Total U.S. Government Agency Debt
(Cost $20,658,061) | 20,658,061 |
|
| U.S. TREASURY DEBT 23.8% OF NET ASSETS |
| UNITED STATES TREASURY | | | | | | |
| (3 mo. US TBILL + 0.15%) | (a) | 0.24% | 01/03/22 | 01/31/22 | 1,250,000 | 1,250,033 |
| | | 1.38% | | 01/31/22 | 1,700,000 | 1,701,701 |
| | | 1.50% | | 01/31/22 | 2,100,000 | 2,102,258 |
| | | 2.50% | | 02/15/22 | 800,000 | 802,278 |
| | | 1.88% | | 02/28/22 | 2,700,000 | 2,707,495 |
| | | 2.38% | | 03/15/22 | 1,900,000 | 1,908,511 |
| | | 1.75% | | 03/31/22 | 1,800,000 | 1,807,099 |
| | | 1.88% | | 03/31/22 | 800,000 | 803,442 |
| | | 2.25% | | 04/15/22 | 900,000 | 905,453 |
| | | 0.11% | | 04/26/22 | 1,400,000 | 1,399,539 |
| (3 mo. US TBILL + 0.11%) | (a) | 0.20% | 01/03/22 | 04/30/22 | 1,400,000 | 1,400,363 |
| | | 1.88% | | 04/30/22 | 800,000 | 804,568 |
| | | 0.13% | | 05/03/22 | 1,600,000 | 1,599,334 |
| | | 0.13% | | 05/31/22 | 700,000 | 700,076 |
| | | 1.75% | | 05/31/22 | 500,000 | 503,371 |
| | | 1.88% | | 05/31/22 | 1,300,000 | 1,309,237 |
| | | 0.11% | | 06/09/22 | 200,000 | 199,908 |
| | | 0.13% | | 06/30/22 | 200,000 | 199,979 |
| | | 1.75% | | 06/30/22 | 200,000 | 201,639 |
| | | 0.09% | | 07/14/22 | 1,000,000 | 999,520 |
| | | 0.13% | | 07/31/22 | 500,000 | 500,140 |
| (3 mo. US TBILL + 0.06%) | (a) | 0.14% | 01/03/22 | 07/31/22 | 2,800,000 | 2,799,961 |
| | | 1.88% | | 07/31/22 | 700,000 | 707,227 |
| | | 2.00% | | 07/31/22 | 500,000 | 505,520 |
| | | 0.11% | | 08/11/22 | 600,000 | 599,615 |
| | | 1.50% | | 08/15/22 | 2,500,000 | 2,521,882 |
| | | 0.13% | | 08/31/22 | 1,400,000 | 1,400,450 |
| | | 1.63% | | 08/31/22 | 1,200,000 | 1,211,622 |
| | | 1.88% | | 08/31/22 | 600,000 | 607,091 |
| | | 1.50% | | 09/15/22 | 2,300,000 | 2,322,729 |
Schwab Government Money Market Portfolio | Annual Report
Schwab Government Money Market Portfolio
Portfolio Holdings as of December 31, 2021 (continued)
| Issuer | Footnotes | Rate | Effective
Maturity | Maturity
Date | Face
Amount ($) | Value ($) |
| | | 0.13% | | 09/30/22 | 1,500,000 | 1,500,412 |
| | | 1.75% | | 09/30/22 | 900,000 | 911,053 |
| | | 1.88% | | 09/30/22 | 600,000 | 607,684 |
| (3 mo. US TBILL + 0.06%) | (a) | 0.14% | 01/03/22 | 10/31/22 | 500,000 | 499,979 |
| (3 mo. US TBILL + 0.05%) | (a) | 0.13% | 01/03/22 | 01/31/23 | 2,500,000 | 2,500,739 |
| (3 mo. US TBILL + 0.03%) | (a) | 0.12% | 01/03/22 | 04/30/23 | 700,000 | 700,084 |
| (3 mo. US TBILL + 0.03%) | (a) | 0.11% | 01/03/22 | 07/31/23 | 500,000 | 500,012 |
| (3 mo. US TBILL + 0.04%) | (a) | 0.12% | 01/03/22 | 10/31/23 | 400,000 | 399,993 |
Total U.S. Treasury Debt
(Cost $44,101,997) | 44,101,997 |
|
| VARIABLE RATE DEMAND NOTES 1.9% OF NET ASSETS |
| ABAG FINANCE AUTH |
| M/F HOUSING RB (CROSSING APTS) SERIES 2002A (LOC: FEDERAL NATIONAL MORTGAGE ASSOCIATION) | (a)(b) | 0.07% | | 01/07/22 | 300,000 | 300,000 |
| ALABAMA HFA |
| M/F HOUSING RB (CHAPEL RIDGE APTS) SERIES 2005E (LOC: FEDERAL HOME LOAN MORTGAGE CORPORATION) | (a)(b) | 0.20% | | 01/07/22 | 100,000 | 100,000 |
| CALIFORNIA STATEWIDE COMMUNITIES DEVELOPMENT AUTH | | | | | | |
| M/F HOUSING RB (BAY VISTA AT MEADOW PARK APTS) SERIES 2003NN-1 (LOC: FEDERAL NATIONAL MORTGAGE ASSOCIATION) | (a)(b) | 0.07% | | 01/07/22 | 200,000 | 200,000 |
| M/F HOUSING RB (CROSSINGS WEST APTS) SERIES 2009E (LOC: FEDERAL HOME LOAN MORTGAGE CORPORATION) | (a)(b) | 0.13% | | 01/07/22 | 100,000 | 100,000 |
| M/F HOUSING RB (VARENNA ASSISTED LIVING APTS) SERIES 2006F (LOC: FEDERAL HOME LOAN BANKS) | (a)(b) | 0.13% | | 01/07/22 | 100,000 | 100,000 |
| M/F HOUSING RB (WILSHIRE COURT APTS) SERIES 2003M (LOC: FEDERAL NATIONAL MORTGAGE ASSOCIATION) | (a)(b) | 0.07% | | 01/07/22 | 100,000 | 100,000 |
| EMERYVILLE SUCCESSOR REDEVELOPMENT AGENCY |
| M/F HOUSING RB (BAY ST APTS) SERIES 2002A (LOC: FEDERAL NATIONAL MORTGAGE ASSOCIATION) | (a)(b) | 0.13% | | 01/07/22 | 300,000 | 300,000 |
| HARRIS CNTY HOUSING FINANCE CORP |
| M/F HOUSING RB (LAFAYETTE VILLAGE APTS) SERIES 2006 (LOC: FEDERAL NATIONAL MORTGAGE ASSOCIATION) | (a)(b) | 0.07% | | 01/07/22 | 100,000 | 100,000 |
| JACKSONVILLE HFA |
| M/F HOUSING RB (HARTWOOD APTS) SERIES 2006 (LOC: FEDERAL HOME LOAN MORTGAGE CORPORATION) | (a)(b) | 0.13% | | 01/07/22 | 505,000 | 505,000 |
| LOUISIANA LOCAL GOVERNMENT ENVIRONMENTAL FACILITIES & COMMUNITY DEVELOPMENT AUTH |
| RB (LOUISE S. MCGEHEE SCHOOL) SERIES 2010 (LOC: FEDERAL HOME LOAN BANKS) | (a)(b) | 0.15% | | 01/07/22 | 270,000 | 270,000 |
| NEW YORK STATE HFA | | | | | | |
| HOUSING RB (THEATRE ROW TOWER) SERIES 2000A (LOC: FEDERAL HOME LOAN MORTGAGE CORPORATION) | (a)(b) | 0.10% | | 01/07/22 | 100,000 | 100,000 |
| HOUSING RB SERIES 2005A (LOC: FEDERAL HOME LOAN MORTGAGE CORPORATION) | (a)(b) | 0.10% | | 01/07/22 | 200,000 | 200,000 |
Schwab Government Money Market Portfolio | Annual Report
Schwab Government Money Market Portfolio
Portfolio Holdings as of December 31, 2021 (continued)
| Issuer | Footnotes | Rate | Effective
Maturity | Maturity
Date | Face
Amount ($) | Value ($) |
| ORANGE CNTY HFA | | | | | | |
| M/F HOUSING RB (LANDINGS ON MILLENIA BLVD APTS) SERIES 2002A (LOC: FEDERAL NATIONAL MORTGAGE ASSOCIATION) | (a)(b) | 0.15% | | 01/07/22 | 100,000 | 100,000 |
| M/F HOUSING RB (LEE VISTA CLUB APTS) SERIES 2004A (LOC: FEDERAL NATIONAL MORTGAGE ASSOCIATION) | (a)(b) | 0.15% | | 01/07/22 | 100,000 | 100,000 |
| SACRAMENTO CNTY HOUSING AUTH |
| M/F HOUSING RB (LOGAN PARK APTS) SERIES 2007E (LOC: FEDERAL HOME LOAN MORTGAGE CORPORATION) | (a)(b) | 0.14% | | 01/07/22 | 300,000 | 300,000 |
| SAN JOSE |
| M/F HOUSING RB (CINNABAR COMMONS) SERIES 2003C (LOC: FEDERAL HOME LOAN MORTGAGE CORPORATION) | (a)(b) | 0.07% | | 01/07/22 | 100,000 | 100,000 |
| ST. TAMMANY PARISH DEVELOPMENT DISTRICT |
| RB (BCS DEVELOPMENT) SERIES 2008 (LOC: FEDERAL HOME LOAN BANKS) | (a)(b) | 0.15% | | 01/07/22 | 190,000 | 190,000 |
| TEXAS DEPT OF HOUSING & COMMUNITY AFFAIRS | | | | | | |
| M/F HOUSING RB (COSTA IBIZA APTS) SERIES 2008 (LOC: FEDERAL HOME LOAN MORTGAGE CORPORATION) | (a)(b) | 0.16% | | 01/07/22 | 100,000 | 100,000 |
| M/F HOUSING RB (TOWER RIDGE APTS) SERIES 2005 (LOC: FEDERAL NATIONAL MORTGAGE ASSOCIATION) | (a)(b) | 0.20% | | 01/07/22 | 100,000 | 100,000 |
| M/F HOUSING REFUNDING RB (ALTA CULLEN APTS) SERIES 2008 (LOC: FEDERAL HOME LOAN MORTGAGE CORPORATION) | (a)(b) | 0.16% | | 01/07/22 | 100,000 | 100,000 |
Total Variable Rate Demand Notes
(Cost $3,465,000) | 3,465,000 |
|
| INVESTMENT COMPANIES 0.0% OF NET ASSETS |
| MONEY MARKET FUNDS 0.0% | |
| STATE STREET INSTITUTIONAL U.S. GOVERNMENT MONEY MARKET FUND, PREMIER CLASS | (c) | 0.03% | | | 45,600 | 45,600 |
Total Investment Companies
(Cost $45,600) | 45,600 |
| ISSUER | FOOTNOTES | RATE | EFFECTIVE
MATURITY | MATURITY
DATE | MATURITY
AMOUNT ($) | VALUE ($) |
| REPURCHASE AGREEMENTS 63.0% OF NET ASSETS |
| U.S. GOVERNMENT AGENCY REPURCHASE AGREEMENTS* 46.0% |
| BANK OF MONTREAL | | | | | | |
| Issued 12/31/21, repurchase date 01/03/22 | | 0.05% | | 01/03/22 | 4,000,017 | 4,000,000 |
| (Collateralized by U.S. Government Agency Securities valued at $4,120,018, 1.38% - 3.20%, due 02/01/31 - 01/15/62) | | | | | | |
| BOFA SECURITIES INC | | | | | | |
| Issued 12/31/21, repurchase date 01/03/22 | | 0.05% | | 01/03/22 | 20,000,083 | 20,000,000 |
| (Collateralized by U.S. Government Agency Securities valued at $20,600,001, 2.00%, due 01/01/37) | | | | | | |
| CREDIT AGRICOLE CORPORATE AND INVESTMENT BANK SA | | | | | | |
| Issued 12/31/21, repurchase date 01/03/22 | | 0.05% | | 01/03/22 | 15,000,063 | 15,000,000 |
| (Collateralized by U.S. Government Agency Securities valued at $15,450,065, 2.00%, due 01/20/51) | | | | | | |
Schwab Government Money Market Portfolio | Annual Report
Schwab Government Money Market Portfolio
Portfolio Holdings as of December 31, 2021 (continued)
| ISSUER | FOOTNOTES | RATE | EFFECTIVE
MATURITY | MATURITY
DATE | MATURITY
AMOUNT ($) | VALUE ($) |
| DAIWA CAPITAL MARKETS AMERICA INC | | | | | | |
| Issued 12/31/21, repurchase date 01/03/22 | | 0.05% | | 01/03/22 | 8,000,033 | 8,000,000 |
| (Collateralized by U.S. Treasury and U.S. Government Agency Securities valued at $8,180,865, 0.13% - 5.00%, due 09/30/22 - 12/20/51) | | | | | | |
| DEUTSCHE BANK AG (NEW YORK BRANCH) | | | | | | |
| Issued 12/31/21, repurchase date 01/03/22 | | 0.05% | | 01/03/22 | 8,000,033 | 8,000,000 |
| (Collateralized by U.S. Treasury Securities valued at $8,160,139, 2.88%, due 05/15/28) | | | | | | |
| GOLDMAN SACHS & CO LLC | | | | | | |
| Issued 12/28/21, repurchase date 01/04/22 | | 0.06% | | 01/04/22 | 3,000,035 | 3,000,000 |
| (Collateralized by U.S. Government Agency Securities valued at $3,060,000, 3.00% - 5.50%, due 12/01/30 - 12/20/51) | | | | | | |
| Issued 12/29/21, repurchase date 01/05/22 | | 0.06% | | 01/05/22 | 2,000,023 | 2,000,000 |
| (Collateralized by U.S. Government Agency Securities valued at $2,040,000, 2.50% - 7.50%, due 03/01/23 - 05/01/49) | | | | | | |
| JP MORGAN SECURITIES LLC | | | | | | |
| Issued 12/31/21, repurchase date 01/03/22 | | 0.05% | | 01/03/22 | 10,000,042 | 10,000,000 |
| (Collateralized by U.S. Government Agency Securities valued at $10,300,002, 3.00%, due 07/15/48 - 11/01/51) | | | | | | |
| MIZUHO SECURITIES USA LLC | | | | | | |
| Issued 12/31/21, repurchase date 01/03/22 | | 0.05% | | 01/03/22 | 5,000,021 | 5,000,000 |
| (Collateralized by U.S. Treasury Securities valued at $5,100,026, 1.25%, due 12/31/26) | | | | | | |
| RBC DOMINION SECURITIES INC | | | | | | |
| Issued 12/31/21, repurchase date 01/03/22 | | 0.05% | | 01/03/22 | 2,000,008 | 2,000,000 |
| (Collateralized by U.S. Treasury and U.S. Government Agency Securities valued at $2,048,699, 0.25% - 4.50%, due 08/31/23 - 03/20/51) | | | | | | |
| ROYAL BANK OF CANADA | | | | | | |
| Issued 12/31/21, repurchase date 01/03/22 | | 0.05% | | 01/03/22 | 8,000,033 | 8,000,000 |
| (Collateralized by U.S. Government Agency Securities valued at $8,240,035, 1.31% - 4.50%, due 02/01/31 - 12/20/51) | | | | | | |
| | | | | | | 85,000,000 |
| U.S. TREASURY REPURCHASE AGREEMENTS 17.0% |
| BARCLAYS BANK PLC | | | | | | |
| Issued 12/31/21, repurchase date 01/03/22 | | 0.05% | | 01/03/22 | 2,506,525 | 2,506,515 |
| (Collateralized by U.S. Treasury Securities valued at $2,556,658, 2.75%, due 08/31/25) | | | | | | |
| CREDIT SUISSE AG (NEW YORK BRANCH) | | | | | | |
| Issued 12/31/21, repurchase date 01/03/22 | | 0.05% | | 01/03/22 | 20,000,083 | 20,000,000 |
| (Collateralized by U.S. Treasury Securities valued at $20,400,101, 0.12% - 1.25%, due 10/31/23 - 12/31/26) | | | | | | |
| FICC - BANK OF NEW YORK | | | | | | |
| Issued 12/31/21, repurchase date 01/03/22 | | 0.06% | | 01/03/22 | 4,000,020 | 4,000,000 |
| (Collateralized by U.S. Treasury Securities valued at $4,080,026, 0.13%, due 05/31/22) | | | | | | |
Schwab Government Money Market Portfolio | Annual Report
Schwab Government Money Market Portfolio
Portfolio Holdings as of December 31, 2021 (continued)
| ISSUER | FOOTNOTES | RATE | EFFECTIVE
MATURITY | MATURITY
DATE | MATURITY
AMOUNT ($) | VALUE ($) |
| Issued 12/30/21, repurchase date 01/06/22 | | 0.06% | | 01/06/22 | 2,000,023 | 2,000,000 |
| (Collateralized by U.S. Treasury Securities valued at $2,636,732, 1.00%, due 12/15/24) | | | | | | |
| JP MORGAN SECURITIES LLC | | | | | | |
| Issued 12/30/21, repurchase date 01/06/22 | | 0.05% | | 01/06/22 | 3,000,029 | 3,000,000 |
| (Collateralized by U.S. Treasury Securities valued at $3,060,008, 0.13% - 7.25%, due 01/15/22 - 08/15/22) | | | | | | |
| | | | | | | 31,506,515 |
Total Repurchase Agreements
(Cost $116,506,515) | 116,506,515 |
Total Investments in Securities
(Cost $184,777,173) | 184,777,173 |
| * | Collateralized via U.S. Government Agency Securities or less frequently by higher rated U.S. Treasury Securities. |
| (a) | Variable rate security; rate shown is effective rate at period end. |
| (b) | VRDN is a municipal security which allows holders to sell their security through a put or tender feature, at par value plus accrued interest. The interest rate resets on a periodic basis, the majority of which are weekly but may be daily or monthly. Unless a reference rate and spread is shown parenthetically, the Remarketing Agent, generally a dealer, determines the interest rate for the security at each interest rate reset date. The rate is typically based on the SIFMA Municipal Swap Index. |
| (c) | The rate shown is the 7-day yield. |
| EFFR — | Effective Federal Funds Rate is published daily by the Federal Reserve Bank of New York and is based on the interest rate financial institutions charge each other for overnight funds. |
| FICC — | Fixed Income Clearing Corp |
| HFA — | Housing finance agency/authority |
| LOC — | Letter of credit |
| M/F — | Multi-family |
| RB — | Revenue bond |
| SIFMA — | Securities Industry and Financial Markets Association. The SIFMA Municipal Swap Index is a market index comprised of high-grade 7-day tax-exempt Variable Rate Demand Obligations with certain characteristics. |
| SOFR — | Secured Overnight Financing Rate is published daily by the Federal Reserve Bank of New York and is based on the cost of borrowing cash overnight collateralized by U.S. Treasury securities. |
| US TBILL — | The reference rate is the weekly auction stop for the U.S. Treasury Bill. |
| VRDN — | Variable rate demand note |
The following is a summary of the inputs used to value the fund’s investments as of December 31, 2021 (see financial note 2(a) for additional information):
| DESCRIPTION | QUOTED PRICES IN
ACTIVE MARKETS FOR
IDENTICAL ASSETS
(LEVEL 1) | OTHER SIGNIFICANT
OBSERVABLE INPUTS
(LEVEL 2) | SIGNIFICANT
UNOBSERVABLE INPUTS
(LEVEL 3) | TOTAL |
| Assets | | | | |
| U.S. Government Agency Debt1 | $— | $20,658,061 | $— | $20,658,061 |
| U.S. Treasury Debt1 | — | 44,101,997 | — | 44,101,997 |
| Variable Rate Demand Notes1 | — | 3,465,000 | — | 3,465,000 |
| Investment Companies1 | 45,600 | — | — | 45,600 |
| Repurchase Agreements1 | — | 116,506,515 | — | 116,506,515 |
| Total | $45,600 | $184,731,573 | $— | $184,777,173 |
| 1 | As categorized in the Portfolio Holdings. |
Fund investments in mutual funds are classified as Level 1, without consideration to the classification level of the underlying securities held by the mutual funds, which could be Level 1, Level 2 or Level 3.
Schwab Government Money Market Portfolio | Annual Report
Schwab Government Money Market Portfolio
Statement of Assets and Liabilities
As of December 31, 2021
| Assets |
| Investments in securities, at cost and value - unaffiliated (Note 2a) | | $68,270,658 |
| Repurchase agreements, at cost and value — unaffiliated (Note 2a) | | 116,506,515 |
| Receivables: | | |
| Fund shares sold | | 1,798,543 |
| Interest | | 161,407 |
| Prepaid expenses | + | 426 |
| Total assets | | 186,737,549 |
| Liabilities |
| Payables: | | |
| Investments bought | | 1,599,334 |
| Fund shares redeemed | | 122,977 |
| Independent trustees’ fees | | 73 |
| Accrued expenses | + | 99,100 |
| Total liabilities | | 1,821,484 |
| Net assets | | $184,916,065 |
| Net Assets by Source |
| Capital received from investors | | $184,869,469 |
| Total distributable earnings | + | 46,596 |
| Net assets | | $184,916,065 |
| Net Asset Value (NAV) |
| Net Assets | ÷ | Shares
Outstanding | = | NAV |
| $184,916,065 | | 184,916,294 | | $1.00 |
| | | | | |
| | | | | |
Schwab Government Money Market Portfolio | Annual Report
Schwab Government Money Market Portfolio
Statement of Operations
| For the period January 1, 2021 through December 31, 2021 |
| Investment Income |
| Interest received from securities - unaffiliated | | $220,024 |
| Expenses |
| Investment adviser and administrator fees | | 351,411 |
| Portfolio accounting fees | | 38,543 |
| Custodian fees | | 35,646 |
| Professional fees | | 34,586 |
| Shareholder reports | | 24,159 |
| Independent trustees’ fees | | 15,643 |
| Transfer agent fees | | 1,949 |
| Other expenses | + | 4,831 |
| Total expenses | | 506,768 |
| Expense reduction by investment adviser and its affiliates | – | 398,609 |
| Net expenses | – | 108,159 |
| Net investment income | | 111,865 |
| REALIZED GAINS (LOSSES) |
| Net realized gains on sales of securities - unaffiliated | | 880 |
| Increase in net assets resulting from operations | | $112,745 |
Schwab Government Money Market Portfolio | Annual Report
Schwab Government Money Market Portfolio
Statement of Changes in Net Assets
For the current and prior report periods
| OPERATIONS |
| | 1/1/21-12/31/21 | 1/1/20-12/31/20 |
| Net investment income | | $111,865 | $458,260 |
| Net realized gains | + | 880 | 13 |
| Increase in net assets from operations | | $112,745 | $458,273 |
| DISTRIBUTIONS TO SHAREHOLDERS |
| Total distributions | | ($111,865) | ($458,260) |
| TRANSACTIONS IN FUND SHARES* |
| Shares sold | | 151,802,828 | 219,731,996 |
| Shares reinvested | | 111,865 | 458,260 |
| Shares redeemed | + | (152,073,454) | (183,969,281) |
| Net transactions in fund shares | | (158,761) | 36,220,975 |
| NET ASSETS |
| Beginning of period | | $185,073,946 | $148,852,958 |
| Total increase (decrease) | + | (157,881) | 36,220,988 |
| End of period | | $184,916,065 | $185,073,946 |
| * | Transactions took place at $1.00 per share; figures for share quantities are the same as for dollars. |
Schwab Government Money Market Portfolio | Annual Report
Schwab Government Money Market Portfolio
1. Business Structure of the Fund:
Schwab Government Money Market Portfolio (the fund) is a series of Schwab Annuity Portfolios (the trust), a no-load, open-end management investment company. The trust is organized as a Massachusetts business trust and is registered under the Investment Company Act of 1940, as amended (the 1940 Act). The list below shows all the funds in the trust as of the end of the period, including the fund discussed in this report, which is highlighted:
| SCHWAB ANNUITY PORTFOLIOS (ORGANIZED JANUARY 21, 1994) |
| Schwab Government Money Market Portfolio | |
| Schwab S&P 500 Index Portfolio | |
| Schwab VIT Balanced Portfolio | |
| Schwab VIT Balanced with Growth Portfolio | |
| Schwab VIT Growth Portfolio | |
The fund in this report offers one share class. Shares are bought and sold at closing net asset value per share (NAV), which is the price for all outstanding shares of a fund. Each share has a par value of 1/1,000 of a cent, and the fund’s Board of Trustees (the Board) may authorize the issuance of as many shares as necessary.
The fund is available exclusively as an investment vehicle for variable annuity and variable life insurance contracts offered by separate accounts of participating life insurance companies, and in the future may be offered to pension and retirement plans qualified under the Internal Revenue Code of 1986, as amended. At December 31, 2021, 100% of the fund’s shares were held through separate accounts of seven insurance companies. Subscriptions and redemptions of these insurance separate accounts could have a material impact on the fund.
The fund maintains its own account for purposes of holding assets and accounting, and is considered a separate entity for tax purposes. Within its account, the fund may also keep certain assets in segregated accounts, as required by securities law.
2. Significant Accounting Policies:
The following is a summary of the significant accounting policies the fund uses in its preparation of financial statements. The fund follows the investment company accounting and reporting guidance of the Financial Accounting Standards Board (FASB) Accounting Standard Codification Topic 946 Financial Services — Investment Companies. The accounting policies are in conformity with accounting principles generally accepted in the United States of America (GAAP).
(a) Security Valuation:
Under procedures approved by the Board, the investment adviser has formed a Pricing Committee to administer the pricing and valuation of portfolio securities and other assets and to ensure that prices used for internal purposes or provided by third parties reasonably reflect fair value. Among other things, these procedures allow the fund to utilize independent pricing services, quotations from securities and financial instrument dealers and other market sources to determine fair value.
Securities in the fund are valued at amortized cost (which approximates fair value) as permitted in accordance with Rule 2a-7 of the 1940 Act. In the event that security valuations do not approximate fair value, securities may be fair valued as determined in accordance with procedures adopted by the Board. The Pricing Committee considers a number of factors, including unobservable market inputs when arriving at fair value. The Pricing Committee may employ techniques such as the review of related or comparable assets or liabilities, related market activities, recent transactions, market multiples, book values, transactional back-testing, disposition analysis and other relevant information. The Pricing Committee regularly reviews these inputs and assumptions to calibrate the valuations. Due to the subjective and variable nature of fair value pricing, there can be no assurance that a fund could obtain the fair value assigned to the security upon the sale of such security. The Board convenes on a regular basis to review fair value determinations made by the fund pursuant to the valuation procedures.
In accordance with the authoritative guidance on fair value measurements and disclosures under GAAP, the fund discloses the fair value of its investments in a hierarchy that prioritizes the significant inputs to valuation techniques used to measure the fair value. The hierarchy gives the highest priority to valuations based upon unadjusted quoted prices in active markets for identical assets or liabilities (Level 1 measurements) and the lowest priority to valuations based upon unobservable inputs that are significant to the valuation (Level 3 measurements). If inputs used to measure the financial instruments fall within different levels of the hierarchy, the categorization is based on the lowest level input that is significant to the valuation. If the fund determines that either the volume and/or level of activity for an asset or liability has significantly decreased (from normal conditions for that asset or liability) or price quotations or observable inputs are not associated with orderly transactions, increased analysis and management judgment will be required to estimate fair value.
Schwab Government Money Market Portfolio | Annual Report
Schwab Government Money Market Portfolio
Financial Notes (continued)
2. Significant Accounting Policies (continued):
• Mutual funds: Mutual funds are valued at their respective NAVs.
The three levels of the fair value hierarchy are as follows:
• Level 1 — quoted prices in active markets for identical securities — Investments whose values are based on quoted market prices in active markets, and whose values are therefore classified as Level 1 prices, include active listed equities. Investments in mutual funds are valued daily at their NAVs, which are classified as Level 1 prices, without consideration to the classification level of the underlying securities held by an underlying fund.
• Level 2 — other significant observable inputs (including quoted prices for similar securities, interest rates, prepayment speeds, credit risk, etc.) — Investments that trade in markets that are not considered to be active, but whose values are based on quoted market prices, dealer quotations or valuations provided by alternative pricing sources supported by observable inputs are classified as Level 2 prices. These generally include U.S. government and sovereign obligations, most government agency securities, investment-grade corporate bonds, certain mortgage products, less liquid listed equities, and state, municipal and provincial obligations. Securities held by stable NAV money funds operating pursuant to Rule 2a-7 under the 1940 Act are valued at amortized cost which approximates current fair value and are considered to be valued using Level 2 inputs.
• Level 3 — significant unobservable inputs (including the fund’s own assumptions in determining the fair value of investments) — Investments whose values are classified as Level 3 prices have significant unobservable inputs, as they may trade infrequently or not at all. When observable prices are not available for these securities, the fund uses one or more valuation techniques for which sufficient and reliable data is available. The inputs used by the fund in estimating the value of Level 3 prices may include the original transaction price, quoted prices for similar securities or assets in active markets, completed or pending third-party transactions in the underlying investment or comparable issuers, and changes in financial ratios or cash flows. Level 3 prices may also be adjusted to reflect illiquidity and/or non-transferability, with the amount of such discount estimated by the fund in the absence of market information. Assumptions used by the fund due to the lack of observable inputs may significantly impact the resulting fair value and therefore the fund’s results of operations.
The inputs or methodology used for valuing securities are not necessarily an indication of the risk associated with investing in those securities.
The levels associated with valuing the fund’s investments as of December 31, 2021 are disclosed in the Portfolio Holdings.
(b) Accounting Policies for certain Portfolio Investments (if held):
Repurchase Agreements: In a repurchase agreement, a fund buys a security from another party (the counterparty), usually a financial institution, with the agreement that it be sold back in the future. Repurchase agreements subject a fund to counterparty risk, meaning that the fund could lose money if the other party fails to perform under the terms of the agreement. The fund mitigates this risk by ensuring that a fund’s repurchase agreements are collateralized by cash and/or U.S. government securities. All collateral is held by the fund’s custodian (or, with multi-party agreements, the agent’s bank) and is monitored daily to ensure that its fair value is at least equal to the maturity amount under the agreement. In the event of a default by the counterparty, realization of the collateral proceeds could be delayed or limited and the value of the collateral may decline. Investments in repurchase agreements are also based on a review of the credit quality of the repurchase agreement counterparty.
As of December 31, 2021, the fund had investments in repurchase agreements with a gross value of $116,506,515 as disclosed in the Portfolio Holdings and the Statement of Assets and Liabilities. The value of the related collateral disclosed in the Portfolio Holdings exceeded the value of the repurchase agreements at period end.
Delayed-Delivery Transactions: The fund may buy securities at a predetermined price or yield, with payment and delivery taking place after the customary settlement period for that type of security. The fund will assume the rights and risks of ownership at the time of purchase, including the risk of price and yield fluctuations. Typically, no interest will accrue to the fund until the security is delivered. The fund will earmark or segregate appropriate liquid assets to cover its delayed-delivery purchase obligations, if any.
(c) Security Transactions:
Security transactions are recorded as of the date the order to buy or sell the security is executed. Realized gains and losses from security transactions are based on the identified costs of the securities involved.
Schwab Government Money Market Portfolio | Annual Report
Schwab Government Money Market Portfolio
Financial Notes (continued)
2. Significant Accounting Policies (continued):
(d) Investment Income:
Interest income is recorded as it accrues. If the fund buys a debt security at a discount (less than face value) or a premium (more than face value), it amortizes premiums and accretes discounts from the purchase settlement date up to maturity. The fund then increases (in the case of discounts) or reduces (in the case of premiums) the income it records from the security. Certain securities may be callable (meaning that the issuer has the option to pay it off before its maturity date). The fund amortizes the premium and accretes the discount on each callable security to the security’s maturity date, except when the purchase price is higher than the call price at the security’s call date (in which case the premium is amortized to the call date). Dividends and distributions from underlying funds are recorded on the date they are effective (the ex-dividend date). Any distributions from underlying funds are recorded in accordance with the character of the distributions as designated by the underlying funds.
(e) Expenses:
Expenses that are specific to the fund are charged directly to the fund. Expenses that are common to more than one fund in the trusts generally are allocated among those funds in proportion to their average daily net assets.
(f) Distributions to Shareholders:
The fund declares distributions from net investment income, if any, every day it is open for business. The fund makes distributions from net realized capital gains, if any, once a year.
(g) Accounting Estimates:
The accounting policies described in this report conform to GAAP. Notwithstanding this, shareholders should understand that in order to follow these principles, fund management has to make estimates and assumptions that affect the information reported in the financial statements. It’s possible that once the results are known, they may turn out to be different from these estimates and these differences may be material.
(h) Federal Income Taxes:
The fund intends to meet federal income and excise tax requirements for regulated investment companies under subchapter M of the Internal Revenue Code, as amended. Accordingly, the fund distributes substantially all of its net investment income and net realized capital gains, if any, to the participating insurance company’s (shareholders) separate accounts each year. As long as the fund meets the tax requirements, it is not required to pay federal income tax.
(i) Indemnification:
Under the fund’s organizational documents, the officers and trustees are indemnified against certain liabilities arising out of the performance of their duties to the fund. In addition, in the normal course of business the fund enters into contracts with its vendors and others that provide general indemnifications. The fund’s maximum exposure under these arrangements is unknown as this would involve future claims that may be made against the fund. However, based on experience, the fund expects the risk of loss attributable to these arrangements to be remote.
(j) Recent Accounting Standards:
In March 2020, the FASB issued Accounting Standards Update “Facilitation of the Effects of Reference Rate Reform on Financial Reporting (Topic 848)” (ASU 2020-04), which provides optional temporary financial reporting relief from the effect of certain types of contract modifications due to the planned discontinuation of the London Interbank Offered Rate (LIBOR) and other interbank offered based reference rates at the end of 2021. The temporary relief provided is effective for certain reference rate-related contract modifications that occur during the period March 12, 2020 through December 31, 2022. At this time, management believes the adoption of ASU 2020-04 will not have a material impact to the financial statements.
3. Risk Factors:
Market Risk. Financial markets rise and fall in response to a variety of factors, sometimes rapidly and unpredictably. Markets may be impacted by economic, political, regulatory and other conditions, including economic sanctions and other government actions. In addition, the occurrence of global events, such as war, terrorism, environmental disasters, natural disasters and epidemics may also negatively affect the financial markets. These events could reduce consumer demand or economic output; result in market closures, low or negative interest rates, travel restrictions or quarantines; and significantly adversely impact the economy. Governmental and quasi-governmental authorities and regulators throughout the world have in the past often responded to serious economic
Schwab Government Money Market Portfolio | Annual Report
Schwab Government Money Market Portfolio
Financial Notes (continued)
3. Risk Factors (continued):
disruptions with a variety of significant fiscal and monetary policy changes which could have an unexpected impact on financial markets and the fund’s investments. As with any investment whose performance is tied to these markets, the value of an investment in the fund will fluctuate, which means that an investor could lose money over short or long periods.
Investment Risk. You could lose money by investing in the fund. Although the fund seeks to preserve the value of your investment at $1.00 per share, it cannot guarantee it will do so. An investment in the fund is not insured or guaranteed by the Federal Deposit Insurance Corporation or any other government agency. The fund’s sponsor has no legal obligation to provide financial support to the fund, and you should not expect that the sponsor will provide financial support to the fund at any time.
Interest Rate Risk. Interest rates rise and fall over time. As with any investment whose yield reflects current interest rates, the fund’s yield will change over time. During periods when interest rates are low or there are negative interest rates, the fund’s yield (and total return) also could be low or even negative. In addition, the fund may be unable to pay expenses out of fund assets or maintain a stable $1.00 share price. Also, a change in a central bank’s monetary policy or economic conditions may result in a change in interest rates, which could have sudden and unpredictable effects on the markets. A sudden or unpredictable rise or decline in interest rates may cause volatility. Volatility in the market may decrease liquidity in the money market securities markets, making it more difficult for the fund to sell its money market investments at a time when the investment adviser might wish to sell such investments. Decreased market liquidity also may make it more difficult to value some or all of the fund’s money market securities holdings.
Stable Net Asset Value Risk. If the fund or another money market fund fails to maintain a stable net asset value (or such perception exists in the market place), the fund could experience increased redemptions, which may adversely impact the fund’s share price. The fund is permitted, among other things, to reduce or withhold any income and/or gains generated by the fund to maintain a stable $1.00 share price.
Repurchase Agreements Risk. When the fund enters into a repurchase agreement, the fund is exposed to the risk that the other party (i.e. the counterparty) will not fulfill its contractual obligation. In a repurchase agreement, there exists the risk that, when the fund buys a security from a counterparty that agrees to repurchase the security at an agreed upon price (usually higher) and time, the counterparty will not repurchase the security.
Credit Risk. A decline in the credit quality of an issuer, guarantor or liquidity provider of a portfolio investment or a counterparty could cause the fund to lose money or underperform. The fund could lose money if, due to a decline in credit quality, the issuer, guarantor or liquidity provider of a portfolio investment or a counterparty fails to make, or is perceived as being unable or unwilling to make, timely principal or interest payments or otherwise honor its obligations. Even though the fund’s investments in repurchase agreements are collateralized at all times, there is some risk to the fund if the other party should default on its obligations and the fund is delayed or prevented from recovering or disposing of the collateral. The credit quality of the fund’s portfolio holdings can change rapidly in certain market environments and any downgrade or default on the part of a single portfolio investment could cause the fund’s share price or yield to fall.
Certain U.S. government securities that the fund invests in are not backed by the full faith and credit of the U.S. government, which means they are neither issued nor guaranteed by the U.S. Treasury. Although maintained in conservatorship by the Federal Housing Finance Agency (FHFA) since September 2008, the Federal National Mortgage Association (Fannie Mae) and Federal Home Loan Mortgage Corporation (Freddie Mac) maintain only lines of credit with the U.S. Treasury. The Federal Home Loan Banks maintain limited access to credit lines from the U.S. Treasury. Other securities, such as obligations issued by the Federal Farm Credit Banks Funding Corporation, are supported solely by the credit of the issuer. There can be no assurance that the U.S. government will provide financial support to securities of its agencies and instrumentalities if it is not obligated to do so under law. Also, any government guarantees on securities the fund owns do not extend to the shares of the fund itself.
Management Risk. Any actively managed mutual fund is subject to the risk that its investment adviser will select investments or allocate assets in a manner that could cause the fund to underperform or otherwise not meet its investment objective. The fund’s investment adviser applies its own investment techniques and risk analyses in making investment decisions for the fund, but there can be no guarantee that they will produce the desired results. The investment adviser’s maturity decisions will also affect the fund’s yield, and potentially could affect its share price. To the extent that the investment adviser anticipates interest rate trends imprecisely, the fund’s yield at times could lag the yields of other money market funds.
Redemption Risk. The fund may experience periods of heavy redemptions that could cause the fund to liquidate its assets at inopportune times or at a loss or depressed value, particularly during periods of declining or illiquid markets. Redemptions by a few large investors in the fund may have a significant adverse effect on the fund’s ability to maintain a stable $1.00 share price. In the event any money market fund fails to maintain a stable net asset value, other money market funds, including the fund, could face a market-wide risk of increased redemption pressures, potentially jeopardizing the stability of their $1.00 share prices.
Schwab Government Money Market Portfolio | Annual Report
Schwab Government Money Market Portfolio
Financial Notes (continued)
3. Risk Factors (continued):
Money Market Fund Risk. The fund is not designed to offer capital appreciation. In exchange for their emphasis on stability and liquidity, money market investments may offer lower long-term performance than stock or bond investments.
Tax Diversification Risk. As described above, the fund intends to operate as a government money market fund under the regulations governing money market funds. Additionally, the fund intends to meet the diversification requirements that are applicable to insurance company separate accounts under Subchapter L of the Internal Revenue Code of 1986, as amended (the Diversification Requirements). To satisfy the Diversification Requirements applicable to variable annuity contracts, the value of the assets of the fund invested in securities issued by the U.S. government, its agencies or instrumentalities must remain below specified thresholds. For these purposes, each U.S. government agency or instrumentality is treated as a separate issuer.
Operating as a government money market fund may make it difficult for the fund to meet the Diversification Requirements. This difficulty may be exacerbated by the potential increase in demand for the types of securities in which the fund invests as a result of changes to the rules that govern SEC registered money market funds. A failure to satisfy the Diversification Requirements could have significant adverse tax consequences for variable life insurance and variable annuity contract owners whose contract values are determined by investment in the fund.
Please refer to the fund’s prospectus for a more complete description of the principal risks of investing in the fund.
4. Affiliates and Affiliated Transactions:
Investment Adviser
Charles Schwab Investment Management, Inc., dba Schwab Asset Management, a wholly owned subsidiary of The Charles Schwab Corporation, serves as the fund’s investment adviser and administrator pursuant to an Investment Advisory and Administration Agreement between the investment adviser and the trust.
For its advisory and administrative services to the fund, the investment adviser is entitled to receive an annual fee, payable monthly, equal to 0.19% of the fund’s average daily net assets.
Contractual Expense Limitation
The investment adviser and its affiliates have made an additional agreement with the fund, for so long as the investment adviser serves as the investment adviser to the fund, which may only be amended or terminated with the approval of the Board, to limit the total annual fund operating expenses charged, excluding interest, taxes, and certain non-routine expenses (expense limitation) to 0.34%.
During the year ended December 31, 2021, the fund waived a total of $398,609 in expenses, all of which was waived voluntarily.
Voluntary Yield Waiver/Reimbursement
The investment adviser and its affiliates may waive and/or reimburse expenses to the extent necessary to maintain a positive net yield for the fund.
Interfund Transactions
The fund may engage in transactions with certain other funds in the Fund Complex (for definition refer to the Trustees and Officers section)in accordance with procedures adopted by the Board pursuant to Rule 17a-7 under the 1940 Act. When one fund is seeking to sell a security that another is seeking to buy, an interfund transaction can allow both funds to benefit by reducing transaction costs. This practice is limited to funds that share the same investment adviser, trustees and/or officers. For the period ended December 31, 2021, the fund’s total aggregate security transactions with other funds in the Fund Complex was $1,505,036 and includes realized gains (losses) of $0.
Interfund Borrowing and Lending
Pursuant to an exemptive order issued by the U.S. Securities and Exchange Commission (SEC), the fund may enter into interfund borrowing and lending transactions with other funds in the Fund Complex. All loans are for temporary or emergency purposes and the interest rate to be charged will be the average of the overnight repurchase agreement rate and the short-term bank loan rate. All loans are subject to numerous conditions designed to ensure fair and equitable treatment of all participating funds. The interfund lending facility is subject to the oversight and periodic review by the Board. The fund had no interfund borrowing or lending activity during the period.
Schwab Government Money Market Portfolio | Annual Report
Schwab Government Money Market Portfolio
Financial Notes (continued)
The Board may include people who are officers and/or directors of the investment adviser or its affiliates. Federal securities law limits the percentage of such “interested persons” who may serve on a trust’s board, and the trust was in compliance with these limitations throughout the report period. The trust did not pay any of these interested persons for their services as trustees, but it did pay non-interested persons (independent trustees), as noted on the fund’s Statement of Operations. For information regarding the trustees, please refer to the Trustees and Officers table at the end of this report.
6. Borrowing from Banks
During the period, the fund was a participant with other funds in the Fund Complex in a joint, syndicated, committed $850 million line of credit (the Syndicated Credit Facility), which matured on September 30, 2021. On September 30, 2021, the Syndicated Credit Facility was amended to run for a new 364 day period with the line of credit amount remaining unchanged, maturing on September 29, 2022. Under the terms of the Syndicated Credit Facility, in addition to the interest charged on any borrowings by the fund, the fund paid a commitment fee of 0.15% per annum on the fund’s proportionate share of the unused portion of the Syndicated Credit Facility.
During the period, the fund was a participant with other funds in the Fund Complex in a joint, unsecured, uncommitted $400 million line of credit (the Uncommitted Credit Facility), with State Street Bank and Trust Company, which matured on September 30, 2021. On September 30, 2021, the Uncommitted Credit Facility was amended to run for a new 364 day period with the line of credit remaining unchanged, maturing on September 29, 2022. Under the terms of the Uncommitted Credit Facility, the fund pays interest on the amount it borrows. There were no borrowings from either line of credit during the period.
The fund also has access to custodian overdraft facilities. The fund may have utilized the overdraft facility and incurred an interest expense, which is disclosed on the fund’s Statement of Operations, if any. The interest expense is determined based on a negotiated rate above the current Federal Funds Rate.
7. Federal Income Taxes:
At December 31, 2021, the tax basis cost of the fund’s investments was $184,731,573 and the unrealized appreciation and depreciation were $45,600 and ($0), respectively, with a net unrealized appreciation of $45,600.
As of December 31, 2021, the components of distributable earnings on a tax basis were as follows:
UNDISTRIBUTED
ORDINARY
INCOME | UNDISTRIBUTED
LONG-TERM
CAPITAL GAINS | NET UNREALIZED
APPRECIATION
(DEPRECIATION)
ON INVESTMENTS | TOTAL |
| $896 | $100 | $45,600 | $46,596 |
The tax basis components of distributions paid during the current and prior fiscal years were:
| CURRENT FISCAL YEAR END DISTRIBUTIONS | PRIOR FISCAL YEAR END DISTRIBUTIONS |
ORDINARY
INCOME | ORDINARY
INCOME |
| $111,865 | $458,260 |
Distributions paid to shareholders are based on net investment income and net realized gains determined on a tax basis, which may differ from net investment income and net realized gains for financial reporting purposes. These differences reflect the differing character of certain income items and net realized gains and losses for financial statement and tax purposes, and may result in reclassification among certain capital accounts on the financial statements. The fund may also designate a portion of the amount paid to redeeming shareholders as a distribution for tax purposes.
Permanent book and tax basis differences may result in reclassifications between components of net assets as required. The adjustments will have no impact on net assets or the results of operations.
As of December 31, 2021, management has reviewed the tax positions for open periods (for federal purposes, three years from the date of filing and for state purposes, four years from the date of filing) as applicable to the fund, and has determined that no provision for income tax is required in the fund’s financial statements. The fund recognizes interest and penalties, if any, related to unrecognized tax benefits as income tax expense in the Statement of Operations. During the fiscal year ended December 31, 2021, the fund did not incur any interest or penalties.
Schwab Government Money Market Portfolio | Annual Report
Schwab Government Money Market Portfolio
Financial Notes (continued)
Management has determined there are no subsequent events or transactions through the date the financial statements were issued that would have materially impacted the financial statements as presented.
Schwab Government Money Market Portfolio | Annual Report
Schwab Government Money Market Portfolio
Report of Independent Registered Public Accounting Firm
To the Board of Trustees of Schwab Annuity Portfolios and Shareholders of Schwab Government Money Market Portfolio
Opinion on the Financial Statements and Financial Highlights
We have audited the accompanying statement of assets and liabilities, including the portfolio holdings, of Schwab Government Money Market Portfolio (the “Fund”), one of the funds constituting Schwab Annuity Portfolios, as of December 31, 2021, the related statement of operations for the year then ended, the statement of changes in net assets and the financial highlights for each of the two years in the period then ended, and the related notes. In our opinion, the financial statements and financial highlights present fairly, in all material respects, the financial position of the Fund as of December 31, 2021, the results of its operations for the year then ended, and the changes in its net assets and the financial highlights for each of the two years in the period then ended in conformity with accounting principles generally accepted in the United States of America. The financial highlights for each of the three years in the period ended December 31, 2019 were audited by other auditors, whose report, dated February 18, 2020, expressed an unqualified opinion on such financial highlights.
Basis for Opinion
These financial statements and financial highlights are the responsibility of the Fund’s management. Our responsibility is to express an opinion on the Fund’s financial statements and financial highlights based on our audits. We are a public accounting firm registered with the Public Company Accounting Oversight Board (United States) (PCAOB) and are required to be independent with respect to the Fund in accordance with the U.S. federal securities laws and the applicable rules and regulations of the Securities and Exchange Commission and the PCAOB.
We conducted our audits in accordance with the standards of the PCAOB. Those standards require that we plan and perform the audit to obtain reasonable assurance about whether the financial statements and financial highlights are free of material misstatement, whether due to error or fraud. The Fund is not required to have, nor were we engaged to perform, an audit of its internal control over financial reporting. As part of our audit, we are required to obtain an understanding of internal control over financial reporting but not for the purpose of expressing an opinion on the effectiveness of the Fund’s internal control over financial reporting. Accordingly, we express no such opinion.
Our audits included performing procedures to assess the risks of material misstatement of the financial statements and financial highlights, whether due to error or fraud, and performing procedures that respond to those risks. Such procedures included examining, on a test basis, evidence regarding the amounts and disclosures in the financial statements and financial highlights. Our audits also included evaluating the accounting principles used and significant estimates made by management, as well as evaluating the overall presentation of the financial statements and financial highlights. Our procedures included confirmation of securities owned as of December 31, 2021, by correspondence with the custodian and brokers; when replies were not received from brokers, we performed other auditing procedures. We believe that our audits provide a reasonable basis for our opinion.
Deloitte & Touche LLP
Denver, Colorado
February 17, 2022
We have served as the auditor of one or more investment companies in the Schwab Funds Complex since 2020.
Schwab Government Money Market Portfolio | Annual Report
Schwab Government Money Market Portfolio
Other Federal Tax Information (unaudited)
For the fiscal year ended December 31, 2021, the fund designates 99.93% of dividend income as business interest income under section 163(j) of the Internal Revenue Code.
Schwab Government Money Market Portfolio | Annual Report
Schwab Government Money Market Portfolio
Trustees and Officers
The tables below give information about the trustees and officers of Schwab Annuity Portfolios, which includes the fund covered in this report. The “Fund Complex” includes The Charles Schwab Family of Funds, Schwab Capital Trust, Schwab Investments, Schwab Annuity Portfolios, Schwab Strategic Trust and Laudus Trust. The Fund Complex includes 103 funds.
The address for all trustees and officers is 211 Main Street, San Francisco, CA 94105. You can find more information about the trustees and officers in the fund’s Statement of Additional Information, which is available free by calling 1-877-824-5615.
| Independent Trustees |
Name, Year of Birth, and
Position(s) with the trust
(Terms of office, and
length of Time Served1) | Principal Occupations
During the Past Five Years | Number of
Portfolios in
Fund Complex
Overseen by
the Trustee | Other Directorships |
Robert W. Burns
1959
Trustee
(Trustee of Schwab Strategic Trust since 2009; The Charles Schwab Family of Funds, Schwab Investments, Schwab Capital Trust, Schwab Annuity Portfolios and Laudus Trust since 2016) | Retired/Private Investor (Jan. 2009 – present). Formerly, Managing Director, Pacific Investment Management Company, LLC (PIMCO) (investment management firm) and President, PIMCO Funds. | 103 | None |
Nancy F. Heller
1956
Trustee
(Trustee of The Charles Schwab Family of Funds, Schwab Investments, Schwab Capital Trust, Schwab Annuity Portfolios, Schwab Strategic Trust and Laudus Trust since 2018) | Retired. President and Chairman (2014 – 2016), TIAA Charitable (financial services); Senior Managing Director (2003 – 2016), TIAA (financial services). | 103 | None |
David L. Mahoney
1954
Trustee
(Trustee of The Charles Schwab Family of Funds, Schwab Investments, Schwab Capital Trust, Schwab Annuity Portfolios and Laudus Trust since 2011; Schwab Strategic Trust since 2016) | Private Investor. | 103 | Director (2004 – present), Corcept Therapeutics Incorporated
Director (2009 – 2021), Adamas Pharmaceuticals, Inc.
Director (2003 – 2019), Symantec Corporation |
Jane P. Moncreiff
1961
Trustee
(Trustee of The Charles Schwab Family of Funds, Schwab Investments, Schwab Capital Trust, Schwab Annuity Portfolios, Schwab Strategic Trust and Laudus Trust since 2019) | Consultant (2018 – present), Fulham Advisers LLC (management consulting); Chief Investment Officer (2009 – 2017), CareGroup Healthcare System, Inc. (healthcare). | 103 | None |
Kiran M. Patel
1948
Trustee
(Trustee of The Charles Schwab Family of Funds, Schwab Investments, Schwab Capital Trust, Schwab Annuity Portfolios and Laudus Trust since 2011; Schwab Strategic Trust since 2016) | Retired. Executive Vice President and General Manager of Small Business Group (Dec. 2008 – Sept. 2013), Intuit, Inc. (financial software and services firm for consumers and small businesses). | 103 | Director (2008 – present), KLA-Tencor Corporation |
Schwab Government Money Market Portfolio | Annual Report
Schwab Government Money Market Portfolio
| Independent Trustees (continued) |
Name, Year of Birth, and
Position(s) with the trust
(Terms of office, and
length of Time Served1) | Principal Occupations
During the Past Five Years | Number of
Portfolios in
Fund Complex
Overseen by
the Trustee | Other Directorships |
Kimberly S. Patmore
1956
Trustee
(Trustee of The Charles Schwab Family of Funds, Schwab Investments, Schwab Capital Trust, Schwab Annuity Portfolios, Schwab Strategic Trust and Laudus Trust since 2016) | Consultant (2008 – present), Patmore Management Consulting (management consulting). | 103 | None |
J. Derek Penn
1957
Trustee
(Trustee of The Charles Schwab Family of Funds, Schwab Investments, Schwab Capital Trust, Schwab Annuity Portfolios, Schwab Strategic Trust and Laudus Trust since 2021) | Head of Equity Sales and Trading (2006 – 2018), BNY Mellon (financial services). | 103 | None |
| Interested Trustees |
Name, Year of Birth, and
Position(s) with the trust
(Terms of office, and
length of Time Served1) | Principal Occupations
During the Past Five Years | Number of
Portfolios in
Fund Complex
Overseen by
the Trustee | Other Directorships |
Walter W. Bettinger II2
1960
Chairman and Trustee
(Trustee of The Charles Schwab Family of Funds, Schwab Investments, Schwab Capital Trust and Schwab Annuity Portfolios since 2008; Schwab Strategic Trust since 2009; Laudus Trust since 2010) | Director and Chief Executive Officer (Oct. 2008 – present) and President (Oct. 2008 – Oct. 2021), The Charles Schwab Corporation; President and Chief Executive Officer (Oct. 2008 – Oct. 2021) and Director (May 2008 – Oct. 2021), Charles Schwab & Co., Inc.; Director (Apr. 2006 – present), Charles Schwab Bank, SSB; Director (Nov. 2017 – present), Charles Schwab Premier Bank, SSB; Director (July 2019 – present), Charles Schwab Trust Bank; Director (May 2008 – present) and President and Chief Executive Officer (Aug. 2017 – present), Schwab Holdings, Inc.; Director (Oct. 2020 – present), TD Ameritrade Holding Corporation; Director (July 2016 – Oct. 2021), Charles Schwab Investment Management, Inc. | 103 | Director (2008 – present), The Charles Schwab Corporation |
Joseph R. Martinetto2
1962
Trustee
(Trustee of The Charles Schwab Family of Funds, Schwab Investments, Schwab Capital Trust, Schwab Annuity Portfolios, Schwab Strategic Trust and Laudus Trust since 2016) | Chief Operating Officer (Feb. 2018 – present) and Senior Executive Vice President (July 2015 – Feb. 2018), The Charles Schwab Corporation; Senior Executive Vice President (July 2015 – present), Charles Schwab & Co., Inc.; Chief Financial Officer (July 2015 – Aug. 2017) and Executive Vice President and Chief Financial Officer (May 2007 – July 2015), The Charles Schwab Corporation and Charles Schwab & Co., Inc.; Director (May 2007 – present), Charles Schwab & Co., Inc.; Director (Apr. 2010 – present) and Chief Executive Officer (July 2013 – Apr. 2015), Charles Schwab Bank, SSB; Director (Nov. 2017 – present), Charles Schwab Premier Bank, SSB; Director (May 2007 – present), Chief Financial Officer (May 2007 – Aug. 2017), Senior Executive Vice President (Feb. 2016 – present), and Executive Vice President (May 2007 – Feb. 2016), Schwab Holdings, Inc.; Director (Oct. 2020 – present), TD Ameritrade Holding Corporation. | 103 | None |
Schwab Government Money Market Portfolio | Annual Report
Schwab Government Money Market Portfolio
| Officers of the Trust |
Name, Year of Birth, and Position(s) with the trust
(Terms of office, and length of Time Served3) | Principal Occupations During the Past Five Years |
Jonathan de St. Paer
1973
President and Chief Executive Officer
(Officer of The Charles Schwab Family of Funds, Schwab Investments, Schwab Capital Trust, Schwab Annuity Portfolios, Schwab Strategic Trust and Laudus Trust since 2018) | Director (Apr. 2019 – present), President (Oct. 2018 – present), Chief Operating Officer (Jan. 2020 – present), and Chief Executive Officer (Apr. 2019 – Nov. 2019), Charles Schwab Investment Management, Inc.; Senior Vice President (June 2020 – present) and Chief Operating Officer (Jan. 2020 – present), Charles Schwab Investment Advisory, Inc.; Chief Executive Officer (Apr. 2019 – present), President (Nov. 2018 – present) and Trustee (Apr. 2019 – Dec. 2020), Schwab Funds, Laudus Trust and Schwab ETFs; Director (Apr. 2019 – present), Charles Schwab Worldwide Funds plc and Charles Schwab Asset Management (Ireland) Limited; Senior Vice President (Apr. 2019 – present), Senior Vice President – Strategy and Product Development (CSIM) (Jan. 2014 – Mar. 2019), and Vice President (Jan. 2009 – Dec. 2013), Charles Schwab & Co., Inc. |
Mark Fischer
1970
Treasurer, Chief Financial Officer and Chief Operating Officer
(Officer of The Charles Schwab Family of Funds, Schwab Investments, Schwab Capital Trust, Schwab Annuity Portfolios, Schwab Strategic Trust and Laudus Trust since 2013) | Treasurer and Chief Financial Officer (Jan. 2016 – present) and Chief Operating Officer (Dec. 2020 – present), Schwab Funds, Laudus Trust and Schwab ETFs; Assistant Treasurer (Dec. 2013 – Dec. 2015), Schwab Funds and Laudus Trust; Assistant Treasurer (Nov. 2013 – Dec. 2015), Schwab ETFs; Chief Financial Officer (Mar. 2020 – present) and Vice President (Oct. 2013 – present), Charles Schwab Investment Management, Inc.; Executive Director (Apr. 2011 – Sept. 2013), J.P. Morgan Investor Services; Assistant Treasurer (May 2005 – Mar. 2011), Massachusetts Financial Service Investment Management. |
Omar Aguilar
1970
Vice President and Chief Investment Officer
(Officer of The Charles Schwab Family of Funds, Schwab Investments, Schwab Capital Trust, Schwab Annuity Portfolios, Schwab Strategic Trust and Laudus Trust since 2011) | Chief Executive Officer (Jan. 2022 – present) and Chief Investment Officer (Apr. 2011 – present), Senior Vice President (Apr. 2011 – Dec. 2021), Charles Schwab Investment Management, Inc.; Vice President and Chief Investment Officer (June 2011 – present), Schwab Funds, Laudus Trust and Schwab ETFs; Head of the Portfolio Management Group and Vice President of Portfolio Management (May 2009 – Apr. 2011), Financial Engines, Inc. (investment management firm); Head of Quantitative Equity (July 2004 – Jan. 2009), ING Investment Management. |
Brett Wander
1961
Vice President and Chief Investment Officer
(Officer of The Charles Schwab Family of Funds, Schwab Investments, Schwab Capital Trust, Schwab Annuity Portfolios, Schwab Strategic Trust and Laudus Trust since 2011) | Senior Vice President and Chief Investment Officer (Apr. 2011 – present), Charles Schwab Investment Management, Inc.; Vice President and Chief Investment Officer (June 2011 – present), Schwab Funds, Laudus Trust and Schwab ETFs; Senior Managing Director and Global Head of Active Fixed-Income Strategies (Jan. 2008 – Oct. 2010), State Street Global Advisors; Director of Alpha Strategies (Apr. 2006 – Jan. 2008), Loomis, Sayles & Company (investment management firm). |
William P. McMahon, Jr.
1972
Vice President and Chief Investment Officer
(Officer of The Charles Schwab Family of Funds, Schwab Investments, Schwab Capital Trust, Schwab Annuity Portfolios, Schwab Strategic Trust and Laudus Trust since 2021) | Senior Vice President and Chief Investment Officer (Jan. 2020 – present), Charles Schwab Investment Management, Inc.; Vice President and Chief Investment Officer (June 2021 – present), Schwab Funds, Laudus Trust and Schwab ETFs; Senior Vice President and Chief Investment Officer – ThomasPartners Strategies (Apr. 2018 – Dec. 2019), Charles Schwab Investment Advisory, Inc.; Senior Vice President and Chief Investment Officer (May 2001 – Apr. 2018), ThomasPartners, Inc. |
Catherine MacGregor
1964
Chief Legal Officer and Secretary, Schwab Funds and Schwab ETFs
Chief Legal Officer, Vice President and Clerk, Laudus Trust
(Officer of The Charles Schwab Family of Funds, Schwab Investments, Schwab Capital Trust, Schwab Annuity Portfolios and Laudus Trust since 2005; Schwab Strategic Trust since 2009) | Vice President (July 2005 – present), Charles Schwab & Co., Inc.; Vice President (Sept. 2005 – present), Charles Schwab Investment Management, Inc.; Vice President (Dec. 2005 – present) and Chief Legal Officer and Clerk (Mar. 2007 – present), Laudus Trust; Chief Legal Officer and Secretary (Oct. 2021 – present), Vice President (Nov. 2005 – Oct. 2021) and Assistant Secretary (June 2007 – Oct. 2021), Schwab Funds; Chief Legal Officer and Secretary (Oct. 2021 – present), Vice President and Assistant Secretary (Oct. 2009 – Oct. 2021), Schwab ETFs. |
| 1 | Each Trustee shall hold office until the election and qualification of his or her successor, or until he or she dies, resigns or is removed. The retirement policy requires that each independent trustee retire by December 31 of the year in which the Trustee turns 74 or the Trustee’s twentieth year of service as an independent trustee on any trust in the Fund Complex, whichever occurs first. |
| 2 | Mr. Bettinger and Mr. Martinetto are Interested Trustees. Mr. Bettinger is an Interested Trustee because he owns stock of The Charles Schwab Corporation (CSC), the parent company of Charles Schwab Investment Management, Inc., the investment adviser for the trusts in the Fund Complex, and is an employee of Charles Schwab & Co., Inc. (Schwab), the principal underwriter for The Charles Schwab Family of Funds, Schwab Investments, Schwab Capital Trust, Schwab Annuity Portfolios and Laudus Trust. Mr. Martinetto is an Interested Trustee because he owns stock of CSC and is an employee and director of Schwab. |
| 3 | The President, Treasurer and Secretary/Clerk hold office until their respective successors are chosen and qualified or until he or she sooner dies, resigns, is removed or becomes disqualified. Each of the other officers serves at the pleasure of the Board. |
Schwab Government Money Market Portfolio | Annual Report
Annual Report | December 31, 2021
Schwab S&P 500 Index Portfolio
Proxy Voting Policies, Procedures and Results
A description of the proxy voting policies and procedures used to determine how to vote proxies on behalf of the funds is available without charge, upon request, by visiting the Schwab Fund’s website at www.schwabassetmanagement.com/schwabfunds_prospectus, the SEC’s website at www.sec.gov, or by contacting Schwab Funds at 1-877-824-5615.
Information regarding how a fund voted proxies relating to portfolio securities during the most recent twelve-month period ended June 30 is available, without charge, by visiting Schwab’s website at www.schwabassetmanagement.com/schwabfunds_prospectus or the SEC’s website at www.sec.gov.
The Sector/Industry classifications in this report use the Global Industry Classification Standard (GICS) which was developed by and is the exclusive property of MSCI Inc. (MSCI) and Standard & Poor’s (S&P). GICS is a service mark of MSCI and S&P and has been licensed for use by Charles Schwab & Co., Inc. The Industry classifications used in the Portfolio Holdings are sub-categories of Sector classifications.
Investment Adviser: Charles Schwab Investment Management, Inc., dba Schwab Asset ManagementTM
Schwab S&P 500 Index Portfolio
The Investment Environment
For the 12-month reporting period ended December 31, 2021, U.S. equity markets generated solid returns, with several key equity market indices ending the reporting period just off record highs. Despite persisting COVID-19 pandemic-driven stresses on the global economy and the emergence and rapid spread of the Delta variant during the summer and the Omicron variant in the late fall, U.S. equity markets rose through most of the period on strong earnings, ongoing fiscal stimulus measures, and optimism related to increased COVID-19 vaccination rates. Amid growing evidence of a slowing global economy and rising inflation, stocks did weaken somewhat in September and again in late November and early December but quickly regained their momentum. For the reporting period, the S&P 500® Index, a bellwether for the overall U.S. stock market, returned 28.71%.
Bolstered by the extensive emergency rescue and fiscal stimulus measures passed by the U.S. Congress and U.S. Federal Reserve (Fed) in March 2020, the U.S. economy began to recover from the dramatic impact of the COVID-19 pandemic beginning in the third quarter of 2020. U.S. gross domestic product (GDP) rose at an annualized rate of 6.4% for the first quarter of 2021 and 6.7% for the second quarter of 2021, before falling back to 2.0% for the third quarter of 2021 amid fading government stimuli, persistent inflation, and new surges in COVID-19 cases. Unemployment, which skyrocketed in April 2020, fell over the reporting period, and ended at its lowest level since February 2020. Inflation, which had remained well below the Fed’s traditional 2% target until it jumped in March 2021, continued to rise over the reporting period, largely due to imbalances in the labor market, supply chain bottlenecks, and higher energy costs.
For the most part, central banks around the world, maintained the low—and for some international central banks, negative—interest rates instituted prior to, and in response to, the COVID-19 pandemic. In the United States, the Fed reiterated several times during the reporting period its intention to continue its support of the economy for as long as needed to achieve a full recovery. The Fed maintained the federal funds rate in a range of 0.00% to 0.25% throughout the reporting period. However, as inflation continued to rise and indicators of economic activity and employment continued to strengthen, the Fed began scaling back its bond-buying program in November 2021 citing significant progress made on its twin goals of maximum employment and price stability. The Fed subsequently accelerated its
Asset Class Performance Comparison % returns during the 12 months ended December 31, 2021
Index figures assume dividends and distributions were reinvested. Index figures do not include trading and management costs, which would lower performance. Indices are unmanaged and cannot be invested in directly. Performance results less than one year are not annualized. Past performance is not an indication of future results.
Data source: Index provider websites and Schwab Asset Management.
Nothing in this report represents a recommendation of a security by the investment adviser.
Management views may have changed since the report date.
| * | The net version of the index reflects reinvested dividends net of withholding taxes, but reflects no deductions for expenses or other taxes. |
Schwab S&P 500 Index Portfolio | Annual Report
Schwab S&P 500 Index Portfolio
The Investment Environment (continued)
wind-down in December 2021 with expectations to end it altogether by March 2022. Fed officials also signaled that interest rates could begin to rise sooner in 2022 than previously anticipated, although the Fed cautioned that the path of the economy continues to depend on the course of the COVID-19 pandemic.
Over the reporting period, large-cap stocks significantly outperformed small-caps and, among large-cap stocks, growth stocks generally outperformed value stocks. Among the sectors in the S&P 500® Index, all posted double-digit returns. The energy and real estate sectors were the strongest performers. The energy sector benefited as oil prices rebounded on growing demand and reduced production. The real estate sector benefitted from low interest rates and strong performance of specialized and industrial REITs as a result of positive performance of data centers and increased demand for online and mobile communications. The weakest sectors for the reporting period were the utilities and consumer staples sectors, which were both hampered by the economy’s strength, which rendered both sectors less attractive relative to others positioned to take advantage of the current business cycle.
Schwab S&P 500 Index Portfolio | Annual Report
Schwab S&P 500 Index Portfolio
 | Christopher Bliss, CFA, Managing Director and Head of Passive Equity Strategies for Schwab Asset Management, is responsible for overseeing the investment process, portfolio management and implementation, and development of investment strategies for passive equity Schwab Funds and Schwab ETFs. Before joining Schwab in 2016, Mr. Bliss spent 12 years at BlackRock (formerly Barclays Global Investors) managing and leading institutional index teams, most recently as a managing director and the head of the Americas institutional index team. In this role, Mr. Bliss was responsible for overseeing a team of portfolio managers managing domestic, developed international and emerging markets index strategies. Prior to BlackRock, he worked as an equity analyst and portfolio manager for Harris Bretall and before that, as a research analyst for JP Morgan. |
 | Jeremy Brown, Portfolio Manager, is responsible for the day-to-day co-management of the fund. Prior to joining Schwab in 2017, Mr. Brown spent six years with ALPS Advisors, Inc. in Denver, most recently as a senior analyst on the ETF portfolio management and research team where he performed portfolio management, trading, and analytics/research functions for ALPS ETFs and passive funds. Additionally, Mr. Brown led a number of investment research, commentary, industry trend analysis, and sales and marketing support initiatives. |
 | Ferian Juwono, CFA, Senior Portfolio Manager, is responsible for the day-to-day co-management of the fund. Prior to joining Schwab in 2010, Mr. Juwono worked at BlackRock (formerly Barclays Global Investors) where he spent more than three years as a portfolio manager, managing equity index funds for institutional clients, and two years as a senior business analyst. Prior to that, Mr. Juwono worked for more than four years as a senior financial analyst with Union Bank of California. |
 | Sabya Sinha, Portfolio Manager, is responsible for the day-to-day co-management of the fund. Prior to joining Schwab in 2015, Mr. Sinha spent a year at F-Squared Investments on the product development and analytics team. Prior to F-Squared, he worked at IndexIQ Advisors as a senior index portfolio manager for three years and for Bank of America’s Columbia Management subsidiary as a portfolio manager for three years. Mr. Sinha also spent time as a software consultant at DPM Mellon, LLC and an equity trader at Jane Street Capital. |
Schwab S&P 500 Index Portfolio | Annual Report
Schwab S&P 500 Index Portfolio as of December 31, 2021
The Schwab S&P 500 Index Portfolio’s (the fund) goal is to track the total return of the S&P 500® Index (the index), which includes the stocks of 500 leading U.S. publicly-traded companies from a broad range of industries. To pursue its goal, the fund generally seeks to replicate the performance of the index by giving the same weight to a given stock as does the index. For more information concerning the fund’s investment objective, strategy and risks, please see the fund’s prospectus.
Market Highlights. For the 12-month reporting period ended December 31, 2021, U.S. equity markets generated solid returns, with several key equity market indices ending the reporting period just off record highs. Despite persisting COVID-19 pandemic-driven stresses on the global economy and the emergence and rapid spread of the Delta variant during the summer and the Omicron variant in the late fall, U.S. equity markets rose through most of the period on strong earnings, ongoing fiscal stimulus measures, and optimism related to increased COVID-19 vaccination rates. Amid growing evidence of a slowing global economy and rising inflation, stocks did weaken somewhat in September and again in late November and early December but quickly regained their momentum.
Performance. The fund closely tracked the index for the reporting period. The fund returned 28.67% for the 12-month reporting period ended December 31, 2021, compared with the index, which returned 28.71%. Differences between the return of the fund and the return of the index may be attributable to, among other things, the operational and transactional costs incurred by the fund and not the index.
Contributors and Detractors. Over the reporting period, no sectors detracted from the returns of the index or the fund. However, the utilities sector was the smallest contributor to the total return of the fund. Stocks in the utilities sector represented an average weight of approximately 3% of the fund’s investments and returned approximately 18% for the reporting period. One example from this sector is Pinnacle West Capital Corp., which provides electric service to most of Arizona, which slightly detracted from the total return of the fund. The fund’s holdings of Pinnacle West Capital Corp. represented an average weight of less than 1% of the fund’s investments and returned approximately -8% for the reporting period.
The materials sector was another small contributor to the total return of the fund, representing an average weight of approximately 3% of the fund’s investments and returning approximately 27% for the reporting period.
The information technology sector contributed the most to the total return of the fund. Information technology stocks represented an average weight of approximately 28% of the fund’s investments and returned approximately 35% for the reporting period. One example from this sector is Microsoft Corp., which develops, manufactures, licenses, sells, and supports software products. The fund’s holdings of Microsoft Corp. represented an average weight of approximately 6% of the fund’s investments and returned approximately 52% for the reporting period.
The financials sector also contributed to the total return of the fund, representing an average weight of approximately 11% of the fund’s investments and returning approximately 35% for the reporting period.
Management views and portfolio holdings may have changed since the report date.
Schwab S&P 500 Index Portfolio | Annual Report
Schwab S&P 500 Index Portfolio
Performance and Fund Facts as of December 31, 2021
The performance data quoted represents past performance. Past performance does not guarantee future results. Investment returns and principal value will fluctuate so that an investor’s shares may be worth more or less than their original cost. Current performance may be lower or higher than performance data quoted. To obtain performance information current to the most recent month end, please visit www.schwabassetmanagement.com/schwabfunds_prospectus.
Performance of Hypothetical $10,000 Investment (December 31, 2011 – December 31, 2021)1
Average Annual Total Returns1
| Fund and Inception Date | 1 Year | 5 Years | 10 Years |
| Fund: Schwab S&P 500 Index Portfolio (11/01/96) | 28.67% | 18.42% | 16.39% |
| S&P 500® Index | 28.71% | 18.47% | 16.55% |
| Fund Category: Morningstar Large-Cap Blend2 | 26.94% | 17.18% | 15.64% |
| Fund Expense Ratio3: 0.03% |
All total return figures on this page assume dividends and distributions were reinvested. Index figures do not include trading and management costs, which would lower performance. Indices are unmanaged and cannot be invested in directly. Performance results less than one year are not annualized.
Index ownership — “Standard & Poor’s®,” “S&P®,” and “S&P 500®” are registered trademarks of Standard & Poor’s Financial Services LLC (S&P), and “Dow Jones®” is a registered trademark of Dow Jones Trademark Holdings LLC (Dow Jones) and have been licensed for use by S&P Dow Jones Indices LLC and its affiliates and sublicensed for certain purposes by Charles Schwab Investment Management, Inc. The “S&P 500® Index” is a product of S&P Dow Jones Indices LLC or its affiliates, and has been licensed for use by Charles Schwab Investment Managment, Inc. The Schwab S&P 500 Index Portfolio is not sponsored, endorsed, sold or promoted by S&P Dow Jones Indices LLC, Dow Jones, S&P, or their respective affiliates, and neither S&P Dow Jones Indices LLC, Dow Jones, S&P, nor their respective affiliates make any representation regarding the advisability of investing in the fund.
| 1 | Fund performance does not reflect the additional fees and expenses imposed by the insurance company under the variable insurance product contract. If those contract fees and expenses were included, the performance would be less than that shown. Please refer to the variable insurance product prospectus for a complete listing of these expenses. |
| 2 | Source for category information: Morningstar, Inc. The Morningstar Category return represents all active and index mutual funds within the category as of the report date. |
| 3 | As stated in the prospectus. |
Schwab S&P 500 Index Portfolio | Annual Report
Schwab S&P 500 Index Portfolio
Performance and Fund Facts as of December 31, 2021 (continued)
| Number of Holdings | 508 |
| Weighted Average Market Cap ($ x 1,000,000) | $674,287 |
| Price/Earnings Ratio (P/E) | 25.5 |
| Price/Book Ratio (P/B) | 4.7 |
| Portfolio Turnover Rate | 13% |
Sector Weightings % of Investments2
Top Equity Holdings % of Net Assets3
Portfolio holdings may have changed since the report date.
Source of Sector Classification: S& P and MSCI.
| 1 | Excludes derivatives. |
| 2 | The percentage may differ from the Portfolio Holdings because the above calculation is based on a percentage of total investments, excluding derivatives, whereas the calculation in the Portfolio Holdings is based on a percentage of net assets. |
| 3 | This list is not a recommendation of any security by the investment adviser. |
Schwab S&P 500 Index Portfolio | Annual Report
Schwab S&P 500 Index Portfolio
Fund Expenses (Unaudited)
Examples for a $1,000 Investment
As a fund shareholder, you may incur two types of costs: (1) transaction costs; and (2) ongoing costs, including management fees.
The expense examples below are intended to help you understand your ongoing cost (in dollars) of investing in the fund and to compare this cost with the ongoing cost of investing in other mutual funds. These examples are based on an investment of $1,000 invested for six months beginning July 1, 2021 and held through December 31, 2021.
The Actual Return line in the table below provides information about actual account values and actual expenses. You may use this information, together with the amount you invested, to estimate the expenses that you paid over the period. To do so, simply divide your account value by $1,000 (for example, an $8,600 account value ÷ $1,000 = 8.6), then multiply the result by the number given for the fund under the heading entitled “Expenses Paid During Period.”
The Hypothetical Return line in the table below provides information about hypothetical account values and hypothetical expenses based on the fund’s actual expense ratio and an assumed return of 5% per year before expenses. Because the return used is not an actual return, it may not be used to estimate the actual ending account value or expenses you paid for the period.
You may use this information to compare the ongoing costs of investing in the fund and other funds. To do so, compare this 5% hypothetical example with the 5% hypothetical examples that appear in the shareholder reports of the other funds.
Please note that the expenses shown in the table are meant to highlight your ongoing costs only, and do not reflect any transactional costs. Therefore, the hypothetical return lines of the table are useful in comparing ongoing costs only, and will not help you determine the relative total costs of owning different funds. In addition, if these transactional costs were included, your costs would have been higher.
| | EXPENSE RATIO
(ANNUALIZED) 1 | BEGINNING
ACCOUNT VALUE
AT 7/1/21 | ENDING
ACCOUNT VALUE
(NET OF EXPENSES)
AT 12/31/21 | EXPENSES PAID
DURING PERIOD
7/1/21-12/31/212 |
| Schwab S&P 500 Index Portfolio | | | | |
| Actual Return | 0.03% | $1,000.00 | $1,116.70 | $0.16 |
| Hypothetical 5% Return | 0.03% | $1,000.00 | $1,025.05 | $0.15 |
| 1 | Based on the most recent six-month expense ratio. |
| 2 | Expenses for the fund are equal to its annualized expense ratio, multiplied by the average account value over the period, multiplied by 184 days of the period, and divided by the 365 days of the fiscal year. |
Schwab S&P 500 Index Portfolio | Annual Report
Schwab S&P 500 Index Portfolio
Financial Statements
FINANCIAL HIGHLIGHTS
| | 1/1/21–
12/31/21 | 1/1/20–
12/31/20 | 1/1/19–
12/31/19 | 1/1/18–
12/31/18 | 1/1/17–
12/31/17 | |
| Per-Share Data |
| Net asset value at beginning of period | $55.41 | $47.48 | $37.10 | $39.51 | $33.01 | |
| Income (loss) from investment operations: | | | | | | |
| Net investment income (loss)1 | 0.85 | 0.96 | 0.91 | 0.82 | 0.71 | |
| Net realized and unrealized gains (losses) | 14.94 | 7.58 | 10.64 | (2.51) | 6.39 | |
| Total from investment operations | 15.79 | 8.54 | 11.55 | (1.69) | 7.10 | |
| Less distributions: | | | | | | |
| Distributions from net investment income | (0.79) | (0.53) | (0.78) | (0.68) | (0.59) | |
| Distributions from net realized gains | — | (0.08) | (0.39) | (0.04) | (0.01) | |
| Total distributions | (0.79) | (0.61) | (1.17) | (0.72) | (0.60) | |
| Net asset value at end of period | $70.41 | $55.41 | $47.48 | $37.10 | $39.51 | |
| Total return | 28.67% | 18.28% | 31.48% | (4.40%) | 21.72% | |
| Ratios/Supplemental Data |
| Ratios to average net assets: | | | | | | |
| Total expenses | 0.03% | 0.03% | 0.03% | 0.03% | 0.06% 2 | |
| Net operating expenses | N/A | N/A | N/A | N/A 3 | 0.06% 2 | |
| Net investment income (loss) | 1.35% | 2.03% | 2.13% | 2.03% | 1.97% | |
| Portfolio turnover rate | 13% | 14% | 6% | 5% | 3% | |
| Net assets, end of period (x 1,000,000) | $1,468 | $947 | $588 | $340 | $346 | |
| 1 | Calculated based on the average shares outstanding during the period. |
| 2 | Effective March 1, 2017, the annual operating expense ratio was reduced. The ratio presented for period ended 12/31/17 is a blended ratio. |
| 3 | Effective March 1, 2017, the fund instituted a new fee structure and the contractual expense limitation was terminated. |
Schwab S&P 500 Index Portfolio | Annual Report
Schwab S&P 500 Index Portfolio
Portfolio Holdings as of December 31, 2021
This section shows all the securities in the fund’s portfolio and their values as of the report date.
The fund files its complete schedule of portfolio holdings with the U.S. Securities and Exchange Commission (SEC) for the first and third quarters of each fiscal year on Form N-PORT Part F. The fund’s Form N-PORT Part F is available on the SEC’s website at www.sec.gov. The fund also makes available its complete schedule of portfolio holdings on the fund’s website at www.schwabassetmanagement.com/schwabfunds_prospectus, typically 60-80 days after the end of the fund’s fiscal quarter.
| SECURITY | NUMBER
OF SHARES | VALUE ($) |
| COMMON STOCKS 99.3% OF NET ASSETS |
| |
| Automobiles & Components 2.7% |
| Aptiv plc * | 9,768 | 1,611,232 |
| BorgWarner, Inc. | 8,655 | 390,081 |
| Ford Motor Co. | 141,738 | 2,943,898 |
| General Motors Co. * | 52,423 | 3,073,560 |
| Tesla, Inc. * | 29,372 | 31,039,742 |
| | | 39,058,513 |
| |
| Banks 3.9% |
| Bank of America Corp. | 260,052 | 11,569,713 |
| Citigroup, Inc. | 71,645 | 4,326,641 |
| Citizens Financial Group, Inc. | 15,388 | 727,083 |
| Comerica, Inc. | 4,735 | 411,945 |
| Fifth Third Bancorp | 24,689 | 1,075,206 |
| First Republic Bank | 6,473 | 1,336,739 |
| Huntington Bancshares, Inc. | 52,228 | 805,356 |
| JPMorgan Chase & Co. | 106,709 | 16,897,370 |
| KeyCorp | 33,613 | 777,469 |
| M&T Bank Corp. | 4,647 | 713,686 |
| People's United Financial, Inc. | 15,452 | 275,355 |
| Regions Financial Corp. | 34,420 | 750,356 |
| Signature Bank | 2,189 | 708,076 |
| SVB Financial Group * | 2,119 | 1,437,191 |
| The PNC Financial Services Group, Inc. | 15,261 | 3,060,136 |
| Truist Financial Corp. | 48,205 | 2,822,403 |
| U.S. Bancorp | 48,725 | 2,736,883 |
| Wells Fargo & Co. | 143,972 | 6,907,776 |
| Zions Bancorp NA | 5,650 | 356,854 |
| | | 57,696,238 |
| |
| Capital Goods 5.1% |
| 3M Co. | 20,807 | 3,695,947 |
| A.O. Smith Corp. | 4,809 | 412,853 |
| Allegion plc | 3,238 | 428,841 |
| AMETEK, Inc. | 8,353 | 1,228,225 |
| Carrier Global Corp. | 31,292 | 1,697,278 |
| Caterpillar, Inc. | 19,533 | 4,038,253 |
| Cummins, Inc. | 5,164 | 1,126,475 |
| Deere & Co. | 10,188 | 3,493,363 |
| Dover Corp. | 5,199 | 944,138 |
| Eaton Corp. plc | 14,393 | 2,487,398 |
| Emerson Electric Co. | 21,586 | 2,006,850 |
| Fastenal Co. | 20,768 | 1,330,398 |
| Fortive Corp. | 12,947 | 987,727 |
| Fortune Brands Home & Security, Inc. | 4,901 | 523,917 |
| Generac Holdings, Inc. * | 2,278 | 801,674 |
| General Dynamics Corp. | 8,368 | 1,744,477 |
| General Electric Co. | 39,653 | 3,746,019 |
| Honeywell International, Inc. | 24,858 | 5,183,142 |
| Howmet Aerospace, Inc. | 13,885 | 441,960 |
| Huntington Ingalls Industries, Inc. | 1,446 | 270,026 |
| IDEX Corp. | 2,745 | 648,698 |
| Illinois Tool Works, Inc. | 10,313 | 2,545,248 |
| Ingersoll Rand, Inc. | 14,719 | 910,665 |
| Johnson Controls International plc | 25,590 | 2,080,723 |
| SECURITY | NUMBER
OF SHARES | VALUE ($) |
| L3Harris Technologies, Inc. | 7,085 | 1,510,805 |
| Lockheed Martin Corp. | 8,862 | 3,149,644 |
| Masco Corp. | 8,811 | 618,708 |
| Northrop Grumman Corp. | 5,381 | 2,082,824 |
| Otis Worldwide Corp. | 15,337 | 1,335,393 |
| PACCAR, Inc. | 12,536 | 1,106,427 |
| Parker-Hannifin Corp. | 4,662 | 1,483,076 |
| Pentair plc | 5,975 | 436,354 |
| Quanta Services, Inc. | 5,146 | 590,040 |
| Raytheon Technologies Corp. | 54,047 | 4,651,285 |
| Rockwell Automation, Inc. | 4,188 | 1,460,984 |
| Roper Technologies, Inc. | 3,809 | 1,873,495 |
| Snap-on, Inc. | 1,940 | 417,837 |
| Stanley Black & Decker, Inc. | 5,887 | 1,110,406 |
| Textron, Inc. | 7,960 | 614,512 |
| The Boeing Co. * | 19,948 | 4,015,931 |
| Trane Technologies plc | 8,577 | 1,732,811 |
| TransDigm Group, Inc. * | 1,890 | 1,202,569 |
| United Rentals, Inc. * | 2,614 | 868,606 |
| W.W. Grainger, Inc. | 1,563 | 810,009 |
| Westinghouse Air Brake Technologies Corp. | 6,746 | 621,374 |
| Xylem, Inc. | 6,511 | 780,799 |
| | | 75,248,184 |
| |
| Commercial & Professional Services 0.9% |
| Cintas Corp. | 3,174 | 1,406,622 |
| Copart, Inc. * | 7,706 | 1,168,384 |
| Equifax, Inc. | 4,405 | 1,289,740 |
| IHS Markit Ltd. | 14,402 | 1,914,314 |
| Jacobs Engineering Group, Inc. | 4,706 | 655,216 |
| Leidos Holdings, Inc. | 5,067 | 450,456 |
| Nielsen Holdings plc | 12,955 | 265,707 |
| Republic Services, Inc. | 7,556 | 1,053,684 |
| Robert Half International, Inc. | 4,020 | 448,310 |
| Rollins, Inc. | 8,174 | 279,633 |
| Verisk Analytics, Inc. | 5,819 | 1,330,980 |
| Waste Management, Inc. | 13,896 | 2,319,242 |
| | | 12,582,288 |
| |
| Consumer Durables & Apparel 1.1% |
| D.R. Horton, Inc. | 11,769 | 1,276,348 |
| Garmin Ltd. | 5,486 | 747,029 |
| Hasbro, Inc. | 4,682 | 476,534 |
| Lennar Corp., Class A | 9,816 | 1,140,226 |
| Mohawk Industries, Inc. * | 1,981 | 360,898 |
| Newell Brands, Inc. | 13,671 | 298,575 |
| NIKE, Inc., Class B | 46,139 | 7,689,987 |
| NVR, Inc. * | 118 | 697,247 |
| PulteGroup, Inc. | 9,141 | 522,499 |
| PVH Corp. | 2,566 | 273,664 |
| Ralph Lauren Corp. | 1,760 | 209,194 |
| Tapestry, Inc. | 9,935 | 403,361 |
| Under Armour, Inc., Class A * | 6,812 | 144,346 |
| Under Armour, Inc., Class C * | 7,766 | 140,099 |
Schwab S&P 500 Index Portfolio | Annual Report
Schwab S&P 500 Index Portfolio
Portfolio Holdings as of December 31, 2021 (continued)
| SECURITY | NUMBER
OF SHARES | VALUE ($) |
| VF Corp. | 11,772 | 861,946 |
| Whirlpool Corp. | 2,193 | 514,609 |
| | | 15,756,562 |
| |
| Consumer Services 1.9% |
| Booking Holdings, Inc. * | 1,483 | 3,558,058 |
| Caesars Entertainment, Inc. * | 7,719 | 721,958 |
| Carnival Corp. * | 29,050 | 584,486 |
| Chipotle Mexican Grill, Inc. * | 1,016 | 1,776,222 |
| Darden Restaurants, Inc. | 4,686 | 705,899 |
| Domino's Pizza, Inc. | 1,314 | 741,530 |
| Expedia Group, Inc. * | 5,272 | 952,756 |
| Hilton Worldwide Holdings, Inc. * | 10,064 | 1,569,883 |
| Las Vegas Sands Corp. * | 12,415 | 467,301 |
| Marriott International, Inc., Class A * | 9,878 | 1,632,241 |
| McDonald's Corp. | 26,981 | 7,232,797 |
| MGM Resorts International | 14,054 | 630,744 |
| Norwegian Cruise Line Holdings Ltd. * | 13,364 | 277,169 |
| Penn National Gaming, Inc. * | 5,998 | 310,996 |
| Royal Caribbean Cruises Ltd. * | 8,097 | 622,659 |
| Starbucks Corp. | 42,607 | 4,983,741 |
| Wynn Resorts Ltd. * | 3,800 | 323,152 |
| Yum! Brands, Inc. | 10,583 | 1,469,555 |
| | | 28,561,147 |
| |
| Diversified Financials 4.9% |
| American Express Co. | 22,655 | 3,706,358 |
| Ameriprise Financial, Inc. | 4,043 | 1,219,611 |
| Berkshire Hathaway, Inc., Class B * | 66,129 | 19,772,571 |
| BlackRock, Inc. | 5,157 | 4,721,543 |
| Capital One Financial Corp. | 15,369 | 2,229,888 |
| Cboe Global Markets, Inc. | 3,852 | 502,301 |
| CME Group, Inc. | 12,979 | 2,965,182 |
| Discover Financial Services | 10,582 | 1,222,856 |
| FactSet Research Systems, Inc. | 1,360 | 660,974 |
| Franklin Resources, Inc. | 10,152 | 339,990 |
| Intercontinental Exchange, Inc. | 20,348 | 2,782,996 |
| Invesco Ltd. | 12,338 | 284,021 |
| MarketAxess Holdings, Inc. | 1,373 | 564,674 |
| Moody's Corp. | 5,841 | 2,281,378 |
| Morgan Stanley | 51,839 | 5,088,516 |
| MSCI, Inc. | 2,978 | 1,824,591 |
| Nasdaq, Inc. | 4,230 | 888,342 |
| Northern Trust Corp. | 7,504 | 897,553 |
| Raymond James Financial, Inc. | 6,694 | 672,078 |
| S&P Global, Inc. | 8,703 | 4,107,207 |
| State Street Corp. | 13,207 | 1,228,251 |
| Synchrony Financial | 19,761 | 916,713 |
| T. Rowe Price Group, Inc. | 8,119 | 1,596,520 |
| The Bank of New York Mellon Corp. | 27,444 | 1,593,947 |
| The Charles Schwab Corp. (a) | 54,130 | 4,552,333 |
| The Goldman Sachs Group, Inc. | 12,258 | 4,689,298 |
| | | 71,309,692 |
| |
| Energy 2.7% |
| APA Corp. | 13,118 | 352,743 |
| Baker Hughes Co. | 31,560 | 759,334 |
| Chevron Corp. | 69,604 | 8,168,029 |
| ConocoPhillips | 47,626 | 3,437,645 |
| Coterra Energy, Inc. | 29,378 | 558,182 |
| Devon Energy Corp. | 22,736 | 1,001,521 |
| Diamondback Energy, Inc. | 6,150 | 663,277 |
| EOG Resources, Inc. | 21,127 | 1,876,711 |
| Exxon Mobil Corp. | 152,866 | 9,353,870 |
| Halliburton Co. | 32,323 | 739,227 |
| SECURITY | NUMBER
OF SHARES | VALUE ($) |
| Hess Corp. | 9,955 | 736,969 |
| Kinder Morgan, Inc. | 70,402 | 1,116,576 |
| Marathon Oil Corp. | 28,114 | 461,632 |
| Marathon Petroleum Corp. | 22,226 | 1,422,242 |
| Occidental Petroleum Corp. | 32,040 | 928,839 |
| ONEOK, Inc. | 16,101 | 946,095 |
| Phillips 66 | 15,821 | 1,146,390 |
| Pioneer Natural Resources Co. | 8,198 | 1,491,052 |
| Schlumberger Ltd. | 50,649 | 1,516,937 |
| The Williams Cos., Inc. | 43,867 | 1,142,297 |
| Valero Energy Corp. | 14,762 | 1,108,774 |
| | | 38,928,342 |
| |
| Food & Staples Retailing 1.4% |
| Costco Wholesale Corp. | 15,954 | 9,057,086 |
| Sysco Corp. | 18,510 | 1,453,961 |
| The Kroger Co. | 24,436 | 1,105,973 |
| Walgreens Boots Alliance, Inc. | 25,942 | 1,353,135 |
| Walmart, Inc. | 51,351 | 7,429,976 |
| | | 20,400,131 |
| |
| Food, Beverage & Tobacco 2.9% |
| Altria Group, Inc. | 66,327 | 3,143,236 |
| Archer-Daniels-Midland Co. | 20,201 | 1,365,386 |
| Brown-Forman Corp., Class B | 6,598 | 480,730 |
| Campbell Soup Co. | 7,308 | 317,606 |
| Conagra Brands, Inc. | 17,319 | 591,444 |
| Constellation Brands, Inc., Class A | 5,931 | 1,488,503 |
| General Mills, Inc. | 21,871 | 1,473,668 |
| Hormel Foods Corp. | 10,189 | 497,325 |
| Kellogg Co. | 9,236 | 594,983 |
| Lamb Weston Holdings, Inc. | 5,275 | 334,329 |
| McCormick & Co, Inc. | 9,004 | 869,876 |
| Molson Coors Beverage Co., Class B | 6,803 | 315,319 |
| Mondelez International, Inc., Class A | 50,370 | 3,340,035 |
| Monster Beverage Corp. * | 13,566 | 1,302,879 |
| PepsiCo, Inc. | 49,925 | 8,672,472 |
| Philip Morris International, Inc. | 56,215 | 5,340,425 |
| The Coca-Cola Co. | 140,369 | 8,311,248 |
| The Hershey Co. | 5,249 | 1,015,524 |
| The JM Smucker Co. | 3,913 | 531,464 |
| The Kraft Heinz Co. | 25,633 | 920,225 |
| Tyson Foods, Inc., Class A | 10,645 | 927,818 |
| | | 41,834,495 |
| |
| Health Care Equipment & Services 5.8% |
| Abbott Laboratories | 63,849 | 8,986,108 |
| ABIOMED, Inc. * | 1,643 | 590,116 |
| Align Technology, Inc. * | 2,648 | 1,740,213 |
| AmerisourceBergen Corp. | 5,402 | 717,872 |
| Anthem, Inc. | 8,764 | 4,062,465 |
| Baxter International, Inc. | 18,078 | 1,551,816 |
| Becton Dickinson & Co. | 10,370 | 2,607,848 |
| Boston Scientific Corp. * | 51,454 | 2,185,766 |
| Cardinal Health, Inc. | 10,173 | 523,808 |
| Centene Corp. * | 21,070 | 1,736,168 |
| Cerner Corp. | 10,623 | 986,558 |
| Cigna Corp. | 11,967 | 2,747,982 |
| CVS Health Corp. | 47,665 | 4,917,121 |
| DaVita, Inc. * | 2,354 | 267,791 |
| Dentsply Sirona, Inc. | 7,893 | 440,350 |
| DexCom, Inc. * | 3,500 | 1,879,325 |
| Edwards Lifesciences Corp. * | 22,544 | 2,920,575 |
| HCA Healthcare, Inc. | 8,647 | 2,221,587 |
| Henry Schein, Inc. * | 5,007 | 388,193 |
Schwab S&P 500 Index Portfolio | Annual Report
Schwab S&P 500 Index Portfolio
Portfolio Holdings as of December 31, 2021 (continued)
| SECURITY | NUMBER
OF SHARES | VALUE ($) |
| Hologic, Inc. * | 9,152 | 700,677 |
| Humana, Inc. | 4,641 | 2,152,774 |
| IDEXX Laboratories, Inc. * | 3,062 | 2,016,205 |
| Intuitive Surgical, Inc. * | 12,890 | 4,631,377 |
| Laboratory Corp. of America Holdings * | 3,455 | 1,085,596 |
| McKesson Corp. | 5,513 | 1,370,366 |
| Medtronic plc | 48,594 | 5,027,049 |
| Quest Diagnostics, Inc. | 4,429 | 766,261 |
| ResMed, Inc. | 5,262 | 1,370,646 |
| STERIS plc | 3,612 | 879,197 |
| Stryker Corp. | 12,123 | 3,241,933 |
| Teleflex, Inc. | 1,692 | 555,788 |
| The Cooper Cos., Inc. | 1,780 | 745,713 |
| UnitedHealth Group, Inc. | 34,009 | 17,077,279 |
| Universal Health Services, Inc., Class B | 2,639 | 342,173 |
| Zimmer Biomet Holdings, Inc. | 7,543 | 958,263 |
| | | 84,392,959 |
| |
| Household & Personal Products 1.6% |
| Church & Dwight Co., Inc. | 8,816 | 903,640 |
| Colgate-Palmolive Co. | 30,429 | 2,596,811 |
| Kimberly-Clark Corp. | 12,156 | 1,737,336 |
| The Clorox Co. | 4,436 | 773,461 |
| The Estee Lauder Cos., Inc., Class A | 8,367 | 3,097,463 |
| The Procter & Gamble Co. | 87,381 | 14,293,784 |
| | | 23,402,495 |
| |
| Insurance 1.8% |
| Aflac, Inc. | 21,975 | 1,283,120 |
| American International Group, Inc. | 29,982 | 1,704,777 |
| Aon plc, Class A | 7,956 | 2,391,255 |
| Arthur J. Gallagher & Co. | 7,485 | 1,269,980 |
| Assurant, Inc. | 2,056 | 320,448 |
| Brown & Brown, Inc. | 8,464 | 594,850 |
| Chubb Ltd. | 15,554 | 3,006,744 |
| Cincinnati Financial Corp. | 5,412 | 616,589 |
| Everest Re Group Ltd. | 1,422 | 389,514 |
| Globe Life, Inc. | 3,354 | 314,337 |
| Lincoln National Corp. | 6,134 | 418,707 |
| Loews Corp. | 7,234 | 417,836 |
| Marsh & McLennan Cos., Inc. | 18,231 | 3,168,912 |
| MetLife, Inc. | 25,818 | 1,613,367 |
| Principal Financial Group, Inc. | 8,901 | 643,809 |
| Prudential Financial, Inc. | 13,648 | 1,477,260 |
| The Allstate Corp. | 10,350 | 1,217,677 |
| The Hartford Financial Services Group, Inc. | 12,290 | 848,502 |
| The Progressive Corp. | 21,126 | 2,168,584 |
| The Travelers Cos., Inc. | 8,883 | 1,389,568 |
| W.R. Berkley Corp. | 5,040 | 415,246 |
| Willis Towers Watson plc | 4,499 | 1,068,467 |
| | | 26,739,549 |
| |
| Materials 2.5% |
| Air Products and Chemicals, Inc. | 7,993 | 2,431,950 |
| Albemarle Corp. | 4,224 | 987,444 |
| Amcor plc | 55,361 | 664,886 |
| Avery Dennison Corp. | 2,990 | 647,544 |
| Ball Corp. | 11,695 | 1,125,878 |
| Celanese Corp., Series A | 3,931 | 660,644 |
| CF Industries Holdings, Inc. | 7,745 | 548,191 |
| Corteva, Inc. | 26,321 | 1,244,457 |
| Dow, Inc. | 26,706 | 1,514,764 |
| DuPont de Nemours, Inc. | 18,708 | 1,511,232 |
| Eastman Chemical Co. | 4,854 | 586,897 |
| SECURITY | NUMBER
OF SHARES | VALUE ($) |
| Ecolab, Inc. | 9,002 | 2,111,779 |
| FMC Corp. | 4,577 | 502,967 |
| Freeport-McMoRan, Inc. | 53,024 | 2,212,692 |
| International Flavors & Fragrances, Inc. | 9,190 | 1,384,473 |
| International Paper Co. | 13,982 | 656,874 |
| Linde plc | 18,507 | 6,411,380 |
| LyondellBasell Industries, Class A | 9,492 | 875,447 |
| Martin Marietta Materials, Inc. | 2,252 | 992,051 |
| Newmont Corp. | 28,793 | 1,785,742 |
| Nucor Corp. | 10,320 | 1,178,028 |
| Packaging Corp. of America | 3,430 | 466,995 |
| PPG Industries, Inc. | 8,572 | 1,478,156 |
| Sealed Air Corp. | 5,349 | 360,897 |
| The Mosaic Co. | 13,375 | 525,504 |
| The Sherwin-Williams Co. | 8,710 | 3,067,314 |
| Vulcan Materials Co. | 4,792 | 994,723 |
| Westrock Co. | 9,641 | 427,675 |
| | | 37,356,584 |
| |
| Media & Entertainment 8.9% |
| Activision Blizzard, Inc. | 28,124 | 1,871,090 |
| Alphabet, Inc., Class A * | 10,862 | 31,467,648 |
| Alphabet, Inc., Class C * | 10,096 | 29,213,685 |
| Charter Communications, Inc., Class A * | 4,467 | 2,912,350 |
| Comcast Corp., Class A | 164,635 | 8,286,080 |
| Discovery, Inc., Class A *(b) | 6,110 | 143,829 |
| Discovery, Inc., Class C * | 10,967 | 251,144 |
| DISH Network Corp., Class A * | 9,017 | 292,511 |
| Electronic Arts, Inc. | 10,212 | 1,346,963 |
| Fox Corp., Class A | 11,567 | 426,822 |
| Fox Corp., Class B | 5,310 | 181,974 |
| Live Nation Entertainment, Inc. * | 4,878 | 583,848 |
| Match Group, Inc. * | 10,222 | 1,351,860 |
| Meta Platforms, Inc., Class A * | 85,441 | 28,738,080 |
| Netflix, Inc. * | 15,994 | 9,635,425 |
| News Corp., Class A | 14,192 | 316,624 |
| News Corp., Class B | 4,397 | 98,933 |
| Omnicom Group, Inc. | 7,675 | 562,347 |
| Take-Two Interactive Software, Inc. * | 4,163 | 739,848 |
| The Interpublic Group of Cos., Inc. | 14,218 | 532,464 |
| The Walt Disney Co. * | 65,613 | 10,162,798 |
| Twitter, Inc. * | 28,872 | 1,247,848 |
| ViacomCBS, Inc., Class B | 21,907 | 661,153 |
| | | 131,025,324 |
| |
| Pharmaceuticals, Biotechnology & Life Sciences 7.4% |
| AbbVie, Inc. | 63,835 | 8,643,259 |
| Agilent Technologies, Inc. | 10,931 | 1,745,134 |
| Amgen, Inc. | 20,338 | 4,575,440 |
| Biogen, Inc. * | 5,304 | 1,272,536 |
| Bio-Rad Laboratories, Inc., Class A * | 780 | 589,345 |
| Bio-Techne Corp. | 1,419 | 734,105 |
| Bristol-Myers Squibb Co. | 80,146 | 4,997,103 |
| Catalent, Inc. * | 6,181 | 791,353 |
| Charles River Laboratories International, Inc. * | 1,822 | 686,493 |
| Danaher Corp. | 22,964 | 7,555,386 |
| Eli Lilly & Co. | 28,669 | 7,918,951 |
| Gilead Sciences, Inc. | 45,292 | 3,288,652 |
| Illumina, Inc. * | 5,644 | 2,147,203 |
| Incyte Corp. * | 6,780 | 497,652 |
| IQVIA Holdings, Inc. * | 6,898 | 1,946,202 |
| Johnson & Johnson | 95,057 | 16,261,401 |
| Merck & Co., Inc. | 91,207 | 6,990,104 |
| Mettler-Toledo International, Inc. * | 830 | 1,408,684 |
| Moderna, Inc. * | 12,737 | 3,234,943 |
Schwab S&P 500 Index Portfolio | Annual Report
Schwab S&P 500 Index Portfolio
Portfolio Holdings as of December 31, 2021 (continued)
| SECURITY | NUMBER
OF SHARES | VALUE ($) |
| Organon & Co. | 9,155 | 278,770 |
| PerkinElmer, Inc. | 4,557 | 916,230 |
| Pfizer, Inc. | 202,670 | 11,967,664 |
| Regeneron Pharmaceuticals, Inc. * | 3,817 | 2,410,512 |
| Thermo Fisher Scientific, Inc. | 14,228 | 9,493,491 |
| Vertex Pharmaceuticals, Inc. * | 9,181 | 2,016,148 |
| Viatris, Inc. | 43,666 | 590,801 |
| Waters Corp. * | 2,204 | 821,210 |
| West Pharmaceutical Services, Inc. | 2,675 | 1,254,602 |
| Zoetis, Inc. | 17,083 | 4,168,765 |
| | | 109,202,139 |
| |
| Real Estate 2.7% |
| Alexandria Real Estate Equities, Inc. | 5,091 | 1,135,089 |
| American Tower Corp. | 16,444 | 4,809,870 |
| AvalonBay Communities, Inc. | 5,046 | 1,274,569 |
| Boston Properties, Inc. | 5,133 | 591,219 |
| CBRE Group, Inc., Class A * | 12,085 | 1,311,343 |
| Crown Castle International Corp. | 15,607 | 3,257,805 |
| Digital Realty Trust, Inc. | 10,248 | 1,812,564 |
| Duke Realty Corp. | 13,752 | 902,681 |
| Equinix, Inc. | 3,251 | 2,749,826 |
| Equity Residential | 12,323 | 1,115,232 |
| Essex Property Trust, Inc. | 2,350 | 827,741 |
| Extra Space Storage, Inc. | 4,835 | 1,096,240 |
| Federal Realty Investment Trust | 2,528 | 344,617 |
| Healthpeak Properties, Inc. | 19,461 | 702,348 |
| Host Hotels & Resorts, Inc. * | 25,783 | 448,366 |
| Iron Mountain, Inc. | 10,454 | 547,058 |
| Kimco Realty Corp. | 22,260 | 548,709 |
| Mid-America Apartment Communities, Inc. | 4,157 | 953,782 |
| Prologis, Inc. | 26,697 | 4,494,707 |
| Public Storage | 5,509 | 2,063,451 |
| Realty Income Corp. | 20,426 | 1,462,297 |
| Regency Centers Corp. | 5,563 | 419,172 |
| SBA Communications Corp. | 3,928 | 1,528,071 |
| Simon Property Group, Inc. | 11,865 | 1,895,671 |
| UDR, Inc. | 10,492 | 629,415 |
| Ventas, Inc. | 14,412 | 736,741 |
| Vornado Realty Trust | 5,741 | 240,318 |
| Welltower, Inc. | 15,718 | 1,348,133 |
| Weyerhaeuser Co. | 27,047 | 1,113,795 |
| | | 40,360,830 |
| |
| Retailing 6.8% |
| Advance Auto Parts, Inc. | 2,275 | 545,727 |
| Amazon.com, Inc. * | 15,748 | 52,509,186 |
| AutoZone, Inc. * | 757 | 1,586,967 |
| Bath & Body Works, Inc. | 9,546 | 666,215 |
| Best Buy Co., Inc. | 7,993 | 812,089 |
| CarMax, Inc. * | 5,854 | 762,366 |
| Dollar General Corp. | 8,424 | 1,986,632 |
| Dollar Tree, Inc. * | 8,121 | 1,141,163 |
| eBay, Inc. | 22,604 | 1,503,166 |
| Etsy, Inc. * | 4,578 | 1,002,307 |
| Genuine Parts Co. | 5,143 | 721,049 |
| LKQ Corp. | 9,684 | 581,331 |
| Lowe's Cos., Inc. | 25,002 | 6,462,517 |
| O'Reilly Automotive, Inc. * | 2,433 | 1,718,258 |
| Pool Corp. | 1,448 | 819,568 |
| Ross Stores, Inc. | 12,832 | 1,466,441 |
| Target Corp. | 17,622 | 4,078,436 |
| The Gap, Inc. | 7,741 | 136,629 |
| The Home Depot, Inc. | 38,107 | 15,814,786 |
| The TJX Cos., Inc. | 43,421 | 3,296,522 |
| SECURITY | NUMBER
OF SHARES | VALUE ($) |
| Tractor Supply Co. | 4,110 | 980,646 |
| Ulta Beauty, Inc. * | 1,963 | 809,423 |
| | | 99,401,424 |
| |
| Semiconductors & Semiconductor Equipment 6.3% |
| Advanced Micro Devices, Inc. * | 43,605 | 6,274,759 |
| Analog Devices, Inc. | 19,405 | 3,410,817 |
| Applied Materials, Inc. | 32,603 | 5,130,408 |
| Broadcom, Inc. | 14,863 | 9,889,989 |
| Enphase Energy, Inc. * | 4,872 | 891,284 |
| Intel Corp. | 146,850 | 7,562,775 |
| KLA Corp. | 5,475 | 2,354,852 |
| Lam Research Corp. | 5,084 | 3,656,159 |
| Microchip Technology, Inc. | 20,036 | 1,744,334 |
| Micron Technology, Inc. | 40,391 | 3,762,422 |
| Monolithic Power Systems, Inc. | 1,565 | 772,061 |
| NVIDIA Corp. | 90,270 | 26,549,310 |
| NXP Semiconductor N.V. | 9,602 | 2,187,143 |
| Qorvo, Inc. * | 3,979 | 622,276 |
| QUALCOMM, Inc. | 40,441 | 7,395,446 |
| Skyworks Solutions, Inc. | 5,963 | 925,100 |
| SolarEdge Technologies, Inc. * | 1,896 | 531,961 |
| Teradyne, Inc. | 5,886 | 962,537 |
| Texas Instruments, Inc. | 33,346 | 6,284,721 |
| Xilinx, Inc. | 8,951 | 1,897,880 |
| | | 92,806,234 |
| |
| Software & Services 13.9% |
| Accenture plc, Class A | 22,807 | 9,454,642 |
| Adobe, Inc. * | 17,180 | 9,742,091 |
| Akamai Technologies, Inc. * | 5,866 | 686,557 |
| ANSYS, Inc. * | 3,151 | 1,263,929 |
| Autodesk, Inc. * | 7,939 | 2,232,367 |
| Automatic Data Processing, Inc. | 15,215 | 3,751,715 |
| Broadridge Financial Solutions, Inc. | 4,209 | 769,489 |
| Cadence Design Systems, Inc. * | 10,007 | 1,864,804 |
| Ceridian HCM Holding, Inc. * | 4,918 | 513,734 |
| Citrix Systems, Inc. | 4,503 | 425,939 |
| Cognizant Technology Solutions Corp., Class A | 18,965 | 1,682,575 |
| DXC Technology Co. * | 9,109 | 293,219 |
| EPAM Systems, Inc. * | 2,048 | 1,368,986 |
| Fidelity National Information Services, Inc. | 21,988 | 2,399,990 |
| Fiserv, Inc. * | 21,456 | 2,226,918 |
| FleetCor Technologies, Inc. * | 2,932 | 656,299 |
| Fortinet, Inc. * | 4,900 | 1,761,060 |
| Gartner, Inc. * | 2,969 | 992,596 |
| Global Payments, Inc. | 10,477 | 1,416,281 |
| International Business Machines Corp. | 32,381 | 4,328,044 |
| Intuit, Inc. | 10,225 | 6,576,925 |
| Jack Henry & Associates, Inc. | 2,673 | 446,364 |
| Mastercard, Inc., Class A | 31,324 | 11,255,340 |
| Microsoft Corp. | 271,098 | 91,175,679 |
| NortonLifeLock, Inc. | 21,005 | 545,710 |
| Oracle Corp. | 58,237 | 5,078,849 |
| Paychex, Inc. | 11,587 | 1,581,626 |
| Paycom Software, Inc. * | 1,738 | 721,600 |
| PayPal Holdings, Inc. * | 42,425 | 8,000,507 |
| PTC, Inc. * | 3,815 | 462,187 |
| salesforce.com, Inc. * | 35,350 | 8,983,495 |
| ServiceNow, Inc. * | 7,186 | 4,664,504 |
| Synopsys, Inc. * | 5,507 | 2,029,330 |
| Tyler Technologies, Inc. * | 1,480 | 796,166 |
Schwab S&P 500 Index Portfolio | Annual Report
Schwab S&P 500 Index Portfolio
Portfolio Holdings as of December 31, 2021 (continued)
| SECURITY | NUMBER
OF SHARES | VALUE ($) |
| VeriSign, Inc. * | 3,489 | 885,578 |
| Visa, Inc., Class A | 60,554 | 13,122,657 |
| | | 204,157,752 |
| |
| Technology Hardware & Equipment 8.7% |
| Amphenol Corp., Class A | 21,593 | 1,888,524 |
| Apple Inc. | 562,781 | 99,933,022 |
| Arista Networks, Inc. * | 8,100 | 1,164,375 |
| CDW Corp. | 4,900 | 1,003,422 |
| Cisco Systems, Inc. | 152,290 | 9,650,617 |
| Corning, Inc. | 27,732 | 1,032,462 |
| F5, Inc. * | 2,178 | 532,978 |
| Hewlett Packard Enterprise Co. | 47,226 | 744,754 |
| HP, Inc. | 41,617 | 1,567,713 |
| IPG Photonics Corp. * | 1,290 | 222,061 |
| Juniper Networks, Inc. | 11,738 | 419,164 |
| Keysight Technologies, Inc. * | 6,651 | 1,373,498 |
| Motorola Solutions, Inc. | 6,098 | 1,656,827 |
| NetApp, Inc. | 8,074 | 742,727 |
| Seagate Technology Holdings plc | 7,396 | 835,600 |
| TE Connectivity Ltd. | 11,783 | 1,901,069 |
| Teledyne Technologies, Inc. * | 1,684 | 735,723 |
| Trimble, Inc. * | 9,064 | 790,290 |
| Western Digital Corp. * | 11,252 | 733,743 |
| Zebra Technologies Corp., Class A * | 1,930 | 1,148,736 |
| | | 128,077,305 |
| |
| Telecommunication Services 1.2% |
| AT&T, Inc. | 257,844 | 6,342,963 |
| Lumen Technologies, Inc. | 33,278 | 417,639 |
| T-Mobile US, Inc. * | 21,198 | 2,458,544 |
| Verizon Communications, Inc. | 149,492 | 7,767,604 |
| | | 16,986,750 |
| |
| Transportation 1.7% |
| Alaska Air Group, Inc. * | 4,523 | 235,648 |
| American Airlines Group, Inc. * | 23,385 | 419,995 |
| C.H. Robinson Worldwide, Inc. | 4,693 | 505,107 |
| CSX Corp. | 80,086 | 3,011,234 |
| Delta Air Lines, Inc. * | 23,106 | 902,982 |
| Expeditors International of Washington, Inc. | 6,117 | 821,452 |
| FedEx Corp. | 8,825 | 2,282,498 |
| JB Hunt Transport Services, Inc. | 3,034 | 620,150 |
| Norfolk Southern Corp. | 8,787 | 2,615,978 |
| Old Dominion Freight Line, Inc. | 3,364 | 1,205,590 |
| Southwest Airlines Co. * | 21,374 | 915,662 |
| Union Pacific Corp. | 23,213 | 5,848,051 |
| United Airlines Holdings, Inc. * | 11,692 | 511,876 |
| United Parcel Service, Inc., Class B | 26,329 | 5,643,358 |
| | | 25,539,581 |
| |
| Utilities 2.5% |
| Alliant Energy Corp. | 9,040 | 555,689 |
| Ameren Corp. | 9,301 | 827,882 |
| American Electric Power Co., Inc. | 18,184 | 1,617,830 |
| American Water Works Co., Inc. | 6,555 | 1,237,977 |
| Atmos Energy Corp. | 4,781 | 500,905 |
| CenterPoint Energy, Inc. | 22,704 | 633,669 |
| CMS Energy Corp. | 10,460 | 680,423 |
| Consolidated Edison, Inc. | 12,772 | 1,089,707 |
| Dominion Energy, Inc. | 29,247 | 2,297,644 |
| SECURITY | NUMBER
OF SHARES | VALUE ($) |
| DTE Energy Co. | 6,994 | 836,063 |
| Duke Energy Corp. | 27,775 | 2,913,597 |
| Edison International | 13,719 | 936,322 |
| Entergy Corp. | 7,257 | 817,501 |
| Evergy, Inc. | 8,278 | 567,954 |
| Eversource Energy | 12,415 | 1,129,517 |
| Exelon Corp. | 35,326 | 2,040,430 |
| FirstEnergy Corp. | 19,659 | 817,618 |
| NextEra Energy, Inc. | 70,851 | 6,614,649 |
| NiSource, Inc. | 14,169 | 391,206 |
| NRG Energy, Inc. | 8,840 | 380,827 |
| Pinnacle West Capital Corp. | 4,072 | 287,442 |
| PPL Corp. | 27,099 | 814,596 |
| Public Service Enterprise Group, Inc. | 18,261 | 1,218,557 |
| Sempra Energy | 11,532 | 1,525,453 |
| The AES Corp. | 24,075 | 585,023 |
| The Southern Co. | 38,266 | 2,624,282 |
| WEC Energy Group, Inc. | 11,391 | 1,105,724 |
| Xcel Energy, Inc. | 19,451 | 1,316,833 |
| | | 36,365,320 |
Total Common Stocks
(Cost $752,952,614) | 1,457,189,838 |
| SECURITY | NUMBER OF SHARES/
FACE AMOUNT ($) | VALUE ($) |
| SHORT-TERM INVESTMENTS 0.7% OF NET ASSETS |
| |
| Money Market Funds 0.0% |
| State Street Institutional U.S. Government Money Market Fund, Premier Class 0.03% (c)(d) | 20,160 | 20,160 |
| |
| Time Deposits 0.7% |
| JPMorgan Chase Bank |
| 0.01%, 01/03/22 (e) | 3,574,232 | 3,574,232 |
| Sumitomo Mitsui Trust Bank, Ltd. |
| 0.01%, 01/03/22 (e) | 6,105,483 | 6,105,483 |
| | | 9,679,715 |
Total Short-Term Investments
(Cost $9,699,875) | 9,699,875 |
Total Investments in Securities
(Cost $762,652,489) | 1,466,889,713 |
| | NUMBER OF
CONTRACTS | NOTIONAL
AMOUNT
($) | CURRENT VALUE/
UNREALIZED
APPRECIATION
($) |
| FUTURES CONTRACTS |
| Long | | | |
| S&P 500 Index, e-mini, expires 03/18/22 | 46 | 10,944,550 | 160,799 |
| * | Non-income producing security. |
| (a) | Issuer is affiliated with the fund’s investment adviser. |
| (b) | All or a portion of this security is on loan. Securities on loan were valued at $19,020. |
| (c) | The rate shown is the 7-day yield. |
| (d) | Security purchased with cash collateral received for securities on loan. |
| (e) | The rate shown is the current daily overnight rate. |
Schwab S&P 500 Index Portfolio | Annual Report
Schwab S&P 500 Index Portfolio
Portfolio Holdings as of December 31, 2021 (continued)
Below is a summary of the fund’s transactions with affiliated issuers during the period ended December 31, 2021:
| | VALUE AT
12/31/20 | PURCHASES | SALES | REALIZED
GAINS (LOSSES) | NET CHANGE
IN UNREALIZED
APPRECIATION
(DEPRECIATION) | VALUE AT
12/31/21 | BALANCE
OF SHARES
HELD AT
12/31/21 | DIVIDENDS
RECEIVED |
| COMMON STOCKS 0.3% OF NET ASSETS |
| |
| Diversified Financials 0.3% |
| The Charles Schwab Corp. | $2,340,814 | $1,127,642 | ($399,952) | $51,215 | $1,432,614 | $4,552,333 | 54,130 | $34,869 |
The following is a summary of the inputs used to value the fund’s investments as of December 31, 2021 (see financial note 2(a) for additional information):
| DESCRIPTION | QUOTED PRICES IN
ACTIVE MARKETS FOR
IDENTICAL ASSETS
(LEVEL 1) | OTHER SIGNIFICANT
OBSERVABLE INPUTS
(LEVEL 2) | SIGNIFICANT
UNOBSERVABLE INPUTS
(LEVEL 3) | TOTAL |
| Assets | | | | |
| Common Stocks1 | $1,457,189,838 | $— | $— | $1,457,189,838 |
| Short-Term Investments1 | 20,160 | — | — | 20,160 |
| Time Deposits | — | 9,679,715 | — | 9,679,715 |
| Futures Contracts2 | 160,799 | — | — | 160,799 |
| Total | $1,457,370,797 | $9,679,715 | $— | $1,467,050,512 |
| 1 | As categorized in the Portfolio Holdings. |
| 2 | Futures contracts are reported at cumulative unrealized appreciation or depreciation. |
Fund investments in mutual funds are classified as Level 1, without consideration to the classification level of the underlying securities held by the mutual funds, which could be Level 1, Level 2 or Level 3.
Schwab S&P 500 Index Portfolio | Annual Report
Schwab S&P 500 Index Portfolio
Statement of Assets and Liabilities
As of December 31, 2021
| Assets |
| Investments in securities, at value - affiliated (cost $2,061,123) | | $4,552,333 |
| Investments in securities, at value - unaffiliated (cost $760,591,366) including securities on loan of $19,020 | | 1,462,337,380 |
| Deposit with broker for futures contracts | | 586,500 |
| Receivables: | | |
| Fund shares sold | | 1,514,464 |
| Dividends | | 841,063 |
| Income from securities on loan | + | 73 |
| Total assets | | 1,469,831,813 |
| Liabilities |
| Collateral held for securities on loan | | 20,160 |
| Payables: | | |
| Fund shares redeemed | | 2,156,507 |
| Investment adviser fees | | 37,113 |
| Variation margin on futures contracts | | 31,625 |
| Investments bought | + | 1,361 |
| Total liabilities | | 2,246,766 |
| Net assets | | $1,467,585,047 |
| Net Assets by Source |
| Capital received from investors | | $753,948,119 |
| Total distributable earnings | + | 713,636,928 |
| Net assets | | $1,467,585,047 |
| Net Asset Value (NAV) |
| Net Assets | ÷ | Shares
Outstanding | = | NAV |
| $1,467,585,047 | | 20,843,574 | | $70.41 |
| | | | | |
| | | | | |
Schwab S&P 500 Index Portfolio | Annual Report
Schwab S&P 500 Index Portfolio
Statement of Operations
| For the period January 1, 2021 through December 31, 2021 |
| Investment Income |
| Dividends received from securities - unaffiliated (net of foreign withholding tax of $2,282) | | $16,297,791 |
| Dividends received from securities - affiliated | | 34,869 |
| Interest received from securities - unaffiliated | | 366 |
| Securites on loan, net | + | 2,207 |
| Total investment income | | 16,335,233 |
| Expenses |
| Investment adviser fees | + | 353,930 |
| Total expenses | – | 353,930 |
| Net investment income | | 15,981,303 |
| REALIZED AND UNREALIZED GAINS (LOSSES) |
| Net realized gains on sales of securities - affiliated | | 51,215 |
| Net realized gains on sales of securities - unaffiliated | | 7,084,739 |
| Net realized gains on futures contracts | + | 1,434,129 |
| Net realized gains | | 8,570,083 |
| Net change in unrealized appreciation (depreciation) on securities - affiliated | | 1,432,614 |
| Net change in unrealized appreciation (depreciation) on securities - unaffiliated | | 270,751,504 |
| Net change in unrealized appreciation (depreciation) on futures contracts | + | 104,680 |
| Net change in unrealized appreciation (depreciation) | + | 272,288,798 |
| Net realized and unrealized gains | | 280,858,881 |
| Increase in net assets resulting from operations | | $296,840,184 |
Schwab S&P 500 Index Portfolio | Annual Report
Schwab S&P 500 Index Portfolio
Statement of Changes in Net Assets
For the current and prior report periods
| OPERATIONS |
| | 1/1/21-12/31/21 | 1/1/20-12/31/20 |
| Net investment income | | $15,981,303 | $15,012,435 |
| Net realized gains (losses) | | 8,570,083 | (11,195,195) |
| Net change in unrealized appreciation (depreciation) | + | 272,288,798 | 166,344,680 |
| Increase in net assets from operations | | $296,840,184 | $170,161,920 |
| DISTRIBUTIONS TO SHAREHOLDERS |
| Total distributions | | ($15,017,859) | ($10,111,416) |
| TRANSACTIONS IN FUND SHARES |
| | 1/1/21-12/31/21 | 1/1/20-12/31/20 |
| | | SHARES | VALUE | SHARES | VALUE |
| Shares sold | | 7,110,963 | $452,221,843 | 8,541,750 | $378,103,272 |
| Shares reinvested | | 238,190 | 15,017,859 | 222,915 | 10,111,416 |
| Shares redeemed | + | (3,588,771) | (228,019,959) | (4,076,571) | (190,181,607) |
| Net transactions in fund shares | | 3,760,382 | $239,219,743 | 4,688,094 | $198,033,081 |
| SHARES OUTSTANDING AND NET ASSETS |
| | 1/1/21-12/31/21 | 1/1/20-12/31/20 |
| | | SHARES | NET ASSETS | SHARES | NET ASSETS |
| Beginning of period | | 17,083,192 | $946,542,979 | 12,395,098 | $588,459,394 |
| Total increase | + | 3,760,382 | 521,042,068 | 4,688,094 | 358,083,585 |
| End of period | | 20,843,574 | $1,467,585,047 | 17,083,192 | $946,542,979 |
Schwab S&P 500 Index Portfolio | Annual Report
Schwab S&P 500 Index Portfolio
1. Business Structure of the Fund:
Schwab S&P 500 Index Portfolio (the fund) is a series of Schwab Annuity Portfolios (the trust), a no-load, open-end management investment company. The trust is organized as a Massachusetts business trust and is registered under the Investment Company Act of 1940, as amended (the 1940 Act). The list below shows all the funds in the trust as of the end of the period, including the fund discussed in this report, which is highlighted:
| SCHWAB ANNUITY PORTFOLIOS (ORGANIZED JANUARY 21, 1994) |
| Schwab Government Money Market Portfolio | |
| Schwab S&P 500 Index Portfolio | |
| Schwab VIT Balanced Portfolio | |
| Schwab VIT Balanced with Growth Portfolio | |
| Schwab VIT Growth Portfolio | |
The fund in this report offers one share class. Shares are bought and sold at closing net asset value per share (NAV), which is the price for all outstanding shares of the fund. Each share has a par value of 1/1,000 of a cent, and the fund’s Board of Trustees (the Board) may authorize the issuance of as many shares as necessary.
The fund is available exclusively as an investment vehicle for variable annuity and variable life insurance contracts offered by separate accounts of participating life insurance companies, and in the future may be offered to pension and retirement plans qualified under the Internal Revenue Code of 1986, as amended. At December 31, 2021, 100% of the fund’s shares were held through separate accounts of six insurance companies. Subscriptions and redemptions of these insurance separate accounts could have a material impact on the fund.
The fund maintains its own account for purposes of holding assets and accounting, and is considered a separate entity for tax purposes. Within its account, the fund may also keep certain assets in segregated accounts, as required by securities law.
2. Significant Accounting Policies:
The following is a summary of the significant accounting policies the fund uses in its preparation of financial statements. The fund follows the investment company accounting and reporting guidance of the Financial Accounting Standards Board (FASB) Accounting Standard Codification Topic 946 Financial Services — Investment Companies. The accounting policies are in conformity with accounting principles generally accepted in the United States of America (GAAP).
(a) Security Valuation:
Under procedures approved by the Board, the investment adviser has formed a Pricing Committee to administer the pricing and valuation of portfolio securities and other assets and to ensure that prices used for internal purposes or provided by third parties reasonably reflect fair value. Among other things, these procedures allow the fund to utilize independent pricing services, quotations from securities and financial instrument dealers and other market sources to determine fair value.
The fund values the securities in its portfolio every business day. The fund uses the following policies to value various types of securities:
• Securities traded on an exchange or over-the-counter: Traded securities are valued at the closing value for the day, or, on days when no closing value has been reported, at the mean of the most recent bid and ask quotes.
• Futures contracts: Futures contracts are valued at their settlement prices as of the close of their exchanges.
• Mutual funds: Mutual funds are valued at their respective NAVs.
• Cash management sweep time deposits: Balances held in cash management sweep time deposits are accounted for on a cost basis, which approximates fair value.
• Securities for which no quoted value is available: The Board has adopted procedures to fair value the fund’s securities when market prices are not “readily available” or are unreliable. For example, the fund may fair value a security when it is de-listed or its trading is halted or suspended; when a security’s primary pricing source is unable or unwilling to provide a price; or when a security’s primary trading market is closed during regular market hours. The fund makes fair value determinations in good faith in accordance with the fund’s valuation procedures. The Pricing Committee considers a number of factors, including unobservable market inputs, when arriving at fair value. The Pricing Committee may employ techniques such as the review of related or comparable assets or liabilities, related market activities, recent transactions, market multiples, book values, transactional back-testing, disposition analysis and other relevant information. The Pricing Committee regularly reviews these
Schwab S&P 500 Index Portfolio | Annual Report
Schwab S&P 500 Index Portfolio
Financial Notes (continued)
2. Significant Accounting Policies (continued):
inputs and assumptions to calibrate the valuations. Due to the subjective and variable nature of fair value pricing, there can be no assurance that the fund could obtain the fair value assigned to the security upon the sale of such security. The Board convenes on a regular basis to review fair value determinations made by the fund pursuant to the valuation procedures.
In accordance with the authoritative guidance on fair value measurements and disclosures under GAAP, the fund discloses the fair value of its investments in a hierarchy that prioritizes the significant inputs to valuation techniques used to measure the fair value. The hierarchy gives the highest priority to valuations based upon unadjusted quoted prices in active markets for identical assets or liabilities (Level 1 measurements) and the lowest priority to valuations based upon unobservable inputs that are significant to the valuation (Level 3 measurements). If inputs used to measure the financial instruments fall within different levels of the hierarchy, the categorization is based on the lowest level input that is significant to the valuation. If the fund determines that either the volume and/or level of activity for an asset or liability has significantly decreased (from normal conditions for that asset or liability) or price quotations or observable inputs are not associated with orderly transactions, increased analysis and management judgment will be required to estimate fair value.
The three levels of the fair value hierarchy are as follows:
• Level 1 quoted prices in active markets for identical securities— Investments whose values are based on quoted market prices in active markets, and whose values are therefore classified as Level 1 prices, include active listed equities and futures contracts. Investments in mutual funds are valued daily at their NAVs, which are classified as Level 1 prices, without consideration to the classification level of the underlying securities held by an underlying fund.
• Level 2 other significant observable inputs (including quoted prices for similar securities, interest rates, prepayment speeds, credit risk, etc.)— Investments that trade in markets that are not considered to be active, but whose values are based on quoted market prices, dealer quotations or valuations provided by alternative pricing sources supported by observable inputs are classified as Level 2 prices. These generally include U.S. government and sovereign obligations, most government agency securities, investment-grade corporate bonds, certain mortgage products, less liquid listed equities, and state, municipal and provincial obligations.
• Level 3 significant unobservable inputs (including the fund’s own assumptions in determining the fair value of investments)— Investments whose values are classified as Level 3 prices have significant unobservable inputs, as they may trade infrequently or not at all. When observable prices are not available for these securities, the fund uses one or more valuation techniques for which sufficient and reliable data is available. The inputs used by the fund in estimating the value of Level 3 prices may include the original transaction price, quoted prices for similar securities or assets in active markets, completed or pending third-party transactions in the underlying investment or comparable issuers, and changes in financial ratios or cash flows. Level 3 prices may also be adjusted to reflect illiquidity and/or non-transferability, with the amount of such discount estimated by the fund in the absence of market information. Assumptions used by the fund due to the lack of observable inputs may significantly impact the resulting fair value and therefore the fund’s results of operations.
The inputs or methodology used for valuing securities are not necessarily an indication of the risk associated with investing in those securities.
The levels associated with valuing the fund’s investments as of December 31, 2021 are disclosed in the Portfolio Holdings.
(b) Accounting Policies for certain Portfolio Investments (if held):
Futures Contracts: Futures contracts are instruments that represent an agreement between two parties that obligates one party to buy, and the other party to sell, specific instruments at an agreed upon price on a stipulated future date. The fund must give the broker a deposit of cash and/or securities (initial margin) whenever it enters into a futures contract. The amount of the deposit may vary from one contract to another. Subsequent payments (variation margin) are made or received by the fund depending on the daily fluctuations in the value of the futures contract and are accounted for as unrealized appreciation or depreciation until the contract is closed, at which time the gains or losses are realized. Futures contracts are traded publicly on exchanges, and their value may change daily.
Cash Management Transactions: The fund may subscribe to the Brown Brothers Harriman & Co. (BBH) Cash Management Service Sweep (CMS Sweep). The BBH CMS Sweep is an investment product that automatically sweeps the fund’s cash balances into overnight offshore time deposits with either the BBH Grand Cayman branch or a branch of a pre-approved commercial bank. This fully automated program allows the fund to earn interest on cash balances. Excess cash invested with deposit institutions domiciled
Schwab S&P 500 Index Portfolio | Annual Report
Schwab S&P 500 Index Portfolio
Financial Notes (continued)
2. Significant Accounting Policies (continued):
outside of the U.S., as with any offshore deposit, may be subject to sovereign actions in the jurisdiction of the deposit institution including, but not limited to, freeze, seizure or diminution. The fund bears the risk associated with the repayment of principal and payment of interest on such instruments by the institution with which the deposit is ultimately placed.
Securities Lending: Under the trust’s Securities Lending Program, the fund (lender) may make short-term loans of its securities to another party (borrower) to generate additional revenue for the fund. The borrower pledges collateral in the form of cash, securities issued or fully guaranteed by the U.S. government or foreign governments, or letters of credit issued by a bank. Collateral at the individual loan level is required to be maintained on a daily marked-to-market basis in an amount at least equal to the current value of the securities loaned. The lending agent provides the fund with indemnification against borrower default (the borrower fails to return the security on loan) reducing the risk of loss as a result of default. The cash collateral of securities loaned is currently invested in money market portfolios operating pursuant to Rule 2a-7 under the 1940 Act. The fund bears the risk of loss with respect to the investment of cash collateral. The terms of the securities lending agreement allow the fund or the lending agent to terminate any loan at any given time and the securities must be returned within the earlier of the standard trade settlement period or the specified time period under the relevant securities lending agreement. Securities lending income, as disclosed in the fund’s Statement of Operations, if applicable, represents the income earned from the investment of the cash collateral plus any fees paid by borrowers, less the fees paid to the lending agent and broker rebates which are subject to adjustments pursuant to the securities lending agreement. On loans not collateralized by cash, a fee is received from the borrower, and is allocated between the fund and the lending agent. The aggregate fair value of securities loaned will not at any time exceed one-third of the total assets of the fund, including collateral received from the loan. Securities lending fees paid to the unaffiliated lending agents start at 10% of gross lending revenue, with subsequent breakpoints to a low of 5%. In this context, the gross lending revenue equals the income received from the investment of cash collateral and fees paid by borrowers less any rebates paid to the borrowers. Any expenses charged by the cash collateral fund are in addition to these fees. All remaining revenue is retained by the fund, as applicable. No portion of lending revenue is paid to or retained by the investment adviser or any of its affiliates.
As of December 31, 2021, the fund had securities on loan, all of which were classified as common stocks. The value of the securities on loan and the related collateral as of December 31, 2021, are disclosed in the fund’s Portfolio Holdings and Statement of Assets and Liabilities.
(c) Security Transactions:
Security transactions are recorded as of the date the order to buy or sell the security is executed. Realized gains and losses from security transactions are based on the identified costs of the securities involved.
Assets and liabilities denominated in foreign currencies are reported in U.S. dollars. For assets and liabilities held on a given date, the dollar value is based on market exchange rates in effect on that date. Transactions involving foreign currencies, including purchases, sales, income receipts and expense payments, are calculated using exchange rates in effect on the transaction date. The fund does not isolate the portion of the fluctuations on investments resulting from changes in foreign currency exchange rates from the fluctuations in market prices of investments held. Such fluctuations are included with the net realized and unrealized gain or loss from investments.
When the fund closes out a futures contract position, it calculates the difference between the value of the position at the beginning and at the end of the contract, and records a realized gain or loss accordingly.
(d) Investment Income:
Interest income is recorded as it accrues. Dividends and distributions from portfolio securities and underlying funds are recorded on the date they are effective (the ex-dividend date), although the fund records certain foreign security dividends on the date the ex-dividend date is confirmed. Any distributions from underlying funds are recorded in accordance with the character of the distributions as designated by the underlying funds.
(e) Expenses:
Pursuant to an Amended and Restated Investment Advisory and Administration Agreement (Advisory Agreement) between the investment adviser and the fund, the investment adviser pays the operating expenses of the fund, excluding acquired fund fees and expenses, taxes, any brokerage expenses, and extraordinary or non-routine expenses. Taxes, any brokerage expenses and extraordinary or non-routine expenses that are specific to the fund are charged directly to the fund.
(f) Distributions to Shareholders:
The fund makes distributions from net investment income and net realized capital gains, if any, once a year.
Schwab S&P 500 Index Portfolio | Annual Report
Schwab S&P 500 Index Portfolio
Financial Notes (continued)
2. Significant Accounting Policies (continued):
(g) Accounting Estimates:
The accounting policies described in this report conform to GAAP. Notwithstanding this, shareholders should understand that in order to follow these principles, fund management has to make estimates and assumptions that affect the information reported in the financial statements. It’s possible that once the results are known, they may turn out to be different from these estimates and these differences may be material.
(h) Federal Income Taxes:
The fund intends to meet federal income and excise tax requirements for regulated investment companies under subchapter M of the Internal Revenue Code, as amended. Accordingly, the fund distributes substantially all of its net investment income and net realized capital gains, if any, to the participating insurance company’s (shareholders) separate accounts each year. As long as the fund meets the tax requirements, it is not required to pay federal income tax.
(i) Indemnification:
Under the fund’s organizational documents, the officers and trustees are indemnified against certain liabilities arising out of the performance of their duties to the fund. In addition, in the normal course of business the fund enters into contracts with its vendors and others that provide general indemnifications. The fund’s maximum exposure under these arrangements is unknown as this would involve future claims that may be made against the fund. However, based on experience, the fund expects the risk of loss attributable to these arrangements to be remote.
3. Risk Factors:
Market Risk. Financial markets rise and fall in response to a variety of factors, sometimes rapidly and unpredictably. Markets may be impacted by economic, political, regulatory and other conditions, including economic sanctions and other government actions. In addition, the occurrence of global events, such as war, terrorism, environmental disasters, natural disasters and epidemics may also negatively affect the financial markets. As with any investment whose performance is tied to these markets, the value of an investment in the fund will fluctuate, which means that an investor could lose money over short or long periods.
Equity Risk. The prices of equity securities rise and fall daily. These price movements may result from factors affecting individual companies, industries or the securities market as a whole. In addition, equity markets tend to move in cycles, which may cause stock prices to fall over short or extended periods of time.
Investment Style Risk. The fund primarily follows the large-cap portion of the U.S. stock market, as measured by the index. It follows these stocks during upturns as well as downturns. Because of its indexing strategy, the fund does not take steps to reduce market exposure or to lessen the effects of a declining market. In addition, because of the fund’s expenses, the fund’s performance may be below that of the index. Market disruptions could cause delays in the index’s rebalancing schedule which may result in the index and, in turn, the fund experiencing returns different than those that would have been achieved under a normal rebalancing schedule.
A significant percentage of the index may be composed of securities in a single industry or sector of the economy. If the fund is focused in an industry or sector, it may present more risks than if it were broadly diversified over numerous industries and sectors of the economy.
Tracking Error Risk. As an index fund, the fund seeks to track the performance of its benchmark index, although it may not be successful in doing so. The divergence between the performance of a fund and its benchmark index, positive or negative, is called “tracking error.” Tracking error can be caused by many factors and it may be significant.
Market Capitalization Risk. Securities issued by companies of different market capitalizations tend to go in and out of favor based on market and economic conditions. During a period when securities of a particular market capitalization fall behind other types of investments, the fund’s performance could be impacted.
Large-Cap Company Risk. Large-cap companies are generally more mature and the securities issued by these companies may not be able to reach the same levels of growth as the securities issued by small- or mid-cap companies.
Concentration Risk. To the extent that the fund’s or the index’s portfolio is concentrated in the securities of issuers in a particular market, industry, group of industries, sector, or asset class, the fund may be adversely affected by the performance of those securities, may be subject to increased price volatility and may be more vulnerable to adverse economic, market, political or regulatory occurrences affecting that market, industry, group of industries, sector, or asset class.
Schwab S&P 500 Index Portfolio | Annual Report
Schwab S&P 500 Index Portfolio
Financial Notes (continued)
3. Risk Factors (continued):
Derivatives Risk. The fund’s use of derivative instruments involves risks different from, or possibly greater than, the risks associated with investing directly in securities and other traditional investments. The fund’s use of derivatives could reduce the fund’s performance, increase its volatility, and could cause the fund to lose more than the initial amount invested. In addition, investments in derivatives may involve leverage, which means a small percentage of assets invested in derivatives can have a disproportionately large impact on the fund.
Liquidity Risk. The fund may be unable to sell certain securities, such as illiquid securities, readily at a favorable time or price, or the fund may have to sell them at a loss.
Securities Lending Risk. Securities lending involves the risk of loss of rights in, or delay in recovery of, the loaned securities if the borrower fails to return the security loaned or becomes insolvent.
Please refer to the fund’s prospectus for a more complete description of the principal risks of investing in the fund.
4. Affiliates and Affiliated Transactions:
Investment Adviser
Charles Schwab Investment Management, Inc., dba Schwab Asset Management, a wholly owned subsidiary of The Charles Schwab Corporation, serves as the fund’s investment adviser and administrator pursuant to an Advisory Agreement between the investment adviser and the trust.
For its advisory services to the fund, the investment adviser is entitled to receive an annual fee, payable monthly, equal to 0.03% of the fund’s average daily net assets.
Interfund Transactions
The fund may engage in transactions with certain other funds in the Fund Complex (for definition refer to the Trustees and Officers Section) in accordance with procedures adopted by the Board pursuant to Rule 17a-7 under the 1940 Act. When one fund is seeking to sell a security that another is seeking to buy, an interfund transaction can allow both funds to benefit by reducing transaction costs. This practice is limited to funds that share the same investment adviser, trustees and/or officers. For the period ended December 31, 2021, the fund’s total aggregate security transactions with other funds in the Fund Complex was $6,801,542 and includes realized losses of $205,210.
Interfund Borrowing and Lending
Pursuant to an exemptive order issued by the U.S. Securities and Exchange Commission (SEC), the fund may enter into interfund borrowing and lending transactions with other funds in the Fund Complex . All loans are for temporary or emergency purposes and the interest rate to be charged will be the average of the overnight repurchase agreement rate and the short-term bank loan rate. All loans are subject to numerous conditions designed to ensure fair and equitable treatment of all participating funds. The interfund lending facility is subject to the oversight and periodic review by the Board. The fund had no interfund borrowing or lending activity during the period.
5. Board of Trustees:
The Board may include people who are officers and/or directors of the investment adviser or its affiliates. Federal securities law limits the percentage of such “interested persons” who may serve on a trust’s board, and the trust was in compliance with these limitations throughout the report period. The fund does not pay any interested or non-interested (independent trustees) trustees. The independent trustees are paid by the investment adviser. For information regarding the trustees, please refer to the Trustees and Officers table at the end of this report.
6. Borrowing from Banks:
During the period, the fund was a participant with other funds in the Fund Complex in a joint, syndicated, committed $850 million line of credit (the Syndicated Credit Facility), which matured on September 30, 2021. On September 30, 2021 the Syndicated Credit Facility was amended to run for a new 364 day period with the line of credit amount remaining unchanged, maturing on
Schwab S&P 500 Index Portfolio | Annual Report
Schwab S&P 500 Index Portfolio
Financial Notes (continued)
6. Borrowing from Banks (continued):
September 29, 2022. Under the terms of the Syndicated Credit Facility, in addition to the investment adviser paying the interest charged on any borrowings by the fund, the investment adviser paid a commitment fee of 0.15% per annum on the fund’s proportionate share of the unused portion of the Syndicated Credit Facility.
During the period, the fund was a participant with other funds in the Fund Complex, in a joint, unsecured, uncommitted $400 million line of credit (the Uncommitted Credit Facility), with State Street Bank and Trust Company, which matured on September 30, 2021. On September 30, 2021, the Uncommitted Credit Facility was amended to run for a new 364 day period with the new line of credit amount remaining unchanged, maturing on September 29, 2022. Under the terms of the Uncommitted Credit Facility, the investment adviser pays interest on the amount the fund borrows. There were no borrowings from either line of credit during the period.
The fund also has access to custodian overdraft facilities. The fund may have utilized the overdraft facility and incurred an interest expense, which is disclosed on the fund’s Statement of Operations, if any. The interest expense is determined based on a negotiated rate above the current Federal Funds Rate.
7. Purchases and Sales/Maturities of Investment Securities:
For the period ended December 31, 2021, purchases and sales/maturities of securities (excluding short-term obligations) were as follows:
PURCHASES
OF SECURITIES | SALES
OF SECURITIES |
| $391,164,192 | $152,254,217 |
8. Derivatives:
The fund entered into equity index futures contracts during the report period. The fund invested in futures contracts to equitize available cash. The value and variation margin for futures contracts held at December 31, 2021 are presented in the Portfolio Holdings and Statement of Assets and Liabilities, respectively. The net realized gains (losses) and change in unrealized appreciation (depreciation) on futures contracts are presented in the Statement of Operations. Refer to financial note 2(b) for the fund’s accounting policies with respect to futures contracts and financial note 3 for disclosures concerning the risks of investing in futures contracts. During the period ended December 31, 2021, the month-end average notional amounts of futures contracts held by the fund and the month-end average number of contracts held were as follows:
| Notional Amount | Number of Contracts |
| $6,432,357 | 30 |
| | |
9. Federal Income Taxes:
As of December 31, 2021, the tax basis cost of the fund’s investments and gross unrealized appreciation and depreciation were as follows:
| TAX COST | GROSS UNREALIZED
APPRECIATION | GROSS UNREALIZED
DEPRECIATION | NET UNREALIZED
APPRECIATION
(DEPRECIATION) |
| $779,299,562 | $708,863,687 | ($21,112,737) | $687,750,950 |
As of December 31, 2021, the components of distributable earnings on a tax basis were as follows:
UNDISTRIBUTED
ORDINARY
INCOME | UNDISTRIBUTED
LONG-TERM
CAPITAL GAINS | NET UNREALIZED
APPRECIATION
(DEPRECIATION)
ON INVESTMENTS | TOTAL |
| $19,218,062 | $6,667,916 | $687,750,950 | $713,636,928 |
Schwab S&P 500 Index Portfolio | Annual Report
Schwab S&P 500 Index Portfolio
Financial Notes (continued)
9. Federal Income Taxes (continued):
The primary difference between book basis and tax basis unrealized appreciation or unrealized depreciation of investments is the tax deferral of losses on wash sales and realization for tax purposes of unrealized gains (losses) on futures contracts. The tax cost of the fund’s investments, disclosed above, has been adjusted from the book amounts to reflect these unrealized appreciation or depreciation differences, as applicable.
For the fiscal year ended December 31, 2021, the fund had capital loss carryforwards utilized in the amount of $2,992,815.
The tax basis components of distributions paid during the current and prior fiscal years were as follows:
| CURRENT FISCAL YEAR END DISTRIBUTIONS | PRIOR FISCAL YEAR END DISTRIBUTIONS |
ORDINARY
INCOME | LONG-TERM
CAPITAL
GAINS | ORDINARY
INCOME | LONG-TERM
CAPITAL
GAINS |
| $15,017,859 | $— | $8,976,180 | $1,135,236 |
Distributions paid to shareholders are based on net investment income and net realized gains determined on a tax basis, which may differ from net investment income and net realized gains for financial reporting purposes. These differences reflect the differing character of certain income items and net realized gains and losses for financial statement and tax purposes, and may result in reclassification among certain capital accounts on the financial statements.
Permanent book and tax basis differences may result in reclassifications between components of net assets as required. The adjustments will have no impact on net assets or the results of operations.
As of December 31, 2021, management has reviewed the tax positions for open periods (for federal purposes, three years from the date of filing and for state purposes, four years from the date of filing) as applicable to the fund, and has determined that no provision for income tax is required in the fund’s financial statements. The fund recognizes interest and penalties, if any, related to unrecognized tax benefits as income tax expense in the Statement of Operations. During the fiscal year ended December 31, 2021, the fund did not incur any interest or penalties.
10. Subsequent Events:
Management has determined there are no subsequent events or transactions through the date the financial statements were issued that would have materially impacted the financial statements as presented.
Schwab S&P 500 Index Portfolio | Annual Report
Schwab S&P 500 Index Portfolio
Report of Independent Registered Public Accounting Firm
To the Board of Trustees of Schwab Annuity Portfolios and Shareholders of Schwab S&P 500 Index Portfolio
Opinion on the Financial Statements and Financial Highlights
We have audited the accompanying statement of assets and liabilities, including the portfolio holdings, of Schwab S&P 500 Index Portfolio (the “Fund”), one of the funds constituting Schwab Annuity Portfolios, as of December 31, 2021, the related statement of operations for the year then ended, the statement of changes in net assets and the financial highlights for each of the two years in the period then ended, and the related notes. In our opinion, the financial statements and financial highlights present fairly, in all material respects, the financial position of the Fund as of December 31, 2021, the results of its operations for the year then ended, and the changes in its net assets and the financial highlights for each of the two years in the period then ended in conformity with accounting principles generally accepted in the United States of America. The financial highlights for each of the three years in the period ended December 31, 2019 were audited by other auditors, whose report, dated February 18, 2020, expressed an unqualified opinion on such financial highlights.
Basis for Opinion
These financial statements and financial highlights are the responsibility of the Fund’s management. Our responsibility is to express an opinion on the Fund’s financial statements and financial highlights based on our audits. We are a public accounting firm registered with the Public Company Accounting Oversight Board (United States) (PCAOB) and are required to be independent with respect to the Fund in accordance with the U.S. federal securities laws and the applicable rules and regulations of the Securities and Exchange Commission and the PCAOB.
We conducted our audits in accordance with the standards of the PCAOB. Those standards require that we plan and perform the audit to obtain reasonable assurance about whether the financial statements and financial highlights are free of material misstatement, whether due to error or fraud. The Fund is not required to have, nor were we engaged to perform, an audit of its internal control over financial reporting. As part of our audit, we are required to obtain an understanding of internal control over financial reporting but not for the purpose of expressing an opinion on the effectiveness of the Fund’s internal control over financial reporting. Accordingly, we express no such opinion.
Our audits included performing procedures to assess the risks of material misstatement of the financial statements and financial highlights, whether due to error or fraud, and performing procedures that respond to those risks. Such procedures included examining, on a test basis, evidence regarding the amounts and disclosures in the financial statements and financial highlights. Our audits also included evaluating the accounting principles used and significant estimates made by management, as well as evaluating the overall presentation of the financial statements and financial highlights. Our procedures included confirmation of securities owned as of December 31, 2021, by correspondence with the custodian and brokers; when replies were not received from brokers, we performed other auditing procedures. We believe that our audits provide a reasonable basis for our opinion.
Deloitte & Touche LLP
Denver, Colorado
February 17, 2022
We have served as the auditor of one or more investment companies in the Schwab Funds Complex since 2020.
Schwab S&P 500 Index Portfolio | Annual Report
Schwab S&P 500 Index Portfolio
Other Federal Tax Information (unaudited)
For corporate shareholders, 83.48% of the fund’s dividend distributions paid during the fiscal year ended December 31, 2021, qualify for the corporate dividends received deduction.
Schwab S&P 500 Index Portfolio | Annual Report
Schwab S&P 500 Index Portfolio
Liquidity Risk Management Program (unaudited)
The Fund has adopted and implemented a liquidity risk management program (the “program”) as required by Rule 22e-4 under the Investment Company Act of 1940, as amended. The Fund’s Board of Trustees (the “Board”) has designated the Fund’s investment adviser, Charles Schwab Investment Management, Inc., dba Schwab Asset Management, as the administrator of the program. Personnel of the investment adviser or its affiliates conduct the day-to-day operation of the program.
Under the program, the investment adviser manages a Fund’s liquidity risk, which is the risk that the Fund could not meet shareholder redemption requests without significant dilution of remaining shareholders’ interests in the Fund. The program is reasonably designed to assess and manage a Fund’s liquidity risk, taking into consideration the Fund’s investment strategy and the liquidity of its portfolio investments during normal and reasonably foreseeable stressed conditions; its historical redemption history and shareholder concentrations; and its cash holdings and access to other funding sources, including the custodian overdraft facility and lines of credit. The investment adviser’s process of determining the degree of liquidity of each Fund’s investments is supported by third-party liquidity assessment vendors.
The Fund’s Board reviewed a report at its meeting held on September 20, 2021 prepared by the investment adviser regarding the operation and effectiveness of the program for the period June 1, 2020, through May 31, 2021, which included individual Fund liquidity metrics. No significant liquidity events impacting the Fund were noted in the report. In addition, the investment adviser provided its assessment that the program had been operating effectively in managing the Fund’s liquidity risk.
Schwab S&P 500 Index Portfolio | Annual Report
Schwab S&P 500 Index Portfolio
Trustees and Officers
The tables below give information about the trustees and officers of Schwab Annuity Portfolios, which includes the fund covered in this report. The “Fund Complex” includes The Charles Schwab Family of Funds, Schwab Capital Trust, Schwab Investments, Schwab Annuity Portfolios, Schwab Strategic Trust and Laudus Trust. The Fund Complex includes 103 funds.
The address for all trustees and officers is 211 Main Street, San Francisco, CA 94105. You can find more information about the trustees and officers in the fund’s Statement of Additional Information, which is available free by calling 1-877-824-5615.
| Independent Trustees |
Name, Year of Birth, and
Position(s) with the trust
(Terms of office, and
length of Time Served1) | Principal Occupations
During the Past Five Years | Number of
Portfolios in
Fund Complex
Overseen by
the Trustee | Other Directorships |
Robert W. Burns
1959
Trustee
(Trustee of Schwab Strategic Trust since 2009; The Charles Schwab Family of Funds, Schwab Investments, Schwab Capital Trust, Schwab Annuity Portfolios and Laudus Trust since 2016) | Retired/Private Investor (Jan. 2009 – present). Formerly, Managing Director, Pacific Investment Management Company, LLC (PIMCO) (investment management firm) and President, PIMCO Funds. | 103 | None |
Nancy F. Heller
1956
Trustee
(Trustee of The Charles Schwab Family of Funds, Schwab Investments, Schwab Capital Trust, Schwab Annuity Portfolios, Schwab Strategic Trust and Laudus Trust since 2018) | Retired. President and Chairman (2014 – 2016), TIAA Charitable (financial services); Senior Managing Director (2003 – 2016), TIAA (financial services). | 103 | None |
David L. Mahoney
1954
Trustee
(Trustee of The Charles Schwab Family of Funds, Schwab Investments, Schwab Capital Trust, Schwab Annuity Portfolios and Laudus Trust since 2011; Schwab Strategic Trust since 2016) | Private Investor. | 103 | Director (2004 – present), Corcept Therapeutics Incorporated
Director (2009 – 2021), Adamas Pharmaceuticals, Inc.
Director (2003 – 2019), Symantec Corporation |
Jane P. Moncreiff
1961
Trustee
(Trustee of The Charles Schwab Family of Funds, Schwab Investments, Schwab Capital Trust, Schwab Annuity Portfolios, Schwab Strategic Trust and Laudus Trust since 2019) | Consultant (2018 – present), Fulham Advisers LLC (management consulting); Chief Investment Officer (2009 – 2017), CareGroup Healthcare System, Inc. (healthcare). | 103 | None |
Kiran M. Patel
1948
Trustee
(Trustee of The Charles Schwab Family of Funds, Schwab Investments, Schwab Capital Trust, Schwab Annuity Portfolios and Laudus Trust since 2011; Schwab Strategic Trust since 2016) | Retired. Executive Vice President and General Manager of Small Business Group (Dec. 2008 – Sept. 2013), Intuit, Inc. (financial software and services firm for consumers and small businesses). | 103 | Director (2008 – present), KLA-Tencor Corporation |
Schwab S&P 500 Index Portfolio | Annual Report
Schwab S&P 500 Index Portfolio
| Independent Trustees (continued) |
Name, Year of Birth, and
Position(s) with the trust
(Terms of office, and
length of Time Served1) | Principal Occupations
During the Past Five Years | Number of
Portfolios in
Fund Complex
Overseen by
the Trustee | Other Directorships |
Kimberly S. Patmore
1956
Trustee
(Trustee of The Charles Schwab Family of Funds, Schwab Investments, Schwab Capital Trust, Schwab Annuity Portfolios, Schwab Strategic Trust and Laudus Trust since 2016) | Consultant (2008 – present), Patmore Management Consulting (management consulting). | 103 | None |
J. Derek Penn
1957
Trustee
(Trustee of The Charles Schwab Family of Funds, Schwab Investments, Schwab Capital Trust, Schwab Annuity Portfolios, Schwab Strategic Trust and Laudus Trust since 2021) | Head of Equity Sales and Trading (2006 – 2018), BNY Mellon (financial services). | 103 | None |
| Interested Trustees |
Name, Year of Birth, and
Position(s) with the trust
(Terms of office, and
length of Time Served1) | Principal Occupations
During the Past Five Years | Number of
Portfolios in
Fund Complex
Overseen by
the Trustee | Other Directorships |
Walter W. Bettinger II2
1960
Chairman and Trustee
(Trustee of The Charles Schwab Family of Funds, Schwab Investments, Schwab Capital Trust and Schwab Annuity Portfolios since 2008; Schwab Strategic Trust since 2009; Laudus Trust since 2010) | Director and Chief Executive Officer (Oct. 2008 – present) and President (Oct. 2008 – Oct. 2021), The Charles Schwab Corporation; President and Chief Executive Officer (Oct. 2008 – Oct. 2021) and Director (May 2008 – Oct. 2021), Charles Schwab & Co., Inc.; Director (Apr. 2006 – present), Charles Schwab Bank, SSB; Director (Nov. 2017 – present), Charles Schwab Premier Bank, SSB; Director (July 2019 – present), Charles Schwab Trust Bank; Director (May 2008 – present) and President and Chief Executive Officer (Aug. 2017 – present), Schwab Holdings, Inc.; Director (Oct. 2020 – present), TD Ameritrade Holding Corporation; Director (July 2016 – Oct. 2021), Charles Schwab Investment Management, Inc. | 103 | Director (2008 – present), The Charles Schwab Corporation |
Joseph R. Martinetto2
1962
Trustee
(Trustee of The Charles Schwab Family of Funds, Schwab Investments, Schwab Capital Trust, Schwab Annuity Portfolios, Schwab Strategic Trust and Laudus Trust since 2016) | Chief Operating Officer (Feb. 2018 – present) and Senior Executive Vice President (July 2015 – Feb. 2018), The Charles Schwab Corporation; Senior Executive Vice President (July 2015 – present), Charles Schwab & Co., Inc.; Chief Financial Officer (July 2015 – Aug. 2017) and Executive Vice President and Chief Financial Officer (May 2007 – July 2015), The Charles Schwab Corporation and Charles Schwab & Co., Inc.; Director (May 2007 – present), Charles Schwab & Co., Inc.; Director (Apr. 2010 – present) and Chief Executive Officer (July 2013 – Apr. 2015), Charles Schwab Bank, SSB; Director (Nov. 2017 – present), Charles Schwab Premier Bank, SSB; Director (May 2007 – present), Chief Financial Officer (May 2007 – Aug. 2017), Senior Executive Vice President (Feb. 2016 – present), and Executive Vice President (May 2007 – Feb. 2016), Schwab Holdings, Inc.; Director (Oct. 2020 – present), TD Ameritrade Holding Corporation. | 103 | None |
Schwab S&P 500 Index Portfolio | Annual Report
Schwab S&P 500 Index Portfolio
| Officers of the Trust |
Name, Year of Birth, and Position(s) with the trust
(Terms of office, and length of Time Served3) | Principal Occupations During the Past Five Years |
Jonathan de St. Paer
1973
President and Chief Executive Officer
(Officer of The Charles Schwab Family of Funds, Schwab Investments, Schwab Capital Trust, Schwab Annuity Portfolios, Schwab Strategic Trust and Laudus Trust since 2018) | Director (Apr. 2019 – present), President (Oct. 2018 – present), Chief Operating Officer (Jan. 2020 – present), and Chief Executive Officer (Apr. 2019 – Nov. 2019), Charles Schwab Investment Management, Inc.; Senior Vice President (June 2020 – present) and Chief Operating Officer (Jan. 2020 – present), Charles Schwab Investment Advisory, Inc.; Chief Executive Officer (Apr. 2019 – present), President (Nov. 2018 – present) and Trustee (Apr. 2019 – Dec. 2020), Schwab Funds, Laudus Trust and Schwab ETFs; Director (Apr. 2019 – present), Charles Schwab Worldwide Funds plc and Charles Schwab Asset Management (Ireland) Limited; Senior Vice President (Apr. 2019 – present), Senior Vice President – Strategy and Product Development (CSIM) (Jan. 2014 – Mar. 2019), and Vice President (Jan. 2009 – Dec. 2013), Charles Schwab & Co., Inc. |
Mark Fischer
1970
Treasurer, Chief Financial Officer and Chief Operating Officer
(Officer of The Charles Schwab Family of Funds, Schwab Investments, Schwab Capital Trust, Schwab Annuity Portfolios, Schwab Strategic Trust and Laudus Trust since 2013) | Treasurer and Chief Financial Officer (Jan. 2016 – present) and Chief Operating Officer (Dec. 2020 – present), Schwab Funds, Laudus Trust and Schwab ETFs; Assistant Treasurer (Dec. 2013 – Dec. 2015), Schwab Funds and Laudus Trust; Assistant Treasurer (Nov. 2013 – Dec. 2015), Schwab ETFs; Chief Financial Officer (Mar. 2020 – present) and Vice President (Oct. 2013 – present), Charles Schwab Investment Management, Inc.; Executive Director (Apr. 2011 – Sept. 2013), J.P. Morgan Investor Services; Assistant Treasurer (May 2005 – Mar. 2011), Massachusetts Financial Service Investment Management. |
Omar Aguilar
1970
Vice President and Chief Investment Officer
(Officer of The Charles Schwab Family of Funds, Schwab Investments, Schwab Capital Trust, Schwab Annuity Portfolios, Schwab Strategic Trust and Laudus Trust since 2011) | Chief Executive Officer (Jan. 2022 – present) and Chief Investment Officer (Apr. 2011 – present), Senior Vice President (Apr. 2011 – Dec. 2021), Charles Schwab Investment Management, Inc.; Vice President and Chief Investment Officer (June 2011 – present), Schwab Funds, Laudus Trust and Schwab ETFs; Head of the Portfolio Management Group and Vice President of Portfolio Management (May 2009 – Apr. 2011), Financial Engines, Inc. (investment management firm); Head of Quantitative Equity (July 2004 – Jan. 2009), ING Investment Management. |
Brett Wander
1961
Vice President and Chief Investment Officer
(Officer of The Charles Schwab Family of Funds, Schwab Investments, Schwab Capital Trust, Schwab Annuity Portfolios, Schwab Strategic Trust and Laudus Trust since 2011) | Senior Vice President and Chief Investment Officer (Apr. 2011 – present), Charles Schwab Investment Management, Inc.; Vice President and Chief Investment Officer (June 2011 – present), Schwab Funds, Laudus Trust and Schwab ETFs; Senior Managing Director and Global Head of Active Fixed-Income Strategies (Jan. 2008 – Oct. 2010), State Street Global Advisors; Director of Alpha Strategies (Apr. 2006 – Jan. 2008), Loomis, Sayles & Company (investment management firm). |
William P. McMahon, Jr.
1972
Vice President and Chief Investment Officer
(Officer of The Charles Schwab Family of Funds, Schwab Investments, Schwab Capital Trust, Schwab Annuity Portfolios, Schwab Strategic Trust and Laudus Trust since 2021) | Senior Vice President and Chief Investment Officer (Jan. 2020 – present), Charles Schwab Investment Management, Inc.; Vice President and Chief Investment Officer (June 2021 – present), Schwab Funds, Laudus Trust and Schwab ETFs; Senior Vice President and Chief Investment Officer – ThomasPartners Strategies (Apr. 2018 – Dec. 2019), Charles Schwab Investment Advisory, Inc.; Senior Vice President and Chief Investment Officer (May 2001 – Apr. 2018), ThomasPartners, Inc. |
Catherine MacGregor
1964
Chief Legal Officer and Secretary, Schwab Funds and Schwab ETFs
Chief Legal Officer, Vice President and Clerk, Laudus Trust
(Officer of The Charles Schwab Family of Funds, Schwab Investments, Schwab Capital Trust, Schwab Annuity Portfolios and Laudus Trust since 2005; Schwab Strategic Trust since 2009) | Vice President (July 2005 – present), Charles Schwab & Co., Inc.; Vice President (Sept. 2005 – present), Charles Schwab Investment Management, Inc.; Vice President (Dec. 2005 – present) and Chief Legal Officer and Clerk (Mar. 2007 – present), Laudus Trust; Chief Legal Officer and Secretary (Oct. 2021 – present), Vice President (Nov. 2005 – Oct. 2021) and Assistant Secretary (June 2007 – Oct. 2021), Schwab Funds; Chief Legal Officer and Secretary (Oct. 2021 – present), Vice President and Assistant Secretary (Oct. 2009 – Oct. 2021), Schwab ETFs. |
| 1 | Each Trustee shall hold office until the election and qualification of his or her successor, or until he or she dies, resigns or is removed. The retirement policy requires that each independent trustee retire by December 31 of the year in which the Trustee turns 74 or the Trustee’s twentieth year of service as an independent trustee on any trust in the Fund Complex, whichever occurs first. |
| 2 | Mr. Bettinger and Mr. Martinetto are Interested Trustees. Mr. Bettinger is an Interested Trustee because he owns stock of The Charles Schwab Corporation (CSC), the parent company of Charles Schwab Investment Management, Inc., the investment adviser for the trusts in the Fund Complex, and is an employee of Charles Schwab & Co., Inc. (Schwab), the principal underwriter for The Charles Schwab Family of Funds, Schwab Investments, Schwab Capital Trust, Schwab Annuity Portfolios and Laudus Trust. Mr. Martinetto is an Interested Trustee because he owns stock of CSC and is an employee and director of Schwab. |
| 3 | The President, Treasurer and Secretary/Clerk hold office until their respective successors are chosen and qualified or until he or she sooner dies, resigns, is removed or becomes disqualified. Each of the other officers serves at the pleasure of the Board. |
Schwab S&P 500 Index Portfolio | Annual Report
Annual Report | December 31, 2021
Schwab VIT Balanced Portfolio
Proxy Voting Policies, Procedures and Results
A description of the proxy voting policies and procedures used to determine how to vote proxies on behalf of the funds is available without charge, upon request, by visiting the Schwab Fund’s website at www.schwabassetmanagement.com/schwabfunds_prospectus, the SEC’s website at www.sec.gov, or by contacting Schwab Funds at 1-877-824-5615.
Information regarding how a fund voted proxies relating to portfolio securities during the most recent twelve-month period ended June 30 is available, without charge, by visiting Schwab’s website at www.schwabassetmanagement.com/schwabfunds_prospectus or the SEC’s website at www.sec.gov.
Investment Adviser: Charles Schwab Investment Management, Inc., dba Schwab Asset ManagementTM
Schwab VIT Balanced Portfolio
The Investment Environment
For the 12-month reporting period ended December 31, 2021, global equities generated mostly positive returns, particularly in the United States, where several key equity market indices ended the reporting period just off record highs. Developed international equity markets were less robust but still positive, while emerging markets and most U.S. fixed-income markets lost ground. Despite persisting COVID-19 pandemic-driven stresses on the global economy and the emergence and rapid spread of the Delta variant during the summer and the Omicron variant in the late fall, equity markets rose through most of the period on strong earnings, ongoing fiscal stimulus measures, and optimism related to increased COVID-19 vaccination rates. Amid growing evidence of a slowing global economy and rising inflation, stocks did weaken somewhat in September and again in late November and early December but quickly regained their momentum. U.S. and developed international equity markets maintained their strength, emerging markets declined, demand for bonds waned, and bond yields rose as prices sank. (Bond yields and bond prices typically move in opposite directions.) Over the reporting period, the U.S. dollar strengthened against a basket of international currencies, generally decreasing the returns on overseas investments in U.S. dollar terms. For the reporting period, the S&P 500® Index, a bellwether for the overall U.S. stock market, returned 28.71%. Outside the United States, the MSCI EAFE® Index (Net)*, a broad measure of developed international equity performance, returned 11.26%. Emerging market equities were weaker, with the MSCI Emerging Markets Index (Net)* returning -2.54%. Fixed-income markets were also weaker, with the Bloomberg US Aggregate Bond Index returning -1.54% and the FTSE non-US Dollar World Government Bond Index returning -9.68%.
Bolstered by the extensive emergency rescue and fiscal stimulus measures passed by the U.S. Congress and U.S. Federal Reserve (Fed) in March 2020, the U.S. economy began to recover from the dramatic impact of the COVID-19 pandemic beginning in the third quarter of 2020. U.S. gross domestic product (GDP) rose at an annualized rate of 6.4% for the first quarter of 2021 and 6.7% for the second quarter of 2021, before falling back to 2.0% for the third quarter of 2021 amid fading government stimuli, persistent inflation, and new surges in COVID-19 cases. Unemployment, which skyrocketed in April 2020, fell over the reporting period, and ended at its lowest level since February 2020. Inflation, which had remained well below the Fed’s traditional 2% target until it jumped in March 2021,
Asset Class Performance Comparison % returns during the 12 months ended December 31, 2021
Index figures assume dividends and distributions were reinvested. Index figures do not include trading and management costs, which would lower performance. Indices are unmanaged and cannot be invested in directly. Performance results less than one year are not annualized. Past performance is not an indication of future results.
For index definitions, please see the Glossary.
Data source: Index provider websites and Schwab Asset Management.
Nothing in this report represents a recommendation of a security by the investment adviser.
Management views may have changed since the report date.
| * | The net version of the index reflects reinvested dividends net of withholding taxes, but reflects no deductions for expenses or other taxes. |
Schwab VIT Balanced Portfolio | Annual Report
Schwab VIT Balanced Portfolio
The Investment Environment (continued)
continued to rise over the reporting period, largely due to imbalances in the labor market, supply chain bottlenecks, and higher energy costs.
Outside the United States, global economies also displayed resilience but were somewhat more constrained amid continuing struggles against COVID-19 and the emergence and spread of the Delta and Omicron variants. Oil prices rebounded over much of the reporting period, except for dips in July and August and November, on growing demand and reduced production. In the eurozone, GDP growth turned positive for the second and third quarters of 2021, following two previous quarters of contraction. In the United Kingdom, which was particularly hard-hit by the COVID-19 pandemic, GDP growth was negative for the first quarter of 2021, turned strongly positive for the second quarter of 2021, then fell back to just slightly positive for the third quarter of 2021. Japan’s economy vacillated between contraction in the first and third quarters of 2021 and a small gain in the second quarter of 2021 on a resurgence of COVID-19 cases and persistent supply chain disruptions. Among emerging markets, China’s GDP growth rate accelerated sharply for the first quarter of 2021 before easing for the subsequent two quarters, albeit remaining positive, in part because of the political landscape and an emphasis on domestic consumption over globalization. India, after plunging into one of the worst recessions of any major economy in 2020, posted a sharp jump in GDP growth for the second quarter of 2021 before falling back for the third quarter of 2021.
For the most part, central banks around the world, maintained the low—and for some international central banks, negative—interest rates instituted prior to, and in response to, the COVID-19 pandemic. In the United States, the Fed reiterated several times during the reporting period its intention to continue its support of the economy for as long as needed to achieve a full recovery. The Fed maintained the federal funds rate in a range of 0.00% to 0.25% throughout the reporting period. However, as inflation continued to rise and indicators of economic activity and employment continued to strengthen, the Fed began scaling back its bond-buying program in November 2021 citing significant progress made on its twin goals of maximum employment and price stability. The Fed subsequently accelerated its wind-down in December 2021 with expectations to end it altogether by March 2022. Fed officials also signaled that interest rates could begin to rise sooner in 2022 than previously anticipated, although the Fed cautioned that the path of the economy continues to depend on the course of the COVID-19 pandemic. In developed international markets, most central banks were similarly accommodative while acknowledging economic improvements and, in some cases, changes in monetary policy. The European Central Bank held its interest rate at 0.00%, unchanged since March 2016. However, in December 2021, it announced that in the first quarter of 2022 it would reduce the pace of its asset purchase program that it had instituted to help counter the serious risks posed by the COVID-19 pandemic. The Bank of Japan upheld its short-term interest rate target of -0.1%, also unchanged since 2016, and also announced its plans to taper its corporate debt buying to pre-pandemic levels. In December 2021, the Bank of England raised its key official bank rate from 0.1% to 0.25%, its first rate hike since the onset of the COVID-19 pandemic, citing inflation pressures. Emerging markets were mixed. China cut its interest rate by 0.05% in December. Indonesia and India maintained low policy rates implemented in 2020 and early 2021. Central banks in Mexico, Brazil, Russia, and Pakistan raised their rates, citing a stronger-than-expected recovery or to counteract the impacts of inflation.
After languishing at historically low levels since the onset of the COVID-19 pandemic, U.S. bond yields climbed steadily through the first quarter of the reporting period as COVID-19 vaccine distribution ramped up rapidly and investors anticipated an accelerating economic recovery. From April through July, yields drifted lower on tepid employment reports and growing inflation concerns before gradually, albeit non-linearly, rising again by the end of the reporting period. The yield on the 10-year U.S. Treasury began the reporting period at 0.93%, hit a reporting-period high of 1.74% in March, and fell back to end the reporting period at 1.52%. Short-term rates, which remained near historic lows, fell further, with the yield on the three-month U.S. Treasury dropping to 0.06% from 0.09% over the reporting period. Outside the U.S., bond yields generally remained low.
Schwab VIT Balanced Portfolio | Annual Report
Schwab VIT Balanced Portfolio
 | Zifan Tang, Ph.D., CFA, Senior Portfolio Manager, is responsible for the co-management of the fund. Prior to joining Schwab in 2012, Ms. Tang was a product manager at Thomson Reuters and from 1997 to 2009 worked as a portfolio manager at Barclays Global Investors (now known as BlackRock). |
 | Patrick Kwok, CFA, Portfolio Manager, is responsible for the co-management of the fund. Previously, Mr. Kwok served as an associate portfolio manager from 2012 to 2016. Prior to that, he worked as a fund administration manager, where he was responsible for oversight of sub-advisers, trading, cash management, and fund administration supporting the Charles Schwab Trust Bank Collective Investment Trusts and multi-asset Schwab Funds. Prior to joining Schwab Asset Management in 2008, Mr. Kwok spent two years as an asset operations specialist at Charles Schwab Trust Company. He also worked for one year at State Street Bank & Trust as a portfolio accountant and pricing specialist. |
Schwab VIT Balanced Portfolio | Annual Report
Schwab VIT Balanced Portfolio as of December 31, 2021
The Schwab VIT Balanced Portfolio (the fund) seeks long-term capital appreciation and income. To pursue its goal, the fund aims to provide diversification across major asset classes, including domestic equity securities, international equity securities, real assets, fixed-income securities, and money market investments, as well as diversification across a range of sub-asset classes within the major asset classes.
The fund is considered a “fund-of-funds” in that it gains exposure to these asset classes by primarily investing in affiliated exchange-traded funds (ETFs) from Schwab Funds. The fund may also invest in affiliated mutual funds from Schwab Funds and Laudus Funds and unaffiliated third-party ETFs and mutual funds. The fund normally will invest, including its investments in the underlying funds, at least 25% of its assets in equity securities and at least 25% of its assets in fixed-income securities, which may include bonds, cash equivalents, money market funds and money market investments. As of the fund’s most recent prospectus, the target asset class allocation ranges are 38-68% in fixed-income securities, and 32-62% in equity securities.
Market Highlights. For the 12-month reporting period ended December 31, 2021, global equities generated mostly positive returns, particularly in the United States, where several key equity market indices ended the reporting period just off record highs. Developed international equity markets were less robust but still positive, while emerging markets and most U.S. fixed-income markets lost ground. Despite persisting COVID-19 pandemic-driven stresses on the global economy and the emergence and rapid spread of the Delta variant during the summer and the Omicron variant in the late fall, equity markets rose through most of the period on strong earnings, ongoing fiscal stimulus measures, and optimism related to increased COVID-19 vaccination rates. Amid growing evidence of a slowing global economy and rising inflation, stocks did weaken somewhat in September and again in late November and early December but quickly regained their momentum. U.S. and developed international equity markets maintained their strength, emerging markets declined, demand for bonds waned, and bond yields rose as prices sank. (Bond yields and bond prices typically move in opposite directions.) Over the reporting period, the U.S. dollar strengthened against a basket of international currencies, generally decreasing the returns on overseas investments in U.S. dollar terms.
Performance. For the 12-month reporting period ended December 31, 2021, the fund returned 8.19%. The Dow Jones U.S. Total Stock Market Index and the Bloomberg US Aggregate Bond Index, reflecting broad-based U.S. stock and bond market performance, returned 25.66% and -1.54%, respectively. The fund’s internally calculated comparative index, the VIT Balanced Composite Index (the composite index), returned 8.79%.
Positioning and Strategies. The fund’s allocations were broadly in line with those of the composite index.
The fund’s U.S. equity exposure was the largest contributor to the total return of the fund. The Schwab U.S. Large-Cap ETF was the largest contributor to the total return of the fund, returning approximately 27% for the reporting period, generally tracking its comparative index component. The Schwab U.S. Small-Cap ETF also contributed to the total return of the fund, returning approximately 16% for the reporting period and generally tracking its comparative index component.
The fund’s real estate exposure also contributed to the total return of the fund, with the Schwab U.S. REIT ETF returning approximately 41% for the reporting period.
The fund’s international equity exposure also contributed to the total return of the fund. The Schwab International Equity ETF, representing the fund’s developed international markets exposure, returned approximately 11% for the reporting period and the Schwab International Small-Cap Equity ETF, representing the fund’s international small-cap exposure, returned approximately 12% for the reporting period. The Schwab Emerging Markets Equity ETF, representing the fund’s emerging markets exposure, detracted slightly from the fund’s total return, returning approximately -1% for the reporting period. On a relative basis, the three international equity funds generally tracked their comparative index components.
The fund’s fixed-income exposure detracted from the total return of the fund. The Schwab U.S. Aggregate Bond ETF was the largest detractor from the total return of the fund, returning approximately -2% for the reporting period and generally tracking its comparative index component. The Schwab Short-Term U.S. Treasury ETF also detracted from the total return of the fund, returning approximately -1% for the reporting period and also generally tracking its comparative index component. The Schwab U.S. TIPS ETF contributed to the total return of the fund, returning approximately 6% for the reporting period and generally tracking its comparative index component.
Management views and portfolio holdings may have changed since the report date.
Schwab VIT Balanced Portfolio | Annual Report
Schwab VIT Balanced Portfolio
Performance and Fund Facts as of December 31, 2021
The performance data quoted represents past performance. Past performance does not guarantee future results. Investment returns and principal value will fluctuate so that an investor’s shares may be worth more or less than their original cost. Current performance may be lower or higher than performance data quoted. To obtain performance information current to the most recent month end, please visit www.schwabassetmanagement.com/schwabfunds_prospectus.
Performance of Hypothetical $10,000 Investment (July 25, 2012 – December 31, 2021)1
Average Annual Total Returns1
| Fund and Inception Date | 1 Year | 5 Years | Since Inception |
| Fund: Schwab VIT Balanced Portfolio (07/25/12) | 8.19% | 7.01% | 5.68% |
| S&P 500® Index | 28.71% | 18.47% | 16.70% |
| Bloomberg US Aggregate Bond Index | -1.54% | 3.57% | 2.66% |
| VIT Balanced Composite Index | 8.79% | 7.61% | 6.37% |
| Fund Category: Morningstar Allocation – 30% to 50% Equity2 | 8.50% | 7.77% | N/A |
| Fund Expense Ratio3: 0.62% |
All total return figures on this page assume dividends and distributions were reinvested. Index figures do not include trading and management costs, which would lower performance. Indices are unmanaged and cannot be invested in directly. Performance results less than one year are not annualized.
The components that make up the composite index may vary over time. For index definitions, please see the Glossary.
| 1 | Fund expenses may have been partially absorbed by the investment adviser and its affiliates. Without these reductions, the fund’s returns would have been lower. Fund performance does not reflect the additional fees and expenses imposed by the insurance company under the variable insurance product contract. If those contract fees and expenses were included, the performance would be less than that shown. Please refer to the variable insurance product prospectus for a complete listing of these expenses. |
| 2 | Source for category information: Morningstar, Inc. The Morningstar Category return represents all active and index mutual funds within the category as of the report date. |
| 3 | As stated in the prospectus. Includes 0.08% of acquired fund fees and expenses (AFFE), which are indirect expenses incurred by the fund through its investments in the underlying funds. Reflects the total annual operating expenses without contractual fee waivers. For actual expense ratios during the period, not including AFFE, refer to the Financial Highlights section of the financial statements. |
Schwab VIT Balanced Portfolio | Annual Report
Schwab VIT Balanced Portfolio
Performance and Fund Facts as of December 31, 2021 (continued)
| Number of Holdings | 12 |
| Portfolio Turnover Rate | 13% |
Asset Class Weightings % of Investments1,2
Top Holdings % of Net Assets1,3,4
Portfolio holdings may have changed since the report date.
| 1 | The fund intends to primarily invest in affiliated Schwab ETFs and may also invest in affiliated Schwab Funds and Laudus Funds and unaffiliated third-party ETFs and mutual funds (all such ETFs and mutual funds referred to as “underlying funds”). The fund may also invest directly in equity, fixed-income, or other securities or investments, as appropriate, consistent with its investment objectives, strategies, and policies. |
| 2 | The percentage may differ from the Portfolio Holdings because the above calculation is based on a percentage of total investments, whereas the calculation in the Portfolio Holdings is based on a percentage of net assets. |
| 3 | This list is not a recommendation of any security by the investment adviser. |
| 4 | The holdings listed exclude any temporary liquidity investments. |
Schwab VIT Balanced Portfolio | Annual Report
Schwab VIT Balanced Portfolio
Fund Expenses (Unaudited)
Examples for a $1,000 Investment
As a fund shareholder, you may incur two types of costs: (1) transaction costs; and (2) ongoing costs, including management fees, transfer agent fees, and other fund expenses.
The expense examples below are intended to help you understand your ongoing cost (in dollars) of investing in the fund and to compare this cost with the ongoing cost of investing in other mutual funds. These examples are based on an investment of $1,000 invested for six months beginning July 1, 2021 and held through December 31, 2021.
The Actual Return line in the table below provides information about actual account values and actual expenses. You may use this information, together with the amount you invested, to estimate the expenses that you paid over the period. To do so, simply divide your account value by $1,000 (for example, an $8,600 account value ÷ $1,000 = 8.6), then multiply the result by the number given for the fund under the heading entitled “Expenses Paid During Period.”
The Hypothetical Return line in the table below provides information about hypothetical account values and hypothetical expenses based on the fund’s actual expense ratio and an assumed return of 5% per year before expenses. Because the return used is not an actual return, it may not be used to estimate the actual ending account value or expenses you paid for the period.
You may use this information to compare the ongoing costs of investing in the fund and other funds. To do so, compare this 5% hypothetical example with the 5% hypothetical examples that appear in the shareholder reports of the other funds.
Please note that the expenses shown in the table are meant to highlight your ongoing costs only, and do not reflect any transactional costs. Therefore, the hypothetical return lines of the table are useful in comparing ongoing costs only, and will not help you determine the relative total costs of owning different funds. In addition, if these transactional costs were included, your costs would have been higher.
| | EXPENSE RATIO
(ANNUALIZED)1,2 | EFFECTIVE
EXPENSE RATIO
(ANNUALIZED)3,4 | BEGINNING
ACCOUNT VALUE
AT 7/1/21 | ENDING
ACCOUNT VALUE
(NET OF EXPENSES)
AT 12/31/212 | EXPENSES PAID
DURING PERIOD
7/1/21-12/31/212,5 | EFFECTIVE
EXPENSES PAID
DURING PERIOD
7/1/21-12/31/214,5 |
| Schwab VIT Balanced Portfolio | | | | | | |
| Actual Return | 0.53% | 0.58% | $1,000.00 | $1,023.90 | $2.70 | $2.96 |
| Hypothetical 5% Return | 0.53% | 0.58% | $1,000.00 | $1,022.53 | $2.70 | $2.96 |
| 1 | Based on the most recent six-month expense ratio; may differ from the expense ratio provided in the Financial Highlights. |
| 2 | Excludes acquired fund fees and expenses, which are indirect expenses incurred by the fund through its investments in underlying funds. |
| 3 | Based on the most recent six-month acquired fund fees and expenses and the expense ratio; may differ from the acquired fund fees and expenses and the expense ratio in the prospectus. |
| 4 | Includes acquired fund fees and expenses, which are indirect expenses incurred by the fund through its investments in underlying funds. |
| 5 | Expenses for the fund are equal to its annualized expense ratio, multiplied by the average account value over the period, multiplied by 184 days of the period, and divided by the 365 days of the fiscal year. |
Schwab VIT Balanced Portfolio | Annual Report
Schwab VIT Balanced Portfolio
Financial Statements
FINANCIAL HIGHLIGHTS
| | 1/1/21–
12/31/21 | 1/1/20–
12/31/20 | 1/1/19–
12/31/19 | 1/1/18–
12/31/18 | 1/1/17–
12/31/17 | |
| Per-Share Data |
| Net asset value at beginning of period | $14.04 | $13.25 | $11.82 | $12.58 | $11.66 | |
| Income (loss) from investment operations: | | | | | | |
| Net investment income (loss)1 | 0.21 | 0.20 | 0.25 | 0.23 | 0.18 | |
| Net realized and unrealized gains (losses) | 0.93 | 0.86 | 1.42 | (0.80) | 0.98 | |
| Total from investment operations | 1.14 | 1.06 | 1.67 | (0.57) | 1.16 | |
| Less distributions: | | | | | | |
| Distributions from net investment income | (0.19) | (0.24) | (0.22) | (0.17) | (0.15) | |
| Distributions from net realized gains | (0.00) 2 | (0.03) | (0.02) | (0.02) | (0.09) | |
| Total distributions | (0.19) | (0.27) | (0.24) | (0.19) | (0.24) | |
| Net asset value at end of period | $14.99 | $14.04 | $13.25 | $11.82 | $12.58 | |
| Total return | 8.19% | 8.23% | 14.24% | (4.63%) | 10.00% | |
| Ratios/Supplemental Data |
| Ratios to average net assets: | | | | | | |
| Net operating expenses3 | 0.52% | 0.54% | 0.56% | 0.55% | 0.55% | |
| Gross operating expenses3 | 0.52% | 0.54% | 0.56% | 0.55% | 0.55% | |
| Net investment income (loss) | 1.42% | 1.53% | 1.97% | 1.87% | 1.50% | |
| Portfolio turnover rate | 13% | 38% | 15% | 9% | 9% | |
| Net assets, end of period (x 1,000,000) | $93 | $84 | $76 | $66 | $64 | |
| 1 | Calculated based on the average shares outstanding during the period. |
| 2 | Per-share amount was less than $0.005. |
| 3 | Ratio excludes acquired fund fees and expenses, which are indirect expenses incurred by the fund through its investments in underlying funds. |
Schwab VIT Balanced Portfolio | Annual Report
Schwab VIT Balanced Portfolio
Portfolio Holdings as of December 31, 2021
This section shows all the securities in the fund’s portfolio and their values as of the report date.
The fund files its complete schedule of portfolio holdings with the U.S. Securities and Exchange Commission (SEC) for the first and third quarters of each fiscal year on Form N-PORT Part F. The fund’s Form N-PORT Part F is available on the SEC’s website at www.sec.gov. The fund also makes available its complete schedule of portfolio holdings on the fund’s website at www.schwabassetmanagement.com/schwabfunds_prospectus, typically 60-80 days after the end of the fund’s fiscal quarter.
| SECURITY | NUMBER
OF SHARES | VALUE ($) |
| AFFILIATED UNDERLYING FUNDS 98.6% OF NET ASSETS |
| |
| U.S. Stocks 23.1% |
| Large-Cap 19.1% |
| Schwab U.S. Large-Cap ETF | 155,896 | 17,744,083 |
| Small-Cap 4.0% |
| Schwab U.S. Small-Cap ETF | 36,453 | 3,732,787 |
| | | 21,476,870 |
| |
| International Stocks 18.0% |
| Developed Markets 13.1% |
| Schwab International Equity ETF | 263,181 | 10,229,845 |
| Schwab International Small-Cap Equity ETF | 45,572 | 1,865,262 |
| | | 12,095,107 |
| Emerging Markets 4.9% |
| Schwab Emerging Markets Equity ETF | 154,356 | 4,572,025 |
| | | 16,667,132 |
| |
| Real Estate 6.1% |
| U.S. REITs 6.1% |
| Schwab U.S. REIT ETF | 107,811 | 5,680,561 |
| |
| Fixed Income 48.8% |
| Inflation-Protected Bond 3.7% |
| Schwab U.S. TIPS ETF | 54,110 | 3,402,978 |
| Intermediate-Term Bond 36.1% |
| Schwab U.S. Aggregate Bond ETF | 621,876 | 33,519,116 |
| Treasury Bond 9.0% |
| Schwab Short-Term U.S. Treasury ETF | 163,734 | 8,325,874 |
| | | 45,247,968 |
| |
| SECURITY | NUMBER
OF SHARES | VALUE ($) |
| Money Market Funds 2.6% |
| Schwab Variable Share Price Money Fund, Ultra Shares 0.03% (a) | 2,402,330 | 2,403,051 |
Total Affiliated Underlying Funds
(Cost $71,905,220) | 91,475,582 |
| ISSUER | FACE
AMOUNT ($) | VALUE ($) |
| SHORT-TERM INVESTMENTS 1.4% OF NET ASSETS |
| |
| Time Deposits 1.4% |
| National Australia Bank Ltd. |
| 0.01%, 01/03/22 (b) | 362,071 | 362,071 |
| Sumitomo Mitsui Trust Bank, Ltd. |
| 0.01%, 01/03/22 (b) | 929,187 | 929,187 |
Total Short-Term Investments
(Cost $1,291,258) | 1,291,258 |
Total Investments in Securities
(Cost $73,196,478) | 92,766,840 |
| (a) | The rate shown is the 7-day yield. |
| (b) | The rate shown is the current daily overnight rate. |
| ETF — | Exchange traded fund |
| REIT — | Real Estate Investment Trust |
| TIPS — | Treasury Inflation Protected Securities |
Schwab VIT Balanced Portfolio | Annual Report
Schwab VIT Balanced Portfolio
Portfolio Holdings as of December 31, 2021 (continued)
Below is a summary of the fund’s transactions with its affiliated underlying funds during the period ended December 31, 2021:
| | VALUE AT
12/31/20 | PURCHASES | SALES | REALIZED
GAINS (LOSSES) | NET CHANGE IN
UNREALIZED
APPRECIATION
(DEPRECIATION) | VALUE AT
12/31/21 | BALANCE
OF SHARES
HELD AT
12/31/21 | DISTRIBUTIONS
RECEIVED* |
| AFFILIATED UNDERLYING FUNDS 98.6% OF NET ASSETS |
| |
| U.S. Stocks 23.1% |
| Large-Cap 19.1% |
| Schwab U.S. Large-Cap ETF | $16,004,835 | $2,039,875 | ($4,113,461) | $897,211 | $2,915,623 | $17,744,083 | 155,896 | $225,549 |
| Small-Cap 4.0% |
| Schwab U.S. Small-Cap ETF | 3,394,104 | 463,679 | (617,472) | 214,777 | 277,699 | 3,732,787 | 36,453 | 43,175 |
| | | | | | | 21,476,870 | | |
| |
| International Stocks 18.0% |
| Developed Markets 13.1% |
| Schwab International Equity ETF | 9,206,208 | 1,590,269 | (1,278,846) | 119,951 | 592,263 | 10,229,845 | 263,181 | 317,501 |
| Schwab International Small-Cap Equity ETF | 1,668,761 | 250,339 | (198,830) | 17,816 | 127,176 | 1,865,262 | 45,572 | 54,501 |
| | | | | | | 12,095,107 | | |
| Emerging Markets 4.9% |
| Schwab Emerging Markets Equity ETF | 4,273,959 | 879,121 | (431,709) | 85,140 | (234,486) | 4,572,025 | 154,356 | 125,746 |
| | | | | | | 16,667,132 | | |
| |
| Real Estate 6.1% |
| U.S. REITs 6.1% |
| Schwab U.S. REIT ETF | 4,995,106 | 528,271 | (1,632,561) | 222,841 | 1,566,904 | 5,680,561 | 107,811 | 90,868 |
| |
| Fixed Income 48.8% |
| Inflation-Protected Bond 3.7% |
| Schwab U.S. TIPS ETF | 3,101,269 | 446,737 | (190,744) | 1,674 | 44,042 | 3,402,978 | 54,110 | 146,772 |
| Intermediate-Term Bond 36.1% |
| Schwab U.S. Aggregate Bond ETF | 30,253,118 | 6,783,602 | (2,350,593) | (63,528) | (1,103,483) | 33,519,116 | 621,876 | 684,646 |
| Treasury Bond 9.0% |
| Schwab Short-Term U.S. Treasury ETF | 7,405,967 | 1,680,093 | (674,711) | (4,835) | (80,640) | 8,325,874 | 163,734 | 32,424 |
| | | | | | | 45,247,968 | | |
| |
| Money Market Funds 2.6% |
| Schwab Variable Share Price Money Fund, Ultra Shares | 2,502,279 | 829 | (100,057) | 26 | (26) | 2,403,051 | 2,402,330 | 770 |
| Total Affiliated Underlying Funds | $82,805,606 | $14,662,815 | ($11,588,984) | $1,491,073 | $4,105,072 | $91,475,582 | | $1,721,952 |
| * | Distributions received include distributions from net investment income and capital gains, if any, from the underlying funds. |
Schwab VIT Balanced Portfolio | Annual Report
Schwab VIT Balanced Portfolio
Portfolio Holdings as of December 31, 2021 (continued)
The following is a summary of the inputs used to value the fund’s investments as of December 31, 2021 (see financial note 2(a) for additional information):
| DESCRIPTION | QUOTED PRICES IN
ACTIVE MARKETS FOR
IDENTICAL ASSETS
(LEVEL 1) | OTHER SIGNIFICANT
OBSERVABLE INPUTS
(LEVEL 2) | SIGNIFICANT
UNOBSERVABLE INPUTS
(LEVEL 3) | TOTAL |
| Assets | | | | |
| Affiliated Underlying Funds1 | $91,475,582 | $— | $— | $91,475,582 |
| Short-Term Investments1 | — | 1,291,258 | — | 1,291,258 |
| Total | $91,475,582 | $1,291,258 | $— | $92,766,840 |
| 1 | As categorized in the Portfolio Holdings. |
Fund investments in mutual funds and ETFs are classified as Level 1, without consideration to the classification level of the underlying securities held by the mutual funds and ETFs, which could be Level 1, Level 2 or Level 3.
Schwab VIT Balanced Portfolio | Annual Report
Schwab VIT Balanced Portfolio
Statement of Assets and Liabilities
As of December 31, 2021
| Assets |
| Investments in securities, at value - affiliated (cost $71,905,220) | | $91,475,582 |
| Investments in securities, at value - unaffiliated (cost $1,291,258) | | 1,291,258 |
| Receivables: | | |
| Investments sold | | 726,903 |
| Dividends | | 18,370 |
| Prepaid expenses | + | 206 |
| Total assets | | 93,512,319 |
| Liabilities |
| Payables: | | |
| Investments bought | | 660,541 |
| Investment adviser and administrator fees | | 37,484 |
| Fund shares redeemed | | 4,582 |
| Independent trustees’ fees | | 61 |
| Accrued expenses | + | 32,496 |
| Total liabilities | | 735,164 |
| Net assets | | $92,777,155 |
| Net Assets by Source |
| Capital received from investors | | $71,100,773 |
| Total distributable earnings | + | 21,676,382 |
| Net assets | | $92,777,155 |
| Net Asset Value (NAV) |
| Net Assets | ÷ | Shares
Outstanding | = | NAV |
| $92,777,155 | | 6,189,936 | | $14.99 |
| | | | | |
| | | | | |
Schwab VIT Balanced Portfolio | Annual Report
Schwab VIT Balanced Portfolio
Statement of Operations
| For the period January 1, 2021 through December 31, 2021 |
| Investment Income |
| Dividends received from securities - affiliated | | $1,721,952 |
| Interest received from securities - unaffiliated | + | 67 |
| Total investment income | | 1,722,019 |
| Expenses |
| Investment adviser and administrator fees | | 397,187 |
| Professional fees | | 23,298 |
| Independent trustees’ fees | | 12,593 |
| Portfolio accounting fees | | 12,074 |
| Shareholder reports | | 11,904 |
| Custodian fees | | 2,500 |
| Transfer agent fees | | 1,426 |
| Other expenses | + | 3,404 |
| Total expenses | – | 464,386 |
| Net investment income | | 1,257,633 |
| REALIZED AND UNREALIZED GAINS (LOSSES) |
| Net realized gains on sales of securities - affiliated | | 1,491,073 |
| Net change in unrealized appreciation (depreciation) on securities - affiliated | + | 4,105,072 |
| Net realized and unrealized gains | | 5,596,145 |
| Increase in net assets resulting from operations | | $6,853,778 |
Schwab VIT Balanced Portfolio | Annual Report
Schwab VIT Balanced Portfolio
Statement of Changes in Net Assets
For the current and prior report periods
| OPERATIONS |
| | 1/1/21-12/31/21 | 1/1/20-12/31/20 |
| Net investment income | | $1,257,633 | $1,170,282 |
| Net realized gains (losses) | | 1,491,073 | (147,303) |
| Net change in unrealized appreciation (depreciation) | + | 4,105,072 | 5,460,186 |
| Increase in net assets from operations | | $6,853,778 | $6,483,165 |
| DISTRIBUTIONS TO SHAREHOLDERS |
| Total distributions | | ($1,172,672) | ($1,583,531) |
| TRANSACTIONS IN FUND SHARES |
| | 1/1/21-12/31/21 | 1/1/20-12/31/20 |
| | | SHARES | VALUE | SHARES | VALUE |
| Shares sold | | 1,041,182 | $15,151,379 | 934,736 | $11,978,203 |
| Shares reinvested | | 80,101 | 1,172,672 | 125,279 | 1,583,531 |
| Shares redeemed | + | (883,201) | (12,804,877) | (834,964) | (10,767,159) |
| Net transactions in fund shares | | 238,082 | $3,519,174 | 225,051 | $2,794,575 |
| SHARES OUTSTANDING AND NET ASSETS |
| | 1/1/21-12/31/21 | 1/1/20-12/31/20 |
| | | SHARES | NET ASSETS | SHARES | NET ASSETS |
| Beginning of period | | 5,951,854 | $83,576,875 | 5,726,803 | $75,882,666 |
| Total increase | + | 238,082 | 9,200,280 | 225,051 | 7,694,209 |
| End of period | | 6,189,936 | $92,777,155 | 5,951,854 | $83,576,875 |
Schwab VIT Balanced Portfolio | Annual Report
Schwab VIT Balanced Portfolio
1. Business Structure of the Fund:
Schwab VIT Balanced Portfolio (the fund) is a series of Schwab Annuity Portfolios (the trust), a no-load, open-end management investment company. The trust is organized as a Massachusetts business trust and is registered under the Investment Company Act of 1940, as amended (the 1940 Act). The list below shows all the funds in the trust as of the end of the period, including the fund discussed in this report, which is highlighted:
| SCHWAB ANNUITY PORTFOLIOS (ORGANIZED JANUARY 21, 1994) |
| Schwab Government Money Market Portfolio | |
| Schwab S&P 500 Index Portfolio | |
| Schwab VIT Balanced Portfolio | |
| Schwab VIT Balanced with Growth Portfolio | |
| Schwab VIT Growth Portfolio | |
The fund is a “fund of funds” which primarily invests in affiliated Schwab Exchange-Traded Funds (ETFs). The fund may also invest in affiliated mutual funds from Schwab Funds and Laudus Funds and unaffiliated third-party ETFs and mutual funds (all such ETFs and mutual funds referred to as "underlying funds"). The fund may also invest directly in equity or fixed-income securities, including bonds, cash equivalents, money market funds and money market investments, to achieve its investment objectives.
The fund in this report offers one share class. Shares are bought and sold at closing net asset value per share (NAV), which is the price for all outstanding shares of the fund. Each share has a par value of 1/1,000 of a cent, and the fund’s Board of Trustees (the Board) may authorize the issuance of as many shares as necessary.
The fund is available exclusively as an investment vehicle for variable annuity and variable life insurance contracts offered by separate accounts of participating life insurance companies, and in the future may be offered to pension and retirement plans qualified under the Internal Revenue Code of 1986, as amended. At December 31, 2021, 100% of the fund’s shares were held through separate accounts of five insurance companies. Subscriptions and redemptions of these insurance separate accounts could have a material impact on the fund.
The fund maintains its own account for purposes of holding assets and accounting, and is considered a separate entity for tax purposes. Within its account, the fund may also keep certain assets in segregated accounts, as required by securities law.
2. Significant Accounting Policies:
The following is a summary of the significant accounting policies the fund uses in its preparation of financial statements. The fund follows the investment company accounting and reporting guidance of the Financial Accounting Standards Board (FASB) Accounting Standard Codification Topic 946 Financial Services — Investment Companies. The accounting policies are in conformity with accounting principles generally accepted in the United States of America (GAAP).
The financial statements of the fund should be read in conjunction with the underlying funds’ financial statements. For more information about the underlying funds’ operations and policies, please refer to those funds’ semiannual and annual reports, which are filed with the U.S. Securities and Exchange Commission (SEC) and are available on the SEC’s website at www.sec.gov.
(a) Security Valuation:
Under procedures approved by the Board, the investment adviser has formed a Pricing Committee to administer the pricing and valuation of portfolio securities and other assets and to ensure that prices used for internal purposes or provided by third parties reasonably reflect fair value. Among other things, these procedures allow the fund to utilize independent pricing services, quotations from securities and financial instrument dealers and other market sources to determine fair value.
The fund values the securities in its portfolio every business day. The fund uses the following policies to value various types of securities:
• Securities traded on an exchange or over-the-counter: Traded securities are valued at the closing value for the day, or, on days when no closing value has been reported, at the mean of the most recent bid and ask quotes.
• Mutual funds: Mutual funds are valued at their respective NAVs.
• Cash management sweep time deposits: Balances held in cash management sweep time deposits are accounted for on a cost basis, which approximates fair value.
Schwab VIT Balanced Portfolio | Annual Report
Schwab VIT Balanced Portfolio
Financial Notes (continued)
2. Significant Accounting Policies (continued):
• Securities for which no quoted value is available: The Board has adopted procedures to fair value the fund’s securities when market prices are not “readily available” or are unreliable. For example, the fund may fair value a security when it is de-listed or its trading is halted or suspended; when a security’s primary pricing source is unable or unwilling to provide a price; or when a security’s primary trading market is closed during regular market hours. The fund makes fair value determinations in good faith in accordance with the fund’s valuation procedures. The Pricing Committee considers a number of factors, including unobservable market inputs, when arriving at fair value. The Pricing Committee may employ techniques such as the review of related or comparable assets or liabilities, related market activities, recent transactions, market multiples, book values, transactional back-testing, disposition analysis and other relevant information. The Pricing Committee regularly reviews these inputs and assumptions to calibrate the valuations. Due to the subjective and variable nature of fair value pricing, there can be no assurance that the fund could obtain the fair value assigned to the security upon the sale of such security. The Board convenes on a regular basis to review fair value determinations made by the fund pursuant to the valuation procedures.
In accordance with the authoritative guidance on fair value measurements and disclosures under GAAP, the fund discloses the fair value of its investments in a hierarchy that prioritizes the significant inputs to valuation techniques used to measure the fair value. The hierarchy gives the highest priority to valuations based upon unadjusted quoted prices in active markets for identical assets or liabilities (Level 1 measurements) and the lowest priority to valuations based upon unobservable inputs that are significant to the valuation (Level 3 measurements). If inputs used to measure the financial instruments fall within different levels of the hierarchy, the categorization is based on the lowest level input that is significant to the valuation. If the fund determines that either the volume and/or level of activity for an asset or liability has significantly decreased (from normal conditions for that asset or liability) or price quotations or observable inputs are not associated with orderly transactions, increased analysis and management judgment will be required to estimate fair value.
The three levels of the fair value hierarchy are as follows:
• Level 1 — quoted prices in active markets for identical securities — Investments whose values are based on quoted market prices in active markets, and whose values are therefore classified as Level 1 prices, include active listed equities, mutual funds and ETFs. Investments in mutual funds are valued daily at their NAVs, and investments in ETFs are valued daily at the last reported sale price or the official closing price, which are classified as Level 1 prices, without consideration to the classification level of the underlying securities held by an underlying fund.
• Level 2 — other significant observable inputs (including quoted prices for similar securities, interest rates, prepayment speeds, credit risk, etc.) — Investments that trade in markets that are not considered to be active, but whose values are based on quoted market prices, dealer quotations or valuations provided by alternative pricing sources supported by observable inputs are classified as Level 2 prices. These generally include U.S. government and sovereign obligations, most government agency securities, investment-grade corporate bonds, certain mortgage products, less liquid listed equities, and state, municipal and provincial obligations.
• Level 3 — significant unobservable inputs (including the fund’s own assumptions in determining the fair value of investments) — Investments whose values are classified as Level 3 prices have significant unobservable inputs, as they may trade infrequently or not at all. When observable prices are not available for these securities, the fund uses one or more valuation techniques for which sufficient and reliable data is available. The inputs used by the fund in estimating the value of Level 3 prices may include the original transaction price, quoted prices for similar securities or assets in active markets, completed or pending third-party transactions in the underlying investment or comparable issuers, and changes in financial ratios or cash flows. Level 3 prices may also be adjusted to reflect illiquidity and/or non-transferability, with the amount of such discount estimated by the fund in the absence of market information. Assumptions used by the fund due to the lack of observable inputs may significantly impact the resulting fair value and therefore the fund’s results of operations.
The inputs or methodology used for valuing securities are not necessarily an indication of the risk associated with investing in those securities.
The levels associated with valuing the fund’s investments as of December 31, 2021 are disclosed in the Portfolio Holdings.
(b) Accounting Policies for certain Portfolio Investments (if held):
Securities Lending: Under the trust’s Securities Lending Program, a fund (lender) may make short-term loans of its securities to another party (borrower) to generate additional revenue for the fund. The borrower pledges collateral in the form of cash, securities issued or fully guaranteed by the U.S. government or foreign governments, or letters of credit issued by a bank. Collateral at the individual loan level is required to be maintained on a daily marked-to-market basis in an amount at least equal to the current value of the securities loaned. The lending agent provides the fund with indemnification against borrower default (the borrower fails to
Schwab VIT Balanced Portfolio | Annual Report
Schwab VIT Balanced Portfolio
Financial Notes (continued)
2. Significant Accounting Policies (continued):
return the security on loan) reducing the risk of loss as a result of default. The cash collateral of securities loaned is currently invested in money market portfolios operating pursuant to Rule 2a-7 under the 1940 Act. The fund bears the risk of loss with respect to the investment of cash collateral. The terms of the securities lending agreement allow the fund or the lending agent to terminate any loan at any given time and the securities must be returned within the earlier of the standard trade settlement period or the specified time period under the relevant securities lending agreement. Securities lending income, as disclosed in the fund’s Statement of Operations, if applicable, represents the income earned from the investment of the cash collateral plus any fees paid by borrowers, less the fees paid to the lending agent and broker rebates which are subject to adjustments pursuant to the securities lending agreement. On loans not collateralized by cash, a fee is received from the borrower, and is allocated between the fund and the lending agent. The aggregate fair value of securities loaned will not at any time exceed one-third of the total assets of the fund, including collateral received from the loan. Securities lending fees paid to the unaffiliated lending agents start at 10% of gross lending revenue, with subsequent breakpoints to a low of 5%. In this context, the gross lending revenue equals the income received from the investment of cash collateral and fees paid by borrowers less any rebates paid to the borrowers. Any expenses charged by the cash collateral fund are in addition to these fees. All remaining revenue is retained by the fund, as applicable. No portion of lending revenue is paid to or retained by the investment adviser or any of its affiliates.
As of December 31, 2021, the fund had no securities on loan.
Cash Management Transactions: The fund may subscribe to the Brown Brothers Harriman & Co. (BBH) Cash Management Service Sweep (CMS Sweep). The BBH CMS Sweep is an investment product that automatically sweeps the fund’s cash balances into overnight offshore time deposits with either the BBH Grand Cayman branch or a branch of a pre-approved commercial bank. This fully automated program allows the fund to earn interest on cash balances. Excess cash invested with deposit institutions domiciled outside of the U.S., as with any offshore deposit, may be subject to sovereign actions in the jurisdiction of the deposit institution including, but not limited to, freeze, seizure or diminution. The fund bears the risk associated with the repayment of principal and payment of interest on such instruments by the institution with which the deposit is ultimately placed.
(c) Security Transactions:
Security transactions are recorded as of the date the order to buy or sell the security is executed. Realized gains and losses from security transactions are based on the identified costs of the securities involved.
(d) Investment Income:
Interest income is recorded as it accrues. Dividends and distributions from portfolio securities and underlying funds are recorded on the date they are effective (the ex-dividend date). Any distributions from underlying funds are recorded in accordance with the character of the distributions as designated by the underlying funds.
(e) Expenses:
Expenses that are specific to the fund are charged directly to the fund. Expenses that are common to more than one fund in the trusts generally are allocated among those funds in proportion to their average daily net assets. The fund bears its share of the acquired fund fees and expenses of the underlying funds, which are indirect expenses incurred by the fund through its investments in the underlying funds. Such expenses are reflected in the net asset values of the underlying funds.
(f) Distributions to Shareholders:
The fund makes distributions from net investment income and net realized capital gains, if any, once a year.
(g) Accounting Estimates:
The accounting policies described in this report conform to GAAP. Notwithstanding this, shareholders should understand that in order to follow these principles, fund management has to make estimates and assumptions that affect the information reported in the financial statements. It’s possible that once the results are known, they may turn out to be different from these estimates and these differences may be material.
(h) Federal Income Taxes:
The fund intends to meet federal income and excise tax requirements for regulated investment companies under subchapter M of the Internal Revenue Code, as amended. Accordingly, the fund distributes substantially all of its net investment income and net realized capital gains, if any, to the participating insurance company’s (shareholders) separate accounts each year. As long as the fund meets the tax requirements, it is not required to pay federal income tax.
Schwab VIT Balanced Portfolio | Annual Report
Schwab VIT Balanced Portfolio
Financial Notes (continued)
2. Significant Accounting Policies (continued):
(i) Indemnification:
Under the fund’s organizational documents, the officers and trustees are indemnified against certain liabilities arising out of the performance of their duties to the fund. In addition, in the normal course of business the fund enters into contracts with its vendors and others that provide general indemnifications. The fund’s maximum exposure under these arrangements is unknown as this would involve future claims that may be made against the fund. However, based on experience, the fund expects the risk of loss attributable to these arrangements to be remote.
3. Risk Factors:
Investing in the fund may involve certain risks, as discussed in the fund’s prospectus, including, but not limited to, those described below. Any of these risks could cause an investor to lose money.
Asset Allocation Risk. The fund is subject to the risk that the selection of the underlying funds and the allocation of the fund’s assets among the various asset classes and market segments may cause the fund to underperform other funds with a similar investment objective.
Conflicts of Interest Risk. The investment adviser’s authority to select and substitute underlying funds from a variety of affiliated and unaffiliated mutual funds and ETFs may create a conflict of interest because the fees paid to it and its affiliates by some underlying funds are higher than the fees paid by other underlying funds. The investment adviser also may have an incentive to select an affiliated underlying fund for other reasons, including to increase assets under management or to support new investment strategies. In addition, other conflicts of interest may exist where the best interests of the affiliated underlying fund may not be aligned with those of the fund. However, the investment adviser is a fiduciary to the fund and is legally obligated to act in the fund’s best interests when selecting underlying funds.
Market Risk. Financial markets rise and fall in response to a variety of factors, sometimes rapidly and unpredictably. Markets may be impacted by economic, political, regulatory and other conditions, including economic sanctions and other government actions. In addition, the occurrence of global events, such as war, terrorism, environmental disasters, natural disasters and epidemics may also negatively affect the financial markets. As with any investment whose performance is tied to these markets, the value of an investment in the fund will fluctuate, which means that an investor could lose money over short or long periods.
Securities Lending Risk. Securities lending involves the risk of loss of rights in, or delay in recovery of, the loaned securities if the borrower fails to return the security loaned or becomes insolvent.
ETF Risk. When the fund invests in an ETF, it will bear a proportionate share of the ETF’s expenses. In addition, lack of liquidity in the market for an ETF’s shares can result in its value being more volatile than the underlying portfolio of securities.
Direct Investment Risk. The fund may invest directly in cash, cash equivalents and equity and fixed-income securities, including money market securities, to maintain its allocations. The fund’s direct investment in these securities is subject to the same or similar risks as an underlying fund’s investment in the same securities.
Underlying Fund Investment Risk. Before investing in the fund, investors should assess the risks associated with the underlying funds in which the fund may invest, which include any combination of the risks described below.
• Equity Risk. The prices of equity securities rise and fall daily. These price movements may result from factors affecting individual companies, industries or the securities market as a whole. In addition, equity markets tend to move in cycles, which may cause stock prices to fall over short or extended periods of time.
• Market Capitalization Risk. Securities issued by companies of different market capitalizations tend to go in and out of favor based on market and economic conditions. During a period when securities of a particular market capitalization fall behind other types of investments, an underlying fund’s performance could be impacted.
• Foreign Investment Risk. An underlying fund’s investments in securities of foreign issuers involve certain risks that may be greater than those associated with investments in securities of U.S. issuers. These include risks of adverse changes in foreign economic, political, regulatory and other conditions; changes in currency exchange rates or exchange control regulations (including limitations on currency movements and exchanges); the imposition of economic sanctions or other government restrictions; differing accounting, auditing, financial reporting and legal standards and practices; differing securities market structures; and higher transaction costs. These risks may negatively impact the value or liquidity of an underlying fund’s investments, and could impair the underlying fund’s ability to meet its investment objective or invest in accordance with its
Schwab VIT Balanced Portfolio | Annual Report
Schwab VIT Balanced Portfolio
Financial Notes (continued)
3. Risk Factors (continued):
investment strategy. There is a risk that investments in securities denominated in, and/or receiving revenues in, foreign currencies will decline in value relative to the U.S. dollar or, in the case of hedging positions, that the U.S. dollar will decline in value relative to the currency hedged, resulting in the dollar value of an underlying fund’s investment being adversely affected.
• Emerging Markets Risk. Emerging market countries may be more likely to experience political turmoil or rapid changes in market or economic conditions than more developed countries. Emerging market countries often have less uniformity in accounting, auditing, financial reporting and recordkeeping requirements and greater risk associated with the custody of securities. In addition, the financial stability of issuers (including governments) in emerging market countries may be more precarious than in developed countries. As a result, there may be an increased risk of illiquidity and price volatility associated with an underlying fund’s investments in emerging market countries, which may be magnified by currency fluctuations relative to the U.S. dollar, and, at times, it may be difficult to value such investments.
• Growth Investing Risk. Certain of the underlying funds pursue a “growth style” of investing. Growth investing focuses on a company’s prospects for growth of revenue and earnings. If a company’s earnings or revenues fall short of expectations, its stock price may fall dramatically. Growth stocks also can perform differently from the market as a whole and other types of stocks and can be more volatile than other types of stocks. Since growth companies usually invest a high portion of earnings in their business, they may lack the dividends of value stocks that can cushion stock prices in a falling market. Growth stocks may also be more expensive relative to their earnings or assets compared to value or other stocks.
• Value Investing Risk. Certain of the underlying funds may pursue a “value style” of investing. Value investing focuses on companies whose stocks appear undervalued in light of factors such as the company’s earnings, book value, revenues or cash flow. If an underlying fund’s investment adviser’s (or sub-adviser’s) assessment of a company’s value or prospects for exceeding earnings expectations or market conditions is wrong, the underlying fund could suffer losses or produce poor performance relative to other funds. In addition, “value stocks” can continue to be undervalued by the market for long periods of time.
• Fixed-Income Risk. Interest rates rise and fall over time, which will affect an underlying fund’s yield and share price. A change in a central bank’s monetary policy or economic conditions, among other things, may result in a change in interest rates. A rise in interest rates could cause an underlying fund’s share price to fall. The credit quality of a portfolio investment could also cause an underlying fund’s share price to fall. An underlying fund could lose money if the issuer or guarantor of a portfolio investment or the counterparty to a derivatives contract fails to make timely principal or interest payments or otherwise honor its obligations. Fixed-income securities may be paid off earlier or later than expected. Either situation could cause an underlying fund to hold securities paying lower-than-market rates of interest, which could hurt an underlying fund’s yield or share price. Below investment-grade bonds (junk bonds) involve greater credit risk, are more volatile, involve greater risk of price declines and may be more susceptible to economic downturns than investment-grade securities.
• Interest Rate Risk. Interest rates rise and fall over time. As with any investment whose yield reflects current interest rates, an underlying fund’s yield will change over time. During periods when interest rates are low, an underlying fund’s yield (and total return) also may be low. Changes in interest rates also may affect an underlying fund’s share price: a rise in interest rates generally causes an underlying fund’s share price to fall. The longer an underlying fund’s portfolio duration, the more sensitive to interest rate movements its share price is likely to be. Also, a change in a central bank’s monetary policy or economic conditions, among other things, may result in a change in interest rates, which could have sudden and unpredictable effects on the markets and significantly impact the value of fixed-income securities in which the underlying fund invests.
• Credit Risk. A decline in the credit quality of an issuer or guarantor of a portfolio investment could cause an underlying fund to lose money or underperform. An underlying fund could lose money if the issuer or guarantor of a portfolio investment fails to make timely principal or interest payments or otherwise honor its obligations.
• Prepayment and Extension Risk. Certain fixed income securities are subject to the risk that the securities may be paid off earlier or later than expected, especially during periods of falling or rising interest rates, respectively. Prepayments of obligations could cause an underlying fund to forgo future interest income on the portion of the security’s principal repaid early and force the underlying fund to reinvest that money at the lower prevailing interest rates. Extensions of obligations could cause the fund to exhibit additional volatility and hold securities paying lower-than-market rates of interest. Either case could hurt the underlying fund’s performance.
• U.S. Government Securities Risk. Some of the U.S. government securities that the underlying funds invest in are not backed by the full faith and credit of the U.S. government, which means they are neither issued nor guaranteed by the U.S. Treasury. Issuers such as the Federal Home Loan Banks (FHLB) maintain limited access to credit lines from the U.S. Treasury. Certain securities, such as obligations issued by the Federal Farm Credit Banks Funding Corporation, are supported solely by the
Schwab VIT Balanced Portfolio | Annual Report
Schwab VIT Balanced Portfolio
Financial Notes (continued)
3. Risk Factors (continued):
credit of the issuer. There can be no assurance that the U.S. government will provide financial support to securities of its agencies and instrumentalities if it is not obligated to do so under law. Also, any government guarantees on securities the underlying funds own do not extend to shares of the underlying funds themselves.
• Real Estate Investment Risk. An underlying fund in which the fund may invest may have a policy of concentrating its investments in real estate companies and companies related to the real estate industry. As such, an underlying fund is subject to risks associated with the direct ownership of real estate securities and the fund’s investment in such an underlying fund is subject to risks associated with the direct ownership of real estate securities and an investment in the underlying fund will be closely linked to the performance of the real estate markets. These risks include, among others, declines in the value of real estate; risks related to general and local economic conditions; possible lack of availability of mortgage funds or other limits to accessing the credit or capital markets; defaults by borrowers or tenants, particularly during an economic downturn; and changes in interest rates.
• Real Estate Investment Trusts (REITs) Risk. An underlying fund may invest in REITs. An underlying fund’s investments in REITs will be subject to the risks associated with the direct ownership of real estate, including fluctuations in the value of underlying properties, defaults by borrowers or tenants, changes in interest rates and risks related to general or local economic conditions. REITs are also subject to certain additional risks. For example, equity REITs may be affected by changes in the value of the underlying properties owned by the trusts, and mortgage REITs may be affected by the quality of any credit extended. Further, REITs may have their investments in relatively few properties, a small geographic area or a single property type. In addition, REITs have their own expenses, and the underlying fund will bear a proportionate share of those expenses.
• Mortgage-Backed and Mortgage Pass-Through Securities Risk. Mortgage-backed securities tend to increase in value less than other debt securities when interest rates decline, but are subject to similar or greater risk of decline in fair value during periods of rising interest rates. Certain of the mortgage-backed securities in which an underlying fund may invest are issued or guaranteed by agencies or instrumentalities of the U.S. government but are not backed by the full faith and credit of the U.S. government. There can be no assurance that the U.S. government would provide financial support to its agencies or instrumentalities where it was not obligated to do so which can cause an underlying fund to lose money or underperform. The risks of investing in mortgage-backed securities include, among others, interest rate risk, credit risk, prepayment risk and extension risk. Transactions in mortgage pass-through securities often occur through to-be-announced (TBA) transactions. An underlying fund could lose money or underperform if a TBA counterparty defaults or goes bankrupt.
• Portfolio Turnover Risk. Certain of the underlying funds may buy and sell portfolio securities actively. If they do, their portfolio turnover rate and transaction costs will rise, which may lower the underlying fund’s performance and may increase the likelihood of capital gains distributions.
• Liquidity Risk. An underlying fund may be unable to sell certain securities, such as illiquid securities, readily at a favorable time or price, or the underlying fund may have to sell them at a loss.
• Derivatives Risk. An underlying fund’s use of derivative instruments involves risks different from, or possibly greater than, the risks associated with investing directly in securities and other traditional investments. An underlying fund’s use of derivatives could reduce the underlying fund’s performance, increase volatility, and could cause the underlying fund to lose more than the initial amount invested. In addition, investments in derivatives may involve leverage, which means a small percentage of assets invested in derivatives can have a disproportionately large impact on an underlying fund.
• Securities Lending Risk. Certain underlying funds engage in securities lending, which involves the risk of loss of rights in, or delay in recovery of, the loaned securities if the borrower fails to return the security loaned or becomes insolvent.
• Management Risk. An underlying fund may be an actively managed mutual fund. Any actively managed mutual fund is subject to the risk that its investment adviser (or sub-adviser(s)) will make poor security selections. An underlying fund’s adviser applies its own investment techniques and risk analyses in making investment decisions for the fund, but there can be no guarantee that they will produce the desired results.
• Investment Style Risk. Certain underlying funds seek to track the performance of various segments of the stock market, as measured by their respective indices. Such underlying funds follow these stocks during upturns as well as downturns. Because of their indexing strategy, these underlying funds do not take steps to reduce market exposure or to lessen the effects of a declining market. In addition, because of an underlying fund’s expenses, the underlying fund’s performance is normally below that of the index. Errors relating to an index may occur from time to time and may not be identified by the underlying fund’s index provider for a period time. In addition, market disruptions could cause delays in an underlying fund’s index’s rebalancing schedule. Such errors and/or market disruptions may result in losses for an underlying fund.
Schwab VIT Balanced Portfolio | Annual Report
Schwab VIT Balanced Portfolio
Financial Notes (continued)
3. Risk Factors (continued):
• Tracking Error Risk. An underlying fund may seek to track the performance of its benchmark index, although it may not be successful in doing so. The divergence between the performance of a fund and its benchmark index, positive or negative, is called “tracking error.” Tracking error can be caused by many factors and it may be significant.
• Concentration Risk. To the extent that an underlying fund’s portfolio is concentrated in the securities of issuers in a particular market, industry, group of industries, sector or asset class, the underlying fund may be adversely affected by the performance of those securities, may be subject to increased price volatility and may be more vulnerable to adverse economic, market, political, or regulatory occurrences affecting that market, industry, group of industries, sector or asset class.
• Commodity Risk. To the extent that an underlying fund invests in commodity-linked derivative instruments, it may subject the underlying fund to greater volatility than investments in traditional securities. Also, commodity-linked investments may be more volatile and less liquid than the underlying commodity. The value of commodity-linked derivative instruments may be affected by changes in overall market movements, commodity index volatility, changes in interest rates, or factors affecting a particular industry or commodity, such as drought, floods, weather, livestock disease, embargoes, tariffs and international economic, political and other regulatory and market developments. The use of leveraged commodity-linked derivatives creates an opportunity for increased return, but also creates the possibility for a greater loss.
• Money Market Fund Risk. The fund may invest in underlying money market funds that either seek to maintain a stable $1.00 net asset value (“stable share price money market funds”) or that have a share price that fluctuates (“variable share price money market funds”). Although an underlying stable share price money market fund seeks to maintain a stable $1.00 net asset value, it is possible to lose money by investing in such a money market fund. Because the share price of an underlying variable share price money market fund will fluctuate, when the fund sells the shares it owns they may be worth more or less than what the fund originally paid for them. In addition, neither type of money market fund is designed to offer capital appreciation. Certain underlying money market funds may impose a fee upon the sale of shares or may temporarily suspend the ability to sell shares if such fund’s liquidity falls below required minimums.
Please refer to the fund’s prospectus for a more complete description of the principal risks of investing in the fund.
4. Affiliates and Affiliated Transactions:
Investment Adviser
Charles Schwab Investment Management Inc., dba Schwab Asset Management, a wholly owned subsidiary of The Charles Schwab Corporation, serves as the fund’s investment adviser and administrator pursuant to an Investment Advisory and Administration Agreement between the investment adviser and the trust.
For its advisory and administrative services to the fund, the investment adviser is entitled to receive an annual fee, accrued daily and payable monthly, equal to 0.45% of the fund’s average daily net assets.
Expense Limitation
The investment adviser and its affiliates have agreed with the fund, for so long as the investment adviser serves as the investment adviser to the fund, which may only be amended or terminated with approval of the fund’s Board, to limit the total annual fund operating expenses charged, excluding interest, taxes and certain non-routine expenses to 0.58%.
The agreement to limit the fund’s total expenses charged is limited to the fund’s direct operating expenses and, therefore, does not apply to acquired fund fees and expenses, which are indirect expenses incurred by the fund through its investments in the underlying funds.
Schwab VIT Balanced Portfolio | Annual Report
Schwab VIT Balanced Portfolio
Financial Notes (continued)
4. Affiliates and Affiliated Transactions (continued):
Investments in Affiliates
The fund may engage in certain transactions involving related parties. Pursuant to an exemptive order issued by the SEC, the fund may invest in other related ETFs and mutual funds. As of December 31, 2021, the Schwab VIT Balanced Portfolio’s ownership percentages of other related funds’ shares are:
| Schwab Emerging Markets Equity ETF | 0.0%* |
| Schwab International Equity ETF | 0.0%* |
| Schwab International Small-Cap Equity ETF | 0.0%* |
| Schwab Short-Term U.S. Treasury ETF | 0.1% |
| Schwab U.S. Aggregate Bond ETF | 0.4% |
| Schwab U.S. Large-Cap ETF | 0.1% |
| Schwab U.S. REIT ETF | 0.1% |
| Schwab U.S. Small-Cap ETF | 0.0%* |
| Schwab U.S. TIPS ETF | 0.0%* |
| Schwab Variable Share Price Money Fund, Ultra Shares | 0.1% |
Interfund Borrowing and Lending
Pursuant to an exemptive order issued by the SEC, the fund may enter into interfund borrowing and lending transactions with other funds in the Fund Complex (for definition refer to the Trustees and Officers section). All loans are for temporary or emergency purposes and the interest rate to be charged will be the average of the overnight repurchase agreement rate and the short-term bank loan rate. All loans are subject to numerous conditions designed to ensure fair and equitable treatment of all participating funds. The interfund lending facility is subject to the oversight and periodic review by the Board. The fund had no interfund borrowing or lending activity during the period.
5. Board of Trustees:
The Board may include people who are officers and/or directors of the investment adviser or its affiliates. Federal securities law limits the percentage of such “interested persons” who may serve on a trust’s board, and the trust was in compliance with these limitations throughout the report period. The trust did not pay any of these interested persons for their services as trustees, but it did pay non-interested persons (independent trustees), as noted on the fund’s Statement of Operations. For information regarding the trustees, please refer to the Trustees and Officers table at the end of this report.
6. Borrowing from Banks:
During the period, the fund was a participant with other funds in the Fund Complex in a joint, syndicated, committed $850 million line of credit (the Syndicated Credit Facility), which matured on September 30, 2021. On September 30, 2021, the Syndicated Credit Facility was amended to run for a new 364 day period with the line of credit amount remaining unchanged, maturing on September 29, 2022. Under the terms of the Syndicated Credit Facility, in addition to the interest charged on any borrowings by a fund, the fund paid a commitment fee of 0.15% per annum on the fund’s proportionate share of the unused portion of the Syndicated Credit Facility.
During the period, the fund was a participant with other funds in the Fund Complex in a joint, unsecured, uncommitted $400 million line of credit (the Uncommitted Credit Facility), with State Street Bank and Trust Company, which matured on September 30, 2021. On September 30, 2021, the Uncommitted Credit Facility was amended to run for a new 364 day period with the line of credit amount remaining unchanged, maturing on September 29, 2022. Under the terms of the Uncommitted Credit Facility, the fund pays interest on the amount it borrows. There were no borrowings from either line of credit during the period.
The fund also has access to custodian overdraft facilities. The fund may have utilized the overdraft facility and incurred an interest expense, which is disclosed on the fund’s Statement of Operations, if any. The interest expense is determined based on a negotiated rate above the current Federal Funds Rate.
Schwab VIT Balanced Portfolio | Annual Report
Schwab VIT Balanced Portfolio
Financial Notes (continued)
| | 7. Purchases and Sales of Investment Securities: |
For the period ended December 31, 2021, purchases and sales of securities (excluding short-term obligations) were as follows:
PURCHASES
OF SECURITIES | SALES
OF SECURITIES |
| $14,662,815 | $11,588,984 |
8. Federal Income Taxes:
As of December 31, 2021, the tax basis cost of the fund’s investments and gross unrealized appreciation and depreciation were as follows:
| TAX COST | GROSS UNREALIZED
APPRECIATION | GROSS UNREALIZED
DEPRECIATION | NET UNREALIZED
APPRECIATION
(DEPRECIATION) |
| $73,870,029 | $19,692,167 | ($795,356) | $18,896,811 |
As of December 31, 2021, the components of distributable earnings on a tax basis were as follows:
UNDISTRIBUTED
ORDINARY
INCOME | UNDISTRIBUTED
LONG-TERM
CAPITAL GAINS | NET UNREALIZED
APPRECIATION
(DEPRECIATION)
ON INVESTMENTS | TOTAL |
| $1,332,895 | $1,446,676 | $18,896,811 | $21,676,382 |
The primary difference between book basis and tax basis unrealized appreciation or unrealized depreciation of investments is the tax deferral of losses on wash sales. The tax cost of the fund’s investments, disclosed above, have been adjusted from their book amounts to reflect these unrealized appreciation or depreciation differences, as applicable.
The tax basis components of distributions paid during the current and prior fiscal years were as follows:
| | CURRENT FISCAL YEAR END DISTRIBUTIONS | PRIOR FISCAL YEAR END DISTRIBUTIONS |
| | ORDINARY
INCOME | LONG-TERM
CAPITAL
GAINS | ORDINARY
INCOME | LONG-TERM
CAPITAL
GAINS |
| | $1,172,672 | $— | $1,503,427 | $80,104 |
Distributions paid to shareholders are based on net investment income and net realized gains determined on a tax basis, which may differ from net investment income and net realized gains for financial reporting purposes. These differences reflect the differing character of certain income items and net realized gains and losses for financial statement and tax purposes, and may result in reclassification among certain capital accounts on the financial statements.
Permanent book and tax basis differences may result in reclassifications between components of net assets as required. The adjustments will have no impact on net assets or the results of operations.
As of December 31, 2021, management has reviewed the tax positions for open periods (for federal purposes, three years from the date of filing and for state purposes, four years from the date of filing) as applicable to the fund, and has determined that no provision for income tax is required in the fund’s financial statements. The fund recognizes interest and penalties, if any, related to unrecognized tax benefits as income tax expense in the Statement of Operations. During the fiscal year ended December 31, 2021, the fund did not incur any interest or penalties.
9. Subsequent Events:
Management has determined there are no subsequent events or transactions through the date the financial statements were issued that would have materially impacted the financial statements as presented.
Schwab VIT Balanced Portfolio | Annual Report
Schwab VIT Balanced Portfolio
Report of Independent Registered Public Accounting Firm
To the Board of Trustees of Schwab Annuity Portfolios and Shareholders of Schwab VIT Balanced Portfolio
Opinion on the Financial Statements and Financial Highlights
We have audited the accompanying statement of assets and liabilities, including the portfolio holdings, of Schwab VIT Balanced Portfolio (the “Fund”), one of the funds constituting Schwab Annuity Portfolios, as of December 31, 2021, the related statement of operations for the year then ended, the statement of changes in net assets and the financial highlights for each of the two years in the period then ended, and the related notes. In our opinion, the financial statements and financial highlights present fairly, in all material respects, the financial position of the Fund as of December 31, 2021, the results of its operations for the year then ended, and the changes in its net assets and the financial highlights for each of the two years in the period then ended in conformity with accounting principles generally accepted in the United States of America. The financial highlights for each of the three years in the period ended December 31, 2019 were audited by other auditors, whose report, dated February 18, 2020, expressed an unqualified opinion on such financial highlights.
Basis for Opinion
These financial statements and financial highlights are the responsibility of the Fund’s management. Our responsibility is to express an opinion on the Fund’s financial statements and financial highlights based on our audits. We are a public accounting firm registered with the Public Company Accounting Oversight Board (United States) (PCAOB) and are required to be independent with respect to the Fund in accordance with the U.S. federal securities laws and the applicable rules and regulations of the Securities and Exchange Commission and the PCAOB.
We conducted our audits in accordance with the standards of the PCAOB. Those standards require that we plan and perform the audit to obtain reasonable assurance about whether the financial statements and financial highlights are free of material misstatement, whether due to error or fraud. The Fund is not required to have, nor were we engaged to perform, an audit of its internal control over financial reporting. As part of our audit, we are required to obtain an understanding of internal control over financial reporting but not for the purpose of expressing an opinion on the effectiveness of the Fund’s internal control over financial reporting. Accordingly, we express no such opinion.
Our audits included performing procedures to assess the risks of material misstatement of the financial statements and financial highlights, whether due to error or fraud, and performing procedures that respond to those risks. Such procedures included examining, on a test basis, evidence regarding the amounts and disclosures in the financial statements and financial highlights. Our audits also included evaluating the accounting principles used and significant estimates made by management, as well as evaluating the overall presentation of the financial statements and financial highlights. Our procedures included confirmation of securities owned as of December 31, 2021, by correspondence with the custodian and transfer agent. We believe that our audits provide a reasonable basis for our opinion.
Deloitte & Touche LLP
Denver, Colorado
February 17, 2022
We have served as the auditor of one or more investment companies in the Schwab Funds Complex since 2020.
Schwab VIT Balanced Portfolio | Annual Report
Schwab VIT Balanced Portfolio
Other Federal Tax Information (unaudited)
Schwab VIT Balanced Portfolio may elect to pass on the benefits of the foreign tax credit of $34,691 to its shareholders for the fiscal year ended December 31, 2021. The respective foreign source income on the fund is $493,754.
For corporate shareholders, 20.76% of the fund’s dividend distributions paid during the fiscal year ended December 31, 2021, qualify for the corporate dividends received deduction.
Schwab VIT Balanced Portfolio | Annual Report
Schwab VIT Balanced Portfolio
Liquidity Risk Management Program (unaudited)
The Fund has adopted and implemented a liquidity risk management program (the “program”) as required by Rule 22e-4 under the Investment Company Act of 1940, as amended. The Fund’s Board of Trustees (the “Board”) has designated the Fund’s investment adviser, Charles Schwab Investment Management, Inc., dba Schwab Asset Management, as the administrator of the program. Personnel of the investment adviser or its affiliates conduct the day-to-day operation of the program.
Under the program, the investment adviser manages a Fund’s liquidity risk, which is the risk that the Fund could not meet shareholder redemption requests without significant dilution of remaining shareholders’ interests in the Fund. The program is reasonably designed to assess and manage a Fund’s liquidity risk, taking into consideration the Fund’s investment strategy and the liquidity of its portfolio investments during normal and reasonably foreseeable stressed conditions; its historical redemption history and shareholder concentrations; and its cash holdings and access to other funding sources, including the custodian overdraft facility and lines of credit. The investment adviser’s process of determining the degree of liquidity of each Fund’s investments is supported by third-party liquidity assessment vendors.
The Fund’s Board reviewed a report at its meeting held on September 20, 2021 prepared by the investment adviser regarding the operation and effectiveness of the program for the period June 1, 2020, through May 31, 2021, which included individual Fund liquidity metrics. No significant liquidity events impacting the Fund were noted in the report. In addition, the investment adviser provided its assessment that the program had been operating effectively in managing the Fund’s liquidity risk.
Schwab VIT Balanced Portfolio | Annual Report
Schwab VIT Balanced Portfolio
Trustees and Officers
The tables below give information about the trustees and officers of Schwab Annuity Portfolios, which includes the fund covered in this report. The “Fund Complex” includes The Charles Schwab Family of Funds, Schwab Capital Trust, Schwab Investments, Schwab Annuity Portfolios, Schwab Strategic Trust and Laudus Trust. The Fund Complex includes 103 funds.
The address for all trustees and officers is 211 Main Street, San Francisco, CA 94105. You can find more information about the trustees and officers in the fund’s Statement of Additional Information, which is available free by calling 1-877-824-5615.
| Independent Trustees |
Name, Year of Birth, and
Position(s) with the trust
(Terms of office, and
length of Time Served1) | Principal Occupations
During the Past Five Years | Number of
Portfolios in
Fund Complex
Overseen by
the Trustee | Other Directorships |
Robert W. Burns
1959
Trustee
(Trustee of Schwab Strategic Trust since 2009; The Charles Schwab Family of Funds, Schwab Investments, Schwab Capital Trust, Schwab Annuity Portfolios and Laudus Trust since 2016) | Retired/Private Investor (Jan. 2009 – present). Formerly, Managing Director, Pacific Investment Management Company, LLC (PIMCO) (investment management firm) and President, PIMCO Funds. | 103 | None |
Nancy F. Heller
1956
Trustee
(Trustee of The Charles Schwab Family of Funds, Schwab Investments, Schwab Capital Trust, Schwab Annuity Portfolios, Schwab Strategic Trust and Laudus Trust since 2018) | Retired. President and Chairman (2014 – 2016), TIAA Charitable (financial services); Senior Managing Director (2003 – 2016), TIAA (financial services). | 103 | None |
David L. Mahoney
1954
Trustee
(Trustee of The Charles Schwab Family of Funds, Schwab Investments, Schwab Capital Trust, Schwab Annuity Portfolios and Laudus Trust since 2011; Schwab Strategic Trust since 2016) | Private Investor. | 103 | Director (2004 – present), Corcept Therapeutics Incorporated
Director (2009 – 2021), Adamas Pharmaceuticals, Inc.
Director (2003 – 2019), Symantec Corporation |
Jane P. Moncreiff
1961
Trustee
(Trustee of The Charles Schwab Family of Funds, Schwab Investments, Schwab Capital Trust, Schwab Annuity Portfolios, Schwab Strategic Trust and Laudus Trust since 2019) | Consultant (2018 – present), Fulham Advisers LLC (management consulting); Chief Investment Officer (2009 – 2017), CareGroup Healthcare System, Inc. (healthcare). | 103 | None |
Kiran M. Patel
1948
Trustee
(Trustee of The Charles Schwab Family of Funds, Schwab Investments, Schwab Capital Trust, Schwab Annuity Portfolios and Laudus Trust since 2011; Schwab Strategic Trust since 2016) | Retired. Executive Vice President and General Manager of Small Business Group (Dec. 2008 – Sept. 2013), Intuit, Inc. (financial software and services firm for consumers and small businesses). | 103 | Director (2008 – present), KLA-Tencor Corporation |
Schwab VIT Balanced Portfolio | Annual Report
Schwab VIT Balanced Portfolio
| Independent Trustees (continued) |
Name, Year of Birth, and
Position(s) with the trust
(Terms of office, and
length of Time Served1) | Principal Occupations
During the Past Five Years | Number of
Portfolios in
Fund Complex
Overseen by
the Trustee | Other Directorships |
Kimberly S. Patmore
1956
Trustee
(Trustee of The Charles Schwab Family of Funds, Schwab Investments, Schwab Capital Trust, Schwab Annuity Portfolios, Schwab Strategic Trust and Laudus Trust since 2016) | Consultant (2008 – present), Patmore Management Consulting (management consulting). | 103 | None |
J. Derek Penn
1957
Trustee
(Trustee of The Charles Schwab Family of Funds, Schwab Investments, Schwab Capital Trust, Schwab Annuity Portfolios, Schwab Strategic Trust and Laudus Trust since 2021) | Head of Equity Sales and Trading (2006 – 2018), BNY Mellon (financial services). | 103 | None |
| Interested Trustees |
Name, Year of Birth, and
Position(s) with the trust
(Terms of office, and
length of Time Served1) | Principal Occupations
During the Past Five Years | Number of
Portfolios in
Fund Complex
Overseen by
the Trustee | Other Directorships |
Walter W. Bettinger II2
1960
Chairman and Trustee
(Trustee of The Charles Schwab Family of Funds, Schwab Investments, Schwab Capital Trust and Schwab Annuity Portfolios since 2008; Schwab Strategic Trust since 2009; Laudus Trust since 2010) | Director and Chief Executive Officer (Oct. 2008 – present) and President (Oct. 2008 – Oct. 2021), The Charles Schwab Corporation; President and Chief Executive Officer (Oct. 2008 – Oct. 2021) and Director (May 2008 – Oct. 2021), Charles Schwab & Co., Inc.; Director (Apr. 2006 – present), Charles Schwab Bank, SSB; Director (Nov. 2017 – present), Charles Schwab Premier Bank, SSB; Director (July 2019 – present), Charles Schwab Trust Bank; Director (May 2008 – present) and President and Chief Executive Officer (Aug. 2017 – present), Schwab Holdings, Inc.; Director (Oct. 2020 – present), TD Ameritrade Holding Corporation; Director (July 2016 – Oct. 2021), Charles Schwab Investment Management, Inc. | 103 | Director (2008 – present), The Charles Schwab Corporation |
Joseph R. Martinetto2
1962
Trustee
(Trustee of The Charles Schwab Family of Funds, Schwab Investments, Schwab Capital Trust, Schwab Annuity Portfolios, Schwab Strategic Trust and Laudus Trust since 2016) | Chief Operating Officer (Feb. 2018 – present) and Senior Executive Vice President (July 2015 – Feb. 2018), The Charles Schwab Corporation; Senior Executive Vice President (July 2015 – present), Charles Schwab & Co., Inc.; Chief Financial Officer (July 2015 – Aug. 2017) and Executive Vice President and Chief Financial Officer (May 2007 – July 2015), The Charles Schwab Corporation and Charles Schwab & Co., Inc.; Director (May 2007 – present), Charles Schwab & Co., Inc.; Director (Apr. 2010 – present) and Chief Executive Officer (July 2013 – Apr. 2015), Charles Schwab Bank, SSB; Director (Nov. 2017 – present), Charles Schwab Premier Bank, SSB; Director (May 2007 – present), Chief Financial Officer (May 2007 – Aug. 2017), Senior Executive Vice President (Feb. 2016 – present), and Executive Vice President (May 2007 – Feb. 2016), Schwab Holdings, Inc.; Director (Oct. 2020 – present), TD Ameritrade Holding Corporation. | 103 | None |
Schwab VIT Balanced Portfolio | Annual Report
Schwab VIT Balanced Portfolio
| Officers of the Trust |
Name, Year of Birth, and Position(s) with the trust
(Terms of office, and length of Time Served3) | Principal Occupations During the Past Five Years |
Jonathan de St. Paer
1973
President and Chief Executive Officer
(Officer of The Charles Schwab Family of Funds, Schwab Investments, Schwab Capital Trust, Schwab Annuity Portfolios, Schwab Strategic Trust and Laudus Trust since 2018) | Director (Apr. 2019 – present), President (Oct. 2018 – present), Chief Operating Officer (Jan. 2020 – present), and Chief Executive Officer (Apr. 2019 – Nov. 2019), Charles Schwab Investment Management, Inc.; Senior Vice President (June 2020 – present) and Chief Operating Officer (Jan. 2020 – present), Charles Schwab Investment Advisory, Inc.; Chief Executive Officer (Apr. 2019 – present), President (Nov. 2018 – present) and Trustee (Apr. 2019 – Dec. 2020), Schwab Funds, Laudus Trust and Schwab ETFs; Director (Apr. 2019 – present), Charles Schwab Worldwide Funds plc and Charles Schwab Asset Management (Ireland) Limited; Senior Vice President (Apr. 2019 – present), Senior Vice President – Strategy and Product Development (CSIM) (Jan. 2014 – Mar. 2019), and Vice President (Jan. 2009 – Dec. 2013), Charles Schwab & Co., Inc. |
Mark Fischer
1970
Treasurer, Chief Financial Officer and Chief Operating Officer
(Officer of The Charles Schwab Family of Funds, Schwab Investments, Schwab Capital Trust, Schwab Annuity Portfolios, Schwab Strategic Trust and Laudus Trust since 2013) | Treasurer and Chief Financial Officer (Jan. 2016 – present) and Chief Operating Officer (Dec. 2020 – present), Schwab Funds, Laudus Trust and Schwab ETFs; Assistant Treasurer (Dec. 2013 – Dec. 2015), Schwab Funds and Laudus Trust; Assistant Treasurer (Nov. 2013 – Dec. 2015), Schwab ETFs; Chief Financial Officer (Mar. 2020 – present) and Vice President (Oct. 2013 – present), Charles Schwab Investment Management, Inc.; Executive Director (Apr. 2011 – Sept. 2013), J.P. Morgan Investor Services; Assistant Treasurer (May 2005 – Mar. 2011), Massachusetts Financial Service Investment Management. |
Omar Aguilar
1970
Vice President and Chief Investment Officer
(Officer of The Charles Schwab Family of Funds, Schwab Investments, Schwab Capital Trust, Schwab Annuity Portfolios, Schwab Strategic Trust and Laudus Trust since 2011) | Chief Executive Officer (Jan. 2022 – present) and Chief Investment Officer (Apr. 2011 – present), Senior Vice President (Apr. 2011 – Dec. 2021), Charles Schwab Investment Management, Inc.; Vice President and Chief Investment Officer (June 2011 – present), Schwab Funds, Laudus Trust and Schwab ETFs; Head of the Portfolio Management Group and Vice President of Portfolio Management (May 2009 – Apr. 2011), Financial Engines, Inc. (investment management firm); Head of Quantitative Equity (July 2004 – Jan. 2009), ING Investment Management. |
Brett Wander
1961
Vice President and Chief Investment Officer
(Officer of The Charles Schwab Family of Funds, Schwab Investments, Schwab Capital Trust, Schwab Annuity Portfolios, Schwab Strategic Trust and Laudus Trust since 2011) | Senior Vice President and Chief Investment Officer (Apr. 2011 – present), Charles Schwab Investment Management, Inc.; Vice President and Chief Investment Officer (June 2011 – present), Schwab Funds, Laudus Trust and Schwab ETFs; Senior Managing Director and Global Head of Active Fixed-Income Strategies (Jan. 2008 – Oct. 2010), State Street Global Advisors; Director of Alpha Strategies (Apr. 2006 – Jan. 2008), Loomis, Sayles & Company (investment management firm). |
William P. McMahon, Jr.
1972
Vice President and Chief Investment Officer
(Officer of The Charles Schwab Family of Funds, Schwab Investments, Schwab Capital Trust, Schwab Annuity Portfolios, Schwab Strategic Trust and Laudus Trust since 2021) | Senior Vice President and Chief Investment Officer (Jan. 2020 – present), Charles Schwab Investment Management, Inc.; Vice President and Chief Investment Officer (June 2021 – present), Schwab Funds, Laudus Trust and Schwab ETFs; Senior Vice President and Chief Investment Officer – ThomasPartners Strategies (Apr. 2018 – Dec. 2019), Charles Schwab Investment Advisory, Inc.; Senior Vice President and Chief Investment Officer (May 2001 – Apr. 2018), ThomasPartners, Inc. |
Catherine MacGregor
1964
Chief Legal Officer and Secretary, Schwab Funds and Schwab ETFs
Chief Legal Officer, Vice President and Clerk, Laudus Trust
(Officer of The Charles Schwab Family of Funds, Schwab Investments, Schwab Capital Trust, Schwab Annuity Portfolios and Laudus Trust since 2005; Schwab Strategic Trust since 2009) | Vice President (July 2005 – present), Charles Schwab & Co., Inc.; Vice President (Sept. 2005 – present), Charles Schwab Investment Management, Inc.; Vice President (Dec. 2005 – present) and Chief Legal Officer and Clerk (Mar. 2007 – present), Laudus Trust; Chief Legal Officer and Secretary (Oct. 2021 – present), Vice President (Nov. 2005 – Oct. 2021) and Assistant Secretary (June 2007 – Oct. 2021), Schwab Funds; Chief Legal Officer and Secretary (Oct. 2021 – present), Vice President and Assistant Secretary (Oct. 2009 – Oct. 2021), Schwab ETFs. |
| 1 | Each Trustee shall hold office until the election and qualification of his or her successor, or until he or she dies, resigns or is removed. The retirement policy requires that each independent trustee retire by December 31 of the year in which the Trustee turns 74 or the Trustee’s twentieth year of service as an independent trustee on any trust in the Fund Complex, whichever occurs first. |
| 2 | Mr. Bettinger and Mr. Martinetto are Interested Trustees. Mr. Bettinger is an Interested Trustee because he owns stock of The Charles Schwab Corporation (CSC), the parent company of Charles Schwab Investment Management, Inc., the investment adviser for the trusts in the Fund Complex, and is an employee of Charles Schwab & Co., Inc. (Schwab), the principal underwriter for The Charles Schwab Family of Funds, Schwab Investments, Schwab Capital Trust, Schwab Annuity Portfolios and Laudus Trust. Mr. Martinetto is an Interested Trustee because he owns stock of CSC and is an employee and director of Schwab. |
| 3 | The President, Treasurer and Secretary/Clerk hold office until their respective successors are chosen and qualified or until he or she sooner dies, resigns, is removed or becomes disqualified. Each of the other officers serves at the pleasure of the Board. |
Schwab VIT Balanced Portfolio | Annual Report
Schwab VIT Balanced Portfolio
Bloomberg US Aggregate Bond Index An index that is a broad-based benchmark measuring the performance of the U.S. investment grade, taxable bond market, including U.S. Treasuries, government-related and corporate bonds, mortgage pass-through securities, commercial mortgage-backed securities, and asset-backed securities that are publicly available for sale in the United States. To be eligible for inclusion in the index, securities must be fixed rate, non-convertible, U.S. dollar-denominated with at least $300 million or more of outstanding face value and have one or more years remaining to maturity. The index excludes certain types of securities, including tax-exempt state and local government series bonds, structured notes embedded with swaps or other special features, private placements, floating rate securities, inflation-linked bonds and Eurobonds. The index is market capitalization weighted and the securities in the index are updated on the last business day of each month.
Bloomberg US Treasury 1–3 Year Index An index which includes all publicly-issued U.S. Treasury securities that have a remaining maturity of greater than or equal to one year and less than three years, are rated investment grade, and have $300 million or more of outstanding face value. The securities in the index must be denominated in U.S. dollars and must be fixed-rate and non-convertible. The index excludes state and local government series bonds and coupon issues that have been stripped from bonds. The index is market capitalization weighted and the securities in the index are updated on the last business day of each month.
Bloomberg US Treasury 3–10 Year Index An index which includes all publicly-issued U.S. Treasury securities that have a remaining maturity of greater than or equal to three years and less than ten years, are rated investment grade, and have $300 million or more of outstanding face value. The securities in the index must be denominated in U.S. dollars and must be fixed-rate and non-convertible. The index excludes state and local government series bonds and coupon issues that have been stripped from bonds. The index is market capitalization weighted and the securities in the index are updated on the last business day of each month.
Bloomberg US Treasury Bills 1–3 Month Index An index that includes all publicly issued zero-coupon U.S. Treasury Bills that have a remaining maturity of less than 3 months but more than 1 month, are rated investment grade and have $300 million or more of outstanding face value. It excludes zero-coupon STRIPS.
Bloomberg US Treasury Inflation-Linked Bond Index (Series-L) An index which includes all publicly-issued U.S. Treasury Inflation-Protected Securities (TIPS) that have at least one year remaining to maturity, are rated investment grade and have $500 million or more of outstanding face value. The TIPS in the index must be denominated in U.S. dollars and must be fixed-rate and non-convertible. The index is market capitalization weighted and the TIPS in the index are updated on the last business day of each month. TIPS are publicly issued, dollar denominated U.S. Government securities issued by the U.S. Treasury that have principal and interest payments linked to an official inflation measure (as measured by the Consumer Price Index, or CPI) and their payments are supported by the full faith and credit of the United States.
Dow Jones Equity All REIT Capped Index A float-adjusted market cap weighted index that is designed to measure all equity real estate investment trusts (REITs) in the Dow Jones U.S. Total Stock Market Index, as defined by the S&P Dow Jones Indices REIT/RESI Industry Classification Hierarchy, that meet the minimum float market capitalization (FMC) and liquidity thresholds. The aggregate weight of
all companies weighing more than 4.5% cannot exceed 22.5%, and no single company’s weight can exceed 10%. The index is reviewed daily based on each company’s capped market capitalization weight. Daily capping is only performed when the sum of companies with weights great than 5% exceeds 25%.
Dow Jones U.S. Large-Cap Total Stock Market Index An index that is a subset of the Dow Jones U.S. Total Stock Market Index, and is designed to measure the performance of large-cap U.S. equity securities. The index is a float-adjusted market capitalization weighted index.
Dow Jones U.S. Select REIT Index An index that is a float-adjusted market-capitalization weighted index comprised of income-producing commercial and/or residential real estate investment trusts (REITs). The index excludes mortgage REITs, net-lease REITs, real estate finance companies, mortgage brokers and bankers, commercial and residential real estate brokers and estate agents, homebuilders, large landowners and sub-dividers of unimproved land, hybrid REITs, timber REITs and companies that have more than 25% of their assets in direct mortgage investments.
Dow Jones U.S. Small-Cap Total Stock Market Index An index that is a subset of the Dow Jones U.S. Total Stock Market Index, and is designed to measure the performance of small-cap U.S. equity securities. The index is a float-adjusted market capitalization weighted index.
Dow Jones U.S. Total Stock Market Index An index which includes all U.S. equity issues with readily available prices. The index is a float-adjusted market capitalization weighted index that reflects the shares of securities actually available to investors in the marketplace.
FTSE Developed ex US Index (Net) An index that is comprised of large- and mid-capitalization companies in developed countries outside the United States, as defined by the index provider. The index defines the large- and mid-capitalization universe as approximately the top 90% of the eligible universe. The Net version of the index reflects reinvested dividends net of withholding taxes, but reflects no deductions for expenses or other taxes.
FTSE Developed Small Cap ex US Liquid Index (Net) An index comprised of small-capitalization companies in developed countries outside the United States, as defined by the index provider. The index defines the small-capitalization universe as approximately the bottom 10% of the eligible universe with a minimum free float capitalization of $150 million. The Net version of the index reflects reinvested dividends net of withholding taxes, but reflects no deductions for expenses or other taxes.
FTSE Emerging Index (Net) An index that is comprised of large- and mid-capitalization companies in emerging market countries, as defined by the index provider. The index defines the large- and mid-capitalization universe as approximately the top 90% of the eligible universe. The Net version of the index reflects reinvested dividends net of withholding taxes, but reflects no deductions for expenses or other taxes.
FTSE non-US Dollar World Government Bond Index A market capitalization index that measures the total rate of return performance for the government bonds of 22 countries, excluding the U.S., with a remaining maturity of at least 1 year.
Schwab VIT Balanced Portfolio | Annual Report
Schwab VIT Balanced Portfolio
MSCI EAFE Index (Net) A free float-adjusted market capitalization index that is designed to measure the equity market performance of developed markets in Europe, Australasia, and the Far East. The Net version of the index reflects reinvested dividends net of withholding taxes, but reflects no deductions for expenses or other taxes; returns are calculated applying dividend withholding rates applicable to non-resident persons who do not benefit from double taxation treaties.
MSCI Emerging Markets Index (Net) A free float-adjusted market capitalization weighted index that is designed to measure equity market performance in the global emerging markets. This series approximates the minimum possible dividend reinvestment. The returns are calculated applying dividend withholding rates applicable to non-resident persons who do not benefit from double taxation treaties.
Russell 2000 Index An index that measures the performance of the 2,000 smallest companies in the Russell 3000 Index. The Russell 3000 Index measures the performance of the largest 3,000 U.S. companies representing approximately 98% of the investable U.S. equity market.
S&P 500 Index An index that is designed to measure the performance of 500 leading publicly traded companies from a broad range of industries.
VIT Balanced Composite Index A custom blended index developed by Schwab Asset Management based on a comparable portfolio asset allocation and calculated using the following portion allocations effective July 1, 2020: 36.3% Bloomberg US Aggregate Bond Index, 9.0% Bloomberg US Treasury 1-3 Year Index, 4.0% Bloomberg US Treasury Bills 1-3 Month Index, 3.7% Bloomberg US Treasury Inflation-Linked Bond Index (Series-L), 6.0% Dow Jones Equity All REIT Capped Index, 19.0% Dow Jones U.S. Large-Cap Total Stock Market Index, 4.0% Dow Jones U.S. Small-Cap Total Stock Market Index, 5.0% FTSE All Emerging Index (Net), 11.0% FTSE Developed ex US Index
(Net), and 2.0% FTSE Developed Small Cap ex US Liquid Index (Net). From April 29, 2020 through June 30, 2020, the blended index was derived using the following allocations: 36.3% Bloomberg US Aggregate Bond Index, 9.0% Bloomberg US Treasury 1-3 Year Index, 4.0% Bloomberg US Treasury Bills 1-3 Month Index, 3.7% Bloomberg US Treasury Inflation-Linked Bond Index (Series-L), 6.0% Dow Jones U.S. Select REIT Index, 19.0% Dow Jones U.S. Large-Cap Total Stock Market Index, 4.0% Dow Jones U.S. Small-Cap Total Stock Market Index, 5.0% FTSE All Emerging Index (Net), 11.0% FTSE Developed ex US Index (Net), and 2.0% FTSE Developed Small Cap ex US Liquid Index (Net). From June 8, 2016 through April 28, 2020, the blended index was derived using the following allocations: 2% Bloomberg Global Treasury ex-US Capped Index, 34% Bloomberg US Aggregate Bond Index, 15% Bloomberg US Treasury Bills 1-3 Month Index, 2% Bloomberg US Treasury Inflation-Linked Bond Index (Series-L), 3% Bloomberg Commodity Index, 6% Dow Jones U.S. Select REIT Index, 15% Dow Jones U.S. Large-Cap Total Stock Market Index, 4% Dow Jones U.S. Small-Cap Total Stock Market Index, 5% FTSE All Emerging Index (Net), 11% FTSE Developed ex US Index (Net), 2% FTSE Developed Small Cap ex US Liquid Index (Net), and 1% Russell Microcap Index. Prior to June 8, 2016, the composite index was derived using the following allocations: 15% Dow Jones U.S. Large-Cap Total Stock Market Index, 4% Dow Jones U.S. Small-Cap Total Stock Market Index, 1% Russell Microcap Index, 11% FTSE Developed ex US Index (Net), 2% FTSE Developed Small Cap ex US Liquid Index (Net), 5% FTSE Emerging Index (Net), 6% Dow Jones U.S. Select REIT Index, 3% Dow Jones UBS Commodity Index, 2% Bloomberg US Treasury Inflation-Linked Bond Index (Series-L), 12% Bloomberg US Treasury 3-10 Year Index, 2% Bloomberg US Aggregate: Agencies Index, 6% Bloomberg US Credit Index, 13% Bloomberg US Mortgage Backed Securities Index, 2% Bloomberg Global Treasury ex-US Capped Index, 1% Bloomberg High Yield Bond Very Liquid Index, and 15% Bloomberg US Treasury Bills 1–3 Month Index.
Schwab VIT Balanced Portfolio | Annual Report
Annual Report | December 31, 2021
Schwab VIT Balanced with Growth Portfolio
Proxy Voting Policies, Procedures and Results
A description of the proxy voting policies and procedures used to determine how to vote proxies on behalf of the funds is available without charge, upon request, by visiting the Schwab Fund’s website at www.schwabassetmanagement.com/schwabfunds_prospectus, the SEC’s website at www.sec.gov, or by contacting Schwab Funds at 1-877-824-5615.
Information regarding how a fund voted proxies relating to portfolio securities during the most recent twelve-month period ended June 30 is available, without charge, by visiting Schwab’s website at www.schwabassetmanagement.com/schwabfunds_prospectus or the SEC’s website at www.sec.gov.
Investment Adviser: Charles Schwab Investment Management, Inc., dba Schwab Asset ManagementTM
Schwab VIT Balanced with Growth Portfolio
The Investment Environment
For the 12-month reporting period ended December 31, 2021, global equities generated mostly positive returns, particularly in the United States, where several key equity market indices ended the reporting period just off record highs. Developed international equity markets were less robust but still positive, while emerging markets and most U.S. fixed-income markets lost ground. Despite persisting COVID-19 pandemic-driven stresses on the global economy and the emergence and rapid spread of the Delta variant during the summer and the Omicron variant in the late fall, equity markets rose through most of the period on strong earnings, ongoing fiscal stimulus measures, and optimism related to increased COVID-19 vaccination rates. Amid growing evidence of a slowing global economy and rising inflation, stocks did weaken somewhat in September and again in late November and early December but quickly regained their momentum. U.S. and developed international equity markets maintained their strength, emerging markets declined, demand for bonds waned, and bond yields rose as prices sank. (Bond yields and bond prices typically move in opposite directions.) Over the reporting period, the U.S. dollar strengthened against a basket of international currencies, generally decreasing the returns on overseas investments in U.S. dollar terms. For the reporting period, the S&P 500® Index, a bellwether for the overall U.S. stock market, returned 28.71%. Outside the United States, the MSCI EAFE® Index (Net)*, a broad measure of developed international equity performance, returned 11.26%. Emerging market equities were weaker, with the MSCI Emerging Markets Index (Net)* returning -2.54%. Fixed-income markets were also weaker, with the Bloomberg US Aggregate Bond Index returning -1.54% and the FTSE non-US Dollar World Government Bond Index returning -9.68%.
Bolstered by the extensive emergency rescue and fiscal stimulus measures passed by the U.S. Congress and U.S. Federal Reserve (Fed) in March 2020, the U.S. economy began to recover from the dramatic impact of the COVID-19 pandemic beginning in the third quarter of 2020. U.S. gross domestic product (GDP) rose at an annualized rate of 6.4% for the first quarter of 2021 and 6.7% for the second quarter of 2021, before falling back to 2.0% for the third quarter of 2021 amid fading government stimuli, persistent inflation, and new surges in COVID-19 cases. Unemployment, which skyrocketed in April 2020, fell over the reporting period, and ended at its lowest level since February 2020. Inflation, which had remained well below the Fed’s traditional 2% target until it jumped in March 2021,
Asset Class Performance Comparison % returns during the 12 months ended December 31, 2021
Index figures assume dividends and distributions were reinvested. Index figures do not include trading and management costs, which would lower performance. Indices are unmanaged and cannot be invested in directly. Performance results less than one year are not annualized. Past performance is not an indication of future results.
For index definitions, please see the Glossary.
Data source: Index provider websites and Schwab Asset Management.
Nothing in this report represents a recommendation of a security by the investment adviser.
Management views may have changed since the report date.
| * | The net version of the index reflects reinvested dividends net of withholding taxes, but reflects no deductions for expenses or other taxes. |
Schwab VIT Balanced with Growth Portfolio | Annual Report
Schwab VIT Balanced with Growth Portfolio
The Investment Environment (continued)
continued to rise over the reporting period, largely due to imbalances in the labor market, supply chain bottlenecks, and higher energy costs.
Outside the United States, global economies also displayed resilience but were somewhat more constrained amid continuing struggles against COVID-19 and the emergence and spread of the Delta and Omicron variants. Oil prices rebounded over much of the reporting period, except for dips in July and August and November, on growing demand and reduced production. In the eurozone, GDP growth turned positive for the second and third quarters of 2021, following two previous quarters of contraction. In the United Kingdom, which was particularly hard-hit by the COVID-19 pandemic, GDP growth was negative for the first quarter of 2021, turned strongly positive for the second quarter of 2021, then fell back to just slightly positive for the third quarter of 2021. Japan’s economy vacillated between contraction in the first and third quarters of 2021 and a small gain in the second quarter of 2021 on a resurgence of COVID-19 cases and persistent supply chain disruptions. Among emerging markets, China’s GDP growth rate accelerated sharply for the first quarter of 2021 before easing for the subsequent two quarters, albeit remaining positive, in part because of the political landscape and an emphasis on domestic consumption over globalization. India, after plunging into one of the worst recessions of any major economy in 2020, posted a sharp jump in GDP growth for the second quarter of 2021 before falling back for the third quarter of 2021.
For the most part, central banks around the world, maintained the low—and for some international central banks, negative—interest rates instituted prior to, and in response to, the COVID-19 pandemic. In the United States, the Fed reiterated several times during the reporting period its intention to continue its support of the economy for as long as needed to achieve a full recovery. The Fed maintained the federal funds rate in a range of 0.00% to 0.25% throughout the reporting period. However, as inflation continued to rise and indicators of economic activity and employment continued to strengthen, the Fed began scaling back its bond-buying program in November 2021 citing significant progress made on its twin goals of maximum employment and price stability. The Fed subsequently accelerated its wind-down in December 2021 with expectations to end it altogether by March 2022. Fed officials also signaled that interest rates could begin to rise sooner in 2022 than previously anticipated, although the Fed cautioned that the path of the economy continues to depend on the course of the COVID-19 pandemic. In developed international markets, most central banks were similarly accommodative while acknowledging economic improvements and, in some cases, changes in monetary policy. The European Central Bank held its interest rate at 0.00%, unchanged since March 2016. However, in December 2021, it announced that in the first quarter of 2022 it would reduce the pace of its asset purchase program that it had instituted to help counter the serious risks posed by the COVID-19 pandemic. The Bank of Japan upheld its short-term interest rate target of -0.1%, also unchanged since 2016, and also announced its plans to taper its corporate debt buying to pre-pandemic levels. In December 2021, the Bank of England raised its key official bank rate from 0.1% to 0.25%, its first rate hike since the onset of the COVID-19 pandemic, citing inflation pressures. Emerging markets were mixed. China cut its interest rate by 0.05% in December. Indonesia and India maintained low policy rates implemented in 2020 and early 2021. Central banks in Mexico, Brazil, Russia, and Pakistan raised their rates, citing a stronger-than-expected recovery or to counteract the impacts of inflation.
After languishing at historically low levels since the onset of the COVID-19 pandemic, U.S. bond yields climbed steadily through the first quarter of the reporting period as COVID-19 vaccine distribution ramped up rapidly and investors anticipated an accelerating economic recovery. From April through July, yields drifted lower on tepid employment reports and growing inflation concerns before gradually, albeit non-linearly, rising again by the end of the reporting period. The yield on the 10-year U.S. Treasury began the reporting period at 0.93%, hit a reporting-period high of 1.74% in March, and fell back to end the reporting period at 1.52%. Short-term rates, which remained near historic lows, fell further, with the yield on the three-month U.S. Treasury dropping to 0.06% from 0.09% over the reporting period. Outside the U.S., bond yields generally remained low.
Schwab VIT Balanced with Growth Portfolio | Annual Report
Schwab VIT Balanced with Growth Portfolio
 | Zifan Tang, Ph.D., CFA, Senior Portfolio Manager, is responsible for the co-management of the fund. Prior to joining Schwab in 2012, Ms. Tang was a product manager at Thomson Reuters and from 1997 to 2009 worked as a portfolio manager at Barclays Global Investors (now known as BlackRock). |
 | Patrick Kwok, CFA, Portfolio Manager, is responsible for the co-management of the fund. Previously, Mr. Kwok served as an associate portfolio manager from 2012 to 2016. Prior to that, he worked as a fund administration manager, where he was responsible for oversight of sub-advisers, trading, cash management, and fund administration supporting the Charles Schwab Trust Bank Collective Investment Trusts and multi-asset Schwab Funds. Prior to joining Schwab Asset Management in 2008, Mr. Kwok spent two years as an asset operations specialist at Charles Schwab Trust Company. He also worked for one year at State Street Bank & Trust as a portfolio accountant and pricing specialist. |
Schwab VIT Balanced with Growth Portfolio | Annual Report
Schwab VIT Balanced with Growth Portfolio as of December 31, 2021
The Schwab VIT Balanced with Growth Portfolio (the fund) seeks long-term capital appreciation and income. To pursue its goal, the fund aims to provide diversification across major asset classes, including domestic equity securities, international equity securities, real assets, fixed-income securities, and money market investments, as well as diversification across a range of sub-asset classes within the major asset classes.
The fund is considered a “fund-of-funds” in that it gains exposure to these asset classes by primarily investing in affiliated exchange-traded funds (ETFs) from Schwab Funds. The fund may also invest in affiliated mutual funds from Schwab Funds and Laudus Funds and unaffiliated third-party ETFs and mutual funds. The fund normally will invest, including its investments in the underlying funds, at least 25% of its assets in equity securities and at least 25% of its assets in fixed-income securities, which may include bonds, cash equivalents, money market funds and money market investments. The fund’s allocation is weighted toward equity securities (domestic and international) that seek capital growth. The term “growth” in the fund’s name refers to the fund’s weighting towards capital growth. As of the fund’s most recent prospectus, the target asset class allocation ranges are 25-50% in fixed-income securities and 50-75% in equity securities.
Market Highlights. For the 12-month reporting period ended December 31, 2021, global equities generated mostly positive returns, particularly in the United States, where several key equity market indices ended the reporting period just off record highs. Developed international equity markets were less robust but still positive, while emerging markets and most U.S. fixed-income markets lost ground. Despite persisting COVID-19 pandemic-driven stresses on the global economy and the emergence and rapid spread of the Delta variant during the summer and the Omicron variant in the late fall, equity markets rose through most of the period on strong earnings, ongoing fiscal stimulus measures, and optimism related to increased COVID-19 vaccination rates. Amid growing evidence of a slowing global economy and rising inflation, stocks did weaken somewhat in September and again in late November and early December but quickly regained their momentum. U.S. and developed international equity markets maintained their strength, emerging markets declined, demand for bonds waned, and bond yields rose as prices sank. (Bond yields and bond prices typically move in opposite directions.) Over the reporting period, the U.S. dollar strengthened against a basket of international currencies, generally decreasing the returns on overseas investments in U.S. dollar terms.
Performance. For the 12-month reporting period ended December 31, 2021, the fund returned 11.42%. The Dow Jones U.S. Total Stock Market Index and the Bloomberg US Aggregate Bond Index, reflecting broad-based U.S. stock and bond market performance, returned 25.66% and -1.54%, respectively. The fund’s internally calculated comparative index, the VIT Balanced with Growth Composite Index (the composite index), returned 12.10%.
Positioning and Strategies. The fund’s allocations were broadly in line with those of the composite index.
The fund’s U.S. equity exposure was the largest contributor to the total return of the fund. The Schwab U.S. Large-Cap ETF was the largest contributor to the total return of the fund, returning approximately 27% for the reporting period, generally tracking its comparative index component. The Schwab U.S. Small-Cap ETF also contributed to the total return of the fund, returning approximately 16% for the reporting period and generally tracking its comparative index component.
The fund’s international equity exposure also contributed to the total return of the fund. The Schwab International Equity ETF, representing the fund’s developed international markets exposure, returned approximately 11% for the reporting period and the Schwab International Small-Cap Equity ETF, representing the fund’s international small-cap exposure, returned approximately 12% for the reporting period. The Schwab Emerging Markets Equity ETF, representing the fund’s emerging markets exposure, detracted slightly from the fund’s total return, returning approximately -1% for the reporting period. On a relative basis, the three international equity funds generally tracked their comparative index components.
The fund’s real estate exposure also contributed to the total return of the fund, with the Schwab U.S. REIT ETF returning approximately 41% for the reporting period.
The fund’s fixed-income exposure detracted from the total return of the fund. The Schwab U.S. Aggregate Bond ETF was the largest detractor from the total return of the fund, returning approximately -2% for the reporting period and generally tracking its comparative index component. The Schwab Short-Term U.S. Treasury ETF also detracted from the total return of the fund, returning approximately -1% for the reporting period and also generally tracking its comparative index component. The Schwab U.S. TIPS ETF contributed to the total return of the fund, returning approximately 6% for the reporting period and generally tracking its comparative index component.
Management views and portfolio holdings may have changed since the report date.
Schwab VIT Balanced with Growth Portfolio | Annual Report
Schwab VIT Balanced with Growth Portfolio
Performance and Fund Facts as of December 31, 2021
The performance data quoted represents past performance. Past performance does not guarantee future results. Investment returns and principal value will fluctuate so that an investor’s shares may be worth more or less than their original cost. Current performance may be lower or higher than performance data quoted. To obtain performance information current to the most recent month end, please visit www.schwabassetmanagement.com/schwabfunds_prospectus.
Performance of Hypothetical $10,000 Investment (July 25, 2012 – December 31, 2021)1
Average Annual Total Returns1
| Fund and Inception Date | 1 Year | 5 Years | Since Inception |
| Fund: Schwab VIT Balanced with Growth Portfolio (07/25/12) | 11.42% | 8.96% | 7.44% |
| S&P 500® Index | 28.71% | 18.47% | 16.70% |
| Bloomberg US Aggregate Bond Index | -1.54% | 3.57% | 2.66% |
| VIT Balanced with Growth Composite Index | 12.10% | 9.55% | 8.17% |
| Fund Category: Morningstar Allocation – 50% to 70% Equity2 | 12.83% | 10.22% | N/A |
| Fund Expense Ratio3: 0.57% |
All total return figures on this page assume dividends and distributions were reinvested. Index figures do not include trading and management costs, which would lower performance. Indices are unmanaged and cannot be invested in directly. Performance results less than one year are not annualized.
The components that make up the composite index may vary over time. For index definitions, please see the Glossary.
| 1 | Fund expenses may have been partially absorbed by the investment adviser and its affiliates. Without these reductions, the fund’s returns would have been lower. Fund performance does not reflect the additional fees and expenses imposed by the insurance company under the variable insurance product contract. If those contract fees and expenses were included, the performance would be less than that shown. Please refer to the variable insurance product prospectus for a complete listing of these expenses. |
| 2 | Source for category information: Morningstar, Inc. The Morningstar Category return represents all active and index mutual funds within the category as of the report date. |
| 3 | As stated in the prospectus. Includes 0.07% of acquired fund fees and expenses (AFFE), which are indirect expenses incurred by the fund through its investments in the underlying funds. Reflects the total annual fund operating expenses without contractual fee waivers. For actual expense ratios during the period, not including AFFE, refer to the Financial Highlights section of the financial statements. |
Schwab VIT Balanced with Growth Portfolio | Annual Report
Schwab VIT Balanced with Growth Portfolio
Performance and Fund Facts as of December 31, 2021 (continued)
| Number of Holdings | 11 |
| Portfolio Turnover Rate | 8% |
Asset Class Weightings % of Investments1,2
Top Holdings % of Net Assets1,3,4
Portfolio holdings may have changed since the report date.
| 1 | The fund intends to primarily invest in affiliated Schwab ETFs and may also invest in affiliated Schwab Funds and Laudus Funds and unaffiliated third-party ETFs and mutual funds (all such ETFs and mutual funds referred to as “underlying funds”). The fund may also invest directly in equity, fixed-income, or other securities or investments, as appropriate, consistent with its investment objectives, strategies, and policies. |
| 2 | The percentage may differ from the Portfolio Holdings because the above calculation is based on a percentage of total investments, whereas the calculation in the Portfolio Holdings is based on a percentage of net assets. |
| 3 | This list is not a recommendation of any security by the investment adviser. |
| 4 | The holdings listed exclude any temporary liquidity investments. |
Schwab VIT Balanced with Growth Portfolio | Annual Report
Schwab VIT Balanced with Growth Portfolio
Fund Expenses (Unaudited)
Examples for a $1,000 Investment
As a fund shareholder, you may incur two types of costs: (1) transaction costs; and (2) ongoing costs, including management fees, transfer agent fees, and other fund expenses.
The expense examples below are intended to help you understand your ongoing cost (in dollars) of investing in the fund and to compare this cost with the ongoing cost of investing in other mutual funds. These examples are based on an investment of $1,000 invested for six months beginning July 1, 2021 and held through December 31, 2021.
The Actual Return line in the table below provides information about actual account values and actual expenses. You may use this information, together with the amount you invested, to estimate the expenses that you paid over the period. To do so, simply divide your account value by $1,000 (for example, an $8,600 account value ÷ $1,000 = 8.6), then multiply the result by the number given for the fund under the heading entitled “Expenses Paid During Period.”
The Hypothetical Return line in the table below provides information about hypothetical account values and hypothetical expenses based on the fund’s actual expense ratio and an assumed return of 5% per year before expenses. Because the return used is not an actual return, it may not be used to estimate the actual ending account value or expenses you paid for the period.
You may use this information to compare the ongoing costs of investing in the fund and other funds. To do so, compare this 5% hypothetical example with the 5% hypothetical examples that appear in the shareholder reports of the other funds.
Please note that the expenses shown in the table are meant to highlight your ongoing costs only, and do not reflect any transactional costs. Therefore, the hypothetical return lines of the table are useful in comparing ongoing costs only, and will not help you determine the relative total costs of owning different funds. In addition, if these transactional costs were included, your costs would have been higher.
| | EXPENSE RATIO
(ANNUALIZED)1,2 | EFFECTIVE
EXPENSE RATIO
(ANNUALIZED)3,4 | BEGINNING
ACCOUNT VALUE
AT 7/1/21 | ENDING
ACCOUNT VALUE
(NET OF EXPENSES)
AT 12/31/212 | EXPENSES PAID
DURING PERIOD
7/1/21-12/31/212,5 | EFFECTIVE
EXPENSES PAID
DURING PERIOD
7/1/21-12/31/214,5 |
| Schwab VIT Balanced with Growth Portfolio | | | | | | |
| Actual Return | 0.49% | 0.54% | $1,000.00 | $1,030.50 | $2.51 | $2.76 |
| Hypothetical 5% Return | 0.49% | 0.54% | $1,000.00 | $1,022.74 | $2.50 | $2.75 |
| 1 | Based on the most recent six-month expense ratio; may differ from the expense ratio provided in the Financial Highlights. |
| 2 | Excludes acquired fund fees and expenses, which are indirect expenses incurred by the fund through its investments in underlying funds. |
| 3 | Based on the most recent six-month acquired fund fees and expenses and the expense ratio; may differ from the acquired fund fees and expenses and the expense ratio in the prospectus. |
| 4 | Includes acquired fund fees and expenses, which are indirect expenses incurred by the fund through its investments in underlying funds. |
| 5 | Expenses for the fund are equal to its annualized expense ratio, multiplied by the average account value over the period, multiplied by 184 days of the period, and divided by the 365 days of the fiscal year. |
Schwab VIT Balanced with Growth Portfolio | Annual Report
Schwab VIT Balanced with Growth Portfolio
Financial Statements
FINANCIAL HIGHLIGHTS
| | 1/1/21–
12/31/21 | 1/1/20–
12/31/20 | 1/1/19–
12/31/19 | 1/1/18–
12/31/18 | 1/1/17–
12/31/17 | |
| Per-Share Data |
| Net asset value at beginning of period | $15.68 | $14.59 | $12.66 | $13.80 | $12.38 | |
| Income (loss) from investment operations: | | | | | | |
| Net investment income (loss)1 | 0.25 | 0.22 | 0.28 | 0.25 | 0.22 | |
| Net realized and unrealized gains (losses) | 1.53 | 1.20 | 1.99 | (1.16) | 1.46 | |
| Total from investment operations | 1.78 | 1.42 | 2.27 | (0.91) | 1.68 | |
| Less distributions: | | | | | | |
| Distributions from net investment income | (0.22) | (0.29) | (0.26) | (0.21) | (0.18) | |
| Distributions from net realized gains | — | (0.04) | (0.08) | (0.02) | (0.08) | |
| Total distributions | (0.22) | (0.33) | (0.34) | (0.23) | (0.26) | |
| Net asset value at end of period | $17.24 | $15.68 | $14.59 | $12.66 | $13.80 | |
| Total return | 11.42% | 10.09% | 18.05% | (6.70%) | 13.70% | |
| Ratios/Supplemental Data |
| Ratios to average net assets: | | | | | | |
| Net operating expenses2 | 0.49% | 0.50% | 0.51% | 0.50% | 0.51% | |
| Gross operating expenses2 | 0.49% | 0.50% | 0.51% | 0.50% | 0.51% | |
| Net investment income (loss) | 1.48% | 1.56% | 2.04% | 1.87% | 1.65% | |
| Portfolio turnover rate | 8% | 21% | 7% | 8% | 6% | |
| Net assets, end of period (x 1,000,000) | $184 | $164 | $162 | $140 | $150 | |
| 1 | Calculated based on the average shares outstanding during the period. |
| 2 | Ratio excludes acquired fund fees and expenses, which are indirect expenses incurred by the fund through its investments in underlying funds. |
Schwab VIT Balanced with Growth Portfolio | Annual Report
Schwab VIT Balanced with Growth Portfolio
Portfolio Holdings as of December 31, 2021
This section shows all the securities in the fund’s portfolio and their values as of the report date.
The fund files its complete schedule of portfolio holdings with the U.S. Securities and Exchange Commission (SEC) for the first and third quarters of each fiscal year on Form N-PORT Part F. The fund’s Form N-PORT Part F is available on the SEC’s website at www.sec.gov. The fund also makes available its complete schedule of portfolio holdings on the fund’s website at www.schwabassetmanagement.com/schwabfunds_prospectus, typically 60-80 days after the end of the fund’s fiscal quarter.
| SECURITY | NUMBER
OF SHARES | VALUE ($) |
| AFFILIATED UNDERLYING FUNDS 98.7% OF NET ASSETS |
| |
| U.S. Stocks 33.1% |
| Large-Cap 27.1% |
| Schwab U.S. Large-Cap ETF | 438,769 | 49,940,687 |
| Small-Cap 6.0% |
| Schwab U.S. Small-Cap ETF | 108,422 | 11,102,413 |
| | | 61,043,100 |
| |
| International Stocks 26.0% |
| Developed Markets 20.1% |
| Schwab International Equity ETF | 807,676 | 31,394,366 |
| Schwab International Small-Cap Equity ETF | 135,692 | 5,553,873 |
| | | 36,948,239 |
| Emerging Markets 5.9% |
| Schwab Emerging Markets Equity ETF | 367,785 | 10,893,792 |
| | | 47,842,031 |
| |
| Real Estate 6.1% |
| U.S. REITs 6.1% |
| Schwab U.S. REIT ETF | 214,029 | 11,277,189 |
| |
| Fixed Income 30.8% |
| Inflation-Protected Bond 1.0% |
| Schwab U.S. TIPS ETF | 28,249 | 1,776,580 |
| Intermediate-Term Bond 25.9% |
| Schwab U.S. Aggregate Bond ETF | 885,142 | 47,709,154 |
| SECURITY | NUMBER
OF SHARES | VALUE ($) |
| Treasury Bond 3.9% |
| Schwab Short-Term U.S. Treasury ETF | 140,731 | 7,156,171 |
| | | 56,641,905 |
| |
| Money Market Funds 2.7% |
| Schwab Variable Share Price Money Fund, Ultra Shares 0.03% (a) | 4,909,966 | 4,911,439 |
Total Affiliated Underlying Funds
(Cost $127,740,944) | 181,715,664 |
| ISSUER | FACE
AMOUNT ($) | VALUE ($) |
| SHORT-TERM INVESTMENTS 0.8% OF NET ASSETS |
| |
| Time Deposits 0.8% |
| Bank of Montreal |
| 0.01%, 01/03/22 (b) | 1,540,430 | 1,540,430 |
Total Short-Term Investments
(Cost $1,540,430) | 1,540,430 |
Total Investments in Securities
(Cost $129,281,374) | 183,256,094 |
| (a) | The rate shown is the 7-day yield. |
| (b) | The rate shown is the current daily overnight rate. |
| ETF — | Exchange traded fund |
| REIT — | Real Estate Investment Trust |
| TIPS — | Treasury Inflation Protected Securities |
Schwab VIT Balanced with Growth Portfolio | Annual Report
Schwab VIT Balanced with Growth Portfolio
Portfolio Holdings as of December 31, 2021 (continued)
Below is a summary of the fund’s transactions with its affiliated underlying funds during the period ended December 31, 2021:
| | VALUE AT
12/31/20 | PURCHASES | SALES | REALIZED
GAINS (LOSSES) | NET CHANGE IN
UNREALIZED
APPRECIATION
(DEPRECIATION) | VALUE AT
12/31/21 | BALANCE
OF SHARES
HELD AT
12/31/21 | DISTRIBUTIONS
RECEIVED* |
| AFFILIATED UNDERLYING FUNDS 98.7% OF NET ASSETS |
| |
| U.S. Stocks 33.1% |
| Large-Cap 27.1% |
| Schwab U.S. Large-Cap ETF | $44,487,283 | $2,104,210 | ($7,354,749) | $2,203,952 | $8,499,991 | $49,940,687 | 438,769 | $638,047 |
| Small-Cap 6.0% |
| Schwab U.S. Small-Cap ETF | 9,961,592 | 982,621 | (1,292,576) | 500,510 | 950,266 | 11,102,413 | 108,422 | 129,311 |
| | | | | | | 61,043,100 | | |
| |
| International Stocks 26.0% |
| Developed Markets 20.1% |
| Schwab International Equity ETF | 27,863,494 | 2,975,025 | (1,628,341) | 212,602 | 1,971,586 | 31,394,366 | 807,676 | 977,338 |
| Schwab International Small-Cap Equity ETF | 4,905,833 | 451,468 | (222,965) | 49,842 | 369,695 | 5,553,873 | 135,692 | 162,489 |
| | | | | | | 36,948,239 | | |
| Emerging Markets 5.9% |
| Schwab Emerging Markets Equity ETF | 10,002,106 | 1,907,021 | (650,169) | 125,905 | (491,071) | 10,893,792 | 367,785 | 299,360 |
| | | | | | | 47,842,031 | | |
| |
| Real Estate 6.1% |
| U.S. REITs 6.1% |
| Schwab U.S. REIT ETF | 9,786,274 | — | (2,019,152) | 373,897 | 3,136,170 | 11,277,189 | 214,029 | 181,858 |
| |
| Fixed Income 30.8% |
| Inflation-Protected Bond 1.0% |
| Schwab U.S. TIPS ETF | 1,659,709 | 94,303 | — | — | 22,568 | 1,776,580 | 28,249 | 77,179 |
| Intermediate-Term Bond 25.9% |
| Schwab U.S. Aggregate Bond ETF | 42,494,104 | 7,468,544 | (573,225) | (23,062) | (1,657,207) | 47,709,154 | 885,142 | 980,857 |
| Treasury Bond 3.9% |
| Schwab Short-Term U.S. Treasury ETF | 6,258,737 | 970,939 | — | — | (73,505) | 7,156,171 | 140,731 | 27,772 |
| | | | | | | 56,641,905 | | |
| |
| Money Market Funds 2.7% |
| Schwab Variable Share Price Money Fund, Ultra Shares | 4,909,874 | 1,682 | (117) | — | — | 4,911,439 | 4,909,966 | 1,561 |
| Total Affiliated Underlying Funds | $162,329,006 | $16,955,813 | ($13,741,294) | $3,443,646 | $12,728,493 | $181,715,664 | | $3,475,772 |
| * | Distributions received include distributions from net investment income and capital gains, if any, from the underlying funds. |
Schwab VIT Balanced with Growth Portfolio | Annual Report
Schwab VIT Balanced with Growth Portfolio
Portfolio Holdings as of December 31, 2021 (continued)
The following is a summary of the inputs used to value the fund’s investments as of December 31, 2021 (see financial note 2(a) for additional information):
| DESCRIPTION | QUOTED PRICES IN
ACTIVE MARKETS FOR
IDENTICAL ASSETS
(LEVEL 1) | OTHER SIGNIFICANT
OBSERVABLE INPUTS
(LEVEL 2) | SIGNIFICANT
UNOBSERVABLE INPUTS
(LEVEL 3) | TOTAL |
| Assets | | | | |
| Affiliated Underlying Funds1 | $181,715,664 | $— | $— | $181,715,664 |
| Short-Term Investments1 | — | 1,540,430 | — | 1,540,430 |
| Total | $181,715,664 | $1,540,430 | $— | $183,256,094 |
| 1 | As categorized in the Portfolio Holdings. |
Fund investments in mutual funds and ETFs are classified as Level 1, without consideration to the classification level of the underlying securities held by the mutual funds and ETFs, which could be Level 1, Level 2 or Level 3.
Schwab VIT Balanced with Growth Portfolio | Annual Report
Schwab VIT Balanced with Growth Portfolio
Statement of Assets and Liabilities
As of December 31, 2021
| Assets |
| Investments in securities, at value - affiliated (cost $127,740,944) | | $181,715,664 |
| Investments in securities, at value - unaffiliated (cost $1,540,430) | | 1,540,430 |
| Receivables: | | |
| Investments sold | | 1,333,432 |
| Dividends | | 54,002 |
| Prepaid expenses | + | 416 |
| Total assets | | 184,643,944 |
| Liabilities |
| Payables: | | |
| Investments bought | | 396,079 |
| Investment adviser and administrator fees | | 74,487 |
| Fund shares redeemed | | 35,959 |
| Independent trustees’ fees | | 72 |
| Accrued expenses | + | 33,355 |
| Total liabilities | | 539,952 |
| Net assets | | $184,103,992 |
| Net Assets by Source |
| Capital received from investors | | $125,223,020 |
| Total distributable earnings | + | 58,880,972 |
| Net assets | | $184,103,992 |
| Net Asset Value (NAV) |
| Net Assets | ÷ | Shares
Outstanding | = | NAV |
| $184,103,992 | | 10,677,716 | | $17.24 |
| | | | | |
| | | | | |
Schwab VIT Balanced with Growth Portfolio | Annual Report
Schwab VIT Balanced with Growth Portfolio
Statement of Operations
| For the period January 1, 2021 through December 31, 2021 |
| Investment Income |
| Dividends received from securities - affiliated | | $3,475,772 |
| Interest received from securities - unaffiliated | + | 113 |
| Total investment income | | 3,475,885 |
| Expenses |
| Investment adviser and administrator fees | | 791,762 |
| Professional fees | | 25,503 |
| Independent trustees’ fees | | 15,112 |
| Portfolio accounting fees | | 12,968 |
| Shareholder reports | | 11,932 |
| Custodian fees | | 3,418 |
| Transfer agent fees | | 1,969 |
| Other expenses | + | 4,059 |
| Total expenses | – | 866,723 |
| Net investment income | | 2,609,162 |
| REALIZED AND UNREALIZED GAINS (LOSSES) |
| Net realized gains on sales of securities - affiliated | | 3,443,646 |
| Net change in unrealized appreciation (depreciation) on securities - affiliated | + | 12,728,493 |
| Net realized and unrealized gains | | 16,172,139 |
| Increase in net assets resulting from operations | | $18,781,301 |
Schwab VIT Balanced with Growth Portfolio | Annual Report
Schwab VIT Balanced with Growth Portfolio
Statement of Changes in Net Assets
For the current and prior report periods
| OPERATIONS |
| | 1/1/21-12/31/21 | 1/1/20-12/31/20 |
| Net investment income | | $2,609,162 | $2,359,507 |
| Net realized gains (losses) | | 3,443,646 | (489,398) |
| Net change in unrealized appreciation (depreciation) | + | 12,728,493 | 12,666,203 |
| Increase in net assets from operations | | $18,781,301 | $14,536,312 |
| DISTRIBUTIONS TO SHAREHOLDERS |
| Total distributions | | ($2,357,386) | ($3,503,173) |
| TRANSACTIONS IN FUND SHARES |
| | 1/1/21-12/31/21 | 1/1/20-12/31/20 |
| | | SHARES | VALUE | SHARES | VALUE |
| Shares sold | | 875,732 | $14,657,809 | 216,285 | $3,084,560 |
| Shares reinvested | | 140,908 | 2,357,386 | 258,156 | 3,503,173 |
| Shares redeemed | + | (791,626) | (13,183,009) | (1,150,953) | (16,136,997) |
| Net transactions in fund shares | | 225,014 | $3,832,186 | (676,512) | ($9,549,264) |
| SHARES OUTSTANDING AND NET ASSETS |
| | 1/1/21-12/31/21 | 1/1/20-12/31/20 |
| | | SHARES | NET ASSETS | SHARES | NET ASSETS |
| Beginning of period | | 10,452,702 | $163,847,891 | 11,129,214 | $162,364,016 |
| Total increase (decrease) | + | 225,014 | 20,256,101 | (676,512) | 1,483,875 |
| End of period | | 10,677,716 | $184,103,992 | 10,452,702 | $163,847,891 |
Schwab VIT Balanced with Growth Portfolio | Annual Report
Schwab VIT Balanced with Growth Portfolio
1. Business Structure of the Fund:
Schwab VIT Balanced with Growth Portfolio (the fund) is a series of Schwab Annuity Portfolios (the trust), a no-load, open-end management investment company. The trust is organized as a Massachusetts business trust and is registered under the Investment Company Act of 1940, as amended (the 1940 Act). The list below shows all the funds in the trust as of the end of the period, including the fund discussed in this report, which is highlighted:
| SCHWAB ANNUITY PORTFOLIOS (ORGANIZED JANUARY 21, 1994) |
| Schwab Government Money Market Portfolio | |
| Schwab S&P 500 Index Portfolio | |
| Schwab VIT Balanced Portfolio | |
| Schwab VIT Balanced with Growth Portfolio | |
| Schwab VIT Growth Portfolio | |
The fund is a “fund of funds” which primarily invests in affiliated Schwab Exchange-Traded Funds (ETFs). The fund may also invest in affiliated mutual funds from Schwab Funds and Laudus Funds and unaffiliated third-party ETFs and mutual funds (all such ETFs and mutual funds referred to as "underlying funds"). The fund may also invest directly in equity or fixed-income securities, including bonds, cash equivalents, money market funds and money market investments, to achieve its investment objectives.
The fund in this report offers one share class. Shares are bought and sold at closing net asset value per share (NAV), which is the price for all outstanding shares of the fund. Each share has a par value of 1/1,000 of a cent, and the fund’s Board of Trustees (the Board) may authorize the issuance of as many shares as necessary.
The fund is available exclusively as an investment vehicle for variable annuity and variable life insurance contracts offered by separate accounts of participating life insurance companies and in the future may be offered to pension and retirement plans qualified under the Internal Revenue Code of 1986, as amended. At December 31, 2021, 100% of the fund’s shares were held through separate accounts of five insurance companies. Subscriptions and redemptions of these insurance separate accounts could have a material impact on the fund.
The fund maintains its own account for purposes of holding assets and accounting, and is considered a separate entity for tax purposes. Within its account, the fund may also keep certain assets in segregated accounts, as required by securities law.
2. Significant Accounting Policies:
The following is a summary of the significant accounting policies the fund uses in its preparation of financial statements. The fund follows the investment company accounting and reporting guidance of the Financial Accounting Standards Board (FASB) Accounting Standard Codification Topic 946 Financial Services — Investment Companies. The accounting policies are in conformity with accounting principles generally accepted in the United States of America (GAAP).
The financial statements of the fund should be read in conjunction with the underlying funds’ financial statements. For more information about the underlying funds’ operations and policies, please refer to those funds’ semiannual and annual reports, which are filed with the U.S. Securities and Exchange Commission (SEC) and are available on the SEC’s website at www.sec.gov.
(a) Security Valuation:
Under procedures approved by the Board, the investment adviser has formed a Pricing Committee to administer the pricing and valuation of portfolio securities and other assets and to ensure that prices used for internal purposes or provided by third parties reasonably reflect fair value. Among other things, these procedures allow the fund to utilize independent pricing services, quotations from securities and financial instrument dealers and other market sources to determine fair value.
The fund values the securities in its portfolio every business day. The fund uses the following policies to value various types of securities:
• Securities traded on an exchange or over-the-counter: Traded securities are valued at the closing value for the day, or, on days when no closing value has been reported, at the mean of the most recent bid and ask quotes.
• Mutual funds: Mutual funds are valued at their respective NAVs.
• Cash management sweep time deposits: Balances held in cash management sweep time deposits are accounted for on a cost basis, which approximates fair value.
Schwab VIT Balanced with Growth Portfolio | Annual Report
Schwab VIT Balanced with Growth Portfolio
Financial Notes (continued)
2. Significant Accounting Policies (continued):
• Securities for which no quoted value is available: The Board has adopted procedures to fair value the fund’s securities when market prices are not “readily available” or are unreliable. For example, the fund may fair value a security when it is de-listed or its trading is halted or suspended; when a security’s primary pricing source is unable or unwilling to provide a price; or when a security’s primary trading market is closed during regular market hours. The fund makes fair value determinations in good faith in accordance with the fund’s valuation procedures. The Pricing Committee considers a number of factors, including unobservable market inputs, when arriving at fair value. The Pricing Committee may employ techniques such as the review of related or comparable assets or liabilities, related market activities, recent transactions, market multiples, book values, transactional back-testing, disposition analysis and other relevant information. The Pricing Committee regularly reviews these inputs and assumptions to calibrate the valuations. Due to the subjective and variable nature of fair value pricing, there can be no assurance that the fund could obtain the fair value assigned to the security upon the sale of such security. The Board convenes on a regular basis to review fair value determinations made by the fund pursuant to the valuation procedures.
In accordance with the authoritative guidance on fair value measurements and disclosures under GAAP, the fund discloses the fair value of its investments in a hierarchy that prioritizes the significant inputs to valuation techniques used to measure the fair value. The hierarchy gives the highest priority to valuations based upon unadjusted quoted prices in active markets for identical assets or liabilities (Level 1 measurements) and the lowest priority to valuations based upon unobservable inputs that are significant to the valuation (Level 3 measurements). If inputs used to measure the financial instruments fall within different levels of the hierarchy, the categorization is based on the lowest level input that is significant to the valuation. If the fund determines that either the volume and/or level of activity for an asset or liability has significantly decreased (from normal conditions for that asset or liability) or price quotations or observable inputs are not associated with orderly transactions, increased analysis and management judgment will be required to estimate fair value.
The three levels of the fair value hierarchy are as follows:
• Level 1 — quoted prices in active markets for identical securities — Investments whose values are based on quoted market prices in active markets, and whose values are therefore classified as Level 1 prices, include active listed equities, mutual funds and ETFs. Investments in mutual funds are valued daily at their NAVs, and investments in ETFs are valued daily at the last reported sale price or the official closing price, which are classified as Level 1 prices, without consideration to the classification level of the underlying securities held by an underlying fund.
• Level 2 — other significant observable inputs (including quoted prices for similar securities, interest rates, prepayment speeds, credit risk, etc.) — Investments that trade in markets that are not considered to be active, but whose values are based on quoted market prices, dealer quotations or valuations provided by alternative pricing sources supported by observable inputs are classified as Level 2 prices. These generally include U.S. government and sovereign obligations, most government agency securities, investment-grade corporate bonds, certain mortgage products, less liquid listed equities, and state, municipal and provincial obligations.
• Level 3 — significant unobservable inputs (including the fund’s own assumptions in determining the fair value of investments) — Investments whose values are classified as Level 3 prices have significant unobservable inputs, as they may trade infrequently or not at all. When observable prices are not available for these securities, the fund uses one or more valuation techniques for which sufficient and reliable data is available. The inputs used by the fund in estimating the value of Level 3 prices may include the original transaction price, quoted prices for similar securities or assets in active markets, completed or pending third-party transactions in the underlying investment or comparable issuers, and changes in financial ratios or cash flows. Level 3 prices may also be adjusted to reflect illiquidity and/or non-transferability, with the amount of such discount estimated by the fund in the absence of market information. Assumptions used by the fund due to the lack of observable inputs may significantly impact the resulting fair value and therefore the fund’s results of operations.
The inputs or methodology used for valuing securities are not necessarily an indication of the risk associated with investing in those securities.
The levels associated with valuing the fund’s investments as of December 31, 2021 are disclosed in the Portfolio Holdings.
(b) Accounting Policies for certain Portfolio Investments (if held):
Securities Lending: Under the trust’s Securities Lending Program, a fund (lender) may make short-term loans of its securities to another party (borrower) to generate additional revenue for the fund. The borrower pledges collateral in the form of cash, securities issued or fully guaranteed by the U.S. government or foreign governments, or letters of credit issued by a bank. Collateral at the individual loan level is required to be maintained on a daily marked-to-market basis in an amount at least equal to the current value of the securities loaned. The lending agent provides the fund with indemnification against borrower default (the borrower fails to
Schwab VIT Balanced with Growth Portfolio | Annual Report
Schwab VIT Balanced with Growth Portfolio
Financial Notes (continued)
2. Significant Accounting Policies (continued):
return the security on loan) reducing the risk of loss as a result of default. The cash collateral of securities loaned is currently invested in money market portfolios operating pursuant to Rule 2a-7 under the 1940 Act. The fund bears the risk of loss with respect to the investment of cash collateral. The terms of the securities lending agreement allow the fund or the lending agent to terminate any loan at any given time and the securities must be returned within the earlier of the standard trade settlement period or the specified time period under the relevant securities lending agreement. Securities lending income, as disclosed in the fund’s Statement of Operations, if applicable, represents the income earned from the investment of the cash collateral plus any fees paid by borrowers, less the fees paid to the lending agent and broker rebates which are subject to adjustments pursuant to the securities lending agreement. On loans not collateralized by cash, a fee is received from the borrower, and is allocated between the fund and the lending agent. The aggregate fair value of securities loaned will not at any time exceed one-third of the total assets of the fund, including collateral received from the loan. Securities lending fees paid to the unaffiliated lending agents start at 10% of gross lending revenue, with subsequent breakpoints to a low of 5%. In this context, the gross lending revenue equals the income received from the investment of cash collateral and fees paid by borrowers less any rebates paid to the borrowers. Any expenses charged by the cash collateral fund are in addition to these fees. All remaining revenue is retained by the fund, as applicable. No portion of lending revenue is paid to or retained by the investment adviser or any of its affiliates.
As of December 31, 2021, the fund had no securities on loan.
Cash Management Transactions: The fund may subscribe to the Brown Brothers Harriman & Co. (BBH) Cash Management Service Sweep (CMS Sweep). The BBH CMS Sweep is an investment product that automatically sweeps the fund’s cash balances into overnight offshore time deposits with either the BBH Grand Cayman branch or a branch of a pre-approved commercial bank. This fully automated program allows the fund to earn interest on cash balances. Excess cash invested with deposit institutions domiciled outside of the U.S., as with any offshore deposit, may be subject to sovereign actions in the jurisdiction of the deposit institution including, but not limited to, freeze, seizure or diminution. The fund bears the risk associated with the repayment of principal and payment of interest on such instruments by the institution with which the deposit is ultimately placed.
(c) Security Transactions:
Security transactions are recorded as of the date the order to buy or sell the security is executed. Realized gains and losses from security transactions are based on the identified costs of the securities involved.
(d) Investment Income:
Interest income is recorded as it accrues. Dividends and distributions from portfolio securities and underlying funds are recorded on the date they are effective (the ex-dividend date). Any distributions from underlying funds are recorded in accordance with the character of the distributions as designated by the underlying funds.
(e) Expenses:
Expenses that are specific to the fund are charged directly to the fund. Expenses that are common to more than one fund in the trusts generally are allocated among those funds in proportion to their average daily net assets. The fund bears its share of the acquired fund fees and expenses of the underlying funds, which are indirect expenses incurred by the fund through its investments in the underlying funds. Such expenses are reflected in the net asset values of the underlying funds.
(f) Distributions to Shareholders:
The fund makes distributions from net investment income and net realized capital gains, if any, once a year.
(g) Accounting Estimates:
The accounting policies described in this report conform to GAAP. Notwithstanding this, shareholders should understand that in order to follow these principles, fund management has to make estimates and assumptions that affect the information reported in the financial statements. It’s possible that once the results are known, they may turn out to be different from these estimates and these differences may be material.
(h) Federal Income Taxes:
The fund intends to meet federal income and excise tax requirements for regulated investment companies under subchapter M of the Internal Revenue Code, as amended. Accordingly, the fund distributes substantially all of its net investment income and net realized capital gains, if any, to the participating insurance company’s (shareholders) separate accounts each year. As long as the fund meets the tax requirements, it is not required to pay federal income tax.
Schwab VIT Balanced with Growth Portfolio | Annual Report
Schwab VIT Balanced with Growth Portfolio
Financial Notes (continued)
2. Significant Accounting Policies (continued):
(i) Indemnification:
Under the fund’s organizational documents, the officers and trustees are indemnified against certain liabilities arising out of the performance of their duties to the fund. In addition, in the normal course of business the fund enters into contracts with its vendors and others that provide general indemnifications. The fund’s maximum exposure under these arrangements is unknown as this would involve future claims that may be made against the fund. However, based on experience, the fund expects the risk of loss attributable to these arrangements to be remote.
3. Risk Factors:
Investing in the fund may involve certain risks, as discussed in the fund’s prospectus, including, but not limited to, those described below. Any of these risks could cause an investor to lose money.
Asset Allocation Risk. The fund is subject to the risk that the selection of the underlying funds and the allocation of the fund’s assets among the various asset classes and market segments may cause the fund to underperform other funds with a similar investment objective.
Conflicts of Interest Risk. The investment adviser’s authority to select and substitute underlying funds from a variety of affiliated and unaffiliated mutual funds and ETFs may create a conflict of interest because the fees paid to it and its affiliates by some underlying funds are higher than the fees paid by other underlying funds. The investment adviser also may have an incentive to select an affiliated underlying fund for other reasons, including to increase assets under management or to support new investment strategies. In addition, other conflicts of interest may exist where the best interests of the affiliated underlying fund may not be aligned with those of the fund. However, the investment adviser is a fiduciary to the fund and is legally obligated to act in the fund’s best interests when selecting underlying funds.
Market Risk. Financial markets rise and fall in response to a variety of factors, sometimes rapidly and unpredictably. Markets may be impacted by economic, political, regulatory and other conditions, including economic sanctions and other government actions. In addition, the occurrence of global events, such as war, terrorism, environmental disasters, natural disasters and epidemics may also negatively affect the financial markets. As with any investment whose performance is tied to these markets, the value of an investment in the fund will fluctuate, which means that an investor could lose money over short or long periods.
Securities Lending Risk. Securities lending involves the risk of loss of rights in, or delay in recovery of, the loaned securities if the borrower fails to return the security loaned or becomes insolvent.
ETF Risk. When the fund invests in an ETF, it will bear a proportionate share of the ETF’s expenses. In addition, lack of liquidity in the market for an ETF’s shares can result in its value being more volatile than the underlying portfolio of securities.
Direct Investment Risk. The fund may invest directly in cash, cash equivalents and equity and fixed-income securities, including money market securities, to maintain its allocations. The fund’s direct investment in these securities is subject to the same or similar risks as an underlying fund’s investment in the same securities.
Underlying Fund Investment Risk. Before investing in the fund, investors should assess the risks associated with the underlying funds in which the fund may invest, which include any combination of the risks described below.
• Equity Risk. The prices of equity securities rise and fall daily. These price movements may result from factors affecting individual companies, industries or the securities market as a whole. In addition, equity markets tend to move in cycles, which may cause stock prices to fall over short or extended periods of time.
• Market Capitalization Risk. Securities issued by companies of different market capitalizations tend to go in and out of favor based on market and economic conditions. During a period when securities of a particular market capitalization fall behind other types of investments, an underlying fund’s performance could be impacted.
• Foreign Investment Risk. An underlying fund’s investments in securities of foreign issuers involve certain risks that may be greater than those associated with investments in securities of U.S. issuers. These include risks of adverse changes in foreign economic, political, regulatory and other conditions; changes in currency exchange rates or exchange control regulations (including limitations on currency movements and exchanges); the imposition of economic sanctions or other government restrictions; differing accounting, auditing, financial reporting and legal standards and practices; differing securities market structures; and higher transaction costs. These risks may negatively impact the value or liquidity of an underlying fund’s investments, and could impair the underlying fund’s ability to meet its investment objective or invest in accordance with its
Schwab VIT Balanced with Growth Portfolio | Annual Report
Schwab VIT Balanced with Growth Portfolio
Financial Notes (continued)
3. Risk Factors (continued):
investment strategy. There is a risk that investments in securities denominated in, and/or receiving revenues in, foreign currencies will decline in value relative to the U.S. dollar or, in the case of hedging positions, that the U.S. dollar will decline in value relative to the currency hedged, resulting in the dollar value of an underlying fund’s investment being adversely affected.
• Emerging Markets Risk. Emerging market countries may be more likely to experience political turmoil or rapid changes in market or economic conditions than more developed countries. Emerging market countries often have less uniformity in accounting, auditing, financial reporting and recordkeeping requirements and greater risk associated with the custody of securities. In addition, the financial stability of issuers (including governments) in emerging market countries may be more precarious than in developed countries. As a result, there may be an increased risk of illiquidity and price volatility associated with an underlying fund’s investments in emerging market countries, which may be magnified by currency fluctuations relative to the U.S. dollar, and, at times, it may be difficult to value such investments.
• Growth Investing Risk. Certain of the underlying funds pursue a “growth style” of investing. Growth investing focuses on a company’s prospects for growth of revenue and earnings. If a company’s earnings or revenues fall short of expectations, its stock price may fall dramatically. Growth stocks also can perform differently from the market as a whole and other types of stocks and can be more volatile than other types of stocks. Since growth companies usually invest a high portion of earnings in their business, they may lack the dividends of value stocks that can cushion stock prices in a falling market. Growth stocks may also be more expensive relative to their earnings or assets compared to value or other stocks.
• Value Investing Risk. Certain of the underlying funds may pursue a “value style” of investing. Value investing focuses on companies whose stocks appear undervalued in light of factors such as the company’s earnings, book value, revenues or cash flow. If an underlying fund’s investment adviser’s (or sub-adviser’s) assessment of a company’s value or prospects for exceeding earnings expectations or market conditions is wrong, the underlying fund could suffer losses or produce poor performance relative to other funds. In addition, “value stocks” can continue to be undervalued by the market for long periods of time.
• Fixed-Income Risk. Interest rates rise and fall over time, which will affect an underlying fund’s yield and share price. A change in a central bank’s monetary policy or economic conditions, among other things, may result in a change in interest rates. A rise in interest rates could cause an underlying fund’s share price to fall. The credit quality of a portfolio investment could also cause an underlying fund’s share price to fall. An underlying fund could lose money if the issuer or guarantor of a portfolio investment or the counterparty to a derivatives contract fails to make timely principal or interest payments or otherwise honor its obligations. Fixed-income securities may be paid off earlier or later than expected. Either situation could cause an underlying fund to hold securities paying lower-than-market rates of interest, which could hurt an underlying fund’s yield or share price. Below investment-grade bonds (junk bonds) involve greater credit risk, are more volatile, involve greater risk of price declines and may be more susceptible to economic downturns than investment-grade securities.
• Interest Rate Risk. Interest rates rise and fall over time. As with any investment whose yield reflects current interest rates, an underlying fund’s yield will change over time. During periods when interest rates are low, an underlying fund’s yield (and total return) also may be low. Changes in interest rates also may affect an underlying fund’s share price: a rise in interest rates generally causes an underlying fund’s share price to fall. The longer an underlying fund’s portfolio duration, the more sensitive to interest rate movements its share price is likely to be. Also, a change in a central bank’s monetary policy or economic conditions, among other things, may result in a change in interest rates, which could have sudden and unpredictable effects on the markets and significantly impact the value of fixed-income securities in which the underlying fund invests.
• Credit Risk. A decline in the credit quality of an issuer or guarantor of a portfolio investment could cause an underlying fund to lose money or underperform. An underlying fund could lose money if the issuer or guarantor of a portfolio investment fails to make timely principal or interest payments or otherwise honor its obligations.
• Prepayment and Extension Risk. Certain fixed income securities are subject to the risk that the securities may be paid off earlier or later than expected, especially during periods of falling or rising interest rates, respectively. Prepayments of obligations could cause an underlying fund to forgo future interest income on the portion of the security’s principal repaid early and force the underlying fund to reinvest that money at the lower prevailing interest rates. Extensions of obligations could cause the fund to exhibit additional volatility and hold securities paying lower-than-market rates of interest. Either case could hurt the underlying fund’s performance.
• U.S. Government Securities Risk. Some of the U.S. government securities that the underlying funds invest in are not backed by the full faith and credit of the U.S. government, which means they are neither issued nor guaranteed by the U.S. Treasury. Issuers such as the Federal Home Loan Banks (FHLB) maintain limited access to credit lines from the U.S. Treasury. Certain securities, such as obligations issued by the Federal Farm Credit Banks Funding Corporation, are supported solely by the
Schwab VIT Balanced with Growth Portfolio | Annual Report
Schwab VIT Balanced with Growth Portfolio
Financial Notes (continued)
3. Risk Factors (continued):
credit of the issuer. There can be no assurance that the U.S. government will provide financial support to securities of its agencies and instrumentalities if it is not obligated to do so under law. Also, any government guarantees on securities the underlying funds own do not extend to shares of the underlying funds themselves.
• Real Estate Investment Risk. An underlying fund in which the fund may invest may have a policy of concentrating its investments in real estate companies and companies related to the real estate industry. As such, an underlying fund is subject to risks associated with the direct ownership of real estate securities and the fund’s investment in such an underlying fund is subject to risks associated with the direct ownership of real estate securities and an investment in the underlying fund will be closely linked to the performance of the real estate markets. These risks include, among others, declines in the value of real estate; risks related to general and local economic conditions; possible lack of availability of mortgage funds or other limits to accessing the credit or capital markets; defaults by borrowers or tenants, particularly during an economic downturn; and changes in interest rates.
• Real Estate Investment Trusts (REITs) Risk. An underlying fund may invest in REITs. An underlying fund’s investments in REITs will be subject to the risks associated with the direct ownership of real estate, including fluctuations in the value of underlying properties, defaults by borrowers or tenants, changes in interest rates and risks related to general or local economic conditions. REITs are also subject to certain additional risks. For example, equity REITs may be affected by changes in the value of the underlying properties owned by the trusts, and mortgage REITs may be affected by the quality of any credit extended. Further, REITs may have their investments in relatively few properties, a small geographic area or a single property type. In addition, REITs have their own expenses, and the underlying fund will bear a proportionate share of those expenses.
• Mortgage-Backed and Mortgage Pass-Through Securities Risk. Mortgage-backed securities tend to increase in value less than other debt securities when interest rates decline, but are subject to similar or greater risk of decline in fair value during periods of rising interest rates. Certain of the mortgage-backed securities in which an underlying fund may invest are issued or guaranteed by agencies or instrumentalities of the U.S. government but are not backed by the full faith and credit of the U.S. government. There can be no assurance that the U.S. government would provide financial support to its agencies or instrumentalities where it was not obligated to do so which can cause an underlying fund to lose money or underperform. The risks of investing in mortgage-backed securities include, among others, interest rate risk, credit risk, prepayment risk and extension risk. Transactions in mortgage pass-through securities often occur through to-be-announced (TBA) transactions. An underlying fund could lose money or underperform if a TBA counterparty defaults or goes bankrupt.
• Portfolio Turnover Risk. Certain of the underlying funds may buy and sell portfolio securities actively. If they do, their portfolio turnover rate and transaction costs will rise, which may lower the underlying fund’s performance and may increase the likelihood of capital gains distributions.
• Liquidity Risk. An underlying fund may be unable to sell certain securities, such as illiquid securities, readily at a favorable time or price, or the underlying fund may have to sell them at a loss.
• Derivatives Risk. An underlying fund’s use of derivative instruments involves risks different from, or possibly greater than, the risks associated with investing directly in securities and other traditional investments. An underlying fund’s use of derivatives could reduce the underlying fund’s performance, increase volatility, and could cause the underlying fund to lose more than the initial amount invested. In addition, investments in derivatives may involve leverage, which means a small percentage of assets invested in derivatives can have a disproportionately large impact on an underlying fund.
• Securities Lending Risk. Certain underlying funds engage in securities lending, which involves the risk of loss of rights in, or delay in recovery of, the loaned securities if the borrower fails to return the security loaned or becomes insolvent.
• Management Risk. An underlying fund may be an actively managed mutual fund. Any actively managed mutual fund is subject to the risk that its investment adviser (or sub-adviser(s)) will make poor security selections. An underlying fund’s adviser applies its own investment techniques and risk analyses in making investment decisions for the fund, but there can be no guarantee that they will produce the desired results.
• Investment Style Risk. Certain underlying funds seek to track the performance of various segments of the stock market, as measured by their respective indices. Such underlying funds follow these stocks during upturns as well as downturns. Because of their indexing strategy, these underlying funds do not take steps to reduce market exposure or to lessen the effects of a declining market. In addition, because of an underlying fund’s expenses, the underlying fund’s performance is normally below that of the index. Errors relating to an index may occur from time to time and may not be identified by the underlying fund’s index provider for a period time. In addition, market disruptions could cause delays in an underlying fund’s index’s rebalancing schedule. Such errors and/or market disruptions may result in losses for an underlying fund.
Schwab VIT Balanced with Growth Portfolio | Annual Report
Schwab VIT Balanced with Growth Portfolio
Financial Notes (continued)
3. Risk Factors (continued):
• Tracking Error Risk. An underlying fund may seek to track the performance of its benchmark index, although it may not be successful in doing so. The divergence between the performance of a fund and its benchmark index, positive or negative, is called “tracking error.” Tracking error can be caused by many factors and it may be significant.
• Concentration Risk. To the extent that an underlying fund’s portfolio is concentrated in the securities of issuers in a particular market, industry, group of industries, sector or asset class, the underlying fund may be adversely affected by the performance of those securities, may be subject to increased price volatility and may be more vulnerable to adverse economic, market, political, or regulatory occurrences affecting that market, industry, group of industries, sector or asset class.
• Commodity Risk. To the extent that an underlying fund invests in commodity-linked derivative instruments, it may subject the underlying fund to greater volatility than investments in traditional securities. Also, commodity-linked investments may be more volatile and less liquid than the underlying commodity. The value of commodity-linked derivative instruments may be affected by changes in overall market movements, commodity index volatility, changes in interest rates, or factors affecting a particular industry or commodity, such as drought, floods, weather, livestock disease, embargoes, tariffs and international economic, political and other regulatory and market developments. The use of leveraged commodity-linked derivatives creates an opportunity for increased return, but also creates the possibility for a greater loss.
• Money Market Fund Risk. The fund may invest in underlying money market funds that either seek to maintain a stable $1.00 net asset value (“stable share price money market funds”) or that have a share price that fluctuates (“variable share price money market funds”). Although an underlying stable share price money market fund seeks to maintain a stable $1.00 net asset value, it is possible to lose money by investing in such a money market fund. Because the share price of an underlying variable share price money market fund will fluctuate, when the fund sells the shares it owns they may be worth more or less than what the fund originally paid for them. In addition, neither type of money market fund is designed to offer capital appreciation. Certain underlying money market funds may impose a fee upon the sale of shares or may temporarily suspend the ability to sell shares if such fund’s liquidity falls below required minimums.
Please refer to the fund’s prospectus for a more complete description of the principal risks of investing in the fund.
4. Affiliates and Affiliated Transactions:
Investment Adviser
Charles Schwab Investment Management Inc., dba Schwab Asset Management, a wholly owned subsidiary of The Charles Schwab Corporation, serves as the fund’s investment adviser and administrator pursuant to an Investment Advisory and Administration Agreement between the investment adviser and the trust.
For its advisory and administrative services to the fund, the investment adviser is entitled to receive an annual fee, accrued daily and payable monthly, equal to 0.45% of the fund’s average daily net assets.
Expense Limitation
The investment adviser and its affiliates have agreed with the fund, for so long as the investment adviser serves as the investment adviser to the fund, which may only be amended or terminated with approval of the fund’s Board, to limit the total annual fund operating expenses charged, excluding interest, taxes and certain non-routine expenses to 0.58%.
The agreement to limit the fund’s total expenses charged is limited to the fund’s direct operating expenses and, therefore, does not apply to acquired fund fees and expenses, which are indirect expenses incurred by the fund through its investments in the underlying funds.
Schwab VIT Balanced with Growth Portfolio | Annual Report
Schwab VIT Balanced with Growth Portfolio
Financial Notes (continued)
4. Affiliates and Affiliated Transactions (continued):
Investments in Affiliates
The fund may engage in certain transactions involving related parties. Pursuant to an exemptive order issued by the SEC, the fund may invest in other related ETFs and mutual funds. As of December 31, 2021, the Schwab VIT Balanced with Growth Portfolio’s ownership percentages of other related funds’ shares are:
| Schwab Emerging Markets Equity ETF | 0.1% |
| Schwab International Equity ETF | 0.1% |
| Schwab International Small-Cap Equity ETF | 0.1% |
| Schwab Short-Term U.S. Treasury ETF | 0.1% |
| Schwab U.S. Aggregate Bond ETF | 0.5% |
| Schwab U.S. Large-Cap ETF | 0.1% |
| Schwab U.S. REIT ETF | 0.2% |
| Schwab U.S. Small-Cap ETF | 0.1% |
| Schwab U.S. TIPS ETF | 0.0%* |
| Schwab Variable Share Price Money Fund, Ultra Shares | 0.2% |
Interfund Borrowing and Lending
Pursuant to an exemptive order issued by the SEC, the fund may enter into interfund borrowing and lending transactions with other funds in the Fund Complex (for definition refer to the Trustees and Officers section). All loans are for temporary or emergency purposes and the interest rate to be charged will be the average of the overnight repurchase agreement rate and the short-term bank loan rate. All loans are subject to numerous conditions designed to ensure fair and equitable treatment of all participating funds. The interfund lending facility is subject to the oversight and periodic review by the Board. The fund had no interfund borrowing or lending activity during the period.
5. Board of Trustees:
The Board may include people who are officers and/or directors of the investment adviser or its affiliates. Federal securities law limits the percentage of such “interested persons” who may serve on a trust’s board, and the trust was in compliance with these limitations throughout the report period. The trust did not pay any of these interested persons for their services as trustees, but it did pay non-interested persons (independent trustees), as noted on the fund’s Statement of Operations. For information regarding the trustees, please refer to the Trustees and Officers table at the end of this report.
6. Borrowing from Banks:
During the period, the fund was a participant with other funds in the Fund Complex in a joint, syndicated, committed $850 million line of credit (the Syndicated Credit Facility), which matured on September 30, 2021. On September 30, 2021, the Syndicated Credit Facility was amended to run for a new 364 day period with the line of credit amount remaining unchanged, maturing on September 29, 2022. Under the terms of the Syndicated Credit Facility, in addition to the interest charged on any borrowings by a fund, the fund paid a commitment fee of 0.15% per annum on the fund’s proportionate share of the unused portion of the Syndicated Credit Facility.
During the period, the fund was a participant with other funds in the Fund Complex in a joint, unsecured, uncommitted $400 million line of credit (the Uncommitted Credit Facility), with State Street Bank and Trust Company, which matured on September 30, 2021. On September 30, 2021, the Uncommitted Credit Facility was amended to run for a new 364 day period with the line of credit amount remaining unchanged, maturing on September 29, 2022. Under the terms of the Uncommitted Credit Facility, the fund pays interest on the amount it borrows. There were no borrowings from either line of credit during the period.
The fund also has access to custodian overdraft facilities. The fund may have utilized the overdraft facility and incurred an interest expense, which is disclosed on the fund’s Statement of Operations, if any. The interest expense is determined based on a negotiated rate above the current Federal Funds Rate.
Schwab VIT Balanced with Growth Portfolio | Annual Report
Schwab VIT Balanced with Growth Portfolio
Financial Notes (continued)
| | 7. Purchases and Sales of Investment Securities: |
For the period ended December 31, 2021, purchases and sales of securities (excluding short-term obligations) were as follows:
PURCHASES
OF SECURITIES | SALES
OF SECURITIES |
| $16,955,813 | $13,741,294 |
8. Federal Income Taxes:
As of December 31, 2021, the tax basis cost of the fund’s investments and gross unrealized appreciation and depreciation were as follows:
| TAX COST | GROSS UNREALIZED
APPRECIATION | GROSS UNREALIZED
DEPRECIATION | NET UNREALIZED
APPRECIATION
(DEPRECIATION) |
| $130,201,345 | $54,084,029 | ($1,029,280) | $53,054,749 |
As of December 31, 2021, the components of distributable earnings on a tax basis were as follows:
UNDISTRIBUTED
ORDINARY
INCOME | UNDISTRIBUTED
LONG-TERM
CAPITAL GAINS | NET UNREALIZED
APPRECIATION
(DEPRECIATION)
ON INVESTMENTS | TOTAL |
| $2,672,403 | $3,153,820 | $53,054,749 | $58,880,972 |
The primary difference between book basis and tax basis unrealized appreciation or unrealized depreciation of investments is the tax deferral of losses on wash sales. The tax cost of the fund’s investments, disclosed above, have been adjusted from their book amounts to reflect these unrealized appreciation or depreciation differences, as applicable.
For the fiscal year ended December 31, 2021, the fund had capital loss carryforwards utilized in the amount of $174,450.
The tax basis components of distributions paid during the current and prior fiscal years were as follows:
| CURRENT FISCAL YEAR END DISTRIBUTIONS | PRIOR FISCAL YEAR END DISTRIBUTIONS |
ORDINARY
INCOME | LONG-TERM
CAPITAL
GAINS | ORDINARY
INCOME | LONG-TERM
CAPITAL
GAINS |
| $2,357,386 | $— | $3,237,788 | $265,385 |
Distributions paid to shareholders are based on net investment income and net realized gains determined on a tax basis, which may differ from net investment income and net realized gains for financial reporting purposes. These differences reflect the differing character of certain income items and net realized gains and losses for financial statement and tax purposes, and may result in reclassification among certain capital accounts on the financial statements.
Permanent book and tax basis differences may result in reclassifications between components of net assets as required. The adjustments will have no impact on net assets or the results of operations.
As of December 31, 2021, management has reviewed the tax positions for open periods (for federal purposes, three years from the date of filing and for state purposes, four years from the date of filing) as applicable to the fund, and has determined that no provision for income tax is required in the fund’s financial statements. The fund recognizes interest and penalties, if any, related to unrecognized tax benefits as income tax expense in the Statement of Operations. During the fiscal year ended December 31, 2021, the fund did not incur any interest or penalties.
9. Subsequent Events:
Management has determined there are no subsequent events or transactions through the date the financial statements were issued that would have materially impacted the financial statements as presented.
Schwab VIT Balanced with Growth Portfolio | Annual Report
Schwab VIT Balanced with Growth Portfolio
Report of Independent Registered Public Accounting Firm
To the Board of Trustees of Schwab Annuity Portfolios and Shareholders of Schwab VIT Balanced with Growth Portfolio
Opinion on the Financial Statements and Financial Highlights
We have audited the accompanying statement of assets and liabilities, including the portfolio holdings, of Schwab VIT Balanced with Growth Portfolio (the “Fund”), one of the funds constituting Schwab Annuity Portfolios, as of December 31, 2021, the related statement of operations for the year then ended, the statement of changes in net assets and the financial highlights for each of the two years in the period then ended, and the related notes. In our opinion, the financial statements and financial highlights present fairly, in all material respects, the financial position of the Fund as of December 31, 2021, the results of its operations for the year then ended, and the changes in its net assets and the financial highlights for each of the two years in the period then ended in conformity with accounting principles generally accepted in the United States of America. The financial highlights for each of the three years in the period ended December 31, 2019 were audited by other auditors, whose report, dated February 18, 2020, expressed an unqualified opinion on such financial highlights.
Basis for Opinion
These financial statements and financial highlights are the responsibility of the Fund’s management. Our responsibility is to express an opinion on the Fund’s financial statements and financial highlights based on our audits. We are a public accounting firm registered with the Public Company Accounting Oversight Board (United States) (PCAOB) and are required to be independent with respect to the Fund in accordance with the U.S. federal securities laws and the applicable rules and regulations of the Securities and Exchange Commission and the PCAOB.
We conducted our audits in accordance with the standards of the PCAOB. Those standards require that we plan and perform the audit to obtain reasonable assurance about whether the financial statements and financial highlights are free of material misstatement, whether due to error or fraud. The Fund is not required to have, nor were we engaged to perform, an audit of its internal control over financial reporting. As part of our audit, we are required to obtain an understanding of internal control over financial reporting but not for the purpose of expressing an opinion on the effectiveness of the Fund’s internal control over financial reporting. Accordingly, we express no such opinion.
Our audits included performing procedures to assess the risks of material misstatement of the financial statements and financial highlights, whether due to error or fraud, and performing procedures that respond to those risks. Such procedures included examining, on a test basis, evidence regarding the amounts and disclosures in the financial statements and financial highlights. Our audits also included evaluating the accounting principles used and significant estimates made by management, as well as evaluating the overall presentation of the financial statements and financial highlights. Our procedures included confirmation of securities owned as of December 31, 2021, by correspondence with the custodian and transfer agent. We believe that our audits provide a reasonable basis for our opinion.
Deloitte & Touche LLP
Denver, Colorado
February 17, 2022
We have served as the auditor of one or more investment companies in the Schwab Funds Complex since 2020.
Schwab VIT Balanced with Growth Portfolio | Annual Report
Schwab VIT Balanced with Growth Portfolio
Other Federal Tax Information (unaudited)
Schwab VIT Balanced with Growth Portfolio may elect to pass on the benefits of the foreign tax credit of $97,361 to its shareholders for the fiscal year ended December 31, 2021. The respective foreign source income on the fund is $1,427,080.
For corporate shareholders, 29.46% of the fund’s dividend distributions paid during the fiscal year ended December 31, 2021, qualify for the corporate dividends received deduction.
Schwab VIT Balanced with Growth Portfolio | Annual Report
Schwab VIT Balanced with Growth Portfolio
Liquidity Risk Management Program (unaudited)
The Fund has adopted and implemented a liquidity risk management program (the “program”) as required by Rule 22e-4 under the Investment Company Act of 1940, as amended. The Fund’s Board of Trustees (the “Board”) has designated the Fund’s investment adviser, Charles Schwab Investment Management, Inc., dba Schwab Asset Management, as the administrator of the program. Personnel of the investment adviser or its affiliates conduct the day-to-day operation of the program.
Under the program, the investment adviser manages a Fund’s liquidity risk, which is the risk that the Fund could not meet shareholder redemption requests without significant dilution of remaining shareholders’ interests in the Fund. The program is reasonably designed to assess and manage a Fund’s liquidity risk, taking into consideration the Fund’s investment strategy and the liquidity of its portfolio investments during normal and reasonably foreseeable stressed conditions; its historical redemption history and shareholder concentrations; and its cash holdings and access to other funding sources, including the custodian overdraft facility and lines of credit. The investment adviser’s process of determining the degree of liquidity of each Fund’s investments is supported by third-party liquidity assessment vendors.
The Fund’s Board reviewed a report at its meeting held on September 20, 2021 prepared by the investment adviser regarding the operation and effectiveness of the program for the period June 1, 2020, through May 31, 2021, which included individual Fund liquidity metrics. No significant liquidity events impacting the Fund were noted in the report. In addition, the investment adviser provided its assessment that the program had been operating effectively in managing the Fund’s liquidity risk.
Schwab VIT Balanced with Growth Portfolio | Annual Report
Schwab VIT Balanced with Growth Portfolio
Trustees and Officers
The tables below give information about the trustees and officers of Schwab Annuity Portfolios, which includes the fund covered in this report. The “Fund Complex” includes The Charles Schwab Family of Funds, Schwab Capital Trust, Schwab Investments, Schwab Annuity Portfolios, Schwab Strategic Trust and Laudus Trust. The Fund Complex includes 103 funds.
The address for all trustees and officers is 211 Main Street, San Francisco, CA 94105. You can find more information about the trustees and officers in the fund’s Statement of Additional Information, which is available free by calling 1-877-824-5615.
| Independent Trustees |
Name, Year of Birth, and
Position(s) with the trust
(Terms of office, and
length of Time Served1) | Principal Occupations
During the Past Five Years | Number of
Portfolios in
Fund Complex
Overseen by
the Trustee | Other Directorships |
Robert W. Burns
1959
Trustee
(Trustee of Schwab Strategic Trust since 2009; The Charles Schwab Family of Funds, Schwab Investments, Schwab Capital Trust, Schwab Annuity Portfolios and Laudus Trust since 2016) | Retired/Private Investor (Jan. 2009 – present). Formerly, Managing Director, Pacific Investment Management Company, LLC (PIMCO) (investment management firm) and President, PIMCO Funds. | 103 | None |
Nancy F. Heller
1956
Trustee
(Trustee of The Charles Schwab Family of Funds, Schwab Investments, Schwab Capital Trust, Schwab Annuity Portfolios, Schwab Strategic Trust and Laudus Trust since 2018) | Retired. President and Chairman (2014 – 2016), TIAA Charitable (financial services); Senior Managing Director (2003 – 2016), TIAA (financial services). | 103 | None |
David L. Mahoney
1954
Trustee
(Trustee of The Charles Schwab Family of Funds, Schwab Investments, Schwab Capital Trust, Schwab Annuity Portfolios and Laudus Trust since 2011; Schwab Strategic Trust since 2016) | Private Investor. | 103 | Director (2004 – present), Corcept Therapeutics Incorporated
Director (2009 – 2021), Adamas Pharmaceuticals, Inc.
Director (2003 – 2019), Symantec Corporation |
Jane P. Moncreiff
1961
Trustee
(Trustee of The Charles Schwab Family of Funds, Schwab Investments, Schwab Capital Trust, Schwab Annuity Portfolios, Schwab Strategic Trust and Laudus Trust since 2019) | Consultant (2018 – present), Fulham Advisers LLC (management consulting); Chief Investment Officer (2009 – 2017), CareGroup Healthcare System, Inc. (healthcare). | 103 | None |
Kiran M. Patel
1948
Trustee
(Trustee of The Charles Schwab Family of Funds, Schwab Investments, Schwab Capital Trust, Schwab Annuity Portfolios and Laudus Trust since 2011; Schwab Strategic Trust since 2016) | Retired. Executive Vice President and General Manager of Small Business Group (Dec. 2008 – Sept. 2013), Intuit, Inc. (financial software and services firm for consumers and small businesses). | 103 | Director (2008 – present), KLA-Tencor Corporation |
Schwab VIT Balanced with Growth Portfolio | Annual Report
Schwab VIT Balanced with Growth Portfolio
| Independent Trustees (continued) |
Name, Year of Birth, and
Position(s) with the trust
(Terms of office, and
length of Time Served1) | Principal Occupations
During the Past Five Years | Number of
Portfolios in
Fund Complex
Overseen by
the Trustee | Other Directorships |
Kimberly S. Patmore
1956
Trustee
(Trustee of The Charles Schwab Family of Funds, Schwab Investments, Schwab Capital Trust, Schwab Annuity Portfolios, Schwab Strategic Trust and Laudus Trust since 2016) | Consultant (2008 – present), Patmore Management Consulting (management consulting). | 103 | None |
J. Derek Penn
1957
Trustee
(Trustee of The Charles Schwab Family of Funds, Schwab Investments, Schwab Capital Trust, Schwab Annuity Portfolios, Schwab Strategic Trust and Laudus Trust since 2021) | Head of Equity Sales and Trading (2006 – 2018), BNY Mellon (financial services). | 103 | None |
| Interested Trustees |
Name, Year of Birth, and
Position(s) with the trust
(Terms of office, and
length of Time Served1) | Principal Occupations
During the Past Five Years | Number of
Portfolios in
Fund Complex
Overseen by
the Trustee | Other Directorships |
Walter W. Bettinger II2
1960
Chairman and Trustee
(Trustee of The Charles Schwab Family of Funds, Schwab Investments, Schwab Capital Trust and Schwab Annuity Portfolios since 2008; Schwab Strategic Trust since 2009; Laudus Trust since 2010) | Director and Chief Executive Officer (Oct. 2008 – present) and President (Oct. 2008 – Oct. 2021), The Charles Schwab Corporation; President and Chief Executive Officer (Oct. 2008 – Oct. 2021) and Director (May 2008 – Oct. 2021), Charles Schwab & Co., Inc.; Director (Apr. 2006 – present), Charles Schwab Bank, SSB; Director (Nov. 2017 – present), Charles Schwab Premier Bank, SSB; Director (July 2019 – present), Charles Schwab Trust Bank; Director (May 2008 – present) and President and Chief Executive Officer (Aug. 2017 – present), Schwab Holdings, Inc.; Director (Oct. 2020 – present), TD Ameritrade Holding Corporation; Director (July 2016 – Oct. 2021), Charles Schwab Investment Management, Inc. | 103 | Director (2008 – present), The Charles Schwab Corporation |
Joseph R. Martinetto2
1962
Trustee
(Trustee of The Charles Schwab Family of Funds, Schwab Investments, Schwab Capital Trust, Schwab Annuity Portfolios, Schwab Strategic Trust and Laudus Trust since 2016) | Chief Operating Officer (Feb. 2018 – present) and Senior Executive Vice President (July 2015 – Feb. 2018), The Charles Schwab Corporation; Senior Executive Vice President (July 2015 – present), Charles Schwab & Co., Inc.; Chief Financial Officer (July 2015 – Aug. 2017) and Executive Vice President and Chief Financial Officer (May 2007 – July 2015), The Charles Schwab Corporation and Charles Schwab & Co., Inc.; Director (May 2007 – present), Charles Schwab & Co., Inc.; Director (Apr. 2010 – present) and Chief Executive Officer (July 2013 – Apr. 2015), Charles Schwab Bank, SSB; Director (Nov. 2017 – present), Charles Schwab Premier Bank, SSB; Director (May 2007 – present), Chief Financial Officer (May 2007 – Aug. 2017), Senior Executive Vice President (Feb. 2016 – present), and Executive Vice President (May 2007 – Feb. 2016), Schwab Holdings, Inc.; Director (Oct. 2020 – present), TD Ameritrade Holding Corporation. | 103 | None |
Schwab VIT Balanced with Growth Portfolio | Annual Report
Schwab VIT Balanced with Growth Portfolio
| Officers of the Trust |
Name, Year of Birth, and Position(s) with the trust
(Terms of office, and length of Time Served3) | Principal Occupations During the Past Five Years |
Jonathan de St. Paer
1973
President and Chief Executive Officer
(Officer of The Charles Schwab Family of Funds, Schwab Investments, Schwab Capital Trust, Schwab Annuity Portfolios, Schwab Strategic Trust and Laudus Trust since 2018) | Director (Apr. 2019 – present), President (Oct. 2018 – present), Chief Operating Officer (Jan. 2020 – present), and Chief Executive Officer (Apr. 2019 – Nov. 2019), Charles Schwab Investment Management, Inc.; Senior Vice President (June 2020 – present) and Chief Operating Officer (Jan. 2020 – present), Charles Schwab Investment Advisory, Inc.; Chief Executive Officer (Apr. 2019 – present), President (Nov. 2018 – present) and Trustee (Apr. 2019 – Dec. 2020), Schwab Funds, Laudus Trust and Schwab ETFs; Director (Apr. 2019 – present), Charles Schwab Worldwide Funds plc and Charles Schwab Asset Management (Ireland) Limited; Senior Vice President (Apr. 2019 – present), Senior Vice President – Strategy and Product Development (CSIM) (Jan. 2014 – Mar. 2019), and Vice President (Jan. 2009 – Dec. 2013), Charles Schwab & Co., Inc. |
Mark Fischer
1970
Treasurer, Chief Financial Officer and Chief Operating Officer
(Officer of The Charles Schwab Family of Funds, Schwab Investments, Schwab Capital Trust, Schwab Annuity Portfolios, Schwab Strategic Trust and Laudus Trust since 2013) | Treasurer and Chief Financial Officer (Jan. 2016 – present) and Chief Operating Officer (Dec. 2020 – present), Schwab Funds, Laudus Trust and Schwab ETFs; Assistant Treasurer (Dec. 2013 – Dec. 2015), Schwab Funds and Laudus Trust; Assistant Treasurer (Nov. 2013 – Dec. 2015), Schwab ETFs; Chief Financial Officer (Mar. 2020 – present) and Vice President (Oct. 2013 – present), Charles Schwab Investment Management, Inc.; Executive Director (Apr. 2011 – Sept. 2013), J.P. Morgan Investor Services; Assistant Treasurer (May 2005 – Mar. 2011), Massachusetts Financial Service Investment Management. |
Omar Aguilar
1970
Vice President and Chief Investment Officer
(Officer of The Charles Schwab Family of Funds, Schwab Investments, Schwab Capital Trust, Schwab Annuity Portfolios, Schwab Strategic Trust and Laudus Trust since 2011) | Chief Executive Officer (Jan. 2022 – present) and Chief Investment Officer (Apr. 2011 – present), Senior Vice President (Apr. 2011 – Dec. 2021), Charles Schwab Investment Management, Inc.; Vice President and Chief Investment Officer (June 2011 – present), Schwab Funds, Laudus Trust and Schwab ETFs; Head of the Portfolio Management Group and Vice President of Portfolio Management (May 2009 – Apr. 2011), Financial Engines, Inc. (investment management firm); Head of Quantitative Equity (July 2004 – Jan. 2009), ING Investment Management. |
Brett Wander
1961
Vice President and Chief Investment Officer
(Officer of The Charles Schwab Family of Funds, Schwab Investments, Schwab Capital Trust, Schwab Annuity Portfolios, Schwab Strategic Trust and Laudus Trust since 2011) | Senior Vice President and Chief Investment Officer (Apr. 2011 – present), Charles Schwab Investment Management, Inc.; Vice President and Chief Investment Officer (June 2011 – present), Schwab Funds, Laudus Trust and Schwab ETFs; Senior Managing Director and Global Head of Active Fixed-Income Strategies (Jan. 2008 – Oct. 2010), State Street Global Advisors; Director of Alpha Strategies (Apr. 2006 – Jan. 2008), Loomis, Sayles & Company (investment management firm). |
William P. McMahon, Jr.
1972
Vice President and Chief Investment Officer
(Officer of The Charles Schwab Family of Funds, Schwab Investments, Schwab Capital Trust, Schwab Annuity Portfolios, Schwab Strategic Trust and Laudus Trust since 2021) | Senior Vice President and Chief Investment Officer (Jan. 2020 – present), Charles Schwab Investment Management, Inc.; Vice President and Chief Investment Officer (June 2021 – present), Schwab Funds, Laudus Trust and Schwab ETFs; Senior Vice President and Chief Investment Officer – ThomasPartners Strategies (Apr. 2018 – Dec. 2019), Charles Schwab Investment Advisory, Inc.; Senior Vice President and Chief Investment Officer (May 2001 – Apr. 2018), ThomasPartners, Inc. |
Catherine MacGregor
1964
Chief Legal Officer and Secretary, Schwab Funds and Schwab ETFs
Chief Legal Officer, Vice President and Clerk, Laudus Trust
(Officer of The Charles Schwab Family of Funds, Schwab Investments, Schwab Capital Trust, Schwab Annuity Portfolios and Laudus Trust since 2005; Schwab Strategic Trust since 2009) | Vice President (July 2005 – present), Charles Schwab & Co., Inc.; Vice President (Sept. 2005 – present), Charles Schwab Investment Management, Inc.; Vice President (Dec. 2005 – present) and Chief Legal Officer and Clerk (Mar. 2007 – present), Laudus Trust; Chief Legal Officer and Secretary (Oct. 2021 – present), Vice President (Nov. 2005 – Oct. 2021) and Assistant Secretary (June 2007 – Oct. 2021), Schwab Funds; Chief Legal Officer and Secretary (Oct. 2021 – present), Vice President and Assistant Secretary (Oct. 2009 – Oct. 2021), Schwab ETFs. |
| 1 | Each Trustee shall hold office until the election and qualification of his or her successor, or until he or she dies, resigns or is removed. The retirement policy requires that each independent trustee retire by December 31 of the year in which the Trustee turns 74 or the Trustee’s twentieth year of service as an independent trustee on any trust in the Fund Complex, whichever occurs first. |
| 2 | Mr. Bettinger and Mr. Martinetto are Interested Trustees. Mr. Bettinger is an Interested Trustee because he owns stock of The Charles Schwab Corporation (CSC), the parent company of Charles Schwab Investment Management, Inc., the investment adviser for the trusts in the Fund Complex, and is an employee of Charles Schwab & Co., Inc. (Schwab), the principal underwriter for The Charles Schwab Family of Funds, Schwab Investments, Schwab Capital Trust, Schwab Annuity Portfolios and Laudus Trust. Mr. Martinetto is an Interested Trustee because he owns stock of CSC and is an employee and director of Schwab. |
| 3 | The President, Treasurer and Secretary/Clerk hold office until their respective successors are chosen and qualified or until he or she sooner dies, resigns, is removed or becomes disqualified. Each of the other officers serves at the pleasure of the Board. |
Schwab VIT Balanced with Growth Portfolio | Annual Report
Schwab VIT Balanced with Growth Portfolio
Bloomberg US Aggregate Bond Index An index that is a broad-based benchmark measuring the performance of the U.S. investment grade, taxable bond market, including U.S. Treasuries, government-related and corporate bonds, mortgage pass-through securities, commercial mortgage-backed securities, and asset-backed securities that are publicly available for sale in the United States. To be eligible for inclusion in the index, securities must be fixed rate, non-convertible, U.S. dollar-denominated with at least $300 million or more of outstanding face value and have one or more years remaining to maturity. The index excludes certain types of securities, including tax-exempt state and local government series bonds, structured notes embedded with swaps or other special features, private placements, floating rate securities, inflation-linked bonds and Eurobonds. The index is market capitalization weighted and the securities in the index are updated on the last business day of each month.
Bloomberg US Treasury 1–3 Year Index An index which includes all publicly-issued U.S. Treasury securities that have a remaining maturity of greater than or equal to one year and less than three years, are rated investment grade, and have $300 million or more of outstanding face value. The securities in the index must be denominated in U.S. dollars and must be fixed-rate and non-convertible. The index excludes state and local government series bonds and coupon issues that have been stripped from bonds. The index is market capitalization weighted and the securities in the index are updated on the last business day of each month.
Bloomberg US Treasury 3–10 Year Index An index which includes all publicly-issued U.S. Treasury securities that have a remaining maturity of greater than or equal to three years and less than ten years, are rated investment grade, and have $300 million or more of outstanding face value. The securities in the index must be denominated in U.S. dollars and must be fixed-rate and non-convertible. The index excludes state and local government series bonds and coupon issues that have been stripped from bonds. The index is market capitalization weighted and the securities in the index are updated on the last business day of each month.
Bloomberg US Treasury Bills 1–3 Month Index An index that includes all publicly issued zero-coupon U.S. Treasury Bills that have a remaining maturity of less than 3 months but more than 1 month, are rated investment grade and have $300 million or more of outstanding face value. It excludes zero-coupon STRIPS.
Bloomberg US Treasury Inflation-Linked Bond Index (Series-L) An index which includes all publicly-issued U.S. Treasury Inflation-Protected Securities (TIPS) that have at least one year remaining to maturity, are rated investment grade and have $500 million or more of outstanding face value. The TIPS in the index must be denominated in U.S. dollars and must be fixed-rate and non-convertible. The index is market capitalization weighted and the TIPS in the index are updated on the last business day of each month. TIPS are publicly issued, dollar denominated U.S. Government securities issued by the U.S. Treasury that have principal and interest payments linked to an official inflation measure (as measured by the Consumer Price Index, or CPI) and their payments are supported by the full faith and credit of the United States.
Dow Jones Equity All REIT Capped Index A float-adjusted market cap weighted index that is designed to measure all equity real estate investment trusts (REITs) in the Dow Jones U.S. Total Stock Market Index, as defined by the S&P Dow Jones Indices REIT/RESI Industry Classification Hierarchy, that meet the minimum float market capitalization (FMC) and liquidity thresholds. The aggregate weight of
all companies weighing more than 4.5% cannot exceed 22.5%, and no single company’s weight can exceed 10%. The index is reviewed daily based on each company’s capped market capitalization weight. Daily capping is only performed when the sum of companies with weights great than 5% exceeds 25%.
Dow Jones U.S. Large-Cap Total Stock Market Index An index that is a subset of the Dow Jones U.S. Total Stock Market Index, and is designed to measure the performance of large-cap U.S. equity securities. The index is a float-adjusted market capitalization weighted index.
Dow Jones U.S. Select REIT Index An index that is a float-adjusted market-capitalization weighted index comprised of income-producing commercial and/or residential real estate investment trusts (REITs). The index excludes mortgage REITs, net-lease REITs, real estate finance companies, mortgage brokers and bankers, commercial and residential real estate brokers and estate agents, homebuilders, large landowners and sub-dividers of unimproved land, hybrid REITs, timber REITs and companies that have more than 25% of their assets in direct mortgage investments.
Dow Jones U.S. Small-Cap Total Stock Market Index An index that is a subset of the Dow Jones U.S. Total Stock Market Index, and is designed to measure the performance of small-cap U.S. equity securities. The index is a float-adjusted market capitalization weighted index.
Dow Jones U.S. Total Stock Market Index An index which includes all U.S. equity issues with readily available prices. The index is a float-adjusted market capitalization weighted index that reflects the shares of securities actually available to investors in the marketplace.
FTSE Developed ex US Index (Net) An index that is comprised of large- and mid-capitalization companies in developed countries outside the United States, as defined by the index provider. The index defines the large- and mid-capitalization universe as approximately the top 90% of the eligible universe. The Net version of the index reflects reinvested dividends net of withholding taxes, but reflects no deductions for expenses or other taxes.
FTSE Developed Small Cap ex US Liquid Index (Net) An index comprised of small-capitalization companies in developed countries outside the United States, as defined by the index provider. The index defines the small-capitalization universe as approximately the bottom 10% of the eligible universe with a minimum free float capitalization of $150 million. The Net version of the index reflects reinvested dividends net of withholding taxes, but reflects no deductions for expenses or other taxes.
FTSE Emerging Index (Net) An index that is comprised of large- and mid-capitalization companies in emerging market countries, as defined by the index provider. The index defines the large- and mid-capitalization universe as approximately the top 90% of the eligible universe. The Net version of the index reflects reinvested dividends net of withholding taxes, but reflects no deductions for expenses or other taxes.
FTSE non-US Dollar World Government Bond Index A market capitalization index that measures the total rate of return performance for the government bonds of 22 countries, excluding the U.S., with a remaining maturity of at least 1 year.
Schwab VIT Balanced with Growth Portfolio | Annual Report
Schwab VIT Balanced with Growth Portfolio
MSCI EAFE Index (Net) A free float-adjusted market capitalization index that is designed to measure the equity market performance of developed markets in Europe, Australasia, and the Far East. The Net version of the index reflects reinvested dividends net of withholding taxes, but reflects no deductions for expenses or other taxes; returns are calculated applying dividend withholding rates applicable to non-resident persons who do not benefit from double taxation treaties.
MSCI Emerging Markets Index (Net) A free float-adjusted market capitalization weighted index that is designed to measure equity market performance in the global emerging markets. This series approximates the minimum possible dividend reinvestment. The returns are calculated applying dividend withholding rates applicable to non-resident persons who do not benefit from double taxation treaties.
Russell 2000 Index An index that measures the performance of the 2,000 smallest companies in the Russell 3000 Index. The Russell 3000 Index measures the performance of the largest 3,000 U.S. companies representing approximately 98% of the investable U.S. equity market.
S&P 500 Index An index that is designed to measure the performance of 500 leading publicly traded companies from a broad range of industries.
VIT Balanced with Growth Composite Index A custom blended index developed by Schwab Asset Management based on a comparable portfolio asset allocation and calculated using the following portion allocations effective July 1, 2020: 26.1% Bloomberg US Aggregate Bond Index, 3.9% Bloomberg US Treasury 1-3 Year Index, 4.0% Bloomberg US Treasury Bills 1-3 Month Index, 1.0% Bloomberg US Treasury Inflation-Linked Bond Index (Series-L), 6.0% Dow Jones Equity All REIT Capped Index, 27.0% Dow Jones U.S. Large-Cap Total Stock Market Index, 6.0% Dow Jones U.S. Small-Cap Total Stock Market Index, 6.0% FTSE All Emerging Index (Net), 17.0% FTSE
Developed ex US Index (Net), 3.0% FTSE Developed Small Cap ex US Liquid Index (Net). From April 29, 2020 through June 30, 2020, the blended index was derived using the following allocations: 26.1% Bloomberg US Aggregate Bond Index, 3.9% Bloomberg US Treasury 1-3 Year Index, 4.0% Bloomberg US Treasury Bills 1-3 Month Index, 1.0% Bloomberg US Treasury Inflation-Linked Bond Index (Series-L), 6.0% Dow Jones U.S. Select REIT Index, 27.0% Dow Jones U.S. Large-Cap Total Stock Market Index, 6.0% Dow Jones U.S. Small-Cap Total Stock Market Index, 6.0% FTSE All Emerging Index (Net), 17.0% FTSE Developed ex US Index (Net), 3.0% FTSE Developed Small Cap ex US Liquid Index (Net). From June 8, 2016 through April 28, 2020, the blended index was derived using the following allocations: 1% Bloomberg Global Treasury ex-US Capped Index, 27% Bloomberg US Aggregate Bond Index, 5% Bloomberg US Treasury Bills 1-3 Month Index, 2% Bloomberg US Treasury Inflation-Linked Bond Index (Series-L), 4% Bloomberg Commodity Index, 6% Dow Jones U.S. Select REIT Index, 22% Dow Jones U.S. Large-Cap Total Stock Market Index, 6% Dow Jones U.S. Small-Cap Total Stock Market Index, 6% FTSE All Emerging Index (Net), 17% FTSE Developed ex US Index (Net), 3% FTSE Developed Small Cap ex US Liquid Index (Net), and 1% Russell Microcap Index. Prior to June 8, 2016, the composite index was derived using the following allocations: 22% Dow Jones U.S. Large-Cap Total Stock Market Index, 6% Dow Jones U.S. Small-Cap Total Stock Market Index, 1% Russell Microcap Index, 17% FTSE Developed ex US Index (Net), 3% FTSE Developed Small Cap ex US Liquid Index (Net), 6% FTSE Emerging Index (Net), 6% Dow Jones U.S. Select REIT Index, 4% Dow Jones UBS Commodity Index, 2% Bloomberg US Treasury Inflation-Linked Bond Index (Series-L), 9% Bloomberg US Treasury 3-10 Year Index, 2% Bloomberg US Aggregate: Agencies Index, 4% Bloomberg US Credit Index, 11% Bloomberg US Mortgage Backed Securities Index, 1% Bloomberg Global Treasury ex-US Capped Index, 1% Bloomberg High Yield Bond Very Liquid Index, and 5% Bloomberg US Treasury Bills 1-3 Month Index.
Schwab VIT Balanced with Growth Portfolio | Annual Report
Annual Report | December 31, 2021
Schwab VIT Growth Portfolio
Proxy Voting Policies, Procedures and Results
A description of the proxy voting policies and procedures used to determine how to vote proxies on behalf of the funds is available without charge, upon request, by visiting the Schwab Fund’s website at www.schwabassetmanagement.com/schwabfunds_prospectus, the SEC’s website at www.sec.gov, or by contacting Schwab Funds at 1-877-824-5615.
Information regarding how a fund voted proxies relating to portfolio securities during the most recent twelve-month period ended June 30 is available, without charge, by visiting Schwab’s website at www.schwabassetmanagement.com/schwabfunds_prospectus or the SEC’s website at www.sec.gov.
Investment Adviser: Charles Schwab Investment Management, Inc., dba Schwab Asset ManagementTM
Schwab VIT Growth Portfolio
The Investment Environment
For the 12-month reporting period ended December 31, 2021, global equities generated mostly positive returns, particularly in the United States, where several key equity market indices ended the reporting period just off record highs. Developed international equity markets were less robust but still positive, while emerging markets and most U.S. fixed-income markets lost ground. Despite persisting COVID-19 pandemic-driven stresses on the global economy and the emergence and rapid spread of the Delta variant during the summer and the Omicron variant in the late fall, equity markets rose through most of the period on strong earnings, ongoing fiscal stimulus measures, and optimism related to increased COVID-19 vaccination rates. Amid growing evidence of a slowing global economy and rising inflation, stocks did weaken somewhat in September and again in late November and early December but quickly regained their momentum. U.S. and developed international equity markets maintained their strength, emerging markets declined, demand for bonds waned, and bond yields rose as prices sank. (Bond yields and bond prices typically move in opposite directions.) Over the reporting period, the U.S. dollar strengthened against a basket of international currencies, generally decreasing the returns on overseas investments in U.S. dollar terms. For the reporting period, the S&P 500® Index, a bellwether for the overall U.S. stock market, returned 28.71%. Outside the United States, the MSCI EAFE® Index (Net)*, a broad measure of developed international equity performance, returned 11.26%. Emerging market equities were weaker, with the MSCI Emerging Markets Index (Net)* returning -2.54%. Fixed-income markets were also weaker, with the Bloomberg US Aggregate Bond Index returning -1.54% and the FTSE non-US Dollar World Government Bond Index returning -9.68%.
Bolstered by the extensive emergency rescue and fiscal stimulus measures passed by the U.S. Congress and U.S. Federal Reserve (Fed) in March 2020, the U.S. economy began to recover from the dramatic impact of the COVID-19 pandemic beginning in the third quarter of 2020. U.S. gross domestic product (GDP) rose at an annualized rate of 6.4% for the first quarter of 2021 and 6.7% for the second quarter of 2021, before falling back to 2.0% for the third quarter of 2021 amid fading government stimuli, persistent inflation, and new surges in COVID-19 cases. Unemployment, which skyrocketed in April 2020, fell over the reporting period, and ended at its lowest level since February 2020. Inflation, which had remained well below the Fed’s traditional 2% target until it jumped in March 2021,
Asset Class Performance Comparison % returns during the 12 months ended December 31, 2021
Index figures assume dividends and distributions were reinvested. Index figures do not include trading and management costs, which would lower performance. Indices are unmanaged and cannot be invested in directly. Performance results less than one year are not annualized. Past performance is not an indication of future results.
For index definitions, please see the Glossary.
Data source: Index provider websites and Schwab Asset Management.
Nothing in this report represents a recommendation of a security by the investment adviser.
Management views may have changed since the report date.
| * | The net version of the index reflects reinvested dividends net of withholding taxes, but reflects no deductions for expenses or other taxes. |
Schwab VIT Growth Portfolio | Annual Report
Schwab VIT Growth Portfolio
The Investment Environment (continued)
continued to rise over the reporting period, largely due to imbalances in the labor market, supply chain bottlenecks, and higher energy costs.
Outside the United States, global economies also displayed resilience but were somewhat more constrained amid continuing struggles against COVID-19 and the emergence and spread of the Delta and Omicron variants. Oil prices rebounded over much of the reporting period, except for dips in July and August and November, on growing demand and reduced production. In the eurozone, GDP growth turned positive for the second and third quarters of 2021, following two previous quarters of contraction. In the United Kingdom, which was particularly hard-hit by the COVID-19 pandemic, GDP growth was negative for the first quarter of 2021, turned strongly positive for the second quarter of 2021, then fell back to just slightly positive for the third quarter of 2021. Japan’s economy vacillated between contraction in the first and third quarters of 2021 and a small gain in the second quarter of 2021 on a resurgence of COVID-19 cases and persistent supply chain disruptions. Among emerging markets, China’s GDP growth rate accelerated sharply for the first quarter of 2021 before easing for the subsequent two quarters, albeit remaining positive, in part because of the political landscape and an emphasis on domestic consumption over globalization. India, after plunging into one of the worst recessions of any major economy in 2020, posted a sharp jump in GDP growth for the second quarter of 2021 before falling back for the third quarter of 2021.
For the most part, central banks around the world, maintained the low—and for some international central banks, negative—interest rates instituted prior to, and in response to, the COVID-19 pandemic. In the United States, the Fed reiterated several times during the reporting period its intention to continue its support of the economy for as long as needed to achieve a full recovery. The Fed maintained the federal funds rate in a range of 0.00% to 0.25% throughout the reporting period. However, as inflation continued to rise and indicators of economic activity and employment continued to strengthen, the Fed began scaling back its bond-buying program in November 2021 citing significant progress made on its twin goals of maximum employment and price stability. The Fed subsequently accelerated its wind-down in December 2021 with expectations to end it altogether by March 2022. Fed officials also signaled that interest rates could begin to rise sooner in 2022 than previously anticipated, although the Fed cautioned that the path of the economy continues to depend on the course of the COVID-19 pandemic. In developed international markets, most central banks were similarly accommodative while acknowledging economic improvements and, in some cases, changes in monetary policy. The European Central Bank held its interest rate at 0.00%, unchanged since March 2016. However, in December 2021, it announced that in the first quarter of 2022 it would reduce the pace of its asset purchase program that it had instituted to help counter the serious risks posed by the COVID-19 pandemic. The Bank of Japan upheld its short-term interest rate target of -0.1%, also unchanged since 2016, and also announced its plans to taper its corporate debt buying to pre-pandemic levels. In December 2021, the Bank of England raised its key official bank rate from 0.1% to 0.25%, its first rate hike since the onset of the COVID-19 pandemic, citing inflation pressures. Emerging markets were mixed. China cut its interest rate by 0.05% in December. Indonesia and India maintained low policy rates implemented in 2020 and early 2021. Central banks in Mexico, Brazil, Russia, and Pakistan raised their rates, citing a stronger-than-expected recovery or to counteract the impacts of inflation.
After languishing at historically low levels since the onset of the COVID-19 pandemic, U.S. bond yields climbed steadily through the first quarter of the reporting period as COVID-19 vaccine distribution ramped up rapidly and investors anticipated an accelerating economic recovery. From April through July, yields drifted lower on tepid employment reports and growing inflation concerns before gradually, albeit non-linearly, rising again by the end of the reporting period. The yield on the 10-year U.S. Treasury began the reporting period at 0.93%, hit a reporting-period high of 1.74% in March, and fell back to end the reporting period at 1.52%. Short-term rates, which remained near historic lows, fell further, with the yield on the three-month U.S. Treasury dropping to 0.06% from 0.09% over the reporting period. Outside the U.S., bond yields generally remained low.
Schwab VIT Growth Portfolio | Annual Report
Schwab VIT Growth Portfolio
 | Zifan Tang, Ph.D., CFA, Senior Portfolio Manager, is responsible for the co-management of the fund. Prior to joining Schwab in 2012, Ms. Tang was a product manager at Thomson Reuters and from 1997 to 2009 worked as a portfolio manager at Barclays Global Investors (now known as BlackRock). |
 | Patrick Kwok, CFA, Portfolio Manager, is responsible for the co-management of the fund. Previously, Mr. Kwok served as an associate portfolio manager from 2012 to 2016. Prior to that, he worked as a fund administration manager, where he was responsible for oversight of sub-advisers, trading, cash management, and fund administration supporting the Charles Schwab Trust Bank Collective Investment Trusts and multi-asset Schwab Funds. Prior to joining Schwab Asset Management in 2008, Mr. Kwok spent two years as an asset operations specialist at Charles Schwab Trust Company. He also worked for one year at State Street Bank & Trust as a portfolio accountant and pricing specialist. |
Schwab VIT Growth Portfolio | Annual Report
Schwab VIT Growth Portfolio as of December 31, 2021
The Schwab VIT Growth Portfolio (the fund) seeks to provide long-term capital appreciation. To pursue its goal, the fund aims to provide diversification across major asset classes, including domestic equity securities, international equity securities, real assets, fixed-income securities, and money market investments, as well as diversification across a range of sub-asset classes within the major asset classes.
The fund is considered a “fund-of-funds” in that it gains exposure to these asset classes by primarily investing in affiliated exchange-traded funds (ETFs) from Schwab Funds. The fund may also invest in affiliated mutual funds from Schwab Funds and Laudus Funds and unaffiliated third-party ETFs and mutual funds. The term “growth” in the fund’s name refers to the fund’s strategy of primarily investing, through its investments in underlying funds, in equity securities (domestic and international) that seek capital growth. As of the fund’s most recent prospectus, the target asset class allocation ranges are 67-97% in equity securities and 3-33% in fixed-income securities.
Market Highlights. For the 12-month reporting period ended December 31, 2021, global equities generated mostly positive returns, particularly in the United States, where several key equity market indices ended the reporting period just off record highs. Developed international equity markets were less robust but still positive, while emerging markets and most U.S. fixed-income markets lost ground. Despite persisting COVID-19 pandemic-driven stresses on the global economy and the emergence and rapid spread of the Delta variant during the summer and the Omicron variant in the late fall, equity markets rose through most of the period on strong earnings, ongoing fiscal stimulus measures, and optimism related to increased COVID-19 vaccination rates. Amid growing evidence of a slowing global economy and rising inflation, stocks did weaken somewhat in September and again in late November and early December but quickly regained their momentum. U.S. and developed international equity markets maintained their strength, emerging markets declined, demand for bonds waned, and bond yields rose as prices sank. (Bond yields and bond prices typically move in opposite directions.) Over the reporting period, the U.S. dollar strengthened against a basket of international currencies, generally decreasing the returns on overseas investments in U.S. dollar terms.
Performance. For the 12-month reporting period ended December 31, 2021, the fund returned 14.67%. The Dow Jones U.S. Total Stock Market Index and the Bloomberg US Aggregate Bond Index, reflecting broad-based U.S. stock and bond market performance, returned 25.66% and -1.54%, respectively. The fund’s internally calculated comparative index, the VIT Growth Composite Index (the composite index), returned 15.31%.
Positioning and Strategies. The fund’s allocations were broadly in line with those of the composite index.
The fund’s U.S. equity exposure was the largest contributor to the total return of the fund. The Schwab U.S. Large-Cap ETF was the largest contributor to the total return of the fund, returning approximately 27% for the reporting period, generally tracking its comparative index component. The Schwab U.S. Small-Cap ETF also contributed to the total return of the fund, returning approximately 16% for the reporting period and generally tracking its comparative index component.
The fund’s international equity exposure also contributed to the total return of the fund. The Schwab International Equity ETF, representing the fund’s developed international markets exposure, returned approximately 11% for the reporting period and the Schwab International Small-Cap Equity ETF, representing the fund’s international small-cap exposure, returned approximately 12% for the reporting period. The Schwab Emerging Markets Equity ETF, representing the fund’s emerging markets exposure, detracted slightly from the fund’s total return, returning approximately -1% for the reporting period. On a relative basis, the three international equity funds generally tracked their comparative index components.
The fund’s real estate exposure also contributed to the total return of the fund, with the Schwab U.S. REIT ETF returning approximately 41% for the reporting period.
The fund’s fixed-income exposure detracted from the total return of the fund. The Schwab U.S. Aggregate Bond ETF was detracted from the total return of the fund, returning approximately -2% for the reporting period and generally tracking its comparative index component.
Management views and portfolio holdings may have changed since the report date.
Schwab VIT Growth Portfolio | Annual Report
Schwab VIT Growth Portfolio
Performance and Fund Facts as of December 31, 2021
The performance data quoted represents past performance. Past performance does not guarantee future results. Investment returns and principal value will fluctuate so that an investor’s shares may be worth more or less than their original cost. Current performance may be lower or higher than performance data quoted. To obtain performance information current to the most recent month end, please visit www.schwabassetmanagement.com/schwabfunds_prospectus.
Performance of Hypothetical $10,000 Investment (July 25, 2012 – December 31, 2021)1
Average Annual Total Returns1
| Fund and Inception Date | 1 Year | 5 Years | Since Inception |
| Fund: Schwab VIT Growth Portfolio (07/25/12) | 14.67% | 10.62% | 9.12% |
| S&P 500® Index | 28.71% | 18.47% | 16.70% |
| Bloomberg US Aggregate Bond Index | -1.54% | 3.57% | 2.66% |
| VIT Growth Composite Index | 15.31% | 11.20% | 9.80% |
| Fund Category: Morningstar Allocation – 70% to 85% Equity2 | 15.77% | 11.46% | N/A |
| Fund Expense Ratio3: 0.58% |
All total return figures on this page assume dividends and distributions were reinvested. Index figures do not include trading and management costs, which would lower performance. Indices are unmanaged and cannot be invested in directly. Performance results less than one year are not annualized.
The components that make up the composite index may vary over time. For index definitions, please see the Glossary.
| 1 | Fund expenses may have been partially absorbed by the investment adviser and its affiliates. Without these reductions, the fund’s returns would have been lower. Fund performance does not reflect the additional fees and expenses imposed by the insurance company under the variable insurance product contract. If those contract fees and expenses were included, the performance would be less than that shown. Please refer to the variable insurance product prospectus for a complete listing of these expenses. |
| 2 | Source for category information: Morningstar, Inc. The Morningstar Category return represents all active and index mutual funds within the category as of the report date. |
| 3 | As stated in the prospectus. Includes 0.08% of acquired fund fees and expenses (AFFE), which are indirect expenses incurred by the fund through its investments in the underlying funds. Reflects the total annual fund operating expenses without contractual fee waivers. For actual expense ratios during the period, not including AFFE, refer to the Financial Highlights section of the financial statements. |
Schwab VIT Growth Portfolio | Annual Report
Schwab VIT Growth Portfolio
Performance and Fund Facts as of December 31, 2021 (continued)
| Number of Holdings | 10 |
| Portfolio Turnover Rate | 13% |
Asset Class Weightings % of Investments1,2
Top Holdings % of Net Assets1,3,4
Portfolio holdings may have changed since the report date.
| 1 | The fund intends to primarily invest in affiliated Schwab ETFs and may also invest in affiliated Schwab Funds and Laudus Funds and unaffiliated third-party ETFs and mutual funds (all such ETFs and mutual funds referred to as “underlying funds”). The fund may also invest directly in equity, fixed-income, or other securities or investments, as appropriate, consistent with its investment objectives, strategies, and policies. |
| 2 | The percentage may differ from the Portfolio Holdings because the above calculation is based on a percentage of total investments, whereas the calculation in the Portfolio Holdings is based on a percentage of net assets. |
| 3 | This list is not a recommendation of any security by the investment adviser. |
| 4 | The holdings listed exclude any temporary liquidity investments. |
Schwab VIT Growth Portfolio | Annual Report
Schwab VIT Growth Portfolio
Fund Expenses (Unaudited)
Examples for a $1,000 Investment
As a fund shareholder, you may incur two types of costs: (1) transaction costs; and (2) ongoing costs, including management fees, transfer agent fees, and other fund expenses.
The expense examples below are intended to help you understand your ongoing cost (in dollars) of investing in the fund and to compare this cost with the ongoing cost of investing in other mutual funds. These examples are based on an investment of $1,000 invested for six months beginning July 1, 2021 and held through December 31, 2021.
The Actual Return line in the table below provides information about actual account values and actual expenses. You may use this information, together with the amount you invested, to estimate the expenses that you paid over the period. To do so, simply divide your account value by $1,000 (for example, an $8,600 account value ÷ $1,000 = 8.6), then multiply the result by the number given for the fund under the heading entitled “Expenses Paid During Period.”
The Hypothetical Return line in the table below provides information about hypothetical account values and hypothetical expenses based on the fund’s actual expense ratio and an assumed return of 5% per year before expenses. Because the return used is not an actual return, it may not be used to estimate the actual ending account value or expenses you paid for the period.
You may use this information to compare the ongoing costs of investing in the fund and other funds. To do so, compare this 5% hypothetical example with the 5% hypothetical examples that appear in the shareholder reports of the other funds.
Please note that the expenses shown in the table are meant to highlight your ongoing costs only, and do not reflect any transactional costs. Therefore, the hypothetical return lines of the table are useful in comparing ongoing costs only, and will not help you determine the relative total costs of owning different funds. In addition, if these transactional costs were included, your costs would have been higher.
| | EXPENSE RATIO
(ANNUALIZED)1,2 | EFFECTIVE
EXPENSE RATIO
(ANNUALIZED)3,4 | BEGINNING
ACCOUNT VALUE
AT 7/1/21 | ENDING
ACCOUNT VALUE
(NET OF EXPENSES)
AT 12/31/212 | EXPENSES PAID
DURING PERIOD
7/1/21-12/31/212,5 | EFFECTIVE
EXPENSES PAID
DURING PERIOD
7/1/21-12/31/214,5 |
| Schwab VIT Growth Portfolio | | | | | | |
| Actual Return | 0.49% | 0.55% | $1,000.00 | $1,037.10 | $2.52 | $2.82 |
| Hypothetical 5% Return | 0.49% | 0.55% | $1,000.00 | $1,022.74 | $2.50 | $2.80 |
| 1 | Based on the most recent six-month expense ratio; may differ from the expense ratio provided in the Financial Highlights. |
| 2 | Excludes acquired fund fees and expenses, which are indirect expenses incurred by the fund through its investments in underlying funds. |
| 3 | Based on the most recent six-month acquired fund fees and expenses and the expense ratio; may differ from the acquired fund fees and expenses and the expense ratio in the prospectus. |
| 4 | Includes acquired fund fees and expenses, which are indirect expenses incurred by the fund through its investments in underlying funds. |
| 5 | Expenses for the fund are equal to its annualized expense ratio, multiplied by the average account value over the period, multiplied by 184 days of the period, and divided by the 365 days of the fiscal year. |
Schwab VIT Growth Portfolio | Annual Report
Schwab VIT Growth Portfolio
Financial Statements
FINANCIAL HIGHLIGHTS
| | 1/1/21–
12/31/21 | 1/1/20–
12/31/20 | 1/1/19–
12/31/19 | 1/1/18–
12/31/18 | 1/1/17–
12/31/17 | |
| Per-Share Data |
| Net asset value at beginning of period | $17.52 | $16.24 | $13.75 | $15.28 | $13.26 | |
| Income (loss) from investment operations: | | | | | | |
| Net investment income (loss)1 | 0.29 | 0.24 | 0.30 | 0.27 | 0.23 | |
| Net realized and unrealized gains (losses) | 2.27 | 1.51 | 2.54 | (1.53) | 2.02 | |
| Total from investment operations | 2.56 | 1.75 | 2.84 | (1.26) | 2.25 | |
| Less distributions: | | | | | | |
| Distributions from net investment income | (0.25) | (0.32) | (0.27) | (0.22) | (0.19) | |
| Distributions from net realized gains | — | (0.15) | (0.08) | (0.05) | (0.04) | |
| Total distributions | (0.25) | (0.47) | (0.35) | (0.27) | (0.23) | |
| Net asset value at end of period | $19.83 | $17.52 | $16.24 | $13.75 | $15.28 | |
| Total return | 14.67% | 11.34% | 20.84% | (8.35%) | 17.14% | |
| Ratios/Supplemental Data |
| Ratios to average net assets: | | | | | | |
| Net operating expenses2 | 0.49% | 0.50% | 0.51% | 0.50% | 0.50% | |
| Gross operating expenses2 | 0.49% | 0.50% | 0.51% | 0.50% | 0.50% | |
| Net investment income (loss) | 1.53% | 1.55% | 1.98% | 1.78% | 1.61% | |
| Portfolio turnover rate | 13% | 18% | 5% | 9% | 6% | |
| Net assets, end of period (x 1,000,000) | $187 | $165 | $160 | $140 | $150 | |
| 1 | Calculated based on the average shares outstanding during the period. |
| 2 | Ratio excludes acquired fund fees and expenses, which are indirect expenses incurred by the fund through its investments in underlying funds. |
Schwab VIT Growth Portfolio | Annual Report
Schwab VIT Growth Portfolio
Portfolio Holdings as of December 31, 2021
This section shows all the securities in the fund’s portfolio and their values as of the report date.
The fund files its complete schedule of portfolio holdings with the U.S. Securities and Exchange Commission (SEC) for the first and third quarters of each fiscal year on Form N-PORT Part F. The fund’s Form N-PORT Part F is available on the SEC’s website at www.sec.gov. The fund also makes available its complete schedule of portfolio holdings on the fund’s website at www.schwabassetmanagement.com/schwabfunds_prospectus, typically 60-80 days after the end of the fund’s fiscal quarter.
| SECURITY | NUMBER
OF SHARES | VALUE ($) |
| AFFILIATED UNDERLYING FUNDS 98.5% OF NET ASSETS |
| |
| U.S. Stocks 42.1% |
| Large-Cap 35.1% |
| Schwab U.S. Large-Cap ETF | 576,548 | 65,622,693 |
| Small-Cap 7.0% |
| Schwab U.S. Small-Cap ETF | 127,745 | 13,081,088 |
| | | 78,703,781 |
| |
| International Stocks 34.0% |
| Developed Markets 26.1% |
| Schwab International Equity ETF | 1,015,652 | 39,478,393 |
| Schwab International Small-Cap Equity ETF | 228,129 | 9,337,320 |
| | | 48,815,713 |
| Emerging Markets 7.9% |
| Schwab Emerging Markets Equity ETF | 498,461 | 14,764,415 |
| | | 63,580,128 |
| |
| Real Estate 6.2% |
| U.S. REITs 6.2% |
| Schwab U.S. REIT ETF | 220,879 | 11,638,115 |
| |
| Fixed Income 13.7% |
| Intermediate-Term Bond 13.7% |
| Schwab U.S. Aggregate Bond ETF | 475,680 | 25,639,152 |
| |
| SECURITY | NUMBER
OF SHARES | VALUE ($) |
| Money Market Funds 2.5% |
| Schwab Variable Share Price Money Fund, Ultra Shares 0.03% (a) | 4,633,990 | 4,635,380 |
Total Affiliated Underlying Funds
(Cost $117,203,585) | 184,196,556 |
| ISSUER | FACE
AMOUNT ($) | VALUE ($) |
| SHORT-TERM INVESTMENTS 1.3% OF NET ASSETS |
| |
| Time Deposits 1.3% |
| Bank of Montreal |
| 0.01%, 01/03/22 (b) | 1,874,369 | 1,874,369 |
| Sumitomo Mitsui Banking Corp. |
| 0.01%, 01/03/22 (b) | 545,797 | 545,797 |
Total Short-Term Investments
(Cost $2,420,166) | 2,420,166 |
Total Investments in Securities
(Cost $119,623,751) | 186,616,722 |
| (a) | The rate shown is the 7-day yield. |
| (b) | The rate shown is the current daily overnight rate. |
| ETF — | Exchange traded fund |
| REIT — | Real Estate Investment Trust |
Schwab VIT Growth Portfolio | Annual Report
Schwab VIT Growth Portfolio
Portfolio Holdings as of December 31, 2021 (continued)
Below is a summary of the fund’s transactions with its affiliated underlying funds during the period ended December 31, 2021:
| | VALUE AT
12/31/20 | PURCHASES | SALES | REALIZED
GAINS (LOSSES) | NET CHANGE IN
UNREALIZED
APPRECIATION
(DEPRECIATION) | VALUE AT
12/31/21 | BALANCE
OF SHARES
HELD AT
12/31/21 | DISTRIBUTIONS
RECEIVED* |
| AFFILIATED UNDERLYING FUNDS 98.5% OF NET ASSETS |
| |
| U.S. Stocks 42.1% |
| Large-Cap 35.1% |
| Schwab U.S. Large-Cap ETF | $58,193,175 | $4,043,580 | ($10,430,918) | $2,886,329 | $10,930,527 | $65,622,693 | 576,548 | $820,346 |
| Small-Cap 7.0% |
| Schwab U.S. Small-Cap ETF | 11,716,761 | 1,580,467 | (1,913,715) | 864,392 | 833,183 | 13,081,088 | 127,745 | 149,070 |
| | | | | | | 78,703,781 | | |
| |
| International Stocks 34.0% |
| Developed Markets 26.1% |
| Schwab International Equity ETF | 34,551,019 | 6,498,247 | (4,264,291) | 308,597 | 2,384,821 | 39,478,393 | 1,015,652 | 1,213,888 |
| Schwab International Small-Cap Equity ETF | 8,321,742 | 950,085 | (636,350) | 95,194 | 606,649 | 9,337,320 | 228,129 | 273,701 |
| | | | | | | 48,815,713 | | |
| Emerging Markets 7.9% |
| Schwab Emerging Markets Equity ETF | 13,509,447 | 3,098,006 | (1,366,285) | 283,886 | (760,639) | 14,764,415 | 498,461 | 401,313 |
| | | | | | | 63,580,128 | | |
| |
| Real Estate 6.2% |
| U.S. REITs 6.2% |
| Schwab U.S. REIT ETF | 9,896,121 | 443,723 | (2,223,928) | 285,284 | 3,236,915 | 11,638,115 | 220,879 | 181,449 |
| |
| Fixed Income 13.7% |
| Intermediate-Term Bond 13.7% |
| Schwab U.S. Aggregate Bond ETF | 22,821,691 | 5,700,719 | (1,990,582) | (67,567) | (825,109) | 25,639,152 | 475,680 | 522,562 |
| |
| Money Market Funds 2.5% |
| Schwab Variable Share Price Money Fund, Ultra Shares | 4,633,903 | 1,588 | (111) | — | — | 4,635,380 | 4,633,990 | 1,473 |
| Total Affiliated Underlying Funds | $163,643,859 | $22,316,415 | ($22,826,180) | $4,656,115 | $16,406,347 | $184,196,556 | | $3,563,802 |
| * | Distributions received include distributions from net investment income and capital gains, if any, from the underlying funds. |
The following is a summary of the inputs used to value the fund’s investments as of December 31, 2021 (see financial note 2(a) for additional information):
| DESCRIPTION | QUOTED PRICES IN
ACTIVE MARKETS FOR
IDENTICAL ASSETS
(LEVEL 1) | OTHER SIGNIFICANT
OBSERVABLE INPUTS
(LEVEL 2) | SIGNIFICANT
UNOBSERVABLE INPUTS
(LEVEL 3) | TOTAL |
| Assets | | | | |
| Affiliated Underlying Funds1 | $184,196,556 | $— | $— | $184,196,556 |
| Short-Term Investments1 | — | 2,420,166 | — | 2,420,166 |
| Total | $184,196,556 | $2,420,166 | $— | $186,616,722 |
| 1 | As categorized in the Portfolio Holdings. |
Fund investments in mutual funds and ETFs are classified as Level 1, without consideration to the classification level of the underlying securities held by the mutual funds and ETFs, which could be Level 1, Level 2 or Level 3.
Schwab VIT Growth Portfolio | Annual Report
Schwab VIT Growth Portfolio
Statement of Assets and Liabilities
As of December 31, 2021
| Assets |
| Investments in securities, at value - affiliated (cost $117,203,585) | | $184,196,556 |
| Investments in securities, at value - unaffiliated (cost $2,420,166) | | 2,420,166 |
| Receivables: | | |
| Investments sold | | 719,342 |
| Dividends | | 69,395 |
| Fund shares sold | | 28,864 |
| Prepaid expenses | + | 417 |
| Total assets | | 187,434,740 |
| Liabilities |
| Payables: | | |
| Investments bought | | 270,512 |
| Investment adviser and administrator fees | | 75,245 |
| Fund shares redeemed | | 17,754 |
| Independent trustees’ fees | | 72 |
| Accrued expenses | + | 33,121 |
| Total liabilities | | 396,704 |
| Net assets | | $187,038,036 |
| Net Assets by Source |
| Capital received from investors | | $114,511,857 |
| Total distributable earnings | + | 72,526,179 |
| Net assets | | $187,038,036 |
| Net Asset Value (NAV) |
| Net Assets | ÷ | Shares
Outstanding | = | NAV |
| $187,038,036 | | 9,429,969 | | $19.83 |
| | | | | |
| | | | | |
Schwab VIT Growth Portfolio | Annual Report
Schwab VIT Growth Portfolio
Statement of Operations
| For the period January 1, 2021 through December 31, 2021 |
| Investment Income |
| Dividends received from securities - affiliated | | $3,563,802 |
| Interest received from securities - unaffiliated | + | 135 |
| Total investment income | | 3,563,937 |
| Expenses |
| Investment adviser and administrator fees | | 791,139 |
| Professional fees | | 25,145 |
| Independent trustees’ fees | | 15,118 |
| Portfolio accounting fees | | 12,934 |
| Shareholder reports | | 11,942 |
| Custodian fees | | 3,494 |
| Transfer agent fees | | 1,880 |
| Other expenses | + | 4,083 |
| Total expenses | – | 865,735 |
| Net investment income | | 2,698,202 |
| REALIZED AND UNREALIZED GAINS (LOSSES) |
| Net realized gains on sales of securities - affiliated | | 4,656,115 |
| Net change in unrealized appreciation (depreciation) on securities - affiliated | + | 16,406,347 |
| Net realized and unrealized gains | | 21,062,462 |
| Increase in net assets resulting from operations | | $23,760,664 |
Schwab VIT Growth Portfolio | Annual Report
Schwab VIT Growth Portfolio
Statement of Changes in Net Assets
For the current and prior report periods
| OPERATIONS |
| | 1/1/21-12/31/21 | 1/1/20-12/31/20 |
| Net investment income | | $2,698,202 | $2,315,860 |
| Net realized gains (losses) | | 4,656,115 | (854,068) |
| Net change in unrealized appreciation (depreciation) | + | 16,406,347 | 15,041,133 |
| Increase in net assets from operations | | $23,760,664 | $16,502,925 |
| DISTRIBUTIONS TO SHAREHOLDERS |
| Total distributions | | ($2,315,222) | ($4,476,302) |
| TRANSACTIONS IN FUND SHARES |
| | 1/1/21-12/31/21 | 1/1/20-12/31/20 |
| | | SHARES | VALUE | SHARES | VALUE |
| Shares sold | | 1,044,962 | $19,957,820 | 369,653 | $5,468,746 |
| Shares reinvested | | 121,089 | 2,315,222 | 306,177 | 4,476,302 |
| Shares redeemed | + | (1,184,544) | (22,175,070) | (1,101,197) | (16,858,442) |
| Net transactions in fund shares | | (18,493) | $97,972 | (425,367) | ($6,913,394) |
| SHARES OUTSTANDING AND NET ASSETS |
| | 1/1/21-12/31/21 | 1/1/20-12/31/20 |
| | | SHARES | NET ASSETS | SHARES | NET ASSETS |
| Beginning of period | | 9,448,462 | $165,494,622 | 9,873,829 | $160,381,393 |
| Total increase (decrease) | + | (18,493) | 21,543,414 | (425,367) | 5,113,229 |
| End of period | | 9,429,969 | $187,038,036 | 9,448,462 | $165,494,622 |
Schwab VIT Growth Portfolio | Annual Report
Schwab VIT Growth Portfolio
1. Business Structure of the Fund:
Schwab VIT Growth Portfolio (the fund) is a series of Schwab Annuity Portfolios (the trust), a no-load, open-end management investment company. The trust is organized as a Massachusetts business trust and is registered under the Investment Company Act of 1940, as amended (the 1940 Act). The list below shows all the funds in the trust as of the end of the period, including the fund discussed in this report, which is highlighted:
| SCHWAB ANNUITY PORTFOLIOS (ORGANIZED JANUARY 21, 1994) |
| Schwab Government Money Market Portfolio | |
| Schwab S&P 500 Index Portfolio | |
| Schwab VIT Balanced Portfolio | |
| Schwab VIT Balanced with Growth Portfolio | |
| Schwab VIT Growth Portfolio | |
The fund is a “fund of funds” which primarily invests in affiliated Schwab Exchange-Traded Funds (ETFs). The fund may also invest in affiliated mutual funds from Schwab Funds and Laudus Funds and unaffiliated third-party ETFs and mutual funds (all such ETFs and mutual funds referred to as "underlying funds"). The fund may also invest directly in equity or fixed-income securities, including bonds, cash equivalents, money market funds and money market investments, to achieve its investment objectives.
The fund in this report offers one share class. Shares are bought and sold at closing net asset value per share (NAV), which is the price for all outstanding shares of the fund. Each share has a par value of 1/1,000 of a cent, and the fund’s Board of Trustees (the Board) may authorize the issuance of as many shares as necessary.
The fund is available exclusively as an investment vehicle for variable annuity and variable life insurance contracts offered by separate accounts of participating life insurance companies, and in the future may be offered to pension and retirement plans qualified under the Internal Revenue Code of 1986, as amended. At December 31, 2021, 100% of the fund’s shares were held through separate accounts of five insurance companies. Subscriptions and redemptions of these insurance separate accounts could have a material impact on the fund.
The fund maintains its own account for purposes of holding assets and accounting, and is considered a separate entity for tax purposes. Within its account, the fund may also keep certain assets in segregated accounts, as required by securities law.
2. Significant Accounting Policies:
The following is a summary of the significant accounting policies the fund uses in its preparation of financial statements. The fund follows the investment company accounting and reporting guidance of the Financial Accounting Standards Board (FASB) Accounting Standard Codification Topic 946 Financial Services — Investment Companies. The accounting policies are in conformity with accounting principles generally accepted in the United States of America (GAAP).
The financial statements of the fund should be read in conjunction with the underlying funds’ financial statements. For more information about the underlying funds’ operations and policies, please refer to those funds’ semiannual and annual reports, which are filed with the U.S. Securities and Exchange Commission (SEC) and are available on the SEC’s website at www.sec.gov.
(a) Security Valuation:
Under procedures approved by the Board, the investment adviser has formed a Pricing Committee to administer the pricing and valuation of portfolio securities and other assets and to ensure that prices used for internal purposes or provided by third parties reasonably reflect fair value. Among other things, these procedures allow the fund to utilize independent pricing services, quotations from securities and financial instrument dealers and other market sources to determine fair value.
The fund values the securities in its portfolio every business day. The fund uses the following policies to value various types of securities:
• Securities traded on an exchange or over-the-counter: Traded securities are valued at the closing value for the day, or, on days when no closing value has been reported, at the mean of the most recent bid and ask quotes.
• Mutual funds: Mutual funds are valued at their respective NAVs.
• Cash management sweep time deposits: Balances held in cash management sweep time deposits are accounted for on a cost basis, which approximates fair value.
Schwab VIT Growth Portfolio | Annual Report
Schwab VIT Growth Portfolio
Financial Notes (continued)
2. Significant Accounting Policies (continued):
• Securities for which no quoted value is available: The Board has adopted procedures to fair value the fund’s securities when market prices are not “readily available” or are unreliable. For example, the fund may fair value a security when it is de-listed or its trading is halted or suspended; when a security’s primary pricing source is unable or unwilling to provide a price; or when a security’s primary trading market is closed during regular market hours. The fund makes fair value determinations in good faith in accordance with the fund’s valuation procedures. The Pricing Committee considers a number of factors, including unobservable market inputs, when arriving at fair value. The Pricing Committee may employ techniques such as the review of related or comparable assets or liabilities, related market activities, recent transactions, market multiples, book values, transactional back-testing, disposition analysis and other relevant information. The Pricing Committee regularly reviews these inputs and assumptions to calibrate the valuations. Due to the subjective and variable nature of fair value pricing, there can be no assurance that the fund could obtain the fair value assigned to the security upon the sale of such security. The Board convenes on a regular basis to review fair value determinations made by the fund pursuant to the valuation procedures.
In accordance with the authoritative guidance on fair value measurements and disclosures under GAAP, the fund discloses the fair value of its investments in a hierarchy that prioritizes the significant inputs to valuation techniques used to measure the fair value. The hierarchy gives the highest priority to valuations based upon unadjusted quoted prices in active markets for identical assets or liabilities (Level 1 measurements) and the lowest priority to valuations based upon unobservable inputs that are significant to the valuation (Level 3 measurements). If inputs used to measure the financial instruments fall within different levels of the hierarchy, the categorization is based on the lowest level input that is significant to the valuation. If the fund determines that either the volume and/or level of activity for an asset or liability has significantly decreased (from normal conditions for that asset or liability) or price quotations or observable inputs are not associated with orderly transactions, increased analysis and management judgment will be required to estimate fair value.
The three levels of the fair value hierarchy are as follows:
• Level 1 — quoted prices in active markets for identical securities — Investments whose values are based on quoted market prices in active markets, and whose values are therefore classified as Level 1 prices, include active listed equities, mutual funds and ETFs. Investments in mutual funds are valued daily at their NAVs, and investments in ETFs are valued daily at the last reported sale price or the official closing price, which are classified as Level 1 prices, without consideration to the classification level of the underlying securities held by an underlying fund.
• Level 2 — other significant observable inputs (including quoted prices for similar securities, interest rates, prepayment speeds, credit risk, etc.) — Investments that trade in markets that are not considered to be active, but whose values are based on quoted market prices, dealer quotations or valuations provided by alternative pricing sources supported by observable inputs are classified as Level 2 prices. These generally include U.S. government and sovereign obligations, most government agency securities, investment-grade corporate bonds, certain mortgage products, less liquid listed equities, and state, municipal and provincial obligations.
• Level 3 — significant unobservable inputs (including the fund’s own assumptions in determining the fair value of investments) — Investments whose values are classified as Level 3 prices have significant unobservable inputs, as they may trade infrequently or not at all. When observable prices are not available for these securities, the fund uses one or more valuation techniques for which sufficient and reliable data is available. The inputs used by the fund in estimating the value of Level 3 prices may include the original transaction price, quoted prices for similar securities or assets in active markets, completed or pending third-party transactions in the underlying investment or comparable issuers, and changes in financial ratios or cash flows. Level 3 prices may also be adjusted to reflect illiquidity and/or non-transferability, with the amount of such discount estimated by the fund in the absence of market information. Assumptions used by the fund due to the lack of observable inputs may significantly impact the resulting fair value and therefore the fund’s results of operations.
The inputs or methodology used for valuing securities are not necessarily an indication of the risk associated with investing in those securities.
The levels associated with valuing the fund’s investments as of December 31, 2021 are disclosed in the Portfolio Holdings.
(b) Accounting Policies for certain Portfolio Investments (if held):
Securities Lending: Under the trust’s Securities Lending Program, a fund (lender) may make short-term loans of its securities to another party (borrower) to generate additional revenue for the fund. The borrower pledges collateral in the form of cash, securities issued or fully guaranteed by the U.S. government or foreign governments, or letters of credit issued by a bank. Collateral at the individual loan level is required to be maintained on a daily marked-to-market basis in an amount at least equal to the current value of the securities loaned. The lending agent provides the fund with indemnification against borrower default (the borrower fails to
Schwab VIT Growth Portfolio | Annual Report
Schwab VIT Growth Portfolio
Financial Notes (continued)
2. Significant Accounting Policies (continued):
return the security on loan) reducing the risk of loss as a result of default. The cash collateral of securities loaned is currently invested in money market portfolios operating pursuant to Rule 2a-7 under the 1940 Act. The fund bears the risk of loss with respect to the investment of cash collateral. The terms of the securities lending agreement allow the fund or the lending agent to terminate any loan at any given time and the securities must be returned within the earlier of the standard trade settlement period or the specified time period under the relevant securities lending agreement. Securities lending income, as disclosed in the fund’s Statement of Operations, if applicable, represents the income earned from the investment of the cash collateral plus any fees paid by borrowers, less the fees paid to the lending agent and broker rebates which are subject to adjustments pursuant to the securities lending agreement. On loans not collateralized by cash, a fee is received from the borrower, and is allocated between the fund and the lending agent. The aggregate fair value of securities loaned will not at any time exceed one-third of the total assets of the fund, including collateral received from the loan. Securities lending fees paid to the unaffiliated lending agents start at 10% of gross lending revenue, with subsequent breakpoints to a low of 5%. In this context, the gross lending revenue equals the income received from the investment of cash collateral and fees paid by borrowers less any rebates paid to the borrowers. Any expenses charged by the cash collateral fund are in addition to these fees. All remaining revenue is retained by the fund, as applicable. No portion of lending revenue is paid to or retained by the investment adviser or any of its affiliates.
As of December 31, 2021, the fund had no securities on loan.
Cash Management Transactions: The fund may subscribe to the Brown Brothers Harriman & Co. (BBH) Cash Management Service Sweep (CMS Sweep). The BBH CMS Sweep is an investment product that automatically sweeps the fund’s cash balances into overnight offshore time deposits with either the BBH Grand Cayman branch or a branch of a pre-approved commercial bank. This fully automated program allows the fund to earn interest on cash balances. Excess cash invested with deposit institutions domiciled outside of the U.S., as with any offshore deposit, may be subject to sovereign actions in the jurisdiction of the deposit institution including, but not limited to, freeze, seizure or diminution. The fund bears the risk associated with the repayment of principal and payment of interest on such instruments by the institution with which the deposit is ultimately placed.
(c) Security Transactions:
Security transactions are recorded as of the date the order to buy or sell the security is executed. Realized gains and losses from security transactions are based on the identified costs of the securities involved.
(d) Investment Income:
Interest income is recorded as it accrues. Dividends and distributions from portfolio securities and underlying funds are recorded on the date they are effective (the ex-dividend date). Any distributions from underlying funds are recorded in accordance with the character of the distributions as designated by the underlying funds.
(e) Expenses:
Expenses that are specific to the fund are charged directly to the fund. Expenses that are common to more than one fund in the trusts generally are allocated among those funds in proportion to their average daily net assets. The fund bears its share of the acquired fund fees and expenses of the underlying funds, which are indirect expenses incurred by the fund through its investments in the underlying funds. Such expenses are reflected in the net asset values of the underlying funds.
(f) Distributions to Shareholders:
The fund makes distributions from net investment income and net realized capital gains, if any, once a year.
(g) Accounting Estimates:
The accounting policies described in this report conform to GAAP. Notwithstanding this, shareholders should understand that in order to follow these principles, fund management has to make estimates and assumptions that affect the information reported in the financial statements. It’s possible that once the results are known, they may turn out to be different from these estimates and these differences may be material.
(h) Federal Income Taxes:
The fund intends to meet federal income and excise tax requirements for regulated investment companies under subchapter M of the Internal Revenue Code, as amended. Accordingly, the fund distributes substantially all of its net investment income and net realized capital gains, if any, to the participating insurance company’s (shareholders) separate accounts each year. As long as the fund meets the tax requirements, it is not required to pay federal income tax.
Schwab VIT Growth Portfolio | Annual Report
Schwab VIT Growth Portfolio
Financial Notes (continued)
2. Significant Accounting Policies (continued):
(i) Indemnification:
Under the fund’s organizational documents, the officers and trustees are indemnified against certain liabilities arising out of the performance of their duties to the fund. In addition, in the normal course of business the fund enters into contracts with its vendors and others that provide general indemnifications. The fund’s maximum exposure under these arrangements is unknown as this would involve future claims that may be made against the fund. However, based on experience, the fund expects the risk of loss attributable to these arrangements to be remote.
3. Risk Factors:
Investing in the fund may involve certain risks, as discussed in the fund’s prospectus, including, but not limited to, those described below. Any of these risks could cause an investor to lose money.
Asset Allocation Risk. The fund is subject to the risk that the selection of the underlying funds and the allocation of the fund’s assets among the various asset classes and market segments may cause the fund to underperform other funds with a similar investment objective.
Conflicts of Interest Risk. The investment adviser’s authority to select and substitute underlying funds from a variety of affiliated and unaffiliated mutual funds and ETFs may create a conflict of interest because the fees paid to it and its affiliates by some underlying funds are higher than the fees paid by other underlying funds. The investment adviser also may have an incentive to select an affiliated underlying fund for other reasons, including to increase assets under management or to support new investment strategies. In addition, other conflicts of interest may exist where the best interests of the affiliated underlying fund may not be aligned with those of the fund. However, the investment adviser is a fiduciary to the fund and is legally obligated to act in the fund’s best interests when selecting underlying funds.
Market Risk. Financial markets rise and fall in response to a variety of factors, sometimes rapidly and unpredictably. Markets may be impacted by economic, political, regulatory and other conditions, including economic sanctions and other government actions. In addition, the occurrence of global events, such as war, terrorism, environmental disasters, natural disasters and epidemics may also negatively affect the financial markets. As with any investment whose performance is tied to these markets, the value of an investment in the fund will fluctuate, which means that an investor could lose money over short or long periods.
Securities Lending Risk. Securities lending involves the risk of loss of rights in, or delay in recovery of, the loaned securities if the borrower fails to return the security loaned or becomes insolvent.
ETF Risk. When the fund invests in an ETF, it will bear a proportionate share of the ETF’s expenses. In addition, lack of liquidity in the market for an ETF’s shares can result in its value being more volatile than the underlying portfolio of securities.
Direct Investment Risk. The fund may invest directly in cash, cash equivalents and equity and fixed-income securities, including money market securities, to maintain its allocations. The fund’s direct investment in these securities is subject to the same or similar risks as an underlying fund’s investment in the same securities.
Underlying Fund Investment Risk. Before investing in the fund, investors should assess the risks associated with the underlying funds in which the fund may invest, which include any combination of the risks described below.
• Equity Risk. The prices of equity securities rise and fall daily. These price movements may result from factors affecting individual companies, industries or the securities market as a whole. In addition, equity markets tend to move in cycles, which may cause stock prices to fall over short or extended periods of time.
• Market Capitalization Risk. Securities issued by companies of different market capitalizations tend to go in and out of favor based on market and economic conditions. During a period when securities of a particular market capitalization fall behind other types of investments, an underlying fund’s performance could be impacted.
• Foreign Investment Risk. An underlying fund’s investments in securities of foreign issuers involve certain risks that may be greater than those associated with investments in securities of U.S. issuers. These include risks of adverse changes in foreign economic, political, regulatory and other conditions; changes in currency exchange rates or exchange control regulations (including limitations on currency movements and exchanges); the imposition of economic sanctions or other government restrictions; differing accounting, auditing, financial reporting and legal standards and practices; differing securities market structures; and higher transaction costs. These risks may negatively impact the value or liquidity of an underlying fund’s investments, and could impair the underlying fund’s ability to meet its investment objective or invest in accordance with its
Schwab VIT Growth Portfolio | Annual Report
Schwab VIT Growth Portfolio
Financial Notes (continued)
3. Risk Factors (continued):
investment strategy. There is a risk that investments in securities denominated in, and/or receiving revenues in, foreign currencies will decline in value relative to the U.S. dollar or, in the case of hedging positions, that the U.S. dollar will decline in value relative to the currency hedged, resulting in the dollar value of an underlying fund’s investment being adversely affected.
• Emerging Markets Risk. Emerging market countries may be more likely to experience political turmoil or rapid changes in market or economic conditions than more developed countries. Emerging market countries often have less uniformity in accounting, auditing, financial reporting and recordkeeping requirements and greater risk associated with the custody of securities. In addition, the financial stability of issuers (including governments) in emerging market countries may be more precarious than in developed countries. As a result, there may be an increased risk of illiquidity and price volatility associated with an underlying fund’s investments in emerging market countries, which may be magnified by currency fluctuations relative to the U.S. dollar, and, at times, it may be difficult to value such investments.
• Growth Investing Risk. Certain of the underlying funds pursue a “growth style” of investing. Growth investing focuses on a company’s prospects for growth of revenue and earnings. If a company’s earnings or revenues fall short of expectations, its stock price may fall dramatically. Growth stocks also can perform differently from the market as a whole and other types of stocks and can be more volatile than other types of stocks. Since growth companies usually invest a high portion of earnings in their business, they may lack the dividends of value stocks that can cushion stock prices in a falling market. Growth stocks may also be more expensive relative to their earnings or assets compared to value or other stocks.
• Value Investing Risk. Certain of the underlying funds may pursue a “value style” of investing. Value investing focuses on companies whose stocks appear undervalued in light of factors such as the company’s earnings, book value, revenues or cash flow. If an underlying fund’s investment adviser’s (or sub-adviser’s) assessment of a company’s value or prospects for exceeding earnings expectations or market conditions is wrong, the underlying fund could suffer losses or produce poor performance relative to other funds. In addition, “value stocks” can continue to be undervalued by the market for long periods of time.
• Fixed-Income Risk. Interest rates rise and fall over time, which will affect an underlying fund’s yield and share price. A change in a central bank’s monetary policy or economic conditions, among other things, may result in a change in interest rates. A rise in interest rates could cause an underlying fund’s share price to fall. The credit quality of a portfolio investment could also cause an underlying fund’s share price to fall. An underlying fund could lose money if the issuer or guarantor of a portfolio investment or the counterparty to a derivatives contract fails to make timely principal or interest payments or otherwise honor its obligations. Fixed-income securities may be paid off earlier or later than expected. Either situation could cause an underlying fund to hold securities paying lower-than-market rates of interest, which could hurt an underlying fund’s yield or share price. Below investment-grade bonds (junk bonds) involve greater credit risk, are more volatile, involve greater risk of price declines and may be more susceptible to economic downturns than investment-grade securities.
• Interest Rate Risk. Interest rates rise and fall over time. As with any investment whose yield reflects current interest rates, an underlying fund’s yield will change over time. During periods when interest rates are low, an underlying fund’s yield (and total return) also may be low. Changes in interest rates also may affect an underlying fund’s share price: a rise in interest rates generally causes an underlying fund’s share price to fall. The longer an underlying fund’s portfolio duration, the more sensitive to interest rate movements its share price is likely to be. Also, a change in a central bank’s monetary policy or economic conditions, among other things, may result in a change in interest rates, which could have sudden and unpredictable effects on the markets and significantly impact the value of fixed-income securities in which the underlying fund invests.
• Credit Risk. A decline in the credit quality of an issuer or guarantor of a portfolio investment could cause an underlying fund to lose money or underperform. An underlying fund could lose money if the issuer or guarantor of a portfolio investment fails to make timely principal or interest payments or otherwise honor its obligations.
• Prepayment and Extension Risk. Certain fixed income securities are subject to the risk that the securities may be paid off earlier or later than expected, especially during periods of falling or rising interest rates, respectively. Prepayments of obligations could cause an underlying fund to forgo future interest income on the portion of the security’s principal repaid early and force the underlying fund to reinvest that money at the lower prevailing interest rates. Extensions of obligations could cause the fund to exhibit additional volatility and hold securities paying lower-than-market rates of interest. Either case could hurt the underlying fund’s performance.
• U.S. Government Securities Risk. Some of the U.S. government securities that the underlying funds invest in are not backed by the full faith and credit of the U.S. government, which means they are neither issued nor guaranteed by the U.S. Treasury. Issuers such as the Federal Home Loan Banks (FHLB) maintain limited access to credit lines from the U.S. Treasury. Certain securities, such as obligations issued by the Federal Farm Credit Banks Funding Corporation, are supported solely by the
Schwab VIT Growth Portfolio | Annual Report
Schwab VIT Growth Portfolio
Financial Notes (continued)
3. Risk Factors (continued):
credit of the issuer. There can be no assurance that the U.S. government will provide financial support to securities of its agencies and instrumentalities if it is not obligated to do so under law. Also, any government guarantees on securities the underlying funds own do not extend to shares of the underlying funds themselves.
• Real Estate Investment Risk. An underlying fund in which the fund may invest may have a policy of concentrating its investments in real estate companies and companies related to the real estate industry. As such, an underlying fund is subject to risks associated with the direct ownership of real estate securities and the fund’s investment in such an underlying fund is subject to risks associated with the direct ownership of real estate securities and an investment in the underlying fund will be closely linked to the performance of the real estate markets. These risks include, among others, declines in the value of real estate; risks related to general and local economic conditions; possible lack of availability of mortgage funds or other limits to accessing the credit or capital markets; defaults by borrowers or tenants, particularly during an economic downturn; and changes in interest rates.
• Real Estate Investment Trusts (REITs) Risk. An underlying fund may invest in REITs. An underlying fund’s investments in REITs will be subject to the risks associated with the direct ownership of real estate, including fluctuations in the value of underlying properties, defaults by borrowers or tenants, changes in interest rates and risks related to general or local economic conditions. REITs are also subject to certain additional risks. For example, equity REITs may be affected by changes in the value of the underlying properties owned by the trusts, and mortgage REITs may be affected by the quality of any credit extended. Further, REITs may have their investments in relatively few properties, a small geographic area or a single property type. In addition, REITs have their own expenses, and the underlying fund will bear a proportionate share of those expenses.
• Mortgage-Backed and Mortgage Pass-Through Securities Risk. Mortgage-backed securities tend to increase in value less than other debt securities when interest rates decline, but are subject to similar or greater risk of decline in fair value during periods of rising interest rates. Certain of the mortgage-backed securities in which an underlying fund may invest are issued or guaranteed by agencies or instrumentalities of the U.S. government but are not backed by the full faith and credit of the U.S. government. There can be no assurance that the U.S. government would provide financial support to its agencies or instrumentalities where it was not obligated to do so which can cause an underlying fund to lose money or underperform. The risks of investing in mortgage-backed securities include, among others, interest rate risk, credit risk, prepayment risk and extension risk. Transactions in mortgage pass-through securities often occur through to-be-announced (TBA) transactions. An underlying fund could lose money or underperform if a TBA counterparty defaults or goes bankrupt.
• Portfolio Turnover Risk. Certain of the underlying funds may buy and sell portfolio securities actively. If they do, their portfolio turnover rate and transaction costs will rise, which may lower the underlying fund’s performance and may increase the likelihood of capital gains distributions.
• Liquidity Risk. An underlying fund may be unable to sell certain securities, such as illiquid securities, readily at a favorable time or price, or the underlying fund may have to sell them at a loss.
• Derivatives Risk. An underlying fund’s use of derivative instruments involves risks different from, or possibly greater than, the risks associated with investing directly in securities and other traditional investments. An underlying fund’s use of derivatives could reduce the underlying fund’s performance, increase volatility, and could cause the underlying fund to lose more than the initial amount invested. In addition, investments in derivatives may involve leverage, which means a small percentage of assets invested in derivatives can have a disproportionately large impact on an underlying fund.
• Securities Lending Risk. Certain underlying funds engage in securities lending, which involves the risk of loss of rights in, or delay in recovery of, the loaned securities if the borrower fails to return the security loaned or becomes insolvent.
• Management Risk. An underlying fund may be an actively managed mutual fund. Any actively managed mutual fund is subject to the risk that its investment adviser (or sub-adviser(s)) will make poor security selections. An underlying fund’s adviser applies its own investment techniques and risk analyses in making investment decisions for the fund, but there can be no guarantee that they will produce the desired results.
• Investment Style Risk. Certain underlying funds seek to track the performance of various segments of the stock market, as measured by their respective indices. Such underlying funds follow these stocks during upturns as well as downturns. Because of their indexing strategy, these underlying funds do not take steps to reduce market exposure or to lessen the effects of a declining market. In addition, because of an underlying fund’s expenses, the underlying fund’s performance is normally below that of the index. Errors relating to an index may occur from time to time and may not be identified by the underlying fund’s index provider for a period time. In addition, market disruptions could cause delays in an underlying fund’s index’s rebalancing schedule. Such errors and/or market disruptions may result in losses for an underlying fund.
Schwab VIT Growth Portfolio | Annual Report
Schwab VIT Growth Portfolio
Financial Notes (continued)
3. Risk Factors (continued):
• Tracking Error Risk. An underlying fund may seek to track the performance of its benchmark index, although it may not be successful in doing so. The divergence between the performance of a fund and its benchmark index, positive or negative, is called “tracking error.” Tracking error can be caused by many factors and it may be significant.
• Concentration Risk. To the extent that an underlying fund’s portfolio is concentrated in the securities of issuers in a particular market, industry, group of industries, sector or asset class, the underlying fund may be adversely affected by the performance of those securities, may be subject to increased price volatility and may be more vulnerable to adverse economic, market, political, or regulatory occurrences affecting that market, industry, group of industries, sector or asset class.
• Commodity Risk. To the extent that an underlying fund invests in commodity-linked derivative instruments, it may subject the underlying fund to greater volatility than investments in traditional securities. Also, commodity-linked investments may be more volatile and less liquid than the underlying commodity. The value of commodity-linked derivative instruments may be affected by changes in overall market movements, commodity index volatility, changes in interest rates, or factors affecting a particular industry or commodity, such as drought, floods, weather, livestock disease, embargoes, tariffs and international economic, political and other regulatory and market developments. The use of leveraged commodity-linked derivatives creates an opportunity for increased return, but also creates the possibility for a greater loss.
• Money Market Fund Risk. The fund may invest in underlying money market funds that either seek to maintain a stable $1.00 net asset value (“stable share price money market funds”) or that have a share price that fluctuates (“variable share price money market funds”). Although an underlying stable share price money market fund seeks to maintain a stable $1.00 net asset value, it is possible to lose money by investing in such a money market fund. Because the share price of an underlying variable share price money market fund will fluctuate, when the fund sells the shares it owns they may be worth more or less than what the fund originally paid for them. In addition, neither type of money market fund is designed to offer capital appreciation. Certain underlying money market funds may impose a fee upon the sale of shares or may temporarily suspend the ability to sell shares if such fund’s liquidity falls below required minimums.
Please refer to the fund’s prospectus for a more complete description of the principal risks of investing in the fund.
4. Affiliates and Affiliated Transactions:
Investment Adviser
Charles Schwab Investment Management Inc., dba Schwab Asset Management, a wholly owned subsidiary of The Charles Schwab Corporation, serves as the fund’s investment adviser and administrator pursuant to an Investment Advisory and Administration Agreement between the investment adviser and the trust.
For its advisory and administrative services to the fund, the investment adviser is entitled to receive an annual fee, accrued daily and payable monthly, equal to 0.45% of the fund’s average daily net assets.
Expense Limitation
The investment adviser and its affiliates have agreed with the fund, for so long as the investment adviser serves as the investment adviser to the fund, which may only be amended or terminated with approval of the fund’s Board, to limit the total annual fund operating expenses charged, excluding interest, taxes and certain non-routine expenses to 0.58%.
The agreement to limit the fund’s total expenses charged is limited to the fund’s direct operating expenses and, therefore, does not apply to acquired fund fees and expenses, which are indirect expenses incurred by the fund through its investments in the underlying funds.
Schwab VIT Growth Portfolio | Annual Report
Schwab VIT Growth Portfolio
Financial Notes (continued)
4. Affiliates and Affiliated Transactions (continued):
Investments in Affiliates
The fund may engage in certain transactions involving related parties. Pursuant to an exemptive order issued by the SEC, the fund may invest in other related ETFs and mutual funds. As of December 31, 2021, the Schwab VIT Growth Portfolio’s ownership percentages of other related funds’ shares are:
| Schwab Emerging Markets Equity ETF | 0.2% |
| Schwab International Equity ETF | 0.1% |
| Schwab International Small-Cap Equity ETF | 0.2% |
| Schwab U.S. Aggregate Bond ETF | 0.3% |
| Schwab U.S. Large-Cap ETF | 0.2% |
| Schwab U.S. REIT ETF | 0.2% |
| Schwab U.S. Small-Cap ETF | 0.1% |
| Schwab Variable Share Price Money Fund, Ultra Shares | 0.2% |
Interfund Borrowing and Lending
Pursuant to an exemptive order issued by the SEC, the fund may enter into interfund borrowing and lending transactions with other funds in the Fund Complex (for definition refer to the Trustees and Officers section). All loans are for temporary or emergency purposes and the interest rate to be charged will be the average of the overnight repurchase agreement rate and the short-term bank loan rate. All loans are subject to numerous conditions designed to ensure fair and equitable treatment of all participating funds. The interfund lending facility is subject to the oversight and periodic review by the Board. The fund had no interfund borrowing or lending activity during the period.
5. Board of Trustees:
The Board may include people who are officers and/or directors of the investment adviser or its affiliates. Federal securities law limits the percentage of such “interested persons” who may serve on a trust’s board, and the trust was in compliance with these limitations throughout the report period. The trust did not pay any of these interested persons for their services as trustees, but it did pay non-interested persons (independent trustees), as noted on the fund’s Statement of Operations. For information regarding the trustees, please refer to the Trustees and Officers table at the end of this report.
6. Borrowing from Banks:
During the period, the fund was a participant with other funds in the Fund Complex in a joint, syndicated, committed $850 million line of credit (the Syndicated Credit Facility), which matured on September 30, 2021. On September 30, 2021, the Syndicated Credit Facility was amended to run for a new 364 day period with the line of credit amount remaining unchanged, maturing on September 29, 2022. Under the terms of the Syndicated Credit Facility, in addition to the interest charged on any borrowings by a fund, the fund paid a commitment fee of 0.15% per annum on the fund’s proportionate share of the unused portion of the Syndicated Credit Facility.
During the period, the fund was a participant with other funds in the Fund Complex in a joint, unsecured, uncommitted $400 million line of credit (the Uncommitted Credit Facility), with State Street Bank and Trust Company, which matured on September 30, 2021. On September 30, 2021, the Uncommitted Credit Facility was amended to run for a new 364 day period with the line of credit amount remaining unchanged, maturing on September 29, 2022. Under the terms of the Uncommitted Credit Facility, the fund pays interest on the amount it borrows. There were no borrowings from either line of credit during the period.
The fund also has access to custodian overdraft facilities. The fund may have utilized the overdraft facility and incurred an interest expense, which is disclosed on the fund’s Statement of Operations, if any. The interest expense is determined based on a negotiated rate above the current Federal Funds Rate.
Schwab VIT Growth Portfolio | Annual Report
Schwab VIT Growth Portfolio
Financial Notes (continued)
| | 7. Purchases and Sales of Investment Securities: |
For the period ended December 31, 2021, purchases and sales of securities (excluding short-term obligations) were as follows:
PURCHASES
OF SECURITIES | SALES
OF SECURITIES |
| $22,316,415 | $22,826,180 |
8. Federal Income Taxes:
As of December 31, 2021, the tax basis cost of the fund’s investments and gross unrealized appreciation and depreciation were as follows:
| TAX COST | GROSS UNREALIZED
APPRECIATION | GROSS UNREALIZED
DEPRECIATION | NET UNREALIZED
APPRECIATION
(DEPRECIATION) |
| $120,713,675 | $66,992,971 | ($1,089,924) | $65,903,047 |
As of December 31, 2021, the components of distributable earnings on a tax basis were as follows:
UNDISTRIBUTED
ORDINARY
INCOME | UNDISTRIBUTED
LONG-TERM
CAPITAL GAINS | NET UNREALIZED
APPRECIATION
(DEPRECIATION)
ON INVESTMENTS | TOTAL |
| $2,844,483 | $3,778,649 | $65,903,047 | $72,526,179 |
The primary difference between book basis and tax basis unrealized appreciation or unrealized depreciation of investments is the tax deferral of losses on wash sales. The tax cost of the fund’s investments, disclosed above, have been adjusted from their book amounts to reflect these unrealized appreciation or depreciation differences, as applicable.
For the fiscal year ended December 31, 2021, the fund had capital loss carryforwards utilized in the amount of $778,717.
The tax basis components of distributions paid during the current and prior fiscal years were as follows:
| | CURRENT FISCAL YEAR END DISTRIBUTIONS | PRIOR FISCAL YEAR END DISTRIBUTIONS |
| | ORDINARY
INCOME | LONG-TERM
CAPITAL
GAINS | ORDINARY
INCOME | LONG-TERM
CAPITAL
GAINS |
| | $2,315,222 | $— | $3,026,731 | $1,449,571 |
Distributions paid to shareholders are based on net investment income and net realized gains determined on a tax basis, which may differ from net investment income and net realized gains for financial reporting purposes. These differences reflect the differing character of certain income items and net realized gains and losses for financial statement and tax purposes, and may result in reclassification among certain capital accounts on the financial statements.
Permanent book and tax basis differences may result in reclassifications between components of net assets as required. The adjustments will have no impact on net assets or the results of operations.
As of December 31, 2021, management has reviewed the tax positions for open periods (for federal purposes, three years from the date of filing and for state purposes, four years from the date of filing) as applicable to the fund, and has determined that no provision for income tax is required in the fund’s financial statements. The fund recognizes interest and penalties, if any, related to unrecognized tax benefits as income tax expense in the Statement of Operations. During the fiscal year ended December 31, 2021, the fund did not incur any interest or penalties.
9. Subsequent Events:
Management has determined there are no subsequent events or transactions through the date the financial statements were issued that would have materially impacted the financial statements as presented.
Schwab VIT Growth Portfolio | Annual Report
Schwab VIT Growth Portfolio
Report of Independent Registered Public Accounting Firm
To the Board of Trustees of Schwab Annuity Portfolios and Shareholders of Schwab VIT Growth Portfolio
Opinion on the Financial Statements and Financial Highlights
We have audited the accompanying statement of assets and liabilities, including the portfolio holdings, of Schwab VIT Growth Portfolio (the “Fund”), one of the funds constituting Schwab Annuity Portfolios, as of December 31, 2021, the related statement of operations for the year then ended, the statement of changes in net assets and the financial highlights for each of the two years in the period then ended, and the related notes. In our opinion, the financial statements and financial highlights present fairly, in all material respects, the financial position of the Fund as of December 31, 2021, the results of its operations for the year then ended, and the changes in its net assets and the financial highlights for each of the two years in the period then ended in conformity with accounting principles generally accepted in the United States of America. The financial highlights for each of the three years in the period ended December 31, 2019 were audited by other auditors, whose report, dated February 18, 2020, expressed an unqualified opinion on such financial highlights.
Basis for Opinion
These financial statements and financial highlights are the responsibility of the Fund’s management. Our responsibility is to express an opinion on the Fund’s financial statements and financial highlights based on our audits. We are a public accounting firm registered with the Public Company Accounting Oversight Board (United States) (PCAOB) and are required to be independent with respect to the Fund in accordance with the U.S. federal securities laws and the applicable rules and regulations of the Securities and Exchange Commission and the PCAOB.
We conducted our audits in accordance with the standards of the PCAOB. Those standards require that we plan and perform the audit to obtain reasonable assurance about whether the financial statements and financial highlights are free of material misstatement, whether due to error or fraud. The Fund is not required to have, nor were we engaged to perform, an audit of its internal control over financial reporting. As part of our audit, we are required to obtain an understanding of internal control over financial reporting but not for the purpose of expressing an opinion on the effectiveness of the Fund’s internal control over financial reporting. Accordingly, we express no such opinion.
Our audits included performing procedures to assess the risks of material misstatement of the financial statements and financial highlights, whether due to error or fraud, and performing procedures that respond to those risks. Such procedures included examining, on a test basis, evidence regarding the amounts and disclosures in the financial statements and financial highlights. Our audits also included evaluating the accounting principles used and significant estimates made by management, as well as evaluating the overall presentation of the financial statements and financial highlights. Our procedures included confirmation of securities owned as of December 31, 2021, by correspondence with the custodian and transfer agent. We believe that our audits provide a reasonable basis for our opinion.
Deloitte & Touche LLP
Denver, Colorado
February 17, 2022
We have served as the auditor of one or more investment companies in the Schwab Funds Complex since 2020.
Schwab VIT Growth Portfolio | Annual Report
Schwab VIT Growth Portfolio
Other Federal Tax Information (unaudited)
Schwab VIT Growth Portfolio may elect to pass on the benefits of the foreign tax credit of $128,453 to its shareholders for the fiscal year ended December 31, 2021. The respective foreign source income on the fund is $1,871,773.
For corporate shareholders, 37.98% of the fund’s dividend distributions paid during the fiscal year ended December 31, 2021, qualify for the corporate dividends received deduction.
Schwab VIT Growth Portfolio | Annual Report
Schwab VIT Growth Portfolio
Liquidity Risk Management Program (unaudited)
The Fund has adopted and implemented a liquidity risk management program (the “program”) as required by Rule 22e-4 under the Investment Company Act of 1940, as amended. The Fund’s Board of Trustees (the “Board”) has designated the Fund’s investment adviser, Charles Schwab Investment Management, Inc., dba Schwab Asset Management, as the administrator of the program. Personnel of the investment adviser or its affiliates conduct the day-to-day operation of the program.
Under the program, the investment adviser manages a Fund’s liquidity risk, which is the risk that the Fund could not meet shareholder redemption requests without significant dilution of remaining shareholders’ interests in the Fund. The program is reasonably designed to assess and manage a Fund’s liquidity risk, taking into consideration the Fund’s investment strategy and the liquidity of its portfolio investments during normal and reasonably foreseeable stressed conditions; its historical redemption history and shareholder concentrations; and its cash holdings and access to other funding sources, including the custodian overdraft facility and lines of credit. The investment adviser’s process of determining the degree of liquidity of each Fund’s investments is supported by third-party liquidity assessment vendors.
The Fund’s Board reviewed a report at its meeting held on September 20, 2021 prepared by the investment adviser regarding the operation and effectiveness of the program for the period June 1, 2020, through May 31, 2021, which included individual Fund liquidity metrics. No significant liquidity events impacting the Fund were noted in the report. In addition, the investment adviser provided its assessment that the program had been operating effectively in managing the Fund’s liquidity risk.
Schwab VIT Growth Portfolio | Annual Report
Schwab VIT Growth Portfolio
Trustees and Officers
The tables below give information about the trustees and officers of Schwab Annuity Portfolios, which includes the fund covered in this report. The “Fund Complex” includes The Charles Schwab Family of Funds, Schwab Capital Trust, Schwab Investments, Schwab Annuity Portfolios, Schwab Strategic Trust and Laudus Trust. The Fund Complex includes 103 funds.
The address for all trustees and officers is 211 Main Street, San Francisco, CA 94105. You can find more information about the trustees and officers in the fund’s Statement of Additional Information, which is available free by calling 1-877-824-5615.
| Independent Trustees |
Name, Year of Birth, and
Position(s) with the trust
(Terms of office, and
length of Time Served1) | Principal Occupations
During the Past Five Years | Number of
Portfolios in
Fund Complex
Overseen by
the Trustee | Other Directorships |
Robert W. Burns
1959
Trustee
(Trustee of Schwab Strategic Trust since 2009; The Charles Schwab Family of Funds, Schwab Investments, Schwab Capital Trust, Schwab Annuity Portfolios and Laudus Trust since 2016) | Retired/Private Investor (Jan. 2009 – present). Formerly, Managing Director, Pacific Investment Management Company, LLC (PIMCO) (investment management firm) and President, PIMCO Funds. | 103 | None |
Nancy F. Heller
1956
Trustee
(Trustee of The Charles Schwab Family of Funds, Schwab Investments, Schwab Capital Trust, Schwab Annuity Portfolios, Schwab Strategic Trust and Laudus Trust since 2018) | Retired. President and Chairman (2014 – 2016), TIAA Charitable (financial services); Senior Managing Director (2003 – 2016), TIAA (financial services). | 103 | None |
David L. Mahoney
1954
Trustee
(Trustee of The Charles Schwab Family of Funds, Schwab Investments, Schwab Capital Trust, Schwab Annuity Portfolios and Laudus Trust since 2011; Schwab Strategic Trust since 2016) | Private Investor. | 103 | Director (2004 – present), Corcept Therapeutics Incorporated
Director (2009 – 2021), Adamas Pharmaceuticals, Inc.
Director (2003 – 2019), Symantec Corporation |
Jane P. Moncreiff
1961
Trustee
(Trustee of The Charles Schwab Family of Funds, Schwab Investments, Schwab Capital Trust, Schwab Annuity Portfolios, Schwab Strategic Trust and Laudus Trust since 2019) | Consultant (2018 – present), Fulham Advisers LLC (management consulting); Chief Investment Officer (2009 – 2017), CareGroup Healthcare System, Inc. (healthcare). | 103 | None |
Kiran M. Patel
1948
Trustee
(Trustee of The Charles Schwab Family of Funds, Schwab Investments, Schwab Capital Trust, Schwab Annuity Portfolios and Laudus Trust since 2011; Schwab Strategic Trust since 2016) | Retired. Executive Vice President and General Manager of Small Business Group (Dec. 2008 – Sept. 2013), Intuit, Inc. (financial software and services firm for consumers and small businesses). | 103 | Director (2008 – present), KLA-Tencor Corporation |
Schwab VIT Growth Portfolio | Annual Report
Schwab VIT Growth Portfolio
| Independent Trustees (continued) |
Name, Year of Birth, and
Position(s) with the trust
(Terms of office, and
length of Time Served1) | Principal Occupations
During the Past Five Years | Number of
Portfolios in
Fund Complex
Overseen by
the Trustee | Other Directorships |
Kimberly S. Patmore
1956
Trustee
(Trustee of The Charles Schwab Family of Funds, Schwab Investments, Schwab Capital Trust, Schwab Annuity Portfolios, Schwab Strategic Trust and Laudus Trust since 2016) | Consultant (2008 – present), Patmore Management Consulting (management consulting). | 103 | None |
J. Derek Penn
1957
Trustee
(Trustee of The Charles Schwab Family of Funds, Schwab Investments, Schwab Capital Trust, Schwab Annuity Portfolios, Schwab Strategic Trust and Laudus Trust since 2021) | Head of Equity Sales and Trading (2006 – 2018), BNY Mellon (financial services). | 103 | None |
| Interested Trustees |
Name, Year of Birth, and
Position(s) with the trust
(Terms of office, and
length of Time Served1) | Principal Occupations
During the Past Five Years | Number of
Portfolios in
Fund Complex
Overseen by
the Trustee | Other Directorships |
Walter W. Bettinger II2
1960
Chairman and Trustee
(Trustee of The Charles Schwab Family of Funds, Schwab Investments, Schwab Capital Trust and Schwab Annuity Portfolios since 2008; Schwab Strategic Trust since 2009; Laudus Trust since 2010) | Director and Chief Executive Officer (Oct. 2008 – present) and President (Oct. 2008 – Oct. 2021), The Charles Schwab Corporation; President and Chief Executive Officer (Oct. 2008 – Oct. 2021) and Director (May 2008 – Oct. 2021), Charles Schwab & Co., Inc.; Director (Apr. 2006 – present), Charles Schwab Bank, SSB; Director (Nov. 2017 – present), Charles Schwab Premier Bank, SSB; Director (July 2019 – present), Charles Schwab Trust Bank; Director (May 2008 – present) and President and Chief Executive Officer (Aug. 2017 – present), Schwab Holdings, Inc.; Director (Oct. 2020 – present), TD Ameritrade Holding Corporation; Director (July 2016 – Oct. 2021), Charles Schwab Investment Management, Inc. | 103 | Director (2008 – present), The Charles Schwab Corporation |
Joseph R. Martinetto2
1962
Trustee
(Trustee of The Charles Schwab Family of Funds, Schwab Investments, Schwab Capital Trust, Schwab Annuity Portfolios, Schwab Strategic Trust and Laudus Trust since 2016) | Chief Operating Officer (Feb. 2018 – present) and Senior Executive Vice President (July 2015 – Feb. 2018), The Charles Schwab Corporation; Senior Executive Vice President (July 2015 – present), Charles Schwab & Co., Inc.; Chief Financial Officer (July 2015 – Aug. 2017) and Executive Vice President and Chief Financial Officer (May 2007 – July 2015), The Charles Schwab Corporation and Charles Schwab & Co., Inc.; Director (May 2007 – present), Charles Schwab & Co., Inc.; Director (Apr. 2010 – present) and Chief Executive Officer (July 2013 – Apr. 2015), Charles Schwab Bank, SSB; Director (Nov. 2017 – present), Charles Schwab Premier Bank, SSB; Director (May 2007 – present), Chief Financial Officer (May 2007 – Aug. 2017), Senior Executive Vice President (Feb. 2016 – present), and Executive Vice President (May 2007 – Feb. 2016), Schwab Holdings, Inc.; Director (Oct. 2020 – present), TD Ameritrade Holding Corporation. | 103 | None |
Schwab VIT Growth Portfolio | Annual Report
Schwab VIT Growth Portfolio
| Officers of the Trust |
Name, Year of Birth, and Position(s) with the trust
(Terms of office, and length of Time Served3) | Principal Occupations During the Past Five Years |
Jonathan de St. Paer
1973
President and Chief Executive Officer
(Officer of The Charles Schwab Family of Funds, Schwab Investments, Schwab Capital Trust, Schwab Annuity Portfolios, Schwab Strategic Trust and Laudus Trust since 2018) | Director (Apr. 2019 – present), President (Oct. 2018 – present), Chief Operating Officer (Jan. 2020 – present), and Chief Executive Officer (Apr. 2019 – Nov. 2019), Charles Schwab Investment Management, Inc.; Senior Vice President (June 2020 – present) and Chief Operating Officer (Jan. 2020 – present), Charles Schwab Investment Advisory, Inc.; Chief Executive Officer (Apr. 2019 – present), President (Nov. 2018 – present) and Trustee (Apr. 2019 – Dec. 2020), Schwab Funds, Laudus Trust and Schwab ETFs; Director (Apr. 2019 – present), Charles Schwab Worldwide Funds plc and Charles Schwab Asset Management (Ireland) Limited; Senior Vice President (Apr. 2019 – present), Senior Vice President – Strategy and Product Development (CSIM) (Jan. 2014 – Mar. 2019), and Vice President (Jan. 2009 – Dec. 2013), Charles Schwab & Co., Inc. |
Mark Fischer
1970
Treasurer, Chief Financial Officer and Chief Operating Officer
(Officer of The Charles Schwab Family of Funds, Schwab Investments, Schwab Capital Trust, Schwab Annuity Portfolios, Schwab Strategic Trust and Laudus Trust since 2013) | Treasurer and Chief Financial Officer (Jan. 2016 – present) and Chief Operating Officer (Dec. 2020 – present), Schwab Funds, Laudus Trust and Schwab ETFs; Assistant Treasurer (Dec. 2013 – Dec. 2015), Schwab Funds and Laudus Trust; Assistant Treasurer (Nov. 2013 – Dec. 2015), Schwab ETFs; Chief Financial Officer (Mar. 2020 – present) and Vice President (Oct. 2013 – present), Charles Schwab Investment Management, Inc.; Executive Director (Apr. 2011 – Sept. 2013), J.P. Morgan Investor Services; Assistant Treasurer (May 2005 – Mar. 2011), Massachusetts Financial Service Investment Management. |
Omar Aguilar
1970
Vice President and Chief Investment Officer
(Officer of The Charles Schwab Family of Funds, Schwab Investments, Schwab Capital Trust, Schwab Annuity Portfolios, Schwab Strategic Trust and Laudus Trust since 2011) | Chief Executive Officer (Jan. 2022 – present) and Chief Investment Officer (Apr. 2011 – present), Senior Vice President (Apr. 2011 – Dec. 2021), Charles Schwab Investment Management, Inc.; Vice President and Chief Investment Officer (June 2011 – present), Schwab Funds, Laudus Trust and Schwab ETFs; Head of the Portfolio Management Group and Vice President of Portfolio Management (May 2009 – Apr. 2011), Financial Engines, Inc. (investment management firm); Head of Quantitative Equity (July 2004 – Jan. 2009), ING Investment Management. |
Brett Wander
1961
Vice President and Chief Investment Officer
(Officer of The Charles Schwab Family of Funds, Schwab Investments, Schwab Capital Trust, Schwab Annuity Portfolios, Schwab Strategic Trust and Laudus Trust since 2011) | Senior Vice President and Chief Investment Officer (Apr. 2011 – present), Charles Schwab Investment Management, Inc.; Vice President and Chief Investment Officer (June 2011 – present), Schwab Funds, Laudus Trust and Schwab ETFs; Senior Managing Director and Global Head of Active Fixed-Income Strategies (Jan. 2008 – Oct. 2010), State Street Global Advisors; Director of Alpha Strategies (Apr. 2006 – Jan. 2008), Loomis, Sayles & Company (investment management firm). |
William P. McMahon, Jr.
1972
Vice President and Chief Investment Officer
(Officer of The Charles Schwab Family of Funds, Schwab Investments, Schwab Capital Trust, Schwab Annuity Portfolios, Schwab Strategic Trust and Laudus Trust since 2021) | Senior Vice President and Chief Investment Officer (Jan. 2020 – present), Charles Schwab Investment Management, Inc.; Vice President and Chief Investment Officer (June 2021 – present), Schwab Funds, Laudus Trust and Schwab ETFs; Senior Vice President and Chief Investment Officer – ThomasPartners Strategies (Apr. 2018 – Dec. 2019), Charles Schwab Investment Advisory, Inc.; Senior Vice President and Chief Investment Officer (May 2001 – Apr. 2018), ThomasPartners, Inc. |
Catherine MacGregor
1964
Chief Legal Officer and Secretary, Schwab Funds and Schwab ETFs
Chief Legal Officer, Vice President and Clerk, Laudus Trust
(Officer of The Charles Schwab Family of Funds, Schwab Investments, Schwab Capital Trust, Schwab Annuity Portfolios and Laudus Trust since 2005; Schwab Strategic Trust since 2009) | Vice President (July 2005 – present), Charles Schwab & Co., Inc.; Vice President (Sept. 2005 – present), Charles Schwab Investment Management, Inc.; Vice President (Dec. 2005 – present) and Chief Legal Officer and Clerk (Mar. 2007 – present), Laudus Trust; Chief Legal Officer and Secretary (Oct. 2021 – present), Vice President (Nov. 2005 – Oct. 2021) and Assistant Secretary (June 2007 – Oct. 2021), Schwab Funds; Chief Legal Officer and Secretary (Oct. 2021 – present), Vice President and Assistant Secretary (Oct. 2009 – Oct. 2021), Schwab ETFs. |
| 1 | Each Trustee shall hold office until the election and qualification of his or her successor, or until he or she dies, resigns or is removed. The retirement policy requires that each independent trustee retire by December 31 of the year in which the Trustee turns 74 or the Trustee’s twentieth year of service as an independent trustee on any trust in the Fund Complex, whichever occurs first. |
| 2 | Mr. Bettinger and Mr. Martinetto are Interested Trustees. Mr. Bettinger is an Interested Trustee because he owns stock of The Charles Schwab Corporation (CSC), the parent company of Charles Schwab Investment Management, Inc., the investment adviser for the trusts in the Fund Complex, and is an employee of Charles Schwab & Co., Inc. (Schwab), the principal underwriter for The Charles Schwab Family of Funds, Schwab Investments, Schwab Capital Trust, Schwab Annuity Portfolios and Laudus Trust. Mr. Martinetto is an Interested Trustee because he owns stock of CSC and is an employee and director of Schwab. |
| 3 | The President, Treasurer and Secretary/Clerk hold office until their respective successors are chosen and qualified or until he or she sooner dies, resigns, is removed or becomes disqualified. Each of the other officers serves at the pleasure of the Board. |
Schwab VIT Growth Portfolio | Annual Report
Schwab VIT Growth Portfolio
Bloomberg US Aggregate Bond Index An index that is a broad-based benchmark measuring the performance of the U.S. investment grade, taxable bond market, including U.S. Treasuries, government-related and corporate bonds, mortgage pass-through securities, commercial mortgage-backed securities, and asset-backed securities that are publicly available for sale in the United States. To be eligible for inclusion in the index, securities must be fixed rate, non-convertible, U.S. dollar-denominated with at least $300 million or more of outstanding face value and have one or more years remaining to maturity. The index excludes certain types of securities, including tax-exempt state and local government series bonds, structured notes embedded with swaps or other special features, private placements, floating rate securities, inflation-linked bonds and Eurobonds. The index is market capitalization weighted and the securities in the index are updated on the last business day of each month.
Bloomberg US Treasury 3–10 Year Index An index which includes all publicly-issued U.S. Treasury securities that have a remaining maturity of greater than or equal to three years and less than ten years, are rated investment grade, and have $300 million or more of outstanding face value. The securities in the index must be denominated in U.S. dollars and must be fixed-rate and non-convertible. The index excludes state and local government series bonds and coupon issues that have been stripped from bonds. The index is market capitalization weighted and the securities in the index are updated on the last business day of each month.
Bloomberg US Treasury Bills 1–3 Month Index An index that includes all publicly issued zero-coupon U.S. Treasury Bills that have a remaining maturity of less than 3 months but more than 1 month, are rated investment grade and have $300 million or more of outstanding face value. It excludes zero-coupon STRIPS.
Bloomberg US Treasury Inflation-Linked Bond Index (Series-L) An index which includes all publicly-issued U.S. Treasury Inflation-Protected Securities (TIPS) that have at least one year remaining to maturity, are rated investment grade and have $500 million or more of outstanding face value. The TIPS in the index must be denominated in U.S. dollars and must be fixed-rate and non-convertible. The index is market capitalization weighted and the TIPS in the index are updated on the last business day of each month. TIPS are publicly issued, dollar denominated U.S. Government securities issued by the U.S. Treasury that have principal and interest payments linked to an official inflation measure (as measured by the Consumer Price Index, or CPI) and their payments are supported by the full faith and credit of the United States.
Dow Jones Equity All REIT Capped Index A float-adjusted market cap weighted index that is designed to measure all equity real estate investment trusts (REITs) in the Dow Jones U.S. Total Stock Market Index, as defined by the S&P Dow Jones Indices REIT/RESI Industry Classification Hierarchy, that meet the minimum float market capitalization (FMC) and liquidity thresholds. The aggregate weight of all companies weighing more than 4.5% cannot exceed 22.5%, and no single company’s weight can exceed 10%. The index is reviewed daily based on each company’s capped market capitalization weight. Daily capping is only performed when the sum of companies with weights great than 5% exceeds 25%.
Dow Jones U.S. Large-Cap Total Stock Market Index An index that is a subset of the Dow Jones U.S. Total Stock Market Index, and is designed to measure the performance of large-cap U.S. equity securities. The index is a float-adjusted market capitalization weighted index.
Dow Jones U.S. Select REIT Index An index that is a float-adjusted market-capitalization weighted index comprised of income-producing commercial and/or residential real estate investment trusts (REITs). The index excludes mortgage REITs, net-lease REITs, real estate finance companies, mortgage brokers and bankers, commercial and residential real estate brokers and estate agents, homebuilders, large landowners and sub-dividers of unimproved land, hybrid REITs, timber REITs and companies that have more than 25% of their assets in direct mortgage investments.
Dow Jones U.S. Small-Cap Total Stock Market Index An index that is a subset of the Dow Jones U.S. Total Stock Market Index, and is designed to measure the performance of small-cap U.S. equity securities. The index is a float-adjusted market capitalization weighted index.
Dow Jones U.S. Total Stock Market Index An index which includes all U.S. equity issues with readily available prices. The index is a float-adjusted market capitalization weighted index that reflects the shares of securities actually available to investors in the marketplace.
FTSE Developed ex US Index (Net) An index that is comprised of large- and mid-capitalization companies in developed countries outside the United States, as defined by the index provider. The index defines the large- and mid-capitalization universe as approximately the top 90% of the eligible universe. The Net version of the index reflects reinvested dividends net of withholding taxes, but reflects no deductions for expenses or other taxes.
FTSE Developed Small Cap ex US Liquid Index (Net) An index comprised of small-capitalization companies in developed countries outside the United States, as defined by the index provider. The index defines the small-capitalization universe as approximately the bottom 10% of the eligible universe with a minimum free float capitalization of $150 million. The Net version of the index reflects reinvested dividends net of withholding taxes, but reflects no deductions for expenses or other taxes.
FTSE Emerging Index (Net) An index that is comprised of large- and mid-capitalization companies in emerging market countries, as defined by the index provider. The index defines the large- and mid-capitalization universe as approximately the top 90% of the eligible universe. The Net version of the index reflects reinvested dividends net of withholding taxes, but reflects no deductions for expenses or other taxes.
FTSE non-US Dollar World Government Bond Index A market capitalization index that measures the total rate of return performance for the government bonds of 22 countries, excluding the U.S., with a remaining maturity of at least 1 year.
MSCI EAFE Index (Net) A free float-adjusted market capitalization index that is designed to measure the equity market performance of developed markets in Europe, Australasia, and the Far East. The Net version of the index reflects reinvested dividends net of withholding taxes, but reflects no deductions for expenses or other taxes; returns are calculated applying dividend withholding rates applicable to non-resident persons who do not benefit from double taxation treaties.
MSCI Emerging Markets Index (Net) A free float-adjusted market capitalization weighted index that is designed to measure equity market performance in the global emerging markets. This series approximates the minimum possible dividend reinvestment. The returns are calculated applying dividend withholding rates applicable to non-resident persons who do not benefit from double taxation treaties.
Schwab VIT Growth Portfolio | Annual Report
Schwab VIT Growth Portfolio
Russell 2000 Index An index that measures the performance of the 2,000 smallest companies in the Russell 3000 Index. The Russell 3000 Index measures the performance of the largest 3,000 U.S. companies representing approximately 98% of the investable U.S. equity market.
S&P 500 Index An index that is designed to measure the performance of 500 leading publicly traded companies from a broad range of industries.
VIT Growth Composite Index A custom blended index developed by Schwab Asset Management based on a comparable portfolio asset allocation and calculated using the following portion allocations effective July 1, 2020: 14.0% Bloomberg US Aggregate Bond Index, 4.0% Bloomberg US Treasury Bills 1-3 Month Index, 6.0% Dow Jones Equity All REIT Capped Index, 35.0% Dow Jones U.S. Large-Cap Total Stock Market Index, 7.0% Dow Jones U.S. Small-Cap Total Stock Market Index, 8.0% FTSE All Emerging Index (Net), 21.0% FTSE Developed ex US Index (Net), 5.0% FTSE Developed Small Cap ex US Liquid Index (Net). From April 29, 2020 through June 30, 2020, the blended index was derived using the following allocations: 14.0% Bloomberg US Aggregate Bond Index, 4.0% Bloomberg US Treasury Bills 1-3 Month Index, 6.0% Dow Jones U.S. Select REIT Index, 35.0% Dow Jones U.S. Large-Cap Total Stock Market Index, 7.0% Dow Jones U.S. Small-Cap Total Stock Market Index, 8.0% FTSE All Emerging Index
(Net), 21.0% FTSE Developed ex US Index (Net), 5.0% FTSE Developed Small Cap ex US Liquid Index (Net). From June 8, 2016 through April 28, 2020, the blended index was derived using the following allocations: 12% Bloomberg US Aggregate Bond Index, 5% Bloomberg US Treasury Bills 1-3 Month Index, 1% Bloomberg US Treasury Inflation-Linked Bond Index (Series-L), 4% Bloomberg Commodity Index, 6% Dow Jones U.S. Select REIT Index, 29% Dow Jones U.S. Large-Cap Total Stock Market Index, 7% Dow Jones U.S. Small-Cap Total Stock Market Index, 8% FTSE All Emerging Index (Net), 21% FTSE Developed ex US Index (Net), 5% FTSE Developed Small Cap ex US Liquid Index (Net), and 2% Russell Microcap Index. Prior to June 8, 2016, the composite index was derived using the following allocations: 29% Dow Jones U.S. Large-Cap Total Stock Market Index, 7% Dow Jones U.S. Small-Cap Total Stock Market Index, 2% Russell Microcap Index, 21% FTSE Developed ex US Index (Net), 5% FTSE Developed Small Cap ex US Liquid Index (Net), 8% FTSE Emerging Index (Net), 6% Dow Jones U.S. Select REIT Index, 4% Dow Jones UBS Commodity Index, 1% Bloomberg US Treasury Inflation-Linked Bond Index (Series-L), 5% Bloomberg US Treasury 3-10 Year Index, 2% Bloomberg US Credit Index, 5% Bloomberg US Mortgage Backed Securities Index, and 5% Bloomberg US Treasury Bills 1-3 Month Index.
Schwab VIT Growth Portfolio | Annual Report
Item 2: Code of Ethics.
| (a) | Registrant has adopted a code of ethics that applies to its principal executive officer, principal financial officer, and any other persons who perform a similar function, regardless of whether these individuals are employed by Registrant or a third party. |
| (c) | During the period covered by the report, no amendments were made to the provisions of this code of ethics. |
| (d) | During the period covered by the report, Registrant did not grant any waivers, including implicit waivers, from the provisions of this code of ethics. |
(f)(1) Registrant has filed this code of ethics as an exhibit pursuant to Item 13(a)(1) of Form N-CSR.
Item 3: Audit Committee Financial Expert.
Registrant’s Board of Trustees has determined that Kiran M. Patel, Kimberly S. Patmore and J. Derek Penn, each currently serving on its audit, compliance and valuation committee, are each an “audit committee financial expert,” as such term is defined in Item 3 of Form N-CSR. Each member of Registrant’s audit, compliance and valuation committee is “independent” under the standards set forth in Item 3 of Form N-CSR.
The designation of each of Mr. Patel, Ms. Patmore and Mr. Penn as an “audit committee financial expert” pursuant to Item 3 of Form N-CSR does not (i) impose upon such individual any duties, obligations, or liability that are greater than the duties, obligations and liability imposed upon such individual as a member of Registrant’s audit, compliance and valuation committee or Board of Trustees in the absence of such designation; and (ii) affect the duties, obligations or liability of any other member of Registrant’s audit, compliance and valuation committee or Board of Trustees.
Item 4: Principal Accountant Fees and Services.
(a) Below are the aggregate fees billed for each of the last two fiscal years for professional services rendered by the principal accountant for the audit of Registrant’s annual financial statements or services that are normally provided by the accountant in connection with statutory and regulatory filings or engagements.
The following table presents fees billed by the principal accountant in each of the last two fiscal years for the services rendered to the Funds:
| | | | | | | | | | | | | | | | | | | | | | | | | | | | | | |
| (a) Audit Fees | | | (b) Audit-Related Fees1 | | | (c) Tax Fees2 | | | (d) All Other Fees | |
Fiscal Year
2021 | | | Fiscal Year
2020 | | | Fiscal Year
2021 | | | Fiscal Year
2020 | | | Fiscal Year
2021 | | | Fiscal Year
2020 | | | Fiscal Year
2021 | | | Fiscal Year
2020 | |
| | $ 103,520 | | | $ | 103,520 | | | $ | 9,000 | | | $ | 9,000 | | | $ | 15,500 | | | $ | 15,500 | | | $ | 0 | | | $ | 0 | |
| 1 | The nature of the services includes assurance and related services reasonably related to the performance of the audit of financial statements not included in Audit Fees. |
| 2 | The nature of the services includes tax compliance, tax advice and tax planning. |
(e) (1) Registrant’s audit, compliance and valuation committee does not have pre-approval policies and procedures as described in paragraph (c)(7) of Rule 2-01 of Regulation S-X.
(2) There were no services described in each of paragraphs (b) through (d) above (including services required to be approved by Registrant’s audit, compliance and valuation committee pursuant to paragraph (c)(7)(ii) of Rule 2-01 of Regulation S-X) that were approved by Registrant’s audit, compliance and valuation committee pursuant to paragraph (c)(7)(i)(C) of Rule 2-01 of Regulation S-X.
(f) Not applicable.
(g) Below are the aggregate non-audit fees billed in each of the last two fiscal years by Registrant’s principal accountant for services rendered to Registrant, to Registrant’s investment adviser, and to any entity controlling, controlled by, or under common control with Registrant’s investment adviser that provides ongoing services to Registrant.
2021: $3,088,431 2020: $3,577,864
(h) During the past fiscal year, all non-audit services provided by Registrant’s principal accountant to either Registrant’s investment adviser or to any entity controlling, controlled by, or under common control with Registrant’s investment adviser that provides ongoing services to Registrant were pre-approved. Included in the audit, compliance and valuation committee’s pre-approval was the review and consideration as to whether the provision of these non-audit services is compatible with maintaining the principal accountant’s independence.
Item 5: Audit Committee of Listed Registrants.
Not applicable.
Item 6: Schedule of Investments.
The schedules of investments are included as part of the report to shareholders filed under Item 1 of this Form.
Item 7: Disclosure of Proxy Voting Policies and Procedures for Closed-End Management Investment Companies.
Not applicable.
Item 8: Portfolio Managers of Closed-End Management Investment Companies.
Not applicable.
Item 9: Purchases of Equity Securities by Closed-End Management Investment Company and Affiliated Purchasers.
Not applicable.
Item 10: Submission of Matters to a Vote of Security Holders.
Not applicable.
Item 11: Controls and Procedures.
| | (a) | Based on their evaluation of Registrant’s disclosure controls and procedures, as of a date within 90 days of the filing date, Registrant’s Chief Executive Officer, Jonathan de St. Paer and Registrant’s Chief Financial Officer, Mark Fischer, have concluded that Registrant’s disclosure controls and procedures are: (i) reasonably designed to ensure that information required to be disclosed in this report is appropriately communicated to Registrant’s officers to allow timely decisions regarding disclosures required in this report; (ii) reasonably designed to ensure that information required to be disclosed in this report is recorded, processed, summarized and reported in a timely manner; and (iii) are effective in achieving the goals described in (i) and (ii) above. |
| | (b) | During the period covered by this report, there have been no changes in Registrant’s internal control over financial reporting that the above officers believe to have materially affected, or to be reasonably likely to materially affect, Registrant’s internal control over financial reporting. |
Item 12: Disclosure of Securities Lending Activities for Closed-End Management Investment Companies.
Not applicable.
Item 13: Exhibits.
(a) (1) Registrant’s code of ethics (that is the subject of the disclosure required by Item 2(a)) is attached.
Pursuant to the requirements of the Securities Exchange Act of 1934 and the Investment Company Act of 1940, the registrant has duly caused this report to be signed on its behalf by the undersigned, thereunto duly authorized.
(Registrant) Schwab Annuity Portfolios
| | |
| By: | | /s/ Jonathan de St. Paer |
| | Jonathan de St. Paer Chief Executive Officer |
| |
| Date: | | February 17, 2022 |
Pursuant to the requirements of the Securities Exchange Act of 1934 and the Investment Company Act of 1940, this report has been signed below by the following persons on behalf of the registrant and in the capacities and on the dates indicated.
| | |
| By: | | /s/ Jonathan de St. Paer |
| | Jonathan de St. Paer Chief Executive Officer |
| |
| Date: | | February 17, 2022 |
| | |
| By: | | /s/ Mark Fischer |
| | Mark Fischer Chief Financial Officer |
| |
| Date: | | February 17, 2022 |