UNITED STATES
SECURITIES AND EXCHANGE COMMISSION
Washington, D.C. 20549
FORM N-CSR
CERTIFIED SHAREHOLDER REPORT OF REGISTERED
MANAGEMENT INVESTMENT COMPANIES
Investment Company Act file number: 811-08314
Schwab Annuity Portfolios
(Exact name of registrant as specified in charter)
211 Main Street, San Francisco, California 94105
(Address of principal executive offices) (Zip code)
Omar Aguilar
Schwab Annuity Portfolios
211 Main Street, San Francisco, California 94105
(Name and address of agent for service)
Registrant’s telephone number, including area code: (415) 636-7000
Date of fiscal year end: December 31
Date of reporting period: December 31, 2023
Item 1: Report(s) to Stockholders.
Annual Report | December 31, 2023
Schwab Government Money Market Portfolio
No Action Required – Notice Regarding Shareholder Report Delivery |
Beginning on July 24, 2024, fund shareholder reports will be streamlined to highlight key information deemed important for investors to assess and monitor their fund investments. Other information, including financial statements, will not appear in the streamlined shareholder reports but will available online and delivered free of charge upon request. |
• If you already receive the full shareholder reports, you will receive the streamlined shareholder reports in the same way that you currently receive the full shareholder reports (either in paper or electronically). |
• If you currently receive a notification when a shareholder report is available on a fund’s website, beginning July 24, 2024, you will begin to receive the streamlined shareholder report (in paper). |
Proxy Voting Policies, Procedures and Results
A description of the proxy voting policies and procedures used to determine how to vote proxies on behalf of the funds is available without charge, upon request, by visiting the Schwab Fund’s website at www.schwabassetmanagement.com/schwabfunds_prospectus, the SEC’s website at www.sec.gov, or by contacting Schwab Funds at 1-877-824-5615.
Information regarding how a fund voted proxies relating to portfolio securities during the most recent twelve-month period ended June 30 is available, without charge, by visiting Schwab’s website at www.schwabassetmanagement.com/schwabfunds_prospectus or the SEC’s website at www.sec.gov.
Investment Adviser: Charles Schwab Investment Management, Inc., dba Schwab Asset Management®
Schwab Government Money Market Portfolio
| Linda Klingman, Managing Director and Head of Money Market Strategies for Schwab Asset Management, leads the portfolio management teams for taxable and tax-exempt Schwab Money Funds and has overall responsibility for all aspects of the management of the fund. Prior to joining Schwab in 1990, she was a senior money market trader with AIM Management, Inc. She has managed money market funds since 1988. |
| Lynn Paschen, Senior Portfolio Manager for Schwab Asset Management, is responsible for the day-to-day co-management of the fund. Prior to joining Schwab in 2011, Ms. Paschen held a number of positions at American Century Investments. She was most recently a portfolio manager and, from 2000 to 2003, worked as a fixed-income trader. She has managed money market funds since 2003. |
| Nicole Perret-Gentil, Portfolio Manager for Schwab Asset Management, is responsible for the day-to-day co-management of the fund. Prior to joining Schwab in 2016, Ms. Perret-Gentil worked at Freddie Mac for 15 years, most recently as a senior portfolio manager where she managed and executed trades for a fixed-income strategy. Prior to that role, she served as a portfolio manager performing fixed-income analysis, a senior research analyst for investor and dealer relations, a senior securities operations analyst in loan and securities operations, and a lead mortgage securities operations specialist. She also worked at Merrill Lynch for a year as a senior specialist in fixed-income global banking and investments. |
Schwab Government Money Market Portfolio | Annual Report2
Schwab Government Money Market Portfolio
The Schwab Government Money Market Portfolio’s (the fund) goal is to seek the highest current income consistent with stability of capital and liquidity. To pursue its goal, the fund invests in U.S. government securities such as U.S. Treasury bills and notes, other obligations that are issued by the U.S. government, its agencies, or instrumentalities, repurchase agreements that are collateralized fully by cash and/or U.S. government securities, and obligations that are issued by private issuers that are guaranteed as to principal or interest by the U.S. government, its agencies, or instrumentalities. The fund will invest at least 99.5% of its total assets in cash, U.S. government securities and/or repurchase agreements that are collateralized fully by cash and/or U.S. government securities; under normal circumstances, at least 80% of the fund’s net assets (including, for this purpose, any borrowings for investment purposes) will be invested in U.S. government securities, including repurchase agreements that are collateralized fully by U.S. government securities. For more information concerning the fund’s investment objective, strategy, and risks, please see the fund’s prospectus.
Market Highlights. During the 12-month reporting period ended December 31, 2023, demand for money market funds remained strong. In its efforts to lower inflation, the Fed raised interest rates four times between January and July, increasing the federal funds rate from a range of 4.25% to 4.50% to a range of 5.25% to 5.50%. The Fed cited strong economic activity and low unemployment along with the potential risks from tighter financial and credit conditions for households and businesses as justification for keeping the federal funds rate unchanged later in the year. The Fed also maintained its program to reduce the assets held on its balance sheet, though its balance sheet temporarily spiked in March when the Fed supported banks after the failure of two U.S. regional banks (a third U.S. regional bank failed in early May). Despite that spike, the Fed’s balance sheet assets declined over the reporting period.
In January, the U.S. Treasury hit the debt limit and began operating under “extraordinary measures.” During the lead-up to debt-ceiling negotiations, the supply of U.S. Treasury bills declined, and short-term U.S. Treasury bills with maturities that could potentially be affected by a technical default became more volatile. Supply subsequently increased once a debt ceiling agreement was reached in early June. Through it all, the Fed’s Overnight Reverse Repurchase Agreement Facility ensured there was no shortage of supply despite the swings in U.S. Treasury bill issuance.
Central banks outside the United States battled with persistently high inflation. Both the European Central Bank and the Bank of England raised their key policy rates multiple times over the year—six times for the European Central Bank and five times for the Bank of England—before holding rates steady beginning at their October and September meetings, respectively, as inflation and pricing pressures finally showed signs of easing. In contrast, the Bank of Japan continued to uphold its short-term interest rate target of -0.1%, unchanged since 2016, but maintained its pledge to ramp up stimulus “without hesitation” if needed.
Performance, Positioning, and Strategies. Throughout the reporting period, the fund’s investment adviser remained focused on ensuring liquidity and stability of capital as market conditions evolved, while continuing its rigorous credit review process and ongoing monitoring for all issuers and regions in which the fund invests. As the year progressed, inflation moderated, expectations of future rate hikes diminished, and the potential for rate cuts in 2024 grew. To lock in higher yields before the Fed potentially begins cutting rates, the fund’s weighted average maturity (WAM) was extended, beginning the reporting period at 21 days and ending it at 33 days.
Portfolio Composition By Effective Maturity % of Investments1
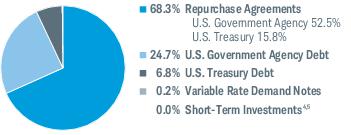
Portfolio Composition by Security Type % of Investments3
Weighted Average Maturity2 | |
Management views and portfolio holdings may have changed since the report date.
1
Maturity shown is the date the security matures, the date the interest rate on those securities is reset, or the date those securities can be redeemed through demand.
2
Money funds must maintain a dollar-weighted average maturity of no longer than 60 days and cannot invest in any security whose effective maturity is longer than 397 days (approximately 13 months).
3
The percentage may differ from the Portfolio Holdings because the above calculation is based on a percentage of total investments, whereas the calculation in the Portfolio Holdings is based on a percentage of net assets.
4
Includes the fund’s position in money market mutual funds registered under the Investment Company Act of 1940, as amended.
3Schwab Government Money Market Portfolio | Annual Report
Schwab Government Money Market Portfolio
Performance and Fund Facts as of December 31, 2023
The performance data quoted represents past performance. Past performance does not guarantee future results. Current performance may be lower or higher than performance data quoted. To obtain more current performance information, please visit www.schwabassetmanagement.com/schwabfunds_prospectus.
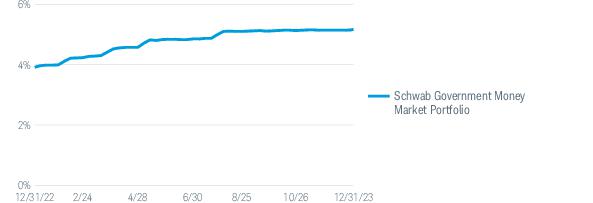
Seven-Day Average Yield Trend for Previous 12 Months
The seven-day yield is the income generated by the fund’s holdings minus the fund’s operating expenses. The seven-day yields are calculated using standard SEC formulas. The effective yield includes the effect of reinvesting daily dividends. Please remember that money market fund yields fluctuate.
| Schwab Government Money Market Portfolio |
| |
Seven-Day Yield (with waivers)2 | |
Seven-Day Yield (without waivers)2 | |
Seven-Day Effective Yield (with waivers)2 | |
You could lose money by investing in the fund. Although the fund seeks to preserve the value of your investment at $1.00 per share, it cannot guarantee it will do so. An investment in the fund is not insured or guaranteed by the Federal Deposit Insurance Corporation or any other government agency. The fund’s sponsor has no legal obligation to provide financial support to the fund, and you should not expect that the sponsor will provide financial support to the fund at any time.
1
Fund yields do not reflect the additional fees and expenses imposed by the insurance company under the variable insurance product contract. If those contract fees and expenses were included, the yields would be less than those shown. Please refer to the variable insurance product prospectus for a complete listing of these expenses.
2
The Seven-Day Yield (with waivers) is the average income paid out over the previous seven days assuming interest income is not reinvested and it reflects the effect of any applicable waivers. Absent such waivers, the fund’s yield would have been lower. The Seven-Day Yield (without waivers) is the yield without the effect of any applicable waivers. The Seven-Day Effective Yield is the yield with waivers assuming that all interest income is reinvested in additional shares of the fund. For additional details, see financial note 4.
Schwab Government Money Market Portfolio | Annual Report4
Schwab Government Money Market Portfolio
Fund Expenses (Unaudited)
Examples for a $1,000 Investment
As a fund shareholder, you may incur two types of costs: (1) transaction costs; and (2) ongoing costs, including management fees, transfer agent fees, and other fund expenses.
The expense examples below are intended to help you understand your ongoing cost (in dollars) of investing in the fund and to compare this cost with the ongoing cost of investing in other mutual funds. These examples are based on an investment of $1,000 invested for six months beginning July 1, 2023 and held through December 31, 2023.
The Actual Return line in the table below provides information about actual account values and actual expenses. You may use this information, together with the amount you invested, to estimate the expenses that you paid over the period. To do so, simply divide your account value by $1,000 (for example, an $8,600 account value ÷ $1,000 = 8.6), then multiply the result by the number given for the fund under the heading entitled “Expenses Paid During Period.”
The Hypothetical Return line in the table below provides information about hypothetical account values and hypothetical expenses based on the fund’s actual expense ratio and an assumed return of 5% per year before expenses. Because the return used is not an actual return, it may not be used to estimate the actual ending account value or expenses you paid for the period.
You may use this information to compare the ongoing costs of investing in the fund and other funds. To do so, compare this 5% hypothetical example with the 5% hypothetical examples that appear in the shareholder reports of the other funds.
Please note that the expenses shown in the table are meant to highlight your ongoing costs only, and do not reflect any transactional costs. Therefore, the hypothetical return line of the table is useful in comparing ongoing costs only, and will not help you determine the relative total costs of owning different funds. In addition, if these transactional costs were included, your costs would have been higher.
| | BEGINNING
ACCOUNT VALUE
AT 7/1/23 | ENDING
ACCOUNT VALUE
(NET OF EXPENSES)
AT 12/31/23 | EXPENSES PAID
DURING PERIOD
|
Schwab Government Money Market Portfolio | | | | |
| | | | |
| | | | |
| Based on the most recent six-month expense ratio. |
| Expenses for the fund are equal to its annualized expense ratio, multiplied by the average account value over the period, multiplied by 184 days in the period, and divided by 365 days in the fiscal year. |
5Schwab Government Money Market Portfolio | Annual Report
Schwab Government Money Market Portfolio
Financial Statements
| | | | | | |
|
Net asset value at beginning of period | | | | | | |
Income (loss) from investment operations: | | | | | | |
Net investment income (loss)1 | | | | | | |
Net realized and unrealized gains (losses) | | | | | | |
Total from investment operations | | | | | | |
| | | | | | |
Distributions from net investment income | | | | | | |
Distributions from net realized gains | | | | | | |
| | | | | | |
Net asset value at end of period | | | | | | |
| | | | | | |
|
Ratios to average net assets: | | | | | | |
| | | | | | |
| | | | | | |
Net investment income (loss) | | | | | | |
Net assets, end of period (x 1,000) | | | | | | |
| Calculated based on the average shares outstanding during the period. |
| Per-share amount was less than $0.005. |
| These amounts include a non-recurring special distribution. The effect on the distributions from net investment income was less than $0.005 and the effect on the total return was 0.05%. |
| Reflects the effect of a voluntary yield waiver. |
| Ratio includes less than 0.005% of non-routine proxy expenses. |
| Effective September 24, 2020, the contractual expense limitation changed. The ratio presented for period ended December 31, 2020 is a blended ratio. |
| Reflects the effect of a voluntary yield waiver in excess of the contractual expense limitation. |
Schwab Government Money Market Portfolio | Annual Report6
Schwab Government Money Market Portfolio
Portfolio Holdings as of December 31, 2023
This section shows all the securities in the fund’s portfolio and their values as of the report date.
The fund files its complete schedule of portfolio holdings with the U.S. Securities and Exchange Commission (SEC) monthly on Form N-MFP, which is available immediately upon filing. The fund’s Form N-MFP is available on the SEC’s website at www.sec.gov. The fund also makes available its complete schedule of portfolio holdings 5 business days after month end on the fund’s website at www.schwabassetmanagement.com/schwabfunds_prospectus.
For fixed rate securities, the rate shown is the coupon rate (the rate established when the security was issued) and if the coupon rate is not available, the effective yield at the time of purchase is shown. For variable rate securities, the rate shown is the interest rate as of the report date based on each security’s rate reset date. The reference rate and spread used is shown parenthetically in the security description, if available; if not, the reference rate is described in a footnote. The date shown in the maturity date column below is either the date on which the principal amount must be paid or the date payment must be made pursuant to a demand feature. If the security’s structure includes one of a number of maturity-shortening provisions set forth in Rule 2a-7, such as an interest rate reset, demand feature or put feature, the effective maturity date is also disclosed. If the effective maturity and maturity date are the same, the date will only appear in the maturity date column.
| | | | | | |
U.S. GOVERNMENT AGENCY DEBT 24.6% OF NET ASSETS |
FEDERAL FARM CREDIT BANKS FUNDING CORP | | | | | | |
| | | | | | |
| | | | | | |
| | | | | | |
| | | | | | |
| | | | | | |
| | | | | | |
| | | | | | |
| | | | | | |
| | | | | | |
| | | | | | |
| | | | | | |
| | | | | | |
| | | | | | |
| | | | | | |
| | | | | | |
| | | | | | |
| | | | | | |
| | | | | | |
| | | | | | |
| | | | | | |
| | | | | | |
| | | | | | |
| | | | | | |
| | | | | | |
| | | | | | |
| | | | | | |
| | | | | | |
| | | | | | |
| | | | | | |
| | | | | | |
| | | | | | |
| | | | | | |
| | | | | | |
| | | | | | |
| | | | | | |
7Schwab Government Money Market Portfolio | Annual Report
Schwab Government Money Market Portfolio
Portfolio Holdings as of December 31, 2023 (continued)
Schwab Government Money Market Portfolio | Annual Report8
Schwab Government Money Market Portfolio
Portfolio Holdings as of December 31, 2023 (continued)
| | | | | | |
| | | | | | |
| | | | | | |
| | | | | | |
| | | | | | |
| | | | | | |
| | | | | | |
| | | | | | |
| | | | | | |
| | | | | | |
| | | | | | |
| | | | | | |
| | | | | | |
| | | | | | |
| | | | | | |
| | | | | | |
| | | | | | |
| | | | | | |
| | | | | | |
| | | | | | |
| | | | | | |
| | | | | | |
| | | | | | |
FEDERAL NATIONAL MORTGAGE ASSOCIATION | | | | | | |
| | | | | | |
| | | | | | |
| | | | | | |
| | | | | | |
Total U.S. Government Agency Debt
(Cost $59,704,293) | |
|
U.S. TREASURY DEBT 6.8% OF NET ASSETS |
| | | | | | |
| | | | | | |
| | | | | | |
| | | | | | |
| | | | | | |
| | | | | | |
| | | | | | |
| | | | | | |
| | | | | | |
| | | | | | |
| | | | | | |
| | | | | | |
| | | | | | |
| | | | | | |
| | | | | | |
| | | | | | |
| | | | | | |
| | | | | | |
9Schwab Government Money Market Portfolio | Annual Report
Schwab Government Money Market Portfolio
Portfolio Holdings as of December 31, 2023 (continued)
| | | | | | |
| | | | | | |
| | | | | | |
| | | | | | |
| | | | | | |
| | | | | | |
Total U.S. Treasury Debt
(Cost $16,496,026) | |
|
VARIABLE RATE DEMAND NOTES 0.2% OF NET ASSETS |
|
TAXABLE VARIABLE RATE DEMAND NOTES SERIES 2022 (LOC: FEDERAL HOME LOAN BANKS) | | | | | | |
Total Variable Rate Demand Notes
(Cost $600,000) | |
|
INVESTMENT COMPANIES 0.0% OF NET ASSETS |
| |
STATE STREET INSTITUTIONAL U.S. GOVERNMENT MONEY MARKET FUND, PREMIER CLASS | | | | | | |
Total Investment Companies
(Cost $45,600) | |
| | | | | | |
REPURCHASE AGREEMENTS 68.1% OF NET ASSETS |
U.S. GOVERNMENT AGENCY REPURCHASE AGREEMENTS* 52.3% |
| | | | | | |
Issued 12/29/23, repurchase date 01/02/24 | | | | | | |
(Collateralized by U.S. Government Agency Securities valued at $10,300,204, 2.50% - 4.00%, due 08/01/39 - 06/01/52) | | | | | | |
| | | | | | |
Issued 12/29/23, repurchase date 01/02/24 | | | | | | |
(Collateralized by U.S. Government Agency Securities valued at $10,306,112, 3.00%, due 04/20/52) | | | | | | |
| | | | | | |
Issued 12/26/23, repurchase date 01/02/24 | | | | | | |
(Collateralized by U.S. Government Agency Securities valued at $1,031,066, 5.50%, due 06/20/53) | | | | | | |
Issued 12/29/23, repurchase date 01/02/24 | | | | | | |
(Collateralized by U.S. Government Agency Securities valued at $8,244,890, 5.50%, due 06/20/53) | | | | | | |
| | | | | | |
Issued 12/29/23, repurchase date 01/02/24 | | | | | | |
(Collateralized by U.S. Treasury and U.S. Government Agency Securities valued at $8,234,009, 0.00% - 6.14%, due 04/16/24 - 10/20/69) | | | | | | |
Schwab Government Money Market Portfolio | Annual Report10
Schwab Government Money Market Portfolio
Portfolio Holdings as of December 31, 2023 (continued)
| | | | | | |
Issued 12/29/23, repurchase date 01/02/24 | | | | | | |
(Collateralized by U.S. Treasury and U.S. Government Agency Securities valued at $1,021,507, 0.75% - 6.24%, due 07/15/32 - 04/20/72) | | | | | | |
Issued 10/16/23, repurchase date 04/16/24 | | | | | | |
(Collateralized by U.S. Government Agency Securities valued at $2,060,000, 6.01% - 7.35%, due 06/25/25 - 04/20/72) | | | | | | |
CANADIAN IMPERIAL BANK OF COMMERCE | | | | | | |
Issued 12/29/23, repurchase date 01/02/24 | | | | | | |
(Collateralized by U.S. Government Agency Securities valued at $1,030,001, 3.00% - 5.43%, due 10/01/38 - 03/01/53) | | | | | | |
DAIWA CAPITAL MARKETS AMERICA INC | | | | | | |
Issued 12/29/23, repurchase date 01/02/24 | | | | | | |
(Collateralized by U.S. Treasury and U.S. Government Agency Securities valued at $1,020,059, 2.50% - 6.15%, due 04/30/24 - 05/01/52) | | | | | | |
| | | | | | |
Issued 12/29/23, repurchase date 01/02/24 | | | | | | |
(Collateralized by U.S. Government Agency Securities valued at $4,120,000, 4.50% - 6.50%, due 03/01/53 - 01/01/54) | | | | | | |
| | | | | | |
Issued 12/26/23, repurchase date 01/02/24 | | | | | | |
(Collateralized by U.S. Government Agency Securities valued at $11,220,000, 2.00% - 7.00%, due 04/01/25 - 11/01/53) | | | | | | |
Issued 12/26/23, repurchase date 01/02/24 | | | | | | |
(Collateralized by U.S. Treasury valued at $2,040,003, 2.75%, due 04/30/27) | | | | | | |
Issued 12/27/23, repurchase date 01/03/24 | | | | | | |
(Collateralized by U.S. Government Agency Securities valued at $5,100,001, 2.50% - 4.55%, due 12/20/51 - 09/15/57) | | | | | | |
Issued 12/28/23, repurchase date 01/04/24 | | | | | | |
(Collateralized by U.S. Government Agency Securities valued at $2,040,000, 3.00% - 8.50%, due 04/20/25 - 06/20/48) | | | | | | |
Issued 12/29/23, repurchase date 01/05/24 | | | | | | |
(Collateralized by U.S. Government Agency Securities valued at $9,195,659, 2.50% - 6.53%, due 11/01/31 - 09/15/57) | | | | | | |
| | | | | | |
Issued 12/29/23, repurchase date 01/02/24 | | | | | | |
(Collateralized by U.S. Government Agency Securities valued at $20,600,001, 1.50% - 8.00%, due 01/15/25 - 11/20/63) | | | | | | |
MIZUHO SECURITIES USA LLC | | | | | | |
Issued 12/29/23, repurchase date 01/02/24 | | | | | | |
(Collateralized by U.S. Treasury Securities valued at $10,200,015, 3.63%, due 05/15/53) | | | | | | |
MUFG SECURITIES AMERICAS INC | | | | | | |
Issued 12/29/23, repurchase date 01/02/24 | | | | | | |
(Collateralized by U.S. Government Agency Securities valued at $10,500,000, 5.97% - 6.00%, due 02/16/41 - 01/20/53) | | | | | | |
11Schwab Government Money Market Portfolio | Annual Report
Schwab Government Money Market Portfolio
Portfolio Holdings as of December 31, 2023 (continued)
| | | | | | |
NOMURA SECURITIES INTERNATIONAL INC | | | | | | |
Issued 12/29/23, repurchase date 01/02/24 | | | | | | |
(Collateralized by U.S. Treasury Securities valued at $1,020,772, 1.25% - 2.38%, due 08/31/24 - 10/15/28) | | | | | | |
RBC DOMINION SECURITIES INC | | | | | | |
Issued 12/29/23, repurchase date 01/02/24 | | | | | | |
(Collateralized by U.S. Treasury and U.S. Government Agency Securities valued at $10,263,084, 0.63% - 7.00%, due 01/15/26 - 06/20/63) | | | | | | |
| | | | | | |
Issued 12/29/23, repurchase date 01/02/24 | | | | | | |
(Collateralized by U.S. Government Agency Securities valued at $1,040,000, 1.25%, due 10/20/50 - 11/20/50) | | | | | | |
| | | | | | |
U.S. TREASURY REPURCHASE AGREEMENTS 15.8% |
| | | | | | |
Issued 12/29/23, repurchase date 01/02/24 | | | | | | |
(Collateralized by U.S. Treasury Securities valued at $1,020,617, 0.00%, due 04/25/24) | | | | | | |
Issued 12/29/23, repurchase date 01/02/24 | | | | | | |
(Collateralized by U.S. Treasury Securities valued at $2,295,799, 0.00%, due 04/25/24) | | | | | | |
CITIGROUP GLOBAL MARKETS INC | | | | | | |
Issued 12/26/23, repurchase date 01/02/24 | | | | | | |
(Collateralized by U.S. Treasury Securities valued at $7,140,022, 3.50% - 4.00%, due 10/31/29 - 02/28/30) | | | | | | |
Issued 12/29/23, repurchase date 01/02/24 | | | | | | |
(Collateralized by U.S. Treasury Securities valued at $14,280,046, 3.50% - 4.00%, due 10/31/29 - 02/28/30) | | | | | | |
| | | | | | |
Issued 12/29/23, repurchase date 01/02/24 | | | | | | |
(Collateralized by U.S. Treasury Securities valued at $12,240,041, 3.88%, due 08/15/33) | | | | | | |
MUFG SECURITIES AMERICAS INC | | | | | | |
Issued 12/29/23, repurchase date 01/02/24 | | | | | | |
(Collateralized by U.S. Treasury Securities valued at $2,040,026, 0.63% - 4.38%, due 08/15/26 - 08/15/46) | | | | | | |
| | | | | | |
Total Repurchase Agreements
(Cost $165,249,393) | |
Total Investments in Securities
(Cost $242,095,312) | |
| Collateralized via U.S. Government Agency Securities or less frequently by higher rated U.S. Treasury Securities. |
| Variable rate security; rate shown is effective rate at period end. |
| VRDN is a municipal security which allows holders to sell their security through a put or tender feature, at par value plus accrued interest. The interest rate resets on a periodic basis, the majority of which are weekly but may be daily or monthly. Unless a reference rate and spread is shown parenthetically, the Remarketing Agent, generally a dealer, determines the interest rate for the security at each interest rate reset date. The rate is typically based on the SIFMA Municipal Swap Index. |
| The rate shown is the annualized 7-day yield. |
Schwab Government Money Market Portfolio | Annual Report12
Schwab Government Money Market Portfolio
Portfolio Holdings as of December 31, 2023 (continued)
| Effective Federal Funds Rate is published daily by the Federal Reserve Bank of New York and is based on the interest rate financial institutions charge each other for overnight funds. |
| Fixed Income Clearing Corp |
| |
| Securities Industry and Financial Markets Association. The SIFMA Municipal Swap Index is a market index comprised of high-grade 7-day tax-exempt Variable Rate Demand Obligations with certain characteristics. |
| Secured Overnight Financing Rate is published daily by the Federal Reserve Bank of New York and is based on the cost of borrowing cash overnight collateralized by U.S. Treasury securities. |
| The reference rate is the weekly auction stop for the U.S. Treasury Bill. |
| Variable rate demand note |
The following is a summary of the inputs used to value the fund’s investments as of December 31, 2023 (see financial note 2(a) for additional information):
| QUOTED PRICES IN
ACTIVE MARKETS FOR
IDENTICAL ASSETS
(LEVEL 1) | OTHER SIGNIFICANT
OBSERVABLE INPUTS
(LEVEL 2) | SIGNIFICANT
UNOBSERVABLE INPUTS
(LEVEL 3) | |
| | | | |
U.S. Government Agency Debt1 | | | | |
| | | | |
Variable Rate Demand Notes1 | | | | |
| | | | |
| | | | |
| | | | |
| As categorized in the Portfolio Holdings. |
13Schwab Government Money Market Portfolio | Annual Report
Schwab Government Money Market Portfolio
Statement of Assets and Liabilities
|
Investments in securities, at cost and value - unaffiliated (Note 2a) | | |
Repurchase agreements, at cost and value — unaffiliated (Note 2a) | | |
| | |
| | |
| | |
| | |
| | |
| | |
|
|
| | |
| | |
Investment adviser and administrator fees | | |
Independent trustees’ fees | | |
| | |
| | |
| | |
|
|
Capital received from investors | | |
Total distributable earnings | | |
| | |
Schwab Government Money Market Portfolio | Annual Report14
Schwab Government Money Market Portfolio
Statement of Operations
For the period January 1, 2023 through December 31, 2023 |
|
Interest received from securities - unaffiliated | | |
|
|
Investment adviser and administrator fees | | |
Portfolio accounting fees | | |
| | |
| | |
Independent trustees’ fees | | |
| | |
| | |
| | |
| | |
| | |
|
|
Net realized gains on sales of securities - unaffiliated | | |
Increase in net assets resulting from operations | | |
15Schwab Government Money Market Portfolio | Annual Report
Schwab Government Money Market Portfolio
Statement of Changes in Net Assets
For the current and prior report periods
|
| | |
| | | |
| | | |
Increase in net assets from operations | | | |
|
DISTRIBUTIONS TO SHAREHOLDERS |
| | | |
|
TRANSACTIONS IN FUND SHARES* |
| | | |
| | | |
| | | |
Net transactions in fund shares | | | |
|
|
| | | |
| | | |
| | | |
| Transactions took place at $1.00 per share; figures for share quantities are the same as for dollars. |
Schwab Government Money Market Portfolio | Annual Report16
Schwab Government Money Market Portfolio
1. Business Structure of the Fund:
Schwab Government Money Market Portfolio (the fund) is a series of Schwab Annuity Portfolios (the trust), a no-load, open-end management investment company. The trust is organized as a Massachusetts business trust and is registered under the Investment Company Act of 1940, as amended (the 1940 Act). The list below shows all the funds in the trust as of the end of the period, including the fund discussed in this report, which is highlighted:
SCHWAB ANNUITY PORTFOLIOS |
Schwab Government Money Market Portfolio | |
Schwab S&P 500 Index Portfolio | |
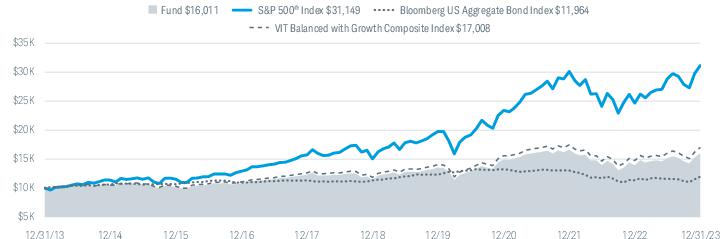
Schwab VIT Balanced Portfolio | |
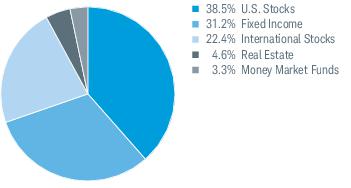
Schwab VIT Balanced with Growth Portfolio | |
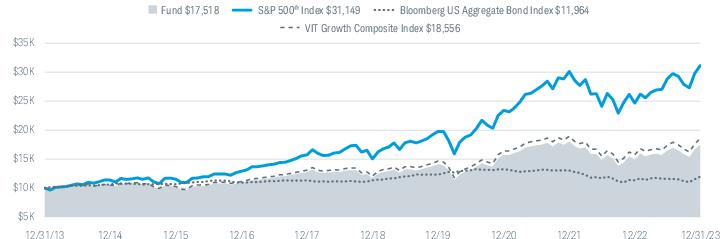
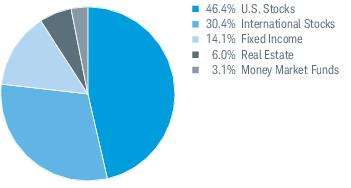
Schwab VIT Growth Portfolio | |
The fund offers one share class. Shares are bought and sold at closing net asset value per share (NAV), which is the price for all outstanding shares of a fund. Each share has a par value of 1/1,000 of a cent, and the fund’s Board of Trustees (the Board) may authorize the issuance of as many shares as necessary.
The fund is available exclusively as an investment vehicle for variable annuity and variable life insurance contracts offered by separate accounts of participating life insurance companies, and in the future may be offered to pension and retirement plans qualified under the Internal Revenue Code, as amended. At December 31, 2023, 100% of the fund’s shares were held through separate accounts of seven insurance companies. Subscriptions and redemptions of these insurance separate accounts could have a material impact on the fund.
The fund maintains its own account for purposes of holding assets and accounting, and is considered a separate entity for tax purposes. Within its account, the fund may also keep certain assets in segregated accounts, as required by securities law. The "Fund Complex" includes The Charles Schwab Family of Funds, Schwab Capital Trust, Schwab Investments, Schwab Annuity Portfolios, Schwab Strategic Trust and Laudus Trust.
2. Significant Accounting Policies:The following is a summary of the significant accounting policies the fund uses in its preparation of financial statements. The fund follows the investment company accounting and reporting guidance of the Financial Accounting Standards Board (FASB) Accounting Standard Codification Topic 946 Financial Services — Investment Companies. The accounting policies are in conformity with accounting principles generally accepted in the United States of America (GAAP).
Pursuant to Rule 2a-5 under the 1940 Act, the Board has designated authority to a Valuation Designee, the fund’s investment adviser, to make fair valuation determinations under adopted procedures, subject to Board oversight. The investment adviser has formed a Pricing Committee to administer the pricing and valuation of portfolio securities and other assets and liabilities as well as to ensure that prices used for internal purposes or provided by third parties reasonably reflect fair value. The Valuation Designee may utilize independent pricing services, quotations from securities and financial instrument dealers and other market sources to determine fair value.
Securities in the fund are valued at amortized cost (which approximates fair value) as permitted in accordance with Rule 2a-7 of the 1940 Act. In the event that security valuations do not approximate fair value, securities may be fair valued as determined by the Valuation Designee. The Valuation Designee considers a number of factors, including unobservable market inputs when arriving at fair value and may employ methods such as the review of related or comparable assets or liabilities, related market activities, recent transactions, market multiples, book values, transactional back-testing, disposition analysis and other relevant information. Due to the subjective and variable nature of fair value pricing, there can be no assurance that a fund could obtain the fair value assigned to the security upon the sale of such security. Mutual funds are valued at their respective NAVs.
In accordance with the authoritative guidance on fair value measurements and disclosures under GAAP, the fund discloses the fair value of its investments in a hierarchy that prioritizes the significant inputs to valuation methods used to measure the fair value. The hierarchy gives the highest priority to valuations based upon unadjusted quoted prices in active markets for identical assets or liabilities (Level 1 measurements) and the lowest priority to valuations based upon unobservable inputs that are significant to the valuation (Level 3 measurements). If inputs used to measure the financial instruments fall within different levels of the hierarchy, the
17Schwab Government Money Market Portfolio | Annual Report
Schwab Government Money Market Portfolio
Financial Notes (continued)
2. Significant Accounting Policies (continued):
categorization is based on the lowest level input that is significant to the valuation. If it is determined that either the volume and/or level of activity for an asset or liability has significantly decreased (from normal conditions for that asset or liability) or price quotations or observable inputs are not associated with orderly transactions, increased analysis and the Valuation Designee’s judgment will be required to estimate fair value.
The three levels of the fair value hierarchy are as follows:
• Level 1 — quoted prices in active markets for identical investments — Investments whose values are based on quoted market prices in active markets. These generally include active listed equities, mutual funds, exchange-traded funds (ETFs) and futures contracts. Mutual funds and ETFs are classified as Level 1 prices, without consideration to the classification level of the underlying securities held which could be Level 1, Level 2, or Level 3 in the fair value hierarchy.
• Level 2 — other significant observable inputs (including quoted prices for similar securities, interest rates, prepayment speeds, credit risk, etc.) — Investments that trade in markets that are not considered to be active, but whose values are based on quoted market prices, dealer quotations or valuations provided by alternative pricing sources supported by observable inputs are classified as Level 2 prices. These generally include U.S. government and sovereign obligations, most government agency securities, investment-grade corporate bonds, certain mortgage products, less liquid listed equities, and state, municipal and provincial obligations. Securities held by stable NAV money funds operating pursuant to Rule 2a-7 under the 1940 Act are valued at amortized cost which approximates current fair value and are considered to be valued using Level 2 inputs.
• Level 3 — significant unobservable inputs (including the Valuation Designee’s assumptions in determining the fair value of investments) — Investments whose values are classified as Level 3 prices have significant unobservable inputs, as they may trade infrequently or not at all. When observable prices are not readily available for these securities, one or more valuation methods are used for which sufficient and reliable data is available. The inputs used in estimating the value of Level 3 prices may include the original transaction price, quoted prices for similar securities or assets in active markets, completed or pending third-party transactions in the underlying investment or comparable issuers, and changes in financial ratios or cash flows. Level 3 prices may also be adjusted to reflect illiquidity and/or non-transferability, with the amount of such discount estimated in the absence of market information. Assumptions used due to the lack of observable inputs may significantly impact the resulting fair value and therefore a fund’s results of operations.
The inputs or methodology used for valuing securities are not necessarily an indication of the risk associated with investing in those securities.
The levels associated with valuing the fund’s investments as of December 31, 2023, are disclosed in the fund’s Portfolio Holdings.
(b) Accounting Policies for certain Portfolio Investments (if held):
Repurchase Agreements: In a repurchase agreement, a fund buys a security from another party (the counterparty), usually a financial institution, with the agreement that it be sold back in the future. Repurchase agreements subject a fund to counterparty risk, meaning that the fund could lose money if the other party fails to perform under the terms of the agreement. The fund mitigates this risk by ensuring that a fund’s repurchase agreements are collateralized by cash and/or U.S. government securities. All collateral is held by the fund’s custodian (or, with multi-party agreements, the agent’s bank) and is monitored daily to ensure that its fair value is at least equal to the maturity amount under the agreement. In the event of a default by the counterparty, realization of the collateral proceeds could be delayed or limited and the value of the collateral may decline. Investments in repurchase agreements are also based on a review of the credit quality of the repurchase agreement counterparty.
As of December 31, 2023, the fund had investments in repurchase agreements with a gross value of $165,249,393 as disclosed in the Portfolio Holdings and the Statement of Assets and Liabilities. The value of the related collateral disclosed in the Portfolio Holdings exceeded the value of the repurchase agreements at period end.
Delayed-Delivery and When-Issued Transactions: The fund may transact in securities on a delayed-delivery or when-issued basis. Payment and delivery may take place after the customary settlement period for that security. The price of the underlying securities and the date when the securities will be delivered and paid for are fixed at the time the transaction is negotiated. The securities purchased on a delayed-delivery or when-issued basis are identified as such in the fund’s Portfolio Holdings, if any. The fund may receive compensation for interest forgone in the purchase of a delayed-delivery or when-issued security. Losses may arise due to changes in the value of the underlying securities or if the counterparty does not perform under the contract’s terms, or if the issuer does not issue the securities due to political, economic, or other factors. The fund complies with Rule 18f-4 under the 1940 Act, where money market funds are only permitted to invest in a security on a delayed-delivery or when-issued basis, or with a
Schwab Government Money Market Portfolio | Annual Report18
Schwab Government Money Market Portfolio
Financial Notes (continued)
2. Significant Accounting Policies (continued):
non-standard settlement cycle, and the transaction will be deemed not to involve a senior security, provided that, (i) the fund intends to physically settle the transaction and (ii) the transaction will settle within 35 days of its trade date. Pursuant to Rule 18f-4 portfolio securities are no longer required to be segregated as collateral to cover delayed-delivery or when-issued securities held within the fund.
(c) Security Transactions:
Security transactions are recorded as of the date the order to buy or sell the security is executed. Realized gains and losses from security transactions are based on the identified costs of the securities involved.
Interest income is recorded as it accrues. If the fund buys a debt security at a discount (less than face value) or a premium (more than face value), it amortizes premiums and accretes discounts from the purchase settlement date up to maturity. The fund then increases (in the case of discounts) or reduces (in the case of premiums) the income it records from the security. Certain securities may be callable (meaning that the issuer has the option to pay it off before its maturity date). The fund amortizes the premium and accretes the discount on each callable security to the security’s maturity date, except when the purchase price is higher than the call price at the security’s call date (in which case the premium is amortized to the call date). Dividends and distributions are recorded on the date they are effective.
Expenses that are specific to the fund are charged directly to the fund. Expenses that are common to more than one fund in the trusts generally are allocated among those funds in proportion to their average daily net assets.
(f) Distributions to Shareholders:
The fund declares distributions from net investment income, if any, every day it is open for business. These distributions, which are substantially equal to the fund’s net investment income for that day, are paid out to shareholders once a month. The fund makes distributions from net realized capital gains, if any, once a year. To receive a distribution, you must be a registered shareholder on the record date. Distributions are paid to shareholders on the payable date.
(g) Accounting Estimates:
The accounting policies described in this report conform to GAAP. Notwithstanding this, shareholders should understand that in order to follow these principles, fund management has to make estimates and assumptions that affect the information reported in the financial statements. It’s possible that once the results are known, they may turn out to be different from these estimates and these differences may be material.
(h) Federal Income Taxes:
The fund intends to meet federal income and excise tax requirements for regulated investment companies under subchapter M of the Internal Revenue Code, as amended. Accordingly, the fund distributes substantially all of its net investment income and net realized capital gains, if any, to the participating insurance company’s (shareholders) separate accounts each year. As long as the fund meets the tax requirements, it is not required to pay federal income tax.
Under the fund’s organizational documents, the officers and trustees are indemnified against certain liabilities arising out of the performance of their duties to the fund. In addition, in the normal course of business the fund enters into contracts with its vendors and others that provide general indemnifications. The fund’s maximum exposure under these arrangements is unknown as this would involve future claims that may be made against the fund. However, based on experience, the fund expects the risk of loss attributable to these arrangements to be remote.
Effective January 24, 2023, the U.S. Securities and Exchange Commission (SEC) adopted rule and form amendments to require mutual funds and ETFs to transmit concise and visually engaging streamlined annual and semiannual reports to shareholders that highlight key information deemed important for retail investors to assess and monitor their fund investments. Other information, including financial statements, will no longer appear in a streamlined shareholder report but must be available online, delivered free
19Schwab Government Money Market Portfolio | Annual Report
Schwab Government Money Market Portfolio
Financial Notes (continued)
2. Significant Accounting Policies (continued):
of charge upon request, and filed on a semiannual basis on Form N-CSR. The rule and form amendments have a compliance date of July 24, 2024. At this time, management is evaluating the impact of these rule and form amendment changes on the content of the current shareholder report and the newly created annual and semiannual streamlined shareholder reports.
On July 12, 2023, the SEC adopted amendments to the rules that govern money market funds under the 1940 Act (the “new rules”). The new rules are in response to stresses in fixed income markets at the onset of the COVID-19 pandemic in March 2020. Along with amendments related to liquidity thresholds, redemption fees and the removal of redemption gates, there are amendments that add reporting requirements for money market funds on Form N-CR and Form N-MFP. There are various compliance dates for the new rules with the compliance date for the new reporting requirements on Form N-CR and Form N-MFP set for June 11, 2024. Schwab Money Funds have met the first set of compliance deadlines and are well prepared to meet those that are upcoming.
Market Risk. Financial markets rise and fall in response to a variety of factors, sometimes rapidly and unpredictably. Markets may be impacted by economic, political, regulatory and other conditions, including economic sanctions and other government actions. In addition, the occurrence of global events, such as war, terrorism, environmental disasters, natural disasters and epidemics may also negatively affect the financial markets. These events could reduce consumer demand or economic output; result in market closures, changes in interest rates, inflation/deflation, travel restrictions or quarantines; and significantly adversely impact the economy. Governmental and quasi-governmental authorities and regulators throughout the world have in the past often responded to serious economic disruptions with a variety of significant fiscal and monetary policy changes which could have an unexpected impact on financial markets and the fund’s investments. As with any investment whose performance is tied to these markets, the value of an investment in the fund will fluctuate, which means that an investor could lose money over short or long periods.
Investment Risk. You could lose money by investing in the fund. Although the fund seeks to preserve the value of your investment at $1.00 per share, it cannot guarantee it will do so. An investment in the fund is not insured or guaranteed by the Federal Deposit Insurance Corporation or any other government agency. The fund’s sponsor has no legal obligation to provide financial support to the fund, and you should not expect that the sponsor will provide financial support to the fund at any time.
Interest Rate Risk. Interest rates rise and fall over time. As with any investment whose yield reflects current interest rates, the fund’s yield will change over time. During periods when interest rates are low or there are negative interest rates, the fund’s yield (and total return) also could be low or even negative. In addition, the fund may be unable to pay expenses out of fund assets or maintain a stable $1.00 share price. Also, a change in a central bank’s monetary policy or economic conditions may result in a change in interest rates, which could have sudden and unpredictable effects on the markets. A sudden or unpredictable rise or decline in interest rates may cause volatility. Volatility in the market may decrease liquidity in the money market securities markets, making it more difficult for the fund to sell its money market investments at a time when the investment adviser might wish to sell such investments. Decreased market liquidity also may make it more difficult to value some or all of the fund’s money market securities holdings.
Stable Net Asset Value Risk. If the fund or another money market fund fails to maintain a stable net asset value (or such perception exists in the market place), the fund could experience increased redemptions, which may adversely impact the fund’s share price. The fund is permitted, among other things, to reduce or withhold any income and/or gains generated by the fund to maintain a stable $1.00 share price.
Repurchase Agreements Risk. When the fund enters into a repurchase agreement, the fund is exposed to the risk that the other party (i.e. the counterparty) will not fulfill its contractual obligation. In a repurchase agreement, there exists the risk that, when the fund buys a security from a counterparty that agrees to repurchase the security at an agreed upon price (usually higher) and time, the counterparty will not repurchase the security.
Credit Risk. A decline in the credit quality of an issuer, guarantor or liquidity provider of a portfolio investment or a counterparty could cause the fund to lose money or underperform. The fund could lose money if, due to a decline in credit quality, the issuer, guarantor or liquidity provider of a portfolio investment or a counterparty fails to make, or is perceived as being unable or unwilling to make, timely principal or interest payments or otherwise honor its obligations. Even though the fund’s investments in repurchase agreements are collateralized at all times, there is some risk to the fund if the other party should default on its obligations and the fund is delayed or prevented from recovering or disposing of the collateral. The credit quality of the fund’s portfolio holdings can change rapidly in certain market environments and any downgrade or default on the part of a single portfolio investment could cause the fund’s share price or yield to fall.
Schwab Government Money Market Portfolio | Annual Report20
Schwab Government Money Market Portfolio
Financial Notes (continued)
3. Risk Factors (continued):
Certain U.S. government securities that the fund invests in are not backed by the full faith and credit of the U.S. government, which means they are neither issued nor guaranteed by the U.S. Treasury. Although maintained in conservatorship by the Federal Housing Finance Agency (FHFA) since September 2008, the Federal National Mortgage Association (Fannie Mae) and Federal Home Loan Mortgage Corporation (Freddie Mac) maintain only lines of credit with the U.S. Treasury. The Federal Home Loan Banks maintain limited access to credit lines from the U.S. Treasury. Other securities, such as obligations issued by the Federal Farm Credit Banks Funding Corporation, are supported solely by the credit of the issuer. There can be no assurance that the U.S. government will provide financial support to securities of its agencies and instrumentalities if it is not obligated to do so under law. Also, any government guarantees on securities the fund owns do not extend to the shares of the fund itself.
Management Risk. Any actively managed mutual fund is subject to the risk that its investment adviser will select investments or allocate assets in a manner that could cause the fund to underperform or otherwise not meet its investment objective. The fund’s investment adviser applies its own investment techniques and risk analyses in making investment decisions for the fund, but there can be no guarantee that they will produce the desired results. The investment adviser’s maturity decisions will also affect the fund’s yield, and potentially could affect its share price. To the extent that the investment adviser anticipates interest rate trends imprecisely, the fund’s yield at times could lag the yields of other money market funds.
Redemption Risk. The fund may experience periods of heavy redemptions that could cause the fund to liquidate its assets at inopportune times or at a loss or depressed value, particularly during periods of declining or illiquid markets. Redemptions by a few large investors in the fund may have a significant adverse effect on the fund’s ability to maintain a stable $1.00 share price. In the event any money market fund fails to maintain a stable net asset value, other money market funds, including the fund, could face a market-wide risk of increased redemption pressures, potentially jeopardizing the stability of their $1.00 share prices.
Money Market Fund Regulation Risk. The SEC and other regulatory agencies continue to review the regulation of money market funds. As of the date of this shareholder report, the SEC has proposed amendments to the rules that govern money market funds. These proposed amendments, if implemented, may affect the fund’s investment strategies, performance, yield, expenses, operations and continued viability.
Money Market Fund Risk. The fund is not designed to offer capital appreciation. In exchange for their emphasis on stability and liquidity, money market investments may offer lower long-term performance than stock or bond investments.
Tax Diversification Risk. As described above, the fund intends to operate as a government money market fund under the regulations governing money market funds. Additionally, the fund intends to meet the diversification requirements that are applicable to insurance company separate accounts under Subchapter L of the Internal Revenue Code of 1986, as amended (the Diversification Requirements). To satisfy the Diversification Requirements applicable to variable annuity contracts, the value of the assets of the fund invested in securities issued by the U.S. government, its agencies or instrumentalities must remain below specified thresholds. For these purposes, each U.S. government agency or instrumentality is treated as a separate issuer.
Operating as a government money market fund may make it difficult for the fund to meet the Diversification Requirements. This difficulty may be exacerbated by the potential increase in demand for the types of securities in which the fund invests as a result of changes to the rules that govern SEC registered money market funds. A failure to satisfy the Diversification Requirements could have significant adverse tax consequences for variable life insurance and variable annuity contract owners whose contract values are determined by investment in the fund.
Please refer to the fund’s prospectus for a more complete description of the principal risks of investing in the fund.
4. Affiliates and Affiliated Transactions:Charles Schwab Investment Management, Inc., dba Schwab Asset Management, a wholly owned subsidiary of The Charles Schwab Corporation, serves as the fund’s investment adviser and administrator pursuant to an Investment Advisory and Administration Agreement between the investment adviser and the trust.
For its advisory and administrative services to the fund, the investment adviser is entitled to receive an annual fee, payable monthly, equal to 0.19% of the fund’s average daily net assets.
21Schwab Government Money Market Portfolio | Annual Report
Schwab Government Money Market Portfolio
Financial Notes (continued)
4. Affiliates and Affiliated Transactions (continued):
Contractual Expense Limitation
The investment adviser and its affiliates have made an additional agreement with the fund, for so long as the investment adviser serves as the investment adviser to the fund, in which the agreement may only be amended or terminated with the approval of the Board, to limit the total annual fund operating expenses charged, excluding interest, taxes, and certain non-routine expenses (expense limitation) to 0.34%.
The fund may engage in direct transactions with certain other funds in the Fund Complex in accordance with procedures adopted by the Board pursuant to Rule 17a-7 under the 1940 Act. When one fund is seeking to sell a security that another is seeking to buy, an interfund transaction can allow both funds to benefit by reducing transaction costs. This practice is limited to funds that share the same investment adviser, trustees and/or officers. For the period ended December 31, 2023, the fund had no direct security transactions with other funds in the Fund Complex.
Interfund Borrowing and Lending
Pursuant to an exemptive order issued by the SEC, the fund may enter into interfund borrowing and lending transactions with other funds in the Fund Complex. All loans are for temporary or emergency purposes and the interest rate to be charged will be the average of the overnight repurchase agreement rate and the short-term bank loan rate. All loans are subject to numerous conditions designed to ensure fair and equitable treatment of all participating funds. The interfund lending facility is subject to the oversight and periodic review by the Board. The fund had no interfund borrowing or lending activity during the period.
The Board may include people who are officers and/or directors of the investment adviser or its affiliates. Federal securities law limits the percentage of such “interested persons” who may serve on a trust’s board, and the trust was in compliance with these limitations throughout the report period. The fund did not pay any of these interested persons for their services as trustees, but did pay non-interested persons (independent trustees), as noted in the fund’s Statement of Operations. For information regarding the trustees, please refer to the Trustees and Officers table at the end of this report.
During the period, the fund was a participant with other funds in the Fund Complex in a joint, syndicated, committed $1 billion line of credit (the Syndicated Credit Facility), which matured on September 28, 2023. On September 28, 2023, the Syndicated Credit Facility was amended to run for a new 364 day period with the line of credit amount remaining unchanged, maturing on September 26, 2024. Under the terms of the Syndicated Credit Facility, in addition to the interest charged on any borrowings by the fund, the fund paid a commitment fee of 0.15% per annum on the fund’s proportionate share of the unused portion of the Syndicated Credit Facility.
During the period, the fund was a participant with other funds in the Fund Complex in a joint, unsecured, uncommitted $400 million line of credit (the Uncommitted Credit Facility), with State Street Bank and Trust Company, which matured on September 28, 2023. On September 28, 2023, the Uncommitted Credit Facility was amended to run for a new 364 day period with the line of credit amount remaining unchanged, maturing on September 26, 2024. Under the terms of the Uncommitted Credit Facility, the fund pays interest on the amount the fund borrows. There were no borrowings by the fund from either line of credit during the period.
The fund also has access to custodian overdraft facilities. The fund may have utilized the overdraft facility and incurred an interest expense, which is disclosed in the fund’s Statement of Operations, if any. The interest expense is determined based on a negotiated rate above the current Federal Funds Rate.
As of December 31, 2023, the tax basis cost of the fund’s investments was $242,049,712 and gross unrealized appreciation and depreciation were $45,600 and ($0), respectively, with a net unrealized appreciation of $45,600.
Schwab Government Money Market Portfolio | Annual Report22
Schwab Government Money Market Portfolio
Financial Notes (continued)
7. Federal Income Taxes (continued):
As of December 31, 2023, the components of distributable earnings on a tax basis were as follows:
UNDISTRIBUTED
ORDINARY
INCOME | NET UNREALIZED
APPRECIATION
(DEPRECIATION)
ON INVESTMENTS | |
| | |
The tax basis components of distributions paid during the current and prior fiscal years were as follows:
| CURRENT FISCAL YEAR END DISTRIBUTIONS | PRIOR FISCAL YEAR END DISTRIBUTIONS |
| | | | |
| | | | |
Distributions paid to shareholders are based on net investment income and net realized gains determined on a tax basis, which may differ from net investment income and net realized gains for financial reporting purposes. These differences reflect the differing character of certain income items and net realized gains and losses for financial statement and tax purposes, and may result in reclassification among certain capital accounts in the financial statements. The fund may also designate a portion of the amount paid to redeeming shareholders as a distribution for tax purposes.
Permanent book and tax basis differences may result in reclassifications between components of net assets as required. The adjustments will have no impact on net assets or the results of operations.
As of December 31, 2023, management has reviewed the tax positions for open periods (for federal purposes, three years from the date of filing and for state purposes, four years from the date of filing) as applicable to the fund, and has determined that no provision for income tax is required in the fund’s financial statements. The fund recognizes interest and penalties, if any, related to unrecognized tax benefits as income tax expense in the fund’s Statement of Operations. During the fiscal year ended December 31, 2023, the fund did not incur any interest or penalties.
Management has determined there are no subsequent events or transactions through the date the financial statements were issued that would have materially impacted the financial statements as presented.
23Schwab Government Money Market Portfolio | Annual Report
Schwab Government Money Market Portfolio
Report of Independent Registered Public Accounting Firm
To the Board of Trustees of Schwab Annuity Portfolios and Shareholders of Schwab Government Money Market Portfolio:
Opinion on the Financial Statements and Financial Highlights
We have audited the accompanying statement of assets and liabilities, including the portfolio holdings, of Schwab Government Money Market Portfolio, (the “Fund”) one of the funds constituting Schwab Annuity Portfolios, as of December 31, 2023, the related statement of operations for the year then ended, the statements of changes in net assets for each of the two years in the period then ended, the financial highlights for each of the four years in the period then ended, and the related notes. In our opinion, the financial statements and financial highlights present fairly, in all material respects, the financial position of the Fund as of December 31, 2023, and the results of its operations for the year then ended, the changes in its net assets for each of the two years in the period then ended, and the financial highlights for each of the four years in the period then ended in conformity with accounting principles generally accepted in the United States of America. The financial highlights for the year in the period ended December 31, 2019 were audited by other auditors, whose report, dated February 18, 2020, expressed an unqualified opinion on such financial highlights.
These financial statements and financial highlights are the responsibility of the Fund’s management. Our responsibility is to express an opinion on the Fund’s financial statements and financial highlights based on our audits. We are a public accounting firm registered with the Public Company Accounting Oversight Board (United States) (PCAOB) and are required to be independent with respect to the Fund in accordance with the U.S. federal securities laws and the applicable rules and regulations of the Securities and Exchange Commission and the PCAOB.
We conducted our audits in accordance with the standards of the PCAOB. Those standards require that we plan and perform the audit to obtain reasonable assurance about whether the financial statements and financial highlights are free of material misstatement, whether due to error or fraud. The Fund is not required to have, nor were we engaged to perform, an audit of its internal control over financial reporting. As part of our audits, we are required to obtain an understanding of internal control over financial reporting but not for the purpose of expressing an opinion on the effectiveness of the Fund’s internal control over financial reporting. Accordingly, we express no such opinion.
Our audits included performing procedures to assess the risks of material misstatement of the financial statements and financial highlights, whether due to error or fraud, and performing procedures that respond to those risks. Such procedures included examining, on a test basis, evidence regarding the amounts and disclosures in the financial statements and financial highlights. Our audits also included evaluating the accounting principles used and significant estimates made by management, as well as evaluating the overall presentation of the financial statements and financial highlights. Our procedures included confirmation of securities owned as of December 31, 2023, by correspondence with the custodian and brokers; when replies were not received from brokers, we performed other auditing procedures. We believe that our audits provide a reasonable basis for our opinion.
Deloitte & Touche LLP
Denver, Colorado
February 16, 2024
We have served as the auditor of one or more investment companies in the Schwab Funds Complex since 2020.
Schwab Government Money Market Portfolio | Annual Report24
Schwab Government Money Market Portfolio
Other Federal Tax Information (unaudited)
For the fiscal year ended December 31, 2023, the fund designates 100% of dividend income as business interest income under section 163(j) of the Internal Revenue Code.
25Schwab Government Money Market Portfolio | Annual Report
Schwab Government Money Market Portfolio
Trustees and Officers
The tables below give information about the trustees and officers of Schwab Annuity Portfolios, which includes the fund covered in this report. The “Fund Complex” includes The Charles Schwab Family of Funds, Schwab Capital Trust, Schwab Investments, Schwab Annuity Portfolios, Schwab Strategic Trust and Laudus Trust. The Fund Complex includes 106 funds.
The address for all trustees and officers is 211 Main Street, San Francisco, CA 94105. You can find more information about the trustees and officers in the fund’s Statement of Additional Information, which is available free by calling 1-877-824-5615.
|
Name, Year of Birth, and Position(s) with the trust (Terms of office, and length of Time Served1) | Principal Occupations During the Past Five Years | Number of Portfolios in Fund Complex Overseen by the Trustee | |
Michael J. Beer 1961 Trustee (Trustee of The Charles Schwab Family of Funds, Schwab Investments, Schwab Capital Trust, Schwab Annuity Portfolios, Schwab Strategic Trust and Laudus Trust since 2022) | Retired. Director, President and Chief Executive Officer (Dec. 2016 – Sept. 2019), Principal Funds (investment management). | | Director (2016 – 2019), Principal Funds, Inc. |
Robert W. Burns 1959 Trustee (Trustee of Schwab Strategic Trust since 2009; The Charles Schwab Family of Funds, Schwab Investments, Schwab Capital Trust, Schwab Annuity Portfolios and Laudus Trust since 2016) | Retired/Private Investor. | | |
Nancy F. Heller 1956 Trustee (Trustee of The Charles Schwab Family of Funds, Schwab Investments, Schwab Capital Trust, Schwab Annuity Portfolios, Schwab Strategic Trust and Laudus Trust since 2018) | | | |
David L. Mahoney 1954 Trustee (Trustee of The Charles Schwab Family of Funds, Schwab Investments, Schwab Capital Trust, Schwab Annuity Portfolios and Laudus Trust since 2011; Schwab Strategic Trust since 2016) | | | Director (2004 – present), Corcept Therapeutics Incorporated Director (2009 – 2021), Adamas Pharmaceuticals, Inc. Director (2003 – 2019), Symantec Corporation |
Jane P. Moncreiff 1961 Trustee (Trustee of The Charles Schwab Family of Funds, Schwab Investments, Schwab Capital Trust, Schwab Annuity Portfolios, Schwab Strategic Trust and Laudus Trust since 2019) | Consultant (2018 – present), Fulham Advisers LLC (management consulting); Chief Investment Officer (2009 – 2017), CareGroup Healthcare System, Inc. (healthcare). | | |
Schwab Government Money Market Portfolio | Annual Report26
Schwab Government Money Market Portfolio
Independent Trustees (continued) |
Name, Year of Birth, and Position(s) with the trust (Terms of office, and length of Time Served1) | Principal Occupations During the Past Five Years | Number of Portfolios in Fund Complex Overseen by the Trustee | |
Kimberly S. Patmore 1956 Trustee (Trustee of The Charles Schwab Family of Funds, Schwab Investments, Schwab Capital Trust, Schwab Annuity Portfolios, Schwab Strategic Trust and Laudus Trust since 2016) | Consultant (2008 – present), Patmore Management Consulting (management consulting). | | |
J. Derek Penn 1957 Trustee (Trustee of The Charles Schwab Family of Funds, Schwab Investments, Schwab Capital Trust, Schwab Annuity Portfolios, Schwab Strategic Trust and Laudus Trust since 2021) | Head of Equity Sales and Trading (2006 – 2018), BNY Mellon (financial services). | | |
|
Name, Year of Birth, and Position(s) with the trust (Terms of office, and length of Time Served1) | Principal Occupations During the Past Five Years | Number of Portfolios in Fund Complex Overseen by the Trustee | |
Walter W. Bettinger II2 1960 Chairman and Trustee (Trustee of The Charles Schwab Family of Funds, Schwab Investments, Schwab Capital Trust and Schwab Annuity Portfolios since 2008; Schwab Strategic Trust since 2009; Laudus Trust since 2010) | Co-Chairman of the Board (July 2022 – present), Director and Chief Executive Officer (Oct. 2008 – present) and President (Feb. 2007 – Oct. 2021), The Charles Schwab Corporation; President and Chief Executive Officer (Oct. 2008 – Oct. 2021) and Director (May 2008 – Oct. 2021), Charles Schwab & Co., Inc.; Co-Chairman of the Board (July 2022 – present) and Director (Apr. 2006 – present), Charles Schwab Bank, SSB; Co-Chairman of the Board (July 2022 – present) and Director (Nov. 2017 – present), Charles Schwab Premier Bank, SSB; Co-Chairman of the Board (July 2022 – present) and Director (July 2019 – present), Charles Schwab Trust Bank; Director (May 2008 – present), Chief Executive Officer (Aug. 2017 – present) and President (Aug. 2017 – Nov. 2021), Schwab Holdings, Inc.; Manager (Sept. 2023 – present), TD Ameritrade Holding LLC; Director (Oct. 2020 – Aug. 2023), TD Ameritrade Holding Corporation; Director (July 2016 – Oct. 2021), Charles Schwab Investment Management, Inc. | | Director (2008 – present), The Charles Schwab Corporation |
Richard A. Wurster2 1973 Trustee (Trustee of The Charles Schwab Family of Funds, Schwab Investments, Schwab Capital Trust, Schwab Annuity Portfolios, Schwab Strategic Trust and Laudus Trust since 2022) | President (Oct. 2021 – present) and Executive Vice President – Schwab Asset Management Solutions (Apr. 2019 – Oct. 2021), The Charles Schwab Corporation; President, Director (Oct. 2021 – present), Executive Vice President – Schwab Asset Management Solutions (July 2019 – Oct. 2021) and Senior Vice President – Advisory (May 2016 – July 2019), Charles Schwab & Co., Inc.; President (Nov. 2021 – present), Schwab Holdings, Inc.; Director (Oct. 2021 – present) and Chief Executive Officer (Nov. 2019 – Jan. 2022), Charles Schwab Investment Management, Inc.; Director, Chief Executive Officer and President (Mar. 2018 – Oct. 2022), Charles Schwab Investment Advisory, Inc.; Chief Executive Officer (July 2016 – Apr. 2018) and President (Mar. 2017 – Apr. 2018), ThomasPartners, Inc.; Chief Executive Officer (July 2016 – Apr. 2018), Windhaven Investment Management, Inc. | | |
27Schwab Government Money Market Portfolio | Annual Report
Schwab Government Money Market Portfolio
|
Name, Year of Birth, and Position(s) with the trust (Terms of office, and length of Time Served3) | Principal Occupations During the Past Five Years |
Omar Aguilar 1970 Chief Executive Officer, President and Chief Investment Officer (Officer of The Charles Schwab Family of Funds, Schwab Investments, Schwab Capital Trust, Schwab Annuity Portfolios, Schwab Strategic Trust and Laudus Trust since 2011) | Chief Executive Officer (Jan. 2022 – present), President (Oct. 2023 – present), (Chief Investment Officer (Apr. 2011 – present) and Senior Vice President (Apr. 2011 – Jan. 2022), Charles Schwab Investment Management, Inc.; Director, Chief Executive Officer and President (Oct. 2022 – present), Charles Schwab Investment Advisory, Inc.; Chief Executive Officer (Sept. 2023 – present), President (Oct. 2023 – present), Chief Investment Officer (June 2011 – present) and Vice President (June 2011 – Sept. 2023), Schwab Funds, Laudus Trust and Schwab ETFs. |
Mark Fischer 1970 Chief Operating Officer (Officer of The Charles Schwab Family of Funds, Schwab Investments, Schwab Capital Trust, Schwab Annuity Portfolios, Schwab Strategic Trust and Laudus Trust since 2013) | Chief Operating Officer (Dec. 2020 – present) and Treasurer and Chief Financial Officer (Jan. 2016 – Dec. 2022), Schwab Funds, Laudus Trust and Schwab ETFs; Chief Financial Officer (Mar. 2020 – present), Chief Operating Officer (Oct. 2023 – present), Managing Director (Mar. 2023 – present) and Vice President (Oct. 2013 – Mar. 2023), Charles Schwab Investment Management, Inc. |
Dana Smith 1965 Treasurer and Chief Financial Officer (Officer of The Charles Schwab Family of Funds, Schwab Investments, Schwab Capital Trust, Schwab Annuity Portfolios, Schwab Strategic Trust and Laudus Trust since 2023) | Treasurer and Chief Financial Officer (Jan. 2023 – present) and Assistant Treasurer (Dec. 2015 – Dec. 2022), Schwab Funds, Laudus Trust and Schwab ETFs; Managing Director (Mar. 2023 – present), Vice President (Mar. 2022 – Mar. 2023) and Director (Oct. 2015 – Mar. 2022), Charles Schwab Investment Management, Inc.; Managing Director (May 2022 – present) and Vice President (Apr. 2022 – May 2022), Charles Schwab & Co., Inc. |
Patrick Cassidy 1964 Vice President and Chief Investment Officer (Officer of The Charles Schwab Family of Funds, Schwab Investments, Schwab Capital Trust, Schwab Annuity Portfolios, Schwab Strategic Trust and Laudus Trust since 2018) | Chief Investment Officer (Oct. 2023 – present) and Vice President (Feb. 2018 – present), Schwab Funds, Laudus Trust and Schwab ETFs; Managing Director (Mar. 2023 – present), Chief Investment Officer (Oct. 2023 – present), and Senior Vice President (Oct. 2012 – Mar. 2023), Charles Schwab Investment Management, Inc. |
William P. McMahon, Jr. 1972 Vice President and Chief Investment Officer (Officer of The Charles Schwab Family of Funds, Schwab Investments, Schwab Capital Trust, Schwab Annuity Portfolios, Schwab Strategic Trust and Laudus Trust since 2021) | Managing Director (Mar. 2023 – present), Senior Vice President (Jan. 2020 – Mar. 2023) and Chief Investment Officer (Jan. 2020 – present) Charles Schwab Investment Management, Inc.; Vice President and Chief Investment Officer (June 2021 – present), Schwab Funds, Laudus Trust and Schwab ETFs; Senior Vice President and Chief Investment Officer – ThomasPartners Strategies (Apr. 2018 – Dec. 2019), Charles Schwab Investment Advisory, Inc.; Senior Vice President and Chief Investment Officer (May 2001 – Apr. 2018), ThomasPartners, Inc. |
Catherine MacGregor 1964 Chief Legal Officer and Secretary, Schwab Funds and Schwab ETFs Chief Legal Officer, Vice President and Clerk, Laudus Trust (Officer of The Charles Schwab Family of Funds, Schwab Investments, Schwab Capital Trust, Schwab Annuity Portfolios and Laudus Trust since 2005; Schwab Strategic Trust since 2009) | Chief Legal Officer (Mar. 2022 – present), Managing Director (Mar. 2023 – present) and Vice President (Sept. 2005 – Mar. 2023), Charles Schwab Investment Management, Inc.; Managing Director (May 2022 – present) and Vice President (Aug. 2005 – May 2022), Charles Schwab & Co., Inc.; Vice President (Dec. 2005 – present) and Chief Legal Officer and Clerk (Mar. 2007 – present), Laudus Trust; Chief Legal Officer and Secretary (Oct. 2021 – present), Vice President (Nov. 2005 – Oct. 2021) and Assistant Secretary (June 2007 – Oct. 2021), Schwab Funds; Chief Legal Officer and Secretary (Oct. 2021 – present), Vice President and Assistant Secretary (Oct. 2009 – Oct. 2021), Schwab ETFs. |
1
Each Trustee shall hold office until the election and qualification of his or her successor, or until he or she dies, resigns or is removed. The retirement policy requires that each independent trustee retire by December 31 of the year in which the Trustee turns 74 or the Trustee’s twentieth year of service as an independent trustee on any trust in the Fund Complex, whichever occurs first.
2
Mr. Bettinger and Mr. Wurster are Interested Trustees. Mr. Bettinger and Mr. Wurster are Interested Trustees because each owns stock of The Charles Schwab Corporation (CSC), the parent company of Charles Schwab Investment Management, Inc., the investment adviser for the trusts in the Fund Complex, and is an employee of Charles Schwab & Co., Inc. (Schwab), the principal underwriter for The Charles Schwab Family of Funds, Schwab Investments, Schwab Capital Trust, Schwab Annuity Portfolios and Laudus Trust.
3
The President, Treasurer and Secretary/Clerk hold office until their respective successors are chosen and qualified or until he or she sooner dies, resigns, is removed or becomes disqualified. Each of the other officers serves at the pleasure of the Board.
Schwab Government Money Market Portfolio | Annual Report28
Annual Report | December 31, 2023
Schwab S&P 500 Index Portfolio
No Action Required – Notice Regarding Shareholder Report Delivery |
Beginning on July 24, 2024, fund shareholder reports will be streamlined to highlight key information deemed important for investors to assess and monitor their fund investments. Other information, including financial statements, will not appear in the streamlined shareholder reports but will available online and delivered free of charge upon request. |
• If you already receive the full shareholder reports, you will receive the streamlined shareholder reports in the same way that you currently receive the full shareholder reports (either in paper or electronically). |
• If you currently receive a notification when a shareholder report is available on a fund’s website, beginning July 24, 2024, you will begin to receive the streamlined shareholder report (in paper). |
Proxy Voting Policies, Procedures and Results
A description of the proxy voting policies and procedures used to determine how to vote proxies on behalf of the funds is available without charge, upon request, by visiting the Schwab Fund’s website at www.schwabassetmanagement.com/schwabfunds_prospectus, the SEC’s website at www.sec.gov, or by contacting Schwab Funds at 1-877-824-5615.
Information regarding how a fund voted proxies relating to portfolio securities during the most recent twelve-month period ended June 30 is available, without charge, by visiting Schwab’s website at www.schwabassetmanagement.com/schwabfunds_prospectus or the SEC’s website at www.sec.gov.
The Sector/Industry classifications in this report use the Global Industry Classification Standard (GICS) which was developed by and is the exclusive property of MSCI Inc. (MSCI) and Standard & Poor’s (S&P). GICS is a service mark of MSCI and S&P and has been licensed for use by Charles Schwab & Co., Inc. The Industry classifications used in the Portfolio Holdings are sub-categories of Sector classifications.
Investment Adviser: Charles Schwab Investment Management, Inc., dba Schwab Asset Management®
Schwab S&P 500 Index Portfolio
The Investment Environment
For the 12-month reporting period ended December 31, 2023, U.S. equity markets rebounded from their losses in 2022. U.S. stocks were volatile early in the reporting period as inflation remained elevated, the U.S. Federal Reserve (Fed) continued to raise interest rates, and the failure of three U.S. regional banks between early March and early May raised concerns about the stability of the banking sector. However, as the year wore on and as inflation began to ease, as did the likelihood of further rate increases, stocks staged a strong upswing—particularly in the final two months of the year. Outside the United States, the ongoing war between Russia and Ukraine and the Israel-Hamas war that broke out following Hamas’ attack on Israel in early October weighed on the global economy. For the reporting period, the S&P 500® Index, a bellwether for the overall U.S. stock market, returned 26.29%.
The U.S. economy continued to show unexpected resiliency over the reporting period. Surprisingly robust job growth and strong consumer spending helped propel U.S. gross domestic product (GDP) to a 4.9% annualized growth rate for the third quarter of 2023, up from roughly 2% for the prior three quarters. Inflation remained above the Fed’s historical 2% target over the reporting period but declined in the first half of the year, as rents and wage growth eased, profit margins declined, and monetary policy remained restrictive, before ticking up slightly in July through September, declining again in October through November, and then ticking up again in December. The unemployment rate remained low throughout the reporting period.
In its efforts to lower inflation, the Fed raised interest rates four times between January and July, increasing the federal funds rate from a range of 4.25% to 4.50% to a range of 5.25% to 5.50%. At its meetings in June, September, October, and December, the Fed maintained the then current rates citing robust economic activity, strong—though moderating—job gains, and low unemployment while acknowledging tighter financial and credit conditions for households and businesses. The Fed also maintained its program to reduce the assets held on its balance sheet, though its balance sheet temporarily spiked in March when the Fed supported banks after the failure of two U.S. regional banks (a third U.S. regional bank failed in early May). Despite that spike, the Fed’s balance sheet assets declined over the reporting period.
Asset Class Performance Comparison % returns during the 12 months ended December 31, 2023
Index figures assume dividends and distributions were reinvested. Index figures do not include trading and management costs, which would lower performance. Indices are unmanaged and cannot be invested in directly. Performance results less than one year are not annualized. Past performance is not an indication of future results.
Data source: Index provider websites and Schwab Asset Management.
Nothing in this report represents a recommendation of a security by the investment adviser.
Management views may have changed since the report date.
*
The net version of the index reflects reinvested dividends net of withholding taxes but reflects no deductions for expenses or other taxes.
Schwab S&P 500 Index Portfolio | Annual Report2
Schwab S&P 500 Index Portfolio
The Investment Environment (continued)
Among U.S. equities, large-cap stocks generally outperformed small-cap stocks, and among large-cap stocks, growth stocks outperformed value stocks. All but two of the 11 sectors in the S&P 500® Index posted positive returns. The strongest performing sector was the communication services sector, followed closely by the information technology sector. Driving much of the performance of these top sectors were “Magnificent Seven” stocks included in these sectors (Meta Platforms, Inc. and Alphabet, Inc., in the communication services sector and Microsoft Corp., Apple, Inc., and NVIDIA Corp. in the information technology sector). Most of these companies rose on strong sales and robust balance sheets, along with the growing enthusiasm surrounding artificial intelligence (AI) and its prospects. The utilities and energy sectors were the only sectors in the index with negative returns. The utilities sector suffered as high interest rates weighed on borrowing costs for the capital-intensive sector. The energy sector was impacted by falling oil prices.
3Schwab S&P 500 Index Portfolio | Annual Report
Schwab S&P 500 Index Portfolio
| Christopher Bliss, CFA, Managing Director and Head of Passive Equity Strategies for Schwab Asset Management, is responsible for overseeing the investment process and portfolio management of investment strategies for passive equity Schwab Funds and Schwab ETFs, and Schwab Personalized Indexing™ separately managed accounts. Before joining Schwab in 2016, Mr. Bliss spent 12 years at BlackRock (formerly Barclays Global Investors) managing and leading institutional index teams, most recently as a managing director and the head of the Americas institutional index team. In this role, Mr. Bliss was responsible for overseeing a team of portfolio managers managing domestic, developed international and emerging markets index strategies. Prior to BlackRock, he worked as an equity analyst and portfolio manager for Harris Bretall and before that, as a research analyst for JP Morgan. |
| Jeremy Brown, CFA, Senior Portfolio Manager for Schwab Asset Management, is responsible for the day-to-day co-management of the fund. Prior to joining Schwab in 2017, Mr. Brown spent six years with ALPS Advisors, Inc. in Denver, most recently as a senior analyst on the ETF portfolio management and research team where he performed portfolio management, trading, and analytics/research functions for ALPS ETFs and passive funds. Additionally, Mr. Brown led a number of investment research, commentary, industry trend analysis, and sales and marketing support initiatives. |
| Ferian Juwono, CFA, Senior Portfolio Manager for Schwab Asset Management, is responsible for the oversight and day-to-day co-management of the fund. Prior to joining Schwab in 2010, Mr. Juwono worked at BlackRock (formerly Barclays Global Investors) where he spent more than three years as a portfolio manager, managing equity index funds for institutional clients, and two years as a senior business analyst. Prior to that, Mr. Juwono worked for more than four years as a senior financial analyst with Union Bank of California. |
| Agnes Zau, CFA, Portfolio Manager for Schwab Asset Management, is responsible for the day-to-day co-management of the fund. Prior to joining Schwab in 2018, Ms. Zau was at BlackRock for three years, most recently as a multi-asset portfolio investment consultant where she advised institutional clients on asset allocation and strategy, constructed risk decomposition and portfolio optimization, and conducted scenario analyses for the core multi-asset target risk strategies. She spent the preceding three years as a derivatives specialist at Mellon Capital. |
Schwab S&P 500 Index Portfolio | Annual Report4
Schwab S&P 500 Index Portfolio as of December 31, 2023
The Schwab S&P 500 Index Portfolio’s (the fund) goal is to track the total return of the S&P 500® Index (the index), which includes the stocks of 500 leading U.S. publicly-traded companies from a broad range of industries. To pursue its goal, the fund generally seeks to replicate the performance of the index by giving the same weight to a given stock as does the index. For more information concerning the fund’s investment objective, strategy and risks, please see the fund’s prospectus.
Market Highlights. For the 12-month reporting period ended December 31, 2023, U.S. equity markets rebounded from their losses in 2022. U.S. stocks were volatile early in the reporting period as inflation remained elevated, the U.S. Federal Reserve (Fed) continued to raise interest rates, and the failure of three U.S. regional banks between early March and early May raised concerns about the stability of the banking sector. However, as the year wore on and as inflation began to ease, as did the likelihood of further rate increases, stocks staged a strong upswing—particularly in the final two months of the year. Outside the United States, the ongoing war between Russia and Ukraine and the Israel-Hamas war that broke out following Hamas’ attack on Israel in early October weighed on the global economy.
Performance. The fund tracked the index for the reporting period. The fund returned 26.22% for the 12-month reporting period ended December 31, 2023, compared with the index, which returned 26.29%. Differences between the return of the fund and the return of the index may be attributable to, among other things, the operational and transactional costs incurred by the fund and not the index.
Contributors and Detractors. The utilities sector detracted the most from the total return of the fund. Utilities stocks represented an average weight of approximately 3% of the fund’s investments and returned approximately -7% for the reporting period. One example from this sector is NextEra Energy, Inc., which provides sustainable energy generation and distribution services. The fund’s holdings of NextEra Energy, Inc. represented an average weight of less than 1% of the fund’s investments and returned approximately -25% for the reporting period.
The energy sector also detracted from the total return of the fund, representing an average weight of approximately 5% of the fund’s investments and returning approximately -1% for the reporting period.
The information technology sector contributed the most to the total return of the fund. Information technology stocks represented an average weight of approximately 30% of the fund’s investments and returned approximately 55% for the reporting period. One example from this sector is Microsoft Corp., which develops, manufactures, licenses, sells, and supports software products. The fund’s holdings of Microsoft Corp. represented an average weight of approximately 6% of the fund’s investments and returned approximately 58% for the reporting period.
The communication services sector also contributed to the total return of the fund, representing an average weight of approximately 8% of the fund’s investments and returning approximately 56% for the reporting period.
Management views and portfolio holdings may have changed since the report date.
5Schwab S&P 500 Index Portfolio | Annual Report
Schwab S&P 500 Index Portfolio
Performance and Fund Facts as of December 31, 2023
The performance data quoted represents past performance. Past performance does not guarantee future results. Investment returns and principal value will fluctuate so that an investor’s shares may be worth more or less than their original cost. Current performance may be lower or higher than performance data quoted. To obtain performance information current to the most recent month end, please visit www.schwabassetmanagement.com/schwabfunds_prospectus.
Performance of Hypothetical $10,000 Investment (December 31, 2013 – December 31, 2023)1
Average Annual Total Returns1
| | | |
Fund: Schwab S&P 500 Index Portfolio (11/01/96) | | | |
| | | |
Fund Category: Morningstar Large-Cap Blend2 | | | |
Fund Expense Ratio3: 0.03% |
All total return figures on this page assume dividends and distributions were reinvested. Index figures do not include trading and management costs, which would lower performance. Indices are unmanaged and cannot be invested in directly. Performance results less than one year are not annualized.
Index ownership — “Standard & Poor’s®,” “S&P®,” and “S&P 500®” are registered trademarks of Standard & Poor’s Financial Services LLC (S&P), and “Dow Jones®” is a registered trademark of Dow Jones Trademark Holdings LLC (Dow Jones) and have been licensed for use by S&P Dow Jones Indices LLC and its affiliates and sublicensed for certain purposes by Charles Schwab Investment Management, Inc. The “S&P 500® Index” is a product of S&P Dow Jones Indices LLC or its affiliates, and has been licensed for use by Charles Schwab Investment Managment, Inc. The Schwab S&P 500 Index Portfolio is not sponsored, endorsed, sold or promoted by S&P Dow Jones Indices LLC, Dow Jones, S&P, or their respective affiliates, and neither S&P Dow Jones Indices LLC, Dow Jones, S&P, nor their respective affiliates make any representation regarding the advisability of investing in the fund.
1
Fund performance does not reflect the additional fees and expenses imposed by the insurance company under the variable insurance product contract. If those contract fees and expenses were included, the performance would be less than that shown. Please refer to the variable insurance product prospectus for a complete listing of these expenses.
2
Source for category information: Morningstar, Inc. The Morningstar Category return represents all active and index mutual funds and ETFs within the category as of the report date.
3
As stated in the prospectus.
Schwab S&P 500 Index Portfolio | Annual Report6
Schwab S&P 500 Index Portfolio
Performance and Fund Facts as of December 31, 2023 (continued)
| |
Weighted Average Market Cap ($ x 1,000,000) | |
Price/Earnings Ratio (P/E) | |
| |
| |
Sector Weightings % of Investments2
Top Equity Holdings % of Net Assets3
Portfolio holdings may have changed since the report date.
Source of Sector Classification: S&P and MSCI.
2
The percentage may differ from the Portfolio Holdings because the above calculation is based on a percentage of total investments, excluding derivatives, whereas the calculation in the Portfolio Holdings is based on a percentage of net assets.
3
This list is not a recommendation of any security by the investment adviser.
7Schwab S&P 500 Index Portfolio | Annual Report
Schwab S&P 500 Index Portfolio
Fund Expenses (Unaudited)
Examples for a $1,000 Investment
As a fund shareholder, you may incur two types of costs: (1) transaction costs; and (2) ongoing costs, including management fees.
The expense examples below are intended to help you understand your ongoing cost (in dollars) of investing in the fund and to compare this cost with the ongoing cost of investing in other mutual funds. These examples are based on an investment of $1,000 invested for six months beginning July 1, 2023 and held through December 31, 2023.
The Actual Return line in the table below provides information about actual account values and actual expenses. You may use this information, together with the amount you invested, to estimate the expenses that you paid over the period. To do so, simply divide your account value by $1,000 (for example, an $8,600 account value ÷ $1,000 = 8.6), then multiply the result by the number given for the fund under the heading entitled “Expenses Paid During Period.”
The Hypothetical Return line in the table below provides information about hypothetical account values and hypothetical expenses based on the fund’s actual expense ratio and an assumed return of 5% per year before expenses. Because the return used is not an actual return, it may not be used to estimate the actual ending account value or expenses you paid for the period.
You may use this information to compare the ongoing costs of investing in the fund and other funds. To do so, compare this 5% hypothetical example with the 5% hypothetical examples that appear in the shareholder reports of the other funds.
Please note that the expenses shown in the table are meant to highlight your ongoing costs only, and do not reflect any transactional costs. Therefore, the hypothetical return line of the table is useful in comparing ongoing costs only, and will not help you determine the relative total costs of owning different funds. In addition, if these transactional costs were included, your costs would have been higher.
| | BEGINNING
ACCOUNT VALUE
AT 7/1/23 | ENDING
ACCOUNT VALUE
(NET OF EXPENSES)
AT 12/31/23 | EXPENSES PAID
DURING PERIOD
|
Schwab S&P 500 Index Portfolio | | | | |
| | | | |
| | | | |
| Based on the most recent six-month expense ratio. |
| Expenses for the fund are equal to its annualized expense ratio, multiplied by the average account value over the period, multiplied by 184 days in the period, and divided by 365 days in the fiscal year. |
Schwab S&P 500 Index Portfolio | Annual Report8
Schwab S&P 500 Index Portfolio
Financial Statements
| | | | | | |
|
Net asset value at beginning of period | | | | | | |
Income (loss) from investment operations: | | | | | | |
Net investment income (loss)1 | | | | | | |
Net realized and unrealized gains (losses) | | | | | | |
Total from investment operations | | | | | | |
| | | | | | |
Distributions from net investment income | | | | | | |
Distributions from net realized gains | | | | | | |
| | | | | | |
Net asset value at end of period | | | | | | |
| | | | | | |
|
Ratios to average net assets: | | | | | | |
| | | | | | |
Net investment income (loss) | | | | | | |
| | | | | | |
Net assets, end of period (x 1,000,000) | | | | | | |
| Calculated based on the average shares outstanding during the period. |
| Ratio includes less than 0.005% of non-routine proxy expenses. |
9Schwab S&P 500 Index Portfolio | Annual Report
Schwab S&P 500 Index Portfolio
Portfolio Holdings as of December 31, 2023
This section shows all the securities in the fund’s portfolio and their values as of the report date.
The fund files its complete schedule of portfolio holdings with the U.S. Securities and Exchange Commission (SEC) for the first and third quarters of each fiscal year on Form N-PORT Part F. The fund’s Form N-PORT Part F is available on the SEC’s website at www.sec.gov. The fund also makes available its complete schedule of portfolio holdings on the fund’s website at www.schwabassetmanagement.com/schwabfunds_prospectus, typically 60-80 days after the end of the fund’s fiscal quarter.
| | |
COMMON STOCKS 99.5% OF NET ASSETS |
|
Automobiles & Components 2.0% |
| | |
| | |
| | |
| | |
| | |
| | |
|
|
| | |
| | |
Citizens Financial Group, Inc. | | |
| | |
| | |
Huntington Bancshares, Inc. | | |
| | |
| | |
| | |
PNC Financial Services Group, Inc. | | |
| | |
| | |
| | |
| | |
| | |
| | |
|
|
| | |
| | |
| | |
| | |
| | |
| | |
Builders FirstSource, Inc. * | | |
| | |
| | |
| | |
| | |
| | |
| | |
| | |
| | |
| | |
| | |
| | |
| | |
Honeywell International, Inc. | | |
| | |
| | |
Huntington Ingalls Industries, Inc. | | |
| | |
Illinois Tool Works, Inc. | | |
| | |
Johnson Controls International PLC | | |
L3Harris Technologies, Inc. | | |
| | |
| | |
| | |
| | |
| | |
| | |
| | |
| | |
| | |
| | |
Rockwell Automation, Inc. | | |
| | |
| | |
Stanley Black & Decker, Inc. | | |
| | |
| | |
| | |
| | |
Westinghouse Air Brake Technologies Corp. | | |
| | |
| | |
| | |
|
Commercial & Professional Services 1.3% |
Automatic Data Processing, Inc. | | |
Broadridge Financial Solutions, Inc. | | |
Ceridian HCM Holding, Inc. * | | |
| | |
| | |
| | |
| | |
| | |
| | |
| | |
| | |
| | |
| | |
| | |
| | |
| | |
| | |
|
Consumer Discretionary Distribution & Retail 5.7% |
| | |
| | |
| | |
| | |
| | |
| | |
| | |
| | |
| | |
| | |
| | |
O'Reilly Automotive, Inc. * | | |
| | |
| | |
| | |
Schwab S&P 500 Index Portfolio | Annual Report10
Schwab S&P 500 Index Portfolio
Portfolio Holdings as of December 31, 2023 (continued)
| | |
| | |
| | |
| | |
|
Consumer Durables & Apparel 0.9% |
| | |
| | |
| | |
| | |
Lululemon Athletica, Inc. * | | |
Mohawk Industries, Inc. * | | |
| | |
| | |
| | |
| | |
| | |
| | |
| | |
| | |
|
|
| | |
| | |
Caesars Entertainment, Inc. * | | |
| | |
Chipotle Mexican Grill, Inc. * | | |
| | |
| | |
| | |
Hilton Worldwide Holdings, Inc. | | |
| | |
Marriott International, Inc., Class A | | |
| | |
MGM Resorts International * | | |
Norwegian Cruise Line Holdings Ltd. * | | |
Royal Caribbean Cruises Ltd. * | | |
| | |
| | |
| | |
| | |
|
Consumer Staples Distribution & Retail 1.8% |
| | |
| | |
| | |
| | |
| | |
| | |
Walgreens Boots Alliance, Inc. | | |
| | |
| | |
|
|
| | |
| | |
| | |
| | |
| | |
| | |
| | |
| | |
| | |
| | |
| | |
| | |
| | |
| | |
| | |
| | |
Occidental Petroleum Corp. | | |
| | |
| | |
Pioneer Natural Resources Co. | | |
| | |
| | |
| | |
| | |
| | |
|
Equity Real Estate Investment Trusts (REITs) 2.3% |
Alexandria Real Estate Equities, Inc. | | |
| | |
AvalonBay Communities, Inc. | | |
| | |
| | |
| | |
Digital Realty Trust, Inc. | | |
| | |
| | |
Essex Property Trust, Inc. | | |
Extra Space Storage, Inc. | | |
Federal Realty Investment Trust | | |
Healthpeak Properties, Inc. | | |
Host Hotels & Resorts, Inc. | | |
| | |
| | |
| | |
Mid-America Apartment Communities, Inc. | | |
| | |
| | |
| | |
| | |
| | |
Simon Property Group, Inc. | | |
| | |
| | |
| | |
| | |
| | |
| | |
|
|
| | |
Ameriprise Financial, Inc. | | |
Bank of New York Mellon Corp. | | |
Berkshire Hathaway, Inc., Class B * | | |
| | |
| | |
Capital One Financial Corp. | | |
Cboe Global Markets, Inc. | | |
| | |
| | |
Discover Financial Services | | |
FactSet Research Systems, Inc. | | |
Fidelity National Information Services, Inc. | | |
| | |
FleetCor Technologies, Inc. * | | |
| | |
| | |
11Schwab S&P 500 Index Portfolio | Annual Report
Schwab S&P 500 Index Portfolio
Portfolio Holdings as of December 31, 2023 (continued)
| | |
Goldman Sachs Group, Inc. | | |
Intercontinental Exchange, Inc. | | |
| | |
Jack Henry & Associates, Inc. | | |
MarketAxess Holdings, Inc. | | |
Mastercard, Inc., Class A | | |
| | |
| | |
| | |
| | |
| | |
| | |
Raymond James Financial, Inc. | | |
| | |
| | |
| | |
| | |
| | |
| | |
|
Food, Beverage & Tobacco 2.9% |
| | |
Archer-Daniels-Midland Co. | | |
Brown-Forman Corp., Class B | | |
| | |
| | |
| | |
| | |
Constellation Brands, Inc., Class A | | |
| | |
| | |
| | |
| | |
| | |
| | |
| | |
Lamb Weston Holdings, Inc. | | |
| | |
Molson Coors Beverage Co., Class B | | |
Mondelez International, Inc., Class A | | |
| | |
| | |
Philip Morris International, Inc. | | |
Tyson Foods, Inc., Class A | | |
| | |
|
Health Care Equipment & Services 5.4% |
| | |
| | |
Baxter International, Inc. | | |
| | |
Boston Scientific Corp. * | | |
| | |
| | |
| | |
| | |
| | |
| | |
| | |
| | |
| | |
Edwards Lifesciences Corp. * | | |
| | |
GE HealthCare Technologies, Inc. | | |
| | |
| | |
| | |
| | |
| | |
IDEXX Laboratories, Inc. * | | |
| | |
Intuitive Surgical, Inc. * | | |
Laboratory Corp. of America Holdings | | |
| | |
| | |
Molina Healthcare, Inc. * | | |
| | |
| | |
| | |
| | |
| | |
| | |
Universal Health Services, Inc., Class B | | |
Zimmer Biomet Holdings, Inc. | | |
| | |
|
Household & Personal Products 1.4% |
Church & Dwight Co., Inc. | | |
| | |
| | |
Estee Lauder Cos., Inc., Class A | | |
| | |
| | |
| | |
| | |
|
|
| | |
| | |
American International Group, Inc. | | |
| | |
Arch Capital Group Ltd. * | | |
| | |
| | |
| | |
| | |
Cincinnati Financial Corp. | | |
| | |
| | |
Hartford Financial Services Group, Inc. | | |
| | |
Marsh & McLennan Cos., Inc. | | |
| | |
Principal Financial Group, Inc. | | |
| | |
Prudential Financial, Inc. | | |
| | |
| | |
| | |
| | |
|
|
Air Products & Chemicals, Inc. | | |
| | |
| | |
| | |
| | |
| | |
CF Industries Holdings, Inc. | | |
| | |
| | |
| | |
Schwab S&P 500 Index Portfolio | Annual Report12
Schwab S&P 500 Index Portfolio
Portfolio Holdings as of December 31, 2023 (continued)
| | |
| | |
| | |
| | |
| | |
International Flavors & Fragrances, Inc. | | |
| | |
| | |
LyondellBasell Industries NV, Class A | | |
Martin Marietta Materials, Inc. | | |
| | |
| | |
| | |
Packaging Corp. of America | | |
| | |
| | |
| | |
| | |
| | |
| | |
|
Media & Entertainment 7.6% |
Alphabet, Inc., Class A * | | |
Alphabet, Inc., Class C * | | |
Charter Communications, Inc., Class A * | | |
| | |
| | |
| | |
Interpublic Group of Cos., Inc. | | |
Live Nation Entertainment, Inc. * | | |
| | |
Meta Platforms, Inc., Class A * | | |
| | |
| | |
| | |
Paramount Global, Class B | | |
Take-Two Interactive Software, Inc. * | | |
| | |
Warner Bros Discovery, Inc. * | | |
| | |
|
Pharmaceuticals, Biotechnology & Life Sciences 7.2% |
| | |
Agilent Technologies, Inc. | | |
| | |
| | |
Bio-Rad Laboratories, Inc., Class A * | | |
| | |
| | |
| | |
Charles River Laboratories International, Inc. * | | |
| | |
| | |
| | |
| | |
| | |
| | |
| | |
| | |
Mettler-Toledo International, Inc. * | | |
| | |
| | |
Regeneron Pharmaceuticals, Inc. * | | |
| | |
Thermo Fisher Scientific, Inc. | | |
Vertex Pharmaceuticals, Inc. * | | |
| | |
| | |
| | |
West Pharmaceutical Services, Inc. | | |
| | |
| | |
|
Real Estate Management & Development 0.2% |
CBRE Group, Inc., Class A * | | |
| | |
| | |
|
Semiconductors & Semiconductor Equipment 8.1% |
Advanced Micro Devices, Inc. * | | |
| | |
| | |
| | |
| | |
| | |
| | |
| | |
| | |
Microchip Technology, Inc. | | |
| | |
Monolithic Power Systems, Inc. | | |
| | |
| | |
| | |
| | |
| | |
| | |
| | |
| | |
| | |
|
Software & Services 11.9% |
| | |
| | |
Akamai Technologies, Inc. * | | |
| | |
| | |
Cadence Design Systems, Inc. * | | |
Cognizant Technology Solutions Corp., Class A | | |
| | |
| | |
| | |
| | |
| | |
International Business Machines Corp. | | |
| | |
| | |
| | |
Palo Alto Networks, Inc. * | | |
| | |
| | |
| | |
| | |
| | |
Tyler Technologies, Inc. * | | |
| | |
| | |
|
13Schwab S&P 500 Index Portfolio | Annual Report
Schwab S&P 500 Index Portfolio
Portfolio Holdings as of December 31, 2023 (continued)
| | |
Technology Hardware & Equipment 8.7% |
| | |
| | |
| | |
| | |
| | |
| | |
| | |
Hewlett Packard Enterprise Co. | | |
| | |
| | |
| | |
Keysight Technologies, Inc. * | | |
| | |
| | |
Seagate Technology Holdings PLC | | |
| | |
Teledyne Technologies, Inc. * | | |
| | |
| | |
Zebra Technologies Corp., Class A * | | |
| | |
|
Telecommunication Services 0.9% |
| | |
| | |
Verizon Communications, Inc. | | |
| | |
|
|
American Airlines Group, Inc. * | | |
CH Robinson Worldwide, Inc. | | |
| | |
| | |
Expeditors International of Washington, Inc. | | |
| | |
JB Hunt Transport Services, Inc. | | |
| | |
Old Dominion Freight Line, Inc. | | |
| | |
Uber Technologies, Inc. * | | |
| | |
United Airlines Holdings, Inc. * | | |
United Parcel Service, Inc., Class B | | |
| | |
|
|
| | |
| | |
| | |
| | |
American Electric Power Co., Inc. | | |
American Water Works Co., Inc. | | |
| | |
| | |
| | |
Consolidated Edison, Inc. | | |
Constellation Energy Corp. | | |
| | |
| | |
| | |
| | |
| | |
| | |
| | |
| | |
| | |
| | |
| | |
| | |
| | |
Pinnacle West Capital Corp. | | |
| | |
Public Service Enterprise Group, Inc. | | |
| | |
| | |
| | |
| | |
| | |
Total Common Stocks
(Cost $1,043,013,592) | |
Total Investments in Securities
(Cost $1,043,013,592) | |
| | | CURRENT VALUE/
UNREALIZED
APPRECIATION
($) |
|
| | | |
S&P 500 Index, e-mini, expires 03/15/24 | | | |
| Non-income producing security. |
| Issuer is affiliated with the fund’s investment adviser. |
Below is a summary of the fund’s transactions with affiliated issuers during the period ended December 31, 2023:
| | | | | NET CHANGE IN UNREALIZED APPRECIATION (DEPRECIATION) | | BALANCE OF SHARES HELD AT 12/31/23 | |
COMMON STOCKS 0.3% OF NET ASSETS |
|
|
| | | | | | | | |
Schwab S&P 500 Index Portfolio | Annual Report14
Schwab S&P 500 Index Portfolio
Portfolio Holdings as of December 31, 2023 (continued)
The following is a summary of the inputs used to value the fund’s investments as of December 31, 2023 (see financial note 2(a) for additional information):
| QUOTED PRICES IN
ACTIVE MARKETS FOR
IDENTICAL ASSETS
(LEVEL 1) | OTHER SIGNIFICANT
OBSERVABLE INPUTS
(LEVEL 2) | SIGNIFICANT
UNOBSERVABLE INPUTS
(LEVEL 3) | |
| | | | |
| | | | |
| | | | |
| | | | |
| As categorized in the Portfolio Holdings. |
| Futures contracts are reported at cumulative unrealized appreciation or depreciation. |
15Schwab S&P 500 Index Portfolio | Annual Report
Schwab S&P 500 Index Portfolio
Statement of Assets and Liabilities
|
Investments in securities, at value - affiliated (cost $3,043,138) | | |
Investments in securities, at value - unaffiliated (cost $1,039,970,454) | | |
| | |
Deposit with broker for futures contracts | | |
| | |
| | |
| | |
| | |
|
|
| | |
| | |
| | |
| | |
Variation margin on futures contracts | | |
| | |
| | |
|
|
Capital received from investors | | |
Total distributable earnings | | |
| | |
Schwab S&P 500 Index Portfolio | Annual Report16
Schwab S&P 500 Index Portfolio
Statement of Operations
For the period January 1, 2023 through December 31, 2023 |
|
Dividends received from securities - unaffiliated (net of foreign withholding tax of $8,489) | | |
Dividends received from securities - affiliated | | |
| | |
| | |
|
|
| | |
| | |
| | |
|
REALIZED AND UNREALIZED GAINS (LOSSES) |
Net realized losses on sales of securities - affiliated | | |
Net realized gains on sales of securities - unaffiliated | | |
Net realized gains on futures contracts | | |
| | |
Net change in unrealized appreciation (depreciation) on securities - affiliated | | |
Net change in unrealized appreciation (depreciation) on securities - unaffiliated | | |
Net change in unrealized appreciation (depreciation) on futures contracts | | |
Net change in unrealized appreciation (depreciation) | | |
Net realized and unrealized gains | | |
Increase in net assets resulting from operations | | |
17Schwab S&P 500 Index Portfolio | Annual Report
Schwab S&P 500 Index Portfolio
Statement of Changes in Net Assets
For the current and prior report periods
|
| | |
| | | |
Net realized gains (losses) | | | |
Net change in unrealized appreciation (depreciation) | | | |
Increase (decrease) in net assets resulting from operations | | | |
|
DISTRIBUTIONS TO SHAREHOLDERS |
| | | |
TRANSACTIONS IN FUND SHARES |
| | |
| | | | | |
| | | | | |
| | | | | |
| | | | | |
Net transactions in fund shares | | | | | |
|
SHARES OUTSTANDING AND NET ASSETS |
| | |
| | | | | |
| | | | | |
Total increase (decrease) | | | | | |
| | | | | |
Schwab S&P 500 Index Portfolio | Annual Report18
Schwab S&P 500 Index Portfolio
1. Business Structure of the Fund:
Schwab S&P 500 Index Portfolio (the fund) is a series of Schwab Annuity Portfolios (the trust), a no-load, open-end management investment company. The trust is organized as a Massachusetts business trust and is registered under the Investment Company Act of 1940, as amended (the 1940 Act). The list below shows all the funds in the trust as of the end of the period, including the fund discussed in this report, which is highlighted:
SCHWAB ANNUITY PORTFOLIOS |
Schwab Government Money Market Portfolio | |
Schwab S&P 500 Index Portfolio | |
Schwab VIT Balanced Portfolio | |
Schwab VIT Balanced with Growth Portfolio | |
Schwab VIT Growth Portfolio | |
The fund offers one share class. Shares are bought and sold at closing net asset value per share (NAV), which is the price for all outstanding shares of the fund. Each share has a par value of 1/1,000 of a cent, and the fund’s Board of Trustees (the Board) may authorize the issuance of as many shares as necessary.
The fund is available exclusively as an investment vehicle for variable annuity and variable life insurance contracts offered by separate accounts of participating life insurance companies, and in the future may be offered to pension and retirement plans qualified under the Internal Revenue Code, as amended. At December 31, 2023, 100% of the fund’s shares were held through separate accounts of six insurance companies. Subscriptions and redemptions of these insurance separate accounts could have a material impact on the fund.
The fund maintains its own account for purposes of holding assets and accounting, and is considered a separate entity for tax purposes. Within its account, the fund may also keep certain assets in segregated accounts, as required by securities law. The "Fund Complex" includes The Charles Schwab Family of Funds, Schwab Capital Trust, Schwab Investments, Schwab Annuity Portfolios, Schwab Strategic Trust and Laudus Trust.
2. Significant Accounting Policies:The following is a summary of the significant accounting policies the fund uses in its preparation of financial statements. The fund follows the investment company accounting and reporting guidance of the Financial Accounting Standards Board (FASB) Accounting Standard Codification Topic 946 Financial Services — Investment Companies. The accounting policies are in conformity with accounting principles generally accepted in the United States of America (GAAP).
Pursuant to Rule 2a-5 under the 1940 Act, the Board has designated authority to a Valuation Designee, the fund’s investment adviser, to make fair valuation determinations under adopted procedures, subject to Board oversight. The investment adviser has formed a Pricing Committee to administer the pricing and valuation of portfolio securities and other assets and liabilities as well as to ensure that prices used for internal purposes or provided by third parties reasonably reflect fair value. The Valuation Designee may utilize independent pricing services, quotations from securities and financial instrument dealers and other market sources to determine fair value.
Securities held in the fund’s portfolio are valued every business day. The following valuation policies and procedures are used by the Valuation Designee to value various types of securities:
• Securities traded on an exchange or over-the-counter: Traded securities are valued at the closing value for the day, or, on days when no closing value has been reported, at the mean of the most recent bid and ask quotes.
• Futures contracts: Futures contracts are valued at their settlement prices as of the close of their exchanges.
• Mutual funds: Mutual funds are valued at their respective NAVs.
• Securities for which no quoted value is available: The Valuation Designee has adopted procedures to fair value the fund’s securities when market prices are not “readily available” or are unreliable. For example, a security may be fair valued when it’s de-listed or its trading is halted or suspended; when a security’s primary pricing source is unable or unwilling to provide a price; or when a security’s primary trading market is closed during regular market hours. Fair value determinations are made in good faith in accordance with adopted valuation procedures. The Valuation Designee considers a number of factors, including unobservable market inputs, when arriving at fair value. The Valuation Designee may employ methods such as the review of related or comparable assets or liabilities, related market activities, recent transactions, market multiples, book
19Schwab S&P 500 Index Portfolio | Annual Report
Schwab S&P 500 Index Portfolio
Financial Notes (continued)
2. Significant Accounting Policies (continued):
values, transactional back-testing, disposition analysis and other relevant information. Due to the subjective and variable nature of fair value pricing, there can be no assurance that the fund could obtain the fair value assigned to the security upon the sale of such security.
In accordance with the authoritative guidance on fair value measurements and disclosures under GAAP, the fund discloses the fair value of its investments in a hierarchy that prioritizes the significant inputs to valuation methods used to measure the fair value. The hierarchy gives the highest priority to valuations based upon unadjusted quoted prices in active markets for identical assets or liabilities (Level 1 measurements) and the lowest priority to valuations based upon unobservable inputs that are significant to the valuation (Level 3 measurements). If inputs used to measure the financial instruments fall within different levels of the hierarchy, the categorization is based on the lowest level input that is significant to the valuation. If it is determined that either the volume and/or level of activity for an asset or liability has significantly decreased (from normal conditions for that asset or liability) or price quotations or observable inputs are not associated with orderly transactions, increased analysis and the Valuation Designee’s judgment will be required to estimate fair value.
The three levels of the fair value hierarchy are as follows:
• Level 1 — quoted prices in active markets for identical investments — Investments whose values are based on quoted market prices in active markets. These generally include active listed equities, mutual funds, exchange-traded funds (ETFs) and futures contracts. Mutual funds and ETFs are classified as Level 1 prices, without consideration to the classification level of the underlying securities held which could be Level 1, Level 2 or Level 3 in the fair value hierarchy.
• Level 2 — other significant observable inputs (including quoted prices for similar securities, interest rates, prepayment speeds, credit risk, etc.) — Investments that trade in markets that are not considered to be active, but whose values are based on quoted market prices, dealer quotations or valuations provided by alternative pricing sources supported by observable inputs are classified as Level 2 prices. These generally include U.S. government and sovereign obligations, most government agency securities, investment-grade corporate bonds, certain mortgage products, less liquid listed equities, and state, municipal and provincial obligations.
• Level 3 — significant unobservable inputs (including the Valuation Designee’s assumptions in determining the fair value of investments) — Investments whose values are classified as Level 3 prices have significant unobservable inputs, as they may trade infrequently or not at all. When observable prices are not readily available for these securities, one or more valuation methods are used for which sufficient and reliable data is available. The inputs used in estimating the value of Level 3 prices may include the original transaction price, quoted prices for similar securities or assets in active markets, completed or pending third-party transactions in the underlying investment or comparable issuers, and changes in financial ratios or cash flows. Level 3 prices may also be adjusted to reflect illiquidity and/or non-transferability, with the amount of such discount estimated in the absence of market information. Assumptions used due to the lack of observable inputs may significantly impact the resulting fair value and therefore the fund’s results of operations.
The inputs or methodology used for valuing securities are not necessarily an indication of the risk associated with investing in those securities.
The levels associated with valuing the fund’s investments as of December 31, 2023, are disclosed in the fund’s Portfolio Holdings.
(b) Accounting Policies for certain Portfolio Investments (if held):
Futures Contracts: Futures contracts are instruments that represent an agreement between two parties that obligates one party to buy, and the other party to sell, specific instruments at an agreed upon price on a stipulated future date. The fund must give the broker a deposit of cash and/or securities (initial margin) whenever it enters into a futures contract. The amount of the deposit may vary from one contract to another. Subsequent payments (variation margin) are made or received by the fund depending on the daily fluctuations in the value of the futures contract and are accounted for as unrealized appreciation or depreciation until the contract is closed, at which time the gains or losses are realized. Futures contracts are traded publicly on exchanges, and their value may change daily.
Cash Investments: The fund may invest a portion of its assets in cash. Cash includes cash bank balances in an interest-bearing demand deposit account with maturity on demand by the fund.
Securities Lending: Under the trust’s Securities Lending Program, the fund (lender) may make short-term loans of its securities to another party (borrower) to generate additional revenue for the fund. The borrower pledges collateral in the form of cash, securities issued or fully guaranteed by the U.S. government or foreign governments, or letters of credit issued by a bank. Collateral at the individual loan level is required to be maintained on a daily marked-to-market basis in an amount at least equal to the current value
Schwab S&P 500 Index Portfolio | Annual Report20
Schwab S&P 500 Index Portfolio
Financial Notes (continued)
2. Significant Accounting Policies (continued):
of the securities loaned. The lending agent provides the fund with indemnification against borrower default (the borrower fails to return the security on loan) reducing the risk of loss as a result of default. The cash collateral of securities loaned is currently invested in money market portfolios operating pursuant to Rule 2a-7 under the 1940 Act. The fund bears the risk of loss with respect to the investment of cash collateral. The terms of the securities lending agreement allow the fund or the lending agent to terminate any loan at any given time and the securities must be returned within the earlier of the standard trade settlement period or the specified time period under the relevant securities lending agreement. Securities lending income, as disclosed in the fund’s Statement of Operations, if applicable, represents the income earned from the investment of the cash collateral plus any fees paid by borrowers, less the fees paid to the lending agent and broker rebates which are subject to adjustments pursuant to the securities lending agreement. On loans not collateralized by cash, a fee is received from the borrower, and is allocated between the fund and the lending agent. The aggregate fair value of securities loaned will not at any time exceed one-third of the total assets of the fund, including collateral received from the loan. Securities lending fees paid to the unaffiliated lending agents start at 9% of gross lending revenue, with subsequent breakpoints to a low of 5%. In this context, the gross lending revenue equals the income received from the investment of cash collateral and fees paid by borrowers less any rebates paid to the borrowers. Any expenses charged by the cash collateral fund are in addition to these fees. All remaining revenue is retained by the fund, as applicable. No portion of lending revenue is paid to or retained by the investment adviser or any of its affiliates.
As of December 31, 2023, the fund had no securities on loan.
(c) Security Transactions:
Security transactions are recorded as of the date the order to buy or sell the security is executed. Realized gains and losses from security transactions are based on the identified costs of the securities involved.
When the fund closes out a futures contract position, it calculates the difference between the value of the position at the beginning and at the end of the contract, and records a realized gain or loss accordingly.
Interest income is recorded as it accrues. Dividends and distributions from portfolio securities funds are recorded on the date they are effective (the ex-dividend date).
Pursuant to an Amended and Restated Investment Advisory and Administration Agreement (Advisory Agreement) between the investment adviser and the fund, the investment adviser pays the operating expenses of the fund, excluding acquired fund fees and expenses, taxes, any brokerage expenses, and extraordinary or non-routine expenses. Taxes, any brokerage expenses and extraordinary or non-routine expenses that are specific to the fund are charged directly to the fund. The Advisory Agreement excludes paying acquired fund fees and expenses, which are indirect expenses incurred by the fund through its investments in underlying funds.
(f) Distributions to Shareholders:
The fund makes distributions from net investment income and net realized capital gains, if any, once a year. To receive a distribution, you must be a registered shareholder on the record date. Distributions are paid to shareholders on the payable date.
(g) Accounting Estimates:
The accounting policies described in this report conform to GAAP. Notwithstanding this, shareholders should understand that in order to follow these principles, fund management has to make estimates and assumptions that affect the information reported in the financial statements. It’s possible that once the results are known, they may turn out to be different from these estimates and these differences may be material.
(h) Federal Income Taxes:
The fund intends to meet federal income and excise tax requirements for regulated investment companies under subchapter M of the Internal Revenue Code, as amended. Accordingly, the fund distributes substantially all of its net investment income and net realized capital gains, if any, to the participating insurance company’s (shareholders) separate accounts each year. As long as the fund meets the tax requirements, it is not required to pay federal income tax.
21Schwab S&P 500 Index Portfolio | Annual Report
Schwab S&P 500 Index Portfolio
Financial Notes (continued)
2. Significant Accounting Policies (continued):
(i) Indemnification:
Under the fund’s organizational documents, the officers and trustees are indemnified against certain liabilities arising out of the performance of their duties to the fund. In addition, in the normal course of business the fund enters into contracts with its vendors and others that provide general indemnifications. The fund’s maximum exposure under these arrangements is unknown as this would involve future claims that may be made against the fund. However, based on experience, the fund expects the risk of loss attributable to these arrangements to be remote.
Effective January 24, 2023, the U.S. Securities and Exchange Commission (SEC) adopted rule and form amendments to require mutual funds and ETFs to transmit concise and visually engaging streamlined annual and semiannual reports to shareholders that highlight key information deemed important for retail investors to assess and monitor their fund investments. Other information, including financial statements, will no longer appear in a streamlined shareholder report but must be available online, delivered free of charge upon request, and filed on a semiannual basis on Form N-CSR. The rule and form amendments have a compliance date of July 24, 2024. At this time, management is evaluating the impact of these rule and form amendment changes on the content of the current shareholder report and the newly created annual and semiannual streamlined shareholder reports.
Market Risk. Financial markets rise and fall in response to a variety of factors, sometimes rapidly and unpredictably. Markets may be impacted by economic, political, regulatory and other conditions, including economic sanctions and other government actions. In addition, the occurrence of global events, such as war, terrorism, environmental disasters, natural disasters and epidemics may also negatively affect the financial markets. As with any investment whose performance is tied to these markets, the value of an investment in the fund will fluctuate, which means that an investor could lose money over short or long periods.
Equity Risk. The prices of equity securities rise and fall daily. These price movements may result from factors affecting individual companies, industries or the securities market as a whole. In addition, equity markets tend to move in cycles, which may cause stock prices to fall over short or extended periods of time.
Investment Style Risk. The fund primarily follows the large-cap portion of the U.S. stock market, as measured by the index. It follows these stocks during upturns as well as downturns. Because of its indexing strategy, the fund does not take steps to reduce market exposure or to lessen the effects of a declining market. In addition, because of the fund’s expenses, the fund’s performance may be below that of the index. Market disruptions could cause delays in the index’s rebalancing schedule which may result in the index and, in turn, the fund experiencing returns different than those that would have been achieved under a normal rebalancing schedule.
A significant percentage of the index may be composed of securities in a single industry or sector of the economy. If the fund is focused in an industry or sector, it may present more risks than if it were broadly diversified over numerous industries and sectors of the economy.
Tracking Error Risk. As an index fund, the fund seeks to track the performance of its benchmark index, although it may not be successful in doing so. The divergence between the performance of a fund and its benchmark index, positive or negative, is called “tracking error.” Tracking error can be caused by many factors and it may be significant.
Market Capitalization Risk. Securities issued by companies of different market capitalizations tend to go in and out of favor based on market and economic conditions. During a period when securities of a particular market capitalization fall behind other types of investments, the fund’s performance could be impacted.
Large-Cap Company Risk. Large-cap companies are generally more mature and the securities issued by these companies may not be able to reach the same levels of growth as the securities issued by small- or mid-cap companies.
Concentration Risk. To the extent that the fund’s or the index’s portfolio is concentrated in the securities of issuers in a particular market, industry, group of industries, sector, or asset class, the fund may be adversely affected by the performance of those securities, may be subject to increased price volatility and may be more vulnerable to adverse economic, market, political or regulatory occurrences affecting that market, industry, group of industries, sector, or asset class.
Schwab S&P 500 Index Portfolio | Annual Report22
Schwab S&P 500 Index Portfolio
Financial Notes (continued)
3. Risk Factors (continued):
Derivatives Risk. The fund’s use of derivative instruments involves risks different from, or possibly greater than, the risks associated with investing directly in securities and other traditional investments. The fund’s use of derivatives could reduce the fund’s performance, increase its volatility and cause the fund to lose more than the initial amount invested. In addition, investments in derivatives may involve leverage, which means a small percentage of assets invested in derivatives can have a disproportionately large impact on the fund.
Liquidity Risk. The fund may be unable to sell certain securities, such as illiquid securities, readily at a favorable time or price, or the fund may have to sell them at a loss.
Securities Lending Risk. Securities lending involves the risk of loss of rights in, or delay in recovery of, the loaned securities if the borrower fails to return the security loaned or becomes insolvent.
Please refer to the fund’s prospectus for a more complete description of the principal risks of investing in the fund.
4. Affiliates and Affiliated Transactions:Charles Schwab Investment Management, Inc., dba Schwab Asset Management, a wholly owned subsidiary of The Charles Schwab Corporation, serves as the fund’s investment adviser and administrator pursuant to an Advisory Agreement between the investment adviser and the trust.
For its advisory services to the fund, the investment adviser is entitled to receive an annual fee, payable monthly, equal to 0.03% of the fund’s average daily net assets.
The fund may engage in direct transactions with certain other funds in the Fund Complex in accordance with procedures adopted by the Board pursuant to Rule 17a-7 under the 1940 Act. When one fund is seeking to sell a security that another is seeking to buy, an interfund transaction can allow both funds to benefit by reducing transaction costs. This practice is limited to funds that share the same investment adviser, trustees and/or officers. For the period ended December 31, 2023, the fund’s purchases and sales of securities with other funds in the Fund Complex was $6,710,080 and $6,817,212 respectively, and includes realized losses of $1,482,048.
Interfund Borrowing and Lending
Pursuant to an exemptive order issued by the SEC, the fund may enter into interfund borrowing and lending transactions with other funds in the Fund Complex . All loans are for temporary or emergency purposes and the interest rate to be charged will be the average of the overnight repurchase agreement rate and the short-term bank loan rate. All loans are subject to numerous conditions designed to ensure fair and equitable treatment of all participating funds. The interfund lending facility is subject to the oversight and periodic review by the Board. The fund had no interfund borrowing or lending activity during the period.
The Board may include people who are officers and/or directors of the investment adviser or its affiliates. Federal securities law limits the percentage of such “interested persons” who may serve on a trust’s board, and the trust was in compliance with these limitations throughout the report period. The fund did not pay any interested persons or non-interested persons (independent trustees). The independent trustees are paid by the investment adviser. For information regarding the trustees, please refer to the Trustees and Officers table at the end of this report.
During the period, the fund was a participant with other funds in the Fund Complex in a joint, syndicated, committed $1 billion line of credit (the Syndicated Credit Facility), which matured on September 28, 2023. On September 28, 2023, the Syndicated Credit Facility was amended to run for a new 364 day period with the line of credit amount remaining unchanged, maturing on September 26, 2024. Under the terms of the Syndicated Credit Facility, in addition to the investment adviser paying the interest charged on any borrowings by the fund, the investment adviser paid a commitment fee of 0.15% per annum on the fund’s proportionate share of the unused portion of the Syndicated Credit Facility.
23Schwab S&P 500 Index Portfolio | Annual Report
Schwab S&P 500 Index Portfolio
Financial Notes (continued)
6. Borrowing from Banks (continued):
During the period, the fund was a participant with other funds in the Fund Complex, in a joint, unsecured, uncommitted $400 million line of credit (the Uncommitted Credit Facility), with State Street Bank and Trust Company, which matured on September 28, 2023. On September 28, 2023, the Uncommitted Credit Facility was amended to run for a new 364 day period with the line of credit amount remaining unchanged, maturing on September 26, 2024. Under the terms of the Uncommitted Credit Facility, the investment adviser pays interest on the amount the fund borrows. There were no borrowings by the fund from either line of credit during the period.
The fund also has access to custodian overdraft facilities. The fund may have utilized the overdraft facility and incurred an interest expense, which is paid by the investment adviser. The interest expense is determined based on a negotiated rate above the current Federal Funds Rate.
7. Purchases and Sales/Maturities of Investment Securities:For the period ended December 31, 2023, purchases and sales of securities (excluding short-term obligations) were as follows:
The fund entered into equity index futures contracts during the report period. The fund invested in futures contracts to equitize available cash. Refer to financial note 2(b) for the fund’s accounting policies with respect to futures contracts and financial note 3 for disclosures concerning the risks of investing in futures contracts.
As of December 31, 2023, the Statement of Assets and Liabilities included the following financial derivative instrument fair values held at period end:
| |
| Includes cumulative unrealized appreciation of futures contracts as reported in the fund’s Portfolio Holdings. Only current day’s variation margin on futures contracts is reported within the Statement of Assets and Liabilities. |
The effects of the derivative contracts held in the Statement of Operations for the period ended December 31, 2023 were:
| | |
Net Realized Gains (Losses) | | |
Schwab S&P 500 Index Portfolio | | |
| | |
Net Change in Unrealized Appreciation (Depreciation) | | |
Schwab S&P 500 Index Portfolio | | |
| | |
| |
| Statement of Operations location: Net realized gains (losses) on futures contracts. |
| Statement of Operations location: Net change in unrealized appreciation (depreciation) on futures contracts. |
During the period ended December 31, 2023, the month-end average notional amounts of futures contracts held by the fund and the month-end average number of contracts held were as follows:
Schwab S&P 500 Index Portfolio | Annual Report24
Schwab S&P 500 Index Portfolio
Financial Notes (continued)
As of December 31, 2023, the tax basis cost of the fund’s investments and gross unrealized appreciation and depreciation were as follows:
| | GROSS UNREALIZED
APPRECIATION | GROSS UNREALIZED
DEPRECIATION | NET UNREALIZED
APPRECIATION
(DEPRECIATION) |
| | | | |
| | | | |
| | | | |
As of December 31, 2023, the components of distributable earnings on a tax basis were as follows:
UNDISTRIBUTED
ORDINARY
INCOME | NET UNREALIZED
APPRECIATION
(DEPRECIATION)
ON INVESTMENTS | CAPITAL LOSS
CARRYFORWARDS AND OTHER LOSSES | |
| | | |
The primary difference between book basis and tax basis unrealized appreciation or unrealized depreciation of investments is the tax deferral of losses on wash sales and realization for tax purposes of unrealized appreciation or depreciation on futures contracts. The tax cost of the fund’s investments, disclosed above, has been adjusted from the book amounts to reflect these unrealized appreciation or depreciation differences, as applicable.
Capital loss carryforwards have no expiration and may be used to offset future realized capital gains for federal income tax purposes. As of December 31, 2023, the fund had capital loss carryforwards of $14,395,509.
The tax basis components of distributions paid during the current and prior fiscal years were as follows:
| CURRENT FISCAL YEAR END DISTRIBUTIONS | PRIOR FISCAL YEAR END DISTRIBUTIONS |
| | | | |
| | | | |
Distributions paid to shareholders are based on net investment income and net realized gains determined on a tax basis, which may differ from net investment income and net realized gains for financial reporting purposes. These differences reflect the differing character of certain income items and net realized gains and losses for financial statement and tax purposes, and may result in reclassification among certain capital accounts in the financial statements. The fund may also designate a portion of the amount paid to redeeming shareholders as a distribution for tax purposes.
Permanent book and tax basis differences may result in reclassifications between components of net assets as required. The adjustments will have no impact on net assets or the results of operations.
As of December 31, 2023, management has reviewed the tax positions for open periods (for federal purposes, three years from the date of filing and for state purposes, four years from the date of filing) as applicable to the fund, and has determined that no provision for income tax is required in the fund’s financial statements. The fund recognizes interest and penalties, if any, related to unrecognized tax benefits as income tax expense in the Statement of Operations. During the fiscal year ended December 31, 2023, the fund did not incur any interest or penalties.
Management has determined there are no subsequent events or transactions through the date the financial statements were issued that would have materially impacted the financial statements as presented.
25Schwab S&P 500 Index Portfolio | Annual Report
Schwab S&P 500 Index Portfolio
Report of Independent Registered Public Accounting Firm
To the Board of Trustees of Schwab Annuity Portfolios and Shareholders of Schwab S&P 500 Index Portfolio:
Opinion on the Financial Statements and Financial Highlights
We have audited the accompanying statement of assets and liabilities, including the portfolio holdings, of Schwab S&P 500 Index Portfolio (the “Fund”), one of the funds constituting Schwab Annuity Portfolios, as of December 31, 2023, the related statement of operations for the year then ended, the statements of changes in net assets for each of the two years in the period then ended, the financial highlights for each of the four years in the period then ended, and the related notes. In our opinion, the financial statements and financial highlights present fairly, in all material respects, the financial position of the Fund as of December 31, 2023, and the results of its operations for the year then ended, the changes in its net assets for each of the two years in the period then ended, and the financial highlights for each of the four years in the period then ended in conformity with accounting principles generally accepted in the United States of America. The financial highlights for the year ended December 31, 2019 were audited by other auditors, whose report, dated February 18, 2020, expressed an unqualified opinion on such financial highlights.
These financial statements and financial highlights are the responsibility of the Fund’s management. Our responsibility is to express an opinion on the Fund’s financial statements and financial highlights based on our audits. We are a public accounting firm registered with the Public Company Accounting Oversight Board (United States) (PCAOB) and are required to be independent with respect to the Fund in accordance with the U.S. federal securities laws and the applicable rules and regulations of the Securities and Exchange Commission and the PCAOB.
We conducted our audits in accordance with the standards of the PCAOB. Those standards require that we plan and perform the audit to obtain reasonable assurance about whether the financial statements and financial highlights are free of material misstatement, whether due to error or fraud. The Fund is not required to have, nor were we engaged to perform, an audit of its internal control over financial reporting. As part of our audits, we are required to obtain an understanding of internal control over financial reporting but not for the purpose of expressing an opinion on the effectiveness of the Fund’s internal control over financial reporting. Accordingly, we express no such opinion.
Our audits included performing procedures to assess the risks of material misstatement of the financial statements and financial highlights, whether due to error or fraud, and performing procedures that respond to those risks. Such procedures included examining, on a test basis, evidence regarding the amounts and disclosures in the financial statements and financial highlights. Our audits also included evaluating the accounting principles used and significant estimates made by management, as well as evaluating the overall presentation of the financial statements and financial highlights. Our procedures included confirmation of securities owned as of December 31, 2023, by correspondence with the custodian and brokers; when replies were not received from brokers, we performed other auditing procedures. We believe that our audits provide a reasonable basis for our opinion.
Deloitte & Touche LLP
Denver, Colorado
February 16, 2024
We have served as the auditor of one or more investment companies in the Schwab Funds Complex since 2020.
Schwab S&P 500 Index Portfolio | Annual Report26
Schwab S&P 500 Index Portfolio
Other Federal Tax Information (unaudited)
For corporate shareholders, 93.57% of the fund’s dividend distributions paid during the fiscal year ended December 31, 2023, qualify for the corporate dividends received deduction.
27Schwab S&P 500 Index Portfolio | Annual Report
Schwab S&P 500 Index Portfolio
Liquidity Risk Management Program (unaudited)
The fund has adopted and implemented a liquidity risk management program (the “program”) as required by Rule 22e-4 under the Investment Company Act of 1940, as amended. The fund’s Board of Trustees (the “Board”) has designated the fund’s investment adviser, Charles Schwab Investment Management, Inc., dba Schwab Asset Management, as the administrator of the program. Personnel of the investment adviser or its affiliates conduct the day-to-day operation of the program.
Under the program, the investment adviser manages a fund’s liquidity risk, which is the risk that the fund could not meet shareholder redemption requests without significant dilution of remaining shareholders’ interests in the fund. The program is reasonably designed to assess and manage a fund’s liquidity risk, taking into consideration the fund’s investment strategy and the liquidity of its portfolio investments during normal and reasonably foreseeable stressed conditions; its historical redemption history and shareholder concentrations; and its cash holdings and access to other funding sources, including the custodian overdraft facility and lines of credit. The investment adviser’s process of determining the degree of liquidity of each fund’s investments is supported by third-party liquidity assessment vendors.
The fund’s Board reviewed a report at its meeting held on September 19, 2023 prepared by the investment adviser regarding the operation and effectiveness of the program for the period June 1, 2022, through May 31, 2023, which included individual fund liquidity metrics. The report summarized the operation of the program and the information and factors considered by the investment adviser in assessing whether the program has been adequately and effectively implemented with respect to a fund. In addition, the investment adviser provided its assessment that the program had been operating effectively in managing the fund’s liquidity risk.
Schwab S&P 500 Index Portfolio | Annual Report28
Schwab S&P 500 Index Portfolio
Trustees and Officers
The tables below give information about the trustees and officers of Schwab Annuity Portfolios, which includes the fund covered in this report. The “Fund Complex” includes The Charles Schwab Family of Funds, Schwab Capital Trust, Schwab Investments, Schwab Annuity Portfolios, Schwab Strategic Trust and Laudus Trust. The Fund Complex includes 106 funds.
The address for all trustees and officers is 211 Main Street, San Francisco, CA 94105. You can find more information about the trustees and officers in the fund’s Statement of Additional Information, which is available free by calling 1-877-824-5615.
|
Name, Year of Birth, and Position(s) with the trust (Terms of office, and length of Time Served1) | Principal Occupations During the Past Five Years | Number of Portfolios in Fund Complex Overseen by the Trustee | |
Michael J. Beer 1961 Trustee (Trustee of The Charles Schwab Family of Funds, Schwab Investments, Schwab Capital Trust, Schwab Annuity Portfolios, Schwab Strategic Trust and Laudus Trust since 2022) | Retired. Director, President and Chief Executive Officer (Dec. 2016 – Sept. 2019), Principal Funds (investment management). | | Director (2016 – 2019), Principal Funds, Inc. |
Robert W. Burns 1959 Trustee (Trustee of Schwab Strategic Trust since 2009; The Charles Schwab Family of Funds, Schwab Investments, Schwab Capital Trust, Schwab Annuity Portfolios and Laudus Trust since 2016) | Retired/Private Investor. | | |
Nancy F. Heller 1956 Trustee (Trustee of The Charles Schwab Family of Funds, Schwab Investments, Schwab Capital Trust, Schwab Annuity Portfolios, Schwab Strategic Trust and Laudus Trust since 2018) | | | |
David L. Mahoney 1954 Trustee (Trustee of The Charles Schwab Family of Funds, Schwab Investments, Schwab Capital Trust, Schwab Annuity Portfolios and Laudus Trust since 2011; Schwab Strategic Trust since 2016) | | | Director (2004 – present), Corcept Therapeutics Incorporated Director (2009 – 2021), Adamas Pharmaceuticals, Inc. Director (2003 – 2019), Symantec Corporation |
Jane P. Moncreiff 1961 Trustee (Trustee of The Charles Schwab Family of Funds, Schwab Investments, Schwab Capital Trust, Schwab Annuity Portfolios, Schwab Strategic Trust and Laudus Trust since 2019) | Consultant (2018 – present), Fulham Advisers LLC (management consulting); Chief Investment Officer (2009 – 2017), CareGroup Healthcare System, Inc. (healthcare). | | |
29Schwab S&P 500 Index Portfolio | Annual Report
Schwab S&P 500 Index Portfolio
Independent Trustees (continued) |
Name, Year of Birth, and Position(s) with the trust (Terms of office, and length of Time Served1) | Principal Occupations During the Past Five Years | Number of Portfolios in Fund Complex Overseen by the Trustee | |
Kimberly S. Patmore 1956 Trustee (Trustee of The Charles Schwab Family of Funds, Schwab Investments, Schwab Capital Trust, Schwab Annuity Portfolios, Schwab Strategic Trust and Laudus Trust since 2016) | Consultant (2008 – present), Patmore Management Consulting (management consulting). | | |
J. Derek Penn 1957 Trustee (Trustee of The Charles Schwab Family of Funds, Schwab Investments, Schwab Capital Trust, Schwab Annuity Portfolios, Schwab Strategic Trust and Laudus Trust since 2021) | Head of Equity Sales and Trading (2006 – 2018), BNY Mellon (financial services). | | |
|
Name, Year of Birth, and Position(s) with the trust (Terms of office, and length of Time Served1) | Principal Occupations During the Past Five Years | Number of Portfolios in Fund Complex Overseen by the Trustee | |
Walter W. Bettinger II2 1960 Chairman and Trustee (Trustee of The Charles Schwab Family of Funds, Schwab Investments, Schwab Capital Trust and Schwab Annuity Portfolios since 2008; Schwab Strategic Trust since 2009; Laudus Trust since 2010) | Co-Chairman of the Board (July 2022 – present), Director and Chief Executive Officer (Oct. 2008 – present) and President (Feb. 2007 – Oct. 2021), The Charles Schwab Corporation; President and Chief Executive Officer (Oct. 2008 – Oct. 2021) and Director (May 2008 – Oct. 2021), Charles Schwab & Co., Inc.; Co-Chairman of the Board (July 2022 – present) and Director (Apr. 2006 – present), Charles Schwab Bank, SSB; Co-Chairman of the Board (July 2022 – present) and Director (Nov. 2017 – present), Charles Schwab Premier Bank, SSB; Co-Chairman of the Board (July 2022 – present) and Director (July 2019 – present), Charles Schwab Trust Bank; Director (May 2008 – present), Chief Executive Officer (Aug. 2017 – present) and President (Aug. 2017 – Nov. 2021), Schwab Holdings, Inc.; Manager (Sept. 2023 – present), TD Ameritrade Holding LLC; Director (Oct. 2020 – Aug. 2023), TD Ameritrade Holding Corporation; Director (July 2016 – Oct. 2021), Charles Schwab Investment Management, Inc. | | Director (2008 – present), The Charles Schwab Corporation |
Richard A. Wurster2 1973 Trustee (Trustee of The Charles Schwab Family of Funds, Schwab Investments, Schwab Capital Trust, Schwab Annuity Portfolios, Schwab Strategic Trust and Laudus Trust since 2022) | President (Oct. 2021 – present) and Executive Vice President – Schwab Asset Management Solutions (Apr. 2019 – Oct. 2021), The Charles Schwab Corporation; President, Director (Oct. 2021 – present), Executive Vice President – Schwab Asset Management Solutions (July 2019 – Oct. 2021) and Senior Vice President – Advisory (May 2016 – July 2019), Charles Schwab & Co., Inc.; President (Nov. 2021 – present), Schwab Holdings, Inc.; Director (Oct. 2021 – present) and Chief Executive Officer (Nov. 2019 – Jan. 2022), Charles Schwab Investment Management, Inc.; Director, Chief Executive Officer and President (Mar. 2018 – Oct. 2022), Charles Schwab Investment Advisory, Inc.; Chief Executive Officer (July 2016 – Apr. 2018) and President (Mar. 2017 – Apr. 2018), ThomasPartners, Inc.; Chief Executive Officer (July 2016 – Apr. 2018), Windhaven Investment Management, Inc. | | |
Schwab S&P 500 Index Portfolio | Annual Report30
Schwab S&P 500 Index Portfolio
|
Name, Year of Birth, and Position(s) with the trust (Terms of office, and length of Time Served3) | Principal Occupations During the Past Five Years |
Omar Aguilar 1970 Chief Executive Officer, President and Chief Investment Officer (Officer of The Charles Schwab Family of Funds, Schwab Investments, Schwab Capital Trust, Schwab Annuity Portfolios, Schwab Strategic Trust and Laudus Trust since 2011) | Chief Executive Officer (Jan. 2022 – present), President (Oct. 2023 – present), (Chief Investment Officer (Apr. 2011 – present) and Senior Vice President (Apr. 2011 – Jan. 2022), Charles Schwab Investment Management, Inc.; Director, Chief Executive Officer and President (Oct. 2022 – present), Charles Schwab Investment Advisory, Inc.; Chief Executive Officer (Sept. 2023 – present), President (Oct. 2023 – present), Chief Investment Officer (June 2011 – present) and Vice President (June 2011 – Sept. 2023), Schwab Funds, Laudus Trust and Schwab ETFs. |
Mark Fischer 1970 Chief Operating Officer (Officer of The Charles Schwab Family of Funds, Schwab Investments, Schwab Capital Trust, Schwab Annuity Portfolios, Schwab Strategic Trust and Laudus Trust since 2013) | Chief Operating Officer (Dec. 2020 – present) and Treasurer and Chief Financial Officer (Jan. 2016 – Dec. 2022), Schwab Funds, Laudus Trust and Schwab ETFs; Chief Financial Officer (Mar. 2020 – present), Chief Operating Officer (Oct. 2023 – present), Managing Director (Mar. 2023 – present) and Vice President (Oct. 2013 – Mar. 2023), Charles Schwab Investment Management, Inc. |
Dana Smith 1965 Treasurer and Chief Financial Officer (Officer of The Charles Schwab Family of Funds, Schwab Investments, Schwab Capital Trust, Schwab Annuity Portfolios, Schwab Strategic Trust and Laudus Trust since 2023) | Treasurer and Chief Financial Officer (Jan. 2023 – present) and Assistant Treasurer (Dec. 2015 – Dec. 2022), Schwab Funds, Laudus Trust and Schwab ETFs; Managing Director (Mar. 2023 – present), Vice President (Mar. 2022 – Mar. 2023) and Director (Oct. 2015 – Mar. 2022), Charles Schwab Investment Management, Inc.; Managing Director (May 2022 – present) and Vice President (Apr. 2022 – May 2022), Charles Schwab & Co., Inc. |
Patrick Cassidy 1964 Vice President and Chief Investment Officer (Officer of The Charles Schwab Family of Funds, Schwab Investments, Schwab Capital Trust, Schwab Annuity Portfolios, Schwab Strategic Trust and Laudus Trust since 2018) | Chief Investment Officer (Oct. 2023 – present) and Vice President (Feb. 2018 – present), Schwab Funds, Laudus Trust and Schwab ETFs; Managing Director (Mar. 2023 – present), Chief Investment Officer (Oct. 2023 – present), and Senior Vice President (Oct. 2012 – Mar. 2023), Charles Schwab Investment Management, Inc. |
William P. McMahon, Jr. 1972 Vice President and Chief Investment Officer (Officer of The Charles Schwab Family of Funds, Schwab Investments, Schwab Capital Trust, Schwab Annuity Portfolios, Schwab Strategic Trust and Laudus Trust since 2021) | Managing Director (Mar. 2023 – present), Senior Vice President (Jan. 2020 – Mar. 2023) and Chief Investment Officer (Jan. 2020 – present) Charles Schwab Investment Management, Inc.; Vice President and Chief Investment Officer (June 2021 – present), Schwab Funds, Laudus Trust and Schwab ETFs; Senior Vice President and Chief Investment Officer – ThomasPartners Strategies (Apr. 2018 – Dec. 2019), Charles Schwab Investment Advisory, Inc.; Senior Vice President and Chief Investment Officer (May 2001 – Apr. 2018), ThomasPartners, Inc. |
Catherine MacGregor 1964 Chief Legal Officer and Secretary, Schwab Funds and Schwab ETFs Chief Legal Officer, Vice President and Clerk, Laudus Trust (Officer of The Charles Schwab Family of Funds, Schwab Investments, Schwab Capital Trust, Schwab Annuity Portfolios and Laudus Trust since 2005; Schwab Strategic Trust since 2009) | Chief Legal Officer (Mar. 2022 – present), Managing Director (Mar. 2023 – present) and Vice President (Sept. 2005 – Mar. 2023), Charles Schwab Investment Management, Inc.; Managing Director (May 2022 – present) and Vice President (Aug. 2005 – May 2022), Charles Schwab & Co., Inc.; Vice President (Dec. 2005 – present) and Chief Legal Officer and Clerk (Mar. 2007 – present), Laudus Trust; Chief Legal Officer and Secretary (Oct. 2021 – present), Vice President (Nov. 2005 – Oct. 2021) and Assistant Secretary (June 2007 – Oct. 2021), Schwab Funds; Chief Legal Officer and Secretary (Oct. 2021 – present), Vice President and Assistant Secretary (Oct. 2009 – Oct. 2021), Schwab ETFs. |
1
Each Trustee shall hold office until the election and qualification of his or her successor, or until he or she dies, resigns or is removed. The retirement policy requires that each independent trustee retire by December 31 of the year in which the Trustee turns 74 or the Trustee’s twentieth year of service as an independent trustee on any trust in the Fund Complex, whichever occurs first.
2
Mr. Bettinger and Mr. Wurster are Interested Trustees. Mr. Bettinger and Mr. Wurster are Interested Trustees because each owns stock of The Charles Schwab Corporation (CSC), the parent company of Charles Schwab Investment Management, Inc., the investment adviser for the trusts in the Fund Complex, and is an employee of Charles Schwab & Co., Inc. (Schwab), the principal underwriter for The Charles Schwab Family of Funds, Schwab Investments, Schwab Capital Trust, Schwab Annuity Portfolios and Laudus Trust.
3
The President, Treasurer and Secretary/Clerk hold office until their respective successors are chosen and qualified or until he or she sooner dies, resigns, is removed or becomes disqualified. Each of the other officers serves at the pleasure of the Board.
31Schwab S&P 500 Index Portfolio | Annual Report
Annual Report | December 31, 2023
Schwab VIT Balanced Portfolio
No Action Required – Notice Regarding Shareholder Report Delivery |
Beginning on July 24, 2024, fund shareholder reports will be streamlined to highlight key information deemed important for investors to assess and monitor their fund investments. Other information, including financial statements, will not appear in the streamlined shareholder reports but will available online and delivered free of charge upon request. |
• If you already receive the full shareholder reports, you will receive the streamlined shareholder reports in the same way that you currently receive the full shareholder reports (either in paper or electronically). |
• If you currently receive a notification when a shareholder report is available on a fund’s website, beginning July 24, 2024, you will begin to receive the streamlined shareholder report (in paper). |
Proxy Voting Policies, Procedures and Results
A description of the proxy voting policies and procedures used to determine how to vote proxies on behalf of the funds is available without charge, upon request, by visiting the Schwab Fund’s website at www.schwabassetmanagement.com/schwabfunds_prospectus, the SEC’s website at www.sec.gov, or by contacting Schwab Funds at 1-877-824-5615.
Information regarding how a fund voted proxies relating to portfolio securities during the most recent twelve-month period ended June 30 is available, without charge, by visiting Schwab’s website at www.schwabassetmanagement.com/schwabfunds_prospectus or the SEC’s website at www.sec.gov.
Investment Adviser: Charles Schwab Investment Management, Inc., dba Schwab Asset Management®
Schwab VIT Balanced Portfolio
The Investment Environment
For the 12-month reporting period ended December 31, 2023, U.S. fixed-income and equity markets rebounded from their losses in 2022. U.S. stocks were volatile early in the reporting period as inflation remained elevated, the U.S. Federal Reserve (Fed) continued to raise interest rates, and the failure of three U.S. regional banks between early March and early May raised concerns about the stability of the banking sector. However, as the year wore on and inflation began to ease, as did the likelihood of further rate increases, stocks staged a strong upswing—particularly in the final two months of the year. International stocks followed the same trajectory for the most part. Outside the United States, the ongoing war between Russia and Ukraine and the Israel-Hamas war that broke out following Hamas’ attack on Israel in early October weighed on the global economy. The U.S. dollar, as measured against a basket of international currencies, vacillated within a relatively small range throughout the year, ending the reporting period slightly weaker than where it began. U.S. Treasury yields soared during the period, peaking in October before falling sharply over the final two months of the year. For the reporting period, the S&P 500® Index, a bellwether for the overall U.S. stock market, returned 26.29%. The MSCI EAFE® Index (Net)*, a broad measure of developed international equity performance, returned 18.24%. Emerging market equities were weaker but still posted gains, with the MSCI Emerging Markets Index (Net)* returning 9.83%. Among fixed-income markets, the Bloomberg US Aggregate Bond Index returned 5.53% and the FTSE non-US Dollar World Government Bond Index returned 5.83%.
Economies around the world grew out of sync as they wrestled with record levels of government debt, rising geopolitical tensions, and weak productivity gains that stifled economic growth. The U.S. economy continued to show unexpected resiliency over the reporting period. Surprisingly robust job growth and strong consumer spending helped propel U.S. gross domestic product (GDP) to a 4.9% annualized growth rate for the third quarter of 2023, up from roughly 2% for the prior three quarters. Inflation remained above the Fed’s historical 2% target over the reporting period but declined in the first half of the year as rents and wage growth eased, profit margins declined, and monetary policy remained restrictive, before ticking up slightly in July through September, declining again in October through November, and then ticking up again in December. The unemployment rate remained low throughout the reporting period.
Asset Class Performance Comparison % returns during the 12 months ended December 31, 2023
Index figures assume dividends and distributions were reinvested. Index figures do not include trading and management costs, which would lower performance. Indices are unmanaged and cannot be invested in directly. Performance results less than one year are not annualized. Past performance is not an indication of future results.
For index definitions, please see the Glossary.
Data source: Index provider websites and Schwab Asset Management.
Nothing in this report represents a recommendation of a security by the investment adviser.
Management views may have changed since the report date.
*
The net version of the index reflects reinvested dividends net of withholding taxes but reflects no deductions for expenses or other taxes.
Schwab VIT Balanced Portfolio | Annual Report2
Schwab VIT Balanced Portfolio
The Investment Environment (continued)
Oil prices were volatile during the reporting period but declined roughly 10% for the year, ending at just over $70 per barrel. Eurozone GDP was flat for the first quarter of 2023, expanded slightly for the second quarter of 2023 bolstered by a moderation of inflationary pressures, and contracted slightly for the third quarter of 2023 as financing conditions remained tight. The United Kingdom posted small gains in GDP growth for the first and second quarters of 2023 and contracted slightly for the third quarter of 2023 as household spending declined. In Japan, GDP rose for the first two quarters of 2023, primarily on rising exports and falling imports, but contracted for the third quarter of 2023 amid elevated cost pressures and mounting global headwinds. Among emerging markets, China’s GDP grew in the first three quarters of 2023 as the government’s various policies seeking to help the economy have offset the impact of a prolonged property crisis and weak trade. India’s GDP also grew throughout the period, driven primarily by robust performance in manufacturing, construction, utilities, and mining, along with strong government spending.
In its efforts to lower inflation, the Fed raised interest rates four times between January and July, increasing the federal funds rate from a range of 4.25% to 4.50% to a range of 5.25% to 5.50%. At its meetings in June, September, October, and December, the Fed maintained the then current rates citing robust economic activity, strong—though moderating—job gains, and low unemployment while acknowledging tighter financial and credit conditions for households and businesses. The Fed also maintained its program to reduce the assets held on its balance sheet, though its balance sheet temporarily spiked in March when the Fed supported banks after the failure of two U.S. regional banks (a third U.S. regional bank failed in early May). Despite that spike, the Fed’s balance sheet assets declined over the reporting period. Central banks outside the United States also battled with persistently high, albeit waning, inflation. After raising rates six times during the year, the European Central Bank held its rate steady since its October meeting as inflation and pricing pressures finally showed signs of easing. Similarly, the Bank of England maintained its key official bank rate since its September meeting, after five rate hikes through August, with borrowing costs at a 15-year high. In contrast, despite inflationary pressures, the Bank of Japan continued to uphold its short-term interest rate target of -0.1%, unchanged since 2016, but maintained its pledge to ramp up stimulus “without hesitation” if needed.
Over the first half of the reporting period, bond yields were volatile, generally following the course of U.S. Treasury yields, with a few short-lived market-moving events. The failure of three U.S. regional banks between early March and early May raised concerns about the stability of the banking sector. In addition, debt ceiling negotiations during the second quarter of 2023 created fear that the federal government could default on its obligations and on August 1, 2023, Fitch Ratings downgraded long-term U.S. debt from AAA to AA+ after indicating earlier in the year that a country refusing to pay its debts in a timely way was not entitled to a AAA rating. Yields rose throughout the third quarter, peaking early in the fourth quarter and driving bond prices to their lowest levels of the year. (Bond yields and bond prices typically move in opposite directions.) Over the final two months of the year yields retreated and bond prices rallied to end the year sharply higher. In October, the yield on the 10-year U.S. Treasury briefly touched 5%—a level not seen since 2007—but declined sharply to end the year at 3.88%, where it began the year. The yield on the three-month U.S. Treasury rose from 4.42% to 5.40% over the reporting period resulting in the yield curve inverting for the reporting period.
3Schwab VIT Balanced Portfolio | Annual Report
Schwab VIT Balanced Portfolio
| Zifan Tang, Ph.D., CFA, Senior Portfolio Manager for Schwab Asset Management, is responsible for the co-management of the fund. Prior to joining Schwab in 2012, Ms. Tang was a product manager at Thomson Reuters and from 1997 to 2009 worked as a portfolio manager at Barclays Global Investors (now known as BlackRock). |
| Drew Hayes, CFA, Portfolio Manager for Schwab Asset Management, is responsible for the co-management of the fund. Mr. Hayes has been with Schwab since 2006. Before becoming a portfolio manager, he spent seven years as a senior fixed income specialist for Schwab Wealth Advisory, Inc. Prior to that, he worked as a bond investment specialist for two years and as a registered representative for two years for Charles Schwab & Co., Inc. |
| Patrick Kwok, CFA, Portfolio Manager for Schwab Asset Management, is responsible for the co-management of the fund. Previously, Mr. Kwok served as an associate portfolio manager from 2012 to 2016. Prior to that, he worked as a fund administration manager, where he was responsible for oversight of sub-advisers, trading, cash management, and fund administration supporting the Charles Schwab Trust Bank Collective Investment Trusts and multi-asset Schwab Funds. Prior to joining Schwab Asset Management in 2008, Mr. Kwok spent two years as an asset operations specialist at Charles Schwab Trust Company. He also worked for one year at State Street Bank & Trust as a portfolio accountant and pricing specialist. |
Schwab VIT Balanced Portfolio | Annual Report4
Schwab VIT Balanced Portfolio as of December 31, 2023
The Schwab VIT Balanced Portfolio (the fund) seeks long-term capital appreciation and income. To pursue its goal, the fund aims to provide diversification across major asset classes, including domestic equity securities, international equity securities, real assets, fixed-income securities, and money market investments, as well as diversification across a range of sub-asset classes within the major asset classes.
The fund is considered a “fund-of-funds” in that it gains exposure to these asset classes by primarily investing in affiliated exchange-traded funds (ETFs) from Schwab Funds. The fund may also invest in affiliated mutual funds from Schwab Funds and unaffiliated third-party ETFs and mutual funds. The fund uses the internally calculated VIT Balanced Composite Index (the composite index) as a performance gauge. The composite index comprises 47% equity, 49% fixed income, and 4% cash.
Market Highlights. For the 12-month reporting period ended December 31, 2023, U.S. fixed-income and equity markets rebounded from their losses in 2022. U.S. stocks were volatile early in the reporting period as inflation remained elevated, the U.S. Federal Reserve (Fed) continued to raise interest rates, and the failure of three U.S. regional banks between early March and early May raised concerns about the stability of the banking sector. However, as the year wore on and inflation began to ease, as did the likelihood of further rate increases, stocks staged a strong upswing—particularly in the final two months of the year. International stocks followed the same trajectory for the most part. Outside the United States, the ongoing war between Russia and Ukraine and the Israel-Hamas war that broke out following Hamas’ attack on Israel in early October weighed on the global economy. The U.S. dollar, as measured against a basket of international currencies, vacillated within a relatively small range throughout the year, ending the reporting period slightly weaker than where it began. U.S. Treasury yields soared during the period, peaking in October before falling sharply over the final two months of the year.
Performance. For the 12-month reporting period ended December 31, 2023, the fund returned 11.96%. The Dow Jones U.S. Total Stock Market Index and the Bloomberg US Aggregate Bond Index, reflecting broad-based U.S. stock and bond market performance, returned 26.06% and 5.53%, respectively. The composite index, described above, returned 12.45%.
Positioning and Strategies. The fund’s allocations were broadly in line with those of the composite index.
The fund’s U.S. equity exposure contributed the most to the total return of the fund. The Schwab U.S. Large-Cap ETF was the largest contributor to the total return of the fund, returning approximately 27% for the reporting period and tracking its comparative index component. The Schwab U.S. Small-Cap ETF also contributed to the total return of the fund, returning approximately 18% for the reporting period and generally tracking its comparative index component.
The fund’s fixed-income exposure also contributed to the total return of the fund. The Schwab U.S. Aggregate Bond ETF and Schwab Short-Term U.S. Treasury ETF contributed to the total return of the fund, returning approximately 6% and 4%, respectively, for the reporting period and generally tracking their comparative index components. The Schwab U.S. TIPS ETF was the smallest contributor to the total return of the fund, returning approximately 4% for the reporting period and tracking its comparative index component.
The fund’s international equity exposure also contributed to the total return of the fund. The Schwab International Equity ETF, Schwab International Small-Cap Equity ETF, and Schwab Emerging Markets Equity ETF contributed to the total return of the fund, returning approximately 18%, 14%, and 9%, respectively, for the reporting period and generally tracking their comparative index components.
The fund’s real estate exposure, the Schwab U.S. REIT ETF, also contributed to the total return of the fund, returning approximately 11% for the reporting period and generally tracking its comparative index component.
Management views and portfolio holdings may have changed since the report date.
5Schwab VIT Balanced Portfolio | Annual Report
Schwab VIT Balanced Portfolio
Performance and Fund Facts as of December 31, 2023
The performance data quoted represents past performance. Past performance does not guarantee future results. Investment returns and principal value will fluctuate so that an investor’s shares may be worth more or less than their original cost. Current performance may be lower or higher than performance data quoted. To obtain performance information current to the most recent month end, please visit www.schwabassetmanagement.com/schwabfunds_prospectus.
Performance of Hypothetical $10,000 Investment (December 31, 2013 – December 31, 2023)1
Average Annual Total Returns1
| | | |
Fund: Schwab VIT Balanced Portfolio (07/25/12) | | | |
| | | |
Bloomberg US Aggregate Bond Index | | | |
VIT Balanced Composite Index | | | |
Fund Category: Moderately Conservative Allocation2 | | | |
Fund Expense Ratio3: 0.58% |
All total return figures on this page assume dividends and distributions were reinvested. Index figures do not include trading and management costs, which would lower performance. Indices are unmanaged and cannot be invested in directly. Performance results less than one year are not annualized.
The components that make up the composite index may vary over time. For index definitions, please see the Glossary.
1
Fund expenses may have been partially absorbed by the investment adviser and its affiliates. Without these reductions, the fund’s returns would have been lower. Fund performance does not reflect the additional fees and expenses imposed by the insurance company under the variable insurance product contract. If those contract fees and expenses were included, the performance would be less than that shown. Please refer to the variable insurance product prospectus for a complete listing of these expenses.
2
Source for category information: Morningstar, Inc. The Morningstar Category return represents all active and index mutual funds and ETFs within the category as of the report date.
3
As stated in the prospectus. Includes 0.05% of acquired fund fees and expenses (AFFE), which are indirect expenses incurred by the fund through its investments in the underlying funds. Reflects the total annual operating expenses without contractual fee waivers. For actual expense ratios during the period, not including AFFE, refer to the Financial Highlights section of the financial statements.
Schwab VIT Balanced Portfolio | Annual Report6
Schwab VIT Balanced Portfolio
Performance and Fund Facts as of December 31, 2023 (continued)
Asset Class Weightings % of Investments1,2
Top Holdings % of Net Assets1,3
Portfolio holdings may have changed since the report date.
1
The fund intends to primarily invest in affiliated Schwab ETFs and may also invest in affiliated Schwab Funds and unaffiliated third-party ETFs and mutual funds (all such ETFs and mutual funds referred to as “underlying funds”). The fund may also invest directly in equity, fixed-income, or other securities or investments, as appropriate, consistent with its investment objectives, strategies, and policies.
2
The percentage may differ from the Portfolio Holdings because the above calculation is based on a percentage of total investments, whereas the calculation in the Portfolio Holdings is based on a percentage of net assets.
3
This list is not a recommendation of any security by the investment adviser.
7Schwab VIT Balanced Portfolio | Annual Report
Schwab VIT Balanced Portfolio
Fund Expenses (Unaudited)
Examples for a $1,000 Investment
As a fund shareholder, you may incur two types of costs: (1) transaction costs; and (2) ongoing costs, including management fees, transfer agent fees, and other fund expenses.
The expense examples below are intended to help you understand your ongoing cost (in dollars) of investing in the fund and to compare this cost with the ongoing cost of investing in other mutual funds. These examples are based on an investment of $1,000 invested for six months beginning July 1, 2023 and held through December 31, 2023.
The Actual Return line in the table below provides information about actual account values and actual expenses. You may use this information, together with the amount you invested, to estimate the expenses that you paid over the period. To do so, simply divide your account value by $1,000 (for example, an $8,600 account value ÷ $1,000 = 8.6), then multiply the result by the number given for the fund under the heading entitled “Expenses Paid During Period.”
The Hypothetical Return line in the table below provides information about hypothetical account values and hypothetical expenses based on the fund’s actual expense ratio and an assumed return of 5% per year before expenses. Because the return used is not an actual return, it may not be used to estimate the actual ending account value or expenses you paid for the period.
You may use this information to compare the ongoing costs of investing in the fund and other funds. To do so, compare this 5% hypothetical example with the 5% hypothetical examples that appear in the shareholder reports of the other funds.
Please note that the expenses shown in the table are meant to highlight your ongoing costs only, and do not reflect any transactional costs. Therefore, the hypothetical return line of the table is useful in comparing ongoing costs only, and will not help you determine the relative total costs of owning different funds. In addition, if these transactional costs were included, your costs would have been higher.
| | | BEGINNING
ACCOUNT VALUE
AT 7/1/23 | ENDING
ACCOUNT VALUE
(NET OF EXPENSES)
| EXPENSES PAID
DURING PERIOD
| EFFECTIVE
EXPENSES PAID
DURING PERIOD
|
Schwab VIT Balanced Portfolio | | | | | | |
| | | | | | |
| | | | | | |
| Based on the most recent six-month expense ratio. |
| Excludes acquired fund fees and expenses, which are indirect expenses incurred by the fund through its investments in underlying funds. |
| Based on the most recent six-month acquired fund fees and expenses and the expense ratio; may differ from the acquired fund fees and expenses and the expense ratio in the prospectus. |
| Includes acquired fund fees and expenses, which are indirect expenses incurred by the fund through its investments in underlying funds. |
| Expenses for the fund are equal to its annualized expense ratio, multiplied by the average account value over the period, multiplied by 184 days in the period, and divided by 365 days in the fiscal year. |
Schwab VIT Balanced Portfolio | Annual Report8
Schwab VIT Balanced Portfolio
Financial Statements
| | | | | | |
|
Net asset value at beginning of period | | | | | | |
Income (loss) from investment operations: | | | | | | |
Net investment income (loss)1 | | | | | | |
Net realized and unrealized gains (losses) | | | | | | |
Total from investment operations | | | | | | |
| | | | | | |
Distributions from net investment income | | | | | | |
Distributions from net realized gains | | | | | | |
| | | | | | |
Net asset value at end of period | | | | | | |
| | | | | | |
|
Ratios to average net assets: | | | | | | |
| | | | | | |
Gross operating expenses3 | | | | | | |
Net investment income (loss) | | | | | | |
| | | | | | |
Net assets, end of period (x 1,000) | | | | | | |
| Calculated based on the average shares outstanding during the period. |
| Per-share amount was less than $0.005. |
| Ratio excludes acquired fund fees and expenses, which are indirect expenses incurred by the fund through its investments in underlying funds. |
| Ratio includes less than 0.005% of non-routine proxy expenses. |
9Schwab VIT Balanced Portfolio | Annual Report
Schwab VIT Balanced Portfolio
Portfolio Holdings as of December 31, 2023
This section shows all the securities in the fund’s portfolio and their values as of the report date, including a summary of the fund’s transactions with its affiliated underlying funds during the period.
The fund files its complete schedule of portfolio holdings with the U.S. Securities and Exchange Commission (SEC) for the first and third quarters of each fiscal year on Form N-PORT Part F. The fund’s Form N-PORT Part F is available on the SEC’s website at www.sec.gov. The fund also makes available its complete schedule of portfolio holdings on the fund’s website at www.schwabassetmanagement.com/schwabfunds_prospectus, typically 60-80 days after the end of the fund’s fiscal quarter.
| | | | | NET CHANGE IN UNREALIZED APPRECIATION (DEPRECIATION) | | BALANCE OF SHARES HELD AT 12/31/23 | |
AFFILIATED UNDERLYING FUNDS 99.9% OF NET ASSETS |
|
|
|
Schwab U.S. Large-Cap ETF | | | | | | | | |
|
Schwab U.S. Small-Cap ETF | | | | | | | | |
| | | | | | | | |
|
International Stocks 15.1% |
|
Schwab International Equity ETF | | | | | | | | |
Schwab International Small-Cap Equity ETF | | | | | | | | |
| | | | | | | | |
|
Schwab Emerging Markets Equity ETF | | | | | | | | |
| | | | | | | | |
|
|
|
| | | | | | | | |
|
|
Inflation-Protected Bond 3.7% |
| | | | | | | | |
Intermediate-Term Bond 36.5% |
Schwab U.S. Aggregate Bond ETF | | | | | | | | |
|
Schwab Short-Term U.S. Treasury ETF | | | | | | | | |
| | | | | | | | |
|
|
Schwab Variable Share Price Money Fund, | | | | | | | | |
Total Affiliated Underlying Funds
(Cost $65,304,172) | | | | | | | | |
Total Investments in Securities
(Cost $65,304,172) | | | | | | | | |
| Distributions received include distributions from net investment income and capital gains, if any, from the underlying funds. Amounts shown are only presented for affiliated underlying funds, which are presented in the corresponding line-item in the Statement of Operations, if applicable (see financial note 2(d) for additional information). |
| The rate shown is the annualized 7-day yield. |
Schwab VIT Balanced Portfolio | Annual Report10
Schwab VIT Balanced Portfolio
Portfolio Holdings as of December 31, 2023 (continued)
| |
| Real Estate Investment Trust |
| Treasury Inflation Protected Securities |
At December 31, 2023, all of the fund’s investment securities were classified as Level 1 (see financial note 2(a) for additional
information).
11Schwab VIT Balanced Portfolio | Annual Report
Schwab VIT Balanced Portfolio
Statement of Assets and Liabilities
|
Investments in securities, at value - affiliated (cost $65,304,172) | | |
| | |
| | |
| | |
| | |
| | |
| | |
|
|
| | |
| | |
| | |
Investment adviser and administrator fees | | |
Independent trustees’ fees | | |
| | |
| | |
| | |
|
|
Capital received from investors | | |
Total distributable earnings | | |
| | |
Schwab VIT Balanced Portfolio | Annual Report12
Schwab VIT Balanced Portfolio
Statement of Operations
For the period January 1, 2023 through December 31, 2023 |
|
Dividends received from securities - affiliated | | |
Interest received from securities - unaffiliated | | |
| | |
|
|
Investment adviser and administrator fees | | |
| | |
Portfolio accounting fees | | |
Independent trustees’ fees | | |
| | |
| | |
| | |
| | |
| | |
| | |
|
REALIZED AND UNREALIZED GAINS (LOSSES) |
Net realized gains on sales of securities - affiliated | | |
Net change in unrealized appreciation (depreciation) on securities - affiliated | | |
Net realized and unrealized gains | | |
Increase in net assets resulting from operations | | |
13Schwab VIT Balanced Portfolio | Annual Report
Schwab VIT Balanced Portfolio
Statement of Changes in Net Assets
For the current and prior report periods
|
| | |
| | | |
Net realized gains (losses) | | | |
Net change in unrealized appreciation (depreciation) | | | |
Increase (decrease) in net assets resulting from operations | | | |
|
DISTRIBUTIONS TO SHAREHOLDERS |
| | | |
TRANSACTIONS IN FUND SHARES |
| | |
| | | | | |
| | | | | |
| | | | | |
| | | | | |
Net transactions in fund shares | | | | | |
|
SHARES OUTSTANDING AND NET ASSETS |
| | |
| | | | | |
| | | | | |
Total increase (decrease) | | | | | |
| | | | | |
Schwab VIT Balanced Portfolio | Annual Report14
Schwab VIT Balanced Portfolio
1. Business Structure of the Fund:
Schwab VIT Balanced Portfolio (the fund) is a series of Schwab Annuity Portfolios (the trust), a no-load, open-end management investment company. The trust is organized as a Massachusetts business trust and is registered under the Investment Company Act of 1940, as amended (the 1940 Act). The list below shows all the funds in the trust as of the end of the period, including the fund discussed in this report, which is highlighted:
SCHWAB ANNUITY PORTFOLIOS |
Schwab Government Money Market Portfolio | |
Schwab S&P 500 Index Portfolio | |
Schwab VIT Balanced Portfolio | |
Schwab VIT Balanced with Growth Portfolio | |
Schwab VIT Growth Portfolio | |
The fund is considered a “fund of funds” because it invests in other exchange traded-funds (ETFs) or mutual funds. The fund seeks to achieve its investment objective by investing primarily in affiliated Schwab ETFs. The fund may also invest in affiliated Schwab mutual funds, and unaffiliated third-party ETFs and mutual funds (referred to herein as unaffiliated funds and, together with Schwab ETFs and Schwab mutual funds, as the "underlying funds"). The fund invests in the underlying funds in accordance with its target portfolio allocation.
The fund offers one share class. Shares are bought and sold at closing net asset value per share (NAV), which is the price for all outstanding shares of the fund. Each share has a par value of 1/1,000 of a cent, and the fund’s Board of Trustees (the Board) may authorize the issuance of as many shares as necessary.
The fund is available exclusively as an investment vehicle for variable annuity and variable life insurance contracts offered by separate accounts of participating life insurance companies, and in the future may be offered to pension and retirement plans qualified under the Internal Revenue Code, as amended. At December 31, 2023, 100% of the fund’s shares were held through separate accounts of five insurance companies. Subscriptions and redemptions of these insurance separate accounts could have a material impact on the fund.
The fund maintains its own account for purposes of holding assets and accounting, and is considered a separate entity for tax purposes. Within its account, the fund may also keep certain assets in segregated accounts, as required by securities law. The "Fund Complex" includes The Charles Schwab Family of Funds, Schwab Capital Trust, Schwab Investments, Schwab Annuity Portfolios, Schwab Strategic Trust and Laudus Trust.
2. Significant Accounting Policies:The following is a summary of the significant accounting policies the fund uses in its preparation of financial statements. The fund follows the investment company accounting and reporting guidance of the Financial Accounting Standards Board (FASB) Accounting Standard Codification Topic 946 Financial Services — Investment Companies. The accounting policies are in conformity with accounting principles generally accepted in the United States of America (GAAP).
The financial statements of the fund should be read in conjunction with the underlying funds’ financial statements. For more information about the underlying funds’ operations and policies, please refer to those funds’ semiannual and annual reports, which are filed with the U.S. Securities and Exchange Commission (SEC) and are available on the SEC’s website at www.sec.gov.
Pursuant to Rule 2a-5 under the 1940 Act, the Board has designated authority to a Valuation Designee, the fund’s investment adviser, to make fair valuation determinations under adopted procedures, subject to Board oversight. The investment adviser has formed a Pricing Committee to administer the pricing and valuation of portfolio securities and other assets and liabilities as well as to ensure that prices used for internal purposes or provided by third parties reasonably reflect fair value. The Valuation Designee may utilize independent pricing services, quotations from securities and financial instrument dealers and other market sources to determine fair value.
Securities held in the fund’s portfolio are valued every business day. The following valuation policies and procedures are used by the Valuation Designee to value various types of securities:
• Securities traded on an exchange or over-the-counter: Traded securities are valued at the closing value for the day, or, on days when no closing value has been reported, at the mean of the most recent bid and ask quotes.
• Mutual funds: Mutual funds are valued at their respective NAVs.
15Schwab VIT Balanced Portfolio | Annual Report
Schwab VIT Balanced Portfolio
Financial Notes (continued)
2. Significant Accounting Policies (continued):
• Securities for which no quoted value is available: The Valuation Designee has adopted procedures to fair value the fund’s securities when market prices are not “readily available” or are unreliable. For example, a security may be fair valued when it’s de-listed or its trading is halted or suspended; when a security’s primary pricing source is unable or unwilling to provide a price; or when a security’s primary trading market is closed during regular market hours. Fair value determinations are made in good faith in accordance with adopted valuation procedures. The Valuation Designee considers a number of factors, including unobservable market inputs, when arriving at fair value. The Valuation Designee may employ methods such as the review of related or comparable assets or liabilities, related market activities, recent transactions, market multiples, book values, transactional back-testing, disposition analysis and other relevant information. Due to the subjective and variable nature of fair value pricing, there can be no assurance that the fund could obtain the fair value assigned to the security upon the sale of such security.
In accordance with the authoritative guidance on fair value measurements and disclosures under GAAP, the fund discloses the fair value of its investments in a hierarchy that prioritizes the significant inputs to valuation methods used to measure the fair value. The hierarchy gives the highest priority to valuations based upon unadjusted quoted prices in active markets for identical assets or liabilities (Level 1 measurements) and the lowest priority to valuations based upon unobservable inputs that are significant to the valuation (Level 3 measurements). If inputs used to measure the financial instruments fall within different levels of the hierarchy, the categorization is based on the lowest level input that is significant to the valuation. If it is determined that either the volume and/or level of activity for an asset or liability has significantly decreased (from normal conditions for that asset or liability) or price quotations or observable inputs are not associated with orderly transactions, increased analysis and the Valuation Designee’s judgment will be required to estimate fair value.
The three levels of the fair value hierarchy are as follows:
• Level 1 — quoted prices in active markets for identical investments — Investments whose values are based on quoted market prices in active markets. These generally include active listed equities, mutual funds, and ETFs. Underlying funds are classified as Level 1 prices, without consideration to the classification level of the underlying securities held which could be Level 1, Level 2 or Level 3 in the fair value hierarchy.
• Level 2 — other significant observable inputs (including quoted prices for similar securities, interest rates, prepayment speeds, credit risk, etc.) — Investments that trade in markets that are not considered to be active, but whose values are based on quoted market prices, dealer quotations or valuations provided by alternative pricing sources supported by observable inputs are classified as Level 2 prices. These generally include U.S. government and sovereign obligations, most government agency securities, investment-grade corporate bonds, certain mortgage products, less liquid listed equities, and state, municipal and provincial obligations.
• Level 3 — significant unobservable inputs (including the Valuation Designee’s assumptions in determining the fair value of investments) — Investments whose values are classified as Level 3 prices have significant unobservable inputs, as they may trade infrequently or not at all. When observable prices are not readily available for these securities, one or more valuation methods are used for which sufficient and reliable data is available. The inputs used in estimating the value of Level 3 prices may include the original transaction price, quoted prices for similar securities or assets in active markets, completed or pending third-party transactions in the underlying investment or comparable issuers, and changes in financial ratios or cash flows. Level 3 prices may also be adjusted to reflect illiquidity and/or non-transferability, with the amount of such discount estimated in the absence of market information. Assumptions used due to the lack of observable inputs may significantly impact the resulting fair value and therefore the fund’s results of operations.
The inputs or methodology used for valuing securities are not necessarily an indication of the risk associated with investing in those securities.
The levels associated with valuing the fund’s investments as of December 31, 2023, are disclosed in the fund’s Portfolio Holdings.
(b) Accounting Policies for certain Portfolio Investments (if held):
Securities Lending: Under the trust’s Securities Lending Program, the fund (lender) may make short-term loans of its securities to another party (borrower) to generate additional revenue for the fund. The borrower pledges collateral in the form of cash, securities issued or fully guaranteed by the U.S. government or foreign governments, or letters of credit issued by a bank. Collateral at the individual loan level is required to be maintained on a daily marked-to-market basis in an amount at least equal to the current value of the securities loaned. The lending agent provides the fund with indemnification against borrower default (the borrower fails to return the security on loan) reducing the risk of loss as a result of default. The cash collateral of securities loaned is currently invested in money market portfolios operating pursuant to Rule 2a-7 under the 1940 Act. The fund bears the risk of loss with
Schwab VIT Balanced Portfolio | Annual Report16
Schwab VIT Balanced Portfolio
Financial Notes (continued)
2. Significant Accounting Policies (continued):
respect to the investment of cash collateral. The terms of the securities lending agreement allow the fund or the lending agent to terminate any loan at any given time and the securities must be returned within the earlier of the standard trade settlement period or the specified time period under the relevant securities lending agreement. Securities lending income, as disclosed in the fund’s Statement of Operations, if applicable, represents the income earned from the investment of the cash collateral plus any fees paid by borrowers, less the fees paid to the lending agent and broker rebates which are subject to adjustments pursuant to the securities lending agreement. On loans not collateralized by cash, a fee is received from the borrower, and is allocated between the fund and the lending agent. The aggregate fair value of securities loaned will not at any time exceed one-third of the total assets of the fund, including collateral received from the loan. Securities lending fees paid to the unaffiliated lending agents start at 9% of gross lending revenue, with subsequent breakpoints to a low of 5%. In this context, the gross lending revenue equals the income received from the investment of cash collateral and fees paid by borrowers less any rebates paid to the borrowers. Any expenses charged by the cash collateral fund are in addition to these fees. All remaining revenue is retained by the fund, as applicable. No portion of lending revenue is paid to or retained by the investment adviser or any of its affiliates.
As of December 31, 2023, the fund had no securities on loan.
Cash Investments: The fund may invest a portion of its assets in cash. Cash includes cash bank balances in an interest-bearing demand deposit account with maturity on demand by the fund.
(c) Security Transactions:
Security transactions are recorded as of the date the order to buy or sell the security is executed. Realized gains and losses from security transactions are based on the identified costs of the securities involved.
Interest income is recorded as it accrues. Dividends and distributions from portfolio securities and underlying funds are recorded on the date they are effective (the ex-dividend date). Any distributions from underlying funds are recorded in accordance with the character of the distributions as designated by the underlying funds.
Expenses that are specific to the fund are charged directly to the fund. Expenses that are common to more than one fund in the trusts generally are allocated among those funds in proportion to their average daily net assets. The fund bears its share of the acquired fund fees and expenses of the underlying funds, which are indirect expenses incurred by the fund through its investments in the underlying funds. Such expenses are reflected in the net asset values of the underlying funds.
(f) Distributions to Shareholders:
The fund makes distributions from net investment income and net realized capital gains, if any, once a year. To receive a distribution, you must be a registered shareholder on the record date. Distributions are paid to shareholders on the payable date.
(g) Accounting Estimates:
The accounting policies described in this report conform to GAAP. Notwithstanding this, shareholders should understand that in order to follow these principles, fund management has to make estimates and assumptions that affect the information reported in the financial statements. It’s possible that once the results are known, they may turn out to be different from these estimates and these differences may be material.
(h) Federal Income Taxes:
The fund intends to meet federal income and excise tax requirements for regulated investment companies under subchapter M of the Internal Revenue Code, as amended. Accordingly, the fund distributes substantially all of its net investment income and net realized capital gains, if any, to the participating insurance company’s (shareholders) separate accounts each year. As long as the fund meets the tax requirements, it is not required to pay federal income tax.
17Schwab VIT Balanced Portfolio | Annual Report
Schwab VIT Balanced Portfolio
Financial Notes (continued)
2. Significant Accounting Policies (continued):
(i) Indemnification:
Under the fund’s organizational documents, the officers and trustees are indemnified against certain liabilities arising out of the performance of their duties to the fund. In addition, in the normal course of business the fund enters into contracts with its vendors and others that provide general indemnifications. The fund’s maximum exposure under these arrangements is unknown as this would involve future claims that may be made against the fund. However, based on experience, the fund expects the risk of loss attributable to these arrangements to be remote.
Effective January 24, 2023, the SEC adopted rule and form amendments to require mutual funds and ETFs to transmit concise and visually engaging streamlined annual and semiannual reports to shareholders that highlight key information deemed important for retail investors to assess and monitor their fund investments. Other information, including financial statements, will no longer appear in a streamlined shareholder report but must be available online, delivered free of charge upon request, and filed on a semiannual basis on Form N-CSR. The rule and form amendments have a compliance date of July 24, 2024. At this time, management is evaluating the impact of these rule and form amendment changes on the content of the current shareholder report and the newly created annual and semiannual streamlined shareholder reports.
Investing in the fund may involve certain risks, as discussed in the fund’s prospectus, including, but not limited to, those described below. Any of these risks could cause an investor to lose money.
Asset Allocation Risk. The fund is subject to the risk that the selection of the underlying funds and the allocation of the fund’s assets among the various asset classes and market segments may cause the fund to underperform other funds with a similar investment objective.
Conflicts of Interest Risk. The investment adviser’s authority to select and substitute underlying funds from a variety of affiliated and unaffiliated mutual funds and ETFs may create a conflict of interest because the fees paid to it and its affiliates by some underlying funds are higher than the fees paid by other underlying funds. The investment adviser also may have an incentive to select an affiliated underlying fund for other reasons, including to increase assets under management or to support new investment strategies. In addition, other conflicts of interest may exist where the best interests of the affiliated underlying fund may not be aligned with those of the fund. However, the investment adviser is a fiduciary to the fund and is legally obligated to act in the fund’s best interests when selecting underlying funds.
Market Risk. Financial markets rise and fall in response to a variety of factors, sometimes rapidly and unpredictably. Markets may be impacted by economic, political, regulatory and other conditions, including economic sanctions and other government actions. In addition, the occurrence of global events, such as war, terrorism, environmental disasters, natural disasters and epidemics may also negatively affect the financial markets. As with any investment whose performance is tied to these markets, the value of an investment in the fund will fluctuate, which means that an investor could lose money over short or long periods.
Securities Lending Risk. Securities lending involves the risk of loss of rights in, or delay in recovery of, the loaned securities if the borrower fails to return the security loaned or becomes insolvent.
ETF Risk. When the fund invests in an ETF, it will bear a proportionate share of the ETF’s expenses. In addition, lack of liquidity in the market for an ETF’s shares can result in its value being more volatile than the underlying portfolio of securities.
Direct Investment Risk. The fund may invest directly in cash, cash equivalents and equity and fixed-income securities, including money market securities, to maintain its allocations. The fund’s direct investment in these securities is subject to the same or similar risks as an underlying fund’s investment in the same securities.
Underlying Fund Investment Risk. Before investing in the fund, investors should assess the risks associated with the underlying funds in which the fund may invest, which include any combination of the risks described below.
• Equity Risk. The prices of equity securities rise and fall daily. These price movements may result from factors affecting individual companies, industries or the securities market as a whole. In addition, equity markets tend to move in cycles, which may cause stock prices to fall over short or extended periods of time.
• Market Capitalization Risk. Securities issued by companies of different market capitalizations tend to go in and out of favor based on market and economic conditions. During a period when securities of a particular market capitalization fall behind other types of investments, an underlying fund’s performance could be impacted.
Schwab VIT Balanced Portfolio | Annual Report18
Schwab VIT Balanced Portfolio
Financial Notes (continued)
3. Risk Factors (continued):
• Foreign Investment Risk. An underlying fund’s investments in securities of foreign issuers involve certain risks that may be greater than those associated with investments in securities of U.S. issuers. These include risks of adverse changes in foreign economic, political, regulatory and other conditions; changes in currency exchange rates or exchange control regulations (including limitations on currency movements and exchanges); the imposition of economic sanctions or other government restrictions; differing accounting, auditing, financial reporting and legal standards and practices; differing securities market structures; and higher transaction costs. These risks may negatively impact the value or liquidity of an underlying fund’s investments, and could impair the underlying fund’s ability to meet its investment objective or invest in accordance with its investment strategy. There is a risk that investments in securities denominated in, and/or receiving revenues in, foreign currencies will decline in value relative to the U.S. dollar or, in the case of hedging positions, that the U.S. dollar will decline in value relative to the currency hedged, resulting in the dollar value of an underlying fund’s investment being adversely affected.
• Emerging Markets Risk. Emerging market countries may be more likely to experience political turmoil or rapid changes in market or economic conditions than more developed countries. Emerging market countries often have less uniformity in accounting, auditing, financial reporting and recordkeeping requirements and greater risk associated with the custody of securities. In addition, the financial stability of issuers (including governments) in emerging market countries may be more precarious than in developed countries. As a result, there may be an increased risk of illiquidity and price volatility associated with an underlying fund’s investments in emerging market countries, which may be magnified by currency fluctuations relative to the U.S. dollar, and, at times, it may be difficult to value such investments.
• Growth Investing Risk. Certain of the underlying funds pursue a “growth style” of investing. Growth investing focuses on a company’s prospects for growth of revenue and earnings. If a company’s earnings or revenues fall short of expectations, its stock price may fall dramatically. Growth stocks also can perform differently from the market as a whole and other types of stocks and can be more volatile than other types of stocks. Since growth companies usually invest a high portion of earnings in their business, they may lack the dividends of value stocks that can cushion stock prices in a falling market. Growth stocks may also be more expensive relative to their earnings or assets compared to value or other stocks.
• Value Investing Risk. Certain of the underlying funds may pursue a “value style” of investing. Value investing focuses on companies whose stocks appear undervalued in light of factors such as the company’s earnings, book value, revenues or cash flow. If an underlying fund’s investment adviser’s (or sub-adviser’s) assessment of a company’s value or prospects for exceeding earnings expectations or market conditions is wrong, the underlying fund could suffer losses or produce poor performance relative to other funds. In addition, “value stocks” can continue to be undervalued by the market for long periods of time.
• Fixed-Income Risk. Interest rates rise and fall over time, which will affect an underlying fund’s yield and share price. A change in a central bank’s monetary policy or economic conditions, among other things, may result in a change in interest rates. A rise in interest rates could cause an underlying fund’s share price to fall. The credit quality of a portfolio investment could also cause an underlying fund’s share price to fall. An underlying fund could lose money if the issuer or guarantor of a portfolio investment or the counterparty to a derivatives contract fails to make timely principal or interest payments or otherwise honor its obligations. Fixed-income securities may be paid off earlier or later than expected. Either situation could cause an underlying fund to hold securities paying lower-than-market rates of interest, which could hurt an underlying fund’s yield or share price. Below investment-grade bonds (junk bonds) involve greater credit risk, are more volatile, involve greater risk of price declines and may be more susceptible to economic downturns than investment-grade securities.
• Interest Rate Risk. Interest rates rise and fall over time. As with any investment whose yield reflects current interest rates, an underlying fund’s yield will change over time. During periods when interest rates are low, an underlying fund’s yield (and total return) also may be low. Changes in interest rates also may affect an underlying fund’s share price: a rise in interest rates generally causes an underlying fund’s share price to fall. The longer an underlying fund’s portfolio duration, the more sensitive to interest rate movements its share price is likely to be. Also, a change in a central bank’s monetary policy or economic conditions, among other things, may result in a change in interest rates, which could have sudden and unpredictable effects on the markets and significantly impact the value of fixed-income securities in which the underlying fund invests.
• Credit Risk. A decline in the credit quality of an issuer or guarantor of a portfolio investment could cause an underlying fund to lose money or underperform. An underlying fund could lose money if the issuer or guarantor of a portfolio investment fails to make timely principal or interest payments or otherwise honor its obligations.
19Schwab VIT Balanced Portfolio | Annual Report
Schwab VIT Balanced Portfolio
Financial Notes (continued)
3. Risk Factors (continued):
• Prepayment and Extension Risk. Certain fixed income securities are subject to the risk that the securities may be paid off earlier or later than expected, especially during periods of falling or rising interest rates, respectively. Prepayments of obligations could cause an underlying fund to forgo future interest income on the portion of the security’s principal repaid early and force the underlying fund to reinvest that money at the lower prevailing interest rates. Extensions of obligations could cause the fund to exhibit additional volatility and hold securities paying lower-than-market rates of interest. Either case could hurt the underlying fund’s performance.
• U.S. Government Securities Risk. Some of the U.S. government securities that the underlying funds invest in are not backed by the full faith and credit of the U.S. government, which means they are neither issued nor guaranteed by the U.S. Treasury. Issuers such as the Federal Home Loan Banks (FHLB) maintain limited access to credit lines from the U.S. Treasury. Certain securities, such as obligations issued by the Federal Farm Credit Banks Funding Corporation, are supported solely by the credit of the issuer. There can be no assurance that the U.S. government will provide financial support to securities of its agencies and instrumentalities if it is not obligated to do so under law. Also, any government guarantees on securities the underlying funds own do not extend to shares of the underlying funds themselves.
• Real Estate Investment Risk. An underlying fund in which the fund may invest may have a policy of concentrating its investments in real estate companies and companies related to the real estate industry. As such, an underlying fund is subject to risks associated with the direct ownership of real estate securities and the fund’s investment in such an underlying fund is subject to risks associated with the direct ownership of real estate securities and an investment in the underlying fund will be closely linked to the performance of the real estate markets. These risks include, among others, declines in the value of real estate; risks related to general and local economic conditions; possible lack of availability of mortgage funds or other limits to accessing the credit or capital markets; defaults by borrowers or tenants, particularly during an economic downturn; and changes in interest rates.
• Real Estate Investment Trusts (REITs) Risk. An underlying fund may invest in REITs. An underlying fund’s investments in REITs will be subject to the risks associated with the direct ownership of real estate, including fluctuations in the value of underlying properties, defaults by borrowers or tenants, changes in interest rates and risks related to general or local economic conditions. REITs are also subject to certain additional risks. For example, equity REITs may be affected by changes in the value of the underlying properties owned by the trusts, and mortgage REITs may be affected by the quality of any credit extended. Further, REITs may have their investments in relatively few properties, a small geographic area or a single property type. In addition, REITs have their own expenses, and the underlying fund will bear a proportionate share of those expenses.
• Mortgage-Backed and Mortgage Pass-Through Securities Risk. Mortgage-backed securities tend to increase in value less than other debt securities when interest rates decline, but are subject to similar or greater risk of decline in fair value during periods of rising interest rates. Certain of the mortgage-backed securities in which an underlying fund may invest are issued or guaranteed by agencies or instrumentalities of the U.S. government but are not backed by the full faith and credit of the U.S. government. There can be no assurance that the U.S. government would provide financial support to its agencies or instrumentalities where it was not obligated to do so which can cause an underlying fund to lose money or underperform. The risks of investing in mortgage-backed securities include, among others, interest rate risk, credit risk, prepayment risk and extension risk. Transactions in mortgage pass-through securities often occur through to-be-announced (TBA) transactions. An underlying fund could lose money or underperform if a TBA counterparty defaults or goes bankrupt.
• Portfolio Turnover Risk. Certain of the underlying funds may buy and sell portfolio securities actively. If they do, their portfolio turnover rate and transaction costs will rise, which may lower the underlying fund’s performance and may increase the likelihood of capital gains distributions.
• Liquidity Risk. An underlying fund may be unable to sell certain securities, such as illiquid securities, readily at a favorable time or price, or the underlying fund may have to sell them at a loss.
• Derivatives Risk. An underlying fund’s use of derivative instruments involves risks different from, or possibly greater than, the risks associated with investing directly in securities and other traditional investments. An underlying fund’s use of derivatives could reduce the underlying fund’s performance, increase its volatility, and could cause the underlying fund to lose more than the initial amount invested. In addition, investments in derivatives may involve leverage, which means a small percentage of assets invested in derivatives can have a disproportionately large impact on an underlying fund.
• Securities Lending Risk. Certain underlying funds engage in securities lending, which involves the risk of loss of rights in, or delay in recovery of, the loaned securities if the borrower fails to return the security loaned or becomes insolvent.
Schwab VIT Balanced Portfolio | Annual Report20
Schwab VIT Balanced Portfolio
Financial Notes (continued)
3. Risk Factors (continued):
• Management Risk. An underlying fund may be an actively managed mutual fund. Any actively managed mutual fund is subject to the risk that its investment adviser (or sub-adviser(s)) will make poor security selections. An underlying fund’s adviser applies its own investment techniques and risk analyses in making investment decisions for the fund, but there can be no guarantee that they will produce the desired results.
• Investment Style Risk. Certain underlying funds seek to track the performance of various segments of the stock market, as measured by their respective indices. Such underlying funds follow these stocks during upturns as well as downturns. Because of their indexing strategy, these underlying funds do not take steps to reduce market exposure or to lessen the effects of a declining market. In addition, because of an underlying fund’s expenses, the underlying fund’s performance is normally below that of the index. Errors relating to an index may occur from time to time and may not be identified by the underlying fund’s index provider for a period of time. In addition, market disruptions could cause delays in an underlying fund’s index’s rebalancing schedule. Such errors and/or market disruptions may result in losses for an underlying fund.
• Tracking Error Risk. An underlying fund may seek to track the performance of its benchmark index, although it may not be successful in doing so. The divergence between the performance of a fund and its benchmark index, positive or negative, is called “tracking error.” Tracking error can be caused by many factors and it may be significant.
• Concentration Risk. To the extent that an underlying fund’s portfolio is concentrated in the securities of issuers in a particular market, industry, group of industries, sector or asset class, the underlying fund may be adversely affected by the performance of those securities, may be subject to increased price volatility and may be more vulnerable to adverse economic, market, political, or regulatory occurrences affecting that market, industry, group of industries, sector or asset class.
• Commodity Risk. To the extent that an underlying fund invests in commodity-linked derivative instruments, it may subject the underlying fund to greater volatility than investments in traditional securities. Also, commodity-linked investments may be more volatile and less liquid than the underlying commodity. The value of commodity-linked derivative instruments may be affected by changes in overall market movements, commodity index volatility, changes in interest rates, or factors affecting a particular industry or commodity, such as drought, floods, weather, livestock disease, embargoes, tariffs and international economic, political and other regulatory and market developments. The use of leveraged commodity-linked derivatives creates an opportunity for increased return, but also creates the possibility for a greater loss.
• Money Market Fund Risk. The fund may invest in underlying money market funds that either seek to maintain a stable $1.00 net asset value (“stable share price money market funds”) or that have a share price that fluctuates (“variable share price money market funds”). Although an underlying stable share price money market fund seeks to maintain a stable $1.00 net asset value, it is possible to lose money by investing in such a money market fund. Because the share price of an underlying variable share price money market fund will fluctuate, when the fund sells the shares it owns they may be worth more or less than what the fund originally paid for them. In addition, neither type of money market fund is designed to offer capital appreciation. Certain underlying money market funds may impose a fee upon the sale of shares or may temporarily suspend the ability to sell shares if such fund’s liquidity falls below required minimums.
Please refer to the fund’s prospectus for a more complete description of the principal risks of investing in the fund.
4. Affiliates and Affiliated Transactions:Charles Schwab Investment Management Inc., dba Schwab Asset Management, a wholly owned subsidiary of The Charles Schwab Corporation, serves as the fund’s investment adviser and administrator pursuant to an Investment Advisory and Administration Agreement between the investment adviser and the trust.
For its advisory and administrative services to the fund, the investment adviser is entitled to receive an annual fee, accrued daily and payable monthly, equal to 0.45% of the fund’s average daily net assets.
The investment adviser and its affiliates have agreed with the fund, for so long as the investment adviser serves as the investment adviser to the fund, in which the agreement may only be amended or terminated with approval of the fund’s Board, to limit the total annual fund operating expenses charged, excluding interest, taxes and certain non-routine expenses to 0.58%.
21Schwab VIT Balanced Portfolio | Annual Report
Schwab VIT Balanced Portfolio
Financial Notes (continued)
4. Affiliates and Affiliated Transactions (continued):
The agreement to limit the fund’s total expenses charged is limited to the fund’s direct operating expenses and, therefore, does not apply to acquired fund fees and expenses, which are indirect expenses incurred by the fund through its investments in the underlying funds.
Investments in Affiliates
The fund may engage in certain transactions involving affiliated parties. Pursuant to an exemptive order issued by the SEC, the fund may invest in other affiliated ETFs and mutual funds. As of December 31, 2023, the Schwab VIT Balanced Portfolio’s ownership percentages of other affiliated funds’ shares are as follows:
Schwab Emerging Markets Equity ETF | |
Schwab International Equity ETF | |
Schwab International Small-Cap Equity ETF | |
Schwab Short-Term U.S. Treasury ETF | |
Schwab U.S. Aggregate Bond ETF | |
Schwab U.S. Large-Cap ETF | |
| |
Schwab U.S. Small-Cap ETF | |
| |
Schwab Variable Share Price Money Fund, Ultra Shares | |
The fund may engage in direct transactions with certain other funds in the Fund Complex in accordance with procedures adopted by the Board pursuant to Rule 17a-7 under the 1940 Act. When one fund is seeking to sell a security that another is seeking to buy, an interfund transaction can allow both funds to benefit by reducing transaction costs. This practice is limited to funds that share the same investment adviser, trustees and/or officers. For the period ended December 31, 2023, the fund’s purchases and sales of securities with other funds in the Fund Complex was $413,438 and $3,103,704 respectively, and includes realized gains of $432,327.
Interfund Borrowing and Lending
Pursuant to an exemptive order issued by the SEC, the fund may enter into interfund borrowing and lending transactions with other funds in the Fund Complex. All loans are for temporary or emergency purposes and the interest rate to be charged will be the average of the overnight repurchase agreement rate and the short-term bank loan rate. All loans are subject to numerous conditions designed to ensure fair and equitable treatment of all participating funds. The interfund lending facility is subject to the oversight and periodic review by the Board. The fund had no interfund borrowing or lending activity during the period.
The Board may include people who are officers and/or directors of the investment adviser or its affiliates. Federal securities law limits the percentage of such “interested persons” who may serve on a trust’s board, and the trust was in compliance with these limitations throughout the report period. The fund did not pay any of these interested persons for their services as trustees, but did pay non-interested persons (independent trustees), as noted in the fund’s Statement of Operations. For information regarding the trustees, please refer to the Trustees and Officers table at the end of this report.
During the period, the fund was a participant with other funds in the Fund Complex in a joint, syndicated, committed $1 billion line of credit (the Syndicated Credit Facility), which matured on September 28, 2023. On September 28, 2023, the Syndicated Credit Facility was amended to run for a new 364 day period with the line of credit amount remaining unchanged, maturing on September 26, 2024. Under the terms of the Syndicated Credit Facility, in addition to the interest charged on any borrowings by the fund, the fund paid a commitment fee of 0.15% per annum on the fund’s proportionate share of the unused portion of the Syndicated Credit Facility.
Schwab VIT Balanced Portfolio | Annual Report22
Schwab VIT Balanced Portfolio
Financial Notes (continued)
6. Borrowing from Banks (continued):
During the period, the fund was a participant with other funds in the Fund Complex in a joint, unsecured, uncommitted $400 million line of credit (the Uncommitted Credit Facility), with State Street Bank and Trust Company, which matured on September 28, 2023. On September 28, 2023, the Uncommitted Credit Facility was amended to run for a new 364 day period with the line of credit amount remaining unchanged, maturing on September 26, 2024. Under the terms of the Uncommitted Credit Facility, the fund pays interest on the amount it borrows. There were no borrowings by the fund from either line of credit during the period.
The fund also has access to custodian overdraft facilities. The fund may have utilized the overdraft facility and incurred an interest expense, which is disclosed in the fund’s Statement of Operations, if any. The interest expense is determined based on a negotiated rate above the current Federal Funds Rate.
7. Purchases and Sales of Investment Securities:For the period ended December 31, 2023, purchases and sales of securities (excluding short-term obligations) were as follows:
As of December 31, 2023, the tax basis cost of the fund’s investments and gross unrealized appreciation and depreciation were as follows:
| | GROSS UNREALIZED
APPRECIATION | GROSS UNREALIZED
DEPRECIATION | NET UNREALIZED
APPRECIATION
(DEPRECIATION) |
| | | | |
| | | | |
| | | | |
As of December 31, 2023, the components of distributable earnings on a tax basis were as follows:
UNDISTRIBUTED
ORDINARY
INCOME | UNDISTRIBUTED
LONG-TERM
CAPITAL GAINS | NET UNREALIZED
APPRECIATION
(DEPRECIATION)
ON INVESTMENTS | |
| | | |
The primary difference between book basis and tax basis unrealized appreciation or unrealized depreciation of investments is the tax deferral of losses on wash sales. The tax cost of the fund’s investments, disclosed above, have been adjusted from their book amounts to reflect these unrealized appreciation or depreciation differences, as applicable.
As of December 31, 2023, the fund had no capital loss carryforwards available to offset future realized capital gains for federal tax purposes. For the fiscal year ended December 31, 2023, the fund had capital loss carryforwards utilized of $402,951.
The tax basis components of distributions paid during the current and prior fiscal years were as follows:
| CURRENT FISCAL YEAR END DISTRIBUTIONS | PRIOR FISCAL YEAR END DISTRIBUTIONS |
| | | | |
| | | | |
Distributions paid to shareholders are based on net investment income and net realized gains determined on a tax basis, which may differ from net investment income and net realized gains for financial reporting purposes. These differences reflect the differing character of certain income items and net realized gains and losses for financial statement and tax purposes, and may result in reclassification among certain capital accounts in the financial statements. The fund may also designate a portion of the amount paid to redeeming shareholders as a distribution for tax purposes.
23Schwab VIT Balanced Portfolio | Annual Report
Schwab VIT Balanced Portfolio
Financial Notes (continued)
8. Federal Income Taxes (continued):
Permanent book and tax basis differences may result in reclassifications between components of net assets as required. The adjustments will have no impact on net assets or the results of operations.
As of December 31, 2023, management has reviewed the tax positions for open periods (for federal purposes, three years from the date of filing and for state purposes, four years from the date of filing) as applicable to the fund, and has determined that no provision for income tax is required in the fund’s financial statements. The fund recognizes interest and penalties, if any, related to unrecognized tax benefits as income tax expense in the Statement of Operations. During the fiscal year ended December 31, 2023, the fund did not incur any interest or penalties.
Management has determined there are no subsequent events or transactions through the date the financial statements were issued that would have materially impacted the financial statements as presented.
Schwab VIT Balanced Portfolio | Annual Report24
Schwab VIT Balanced Portfolio
Report of Independent Registered Public Accounting Firm
To the Board of Trustees of Schwab Annuity Portfolios and Shareholders of Schwab VIT Balanced Portfolio:
Opinion on the Financial Statements and Financial Highlights
We have audited the accompanying statement of assets and liabilities, including the portfolio holdings, of Schwab VIT Balanced Portfolio (the “Fund”), one of the funds constituting Schwab Annuity Portfolios, as of December 31, 2023, the related statement of operations for the year then ended, the statements of changes in net assets for each of the two years in the period then ended, the financial highlights for each of the four years in the period then ended, and the related notes. In our opinion, the financial statements and financial highlights present fairly, in all material respects, the financial position of the Fund as of December 31, 2023, and the results of its operations for the year then ended, the changes in its net assets for each of the two years in the period then ended, and the financial highlights for each of the four years in the period then ended in conformity with accounting principles generally accepted in the United States of America. The financial highlights for the year ended December 31, 2019 were audited by other auditors, whose report, dated February 18, 2020, expressed an unqualified opinion on such financial highlights.
These financial statements and financial highlights are the responsibility of the Fund’s management. Our responsibility is to express an opinion on the Fund’s financial statements and financial highlights based on our audits. We are a public accounting firm registered with the Public Company Accounting Oversight Board (United States) (PCAOB) and are required to be independent with respect to the Fund in accordance with the U.S. federal securities laws and the applicable rules and regulations of the Securities and Exchange Commission and the PCAOB.
We conducted our audits in accordance with the standards of the PCAOB. Those standards require that we plan and perform the audit to obtain reasonable assurance about whether the financial statements and financial highlights are free of material misstatement, whether due to error or fraud. The Fund is not required to have, nor were we engaged to perform, an audit of its internal control over financial reporting. As part of our audits, we are required to obtain an understanding of internal control over financial reporting but not for the purpose of expressing an opinion on the effectiveness of the Fund’s internal control over financial reporting. Accordingly, we express no such opinion.
Our audits included performing procedures to assess the risks of material misstatement of the financial statements and financial highlights, whether due to error or fraud, and performing procedures that respond to those risks. Such procedures included examining, on a test basis, evidence regarding the amounts and disclosures in the financial statements and financial highlights. Our audits also included evaluating the accounting principles used and significant estimates made by management, as well as evaluating the overall presentation of the financial statements and financial highlights. Our procedures included confirmation of securities owned as of December 31, 2023, by correspondence with the custodian and transfer agent. We believe that our audits provide a reasonable basis for our opinion.
Deloitte & Touche LLP
Denver, Colorado
February 16, 2024
We have served as the auditor of one or more investment companies in the Schwab Funds Complex since 2020.
25Schwab VIT Balanced Portfolio | Annual Report
Schwab VIT Balanced Portfolio
Other Federal Tax Information (unaudited)
The fund may elect to pass on the benefits of the foreign tax credit of $35,479 to its shareholders for the fiscal year ended December 31, 2023. The respective foreign source income on the fund is $360,521.
For corporate shareholders, 17.83% of the fund’s dividend distributions paid during the fiscal year ended December 31, 2023, qualify for the corporate dividends received deduction.
For the fiscal year ended December 31, 2023, the fund designates 76.21% of dividend income as business interest income under section 163(j) of the Internal Revenue Code.
Schwab VIT Balanced Portfolio | Annual Report26
Schwab VIT Balanced Portfolio
Liquidity Risk Management Program (unaudited)
The fund has adopted and implemented a liquidity risk management program (the “program”) as required by Rule 22e-4 under the Investment Company Act of 1940, as amended. The fund’s Board of Trustees (the “Board”) has designated the fund’s investment adviser, Charles Schwab Investment Management, Inc., dba Schwab Asset Management, as the administrator of the program. Personnel of the investment adviser or its affiliates conduct the day-to-day operation of the program.
Under the program, the investment adviser manages a fund’s liquidity risk, which is the risk that the fund could not meet shareholder redemption requests without significant dilution of remaining shareholders’ interests in the fund. The program is reasonably designed to assess and manage a fund’s liquidity risk, taking into consideration the fund’s investment strategy and the liquidity of its portfolio investments during normal and reasonably foreseeable stressed conditions; its historical redemption history and shareholder concentrations; and its cash holdings and access to other funding sources, including the custodian overdraft facility and lines of credit. The investment adviser’s process of determining the degree of liquidity of each fund’s investments is supported by third-party liquidity assessment vendors.
The fund’s Board reviewed a report at its meeting held on September 19, 2023 prepared by the investment adviser regarding the operation and effectiveness of the program for the period June 1, 2022, through May 31, 2023, which included individual fund liquidity metrics. The report summarized the operation of the program and the information and factors considered by the investment adviser in assessing whether the program has been adequately and effectively implemented with respect to a fund. In addition, the investment adviser provided its assessment that the program had been operating effectively in managing the fund’s liquidity risk.
27Schwab VIT Balanced Portfolio | Annual Report
Schwab VIT Balanced Portfolio
Trustees and Officers
The tables below give information about the trustees and officers of Schwab Annuity Portfolios, which includes the fund covered in this report. The “Fund Complex” includes The Charles Schwab Family of Funds, Schwab Capital Trust, Schwab Investments, Schwab Annuity Portfolios, Schwab Strategic Trust and Laudus Trust. The Fund Complex includes 106 funds.
The address for all trustees and officers is 211 Main Street, San Francisco, CA 94105. You can find more information about the trustees and officers in the fund’s Statement of Additional Information, which is available free by calling 1-877-824-5615.
|
Name, Year of Birth, and Position(s) with the trust (Terms of office, and length of Time Served1) | Principal Occupations During the Past Five Years | Number of Portfolios in Fund Complex Overseen by the Trustee | |
Michael J. Beer 1961 Trustee (Trustee of The Charles Schwab Family of Funds, Schwab Investments, Schwab Capital Trust, Schwab Annuity Portfolios, Schwab Strategic Trust and Laudus Trust since 2022) | Retired. Director, President and Chief Executive Officer (Dec. 2016 – Sept. 2019), Principal Funds (investment management). | | Director (2016 – 2019), Principal Funds, Inc. |
Robert W. Burns 1959 Trustee (Trustee of Schwab Strategic Trust since 2009; The Charles Schwab Family of Funds, Schwab Investments, Schwab Capital Trust, Schwab Annuity Portfolios and Laudus Trust since 2016) | Retired/Private Investor. | | |
Nancy F. Heller 1956 Trustee (Trustee of The Charles Schwab Family of Funds, Schwab Investments, Schwab Capital Trust, Schwab Annuity Portfolios, Schwab Strategic Trust and Laudus Trust since 2018) | | | |
David L. Mahoney 1954 Trustee (Trustee of The Charles Schwab Family of Funds, Schwab Investments, Schwab Capital Trust, Schwab Annuity Portfolios and Laudus Trust since 2011; Schwab Strategic Trust since 2016) | | | Director (2004 – present), Corcept Therapeutics Incorporated Director (2009 – 2021), Adamas Pharmaceuticals, Inc. Director (2003 – 2019), Symantec Corporation |
Jane P. Moncreiff 1961 Trustee (Trustee of The Charles Schwab Family of Funds, Schwab Investments, Schwab Capital Trust, Schwab Annuity Portfolios, Schwab Strategic Trust and Laudus Trust since 2019) | Consultant (2018 – present), Fulham Advisers LLC (management consulting); Chief Investment Officer (2009 – 2017), CareGroup Healthcare System, Inc. (healthcare). | | |
Schwab VIT Balanced Portfolio | Annual Report28
Schwab VIT Balanced Portfolio
Independent Trustees (continued) |
Name, Year of Birth, and Position(s) with the trust (Terms of office, and length of Time Served1) | Principal Occupations During the Past Five Years | Number of Portfolios in Fund Complex Overseen by the Trustee | |
Kimberly S. Patmore 1956 Trustee (Trustee of The Charles Schwab Family of Funds, Schwab Investments, Schwab Capital Trust, Schwab Annuity Portfolios, Schwab Strategic Trust and Laudus Trust since 2016) | Consultant (2008 – present), Patmore Management Consulting (management consulting). | | |
J. Derek Penn 1957 Trustee (Trustee of The Charles Schwab Family of Funds, Schwab Investments, Schwab Capital Trust, Schwab Annuity Portfolios, Schwab Strategic Trust and Laudus Trust since 2021) | Head of Equity Sales and Trading (2006 – 2018), BNY Mellon (financial services). | | |
|
Name, Year of Birth, and Position(s) with the trust (Terms of office, and length of Time Served1) | Principal Occupations During the Past Five Years | Number of Portfolios in Fund Complex Overseen by the Trustee | |
Walter W. Bettinger II2 1960 Chairman and Trustee (Trustee of The Charles Schwab Family of Funds, Schwab Investments, Schwab Capital Trust and Schwab Annuity Portfolios since 2008; Schwab Strategic Trust since 2009; Laudus Trust since 2010) | Co-Chairman of the Board (July 2022 – present), Director and Chief Executive Officer (Oct. 2008 – present) and President (Feb. 2007 – Oct. 2021), The Charles Schwab Corporation; President and Chief Executive Officer (Oct. 2008 – Oct. 2021) and Director (May 2008 – Oct. 2021), Charles Schwab & Co., Inc.; Co-Chairman of the Board (July 2022 – present) and Director (Apr. 2006 – present), Charles Schwab Bank, SSB; Co-Chairman of the Board (July 2022 – present) and Director (Nov. 2017 – present), Charles Schwab Premier Bank, SSB; Co-Chairman of the Board (July 2022 – present) and Director (July 2019 – present), Charles Schwab Trust Bank; Director (May 2008 – present), Chief Executive Officer (Aug. 2017 – present) and President (Aug. 2017 – Nov. 2021), Schwab Holdings, Inc.; Manager (Sept. 2023 – present), TD Ameritrade Holding LLC; Director (Oct. 2020 – Aug. 2023), TD Ameritrade Holding Corporation; Director (July 2016 – Oct. 2021), Charles Schwab Investment Management, Inc. | | Director (2008 – present), The Charles Schwab Corporation |
Richard A. Wurster2 1973 Trustee (Trustee of The Charles Schwab Family of Funds, Schwab Investments, Schwab Capital Trust, Schwab Annuity Portfolios, Schwab Strategic Trust and Laudus Trust since 2022) | President (Oct. 2021 – present) and Executive Vice President – Schwab Asset Management Solutions (Apr. 2019 – Oct. 2021), The Charles Schwab Corporation; President, Director (Oct. 2021 – present), Executive Vice President – Schwab Asset Management Solutions (July 2019 – Oct. 2021) and Senior Vice President – Advisory (May 2016 – July 2019), Charles Schwab & Co., Inc.; President (Nov. 2021 – present), Schwab Holdings, Inc.; Director (Oct. 2021 – present) and Chief Executive Officer (Nov. 2019 – Jan. 2022), Charles Schwab Investment Management, Inc.; Director, Chief Executive Officer and President (Mar. 2018 – Oct. 2022), Charles Schwab Investment Advisory, Inc.; Chief Executive Officer (July 2016 – Apr. 2018) and President (Mar. 2017 – Apr. 2018), ThomasPartners, Inc.; Chief Executive Officer (July 2016 – Apr. 2018), Windhaven Investment Management, Inc. | | |
29Schwab VIT Balanced Portfolio | Annual Report
Schwab VIT Balanced Portfolio
|
Name, Year of Birth, and Position(s) with the trust (Terms of office, and length of Time Served3) | Principal Occupations During the Past Five Years |
Omar Aguilar 1970 Chief Executive Officer, President and Chief Investment Officer (Officer of The Charles Schwab Family of Funds, Schwab Investments, Schwab Capital Trust, Schwab Annuity Portfolios, Schwab Strategic Trust and Laudus Trust since 2011) | Chief Executive Officer (Jan. 2022 – present), President (Oct. 2023 – present), (Chief Investment Officer (Apr. 2011 – present) and Senior Vice President (Apr. 2011 – Jan. 2022), Charles Schwab Investment Management, Inc.; Director, Chief Executive Officer and President (Oct. 2022 – present), Charles Schwab Investment Advisory, Inc.; Chief Executive Officer (Sept. 2023 – present), President (Oct. 2023 – present), Chief Investment Officer (June 2011 – present) and Vice President (June 2011 – Sept. 2023), Schwab Funds, Laudus Trust and Schwab ETFs. |
Mark Fischer 1970 Chief Operating Officer (Officer of The Charles Schwab Family of Funds, Schwab Investments, Schwab Capital Trust, Schwab Annuity Portfolios, Schwab Strategic Trust and Laudus Trust since 2013) | Chief Operating Officer (Dec. 2020 – present) and Treasurer and Chief Financial Officer (Jan. 2016 – Dec. 2022), Schwab Funds, Laudus Trust and Schwab ETFs; Chief Financial Officer (Mar. 2020 – present), Chief Operating Officer (Oct. 2023 – present), Managing Director (Mar. 2023 – present) and Vice President (Oct. 2013 – Mar. 2023), Charles Schwab Investment Management, Inc. |
Dana Smith 1965 Treasurer and Chief Financial Officer (Officer of The Charles Schwab Family of Funds, Schwab Investments, Schwab Capital Trust, Schwab Annuity Portfolios, Schwab Strategic Trust and Laudus Trust since 2023) | Treasurer and Chief Financial Officer (Jan. 2023 – present) and Assistant Treasurer (Dec. 2015 – Dec. 2022), Schwab Funds, Laudus Trust and Schwab ETFs; Managing Director (Mar. 2023 – present), Vice President (Mar. 2022 – Mar. 2023) and Director (Oct. 2015 – Mar. 2022), Charles Schwab Investment Management, Inc.; Managing Director (May 2022 – present) and Vice President (Apr. 2022 – May 2022), Charles Schwab & Co., Inc. |
Patrick Cassidy 1964 Vice President and Chief Investment Officer (Officer of The Charles Schwab Family of Funds, Schwab Investments, Schwab Capital Trust, Schwab Annuity Portfolios, Schwab Strategic Trust and Laudus Trust since 2018) | Chief Investment Officer (Oct. 2023 – present) and Vice President (Feb. 2018 – present), Schwab Funds, Laudus Trust and Schwab ETFs; Managing Director (Mar. 2023 – present), Chief Investment Officer (Oct. 2023 – present), and Senior Vice President (Oct. 2012 – Mar. 2023), Charles Schwab Investment Management, Inc. |
William P. McMahon, Jr. 1972 Vice President and Chief Investment Officer (Officer of The Charles Schwab Family of Funds, Schwab Investments, Schwab Capital Trust, Schwab Annuity Portfolios, Schwab Strategic Trust and Laudus Trust since 2021) | Managing Director (Mar. 2023 – present), Senior Vice President (Jan. 2020 – Mar. 2023) and Chief Investment Officer (Jan. 2020 – present) Charles Schwab Investment Management, Inc.; Vice President and Chief Investment Officer (June 2021 – present), Schwab Funds, Laudus Trust and Schwab ETFs; Senior Vice President and Chief Investment Officer – ThomasPartners Strategies (Apr. 2018 – Dec. 2019), Charles Schwab Investment Advisory, Inc.; Senior Vice President and Chief Investment Officer (May 2001 – Apr. 2018), ThomasPartners, Inc. |
Catherine MacGregor 1964 Chief Legal Officer and Secretary, Schwab Funds and Schwab ETFs Chief Legal Officer, Vice President and Clerk, Laudus Trust (Officer of The Charles Schwab Family of Funds, Schwab Investments, Schwab Capital Trust, Schwab Annuity Portfolios and Laudus Trust since 2005; Schwab Strategic Trust since 2009) | Chief Legal Officer (Mar. 2022 – present), Managing Director (Mar. 2023 – present) and Vice President (Sept. 2005 – Mar. 2023), Charles Schwab Investment Management, Inc.; Managing Director (May 2022 – present) and Vice President (Aug. 2005 – May 2022), Charles Schwab & Co., Inc.; Vice President (Dec. 2005 – present) and Chief Legal Officer and Clerk (Mar. 2007 – present), Laudus Trust; Chief Legal Officer and Secretary (Oct. 2021 – present), Vice President (Nov. 2005 – Oct. 2021) and Assistant Secretary (June 2007 – Oct. 2021), Schwab Funds; Chief Legal Officer and Secretary (Oct. 2021 – present), Vice President and Assistant Secretary (Oct. 2009 – Oct. 2021), Schwab ETFs. |
1
Each Trustee shall hold office until the election and qualification of his or her successor, or until he or she dies, resigns or is removed. The retirement policy requires that each independent trustee retire by December 31 of the year in which the Trustee turns 74 or the Trustee’s twentieth year of service as an independent trustee on any trust in the Fund Complex, whichever occurs first.
2
Mr. Bettinger and Mr. Wurster are Interested Trustees. Mr. Bettinger and Mr. Wurster are Interested Trustees because each owns stock of The Charles Schwab Corporation (CSC), the parent company of Charles Schwab Investment Management, Inc., the investment adviser for the trusts in the Fund Complex, and is an employee of Charles Schwab & Co., Inc. (Schwab), the principal underwriter for The Charles Schwab Family of Funds, Schwab Investments, Schwab Capital Trust, Schwab Annuity Portfolios and Laudus Trust.
3
The President, Treasurer and Secretary/Clerk hold office until their respective successors are chosen and qualified or until he or she sooner dies, resigns, is removed or becomes disqualified. Each of the other officers serves at the pleasure of the Board.
Schwab VIT Balanced Portfolio | Annual Report30
Schwab VIT Balanced Portfolio
Bloomberg US Aggregate Bond Index An index that is a broad-based benchmark measuring the performance of the U.S. investment grade, taxable bond market, including U.S. Treasuries, government-related and corporate bonds, mortgage pass-through securities, commercial mortgage-backed securities, and asset-backed securities that are publicly available for sale in the United States. To be eligible for inclusion in the index, securities must be fixed rate, non-convertible, U.S. dollar-denominated with at least $300 million or more of outstanding face value and have one or more years remaining to maturity. The index excludes certain types of securities, including tax-exempt state and local government series bonds, structured notes embedded with swaps or other special features, private placements, floating rate securities, inflation-linked bonds and Eurobonds. The index is market capitalization weighted and the securities in the index are updated on the last business day of each month.
Bloomberg US Treasury 1–3 Year Index An index which includes all publicly-issued U.S. Treasury securities that have a remaining maturity of greater than or equal to one year and less than three years, are rated investment grade, and have $300 million or more of outstanding face value. The securities in the index must be denominated in U.S. dollars and must be fixed-rate and non-convertible. The index excludes state and local government series bonds and coupon issues that have been stripped from bonds. The index is market capitalization weighted and the securities in the index are updated on the last business day of each month.
Bloomberg US Treasury 3–10 Year Index An index which includes all publicly-issued U.S. Treasury securities that have a remaining maturity of greater than or equal to three years and less than ten years, are rated investment grade, and have $300 million or more of outstanding face value. The securities in the index must be denominated in U.S. dollars and must be fixed-rate and non-convertible. The index excludes state and local government series bonds and coupon issues that have been stripped from bonds. The index is market capitalization weighted and the securities in the index are updated on the last business day of each month.
Bloomberg US Treasury Bills 1–3 Month Index An index that includes all publicly issued zero-coupon U.S. Treasury Bills that have a remaining maturity of less than 3 months but more than 1 month, are rated investment grade and have $300 million or more of outstanding face value. It excludes zero-coupon STRIPS.
Bloomberg US Treasury Inflation-Linked Bond Index (Series-L) An index which includes all publicly-issued U.S. Treasury Inflation-Protected Securities (TIPS) that have at least one year remaining to maturity, are rated investment grade and have $500 million or more of outstanding face value. The TIPS in the index must be denominated in U.S. dollars and must be fixed-rate and non-convertible. The index is market capitalization weighted and the TIPS in the index are updated on the last business day of each month. TIPS are publicly issued, dollar denominated U.S. Government securities issued by the U.S. Treasury that have principal and interest payments linked to an official inflation measure (as measured by the Consumer Price Index, or CPI) and their payments are supported by the full faith and credit of the United States.
Dow Jones Equity All REIT Capped Index A float-adjusted market cap weighted index that is designed to measure all equity real estate investment trusts (REITs) in the Dow Jones U.S. Total Stock Market Index, as defined by the S&P Dow Jones Indices REIT/RESI Industry Classification Hierarchy, that meet the minimum float market capitalization (FMC) and liquidity thresholds. The aggregate weight of
all companies weighing more than 4.5% cannot exceed 22.5%, and no single company’s weight can exceed 10%. The index is reviewed daily based on each company’s capped market capitalization weight. Daily capping is only performed when the sum of companies with weights greater than 5% exceeds 25%.
Dow Jones U.S. Large-Cap Total Stock Market Index An index that is a subset of the Dow Jones U.S. Total Stock Market Index, and is designed to measure the performance of large-cap U.S. equity securities. The index is a float-adjusted market capitalization weighted index.
Dow Jones U.S. Select REIT Index An index that is a float-adjusted market-capitalization weighted index comprised of income-producing commercial and/or residential real estate investment trusts (REITs). The index excludes mortgage REITs, net-lease REITs, real estate finance companies, mortgage brokers and bankers, commercial and residential real estate brokers and estate agents, homebuilders, large landowners and sub-dividers of unimproved land, hybrid REITs, timber REITs and companies that have more than 25% of their assets in direct mortgage investments.
Dow Jones U.S. Small-Cap Total Stock Market Index An index that is a subset of the Dow Jones U.S. Total Stock Market Index, and is designed to measure the performance of small-cap U.S. equity securities. The index is a float-adjusted market capitalization weighted index.
Dow Jones U.S. Total Stock Market Index An index which includes all U.S. equity issues with readily available prices. The index is a float-adjusted market capitalization weighted index that reflects the shares of securities actually available to investors in the marketplace.
FTSE Developed ex US Index (Net) An index that is comprised of large- and mid-capitalization companies in developed countries outside the United States, as defined by the index provider. The index defines the large- and mid-capitalization universe as approximately the top 90% of the eligible universe. The Net version of the index reflects reinvested dividends net of withholding taxes, but reflects no deductions for expenses or other taxes.
FTSE Developed Small Cap ex US Liquid Index (Net) An index comprised of small-capitalization companies in developed countries outside the United States, as defined by the index provider. The index defines the small-capitalization universe as approximately the bottom 10% of the eligible universe with a minimum free float capitalization of $150 million. The Net version of the index reflects reinvested dividends net of withholding taxes, but reflects no deductions for expenses or other taxes.
FTSE Emerging Index (Net) An index that is comprised of large- and mid-capitalization companies in emerging market countries, as defined by the index provider. The index defines the large- and mid-capitalization universe as approximately the top 90% of the eligible universe. The Net version of the index reflects reinvested dividends net of withholding taxes, but reflects no deductions for expenses or other taxes.
FTSE non-US Dollar World Government Bond Index A market capitalization index that measures the total rate of return performance for the government bonds of 22 countries, excluding the U.S., with a remaining maturity of at least 1 year.
31Schwab VIT Balanced Portfolio | Annual Report
Schwab VIT Balanced Portfolio
MSCI EAFE Index (Net) A free float-adjusted market capitalization index that is designed to measure the equity market performance of developed markets in Europe, Australasia, and the Far East. The Net version of the index reflects reinvested dividends net of withholding taxes, but reflects no deductions for expenses or other taxes; returns are calculated applying dividend withholding rates applicable to non-resident persons who do not benefit from double taxation treaties.
MSCI Emerging Markets Index (Net) A free float-adjusted market capitalization weighted index that is designed to measure equity market performance in the global emerging markets. This series approximates the minimum possible dividend reinvestment. The returns are calculated applying dividend withholding rates applicable to non-resident persons who do not benefit from double taxation treaties.
Russell 2000 Index An index that measures the performance of the 2,000 smallest companies in the Russell 3000 Index. The Russell 3000 Index measures the performance of the largest 3,000 U.S. companies representing approximately 98% of the investable U.S. equity market.
S&P 500 Index An index that is designed to measure the performance of 500 leading publicly traded companies from a broad range of industries.
VIT Balanced Composite Index A custom blended index developed by Schwab Asset Management based on a comparable portfolio asset allocation and calculated using the following portion allocations effective April 28, 2023: 36.3% Bloomberg US Aggregate Bond Index, 9.0% Bloomberg US Treasury 1-3 Year Index, 4.0% Bloomberg US Treasury Bills 1-3 Month Index, 3.7% Bloomberg US Treasury Inflation-Linked Bond Index (Series-L), 3.3% Dow Jones Equity All REIT Capped Index, 25.9% Dow Jones U.S. Large Cap Total Stock Market Index, 2.8% Dow Jones U.S. Small Cap Total Stock Market Index, 2.0% FTSE All Emerging Index (Net), 11.0% FTSE Developed ex US Index (Net), and 2.0% FTSE Developed Small Cap ex US Liquid Index (Net). From July 1, 2020 through April 27, 2023, the blended index was derived using the following allocations: 36.3% Bloomberg US Aggregate Bond Index, 9.0% Bloomberg US Treasury 1-3 Year Index, 4.0% Bloomberg US Treasury Bills 1-3 Month Index, 3.7% Bloomberg US Treasury Inflation-Linked Bond Index (Series-L), 6.0% Dow Jones
Equity All REIT Capped Index, 19.0% Dow Jones U.S. Large-Cap Total Stock Market Index, 4.0% Dow Jones U.S. Small-Cap Total Stock Market Index, 5.0% FTSE All Emerging Index (Net), 11.0% FTSE Developed ex US Index (Net), and 2.0% FTSE Developed Small Cap ex US Liquid Index (Net). From April 29, 2020 through June 30, 2020, the blended index was derived using the following allocations: 36.3% Bloomberg US Aggregate Bond Index, 9.0% Bloomberg US Treasury 1-3 Year Index, 4.0% Bloomberg US Treasury Bills 1-3 Month Index, 3.7% Bloomberg US Treasury Inflation-Linked Bond Index (Series-L), 6.0% Dow Jones U.S. Select REIT Index, 19.0% Dow Jones U.S. Large-Cap Total Stock Market Index, 4.0% Dow Jones U.S. Small-Cap Total Stock Market Index, 5.0% FTSE All Emerging Index (Net), 11.0% FTSE Developed ex US Index (Net), and 2.0% FTSE Developed Small Cap ex US Liquid Index (Net). From June 8, 2016 through April 28, 2020, the blended index was derived using the following allocations: 2% Bloomberg Global Treasury ex-US Capped Index, 34% Bloomberg US Aggregate Bond Index, 15% Bloomberg US Treasury Bills 1-3 Month Index, 2% Bloomberg US Treasury Inflation-Linked Bond Index (Series-L), 3% Bloomberg Commodity Index, 6% Dow Jones U.S. Select REIT Index, 15% Dow Jones U.S. Large-Cap Total Stock Market Index, 4% Dow Jones U.S. Small-Cap Total Stock Market Index, 5% FTSE All Emerging Index (Net), 11% FTSE Developed ex US Index (Net), 2% FTSE Developed Small Cap ex US Liquid Index (Net), and 1% Russell Microcap Index. Prior to June 8, 2016, the composite index was derived using the following allocations: 15% Dow Jones U.S. Large-Cap Total Stock Market Index, 4% Dow Jones U.S. Small-Cap Total Stock Market Index, 1% Russell Microcap Index, 11% FTSE Developed ex US Index (Net), 2% FTSE Developed Small Cap ex US Liquid Index (Net), 5% FTSE Emerging Index (Net), 6% Dow Jones U.S. Select REIT Index, 3% Dow Jones UBS Commodity Index, 2% Bloomberg US Treasury Inflation-Linked Bond Index (Series-L), 12% Bloomberg US Treasury 3-10 Year Index, 2% Bloomberg US Aggregate: Agencies Index, 6% Bloomberg US Credit Index, 13% Bloomberg US Mortgage Backed Securities Index, 2% Bloomberg Global Treasury ex-US Capped Index, 1% Bloomberg High Yield Bond Very Liquid Index, and 15% Bloomberg US Treasury Bills 1–3 Month Index.
Schwab VIT Balanced Portfolio | Annual Report32
Annual Report | December 31, 2023
Schwab VIT Balanced with Growth Portfolio
No Action Required – Notice Regarding Shareholder Report Delivery |
Beginning on July 24, 2024, fund shareholder reports will be streamlined to highlight key information deemed important for investors to assess and monitor their fund investments. Other information, including financial statements, will not appear in the streamlined shareholder reports but will available online and delivered free of charge upon request. |
• If you already receive the full shareholder reports, you will receive the streamlined shareholder reports in the same way that you currently receive the full shareholder reports (either in paper or electronically). |
• If you currently receive a notification when a shareholder report is available on a fund’s website, beginning July 24, 2024, you will begin to receive the streamlined shareholder report (in paper). |
Proxy Voting Policies, Procedures and Results
A description of the proxy voting policies and procedures used to determine how to vote proxies on behalf of the funds is available without charge, upon request, by visiting the Schwab Fund’s website at www.schwabassetmanagement.com/schwabfunds_prospectus, the SEC’s website at www.sec.gov, or by contacting Schwab Funds at 1-877-824-5615.
Information regarding how a fund voted proxies relating to portfolio securities during the most recent twelve-month period ended June 30 is available, without charge, by visiting Schwab’s website at www.schwabassetmanagement.com/schwabfunds_prospectus or the SEC’s website at www.sec.gov.
Investment Adviser: Charles Schwab Investment Management, Inc., dba Schwab Asset Management®
Schwab VIT Balanced with Growth Portfolio
The Investment Environment
For the 12-month reporting period ended December 31, 2023, U.S. fixed-income and equity markets rebounded from their losses in 2022. U.S. stocks were volatile early in the reporting period as inflation remained elevated, the U.S. Federal Reserve (Fed) continued to raise interest rates, and the failure of three U.S. regional banks between early March and early May raised concerns about the stability of the banking sector. However, as the year wore on and inflation began to ease, as did the likelihood of further rate increases, stocks staged a strong upswing—particularly in the final two months of the year. International stocks followed the same trajectory for the most part. Outside the United States, the ongoing war between Russia and Ukraine and the Israel-Hamas war that broke out following Hamas’ attack on Israel in early October weighed on the global economy. The U.S. dollar, as measured against a basket of international currencies, vacillated within a relatively small range throughout the year, ending the reporting period slightly weaker than where it began. U.S. Treasury yields soared during the period, peaking in October before falling sharply over the final two months of the year. For the reporting period, the S&P 500® Index, a bellwether for the overall U.S. stock market, returned 26.29%. The MSCI EAFE® Index (Net)*, a broad measure of developed international equity performance, returned 18.24%. Emerging market equities were weaker but still posted gains, with the MSCI Emerging Markets Index (Net)* returning 9.83%. Among fixed-income markets, the Bloomberg US Aggregate Bond Index returned 5.53% and the FTSE non-US Dollar World Government Bond Index returned 5.83%.
Economies around the world grew out of sync as they wrestled with record levels of government debt, rising geopolitical tensions, and weak productivity gains that stifled economic growth. The U.S. economy continued to show unexpected resiliency over the reporting period. Surprisingly robust job growth and strong consumer spending helped propel U.S. gross domestic product (GDP) to a 4.9% annualized growth rate for the third quarter of 2023, up from roughly 2% for the prior three quarters. Inflation remained above the Fed’s historical 2% target over the reporting period but declined in the first half of the year as rents and wage growth eased, profit margins declined, and monetary policy remained restrictive, before ticking up slightly in July through September, declining again in October through November, and then ticking up again in December. The unemployment rate remained low throughout the reporting period.
Asset Class Performance Comparison % returns during the 12 months ended December 31, 2023
Index figures assume dividends and distributions were reinvested. Index figures do not include trading and management costs, which would lower performance. Indices are unmanaged and cannot be invested in directly. Performance results less than one year are not annualized. Past performance is not an indication of future results.
For index definitions, please see the Glossary.
Data source: Index provider websites and Schwab Asset Management.
Nothing in this report represents a recommendation of a security by the investment adviser.
Management views may have changed since the report date.
*
The net version of the index reflects reinvested dividends net of withholding taxes but reflects no deductions for expenses or other taxes.
Schwab VIT Balanced with Growth Portfolio | Annual Report2
Schwab VIT Balanced with Growth Portfolio
The Investment Environment (continued)
Oil prices were volatile during the reporting period but declined roughly 10% for the year, ending at just over $70 per barrel. Eurozone GDP was flat for the first quarter of 2023, expanded slightly for the second quarter of 2023 bolstered by a moderation of inflationary pressures, and contracted slightly for the third quarter of 2023 as financing conditions remained tight. The United Kingdom posted small gains in GDP growth for the first and second quarters of 2023 and contracted slightly for the third quarter of 2023 as household spending declined. In Japan, GDP rose for the first two quarters of 2023, primarily on rising exports and falling imports, but contracted for the third quarter of 2023 amid elevated cost pressures and mounting global headwinds. Among emerging markets, China’s GDP grew in the first three quarters of 2023 as the government’s various policies seeking to help the economy have offset the impact of a prolonged property crisis and weak trade. India’s GDP also grew throughout the period, driven primarily by robust performance in manufacturing, construction, utilities, and mining, along with strong government spending.
In its efforts to lower inflation, the Fed raised interest rates four times between January and July, increasing the federal funds rate from a range of 4.25% to 4.50% to a range of 5.25% to 5.50%. At its meetings in June, September, October, and December, the Fed maintained the then current rates citing robust economic activity, strong—though moderating—job gains, and low unemployment while acknowledging tighter financial and credit conditions for households and businesses. The Fed also maintained its program to reduce the assets held on its balance sheet, though its balance sheet temporarily spiked in March when the Fed supported banks after the failure of two U.S. regional banks (a third U.S. regional bank failed in early May). Despite that spike, the Fed’s balance sheet assets declined over the reporting period. Central banks outside the United States also battled with persistently high, albeit waning, inflation. After raising rates six times during the year, the European Central Bank held its rate steady since its October meeting as inflation and pricing pressures finally showed signs of easing. Similarly, the Bank of England maintained its key official bank rate since its September meeting, after five rate hikes through August, with borrowing costs at a 15-year high. In contrast, despite inflationary pressures, the Bank of Japan continued to uphold its short-term interest rate target of -0.1%, unchanged since 2016, but maintained its pledge to ramp up stimulus “without hesitation” if needed.
Over the first half of the reporting period, bond yields were volatile, generally following the course of U.S. Treasury yields, with a few short-lived market-moving events. The failure of three U.S. regional banks between early March and early May raised concerns about the stability of the banking sector. In addition, debt ceiling negotiations during the second quarter of 2023 created fear that the federal government could default on its obligations and on August 1, 2023, Fitch Ratings downgraded long-term U.S. debt from AAA to AA+ after indicating earlier in the year that a country refusing to pay its debts in a timely way was not entitled to a AAA rating. Yields rose throughout the third quarter, peaking early in the fourth quarter and driving bond prices to their lowest levels of the year. (Bond yields and bond prices typically move in opposite directions.) Over the final two months of the year yields retreated and bond prices rallied to end the year sharply higher. In October, the yield on the 10-year U.S. Treasury briefly touched 5%—a level not seen since 2007—but declined sharply to end the year at 3.88%, where it began the year. The yield on the three-month U.S. Treasury rose from 4.42% to 5.40% over the reporting period resulting in the yield curve inverting for the reporting period.
3Schwab VIT Balanced with Growth Portfolio | Annual Report
Schwab VIT Balanced with Growth Portfolio
| Zifan Tang, Ph.D., CFA, Senior Portfolio Manager for Schwab Asset Management, is responsible for the co-management of the fund. Prior to joining Schwab in 2012, Ms. Tang was a product manager at Thomson Reuters and from 1997 to 2009 worked as a portfolio manager at Barclays Global Investors (now known as BlackRock). |
| Drew Hayes, CFA, Portfolio Manager for Schwab Asset Management, is responsible for the co-management of the fund. Mr. Hayes has been with Schwab since 2006. Before becoming a portfolio manager, he spent seven years as a senior fixed income specialist for Schwab Wealth Advisory, Inc. Prior to that, he worked as a bond investment specialist for two years and as a registered representative for two years for Charles Schwab & Co., Inc. |
| Patrick Kwok, CFA, Portfolio Manager for Schwab Asset Management, is responsible for the co-management of the fund. Previously, Mr. Kwok served as an associate portfolio manager from 2012 to 2016. Prior to that, he worked as a fund administration manager, where he was responsible for oversight of sub-advisers, trading, cash management, and fund administration supporting the Charles Schwab Trust Bank Collective Investment Trusts and multi-asset Schwab Funds. Prior to joining Schwab Asset Management in 2008, Mr. Kwok spent two years as an asset operations specialist at Charles Schwab Trust Company. He also worked for one year at State Street Bank & Trust as a portfolio accountant and pricing specialist. |
Schwab VIT Balanced with Growth Portfolio | Annual Report4
Schwab VIT Balanced with Growth Portfolio as of December 31, 2023
The Schwab VIT Balanced with Growth Portfolio (the fund) seeks long-term capital appreciation and income. To pursue its goal, the fund aims to provide diversification across major asset classes, including domestic equity securities, international equity securities, real assets, fixed-income securities, and money market investments, as well as diversification across a range of sub-asset classes within the major asset classes.
The fund is considered a “fund-of-funds” in that it gains exposure to these asset classes by primarily investing in affiliated exchange-traded funds (ETFs) from Schwab Funds. The fund may also invest in affiliated mutual funds from Schwab Funds and unaffiliated third-party ETFs and mutual funds. The fund uses the internally calculated VIT Balanced with Growth Composite Index (the composite index) as a performance gauge. The composite index comprises 65% equity, 31% fixed income, and 4% cash.
Market Highlights. For the 12-month reporting period ended December 31, 2023, U.S. fixed-income and equity markets rebounded from their losses in 2022. U.S. stocks were volatile early in the reporting period as inflation remained elevated, the U.S. Federal Reserve (Fed) continued to raise interest rates, and the failure of three U.S. regional banks between early March and early May raised concerns about the stability of the banking sector. However, as the year wore on and inflation began to ease, as did the likelihood of further rate increases, stocks staged a strong upswing—particularly in the final two months of the year. International stocks followed the same trajectory for the most part. Outside the United States, the ongoing war between Russia and Ukraine and the Israel-Hamas war that broke out following Hamas’ attack on Israel in early October weighed on the global economy. The U.S. dollar, as measured against a basket of international currencies, vacillated within a relatively small range throughout the year, ending the reporting period slightly weaker than where it began. U.S. Treasury yields soared during the period, peaking in October before falling sharply over the final two months of the year.
Performance. For the 12-month reporting period ended December 31, 2023, the fund returned 14.85%. The Dow Jones U.S. Total Stock Market Index and the Bloomberg US Aggregate Bond Index, reflecting broad-based U.S. stock and bond market performance, returned 26.06% and 5.53%, respectively. The composite index, described above, returned 15.38%.
Positioning and Strategies. The fund’s allocations were broadly in line with those of the composite index.
The fund’s U.S. equity exposure contributed the most to the total return of the fund. The Schwab U.S. Large-Cap ETF was the largest contributor to the total return of the fund, returning approximately 27% for the reporting period and tracking its comparative index component. The Schwab U.S. Small-Cap ETF also contributed to the total return of the fund, returning approximately 18% for the reporting period and generally tracking its comparative index component.
The fund’s international equity exposure also contributed to the total return of the fund. The Schwab International Equity ETF, Schwab International Small-Cap Equity ETF, and Schwab Emerging Markets Equity ETF contributed to the total return of the fund, returning approximately 18%, 14%, and 9%, respectively, for the reporting period and generally tracking their comparative index components.
The fund’s fixed-income exposure also contributed to the total return of the fund. The Schwab U.S. Aggregate Bond ETF and Schwab Short-Term U.S. Treasury ETF contributed to the total return of the fund, returning approximately 6% and 4%, respectively, for the reporting period and generally tracking their comparative index components. The Schwab U.S. TIPS ETF was the smallest contributor to the total return of the fund, returning approximately 4% for the reporting period and tracking its comparative index component.
The fund’s real estate exposure, the Schwab U.S. REIT ETF, also contributed to the total return of the fund, returning approximately 11% for the reporting period and generally tracking its comparative index component.
Management views and portfolio holdings may have changed since the report date.
5Schwab VIT Balanced with Growth Portfolio | Annual Report
Schwab VIT Balanced with Growth Portfolio
Performance and Fund Facts as of December 31, 2023
The performance data quoted represents past performance. Past performance does not guarantee future results. Investment returns and principal value will fluctuate so that an investor’s shares may be worth more or less than their original cost. Current performance may be lower or higher than performance data quoted. To obtain performance information current to the most recent month end, please visit www.schwabassetmanagement.com/schwabfunds_prospectus.
Performance of Hypothetical $10,000 Investment (December 31, 2013 – December 31, 2023)1
Average Annual Total Returns1
| | | |
Fund: Schwab VIT Balanced with Growth Portfolio (07/25/12) | | | |
| | | |
Bloomberg US Aggregate Bond Index | | | |
VIT Balanced with Growth Composite Index | | | |
Fund Category: Moderate Allocation2 | | | |
Fund Expense Ratio3: 0.54% |
All total return figures on this page assume dividends and distributions were reinvested. Index figures do not include trading and management costs, which would lower performance. Indices are unmanaged and cannot be invested in directly. Performance results less than one year are not annualized.
The components that make up the composite index may vary over time. For index definitions, please see the Glossary.
1
Fund expenses may have been partially absorbed by the investment adviser and its affiliates. Without these reductions, the fund’s returns would have been lower. Fund performance does not reflect the additional fees and expenses imposed by the insurance company under the variable insurance product contract. If those contract fees and expenses were included, the performance would be less than that shown. Please refer to the variable insurance product prospectus for a complete listing of these expenses.
2
Source for category information: Morningstar, Inc. The Morningstar Category return represents all active and index mutual funds and ETFs within the category as of the report date.
3
As stated in the prospectus. Includes 0.05% of acquired fund fees and expenses (AFFE), which are indirect expenses incurred by the fund through its investments in the underlying funds. Reflects the total annual fund operating expenses without contractual fee waivers. For actual expense ratios during the period, not including AFFE, refer to the Financial Highlights section of the financial statements.
Schwab VIT Balanced with Growth Portfolio | Annual Report6
Schwab VIT Balanced with Growth Portfolio
Performance and Fund Facts as of December 31, 2023 (continued)
Asset Class Weightings % of Investments1,2
Top Holdings % of Net Assets1,3
Portfolio holdings may have changed since the report date.
1
The fund intends to primarily invest in affiliated Schwab ETFs and may also invest in affiliated Schwab Funds and unaffiliated third-party ETFs and mutual funds (all such ETFs and mutual funds referred to as “underlying funds”). The fund may also invest directly in equity, fixed-income, or other securities or investments, as appropriate, consistent with its investment objectives, strategies, and policies.
2
The percentage may differ from the Portfolio Holdings because the above calculation is based on a percentage of total investments, whereas the calculation in the Portfolio Holdings is based on a percentage of net assets.
3
This list is not a recommendation of any security by the investment adviser.
7Schwab VIT Balanced with Growth Portfolio | Annual Report
Schwab VIT Balanced with Growth Portfolio
Fund Expenses (Unaudited)
Examples for a $1,000 Investment
As a fund shareholder, you may incur two types of costs: (1) transaction costs; and (2) ongoing costs, including management fees, transfer agent fees, and other fund expenses.
The expense examples below are intended to help you understand your ongoing cost (in dollars) of investing in the fund and to compare this cost with the ongoing cost of investing in other mutual funds. These examples are based on an investment of $1,000 invested for six months beginning July 1, 2023 and held through December 31, 2023.
The Actual Return line in the table below provides information about actual account values and actual expenses. You may use this information, together with the amount you invested, to estimate the expenses that you paid over the period. To do so, simply divide your account value by $1,000 (for example, an $8,600 account value ÷ $1,000 = 8.6), then multiply the result by the number given for the fund under the heading entitled “Expenses Paid During Period.”
The Hypothetical Return line in the table below provides information about hypothetical account values and hypothetical expenses based on the fund’s actual expense ratio and an assumed return of 5% per year before expenses. Because the return used is not an actual return, it may not be used to estimate the actual ending account value or expenses you paid for the period.
You may use this information to compare the ongoing costs of investing in the fund and other funds. To do so, compare this 5% hypothetical example with the 5% hypothetical examples that appear in the shareholder reports of the other funds.
Please note that the expenses shown in the table are meant to highlight your ongoing costs only, and do not reflect any transactional costs. Therefore, the hypothetical return line of the table is useful in comparing ongoing costs only, and will not help you determine the relative total costs of owning different funds. In addition, if these transactional costs were included, your costs would have been higher.
| | | BEGINNING
ACCOUNT VALUE
AT 7/1/23 | ENDING
ACCOUNT VALUE
(NET OF EXPENSES)
| EXPENSES PAID
DURING PERIOD
| EFFECTIVE
EXPENSES PAID
DURING PERIOD
|
Schwab VIT Balanced with Growth Portfolio | | | | | | |
| | | | | | |
| | | | | | |
| Based on the most recent six-month expense ratio; may differ from the expense ratio provided in the Financial Highlights. |
| Excludes acquired fund fees and expenses, which are indirect expenses incurred by the fund through its investments in underlying funds. |
| Based on the most recent six-month acquired fund fees and expenses and the expense ratio; may differ from the acquired fund fees and expenses and the expense ratio in the prospectus. |
| Includes acquired fund fees and expenses, which are indirect expenses incurred by the fund through its investments in underlying funds. |
| Expenses for the fund are equal to its annualized expense ratio, multiplied by the average account value over the period, multiplied by 184 days in the period, and divided by 365 days in the fiscal year. |
Schwab VIT Balanced with Growth Portfolio | Annual Report8
Schwab VIT Balanced with Growth Portfolio
Financial Statements
| | | | | | |
|
Net asset value at beginning of period | | | | | | |
Income (loss) from investment operations: | | | | | | |
Net investment income (loss)1 | | | | | | |
Net realized and unrealized gains (losses) | | | | | | |
Total from investment operations | | | | | | |
| | | | | | |
Distributions from net investment income | | | | | | |
Distributions from net realized gains | | | | | | |
| | | | | | |
Net asset value at end of period | | | | | | |
| | | | | | |
|
Ratios to average net assets: | | | | | | |
| | | | | | |
Gross operating expenses2 | | | | | | |
Net investment income (loss) | | | | | | |
| | | | | | |
Net assets, end of period (x 1,000) | | | | | | |
| Calculated based on the average shares outstanding during the period. |
| Ratio excludes acquired fund fees and expenses, which are indirect expenses incurred by the fund through its investments in underlying funds. |
| Ratio includes less than 0.005% of non-routine proxy expenses. |
9Schwab VIT Balanced with Growth Portfolio | Annual Report
Schwab VIT Balanced with Growth Portfolio
Portfolio Holdings as of December 31, 2023
This section shows all the securities in the fund’s portfolio and their values as of the report date, including a summary of the fund’s transactions with its affiliated underlying funds during the period.
The fund files its complete schedule of portfolio holdings with the U.S. Securities and Exchange Commission (SEC) for the first and third quarters of each fiscal year on Form N-PORT Part F. The fund’s Form N-PORT Part F is available on the SEC’s website at www.sec.gov. The fund also makes available its complete schedule of portfolio holdings on the fund’s website at www.schwabassetmanagement.com/schwabfunds_prospectus, typically 60-80 days after the end of the fund’s fiscal quarter.
| | | | | NET CHANGE IN UNREALIZED APPRECIATION (DEPRECIATION) | | BALANCE OF SHARES HELD AT 12/31/23 | |
AFFILIATED UNDERLYING FUNDS 99.3% OF NET ASSETS |
|
|
|
Schwab U.S. Large-Cap ETF | | | | | | | | |
|
Schwab U.S. Small-Cap ETF | | | | | | | | |
| | | | | | | | |
|
International Stocks 22.2% |
|
Schwab International Equity ETF | | | | | | | | |
Schwab International Small-Cap Equity ETF | | | | | | | | |
| | | | | | | | |
|
Schwab Emerging Markets Equity ETF | | | | | | | | |
| | | | | | | | |
|
|
|
| | | | | | | | |
|
|
Inflation-Protected Bond 1.0% |
| | | | | | | | |
Intermediate-Term Bond 26.1% |
Schwab U.S. Aggregate Bond ETF | | | | | | | | |
|
Schwab Short-Term U.S. Treasury ETF | | | | | | | | |
| | | | | | | | |
|
|
Schwab Variable Share Price Money Fund, | | | | | | | | |
Total Affiliated Underlying Funds
(Cost $120,820,630) | | | | | | | | |
Total Investments in Securities
(Cost $120,820,630) | | | | | | | | |
| Distributions received include distributions from net investment income and capital gains, if any, from the underlying funds. Amounts shown are only presented for affiliated underlying funds, which are presented in the corresponding line-item in the Statement of Operations, if applicable (see financial note 2(d) for additional information). |
| The rate shown is the annualized 7-day yield. |
Schwab VIT Balanced with Growth Portfolio | Annual Report10
Schwab VIT Balanced with Growth Portfolio
Portfolio Holdings as of December 31, 2023 (continued)
| |
| Real Estate Investment Trust |
| Treasury Inflation Protected Securities |
At December 31, 2023, all of the fund’s investment securities were classified as Level 1 (see financial note 2(a) for additional
information).
11Schwab VIT Balanced with Growth Portfolio | Annual Report
Schwab VIT Balanced with Growth Portfolio
Statement of Assets and Liabilities
|
Investments in securities, at value - affiliated (cost $120,820,630) | | |
| | |
| | |
| | |
| | |
| | |
| | |
|
|
| | |
| | |
Investment adviser and administrator fees | | |
| | |
Independent trustees’ fees | | |
| | |
| | |
| | |
|
|
Capital received from investors | | |
Total distributable earnings | | |
| | |
Schwab VIT Balanced with Growth Portfolio | Annual Report12
Schwab VIT Balanced with Growth Portfolio
Statement of Operations
For the period January 1, 2023 through December 31, 2023 |
|
Dividends received from securities - affiliated | | |
Interest received from securities - unaffiliated | | |
| | |
|
|
Investment adviser and administrator fees | | |
| | |
Independent trustees’ fees | | |
Portfolio accounting fees | | |
| | |
| | |
| | |
| | |
| | |
| | |
|
REALIZED AND UNREALIZED GAINS (LOSSES) |
Net realized gains on sales of securities - affiliated | | |
Net change in unrealized appreciation (depreciation) on securities - affiliated | | |
Net realized and unrealized gains | | |
Increase in net assets resulting from operations | | |
13Schwab VIT Balanced with Growth Portfolio | Annual Report
Schwab VIT Balanced with Growth Portfolio
Statement of Changes in Net Assets
For the current and prior report periods
|
| | |
| | | |
Net realized gains (losses) | | | |
Net change in unrealized appreciation (depreciation) | | | |
Increase (decrease) in net assets resulting from operations | | | |
|
DISTRIBUTIONS TO SHAREHOLDERS |
| | | |
TRANSACTIONS IN FUND SHARES |
| | |
| | | | | |
| | | | | |
| | | | | |
| | | | | |
Net transactions in fund shares | | | | | |
|
SHARES OUTSTANDING AND NET ASSETS |
| | |
| | | | | |
| | | | | |
Total increase (decrease) | | | | | |
| | | | | |
Schwab VIT Balanced with Growth Portfolio | Annual Report14
Schwab VIT Balanced with Growth Portfolio
1. Business Structure of the Fund:
Schwab VIT Balanced with Growth Portfolio (the fund) is a series of Schwab Annuity Portfolios (the trust), a no-load, open-end management investment company. The trust is organized as a Massachusetts business trust and is registered under the Investment Company Act of 1940, as amended (the 1940 Act). The list below shows all the funds in the trust as of the end of the period, including the fund discussed in this report, which is highlighted:
SCHWAB ANNUITY PORTFOLIOS |
Schwab Government Money Market Portfolio | |
Schwab S&P 500 Index Portfolio | |
Schwab VIT Balanced Portfolio | |
Schwab VIT Balanced with Growth Portfolio | |
Schwab VIT Growth Portfolio | |
The fund is considered a “fund of funds” because it invests in other exchange traded-funds (ETFs) or mutual funds. The fund seeks to achieve its investment objective by investing primarily in affiliated Schwab ETFs. The fund may also invest in affiliated Schwab mutual funds, and unaffiliated third-party ETFs and mutual funds (referred to herein as unaffiliated funds and, together with Schwab ETFs and Schwab mutual funds, as the "underlying funds"). The fund invests in the underlying funds in accordance with its target portfolio allocation.
The fund offers one share class. Shares are bought and sold at closing net asset value per share (NAV), which is the price for all outstanding shares of the fund. Each share has a par value of 1/1,000 of a cent, and the fund’s Board of Trustees (the Board) may authorize the issuance of as many shares as necessary.
The fund is available exclusively as an investment vehicle for variable annuity and variable life insurance contracts offered by separate accounts of participating life insurance companies and in the future may be offered to pension and retirement plans qualified under the Internal Revenue Code, as amended. At December 31, 2023, 100% of the fund’s shares were held through separate accounts of five insurance companies. Subscriptions and redemptions of these insurance separate accounts could have a material impact on the fund.
The fund maintains its own account for purposes of holding assets and accounting, and is considered a separate entity for tax purposes. Within its account, the fund may also keep certain assets in segregated accounts, as required by securities law. The "Fund Complex" includes The Charles Schwab Family of Funds, Schwab Capital Trust, Schwab Investments, Schwab Annuity Portfolios, Schwab Strategic Trust and Laudus Trust.
2. Significant Accounting Policies:The following is a summary of the significant accounting policies the fund uses in its preparation of financial statements. The fund follows the investment company accounting and reporting guidance of the Financial Accounting Standards Board (FASB) Accounting Standard Codification Topic 946 Financial Services — Investment Companies. The accounting policies are in conformity with accounting principles generally accepted in the United States of America (GAAP).
The financial statements of the fund should be read in conjunction with the underlying funds’ financial statements. For more information about the underlying funds’ operations and policies, please refer to those funds’ semiannual and annual reports, which are filed with the U.S. Securities and Exchange Commission (SEC) and are available on the SEC’s website at www.sec.gov.
Pursuant to Rule 2a-5 under the 1940 Act, the Board has designated authority to a Valuation Designee, the fund’s investment adviser, to make fair valuation determinations under adopted procedures, subject to Board oversight. The investment adviser has formed a Pricing Committee to administer the pricing and valuation of portfolio securities and other assets and liabilities as well as to ensure that prices used for internal purposes or provided by third parties reasonably reflect fair value. The Valuation Designee may utilize independent pricing services, quotations from securities and financial instrument dealers and other market sources to determine fair value.
Securities held in the fund’s portfolio are valued every business day. The following valuation policies and procedures are used by the Valuation Designee to value various types of securities:
• Securities traded on an exchange or over-the-counter: Traded securities are valued at the closing value for the day, or, on days when no closing value has been reported, at the mean of the most recent bid and ask quotes.
• Mutual funds: Mutual funds are valued at their respective NAVs.
15Schwab VIT Balanced with Growth Portfolio | Annual Report
Schwab VIT Balanced with Growth Portfolio
Financial Notes (continued)
2. Significant Accounting Policies (continued):
• Securities for which no quoted value is available: The Valuation Designee has adopted procedures to fair value the fund’s securities when market prices are not “readily available” or are unreliable. For example, a security may be fair valued when it’s de-listed or its trading is halted or suspended; when a security’s primary pricing source is unable or unwilling to provide a price; or when a security’s primary trading market is closed during regular market hours. Fair value determinations are made in good faith in accordance with adopted valuation procedures. The Valuation Designee considers a number of factors, including unobservable market inputs, when arriving at fair value. The Valuation Designee may employ methods such as the review of related or comparable assets or liabilities, related market activities, recent transactions, market multiples, book values, transactional back-testing, disposition analysis and other relevant information. Due to the subjective and variable nature of fair value pricing, there can be no assurance that the fund could obtain the fair value assigned to the security upon the sale of such security.
In accordance with the authoritative guidance on fair value measurements and disclosures under GAAP, the fund discloses the fair value of its investments in a hierarchy that prioritizes the significant inputs to valuation methods used to measure the fair value. The hierarchy gives the highest priority to valuations based upon unadjusted quoted prices in active markets for identical assets or liabilities (Level 1 measurements) and the lowest priority to valuations based upon unobservable inputs that are significant to the valuation (Level 3 measurements). If inputs used to measure the financial instruments fall within different levels of the hierarchy, the categorization is based on the lowest level input that is significant to the valuation. If it is determined that either the volume and/or level of activity for an asset or liability has significantly decreased (from normal conditions for that asset or liability) or price quotations or observable inputs are not associated with orderly transactions, increased analysis and the Valuation Designee’s judgment will be required to estimate fair value.
The three levels of the fair value hierarchy are as follows:
• Level 1 — quoted prices in active markets for identical investments — Investments whose values are based on quoted market prices in active markets. These generally include active listed equities, mutual funds, and ETFs. Underlying funds are classified as Level 1 prices, without consideration to the classification level of the underlying securities held which could be Level 1, Level 2 or Level 3 in the fair value hierarchy.
• Level 2 — other significant observable inputs (including quoted prices for similar securities, interest rates, prepayment speeds, credit risk, etc.) — Investments that trade in markets that are not considered to be active, but whose values are based on quoted market prices, dealer quotations or valuations provided by alternative pricing sources supported by observable inputs are classified as Level 2 prices. These generally include U.S. government and sovereign obligations, most government agency securities, investment-grade corporate bonds, certain mortgage products, less liquid listed equities, and state, municipal and provincial obligations.
• Level 3 — significant unobservable inputs (including the Valuation Designee’s assumptions in determining the fair value of investments) — Investments whose values are classified as Level 3 prices have significant unobservable inputs, as they may trade infrequently or not at all. When observable prices are not readily available for these securities, one or more valuation methods are used for which sufficient and reliable data is available. The inputs used in estimating the value of Level 3 prices may include the original transaction price, quoted prices for similar securities or assets in active markets, completed or pending third-party transactions in the underlying investment or comparable issuers, and changes in financial ratios or cash flows. Level 3 prices may also be adjusted to reflect illiquidity and/or non-transferability, with the amount of such discount estimated in the absence of market information. Assumptions used due to the lack of observable inputs may significantly impact the resulting fair value and therefore the fund’s results of operations.
The inputs or methodology used for valuing securities are not necessarily an indication of the risk associated with investing in those securities.
The levels associated with valuing the fund’s investments as of December 31, 2023, are disclosed in the fund’s Portfolio Holdings.
(b) Accounting Policies for certain Portfolio Investments (if held):
Securities Lending: Under the trust’s Securities Lending Program, the fund (lender) may make short-term loans of its securities to another party (borrower) to generate additional revenue for the fund. The borrower pledges collateral in the form of cash, securities issued or fully guaranteed by the U.S. government or foreign governments, or letters of credit issued by a bank. Collateral at the individual loan level is required to be maintained on a daily marked-to-market basis in an amount at least equal to the current value of the securities loaned. The lending agent provides the fund with indemnification against borrower default (the borrower fails to return the security on loan) reducing the risk of loss as a result of default. The cash collateral of securities loaned is currently invested in money market portfolios operating pursuant to Rule 2a-7 under the 1940 Act. The fund bears the risk of loss with
Schwab VIT Balanced with Growth Portfolio | Annual Report16
Schwab VIT Balanced with Growth Portfolio
Financial Notes (continued)
2. Significant Accounting Policies (continued):
respect to the investment of cash collateral. The terms of the securities lending agreement allow the fund or the lending agent to terminate any loan at any given time and the securities must be returned within the earlier of the standard trade settlement period or the specified time period under the relevant securities lending agreement. Securities lending income, as disclosed in the fund’s Statement of Operations, if applicable, represents the income earned from the investment of the cash collateral plus any fees paid by borrowers, less the fees paid to the lending agent and broker rebates which are subject to adjustments pursuant to the securities lending agreement. On loans not collateralized by cash, a fee is received from the borrower, and is allocated between the fund and the lending agent. The aggregate fair value of securities loaned will not at any time exceed one-third of the total assets of the fund, including collateral received from the loan. Securities lending fees paid to the unaffiliated lending agents start at 9% of gross lending revenue, with subsequent breakpoints to a low of 5%. In this context, the gross lending revenue equals the income received from the investment of cash collateral and fees paid by borrowers less any rebates paid to the borrowers. Any expenses charged by the cash collateral fund are in addition to these fees. All remaining revenue is retained by the fund, as applicable. No portion of lending revenue is paid to or retained by the investment adviser or any of its affiliates.
As of December 31, 2023, the fund had no securities on loan.
Cash Investments: The fund may invest a portion of its assets in cash. Cash includes cash bank balances in an interest-bearing demand deposit account with maturity on demand by the fund.
(c) Security Transactions:
Security transactions are recorded as of the date the order to buy or sell the security is executed. Realized gains and losses from security transactions are based on the identified costs of the securities involved.
Interest income is recorded as it accrues. Dividends and distributions from portfolio securities and underlying funds are recorded on the date they are effective (the ex-dividend date). Any distributions from underlying funds are recorded in accordance with the character of the distributions as designated by the underlying funds.
Expenses that are specific to the fund are charged directly to the fund. Expenses that are common to more than one fund in the trusts generally are allocated among those funds in proportion to their average daily net assets. The fund bears its share of the acquired fund fees and expenses of the underlying funds, which are indirect expenses incurred by the fund through its investments in the underlying funds. Such expenses are reflected in the net asset values of the underlying funds.
(f) Distributions to Shareholders:
The fund makes distributions from net investment income and net realized capital gains, if any, once a year. To receive a distribution, you must be a registered shareholder on the record date. Distributions are paid to shareholders on the payable date.
(g) Accounting Estimates:
The accounting policies described in this report conform to GAAP. Notwithstanding this, shareholders should understand that in order to follow these principles, fund management has to make estimates and assumptions that affect the information reported in the financial statements. It’s possible that once the results are known, they may turn out to be different from these estimates and these differences may be material.
(h) Federal Income Taxes:
The fund intends to meet federal income and excise tax requirements for regulated investment companies under subchapter M of the Internal Revenue Code, as amended. Accordingly, the fund distributes substantially all of its net investment income and net realized capital gains, if any, to the participating insurance company’s (shareholders) separate accounts each year. As long as the fund meets the tax requirements, it is not required to pay federal income tax.
17Schwab VIT Balanced with Growth Portfolio | Annual Report
Schwab VIT Balanced with Growth Portfolio
Financial Notes (continued)
2. Significant Accounting Policies (continued):
(i) Indemnification:
Under the fund’s organizational documents, the officers and trustees are indemnified against certain liabilities arising out of the performance of their duties to the fund. In addition, in the normal course of business the fund enters into contracts with its vendors and others that provide general indemnifications. The fund’s maximum exposure under these arrangements is unknown as this would involve future claims that may be made against the fund. However, based on experience, the fund expects the risk of loss attributable to these arrangements to be remote.
Effective January 24, 2023, the SEC adopted rule and form amendments to require mutual funds and ETFs to transmit concise and visually engaging streamlined annual and semiannual reports to shareholders that highlight key information deemed important for retail investors to assess and monitor their fund investments. Other information, including financial statements, will no longer appear in a streamlined shareholder report but must be available online, delivered free of charge upon request, and filed on a semiannual basis on Form N-CSR. The rule and form amendments have a compliance date of July 24, 2024. At this time, management is evaluating the impact of these rule and form amendment changes on the content of the current shareholder report and the newly created annual and semiannual streamlined shareholder reports.
Investing in the fund may involve certain risks, as discussed in the fund’s prospectus, including, but not limited to, those described below. Any of these risks could cause an investor to lose money.
Asset Allocation Risk. The fund is subject to the risk that the selection of the underlying funds and the allocation of the fund’s assets among the various asset classes and market segments may cause the fund to underperform other funds with a similar investment objective.
Conflicts of Interest Risk. The investment adviser’s authority to select and substitute underlying funds from a variety of affiliated and unaffiliated mutual funds and ETFs may create a conflict of interest because the fees paid to it and its affiliates by some underlying funds are higher than the fees paid by other underlying funds. The investment adviser also may have an incentive to select an affiliated underlying fund for other reasons, including to increase assets under management or to support new investment strategies. In addition, other conflicts of interest may exist where the best interests of the affiliated underlying fund may not be aligned with those of the fund. However, the investment adviser is a fiduciary to the fund and is legally obligated to act in the fund’s best interests when selecting underlying funds.
Market Risk. Financial markets rise and fall in response to a variety of factors, sometimes rapidly and unpredictably. Markets may be impacted by economic, political, regulatory and other conditions, including economic sanctions and other government actions. In addition, the occurrence of global events, such as war, terrorism, environmental disasters, natural disasters and epidemics may also negatively affect the financial markets. As with any investment whose performance is tied to these markets, the value of an investment in the fund will fluctuate, which means that an investor could lose money over short or long periods.
Securities Lending Risk. Securities lending involves the risk of loss of rights in, or delay in recovery of, the loaned securities if the borrower fails to return the security loaned or becomes insolvent.
ETF Risk. When the fund invests in an ETF, it will bear a proportionate share of the ETF’s expenses. In addition, lack of liquidity in the market for an ETF’s shares can result in its value being more volatile than the underlying portfolio of securities.
Direct Investment Risk. The fund may invest directly in cash, cash equivalents and equity and fixed-income securities, including money market securities, to maintain its allocations. The fund’s direct investment in these securities is subject to the same or similar risks as an underlying fund’s investment in the same securities.
Underlying Fund Investment Risk. Before investing in the fund, investors should assess the risks associated with the underlying funds in which the fund may invest, which include any combination of the risks described below.
• Equity Risk. The prices of equity securities rise and fall daily. These price movements may result from factors affecting individual companies, industries or the securities market as a whole. In addition, equity markets tend to move in cycles, which may cause stock prices to fall over short or extended periods of time.
• Market Capitalization Risk. Securities issued by companies of different market capitalizations tend to go in and out of favor based on market and economic conditions. During a period when securities of a particular market capitalization fall behind other types of investments, an underlying fund’s performance could be impacted.
Schwab VIT Balanced with Growth Portfolio | Annual Report18
Schwab VIT Balanced with Growth Portfolio
Financial Notes (continued)
3. Risk Factors (continued):
• Foreign Investment Risk. An underlying fund’s investments in securities of foreign issuers involve certain risks that may be greater than those associated with investments in securities of U.S. issuers. These include risks of adverse changes in foreign economic, political, regulatory and other conditions; changes in currency exchange rates or exchange control regulations (including limitations on currency movements and exchanges); the imposition of economic sanctions or other government restrictions; differing accounting, auditing, financial reporting and legal standards and practices; differing securities market structures; and higher transaction costs. These risks may negatively impact the value or liquidity of an underlying fund’s investments, and could impair the underlying fund’s ability to meet its investment objective or invest in accordance with its investment strategy. There is a risk that investments in securities denominated in, and/or receiving revenues in, foreign currencies will decline in value relative to the U.S. dollar or, in the case of hedging positions, that the U.S. dollar will decline in value relative to the currency hedged, resulting in the dollar value of an underlying fund’s investment being adversely affected.
• Emerging Markets Risk. Emerging market countries may be more likely to experience political turmoil or rapid changes in market or economic conditions than more developed countries. Emerging market countries often have less uniformity in accounting, auditing, financial reporting and recordkeeping requirements and greater risk associated with the custody of securities. In addition, the financial stability of issuers (including governments) in emerging market countries may be more precarious than in developed countries. As a result, there may be an increased risk of illiquidity and price volatility associated with an underlying fund’s investments in emerging market countries, which may be magnified by currency fluctuations relative to the U.S. dollar, and, at times, it may be difficult to value such investments.
• Growth Investing Risk. Certain of the underlying funds pursue a “growth style” of investing. Growth investing focuses on a company’s prospects for growth of revenue and earnings. If a company’s earnings or revenues fall short of expectations, its stock price may fall dramatically. Growth stocks also can perform differently from the market as a whole and other types of stocks and can be more volatile than other types of stocks. Since growth companies usually invest a high portion of earnings in their business, they may lack the dividends of value stocks that can cushion stock prices in a falling market. Growth stocks may also be more expensive relative to their earnings or assets compared to value or other stocks.
• Value Investing Risk. Certain of the underlying funds may pursue a “value style” of investing. Value investing focuses on companies whose stocks appear undervalued in light of factors such as the company’s earnings, book value, revenues or cash flow. If an underlying fund’s investment adviser’s (or sub-adviser’s) assessment of a company’s value or prospects for exceeding earnings expectations or market conditions is wrong, the underlying fund could suffer losses or produce poor performance relative to other funds. In addition, “value stocks” can continue to be undervalued by the market for long periods of time.
• Fixed-Income Risk. Interest rates rise and fall over time, which will affect an underlying fund’s yield and share price. A change in a central bank’s monetary policy or economic conditions, among other things, may result in a change in interest rates. A rise in interest rates could cause an underlying fund’s share price to fall. The credit quality of a portfolio investment could also cause an underlying fund’s share price to fall. An underlying fund could lose money if the issuer or guarantor of a portfolio investment or the counterparty to a derivatives contract fails to make timely principal or interest payments or otherwise honor its obligations. Fixed-income securities may be paid off earlier or later than expected. Either situation could cause an underlying fund to hold securities paying lower-than-market rates of interest, which could hurt an underlying fund’s yield or share price. Below investment-grade bonds (junk bonds) involve greater credit risk, are more volatile, involve greater risk of price declines and may be more susceptible to economic downturns than investment-grade securities.
• Interest Rate Risk. Interest rates rise and fall over time. As with any investment whose yield reflects current interest rates, an underlying fund’s yield will change over time. During periods when interest rates are low, an underlying fund’s yield (and total return) also may be low. Changes in interest rates also may affect an underlying fund’s share price: a rise in interest rates generally causes an underlying fund’s share price to fall. The longer an underlying fund’s portfolio duration, the more sensitive to interest rate movements its share price is likely to be. Also, a change in a central bank’s monetary policy or economic conditions, among other things, may result in a change in interest rates, which could have sudden and unpredictable effects on the markets and significantly impact the value of fixed-income securities in which the underlying fund invests.
• Credit Risk. A decline in the credit quality of an issuer or guarantor of a portfolio investment could cause an underlying fund to lose money or underperform. An underlying fund could lose money if the issuer or guarantor of a portfolio investment fails to make timely principal or interest payments or otherwise honor its obligations.
19Schwab VIT Balanced with Growth Portfolio | Annual Report
Schwab VIT Balanced with Growth Portfolio
Financial Notes (continued)
3. Risk Factors (continued):
• Prepayment and Extension Risk. Certain fixed income securities are subject to the risk that the securities may be paid off earlier or later than expected, especially during periods of falling or rising interest rates, respectively. Prepayments of obligations could cause an underlying fund to forgo future interest income on the portion of the security’s principal repaid early and force the underlying fund to reinvest that money at the lower prevailing interest rates. Extensions of obligations could cause the fund to exhibit additional volatility and hold securities paying lower-than-market rates of interest. Either case could hurt the underlying fund’s performance.
• U.S. Government Securities Risk. Some of the U.S. government securities that the underlying funds invest in are not backed by the full faith and credit of the U.S. government, which means they are neither issued nor guaranteed by the U.S. Treasury. Issuers such as the Federal Home Loan Banks (FHLB) maintain limited access to credit lines from the U.S. Treasury. Certain securities, such as obligations issued by the Federal Farm Credit Banks Funding Corporation, are supported solely by the credit of the issuer. There can be no assurance that the U.S. government will provide financial support to securities of its agencies and instrumentalities if it is not obligated to do so under law. Also, any government guarantees on securities the underlying funds own do not extend to shares of the underlying funds themselves.
• Real Estate Investment Risk. An underlying fund in which the fund may invest may have a policy of concentrating its investments in real estate companies and companies related to the real estate industry. As such, an underlying fund is subject to risks associated with the direct ownership of real estate securities and the fund’s investment in such an underlying fund is subject to risks associated with the direct ownership of real estate securities and an investment in the underlying fund will be closely linked to the performance of the real estate markets. These risks include, among others, declines in the value of real estate; risks related to general and local economic conditions; possible lack of availability of mortgage funds or other limits to accessing the credit or capital markets; defaults by borrowers or tenants, particularly during an economic downturn; and changes in interest rates.
• Real Estate Investment Trusts (REITs) Risk. An underlying fund may invest in REITs. An underlying fund’s investments in REITs will be subject to the risks associated with the direct ownership of real estate, including fluctuations in the value of underlying properties, defaults by borrowers or tenants, changes in interest rates and risks related to general or local economic conditions. REITs are also subject to certain additional risks. For example, equity REITs may be affected by changes in the value of the underlying properties owned by the trusts, and mortgage REITs may be affected by the quality of any credit extended. Further, REITs may have their investments in relatively few properties, a small geographic area or a single property type. In addition, REITs have their own expenses, and the underlying fund will bear a proportionate share of those expenses.
• Mortgage-Backed and Mortgage Pass-Through Securities Risk. Mortgage-backed securities tend to increase in value less than other debt securities when interest rates decline, but are subject to similar or greater risk of decline in fair value during periods of rising interest rates. Certain of the mortgage-backed securities in which an underlying fund may invest are issued or guaranteed by agencies or instrumentalities of the U.S. government but are not backed by the full faith and credit of the U.S. government. There can be no assurance that the U.S. government would provide financial support to its agencies or instrumentalities where it was not obligated to do so which can cause an underlying fund to lose money or underperform. The risks of investing in mortgage-backed securities include, among others, interest rate risk, credit risk, prepayment risk and extension risk. Transactions in mortgage pass-through securities often occur through to-be-announced (TBA) transactions. An underlying fund could lose money or underperform if a TBA counterparty defaults or goes bankrupt.
• Portfolio Turnover Risk. Certain of the underlying funds may buy and sell portfolio securities actively. If they do, their portfolio turnover rate and transaction costs will rise, which may lower the underlying fund’s performance and may increase the likelihood of capital gains distributions.
• Liquidity Risk. An underlying fund may be unable to sell certain securities, such as illiquid securities, readily at a favorable time or price, or the underlying fund may have to sell them at a loss.
• Derivatives Risk. An underlying fund’s use of derivative instruments involves risks different from, or possibly greater than, the risks associated with investing directly in securities and other traditional investments. An underlying fund’s use of derivatives could reduce the underlying fund’s performance, increase its volatility, and could cause the underlying fund to lose more than the initial amount invested. In addition, investments in derivatives may involve leverage, which means a small percentage of assets invested in derivatives can have a disproportionately large impact on an underlying fund.
• Securities Lending Risk. Certain underlying funds engage in securities lending, which involves the risk of loss of rights in, or delay in recovery of, the loaned securities if the borrower fails to return the security loaned or becomes insolvent.
Schwab VIT Balanced with Growth Portfolio | Annual Report20
Schwab VIT Balanced with Growth Portfolio
Financial Notes (continued)
3. Risk Factors (continued):
• Management Risk. An underlying fund may be an actively managed mutual fund. Any actively managed mutual fund is subject to the risk that its investment adviser (or sub-adviser(s)) will make poor security selections. An underlying fund’s adviser applies its own investment techniques and risk analyses in making investment decisions for the fund, but there can be no guarantee that they will produce the desired results.
• Investment Style Risk. Certain underlying funds seek to track the performance of various segments of the stock market, as measured by their respective indices. Such underlying funds follow these stocks during upturns as well as downturns. Because of their indexing strategy, these underlying funds do not take steps to reduce market exposure or to lessen the effects of a declining market. In addition, because of an underlying fund’s expenses, the underlying fund’s performance is normally below that of the index. Errors relating to an index may occur from time to time and may not be identified by the underlying fund’s index provider for a period of time. In addition, market disruptions could cause delays in an underlying fund’s index’s rebalancing schedule. Such errors and/or market disruptions may result in losses for an underlying fund.
• Tracking Error Risk. An underlying fund may seek to track the performance of its benchmark index, although it may not be successful in doing so. The divergence between the performance of a fund and its benchmark index, positive or negative, is called “tracking error.” Tracking error can be caused by many factors and it may be significant.
• Concentration Risk. To the extent that an underlying fund’s portfolio is concentrated in the securities of issuers in a particular market, industry, group of industries, sector or asset class, the underlying fund may be adversely affected by the performance of those securities, may be subject to increased price volatility and may be more vulnerable to adverse economic, market, political, or regulatory occurrences affecting that market, industry, group of industries, sector or asset class.
• Commodity Risk. To the extent that an underlying fund invests in commodity-linked derivative instruments, it may subject the underlying fund to greater volatility than investments in traditional securities. Also, commodity-linked investments may be more volatile and less liquid than the underlying commodity. The value of commodity-linked derivative instruments may be affected by changes in overall market movements, commodity index volatility, changes in interest rates, or factors affecting a particular industry or commodity, such as drought, floods, weather, livestock disease, embargoes, tariffs and international economic, political and other regulatory and market developments. The use of leveraged commodity-linked derivatives creates an opportunity for increased return, but also creates the possibility for a greater loss.
• Money Market Fund Risk. The fund may invest in underlying money market funds that either seek to maintain a stable $1.00 net asset value (“stable share price money market funds”) or that have a share price that fluctuates (“variable share price money market funds”). Although an underlying stable share price money market fund seeks to maintain a stable $1.00 net asset value, it is possible to lose money by investing in such a money market fund. Because the share price of an underlying variable share price money market fund will fluctuate, when the fund sells the shares it owns they may be worth more or less than what the fund originally paid for them. In addition, neither type of money market fund is designed to offer capital appreciation. Certain underlying money market funds may impose a fee upon the sale of shares or may temporarily suspend the ability to sell shares if such fund’s liquidity falls below required minimums.
Please refer to the fund’s prospectus for a more complete description of the principal risks of investing in the fund.
4. Affiliates and Affiliated Transactions:Charles Schwab Investment Management Inc., dba Schwab Asset Management, a wholly owned subsidiary of The Charles Schwab Corporation, serves as the fund’s investment adviser and administrator pursuant to an Investment Advisory and Administration Agreement between the investment adviser and the trust.
For its advisory and administrative services to the fund, the investment adviser is entitled to receive an annual fee, accrued daily and payable monthly, equal to 0.45% of the fund’s average daily net assets.
The investment adviser and its affiliates have agreed with the fund, for so long as the investment adviser serves as the investment adviser to the fund, in which the agreement may only be amended or terminated with approval of the fund’s Board, to limit the total annual fund operating expenses charged, excluding interest, taxes and certain non-routine expenses to 0.58%.
21Schwab VIT Balanced with Growth Portfolio | Annual Report
Schwab VIT Balanced with Growth Portfolio
Financial Notes (continued)
4. Affiliates and Affiliated Transactions (continued):
The agreement to limit the fund’s total expenses charged is limited to the fund’s direct operating expenses and, therefore, does not apply to acquired fund fees and expenses, which are indirect expenses incurred by the fund through its investments in the underlying funds.
Investments in Affiliates
The fund may engage in certain transactions involving affiliated parties. Pursuant to an exemptive order issued by the SEC, the fund may invest in other affiliated ETFs and mutual funds. As of December 31, 2023, the Schwab VIT Balanced with Growth Portfolio’s ownership percentages of other affiliated funds’ shares are as follows:
Schwab Emerging Markets Equity ETF | |
Schwab International Equity ETF | |
Schwab International Small-Cap Equity ETF | |
Schwab Short-Term U.S. Treasury ETF | |
Schwab U.S. Aggregate Bond ETF | |
Schwab U.S. Large-Cap ETF | |
| |
Schwab U.S. Small-Cap ETF | |
| |
Schwab Variable Share Price Money Fund, Ultra Shares | |
The fund may engage in direct transactions with certain other funds in the Fund Complex in accordance with procedures adopted by the Board pursuant to Rule 17a-7 under the 1940 Act. When one fund is seeking to sell a security that another is seeking to buy, an interfund transaction can allow both funds to benefit by reducing transaction costs. This practice is limited to funds that share the same investment adviser, trustees and/or officers. For the period ended December 31, 2023, the fund’s purchases and sales of securities with other funds in the Fund Complex was $532,810 and $5,590,655 respectively, and includes realized gains of $667,009.
Interfund Borrowing and Lending
Pursuant to an exemptive order issued by the SEC, the fund may enter into interfund borrowing and lending transactions with other funds in the Fund Complex. All loans are for temporary or emergency purposes and the interest rate to be charged will be the average of the overnight repurchase agreement rate and the short-term bank loan rate. All loans are subject to numerous conditions designed to ensure fair and equitable treatment of all participating funds. The interfund lending facility is subject to the oversight and periodic review by the Board. The fund had no interfund borrowing or lending activity during the period.
The Board may include people who are officers and/or directors of the investment adviser or its affiliates. Federal securities law limits the percentage of such “interested persons” who may serve on a trust’s board, and the trust was in compliance with these limitations throughout the report period. The fund did not pay any of these interested persons for their services as trustees, but did pay non-interested persons (independent trustees), as noted in the fund’s Statement of Operations. For information regarding the trustees, please refer to the Trustees and Officers table at the end of this report.
During the period, the fund was a participant with other funds in the Fund Complex in a joint, syndicated, committed $1 billion line of credit (the Syndicated Credit Facility), which matured on September 28, 2023. On September 28, 2023, the Syndicated Credit Facility was amended to run for a new 364 day period with the line of credit amount remaining unchanged, maturing on September 26, 2024. Under the terms of the Syndicated Credit Facility, in addition to the interest charged on any borrowings by the fund, the fund paid a commitment fee of 0.15% per annum on the fund’s proportionate share of the unused portion of the Syndicated Credit Facility.
Schwab VIT Balanced with Growth Portfolio | Annual Report22
Schwab VIT Balanced with Growth Portfolio
Financial Notes (continued)
6. Borrowing from Banks (continued):
During the period, the fund was a participant with other funds in the Fund Complex in a joint, unsecured, uncommitted $400 million line of credit (the Uncommitted Credit Facility), with State Street Bank and Trust Company, which matured on September 28, 2023. On September 28, 2023, the Uncommitted Credit Facility was amended to run for a new 364 day period with the line of credit amount remaining unchanged, maturing on September 26, 2024. Under the terms of the Uncommitted Credit Facility, the fund pays interest on the amount it borrows. There were no borrowings by the fund from either line of credit during the period.
The fund also has access to custodian overdraft facilities. The fund may have utilized the overdraft facility and incurred an interest expense, which is disclosed in the fund’s Statement of Operations, if any. The interest expense is determined based on a negotiated rate above the current Federal Funds Rate.
7. Purchases and Sales of Investment Securities:For the period ended December 31, 2023, purchases and sales of securities (excluding short-term obligations) were as follows:
As of December 31, 2023, the tax basis cost of the fund’s investments and gross unrealized appreciation and depreciation were as follows:
| | GROSS UNREALIZED
APPRECIATION | GROSS UNREALIZED
DEPRECIATION | NET UNREALIZED
APPRECIATION
(DEPRECIATION) |
| | | | |
| | | | |
| | | | |
As of December 31, 2023, the components of distributable earnings on a tax basis were as follows:
UNDISTRIBUTED
ORDINARY
INCOME | UNDISTRIBUTED
LONG-TERM
CAPITAL GAINS | NET UNREALIZED
APPRECIATION
(DEPRECIATION)
ON INVESTMENTS | |
| | | |
The primary difference between book basis and tax basis unrealized appreciation or unrealized depreciation of investments is the tax deferral of losses on wash sales. The tax cost of the fund’s investments, disclosed above, have been adjusted from their book amounts to reflect these unrealized appreciation or depreciation differences, as applicable.
As of December 31, 2023, the fund had no capital loss carryforwards available to offset future realized capital gains for federal tax purposes. For the fiscal year ended December 31, 2023, the fund had capital loss carryforwards utilized of $585,828.
The tax basis components of distributions paid during the current and prior fiscal years were as follows:
| CURRENT FISCAL YEAR END DISTRIBUTIONS | PRIOR FISCAL YEAR END DISTRIBUTIONS |
| | | | |
| | | | |
Distributions paid to shareholders are based on net investment income and net realized gains determined on a tax basis, which may differ from net investment income and net realized gains for financial reporting purposes. These differences reflect the differing character of certain income items and net realized gains and losses for financial statement and tax purposes, and may result in reclassification among certain capital accounts in the financial statements. The fund may also designate a portion of the amount paid to redeeming shareholders as a distribution for tax purposes.
23Schwab VIT Balanced with Growth Portfolio | Annual Report
Schwab VIT Balanced with Growth Portfolio
Financial Notes (continued)
8. Federal Income Taxes (continued):
Permanent book and tax basis differences may result in reclassifications between components of net assets as required. The adjustments will have no impact on net assets or the results of operations.
As of December 31, 2023, management has reviewed the tax positions for open periods (for federal purposes, three years from the date of filing and for state purposes, four years from the date of filing) as applicable to the fund, and has determined that no provision for income tax is required in the fund’s financial statements. The fund recognizes interest and penalties, if any, related to unrecognized tax benefits as income tax expense in the fund’s Statement of Operations. During the fiscal year ended December 31, 2023, the fund did not incur any interest or penalties.
Management has determined there are no subsequent events or transactions through the date the financial statements were issued that would have materially impacted the financial statements as presented.
Schwab VIT Balanced with Growth Portfolio | Annual Report24
Schwab VIT Balanced with Growth Portfolio
Report of Independent Registered Public Accounting Firm
To the Board of Trustees of Schwab Annuity Portfolios and Shareholders of Schwab VIT Balanced with Growth Portfolio:
Opinion on the Financial Statements and Financial Highlights
We have audited the accompanying statement of assets and liabilities, including the portfolio holdings, of Schwab VIT Balanced with Growth Portfolio (the “Fund”), one of the funds constituting Schwab Annuity Portfolios, as of December 31, 2023, the related statement of operations for the year then ended, the statements of changes in net assets for each of the two years in the period then ended, the financial highlights for each of the four years in the period then ended, and the related notes. In our opinion, the financial statements and financial highlights present fairly, in all material respects, the financial position of the Fund as of December 31, 2023, and the results of its operations for the year then ended, the changes in its net assets for each of the two years in the period then ended, and the financial highlights for each of the four years in the period then ended in conformity with accounting principles generally accepted in the United States of America. The financial highlights for the year ended December 31, 2019 were audited by other auditors, whose report, dated February 18, 2020, expressed an unqualified opinion on such financial highlights.
These financial statements and financial highlights are the responsibility of the Fund’s management. Our responsibility is to express an opinion on the Fund’s financial statements and financial highlights based on our audits. We are a public accounting firm registered with the Public Company Accounting Oversight Board (United States) (PCAOB) and are required to be independent with respect to the Fund in accordance with the U.S. federal securities laws and the applicable rules and regulations of the Securities and Exchange Commission and the PCAOB.
We conducted our audits in accordance with the standards of the PCAOB. Those standards require that we plan and perform the audit to obtain reasonable assurance about whether the financial statements and financial highlights are free of material misstatement, whether due to error or fraud. The Fund is not required to have, nor were we engaged to perform, an audit of its internal control over financial reporting. As part of our audits, we are required to obtain an understanding of internal control over financial reporting but not for the purpose of expressing an opinion on the effectiveness of the Fund’s internal control over financial reporting. Accordingly, we express no such opinion.
Our audits included performing procedures to assess the risks of material misstatement of the financial statements and financial highlights, whether due to error or fraud, and performing procedures that respond to those risks. Such procedures included examining, on a test basis, evidence regarding the amounts and disclosures in the financial statements and financial highlights. Our audits also included evaluating the accounting principles used and significant estimates made by management, as well as evaluating the overall presentation of the financial statements and financial highlights. Our procedures included confirmation of securities owned as of December 31, 2023, by correspondence with the custodian and transfer agent. We believe that our audits provide a reasonable basis for our opinion.
Deloitte & Touche LLP
Denver, Colorado
February 16, 2024
We have served as the auditor of one or more investment companies in the Schwab Funds Complex since 2020.
25Schwab VIT Balanced with Growth Portfolio | Annual Report
Schwab VIT Balanced with Growth Portfolio
Other Federal Tax Information (unaudited)
The fund may elect to pass on the benefits of the foreign tax credit of $100,086 to its shareholders for the fiscal year ended December 31, 2023. The respective foreign source income on the fund is $1,052,269.
For corporate shareholders, 27.19% of the fund’s dividend distributions paid during the fiscal year ended December 31, 2023, qualify for the corporate dividends received deduction.
For the fiscal year ended December 31, 2023, the fund designates 50.25% of dividend income as business interest income under section 163(j) of the Internal Revenue Code.
Schwab VIT Balanced with Growth Portfolio | Annual Report26
Schwab VIT Balanced with Growth Portfolio
Liquidity Risk Management Program (unaudited)
The fund has adopted and implemented a liquidity risk management program (the “program”) as required by Rule 22e-4 under the Investment Company Act of 1940, as amended. The fund’s Board of Trustees (the “Board”) has designated the fund’s investment adviser, Charles Schwab Investment Management, Inc., dba Schwab Asset Management, as the administrator of the program. Personnel of the investment adviser or its affiliates conduct the day-to-day operation of the program.
Under the program, the investment adviser manages a fund’s liquidity risk, which is the risk that the fund could not meet shareholder redemption requests without significant dilution of remaining shareholders’ interests in the fund. The program is reasonably designed to assess and manage a fund’s liquidity risk, taking into consideration the fund’s investment strategy and the liquidity of its portfolio investments during normal and reasonably foreseeable stressed conditions; its historical redemption history and shareholder concentrations; and its cash holdings and access to other funding sources, including the custodian overdraft facility and lines of credit. The investment adviser’s process of determining the degree of liquidity of each fund’s investments is supported by third-party liquidity assessment vendors.
The fund’s Board reviewed a report at its meeting held on September 19, 2023 prepared by the investment adviser regarding the operation and effectiveness of the program for the period June 1, 2022, through May 31, 2023, which included individual fund liquidity metrics. The report summarized the operation of the program and the information and factors considered by the investment adviser in assessing whether the program has been adequately and effectively implemented with respect to a fund. In addition, the investment adviser provided its assessment that the program had been operating effectively in managing the fund’s liquidity risk.
27Schwab VIT Balanced with Growth Portfolio | Annual Report
Schwab VIT Balanced with Growth Portfolio
Trustees and Officers
The tables below give information about the trustees and officers of Schwab Annuity Portfolios, which includes the fund covered in this report. The “Fund Complex” includes The Charles Schwab Family of Funds, Schwab Capital Trust, Schwab Investments, Schwab Annuity Portfolios, Schwab Strategic Trust and Laudus Trust. The Fund Complex includes 106 funds.
The address for all trustees and officers is 211 Main Street, San Francisco, CA 94105. You can find more information about the trustees and officers in the fund’s Statement of Additional Information, which is available free by calling 1-877-824-5615.
|
Name, Year of Birth, and Position(s) with the trust (Terms of office, and length of Time Served1) | Principal Occupations During the Past Five Years | Number of Portfolios in Fund Complex Overseen by the Trustee | |
Michael J. Beer 1961 Trustee (Trustee of The Charles Schwab Family of Funds, Schwab Investments, Schwab Capital Trust, Schwab Annuity Portfolios, Schwab Strategic Trust and Laudus Trust since 2022) | Retired. Director, President and Chief Executive Officer (Dec. 2016 – Sept. 2019), Principal Funds (investment management). | | Director (2016 – 2019), Principal Funds, Inc. |
Robert W. Burns 1959 Trustee (Trustee of Schwab Strategic Trust since 2009; The Charles Schwab Family of Funds, Schwab Investments, Schwab Capital Trust, Schwab Annuity Portfolios and Laudus Trust since 2016) | Retired/Private Investor. | | |
Nancy F. Heller 1956 Trustee (Trustee of The Charles Schwab Family of Funds, Schwab Investments, Schwab Capital Trust, Schwab Annuity Portfolios, Schwab Strategic Trust and Laudus Trust since 2018) | | | |
David L. Mahoney 1954 Trustee (Trustee of The Charles Schwab Family of Funds, Schwab Investments, Schwab Capital Trust, Schwab Annuity Portfolios and Laudus Trust since 2011; Schwab Strategic Trust since 2016) | | | Director (2004 – present), Corcept Therapeutics Incorporated Director (2009 – 2021), Adamas Pharmaceuticals, Inc. Director (2003 – 2019), Symantec Corporation |
Jane P. Moncreiff 1961 Trustee (Trustee of The Charles Schwab Family of Funds, Schwab Investments, Schwab Capital Trust, Schwab Annuity Portfolios, Schwab Strategic Trust and Laudus Trust since 2019) | Consultant (2018 – present), Fulham Advisers LLC (management consulting); Chief Investment Officer (2009 – 2017), CareGroup Healthcare System, Inc. (healthcare). | | |
Schwab VIT Balanced with Growth Portfolio | Annual Report28
Schwab VIT Balanced with Growth Portfolio
Independent Trustees (continued) |
Name, Year of Birth, and Position(s) with the trust (Terms of office, and length of Time Served1) | Principal Occupations During the Past Five Years | Number of Portfolios in Fund Complex Overseen by the Trustee | |
Kimberly S. Patmore 1956 Trustee (Trustee of The Charles Schwab Family of Funds, Schwab Investments, Schwab Capital Trust, Schwab Annuity Portfolios, Schwab Strategic Trust and Laudus Trust since 2016) | Consultant (2008 – present), Patmore Management Consulting (management consulting). | | |
J. Derek Penn 1957 Trustee (Trustee of The Charles Schwab Family of Funds, Schwab Investments, Schwab Capital Trust, Schwab Annuity Portfolios, Schwab Strategic Trust and Laudus Trust since 2021) | Head of Equity Sales and Trading (2006 – 2018), BNY Mellon (financial services). | | |
|
Name, Year of Birth, and Position(s) with the trust (Terms of office, and length of Time Served1) | Principal Occupations During the Past Five Years | Number of Portfolios in Fund Complex Overseen by the Trustee | |
Walter W. Bettinger II2 1960 Chairman and Trustee (Trustee of The Charles Schwab Family of Funds, Schwab Investments, Schwab Capital Trust and Schwab Annuity Portfolios since 2008; Schwab Strategic Trust since 2009; Laudus Trust since 2010) | Co-Chairman of the Board (July 2022 – present), Director and Chief Executive Officer (Oct. 2008 – present) and President (Feb. 2007 – Oct. 2021), The Charles Schwab Corporation; President and Chief Executive Officer (Oct. 2008 – Oct. 2021) and Director (May 2008 – Oct. 2021), Charles Schwab & Co., Inc.; Co-Chairman of the Board (July 2022 – present) and Director (Apr. 2006 – present), Charles Schwab Bank, SSB; Co-Chairman of the Board (July 2022 – present) and Director (Nov. 2017 – present), Charles Schwab Premier Bank, SSB; Co-Chairman of the Board (July 2022 – present) and Director (July 2019 – present), Charles Schwab Trust Bank; Director (May 2008 – present), Chief Executive Officer (Aug. 2017 – present) and President (Aug. 2017 – Nov. 2021), Schwab Holdings, Inc.; Manager (Sept. 2023 – present), TD Ameritrade Holding LLC; Director (Oct. 2020 – Aug. 2023), TD Ameritrade Holding Corporation; Director (July 2016 – Oct. 2021), Charles Schwab Investment Management, Inc. | | Director (2008 – present), The Charles Schwab Corporation |
Richard A. Wurster2 1973 Trustee (Trustee of The Charles Schwab Family of Funds, Schwab Investments, Schwab Capital Trust, Schwab Annuity Portfolios, Schwab Strategic Trust and Laudus Trust since 2022) | President (Oct. 2021 – present) and Executive Vice President – Schwab Asset Management Solutions (Apr. 2019 – Oct. 2021), The Charles Schwab Corporation; President, Director (Oct. 2021 – present), Executive Vice President – Schwab Asset Management Solutions (July 2019 – Oct. 2021) and Senior Vice President – Advisory (May 2016 – July 2019), Charles Schwab & Co., Inc.; President (Nov. 2021 – present), Schwab Holdings, Inc.; Director (Oct. 2021 – present) and Chief Executive Officer (Nov. 2019 – Jan. 2022), Charles Schwab Investment Management, Inc.; Director, Chief Executive Officer and President (Mar. 2018 – Oct. 2022), Charles Schwab Investment Advisory, Inc.; Chief Executive Officer (July 2016 – Apr. 2018) and President (Mar. 2017 – Apr. 2018), ThomasPartners, Inc.; Chief Executive Officer (July 2016 – Apr. 2018), Windhaven Investment Management, Inc. | | |
29Schwab VIT Balanced with Growth Portfolio | Annual Report
Schwab VIT Balanced with Growth Portfolio
|
Name, Year of Birth, and Position(s) with the trust (Terms of office, and length of Time Served3) | Principal Occupations During the Past Five Years |
Omar Aguilar 1970 Chief Executive Officer, President and Chief Investment Officer (Officer of The Charles Schwab Family of Funds, Schwab Investments, Schwab Capital Trust, Schwab Annuity Portfolios, Schwab Strategic Trust and Laudus Trust since 2011) | Chief Executive Officer (Jan. 2022 – present), President (Oct. 2023 – present), (Chief Investment Officer (Apr. 2011 – present) and Senior Vice President (Apr. 2011 – Jan. 2022), Charles Schwab Investment Management, Inc.; Director, Chief Executive Officer and President (Oct. 2022 – present), Charles Schwab Investment Advisory, Inc.; Chief Executive Officer (Sept. 2023 – present), President (Oct. 2023 – present), Chief Investment Officer (June 2011 – present) and Vice President (June 2011 – Sept. 2023), Schwab Funds, Laudus Trust and Schwab ETFs. |
Mark Fischer 1970 Chief Operating Officer (Officer of The Charles Schwab Family of Funds, Schwab Investments, Schwab Capital Trust, Schwab Annuity Portfolios, Schwab Strategic Trust and Laudus Trust since 2013) | Chief Operating Officer (Dec. 2020 – present) and Treasurer and Chief Financial Officer (Jan. 2016 – Dec. 2022), Schwab Funds, Laudus Trust and Schwab ETFs; Chief Financial Officer (Mar. 2020 – present), Chief Operating Officer (Oct. 2023 – present), Managing Director (Mar. 2023 – present) and Vice President (Oct. 2013 – Mar. 2023), Charles Schwab Investment Management, Inc. |
Dana Smith 1965 Treasurer and Chief Financial Officer (Officer of The Charles Schwab Family of Funds, Schwab Investments, Schwab Capital Trust, Schwab Annuity Portfolios, Schwab Strategic Trust and Laudus Trust since 2023) | Treasurer and Chief Financial Officer (Jan. 2023 – present) and Assistant Treasurer (Dec. 2015 – Dec. 2022), Schwab Funds, Laudus Trust and Schwab ETFs; Managing Director (Mar. 2023 – present), Vice President (Mar. 2022 – Mar. 2023) and Director (Oct. 2015 – Mar. 2022), Charles Schwab Investment Management, Inc.; Managing Director (May 2022 – present) and Vice President (Apr. 2022 – May 2022), Charles Schwab & Co., Inc. |
Patrick Cassidy 1964 Vice President and Chief Investment Officer (Officer of The Charles Schwab Family of Funds, Schwab Investments, Schwab Capital Trust, Schwab Annuity Portfolios, Schwab Strategic Trust and Laudus Trust since 2018) | Chief Investment Officer (Oct. 2023 – present) and Vice President (Feb. 2018 – present), Schwab Funds, Laudus Trust and Schwab ETFs; Managing Director (Mar. 2023 – present), Chief Investment Officer (Oct. 2023 – present), and Senior Vice President (Oct. 2012 – Mar. 2023), Charles Schwab Investment Management, Inc. |
William P. McMahon, Jr. 1972 Vice President and Chief Investment Officer (Officer of The Charles Schwab Family of Funds, Schwab Investments, Schwab Capital Trust, Schwab Annuity Portfolios, Schwab Strategic Trust and Laudus Trust since 2021) | Managing Director (Mar. 2023 – present), Senior Vice President (Jan. 2020 – Mar. 2023) and Chief Investment Officer (Jan. 2020 – present) Charles Schwab Investment Management, Inc.; Vice President and Chief Investment Officer (June 2021 – present), Schwab Funds, Laudus Trust and Schwab ETFs; Senior Vice President and Chief Investment Officer – ThomasPartners Strategies (Apr. 2018 – Dec. 2019), Charles Schwab Investment Advisory, Inc.; Senior Vice President and Chief Investment Officer (May 2001 – Apr. 2018), ThomasPartners, Inc. |
Catherine MacGregor 1964 Chief Legal Officer and Secretary, Schwab Funds and Schwab ETFs Chief Legal Officer, Vice President and Clerk, Laudus Trust (Officer of The Charles Schwab Family of Funds, Schwab Investments, Schwab Capital Trust, Schwab Annuity Portfolios and Laudus Trust since 2005; Schwab Strategic Trust since 2009) | Chief Legal Officer (Mar. 2022 – present), Managing Director (Mar. 2023 – present) and Vice President (Sept. 2005 – Mar. 2023), Charles Schwab Investment Management, Inc.; Managing Director (May 2022 – present) and Vice President (Aug. 2005 – May 2022), Charles Schwab & Co., Inc.; Vice President (Dec. 2005 – present) and Chief Legal Officer and Clerk (Mar. 2007 – present), Laudus Trust; Chief Legal Officer and Secretary (Oct. 2021 – present), Vice President (Nov. 2005 – Oct. 2021) and Assistant Secretary (June 2007 – Oct. 2021), Schwab Funds; Chief Legal Officer and Secretary (Oct. 2021 – present), Vice President and Assistant Secretary (Oct. 2009 – Oct. 2021), Schwab ETFs. |
1
Each Trustee shall hold office until the election and qualification of his or her successor, or until he or she dies, resigns or is removed. The retirement policy requires that each independent trustee retire by December 31 of the year in which the Trustee turns 74 or the Trustee’s twentieth year of service as an independent trustee on any trust in the Fund Complex, whichever occurs first.
2
Mr. Bettinger and Mr. Wurster are Interested Trustees. Mr. Bettinger and Mr. Wurster are Interested Trustees because each owns stock of The Charles Schwab Corporation (CSC), the parent company of Charles Schwab Investment Management, Inc., the investment adviser for the trusts in the Fund Complex, and is an employee of Charles Schwab & Co., Inc. (Schwab), the principal underwriter for The Charles Schwab Family of Funds, Schwab Investments, Schwab Capital Trust, Schwab Annuity Portfolios and Laudus Trust.
3
The President, Treasurer and Secretary/Clerk hold office until their respective successors are chosen and qualified or until he or she sooner dies, resigns, is removed or becomes disqualified. Each of the other officers serves at the pleasure of the Board.
Schwab VIT Balanced with Growth Portfolio | Annual Report30
Schwab VIT Balanced with Growth Portfolio
Bloomberg US Aggregate Bond Index An index that is a broad-based benchmark measuring the performance of the U.S. investment grade, taxable bond market, including U.S. Treasuries, government-related and corporate bonds, mortgage pass-through securities, commercial mortgage-backed securities, and asset-backed securities that are publicly available for sale in the United States. To be eligible for inclusion in the index, securities must be fixed rate, non-convertible, U.S. dollar-denominated with at least $300 million or more of outstanding face value and have one or more years remaining to maturity. The index excludes certain types of securities, including tax-exempt state and local government series bonds, structured notes embedded with swaps or other special features, private placements, floating rate securities, inflation-linked bonds and Eurobonds. The index is market capitalization weighted and the securities in the index are updated on the last business day of each month.
Bloomberg US Treasury 1–3 Year Index An index which includes all publicly-issued U.S. Treasury securities that have a remaining maturity of greater than or equal to one year and less than three years, are rated investment grade, and have $300 million or more of outstanding face value. The securities in the index must be denominated in U.S. dollars and must be fixed-rate and non-convertible. The index excludes state and local government series bonds and coupon issues that have been stripped from bonds. The index is market capitalization weighted and the securities in the index are updated on the last business day of each month.
Bloomberg US Treasury 3–10 Year Index An index which includes all publicly-issued U.S. Treasury securities that have a remaining maturity of greater than or equal to three years and less than ten years, are rated investment grade, and have $300 million or more of outstanding face value. The securities in the index must be denominated in U.S. dollars and must be fixed-rate and non-convertible. The index excludes state and local government series bonds and coupon issues that have been stripped from bonds. The index is market capitalization weighted and the securities in the index are updated on the last business day of each month.
Bloomberg US Treasury Bills 1–3 Month Index An index that includes all publicly issued zero-coupon U.S. Treasury Bills that have a remaining maturity of less than 3 months but more than 1 month, are rated investment grade and have $300 million or more of outstanding face value. It excludes zero-coupon STRIPS.
Bloomberg US Treasury Inflation-Linked Bond Index (Series-L) An index which includes all publicly-issued U.S. Treasury Inflation-Protected Securities (TIPS) that have at least one year remaining to maturity, are rated investment grade and have $500 million or more of outstanding face value. The TIPS in the index must be denominated in U.S. dollars and must be fixed-rate and non-convertible. The index is market capitalization weighted and the TIPS in the index are updated on the last business day of each month. TIPS are publicly issued, dollar denominated U.S. Government securities issued by the U.S. Treasury that have principal and interest payments linked to an official inflation measure (as measured by the Consumer Price Index, or CPI) and their payments are supported by the full faith and credit of the United States.
Dow Jones Equity All REIT Capped Index A float-adjusted market cap weighted index that is designed to measure all equity real estate investment trusts (REITs) in the Dow Jones U.S. Total Stock Market Index, as defined by the S&P Dow Jones Indices REIT/RESI Industry Classification Hierarchy, that meet the minimum float market capitalization (FMC) and liquidity thresholds. The aggregate weight of
all companies weighing more than 4.5% cannot exceed 22.5%, and no single company’s weight can exceed 10%. The index is reviewed daily based on each company’s capped market capitalization weight. Daily capping is only performed when the sum of companies with weights greater than 5% exceeds 25%.
Dow Jones U.S. Large-Cap Total Stock Market Index An index that is a subset of the Dow Jones U.S. Total Stock Market Index, and is designed to measure the performance of large-cap U.S. equity securities. The index is a float-adjusted market capitalization weighted index.
Dow Jones U.S. Select REIT Index An index that is a float-adjusted market-capitalization weighted index comprised of income-producing commercial and/or residential real estate investment trusts (REITs). The index excludes mortgage REITs, net-lease REITs, real estate finance companies, mortgage brokers and bankers, commercial and residential real estate brokers and estate agents, homebuilders, large landowners and sub-dividers of unimproved land, hybrid REITs, timber REITs and companies that have more than 25% of their assets in direct mortgage investments.
Dow Jones U.S. Small-Cap Total Stock Market Index An index that is a subset of the Dow Jones U.S. Total Stock Market Index, and is designed to measure the performance of small-cap U.S. equity securities. The index is a float-adjusted market capitalization weighted index.
Dow Jones U.S. Total Stock Market Index An index which includes all U.S. equity issues with readily available prices. The index is a float-adjusted market capitalization weighted index that reflects the shares of securities actually available to investors in the marketplace.
FTSE Developed ex US Index (Net) An index that is comprised of large- and mid-capitalization companies in developed countries outside the United States, as defined by the index provider. The index defines the large- and mid-capitalization universe as approximately the top 90% of the eligible universe. The Net version of the index reflects reinvested dividends net of withholding taxes, but reflects no deductions for expenses or other taxes.
FTSE Developed Small Cap ex US Liquid Index (Net) An index comprised of small-capitalization companies in developed countries outside the United States, as defined by the index provider. The index defines the small-capitalization universe as approximately the bottom 10% of the eligible universe with a minimum free float capitalization of $150 million. The Net version of the index reflects reinvested dividends net of withholding taxes, but reflects no deductions for expenses or other taxes.
FTSE Emerging Index (Net) An index that is comprised of large- and mid-capitalization companies in emerging market countries, as defined by the index provider. The index defines the large- and mid-capitalization universe as approximately the top 90% of the eligible universe. The Net version of the index reflects reinvested dividends net of withholding taxes, but reflects no deductions for expenses or other taxes.
FTSE non-US Dollar World Government Bond Index A market capitalization index that measures the total rate of return performance for the government bonds of 22 countries, excluding the U.S., with a remaining maturity of at least 1 year.
31Schwab VIT Balanced with Growth Portfolio | Annual Report
Schwab VIT Balanced with Growth Portfolio
MSCI EAFE Index (Net) A free float-adjusted market capitalization index that is designed to measure the equity market performance of developed markets in Europe, Australasia, and the Far East. The Net version of the index reflects reinvested dividends net of withholding taxes, but reflects no deductions for expenses or other taxes; returns are calculated applying dividend withholding rates applicable to non-resident persons who do not benefit from double taxation treaties.
MSCI Emerging Markets Index (Net) A free float-adjusted market capitalization weighted index that is designed to measure equity market performance in the global emerging markets. This series approximates the minimum possible dividend reinvestment. The returns are calculated applying dividend withholding rates applicable to non-resident persons who do not benefit from double taxation treaties.
Russell 2000 Index An index that measures the performance of the 2,000 smallest companies in the Russell 3000 Index. The Russell 3000 Index measures the performance of the largest 3,000 U.S. companies representing approximately 98% of the investable U.S. equity market.
S&P 500 Index An index that is designed to measure the performance of 500 leading publicly traded companies from a broad range of industries.
VIT Balanced with Growth Composite Index A custom blended index developed by Schwab Asset Management based on a comparable portfolio asset allocation and calculated using the following portion allocations effective April 28, 2023: 26.1% Bloomberg US Aggregate Bond Index, 3.9% Bloomberg US Treasury 1-3 Year Index, 4.0% Bloomberg US Treasury Bills 1-3 Month Index, 1.0% Bloomberg US Treasury Inflation-Linked Bond Index (Series-L), 4.6% Dow Jones Equity All REIT Capped Index, 34.0% Dow Jones U.S. Large Cap Total Stock Market Index, 4.2% Dow Jones U.S. Small Cap Total Stock Market Index, 3.2% FTSE All Emerging Index (Net), 16.0% FTSE Developed ex US Index (Net), and 3.0% FTSE Developed Small Cap ex US Liquid Index (Net). From July 1, 2020 through April 27, 2023, the blended index was derived using the following allocations: 26.1% Bloomberg US Aggregate Bond Index, 3.9% Bloomberg US Treasury 1-3 Year Index, 4.0% Bloomberg US Treasury Bills 1-3 Month Index,
1.0% Bloomberg US Treasury Inflation-Linked Bond Index (Series-L), 6.0% Dow Jones Equity All REIT Capped Index, 27.0% Dow Jones U.S. Large-Cap Total Stock Market Index, 6.0% Dow Jones U.S. Small-Cap Total Stock Market Index, 6.0% FTSE All Emerging Index (Net), 17.0% FTSE Developed ex US Index (Net), 3.0% FTSE Developed Small Cap ex US Liquid Index (Net). From April 29, 2020 through June 30, 2020, the blended index was derived using the following allocations: 26.1% Bloomberg US Aggregate Bond Index, 3.9% Bloomberg US Treasury 1-3 Year Index, 4.0% Bloomberg US Treasury Bills 1-3 Month Index, 1.0% Bloomberg US Treasury Inflation-Linked Bond Index (Series-L), 6.0% Dow Jones U.S. Select REIT Index, 27.0% Dow Jones U.S. Large-Cap Total Stock Market Index, 6.0% Dow Jones U.S. Small-Cap Total Stock Market Index, 6.0% FTSE All Emerging Index (Net), 17.0% FTSE Developed ex US Index (Net), 3.0% FTSE Developed Small Cap ex US Liquid Index (Net). From June 8, 2016 through April 28, 2020, the blended index was derived using the following allocations: 1% Bloomberg Global Treasury ex-US Capped Index, 27% Bloomberg US Aggregate Bond Index, 5% Bloomberg US Treasury Bills 1-3 Month Index, 2% Bloomberg US Treasury Inflation-Linked Bond Index (Series-L), 4% Bloomberg Commodity Index, 6% Dow Jones U.S. Select REIT Index, 22% Dow Jones U.S. Large-Cap Total Stock Market Index, 6% Dow Jones U.S. Small-Cap Total Stock Market Index, 6% FTSE All Emerging Index (Net), 17% FTSE Developed ex US Index (Net), 3% FTSE Developed Small Cap ex US Liquid Index (Net), and 1% Russell Microcap Index. Prior to June 8, 2016, the composite index was derived using the following allocations: 22% Dow Jones U.S. Large-Cap Total Stock Market Index, 6% Dow Jones U.S. Small-Cap Total Stock Market Index, 1% Russell Microcap Index, 17% FTSE Developed ex US Index (Net), 3% FTSE Developed Small Cap ex US Liquid Index (Net), 6% FTSE Emerging Index (Net), 6% Dow Jones U.S. Select REIT Index, 4% Dow Jones UBS Commodity Index, 2% Bloomberg US Treasury Inflation-Linked Bond Index (Series-L), 9% Bloomberg US Treasury 3-10 Year Index, 2% Bloomberg US Aggregate: Agencies Index, 4% Bloomberg US Credit Index, 11% Bloomberg US Mortgage Backed Securities Index, 1% Bloomberg Global Treasury ex-US Capped Index, 1% Bloomberg High Yield Bond Very Liquid Index, and 5% Bloomberg US Treasury Bills 1-3 Month Index.
Schwab VIT Balanced with Growth Portfolio | Annual Report32
Annual Report | December 31, 2023
Schwab VIT Growth Portfolio
No Action Required – Notice Regarding Shareholder Report Delivery |
Beginning on July 24, 2024, fund shareholder reports will be streamlined to highlight key information deemed important for investors to assess and monitor their fund investments. Other information, including financial statements, will not appear in the streamlined shareholder reports but will available online and delivered free of charge upon request. |
• If you already receive the full shareholder reports, you will receive the streamlined shareholder reports in the same way that you currently receive the full shareholder reports (either in paper or electronically). |
• If you currently receive a notification when a shareholder report is available on a fund’s website, beginning July 24, 2024, you will begin to receive the streamlined shareholder report (in paper). |
Proxy Voting Policies, Procedures and Results
A description of the proxy voting policies and procedures used to determine how to vote proxies on behalf of the funds is available without charge, upon request, by visiting the Schwab Fund’s website at www.schwabassetmanagement.com/schwabfunds_prospectus, the SEC’s website at www.sec.gov, or by contacting Schwab Funds at 1-877-824-5615.
Information regarding how a fund voted proxies relating to portfolio securities during the most recent twelve-month period ended June 30 is available, without charge, by visiting Schwab’s website at www.schwabassetmanagement.com/schwabfunds_prospectus or the SEC’s website at www.sec.gov.
Investment Adviser: Charles Schwab Investment Management, Inc., dba Schwab Asset Management®
Schwab VIT Growth Portfolio
The Investment Environment
For the 12-month reporting period ended December 31, 2023, U.S. fixed-income and equity markets rebounded from their losses in 2022. U.S. stocks were volatile early in the reporting period as inflation remained elevated, the U.S. Federal Reserve (Fed) continued to raise interest rates, and the failure of three U.S. regional banks between early March and early May raised concerns about the stability of the banking sector. However, as the year wore on and inflation began to ease, as did the likelihood of further rate increases, stocks staged a strong upswing—particularly in the final two months of the year. International stocks followed the same trajectory for the most part. Outside the United States, the ongoing war between Russia and Ukraine and the Israel-Hamas war that broke out following Hamas’ attack on Israel in early October weighed on the global economy. The U.S. dollar, as measured against a basket of international currencies, vacillated within a relatively small range throughout the year, ending the reporting period slightly weaker than where it began. U.S. Treasury yields soared during the period, peaking in October before falling sharply over the final two months of the year. For the reporting period, the S&P 500® Index, a bellwether for the overall U.S. stock market, returned 26.29%. The MSCI EAFE® Index (Net)*, a broad measure of developed international equity performance, returned 18.24%. Emerging market equities were weaker but still posted gains, with the MSCI Emerging Markets Index (Net)* returning 9.83%. Among fixed-income markets, the Bloomberg US Aggregate Bond Index returned 5.53% and the FTSE non-US Dollar World Government Bond Index returned 5.83%.
Economies around the world grew out of sync as they wrestled with record levels of government debt, rising geopolitical tensions, and weak productivity gains that stifled economic growth. The U.S. economy continued to show unexpected resiliency over the reporting period. Surprisingly robust job growth and strong consumer spending helped propel U.S. gross domestic product (GDP) to a 4.9% annualized growth rate for the third quarter of 2023, up from roughly 2% for the prior three quarters. Inflation remained above the Fed’s historical 2% target over the reporting period but declined in the first half of the year as rents and wage growth eased, profit margins declined, and monetary policy remained restrictive, before ticking up slightly in July through September, declining again in October through November, and then ticking up again in December. The unemployment rate remained low throughout the reporting period.
Asset Class Performance Comparison % returns during the 12 months ended December 31, 2023
Index figures assume dividends and distributions were reinvested. Index figures do not include trading and management costs, which would lower performance. Indices are unmanaged and cannot be invested in directly. Performance results less than one year are not annualized. Past performance is not an indication of future results.
For index definitions, please see the Glossary.
Data source: Index provider websites and Schwab Asset Management.
Nothing in this report represents a recommendation of a security by the investment adviser.
Management views may have changed since the report date.
*
The net version of the index reflects reinvested dividends net of withholding taxes but reflects no deductions for expenses or other taxes.
Schwab VIT Growth Portfolio | Annual Report2
Schwab VIT Growth Portfolio
The Investment Environment (continued)
Oil prices were volatile during the reporting period but declined roughly 10% for the year, ending at just over $70 per barrel. Eurozone GDP was flat for the first quarter of 2023, expanded slightly for the second quarter of 2023 bolstered by a moderation of inflationary pressures, and contracted slightly for the third quarter of 2023 as financing conditions remained tight. The United Kingdom posted small gains in GDP growth for the first and second quarters of 2023 and contracted slightly for the third quarter of 2023 as household spending declined. In Japan, GDP rose for the first two quarters of 2023, primarily on rising exports and falling imports, but contracted for the third quarter of 2023 amid elevated cost pressures and mounting global headwinds. Among emerging markets, China’s GDP grew in the first three quarters of 2023 as the government’s various policies seeking to help the economy have offset the impact of a prolonged property crisis and weak trade. India’s GDP also grew throughout the period, driven primarily by robust performance in manufacturing, construction, utilities, and mining, along with strong government spending.
In its efforts to lower inflation, the Fed raised interest rates four times between January and July, increasing the federal funds rate from a range of 4.25% to 4.50% to a range of 5.25% to 5.50%. At its meetings in June, September, October, and December, the Fed maintained the then current rates citing robust economic activity, strong—though moderating—job gains, and low unemployment while acknowledging tighter financial and credit conditions for households and businesses. The Fed also maintained its program to reduce the assets held on its balance sheet, though its balance sheet temporarily spiked in March when the Fed supported banks after the failure of two U.S. regional banks (a third U.S. regional bank failed in early May). Despite that spike, the Fed’s balance sheet assets declined over the reporting period. Central banks outside the United States also battled with persistently high, albeit waning, inflation. After raising rates six times during the year, the European Central Bank held its rate steady since its October meeting as inflation and pricing pressures finally showed signs of easing. Similarly, the Bank of England maintained its key official bank rate since its September meeting, after five rate hikes through August, with borrowing costs at a 15-year high. In contrast, despite inflationary pressures, the Bank of Japan continued to uphold its short-term interest rate target of -0.1%, unchanged since 2016, but maintained its pledge to ramp up stimulus “without hesitation” if needed.
Over the first half of the reporting period, bond yields were volatile, generally following the course of U.S. Treasury yields, with a few short-lived market-moving events. The failure of three U.S. regional banks between early March and early May raised concerns about the stability of the banking sector. In addition, debt ceiling negotiations during the second quarter of 2023 created fear that the federal government could default on its obligations and on August 1, 2023, Fitch Ratings downgraded long-term U.S. debt from AAA to AA+ after indicating earlier in the year that a country refusing to pay its debts in a timely way was not entitled to a AAA rating. Yields rose throughout the third quarter, peaking early in the fourth quarter and driving bond prices to their lowest levels of the year. (Bond yields and bond prices typically move in opposite directions.) Over the final two months of the year yields retreated and bond prices rallied to end the year sharply higher. In October, the yield on the 10-year U.S. Treasury briefly touched 5%—a level not seen since 2007—but declined sharply to end the year at 3.88%, where it began the year. The yield on the three-month U.S. Treasury rose from 4.42% to 5.40% over the reporting period resulting in the yield curve inverting for the reporting period.
3Schwab VIT Growth Portfolio | Annual Report
Schwab VIT Growth Portfolio
| Zifan Tang, Ph.D., CFA, Senior Portfolio Manager for Schwab Asset Management, is responsible for the co-management of the fund. Prior to joining Schwab in 2012, Ms. Tang was a product manager at Thomson Reuters and from 1997 to 2009 worked as a portfolio manager at Barclays Global Investors (now known as BlackRock). |
| Drew Hayes, CFA, Portfolio Manager for Schwab Asset Management, is responsible for the co-management of the fund. Mr. Hayes has been with Schwab since 2006. Before becoming a portfolio manager, he spent seven years as a senior fixed income specialist for Schwab Wealth Advisory, Inc. Prior to that, he worked as a bond investment specialist for two years and as a registered representative for two years for Charles Schwab & Co., Inc. |
| Patrick Kwok, CFA, Portfolio Manager for Schwab Asset Management, is responsible for the co-management of the fund. Previously, Mr. Kwok served as an associate portfolio manager from 2012 to 2016. Prior to that, he worked as a fund administration manager, where he was responsible for oversight of sub-advisers, trading, cash management, and fund administration supporting the Charles Schwab Trust Bank Collective Investment Trusts and multi-asset Schwab Funds. Prior to joining Schwab Asset Management in 2008, Mr. Kwok spent two years as an asset operations specialist at Charles Schwab Trust Company. He also worked for one year at State Street Bank & Trust as a portfolio accountant and pricing specialist. |
Schwab VIT Growth Portfolio | Annual Report4
Schwab VIT Growth Portfolio as of December 31, 2023
The Schwab VIT Growth Portfolio (the fund) seeks to provide long-term capital appreciation. To pursue its goal, the fund aims to provide diversification across major asset classes, including domestic equity securities, international equity securities, real assets, fixed-income securities, and money market investments, as well as diversification across a range of sub-asset classes within the major asset classes.
The fund is considered a “fund-of-funds” in that it gains exposure to these asset classes by primarily investing in affiliated exchange-traded funds (ETFs) from Schwab Funds. The fund may also invest in affiliated mutual funds from Schwab Funds and unaffiliated third-party ETFs and mutual funds. The fund uses the internally calculated VIT Growth Composite Index (the composite index) as a performance gauge. The composite index comprises 82% equity, 14% fixed income, and 4% cash.
Market Highlights. For the 12-month reporting period ended December 31, 2023, U.S. fixed-income and equity markets rebounded from their losses in 2022. U.S. stocks were volatile early in the reporting period as inflation remained elevated, the U.S. Federal Reserve (Fed) continued to raise interest rates, and the failure of three U.S. regional banks between early March and early May raised concerns about the stability of the banking sector. However, as the year wore on and inflation began to ease, as did the likelihood of further rate increases, stocks staged a strong upswing—particularly in the final two months of the year. International stocks followed the same trajectory for the most part. Outside the United States, the ongoing war between Russia and Ukraine and the Israel-Hamas war that broke out following Hamas’ attack on Israel in early October weighed on the global economy. The U.S. dollar, as measured against a basket of international currencies, vacillated within a relatively small range throughout the year, ending the reporting period slightly weaker than where it began. U.S. Treasury yields soared during the period, peaking in October before falling sharply over the final two months of the year.
Performance. For the 12-month reporting period ended December 31, 2023, the fund returned 17.52%. The Dow Jones U.S. Total Stock Market Index and the Bloomberg US Aggregate Bond Index, reflecting broad-based U.S. stock and bond market performance, returned 26.06% and 5.53%, respectively. The composite index, described above, returned 17.96%.
Positioning and Strategies. The fund’s allocations were broadly in line with those of the composite index.
The fund’s U.S. equity exposure contributed the most to the total return of the fund. The Schwab U.S. Large-Cap ETF was the largest contributor to the total return of the fund, returning approximately 27% for the reporting period and tracking its comparative index component. The Schwab U.S. Small-Cap ETF also contributed to the total return of the fund, returning approximately 18% for the reporting period and generally tracking its comparative index component.
The fund’s international equity exposure also contributed to the total return of the fund. The Schwab International Equity ETF, Schwab International Small-Cap Equity ETF, and Schwab Emerging Markets Equity ETF contributed to the total return of the fund, returning approximately 18%, 14%, and 9%, respectively, for the reporting period and generally tracking their comparative index components.
The fund’s fixed-income exposure also contributed to the total return of the fund. The Schwab U.S. Aggregate Bond ETF contributed to the total return of the fund, returning approximately 6% for the reporting period and generally tracking its comparative index component.
The fund’s real estate exposure, the Schwab U.S. REIT ETF, also contributed to the total return of the fund, returning approximately 11% for the reporting period and generally tracking its comparative index component.
Management views and portfolio holdings may have changed since the report date.
5Schwab VIT Growth Portfolio | Annual Report
Schwab VIT Growth Portfolio
Performance and Fund Facts as of December 31, 2023
The performance data quoted represents past performance. Past performance does not guarantee future results. Investment returns and principal value will fluctuate so that an investor’s shares may be worth more or less than their original cost. Current performance may be lower or higher than performance data quoted. To obtain performance information current to the most recent month end, please visit www.schwabassetmanagement.com/schwabfunds_prospectus.
Performance of Hypothetical $10,000 Investment (December 31, 2013 – December 31, 2023)1
Average Annual Total Returns1
| | | |
Fund: Schwab VIT Growth Portfolio (07/25/12) | | | |
| | | |
Bloomberg US Aggregate Bond Index | | | |
VIT Growth Composite Index | | | |
Fund Category: Moderately Aggressive Allocation2 | | | |
Fund Expense Ratio3: 0.55% |
All total return figures on this page assume dividends and distributions were reinvested. Index figures do not include trading and management costs, which would lower performance. Indices are unmanaged and cannot be invested in directly. Performance results less than one year are not annualized.
The components that make up the composite index may vary over time. For index definitions, please see the Glossary.
1
Fund expenses may have been partially absorbed by the investment adviser and its affiliates. Without these reductions, the fund’s returns would have been lower. Fund performance does not reflect the additional fees and expenses imposed by the insurance company under the variable insurance product contract. If those contract fees and expenses were included, the performance would be less than that shown. Please refer to the variable insurance product prospectus for a complete listing of these expenses.
2
Source for category information: Morningstar, Inc. The Morningstar Category return represents all active and index mutual funds and ETFs within the category as of the report date.
3
As stated in the prospectus. Includes 0.06% of acquired fund fees and expenses (AFFE), which are indirect expenses incurred by the fund through its investments in the underlying funds. Reflects the total annual fund operating expenses without contractual fee waivers. For actual expense ratios during the period, not including AFFE, refer to the Financial Highlights section of the financial statements.
Schwab VIT Growth Portfolio | Annual Report6
Schwab VIT Growth Portfolio
Performance and Fund Facts as of December 31, 2023 (continued)
Asset Class Weightings % of Investments1,2
Top Holdings % of Net Assets1,3
Portfolio holdings may have changed since the report date.
1
The fund intends to primarily invest in affiliated Schwab ETFs and may also invest in affiliated Schwab Funds and unaffiliated third-party ETFs and mutual funds (all such ETFs and mutual funds referred to as “underlying funds”). The fund may also invest directly in equity, fixed-income, or other securities or investments, as appropriate, consistent with its investment objectives, strategies, and policies.
2
The percentage may differ from the Portfolio Holdings because the above calculation is based on a percentage of total investments, whereas the calculation in the Portfolio Holdings is based on a percentage of net assets.
3
This list is not a recommendation of any security by the investment adviser.
7Schwab VIT Growth Portfolio | Annual Report
Schwab VIT Growth Portfolio
Fund Expenses (Unaudited)
Examples for a $1,000 Investment
As a fund shareholder, you may incur two types of costs: (1) transaction costs; and (2) ongoing costs, including management fees, transfer agent fees, and other fund expenses.
The expense examples below are intended to help you understand your ongoing cost (in dollars) of investing in the fund and to compare this cost with the ongoing cost of investing in other mutual funds. These examples are based on an investment of $1,000 invested for six months beginning July 1, 2023 and held through December 31, 2023.
The Actual Return line in the table below provides information about actual account values and actual expenses. You may use this information, together with the amount you invested, to estimate the expenses that you paid over the period. To do so, simply divide your account value by $1,000 (for example, an $8,600 account value ÷ $1,000 = 8.6), then multiply the result by the number given for the fund under the heading entitled “Expenses Paid During Period.”
The Hypothetical Return line in the table below provides information about hypothetical account values and hypothetical expenses based on the fund’s actual expense ratio and an assumed return of 5% per year before expenses. Because the return used is not an actual return, it may not be used to estimate the actual ending account value or expenses you paid for the period.
You may use this information to compare the ongoing costs of investing in the fund and other funds. To do so, compare this 5% hypothetical example with the 5% hypothetical examples that appear in the shareholder reports of the other funds.
Please note that the expenses shown in the table are meant to highlight your ongoing costs only, and do not reflect any transactional costs. Therefore, the hypothetical return line of the table is useful in comparing ongoing costs only, and will not help you determine the relative total costs of owning different funds. In addition, if these transactional costs were included, your costs would have been higher.
| | | BEGINNING
ACCOUNT VALUE
AT 7/1/23 | ENDING
ACCOUNT VALUE
(NET OF EXPENSES)
| EXPENSES PAID
DURING PERIOD
| EFFECTIVE
EXPENSES PAID
DURING PERIOD
|
Schwab VIT Growth Portfolio | | | | | | |
| | | | | | |
| | | | | | |
| Based on the most recent six-month expense ratio. |
| Excludes acquired fund fees and expenses, which are indirect expenses incurred by the fund through its investments in underlying funds. |
| Based on the most recent six-month acquired fund fees and expenses and the expense ratio; may differ from the acquired fund fees and expenses and the expense ratio in the prospectus. |
| Includes acquired fund fees and expenses, which are indirect expenses incurred by the fund through its investments in underlying funds. |
| Expenses for the fund are equal to its annualized expense ratio, multiplied by the average account value over the period, multiplied by 184 days in the period, and divided by 365 days in the fiscal year. |
Schwab VIT Growth Portfolio | Annual Report8
Schwab VIT Growth Portfolio
Financial Statements
| | | | | | |
|
Net asset value at beginning of period | | | | | | |
Income (loss) from investment operations: | | | | | | |
Net investment income (loss)1 | | | | | | |
Net realized and unrealized gains (losses) | | | | | | |
Total from investment operations | | | | | | |
| | | | | | |
Distributions from net investment income | | | | | | |
Distributions from net realized gains | | | | | | |
| | | | | | |
Net asset value at end of period | | | | | | |
| | | | | | |
|
Ratios to average net assets: | | | | | | |
| | | | | | |
Gross operating expenses2 | | | | | | |
Net investment income (loss) | | | | | | |
| | | | | | |
Net assets, end of period (x 1,000) | | | | | | |
| Calculated based on the average shares outstanding during the period. |
| Ratio excludes acquired fund fees and expenses, which are indirect expenses incurred by the fund through its investments in underlying funds. |
| Ratio includes less than 0.005% of non-routine proxy expenses. |
9Schwab VIT Growth Portfolio | Annual Report
Schwab VIT Growth Portfolio
Portfolio Holdings as of December 31, 2023
This section shows all the securities in the fund’s portfolio and their values as of the report date, including a summary of the fund’s transactions with its affiliated underlying funds during the period.
The fund files its complete schedule of portfolio holdings with the U.S. Securities and Exchange Commission (SEC) for the first and third quarters of each fiscal year on Form N-PORT Part F. The fund’s Form N-PORT Part F is available on the SEC’s website at www.sec.gov. The fund also makes available its complete schedule of portfolio holdings on the fund’s website at www.schwabassetmanagement.com/schwabfunds_prospectus, typically 60-80 days after the end of the fund’s fiscal quarter.
| | | | | NET CHANGE IN UNREALIZED APPRECIATION (DEPRECIATION) | | BALANCE OF SHARES HELD AT 12/31/23 | |
AFFILIATED UNDERLYING FUNDS 98.9% OF NET ASSETS |
|
|
|
Schwab U.S. Large-Cap ETF | | | | | | | | |
|
Schwab U.S. Small-Cap ETF | | | | | | | | |
| | | | | | | | |
|
International Stocks 30.0% |
|
Schwab International Equity ETF | | | | | | | | |
Schwab International Small-Cap Equity ETF | | | | | | | | |
| | | | | | | | |
|
Schwab Emerging Markets Equity ETF | | | | | | | | |
| | | | | | | | |
|
|
|
| | | | | | | | |
|
|
Intermediate-Term Bond 14.0% |
Schwab U.S. Aggregate Bond ETF | | | | | | | | |
|
|
Schwab Variable Share Price Money Fund, | | | | | | | | |
Total Affiliated Underlying Funds
(Cost $106,225,409) | | | | | | | | |
Total Investments in Securities
(Cost $106,225,409) | | | | | | | | |
| Distributions received include distributions from net investment income and capital gains, if any, from the underlying funds. Amounts shown are only presented for affiliated underlying funds, which are presented in the corresponding line-item in the Statement of Operations, if applicable (see financial note 2(d) for additional information). |
| The rate shown is the annualized 7-day yield. |
| |
| Real Estate Investment Trust |
At December 31, 2023, all of the fund’s investment securities were classified as Level 1 (see financial note 2(a) for additional
information).
Schwab VIT Growth Portfolio | Annual Report10
Schwab VIT Growth Portfolio
Statement of Assets and Liabilities
|
Investments in securities, at value - affiliated (cost $106,225,409) | | |
| | |
| | |
| | |
| | |
| | |
| | |
| | |
|
|
| | |
| | |
Investment adviser and administrator fees | | |
| | |
Independent trustees’ fees | | |
| | |
| | |
| | |
|
|
Capital received from investors | | |
Total distributable earnings | | |
| | |
11Schwab VIT Growth Portfolio | Annual Report
Schwab VIT Growth Portfolio
Statement of Operations
For the period January 1, 2023 through December 31, 2023 |
|
Dividends received from securities - affiliated | | |
Interest received from securities - unaffiliated | | |
| | |
|
|
Investment adviser and administrator fees | | |
| | |
Independent trustees’ fees | | |
Portfolio accounting fees | | |
| | |
| | |
| | |
| | |
| | |
| | |
|
REALIZED AND UNREALIZED GAINS (LOSSES) |
Net realized gains on sales of securities - affiliated | | |
Net change in unrealized appreciation (depreciation) on securities - affiliated | | |
Net realized and unrealized gains | | |
Increase in net assets resulting from operations | | |
Schwab VIT Growth Portfolio | Annual Report12
Schwab VIT Growth Portfolio
Statement of Changes in Net Assets
For the current and prior report periods
|
| | |
| | | |
Net realized gains (losses) | | | |
Net change in unrealized appreciation (depreciation) | | | |
Increase (decrease) in net assets resulting from operations | | | |
|
DISTRIBUTIONS TO SHAREHOLDERS |
| | | |
TRANSACTIONS IN FUND SHARES |
| | |
| | | | | |
| | | | | |
| | | | | |
| | | | | |
Net transactions in fund shares | | | | | |
|
SHARES OUTSTANDING AND NET ASSETS |
| | |
| | | | | |
| | | | | |
Total increase (decrease) | | | | | |
| | | | | |
13Schwab VIT Growth Portfolio | Annual Report
Schwab VIT Growth Portfolio
1. Business Structure of the Fund:
Schwab VIT Growth Portfolio (the fund) is a series of Schwab Annuity Portfolios (the trust), a no-load, open-end management investment company. The trust is organized as a Massachusetts business trust and is registered under the Investment Company Act of 1940, as amended (the 1940 Act). The list below shows all the funds in the trust as of the end of the period, including the fund discussed in this report, which is highlighted:
SCHWAB ANNUITY PORTFOLIOS |
Schwab Government Money Market Portfolio | |
Schwab S&P 500 Index Portfolio | |
Schwab VIT Balanced Portfolio | |
Schwab VIT Balanced with Growth Portfolio | |
Schwab VIT Growth Portfolio | |
The fund is considered a “fund of funds” because it invests in other exchange traded-funds (ETFs) or mutual funds. The fund seeks to achieve its investment objective by investing primarily in affiliated Schwab ETFs. The fund may also invest in affiliated Schwab mutual funds, and unaffiliated third-party ETFs and mutual funds (referred to herein as unaffiliated funds and, together with Schwab ETFs and Schwab mutual funds, as the "underlying funds"). The fund invests in the underlying funds in accordance with its target portfolio allocation.
The fund offers one share class. Shares are bought and sold at closing net asset value per share (NAV), which is the price for all outstanding shares of the fund. Each share has a par value of 1/1,000 of a cent, and the fund’s Board of Trustees (the Board) may authorize the issuance of as many shares as necessary.
The fund is available exclusively as an investment vehicle for variable annuity and variable life insurance contracts offered by separate accounts of participating life insurance companies, and in the future may be offered to pension and retirement plans qualified under the Internal Revenue Code, as amended. At December 31, 2023, 100% of the fund’s shares were held through separate accounts of five insurance companies. Subscriptions and redemptions of these insurance separate accounts could have a material impact on the fund.
The fund maintains its own account for purposes of holding assets and accounting, and is considered a separate entity for tax purposes. Within its account, the fund may also keep certain assets in segregated accounts, as required by securities law. The "Fund Complex" includes The Charles Schwab Family of Funds, Schwab Capital Trust, Schwab Investments, Schwab Annuity Portfolios, Schwab Strategic Trust and Laudus Trust.
2. Significant Accounting Policies:The following is a summary of the significant accounting policies the fund uses in its preparation of financial statements. The fund follows the investment company accounting and reporting guidance of the Financial Accounting Standards Board (FASB) Accounting Standard Codification Topic 946 Financial Services — Investment Companies. The accounting policies are in conformity with accounting principles generally accepted in the United States of America (GAAP).
The financial statements of the fund should be read in conjunction with the underlying funds’ financial statements. For more information about the underlying funds’ operations and policies, please refer to those funds’ semiannual and annual reports, which are filed with the U.S. Securities and Exchange Commission (SEC) and are available on the SEC’s website at www.sec.gov.
Pursuant to Rule 2a-5 under the 1940 Act, the Board has designated authority to a Valuation Designee, the fund’s investment adviser, to make fair valuation determinations under adopted procedures, subject to Board oversight. The investment adviser has formed a Pricing Committee to administer the pricing and valuation of portfolio securities and other assets and liabilities as well as to ensure that prices used for internal purposes or provided by third parties reasonably reflect fair value. The Valuation Designee may utilize independent pricing services, quotations from securities and financial instrument dealers and other market sources to determine fair value.
Securities held in the fund’s portfolio are valued every business day. The following valuation policies and procedures are used by the Valuation Designee to value various types of securities:
• Securities traded on an exchange or over-the-counter: Traded securities are valued at the closing value for the day, or, on days when no closing value has been reported, at the mean of the most recent bid and ask quotes.
• Mutual funds: Mutual funds are valued at their respective NAVs.
Schwab VIT Growth Portfolio | Annual Report14
Schwab VIT Growth Portfolio
Financial Notes (continued)
2. Significant Accounting Policies (continued):
• Securities for which no quoted value is available: The Valuation Designee has adopted procedures to fair value the fund’s securities when market prices are not “readily available” or are unreliable. For example, a security may be fair valued when it’s de-listed or its trading is halted or suspended; when a security’s primary pricing source is unable or unwilling to provide a price; or when a security’s primary trading market is closed during regular market hours. Fair value determinations are made in good faith in accordance with adopted valuation procedures. The Valuation Designee considers a number of factors, including unobservable market inputs, when arriving at fair value. The Valuation Designee may employ methods such as the review of related or comparable assets or liabilities, related market activities, recent transactions, market multiples, book values, transactional back-testing, disposition analysis and other relevant information. Due to the subjective and variable nature of fair value pricing, there can be no assurance that the fund could obtain the fair value assigned to the security upon the sale of such security.
In accordance with the authoritative guidance on fair value measurements and disclosures under GAAP, the fund discloses the fair value of its investments in a hierarchy that prioritizes the significant inputs to valuation methods used to measure the fair value. The hierarchy gives the highest priority to valuations based upon unadjusted quoted prices in active markets for identical assets or liabilities (Level 1 measurements) and the lowest priority to valuations based upon unobservable inputs that are significant to the valuation (Level 3 measurements). If inputs used to measure the financial instruments fall within different levels of the hierarchy, the categorization is based on the lowest level input that is significant to the valuation. If it is determined that either the volume and/or level of activity for an asset or liability has significantly decreased (from normal conditions for that asset or liability) or price quotations or observable inputs are not associated with orderly transactions, increased analysis and the Valuation Designee’s judgment will be required to estimate fair value.
The three levels of the fair value hierarchy are as follows:
• Level 1 — quoted prices in active markets for identical investments — Investments whose values are based on quoted market prices in active markets. These generally include active listed equities, mutual funds, and ETFs. Underlying funds are classified as Level 1 prices, without consideration to the classification level of the underlying securities held which could be Level 1, Level 2 or Level 3 in the fair value hierarchy.
• Level 2 — other significant observable inputs (including quoted prices for similar securities, interest rates, prepayment speeds, credit risk, etc.) — Investments that trade in markets that are not considered to be active, but whose values are based on quoted market prices, dealer quotations or valuations provided by alternative pricing sources supported by observable inputs are classified as Level 2 prices. These generally include U.S. government and sovereign obligations, most government agency securities, investment-grade corporate bonds, certain mortgage products, less liquid listed equities, and state, municipal and provincial obligations.
• Level 3 — significant unobservable inputs (including the Valuation Designee’s assumptions in determining the fair value of investments) — Investments whose values are classified as Level 3 prices have significant unobservable inputs, as they may trade infrequently or not at all. When observable prices are not readily available for these securities, one or more valuation methods are used for which sufficient and reliable data is available. The inputs used in estimating the value of Level 3 prices may include the original transaction price, quoted prices for similar securities or assets in active markets, completed or pending third-party transactions in the underlying investment or comparable issuers, and changes in financial ratios or cash flows. Level 3 prices may also be adjusted to reflect illiquidity and/or non-transferability, with the amount of such discount estimated in the absence of market information. Assumptions used due to the lack of observable inputs may significantly impact the resulting fair value and therefore the fund’s results of operations.
The inputs or methodology used for valuing securities are not necessarily an indication of the risk associated with investing in those securities.
The levels associated with valuing the fund’s investments as of December 31, 2023, are disclosed in the fund’s Portfolio Holdings.
(b) Accounting Policies for certain Portfolio Investments (if held):
Securities Lending: Under the trust’s Securities Lending Program, the fund (lender) may make short-term loans of its securities to another party (borrower) to generate additional revenue for the fund. The borrower pledges collateral in the form of cash, securities issued or fully guaranteed by the U.S. government or foreign governments, or letters of credit issued by a bank. Collateral at the individual loan level is required to be maintained on a daily marked-to-market basis in an amount at least equal to the current value of the securities loaned. The lending agent provides the fund with indemnification against borrower default (the borrower fails to return the security on loan) reducing the risk of loss as a result of default. The cash collateral of securities loaned is currently invested in money market portfolios operating pursuant to Rule 2a-7 under the 1940 Act. The fund bears the risk of loss with
15Schwab VIT Growth Portfolio | Annual Report
Schwab VIT Growth Portfolio
Financial Notes (continued)
2. Significant Accounting Policies (continued):
respect to the investment of cash collateral. The terms of the securities lending agreement allow the fund or the lending agent to terminate any loan at any given time and the securities must be returned within the earlier of the standard trade settlement period or the specified time period under the relevant securities lending agreement. Securities lending income, as disclosed in the fund’s Statement of Operations, if applicable, represents the income earned from the investment of the cash collateral plus any fees paid by borrowers, less the fees paid to the lending agent and broker rebates which are subject to adjustments pursuant to the securities lending agreement. On loans not collateralized by cash, a fee is received from the borrower, and is allocated between the fund and the lending agent. The aggregate fair value of securities loaned will not at any time exceed one-third of the total assets of the fund, including collateral received from the loan. Securities lending fees paid to the unaffiliated lending agents start at 9% of gross lending revenue, with subsequent breakpoints to a low of 5%. In this context, the gross lending revenue equals the income received from the investment of cash collateral and fees paid by borrowers less any rebates paid to the borrowers. Any expenses charged by the cash collateral fund are in addition to these fees. All remaining revenue is retained by the fund, as applicable. No portion of lending revenue is paid to or retained by the investment adviser or any of its affiliates.
As of December 31, 2023, the fund had no securities on loan.
Cash Investments: The fund may invest a portion of its assets in cash. Cash includes cash bank balances in an interest-bearing demand deposit account with maturity on demand by the fund.
(c) Security Transactions:
Security transactions are recorded as of the date the order to buy or sell the security is executed. Realized gains and losses from security transactions are based on the identified costs of the securities involved.
Interest income is recorded as it accrues. Dividends and distributions from portfolio securities and underlying funds are recorded on the date they are effective (the ex-dividend date). Any distributions from underlying funds are recorded in accordance with the character of the distributions as designated by the underlying funds.
Expenses that are specific to the fund are charged directly to the fund. Expenses that are common to more than one fund in the trusts generally are allocated among those funds in proportion to their average daily net assets. The fund bears its share of the acquired fund fees and expenses of the underlying funds, which are indirect expenses incurred by the fund through its investments in the underlying funds. Such expenses are reflected in the net asset values of the underlying funds.
(f) Distributions to Shareholders:
The fund makes distributions from net investment income and net realized capital gains, if any, once a year. To receive a distribution, you must be a registered shareholder on the record date. Distributions are paid to shareholders on the payable date.
(g) Accounting Estimates:
The accounting policies described in this report conform to GAAP. Notwithstanding this, shareholders should understand that in order to follow these principles, fund management has to make estimates and assumptions that affect the information reported in the financial statements. It’s possible that once the results are known, they may turn out to be different from these estimates and these differences may be material.
(h) Federal Income Taxes:
The fund intends to meet federal income and excise tax requirements for regulated investment companies under subchapter M of the Internal Revenue Code, as amended. Accordingly, the fund distributes substantially all of its net investment income and net realized capital gains, if any, to the participating insurance company’s (shareholders) separate accounts each year. As long as the fund meets the tax requirements, it is not required to pay federal income tax.
Schwab VIT Growth Portfolio | Annual Report16
Schwab VIT Growth Portfolio
Financial Notes (continued)
2. Significant Accounting Policies (continued):
(i) Indemnification:
Under the fund’s organizational documents, the officers and trustees are indemnified against certain liabilities arising out of the performance of their duties to the fund. In addition, in the normal course of business the fund enters into contracts with its vendors and others that provide general indemnifications. The fund’s maximum exposure under these arrangements is unknown as this would involve future claims that may be made against the fund. However, based on experience, the fund expects the risk of loss attributable to these arrangements to be remote.
Effective January 24, 2023, the SEC adopted rule and form amendments to require mutual funds and ETFs to transmit concise and visually engaging streamlined annual and semiannual reports to shareholders that highlight key information deemed important for retail investors to assess and monitor their fund investments. Other information, including financial statements, will no longer appear in a streamlined shareholder report but must be available online, delivered free of charge upon request, and filed on a semiannual basis on Form N-CSR. The rule and form amendments have a compliance date of July 24, 2024. At this time, management is evaluating the impact of these rule and form amendment changes on the content of the current shareholder report and the newly created annual and semiannual streamlined shareholder reports.
Investing in the fund may involve certain risks, as discussed in the fund’s prospectus, including, but not limited to, those described below. Any of these risks could cause an investor to lose money.
Asset Allocation Risk. The fund is subject to the risk that the selection of the underlying funds and the allocation of the fund’s assets among the various asset classes and market segments may cause the fund to underperform other funds with a similar investment objective.
Conflicts of Interest Risk. The investment adviser’s authority to select and substitute underlying funds from a variety of affiliated and unaffiliated mutual funds and ETFs may create a conflict of interest because the fees paid to it and its affiliates by some underlying funds are higher than the fees paid by other underlying funds. The investment adviser also may have an incentive to select an affiliated underlying fund for other reasons, including to increase assets under management or to support new investment strategies. In addition, other conflicts of interest may exist where the best interests of the affiliated underlying fund may not be aligned with those of the fund. However, the investment adviser is a fiduciary to the fund and is legally obligated to act in the fund’s best interests when selecting underlying funds.
Market Risk. Financial markets rise and fall in response to a variety of factors, sometimes rapidly and unpredictably. Markets may be impacted by economic, political, regulatory and other conditions, including economic sanctions and other government actions. In addition, the occurrence of global events, such as war, terrorism, environmental disasters, natural disasters and epidemics may also negatively affect the financial markets. As with any investment whose performance is tied to these markets, the value of an investment in the fund will fluctuate, which means that an investor could lose money over short or long periods.
Securities Lending Risk. Securities lending involves the risk of loss of rights in, or delay in recovery of, the loaned securities if the borrower fails to return the security loaned or becomes insolvent.
ETF Risk. When the fund invests in an ETF, it will bear a proportionate share of the ETF’s expenses. In addition, lack of liquidity in the market for an ETF’s shares can result in its value being more volatile than the underlying portfolio of securities.
Direct Investment Risk. The fund may invest directly in cash, cash equivalents and equity and fixed-income securities, including money market securities, to maintain its allocations. The fund’s direct investment in these securities is subject to the same or similar risks as an underlying fund’s investment in the same securities.
Underlying Fund Investment Risk. Before investing in the fund, investors should assess the risks associated with the underlying funds in which the fund may invest, which include any combination of the risks described below.
• Equity Risk. The prices of equity securities rise and fall daily. These price movements may result from factors affecting individual companies, industries or the securities market as a whole. In addition, equity markets tend to move in cycles, which may cause stock prices to fall over short or extended periods of time.
• Market Capitalization Risk. Securities issued by companies of different market capitalizations tend to go in and out of favor based on market and economic conditions. During a period when securities of a particular market capitalization fall behind other types of investments, an underlying fund’s performance could be impacted.
17Schwab VIT Growth Portfolio | Annual Report
Schwab VIT Growth Portfolio
Financial Notes (continued)
3. Risk Factors (continued):
• Foreign Investment Risk. An underlying fund’s investments in securities of foreign issuers involve certain risks that may be greater than those associated with investments in securities of U.S. issuers. These include risks of adverse changes in foreign economic, political, regulatory and other conditions; changes in currency exchange rates or exchange control regulations (including limitations on currency movements and exchanges); the imposition of economic sanctions or other government restrictions; differing accounting, auditing, financial reporting and legal standards and practices; differing securities market structures; and higher transaction costs. These risks may negatively impact the value or liquidity of an underlying fund’s investments, and could impair the underlying fund’s ability to meet its investment objective or invest in accordance with its investment strategy. There is a risk that investments in securities denominated in, and/or receiving revenues in, foreign currencies will decline in value relative to the U.S. dollar or, in the case of hedging positions, that the U.S. dollar will decline in value relative to the currency hedged, resulting in the dollar value of an underlying fund’s investment being adversely affected.
• Emerging Markets Risk. Emerging market countries may be more likely to experience political turmoil or rapid changes in market or economic conditions than more developed countries. Emerging market countries often have less uniformity in accounting, auditing, financial reporting and recordkeeping requirements and greater risk associated with the custody of securities. In addition, the financial stability of issuers (including governments) in emerging market countries may be more precarious than in developed countries. As a result, there may be an increased risk of illiquidity and price volatility associated with an underlying fund’s investments in emerging market countries, which may be magnified by currency fluctuations relative to the U.S. dollar, and, at times, it may be difficult to value such investments.
• Growth Investing Risk. Certain of the underlying funds pursue a “growth style” of investing. Growth investing focuses on a company’s prospects for growth of revenue and earnings. If a company’s earnings or revenues fall short of expectations, its stock price may fall dramatically. Growth stocks also can perform differently from the market as a whole and other types of stocks and can be more volatile than other types of stocks. Since growth companies usually invest a high portion of earnings in their business, they may lack the dividends of value stocks that can cushion stock prices in a falling market. Growth stocks may also be more expensive relative to their earnings or assets compared to value or other stocks.
• Value Investing Risk. Certain of the underlying funds may pursue a “value style” of investing. Value investing focuses on companies whose stocks appear undervalued in light of factors such as the company’s earnings, book value, revenues or cash flow. If an underlying fund’s investment adviser’s (or sub-adviser’s) assessment of a company’s value or prospects for exceeding earnings expectations or market conditions is wrong, the underlying fund could suffer losses or produce poor performance relative to other funds. In addition, “value stocks” can continue to be undervalued by the market for long periods of time.
• Fixed-Income Risk. Interest rates rise and fall over time, which will affect an underlying fund’s yield and share price. A change in a central bank’s monetary policy or economic conditions, among other things, may result in a change in interest rates. A rise in interest rates could cause an underlying fund’s share price to fall. The credit quality of a portfolio investment could also cause an underlying fund’s share price to fall. An underlying fund could lose money if the issuer or guarantor of a portfolio investment or the counterparty to a derivatives contract fails to make timely principal or interest payments or otherwise honor its obligations. Fixed-income securities may be paid off earlier or later than expected. Either situation could cause an underlying fund to hold securities paying lower-than-market rates of interest, which could hurt an underlying fund’s yield or share price. Below investment-grade bonds (junk bonds) involve greater credit risk, are more volatile, involve greater risk of price declines and may be more susceptible to economic downturns than investment-grade securities.
• Interest Rate Risk. Interest rates rise and fall over time. As with any investment whose yield reflects current interest rates, an underlying fund’s yield will change over time. During periods when interest rates are low, an underlying fund’s yield (and total return) also may be low. Changes in interest rates also may affect an underlying fund’s share price: a rise in interest rates generally causes an underlying fund’s share price to fall. The longer an underlying fund’s portfolio duration, the more sensitive to interest rate movements its share price is likely to be. Also, a change in a central bank’s monetary policy or economic conditions, among other things, may result in a change in interest rates, which could have sudden and unpredictable effects on the markets and significantly impact the value of fixed-income securities in which the underlying fund invests.
• Credit Risk. A decline in the credit quality of an issuer or guarantor of a portfolio investment could cause an underlying fund to lose money or underperform. An underlying fund could lose money if the issuer or guarantor of a portfolio investment fails to make timely principal or interest payments or otherwise honor its obligations.
Schwab VIT Growth Portfolio | Annual Report18
Schwab VIT Growth Portfolio
Financial Notes (continued)
3. Risk Factors (continued):
• Prepayment and Extension Risk. Certain fixed income securities are subject to the risk that the securities may be paid off earlier or later than expected, especially during periods of falling or rising interest rates, respectively. Prepayments of obligations could cause an underlying fund to forgo future interest income on the portion of the security’s principal repaid early and force the underlying fund to reinvest that money at the lower prevailing interest rates. Extensions of obligations could cause the fund to exhibit additional volatility and hold securities paying lower-than-market rates of interest. Either case could hurt the underlying fund’s performance.
• U.S. Government Securities Risk. Some of the U.S. government securities that the underlying funds invest in are not backed by the full faith and credit of the U.S. government, which means they are neither issued nor guaranteed by the U.S. Treasury. Issuers such as the Federal Home Loan Banks (FHLB) maintain limited access to credit lines from the U.S. Treasury. Certain securities, such as obligations issued by the Federal Farm Credit Banks Funding Corporation, are supported solely by the credit of the issuer. There can be no assurance that the U.S. government will provide financial support to securities of its agencies and instrumentalities if it is not obligated to do so under law. Also, any government guarantees on securities the underlying funds own do not extend to shares of the underlying funds themselves.
• Real Estate Investment Risk. An underlying fund in which the fund may invest may have a policy of concentrating its investments in real estate companies and companies related to the real estate industry. As such, an underlying fund is subject to risks associated with the direct ownership of real estate securities and the fund’s investment in such an underlying fund is subject to risks associated with the direct ownership of real estate securities and an investment in the underlying fund will be closely linked to the performance of the real estate markets. These risks include, among others, declines in the value of real estate; risks related to general and local economic conditions; possible lack of availability of mortgage funds or other limits to accessing the credit or capital markets; defaults by borrowers or tenants, particularly during an economic downturn; and changes in interest rates.
• Real Estate Investment Trusts (REITs) Risk. An underlying fund may invest in REITs. An underlying fund’s investments in REITs will be subject to the risks associated with the direct ownership of real estate, including fluctuations in the value of underlying properties, defaults by borrowers or tenants, changes in interest rates and risks related to general or local economic conditions. REITs are also subject to certain additional risks. For example, equity REITs may be affected by changes in the value of the underlying properties owned by the trusts, and mortgage REITs may be affected by the quality of any credit extended. Further, REITs may have their investments in relatively few properties, a small geographic area or a single property type. In addition, REITs have their own expenses, and the underlying fund will bear a proportionate share of those expenses.
• Mortgage-Backed and Mortgage Pass-Through Securities Risk. Mortgage-backed securities tend to increase in value less than other debt securities when interest rates decline, but are subject to similar or greater risk of decline in fair value during periods of rising interest rates. Certain of the mortgage-backed securities in which an underlying fund may invest are issued or guaranteed by agencies or instrumentalities of the U.S. government but are not backed by the full faith and credit of the U.S. government. There can be no assurance that the U.S. government would provide financial support to its agencies or instrumentalities where it was not obligated to do so which can cause an underlying fund to lose money or underperform. The risks of investing in mortgage-backed securities include, among others, interest rate risk, credit risk, prepayment risk and extension risk. Transactions in mortgage pass-through securities often occur through to-be-announced (TBA) transactions. An underlying fund could lose money or underperform if a TBA counterparty defaults or goes bankrupt.
• Portfolio Turnover Risk. Certain of the underlying funds may buy and sell portfolio securities actively. If they do, their portfolio turnover rate and transaction costs will rise, which may lower the underlying fund’s performance and may increase the likelihood of capital gains distributions.
• Liquidity Risk. An underlying fund may be unable to sell certain securities, such as illiquid securities, readily at a favorable time or price, or the underlying fund may have to sell them at a loss.
• Derivatives Risk. An underlying fund’s use of derivative instruments involves risks different from, or possibly greater than, the risks associated with investing directly in securities and other traditional investments. An underlying fund’s use of derivatives could reduce the underlying fund’s performance, increase its volatility, and could cause the underlying fund to lose more than the initial amount invested. In addition, investments in derivatives may involve leverage, which means a small percentage of assets invested in derivatives can have a disproportionately large impact on an underlying fund.
• Securities Lending Risk. Certain underlying funds engage in securities lending, which involves the risk of loss of rights in, or delay in recovery of, the loaned securities if the borrower fails to return the security loaned or becomes insolvent.
19Schwab VIT Growth Portfolio | Annual Report
Schwab VIT Growth Portfolio
Financial Notes (continued)
3. Risk Factors (continued):
• Management Risk. An underlying fund may be an actively managed mutual fund. Any actively managed mutual fund is subject to the risk that its investment adviser (or sub-adviser(s)) will make poor security selections. An underlying fund’s adviser applies its own investment techniques and risk analyses in making investment decisions for the fund, but there can be no guarantee that they will produce the desired results.
• Investment Style Risk. Certain underlying funds seek to track the performance of various segments of the stock market, as measured by their respective indices. Such underlying funds follow these stocks during upturns as well as downturns. Because of their indexing strategy, these underlying funds do not take steps to reduce market exposure or to lessen the effects of a declining market. In addition, because of an underlying fund’s expenses, the underlying fund’s performance is normally below that of the index. Errors relating to an index may occur from time to time and may not be identified by the underlying fund’s index provider for a period of time. In addition, market disruptions could cause delays in an underlying fund’s index’s rebalancing schedule. Such errors and/or market disruptions may result in losses for an underlying fund.
• Tracking Error Risk. An underlying fund may seek to track the performance of its benchmark index, although it may not be successful in doing so. The divergence between the performance of a fund and its benchmark index, positive or negative, is called “tracking error.” Tracking error can be caused by many factors and it may be significant.
• Concentration Risk. To the extent that an underlying fund’s portfolio is concentrated in the securities of issuers in a particular market, industry, group of industries, sector or asset class, the underlying fund may be adversely affected by the performance of those securities, may be subject to increased price volatility and may be more vulnerable to adverse economic, market, political, or regulatory occurrences affecting that market, industry, group of industries, sector or asset class.
• Commodity Risk. To the extent that an underlying fund invests in commodity-linked derivative instruments, it may subject the underlying fund to greater volatility than investments in traditional securities. Also, commodity-linked investments may be more volatile and less liquid than the underlying commodity. The value of commodity-linked derivative instruments may be affected by changes in overall market movements, commodity index volatility, changes in interest rates, or factors affecting a particular industry or commodity, such as drought, floods, weather, livestock disease, embargoes, tariffs and international economic, political and other regulatory and market developments. The use of leveraged commodity-linked derivatives creates an opportunity for increased return, but also creates the possibility for a greater loss.
• Money Market Fund Risk. The fund may invest in underlying money market funds that either seek to maintain a stable $1.00 net asset value (“stable share price money market funds”) or that have a share price that fluctuates (“variable share price money market funds”). Although an underlying stable share price money market fund seeks to maintain a stable $1.00 net asset value, it is possible to lose money by investing in such a money market fund. Because the share price of an underlying variable share price money market fund will fluctuate, when the fund sells the shares it owns they may be worth more or less than what the fund originally paid for them. In addition, neither type of money market fund is designed to offer capital appreciation. Certain underlying money market funds may impose a fee upon the sale of shares or may temporarily suspend the ability to sell shares if such fund’s liquidity falls below required minimums.
Please refer to the fund’s prospectus for a more complete description of the principal risks of investing in the fund.
4. Affiliates and Affiliated Transactions:Charles Schwab Investment Management Inc., dba Schwab Asset Management, a wholly owned subsidiary of The Charles Schwab Corporation, serves as the fund’s investment adviser and administrator pursuant to an Investment Advisory and Administration Agreement between the investment adviser and the trust.
For its advisory and administrative services to the fund, the investment adviser is entitled to receive an annual fee, accrued daily and payable monthly, equal to 0.45% of the fund’s average daily net assets.
The investment adviser and its affiliates have agreed with the fund, for so long as the investment adviser serves as the investment adviser to the fund, in which the agreement may only be amended or terminated with approval of the fund’s Board, to limit the total annual fund operating expenses charged, excluding interest, taxes and certain non-routine expenses to 0.58%.
Schwab VIT Growth Portfolio | Annual Report20
Schwab VIT Growth Portfolio
Financial Notes (continued)
4. Affiliates and Affiliated Transactions (continued):
The agreement to limit the fund’s total expenses charged is limited to the fund’s direct operating expenses and, therefore, does not apply to acquired fund fees and expenses, which are indirect expenses incurred by the fund through its investments in the underlying funds.
Investments in Affiliates
The fund may engage in certain transactions involving affiliated parties. Pursuant to an exemptive order issued by the SEC, the fund may invest in other affiliated ETFs and mutual funds. As of December 31, 2023, the Schwab VIT Growth Portfolio’s ownership percentages of other affiliated funds’ shares are as follows:
Schwab Emerging Markets Equity ETF | |
Schwab International Equity ETF | |
Schwab International Small-Cap Equity ETF | |
Schwab U.S. Aggregate Bond ETF | |
Schwab U.S. Large-Cap ETF | |
| |
Schwab U.S. Small-Cap ETF | |
Schwab Variable Share Price Money Fund, Ultra Shares | |
The fund may engage in direct transactions with certain other funds in the Fund Complex in accordance with procedures adopted by the Board pursuant to Rule 17a-7 under the 1940 Act. When one fund is seeking to sell a security that another is seeking to buy, an interfund transaction can allow both funds to benefit by reducing transaction costs. This practice is limited to funds that share the same investment adviser, trustees and/or officers. For the period ended December 31, 2023, the fund’s purchases and sales of securities with other funds in the Fund Complex was $280,046 and $2,410,116 respectively, and includes realized losses of $26,081.
Interfund Borrowing and Lending
Pursuant to an exemptive order issued by the SEC, the fund may enter into interfund borrowing and lending transactions with other funds in the Fund Complex. All loans are for temporary or emergency purposes and the interest rate to be charged will be the average of the overnight repurchase agreement rate and the short-term bank loan rate. All loans are subject to numerous conditions designed to ensure fair and equitable treatment of all participating funds. The interfund lending facility is subject to the oversight and periodic review by the Board. The fund had no interfund borrowing or lending activity during the period.
The Board may include people who are officers and/or directors of the investment adviser or its affiliates. Federal securities law limits the percentage of such “interested persons” who may serve on a trust’s board, and the trust was in compliance with these limitations throughout the report period. The fund did not pay any of these interested persons for their services as trustees, but did pay non-interested persons (independent trustees), as noted in the fund’s Statement of Operations. For information regarding the trustees, please refer to the Trustees and Officers table at the end of this report.
During the period, the fund was a participant with other funds in the Fund Complex in a joint, syndicated, committed $1 billion line of credit (the Syndicated Credit Facility), which matured on September 28, 2023. On September 28, 2023, the Syndicated Credit Facility was amended to run for a new 364 day period with the line of credit amount remaining unchanged, maturing on September 26, 2024. Under the terms of the Syndicated Credit Facility, in addition to the interest charged on any borrowings by the fund, the fund paid a commitment fee of 0.15% per annum on the fund’s proportionate share of the unused portion of the Syndicated Credit Facility.
During the period, the fund was a participant with other funds in the Fund Complex in a joint, unsecured, uncommitted $400 million line of credit (the Uncommitted Credit Facility), with State Street Bank and Trust Company, which matured on September 28, 2023. On September 28, 2023, the Uncommitted Credit Facility was amended to run for a new 364 day period with the line of credit amount remaining unchanged, maturing on September 26, 2024. Under the terms of the Uncommitted Credit Facility, the fund pays interest on the amount the fund borrows. There were no borrowings by the fund from either line of credit during the period.
21Schwab VIT Growth Portfolio | Annual Report
Schwab VIT Growth Portfolio
Financial Notes (continued)
6. Borrowing from Banks (continued):
The fund also has access to custodian overdraft facilities. The fund may have utilized the overdraft facility and incurred an interest expense, which is disclosed in the fund’s Statement of Operations, if any. The interest expense is determined based on a negotiated rate above the current Federal Funds Rate.
7. Purchases and Sales of Investment Securities:For the period ended December 31, 2023, purchases and sales of securities (excluding short-term obligations) were as follows:
As of December 31, 2023, the tax basis cost of the fund’s investments and gross unrealized appreciation and depreciation were as follows:
| | GROSS UNREALIZED
APPRECIATION | GROSS UNREALIZED
DEPRECIATION | NET UNREALIZED
APPRECIATION
(DEPRECIATION) |
| | | | |
| | | | |
| | | | |
As of December 31, 2023, the components of distributable earnings on a tax basis were as follows:
UNDISTRIBUTED
ORDINARY
INCOME | UNDISTRIBUTED
LONG-TERM
CAPITAL GAINS | NET UNREALIZED
APPRECIATION
(DEPRECIATION)
ON INVESTMENTS | |
| | | |
The primary difference between book basis and tax basis unrealized appreciation or unrealized depreciation of investments is the tax deferral of losses on wash sales. The tax cost of the fund’s investments, disclosed above, have been adjusted from their book amounts to reflect these unrealized appreciation or depreciation differences, as applicable.
As of December 31, 2023, the fund had no capital loss carryforwards available to offset future realized capital gains for federal tax purposes. For the fiscal year ended December 31, 2023, the fund had capital loss carryforwards utilized of $40,240.
The tax basis components of distributions paid during the current and prior fiscal years were as follows:
| CURRENT FISCAL YEAR END DISTRIBUTIONS | PRIOR FISCAL YEAR END DISTRIBUTIONS |
| | | | |
| | | | |
Distributions paid to shareholders are based on net investment income and net realized gains determined on a tax basis, which may differ from net investment income and net realized gains for financial reporting purposes. These differences reflect the differing character of certain income items and net realized gains and losses for financial statement and tax purposes, and may result in reclassification among certain capital accounts in the financial statements. The fund may also designate a portion of the amount paid to redeeming shareholders as a distribution for tax purposes.
Permanent book and tax basis differences may result in reclassifications between components of net assets as required. The adjustments will have no impact on net assets or the results of operations.
Schwab VIT Growth Portfolio | Annual Report22
Schwab VIT Growth Portfolio
Financial Notes (continued)
8. Federal Income Taxes (continued):
As of December 31, 2023, management has reviewed the tax positions for open periods (for federal purposes, three years from the date of filing and for state purposes, four years from the date of filing) as applicable to the fund, and has determined that no provision for income tax is required in the fund’s financial statements. The fund recognizes interest and penalties, if any, related to unrecognized tax benefits as income tax expense in the fund’s Statement of Operations. During the fiscal year ended December 31, 2023, the fund did not incur any interest or penalties.
Management has determined there are no subsequent events or transactions through the date the financial statements were issued that would have materially impacted the financial statements as presented.
23Schwab VIT Growth Portfolio | Annual Report
Schwab VIT Growth Portfolio
Report of Independent Registered Public Accounting Firm
To the Board of Trustees of Schwab Annuity Portfolios and Shareholders of Schwab VIT Growth Portfolio:
Opinion on the Financial Statements and Financial Highlights
We have audited the accompanying statement of assets and liabilities, including the portfolio holdings, of Schwab VIT Growth Portfolio (the “Fund”), one of the funds constituting Schwab Annuity Portfolios, as of December 31, 2023, the related statement of operations for the year then ended, the statements of changes in net assets for each of the two years in the period then ended, the financial highlights for each of the four years in the period then ended, and the related notes. In our opinion, the financial statements and financial highlights present fairly, in all material respects, the financial position of the Fund as of December 31, 2023, and the results of its operations for the year then ended, the changes in its net assets for each of the two years in the period then ended, and the financial highlights for each of the four years in the period then ended in conformity with accounting principles generally accepted in the United States of America. The financial highlights for the year ended December 31, 2019 were audited by other auditors, whose report, dated February 18, 2020, expressed an unqualified opinion on such financial highlights.
These financial statements and financial highlights are the responsibility of the Fund’s management. Our responsibility is to express an opinion on the Fund’s financial statements and financial highlights based on our audits. We are a public accounting firm registered with the Public Company Accounting Oversight Board (United States) (PCAOB) and are required to be independent with respect to the Fund in accordance with the U.S. federal securities laws and the applicable rules and regulations of the Securities and Exchange Commission and the PCAOB.
We conducted our audits in accordance with the standards of the PCAOB. Those standards require that we plan and perform the audit to obtain reasonable assurance about whether the financial statements and financial highlights are free of material misstatement, whether due to error or fraud. The Fund is not required to have, nor were we engaged to perform, an audit of its internal control over financial reporting. As part of our audits, we are required to obtain an understanding of internal control over financial reporting but not for the purpose of expressing an opinion on the effectiveness of the Fund’s internal control over financial reporting. Accordingly, we express no such opinion.
Our audits included performing procedures to assess the risks of material misstatement of the financial statements and financial highlights, whether due to error or fraud, and performing procedures that respond to those risks. Such procedures included examining, on a test basis, evidence regarding the amounts and disclosures in the financial statements and financial highlights. Our audits also included evaluating the accounting principles used and significant estimates made by management, as well as evaluating the overall presentation of the financial statements and financial highlights. Our procedures included confirmation of securities owned as of December 31, 2023, by correspondence with the custodian and transfer agent. We believe that our audits provide a reasonable basis for our opinion.
Deloitte & Touche LLP
Denver, Colorado
February 16, 2024
We have served as the auditor of one or more investment companies in the Schwab Funds Complex since 2020.
Schwab VIT Growth Portfolio | Annual Report24
Schwab VIT Growth Portfolio
Other Federal Tax Information (unaudited)
The fund may elect to pass on the benefits of the foreign tax credit of $128,898 to its shareholders for the fiscal year ended December 31, 2023. The respective foreign source income on the fund is $1,324,169.
For corporate shareholders, 37.27% of the fund’s dividend distributions paid during the fiscal year ended December 31, 2023, qualify for the corporate dividends received deduction.
For the fiscal year ended December 31, 2023, the fund designates 26.09% of dividend income as business interest income under section 163(j) of the Internal Revenue Code.
25Schwab VIT Growth Portfolio | Annual Report
Schwab VIT Growth Portfolio
Liquidity Risk Management Program (unaudited)
The fund has adopted and implemented a liquidity risk management program (the “program”) as required by Rule 22e-4 under the Investment Company Act of 1940, as amended. The fund’s Board of Trustees (the “Board”) has designated the fund’s investment adviser, Charles Schwab Investment Management, Inc., dba Schwab Asset Management, as the administrator of the program. Personnel of the investment adviser or its affiliates conduct the day-to-day operation of the program.
Under the program, the investment adviser manages a fund’s liquidity risk, which is the risk that the fund could not meet shareholder redemption requests without significant dilution of remaining shareholders’ interests in the fund. The program is reasonably designed to assess and manage a fund’s liquidity risk, taking into consideration the fund’s investment strategy and the liquidity of its portfolio investments during normal and reasonably foreseeable stressed conditions; its historical redemption history and shareholder concentrations; and its cash holdings and access to other funding sources, including the custodian overdraft facility and lines of credit. The investment adviser’s process of determining the degree of liquidity of each fund’s investments is supported by third-party liquidity assessment vendors.
The fund’s Board reviewed a report at its meeting held on September 19, 2023 prepared by the investment adviser regarding the operation and effectiveness of the program for the period June 1, 2022, through May 31, 2023, which included individual fund liquidity metrics. The report summarized the operation of the program and the information and factors considered by the investment adviser in assessing whether the program has been adequately and effectively implemented with respect to a fund. In addition, the investment adviser provided its assessment that the program had been operating effectively in managing the fund’s liquidity risk.
Schwab VIT Growth Portfolio | Annual Report26
Schwab VIT Growth Portfolio
Trustees and Officers
The tables below give information about the trustees and officers of Schwab Annuity Portfolios, which includes the fund covered in this report. The “Fund Complex” includes The Charles Schwab Family of Funds, Schwab Capital Trust, Schwab Investments, Schwab Annuity Portfolios, Schwab Strategic Trust and Laudus Trust. The Fund Complex includes 106 funds.
The address for all trustees and officers is 211 Main Street, San Francisco, CA 94105. You can find more information about the trustees and officers in the fund’s Statement of Additional Information, which is available free by calling 1-877-824-5615.
|
Name, Year of Birth, and Position(s) with the trust (Terms of office, and length of Time Served1) | Principal Occupations During the Past Five Years | Number of Portfolios in Fund Complex Overseen by the Trustee | |
Michael J. Beer 1961 Trustee (Trustee of The Charles Schwab Family of Funds, Schwab Investments, Schwab Capital Trust, Schwab Annuity Portfolios, Schwab Strategic Trust and Laudus Trust since 2022) | Retired. Director, President and Chief Executive Officer (Dec. 2016 – Sept. 2019), Principal Funds (investment management). | | Director (2016 – 2019), Principal Funds, Inc. |
Robert W. Burns 1959 Trustee (Trustee of Schwab Strategic Trust since 2009; The Charles Schwab Family of Funds, Schwab Investments, Schwab Capital Trust, Schwab Annuity Portfolios and Laudus Trust since 2016) | Retired/Private Investor. | | |
Nancy F. Heller 1956 Trustee (Trustee of The Charles Schwab Family of Funds, Schwab Investments, Schwab Capital Trust, Schwab Annuity Portfolios, Schwab Strategic Trust and Laudus Trust since 2018) | | | |
David L. Mahoney 1954 Trustee (Trustee of The Charles Schwab Family of Funds, Schwab Investments, Schwab Capital Trust, Schwab Annuity Portfolios and Laudus Trust since 2011; Schwab Strategic Trust since 2016) | | | Director (2004 – present), Corcept Therapeutics Incorporated Director (2009 – 2021), Adamas Pharmaceuticals, Inc. Director (2003 – 2019), Symantec Corporation |
Jane P. Moncreiff 1961 Trustee (Trustee of The Charles Schwab Family of Funds, Schwab Investments, Schwab Capital Trust, Schwab Annuity Portfolios, Schwab Strategic Trust and Laudus Trust since 2019) | Consultant (2018 – present), Fulham Advisers LLC (management consulting); Chief Investment Officer (2009 – 2017), CareGroup Healthcare System, Inc. (healthcare). | | |
27Schwab VIT Growth Portfolio | Annual Report
Schwab VIT Growth Portfolio
Independent Trustees (continued) |
Name, Year of Birth, and Position(s) with the trust (Terms of office, and length of Time Served1) | Principal Occupations During the Past Five Years | Number of Portfolios in Fund Complex Overseen by the Trustee | |
Kimberly S. Patmore 1956 Trustee (Trustee of The Charles Schwab Family of Funds, Schwab Investments, Schwab Capital Trust, Schwab Annuity Portfolios, Schwab Strategic Trust and Laudus Trust since 2016) | Consultant (2008 – present), Patmore Management Consulting (management consulting). | | |
J. Derek Penn 1957 Trustee (Trustee of The Charles Schwab Family of Funds, Schwab Investments, Schwab Capital Trust, Schwab Annuity Portfolios, Schwab Strategic Trust and Laudus Trust since 2021) | Head of Equity Sales and Trading (2006 – 2018), BNY Mellon (financial services). | | |
|
Name, Year of Birth, and Position(s) with the trust (Terms of office, and length of Time Served1) | Principal Occupations During the Past Five Years | Number of Portfolios in Fund Complex Overseen by the Trustee | |
Walter W. Bettinger II2 1960 Chairman and Trustee (Trustee of The Charles Schwab Family of Funds, Schwab Investments, Schwab Capital Trust and Schwab Annuity Portfolios since 2008; Schwab Strategic Trust since 2009; Laudus Trust since 2010) | Co-Chairman of the Board (July 2022 – present), Director and Chief Executive Officer (Oct. 2008 – present) and President (Feb. 2007 – Oct. 2021), The Charles Schwab Corporation; President and Chief Executive Officer (Oct. 2008 – Oct. 2021) and Director (May 2008 – Oct. 2021), Charles Schwab & Co., Inc.; Co-Chairman of the Board (July 2022 – present) and Director (Apr. 2006 – present), Charles Schwab Bank, SSB; Co-Chairman of the Board (July 2022 – present) and Director (Nov. 2017 – present), Charles Schwab Premier Bank, SSB; Co-Chairman of the Board (July 2022 – present) and Director (July 2019 – present), Charles Schwab Trust Bank; Director (May 2008 – present), Chief Executive Officer (Aug. 2017 – present) and President (Aug. 2017 – Nov. 2021), Schwab Holdings, Inc.; Manager (Sept. 2023 – present), TD Ameritrade Holding LLC; Director (Oct. 2020 – Aug. 2023), TD Ameritrade Holding Corporation; Director (July 2016 – Oct. 2021), Charles Schwab Investment Management, Inc. | | Director (2008 – present), The Charles Schwab Corporation |
Richard A. Wurster2 1973 Trustee (Trustee of The Charles Schwab Family of Funds, Schwab Investments, Schwab Capital Trust, Schwab Annuity Portfolios, Schwab Strategic Trust and Laudus Trust since 2022) | President (Oct. 2021 – present) and Executive Vice President – Schwab Asset Management Solutions (Apr. 2019 – Oct. 2021), The Charles Schwab Corporation; President, Director (Oct. 2021 – present), Executive Vice President – Schwab Asset Management Solutions (July 2019 – Oct. 2021) and Senior Vice President – Advisory (May 2016 – July 2019), Charles Schwab & Co., Inc.; President (Nov. 2021 – present), Schwab Holdings, Inc.; Director (Oct. 2021 – present) and Chief Executive Officer (Nov. 2019 – Jan. 2022), Charles Schwab Investment Management, Inc.; Director, Chief Executive Officer and President (Mar. 2018 – Oct. 2022), Charles Schwab Investment Advisory, Inc.; Chief Executive Officer (July 2016 – Apr. 2018) and President (Mar. 2017 – Apr. 2018), ThomasPartners, Inc.; Chief Executive Officer (July 2016 – Apr. 2018), Windhaven Investment Management, Inc. | | |
Schwab VIT Growth Portfolio | Annual Report28
Schwab VIT Growth Portfolio
|
Name, Year of Birth, and Position(s) with the trust (Terms of office, and length of Time Served3) | Principal Occupations During the Past Five Years |
Omar Aguilar 1970 Chief Executive Officer, President and Chief Investment Officer (Officer of The Charles Schwab Family of Funds, Schwab Investments, Schwab Capital Trust, Schwab Annuity Portfolios, Schwab Strategic Trust and Laudus Trust since 2011) | Chief Executive Officer (Jan. 2022 – present), President (Oct. 2023 – present), (Chief Investment Officer (Apr. 2011 – present) and Senior Vice President (Apr. 2011 – Jan. 2022), Charles Schwab Investment Management, Inc.; Director, Chief Executive Officer and President (Oct. 2022 – present), Charles Schwab Investment Advisory, Inc.; Chief Executive Officer (Sept. 2023 – present), President (Oct. 2023 – present), Chief Investment Officer (June 2011 – present) and Vice President (June 2011 – Sept. 2023), Schwab Funds, Laudus Trust and Schwab ETFs. |
Mark Fischer 1970 Chief Operating Officer (Officer of The Charles Schwab Family of Funds, Schwab Investments, Schwab Capital Trust, Schwab Annuity Portfolios, Schwab Strategic Trust and Laudus Trust since 2013) | Chief Operating Officer (Dec. 2020 – present) and Treasurer and Chief Financial Officer (Jan. 2016 – Dec. 2022), Schwab Funds, Laudus Trust and Schwab ETFs; Chief Financial Officer (Mar. 2020 – present), Chief Operating Officer (Oct. 2023 – present), Managing Director (Mar. 2023 – present) and Vice President (Oct. 2013 – Mar. 2023), Charles Schwab Investment Management, Inc. |
Dana Smith 1965 Treasurer and Chief Financial Officer (Officer of The Charles Schwab Family of Funds, Schwab Investments, Schwab Capital Trust, Schwab Annuity Portfolios, Schwab Strategic Trust and Laudus Trust since 2023) | Treasurer and Chief Financial Officer (Jan. 2023 – present) and Assistant Treasurer (Dec. 2015 – Dec. 2022), Schwab Funds, Laudus Trust and Schwab ETFs; Managing Director (Mar. 2023 – present), Vice President (Mar. 2022 – Mar. 2023) and Director (Oct. 2015 – Mar. 2022), Charles Schwab Investment Management, Inc.; Managing Director (May 2022 – present) and Vice President (Apr. 2022 – May 2022), Charles Schwab & Co., Inc. |
Patrick Cassidy 1964 Vice President and Chief Investment Officer (Officer of The Charles Schwab Family of Funds, Schwab Investments, Schwab Capital Trust, Schwab Annuity Portfolios, Schwab Strategic Trust and Laudus Trust since 2018) | Chief Investment Officer (Oct. 2023 – present) and Vice President (Feb. 2018 – present), Schwab Funds, Laudus Trust and Schwab ETFs; Managing Director (Mar. 2023 – present), Chief Investment Officer (Oct. 2023 – present), and Senior Vice President (Oct. 2012 – Mar. 2023), Charles Schwab Investment Management, Inc. |
William P. McMahon, Jr. 1972 Vice President and Chief Investment Officer (Officer of The Charles Schwab Family of Funds, Schwab Investments, Schwab Capital Trust, Schwab Annuity Portfolios, Schwab Strategic Trust and Laudus Trust since 2021) | Managing Director (Mar. 2023 – present), Senior Vice President (Jan. 2020 – Mar. 2023) and Chief Investment Officer (Jan. 2020 – present) Charles Schwab Investment Management, Inc.; Vice President and Chief Investment Officer (June 2021 – present), Schwab Funds, Laudus Trust and Schwab ETFs; Senior Vice President and Chief Investment Officer – ThomasPartners Strategies (Apr. 2018 – Dec. 2019), Charles Schwab Investment Advisory, Inc.; Senior Vice President and Chief Investment Officer (May 2001 – Apr. 2018), ThomasPartners, Inc. |
Catherine MacGregor 1964 Chief Legal Officer and Secretary, Schwab Funds and Schwab ETFs Chief Legal Officer, Vice President and Clerk, Laudus Trust (Officer of The Charles Schwab Family of Funds, Schwab Investments, Schwab Capital Trust, Schwab Annuity Portfolios and Laudus Trust since 2005; Schwab Strategic Trust since 2009) | Chief Legal Officer (Mar. 2022 – present), Managing Director (Mar. 2023 – present) and Vice President (Sept. 2005 – Mar. 2023), Charles Schwab Investment Management, Inc.; Managing Director (May 2022 – present) and Vice President (Aug. 2005 – May 2022), Charles Schwab & Co., Inc.; Vice President (Dec. 2005 – present) and Chief Legal Officer and Clerk (Mar. 2007 – present), Laudus Trust; Chief Legal Officer and Secretary (Oct. 2021 – present), Vice President (Nov. 2005 – Oct. 2021) and Assistant Secretary (June 2007 – Oct. 2021), Schwab Funds; Chief Legal Officer and Secretary (Oct. 2021 – present), Vice President and Assistant Secretary (Oct. 2009 – Oct. 2021), Schwab ETFs. |
1
Each Trustee shall hold office until the election and qualification of his or her successor, or until he or she dies, resigns or is removed. The retirement policy requires that each independent trustee retire by December 31 of the year in which the Trustee turns 74 or the Trustee’s twentieth year of service as an independent trustee on any trust in the Fund Complex, whichever occurs first.
2
Mr. Bettinger and Mr. Wurster are Interested Trustees. Mr. Bettinger and Mr. Wurster are Interested Trustees because each owns stock of The Charles Schwab Corporation (CSC), the parent company of Charles Schwab Investment Management, Inc., the investment adviser for the trusts in the Fund Complex, and is an employee of Charles Schwab & Co., Inc. (Schwab), the principal underwriter for The Charles Schwab Family of Funds, Schwab Investments, Schwab Capital Trust, Schwab Annuity Portfolios and Laudus Trust.
3
The President, Treasurer and Secretary/Clerk hold office until their respective successors are chosen and qualified or until he or she sooner dies, resigns, is removed or becomes disqualified. Each of the other officers serves at the pleasure of the Board.
29Schwab VIT Growth Portfolio | Annual Report
Schwab VIT Growth Portfolio
Bloomberg US Aggregate Bond Index An index that is a broad-based benchmark measuring the performance of the U.S. investment grade, taxable bond market, including U.S. Treasuries, government-related and corporate bonds, mortgage pass-through securities, commercial mortgage-backed securities, and asset-backed securities that are publicly available for sale in the United States. To be eligible for inclusion in the index, securities must be fixed rate, non-convertible, U.S. dollar-denominated with at least $300 million or more of outstanding face value and have one or more years remaining to maturity. The index excludes certain types of securities, including tax-exempt state and local government series bonds, structured notes embedded with swaps or other special features, private placements, floating rate securities, inflation-linked bonds and Eurobonds. The index is market capitalization weighted and the securities in the index are updated on the last business day of each month.
Bloomberg US Treasury 3–10 Year Index An index which includes all publicly-issued U.S. Treasury securities that have a remaining maturity of greater than or equal to three years and less than ten years, are rated investment grade, and have $300 million or more of outstanding face value. The securities in the index must be denominated in U.S. dollars and must be fixed-rate and non-convertible. The index excludes state and local government series bonds and coupon issues that have been stripped from bonds. The index is market capitalization weighted and the securities in the index are updated on the last business day of each month.
Bloomberg US Treasury Bills 1–3 Month Index An index that includes all publicly issued zero-coupon U.S. Treasury Bills that have a remaining maturity of less than 3 months but more than 1 month, are rated investment grade and have $300 million or more of outstanding face value. It excludes zero-coupon STRIPS.
Bloomberg US Treasury Inflation-Linked Bond Index (Series-L) An index which includes all publicly-issued U.S. Treasury Inflation-Protected Securities (TIPS) that have at least one year remaining to maturity, are rated investment grade and have $500 million or more of outstanding face value. The TIPS in the index must be denominated in U.S. dollars and must be fixed-rate and non-convertible. The index is market capitalization weighted and the TIPS in the index are updated on the last business day of each month. TIPS are publicly issued, dollar denominated U.S. Government securities issued by the U.S. Treasury that have principal and interest payments linked to an official inflation measure (as measured by the Consumer Price Index, or CPI) and their payments are supported by the full faith and credit of the United States.
Dow Jones Equity All REIT Capped Index A float-adjusted market cap weighted index that is designed to measure all equity real estate investment trusts (REITs) in the Dow Jones U.S. Total Stock Market Index, as defined by the S&P Dow Jones Indices REIT/RESI Industry Classification Hierarchy, that meet the minimum float market capitalization (FMC) and liquidity thresholds. The aggregate weight of all companies weighing more than 4.5% cannot exceed 22.5%, and no single company’s weight can exceed 10%. The index is reviewed daily based on each company’s capped market capitalization weight. Daily capping is only performed when the sum of companies with weights greater than 5% exceeds 25%.
Dow Jones U.S. Large-Cap Total Stock Market Index An index that is a subset of the Dow Jones U.S. Total Stock Market Index, and is designed to measure the performance of large-cap U.S. equity securities. The index is a float-adjusted market capitalization weighted index.
Dow Jones U.S. Select REIT Index An index that is a float-adjusted market-capitalization weighted index comprised of income-producing commercial and/or residential real estate investment trusts (REITs). The index excludes mortgage REITs, net-lease REITs, real estate finance companies, mortgage brokers and bankers, commercial and residential real estate brokers and estate agents, homebuilders, large landowners and sub-dividers of unimproved land, hybrid REITs, timber REITs and companies that have more than 25% of their assets in direct mortgage investments.
Dow Jones U.S. Small-Cap Total Stock Market Index An index that is a subset of the Dow Jones U.S. Total Stock Market Index, and is designed to measure the performance of small-cap U.S. equity securities. The index is a float-adjusted market capitalization weighted index.
Dow Jones U.S. Total Stock Market Index An index which includes all U.S. equity issues with readily available prices. The index is a float-adjusted market capitalization weighted index that reflects the shares of securities actually available to investors in the marketplace.
FTSE Developed ex US Index (Net) An index that is comprised of large- and mid-capitalization companies in developed countries outside the United States, as defined by the index provider. The index defines the large- and mid-capitalization universe as approximately the top 90% of the eligible universe. The Net version of the index reflects reinvested dividends net of withholding taxes, but reflects no deductions for expenses or other taxes.
FTSE Developed Small Cap ex US Liquid Index (Net) An index comprised of small-capitalization companies in developed countries outside the United States, as defined by the index provider. The index defines the small-capitalization universe as approximately the bottom 10% of the eligible universe with a minimum free float capitalization of $150 million. The Net version of the index reflects reinvested dividends net of withholding taxes, but reflects no deductions for expenses or other taxes.
FTSE Emerging Index (Net) An index that is comprised of large- and mid-capitalization companies in emerging market countries, as defined by the index provider. The index defines the large- and mid-capitalization universe as approximately the top 90% of the eligible universe. The Net version of the index reflects reinvested dividends net of withholding taxes, but reflects no deductions for expenses or other taxes.
FTSE non-US Dollar World Government Bond Index A market capitalization index that measures the total rate of return performance for the government bonds of 22 countries, excluding the U.S., with a remaining maturity of at least 1 year.
MSCI EAFE Index (Net) A free float-adjusted market capitalization index that is designed to measure the equity market performance of developed markets in Europe, Australasia, and the Far East. The Net version of the index reflects reinvested dividends net of withholding taxes, but reflects no deductions for expenses or other taxes; returns are calculated applying dividend withholding rates applicable to non-resident persons who do not benefit from double taxation treaties.
MSCI Emerging Markets Index (Net) A free float-adjusted market capitalization weighted index that is designed to measure equity market performance in the global emerging markets. This series approximates the minimum possible dividend reinvestment. The returns are calculated applying dividend withholding rates applicable to non-resident persons who do not benefit from double taxation treaties.
Schwab VIT Growth Portfolio | Annual Report30
Schwab VIT Growth Portfolio
Russell 2000 Index An index that measures the performance of the 2,000 smallest companies in the Russell 3000 Index. The Russell 3000 Index measures the performance of the largest 3,000 U.S. companies representing approximately 98% of the investable U.S. equity market.
S&P 500 Index An index that is designed to measure the performance of 500 leading publicly traded companies from a broad range of industries.
VIT Growth Composite Index A custom blended index developed by Schwab Asset Management based on a comparable portfolio asset allocation and calculated using the following portion allocations effective April 28, 2023: 14.0% Bloomberg US Aggregate Bond Index, 4.0% Bloomberg US Treasury Bills 1-3 Month Index, 6.0% Dow Jones Equity All REIT Capped Index, 39.6% Dow Jones U.S. Large Cap Total Stock Market Index, 6.3% Dow Jones U.S. Small Cap Total Stock Market Index, 5.4% FTSE All Emerging Index (Net), 21.0% FTSE Developed ex US Index (Net), and 3.7% FTSE Developed Small Cap ex US Liquid Index. From July 1, 2020 through April 27, 2023, the blended index was derived using the following allocations: 14.0% Bloomberg US Aggregate Bond Index, 4.0% Bloomberg US Treasury Bills 1-3 Month Index, 6.0% Dow Jones Equity All REIT Capped Index, 35.0% Dow Jones U.S. Large-Cap Total Stock Market Index, 7.0% Dow Jones U.S. Small-Cap Total Stock Market Index, 8.0% FTSE All Emerging Index (Net), 21.0% FTSE Developed ex US Index (Net), 5.0% FTSE Developed Small Cap ex US Liquid Index (Net). From April 29, 2020 through June 30, 2020, the blended index was derived using the following
allocations: 14.0% Bloomberg US Aggregate Bond Index, 4.0% Bloomberg US Treasury Bills 1-3 Month Index, 6.0% Dow Jones U.S. Select REIT Index, 35.0% Dow Jones U.S. Large-Cap Total Stock Market Index, 7.0% Dow Jones U.S. Small-Cap Total Stock Market Index, 8.0% FTSE All Emerging Index (Net), 21.0% FTSE Developed ex US Index (Net), 5.0% FTSE Developed Small Cap ex US Liquid Index (Net). From June 8, 2016 through April 28, 2020, the blended index was derived using the following allocations: 12% Bloomberg US Aggregate Bond Index, 5% Bloomberg US Treasury Bills 1-3 Month Index, 1% Bloomberg US Treasury Inflation-Linked Bond Index (Series-L), 4% Bloomberg Commodity Index, 6% Dow Jones U.S. Select REIT Index, 29% Dow Jones U.S. Large-Cap Total Stock Market Index, 7% Dow Jones U.S. Small-Cap Total Stock Market Index, 8% FTSE All Emerging Index (Net), 21% FTSE Developed ex US Index (Net), 5% FTSE Developed Small Cap ex US Liquid Index (Net), and 2% Russell Microcap Index. Prior to June 8, 2016, the composite index was derived using the following allocations: 29% Dow Jones U.S. Large-Cap Total Stock Market Index, 7% Dow Jones U.S. Small-Cap Total Stock Market Index, 2% Russell Microcap Index, 21% FTSE Developed ex US Index (Net), 5% FTSE Developed Small Cap ex US Liquid Index (Net), 8% FTSE Emerging Index (Net), 6% Dow Jones U.S. Select REIT Index, 4% Dow Jones UBS Commodity Index, 1% Bloomberg US Treasury Inflation-Linked Bond Index (Series-L), 5% Bloomberg US Treasury 3-10 Year Index, 2% Bloomberg US Credit Index, 5% Bloomberg US Mortgage Backed Securities Index, and 5% Bloomberg US Treasury Bills 1-3 Month Index.
31Schwab VIT Growth Portfolio | Annual Report
Item 2: Code of Ethics.
| (a) | Registrant has adopted a code of ethics that applies to its principal executive officer, principal financial officer, and any other persons who perform a similar function, regardless of whether these individuals are employed by Registrant or a third party. |
| (c) | During the period covered by the report, no amendments were made to the provisions of this code of ethics. |
| (d) | During the period covered by the report, Registrant did not grant any waivers, including implicit waivers, from the provisions of this code of ethics. |
| (f)(1) | Registrant has filed this code of ethics as an exhibit pursuant to Item 19(a)(1) of Form N-CSR. |
Item 3: Audit Committee Financial Expert.
Registrant’s Board of Trustees has determined that Kimberly S. Patmore, Michael J. Beer and J. Derek Penn, each currently serving on its audit, compliance and valuation committee, are each an “audit committee financial expert,” as such term is defined in Item 3 of Form N-CSR. Each member of Registrant’s audit, compliance and valuation committee is “independent” under the standards set forth in Item 3 of Form N-CSR.
The designation of each of Ms. Patmore, Mr. Beer and Mr. Penn as an “audit committee financial expert” pursuant to Item 3 of Form N-CSR does not (i) impose upon such individual any duties, obligations, or liability that are greater than the duties, obligations and liability imposed upon such individual as a member of Registrant’s audit, compliance and valuation committee or Board of Trustees in the absence of such designation; and (ii) affect the duties, obligations or liability of any other member of Registrant’s audit, compliance and valuation committee or Board of Trustees.
Item 4: Principal Accountant Fees and Services.
(a) Below are the aggregate fees billed for each of the last two fiscal years for professional services rendered by the principal accountant for the audit of Registrant’s annual financial statements or services that are normally provided by the accountant in connection with statutory and regulatory filings or engagements.
The following table presents fees billed by the principal accountant in each of the last two fiscal years for the services rendered to the Funds:
| | | | | | | | | | | | | | | | | | | | | | | | | | | | | | |
| (a)Audit Fees1 | | | (b)Audit-Related Fees2 | | | (c) Tax Fees3 | | | (d) All Other Fees | |
Fiscal Year
2023 | | | Fiscal Year
2022 | | | Fiscal Year
2023 | | | Fiscal Year
2022 | | | Fiscal Year
2023 | | | Fiscal Year
2022 | | | Fiscal Year
2023 | | | Fiscal Year
2022 | |
| | $109,731 | | | $ | 103,520 | | | $ | 9,540 | | | $ | 9,000 | | | $ | 16,425 | | | $ | 15,500 | | | $ | 0 | | | $ | 0 | |
| 1 | The nature of the services includes audit of the registrant’s annual financial statements and normally provided services in connection with regulatory filings for those fiscal years. |
| 2 | The nature of the services includes assurance and related services reasonably related to the performance of the audit of financial statements not included in Audit Fees. |
| 3 | The nature of the services includes tax compliance, tax advice and tax planning. |
| (e) (1) | Registrant’s audit, compliance and valuation committee does not have pre-approval policies and procedures as described in paragraph (c)(7) of Rule 2-01 of Regulation S-X. |
| (2) | There were no services described in each of paragraphs (b) through (d) above that were approved by Registrant’s audit, compliance and valuation committee pursuant to paragraph (c)(7)(i)(C) of Rule 2-01 of Regulation S-X. |
(f) Not applicable.
(g) Below are the aggregate non-audit fees billed in each of the last two fiscal years by Registrant’s principal accountant for services rendered to Registrant, to Registrant’s investment adviser, and to any entity controlling, controlled by, or under common control with Registrant’s investment adviser that provides ongoing services to Registrant.
2023: $3,940,154 2022: $3,031,117
(h) During the past fiscal year, all non-audit services provided by Registrant’s principal accountant to either Registrant’s investment adviser or to any entity controlling, controlled by, or under common control with Registrant’s investment adviser that provides ongoing services to Registrant were pre-approved. Included in the audit, compliance and valuation committee’s pre-approval was the review and consideration as to whether the provision of these non-audit services is compatible with maintaining the principal accountant’s independence.
(i) Not applicable.
(j) Not applicable.
Item 5: Audit Committee of Listed Registrants.
Not applicable.
Item 6: Investments.
The schedules of investments are included as part of the report to shareholders filed under Item 1 of this Form.
Item 7: Financial Statements and Financial Highlights for Open-End Management Investment Companies.
The financial statements and financial highlights are included as part of the report to shareholders filed under Item 1 of this Form.
Item 8: Changes in and Disagreements with Accountants for Open-End Management Investment Companies.
Not applicable.
Item 9: Proxy Disclosures for Open-End Management Investment Companies.
Not applicable.
Item 10: Remuneration Paid to Directors, Officers, and Others of Open-End Management Investment Companies.
The remuneration paid to directors, officers and others are included as part of the report to shareholders filed under Item 1 of this Form.
Item 11: Statement Regarding Basis for Approval of Investment Advisory Contract.
Not applicable.
Item 12: Disclosure of Proxy Voting Policies and Procedures for Closed-End Management Investment Companies.
Not applicable.
Item 13: Portfolio Managers of Closed-End Management Investment Companies.
Not applicable.
Item 14: Purchases of Equity Securities by Closed-End Management Investment Company and Affiliated Purchasers.
Not applicable.
Item 15: Submission of Matters to a Vote of Security Holders.
Not applicable.
Item 16: Controls and Procedures.
| | (a) | Based on their evaluation of Registrant’s disclosure controls and procedures, as of a date within 90 days of the filing date, Registrant’s Chief Executive Officer, Omar Aguilar and Registrant’s Chief Financial Officer, Dana Smith, have concluded that Registrant’s disclosure controls and procedures are: (i) reasonably designed to ensure that information required to be disclosed in this report is appropriately communicated to Registrant’s officers to allow timely decisions regarding disclosures required in this report; (ii) reasonably designed to ensure that information required to be disclosed in this report is recorded, processed, summarized and reported in a timely manner; and (iii) are effective in achieving the goals described in (i) and (ii) above. |
| | (b) | During the period covered by this report, there have been no changes in Registrant’s internal control over financial reporting that the above officers believe to have materially affected, or to be reasonably likely to materially affect, Registrant’s internal control over financial reporting. |
Item 17: Disclosure of Securities Lending Activities for Closed-End Management Investment Companies.
Not applicable.
Item 18: Recovery of Erroneously Awarded Compensation.
Item 19: Exhibits.
Pursuant to the requirements of the Securities Exchange Act of 1934 and the Investment Company Act of 1940, the registrant has duly caused this report to be signed on its behalf by the undersigned, thereunto duly authorized.
(Registrant) Schwab Annuity Portfolios
| | |
| By: | | /s/ Omar Aguilar |
| | Omar Aguilar Chief Executive Officer |
| |
| Date: | | February 16, 2024 |
Pursuant to the requirements of the Securities Exchange Act of 1934 and the Investment Company Act of 1940, this report has been signed below by the following persons on behalf of the registrant and in the capacities and on the dates indicated.
| | |
| By: | | /s/ Omar Aguilar |
| | Omar Aguilar Chief Executive Officer |
| |
| Date: | | February 16, 2024 |
| |
| By: | | /s/ Dana Smith |
| | Dana Smith Chief Financial Officer |
| |
| Date: | | February 16, 2024 |