Item 1: Report to Shareholders| International Stock Portfolio | December 31, 2005 |
The views and opinions in this report were current as of December 31, 2005. They are not guarantees of performance or investment results and should not be taken as investment advice. Investment decisions reflect a variety of factors, and the managers reserve the right to change their views about individual stocks, sectors, and the markets at any time. As a result, the views expressed should not be relied upon as a forecast of the fund’s future investment intent. The report is certified under the Sarbanes-Oxley Act of 2002, which requires mutual funds and other public companies to affirm that, to the best of their knowledge, the information in their financial reports is fairly and accurately stated in all material respects.
Dear Investor
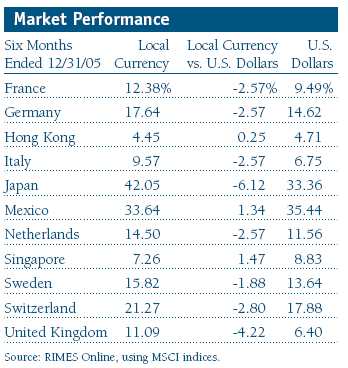
International stocks set a robust pace during the past six months, delivering substantial returns for the year overall. Emerging markets were the strongest performers in 2005, although they suffered the steepest decline in October as markets with the biggest gains were punished most by profit-taking, concerns about inflation, and high oil prices. European stocks did well in both periods, and Japan’s results were outstanding during the past six months.
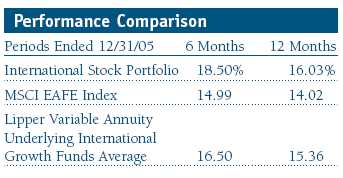
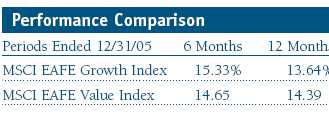
The portfolio handily surpassed the returns of the MSCI EAFE Index during both the recent six-month period and the full year ended December 31, 2005, as the portfolio’s financial holdings, particularly Japanese banks and real estate stocks, rebounded sharply in response to an economic upturn in that country. Fund results were also favorable versus the Lipper Variable Annuity Underlying International Growth Funds Average. In addition, our telecom holdings benefited relative performance even as the sector as a whole languished over the year. Value stocks outperformed growth through most of 2005, but fund performance was boosted later in the year when growth stocks finally sprang to life.
MARKET ENVIRONMENT
In Europe, companies continued to manage capital well by reducing debt and other costs, which led to increased cash flows and stock buybacks. Relatively high dividend yields and low interest rates provided an underpinning for the markets. Prolonged inflationary pressures, however, could lead to moderate rate increases in coming months as the European Central Bank demonstrates its commitment to contain inflation. Stock valuations have been reasonable and earnings growth was solid, particularly in the financials sector. Recent economic data have been encouraging, and we expect broad European economic growth to be moderate in the medium term.
The Japanese economy continued on its upward trend (notwithstanding a sell-off in stocks after year-end), and higher corporate revenues combined with greater cost controls have boosted the quality of earnings. The corporate sector enjoyed good liquidity, reflecting declining debt repayments, and dividend payments have been rising. Private spending has been the driver of Japan’s recovery. Japanese business has been investing heavily, and domestic consumption continued to pick up—key factors in determining whether Japan’s economic upturn will be sustainable long term. Employment expanded, lending further support to increased household consumption. Lending by the nation’s banks has stopped declining, and nonperforming loans are being trimmed, which is flowing through to earnings growth.
The strong corporate performance witnessed in many emerging markets last year was supported by cyclical factors such as escalating commodity prices and fundamental improvements in areas such as company management and governance. Sales and earnings growth have been strong, driven to a large extent by relatively stable domestic political and economic environments. Emerging market companies have used their improving cash flow to strengthen balance sheets, pay down debt, and distribute bigger dividends to investors.
PORTFOLIO REVIEW
As mentioned, stock selection among Japanese banks and real estate holdings aided fund performance versus the MSCI EAFE benchmark over the year. Election results in Japan and signs that the country’s economy may finally be strengthening after a prolonged recession boosted the shares of leading commercial bank Sumitomo Mitsui Financial. Observers believe that long-awaited economic reforms will continue under Prime Minister Koizumi. Similarly, Resona Holdings posted good yearly results, and real estate conglomerates Mitsui Fudosan and Leopalace21 benefited from the improved economic environment. European financials also did well with improved earnings due to higher mortgage and lending activity, which boosted shares of Italy’s UniCredito and Germany’s Commerzbank. (Please refer to our portfolio of investments for a complete listing of portfolio holdings and the amount each represents of the portfolio.)
Telecom stock selection was another strong contributor to relative results, even though the sector did poorly. Mexico’s America Movil and Canada’s Telus posted excellent results. The portfolio’s information technology holdings provided a bright spot as well, as shares of South Korea’s Samsung Electronics and India’s I-Flex Solutions soared thanks to good earnings momentum. Samsung has been able to invest more capital in its production facilities than most of the company’s rivals, thereby fueling more growth in capacity and productivity. In addition, as might be expected during a year in which energy prices skyrocketed, Brazil’s Petroleo Brasileiro (Petrobras), Latin America’s biggest oil company, was one of the largest contributors to fund performance during the past 12 months. The company has particular expertise in deep-water exploration, has prospered from higher oil prices and increased production output, and still traded at an attractive valuation relative to its global peers at the end of the year.
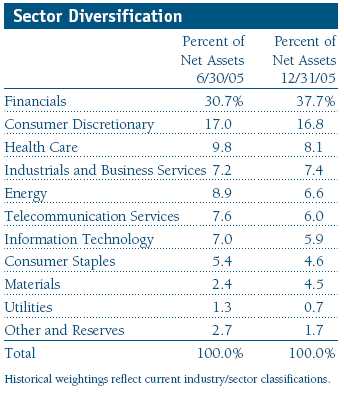
There were restraints on portfolio performance as well, primarily due to an underweight in materials, an overweight in the weak telecom sector, and poor stock selection in the consumer discretionary and industrials sectors. U.K. retailer Kingfisher warned in April that sales were likely to decline because of poor economic prospects. Earnings estimates had been slipping, and the shares suffered accordingly. We decided to eliminate the stock from the portfolio. Another detractor from performance was Vodafone, the U.K. telecom stock. The share price fell about 10% on warnings of slower sales and profit growth, as well as potential tax liabilities.
Market activity during the past few months prompted us to sell stocks of companies whose prospects we no longer are optimistic about and switch into stocks we believe could benefit from potential merger and acquisition activity as well as strengthening economies. We purchased stocks of companies in a wide variety of sectors, including Swiss pharmaceutical Novartis, whose prospects we like; Erste Bank, which is exposed to retail banking in under-penetrated markets in central and eastern Europe; and Aviva, a market leader in an improving U.K. insurance climate. Among our sales were BP, whose output was adversely affected by the Gulf Coast hurricanes in 2005; GUS, a retailer and business services company whose prospects are uncertain because of trading conditions in the U.K.; and France Telecom, which is experiencing difficulties because of heavy competition in France’s fixed line and mobile businesses.
OUTLOOK
A buoyant world economy, strong corporate profitability, and increased merger and acquisition activity should support global markets in 2006. Despite three years of gains, valuations remain reasonable as profit growth has outstripped price increases. The dollar strengthened in 2005, largely due to the combination of U.S. rate increases and restrained policies at other central banks. Recently, there have been indications that the Fed is nearing the end of its current tightening cycle, while prospects are growing for a round of monetary tightening elsewhere. The persistence of the U.S. budget and trade deficits, however, suggests that the dollar may well weaken again, which would boost returns for U.S. investors.
Threats to our positive outlook for 2006 include the possibilities of tightening global liquidity, volatile commodity prices, an economic slowdown in China, and heightened political risk, especially in Latin America. Our portfolios will retain their bias toward companies positioned to benefit from improving domestic demand, rather than those exposed to the more cyclical dollar-sensitive export sectors such as materials. We believe this positioning will continue to reward investors in 2006 given the sound global economic environment and the ongoing improvement in corporate fundamentals.
Respectfully submitted,

David J.L. Warren
President, T. Rowe Price International Funds, Inc.
January 20, 2006
| Risks of International Investing |
Funds that invest overseas generally carry more risk than funds that invest strictly in U.S. assets. Funds investing in a single country or in a limited geographic region tend to be riskier than more diversified funds. Risks can result from varying stages of economic and political development; differing regulatory environments, trading days, and accounting standards; and higher transaction costs of non-U.S. markets. Non-U.S. investments are also subject to currency risk, or a decline in the value of a foreign currency versus the U.S. dollar, which reduces the dollar value of securities denominated in that currency.
GDP: Gross domestic product is the total market value of all goods and services produced in a country in a given year.
Lipper averages: The averages of available mutual fund performance returns for specified periods in defined categories as tracked by Lipper Inc.
MSCI EAFE Index: Widely accepted as the benchmark for international stock performance (EAFE refers to Europe, Australasia, and Far East). The index represents the major markets of the world.
Price/earnings ratio: Calculated by dividing a stock’s market value per share by the company’s earnings per share for the past 12 months or by expected earnings for the coming year.

This chart shows the value of a hypothetical $10,000 investment in the fund over the past 10 fiscal year periods or since inception (for funds lacking 10-year records). The result is compared with benchmarks, which may include a broad-based market index and a peer group average or index. Market indexes do not include expenses, which are deducted from fund returns as well as mutual fund averages and indexes.
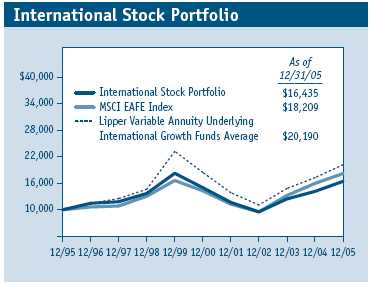
Current performance may be higher or lower than the quoted past performance, which cannot guarantee future results. Share price, principal value, and return will vary, and you may have a gain or loss when you sell your shares. For the most recent month-end performance information, please visit our Web site (troweprice.com) or contact a T. Rowe Price representative at 1-800-469-5304. Total returns do not include charges imposed by your insurance company’s separate account. If these were included, performance would have been lower.
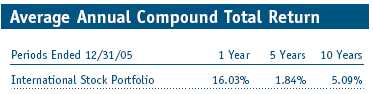
This table shows how the portfolio would have performed each year if its actual (or cumulative) returns for the periods shown had been earned at a constant rate. Average annual total return figures include changes in principal value, reinvested dividends, and capital gain distributions. When assessing performance, investors should consider both short- and long-term returns.
Fund Expense Example
As a mutual fund shareholder, you may incur two types of costs: (1) transaction costs such as redemption fees or sales loads and (2) ongoing costs, including management fees, distribution and service (12b-1) fees, and other fund expenses. The following example is intended to help you understand your ongoing costs (in dollars) of investing in the fund and to compare these costs with the ongoing costs of investing in other mutual funds. The example is based on an investment of $1,000 invested at the beginning of the most recent six-month period and held for the entire period.
Actual Expenses
The first line of the following table ("Actual") provides information about actual account values and actual expenses. You may use the information in this line, together with your account balance, to estimate the expenses that you paid over the period. Simply divide your account value by $1,000 (for example, an $8,600 account value divided by $1,000 = 8.6), then multiply the result by the number in the first line under the heading "Expenses Paid During Period" to estimate the expenses you paid on your account during this period.
Hypothetical Example for Comparison Purposes
The information on the second line of the table ("Hypothetical") is based on hypothetical account values and expenses derived from the fund’s actual expense ratio and an assumed 5% per year rate of return before expenses (not the fund’s actual return). You may compare the ongoing costs of investing in the fund with other funds by contrasting this 5% hypothetical example and the 5% hypothetical examples that appear in the shareholder reports of the other funds. The hypothetical account values and expenses may not be used to estimate the actual ending account balance or expenses you paid for the period.
You should also be aware that the expenses shown in the table highlight only your ongoing costs and do not reflect any transaction costs, such as redemption fees or sales loads. Therefore, the second line of the table is useful in comparing ongoing costs only, and will not help you determine the relative total costs of owning different funds. To the extent a fund charges transaction costs, however, the total cost of owning that fund is higher.

Financial Highlights
T. Rowe Price International Stock Portfolio

The accompanying notes are an integral part of these financial statements.
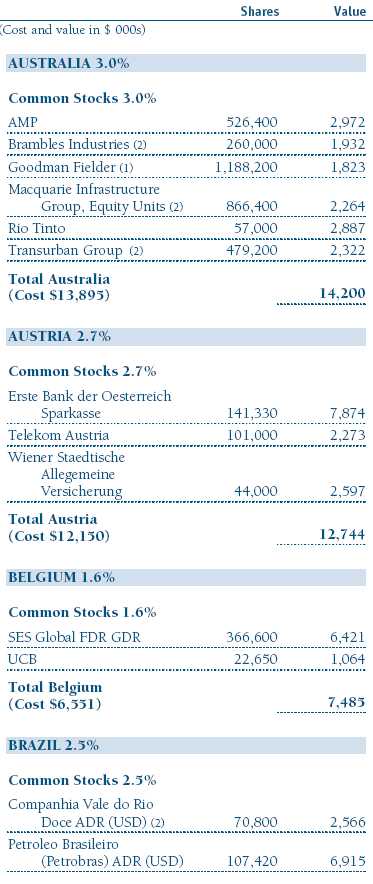
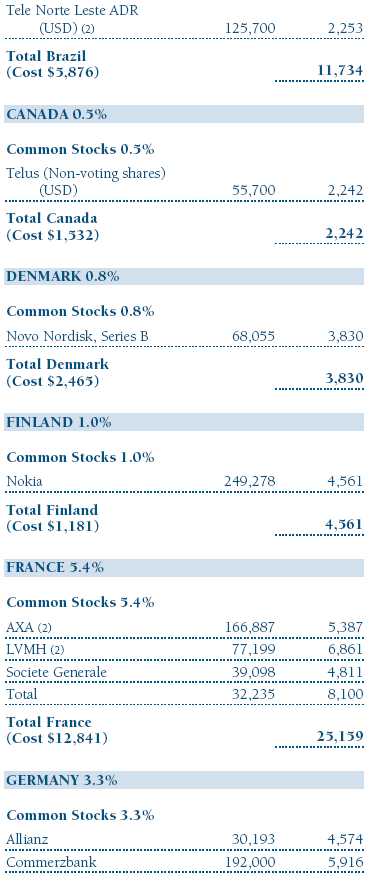
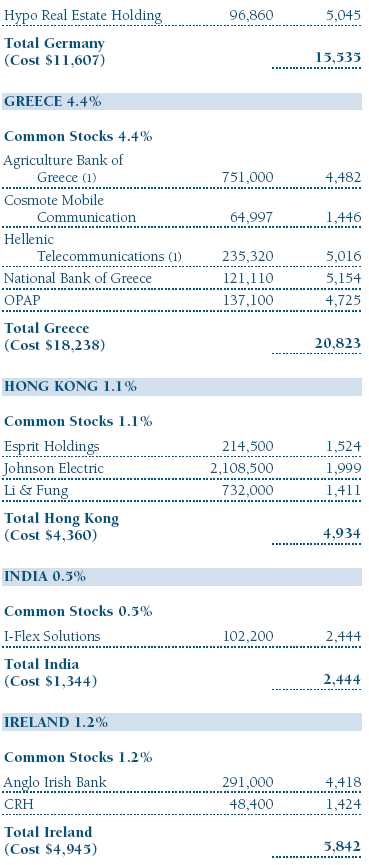
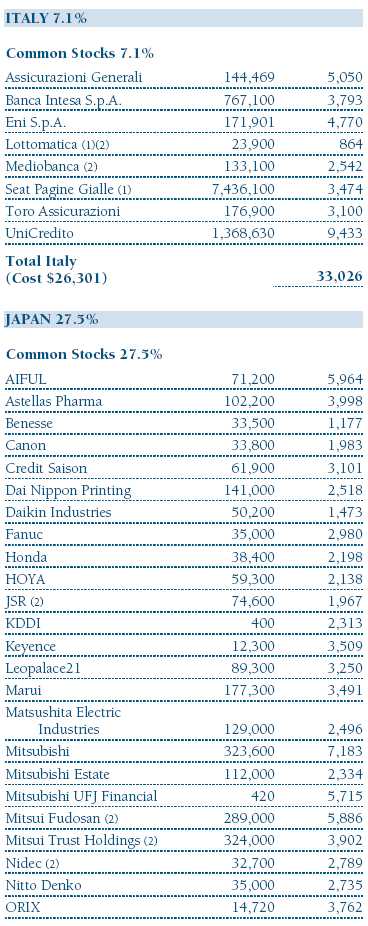
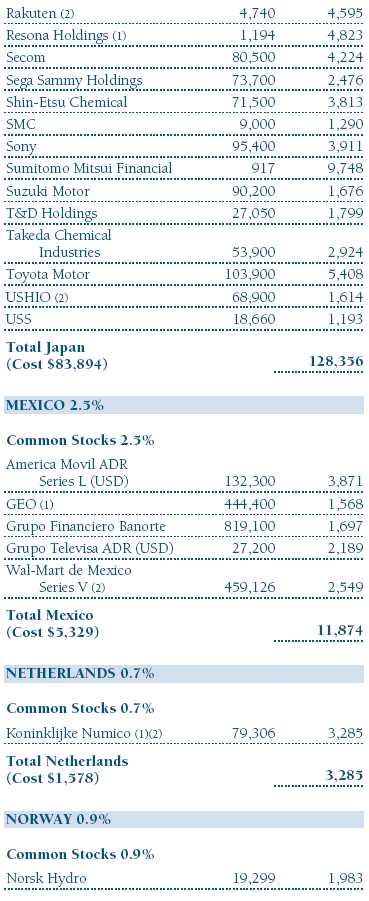
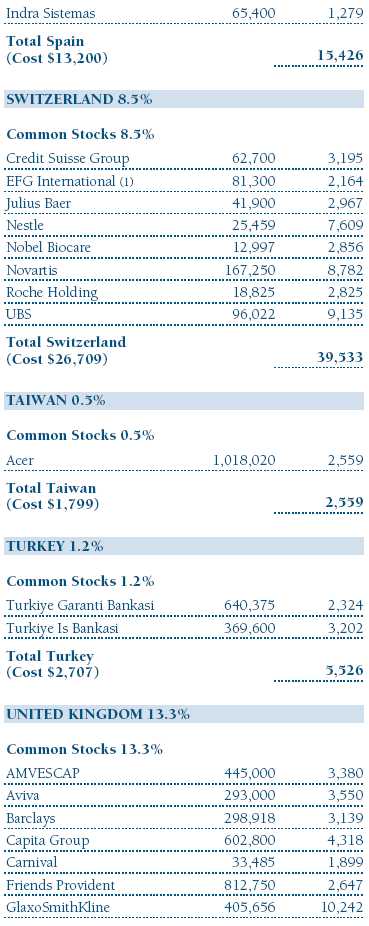
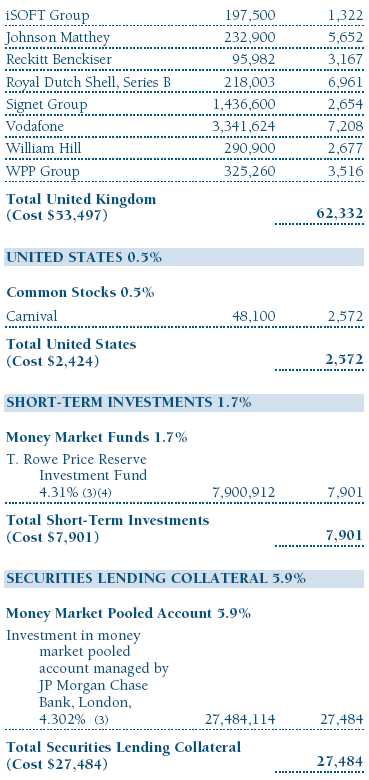
Portfolio of Investments †
T. Rowe Price International Stock Portfolio
December 31, 2005


The accompanying notes are an integral part of these financial statements.
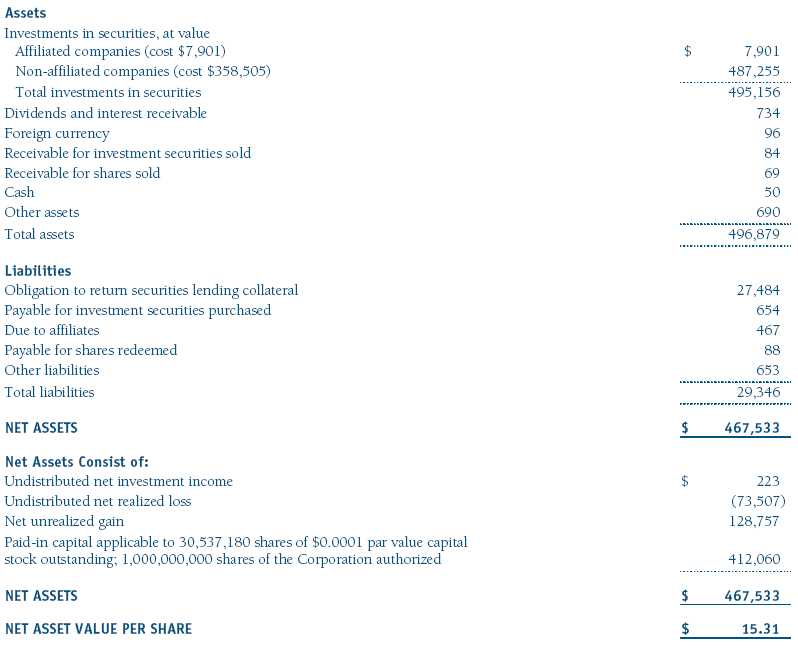
Statement of Assets and Liabilities
T. Rowe Price International Stock Portfolio
December 31, 2005
(In thousands except shares and per share amounts)
The accompanying notes are an integral part of these financial statements.
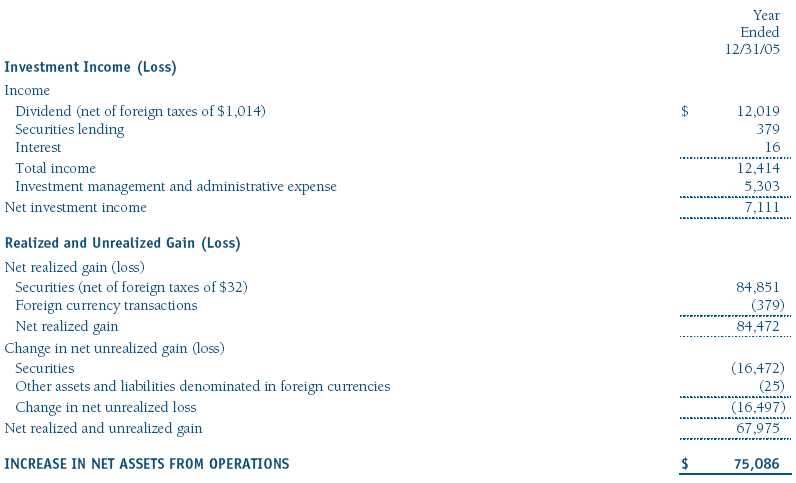
Statement of Operations
T. Rowe Price International Stock Portfolio
($ 000s)
The accompanying notes are an integral part of these financial statements.
Statement of Changes in Net Assets
T. Rowe Price International Stock Portfolio
($ 000s)
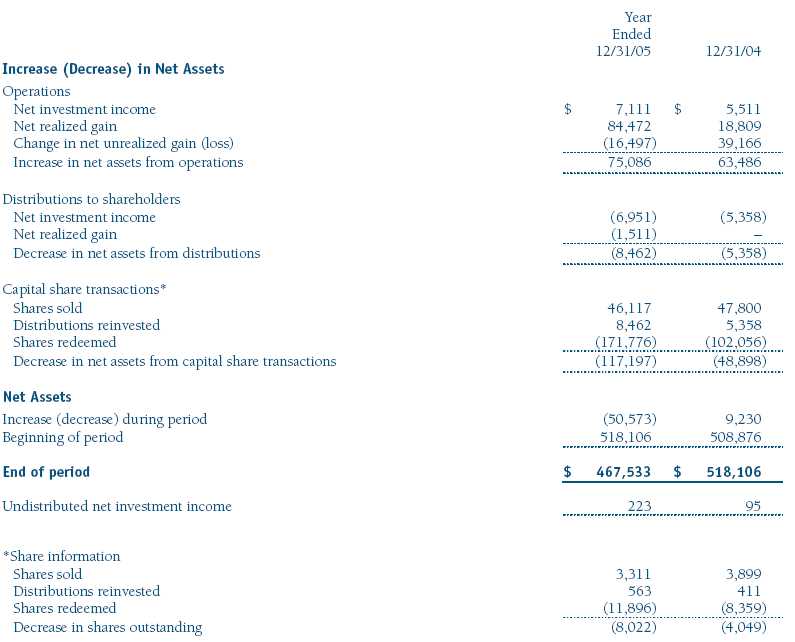
The accompanying notes are an integral part of these financial statements.
Notes to Financial Statements
T. Rowe Price International Stock Portfolio
December 31, 2005
NOTE 1 - SIGNIFICANT ACCOUNTING POLICIES
T. Rowe Price International Series, Inc. (the corporation) is registered under the Investment Company Act of 1940 (the 1940 Act). The International Stock Portfolio (the fund), a diversified, open-end management investment company, is one portfolio established by the corporation. The fund commenced operations on March 31, 1994. The fund seeks long-term growth of capital through investments primarily in the common stocks of established, non-U.S. companies. Shares of the fund are currently offered only through certain insurance companies as an investment medium for both variable annuity contracts and variable life insurance policies.
The accompanying financial statements were prepared in accordance with accounting principles generally accepted in the United States of America, which require the use of estimates made by fund management. Fund management believes that estimates and security valuations are appropriate; however actual results may differ from those estimates, and the security valuations reflected in the financial statements may differ from the value the fund ultimately realizes upon sale of the securities.
Valuation The fund values its investments and computes its net asset value per share at the close of the New York Stock Exchange (NYSE), normally 4 p.m. ET, each day that the NYSE is open for business. Equity securities listed or regularly traded on a securities exchange or in the over-the-counter market are valued at the last quoted sale price or, for certain markets, the official closing price at the time the valuations are made, except for OTC Bulletin Board securities, which are valued at the mean of the latest bid and asked prices. A security that is listed or traded on more than one exchange is valued at the quotation on the exchange determined to be the primary market for such security. Listed securities not traded on a particular day are valued at the mean of the latest bid and asked prices for domestic securities and the last quoted sale price for international securities.
Investments in mutual funds are valued at the mutual fund’s closing net asset value per share on the day of valuation.
Other investments, including restricted securities, and those for which the above valuation procedures are inappropriate or are deemed not to reflect fair value are stated at fair value as determined in good faith by the T. Rowe Price Valuation Committee, established by the fund’s Board of Directors.
Most foreign markets close before the close of trading on the NYSE. If the fund determines that developments between the close of a foreign market and the close of the NYSE will, in its judgment, materially affect the value of some or all of its portfolio securities, which in turn will affect the fund’s share price, the fund will adjust the previous closing prices to reflect the fair value of the securities as of the close of the NYSE, as determined in good faith by the T. Rowe Price Valuation Committee, established by the fund’s Board of Directors. A fund may also fair value securities in other situations, such as when a particular foreign market is closed but the fund is open. In deciding whether to make fair value adjustments, the fund reviews a variety of factors, including developments in foreign markets, the performance of U.S. securities markets, and the performance of instruments trading in U.S. markets that represent foreign securities and baskets of foreign securities. The fund uses outside pricing services to provide it with closing market prices and information used for adjusting those prices. The fund cannot predict when and how often it will use closing prices and when it will adjust those prices to reflect fair value. As a means of evaluating its fair value process, the fund routinely compares closing market prices, the next day’s opening prices in the same markets, and adjusted prices.
Currency Translation Assets, including investments, and liabilities denominated in foreign currencies are translated into U.S. dollar values each day at the prevailing exchange rate, using the mean of the bid and asked prices of such currencies against U.S. dollars as quoted by a major bank. Purchases and sales of securities, income, and expenses are translated into U.S. dollars at the prevailing exchange rate on the date of the transaction. The effect of changes in foreign currency exchange rates on realized and unrealized security gains and losses is reflected as a component of security gains and losses.
Investment Transactions, Investment Income, and Distributions Income and expenses are recorded on the accrual basis. Dividends received from mutual fund investments are reflected as dividend income; capital gain distributions are reflected as realized gain/loss. Dividend income and capital gain distributions are recorded on the ex-dividend date. Investment transactions are accounted for on the trade date. Realized gains and losses are reported on the identified cost basis. Distributions to shareholders are recorded on the ex-dividend date. Income distributions are declared and paid on an annual basis. Capital gain distributions, if any, are declared and paid by the fund, typically on an annual basis.
NOTE 2 - INVESTMENT TRANSACTIONS
Consistent with its investment objective, the fund engages in the following practices to manage exposure to certain risks or enhance performance. The investment objective, policies, program, and risk factors of the fund are described more fully in the fund’s prospectus and Statement of Additional Information.
Emerging Markets At December 31, 2005, approximately 17% of the fund’s net assets were invested in securities of companies located in emerging markets or denominated in or linked to the currencies of emerging market countries. Future economic or political developments could adversely affect the liquidity or value, or both, of such securities.
Restricted Securities The fund may invest in securities that are subject to legal or contractual restrictions on resale. Although certain of these securities may be readily sold, for example, under Rule 144A, others may be illiquid, their sale may involve substantial delays and additional costs, and prompt sale at an acceptable price may be difficult.
Securities Lending The fund lends its securities to approved brokers to earn additional income. It receives as collateral cash and U.S. government securities valued at 102% to 105% of the value of the securities on loan. Cash collateral is invested in a money market pooled account managed by the fund’s lending agent in accordance with investment guidelines approved by fund management. Collateral is maintained over the life of the loan in an amount not less than the value of loaned securities, as determined at the close of fund business each day; any additional collateral required due to changes in security values is delivered to the fund the next business day. Although risk is mitigated by the collateral, the fund could experience a delay in recovering its securities and a possible loss of income or value if the borrower fails to return the securities. Securities lending revenue recognized by the fund consists of earnings on invested collateral and borrowing fees, net of any rebates to the borrower and compensation to the lending agent. At December 31, 2005, the value of loaned securities was $26,218,000; aggregate collateral consisted of $27,484,000 in the money market pooled account.
Other Purchases and sales of portfolio securities, other than short-term securities, aggregated $350,944,000 and $467,490,000, respectively, for the year ended December 31, 2005.
NOTE 3 - FEDERAL INCOME TAXES
No provision for federal income taxes is required since the fund intends to continue to qualify as a regulated investment company under Subchapter M of the Internal Revenue Code and distribute to shareholders all of its taxable income and gains. Federal income tax regulations differ from generally accepted accounting principles; therefore, distributions determined in accordance with tax regulations may differ significantly in amount or character from net investment income and realized gains for financial reporting purposes. Financial reporting records are adjusted for permanent book/tax differences to reflect tax character. Financial records are not adjusted for temporary differences.
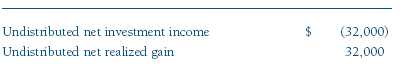
Distributions during the year ended December 31, 2005 totaled $8,462,000 and were characterized as ordinary income for tax purposes. At December 31, 2005, the tax-basis components of net assets were as follows:

Federal income tax regulations require the fund to treat the gain/loss on passive foreign investment companies as realized on the last day of the tax year; accordingly, $2,421,000 of unrealized gains reflected in the accompanying financial statements were realized for tax purposes as of December 31, 2005. The fund intends to retain realized gains to the extent of available capital loss carryforwards for federal income tax purposes. During the year ended December 31, 2005, the fund utilized $84,262,000 of capital loss carryforwards. As of December 31, 2005, the fund had $22,295,000 of capital loss carryforwards that expire in 2010 and $49,887,000 that expire in 2011.
For the year ended December 31, 2005, the fund recorded the following permanent reclassifications to reflect tax character. Reclassifications between income and gain relate primarily to the character of foreign capital gain taxes. Results of operations and net assets were not affected by these reclassifications.
At December 31, 2005, the cost of investments for federal income tax purposes was $368,827,000.
NOTE 4 - FOREIGN TAXES
The fund is subject to foreign income taxes imposed by certain countries in which it invests. Foreign income taxes are accrued by the fund as a reduction of income.
Gains realized upon disposition of certain Indian securities held by the fund are subject to capital gains tax in India, payable prior to repatriation of sale proceeds. The tax is computed on net realized gains, and realized losses in excess of gains may be carried forward eight years to offset future gains. In addition, the fund accrues a deferred tax liability for net unrealized gains on Indian securities when applicable. At December 31, 2005, the fund had no deferred tax liability, and $164,000 of capital loss carry-forwards that expire in 2009, $3,055,000 that expire in 2010, and $1,929,000 that expire thereafter through 2013.
NOTE 5 - RELATED PARTY TRANSACTIONS
The fund is managed by T. Rowe Price International, Inc. (the manager), a wholly owned subsidiary of T. Rowe Price Associates, Inc. (Price Associates), which is wholly owned by T. Rowe Price Group, Inc. The investment management and administrative agreement between the fund and the manager provides for an all-inclusive annual fee equal to 1.05% of the fund’s average daily net assets. The fee is computed daily and paid monthly. The agreement provides that investment management, shareholder servicing, transfer agency, accounting, and custody services are provided to the fund, and interest, taxes, brokerage commissions, directors’ fees and expenses, and extraordinary expenses are paid directly by the fund.
The fund may invest in the T. Rowe Price Reserve Investment Fund and the T. Rowe Price Government Reserve Investment Fund (collectively, the T. Rowe Price Reserve Funds), open-end management investment companies managed by Price Associates and affiliates of the fund. The T. Rowe Price Reserve Funds are offered as cash management options to mutual funds, trusts, and other accounts managed by Price Associates and/or its affiliates, and are not available for direct purchase by members of the public. The T. Rowe Price Reserve Funds pay no investment management fees. During the year ended December 31, 2005, dividend income from the T. Rowe Price Reserve Funds totaled $291,000, and the value of shares of the T. Rowe Price Reserve Funds held at December 31, 2005 and December 31, 2004 was $7,901,000 and $9,565,000, respectively.
Report of Independent Registered Public Accounting Firm
To the Board of Directors of T. Rowe Price International Series, Inc. and
Shareholders of T. Rowe Price International Stock Portfolio
In our opinion, the accompanying statement of assets and liabilities, including the portfolio of investments, and the related statements of operations and of changes in net assets and the financial highlights present fairly, in all material respects, the financial position of T. Rowe Price International Stock Portfolio (one of the portfolios comprising T. Rowe Price International Series, Inc., hereafter referred to as the "Fund") at December 31, 2005, the results of its operations for the year then ended, the changes in its net assets for each of the two years in the period then ended and the financial highlights for each of the five years in the period then ended, in conformity with accounting principles generally accepted in the United States of America. These financial statements and financial highlights (hereafter referred to as "financial statements") are the responsibility of the Fund’s management; our responsibility is to express an opinion on these financial statements based on our audits. We conducted our audits of these financial statements in accordance with the standards of the Public Company Accounting Oversight Board (United States). Those standards require that we plan and perform the audit to obtain reasonable assurance about whether the financial statements are free of material misstatement. An audit includes examining, on a test basis, evidence supporting the amounts and disclosures in the financial statements, assessing the accounting principles used and significant estimates made by management, and evaluating the overall financial statement presentation. We believe that our audits, which included confirmation of securities at December 31, 2005 by correspondence with the custodian and by agreement to the underlying ownership records for T. Rowe Price Reserve Investment Fund, provide a reasonable basis for our opinion.
PricewaterhouseCoopers LLP
Baltimore, Maryland
February 7, 2006
| Tax Information (Unaudited) for the Tax Year Ended 12/31/05 |
We are providing this information as required by the Internal Revenue Code. The amounts shown may differ from those elsewhere in this report because of differences between tax and financial reporting requirements.
The fund’s distributions to shareholders included $1,512,000 from short-term capital gains.
For taxable non-corporate shareholders, $7,296,000 of the fund’s income represents qualified dividend income subject to the 15% rate category.
The fund will pass through foreign source income of $8,956,000 and foreign taxes paid of $420,000.
| Information on Proxy Voting Policies, Procedures, and Records |
A description of the policies and procedures used by T. Rowe Price funds and portfolios to determine how to vote proxies relating to portfolio securities is available in each fund’s Statement of Additional Information, which you may request by calling 1-800-225-5132 or by accessing the SEC’s Web site, www.sec.gov. The description of our proxy voting policies and procedures is also available on our Web site, www.troweprice.com. To access it, click on the words "Company Info" at the top of our homepage for individual investors. Then, in the window that appears, click on the "Proxy Voting Policy" navigation button in the top left corner.
Each fund’s most recent annual proxy voting record is available on our Web site and through the SEC’s Web site. To access it through our Web site, follow the directions above, then click on the words "Proxy Voting Record" at the bottom of the Proxy Voting Policy page.
| How to Obtain Quarterly Portfolio Holdings |
The fund files a complete schedule of portfolio holdings with the Securities and Exchange Commission for the first and third quarters of each fiscal year on Form N-Q. The fund’s Form N-Q is available electronically on the SEC’s Web site (www.sec.gov); hard copies may be reviewed and copied at the SEC’s Public Reference Room, 450 Fifth St. N.W., Washington, DC 20549. For more information on the Public Reference Room, call 1-800-SEC-0330.
| About the Fund’s Directors and Officers |
Your fund is governed by a Board of Directors that meets regularly to review investments, performance, compliance matters, advisory fees, expenses, and other business affairs, and is responsible for protecting the interests of shareholders. The majority of the fund’s directors are independent of T. Rowe Price Associates, Inc. (T. Rowe Price); "inside" directors are officers of T. Rowe Price. The Board of Directors elects the fund’s officers, who are listed in the final table. The business address of each director and officer is 100 East Pratt Street, Baltimore, MD 21202. The Statement of Additional Information includes additional information about the fund directors and is available without charge by calling a T. Rowe Price representative at 1-800-225-5132.
| Independent Directors | |
| |
| Name (Year of Birth) | |
| Year Elected* [Number of | |
| T. Rowe Price Portfolios | Principal Occupation(s) During Past 5 Years |
| Overseen] | and Directorships of Other Public Companies |
| |
| Anthony W. Deering (1945) | Chairman, Exeter Capital, LLC, a private investment firm (2004 to present); Director, Chairman of the Board, |
| 1994 [113] | and Chief Executive Officer, The Rouse Company, real estate developers (1997 to 2004); Director, Mercantile Bank |
| | (4/03 to present) |
| |
| Donald W. Dick, Jr. (1943) | Principal, EuroCapital Advisors, LLC, an acquisition and management advisory firm; Chairman, President, and |
| 1994 [113] | Chief Executive Officer, The Haven Group, a custom manufacturer of modular homes (1/04 to present) |
| |
| David K. Fagin (1938) | Chairman and President, Nye Corporation (6/88 to present); Director, Canyon Resources Corp. and Golden Star |
| 2001 [113] | Resources Ltd. (5/00 to present) and Pacific Rim Mining Corp. (2/02 to present) |
| |
| Karen N. Horn (1943) | Managing Director and President, Global Private Client Services, Marsh Inc. (1999 to 2003); Managing Director and |
| 2003 [113] | Head of International Private Banking, Bankers Trust (1996 to 1999); Director, Eli Lilly and Company and Georgia |
| | Pacific |
| |
| F. Pierce Linaweaver (1934) | President, F. Pierce Linaweaver & Associates, Inc., consulting environmental and civil engineers |
| 2001 [113] | |
| |
| John G. Schreiber (1946) | Owner/President, Centaur Capital Partners, Inc., a real estate investment company; Partner, Blackstone Real Estate |
| 2001 [113] | Advisors, L.P.; Director, AMLI Residential Properties Trust |
| |
| * Each independent director serves until retirement, resignation, or election of a successor. |
| Inside Directors | |
| |
| Name (Year of Birth) | |
| Year Elected* [Number of | |
| T. Rowe Price Portfolios | Principal Occupation(s) During Past 5 Years |
| Overseen] | and Directorships of Other Public Companies |
| |
| James S. Riepe (1943) | Director and Vice President, T. Rowe Price; Vice Chairman of the Board, Director, and Vice President, T. Rowe Price |
| 2002 [113] | Group, Inc.; Chairman of the Board and Director, T. Rowe Price Global Asset Management Limited, T. Rowe Price |
| | Global Investment Services Limited, T. Rowe Price Investment Services, Inc., T. Rowe Price Retirement Plan Services, |
| | Inc., and T. Rowe Price Services, Inc.; Chairman of the Board, Director, President, and Trust Officer, T. Rowe Price |
| | Trust Company; Director, T. Rowe Price International, Inc.; Chairman of the Board, all funds |
| |
| * Each inside director serves until retirement, resignation, or election of a successor. |
| Officers | |
| |
| Name (Year of Birth) | |
| Title and Fund(s) Served | Principal Occupation(s) |
| |
| Mark C.J. Bickford-Smith (1962) | Vice President, T. Rowe Price Group, Inc., and T. Rowe Price |
| Vice President, International Series | International, Inc. |
| |
| Joseph A. Carrier, CPA (1960) | Vice President, T. Rowe Price, T. Rowe Price Group, Inc., T. Rowe Price |
| Treasurer, International Series | Investment Services, Inc., and T. Rowe Price Trust Company |
| |
| Ann B. Cranmer, FCIS (1947) | Vice President, T. Rowe Price Group, Inc., and T. Rowe Price International, |
| Assistant Vice President, | Inc.; Vice President and Secretary, T. Rowe Price Global Asset Management |
| International Series | Limited and T. Rowe Price Global Investment Services Limited |
| |
| Roger L. Fiery III, CPA (1959) | Vice President, T. Rowe Price, T. Rowe Price Group, Inc., T. Rowe Price |
| Vice President, International Series | International, Inc., and T. Rowe Price Trust Company |
| |
| John R. Gilner (1961) | Chief Compliance Officer and Vice President, T. Rowe Price; Vice President, |
| Chief Compliance Officer, | T. Rowe Price Group, Inc., and T. Rowe Price Investment Services, Inc. |
| International Series | |
| |
| Gregory S. Golczewski (1966) | Vice President, T. Rowe Price and T. Rowe Price Trust Company |
| Vice President, International Series | |
| |
| Henry H. Hopkins (1942) | Director and Vice President, T. Rowe Price Investment Services, Inc., |
| Vice President, International Series | T. Rowe Price Services, Inc., and T. Rowe Price Trust Company; Vice |
| | President, T. Rowe Price, T. Rowe Price Group, Inc., T. Rowe Price |
| | International, Inc., and T. Rowe Price Retirement Plan Services, Inc. |
| |
| Patricia B. Lippert (1953) | Assistant Vice President, T. Rowe Price and T. Rowe Price Investment |
| Secretary, International Series | Services, Inc. |
| |
| Julie L. Waples (1970) | Vice President, T. Rowe Price |
| Vice President, International Series | |
| |
| David J.L. Warren (1957) | Director and Vice President, T. Rowe Price; Vice President, T. Rowe Price |
| President, International Series | Group, Inc.; Chief Executive Officer, Director, and President, T. Rowe Price |
| | International, Inc.; Director, T. Rowe Price Global Asset Management |
| | Limited and T. Rowe Price Global Investment Services Limited |
| |
| William F. Wendler II, CFA (1962) | Vice President, T. Rowe Price and T. Rowe Price Group, Inc. |
| Vice President, International Series | |
| |
| Edward A. Wiese, CFA (1959) | Vice President, T. Rowe Price, T. Rowe Price Group, Inc., and T. Rowe |
| Vice President, International Series | Price Trust Company; Chief Investment Officer, Director, and Vice |
| | President, T. Rowe Price Savings Bank |
| |
| Unless otherwise noted, officers have been employees of T. Rowe Price or T. Rowe Price International for at least five years. |
Item 2. Code of Ethics.The registrant has adopted a code of ethics, as defined in Item 2 of Form N-CSR, applicable to its principal executive officer, principal financial officer, principal accounting officer or controller, or persons performing similar functions. A copy of this code of ethics is filed as an exhibit to this Form N-CSR. No substantive amendments were approved or waivers were granted to this code of ethics during the period covered by this report.
Item 3. Audit Committee Financial Expert.
The registrant’s Board of Directors/Trustees has determined that Mr. Donald W. Dick Jr. qualifies as an audit committee financial expert, as defined in Item 3 of Form N-CSR. Mr. Dick is considered independent for purposes of Item 3 of Form N-CSR.
Item 4. Principal Accountant Fees and Services.
(a) – (d) Aggregate fees billed to the registrant for the last two fiscal years for professional services rendered by the registrant’s principal accountant were as follows:
| | 2005 | 2004 |
| Audit Fees | $13,207 | $12,054 |
| Audit-Related Fees | 849 | 1,703 |
| Tax Fees | 3,752 | 5,521 |
| All Other Fees | 393 | - |
Audit fees include amounts related to the audit of the registrant’s annual financial statements and services normally provided by the accountant in connection with statutory and regulatory filings. Audit-related fees include amounts reasonably related to the performance of the audit of the registrant’s financial statements and specifically include the issuance of a report on internal controls. Tax fees include amounts related to services for tax compliance, tax planning, and tax advice. The nature of these services specifically includes the review of distribution calculations and the preparation of Federal, state, and excise tax returns. All other fees include the registrant’s pro-rata share of amounts for agreed-upon procedures in conjunction with service contract approvals by the registrant’s Board of Directors/Trustees.
(e)(1) The registrant’s audit committee has adopted a policy whereby audit and non-audit services performed by the registrant’s principal accountant for the registrant, its investment adviser, and any entity controlling, controlled by, or under common control with the investment adviser that provides ongoing services to the registrant require pre-approval in advance at regularly scheduled audit committee meetings. If such a service is required between regularly scheduled audit committee meetings, pre-approval may be authorized by one audit committee member with ratification at the next scheduled audit committee meeting. Waiver of pre-approval for audit or non-audit services requiring fees of a de minimis amount is not permitted.
(2) No services included in (b) – (d) above were approved pursuant to paragraph (c)(7)(i)(C) of Rule 2-01 of Regulation S-X.
(f) Less than 50 percent of the hours expended on the principal accountant’s engagement to audit the registrant’s financial statements for the most recent fiscal year were attributed to work performed by persons other than the principal accountant’s full-time, permanent employees.
(g) The aggregate fees billed for the most recent fiscal year and the preceding fiscal year by the registrant’s principal accountant for non-audit services rendered to the registrant, its investment adviser, and any entity controlling, controlled by, or under common control with the investment adviser that provides ongoing services to the registrant were $1,008,000 and $903,000, respectively, and were less than the aggregate fees billed for those same periods by the registrant’s principal accountant for audit services rendered to the T. Rowe Price Funds.
(h) All non-audit services rendered in (g) above were pre-approved by the registrant’s audit committee. Accordingly, these services were considered by the registrant’s audit committee in maintaining the principal accountant’s independence.Item 5. Audit Committee of Listed Registrants.
Not applicable.
Item 6. Schedule of Investments.
Not applicable. The complete schedule of investments is included in Item 1 of this Form N-CSR.
Item 7. Disclosure of Proxy Voting Policies and Procedures for Closed-End Management Investment Companies.
Not applicable.
Item 8. Portfolio Managers of Closed-End Management Investment Companies.
Not applicable.
Item 9. Purchases of Equity Securities by Closed-End Management Investment Company and Affiliated Purchasers.
Not applicable.
Item 10. Submission of Matters to a Vote of Security Holders.
Not applicable.
Item 11. Controls and Procedures.
(a) The registrant’s principal executive officer and principal financial officer have evaluated the registrant’s disclosure controls and procedures within 90 days of this filing and have concluded that the registrant’s disclosure controls and procedures were effective, as of that date, in ensuring that information required to be disclosed by the registrant in this Form N-CSR was recorded, processed, summarized, and reported timely.
(b) The registrant’s principal executive officer and principal financial officer are aware of no change in the registrant’s internal control over financial reporting that occurred during the registrant’s second fiscal quarter covered by this report that has materially affected, or is reasonably likely to materially affect, the registrant’s internal control over financial reporting.
Item 12. Exhibits.
(a)(1) The registrant’s code of ethics pursuant to Item 2 of Form N-CSR is attached.
(2) Separate certifications by the registrant's principal executive officer and principal financial officer, pursuant to Section 302 of the Sarbanes-Oxley Act of 2002 and required by Rule 30a-2(a) under the Investment Company Act of 1940, are attached.
(3) Written solicitation to repurchase securities issued by closed-end companies: not applicable.
(b) A certification by the registrant's principal executive officer and principal financial officer, pursuant to Section 906 of the Sarbanes-Oxley Act of 2002 and required by Rule 30a-2(b) under the Investment Company Act of 1940, is attached.
SIGNATURES |
| |
| |
| | Pursuant to the requirements of the Securities Exchange Act of 1934 and the Investment |
| Company Act of 1940, the registrant has duly caused this report to be signed on its behalf by the |
| undersigned, thereunto duly authorized. |
| |
| T. Rowe Price International Series, Inc. |
| |
| |
| By | /s/ James S. Riepe |
| | James S. Riepe |
| | Principal Executive Officer |
| |
| Date | February 21, 2006 |
| |
| |
| | Pursuant to the requirements of the Securities Exchange Act of 1934 and the Investment |
| Company Act of 1940, this report has been signed below by the following persons on behalf of |
| the registrant and in the capacities and on the dates indicated. |
| |
| |
| By | /s/ James S. Riepe |
| | James S. Riepe |
| | Principal Executive Officer |
| |
| Date | February 21, 2006 |
| |
| |
| |
| By | /s/ Joseph A. Carrier |
| | Joseph A. Carrier |
| | Principal Financial Officer |
| |
| Date | February 21, 2006 |