Item 1: Report to Shareholders| International Stock Portfolio | December 31, 2006 |
The views and opinions in this report were current as of December 31, 2006. They are not guarantees of performance or investment results and should not be taken as investment advice. Investment decisions reflect a variety of factors, and the managers reserve the right to change their views about individual stocks, sectors, and the markets at any time. As a result, the views expressed should not be relied upon as a forecast of the fund’s future investment intent. The report is certified under the Sarbanes-Oxley Act, which requires mutual funds and other public companies to affirm that, to the best of their knowledge, the information in their financial reports is fairly and accurately stated in all material respects.
Manager’s Letter
T. Rowe Price International Stock Portfolio
Dear Investor
International stocks continued to provide solid returns in the final months of 2006, with many markets closing the year at record levels. Global economic data remained strong, and most countries experienced healthy, noninflationary growth. Europe enjoyed a robust year overall, extending its gains in the final quarter. With the exception of Japan, developed Asian markets turned in double-digit performance. In the developing world, growth trends were encouraging in both China and India. Value stocks outpaced growth in 2006, and telecom services, utilities, and materials were among the best-performing sectors.
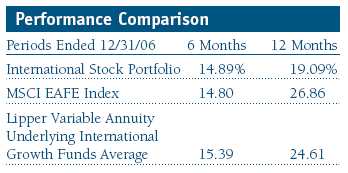
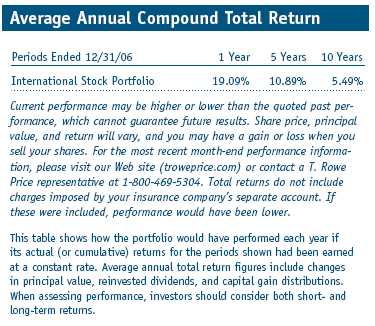
The portfolio’s performance was roughly in line with both the MSCI EAFE Index and the Lipper Variable Annuity Underlying International Growth Funds Average during the recent six-month period, but it trailed both benchmarks for the calendar year. Stock selection, especially in Japan, was the primary reason for the lagging 12-month performance. Value stocks outpaced growth once again, due mostly to heightened merger and acquisition activity, which worked against our growth-oriented portfolio.
• International stocks continued to provide solid returns in 2006.
• Portfolio performance was in line with the benchmarks during the past six months but lagged over the year.
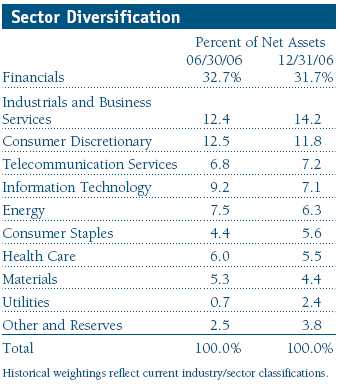
• Energy and telecom stocks helped the portfolio close the gap with its competitors, while consumer discretionary and financial holdings detracted.
• We remain optimistic about the prospects for international equity markets in 2007.
Market Environment
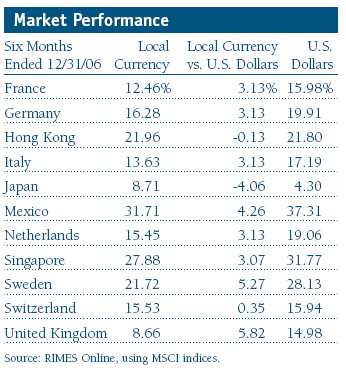
Non-U.S. stocks started 2006 briskly before sliding in the late spring. They renewed their earlier momentum during the second half of the year and closed out the last six months with a solid performance that resulted in double-digit annual returns for nearly all international markets. Noninflationary global growth provided a foundation for investor optimism. Crude oil prices, which peaked well above $70 a barrel in July, fell sharply during the ensuing months and have recently fallen below $54 a barrel.
Both the European Central Bank and the Bank of Japan raised short-term interest rates to head off any incipient inflation, but the U.S. Federal Reserve halted its two-year cycle of tightening last summer. European shares registered impressive gains for the year overall, completing a fourth consecutive year of positive results, thanks to healthy corporate profits, high levels of merger-and-acquisition activity, and strong economic growth. Asian stocks also logged another year of dynamic performance, with the notable exception of Japan, which suffered through a lackluster year—particularly in U.S. dollar terms.
Latin American stocks posted double-digit increases—their fourth straight year of gains as was the case with Europe—the region’s longest winning streak in at least 19 years. Global investors remained optimistic that the larger economies of Mexico and Brazil would continue to avoid the political and financial crises that bedeviled them in the past. Small-cap stocks did well except in Japan, and the dollar rallied against the yen but lost ground against the euro and pound sterling.
Portfolio Review
We would like to reiterate that our investment style focuses primarily on individual stock selection rather than on sector and geographical weightings. We remained disciplined throughout the year about selecting stocks of companies in which we have a high level of conviction.
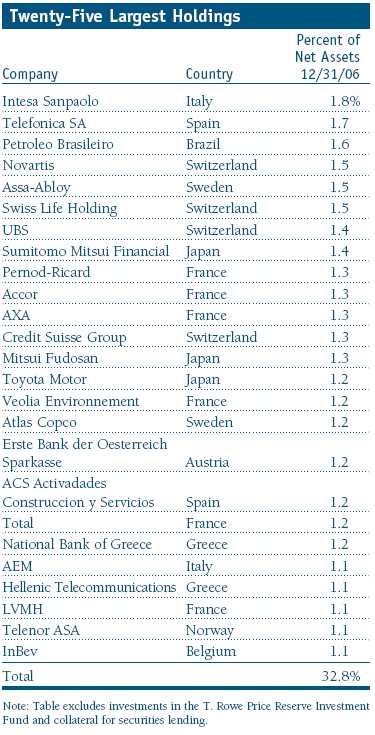
Our strategy helped the portfolio close the gap with the MSCI EAFE Index during the past six months. Among the top contributors to the portfolio’s absolute performance in recent months were Petroleo Brasileiro (Petrobras), Telenor, and Telefonica. Petrobras benefited from a rebound in the price of oil earlier in the period and from the strong Brazilian market. Telenor has significant exposure to attractive mobile assets, and Telefonica’s Latin American operations have been providing good revenue growth and profit margin expansion. (Please refer to the fund’s portfolio of investments for a detailed list of holdings and the amount each represents in the portfolio.)
For the year as a whole, Petrobras was again one of the major contributors to the portfolio’s absolute results. Other holdings of note were Intesa Sanpaolo and UBS. The former stock benefited from merger speculation and rose through much of the year, while the latter reported healthy earnings, which were boosted by the company’s private banking and investment banking operations. India’s Bharti Airtel was a strong positive contributor to relative performance. India is the fastest-growing mobile phone market in the world, and the company has taken steps to gain market share in an increasingly competitive environment.
Unfortunately, our relative detractors outweighed the positive contributors over the full 12 months. Our holdings in the consumer discretionary and financial sectors were particularly weak, and many of them were in the troubled Japanese market. Rakuten’s share price declined because of corporate governance issues and general skepticism about Internet stocks. In the final quarter of 2006, capital spending and domestic consumption weakened, putting further pressure on the stock. Marui was another poor performer as flagging consumer demand and a cap on interest rates hurt the company’s credit card business. Rakuten and Marui were among the worst absolute performers during the year, along with Aiful, another Japanese holding.
Outlook
The global economy appears set to continue the strong expansion of the past few years, helped by converging business practices and major structural changes. These dynamics have allowed for extended periods of synchronized growth, led by emerging markets such as India and China, as globalization has integrated their economies more closely with those of developed countries. U.S. consumers have been significant drivers of this expansion, and a sharp slowdown in their spending remains the single largest risk, particularly if the U.S. housing market were to weaken further. Other possible pitfalls include geopolitical instability, rising commodities prices, and compression in earnings margins. Nevertheless, we remain positive about the outlook for international equities.
We believe our discipline in selecting companies in which we have a high level of confidence, along with our growth-oriented bias, will serve shareholders best over the long term. Overall, notwithstanding the concerns we have discussed, we remain optimistic about the outlook for international equity markets as we look ahead to the rest of 2007.
Respectfully submitted,

David J.L. Warren
President, T. Rowe Price International Funds, Inc.
January 19, 2007
| Risks of International Investing |
Funds that invest overseas generally carry more risk than funds that invest strictly in U.S. assets. Funds investing in a single country or in a limited geographic region tend to be riskier than more diversified funds. Risks can result from varying stages of economic and political development, differing regulatory environments, trading days, and accounting standards, and higher transaction costs of non-U.S. markets. Non-U.S. investments are also subject to currency risk, or a decline in the value of a foreign currency versus the U.S. dollar, which reduces the dollar value of securities denominated in that currency.
GDP: Gross domestic product is the total market value of all goods and services produced in a country in a given year.
Lipper averages: The averages of available mutual fund performance returns for specified periods in defined categories as tracked by Lipper Inc.
MSCI EAFE Index: Widely accepted as the benchmark for international stock performance (EAFE refers to Europe, Australasia, and the Far East). The index represents the major markets of the world.
Price/earnings ratio: Calculated by dividing a stock’s market value per share by the company’s earnings per share for the past 12 months or by expected earnings for the coming year.
Portfolio Highlights
 Performance and Expenses
T. Rowe Price International Stock Portfolio
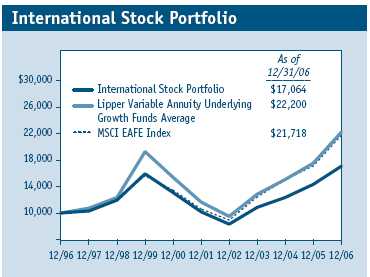
This chart shows the value of a hypothetical $10,000 investment in the fund over the past 10 fiscal year periods or since inception (for funds lacking 10-year records). The result is compared with benchmarks, which may include a broad-based market index and a peer group average or index. Market indexes do not include expenses, which are deducted from fund returns as well as mutual fund averages and indexes.
Fund Expense Example
As a mutual fund shareholder, you may incur two types of costs: (1) transaction costs, such as redemption fees or sales loads, and (2) ongoing costs, including management fees, distribution and service (12b-1) fees, and other fund expenses. The following example is intended to help you understand your ongoing costs (in dollars) of investing in the fund and to compare these costs with the ongoing costs of investing in other mutual funds. The example is based on an investment of $1,000 invested at the beginning of the most recent six-month period and held for the entire period.
Actual Expenses
The first line of the following table (“Actual”) provides information about actual account values and actual expenses. You may use the information in this line, together with your account balance, to estimate the expenses that you paid over the period. Simply divide your account value by $1,000 (for example, an $8,600 account value divided by $1,000 = 8.6), then multiply the result by the number in the first line under the heading “Expenses Paid During Period” to estimate the expenses you paid on your account during this period.
Hypothetical Example for Comparison Purposes
The information on the second line of the table (“Hypothetical”) is based on hypothetical account values and expenses derived from the fund’s actual expense ratio and an assumed 5% per year rate of return before expenses (not the fund’s actual return). You may compare the ongoing costs of investing in the fund with other funds by contrasting this 5% hypothetical example and the 5% hypothetical examples that appear in the shareholder reports of the other funds. The hypothetical account values and expenses may not be used to estimate the actual ending account balance or expenses you paid for the period.
You should also be aware that the expenses shown in the table highlight only your ongoing costs and do not reflect any transaction costs, such as redemption fees or sales loads. Therefore, the second line of the table is useful in comparing ongoing costs only, and will not help you determine the relative total costs of owning different funds. To the extent a fund charges transaction costs, however, the total cost of owning that fund is higher.

Financial Highlights
T. Rowe Price International Stock Portfolio

The accompanying notes are an integral part of these financial statements.
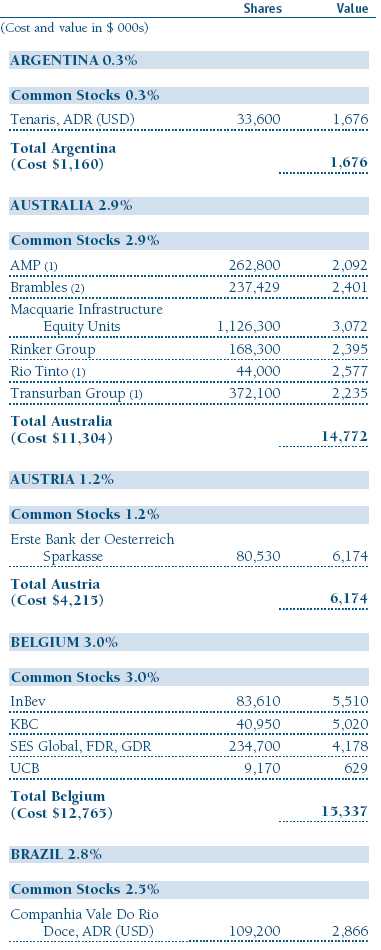
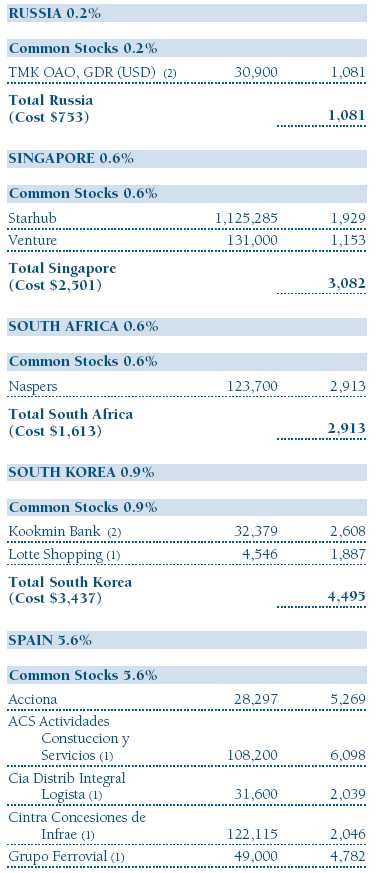
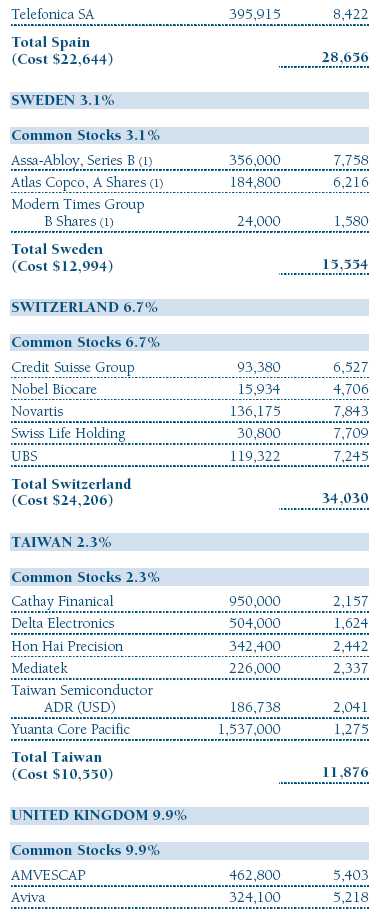
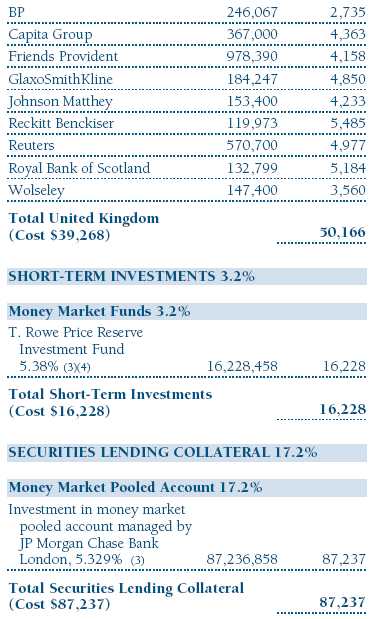
Portfolio of Investments †
T. Rowe Price International Stock Portfolio
December 31, 2006


The accompanying notes are an integral part of these financial statements.
Statement of Assets and Liabilities
T. Rowe Price International Stock Portfolio
December 31, 2006
(In thousands except shares and per share amounts)

The accompanying notes are an integral part of these financial statements.
Statement of Operations
T. Rowe Price International Stock Portfolio
($ 000s)

The accompanying notes are an integral part of these financial statements.
Statement of Changes in Net Assets
T. Rowe Price International Stock Portfolio
($ 000s)
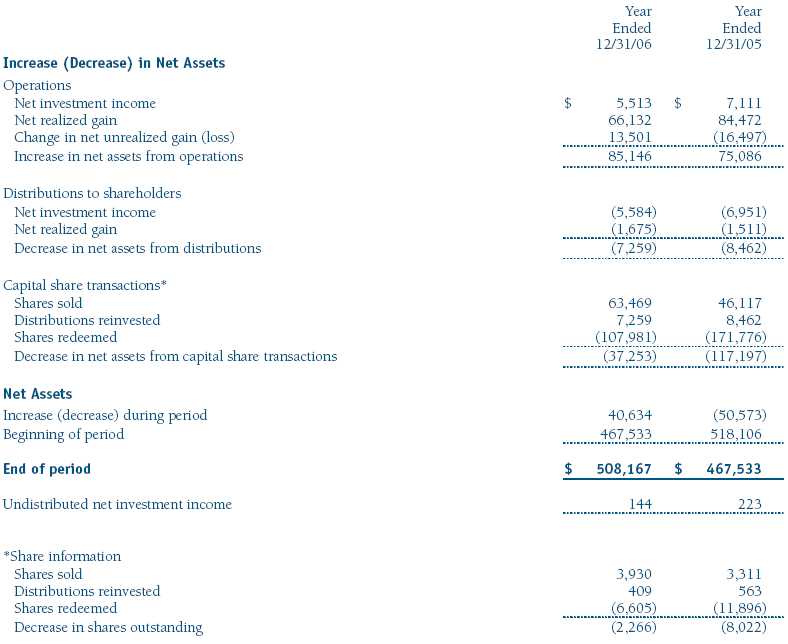
The accompanying notes are an integral part of these financial statements.
Notes to Financial Statements
T. Rowe Price International Stock Portfolio
December 31, 2006
NOTE 1 - SIGNIFICANT ACCOUNTING POLICIES
T. Rowe Price International Series, Inc. (the corporation), is registered under the Investment Company Act of 1940 (the 1940 Act). The International Stock Portfolio (the fund), a diversified, open-end management investment company, is one portfolio established by the corporation. The fund commenced operations on March 31, 1994. The fund seeks long-term growth of capital through investments primarily in the common stocks of established, non-U.S. companies. Shares of the fund are currently offered only through certain insurance companies as an investment medium for both variable annuity contracts and variable life insurance policies.
The accompanying financial statements were prepared in accordance with accounting principles generally accepted in the United States of America, which require the use of estimates made by fund management. Fund management believes that estimates and security valuations are appropriate; however, actual results may differ from those estimates, and the security valuations reflected in the financial statements may differ from the value the fund ultimately realizes upon sale of the securities.
Valuation The fund values its investments and computes its net asset value per share at the close of the New York Stock Exchange (NYSE), normally 4 p.m. ET, each day that the NYSE is open for business. Equity securities listed or regularly traded on a securities exchange or in the over-the-counter (OTC) market are valued at the last quoted sale price or, for certain markets, the official closing price at the time the valuations are made, except for OTC Bulletin Board securities, which are valued at the mean of the latest bid and asked prices. A security that is listed or traded on more than one exchange is valued at the quotation on the exchange determined to be the primary market for such security. Listed securities not traded on a particular day are valued at the mean of the latest bid and asked prices for domestic securities and the last quoted sale price for international securities.
Investments in mutual funds are valued at the mutual fund’s closing net asset value per share on the day of valuation.
Other investments, including restricted securities, and those for which the above valuation procedures are inappropriate or are deemed not to reflect fair value are stated at fair value as determined in good faith by the T. Rowe Price Valuation Committee, established by the fund’s Board of Directors.
Most foreign markets close before the close of trading on the NYSE. If the fund determines that developments between the close of a foreign market and the close of the NYSE will, in its judgment, materially affect the value of some or all of its portfolio securities, which in turn will affect the fund’s share price, the fund will adjust the previous closing prices to reflect the fair value of the securities as of the close of the NYSE, as determined in good faith by the T. Rowe Price Valuation Committee, established by the fund’s Board of Directors. A fund may also fair value securities in other situations, such as when a particular foreign market is closed but the fund is open. In deciding whether to make fair value adjustments, the fund reviews a variety of factors, including developments in foreign markets, the performance of U.S. securities markets, and the performance of instruments trading in U.S. markets that represent foreign securities and baskets of foreign securities. The fund uses outside pricing services to provide it with closing market prices and information used for adjusting those prices. The fund cannot predict when and how often it will use closing prices and when it will adjust those prices to reflect fair value. As a means of evaluating its fair value process, the fund routinely compares closing market prices, the next day’s opening prices in the same markets, and adjusted prices.
Currency Translation Assets, including investments, and liabilities denominated in foreign currencies are translated into U.S. dollar values each day at the prevailing exchange rate, using the mean of the bid and asked prices of such currencies against U.S. dollars as quoted by a major bank. Purchases and sales of securities, income, and expenses are translated into U.S. dollars at the prevailing exchange rate on the date of the transaction. The effect of changes in foreign currency exchange rates on realized and unrealized security gains and losses is reflected as a component of security gains and losses.
Rebates Subject to best execution, the fund may direct certain security trades to brokers who have agreed to rebate a portion of the related brokerage commission to the fund in cash. Commission rebates are reflected as realized gain on securities in the accompanying financial statements and totaled $53,000 for the year ended December 31, 2006.
Investment Transactions, Investment Income, and Distributions Income and expenses are recorded on the accrual basis. Dividends received from mutual fund investments are reflected as dividend income; capital gain distributions are reflected as realized gain/loss. Dividend income and capital gain distributions are recorded on the ex-dividend date. Investment transactions are accounted for on the trade date. Realized gains and losses are reported on the identified cost basis. Distributions to shareholders are recorded on the ex-dividend date. Income distributions are declared and paid on an annual basis. Capital gain distributions, if any, are declared and paid by the fund, typically on an annual basis.
New Accounting Pronouncements In June 2006, the Financial Accounting Standards Board (“FASB”) issued FASB Interpretation No. 48 (“FIN 48”), Accounting for Uncertainty in Income Taxes, a clarification of FASB Statement No. 109, Accounting for Income Taxes. FIN 48 establishes financial reporting rules regarding recognition and measurement of tax positions taken or expected to be taken on a tax return. Management is evaluating the anticipated impact, if any, that FIN 48 will have on the fund upon adoption, which, pursuant to a delay granted by the U.S. Securities and Exchange Commission, is expected to be on the last business day of the fund’s semi-annual period, June 29, 2007.
In September 2006, the FASB released the Statement of Financial Accounting Standard No. 157 (“FAS 157”), Fair Value Measurements. FAS 157 clarifies the definition of fair value and establishes the framework for measuring fair value, as well as proper disclosure of this methodology in the financial statements. It will be effective for the fund’s fiscal year beginning January 1, 2008. Management is evaluating the effects of FAS 157; however, it is not expected to have a material impact on the fund’s net assets or results of operations.
NOTE 2 - INVESTMENT TRANSACTIONS
Consistent with its investment objective, the fund engages in the following practices to manage exposure to certain risks or to enhance performance. The investment objective, policies, program, and risk factors of the fund are described more fully in the fund’s prospectus and Statement of Additional Information.
Emerging Markets At December 31, 2006, approximately 15% of the fund’s net assets were invested in securities of companies located in emerging markets or denominated in or linked to the currencies of emerging market countries. Future economic or political developments could adversely affect the liquidity or value, or both, of such securities.
Securities Lending The fund lends its securities to approved brokers to earn additional income. It receives as collateral cash and U.S. government securities valued at 102% to 105% of the value of the securities on loan. Cash collateral is invested in a money market pooled account managed by the fund’s lending agent in accordance with investment guidelines approved by fund management. Collateral is maintained over the life of the loan in an amount not less than the value of loaned securities, as determined at the close of fund business each day; any additional collateral required due to changes in security values is delivered to the fund the next business day. Although risk is mitigated by the collateral, the fund could experience a delay in recovering its securities and a possible loss of income or value if the borrower fails to return the securities. Securities lending revenue recognized by the fund consists of earnings on invested collateral and borrowing fees, net of any rebates to the borrower and compensation to the lending agent. At December 31, 2006, the value of loaned securities was $85,135,000; aggregate collateral consisted of $87,237,000 in the money market pooled account and U.S. government securities valued at $1,523,000.
Other Purchases and sales of portfolio securities, other than short-term securities, aggregated $302,224,000 and $354,339,000, respectively, for the year ended December 31, 2006.
NOTE 3 - FEDERAL INCOME TAXES
No provision for federal income taxes is required since the fund intends to continue to qualify as a regulated investment company under Subchapter M of the Internal Revenue Code and distribute to shareholders all of its taxable income and gains. Federal income tax regulations differ from generally accepted accounting principles; therefore, distributions determined in accordance with tax regulations may differ significantly in amount or character from net investment income and realized gains for financial reporting purposes. Financial reporting records are adjusted for permanent book/tax differences to reflect tax character. Financial records are not adjusted for temporary differences.
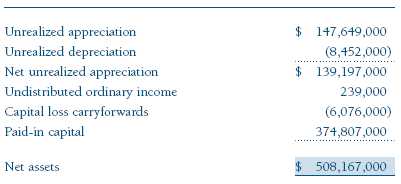
Distributions during the year ended December 31, 2006, totaled $7,259,000 and were characterized as ordinary income for tax purposes. At December 31, 2006, the tax-basis components of net assets were as follows:
Federal income tax regulations require the fund to treat the gain/loss on passive foreign investment companies as realized on the last day of the tax year; accordingly, $3,061,000 of unrealized gains reflected in the accompanying financial statements were realized for tax purposes as of December 31, 2006.
The fund intends to retain realized gains to the extent of available capital loss carryforwards. During the year ended December 31, 2006, the fund utilized $66,106,000 of capital loss carryforwards. As of December 31, 2006, the fund had $6,076,000 of capital loss carryforwards, of which $6,076, 000 expire in 2011.
For the year ended December 31, 2006, the fund recorded the following permanent reclassifications to reflect tax character. Reclassifications between income and gain relate primarily to the character of foreign capital gain taxes. Results of operations and net assets were not affected by these reclassifications.
At December 31, 2006, the cost of investments for federal income tax purposes was $453,233,000.
NOTE 4 - FOREIGN TAXES
The fund is subject to foreign income taxes imposed by certain countries in which it invests. Additionally, capital gains realized by the fund upon disposition of securities issued in or by certain foreign countries are subject to capital gains tax imposed by those countries, which is payable prior to repatriation of sale proceeds. Similarly, a tax on net profits, including interest income and realized and unrealized capital gains, is imposed by certain other countries. All taxes are computed in accordance with the applicable foreign tax law, and, to the extent permitted, capital losses are used to offset capital gains. Tax expense attributable to income is accrued by the fund as a reduction of income. Current and deferred tax expense attributable to net capital gains is reflected as a component of realized and/or change in unrealized gain/loss on securities in the accompanying financial statements.
At December 31, 2006, the fund had no taxes payable attributable to foreign securities, no deferred tax liability attributable to foreign securities, and $5,251,000 of foreign capital loss carryforwards, including $167,000 that expire in 2009, $3,116,000 that expire in 2010 and $1,968,000 that expire thereafter through 2013.
NOTE 5 - RELATED PARTY TRANSACTIONS
The fund is managed by T. Rowe Price International, Inc. (the manager), a wholly owned subsidiary of T. Rowe Price Associates, Inc. (Price Associates), which is wholly owned by T. Rowe Price Group, Inc. The investment management and administrative agreement between the fund and the manager provides for an all-inclusive annual fee equal to 1.05% of the fund’s average daily net assets. The fee is computed daily and paid monthly. The agreement provides that investment management, shareholder servicing, transfer agency, accounting, custody services and directors’ fees and expenses are provided to the fund, and interest, taxes, brokerage commissions, and extraordinary expenses are paid directly by the fund.
The fund may invest in the T. Rowe Price Reserve Investment Fund and the T. Rowe Price Government Reserve Investment Fund (collectively, the T. Rowe Price Reserve Funds), open-end management investment companies managed by Price Associates and affiliates of the fund. The T. Rowe Price Reserve Funds are offered as cash management options to mutual funds, trusts, and other accounts managed by Price Associates and/or its affiliates, and are not available for direct purchase by members of the public. The T. Rowe Price Reserve Funds pay no investment management fees. During the year ended December 31, 2006, dividend income from the T. Rowe Price Reserve Funds totaled $387,000, and the value of shares of the T. Rowe Price Reserve Funds held at December 31, 2006, and December 31, 2005, was $16,228,000 and $7,901,000, respectively.
Report of Independent Registered Public Accounting Firm
To the Board of Directors of T. Rowe Price International Series, Inc. and Shareholders of T. Rowe Price International Stock Portfolio
In our opinion, the accompanying statement of assets and liabilities, including the portfolio of investments, and the related statements of operations and of changes in net assets and the financial highlights present fairly, in all material respects, the financial position of T. Rowe Price International Stock Portfolio (one of the portfolios comprising T. Rowe Price International Series, Inc., hereafter referred to as the “Fund”) at December 31, 2006, the results of its operations for the year then ended, the changes in its net assets for each of the two years in the period then ended and the financial highlights for each of the five years in the period then ended, in conformity with accounting principles generally accepted in the United States of America. These financial statements and financial highlights (hereafter referred to as “financial statements”) are the responsibility of the Fund’s management; our responsibility is to express an opinion on these financial statements based on our audits. We conducted our audits of these financial statements in accordance with the auditing standards of the Public Company Accounting Oversight Board (United States). Those standards require that we plan and perform the audit to obtain reasonable assurance about whether the financial statements are free of material misstatement. An audit includes examining, on a test basis, evidence supporting the amounts and disclosures in the financial statements, assessing the accounting principles used and significant estimates made by management, and evaluating the overall financial statement presentation. We believe that our audits, which included confirmation of securities at December 31, 2006 by correspondence with the custodian and by agreement to the underlying ownership records for T. Rowe Price Reserve Investment Fund, provide a reasonable basis for our opinion.
PricewaterhouseCoopers LLP
Baltimore, Maryland
February 5, 2007
| Tax Information (Unaudited) for the Tax Year Ended 12/31/06 |
We are providing this information as required by the Internal Revenue Code. The amounts shown may differ from those elsewhere in this report because of differences between tax and financial reporting requirements.
• The fund’s distributions to shareholders included $1,675,000 from short-term capital gains.
• For taxable non-corporate shareholders, $5,163,000 of the fund’s income represents qualified dividend income subject to the 15% rate category.
• The fund will pass through foreign source income of $6,721,000 and foreign taxes paid of $337,000.
| Information on Proxy Voting Policies, Procedures, and Records |
A description of the policies and procedures used by T. Rowe Price funds and portfolios to determine how to vote proxies relating to portfolio securities is available in each fund’s Statement of Additional Information, which you may request by calling 1-800-225-5132 or by accessing the SEC’s Web site, www.sec.gov. The description of our proxy voting policies and procedures is also available on our Web site, www.troweprice.com. To access it, click on the words “Company Info” at the top of our homepage for individual investors. Then, in the window that appears, click on the “Proxy Voting Policy” navigation button in the top left corner.
Each fund’s most recent annual proxy voting record is available on our Web site and through the SEC’s Web site. To access it through our Web site, follow the directions above, then click on the words “Proxy Voting Record” at the bottom of the Proxy Voting Policy page.
| How to Obtain Quarterly Portfolio Holdings |
The fund files a complete schedule of portfolio holdings with the Securities and Exchange Commission for the first and third quarters of each fiscal year on Form N-Q. The fund’s Form N-Q is available electronically on the SEC’s Web site (www.sec.gov); hard copies may be reviewed and copied at the SEC’s Public Reference Room, 450 Fifth St. N.W., Washington, DC 20549. For more information on the Public Reference Room, call 1-800-SEC-0330.
| About the Fund’s Directors and Officers |
Your fund is governed by a Board of Directors that meets regularly to review a wide variety of matters affecting the fund, including performance, investment programs, compliance matters, advisory fees and expenses, service providers, and other business affairs. The Board of Directors elects the fund’s officers, who are listed in the final table. At least 75% of Board members are independent of T. Rowe Price Associates, Inc. (T. Rowe Price), and T. Rowe Price International, Inc. (T. Rowe Price International); “inside” or “interested” directors are officers of T. Rowe Price. The business address of each director and officer is 100 East Pratt Street, Baltimore, Maryland 21202. The Statement of Additional Information includes additional information about the fund directors and is available without charge by calling a T. Rowe Price representative at 1-800-225-5132.
| Independent Directors | |
| |
| Name (Year of Birth) | |
| Year Elected* | Principal Occupation(s) During Past 5 Years and Directorships of Other Public Companies |
|
| Jeremiah E. Casey (1940) | Director, Allfirst Financial Inc. (previously First Maryland Bankcorp) (1983 to 2002); Director, National Life |
| 2006 | Insurance (2001 to 2005); Director, The Rouse Company, real estate developers (1990 to 2004) |
|
| Anthony W. Deering (1945) | Chairman, Exeter Capital, LLC, a private investment firm (2004 to present); Director, Vornado Real Estate Investment |
| 1994 | Trust (3/04 to present); Director, Mercantile Bankshares (4/03 to present); Member, Advisory Board, Deutsche Bank |
| | North America (2004 to present); Director, Chairman of the Board, and Chief Executive Officer, The Rouse Company, |
| | real estate developers (1997 to 2004) |
|
| Donald W. Dick, Jr. (1943) | Principal, EuroCapital Advisors, LLC, an acquisition and management advisory firm; Chairman, President, and Chief |
| 1994 | Executive Officer, The Haven Group, a custom manufacturer of modular homes (1/04 to present) |
|
| David K. Fagin (1938) | Chairman and President, Nye Corporation (6/88 to present); Director, Canyon Resources Corp., Golden Star Resources |
| 2001 | Ltd. (5/92 to present), and Pacific Rim Mining Corp. (2/02 to present) |
|
| Karen N. Horn (1943) | Director, Federal National Mortgage Association (9/06 to present); Managing Director and President, Global Private |
| 2003 | Client Services, Marsh Inc. (1999 to 2003); Director, Georgia Pacific (5/04 to 12/05), Eli Lilly and Company, and |
| | Simon Property Group |
|
| Theo C. Rodgers (1941) | President, A&R Development Corporation |
| 2006 | |
|
| John G. Schreiber (1946) | Owner/President, Centaur Capital Partners, Inc., a real estate investment company; Partner, Blackstone Real Estate |
| 2001 | Advisors, L.P. |
|
| * Each independent director oversees 115 T. Rowe Price portfolios and serves until retirement, resignation, or election of a successor. |
| Inside Directors | |
| |
| Name (Year of Birth) | |
| Year Elected* [Number of | |
| T. Rowe Price Portfolios | |
| Overseen] | Principal Occupation(s) During Past 5 Years and Directorships of Other Public Companies |
|
| Edward C. Bernard (1956) | Director and Vice President, T. Rowe Price and T. Rowe Price Group, Inc.; Chairman of the Board, Director, and President, |
| 2006 [115] | T. Rowe Price Investment Services, Inc.; Chairman of the Board and Director, T. Rowe Price International, Inc., T. Rowe |
| | Price Retirement Plan Services, Inc., T. Rowe Price Services, Inc., and T. Rowe Price Savings Bank; Director, T. Rowe Price |
| | Global Asset Management Limited and T. Rowe Price Global Investment Services Limited; Chief Executive Officer, Chairman |
| | of the Board, Director, and President, T. Rowe Price Trust Company; Chairman of the Board, all funds |
|
| Brian C. Rogers, CFA, CIC (1955) | Chief Investment Officer, Director, and Vice President, T. Rowe Price and T. Rowe Price Group, Inc.; Vice President, |
| 2006 [62] | T. Rowe Price Trust Company |
|
| * Each inside director serves until retirement, resignation, or election of a successor. |
| Officers | |
| |
| Name (Year of Birth) | |
| Title and Fund(s) Served | Principal Occupation(s) |
|
| Mark C.J. Bickford-Smith (1962) | Vice President, T. Rowe Price Group, Inc., and T. Rowe Price |
| Vice President, International Series | International, Inc. |
|
| Joseph A. Carrier, CPA (1960) | Vice President, T. Rowe Price, T. Rowe Price Group, Inc., T. Rowe Price |
| Treasurer, International Series | Investment Services, Inc., and T. Rowe Price Trust Company |
|
| Ann B. Cranmer, FCIS (1947) | Vice President, T. Rowe Price Group, Inc., and T. Rowe Price International, |
| Assistant Vice President, International Series | Inc.; Vice President and Secretary, T. Rowe Price Global Asset Management |
| | Limited and T. Rowe Price Global Investment Services Limited |
|
| Roger L. Fiery III, CPA (1959) | Vice President, T. Rowe Price, T. Rowe Price Group, Inc., T. Rowe Price |
| Vice President, International Series | International, Inc., and T. Rowe Price Trust Company |
|
| John R. Gilner (1961) | Chief Compliance Officer and Vice President, T. Rowe Price; Vice President, |
| Chief Compliance Officer, International Series | T. Rowe Price Group, Inc., and T. Rowe Price Investment Services, Inc. |
|
| Gregory S. Golczewski (1966) | Vice President, T. Rowe Price and T. Rowe Price Trust Company |
| Vice President, International Series | |
|
| Henry H. Hopkins (1942) | Director and Vice President, T. Rowe Price Investment Services, Inc., T. Rowe |
| Vice President, International Series | Price Services, Inc., and T. Rowe Price Trust Company; Vice President, T. Rowe |
| | Price, T. Rowe Price Group, Inc., T. Rowe Price International, Inc., and |
| | T. Rowe Price Retirement Plan Services, Inc. |
|
| Patricia B. Lippert (1953) | Assistant Vice President, T. Rowe Price and T. Rowe Price Investment |
| Secretary, International Series | Services, Inc. |
|
| Julie L. Waples (1970) | Vice President, T. Rowe Price |
| Vice President, International Series | |
|
| David J.L. Warren (1957) | Director, T. Rowe Price, T. Rowe Price Global Asset Management Limited, |
| President, International Series | and T. Rowe Price Global Investment Services Limited; Vice President, |
| T. Rowe Price Group, Inc.; Chief Executive Officer, Director, and President, |
| T. Rowe Price International, Inc. |
|
| William F. Wendler II, CFA (1962) | Vice President, T. Rowe Price and T. Rowe Price Group, Inc. |
| Vice President, International Series | |
|
| Edward A. Wiese, CFA (1959) | Vice President, T. Rowe Price, T. Rowe Price Group, Inc., and T. Rowe |
| Vice President, International Series | Price Trust Company; Chief Investment Officer, Director, and Vice |
| President, T. Rowe Price Savings Bank |
|
Unless otherwise noted, officers have been employees of T. Rowe Price or T. Rowe Price International for at least five years. Item 2. Code of Ethics.
The registrant has adopted a code of ethics, as defined in Item 2 of Form N-CSR, applicable to its principal executive officer, principal financial officer, principal accounting officer or controller, or persons performing similar functions. A copy of this code of ethics is filed as an exhibit to this Form N-CSR. No substantive amendments were approved or waivers were granted to this code of ethics during the period covered by this report.
Item 3. Audit Committee Financial Expert.
The registrant’s Board of Directors/Trustees has determined that Mr. Donald W. Dick Jr. qualifies as an audit committee financial expert, as defined in Item 3 of Form N-CSR. Mr. Dick is considered independent for purposes of Item 3 of Form N-CSR.
Item 4. Principal Accountant Fees and Services.
(a) – (d) Aggregate fees billed to the registrant for the last two fiscal years for professional services rendered by the registrant’s principal accountant were as follows:

Audit fees include amounts related to the audit of the registrant’s annual financial statements and services normally provided by the accountant in connection with statutory and regulatory filings. Audit-related fees include amounts reasonably related to the performance of the audit of the registrant’s financial statements and specifically include the issuance of a report on internal controls and, if applicable for 2006, agreed-upon procedures related to fund acquisitions. Tax fees include amounts related to services for tax compliance, tax planning, and tax advice. The nature of these services specifically includes the review of distribution calculations and the preparation of Federal, state, and excise tax returns. Reclassification from tax fees to audit fees of fiscal 2005 amounts related to the auditing of tax disclosures within the registrant’s annual financial statements has been made in order to conform to fiscal 2006 presentation. All other fees include the registrant’s pro-rata share of amounts for agreed-upon procedures in conjunction with service contract approvals by the registrant’s Board of Directors/Trustees.
(e)(1) The registrant’s audit committee has adopted a policy whereby audit and non-audit services performed by the registrant’s principal accountant for the registrant, its investment adviser, and any entity controlling, controlled by, or under common control with the investment adviser that provides ongoing services to the registrant require pre-approval in advance at regularly scheduled audit committee meetings. If such a service is required between regularly scheduled audit committee meetings, pre-approval may be authorized by one audit committee member with ratification at the next scheduled audit committee meeting. Waiver of pre-approval for audit or non-audit services requiring fees of a de minimis amount is not permitted.
(2) No services included in (b) – (d) above were approved pursuant to paragraph (c)(7)(i)(C) of Rule 2-01 of Regulation S-X.
(f) Less than 50 percent of the hours expended on the principal accountant’s engagement to audit the registrant’s financial statements for the most recent fiscal year were attributed to work performed by persons other than the principal accountant’s full-time, permanent employees.
(g) The aggregate fees billed for the most recent fiscal year and the preceding fiscal year by the registrant’s principal accountant for non-audit services rendered to the registrant, its investment adviser, and any entity controlling, controlled by, or under common control with the investment adviser that provides ongoing services to the registrant were $1,401,000 and $883,000, respectively, and were less than the aggregate fees billed for those same periods by the registrant’s principal accountant for audit services rendered to the T. Rowe Price Funds. Preceding fiscal year amount reflects the reclassification of tax fees described in (a) – (d) above.
(h) All non-audit services rendered in (g) above were pre-approved by the registrant’s audit committee. Accordingly, these services were considered by the registrant’s audit committee in maintaining the principal accountant’s independence.
Item 5. Audit Committee of Listed Registrants.
Not applicable.
Item 6. Schedule of Investments.
Not applicable. The complete schedule of investments is included in Item 1 of this Form N-CSR.
Item 7. Disclosure of Proxy Voting Policies and Procedures for Closed-End Management Investment Companies.
Not applicable.
Item 8. Portfolio Managers of Closed-End Management Investment Companies.
Not applicable.
Item 9. Purchases of Equity Securities by Closed-End Management Investment Company and Affiliated Purchasers.
Not applicable.
Item 10. Submission of Matters to a Vote of Security Holders.
Not applicable.
Item 11. Controls and Procedures.
(a) The registrant’s principal executive officer and principal financial officer have evaluated the registrant’s disclosure controls and procedures within 90 days of this filing and have concluded that the registrant’s disclosure controls and procedures were effective, as of that date, in ensuring that information required to be disclosed by the registrant in this Form N-CSR was recorded, processed, summarized, and reported timely.
(b) The registrant’s principal executive officer and principal financial officer are aware of no change in the registrant’s internal control over financial reporting that occurred during the registrant’s second fiscal quarter covered by this report that has materially affected, or is reasonably likely to materially affect, the registrant’s internal control over financial reporting.
Item 12. Exhibits.
(a)(1) The registrant’s code of ethics pursuant to Item 2 of Form N-CSR is attached.
(2) Separate certifications by the registrant's principal executive officer and principal financial officer, pursuant to Section 302 of the Sarbanes-Oxley Act of 2002 and required by Rule 30a-2(a) under the Investment Company Act of 1940, are attached.
(3) Written solicitation to repurchase securities issued by closed-end companies: not applicable.
(b) A certification by the registrant's principal executive officer and principal financial officer, pursuant to Section 906 of the Sarbanes-Oxley Act of 2002 and required by Rule 30a-2(b) under the Investment Company Act of 1940, is attached.
| | |
SIGNATURES |
| |
| | Pursuant to the requirements of the Securities Exchange Act of 1934 and the Investment |
| Company Act of 1940, the registrant has duly caused this report to be signed on its behalf by the |
| undersigned, thereunto duly authorized. |
| |
| T. Rowe Price International Series, Inc. |
| |
| |
| |
| By | /s/ Edward C. Bernard |
| | Edward C. Bernard |
| | Principal Executive Officer |
| |
| Date | February 16, 2007 |
| |
| |
| | Pursuant to the requirements of the Securities Exchange Act of 1934 and the Investment |
| Company Act of 1940, this report has been signed below by the following persons on behalf of |
| the registrant and in the capacities and on the dates indicated. |
| |
| |
| By | /s/ Edward C. Bernard |
| | Edward C. Bernard |
| | Principal Executive Officer |
| |
| Date | February 16, 2007 |
| |
| |
| |
| By | /s/ Joseph A. Carrier |
| | Joseph A. Carrier |
| | Principal Financial Officer |
| |
| Date | February 16, 2007 |