| UNITED STATES |
| SECURITIES AND EXCHANGE COMMISSION |
| Washington, D.C. 20549 |
| |
FORM N-CSR |
| |
CERTIFIED SHAREHOLDER REPORT OF REGISTERED |
MANAGEMENT INVESTMENT COMPANIES |
| |
| |
| |
| Investment Company Act File Number: 811-07145 |
|
| |
| T. Rowe Price International Series, Inc. |
|
| (Exact name of registrant as specified in charter) |
| |
| 100 East Pratt Street, Baltimore, MD 21202 |
|
| (Address of principal executive offices) |
| |
| David Oestreicher |
| 100 East Pratt Street, Baltimore, MD 21202 |
|
| (Name and address of agent for service) |
| |
| |
| Registrant’s telephone number, including area code: (410) 345-2000 |
| |
| |
| Date of fiscal year end: December 31 |
| |
| |
| Date of reporting period: December 31, 2009 |
Item 1: Report to Shareholders| International Stock Portfolio | December 31, 2009 |
• International stock markets rallied off their mid-March lows, recording solid gains for the 6- and 12-month periods ended December 31, 2009.
• The portfolio significantly outperformed its MSCI benchmark and Lipper peer group for the year and modestly outperformed both yardsticks for the last six months.
• We opportunistically added to our positions in emerging markets, which we believe hold the prospect for significant long-term gains.
• We are encouraged by the number of companies that offer excellent growth opportunities in international stock markets. Our focus is on owning companies with good global franchises that can grow their earnings and cash flow at a double-digit rate over the long term.
The views and opinions in this report were current as of December 31, 2009. They are not guarantees of performance or investment results and should not be taken as investment advice. Investment decisions reflect a variety of factors, and the managers reserve the right to change their views about individual stocks, sectors, and the markets at any time. As a result, the views expressed should not be relied upon as a forecast of the fund’s future investment intent. The report is certified under the Sarbanes-Oxley Act, which requires mutual funds and other public companies to affirm that, to the best of their knowledge, the information in their financial reports is fairly and accurately stated in all material respects.
Manager’s Letter
T. Rowe Price International Stock Portfolio
Dear Investor
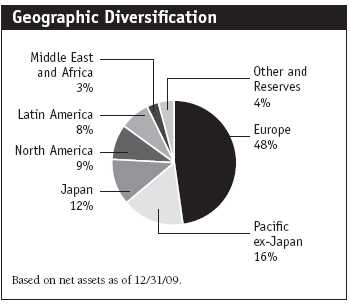
We are pleased to report good results for the six months and the year ended December 31, 2009. Our strong recovery after the devastating bear market was largely due to our conviction in our analysts’ best ideas. Investors have endured an extremely challenging environment over the past year, but equity markets appear to have bottomed in the spring and every major market ended the reporting period with gains over the past six and 12 months. We believe emerging economies offer strong growth prospects, and we have positioned the portfolio to capitalize on their strength. The portfolio remains broadly diversified but focused on companies with the best long-term growth prospects.
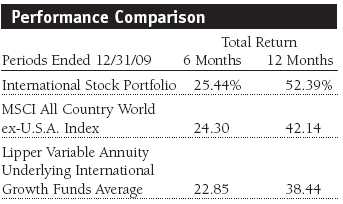
The International Stock Portfolio posted a 25.44% gain for the last six months and a 52.39% return for the 12-month period ended December 31, 2009. As shown in the Performance Comparison table, the portfolio outperformed the Lipper Variable Annuity Underlying International Growth Funds Average and the benchmark MSCI All Country World ex-U.S.A. Index. Performance versus the MSCI index benefited from stock selection. Over the last year, our holdings in the financials and information technology sectors powered our outperformance versus the MSCI index. Although our holdings in the health care and materials sectors generated positive absolute returns, they detracted from the portfolio’s comparison with the benchmark. In general, the portfolio’s emerging markets holdings were strong contributors. From a regional perspective both stock selection and allocation decisions benefited our comparison with the MSCI benchmark.
Portfolio Strategy
Through the market meltdown in 2008 and into the early part of 2009, we stuck with our core investment philosophy—buying high-quality growth companies that have a competitive advantage in their respective markets.
We believe that over the long term, stock prices move with earnings and cash flow growth, meaning simply that if a company grows free cash flow by 15% a year, its stock should appreciate at roughly the same rate. We search for companies we think can generate double-digit earnings growth over time by participating in expanding markets, taking market share, or improving profitability at a rate much faster than sales. We think that if we can find those companies and pay a fair price for their stock, we can compound absolute returns at double-digit levels and provide solid long-term relative returns.
With this objective in mind, our industry analysts, as well as other T. Rowe Price portfolio managers, research and travel the world to find companies that fit these criteria. We look for the best non-U.S. stocks wherever we may find them, rather than employing a regional or country focus. While we keep a weather eye on broad economic conditions in regions and countries, the portfolio composition is primarily determined by individual stock considerations.
Market Review
As I sit down to write this annual report, I’m thinking to myself, “Did it really happen?” The “it” I refer to is the global equity markets meltdown, which lasted from early September 2008 into the first week of March 2009. It was the second- or third-largest decline for a six-month period over the last 100 years, depending on the performance yardstick you’re using. In my shareholder letter six months ago, I attempted to describe that period through individual stories. Although I felt that the market was pricing in a dire scenario, which appeared to be a very unlikely outcome, my team and I battened down the hatches and braced for the worst.
Although it happened, the economic and stock markets maelstrom passed without sinking the fleet. I’m pleased to report that investors are beginning to price in a return to normal. When we talk to the management teams running the companies in our portfolio, we see and hear them planning for the future. I think that “normal” will be somewhat different going forward and that the other side of the hill will have a different terrain. Our job is to discern the best course for the “new normal” and how stocks and markets will respond and perform on the other side. Nevertheless, we’re clearly not out of the woods. Credit markets are in better shape but still face significant challenges, and global economies, while showing signs of reviving, are not yet firing on all cylinders.
At this time, our investment decisions are being shaped by the following views:
• Economies are improving in all regions.
• Companies exposed to the U.S. consumer will face strong headwinds for a long time.
• Consumer spending in emerging countries is going to be a strong global growth driver.
• Capital will be more choosy (borrowers will need to be creditworthy and able to demonstrate their ability to repay funds).
• Financials, especially in the banking segment, will face higher capital requirements, which will mean more regulation and lower return on equity.
Portfolio Positioning
As bottom-up stock pickers, we analyze every company for several criteria. First, we determine the quality of its management, its growth potential, and its ability to generate cash flow over time. We attempt to discern if the management team is effective in deploying its free cash flow. We also look to see if the company is taking market share and whether it has pricing power. We think that every company in our portfolio has answered these questions with a positive response. The second and key question we ask is whether the stock, at current prices, offers a good risk/reward proposition over the next few years. The answer to this question determines our buying and selling decisions and, ultimately, the size of the positions in the portfolio.
During the global markets meltdown, we shifted the portfolio’s emphasis toward owning bigger positions in faster-growing companies and those that were more economically sensitive because their risk/reward trade-off was better than at the peak of the market. However, in recent months, we trimmed some of those holdings as the risk/reward potential became less compelling. It’s somewhat like the trade-off shoppers make between steak and ground beef. Consumers will order more steak when the price differential to ground beef is low, and they will buy more ground beef when the price differential is high. We will similarly shift the portfolio’s mix of holdings for the best risk/reward opportunity.
Portfolio Review
It seems increasingly likely that our assessment of an equity market bottom in early March—made in our previous shareholder letter—will prove to be correct. We also said, “The economic recovery is likely to progress in fits and starts, and the next up-leg will require tangible economic and earnings improvement from currently depressed levels.” We are pleased to report that we are starting to see improved earnings forecasts from many companies. We still think it makes sense to remain overweight in emerging markets. We have maintained our large allocations in Latin American and Asian emerging markets that have performed exceptionally well. Although our regional allocations have changed very little over the past six months, we have strategically taken profits in sectors that have generated outsized gains.
Where We Were Positioned and Why
We are pleased with performance in the last six months. Our goal is to always improve the overall quality of the companies that we own, and we remain vigilant in managing risks relative to the potential return of our holdings. Because we think it is likely that the bulk of the “easy gains” have already been reaped in international markets, we have become more defensive. In general, we like stable companies that pay dividends and can grow their earnings at a double-digit pace.
Consumer staples holdings were the best contributors over the past six months. Six months ago, we said that we were willing to take advantage of investors’ fear of owning companies with a large amount of debt, such as Anheuser-Busch Inbev, and that we had made significant additions to the Belgian brewer. The stock generated good results during the market meltdown and was a top contributor for the last six months. We like the company for its strong cash flow generation and think that investors now have a better perspective on the company’s debt and management’s ability to service it. (Please refer to the portfolio of investments for a complete listing of holdings and the amount each represents in the portfolio.)

Other strong performers from the consumer staples sector included Portuguese food retailer Jeronimo Martins and Switzerland-based Nestle. Both appear to be steady double-digit growers that we think can improve revenues and cash flows. We significantly added to our position in Shoppers Drug Mart, which has lagged the market and the sector. Shoppers is Canada’s largest drug store chain and a high-quality, well-managed market leader positioned to continue to take market share from its weaker competitors. However, the stock has been weak due to concerns about regulation in generic drugs. We added to our position in Want Want China Holdings to increase our exposure to Chinese consumers. It is one of the largest food and beverage companies in China, with leading positions in several child-focused product categories, such as rice crackers and milk.
Consumer discretionary was the second-best-performing sector over the last six months, led by outstanding gains in media holdings. As was the case across our consumer staples positions, virtually every stock we held in the sector posted positive second-half returns. The standout performers were Liberty Global (U.S.), Jupiter Telecommunications (Japan), and WPP (U.K.). Liberty Global is an international media company and one of the largest broadband providers outside the U.S. and is one of the largest cable operators in several countries across Europe and the Pacific Rim. We like the company because it consistently generates strong free cash flow and its management team has a solid record of deploying the cash wisely or returning it to shareholders.
One of Liberty Global’s biggest international holdings is Jupiter Telecom, Japan’s leading cable provider. It also sells subscription television services, VoIP and wireless telephone services, and broadband Internet access. We think Jupiter’s growth prospects will improve in 2010, unlocking value that is not yet reflected in its share price. WPP is a media and advertising Goliath. The company operates as four divisions, but about half of the firm’s revenues are generated by its advertising and media investment management business. Advertising revenue gains generally are strongest later in the recovery cycle. WPP’s businesses were showing significant improvement toward the end of 2009, and we think the company can generate improving profit margins and double-digit earnings growth. In our view, this potential is not yet priced into the stock. We added one new holding in the media industry during the past six months, British Sky Broadcasting. Although we had a modest loss on the position for the period, we are excited about the company’s growth potential. We think that Sky will report significant earnings gains and profit margin expansion in the coming quarters.
The portfolio’s financials holdings were far and away the strongest performers for the year but third-best in the second half. The sector had been among the worst performers in 2008, and we took advantage of that weakness to build positions in our favored companies. In the last six months, commercial banks were the strongest segment in the sector. Itaú UniBanco (Brazil) and Banco Santander (Spain), two of the portfolio’s largest holdings, generated excellent returns. Standard Chartered (U.K.) was also a solid performer and is a good example of a company based in a mature market that generates a significant portion of its revenue in developing markets. The multinational corporation provides commercial banking services to companies and institutions in Asia, Africa, Europe, the Middle East, and the Americas. It was also a top 10 contributor for the past six months.
However, as the sector rallied over the last six months, we trimmed several holdings that we believed had run too far, too fast. We eliminated our position in Allied Irish Bank as the stock rebounded and the Irish government took steps to stabilize its banking industry. Within the diversified financial services segment, we trimmed our hugely profitable position in Bm&F Bovespa, which controls the Sao Paulo stock exchange and the Brazilian commodities and futures exchanges. Among insurers, we recorded good gains in AXA (France) and eliminated our position in Aflac (U.S.) for a modest profit. However, two recent additions, Sun Life Financial (Canada) and Sony Financial Holdings (Japan), generated poor performance and were among the largest second-half detractors.
Our information technology holdings were strong contributors for the year and provided above-average results for the past six months. The sector’s returns were led by Internet software and services stocks in both periods. We view Internet companies as appealing because they have a low fixed-cost base and minimal capital costs, and they typically generate predictable cash flow and have unleveraged balance sheets.
We have a large allocation in Chinese Internet software and services companies because we believe China will be one of the first countries to recover from the recession and can generate durable economic growth. Additionally, the government has demonstrated that it will take the necessary steps to revive its ailing economy. It made sense to buy these companies in a slow period and when investors were fearful—an example of our willingness to buy solid growth stocks at depressed prices.
The portfolio benefited from the strong gains in our longtime position in Tencent Holdings. The company, also referred to as QQ, is the most popular free instant messaging service in China and one of the most popular in the world. Sina and Baidu, which had been strong contributors in the first half, generated more modest second-half results. Other notable contributors in the information technology sector included electronic equipment maker Hon Hai Precision and ASML, a semiconductor manufacturer. We closed out our profitable position in Alcatel-Lucent during the period because of its volatility, the uncertainty about global wireless spending, and concerns about management’s performance.
Every sector in the portfolio posted gains in the past six months, but utilities and telecommunication services—which account for a small allocation in the portfolio—were only modest contributors. Our largest detractors were spread across a variety of sectors. Health care holding Lonza Group posted a significant loss for the six-month period. The Swiss life sciences and bio-technology services provider fell due to unexpectedly poor quarterly results and downward revisions to its order backlog. We eliminated the position because the risk/reward trade-off became less favorable. We also held a few information technology stocks that declined in the past six months. Software manufacturers Ubisoft Entertainment and Nintendo, which we trimmed, were weak, as was BlackBerry maker Research In Motion, a communications equipment industry holding.
Investment Outlook
Over the next 12 to 18 months, returns across international markets are likely to be much more muted than we have enjoyed over the past eight months. Coming off a bear market of historic proportions, international markets have already recorded significant gains from their lows. Clearly, the most bullish case can be made for emerging markets, but with the caveat that many of them have already rallied more than 50%. Several have posted gains in the 100% range. I see good opportunities in consumer-related (Internet and retail) emerging markets stocks, especially in Brazil, China, and India, and our current allocation to developing markets reflects that optimism. I am also buying global infrastructure companies, especially those that generate some of their revenues in emerging markets. Even though valuations are not nearly as compelling as they were eight months ago, I think emerging markets are attractive compared with their longer-term compound growth potential.
Euro zone growth and profit forecasts are starting to improve from their extremely depressed levels of 2008. Valuations are not demanding—price-to-earnings and price-to-book values are historically low, and dividend yields on stocks are marginally above the yield on 10-year bonds—which leads me to believe that earnings could surprise on the upside, sparking a near-term, 6- to 12-month rally in the region. My concern is that longer-term economic growth (more than three years) is likely to remain subdued.
In Japan, foreign investment is fading, wages are falling faster than prices, and capacity utilization plunged in 2009. Overall, there is little reason for bullishness on the broad Japanese market over the intermediate term. That said, there are bright spots in select industries, and several companies offer very attractive return potential. In automobiles, for example, Toyota Motor is the best-in-class manufacturer of hybrids. I also see opportunities to invest in Japanese technology and machinery companies and global companies with solid valuations, such as Mitsubishi and Mitsui. Additionally, Japan will benefit from its proximity to the fast-growing Chinese market.
The global economy is healing. I believe that the improvement we saw this year will carry forward into 2010 and businesses can show sequential improvement. A second positive factor for stocks is abundant liquidity. There is a lot of money tucked into safe places that can move into stocks. Those two things can work positively for equities. The negative for many companies is the three- to five-year demand scenario, which is average at best. Companies that sell to the U.S. consumer or lend to the U.S. consumer and other mature markets are likely to encounter weak demand for several years. I think the “steady Eddie” 10% growers—in what some might term stodgy sectors, including health care, consumer discretionary, and financials—can be solid-performing core holdings for the long term.
Respectfully submitted,

Robert W. Smith
Chairman of the Investment Advisory Committee
January 13, 2010
The committee chairman has day-to-day responsibility for managing the portfolio and works with committee members in developing and executing its investment program.
| Risks of International Investing |
Portfolios that invest overseas generally carry more risk than those that invest strictly in U.S. assets. Portfolios investing in a single country or in a limited geographic region tend to be riskier than more diversified funds. Risks can result from varying stages of economic and political development; differing regulatory environments, trading days, and accounting standards; and higher transaction costs of non-U.S. markets. Non-U.S. investments are also subject to currency risk, or a decline in the value of a foreign currency versus the U.S. dollar, which reduces the dollar value of securities denominated in that currency.
Lipper averages: The averages of available mutual fund performance returns for specified periods in defined categories as tracked by Lipper Inc.
MSCI All Country World ex-U.S.A. Index: An index that measures equity market performance of developed and emerging countries, excluding the U.S.
Portfolio Highlights

Performance and Expenses
T. Rowe Price International Stock Portfolio
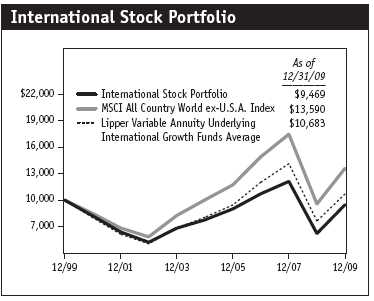
This chart shows the value of a hypothetical $10,000 investment in the portfolio over the past 10 fiscal year periods or since inception (for portfolios lacking 10-year records). The result is compared with benchmarks, which may include a broad-based market index and a peer group average or index. Market indexes do not include expenses, which are deducted from portfolio returns as well as mutual fund averages and indexes.

Fund Expense Example
As a mutual fund shareholder, you may incur two types of costs: (1) transaction costs, such as redemption fees or sales loads, and (2) ongoing costs, including management fees, distribution and service (12b-1) fees, and other fund expenses. The following example is intended to help you understand your ongoing costs (in dollars) of investing in the fund and to compare these costs with the ongoing costs of investing in other mutual funds. The example is based on an investment of $1,000 invested at the beginning of the most recent six-month period and held for the entire period.
Actual Expenses
The first line of the following table (“Actual”) provides information about actual account values and actual expenses. You may use the information in this line, together with your account balance, to estimate the expenses that you paid over the period. Simply divide your account value by $1,000 (for example, an $8,600 account value divided by $1,000 = 8.6), then multiply the result by the number in the first line under the heading “Expenses Paid During Period” to estimate the expenses you paid on your account during this period.
Hypothetical Example for Comparison Purposes
The information on the second line of the table (“Hypothetical”) is based on hypothetical account values and expenses derived from the fund’s actual expense ratio and an assumed 5% per year rate of return before expenses (not the fund’s actual return). You may compare the ongoing costs of investing in the fund with other funds by contrasting this 5% hypothetical example and the 5% hypothetical examples that appear in the shareholder reports of the other funds. The hypothetical account values and expenses may not be used to estimate the actual ending account balance or expenses you paid for the period.
You should also be aware that the expenses shown in the table highlight only your ongoing costs and do not reflect any transaction costs, such as redemption fees or sales loads. Therefore, the second line of the table is useful in comparing ongoing costs only and will not help you determine the relative total costs of owning different funds. To the extent a fund charges transaction costs, however, the total cost of owning that fund is higher.

Financial Highlights
T. Rowe Price International Stock Portfolio
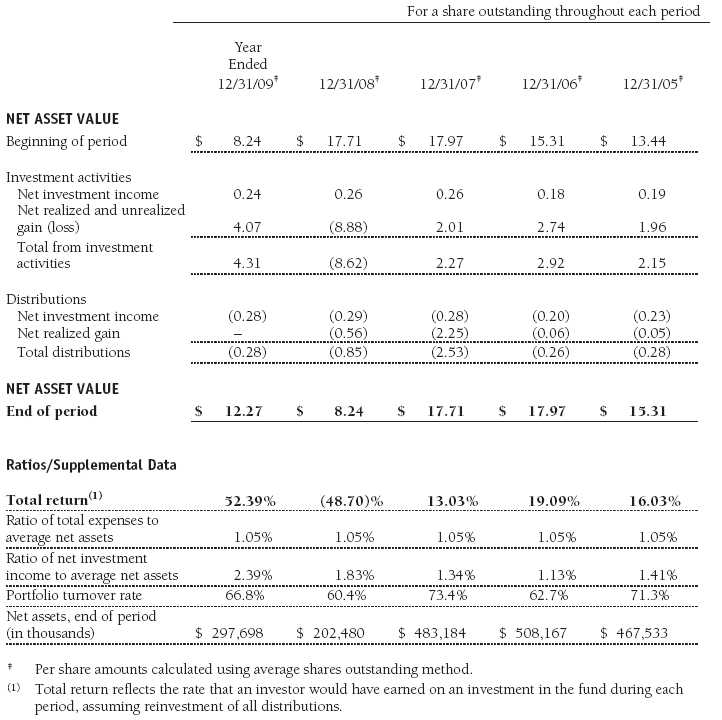
The accompanying notes are an integral part of these financial statements.
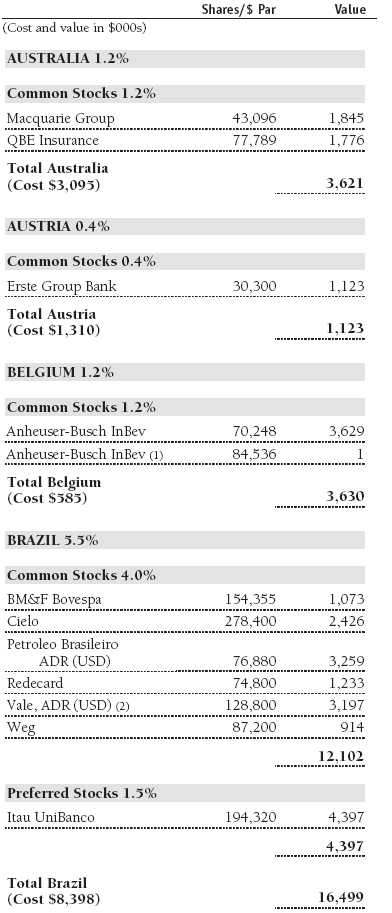
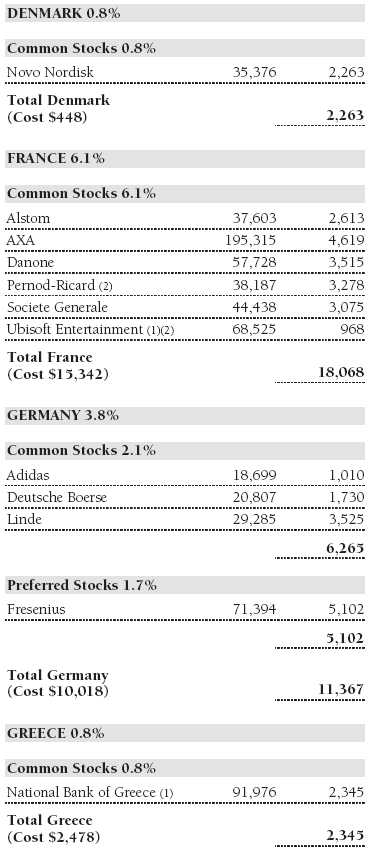
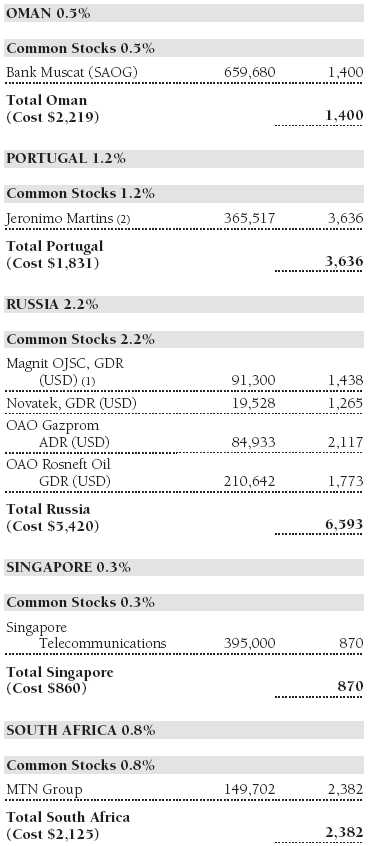
Portfolio of Investments‡
T. Rowe Price International Stock Portfolio
December 31, 2009


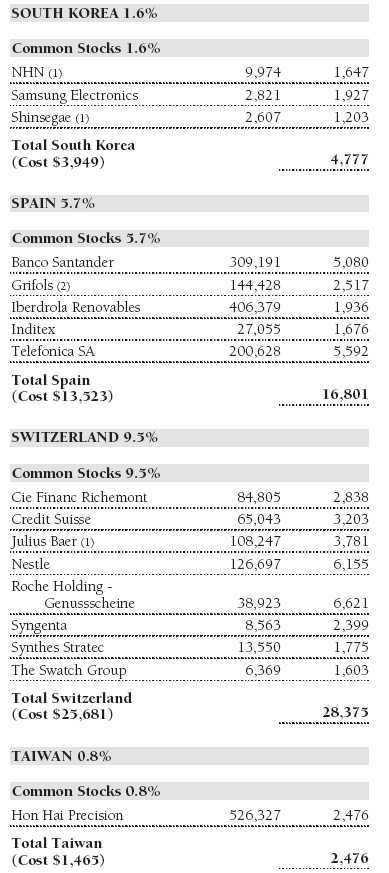
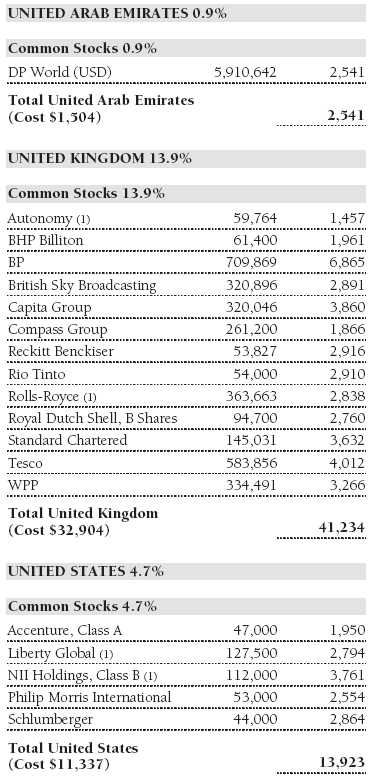


The accompanying notes are an integral part of these financial statements.
Statement of Assets and Liabilities
T. Rowe Price International Stock Portfolio
December 31, 2009
($000s, except shares and per share amounts)
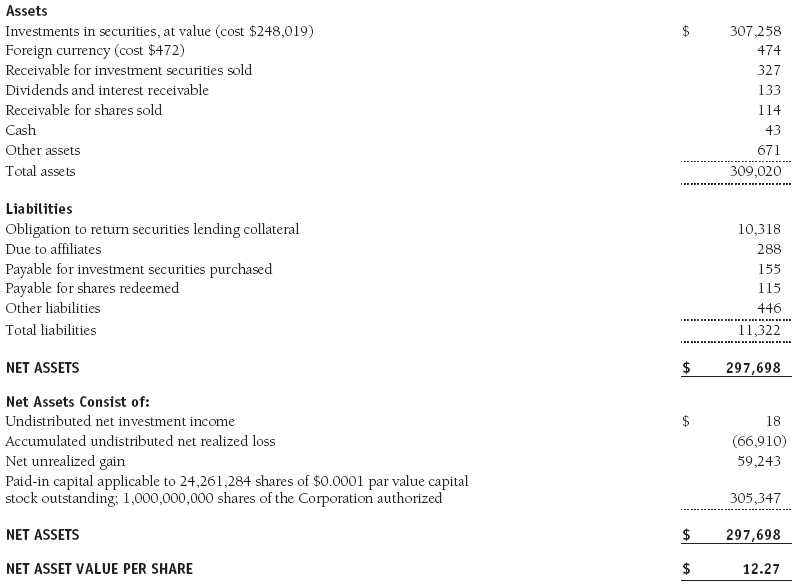
The accompanying notes are an integral part of these financial statements.
Statement of Operations
T. Rowe Price International Stock Portfolio
($000s)
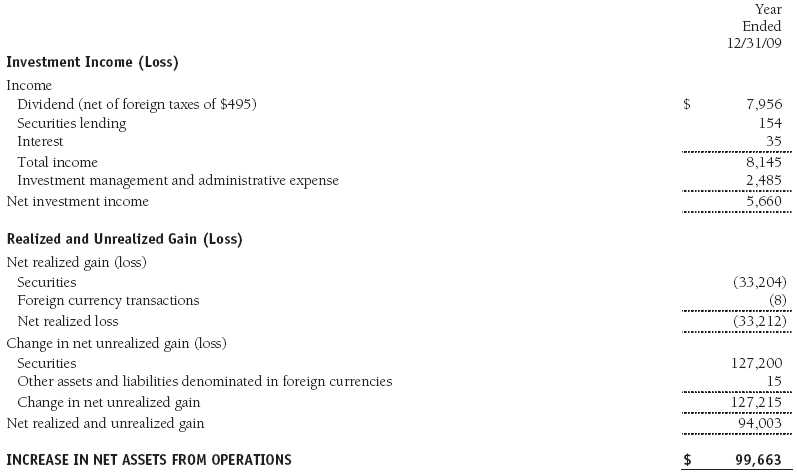
The accompanying notes are an integral part of these financial statements.
Statement of Changes in Net Assets
T. Rowe Price International Stock Portfolio
($000s)
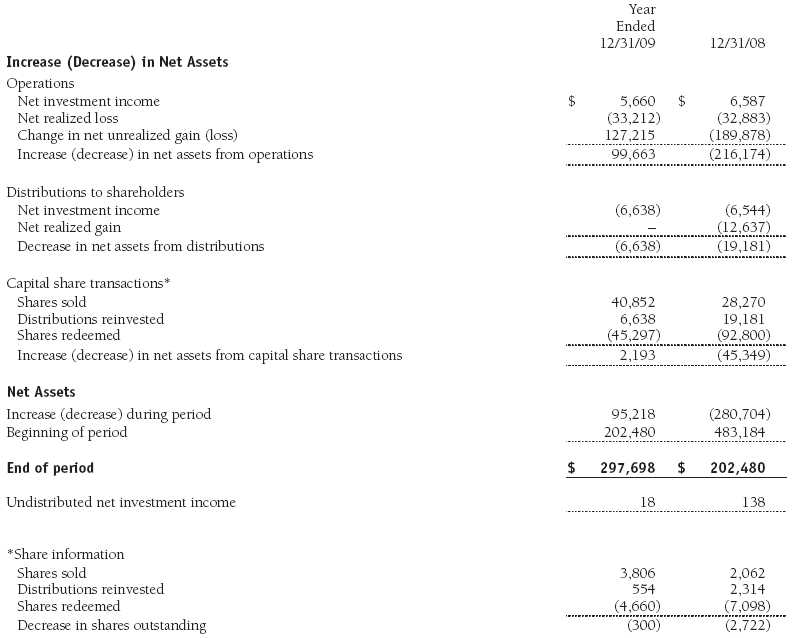
The accompanying notes are an integral part of these financial statements.
Notes to Financial Statements
T. Rowe Price International Stock Portfolio
December 31, 2009
T. Rowe Price International Series, Inc. (the corporation), is registered under the Investment Company Act of 1940 (the 1940 Act). The International Stock Portfolio (the fund), a diversified, open-end management investment company, is one portfolio established by the corporation. The fund commenced operations on March 31, 1994. The fund seeks long-term growth of capital through investments primarily in the common stocks of established, non-U.S. companies. Shares of the fund are currently offered only through certain insurance companies as an investment medium for both variable annuity contracts and variable life insurance policies.
NOTE 1 - SIGNIFICANT ACCOUNTING POLICIES
Basis of Preparation The accompanying financial statements were prepared in accordance with accounting principles generally accepted in the United States of America (GAAP), which require the use of estimates made by fund management. Fund management believes that estimates and security valuations are appropriate; however, actual results may differ from those estimates, and the security valuations reflected in the accompanying financial statements may differ from the value ultimately realized upon sale of the securities. Further, fund management believes that no events have occurred between December 31, 2009, the date of this report, and February 18, 2010, the date of issuance of the financial statements, that require adjustment of, or disclosure in, the accompanying financial statements.
Investment Transactions, Investment Income, and Distributions Income and expenses are recorded on the accrual basis. Premiums and discounts on debt securities are amortized for financial reporting purposes. Dividends received from mutual fund investments are reflected as dividend income; capital gain distributions are reflected as realized gain/loss. Dividend income and capital gain distributions are recorded on the ex-dividend date. Income tax-related interest and penalties, if incurred, would be recorded as income tax expense. Investment transactions are accounted for on the trade date. Realized gains and losses are reported on the identified cost basis. Distributions to shareholders are recorded on the ex-dividend date. Income distributions are declared and paid annually. Capital gain distributions, if any, are generally declared and paid by the fund, annually.
Currency Translation Assets, including investments, and liabilities denominated in foreign currencies are translated into U.S. dollar values each day at the prevailing exchange rate, using the mean of the bid and asked prices of such currencies against U.S. dollars as quoted by a major bank. Purchases and sales of securities, income, and expenses are translated into U.S. dollars at the prevailing exchange rate on the date of the transaction. The effect of changes in foreign currency exchange rates on realized and unrealized security gains and losses is reflected as a component of security gains and losses.
New Accounting Pronouncement On January 1, 2009, the fund adopted new accounting guidance that requires enhanced disclosures about derivative and hedging activities, including how such activities are accounted for and their effect on financial position, performance, and cash flows. Adoption of this guidance had no impact on the fund’s net assets or results of operations.
NOTE 2 - VALUATION
The fund’s investments are reported at fair value as defined under GAAP. The fund determines the values of its assets and liabilities and computes its net asset value per share at the close of the New York Stock Exchange (NYSE), normally 4 p.m. ET, each day that the NYSE is open for business.
Valuation Methods Equity securities listed or regularly traded on a securities exchange or in the over-the-counter (OTC) market are valued at the last quoted sale price or, for certain markets, the official closing price at the time the valuations are made, except for OTC Bulletin Board securities, which are valued at the mean of the latest bid and asked prices. A security that is listed or traded on more than one exchange is valued at the quotation on the exchange determined to be the primary market for such security. Listed securities not traded on a particular day are valued at the mean of the latest bid and asked prices for domestic securities and the last quoted sale price for international securities. Debt securities with remaining maturities of less than one year at the time of acquisition generally use amortized cost in local currency to approximate fair value. However, if amortized cost is deemed not to reflect fair value or the fund holds a significant amount of such securities with remaining maturities of more than 60 days, the securities are valued at prices furnished by dealers who make markets in such securities or by an independent pricing service.
Investments in mutual funds are valued at the mutual fund’s closing net asset value per share on the day of valuation.
Other investments, including restricted securities, and those financial instruments for which the above valuation procedures are inappropriate or are deemed not to reflect fair value are stated at fair value as determined in good faith by the T. Rowe Price Valuation Committee, established by the fund’s Board of Directors.
For valuation purposes, the last quoted prices of non-U.S. equity securities may be adjusted under the circumstances described below. If the fund determines that developments between the close of a foreign market and the close of the NYSE will, in its judgment, materially affect the value of some or all of its portfolio securities, the fund will adjust the previous closing prices to reflect what it believes to be the fair value of the securities as of the close of the NYSE. In deciding whether it is necessary to adjust closing prices to reflect fair value, the fund reviews a variety of factors, including developments in foreign markets, the performance of U.S. securities markets, and the performance of instruments trading in U.S. markets that represent foreign securities and baskets of foreign securities. A fund may also fair value securities in other situations, such as when a particular foreign market is closed but the fund is open. The fund uses outside pricing services to provide it with closing prices and information to evaluate and/or adjust those prices. The fund cannot predict how often it will use closing prices and how often it will determine it necessary to adjust those prices to reflect fair value. As a means of evaluating its security valuation process, the fund routinely compares closing prices, the next day’s opening prices in the same markets, and adjusted prices.
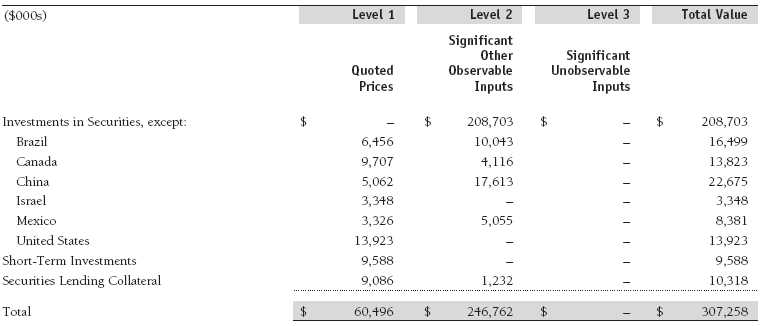
Valuation Inputs Various inputs are used to determine the value of the fund’s financial instruments. These inputs are summarized in the three broad levels listed below:
Level 1 – quoted prices in active markets for identical securities
Level 2 – observable inputs other than Level 1 quoted prices (including, but not limited to, quoted prices for similar securities, interest rates, prepayment speeds, and credit risk)
Level 3 – unobservable inputs
Observable inputs are those based on market data obtained from sources independent of the fund, and unobservable inputs reflect the fund’s own assumptions based on the best information available. The input levels are not necessarily an indication of the risk or liquidity associated with financial instruments at that level. For example, non-U.S. equity securities actively traded in foreign markets generally are reflected in Level 2 despite the availability of closing prices because the fund evaluates and determines whether those closing prices reflect fair value at the close of the NYSE or require adjustment, as described above. The following table summarizes the fund’s financial instruments, based on the inputs used to determine their values on December 31, 2009:
Following is a reconciliation of the fund’s Level 3 holdings for the year ended December 31, 2009. Gain (loss) reflects both realized and change in unrealized gain (loss) on Level 3 holdings during the period, if any, and is included on the accompanying Statement of Operations. The change in unrealized gain/loss on Level 3 instruments held at December 31, 2009, totaled $1,900,000 for the year ended December 31, 2009.

NOTE 3 - OTHER INVESTMENT TRANSACTIONS
Consistent with its investment objective, the fund engages in the following practices to manage exposure to certain risks and/or to enhance performance. The investment objective, policies, program, and risk factors of the fund are described more fully in the fund’s prospectus and Statement of Additional Information.
Emerging Markets At December 31, 2009, approximately 28% of the fund’s net assets were invested, either directly or indirectly, in securities of companies located in emerging markets, securities issued by governments of emerging market countries, and/or securities denominated in or linked to the currencies of emerging market countries. Emerging market securities are often subject to greater price volatility, less liquidity, and higher rates of inflation than U.S. securities. In addition, emerging markets may be subject to greater political, economic and social uncertainty, and differing regulatory environments that may potentially impact the fund’s ability to buy or sell certain securities or repatriate proceeds to U.S. dollars.
Repurchase Agreements All repurchase agreements are fully collateralized by U.S. government securities. Collateral is in the possession of the fund’s custodian or, for tri-party agreements, the custodian designated by the agreement. Collateral is evaluated daily to ensure that its market value exceeds the delivery value of the repurchase agreements at maturity. Although risk is mitigated by the collateral, the fund could experience a delay in recovering its value and a possible loss of income or value if the counterparty fails to perform in accordance with the terms of the agreement.
Securities Lending The fund lends its securities to approved brokers to earn additional income. It receives as collateral cash and U.S. government securities valued at 102% to 105% of the value of the securities on loan. Cash collateral is invested by the fund’s lending agent(s) in accordance with investment guidelines approved by fund management. Although risk is mitigated by the collateral, the fund could experience a delay in recovering its securities and a possible loss of income or value if the borrower fails to return the securities or if collateral investments decline in value. Securities lending revenue recognized by the fund consists of earnings on invested collateral and borrowing fees, net of any rebates to the borrower and compensation to the lending agent. On December 31, 2009, the value of loaned securities was $9,816,000.
Other Purchases and sales of portfolio securities other than short-term securities aggregated $151,925,000 and $156,421,000, respectively, for the year ended December 31, 2009.
NOTE 4 - FEDERAL INCOME TAXES
No provision for federal income taxes is required since the fund intends to continue to qualify as a regulated investment company under Subchapter M of the Internal Revenue Code and distribute to shareholders all of its taxable income and gains. Distributions determined in accordance with federal income tax regulations may differ in amount or character from net investment income and realized gains for financial reporting purposes. Financial reporting records are adjusted for permanent book/tax differences to reflect tax character but are not adjusted for temporary differences.
The fund files U.S. federal, state, and local tax returns as required. The fund’s tax returns are subject to examination by the relevant tax authorities until expiration of the applicable statute of limitations, which is generally three years after filing of the tax return but could be longer in certain circumstances.
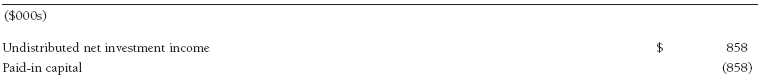
Reclassifications from paid-in capital relate primarily to the tax treatment of cash received from certain regulatory settlements. For the year ended December 31, 2009, the following reclassifications were recorded to reflect tax character; there was no impact on results of operations or net assets:
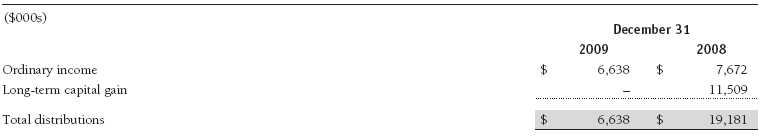
Distributions during the years ended December 31, 2009 and December 31, 2008 were characterized for tax purposes as follows:
At December 31, 2009, the tax-basis cost of investments and components of net assets were as follows:

The difference between book-basis and tax-basis net unrealized appreciation (depreciation) is attributable to the deferral of losses from wash sales for tax purposes. The fund intends to retain realized gains to the extent of available capital loss carryforwards. The fund’s unused capital loss carryforwards as of December 31, 2009, all expire in fiscal 2017. In accordance with federal income tax regulations applicable to investment companies, recognition of capital losses on certain transactions realized between November 1 and the fund’s year end is deferred for tax purposes until the subsequent year (post-October loss deferrals); however, such losses are recognized for financial reporting purposes in the year realized.
NOTE 5 - FOREIGN TAXES
The fund is subject to foreign income taxes imposed by certain countries in which it invests. Acquisition of certain foreign currencies related to security transactions are also subject to tax. Additionally, capital gains realized by the fund upon disposition of securities issued in or by certain foreign countries are subject to capital gains tax imposed by those countries. All taxes are computed in accordance with the applicable foreign tax law, and, to the extent permitted, capital losses are used to offset capital gains. Tax expense attributable to income is accrued by the fund as a reduction of income. Taxes incurred on the purchase of foreign currencies are recorded as realized loss on foreign currency transactions. Current and deferred tax expense attributable to net capital gains is reflected as a component of realized and/or change in unrealized gain/loss on securities in the accompanying financial statements. At December 31, 2009, the fund had no deferred tax liability attributable to foreign securities and $4,650,000 of foreign capital loss carryforwards, including $1,275,000 that expire in 2010, $534,000 that expire in 2011, $1,280,000 that expire in 2012, $51,000 that expire in 2013 and $1,510,000 that expire in 2017.
NOTE 6 - RELATED PARTY TRANSACTIONS
The fund is managed by T. Rowe Price International, Inc. (the manager), a wholly owned subsidiary of T. Rowe Price Associates, Inc. (Price Associates), which is wholly owned by T. Rowe Price Group, Inc. The investment management and administrative agreement between the fund and the manager provides for an all-inclusive annual fee equal to 1.05% of the fund’s average daily net assets. The fee is computed daily and paid monthly. The agreement provides that investment management, shareholder servicing, transfer agency, accounting, custody services, and directors’ fees and expenses are provided to the fund, and interest, taxes, brokerage commissions, and extraordinary expenses are paid directly by the fund.
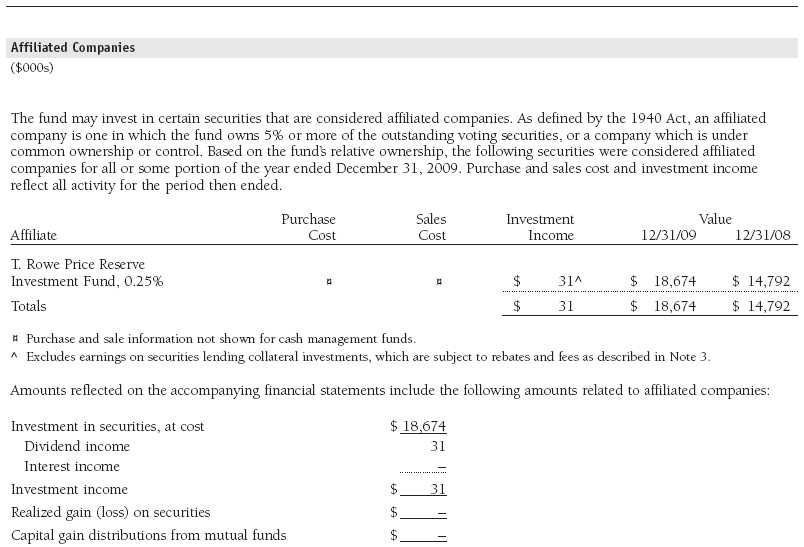
The fund may invest in the T. Rowe Price Reserve Investment Fund and the T. Rowe Price Government Reserve Investment Fund (collectively, the T. Rowe Price Reserve Investment Funds), open-end management investment companies managed by Price Associates and considered affiliates of the fund. The T. Rowe Price Reserve Investment Funds are offered as cash management options to mutual funds, trusts, and other accounts managed by Price Associates and/or its affiliates and are not available for direct purchase by members of the public. The T. Rowe Price Reserve Investment Funds pay no investment management fees.
Report of Independent Registered Public Accounting Firm
To the Board of Directors of T. Rowe Price International Series, Inc. and
Shareholders of T. Rowe Price International Stock Portfolio
In our opinion, the accompanying statement of assets and liabilities, including the schedule of investments, and the related statements of operations and of changes in net assets and the financial highlights present fairly, in all material respects, the financial position of T. Rowe Price International Stock Portfolio (one of the portfolios comprising T. Rowe Price International Series, Inc., hereafter referred to as the “Fund”) at December 31, 2009, the results of its operations for the year then ended, the changes in its net assets for each of the two years in the period then ended and the financial highlights for each of the five years in the period then ended, in conformity with accounting principles generally accepted in the United States of America. These financial statements and financial highlights (hereafter referred to as “financial statements”) are the responsibility of the Fund’s management; our responsibility is to express an opinion on these financial statements based on our audits. We conducted our audits of these financial statements in accordance with the standards of the Public Company Accounting Oversight Board (United States). Those standards require that we plan and perform the audit to obtain reasonable assurance about whether the financial statements are free of material misstatement. An audit includes examining, on a test basis, evidence supporting the amounts and disclosures in the financial statements, assessing the accounting principles used and significant estimates made by management, and evaluating the overall financial statement presentation. We believe that our audits, which included confirmation of securities at December 31, 2009 by correspondence with the custodian, and confirmation of the underlying fund by correspondence with the transfer agent, provide a reasonable basis for our opinion.
PricewaterhouseCoopers LLP
Baltimore, Maryland
February 18, 2010
| Tax Information (Unaudited) for the Tax Year Ended 12/31/09 |
We are providing this information as required by the Internal Revenue Code. The amounts shown may differ from those elsewhere in this report because of differences between tax and financial reporting requirements.
For taxable non-corporate shareholders, $6,879,000 of the fund’s income represents qualified dividend income subject to the 15% rate category.
For corporate shareholders, $127,000 of the fund’s income qualifies for the dividends-received deduction.
The fund will pass through foreign source income of $6,382,000 and foreign taxes paid of $341,000.
| Information on Proxy Voting Policies, Procedures, and Records |
A description of the policies and procedures used by T. Rowe Price funds and portfolios to determine how to vote proxies relating to portfolio securities is available in each fund’s Statement of Additional Information, which you may request by calling 1-800-225-5132 or by accessing the SEC’s Web site, www.sec.gov. The description of our proxy voting policies and procedures is also available on our Web site, www.troweprice.com. To access it, click on the words “Our Company” at the top of our corporate homepage. Then, when the next page appears, click on the words “Proxy Voting Policies” on the left side of the page.
Each fund’s most recent annual proxy voting record is available on our Web site and through the SEC’s Web site. To access it through our Web site, follow the directions above, then click on the words “Proxy Voting Records” on the right side of the Proxy Voting Policies page.
| How to Obtain Quarterly Portfolio Holdings |
The fund files a complete schedule of portfolio holdings with the Securities and Exchange Commission for the first and third quarters of each fiscal year on Form N-Q. The fund’s Form N-Q is available electronically on the SEC’s Web site (www.sec.gov); hard copies may be reviewed and copied at the SEC’s Public Reference Room, 450 Fifth St. N.W., Washington, DC 20549. For more information on the Public Reference Room, call 1-800-SEC-0330.
| About the Portfolio’s Directors and Officers |
Your portfolio is governed by a Board of Directors (Board) that meets regularly to review a wide variety of matters affecting the portfolio, including performance, investment programs, compliance matters, advisory fees and expenses, service providers, and other business affairs. The Board elects the portfolio’s officers, who are listed in the final table. At least 75% of Board members are independent of T. Rowe Price Associates, Inc. (T. Rowe Price), and T. Rowe Price International, Inc. (T. Rowe Price International); “inside” or “interested” directors are employees or officers of T. Rowe Price. The business address of each director and officer is 100 East Pratt Street, Baltimore, Maryland 21202. The Statement of Additional Information includes additional information about the directors and is available without charge by calling a T. Rowe Price representative at 1-800-225-5132.
| Independent Directors | |
| |
| Name | |
| (Year of Birth) | |
| Year Elected* | Principal Occupation(s) During Past Five Years and Directorships of Other Public Companies |
| | |
| William R. Brody, M.D., Ph.D. | President and Trustee, Salk Institute for Biological Studies (2009 to present); Director, Novartis, Inc. (2009 |
| (1944) | to present); Director, IBM (2007 to present); President and Trustee, Johns Hopkins University (1996 to 2009); |
| 2009 | Chairman of Executive Committee and Trustee, Johns Hopkins Health System (1996 to 2009) |
| | |
| Jeremiah E. Casey | Director, National Life Insurance (2001 to 2005); Director, The Rouse Company, real estate developers (1990 |
| (1940) | to 2004) |
| 2006 | |
| | |
| Anthony W. Deering | Chairman, Exeter Capital, LLC, a private investment firm (2004 to present); Director, Under Armour (2008 to pres- |
| (1945) | ent); Director, Vornado Real Estate Investment Trust (2004 to present); Director, Mercantile Bankshares (2002 to |
| 1994 | 2007); Member, Advisory Board, Deutsche Bank North America (2004 to present); Director, Chairman of the Board, |
| | and Chief Executive Officer, The Rouse Company, real estate developers (1997 to 2004) |
| | |
| Donald W. Dick, Jr. | Principal, EuroCapital Advisors, LLC, an acquisition and management advisory firm (1995 to present) |
| (1943) | |
| 1994 | |
| | |
| Karen N. Horn | Director, Eli Lilly and Company (1987 to present); Director, Simon Property Group (2004 to present); Director, |
| (1943) | Norfolk Southern (2008 to present); Director, Georgia Pacific (2004 to 2005) |
| 2003 | |
| | |
| Theo C. Rodgers | President, A&R Development Corporation (1977 to present) |
| (1941) | |
| 2005 | |
| | |
| John G. Schreiber | Owner/President, Centaur Capital Partners, Inc., a real estate investment company (1991 to present); Partner, |
| (1946) | Blackstone Real Estate Advisors, L.P. (1992 to present) |
| 2001 | |
| | |
| Mark R. Tercek | President and Chief Executive Officer, The Nature Conservancy (2008 to present); Managing Director, The Goldman |
| (1957) | Sachs Group, Inc. (1984 to 2008) |
| 2009 | |
| |
| *Each independent director oversees 124 T. Rowe Price portfolios and serves until retirement, resignation, or election of a successor. |
| Inside Directors | |
| |
| Name (Year of Birth) | |
| Year Elected* [Number of | |
| T. Rowe Price Portfolios Overseen] | Principal Occupation(s) During Past Five Years and Directorships of Other Public Companies |
| | |
| Edward C. Bernard (1956) | Director and Vice President, T. Rowe Price; Vice Chairman of the Board, Director, and Vice President, T. Rowe Price |
| 2006 [124] | Group, Inc.; Chairman of the Board, Director, and President, T. Rowe Price Investment Services, Inc.; Chairman of |
| | the Board and Director, T. Rowe Price Global Asset Management Limited, T. Rowe Price Global Investment Services |
| | Limited, T. Rowe Price Retirement Plan Services, Inc., T. Rowe Price Savings Bank, and T. Rowe Price Services, Inc.; |
| | Director, T. Rowe Price International, Inc.; Chief Executive Officer, Chairman of the Board, Director, and President, |
| | T. Rowe Price Trust Company; Chairman of the Board, all funds |
| | |
| Brian C. Rogers, CFA, CIC (1955) | Chief Investment Officer, Director, and Vice President, T. Rowe Price; Chairman of the Board, Chief Investment |
| 2006 [69] | Officer, Director, and Vice President, T. Rowe Price Group, Inc.; Vice President, T. Rowe Price Trust Company |
| |
| *Each inside director serves until retirement, resignation, or election of a successor. |
| Officers | |
| |
| Name (Year of Birth) | |
| Position Held With International Series | Principal Occupation(s) |
| | |
| Christopher D. Alderson (1962) | Chief Executive Officer, Director, and President, T. Rowe Price International, |
| President | Inc.; Vice President, T. Rowe Price Global Investment Services Limited and |
| | T. Rowe Price Group, Inc. |
| | |
| Mark C.J. Bickford-Smith (1962) | Vice President, T. Rowe Price Group, Inc., and T. Rowe Price |
| Vice President | International, Inc. |
| | |
| Richard N. Clattenburg, CFA (1979) | Vice President, T. Rowe Price, T. Rowe Price Global Investment Services |
| Vice President | Limited, and T. Rowe Price Group, Inc.; formerly Financial Analyst, Goldman |
| | Sachs (to 2005) |
| | |
| Henry M. Ellenbogen (1973) | Vice President, T. Rowe Price and T. Rowe Price Group, Inc. |
| Vice President | |
| | |
| Roger L. Fiery III, CPA (1959) | Vice President, T. Rowe Price, T. Rowe Price Group, Inc., T. Rowe Price |
| Vice President | International, Inc., and T. Rowe Price Trust Company |
| | |
| Robert N. Gensler (1957) | Vice President, T. Rowe Price, T. Rowe Price Global Investment Services |
| Vice President | Limited, T. Rowe Price Group, Inc., and T. Rowe Price International, Inc. |
| | |
| John R. Gilner (1961) | Chief Compliance Officer and Vice President, T. Rowe Price; Vice President, |
| Chief Compliance Officer | T. Rowe Price Group, Inc., and T. Rowe Price Investment Services, Inc. |
| | |
| Gregory S. Golczewski (1966) | Vice President, T. Rowe Price and T. Rowe Price Trust Company |
| Vice President | |
| | |
| M. Campbell Gunn (1956) | Vice President, T. Rowe Price Global Investment Services Limited, T. Rowe |
| Vice President | Price Group, Inc., and T. Rowe Price International, Inc. |
| | |
| Gregory K. Hinkle, CPA (1958) | Vice President, T. Rowe Price, T. Rowe Price Group, Inc., and T. Rowe Price |
| Treasurer | Trust Company; formerly Partner, PricewaterhouseCoopers LLP (to 2007) |
| | |
| Patricia B. Lippert (1953) | Assistant Vice President, T. Rowe Price and T. Rowe Price Investment |
| Secretary | Services, Inc. |
| | |
| David Oestreicher (1967) | Director and Vice President, T. Rowe Price Investment Services, Inc., T. Rowe |
| Vice President | Price Trust Company, and T. Rowe Price Services, Inc.; Vice President, |
| | T. Rowe Price, T. Rowe Price Global Asset Management Limited, T. Rowe |
| | Price Global Investment Services Limited, T. Rowe Price Group, Inc., T. Rowe |
| | Price International, Inc., and T. Rowe Price Retirement Plan Services, Inc. |
| | |
| Gonzalo Pángaro, CFA (1968) | Vice President, T. Rowe Price Group, Inc., and T. Rowe Price |
| Vice President | International, Inc. |
| | |
| Jeffrey Rottinghaus, CPA (1970) | Vice President, T. Rowe Price, T. Rowe Price Global Investment Services |
| Vice President | Limited, and T. Rowe Price Group, Inc. |
| | |
| Deborah D. Seidel (1962) | Vice President, T. Rowe Price, T. Rowe Price Investment Services, Inc., |
| Vice President | and T. Rowe Price Services Inc. |
| | |
| Robert W. Smith (1961) | Vice President, T. Rowe Price, T. Rowe Price Group, Inc., and T. Rowe Price |
| Executive Vice President | Trust Company |
| | |
| Dean Tenerelli (1964) | Vice President, T. Rowe Price Group, Inc., and T. Rowe Price |
| Vice President | International, Inc. |
| | |
| Julie L. Waples (1970) | Vice President, T. Rowe Price |
| Vice President | |
| | |
| Edward A. Wiese, CFA (1959) | Vice President, T. Rowe Price, T. Rowe Price Group, Inc., and T. Rowe Price |
| Vice President | Trust Company; Chief Investment Officer, Director, and Vice President, |
| | T. Rowe Price Savings Bank |
| |
| Unless otherwise noted, officers have been employees of T. Rowe Price or T. Rowe Price International for at least five years. |
Item 2. Code of Ethics.
The registrant has adopted a code of ethics, as defined in Item 2 of Form N-CSR, applicable to its principal executive officer, principal financial officer, principal accounting officer or controller, or persons performing similar functions. A copy of this code of ethics is filed as an exhibit to this Form N-CSR. No substantive amendments were approved or waivers were granted to this code of ethics during the period covered by this report.
Item 3. Audit Committee Financial Expert.
The registrant’s Board of Directors/Trustees has determined that Mr. Anthony W. Deering qualifies as an audit committee financial expert, as defined in Item 3 of Form N-CSR. Mr. Deering is considered independent for purposes of Item 3 of Form N-CSR.
Item 4. Principal Accountant Fees and Services.
(a) – (d) Aggregate fees billed to the registrant for the last two fiscal years for professional services rendered by the registrant’s principal accountant were as follows:

Audit fees include amounts related to the audit of the registrant’s annual financial statements and services normally provided by the accountant in connection with statutory and regulatory filings. Audit-related fees include amounts reasonably related to the performance of the audit of the registrant’s financial statements and specifically include the issuance of a report on internal controls and, if applicable, agreed-upon procedures related to fund acquisitions. Tax fees include amounts related to services for tax compliance, tax planning, and tax advice. The nature of these services specifically includes the review of distribution calculations and the preparation of Federal, state, and excise tax returns. All other fees include the registrant’s pro-rata share of amounts for agreed-upon procedures in conjunction with service contract approvals by the registrant’s Board of Directors/Trustees.
(e)(1) The registrant’s audit committee has adopted a policy whereby audit and non-audit services performed by the registrant’s principal accountant for the registrant, its investment adviser, and any entity controlling, controlled by, or under common control with the investment adviser that provides ongoing services to the registrant require pre-approval in advance at regularly scheduled audit committee meetings. If such a service is required between regularly scheduled audit committee meetings, pre-approval may be authorized by one audit committee member with ratification at the next scheduled audit committee meeting. Waiver of pre-approval for audit or non-audit services requiring fees of a de minimis amount is not permitted.
(2) No services included in (b) – (d) above were approved pursuant to paragraph (c)(7)(i)(C) of Rule 2-01 of Regulation S-X.
(f) Less than 50 percent of the hours expended on the principal accountant’s engagement to audit the registrant’s financial statements for the most recent fiscal year were attributed to work performed by persons other than the principal accountant’s full-time, permanent employees.
(g) The aggregate fees billed for the most recent fiscal year and the preceding fiscal year by the registrant’s principal accountant for non-audit services rendered to the registrant, its investment adviser, and any entity controlling, controlled by, or under common control with the investment adviser that provides ongoing services to the registrant were $1,879,000 and $1,922,000, respectively.
(h) All non-audit services rendered in (g) above were pre-approved by the registrant’s audit committee. Accordingly, these services were considered by the registrant’s audit committee in maintaining the principal accountant’s independence.
Item 5. Audit Committee of Listed Registrants.
Not applicable.
Item 6. Investments.
(a) Not applicable. The complete schedule of investments is included in Item 1 of this Form N-CSR.
(b) Not applicable.
Item 7. Disclosure of Proxy Voting Policies and Procedures for Closed-End Management Investment Companies.
Not applicable.
Item 8. Portfolio Managers of Closed-End Management Investment Companies.
Not applicable.
Item 9. Purchases of Equity Securities by Closed-End Management Investment Company and Affiliated Purchasers.
Not applicable.
Item 10. Submission of Matters to a Vote of Security Holders.
Not applicable.
Item 11. Controls and Procedures.
(a) The registrant’s principal executive officer and principal financial officer have evaluated the registrant’s disclosure controls and procedures within 90 days of this filing and have concluded that the registrant’s disclosure controls and procedures were effective, as of that date, in ensuring that information required to be disclosed by the registrant in this Form N-CSR was recorded, processed, summarized, and reported timely.
(b) The registrant’s principal executive officer and principal financial officer are aware of no change in the registrant’s internal control over financial reporting that occurred during the registrant’s second fiscal quarter covered by this report that has materially affected, or is reasonably likely to materially affect, the registrant’s internal control over financial reporting.
Item 12. Exhibits.
(a)(1) The registrant’s code of ethics pursuant to Item 2 of Form N-CSR is attached.
(2) Separate certifications by the registrant's principal executive officer and principal financial officer, pursuant to Section 302 of the Sarbanes-Oxley Act of 2002 and required by Rule 30a-2(a) under the Investment Company Act of 1940, are attached.
(3) Written solicitation to repurchase securities issued by closed-end companies: not applicable.
(b) A certification by the registrant's principal executive officer and principal financial officer, pursuant to Section 906 of the Sarbanes-Oxley Act of 2002 and required by Rule 30a-2(b) under the Investment Company Act of 1940, is attached.
| | |
SIGNATURES |
| |
| | Pursuant to the requirements of the Securities Exchange Act of 1934 and the Investment |
| Company Act of 1940, the registrant has duly caused this report to be signed on its behalf by the |
| undersigned, thereunto duly authorized. |
| |
| T. Rowe Price International Series, Inc. |
| |
| |
| |
| By | /s/ Edward C. Bernard |
| | Edward C. Bernard |
| | Principal Executive Officer |
| |
| Date | February 18, 2010 |
| |
| |
| |
| | Pursuant to the requirements of the Securities Exchange Act of 1934 and the Investment |
| Company Act of 1940, this report has been signed below by the following persons on behalf of |
| the registrant and in the capacities and on the dates indicated. |
| |
| |
| By | /s/ Edward C. Bernard |
| | Edward C. Bernard |
| | Principal Executive Officer |
| |
| Date | February 18, 2010 |
| |
| |
| |
| By | /s/ Gregory K. Hinkle |
| | Gregory K. Hinkle |
| | Principal Financial Officer |
| |
| Date | February 18, 2010 |