UNITED STATES
SECURITIES AND EXCHANGE COMMISSION
Washington, D.C. 20549
FORM N-CSR
CERTIFIED SHAREHOLDER REPORT OF REGISTERED
MANAGEMENT INVESTMENT COMPANIES
Investment Company Act File Number: 811-07145
| T. Rowe Price International Series, Inc. |
|
| (Exact name of registrant as specified in charter) |
| |
| 100 East Pratt Street, Baltimore, MD 21202 |
|
| (Address of principal executive offices) |
| |
| David Oestreicher |
| 100 East Pratt Street, Baltimore, MD 21202 |
|
| (Name and address of agent for service) |
Registrant’s telephone number, including area code: (410) 345-2000
Date of fiscal year end: December 31
Date of reporting period: December 31, 2012
Item 1. Report to Shareholders
| International Stock Portfolio | December 31, 2012 |
- International stock markets generated strong gains in 2012.
- The International Stock Portfolio returned a solid 18.44% for the year ended December 31, 2012, and outperformed its MSCI benchmark.
- Our investment focus remains on companies with durable franchises that can grow their earnings and cash flow at a double-digit rate over the long term.
- We continue to uncover companies with attractive growth prospects, and we favor those that generate revenues and earnings in emerging markets.
The views and opinions in this report were current as of December 31, 2012. They are not guarantees of performance or investment results and should not be taken as investment advice. Investment decisions reflect a variety of factors, and the managers reserve the right to change their views about individual stocks, sectors, and the markets at any time. As a result, the views expressed should not be relied upon as a forecast of the fund’s future investment intent. The report is certified under the Sarbanes-Oxley Act, which requires mutual funds and other public companies to affirm that, to the best of their knowledge, the information in their financial reports is fairly and accurately stated in all material respects.
Manager’s Letter
T. Rowe Price International Stock Portfolio
Dear Investor
Non-U.S. stock markets were volatile during the year as investors reacted to a range of macroeconomic and political problems. As the period progressed, bouts of heavy selling subsided and your portfolio posted strong 6- and 12-month gains. We stuck to our disciplined, bottom-up stock selection process and maintained our focus on generating long-term performance. The portfolio remains broadly diversified across regions, countries, and sectors, and our goal is to own companies with the best long-term growth opportunities.
Performance Review
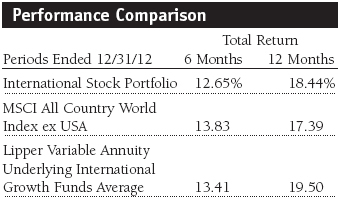
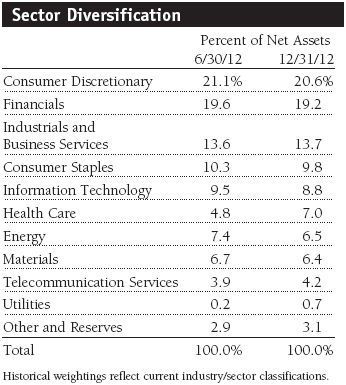
The International Stock Portfolio returned 18.44% for the year ended December 31, 2012. As shown in the Performance Comparison table, international stocks overall posted excellent gains in the second half of the year. For the year, the portfolio’s performance versus the MSCI index benefited from stock selection in the industrials and business services, health care, and consumer staples sectors. Allocation decisions, including an overweight in consumer discretionary and underweight allocations to utilities, energy, and consumer staples, also contributed to relative returns. However, stock selection in our largest sectors, consumer discretionary and financials, and our underweight to financials hurt our comparison with the benchmark. Nevertheless, every sector except energy was a positive contributor.
From a regional perspective, stock selection in developed European markets was the largest contributor in our comparison with the MSCI All Country World Index ex USA. Stock selection and an underweight allocation in Japan also helped relative performance. Our overweight allocation to developed Asia-Pacific markets (ex-Japan) posted solid absolute results but detracted from relative returns over the 12-month period. Overall, stock selection in emerging markets, which accounts for about one-quarter of the portfolio, hurt our relative results.
Portfolio Strategy
Our investment strategy is to buy and hold high-quality growth companies with competitive advantages in their respective markets. The fund focuses on long-term performance and shuns fad investments and momentum trading. We believe that over the long term, stock prices move with earnings and cash flow growth, meaning simply that if a company grows free cash flow by 15% a year, its stock should appreciate at roughly the same rate. We search for companies we think can generate double-digit earnings growth over time by participating in expanding markets, taking market share, or improving profitability faster than sales. We think that if we can find those companies and pay a fair price for their stock, we can compound absolute returns at double-digit levels and provide solid long-term relative results.
We work with T. Rowe Price’s specialized industry analysts and other portfolio managers to find companies that fit these criteria. We look for the best stocks wherever we may find them rather than employing a regional, country, or sector focus. While we take note of the broad economic conditions in regions and countries, the portfolio’s composition is primarily determined by individual stock considerations.
At this time, our investment decisions are being shaped by the following views:
- Japan and Europe remain economically challenged, but policy has modestly shifted toward stimulating growth.
- Consumer spending in emerging markets should continue to be a strong global growth driver.
- Our call for faster growth in the larger emerging markets was premature, but we believe that growth in those countries will accelerate.
- We are drawn to the opportunities in consumer discretionary stocks, which we view as cheaper (versus their growth prospects) than consumer staples companies.
- When interest rates rise, which we still think is a long way off, we think low-risk, higher-yielding stocks will begin to struggle, valuations will slowly narrow, and investors will favor growth stocks.
- Government policy continues to be onerous for corporations.
It has been a strange market. Usually when stocks go up, there is a degree of ebullience. There’s an air of happiness within investment offices and swagger among investment pros, who slap each other on the back and say, “Wow! That was a great/gutsy call on that stock.” For the past 12 months, the market has climbed the proverbial “wall of worry,” but without relinquishing much of the worry. Stocks that have done well—largely modest-growth firms that generate strong cash flow, above-average dividends, and stable revenue and income—still seem to be in favor as a proxy for bonds (and an income stream). Although investors have warmed up to a few of the high-quality financials, it is a short list, and the price of admission has become very steep. For most of the year, investors shunned risky stocks.
While performance was good, it has felt like a more difficult year for your portfolio. Large parts of the fund outperformed, but it was mainly due to rising valuations rather than robust earnings, sales, or cash flow. Where we took a bit more risk—adding struggling or out-of-favor companies that appear to have good prospects over a two- to three-year period—the portfolio was punished. However, in the past two or three months, investors have started to embrace risk. We believe that over time investors are rewarded for taking risk, but reward can be fleeting for investors with short time horizons—even half a year. We are willing and comfortable with absorbing some short-term blows to achieve long-term gains. While we are not dramatically repositioning the portfolio, we are taking more risk at the margin and extending our investment horizon to find opportunity. The balancing of risk and reward is a combination of art and science, and our experienced and talented team of analysts and I pledge to work diligently on your behalf.
Market Environment
Stocks rallied, but the European macroeconomic backdrop remained subdued. The worsening economic environment, once confined to peripheral Europe, appears to be spreading to core eurozone economies. The European Central Bank’s current bond-buying plan is intended to help ease the ongoing eurozone sovereign debt crisis. ECB President Mario Draghi explained that the bank would conduct outright monetary transactions, buying bonds with maturities between one and three years, to address “severe distortions” in government bond markets. However, outright monetary transactions will only be carried out when a country has requested a bailout from one of the eurozone’s rescue funds, thus relinquishing some of its economic sovereignty—a decision the Spanish and Italian governments have so far been reluctant to make.
Fiscal austerity remains widespread in the region as governments seek to reduce debt levels. Companies across Europe have made decent progress in strengthening balance sheets by cutting costs, leading to healthier earnings and cash flow generation. Faced with modest demand in local markets, European companies are looking outside their borders for opportunities to increase revenues, especially in faster-growing emerging markets.
In Asia, developed equity markets generally produced strong results. Policy easing in developed and emerging markets has benefited sentiment for stocks. Japan continued to struggle with generating growth and was a drag on the region. The Chinese economy remained a key focus for investors as the government takes steps to revive domestic growth. The economy is suffering from slowing domestic consumer demand and faltering foreign investment. While we do not expect a hard landing, we think the country can achieve sustained growth at lower levels, although there will likely be periods of disruption. We remain optimistic on the long-term structural growth story in Asia. Given the uncertain environment, we expect volatility to continue, and we intend to use it as an opportunity to add high-conviction names.

This is undoubtedly a challenging economic and investing environment, but if we look beyond the political issues, there are a number of positives. For example, banks are much better capitalized, companies’ cost bases are lean, and corporations have not over-invested during the recovery phase, in part given the short time frame since the last recession. Although stocks have posted good gains, equity valuations—broadly in Europe and selectively around the world—remain reasonable, as evidenced by price-to-earnings ratios, price-to-book values, and prospective dividend yields. However, defensive stocks are currently priced at a significant premium to the market. On the negative side, risk aversion is still above average, and investors are broadly shunning risky assets and equities in general. At times during the past year, this sentiment has overwhelmed all assessments of longer-term fundamental strength.
Portfolio Review
Our largest sectors—consumer discretionary, financials, and industrials and business services—were the portfolio’s best absolute performance contributors. Industrials and business services holdings were, by far, the top relative performance contributors for the past 12 months. The portfolio’s overweight was a slight negative, but stock selection was exceptionally strong. At the industry level, professional services represent a significant portion of the gains, and electrical equipment and trading companies and distributors also rallied.

Brenntag (Germany) was among the portfolio’s top contributors for the year. It is the world’s largest third-party chemicals distributor with leading market positions across Europe and in Latin America. The company continued to grow despite the slow economic environment, and it has benefited from its pricing power in the fragmented chemicals distribution market. (Please refer to the portfolio of investments for a complete list of holdings and the amount each represents in the portfolio.)
Intertek (UK) posted strong results for the past 12 months. The niche firm has a worldwide group of testing laboratories serving the textile, footwear, toys, petroleum, and chemicals industries. The company has done well due to heightened demand for safety testing from an independent testing agency. The firm’s global reach and the recurring nature of demand for the company’s services have helped expand the company’s market share.
Leading global credit information provider Experian (UK) also generated solid results for the year. Its core credit data and analytics business is structurally attractive, benefits from high barriers to entry, and offers solid long-term growth prospects. Like Brenntag, Experian was a top absolute and relative performance contributor for the past 12 months. Growth prospects for the company continue to look attractive due to limited competition, strong profitability trends, and significant exposure to emerging markets. The company made well-executed moves into analytics, marketing data, and commercial credit data to add to its already strong credit bureau business. We eliminated our position in Jaiprakash Associates (India) at a disappointingly modest profit during the period. Our longtime holding in this industrial conglomerate has not performed as well as we had hoped.
The financials sector was the portfolio’s strongest absolute contributor and the largest detractor from our comparison with the benchmark for the year, due to a combination of stock selection and our underweight allocation to the best-performing sector in the index. Although financials (at 19.2% of the portfolio) was our second-largest sector allocation at the end of the year, the sector accounted for 25.9% of the benchmark. We took profits and eliminated several winners in the sector, including Kasikornbank (Thailand), China Construction Bank, and Deutsche Boerse (Germany). We also sold our entire position in Banco Santander (Spain), which was one of our largest detractors for the year. However, we remain positive and held onto our stake in Banco Itau (Brazil), one of Latin America’s largest financial institutions, which has struggled with higher nonperforming loan provisions and expenses.
Our consumer discretionary holdings total more than 20% of the portfolio—about double the allocation in the MSCI benchmark—because that is where we are finding what we believe are the best growth companies at attractive valuations. The overweight allocation helped relative results, but stock selection detracted during the last 12 months. We favor companies in the sector that can generate stable recurring revenues. Richemont (Switzerland), one of the world’s premier luxury goods companies, posted good revenues and income during the period. Sales of the company’s high-end jewelry, watches, writing instruments, and clothing benefited as stock markets rallied and sentiment about future economic growth improved. Richemont was the top contributor in the sector for the year.
We generated outstanding gains across our media holdings, and virtually every stock we held in the segment posted positive 12-month returns. The standout performers were WPP (UK); Liberty Global (U.S.); and Jupiter Telecommunications (Japan), due to a takeover bid from one of its large shareholders, KDDI. Media company Liberty Global is one of the largest broadband providers outside the U.S. and a leading cable operator in several countries across Europe. We like the company because it consistently generates strong free cash flow, and its management team has a solid record of deploying the cash wisely or returning it to shareholders.
Consumer staples stocks also performed well during the 12-month period, as many investors view the sector as a haven from elevated market volatility. In general, investors think of consumer staples companies as conservative and less economically sensitive than the broad market. Cash flow, revenue, and income tend to be somewhat stable and predictable. Stock selection helped our comparison with the benchmark. Our best performers in the sector for the year were Anheuser-Busch InBev (Belgium) and Carlsberg (Denmark). Carlsberg has overcome its regulation and taxation issues in the Russian market, where it has several leading brands and approximately a 40% market share. We continue to see the company as a good value and believe the market will continue to improve. InBev was a top absolute and relative performance contributor for the 12-month period. Longer term, we think the company is solid and can continue to generate steady revenue, income, and profit margins.
Among our food and staples retailers, we eliminated Jeronimo Martins, Portugal’s second-largest food retailer, in the fourth quarter. The stock had performed well, but its competitive position had become more challenging. Tesco (UK) and X5 Retail Group (Russia) were our poorest performers in the sector. We thought Tesco had good growth prospects (we expected low double-digit revenue gains) and that it would take market share in the UK. We were wrong on both counts. The company is growing sales at a mid-single-digit rate, and it has lost market share in the UK and globally. Regaining market share is proving to be costly, and investor sentiment for the stock turned south in the second half of our fiscal year. X5, the largest Russian food retailer by sales, suffered throughout the period. Disappointing quarterly results and poor gross margins drove the stock price lower. Additionally, integration costs associated with a recent acquisition have been higher than anticipated, which is crimping margins.
The telecommunication services sector was a significant detractor in absolute and relative terms for the year. Stock selection was entirely responsible for the underperformance. The portfolio’s underweight allocation benefited relative results. NII Holdings (U.S.), also known as Nextel International, which offers wireless communication services in Latin America, was among the portfolio’s largest detractors for the year. The stock has been pressured by a significant increase in competition in Brazil and higher costs associated with its 3G upgrade. The company also reported disappointing earnings results in August due to currency weakness, larger-than-anticipated expenses, and a significant decline in new customer additions. We continue to believe in the company’s longer-term prospects, and we have added to our position. Right now, the stock is trading as if the company is going out of business.
Results were generally very strong across the fund’s largest holdings, which are listed in the Twenty-Five Largest Holdings table on page 6. Five of our 10 largest holdings were among the 10 top absolute performance contributors for the year, including Samsung Electronics (South Korea), WPP, Richemont, AXA (France), and Anheuser-Busch InBev. Among the others in the top 10, only Baidu (China) posted a loss for the 12-month period, and Credit Suisse (Switzerland), Standard Chartered (UK), AIA Group (Hong Kong), and Rolls-Royce (UK) were solid contributors.
Investment Outlook
We believe that in the short term, market performance will be shaped by policy decisions. We expect policymakers to focus on debt reduction in mature markets, which will inevitably cause global growth to slow. It could also hurt growth in emerging markets, but we believe that growth in these economies will remain more robust than in mature markets. If extreme events can be avoided, stocks should move higher as many companies are performing well, continue to report solid revenues and earnings, and have fundamentally sound balance sheets. In our view, stocks are currently priced at reasonable, if not cheap, valuations.
Markets generated good gains in the final months of the reporting period, tempering our near-term expectations for equities. Stocks rallied on accommodative fiscal policy announcements coupled with central bank commitments to keeping rates low for an extended period of time. We think the markets will continue to trade in choppy fashion, vacillating between the support of increased liquidity and low rates and the threat of weak sovereign balance sheets and sluggish global growth. China’s efforts to rebalance its economy will remain a key focus for investors, and its central bank will undoubtedly take more steps to bolster growth. China’s slowdown was more severe than expected—we view it as part of a transition to a slower and more sustainable growth rate—but we have not lost sight of the country and the region’s long-term growth potential.
Despite our cautious near-term outlook, we remain optimistic about medium- and long-term prospects, especially in emerging markets. Emerging markets generally carry much less debt than developed countries and are well equipped to withstand a financial crisis thanks to conservative fiscal policies. Emerging markets stocks are trading at attractive levels, and current valuations appear to reflect the near-term risks.
We expect volatility to continue in this uncertain environment and will use opportunities to add to high-conviction names. As always, our focus is on owning high-quality growth companies with a competitive advantage in their respective markets, especially companies that generate strong free cash flow and have seasoned management teams. We search for companies that have the potential to generate double-digit earnings growth over time by participating in expanding markets, taking market share, or improving profitability faster than sales. We believe these companies are best equipped to navigate and thrive in the current unsettled environment.
Respectfully submitted,

Robert W. Smith
Chairman of the Investment Advisory Committee
January 16, 2013
The committee chairman has day-to-day responsibility for managing the portfolio and works with committee members in developing and executing its investment program.
| Risks of International Investing |
Portfolios that invest overseas generally carry more risk than funds that invest strictly in U.S. assets. Portfolios investing in a single country or in a limited geographic region tend to be riskier than more diversified funds. Risks can result from varying stages of economic and political development; differing regulatory environments, trading days, and accounting standards; and higher transaction costs of non-U.S. markets. Non-U.S. investments are also subject to currency risk, or a decline in the value of a foreign currency versus the U.S. dollar, which reduces the dollar value of securities denominated in that currency.Lipper averages: The averages of available mutual fund performance returns for specified periods in categories defined by Lipper Inc.
MSCI All Country World Index ex USA: An index that measures equity market performance of developed and emerging countries, excluding the U.S.
Price/book ratio: A valuation measure that compares a stock’s market price with its book value, i.e., the company’s net worth divided by the number of outstanding shares.
Price-to-earnings (P/E) ratio: A valuation measure calculated by dividing the price of a stock by its reported earnings per share. The ratio is a measure of how much investors are willing to pay for the company’s earnings.
Portfolio Highlights

Performance and Expenses
T. Rowe Price International Stock Portfolio
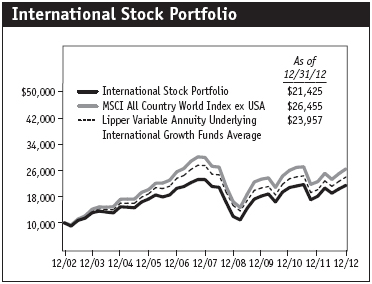
This chart shows the value of a hypothetical $10,000 investment in the portfolio over the past 10 fiscal year periods or since inception (for portfolios lacking 10-year records). The result is compared with benchmarks, which may include a broad-based market index and a peer group average or index. Market indexes do not include expenses, which are deducted from portfolio returns as well as mutual fund averages and indexes.

Fund Expense Example
As a mutual fund shareholder, you may incur two types of costs: (1) transaction costs, such as redemption fees or sales loads, and (2) ongoing costs, including management fees, distribution and service (12b-1) fees, and other fund expenses. The following example is intended to help you understand your ongoing costs (in dollars) of investing in the fund and to compare these costs with the ongoing costs of investing in other mutual funds. The example is based on an investment of $1,000 invested at the beginning of the most recent six-month period and held for the entire period.
Actual Expenses
The first line of the following table (Actual) provides information about actual account values and actual expenses. You may use the information on this line, together with your account balance, to estimate the expenses that you paid over the period. Simply divide your account value by $1,000 (for example, an $8,600 account value divided by $1,000 = 8.6), then multiply the result by the number on the first line under the heading “Expenses Paid During Period” to estimate the expenses you paid on your account during this period.
Hypothetical Example for Comparison Purposes
The information on the second line of the table (Hypothetical) is based on hypothetical account values and expenses derived from the fund’s actual expense ratio and an assumed 5% per year rate of return before expenses (not the fund’s actual return). You may compare the ongoing costs of investing in the fund with other funds by contrasting this 5% hypothetical example and the 5% hypothetical examples that appear in the shareholder reports of the other funds. The hypothetical account values and expenses may not be used to estimate the actual ending account balance or expenses you paid for the period.
You should also be aware that the expenses shown in the table highlight only your ongoing costs and do not reflect any transaction costs, such as redemption fees or sales loads. Therefore, the second line of the table is useful in comparing ongoing costs only and will not help you determine the relative total costs of owning different funds. To the extent a fund charges transaction costs, however, the total cost of owning that fund is higher.

Financial Highlights
T. Rowe Price International Stock Portfolio
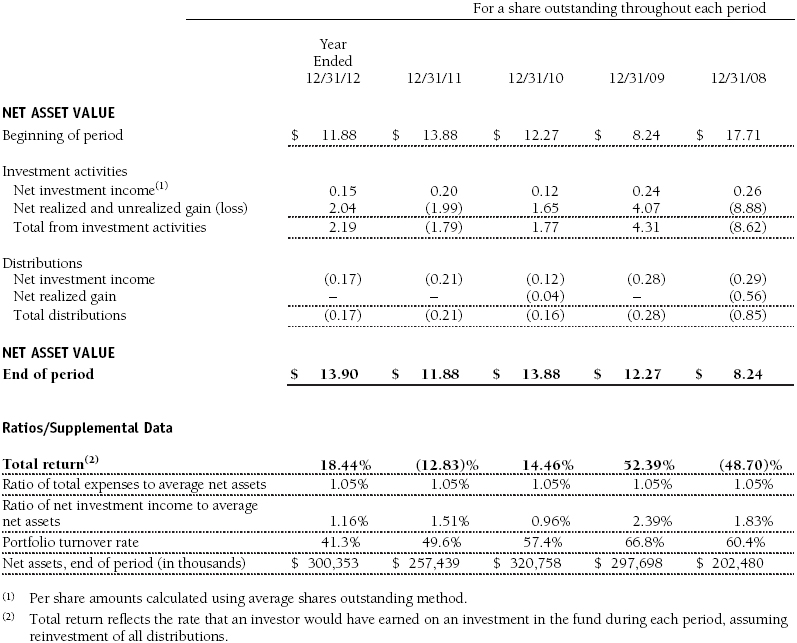
The accompanying notes are an integral part of these financial statements.
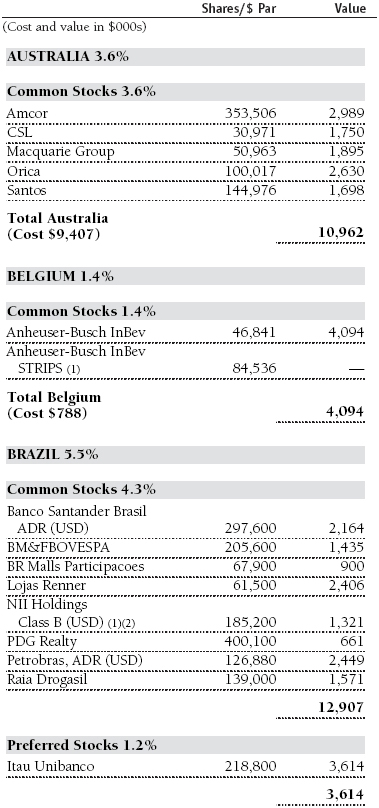
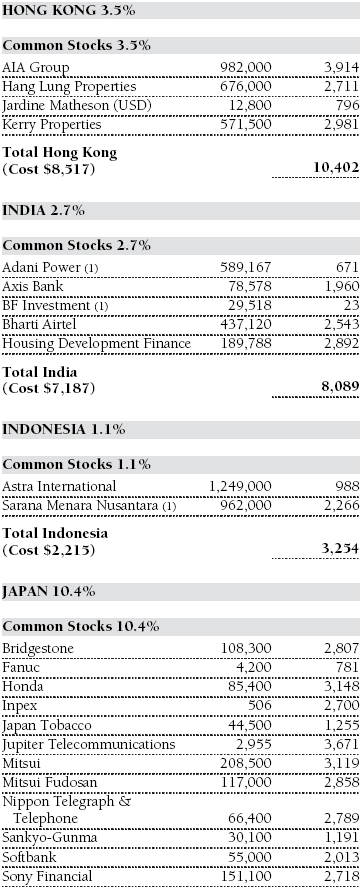
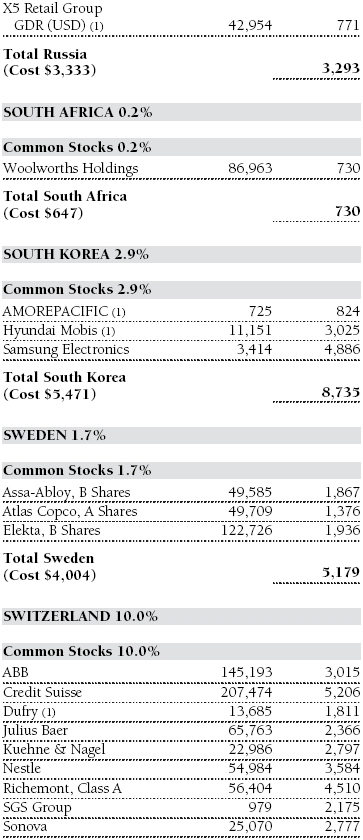
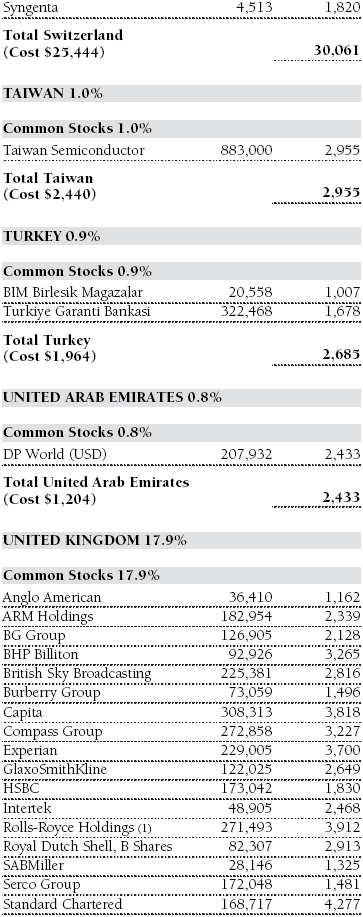
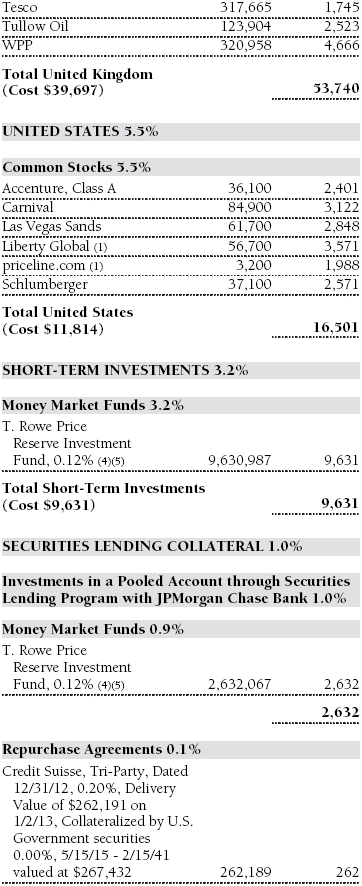
Portfolio of Investments‡
T. Rowe Price International Stock Portfolio
December 31, 2012


The accompanying notes are an integral part of these financial statements.
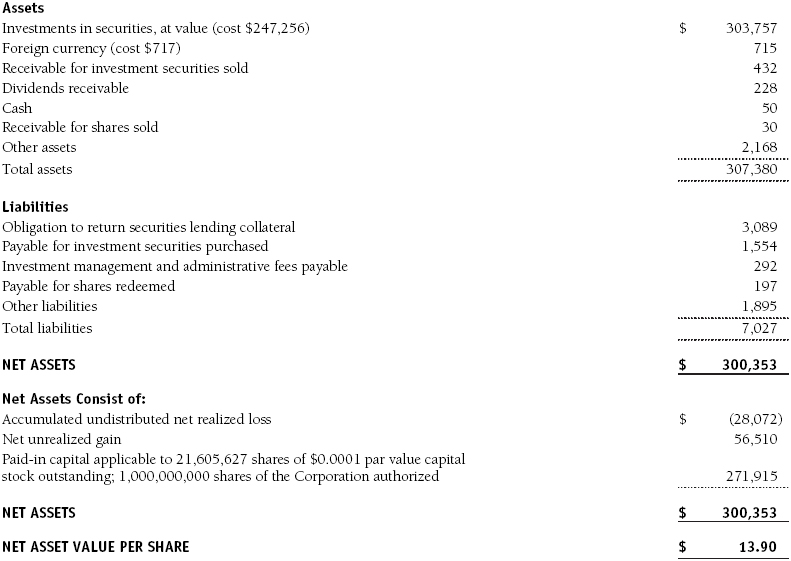
Statement of Assets and Liabilities
T. Rowe Price International Stock Portfolio
December 31, 2012
($000s, except shares and per share amounts)
The accompanying notes are an integral part of these financial statements.
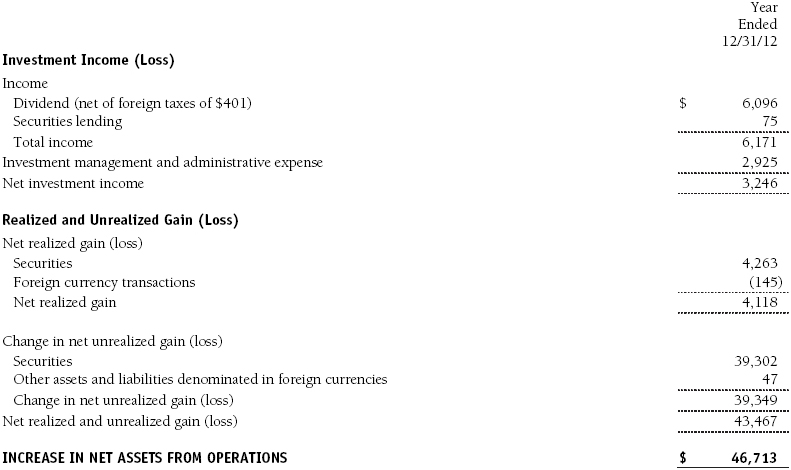
Statement of Operations
T. Rowe Price International Stock Portfolio
($000s)
The accompanying notes are an integral part of these financial statements.
Statement of Changes in Net Assets
T. Rowe Price International Stock Portfolio
($000s)

The accompanying notes are an integral part of these financial statements.
Notes to Financial Statements
T. Rowe Price International Stock Portfolio
December 31, 2012
T. Rowe Price International Series, Inc. (the corporation), is registered under the Investment Company Act of 1940 (the 1940 Act). The International Stock Portfolio (the fund) is a diversified, open-end management investment company established by the corporation. The fund commenced operations on March 31, 1994. The fund seeks long-term growth of capital through investments primarily in the common stocks of established, non-U.S. companies. Shares of the fund are currently offered only through certain insurance companies as an investment medium for both variable annuity contracts and variable life insurance policies.
NOTE 1 - SIGNIFICANT ACCOUNTING POLICIES
Basis of Preparation The accompanying financial statements were prepared in accordance with accounting principles generally accepted in the United States of America (GAAP), which require the use of estimates made by management. Management believes that estimates and valuations are appropriate; however, actual results may differ from those estimates, and the valuations reflected in the accompanying financial statements may differ from the value ultimately realized upon sale or maturity.
Investment Transactions, Investment Income, and Distributions Income and expenses are recorded on the accrual basis. Premiums and discounts on debt securities are amortized for financial reporting purposes. Dividends received from mutual fund investments are reflected as dividend income; capital gain distributions are reflected as realized gain/loss. Dividend income and capital gain distributions are recorded on the ex-dividend date. Income tax-related interest and penalties, if incurred, would be recorded as income tax expense. Investment transactions are accounted for on the trade date. Realized gains and losses are reported on the identified cost basis. Distributions to shareholders are recorded on the ex-dividend date. Income distributions are declared and paid annually. Capital gain distributions, if any, are generally declared and paid by the fund annually.
Currency Translation Assets, including investments, and liabilities denominated in foreign currencies are translated into U.S. dollar values each day at the prevailing exchange rate, using the mean of the bid and asked prices of such currencies against U.S. dollars as quoted by a major bank. Purchases and sales of securities, income, and expenses are translated into U.S. dollars at the prevailing exchange rate on the date of the transaction. The effect of changes in foreign currency exchange rates on realized and unrealized security gains and losses is reflected as a component of security gains and losses.
Credits Credits are earned on the fund’s temporarily uninvested cash balances held at the custodian and such credits reduce the amount paid by the manager for custody of the fund’s assets. In order to pass the benefit of custody credits to the fund, the manager has voluntarily reduced its investment management and administrative expense in the accompanying financial statements.
New Accounting Pronouncements In December 2011, the FASB issued amended guidance to enhance disclosure for offsetting assets and liabilities. The guidance is effective for fiscal years and interim periods beginning on or after January 1, 2013. Adoption will have no effect on the fund’s net assets or results of operations.
NOTE 2 - VALUATION
The fund’s financial instruments are reported at fair value as defined by GAAP. The fund determines the values of its assets and liabilities and computes its net asset value per share at the close of the New York Stock Exchange (NYSE), normally 4 p.m. ET, each day that the NYSE is open for business.
Valuation Methods Equity securities listed or regularly traded on a securities exchange or in the over-the-counter (OTC) market are valued at the last quoted sale price or, for certain markets, the official closing price at the time the valuations are made, except for OTC Bulletin Board securities, which are valued at the mean of the latest bid and asked prices. A security that is listed or traded on more than one exchange is valued at the quotation on the exchange determined to be the primary market for such security. Listed securities not traded on a particular day are valued at the mean of the latest bid and asked prices for domestic securities and the last quoted sale price for international securities. Debt securities with remaining maturities of less than one year at the time of acquisition generally use amortized cost in local currency to approximate fair value. However, if amortized cost is deemed not to reflect fair value or the fund holds a significant amount of such securities with remaining maturities of more than 60 days, the securities are valued at prices furnished by dealers who make markets in such securities or by an independent pricing service.
Investments in mutual funds are valued at the mutual fund’s closing net asset value per share on the day of valuation.
Other investments, including restricted securities and private placements, and those financial instruments for which the above valuation procedures are inappropriate or are deemed not to reflect fair value, are stated at fair value as determined in good faith by the T. Rowe Price Valuation Committee, established by the fund’s Board of Directors (the Board). Subject to oversight by the Board, the Valuation Committee develops pricing-related policies and procedures and approves all fair-value determinations. The Valuation Committee regularly makes good faith judgments, using a wide variety of sources and information, to establish and adjust valuations of certain securities as events occur and circumstances warrant. For instance, in determining the fair value of private-equity instruments, the Valuation Committee considers a variety of factors, including the company’s business prospects, its financial performance, strategic events impacting the company, relevant valuations of similar companies, new rounds of financing, and any negotiated transactions of significant size between other investors in the company. Because any fair-value determination involves a significant amount of judgment, there is a degree of subjectivity inherent in such pricing decisions.
For valuation purposes, the last quoted prices of non-U.S. equity securities may be adjusted under the circumstances described below. If the fund determines that developments between the close of a foreign market and the close of the NYSE will, in its judgment, materially affect the value of some or all of its portfolio securities, the fund will adjust the previous closing prices to reflect what it believes to be the fair value of the securities as of the close of the NYSE. In deciding whether it is necessary to adjust closing prices to reflect fair value, the fund reviews a variety of factors, including developments in foreign markets, the performance of U.S. securities markets, and the performance of instruments trading in U.S. markets that represent foreign securities and baskets of foreign securities. A fund may also fair value securities in other situations, such as when a particular foreign market is closed but the fund is open. The fund uses outside pricing services to provide it with closing prices and information to evaluate and/or adjust those prices. The fund cannot predict how often it will use closing prices and how often it will determine it necessary to adjust those prices to reflect fair value. As a means of evaluating its security valuation process, the fund routinely compares closing prices, the next day’s opening prices in the same markets, and adjusted prices. Additionally, trading in the underlying securities of the fund may take place in various foreign markets on certain days when the fund is not open for business and does not calculate a net asset value. As a result, net asset values may be significantly affected on days when shareholders cannot make transactions.
Valuation Inputs Various inputs are used to determine the value of the fund’s financial instruments. These inputs are summarized in the three broad levels listed below:
Level 1 – quoted prices in active markets for identical financial instruments
Level 2 – observable inputs other than Level 1 quoted prices (including, but not limited to, quoted prices for similar financial instruments, interest rates, prepayment speeds, and credit risk)
Level 3 – unobservable inputs
Observable inputs are those based on market data obtained from sources independent of the fund, and unobservable inputs reflect the fund’s own assumptions based on the best information available. The input levels are not necessarily an indication of the risk or liquidity associated with financial instruments at that level. For example, non-U.S. equity securities actively traded in foreign markets generally are reflected in Level 2 despite the availability of closing prices because the fund evaluates and determines whether those closing prices reflect fair value at the close of the NYSE or require adjustment, as described above. The following table summarizes the fund’s financial instruments, based on the inputs used to determine their values on December 31, 2012:

Following is a reconciliation of the fund’s Level 3 holdings for the year ended December 31, 2012. Gain (loss) reflects both realized and change in unrealized gain (loss) on Level 3 holdings during the period, if any, and is included on the accompanying Statement of Operations. The change in unrealized gain (loss) on Level 3 instruments held at December 31, 2012, totaled $(698,000) for the year ended December 31, 2012.

NOTE 3 - OTHER INVESTMENT TRANSACTIONS
Consistent with its investment objective, the fund engages in the following practices to manage exposure to certain risks and/or to enhance performance. The investment objective, policies, program, and risk factors of the fund are described more fully in the fund’s prospectus and Statement of Additional Information.
Emerging Markets At December 31, 2012, approximately 26% of the fund’s net assets were invested, either directly or through investments in T. Rowe Price institutional funds, in securities of companies located in emerging markets, securities issued by governments of emerging market countries, and/or securities denominated in or linked to the currencies of emerging market countries. Emerging market securities are often subject to greater price volatility, less liquidity, and higher rates of inflation than U.S. securities. In addition, emerging markets may be subject to greater political, economic, and social uncertainty, and differing regulatory environments that may potentially impact the fund’s ability to buy or sell certain securities or repatriate proceeds to U.S. dollars.
Restricted Securities The fund may invest in securities that are subject to legal or contractual restrictions on resale. Prompt sale of such securities at an acceptable price may be difficult and may involve substantial delays and additional costs.
Repurchase Agreements All repurchase agreements are fully collateralized by U.S. government securities. Collateral is in the possession of the fund’s custodian or, for tri-party agreements, the custodian designated by the agreement. Collateral is evaluated daily to ensure that its market value exceeds the delivery value of the repurchase agreements at maturity. Although risk is mitigated by the collateral, the fund could experience a delay in recovering its value and a possible loss of income or value if the counterparty fails to perform in accordance with the terms of the agreement.
Securities Lending The fund lends its securities to approved brokers to earn additional income. It receives as collateral cash and U.S. government securities valued at 102% to 105% of the value of the securities on loan. Collateral is maintained over the life of the loan in an amount not less than the value of loaned securities as determined at the close of fund business each day; any additional collateral required due to changes in security values is delivered to the fund the next business day. Cash collateral is invested by the fund’s lending agent(s) in accordance with investment guidelines approved by management. Although risk is mitigated by the collateral, the fund could experience a delay in recovering its securities and a possible loss of income or value if the borrower fails to return the securities or if collateral investments decline in value. Securities lending revenue recognized by the fund consists of earnings on invested collateral and borrowing fees, net of any rebates to the borrower and compensation to the lending agent. In accordance with GAAP, investments made with cash collateral are reflected in the accompanying financial statements, but collateral received in the form of securities is not. At December 31, 2012, the value of loaned securities was $3,023,000; the value of cash collateral investments was $3,089,000.
Other Purchases and sales of portfolio securities other than short-term securities aggregated $111,033,000 and $117,499,000, respectively, for the year ended December 31, 2012.
NOTE 4 - FEDERAL INCOME TAXES
No provision for federal income taxes is required since the fund intends to continue to qualify as a regulated investment company under Subchapter M of the Internal Revenue Code and distribute to shareholders all of its taxable income and gains. Distributions determined in accordance with federal income tax regulations may differ in amount or character from net investment income and realized gains for financial reporting purposes. Financial reporting records are adjusted for permanent book/tax differences to reflect tax character but are not adjusted for temporary differences.
The fund files U.S. federal, state, and local tax returns as required. The fund’s tax returns are subject to examination by the relevant tax authorities until expiration of the applicable statute of limitations, which is generally three years after the filing of the tax return but which can be extended to six years in certain circumstances. Tax returns for open years have incorporated no uncertain tax positions that require a provision for income taxes.
Reclassifications between income and gain relate primarily to per-share rounding of distributions. For the year ended December 31, 2012, the following reclassifications were recorded to reflect tax character (there was no impact on results of operations or net assets):

Distributions during the years ended December 31, 2012 and December 31, 2011, totaled $3,585,000 and $4,495,000, respectively, and were characterized as ordinary income for tax purposes. At December 31, 2012, the tax-basis cost of investments and components of net assets were as follows:

The difference between book-basis and tax-basis net unrealized appreciation (depreciation) is attributable to the deferral of losses from wash sales and the realization of gains/losses on passive foreign investment companies for tax purposes. The fund intends to retain realized gains to the extent of available capital loss carryforwards. As a result of the Regulated Investment Company Modernization Act of 2010, net capital losses realized on or after January 1, 2011 (effective date) may be carried forward indefinitely to offset future realized capital gains; however, post-effective losses must be used before pre-effective capital loss carryforwards with expiration dates. Accordingly, it is possible that all or a portion of the fund’s pre-effective capital loss carryforwards could expire unused. During the year ended December 31, 2012, the fund utilized $3,525,000 of capital loss carryforwards. The fund’s available capital loss carryforwards as of December 31, 2012, all expire in fiscal 2017.
NOTE 5 - FOREIGN TAXES
The fund is subject to foreign income taxes imposed by certain countries in which it invests. Acquisition of certain foreign currencies related to security transactions are also subject to tax. Additionally, capital gains realized by the fund upon disposition of securities issued in or by certain foreign countries are subject to capital gains tax imposed by those countries. All taxes are computed in accordance with the applicable foreign tax law, and, to the extent permitted, capital losses are used to offset capital gains. Taxes attributable to income are accrued by the fund as a reduction of income. Taxes incurred on the purchase of foreign currencies are recorded as realized loss on foreign currency transactions. Current and deferred tax expense attributable to net capital gains is reflected as a component of realized and/or change in unrealized gain/loss on securities in the accompanying financial statements. At December 31, 2012, the fund had no deferred tax liability attributable to foreign securities and $1,997,000 of foreign capital loss carryforwards, including $44,000 that expire in 2013, $603,000 that expire in 2017, $586,000 that expire in 2018, $230,000 that expire in 2019, $497,000 that expire in 2020, and $37,000 that expire in 2021.
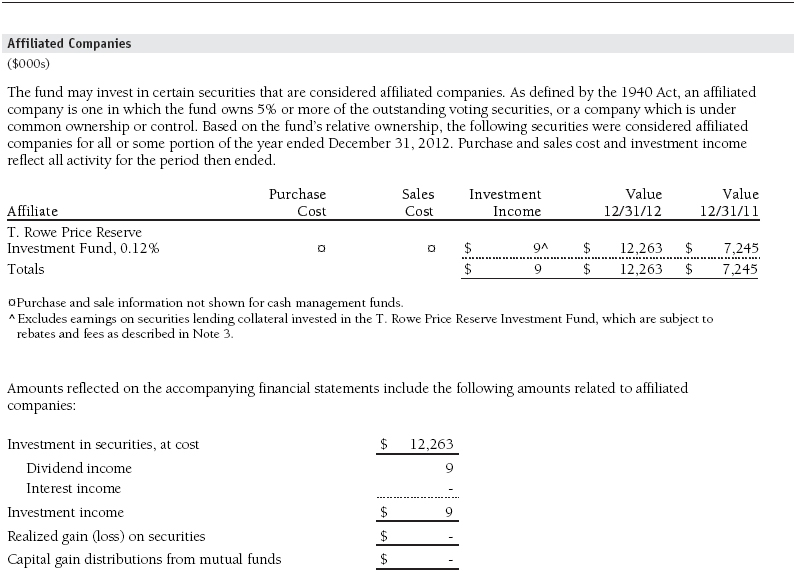
NOTE 6 - RELATED PARTY TRANSACTIONS
The fund is managed by T. Rowe Price Associates, Inc. (Price Associates), a wholly owned subsidiary of T. Rowe Price Group, Inc. (Price Group). Price Associates has entered into subadvisory agreements with T. Rowe Price International Ltd and T. Rowe Price Singapore Private Ltd., wholly owned subsidiaries of Price Associates, to provide investment advisory services to the fund; the subadvisory agreements provide that Price Associates may pay the subadvisors up to 60% of the management fee that Price Associates receives from the fund. The investment management and administrative agreement between the fund and Price Associates provides for an all-inclusive annual fee equal to 1.05% of the fund’s average daily net assets. The fee is computed daily and paid monthly. The all-inclusive fee covers investment management, shareholder servicing, transfer agency, accounting, and custody services provided to the fund, as well as fund directors’ fees and expenses. Interest, taxes, brokerage commissions, and extraordinary expenses are paid directly by the fund.
The fund may invest in the T. Rowe Price Reserve Investment Fund and the T. Rowe Price Government Reserve Investment Fund (collectively, the T. Rowe Price Reserve Investment Funds), open-end management investment companies managed by Price Associates and considered affiliates of the fund. The T. Rowe Price Reserve Investment Funds are offered as cash management options to mutual funds, trusts, and other accounts managed by Price Associates and/or its affiliates and are not available for direct purchase by members of the public. The T. Rowe Price Reserve Investment Funds pay no investment management fees.
Report of Independent Registered Public Accounting Firm
To the Board of Directors of T. Rowe Price International Series, Inc. and
Shareholders of T. Rowe Price International Stock Portfolio
In our opinion, the accompanying statement of assets and liabilities, including the portfolio of investments, and the related statements of operations and of changes in net assets and the financial highlights present fairly, in all material respects, the financial position of T. Rowe Price International Stock Portfolio (one of the portfolios comprising T. Rowe Price International Series, Inc., hereafter referred to as the “Fund”) at December 31, 2012, and the results of its operations, the changes in its net assets and the financial highlights for each of the periods indicated therein, in conformity with accounting principles generally accepted in the United States of America. These financial statements and financial highlights (hereafter referred to as “financial statements”) are the responsibility of the Fund’s management; our responsibility is to express an opinion on these financial statements based on our audits. We conducted our audits of these financial statements in accordance with the standards of the Public Company Accounting Oversight Board (United States). Those standards require that we plan and perform the audit to obtain reasonable assurance about whether the financial statements are free of material misstatement. An audit includes examining, on a test basis, evidence supporting the amounts and disclosures in the financial statements, assessing the accounting principles used and significant estimates made by management, and evaluating the overall financial statement presentation. We believe that our audits, which included confirmation of securities at December 31, 2012 by correspondence with the custodian and brokers, and confirmation of the underlying funds by correspondence with the transfer agent, provide a reasonable basis for our opinion.
PricewaterhouseCoopers LLP
Baltimore, Maryland
February 8, 2013
| Tax Information (Unaudited) for the Tax Year Ended 12/31/12 |
We are providing this information as required by the Internal Revenue Code. The amounts shown may differ from those elsewhere in this report because of differences between tax and financial reporting requirements.
The fund’s distributions to shareholders included $320,000 from short-term capital gains.
For taxable non-corporate shareholders, $3,902,000 of the fund’s income represents qualified dividend income subject to the 15% rate category.
For corporate shareholders, $187,000 of the fund’s income qualifies for the dividends-received deduction.
The fund will pass through foreign source income of $3,902,000 and foreign taxes paid of $296,000.
| Information on Proxy Voting Policies, Procedures, and Records |
A description of the policies and procedures used by T. Rowe Price funds and portfolios to determine how to vote proxies relating to portfolio securities is available in each fund’s Statement of Additional Information, which you may request by calling 1-800-225-5132 or by accessing the SEC’s website, sec.gov. The description of our proxy voting policies and procedures is also available on our website, troweprice.com. To access it, click on the words “Our Company” at the top of our corporate homepage. Then, when the next page appears, click on the words “Proxy Voting Policies” on the left side of the page.
Each fund’s most recent annual proxy voting record is available on our website and through the SEC’s website. To access it through our website, follow the directions above, then click on the words “Proxy Voting Records” on the right side of the Proxy Voting Policies page.
| How to Obtain Quarterly Portfolio Holdings |
The fund files a complete schedule of portfolio holdings with the Securities and Exchange Commission for the first and third quarters of each fiscal year on Form N-Q. The fund’s Form N-Q is available electronically on the SEC’s website (sec.gov); hard copies may be reviewed and copied at the SEC’s Public Reference Room, 100 F St. N.E., Washington, DC 20549. For more information on the Public Reference Room, call 1-800-SEC-0330.
| About the Portfolio’s Directors and Officers |
Your fund is overseen by a Board of Directors (Board) that meets regularly to review a wide variety of matters affecting the fund, including performance, investment programs, compliance matters, advisory fees and expenses, service providers, and other business affairs. The Board elects the fund’s officers, who are listed in the final table. At least 75% of the Board’s members are independent of T. Rowe Price Associates, Inc. (T. Rowe Price), and its affiliates; “inside” or “interested” directors are employees or officers of T. Rowe Price. The business address of each director and officer is 100 East Pratt Street, Baltimore, Maryland 21202. The Statement of Additional Information includes additional information about the fund directors and is available without charge by calling a T. Rowe Price representative at 1-800-638-5660.
| Independent Directors | | |
| |
Name (Year of Birth)
Year Elected* [Number of
T. Rowe Price Portfolios
Overseen] | | Principal Occupation(s) and Directorships of Public Companies and Other Investment Companies During the Past Five Years |
| | | |
William R. Brody, M.D., Ph.D. (1944)
2009 [142] | | President and Trustee, Salk Institute for Biological Studies (2009 to present); Director, Novartis, Inc. (2009 to present); Director, IBM (2007 to present); President and Trustee, Johns Hopkins University (1996 to 2009); Chairman of Executive Committee and Trustee, Johns Hopkins Health System (1996 to 2009) |
| | | |
Anthony W. Deering (1945)
1994 [142] | | Chairman, Exeter Capital, LLC, a private investment firm (2004 to present); Director, Under Armour (2008 to present); Director, Vornado Real Estate Investment Trust (2004 to present); Director and Member of the Advisory Board, Deutsche Bank North America (2004 to present); Director, Mercantile Bankshares (2002 to 2007) |
| | | |
Donald W. Dick, Jr. (1943)
1994 [142] | | Principal, EuroCapital Partners, LLC, an acquisition and management advisory firm (1995 to present) |
| | | |
Robert J. Gerrard, Jr. (1952)
2012 [90] | | Chairman of Compensation Committee and Director, Syniverse Holdings, Inc. (2008 to 2011); Executive Vice President and General Counsel, Scripps Networks, LLC (1997 to 2009); Advisory Board Member, Pipeline Crisis/Winning Strategies (1997 to present) |
| | | |
Karen N. Horn (1943)
2003 [142] | | Senior Managing Director, Brock Capital Group, an advisory and investment banking firm (2004 to present); Director, Eli Lilly and Company (1987 to present); Director, Simon Property Group (2004 to present); Director, Norfolk Southern (2008 to present); Director, Fannie Mae (2006 to 2008) |
| |
Theo C. Rodgers (1941)
2006 [142] | | President, A&R Development Corporation (1977 to present) |
| | | |
Cecilia E. Rouse, Ph.D. (1963)
2012 [90] | | Professor and Researcher, Princeton University (1992 to present); Director, MDRC (2011 to present); Member, National Academy of Education (2010 to present); Research Associate, National Bureau of Economic Research’s Labor Studies Program (1998 to 2009 and 2011 to present); Member, President’s Council of Economic Advisors (2009 to 2011); Member, The MacArthur Foundation Network on the Transition to Adulthood and Public Policy (2000 to 2008); Member, National Advisory Committee for the Robert Wood Johnson Foundation’s Scholars in Health Policy Research Program (2008); Director and Member, National Economic Association (2006 to 2008); Member, Association of Public Policy Analysis and Management Policy Council (2006 to 2008); Member, Hamilton Project’s Advisory Board at The Brookings Institute (2006 to 2008); Chair of Committee on the Status of Minority Groups in the Economic Profession, American Economic Association (2006 to 2008) |
| | | |
John G. Schreiber (1946)
2001 [142] | | Owner/President, Centaur Capital Partners, Inc., a real estate investment company (1991 to present); Cofounder and Partner, Blackstone Real Estate Advisors, L.P. (1992 to present); Director, General Growth Properties, Inc. (2010 to present) |
| | | |
Mark R. Tercek (1957)
2009 [142] | | President and Chief Executive Officer, The Nature Conservancy (2008 to present); Managing Director, The Goldman Sachs Group, Inc. (1984 to 2008) |
| |
| *Each independent director serves until retirement, resignation, or election of a successor. |
| Inside Directors | | |
| | | |
Name (Year of Birth)
Year Elected* [Number of
T. Rowe Price Portfolios
Overseen] | | Principal Occupation(s) and Directorships of Public Companies and Other Investment Companies During the Past Five Years |
| | | |
Edward C. Bernard (1956)
2006 [142] | | Director and Vice President, T. Rowe Price; Vice Chairman of the Board, Director, and Vice President, T. Rowe Price Group, Inc.; Chairman of the Board, Director, and President, T. Rowe Price Investment Services, Inc.; Chairman of the Board and Director, T. Rowe Price Retirement Plan Services, Inc., T. Rowe Price Savings Bank, and T. Rowe Price Services, Inc.; Chairman of the Board, Chief Executive Officer, and Director, T. Rowe Price International; Chief Executive Officer, Chairman of the Board, Director, and President, T. Rowe Price Trust Company; Chairman of the Board, all funds |
| | |
Brian C. Rogers, CFA, CIC (1955)
2006 [75] | | Chief Investment Officer, Director, and Vice President, T. Rowe Price; Chairman of the Board, Chief Investment Officer, Director, and Vice President, T. Rowe Price Group, Inc.; Vice President, T. Rowe Price Trust Company |
| |
| *Each inside director serves until retirement, resignation, or election of a successor. |
| Officers | | |
| |
Name (Year of Birth)
Position Held With International Series | | Principal Occupation(s) |
| | | |
Christopher D. Alderson (1962)
President | | Director and President–International Equity, T. Rowe Price International; Company’s Representative, Director, and Vice President, Price Hong Kong; Director and Vice President, Price Singapore; Vice President, T. Rowe Price Group, Inc. |
| | | |
Richard N. Clattenburg, CFA (1979)
Vice President | | Vice President, Price Singapore, T. Rowe Price, T. Rowe Price Group, Inc., and T. Rowe Price International |
| | | |
David J. Eiswert, CFA (1972)
Vice President | | Vice President, T. Rowe Price, T. Rowe Price Group, Inc., and T. Rowe Price International |
| | |
Roger L. Fiery III, CPA (1959)
Vice President | | Vice President, Price Hong Kong, Price Singapore, T. Rowe Price, T. Rowe Price Group, Inc., T. Rowe Price International, and T. Rowe Price Trust Company |
| | | |
John R. Gilner (1961)
Chief Compliance Officer | | Chief Compliance Officer and Vice President, T. Rowe Price; Vice President, T. Rowe Price Group, Inc., and T. Rowe Price Investment Services, Inc. |
| | | |
Gregory S. Golczewski (1966)
Vice President | | Vice President, T. Rowe Price and T. Rowe Price Trust Company |
| | | |
M. Campbell Gunn (1956)
Vice President | | Vice President, T. Rowe Price Group, Inc., and T. Rowe Price International |
| | | |
Gregory K. Hinkle, CPA (1958)
Treasurer | | Vice President, T. Rowe Price, T. Rowe Price Group, Inc., and T. Rowe Price Trust Company |
| | | |
Patricia B. Lippert (1953)
Secretary | | Assistant Vice President, T. Rowe Price and T. Rowe Price Investment Services, Inc. |
| | | |
David Oestreicher (1967)
Vice President | | Director, Vice President, and Secretary, T. Rowe Price Investment Services, Inc., T. Rowe Price Retirement Plan Services, Inc., T. Rowe Price Services, Inc., and T. Rowe Price Trust Company; Vice President and Secretary, T. Rowe Price, T. Rowe Price Group, Inc., and T. Rowe Price International; Vice President, Price Hong Kong and Price Singapore |
| | | |
Gonzalo Pangaro, CFA (1968)
Vice President | | Vice President, T. Rowe Price Group, Inc., and T. Rowe Price International |
| | |
Sebastian Schrott (1977)
Vice President | | Vice President, T. Rowe Price Group, Inc., and T. Rowe Price International |
| | | |
Deborah D. Seidel (1962)
Vice President | | Vice President, T. Rowe Price, T. Rowe Price Group, Inc., T. Rowe Price Investment Services, Inc., T. Rowe Price Services, Inc. |
| | | |
Robert W. Smith (1961)
Executive Vice President | | Vice President, T. Rowe Price, T. Rowe Price Group, Inc., and T. Rowe Price Trust Company |
| | | |
Dean Tenerelli (1964)
Vice President | | Vice President, T. Rowe Price Group, Inc., and T. Rowe Price International |
| | | |
Julie L. Waples (1970)
Vice President | | Vice President, T. Rowe Price |
| |
| Unless otherwise noted, officers have been employees of T. Rowe Price or T. Rowe Price International for at least 5 years. |
Item 2. Code of Ethics.
The registrant has adopted a code of ethics, as defined in Item 2 of Form N-CSR, applicable to its principal executive officer, principal financial officer, principal accounting officer or controller, or persons performing similar functions. A copy of this code of ethics is filed as an exhibit to this Form N-CSR. No substantive amendments were approved or waivers were granted to this code of ethics during the period covered by this report.
Item 3. Audit Committee Financial Expert.
The registrant’s Board of Directors/Trustees has determined that Mr. Anthony W. Deering qualifies as an audit committee financial expert, as defined in Item 3 of Form N-CSR. Mr. Deering is considered independent for purposes of Item 3 of Form N-CSR.
Item 4. Principal Accountant Fees and Services.
(a) – (d) Aggregate fees billed for the last two fiscal years for professional services rendered to, or on behalf of, the registrant by the registrant’s principal accountant were as follows:

Audit fees include amounts related to the audit of the registrant’s annual financial statements and services normally provided by the accountant in connection with statutory and regulatory filings. Audit-related fees include amounts reasonably related to the performance of the audit of the registrant’s financial statements and specifically include the issuance of a report on internal controls and, if applicable, agreed-upon procedures related to fund acquisitions. Tax fees include amounts related to services for tax compliance, tax planning, and tax advice. The nature of these services specifically includes the review of distribution calculations and the preparation of Federal, state, and excise tax returns. All other fees include the registrant’s pro-rata share of amounts for agreed-upon procedures in conjunction with service contract approvals by the registrant’s Board of Directors/Trustees.
(e)(1) The registrant’s audit committee has adopted a policy whereby audit and non-audit services performed by the registrant’s principal accountant for the registrant, its investment adviser, and any entity controlling, controlled by, or under common control with the investment adviser that provides ongoing services to the registrant require pre-approval in advance at regularly scheduled audit committee meetings. If such a service is required between regularly scheduled audit committee meetings, pre-approval may be authorized by one audit committee member with ratification at the next scheduled audit committee meeting. Waiver of pre-approval for audit or non-audit services requiring fees of a de minimis amount is not permitted.
(2) No services included in (b) – (d) above were approved pursuant to paragraph (c)(7)(i)(C) of Rule 2-01 of Regulation S-X.
(f) Less than 50 percent of the hours expended on the principal accountant’s engagement to audit the registrant’s financial statements for the most recent fiscal year were attributed to work performed by persons other than the principal accountant’s full-time, permanent employees.
(g) The aggregate fees billed for the most recent fiscal year and the preceding fiscal year by the registrant’s principal accountant for non-audit services rendered to the registrant, its investment adviser, and any entity controlling, controlled by, or under common control with the investment adviser that provides ongoing services to the registrant were $1,802,000 and $1,764,000, respectively.
(h) All non-audit services rendered in (g) above were pre-approved by the registrant’s audit committee. Accordingly, these services were considered by the registrant’s audit committee in maintaining the principal accountant’s independence.
Item 5. Audit Committee of Listed Registrants.
Not applicable.
Item 6. Investments.
(a) Not applicable. The complete schedule of investments is included in Item 1 of this Form N-CSR.
(b) Not applicable.
Item 7. Disclosure of Proxy Voting Policies and Procedures for Closed-End Management Investment Companies.
Not applicable.
Item 8. Portfolio Managers of Closed-End Management Investment Companies.
Not applicable.
Item 9. Purchases of Equity Securities by Closed-End Management Investment Company and Affiliated Purchasers.
Not applicable.
Item 10. Submission of Matters to a Vote of Security Holders.
Not applicable.
Item 11. Controls and Procedures.
(a) The registrant’s principal executive officer and principal financial officer have evaluated the registrant’s disclosure controls and procedures within 90 days of this filing and have concluded that the registrant’s disclosure controls and procedures were effective, as of that date, in ensuring that information required to be disclosed by the registrant in this Form N-CSR was recorded, processed, summarized, and reported timely.
(b) The registrant’s principal executive officer and principal financial officer are aware of no change in the registrant’s internal control over financial reporting that occurred during the registrant’s second fiscal quarter covered by this report that has materially affected, or is reasonably likely to materially affect, the registrant’s internal control over financial reporting.
Item 12. Exhibits.
(a)(1) The registrant’s code of ethics pursuant to Item 2 of Form N-CSR is attached.
(2) Separate certifications by the registrant's principal executive officer and principal financial officer, pursuant to Section 302 of the Sarbanes-Oxley Act of 2002 and required by Rule 30a-2(a) under the Investment Company Act of 1940, are attached.
(3) Written solicitation to repurchase securities issued by closed-end companies: not applicable.
(b) A certification by the registrant's principal executive officer and principal financial officer, pursuant to Section 906 of the Sarbanes-Oxley Act of 2002 and required by Rule 30a-2(b) under the Investment Company Act of 1940, is attached.
SIGNATURES
Pursuant to the requirements of the Securities Exchange Act of 1934 and the Investment Company Act of 1940, the registrant has duly caused this report to be signed on its behalf by the undersigned, thereunto duly authorized.
T. Rowe Price International Series, Inc.
| By | /s/ Edward C. Bernard |
| | Edward C. Bernard |
| | Principal Executive Officer |
| | |
| Date February 8, 2013 | | |
Pursuant to the requirements of the Securities Exchange Act of 1934 and the Investment Company Act of 1940, this report has been signed below by the following persons on behalf of the registrant and in the capacities and on the dates indicated.
| By | /s/ Edward C. Bernard |
| | Edward C. Bernard |
| | Principal Executive Officer |
| | |
| Date February 8, 2013 | | |
| | |
| | |
| By | /s/ Gregory K. Hinkle |
| | Gregory K. Hinkle |
| | Principal Financial Officer |
| | |
| Date February 8, 2013 | | |