UNITED STATES
SECURITIES AND EXCHANGE COMMISSION
Washington, D.C. 20549
FORM N-CSR
CERTIFIED SHAREHOLDER REPORT OF REGISTERED
MANAGEMENT INVESTMENT COMPANIES
Investment Company Act File Number: 811-07145
| T. Rowe Price International Series, Inc. |
|
| (Exact name of registrant as specified in charter) |
| |
| 100 East Pratt Street, Baltimore, MD 21202 |
|
| (Address of principal executive offices) |
| |
| David Oestreicher |
| 100 East Pratt Street, Baltimore, MD 21202 |
|
| (Name and address of agent for service) |
Registrant’s telephone number, including area code: (410) 345-2000
Date of fiscal year end: December 31
Date of reporting period: December 31, 2014
Item 1. Report to Shareholders
| International Stock Portfolio | December 31, 2014 |
| ● | International stock markets declined for U.S.-based investors largely due to losses in currency translation as the U.S. dollar rallied. |
| ● | The International Stock Portfolio outperformed its benchmark and its Lipper peer group for the 6- and 12-month periods ended December 31, 2014. |
| ● | We focus on companies with durable franchises that can grow their earnings and cash flow at a double-digit rate over the long term. |
| ● | We are uncovering companies with attractive growth prospects, although economic growth in many markets remains modest. |
The views and opinions in this report were current as of December 31, 2014. They are not guarantees of performance or investment results and should not be taken as investment advice. Investment decisions reflect a variety of factors, and the managers reserve the right to change their views about individual stocks, sectors, and the markets at any time. As a result, the views expressed should not be relied upon as a forecast of the fund’s future investment intent. The report is certified under the Sarbanes-Oxley Act, which requires mutual funds and other public companies to affirm that, to the best of their knowledge, the information in their financial reports is fairly and accurately stated in all material respects.
Manager’s Letter
T. Rowe Price International Stock Portfolio
Dear Investor
As you have read in previous communications, I will be stepping down as lead portfolio manager of the International Stock Portfolio. I will be handing off my day-to-day management responsibilities to Richard Clattenburg, who will become lead portfolio manager on April 1, 2015. This will be my last shareholder letter as manager of your portfolio. I have had the privilege of managing this and other T. Rowe Price portfolios for the past 19 years. As I have stressed in the past and want to reassure you now, all portfolios at T. Rowe Price benefit from our strong research platform and collaboration between our deep and talented pool of portfolio managers and analysts. T. Rowe Price devotes considerable efforts to succession planning, and I am confident that this transition process will be seamless. Importantly, the portfolio’s investment objective will not change, and the investment process will continue to focus on bottom-up stock selection. Your portfolio will remain broadly diversified across regions, countries, and sectors, and, as always, our goal is to own companies with above-average, long-term growth prospects.
Performance Review
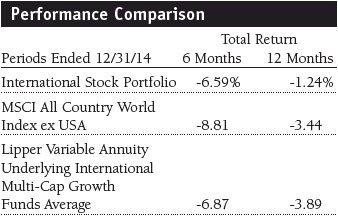
The International Stock Portfolio returned -1.24% for the year ended December 31, 2014. As shown in the Performance Comparison table, international stocks, overall, posted steep losses in the past six months and a more modest decline for the year. While we are disappointed with our absolute results, your portfolio outperformed both the MSCI All Country World Index ex USA and its Lipper peer group average for the past six and 12 months.
Market Environment
U.S. dollar-based investors endured large losses during the past six months. There is no doubt that geopolitical strife, concern about China’s economic slowdown, the potential for rising U.S. interest rates, and the ongoing conflict between Russia and western powers over Ukraine contributed to investor anxiety and demand for safe-haven investments. However, the most significant reason for underwhelming results was the strength of the U.S. dollar, which gained more than 11% versus the euro, almost 9% against the British pound sterling, and more than 15% versus the Japanese yen in the past six months. As shown in the Performance Comparison table, over the last six months, the MSCI All Country World Index ex USA returned -8.81% for dollar-based investors, but investors who owned the same basket of stocks in local currencies generated a 2.06% gain. For the year, the disparity was similar—the MSCI benchmark posted a -3.44% return for U.S. investors, while the same stocks in local currency generated a 6.52% gain. In general, the companies in the MSCI index performed well, but currency translation caused losses for dollar-based investors.
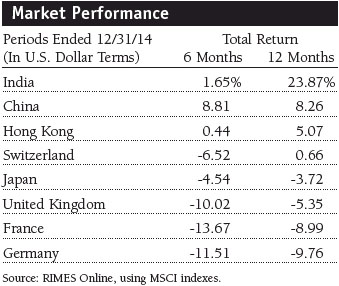
The best-performing stock markets shown in the Market Performance table were less impacted by currency losses than the biggest decliners. For the past 12 months, the Indian rupee declined about 2% versus the U.S. dollar, the Chinese yuan renminbi lost less than 3%, and the Hong Kong dollar traded about even with the U.S. dollar. On the other hand, the stocks in Germany and France, which are euro-denominated, lost more than 12% to currency translation, the UK (pound sterling) fell almost 6%, and the Swiss franc declined more than 10%. From a regional perspective, stocks in North America were the best performers in the benchmark, followed by developed markets in the Pacific ex-Japan region and then emerging markets. Developed markets in Europe, the UK, and Japan, which, combined, account for 60% of the benchmark, were weakest.
Portfolio Strategy
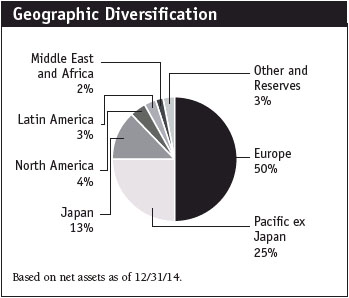
Our largest regional allocation was to Europe (including the UK), representing approximately 50% of the portfolio’s assets. Emerging markets worldwide, including large allocations to China and India, represented approximately 22% of the portfolio. As we’ve stated in prior shareholder letters, our regional and sector allocations are the result of our rigorous bottom-up stock selection process. We invest in companies rather than regions, countries, or sectors. We look to own these companies for the long term and seek to generate solid risk-adjusted returns. Therefore, at this time, our investment decisions are being shaped by the following views:
| ● | Japan and Europe remain challenged to generate stable revenue growth, but they are benefiting from loose monetary and fiscal policies, which have modestly improved company fundamentals. |
| ● | Consumer spending by the growing middle class in emerging markets should continue to drive global growth. |
| ● | Emerging markets growth, while still slightly better than growth in developed markets, will likely be uneven and more modest than in the past few years. |
| ● | Government policies continue to be onerous for corporations, and being ahead of political and policy shifts will be rewarding. |
Portfolio Review
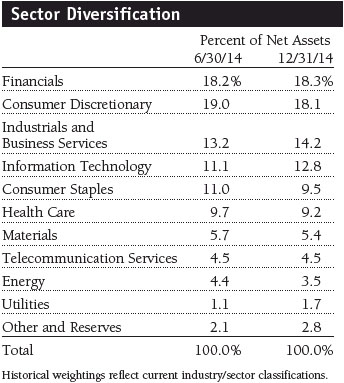
Stock selection in the information technology (IT) sector and our significant overweight allocation contributed to the portfolio’s absolute performance and its comparison with the MSCI benchmark for the year. We increased our overweight allocation to 12.8% of the portfolio from 11.1% six months ago. Overall, our IT holdings gained about 19%, more than double the 7.5% gain for that segment in the benchmark. The fund’s top contributors came from a variety of companies within the sector, including NXP Semiconductors, Avago Technologies, and Taiwan Semiconductor Manufacturing in the semiconductors and equipment segment. In the Internet software and services industry, Baidu, Alibaba Group, and Tencent were among the best performers. Unfortunately, we owned several significant detractors, as well. Among Internet software and services providers, Yahoo! Japan, Sina, and 58.com posted losses. In addition to our eliminations of Sina and 58.com, we also sold our remaining holdings in SAP and Samsung Electronics for a loss. (Please refer to the portfolio of investments for a complete list of holdings and the amount each represents in the portfolio.)
At 18.1% of the portfolio, our allocation to consumer discretionary stocks was significantly larger than the approximately 11% weighting in the MSCI benchmark because that’s where we are finding the best growth companies. The sector was our second-best absolute performance contributor in the reporting period thanks to stock selection. In the last 12 months, we established new positions in Altice, Liberty Global, and Vipshop Holdings, which generated strong contributions to performance. We also added new positions in Sky Deutschland, Start Today, and Wynn Resorts that detracted from performance.
Our health care holdings also posted a solid gain and contribution to the portfolio’s comparison with the benchmark. Pharmaceuticals manufacturers, including Aspen Pharmacare, Valeant Pharmaceuticals International, and Novartis, were top performers. Although we took some profits off the table, our modest overweight allocation helped results. GlaxoSmithKline and Elekta were eliminated at a loss during the period. Recent portfolio addition GN Store Nord posted steep losses as did Takeda Pharmaceutical. Both hurt our comparison with the benchmark index.
As oil prices plunged in the second half of the year, our holdings in the energy sector suffered and were the largest drag on absolute performance. However, our half-the-benchmark allocation worked in our favor, and our energy holdings contributed to the portfolio’s relative results. There were no standout performance contributors, and Tullow Oil (which we eliminated), Santos, and BG Group were the largest decliners.
Financials, our largest sector allocation at 18.3% of assets, is by far the largest allocation in the benchmark at more than 27% of assets. Our holdings did not perform well, but stock selection contributed to relative performance. The worst segment was real estate management and development companies where Kerry Properties and Mitsubishi Estate (both were eliminated) posted steep losses. In the capital markets group, Credit Suisse tumbled, and, among banks, Standard Chartered, Sberbank of Russia, and Barclays were among the portfolio’s largest decliners. On the positive side, Axis Bank, Itau Unibanco, and AIA Group were solid contributors.
From a regional perspective, stock selection generated a solid contribution—allocation decisions contributed to a lesser extent—to our comparison with the MSCI index. Stock selection across emerging markets and in the Europe ex-UK region was strong. However, stock selection in the UK, U.S., and Japanese markets detracted from absolute returns and our performance versus the benchmark.
Lessons Learned Over a Career of Growth Stock Investing
Show me the money—cash flow and earnings, to be precise: For the past 19 years—my entire career as a T. Rowe Price portfolio manager—I have stressed the importance of owning businesses that generate above-average cash flow and earnings growth. It is a central theme that I have stressed in my client presentations and shareholder reports, and it is one of the assumptions that underpins all the growth portfolios we manage at T. Rowe Price. While cash flow and earnings may not be correlated with stock price trends at all over the short term, they correlate very closely over the long term. In a nutshell, I believe that if a company grows its earnings at an average rate of 15% a year for long periods, it will generate very good stock performance. Conversely, we don’t want to own companies that generate low single-digit earnings and free cash flow growth, as history shows that they are unlikely to be superior long-term performers.
Distinguishing cyclical versus structural issues: Many of our best long-term holdings benefited from a durable structural advantage over their competitors that the market underestimated, believing it was cyclical or transitory. In other cases, the market viewed current problems as structural, and we discerned that their issues were temporary. On the other hand, several of our worst stock decisions were investments where we paid too much for what we thought was a structural advantage but turned out to be cyclical. Correctly determining whether a company has a structural tailwind or is benefiting from cyclical gusts is essential to outperformance for growth stock investors.
How companies deploy free cash flow really matters: Analysts spend a great deal of time forecasting revenues, earnings, and profit margins but generally don’t focus enough on how the company is deploying its free cash flow. Companies with management teams that are adept at reinvesting cash flow consistently generate higher-than-expected cash in the future. They reduce the number of shares outstanding or pay dividends, when appropriate, to magnify and maximize the benefit of free cash flow. Management teams that allocate cash unwisely often increase revenues and the company’s market capitalization but tend to overpay for acquisitions, bloat their share count, and fail to rein in costs effectively.
Big economic bets can be a trap: Many investors and most fund managers think of themselves as bottom-up stock pickers, meaning that they build their portfolios one company at a time rather than from a sector or country perspective, also known as top-down investing. If stock selection is your strength, stick with the strategy. Sometimes, however, because of a country or a sector’s recent performance, investors are tempted to chase or flee from that area. Embracing this temptation can offset all the benefit of a solid stock-selection process. If you own the right companies, over time, you will do just fine.
Always understand your investment thesis: Stocks can be mispriced due to either information disparities or irrationality (human nature is not rational). As a stock picker, it is imperative to know which arbitrage you are attempting to exploit. Synthesizing public information (not inside information, which is illegal) can be as simple as understanding that clothing retailer Zara’s addressable market is not just Spain, but the world, or seeing Apple’s iPod as a platform rather than just a product. (Neither Zara nor Apple was held in the portfolio as of December 31, 2014.) In regard to behavior, investors often dump stocks after a market sell-off, such as in March 2009. Astute investors fought the psychological urge to follow the crowd and saw that stocks were significantly undervalued—it has since proved one of the best buying opportunities of our lifetime. Short-term, market-timing strategies are a sucker’s game driven by two powerful forces: greed and fear. The market’s best long-term investors have the ability to shut out the short-term noise and focus on these long-term, time-tested investing tenets.
Portfolio Outlook
As we head into 2015, I wish I could exude more excitement about current markets. I believe that in Europe and Japan, low interest rates, falling currencies, and excess liquidity are favorable for future growth. However, demographics, elevated debt loads, and current market momentum are acting as brakes on economic expansion. These opposing forces have left stocks grinding in place in a sort of one-step-forward and then one-step-back pattern. Expectations for improvements are currently low in these regions, so any progress should be slightly positive.
Emerging markets benefited from some positive policy and political shifts, particularly in India, but the recent Brazilian election and Russian decisions on several fronts have tempered sentiment toward developing markets. In our view, emerging markets growth is likely to remain subdued and uneven.
In this environment, we expect modest positive returns. Companies that are well positioned with their products and geographic distribution and have implemented cost-saving initiatives and sound capital management strategies have the opportunity to separate themselves from the pack in terms of their performance. Since we have always looked for these characteristics, we feel that we are well positioned to succeed.
I am honored to have worried and taken prudent risk on your behalf as portfolio manager of the International Stock Portfolio for the last seven years. Richard Clattenburg, who has worked with me this entire time, looks forward to the opportunity to serve you in this role going forward.
Thank you for your confidence and for investing with T. Rowe Price.
Respectfully submitted,

Robert W. Smith
Lead portfolio manager and chairman of the Investment Advisory Committee
January 12, 2015
The committee chairman has day-to-day responsibility for managing the portfolio and works with committee members in developing and executing its investment program.
| Upcoming Portfolio Manager Change |
Robert “Bob” Smith, lead portfolio manager and chairman of the International Stock Portfolio, is retiring from portfolio management on March 31, 2015, after 21 years with T. Rowe Price. Bob will remain with T. Rowe Price as a member of the investment advisory team for the portfolio and as a mentor and coach to his colleagues until the end of 2015. London-based Richard “Trip” Clattenburg will succeed Bob and become lead portfolio manager for the International Stock Portfolio, effective April 1, 2015.
Trip is well prepared for this role, having served as associate portfolio manager since 2010 and as an integral member of the strategy’s investment team for the past six years. Before moving to London, he worked for two years in our Tokyo office and for nearly two years in our Singapore office, which has provided him with investment experience in Asian and European markets. Trip is already intimately familiar with the portfolio and its holdings, and we expect that the investment philosophy and process will remain unchanged under his leadership.
Prior to joining T. Rowe Price in 2005, Trip was employed by Goldman Sachs as a financial analyst in its Investment Management Division. He is a graduate of The Wharton School, University of Pennsylvania, and has earned the Chartered Financial Analyst designation.
| Risks of International Investing |
Funds that invest overseas generally carry more risk than funds that invest strictly in U.S. assets. Funds investing in a single country or in a limited geographic region tend to be riskier than more diversified funds. Risks can result from varying stages of economic and political development; differing regulatory environments, trading days, and accounting standards; and higher transaction costs of non-U.S. markets. Non-U.S. investments are also subject to currency risk, or a decline in the value of a foreign currency versus the U.S. dollar, which reduces the dollar value of securities denominated in that currency.
Lipper averages: The averages of available mutual fund performance returns for specified periods in categories defined by Lipper Inc.
MSCI All Country World Index ex USA: An index that measures equity market performance of developed and emerging countries, excluding the U.S.
Note: MSCI makes no express or implied warranties or representations and shall have no liability whatsoever with respect to any MSCI data contained herein. The MSCI data may not be further redistributed or used as a basis for other indices or any securities or financial products. This report is not approved, reviewed, or produced by MSCI.
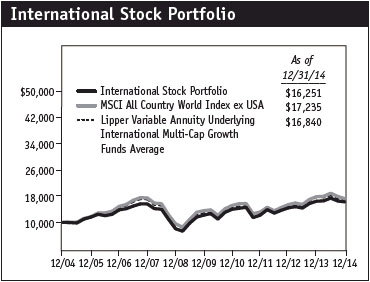
Portfolio Highlights

Performance and Expenses
T. Rowe Price International Stock Portfolio
This chart shows the value of a hypothetical $10,000 investment in the portfolio over the past 10 fiscal year periods or since inception (for portfolios lacking 10-year records). The result is compared with benchmarks, which may include a broad-based market index and a peer group average or index. Market indexes do not include expenses, which are deducted from portfolio returns as well as mutual fund averages and indexes.

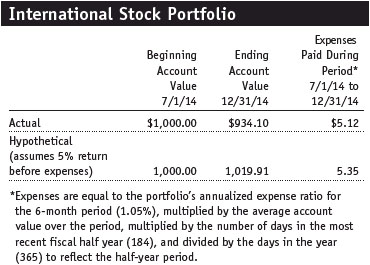
Fund Expense Example
As a mutual fund shareholder, you may incur two types of costs: (1) transaction costs, such as redemption fees or sales loads, and (2) ongoing costs, including management fees, distribution and service (12b-1) fees, and other fund expenses. The following example is intended to help you understand your ongoing costs (in dollars) of investing in the fund and to compare these costs with the ongoing costs of investing in other mutual funds. The example is based on an investment of $1,000 invested at the beginning of the most recent six-month period and held for the entire period.
Actual Expenses
The first line of the following table (Actual) provides information about actual account values and actual expenses. You may use the information on this line, together with your account balance, to estimate the expenses that you paid over the period. Simply divide your account value by $1,000 (for example, an $8,600 account value divided by $1,000 = 8.6), then multiply the result by the number on the first line under the heading “Expenses Paid During Period” to estimate the expenses you paid on your account during this period.
Hypothetical Example for Comparison Purposes
The information on the second line of the table (Hypothetical) is based on hypothetical account values and expenses derived from the fund’s actual expense ratio and an assumed 5% per year rate of return before expenses (not the fund’s actual return). You may compare the ongoing costs of investing in the fund with other funds by contrasting this 5% hypothetical example and the 5% hypothetical examples that appear in the shareholder reports of the other funds. The hypothetical account values and expenses may not be used to estimate the actual ending account balance or expenses you paid for the period.
You should also be aware that the expenses shown in the table highlight only your ongoing costs and do not reflect any transaction costs, such as redemption fees or sales loads. Therefore, the second line of the table is useful in comparing ongoing costs only and will not help you determine the relative total costs of owning different funds. To the extent a fund charges transaction costs, however, the total cost of owning that fund is higher.
Financial Highlights
T. Rowe Price International Stock Portfolio
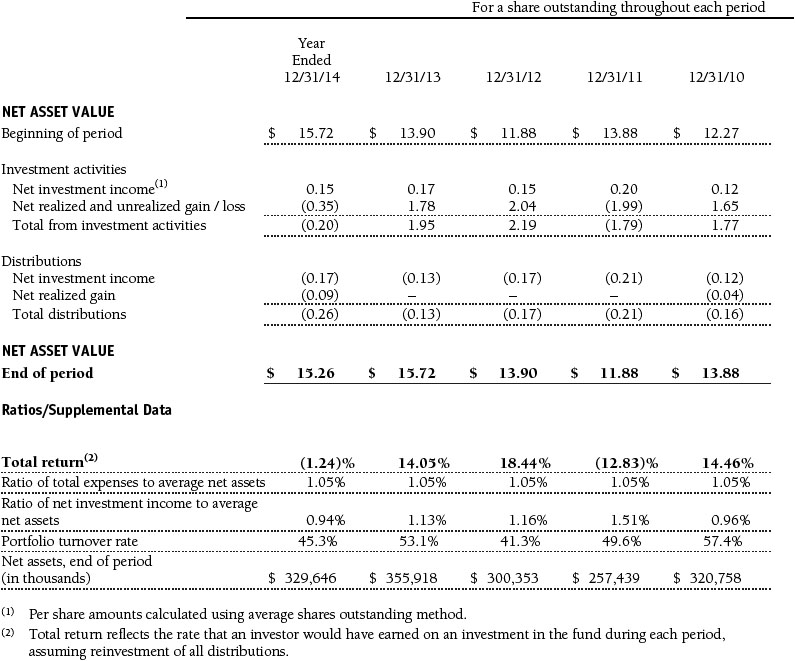
The accompanying notes are an integral part of these financial statements.
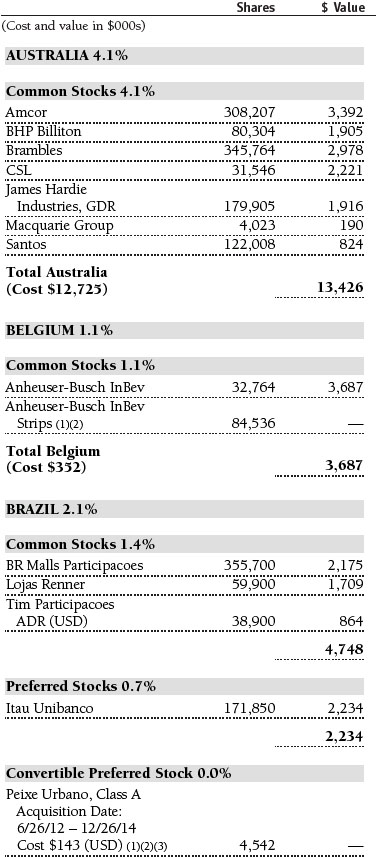
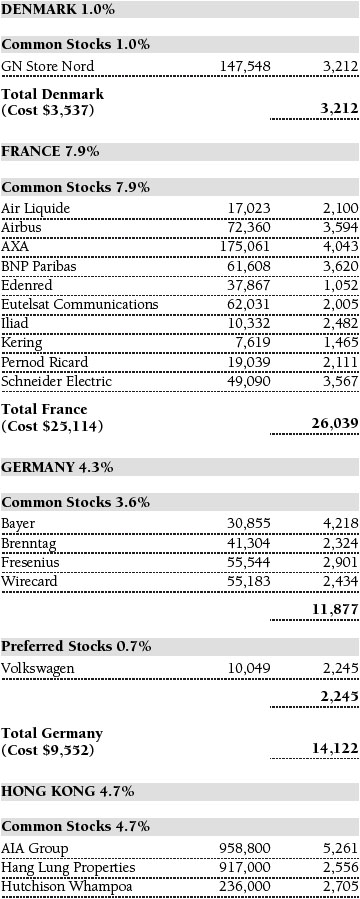
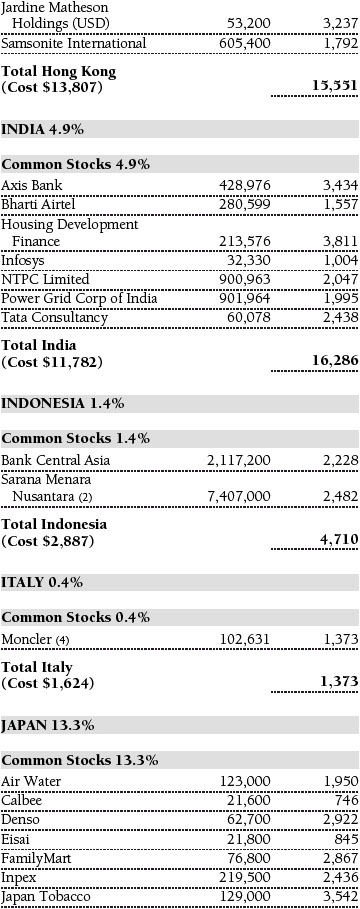
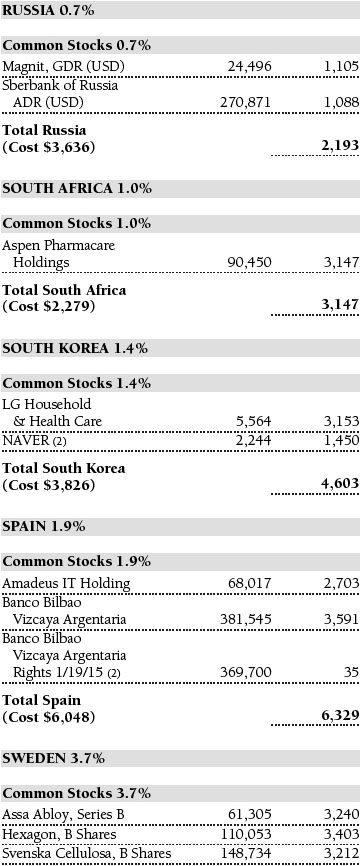
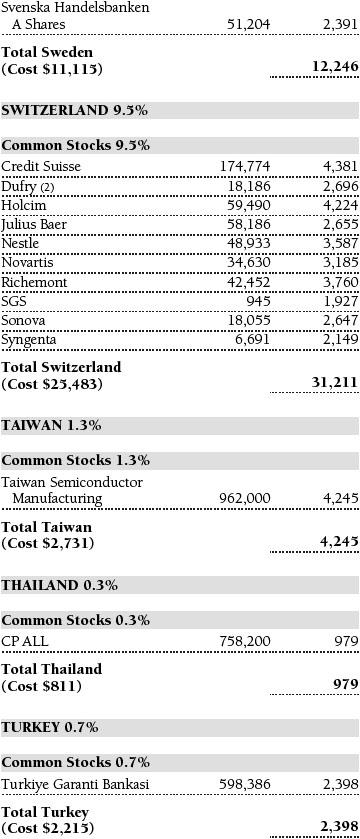
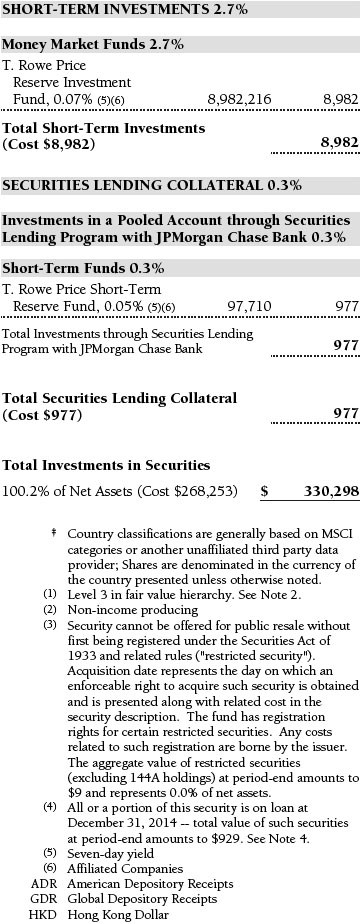
Portfolio of Investments‡
T. Rowe Price International Stock Portfolio
December 31, 2014


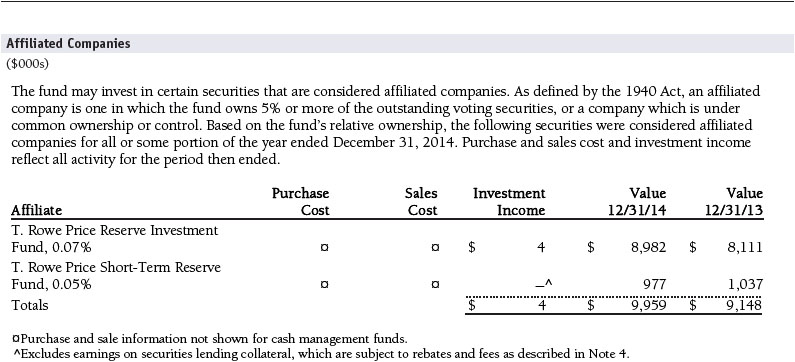
Amounts reflected on the accompanying financial statements include the following amounts related to affiliated companies:

The accompanying notes are an integral part of these financial statements.
Statement of Assets and Liabilities
T. Rowe Price International Stock Portfolio
December 31, 2014
($000s, except shares and per share amounts)
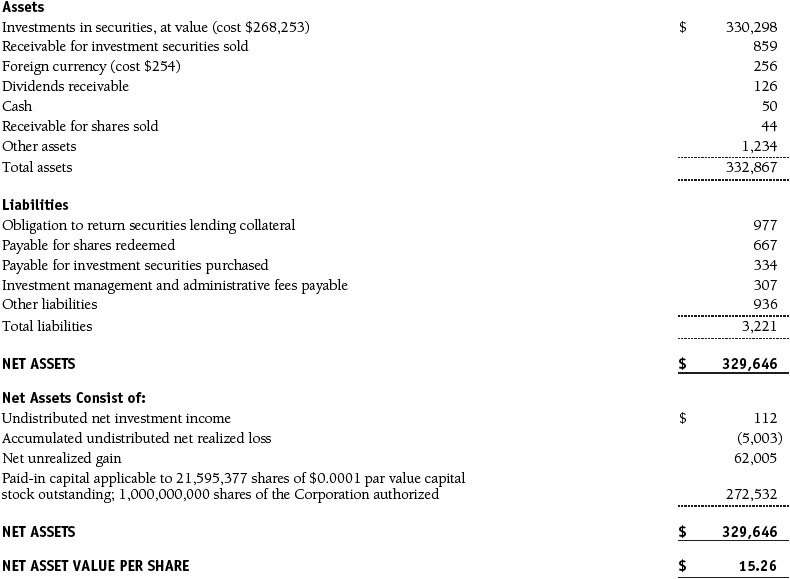
The accompanying notes are an integral part of these financial statements.
Statement of Operations
T. Rowe Price International Stock Portfolio
($000s)
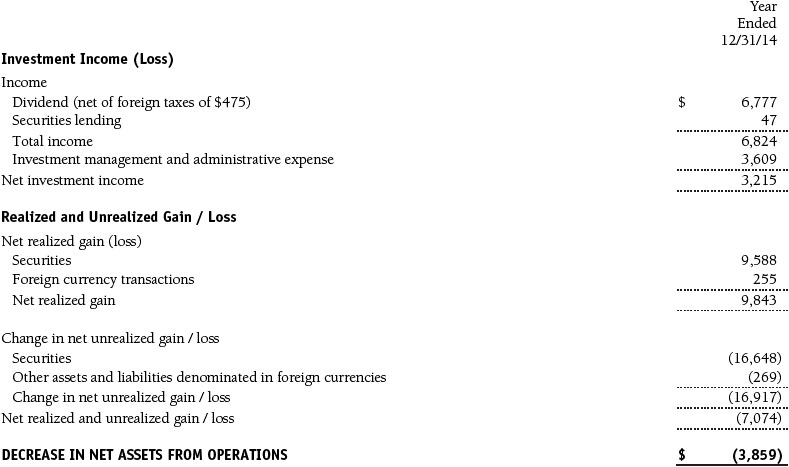
The accompanying notes are an integral part of these financial statements.
Statement of Changes in Net Assets
T. Rowe Price International Stock Portfolio
($000s)

The accompanying notes are an integral part of these financial statements.
Notes to Financial Statements
T. Rowe Price International Stock Portfolio
December 31, 2014
T. Rowe Price International Series, Inc. (the corporation), is registered under the Investment Company Act of 1940 (the 1940 Act). The International Stock Portfolio (the fund) is a diversified, open-end management investment company established by the corporation. The fund commenced operations on March 31, 1994. The fund seeks long-term growth of capital through investments primarily in the common stocks of established, non-U.S. companies. Shares of the fund are currently offered only through certain insurance companies as an investment medium for both variable annuity contracts and variable life insurance policies.
NOTE 1 - SIGNIFICANT ACCOUNTING POLICIES
Basis of Preparation The fund is an investment company and follows accounting and reporting guidance in the Financial Accounting Standards Board (FASB) Accounting Standards Codification Topic 946 (ASC 946). The accompanying financial statements were prepared in accordance with accounting principles generally accepted in the United States of America (GAAP), including but not limited to ASC 946. GAAP requires the use of estimates made by management. Management believes that estimates and valuations are appropriate; however, actual results may differ from those estimates, and the valuations reflected in the accompanying financial statements may differ from the value ultimately realized upon sale or maturity.
Investment Transactions, Investment Income, and Distributions Income and expenses are recorded on the accrual basis. Dividends received from mutual fund investments are reflected as dividend income; capital gain distributions are reflected as realized gain/loss. Dividend income and capital gain distributions are recorded on the ex-dividend date. Income tax-related interest and penalties, if incurred, would be recorded as income tax expense. Investment transactions are accounted for on the trade date. Realized gains and losses are reported on the identified cost basis. Distributions to shareholders are recorded on the ex-dividend date. Income distributions are declared and paid annually. Capital gain distributions, if any, are generally declared and paid by the fund annually.
Currency Translation Assets, including investments, and liabilities denominated in foreign currencies are translated into U.S. dollar values each day at the prevailing exchange rate, using the mean of the bid and asked prices of such currencies against U.S. dollars as quoted by a major bank. Purchases and sales of securities, income, and expenses are translated into U.S. dollars at the prevailing exchange rate on the date of the transaction. The effect of changes in foreign currency exchange rates on realized and unrealized security gains and losses is reflected as a component of security gains and losses.
New Accounting Guidance In June 2014, FASB issued Accounting Standards Update (ASU) No. 2014-11, Transfers and Servicing (Topic 860), Repurchase-to-Maturity Transactions, Repurchase Financings, and Disclosures. The ASU changes the accounting for certain repurchase agreements and expands disclosure requirements related to repurchase agreements, securities lending, repurchase-to-maturity and similar transactions. The ASU is effective for interim and annual reporting periods beginning after December 15, 2014. Adoption will have no effect on the fund’s net assets or results of operations.
NOTE 2 - VALUATION
The fund’s financial instruments are valued and its net asset value (NAV) per share is computed at the close of the New York Stock Exchange (NYSE), normally 4 p.m. ET, each day the NYSE is open for business.
Fair Value The fund’s financial instruments are reported at fair value, which GAAP defines as the price that would be received to sell an asset or paid to transfer a liability in an orderly transaction between market participants at the measurement date. The T. Rowe Price Valuation Committee (the Valuation Committee) has been established by the fund’s Board of Directors (the Board) to ensure that financial instruments are appropriately priced at fair value in accordance with GAAP and the 1940 Act. Subject to oversight by the Board, the Valuation Committee develops and oversees pricing-related policies and procedures and approves all fair value determinations. Specifically, the Valuation Committee establishes procedures to value securities; determines pricing techniques, sources, and persons eligible to effect fair value pricing actions; oversees the selection, services, and performance of pricing vendors; oversees valuation-related business continuity practices; and provides guidance on internal controls and valuation-related matters. The Valuation Committee reports to the Board; is chaired by the fund’s treasurer; and has representation from legal, portfolio management and trading, operations, and risk management.
Various valuation techniques and inputs are used to determine the fair value of financial instruments. GAAP establishes the following fair value hierarchy that categorizes the inputs used to measure fair value:
Level 1 – quoted prices (unadjusted) in active markets for identical financial instruments that the fund can access at the reporting date
Level 2 – inputs other than Level 1 quoted prices that are observable, either directly or indirectly (including, but not limited to, quoted prices for similar financial instruments in active markets, quoted prices for identical or similar financial instruments in inactive markets, interest rates and yield curves, implied volatilities, and credit spreads)
Level 3 – unobservable inputs
Observable inputs are developed using market data, such as publicly available information about actual events or transactions, and reflect the assumptions that market participants would use to price the financial instrument. Unobservable inputs are those for which market data are not available and are developed using the best information available about the assumptions that market participants would use to price the financial instrument. GAAP requires valuation techniques to maximize the use of relevant observable inputs and minimize the use of unobservable inputs. When multiple inputs are used to derive fair value, the financial instrument is assigned to the level within the fair value hierarchy based on the lowest-level input that is significant to the fair value of the financial instrument. Input levels are not necessarily an indication of the risk or liquidity associated with financial instruments at that level but rather the degree of judgment used in determining those values.
Valuation Techniques Equity securities listed or regularly traded on a securities exchange or in the over-the-counter (OTC) market are valued at the last quoted sale price or, for certain markets, the official closing price at the time the valuations are made. OTC Bulletin Board securities are valued at the mean of the closing bid and asked prices. A security that is listed or traded on more than one exchange is valued at the quotation on the exchange determined to be the primary market for such security. Listed securities not traded on a particular day are valued at the mean of the closing bid and asked prices for domestic securities and the last quoted sale or closing price for international securities.
For valuation purposes, the last quoted prices of non-U.S. equity securities may be adjusted to reflect the fair value of such securities at the close of the NYSE. If the fund determines that developments between the close of a foreign market and the close of the NYSE will, in its judgment, materially affect the value of some or all of its portfolio securities, the fund will adjust the previous quoted prices to reflect what it believes to be the fair value of the securities as of the close of the NYSE. In deciding whether it is necessary to adjust quoted prices to reflect fair value, the fund reviews a variety of factors, including developments in foreign markets, the performance of U.S. securities markets, and the performance of instruments trading in U.S. markets that represent foreign securities and baskets of foreign securities. The fund may also fair value securities in other situations, such as when a particular foreign market is closed but the fund is open. The fund uses outside pricing services to provide it with quoted prices and information to evaluate or adjust those prices. The fund cannot predict how often it will use quoted prices and how often it will determine it necessary to adjust those prices to reflect fair value. As a means of evaluating its security valuation process, the fund routinely compares quoted prices, the next day’s opening prices in the same markets, and adjusted prices.
Actively traded domestic equity securities generally are categorized in Level 1 of the fair value hierarchy. Non-U.S. equity securities generally are categorized in Level 2 of the fair value hierarchy despite the availability of quoted prices because, as described above, the fund evaluates and determines whether those quoted prices reflect fair value at the close of the NYSE or require adjustment. OTC Bulletin Board securities, certain preferred securities, and equity securities traded in inactive markets generally are categorized in Level 2 of the fair value hierarchy.
Investments in mutual funds are valued at the mutual fund’s closing NAV per share on the day of valuation and are categorized in Level 1 of the fair value hierarchy. Assets and liabilities other than financial instruments, including short-term receivables and payables, are carried at cost, or estimated realizable value, if less, which approximates fair value.
Thinly traded financial instruments and those for which the above valuation procedures are inappropriate or are deemed not to reflect fair value are stated at fair value as determined in good faith by the Valuation Committee. The objective of any fair value pricing determination is to arrive at a price that could reasonably be expected from a current sale. Financial instruments fair valued by the Valuation Committee are primarily private placements, restricted securities, warrants, rights, and other securities that are not publicly traded.
Subject to oversight by the Board, the Valuation Committee regularly makes good faith judgments to establish and adjust the fair valuations of certain securities as events occur and circumstances warrant. For instance, in determining the fair value of an equity investment with limited market activity, such as a private placement or a thinly traded public company stock, the Valuation Committee considers a variety of factors, which may include, but are not limited to, the issuer’s business prospects, its financial standing and performance, recent investment transactions in the issuer, new rounds of financing, negotiated transactions of significant size between other investors in the company, relevant market valuations of peer companies, strategic events affecting the company, market liquidity for the issuer, and general economic conditions and events. In consultation with the investment and pricing teams, the Valuation Committee will determine an appropriate valuation technique based on available information, which may include both observable and unobservable inputs. The Valuation Committee typically will afford greatest weight to actual prices in arm’s length transactions, to the extent they represent orderly transactions between market participants; transaction information can be reliably obtained; and prices are deemed representative of fair value. However, the Valuation Committee may also consider other valuation methods such as market-based valuation multiples; a discount or premium from market value of a similar, freely traded security of the same issuer; or some combination. Fair value determinations are reviewed on a regular basis and updated as information becomes available, including actual purchase and sale transactions of the issue. Because any fair value determination involves a significant amount of judgment, there is a degree of subjectivity inherent in such pricing decisions, and fair value prices determined by the Valuation Committee could differ from those of other market participants. Depending on the relative significance of unobservable inputs, including the valuation technique(s) used, fair valued securities may be categorized in Level 2 or 3 of the fair value hierarchy.
Valuation Inputs The following table summarizes the fund’s financial instruments, based on the inputs used to determine their fair values on December 31, 2014:

There were no material transfers between Levels 1 and 2 during the year ended December 31, 2014.
Following is a reconciliation of the fund’s Level 3 holdings for the year ended December 31, 2014. Gain (loss) reflects both realized and change in unrealized gain/loss on Level 3 holdings during the period, if any, and is included on the accompanying Statement of Operations. The change in unrealized gain/loss on Level 3 instruments held at December 31, 2014, totaled $(112,000) for the year ended December 31, 2014.

NOTE 3 - DERIVATIVE INSTRUMENTS
During the year ended December 31, 2014, the fund invested in derivative instruments. As defined by GAAP, a derivative is a financial instrument whose value is derived from an underlying security price, foreign exchange rate, interest rate, index of prices or rates, or other variable; it requires little or no initial investment and permits or requires net settlement. The fund invests in derivatives only if the expected risks and rewards are consistent with its investment objectives, policies, and overall risk profile, as described in its prospectus and Statement of Additional Information. The fund may use derivatives for a variety of purposes, such as seeking to hedge against declines in principal value, increase yield, invest in an asset with greater efficiency and at a lower cost than is possible through direct investment, or to adjust credit exposure. The risks associated with the use of derivatives are different from, and potentially much greater than, the risks associated with investing directly in the instruments on which the derivatives are based. The fund at all times maintains sufficient cash reserves, liquid assets, or other SEC-permitted asset types to cover its settlement obligations under open derivative contracts.
The fund values its derivatives at fair value, as described in Note 2, and recognizes changes in fair value currently in its results of operations. Accordingly, the fund does not follow hedge accounting, even for derivatives employed as economic hedges. Generally, the fund accounts for its derivatives on a gross basis. It does not offset the fair value of derivative liabilities against the fair value of derivative assets on its financial statements, nor does it offset the fair value of derivative instruments against the right to reclaim or obligation to return collateral. As of December 31, 2014, the fund held no derivative instruments.
Additionally, during the year ended December 31, 2014, the fund recognized $374,000 of realized gain on Foreign Currency Transactions and a $(252,000) change in unrealized gain/loss on Foreign Currency Transactions related to its investments in foreign exchange derivatives; such amounts are included on the accompanying Statement of Operations.
Forward Currency Exchange Contracts The fund is subject to foreign currency exchange rate risk in the normal course of pursuing its investment objectives. It uses forward currency exchange contracts (forwards) primarily to protect its non-U.S. dollar-denominated securities from adverse currency movements relative to the U.S. dollar. A forward involves an obligation to purchase or sell a fixed amount of a specific currency on a future date at a price set at the time of the contract. Although certain forwards may be settled by exchanging only the net gain or loss on the contract, most forwards are settled with the exchange of the underlying currencies in accordance with the specified terms. Forwards are valued at the unrealized gain or loss on the contract, which reflects the net amount the fund either is entitled to receive or obligated to deliver, as measured by the difference between the forward exchange rates at the date of entry into the contract and the forward rates at the reporting date. Appreciated forwards are reflected as assets, and depreciated forwards are reflected as liabilities on the accompanying Statement of Assets and Liabilities. Risks related to the use of forwards include the possible failure of counterparties to meet the terms of the agreements; that anticipated currency movements will not occur, thereby reducing the fund’s total return; and the potential for losses in excess of the fund’s initial investment. During the year ended December 31, 2014, the volume of the fund’s activity in forwards, based on underlying notional amounts, was generally between 0% and 3% of net assets.
NOTE 4 - OTHER INVESTMENT TRANSACTIONS
Consistent with its investment objective, the fund engages in the following practices to manage exposure to certain risks and/or to enhance performance. The investment objective, policies, program, and risk factors of the fund are described more fully in the fund’s prospectus and Statement of Additional Information.
Emerging Markets At December 31, 2014, approximately 22% of the fund’s net assets were invested, either directly or through investments in T. Rowe Price institutional funds, in securities of companies located in emerging markets, securities issued by governments of emerging market countries, or securities denominated in or linked to the currencies of emerging market countries. Emerging market securities are often subject to greater price volatility, less liquidity, and higher rates of inflation than U.S. securities. In addition, emerging markets may be subject to greater political, economic, and social uncertainty, and differing regulatory environments that may potentially impact the fund’s ability to buy or sell certain securities or repatriate proceeds to U.S. dollars.
Restricted Securities The fund may invest in securities that are subject to legal or contractual restrictions on resale. Prompt sale of such securities at an acceptable price may be difficult and may involve substantial delays and additional costs.
Securities Lending The fund may lend its securities to approved brokers to earn additional income. Its securities lending activities are administered by a lending agent in accordance with a securities lending agreement. Security loans generally do not have stated maturity dates and the fund may recall a security at any time. The fund receives collateral in the form of cash or U.S. government securities, valued at 102% to 105% of the value of the securities on loan. Collateral is maintained over the life of the loan in an amount not less than the value of loaned securities; any additional collateral required due to changes in security values is delivered to the fund the next business day. Cash collateral is invested by the lending agent(s) in accordance with investment guidelines approved by fund management. Additionally, the lending agent indemnifies the fund against losses resulting from borrower default. Although risk is mitigated by the collateral and indemnification, the fund could experience a delay in recovering its securities and a possible loss of income or value if the borrower fails to return the securities, collateral investments decline in value and the lending agent fails to perform. Securities lending revenue consists of earnings on invested collateral and borrowing fees, net of any rebates to the borrower, compensation to the lending agent, and other administrative costs. In accordance with GAAP, investments made with cash collateral are reflected in the accompanying financial statements, but collateral received in the form of securities is not. At December 31, 2014, the value of loaned securities was $929,000; the value of cash collateral and related investments was $977,000.
Other Purchases and sales of portfolio securities other than short-term securities aggregated $152,311,000 and $170,858,000, respectively, for the year ended December 31, 2014.
NOTE 5 - FEDERAL INCOME TAXES
No provision for federal income taxes is required since the fund intends to continue to qualify as a regulated investment company under Subchapter M of the Internal Revenue Code and distribute to shareholders all of its taxable income and gains. Distributions determined in accordance with federal income tax regulations may differ in amount or character from net investment income and realized gains for financial reporting purposes. Financial reporting records are adjusted for permanent book/tax differences to reflect tax character but are not adjusted for temporary differences.
The fund files U.S. federal, state, and local tax returns as required. The fund’s tax returns are subject to examination by the relevant tax authorities until expiration of the applicable statute of limitations, which is generally three years after the filing of the tax return but which can be extended to six years in certain circumstances. Tax returns for open years have incorporated no uncertain tax positions that require a provision for income taxes.
Reclassifications between income and gain relate primarily to per share rounding of distributions. For the year ended December 31, 2014, the following reclassifications were recorded to reflect tax character (there was no impact on results of operations or net assets):

Distributions during the years ended December 31, 2014 and December 31, 2013, were characterized for tax purposes as follows:

At December 31, 2014, the tax-basis cost of investments and components of net assets were as follows:
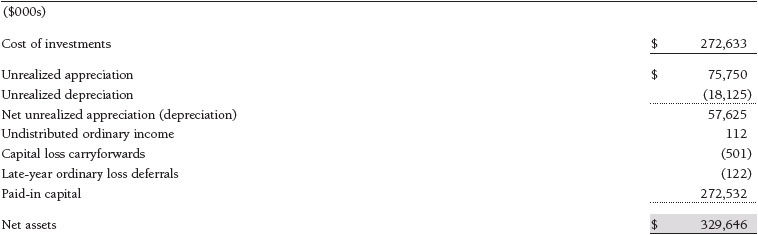
The difference between book-basis and tax-basis net unrealized appreciation (depreciation) is attributable to the deferral of losses from wash sales, and the realization of gains/losses on passive foreign investment companies for tax purposes. The fund intends to retain realized gains to the extent of available capital loss carryforwards. Net realized capital losses may be carried forward indefinitely to offset future realized capital gains. All or a portion of the capital loss carryforwards may be from losses realized between November 1 and the fund’s fiscal year-end, which are deferred for tax purposes until the subsequent year but recognized for financial reporting purposes in the year realized. During the year ended December 31, 2014, the fund utilized $9,699,000 of capital loss carryforwards. In accordance with federal tax laws applicable to investment companies, specified net losses realized between November 1 and December 31 are not recognized for tax purposes until the subsequent year (late-year ordinary loss deferrals); however, such losses are recognized for financial reporting purposes in the year realized.
NOTE 6 - FOREIGN TAXES
The fund is subject to foreign income taxes imposed by certain countries in which it invests. Additionally, certain foreign currency transactions are subject to tax and capital gains realized upon disposition of securities issued in or by certain foreign countries and are subject to capital gains tax imposed by those countries. All taxes are computed in accordance with the applicable foreign tax law and, to the extent permitted, capital losses are used to offset capital gains. Taxes attributable to income are accrued by the fund as a reduction of income. Taxes incurred on the purchase of foreign currencies are recorded as realized loss on foreign currency transactions. Current and deferred tax expense attributable to capital gains is reflected as a component of realized or change in unrealized gain/loss on securities in the accompanying financial statements. At December 31, 2014, the fund had no deferred tax liability attributable to foreign securities and $1,867,000 of foreign capital loss carryforwards, including $524,000 that expire in 2017, $508,000 that expire in 2018, $200,000 that expire in 2019, $432,000 that expire in 2020, $41,000 that expire in 2021, $18,000 that expire in 2022, and $144,000 that expire in 2023.
NOTE 7 - RELATED PARTY TRANSACTIONS
The fund is managed by T. Rowe Price Associates, Inc. (Price Associates), a wholly owned subsidiary of T. Rowe Price Group, Inc. (Price Group). The investment management and administrative agreement between the fund and Price Associates provides for an all-inclusive annual fee equal to 1.05% of the fund’s average daily net assets. The fee is computed daily and paid monthly. The all-inclusive fee covers investment management, shareholder servicing, transfer agency, accounting, and custody services provided to the fund, as well as fund directors’ fees and expenses. Interest, taxes, brokerage commissions, and extraordinary expenses are paid directly by the fund.
The fund may invest in the T. Rowe Price Reserve Investment Fund, the T. Rowe Price Government Reserve Investment Fund, or the T. Rowe Price Short-Term Reserve Fund (collectively, the Price Reserve Investment Funds), open-end management investment companies managed by Price Associates and considered affiliates of the fund. The Price Reserve Investment Funds are offered as short-term investment options to mutual funds, trusts, and other accounts managed by Price Associates or its affiliates and are not available for direct purchase by members of the public. The Price Reserve Investment Funds pay no investment management fees.
Report of Independent Registered Public Accounting Firm
To the Board of Directors of T. Rowe Price International Series, Inc. and
Shareholders of T. Rowe Price International Stock Portfolio
In our opinion, the accompanying statement of assets and liabilities, including the portfolio of investments, and the related statements of operations and of changes in net assets and the financial highlights present fairly, in all material respects, the financial position of T. Rowe Price International Stock Portfolio (one of the portfolios comprising T. Rowe Price International Series, Inc., hereafter referred to as the “Fund”) at December 31, 2014, the results of its operations, the changes in its net assets and the financial highlights for each of the periods indicated therein, in conformity with accounting principles generally accepted in the United States of America. These financial statements and financial highlights (hereafter referred to as “financial statements”) are the responsibility of the Fund’s management. Our responsibility is to express an opinion on these financial statements based on our audits. We conducted our audits of these financial statements in accordance with the standards of the Public Company Accounting Oversight Board (United States). Those standards require that we plan and perform the audit to obtain reasonable assurance about whether the financial statements are free of material misstatement. An audit includes examining, on a test basis, evidence supporting the amounts and disclosures in the financial statements, assessing the accounting principles used and significant estimates made by management, and evaluating the overall financial statement presentation. We believe that our audits, which included confirmation of securities at December 31, 2014 by correspondence with the custodian and brokers, and confirmation of the underlying funds by correspondence with the transfer agent, provide a reasonable basis for our opinion.
PricewaterhouseCoopers LLP
Baltimore, Maryland
February 6, 2015
| Tax Information (Unaudited) for the Tax Year Ended 12/31/14 |
We are providing this information as required by the Internal Revenue Code. The amounts shown may differ from those elsewhere in this report because of differences between tax and financial reporting requirements.
The fund’s distributions to shareholders included:
| ● | $1,492,000 from short-term capital gains, |
| ● | $426,000 from long-term capital gains, subject to a long-term capital gains tax rate of not greater than 20%. |
For taxable non-corporate shareholders, $4,812,000 of the fund’s income represents qualified dividend income subject to a long-term capital gains tax rate of not greater than 20%.
For corporate shareholders, $132,000 of the fund’s income qualifies for the dividends-received deduction.
The fund will pass through foreign source income of $4,536,000 and foreign taxes paid of $349,000.
| Information on Proxy Voting Policies, Procedures, and Records |
A description of the policies and procedures used by T. Rowe Price funds and portfolios to determine how to vote proxies relating to portfolio securities is available in each fund’s Statement of Additional Information. You may request this document by calling 1-800-225-5132 or by accessing the SEC’s website, sec.gov.
The description of our proxy voting policies and procedures is also available on our website, troweprice.com. To access it, click on the words “Social Responsibility” at the top of our corporate homepage. Next, click on the words “Conducting Business Responsibly” on the left side of the page that appears. Finally, click on the words “Proxy Voting Policies” on the left side of the page that appears.
Each fund’s most recent annual proxy voting record is available on our website and through the SEC’s website. To access it through our website, follow the directions above to reach the “Conducting Business Responsibly” page. Click on the words “Proxy Voting Records” on the left side of that page, and then click on the “View Proxy Voting Records” link at the bottom of the page that appears.
| How to Obtain Quarterly Portfolio Holdings |
The fund files a complete schedule of portfolio holdings with the Securities and Exchange Commission for the first and third quarters of each fiscal year on Form N-Q. The fund’s Form N-Q is available electronically on the SEC’s website (sec.gov); hard copies may be reviewed and copied at the SEC’s Public Reference Room, 100 F St. N.E., Washington, DC 20549. For more information on the Public Reference Room, call 1-800-SEC-0330.
| About the Portfolio’s Directors and Officers |
Your fund is overseen by a Board of Directors (Board) that meets regularly to review a wide variety of matters affecting or potentially affecting the fund, including performance, investment programs, compliance matters, advisory fees and expenses, service providers, and business and regulatory affairs. The Board elects the fund’s officers, who are listed in the final table. At least 75% of the Board’s members are independent of T. Rowe Price Associates, Inc. (T. Rowe Price), and its affiliates; “inside” or “interested” directors are employees or officers of T. Rowe Price. The business address of each director and officer is 100 East Pratt Street, Baltimore, Maryland 21202. The Statement of Additional Information includes additional information about the fund directors and is available without charge by calling a T. Rowe Price representative at 1-800-638-5660.
Independent Directors
Name (Year of Birth)
Year Elected* [Number of
T. Rowe Price Portfolios
Overseen] | | Principal Occupation(s) and Directorships of Public Companies and Other Investment Companies During the Past Five Years |
| | |
William R. Brody, M.D., Ph.D. (1944)
2009 [165] | | President and Trustee, Salk Institute for Biological Studies (2009 to present); Director, BioMed Realty Trust (2013 to present); Director, Novartis, Inc. (2009 to present); Director, IBM (2007 to present) |
| | |
Anthony W. Deering (1945)
1994 [165] | | Chairman, Exeter Capital, LLC, a private investment firm (2004 to present); Director, Brixmor Real Estate Investment Trust (2012 to present); Director and Member of the Advisory Board, Deutsche Bank North America (2004 to present); Director, Under Armour (2008 to present); Director, Vornado Real Estate Investment Trust (2004 to 2012) |
| | |
Donald W. Dick, Jr. (1943)
1994 [165] | | Principal, EuroCapital Partners, LLC, an acquisition and management advisory firm (1995 to present) |
| | |
Bruce W. Duncan (1951)
2013 [165] | | President, Chief Executive Officer, and Director, First Industrial Realty Trust, owner and operator of industrial properties (2009 to present); Chairman of the Board (2005 to present), Interim Chief Executive Officer (2007), and Director, Starwood Hotels & Resorts, a hotel and leisure company (1999 to present) |
| | |
Robert J. Gerrard, Jr. (1952)
2012 [165] | | Advisory Board Member, Pipeline Crisis/Winning Strategies, a collaborative working to improve opportunities for young African Americans (1997 to present); Chairman of Compensation Committee and Director, Syniverse Holdings, Inc., a provider of wireless voice and data services for telecommunications companies (2008 to 2011) |
| | |
Karen N. Horn (1943)
2003 [165] | | Limited Partner and Senior Managing Director, Brock Capital Group, an advisory and investment banking firm (2004 to present); Director, Eli Lilly and Company (1987 to present); Director, Simon Property Group (2004 to present); Director, Norfolk Southern (2008 to present) |
| | |
Paul F. McBride (1956)
2013 [165] | | Former Company Officer and Senior Vice President, Human Resources and Corporate Initiatives, Black & Decker Corporation (2004 to 2010) |
| | |
Cecilia E. Rouse, Ph.D. (1963)
2012 [165] | | Dean, Woodrow Wilson School (2012 to present); Professor and Researcher, Princeton University (1992 to present); Director, MDRC, a nonprofit education and social policy research organization (2011 to present); Member, National Academy of Education (2010 to present); Research Associate, National Bureau of Economic Research’s Labor Studies Program (2011 to present); Member, President’s Council of Economic Advisors (2009 to 2011); Chair of Committee on the Status of Minority Groups in the Economic Profession, American Economic Association (2012 to present) |
| | |
John G. Schreiber (1946)
2001 [165] | | Owner/President, Centaur Capital Partners, Inc., a real estate investment company (1991 to present); Cofounder and Partner, Blackstone Real Estate Advisors, L.P. (1992 to present); Director, General Growth Properties, Inc. (2010 to 2013); Director, BXMT (formerly Capital Trust, Inc.), a real estate investment company (2012 to present); Director and Chairman of the Board, Brixmor Property Group, Inc. (2013 to present); Director, Hilton Worldwide (2013 to present) |
| | |
Mark R. Tercek (1957)
2009 [165] | | President and Chief Executive Officer, The Nature Conservancy (2008 to present); Managing Director, The Goldman Sachs Group, Inc. (1984 to 2008) |
| | |
*Each independent director serves until retirement, resignation, or election of a successor. |
Inside Directors
Name (Year of Birth)
Year Elected* [Number of
T. Rowe Price Portfolios
Overseen] | | Principal Occupation(s) and Directorships of Public Companies and Other Investment Companies During the Past Five Years |
| | |
Edward C. Bernard (1956)
2006 [165] | | Director and Vice President, T. Rowe Price; Vice Chairman of the Board, Director, and Vice President, T. Rowe Price Group, Inc.; Chairman of the Board, Director, and President, T. Rowe Price Investment Services, Inc.; Chairman of the Board and Director, T. Rowe Price Retirement Plan Services, Inc., and T. Rowe Price Services, Inc.; Chairman of the Board, Chief Executive Officer, and Director, T. Rowe Price International; Chairman of the Board, Chief Executive Officer, Director, and President, T. Rowe Price Trust Company; Chairman of the Board, all funds |
| | |
Brian C. Rogers, CFA, CIC (1955)
2006 [111] | | Chief Investment Officer, Director, and Vice President, T. Rowe Price; Chairman of the Board, Chief Investment Officer, Director, and Vice President, T. Rowe Price Group, Inc.; Vice President, T. Rowe Price Trust Company |
| | |
*Each inside director serves until retirement, resignation, or election of a successor. |
Officers
| | |
Name (Year of Birth)
Position Held With International Series | | Principal Occupation(s) |
| | |
Christopher D. Alderson (1962)
President | | Company’s Representative, Director, and Vice President, Price Hong Kong; Director and Vice President, T. Rowe Price International and Price Singapore; Vice President, T. Rowe Price Group, Inc. |
| | | |
R. Scott Berg, CFA (1972)
Vice President | | Vice President, T. Rowe Price and T. Rowe Price Group, Inc. |
| | | |
Darrell N. Braman (1963)
Vice President | | Vice President, Price Hong Kong, Price Singapore, T. Rowe Price, T. Rowe Price Group, Inc., T. Rowe Price International, T. Rowe Price Investment Services, Inc., and T. Rowe Price Services, Inc. |
| | | |
Richard N. Clattenburg, CFA (1979)
Executive Vice President | | Vice President, Price Singapore, T. Rowe Price, T. Rowe Price Group, Inc., and T. Rowe Price International |
| | | |
David J. Eiswert, CFA (1972)
Vice President | | Vice President, T. Rowe Price, T. Rowe Price Group, Inc., and T. Rowe Price International |
| | | |
Roger L. Fiery III, CPA (1959)
Vice President | | Vice President, Price Hong Kong, Price Singapore, T. Rowe Price, T. Rowe Price Group, Inc., T. Rowe Price International, and T. Rowe Price Trust Company |
| | | |
John R. Gilner (1961)
Chief Compliance Officer | | Chief Compliance Officer and Vice President, T. Rowe Price; Vice President, T. Rowe Price Group, Inc., and T. Rowe Price Investment Services, Inc. |
| | | |
Gregory S. Golczewski (1966)
Vice President | | Vice President, T. Rowe Price and T. Rowe Price Trust Company |
| | | |
Benjamin Griffiths, CFA (1977)
Vice President | | Vice President, T. Rowe Price Group, Inc., and T. Rowe Price International |
| | | |
Gregory K. Hinkle, CPA (1958)
Treasurer | | Vice President, T. Rowe Price, T. Rowe Price Group, Inc., and T. Rowe Price Trust Company |
| | | |
Patricia B. Lippert (1953)
Secretary | | Assistant Vice President, T. Rowe Price and T. Rowe Price Investment Services, Inc. |
| | | |
David Oestreicher (1967)
Vice President | | Director, Vice President, and Secretary, T. Rowe Price Investment Services, Inc., T. Rowe Price Retirement Plan Services, Inc., T. Rowe Price Services, Inc., and T. Rowe Price Trust Company; Chief Legal Officer, Vice President, and Secretary, T. Rowe Price Group, Inc.; Vice President and Secretary, T. Rowe Price and T. Rowe Price International; Vice President, Price Hong Kong and Price Singapore |
| | | |
Jason Nogueira, CFA (1974)
Vice President | | Vice President, T. Rowe Price and T. Rowe Price Group, Inc. |
| | | |
Gonzalo Pángaro, CFA (1968)
Vice President | | Vice President, T. Rowe Price Group, Inc., and T. Rowe Price International |
| | | |
Sebastian Schrott (1977)
Vice President | | Vice President, T. Rowe Price Group, Inc., and T. Rowe Price International |
| | | |
Deborah D. Seidel (1962)
Vice President | | Vice President, T. Rowe Price, T. Rowe Price Group, Inc., T. Rowe Price Investment Services, Inc., and T. Rowe Price Services, Inc. |
| | | |
Robert W. Smith (1961)
Executive Vice President | | Vice President, T. Rowe Price, T. Rowe Price Group, Inc., and T. Rowe Price Trust Company |
| | | |
Dean Tenerelli (1964)
Vice President | | Vice President, T. Rowe Price Group, Inc., and T. Rowe Price International |
| | | |
Julie L. Waples (1970)
Vice President | | Vice President, T. Rowe Price |
| | |
Unless otherwise noted, officers have been employees of T. Rowe Price or T. Rowe Price International for at least 5 years. |
Item 2. Code of Ethics.
The registrant has adopted a code of ethics, as defined in Item 2 of Form N-CSR, applicable to its principal executive officer, principal financial officer, principal accounting officer or controller, or persons performing similar functions. A copy of this code of ethics is filed as an exhibit to this Form N-CSR. No substantive amendments were approved or waivers were granted to this code of ethics during the period covered by this report.
Item 3. Audit Committee Financial Expert.
The registrant’s Board of Directors/Trustees has determined that Mr. Anthony W. Deering qualifies as an audit committee financial expert, as defined in Item 3 of Form N-CSR. Mr. Deering is considered independent for purposes of Item 3 of Form N-CSR.
Item 4. Principal Accountant Fees and Services.
(a) – (d) Aggregate fees billed for the last two fiscal years for professional services rendered to, or on behalf of, the registrant by the registrant’s principal accountant were as follows:
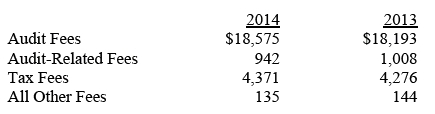
Audit fees include amounts related to the audit of the registrant’s annual financial statements and services normally provided by the accountant in connection with statutory and regulatory filings. Audit-related fees include amounts reasonably related to the performance of the audit of the registrant’s financial statements and specifically include the issuance of a report on internal controls and, if applicable, agreed-upon procedures related to fund acquisitions. Tax fees include amounts related to services for tax compliance, tax planning, and tax advice. The nature of these services specifically includes the review of distribution calculations and the preparation of Federal, state, and excise tax returns. All other fees include the registrant’s pro-rata share of amounts for agreed-upon procedures in conjunction with service contract approvals by the registrant’s Board of Directors/Trustees.
(e)(1) The registrant’s audit committee has adopted a policy whereby audit and non-audit services performed by the registrant’s principal accountant for the registrant, its investment adviser, and any entity controlling, controlled by, or under common control with the investment adviser that provides ongoing services to the registrant require pre-approval in advance at regularly scheduled audit committee meetings. If such a service is required between regularly scheduled audit committee meetings, pre-approval may be authorized by one audit committee member with ratification at the next scheduled audit committee meeting. Waiver of pre-approval for audit or non-audit services requiring fees of a de minimis amount is not permitted.
(2) No services included in (b) – (d) above were approved pursuant to paragraph (c)(7)(i)(C) of Rule 2-01 of Regulation S-X.
(f) Less than 50 percent of the hours expended on the principal accountant’s engagement to audit the registrant’s financial statements for the most recent fiscal year were attributed to work performed by persons other than the principal accountant’s full-time, permanent employees.
(g) The aggregate fees billed for the most recent fiscal year and the preceding fiscal year by the registrant’s principal accountant for non-audit services rendered to the registrant, its investment adviser, and any entity controlling, controlled by, or under common control with the investment adviser that provides ongoing services to the registrant were $2,283,000 and $1,691,000, respectively.
(h) All non-audit services rendered in (g) above were pre-approved by the registrant’s audit committee. Accordingly, these services were considered by the registrant’s audit committee in maintaining the principal accountant’s independence.
Item 5. Audit Committee of Listed Registrants.
Not applicable.
Item 6. Investments.
(a) Not applicable. The complete schedule of investments is included in Item 1 of this Form N-CSR.
(b) Not applicable.
Item 7. Disclosure of Proxy Voting Policies and Procedures for Closed-End Management Investment Companies.
Not applicable.
Item 8. Portfolio Managers of Closed-End Management Investment Companies.
Not applicable.
Item 9. Purchases of Equity Securities by Closed-End Management Investment Company and Affiliated Purchasers.
Not applicable.
Item 10. Submission of Matters to a Vote of Security Holders.
Not applicable.
Item 11. Controls and Procedures.
(a) The registrant’s principal executive officer and principal financial officer have evaluated the registrant’s disclosure controls and procedures within 90 days of this filing and have concluded that the registrant’s disclosure controls and procedures were effective, as of that date, in ensuring that information required to be disclosed by the registrant in this Form N-CSR was recorded, processed, summarized, and reported timely.
(b) The registrant’s principal executive officer and principal financial officer are aware of no change in the registrant’s internal control over financial reporting that occurred during the registrant’s second fiscal quarter covered by this report that has materially affected, or is reasonably likely to materially affect, the registrant’s internal control over financial reporting.
Item 12. Exhibits.
(a)(1) The registrant’s code of ethics pursuant to Item 2 of Form N-CSR is attached.
(2) Separate certifications by the registrant's principal executive officer and principal financial officer, pursuant to Section 302 of the Sarbanes-Oxley Act of 2002 and required by Rule 30a-2(a) under the Investment Company Act of 1940, are attached.
(3) Written solicitation to repurchase securities issued by closed-end companies: not applicable.
(b) A certification by the registrant's principal executive officer and principal financial officer, pursuant to Section 906 of the Sarbanes-Oxley Act of 2002 and required by Rule 30a-2(b) under the Investment Company Act of 1940, is attached.
SIGNATURES
Pursuant to the requirements of the Securities Exchange Act of 1934 and the Investment Company Act of 1940, the registrant has duly caused this report to be signed on its behalf by the undersigned, thereunto duly authorized.
T. Rowe Price International Series, Inc.
| | By | /s/ Edward C. Bernard |
| | Edward C. Bernard |
| | Principal Executive Officer |
| |
| Date February 6, 2015 | | |
Pursuant to the requirements of the Securities Exchange Act of 1934 and the Investment Company Act of 1940, this report has been signed below by the following persons on behalf of the registrant and in the capacities and on the dates indicated.
| | By | /s/ Edward C. Bernard |
| | Edward C. Bernard |
| | Principal Executive Officer |
| |
| Date February 6, 2015 | | |
| |
| |
| By | /s/ Gregory K. Hinkle |
| | Gregory K. Hinkle |
| | Principal Financial Officer |
| |
| Date February 6, 2015 | | |