| UNITED STATES |
| SECURITIES AND EXCHANGE COMMISSION |
| Washington, D.C. 20549 |
| |
FORM N-CSR |
| |
CERTIFIED SHAREHOLDER REPORT OF REGISTERED |
MANAGEMENT INVESTMENT COMPANIES |
| |
| |
| |
| Investment Company Act File Number: 811-07145 |
|
| |
| T. Rowe Price International Series, Inc. |
|
| (Exact name of registrant as specified in charter) |
| |
| 100 East Pratt Street, Baltimore, MD 21202 |
|
| (Address of principal executive offices) |
| |
| David Oestreicher |
| 100 East Pratt Street, Baltimore, MD 21202 |
|
| (Name and address of agent for service) |
| |
| |
| Registrant’s telephone number, including area code: (410) 345-2000 |
| |
| |
| Date of fiscal year end: December 31 |
| |
| |
| Date of reporting period: December 31, 2010 |
Item 1: Report to Shareholders| International Stock Portfolio | December 31, 2010 |
• International stock markets were volatile but sharply higher in the final months of the reporting period.
• The portfolio outperformed its MSCI benchmark and generated returns that were generally in line with its Lipper peer group for the 6- and 12-month periods ended December 31, 2010.
• Our investment focus remains on companies with durable global franchises that can grow their earnings and cash flow at a double-digit rate over the long term.
• Our research is uncovering attractive growth opportunities across a broad array of international stock markets, and we remain especially encouraged by the prospects for emerging markets.
The views and opinions in this report were current as of December 31, 2010. They are not guarantees of performance or investment results and should not be taken as investment advice. Investment decisions reflect a variety of factors, and the managers reserve the right to change their views about individual stocks, sectors, and the markets at any time. As a result, the views expressed should not be relied upon as a forecast of the fund’s future investment intent. The report is certified under the Sarbanes-Oxley Act, which requires mutual funds and other public companies to affirm that, to the best of their knowledge, the information in their financial reports is fairly and accurately stated in all material respects.
Manager’s Letter
T. Rowe Price International Stock Portfolio
Dear Investor
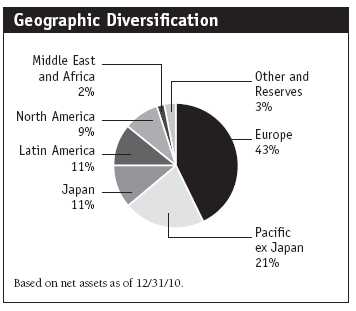
We are pleased to report favorable results for the 6- and 12-month periods ended December 31, 2010. The portfolio’s outperformance of its index was in large part due to our talented research team and our disciplined stock selection process. In the past six months, we did a good job of selecting stocks in Europe and Japan. We believe emerging economies offer strong growth prospects over the intermediate and longer term, and that emphasis also produced solid results. The portfolio remains broadly diversified across regions, countries, and sectors and focused on companies with the best long-term growth prospects.

The International Stock Portfolio generated a strong 27.09% return for the six months and a 14.46% gain for the year ended December 31, 2010. As shown in the Performance Comparison table, the portfolio performed in line with its Lipper peer group average and outperformed the benchmark MSCI All Country World ex-U.S.A. Index. Our performance versus the MSCI index benefited from strong stock selection in the materials, energy, and consumer staples sectors over the past six months. However, stock selection and our overweight allocation in the consumer discretionary sector detracted from relative results. On a regional basis, stock selection in Europe (ex U.K.) and the U.S. generated strong contributions to relative performance, while our holdings in the Asia (ex Japan) region detracted from relative results Overall, stock selection and allocation decisions were beneficial in our comparison with the MSCI benchmark over the last six months.
Portfolio Strategy
Our core investment philosophy is to buy and hold high-quality growth companies, especially those with a competitive advantage in their respective markets. Since the bear market low in early 2009, the portfolio has delivered unusually strong results. Your portfolio focuses on long-term performance and avoids fad investments and momentum trading. We believe that over the long term, stock prices move with earnings and cash flow growth, meaning simply that if a company grows free cash flow by 15% a year, its stock should appreciate at roughly the same rate. We search for companies we think can generate double-digit earnings growth over time by participating in expanding markets, taking market share, or improving profitability faster than sales. We think that if we can find those companies and pay a fair price for their stocks, we can compound absolute returns at double-digit levels and provide solid long-term relative results.
We work with our industry analysts and other T. Rowe Price portfolio managers to find companies that fit these criteria. We look for the best stocks wherever we may find them rather than employing a regional, country, or sector focus. While we are mindful of the broad economic conditions in regions and countries, the portfolio’s composition is primarily determined by individual stock considerations.
Market Review
Six months ago, I wrote about the market’s extreme swings. I’m not sure if this is sad or funny, but most of the short-term prevailing sentiment that I referred to in the last letter has flip-flopped once again. Commodities have rebounded, Japan is now the market of doom, and Europe is now priced as though it will work its way through its austerity issues. QE2, which was once an acronym for a luxury cruise ship, is now an acronym for the second round of Federal Reserve quantitative easing. We question this monetary policy initiative, but market opinion seems to have blessed it. If I have learned only one thing in my 23 years of investing experience, it’s that when the market views all news as shades of good, it is time to be trimming, and when all the news is taken as shades of bad, it is time to be adding. I think the market’s rosy take on many of the recent events is reason for near-term caution. Accordingly, we have increased the portfolio’s cash reserves moderately. Overall, our intermediate-term view is that economies and earnings are improving, but we believe that progress is going to be made in fits and starts: moving forward, then pausing before moving forward again.
At this time, our investment decisions are being shaped by the following views:
• Economies and earnings are improving in most regions.
• Interest rates have remained low in mature markets but have been rising in developing markets, which could prove to be a near-term headwind for emerging countries.
• Consumer spending in emerging markets should continue to be a strong global growth driver.
• The turmoil in Greece and the resultant contagion in other European countries may not be resolved quickly and will slow growth for companies that operate in the region.
• Financials, especially in the banking segment, is likely to face higher capital requirements, which will undoubtedly mean more regulation and lower return on equity.
• Government policy decisions are increasingly affecting our investment decisions.
As bottom-up stock pickers, we analyze every company using several criteria. First, we determine the quality of its management, growth potential, fundamental merits, and ability to generate cash flow over time. We attempt to discern if the management team is effective in deploying its free cash flow. We also look to see if the company is taking market share and whether it has pricing power. Next, we analyze whether the stock, at current prices, offers a good risk/reward proposition over the next few years. Additionally, we are paying increasing attention to how government policy will affect companies in various regions and sectors. Balancing the answers to these questions shapes our buying and selling decisions and, ultimately, the size of the positions in the portfolio.
Market Environment
In our view, many similarities exist between the markets in Europe and the U.S. Both were hit hard in the economic downturn. Each has serious issues with its banking system, and both have struggled to some degree in addressing them this year. One of the biggest issues for Europe earlier in 2010 was currency weakness, although the euro rebounded as the period progressed. On the banking front, the fiscal crisis in Europe was somewhat worse than in the U.S. Several of the heavily indebted countries, including Greece, Ireland, Spain, and Portugal, began to put pressure on the European Union.
The worst of the sovereign debt crisis has passed, but we think some countries will be forced to restructure their debt in the future. Europe has done a reasonable job, at least for now, in dealing with the issue. Although the austerity programs that have been put in place in several countries are likely to lead to slower growth, we think that the European policymakers have made some good fiscal decisions.
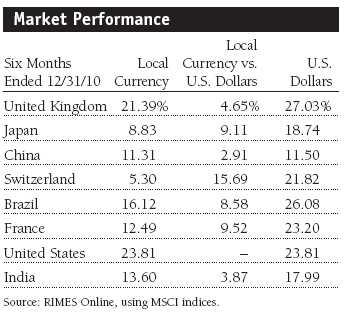
Japan’s economy continues to struggle. The strong yen has made exports more expensive. Because exports are a huge catalyst for the economy, the Bank of Japan launched a bond buying program to stimulate growth and drive the yen down. However, many of the large-cap, export-oriented companies came through the latest downturn in relatively good shape. Although Japanese stocks appear historically cheap in our view—profit margins and cash flows could be poised to turn higher—the economy’s lack of growth, long-term structural debt, and high unemployment are significant headwinds that need to be addressed.
The last month of the reporting period was very positive for Japanese and European stocks, which was a reversal from most of the prior 11 months. In fact, in many developed market countries, the lion’s share of the year’s gains came in December. Emerging markets, on the other hand, had been strong performers for most of the year but took a breather in the final quarter. Overall, emerging and developed markets posted similarly strong gains in the last six months, but emerging markets outperformed for the full year.
We believe that emerging markets have performed well because their companies are growing faster than those in most mature markets. This is particularly the case in Latin America and Asia, where many firms are increasing revenues by 25% or more per year. Our emerging markets exposure totals nearly one-third of the portfolio. Additionally, many of our holdings based in developed markets generate a portion of their sales and earnings from emerging countries. There are pockets of strength in developed markets, but it’s more of a mixed bag.
The European sovereign debt crisis was in some ways a positive for emerging markets because it eased some of the inflation pressures. While we continue to have concerns about near-term inflation (a factor that hampered emerging markets’ returns in the final months of the period), we think that emerging markets equities will benefit over the intermediate term from modest economic growth in the U.S., Europe, and Japan. If, as we expect, these conditions play out, the longer-term environment for emerging markets investing remains promising.
Portfolio Review
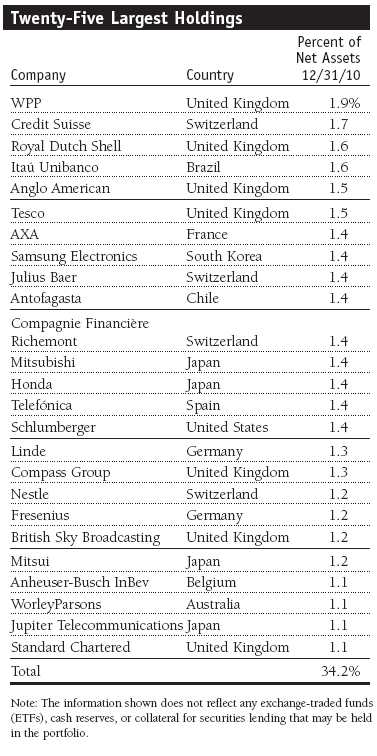
Domestic consumption in emerging markets was our best investment theme this year. We think it could remain a source of market strength for the next three to five years and possibly longer. The divergence between emerging markets consumer stocks and the “old economy” market segments has been cavernous over the last 12 months. For example, Brazil’s second-largest retailer, Lojas Renner, nearly doubled since we purchased it in January. In the same span, longtime portfolio holding and onetime highflier Petroleo Brasileiro declined about 17%. Within emerging markets, the performance difference over the past year between export commodity stocks and domestic consumer stocks was likely the largest in the last 10 years. In Brazil, the government is making sure that wages go up, which is benefiting consumer spending, and it is taxing some of its resource base, which has hurt commodity-related stocks. (Please refer to the portfolio of investments for a complete listing of holdings and the amount each represents in the portfolio.)
We have witnessed a complete rerating in several sectors and across different regions. When a broad swath of investors embrace an investment theme that is somewhat open-ended, its valuations can go sky-high. For example, a few years ago, Chinese banks traded at about 13 times earnings and consumer stocks were priced near 15 times earnings. Currently, Chinese banks trade near 10 times earnings and China’s consumer stocks are quoted at about a 20 multiple. The consumer theme in China has benefited from the government’s five-year policy to bolster consumer spending. This situation is not unique to China and exists in several other emerging markets. In the near term, these higher valuations could limit the price appreciation in some consumer stocks.
Where We Were Positioned and Why
Our goal is to continually improve the quality of the companies that we own, and we remain vigilant in managing risks relative to the potential return of our holdings. Investing in European countries could remain challenging because governments in the region will need to focus on balance sheet repair at the expense of economic growth. We were somewhat underweight in Europe, but it was not because we thought the euro would weaken or its troubles would spread. It was largely because we found more compelling opportunities in other regions.
Consumer discretionary was the portfolio’s best-performing sector for the past six and 12 months and its largest overweight allocation at the end of the reporting period. Switzerland-based Compagnie Financière Richemont, one of the world’s premiere luxury goods companies with brands including Cartier and Van Cleef & Arpels, surged during the reporting period. Sales of the company’s high-end jewelry, watches, writing instruments, and clothing benefited as stock markets rebounded and sentiment improved about future economic growth. Similarly, Ctrip. com International, a Chinese provider of discount hotel reservations, airline tickets, and package tours, posted good revenues and earnings over the last six months thanks in part to improved consumer spending. The portfolio also generated good results from Honda and Carnival Cruise Lines, a pair of recent purchases.
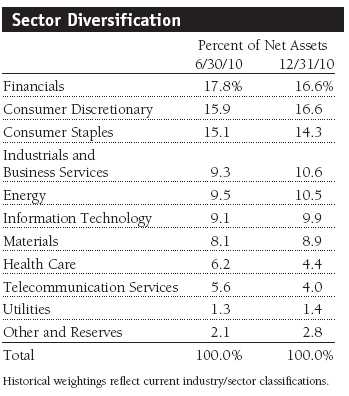
Several of our holdings in consumer staples also generated good results over the last 12 months. Portuguese retailer Jerónimo Martins was a standout contributor for the last six months and the year. The company operates convenience stores and supermarket chains in Portugal and Poland and is involved in food distribution and consumer products manufacturing. A little more than a year ago, we established a large position in Anheuser-Busch InBev, and the stock has also been a strong contributor.
The fund’s best contributor since the end of June was materials holding Antofagasta, the Chilean copper mining company and railroad network operator in Chile, Bolivia, and Peru. Potash Corporation of Saskatchewan, the Canadian fertilizer manufacturer that we purchased earlier this year, was another top performer.
Energy stocks, which had been our worst performers early in the year, recovered nicely in the second half. We generated decent 12-month results from several new positions, including CNOOC and Tullow Oil. Longtime holding Royal Dutch Shell and BP were good contributors in the past six months, and stock selection within the sector was beneficial.
Although every sector in the portfolio generated positive absolute performance in the last six months, the industrials and business services and information technology sectors were detractors from relative returns due to stock selection. Indian holding Jaiprakash Associates has been a prime beneficiary of infrastructure spending and continues to take market share in its segment. Although it generated disappointing results in the last six months and for the year, we believe it will be a good longer-term performer as projects are completed and earnings accelerate. In the technology sector, software holdings were weakest. Autonomy and Alibaba.com were among the few stocks that declined during the past six months. We eliminated our position in Nintendo.
Investment Outlook
In hindsight, we could have been more aggressive and done a better job of taking advantage of the low valuations in the market during the past six months. However, we continue to see some dark clouds on the intermediate- term horizon. We believe that non-U.S. stocks are likely to generate positive results in 2011, but returns will be choppy. Fortunately, we are bottom-up investors and invest for the long term, making only modest tactical allocation shifts around our big-picture thoughts.
As always, we remain focused on owning companies that have solid balance sheets and are able to take market share. We believe that thorough fundamental research will be critical to investment success. We think that over the next few years, non-U.S. markets are likely to generate more normal returns than the outsized gains we have enjoyed for the past two years. However, earnings are improving around the globe, and it appears that interest rates are going to stay low in mature markets for another year. We like the prospects for emerging markets over the long term, but we are in a period when inflation pressures could limit returns.
Respectfully submitted,

Robert W. Smith
Chairman of the Investment Advisory Committee
January 7, 2011
The committee chairman has day-to-day responsibility for managing the portfolio and works with committee members in developing and executing its investment program.
| Risks of International Investing |
Portfolios that invest overseas generally carry more risk than those that invest strictly in U.S. assets. Portfolios investing in a single country or in a limited geographic region tend to be riskier than more-diversified portfolios. Risks can result from varying stages of economic and political development; differing regulatory environments, trading days, and accounting standards; and higher transaction costs of non-U.S. markets. Non-U.S. investments are also subject to currency risk, or a decline in the value of a foreign currency versus the U.S. dollar, which reduces the dollar value of securities denominated in that currency.
Lipper averages: The averages of available mutual fund performance returns for specified periods in defined categories as tracked by Lipper Inc.
MSCI All Country World ex-U.S.A. Index: An index that measures equity market performance of developed and emerging countries, excluding the U.S.
Portfolio Highlights
Performance and Expenses
T. Rowe Price International Stock Portfolio
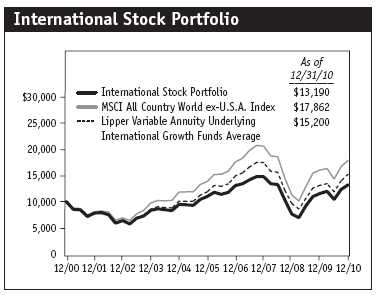
This chart shows the value of a hypothetical $10,000 investment in the portfolio over the past 10 fiscal year periods or since inception (for portfolios lacking 10-year records). The result is compared with benchmarks, which may include a broad-based market index and a peer group average or index. Market indexes do not include expenses, which are deducted from portfolio returns as well as mutual fund averages and indexes.

Fund Expense Example
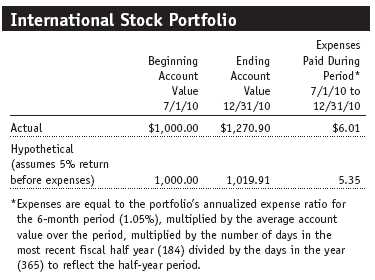
As a mutual fund shareholder, you may incur two types of costs: (1) transaction costs, such as redemption fees or sales loads, and (2) ongoing costs, including management fees, distribution and service (12b-1) fees, and other fund expenses. The following example is intended to help you understand your ongoing costs (in dollars) of investing in the fund and to compare these costs with the ongoing costs of investing in other mutual funds. The example is based on an investment of $1,000 invested at the beginning of the most recent six-month period and held for the entire period.
Actual Expenses
The first line of the following table (“Actual”) provides information about actual account values and actual expenses. You may use the information in this line, together with your account balance, to estimate the expenses that you paid over the period. Simply divide your account value by $1,000 (for example, an $8,600 account value divided by $1,000 = 8.6), then multiply the result by the number in the first line under the heading “Expenses Paid During Period” to estimate the expenses you paid on your account during this period.
Hypothetical Example for Comparison Purposes
The information on the second line of the table (“Hypothetical”) is based on hypothetical account values and expenses derived from the fund’s actual expense ratio and an assumed 5% per year rate of return before expenses (not the fund’s actual return). You may compare the ongoing costs of investing in the fund with other funds by contrasting this 5% hypothetical example and the 5% hypothetical examples that appear in the shareholder reports of the other funds. The hypothetical account values and expenses may not be used to estimate the actual ending account balance or expenses you paid for the period.
You should also be aware that the expenses shown in the table highlight only your ongoing costs and do not reflect any transaction costs, such as redemption fees or sales loads. Therefore, the second line of the table is useful in comparing ongoing costs only and will not help you determine the relative total costs of owning different funds. To the extent a fund charges transaction costs, however, the total cost of owning that fund is higher.
Financial Highlights
T. Rowe Price International Stock Portfolio
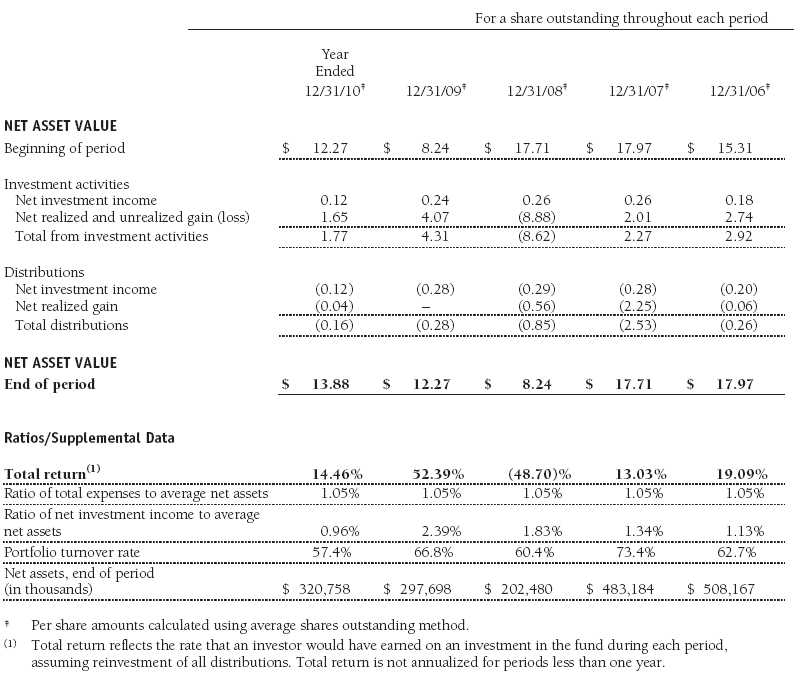
The accompanying notes are an integral part of these financial statements.
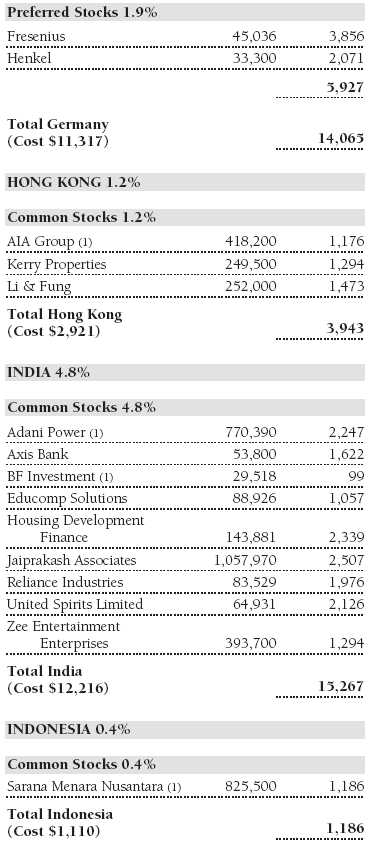
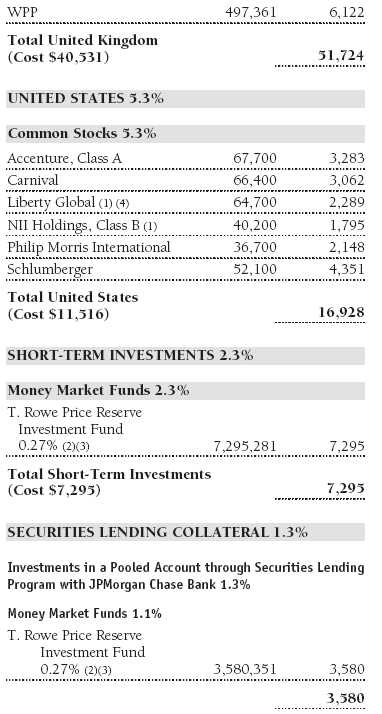
Portfolio of Investments‡
T. Rowe Price International Stock Portfolio
December 31, 2010


The accompanying notes are an integral part of these financial statements.
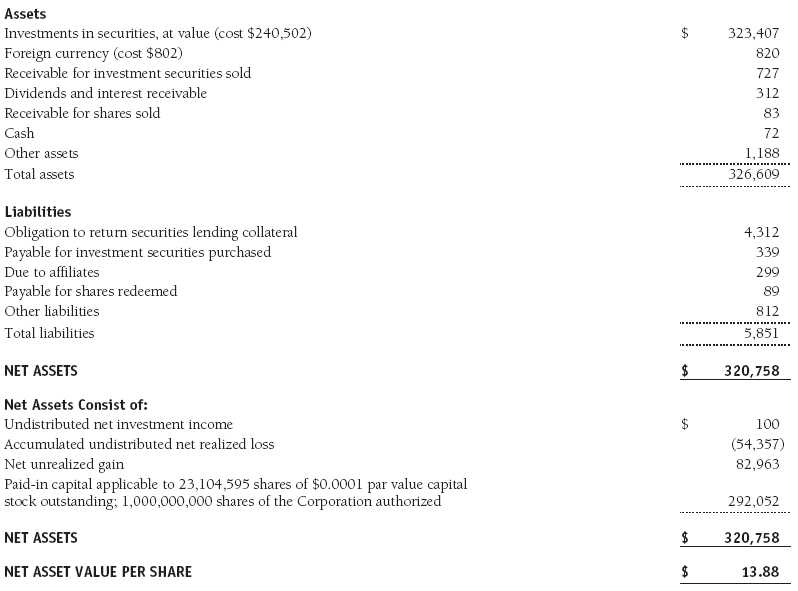
Statement of Assets and Liabilities
T. Rowe Price International Stock Portfolio
December 31, 2010
($000s, except shares and per share amounts)
The accompanying notes are an integral part of these financial statements.
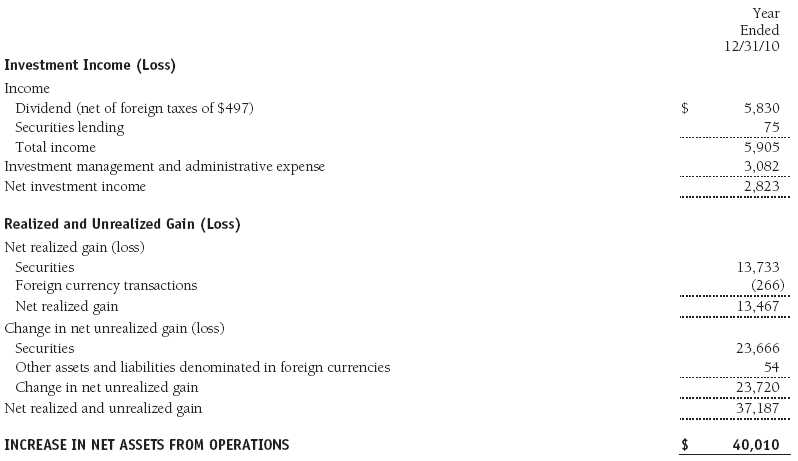
Statement of Operations
T. Rowe Price International Stock Portfolio
($000s)
The accompanying notes are an integral part of these financial statements.
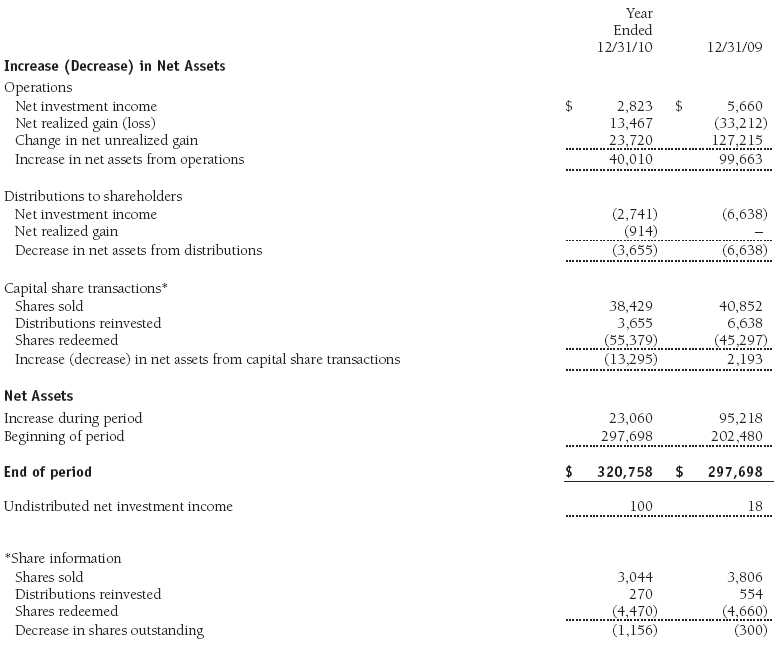
Statement of Changes in Net Assets
T. Rowe Price International Stock Portfolio
($000s)
The accompanying notes are an integral part of these financial statements.
Notes to Financial Statements
T. Rowe Price International Stock Portfolio
December 31, 2010
T. Rowe Price International Series, Inc. (the corporation), is registered under the Investment Company Act of 1940 (the 1940 Act). The International Stock Portfolio (the fund), a diversified, open-end management investment company, is one portfolio established by the corporation. The fund commenced operations on March 31, 1994. The fund seeks long-term growth of capital through investments primarily in the common stocks of established, non-U.S. companies. Shares of the fund are currently offered only through certain insurance companies as an investment medium for both variable annuity contracts and variable life insurance policies.
NOTE 1 - SIGNIFICANT ACCOUNTING POLICIES
Basis of Preparation The accompanying financial statements were prepared in accordance with accounting principles generally accepted in the United States of America (GAAP), which require the use of estimates made by fund management. Fund management believes that estimates and valuations are appropriate; however, actual results may differ from those estimates, and the valuations reflected in the accompanying financial statements may differ from the value ultimately realized upon sale or maturity.
Investment Transactions, Investment Income, and Distributions Income and expenses are recorded on the accrual basis. Premiums and discounts on debt securities are amortized for financial reporting purposes. Dividends received from mutual fund investments are reflected as dividend income; capital gain distributions are reflected as realized gain/loss. Dividend income and capital gain distributions are recorded on the ex-dividend date. Income tax-related interest and penalties, if incurred, would be recorded as income tax expense. Investment transactions are accounted for on the trade date. Realized gains and losses are reported on the identified cost basis. Distributions to shareholders are recorded on the ex-dividend date. Income distributions are declared and paid annually. Capital gain distributions, if any, are generally declared and paid by the fund annually.
Currency Translation Assets, including investments, and liabilities denominated in foreign currencies are translated into U.S. dollar values each day at the prevailing exchange rate, using the mean of the bid and asked prices of such currencies against U.S. dollars as quoted by a major bank. Purchases and sales of securities, income, and expenses are translated into U.S. dollars at the prevailing exchange rate on the date of the transaction. The effect of changes in foreign currency exchange rates on realized and unrealized security gains and losses is reflected as a component of security gains and losses.
New Accounting Pronouncement On January 1, 2010, the fund adopted new accounting guidance that requires enhanced disclosures about fair value measurements in the financial statements. Adoption of this guidance had no impact on the fund’s net assets or results of operations.
NOTE 2 - VALUATION
The fund’s financial instruments are reported at fair value as defined by GAAP. The fund determines the values of its assets and liabilities and computes its net asset value per share at the close of the New York Stock Exchange (NYSE), normally 4 p.m. ET, each day that the NYSE is open for business.
Valuation Methods Equity securities listed or regularly traded on a securities exchange or in the over-the-counter (OTC) market are valued at the last quoted sale price or, for certain markets, the official closing price at the time the valuations are made, except for OTC Bulletin Board securities, which are valued at the mean of the latest bid and asked prices. A security that is listed or traded on more than one exchange is valued at the quotation on the exchange determined to be the primary market for such security. Listed securities not traded on a particular day are valued at the mean of the latest bid and asked prices for domestic securities and the last quoted sale price for international securities. Debt securities with remaining maturities of less than one year at the time of acquisition generally use amortized cost in local currency to approximate fair value. However, if amortized cost is deemed not to reflect fair value or the fund holds a significant amount of such securities with remaining maturities of more than 60 days, the securities are valued at prices furnished by dealers who make markets in such securities or by an independent pricing service.
Investments in mutual funds are valued at the mutual fund’s closing net asset value per share on the day of valuation.
Other investments, including restricted securities, and those financial instruments for which the above valuation procedures are inappropriate or are deemed not to reflect fair value are stated at fair value as determined in good faith by the T. Rowe Price Valuation Committee, established by the fund’s Board of Directors.
For valuation purposes, the last quoted prices of non-U.S. equity securities may be adjusted under the circumstances described below. If the fund determines that developments between the close of a foreign market and the close of the NYSE will, in its judgment, materially affect the value of some or all of its portfolio securities, the fund will adjust the previous closing prices to reflect what it believes to be the fair value of the securities as of the close of the NYSE. In deciding whether it is necessary to adjust closing prices to reflect fair value, the fund reviews a variety of factors, including developments in foreign markets, the performance of U.S. securities markets, and the performance of instruments trading in U.S. markets that represent foreign securities and baskets of foreign securities. A fund may also fair value securities in other situations, such as when a particular foreign market is closed but the fund is open. The fund uses outside pricing services to provide it with closing prices and information to evaluate and/or adjust those prices. The fund cannot predict how often it will use closing prices and how often it will determine it necessary to adjust those prices to reflect fair value. As a means of evaluating its security valuation process, the fund routinely compares closing prices, the next day’s opening prices in the same markets, and adjusted prices.
Valuation Inputs Various inputs are used to determine the value of the fund’s financial instruments. These inputs are summarized in the three broad levels listed below:
Level 1 – quoted prices in active markets for identical financial instruments
Level 2 – observable inputs other than Level 1 quoted prices (including, but not limited to, quoted prices for similar financial instruments, interest rates, prepayment speeds, and credit risk)
Level 3 – unobservable inputs
Observable inputs are those based on market data obtained from sources independent of the fund, and unobservable inputs reflect the fund’s own assumptions based on the best information available. The input levels are not necessarily an indication of the risk or liquidity associated with financial instruments at that level. For example, non-U.S. equity securities actively traded in foreign markets generally are reflected in Level 2 despite the availability of closing prices because the fund evaluates and determines whether those closing prices reflect fair value at the close of the NYSE or require adjustment, as described above. The following table summarizes the fund’s financial instruments, based on the inputs used to determine their values on December 31, 2010:

NOTE 3 - OTHER INVESTMENT TRANSACTIONS
Consistent with its investment objective, the fund engages in the following practices to manage exposure to certain risks and/or to enhance performance. The investment objective, policies, program, and risk factors of the fund are described more fully in the fund’s prospectus and Statement of Additional Information.
Emerging Markets At December 31, 2010, approximately 31% of the fund’s net assets were invested, either directly or through investments in T. Rowe Price institutional funds, in securities of companies located in emerging markets, securities issued by governments of emerging market countries, and/or securities denominated in or linked to the currencies of emerging market countries. Emerging market securities are often subject to greater price volatility, less liquidity, and higher rates of inflation than U.S. securities. In addition, emerging markets may be subject to greater political, economic and social uncertainty, and differing regulatory environments that may potentially impact the fund’s ability to buy or sell certain securities or repatriate proceeds to U.S. dollars.
Repurchase Agreements All repurchase agreements are fully collateralized by U.S. government securities. Collateral is in the possession of the fund’s custodian or, for tri-party agreements, the custodian designated by the agreement. Collateral is evaluated daily to ensure that its market value exceeds the delivery value of the repurchase agreements at maturity. Although risk is mitigated by the collateral, the fund could experience a delay in recovering its value and a possible loss of income or value if the counterparty fails to perform in accordance with the terms of the agreement.
Securities Lending The fund lends its securities to approved brokers to earn additional income. It receives as collateral cash and U.S. government securities valued at 102% to 105% of the value of the securities on loan. Cash collateral is invested by the fund’s lending agent(s) in accordance with investment guidelines approved by fund management. Although risk is mitigated by the collateral, the fund could experience a delay in recovering its securities and a possible loss of income or value if the borrower fails to return the securities or if collateral investments decline in value. Securities lending revenue recognized by the fund consists of earnings on invested collateral and borrowing fees, net of any rebates to the borrower and compensation to the lending agent. In accordance with GAAP, investments made with cash collateral are reflected in the accompanying financial statements, but collateral received in the form of securities are not. On December 31, 2010, the value of loaned securities was $4,176,000 and cash collateral investments totaled $4,312,000.
Other Purchases and sales of portfolio securities other than short-term securities aggregated $162,637,000 and $175,563,000, respectively, for the year ended December 31, 2010.
NOTE 4 - FEDERAL INCOME TAXES
No provision for federal income taxes is required since the fund intends to continue to qualify as a regulated investment company under Subchapter M of the Internal Revenue Code and distribute to shareholders all of its taxable income and gains. Distributions determined in accordance with federal income tax regulations may differ in amount or character from net investment income and realized gains for financial reporting purposes. Financial reporting records are adjusted for permanent book/tax differences to reflect tax character but are not adjusted for temporary differences.
The fund files U.S. federal, state, and local tax returns as required. The fund’s tax returns are subject to examination by the relevant tax authorities until expiration of the applicable statute of limitations, which is generally three years after the filing of the tax return but which can be extended to six years in certain circumstances. Tax returns for open years have incorporated no uncertain tax positions that require a provision for income taxes.
Distributions during the years ended December 31, 2010 and December 31, 2009, totaled $3,655,000 and $6,638,000, respectively, and were characterized as ordinary income for tax purposes. At December 31, 2010, the tax-basis cost of investments and components of net assets were as follows:

The difference between book-basis and tax-basis net unrealized appreciation (depreciation) is attributable to the deferral of losses from wash sales and the realization of unrealized gains/losses on passive foreign investment companies for tax purposes. The fund intends to retain realized gains to the extent of available capital loss carryforwards. During the year ended December 31, 2010, the fund utilized $12,028,000 of capital loss carryforwards. The fund’s unused capital loss carryforwards as of December 31, 2010, all expire in fiscal 2017. In accordance with federal income tax regulations applicable to investment companies, recognition of capital and/or currency losses on certain transactions realized between November 1 and the fund’s fiscal year-end is deferred for tax purposes until the subsequent year (post-October loss deferrals); however, such losses are recognized for financial reporting purposes in the year realized.
NOTE 5 - FOREIGN TAXES
The fund is subject to foreign income taxes imposed by certain countries in which it invests. Acquisition of certain foreign currencies related to security transactions are also subject to tax. Additionally, capital gains realized by the fund upon disposition of securities issued in or by certain foreign countries are subject to capital gains tax imposed by those countries. All taxes are computed in accordance with the applicable foreign tax law, and, to the extent permitted, capital losses are used to offset capital gains. Taxes attributable to income are accrued by the fund as a reduction of income. Taxes incurred on the purchase of foreign currencies are recorded as realized loss on foreign currency transactions. Current and deferred tax expense attributable to net capital gains is reflected as a component of realized and/or change in unrealized gain/loss on securities in the accompanying financial statements. At December 31, 2010, the fund had no deferred tax liability attributable to foreign securities and $3,595,000 of foreign capital loss carryforwards, including $555,000 that expire in 2011, $1,332,000 that expire in 2012, $54,000 that expire in 2013, $740,000 that expire in 2017, and $914,000 that expire in 2018.
NOTE 6 - RELATED PARTY TRANSACTIONS
The fund is managed by T. Rowe Price International, Inc. (the manager), a wholly owned subsidiary of T. Rowe Price Associates, Inc. (Price Associates), which is wholly owned by T. Rowe Price Group, Inc. The investment management and administrative agreement between the fund and the manager provides for an all-inclusive annual fee equal to 1.05% of the fund’s average daily net assets. The fee is computed daily and paid monthly. The all-inclusive fee covers investment management, shareholder servicing, transfer agency, accounting, and custody services provided to the fund, as well as fund directors’ fees and expenses; interest, taxes, brokerage commissions, and extraordinary expenses are paid directly by the fund.
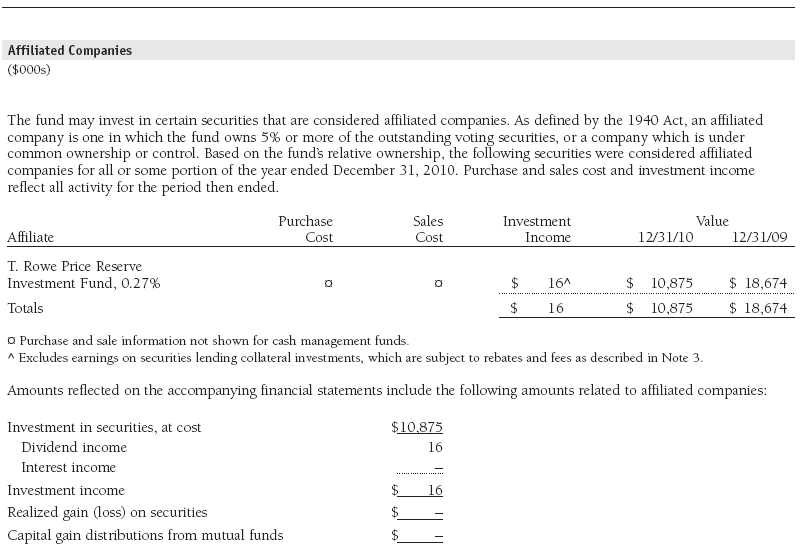
The fund may invest in the T. Rowe Price Reserve Investment Fund and the T. Rowe Price Government Reserve Investment Fund (collectively, the T. Rowe Price Reserve Investment Funds), open-end management investment companies managed by Price Associates and considered affiliates of the fund. The T. Rowe Price Reserve Investment Funds are offered as cash management options to mutual funds, trusts, and other accounts managed by Price Associates and/or its affiliates and are not available for direct purchase by members of the public. The T. Rowe Price Reserve Investment Funds pay no investment management fees.
NOTE 7 - SUBSEQUENT EVENT
Effective at the close of business on December 31, 2010, T. Rowe Price International, Inc. (Price International) was merged into its parent company, Price Associates. Thereafter, Price Associates assumed responsibility for all of Price International’s existing investment management contracts, and Price International ceased all further operations. The corporate reorganization is designed to simplify Price Group’s corporate structure related to its international business and is intended to result in no material changes in the nature, quality, level or cost of services provided to the T. Rowe Price funds.
Report of Independent Registered Public Accounting Firm
To the Board of Directors of T. Rowe Price International Series, Inc. and
Shareholders of T. Rowe Price International Stock Portfolio
In our opinion, the accompanying statement of assets and liabilities, including the portfolio of investments, and the related statements of operations and of changes in net assets and the financial highlights present fairly, in all material respects, the financial position of T. Rowe Price International Stock Portfolio (one of the portfolios comprising T. Rowe Price International Series, Inc., hereafter referred to as the “Fund”) at December 31, 2010, the results of its operations for the year then ended, the changes in its net assets for each of the two years in the period then ended and the financial highlights for each of the five years in the period then ended, in conformity with accounting principles generally accepted in the United States of America. These financial statements and financial highlights (hereafter referred to as “financial statements”) are the responsibility of the Fund’s management; our responsibility is to express an opinion on these financial statements based on our audits. We conducted our audits of these financial statements in accordance with the standards of the Public Company Accounting Oversight Board (United States). Those standards require that we plan and perform the audit to obtain reasonable assurance about whether the financial statements are free of material misstatement. An audit includes examining, on a test basis, evidence supporting the amounts and disclosures in the financial statements, assessing the accounting principles used and significant estimates made by management, and evaluating the overall financial statement presentation. We believe that our audits, which included confirmation of securities at December 31, 2010 by correspondence with the custodian and brokers, and confirmation of the underlying funds by correspondence with the transfer agent, provide a reasonable basis for our opinion.
PricewaterhouseCoopers LLP
Baltimore, Maryland
February 11, 2011
| Tax Information (Unaudited) for the Tax Year Ended 12/31/10 |
We are providing this information as required by the Internal Revenue Code. The amounts shown may differ from those elsewhere in this report because of differences between tax and financial reporting requirements.
The fund’s distributions to shareholders included $914,000 from short-term capital gains.
For taxable non-corporate shareholders, $4,138,000 of the fund’s income represents qualified dividend income subject to the 15% rate category.
For corporate shareholders, $130,000 of the fund’s income qualifies for the dividends-received deduction.
The fund will pass through foreign source income of $4,069,000 and foreign taxes paid of $414,000.
| Information on Proxy Voting Policies, Procedures, and Records |
A description of the policies and procedures used by T. Rowe Price funds and portfolios to determine how to vote proxies relating to portfolio securities is available in each fund’s Statement of Additional Information, which you may request by calling 1-800-225-5132 or by accessing the SEC’s website, sec.gov. The description of our proxy voting policies and procedures is also available on our website, troweprice.com. To access it, click on the words “Our Company” at the top of our corporate homepage. Then, when the next page appears, click on the words “Proxy Voting Policies” on the left side of the page.
Each fund’s most recent annual proxy voting record is available on our website and through the SEC’s website. To access it through our website, follow the directions above, then click on the words “Proxy Voting Records” on the right side of the Proxy Voting Policies page.
| How to Obtain Quarterly Portfolio Holdings |
The fund files a complete schedule of portfolio holdings with the Securities and Exchange Commission for the first and third quarters of each fiscal year on Form N-Q. The fund’s Form N-Q is available electronically on the SEC’s website (sec.gov); hard copies may be reviewed and copied at the SEC’s Public Reference Room, 450 Fifth St. N.W., Washington, DC 20549. For more information on the Public Reference Room, call 1-800-SEC-0330.
| About the Portfolio’s Directors and Officers |
Your portfolio is overseen by a Board of Directors (Board) that meets regularly to review a wide variety of matters affecting the portfolio, including performance, investment programs, compliance matters, advisory fees and expenses, service providers, and other business affairs. The Board elects the portfolio’s officers, who are listed in the final table. At least 75% of the Board’s members are independent of T. Rowe Price Associates, Inc. (T. Rowe Price), and T. Rowe Price International Ltd (T. Rowe Price International); “inside” or “interested” directors are employees or officers of T. Rowe Price. The business address of each director and officer is 100 East Pratt Street, Baltimore, Maryland 21202. The Statement of Additional Information includes additional information about the portfolio directors and is available without charge by calling a T. Rowe Price representative at 1-800-225-5132.
| Independent Directors | |
| |
| Name (Year of Birth) | Principal Occupation(s) and Directorships of Public Companies and Other Investment Companies |
| Year Elected* | During the Past Five Years |
| | |
| William R. Brody, M.D., Ph.D. | President and Trustee, Salk Institute for Biological Studies (2009 to present); Director, Novartis, Inc. (2009 |
| (1944) | to present); Director, IBM (2007 to present); President and Trustee, Johns Hopkins University (1996 to 2009); |
| 2009 | Chairman of Executive Committee and Trustee, Johns Hopkins Health System (1996 to 2009); Director, Medtronic, |
| | Inc. (1998 to 2007); Director, Mercantile Bankshares (1997 to 2007) |
| | |
| Jeremiah E. Casey (1940) | Director, National Life Insurance (2001 to 2005); Director, NLV Financial Corporation (2004 to 2005) |
| 2006 | |
| | |
| Anthony W. Deering (1945) | Chairman, Exeter Capital, LLC, a private investment firm (2004 to present); Director, Under Armour (2008 to |
| 1994 | present); Director, Vornado Real Estate Investment Trust (2004 to present); Director, Mercantile Bankshares |
| | (2002 to 2007); Member, Advisory Board, Deutsche Bank North America (2004 to present) |
| | |
| Donald W. Dick, Jr. (1943) | Principal, EuroCapital Partners, LLC, an acquisition and management advisory firm (1995 to present) |
| 1994 | |
| | |
| Karen N. Horn (1943) | Senior Managing Director, Brock Capital Group, an advisory and investment banking firm (2004 to present); |
| 2003 | Director, Eli Lilly and Company (1987 to present); Director, Simon Property Group (2004 to present); Director, |
| | Norfolk Southern (2008 to present); Director, Fannie Mae (2006 to 2008); Director, Georgia Pacific (2004 to 2005) |
| | |
| Theo C. Rodgers (1941) | President, A&R Development Corporation (1977 to present) |
| 2006 | |
| | |
| John G. Schreiber (1946) | Owner/President, Centaur Capital Partners, Inc., a real estate investment company (1991 to present); Cofounder |
| 2001 | and Partner, Blackstone Real Estate Advisors, L.P. (1992 to present) |
| | |
| Mark R. Tercek (1957) | President and Chief Executive Officer, The Nature Conservancy (2008 to present); Managing Director, The Goldman |
| 2009 | Sachs Group, Inc. (1984 to 2008) |
| |
| *Each independent director oversees 128 T. Rowe Price portfolios and serves until retirement, resignation, or election of a successor. |
| | |
| Inside Directors | |
| |
| Name (Year of Birth) | |
| Year Elected* [Number of T. Rowe | Principal Occupation(s) and Directorships of Public Companies and Other Investment Companies |
| Price Portfolios Overseen] | During the Past Five Year |
| | |
| Edward C. Bernard (1956) | Director and Vice President, T. Rowe Price; Vice Chairman of the Board, Director, and Vice President, T. Rowe Price |
| 2006 [128] | Group, Inc.; Chairman of the Board, Director, and President, T. Rowe Price Investment Services, Inc.; Chairman |
| | of the Board and Director, T. Rowe Price Retirement Plan Services, Inc., T. Rowe Price Savings Bank, and T. Rowe |
| | Price Services, Inc.; Director and Chief Executive Officer, T. Rowe Price International; Chief Executive Officer, |
| | Chairman of the Board, Director, and President, T. Rowe Price Trust Company; Chairman of the Board, all funds |
| | |
| Brian C. Rogers, CFA, CIC (1955) | Chief Investment Officer, Director, and Vice President, T. Rowe Price; Chairman of the Board, Chief Investment |
| 2006 [73] | Officer, Director, and Vice President, T. Rowe Price Group, Inc.; Vice President, T. Rowe Price Trust Company |
| |
| *Each inside director serves until retirement, resignation, or election of a successor. |
| Officers | |
| |
| Name (Year of Birth) | |
| Position Held With | |
| International Series | Principal Occupation(s) |
| | |
| Christopher D. Alderson (1962) | Director and President-International Equity, T. Rowe Price International; Director and Vice President, Price Hong |
| President | Kong and Price Singapore; Vice President, T. Rowe Price Group, Inc. |
| | |
| Mark C.J. Bickford-Smith (1962) | Vice President, T. Rowe Price Group, Inc., and T. Rowe Price International |
| Vice President | |
| | |
| Richard N. Clattenburg, CFA (1979) | Vice President, T. Rowe Price and T. Rowe Price Group, Inc. |
| Vice President | |
| | |
| David J. Eiswert, CFA (1972) | Vice President, T. Rowe Price and T. Rowe Price Group, Inc. |
| Vice President | |
| | |
| Roger L. Fiery III, CPA (1959) | Vice President, Price Hong Kong, Price Singapore, T. Rowe Price, T. Rowe Price Group, Inc., T. Rowe Price |
| Vice President | International, and T. Rowe Price Trust Company |
| | |
| Robert N. Gensler (1957) | Vice President, T. Rowe Price, T. Rowe Price Group, Inc., and T. Rowe Price International |
| Vice President | |
| | |
| John R. Gilner (1961) | Chief Compliance Officer and Vice President, T. Rowe Price; Vice President, T. Rowe Price Group, Inc., and |
| Chief Compliance Officer | T. Rowe Price Investment Services, Inc. |
| | |
| Gregory S. Golczewski (1966) | Vice President, T. Rowe Price and T. Rowe Price Trust Company |
| Vice President | |
| | |
| M. Campbell Gunn (1956) | Vice President, T. Rowe Price Group, Inc., and T. Rowe Price International |
| Vice President | |
| | |
| Gregory K. Hinkle, CPA (1958) | Vice President, T. Rowe Price, T. Rowe Price Group, Inc., and T. Rowe Price Trust Company; formerly Partner, |
| Treasurer | PricewaterhouseCoopers LLP (to 2007) |
| | |
| Patricia B. Lippert (1953) | Assistant Vice President, T. Rowe Price and T. Rowe Price Investment Services, Inc. |
| Secretary | |
| | |
| David Oestreicher (1967) | Director and Vice President, T. Rowe Price Investment Services, Inc., T. Rowe Price Trust Company, T. Rowe Price |
| Vice President | Services, Inc.; Vice President, Price Hong Kong, Price Singapore, T. Rowe Price, T. Rowe Price Group, Inc., T. Rowe |
| | Price International, and T. Rowe Price Retirement Plan Services, Inc. |
| | |
| Gonzalo Pangaro, CFA (1968) | Vice President, T. Rowe Price Group, Inc., and T. Rowe Price International |
| Vice President | |
| | |
| Sebastian Schrott (1977) | Vice President, T. Rowe Price Group, Inc., and T. Rowe Price International |
| Vice President | |
| | |
| Deborah D. Seidel (1962) | Vice President, T. Rowe Price, T. Rowe Price Group, Inc., and T. Rowe Price |
| Vice President | Investment Services, Inc.; Vice President and Assistant Treasurer, T. Rowe |
| | Price Services, Inc. |
| | |
| Robert W. Smith (1961) | Vice President, T. Rowe Price, T. Rowe Price Group, Inc., and T. Rowe Price |
| Executive Vice President | Trust Company |
| | |
| Dean Tenerelli (1964) | Vice President, T. Rowe Price Group, Inc., and T. Rowe Price International |
| Vice President | |
| | |
| Julie L. Waples (1970) | Vice President, T. Rowe Price |
| Vice President | |
| |
| Unless otherwise noted, officers have been employees of T. Rowe Price or T. Rowe Price International for at least 5 years. |
Item 2. Code of Ethics.
The registrant has adopted a code of ethics, as defined in Item 2 of Form N-CSR, applicable to its principal executive officer, principal financial officer, principal accounting officer or controller, or persons performing similar functions. A copy of this code of ethics is filed as an exhibit to this Form N-CSR. No substantive amendments were approved or waivers were granted to this code of ethics during the period covered by this report.
Item 3. Audit Committee Financial Expert.
The registrant’s Board of Directors/Trustees has determined that Mr. Anthony W. Deering qualifies as an audit committee financial expert, as defined in Item 3 of Form N-CSR. Mr. Deering is considered independent for purposes of Item 3 of Form N-CSR.
Item 4. Principal Accountant Fees and Services.
(a) – (d) Aggregate fees billed to the registrant for the last two fiscal years for professional services rendered by the registrant’s principal accountant were as follows:

Audit fees include amounts related to the audit of the registrant’s annual financial statements and services normally provided by the accountant in connection with statutory and regulatory filings. Audit-related fees include amounts reasonably related to the performance of the audit of the registrant’s financial statements and specifically include the issuance of a report on internal controls and, if applicable, agreed-upon procedures related to fund acquisitions. Tax fees include amounts related to services for tax compliance, tax planning, and tax advice. The nature of these services specifically includes the review of distribution calculations and the preparation of Federal, state, and excise tax returns. All other fees include the registrant’s pro-rata share of amounts for agreed-upon procedures in conjunction with service contract approvals by the registrant’s Board of Directors/Trustees.
(e)(1) The registrant’s audit committee has adopted a policy whereby audit and non-audit services performed by the registrant’s principal accountant for the registrant, its investment adviser, and any entity controlling, controlled by, or under common control with the investment adviser that provides ongoing services to the registrant require pre-approval in advance at regularly scheduled audit committee meetings. If such a service is required between regularly scheduled audit committee meetings, pre-approval may be authorized by one audit committee member with ratification at the next scheduled audit committee meeting. Waiver of pre-approval for audit or non-audit services requiring fees of a de minimis amount is not permitted.
(2) No services included in (b) – (d) above were approved pursuant to paragraph (c)(7)(i)(C) of Rule 2-01 of Regulation S-X.
(f) Less than 50 percent of the hours expended on the principal accountant’s engagement to audit the registrant’s financial statements for the most recent fiscal year were attributed to work performed by persons other than the principal accountant’s full-time, permanent employees.
(g) The aggregate fees billed for the most recent fiscal year and the preceding fiscal year by the registrant’s principal accountant for non-audit services rendered to the registrant, its investment adviser, and any entity controlling, controlled by, or under common control with the investment adviser that provides ongoing services to the registrant were $1,417,000 and $1,879,000, respectively.
(h) All non-audit services rendered in (g) above were pre-approved by the registrant’s audit committee. Accordingly, these services were considered by the registrant’s audit committee in maintaining the principal accountant’s independence.
Item 5. Audit Committee of Listed Registrants.
Not applicable.
Item 6. Investments.
(a) Not applicable. The complete schedule of investments is included in Item 1 of this Form N-CSR.
(b) Not applicable.
Item 7. Disclosure of Proxy Voting Policies and Procedures for Closed-End Management Investment Companies.
Not applicable.
Item 8. Portfolio Managers of Closed-End Management Investment Companies.
Not applicable.
Item 9. Purchases of Equity Securities by Closed-End Management Investment Company and Affiliated Purchasers.
Not applicable.
Item 10. Submission of Matters to a Vote of Security Holders.
Not applicable.
Item 11. Controls and Procedures.
(a) The registrant’s principal executive officer and principal financial officer have evaluated the registrant’s disclosure controls and procedures within 90 days of this filing and have concluded that the registrant’s disclosure controls and procedures were effective, as of that date, in ensuring that information required to be disclosed by the registrant in this Form N-CSR was recorded, processed, summarized, and reported timely.
(b) The registrant’s principal executive officer and principal financial officer are aware of no change in the registrant’s internal control over financial reporting that occurred during the registrant’s second fiscal quarter covered by this report that has materially affected, or is reasonably likely to materially affect, the registrant’s internal control over financial reporting.
Item 12. Exhibits.
(a)(1) The registrant’s code of ethics pursuant to Item 2 of Form N-CSR is attached.
(2) Separate certifications by the registrant's principal executive officer and principal financial officer, pursuant to Section 302 of the Sarbanes-Oxley Act of 2002 and required by Rule 30a-2(a) under the Investment Company Act of 1940, are attached.
(3) Written solicitation to repurchase securities issued by closed-end companies: not applicable.
(b) A certification by the registrant's principal executive officer and principal financial officer, pursuant to Section 906 of the Sarbanes-Oxley Act of 2002 and required by Rule 30a-2(b) under the Investment Company Act of 1940, is attached.
| | |
SIGNATURES |
| |
| | Pursuant to the requirements of the Securities Exchange Act of 1934 and the Investment |
| Company Act of 1940, the registrant has duly caused this report to be signed on its behalf by the |
| undersigned, thereunto duly authorized. |
| |
| T. Rowe Price International Series, Inc. |
| |
| |
| |
| By | /s/ Edward C. Bernard |
| | Edward C. Bernard |
| | Principal Executive Officer |
| |
| Date | February 11, 2011 |
| |
| |
| |
| | Pursuant to the requirements of the Securities Exchange Act of 1934 and the Investment |
| Company Act of 1940, this report has been signed below by the following persons on behalf of |
| the registrant and in the capacities and on the dates indicated. |
| |
| |
| By | /s/ Edward C. Bernard |
| | Edward C. Bernard |
| | Principal Executive Officer |
| |
| Date | February 11, 2011 |
| |
| |
| |
| By | /s/ Gregory K. Hinkle |
| | Gregory K. Hinkle |
| | Principal Financial Officer |
| |
| Date | February 11, 2011 |