| UNITED STATES |
| SECURITIES AND EXCHANGE COMMISSION |
| Washington, D.C. 20549 |
| |
FORM N-CSR |
| |
CERTIFIED SHAREHOLDER REPORT OF REGISTERED |
MANAGEMENT INVESTMENT COMPANIES |
| |
| |
| |
| Investment Company Act File Number: 811-07143 |
|
| |
| T. Rowe Price Equity Series, Inc. |
|
| (Exact name of registrant as specified in charter) |
| |
| 100 East Pratt Street, Baltimore, MD 21202 |
|
| (Address of principal executive offices) |
| |
| David Oestreicher |
| 100 East Pratt Street, Baltimore, MD 21202 |
|
| (Name and address of agent for service) |
| |
| |
| Registrant’s telephone number, including area code: (410) 345-2000 |
| |
| |
| Date of fiscal year end: December 31 |
| |
| |
| Date of reporting period: June 30, 2010 |
Item 1: Report to Shareholders| Equity Index 500 Portfolio | June 30, 2010 |
• U.S. equities declined amid renewed concerns about economic growth and the fallout from the European debt crisis.
• Every sector in the S&P 500 Index declined in the last six months. The Equity Index 500 Portfolio’s results generally tracked its unmanaged benchmark.
• Pressures on U.S. economic growth have picked up due to high unemployment, slumping housing prices, and lower consumer spending.
• Although the economy remains fragile, the financial markets appear to be healing. Using full-replication and sampling strategies, we keep the compositions and other attributes of the portfolio similar to those of its benchmark.
The views and opinions in this report were current as of June 30, 2010. They are not guarantees of performance or investment results and should not be taken as investment advice. Investment decisions reflect a variety of factors, and the managers reserve the right to change their views about individual stocks, sectors, and the markets at any time. As a result, the views expressed should not be relied upon as a forecast of the fund’s future investment intent. The report is certified under the Sarbanes-Oxley Act, which requires mutual funds and other public companies to affirm that, to the best of their knowledge, the information in their financial reports is fairly and accurately stated in all material respects.
Manager’s Letter
T. Rowe Price Equity Index 500 Portfolio
Dear Investor
The global economic recovery began to falter in the last six months under the increasing strain of too much debt and too little spending. Developed countries from Europe to the United States were dealing with the classic conundrum following a financial crisis—how to rein in spiraling debt, which saps long-term growth, while spending enough to pull industries, workers, and consumers out of economic malaise. As the period drew to a close, it became abundantly clear that the road to a sustainable economic recovery would continue to come in fits and starts. As a result, the Equity Index 500 Portfolio posted losses over the past six months, closely tracking the returns of its S&P benchmark.
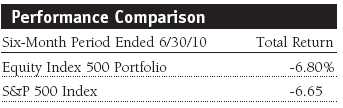
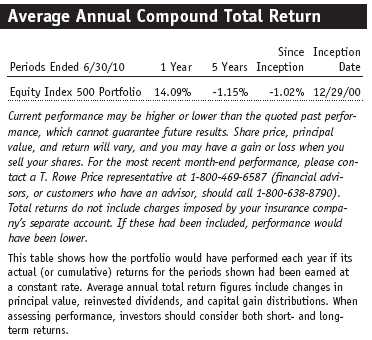
The portfolio returned -6.80% for the first six months of 2010. As shown in the Performance Comparison table, the portfolio’s return closely tracked the performance of its benchmark, the S&P 500 Index. Portfolio performance tends to lag that of the benchmark due to operating and management expenses.
Market Environment
U.S. stocks got off to a solid start at the beginning of the year. The rally in equities that began in March 2009 showed impressive resilience as credit markets improved and corporations reported robust earnings. Payrolls grew at their fastest pace in four years in April, which suggested that the labor market had turned a long-awaited corner. The major U.S. stock indexes reached pre-crisis levels, though they remained well off their 2007 all-time highs. But in May, private sector hiring unexpectedly fell back sharply, and investors grew worried that job growth had stalled. The housing market appeared to lose momentum as well, with sales of existing and new homes falling. Concerned about their jobs and home values, Americans kept their spending to a minimum, which further weighed on growth. The manufacturing and services sectors, which had seen a steady rise in their respective stocks since the recovery began in 2009, continued to improve in June but at a slower-than-expected rate.
Investors also grew increasingly concerned about the debt problems plaguing European countries. Greece’s debt was downgraded to junk status, while Portugal and Spain also suffered ratings downgrades. The International Monetary Fund, the European Union, and the European Central Bank unveiled a nearly $1 trillion rescue package in early May. These measures moderated the sell-off in European equities. But as the dust settled, it became clear that Europe’s problems might weigh on global growth. Worries that China might be in danger of a slowdown or vulnerable to runaway inflation also stoked investor anxiety. Slowing growth in the U.S. and challenges overseas prompted the Federal Reserve to acknowledge that the recovery had stalled. It maintained the fed funds target rate in a range of 0.00% to 0.25%. However, despite persistent concerns about deflation, or price declines, the Fed made no additional moves to stimulate growth, such as buying longer-term government or private sector debt, as some policymakers have suggested.
The broad stock indexes finished the period with declines, though smaller companies held up much better than larger stocks. As measured by various Russell indexes, value stocks outperformed growth stocks across all market capitalizations. All sectors in the S&P 500 Index declined in the period. Materials, energy, and information technology were the weakest sectors, while industrials, consumer discretionary, and consumer staples declined the least.
Portfolio and Performance Review
The T. Rowe Price Equity Index 500 Portfolio is designed for investors who want to harness the potential for long-term capital appreciation from broad exposure to large-cap stocks. The portfolio could serve as a core holding in an investor’s portfolio, as it offers attributes that many investors will find appealing.
• It is well diversified, which can reduce the potentially negative impact of a given stock on the entire portfolio. The portfolio invests in all S&P 500 Index stocks.
• It tends to closely track its benchmark. The portfolio uses a full-replication strategy so that the weightings of our holdings match those of the S&P 500 Index. We occasionally invest in securities such as futures and exchange-traded funds (ETFs) so that the portfolio can accommodate cash flows and remain fully invested.
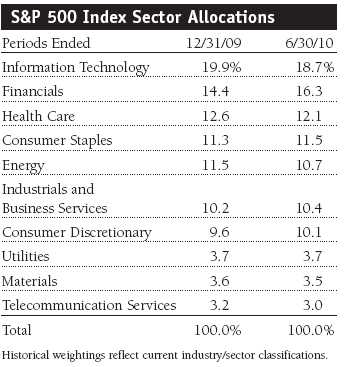
• It offers instant, broad exposure to different sectors of the stock market, and the portfolio’s sector allocations are consistent with its benchmark’s sector breakdown. As such, changes in the sector diversification and other overall characteristics will reflect changes in the composition of the index, rather than strategic shifts that are typical of an actively managed portfolio.

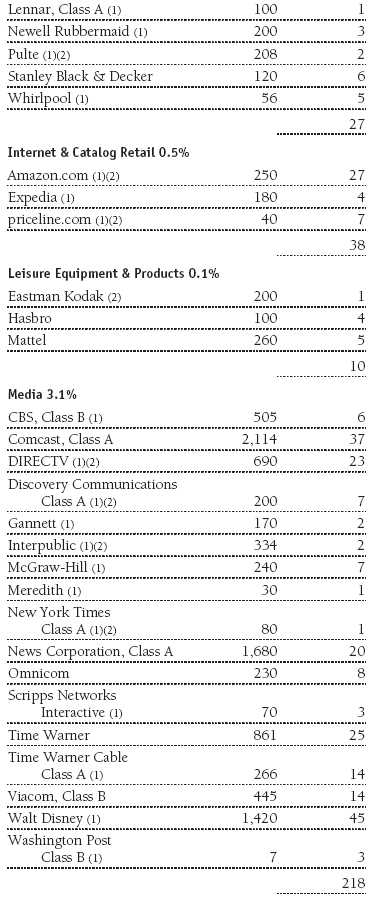
Each of the 10 major sectors in the S&P 500 declined for the six-month period. Materials led the sell-off amid weakening economic conditions, closely followed by energy stocks, which suffered from the stalling economy as well as the fallout from the Gulf oil spill and low inflation. Information technology, which experienced strong performance last year, fell sharply amid the expectation that sales would remain flat. As the cyclical recovery lost steam, consumer-oriented companies held up the best. Perhaps surprisingly, consumer discretionary spending fell only slightly, which offered some hope that negative consumer sentiment is a temporary response to the myriad negative financial news reports of the last several months.
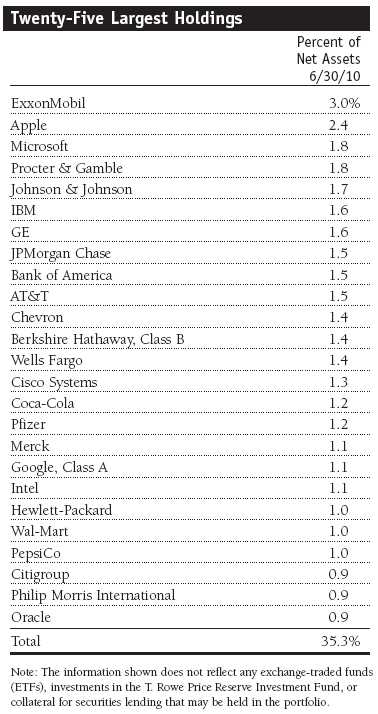
Information technology, the largest sector, composes about 19% of the portfolio. The sector lost ground in the last six months due to the expected slowdown in business and consumer spending. The software industry turned in a poor performance as Microsoft struggled due to concerns about the potential impact of weakness in Europe on personal computer demand. Nevertheless, the infrastructure software company should benefit from an upcoming corporate PC upgrade cycle and the continued adoption of Windows 7, as well as the launch of Office 2010. Semiconductors and semiconductor equipment companies were also hurt by business spending. While the overall IT sector struggled, computers and peripherals was the portfolio’s strongest-performing industry. Apple continued to post impressive gains and was the portfolio’s top contributor. The company has generated increasing profits during the year due to its strong sales of the iPhone and iPad. Internet giant Google, which benefited from a strong global resurgence in advertising sales last year, saw slowing growth as the economic recovery stalled. But the search business is continuing to grow, and Google should be a major beneficiary of that trend. (Please refer to the portfolio of investments for a complete listing of holdings and the amount each represents in the portfolio.)
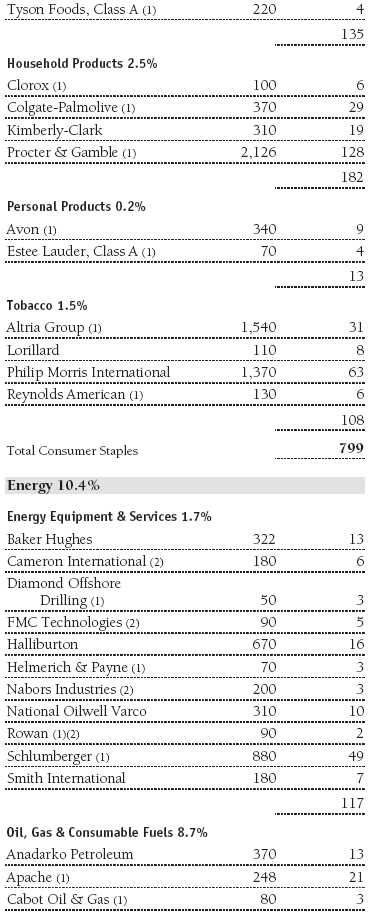
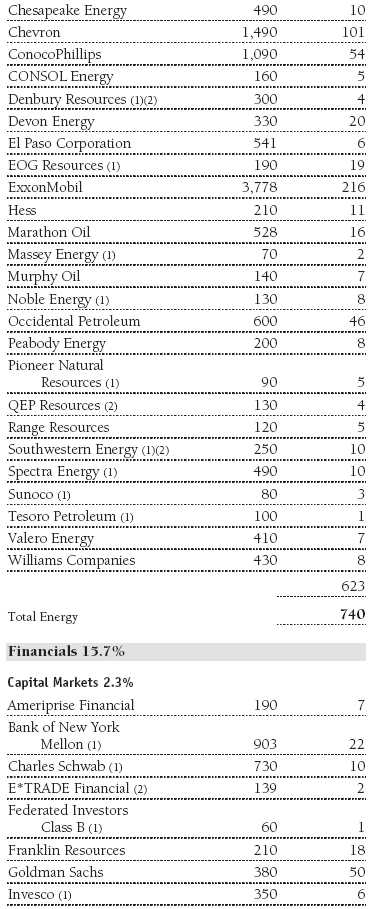
The energy sector was hard hit amid the fallout from the oil spill in the Gulf of Mexico. ExxonMobil, the portfolio’s top holding, suffered a sharp decline as investors abandoned the oil, gas, and consumable fuels industry. The company also reported disappointing earnings due to less profitability in its operations and increasing health care costs. Chevron, another top holding in the portfolio, also declined sharply. The energy equipment and services industry fell as investors expected that lawsuits stemming from the oil spill would adversely affect industry profits for some time to come. These include companies involved in the engineering, execution, or manufacture of products used in the exploration, development, and transport of oil.
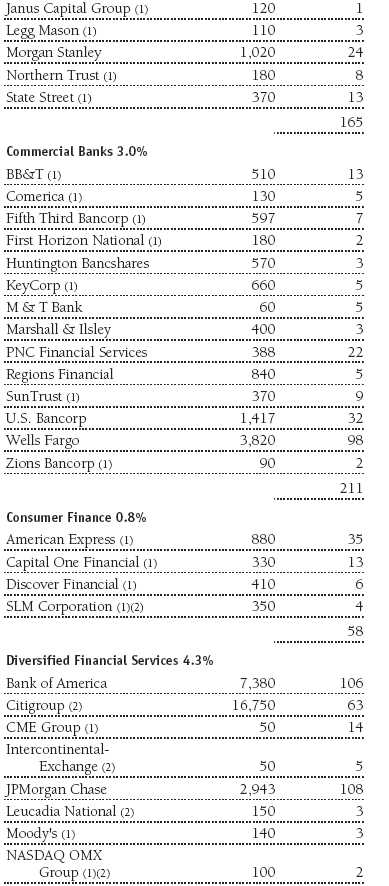
Financials weakened over the period due to the European debt crisis and the concern that the expected federal financial regulatory reform would curtail profits. JPMorgan Chase, Morgan Stanley, and Wells Fargo fell, as renewed questions about their involvement in the subprime market meltdown was highlighted by the government’s independent commission that is charged with determining the causes of the worst financial crisis since the Great Depression. Goldman Sachs was also summoned before the commission and fell sharply after the Securities and Exchange Commission issued a complaint against the company alleging unethical conduct. Investors feared that the secondary effects of the complaint—employee attrition and declining business—could hamper the company’s profits.
The materials sector is a relatively small component of the index, but its losses were a large contributor to portfolio weakness. Many of the companies in the sector, such as chemical company Monsanto and metals and mining giant Freeport McMoRan Copper & Gold, are multinationals that have considerable business interests in emerging markets, particularly China. When Beijing signaled its determination to scale back its robust growth—albeit slightly—investors grew nervous that spending would decline and corporate profits would, too.
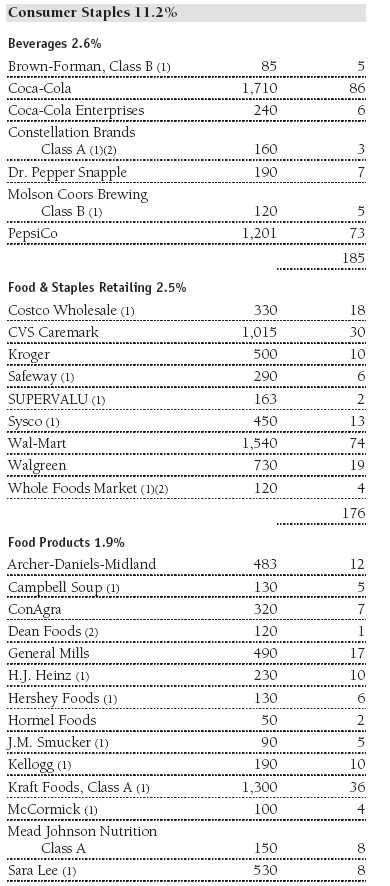
Consumer staples is considered a noncyclical sector that is somewhat impervious to the business cycle. But as the economy slowed, some of these companies, such as Wal-Mart, Philip Morris International, and Coca-Cola, fell. Procter & Gamble, another bellwether stock, also declined.
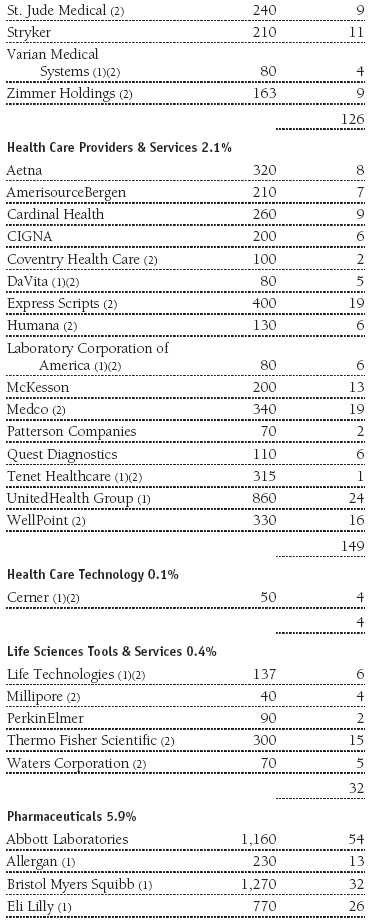
The remaining sectors of the index all suffered declines during the six months. In health care, pharmaceutical giant Pfizer fell sharply after disappointing earnings and the company’s announcement that it was suspending testing of an osteoarthritis drug treatment. Johnson & Johnson came under scrutiny due to quality control problems and the recall of popular over-the-counter drugs. Industrial conglomerate GE was a poor performer due to lower factory orders, sagging unemployment, and a retreating consumer.
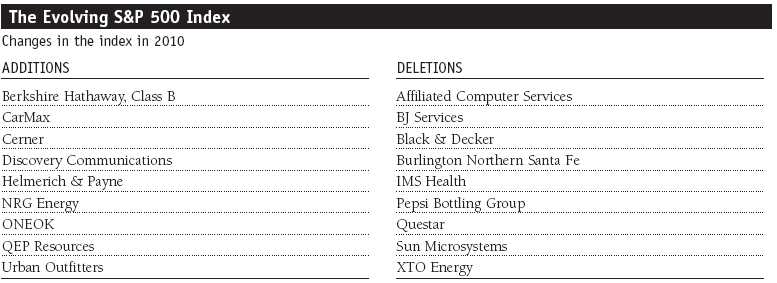
Standard & Poor’s authorized nine changes to the composition of the S&P 500 Index in the first half of 2010. Please see the table on page 5 for a complete list of index changes.
Outlook
Although the economy remains fragile, the financial markets appear to be healing. The key to ongoing economic growth is a recovery in the labor market, which we expect as the year progresses. We believe that growth in employment will be beneficial for companies in the consumer discretionary and financials sectors. Stock valuations are reasonable, especially in relation to today’s low interest rates. However, the economic recovery will be slow and uneven, and the Fed will likely keep monetary policy relaxed until it sees durable signs of employment growth or signs of inflation.
We will continue to focus on our role of replicating the structure and performance of the S&P index to provide you with broad exposure to large-cap U.S. stocks.
Respectfully submitted,

E. Frederick Bair
Cochairman of the Investment Advisory Committee

Ken D. Uematsu
Cochairman of the Investment Advisory Committee
July 14, 2010
The committee chairmen have day-to-day responsibility for managing the portfolio and work with committee members in developing and executing the portfolio’s investment program.
As with all stock mutual funds, the fund’s share price can fall because of weakness in the stock market, a particular industry, or specific holdings. Stock markets can decline for many reasons, including adverse political or economic developments, changes in investor psychology, or heavy institutional selling. The prospects for an industry or company may deteriorate because of a variety of factors, including disappointing earnings or changes in the competitive environment.
Fed funds target rate: An overnight lending rate set by the Federal Reserve and used by banks to meet reserve requirements. Banks also use the fed funds rate as a benchmark for their prime lending rates.
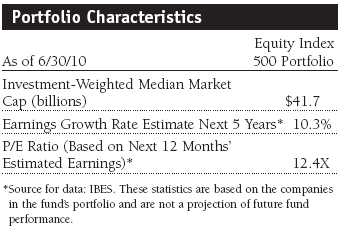
Price/earnings (P/E) ratio–12 months forward: P/E is a valuation measure calculated by dividing the price of a stock by the analysts’ forecast of the next 12 months’ expected earnings. The ratio is a measure of how much investors are willing to pay for the company’s future earnings. The higher the P/E, the more investors are paying for a company’s earnings growth in the next 12 months.
Projected earnings growth rate: A company’s expected earnings per share growth rate for a given time period based on the forecast from the Institutional Brokers’ Estimate System, which is commonly referred to as IBES.
S&P 500 Index: Tracks the stocks of 500 mostly large U.S. companies.
“Standard & Poor’s®”, “S&P®”, “S&P 500®”, “Standard & Poor’s 500”, “500”, “S&P Completion Index”, “S&P Total Market Index”, and “S&P TMI” are marks/trademarks of The McGraw-Hill Companies, Inc., and have been licensed for use by T. Rowe Price. The Product is not sponsored, endorsed, sold, or promoted by Standard & Poor’s, and Standard & Poor’s makes no representation regarding the advisability of investing in the Product.
Portfolio Highlights
Performance and Expenses
T. Rowe Price Equity Index 500 Portfolio
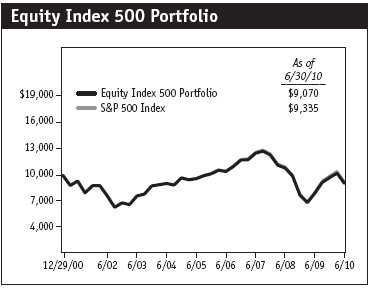
This chart shows the value of a hypothetical $10,000 investment in the portfolio over the past 10 fiscal year periods or since inception (for portfolios lacking 10-year records). The result is compared with benchmarks, which may include a broad-based market index and a peer group average or index. Market indexes do not include expenses, which are deducted from portfolio returns as well as mutual fund averages and indexes.
Fund Expense Example
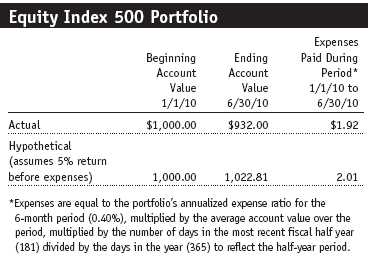
As a mutual fund shareholder, you may incur two types of costs: (1) transaction costs, such as redemption fees or sales loads, and (2) ongoing costs, including management fees, distribution and service (12b-1) fees, and other fund expenses. The following example is intended to help you understand your ongoing costs (in dollars) of investing in the fund and to compare these costs with the ongoing costs of investing in other mutual funds. The example is based on an investment of $1,000 invested at the beginning of the most recent six-month period and held for the entire period.
Actual Expenses
The first line of the following table (“Actual”) provides information about actual account values and actual expenses. You may use the information in this line, together with your account balance, to estimate the expenses that you paid over the period. Simply divide your account value by $1,000 (for example, an $8,600 account value divided by $1,000 = 8.6), then multiply the result by the number in the first line under the heading “Expenses Paid During Period” to estimate the expenses you paid on your account during this period.
Hypothetical Example for Comparison Purposes
The information on the second line of the table (“Hypothetical”) is based on hypothetical account values and expenses derived from the fund’s actual expense ratio and an assumed 5% per year rate of return before expenses (not the fund’s actual return). You may compare the ongoing costs of investing in the fund with other funds by contrasting this 5% hypothetical example and the 5% hypothetical examples that appear in the shareholder reports of the other funds. The hypothetical account values and expenses may not be used to estimate the actual ending account balance or expenses you paid for the period.
You should also be aware that the expenses shown in the table highlight only your ongoing costs and do not reflect any transaction costs, such as redemption fees or sales loads. Therefore, the second line of the table is useful in comparing ongoing costs only and will not help you determine the relative total costs of owning different funds. To the extent a fund charges transaction costs, however, the total cost of owning that fund is higher.
Financial Highlights
T. Rowe Price Equity Index 500 Portfolio
(Unaudited)
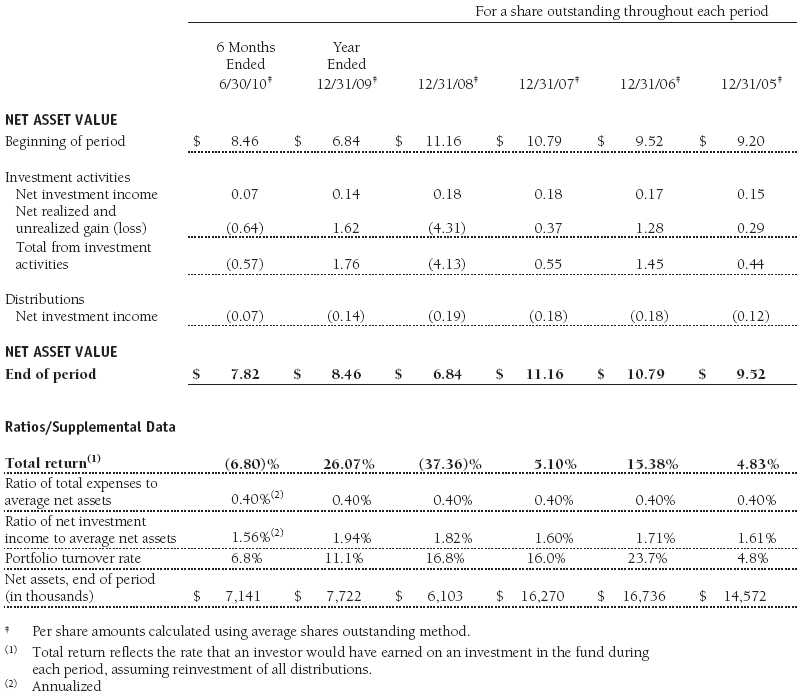
The accompanying notes are an integral part of these financial statements.
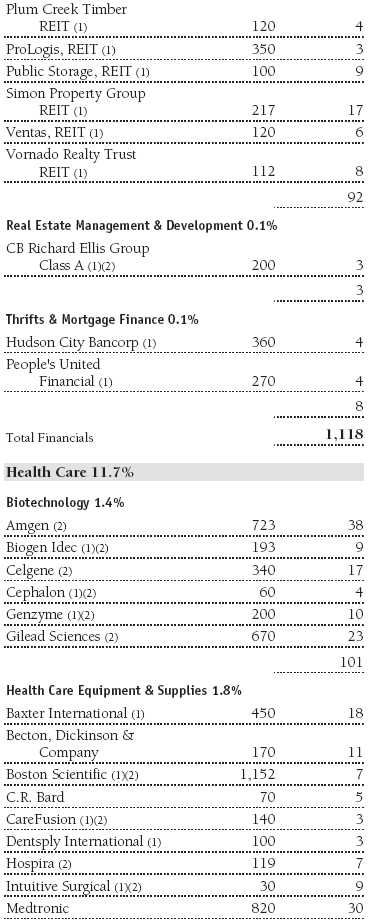
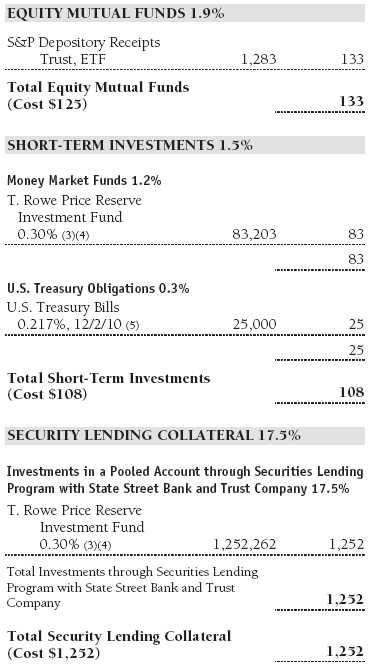
Portfolio of Investments‡
T. Rowe Price Equity Index 500 Portfolio
June 30, 2010 (Unaudited)


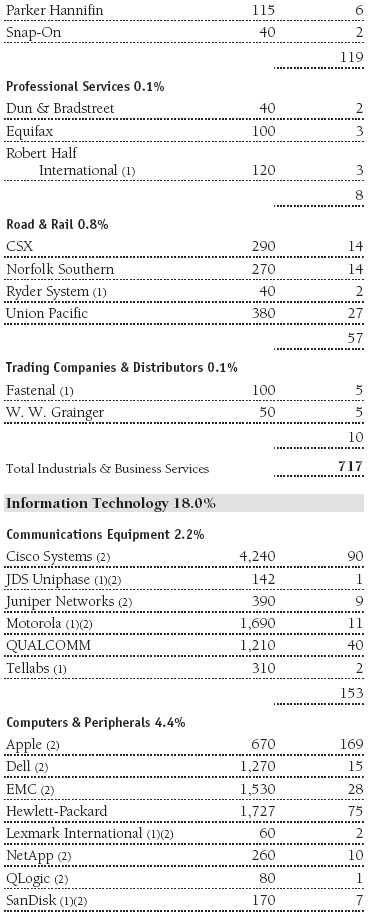
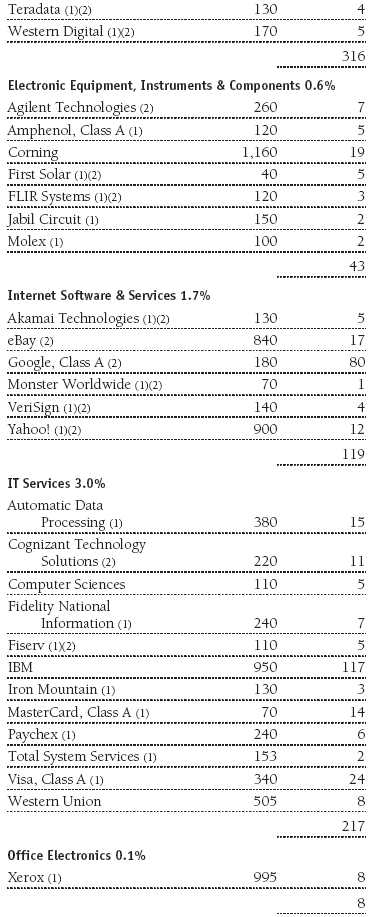
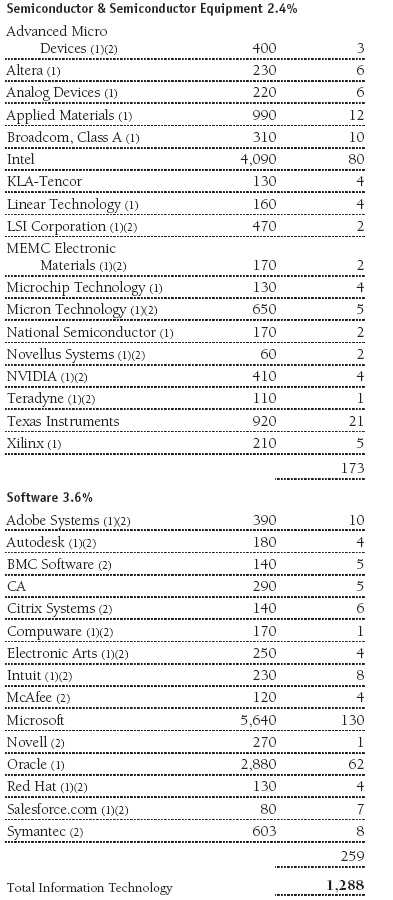


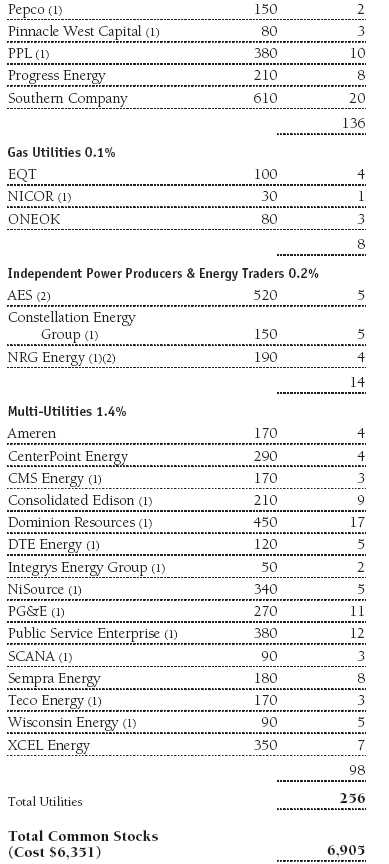

The accompanying notes are an integral part of these financial statements.
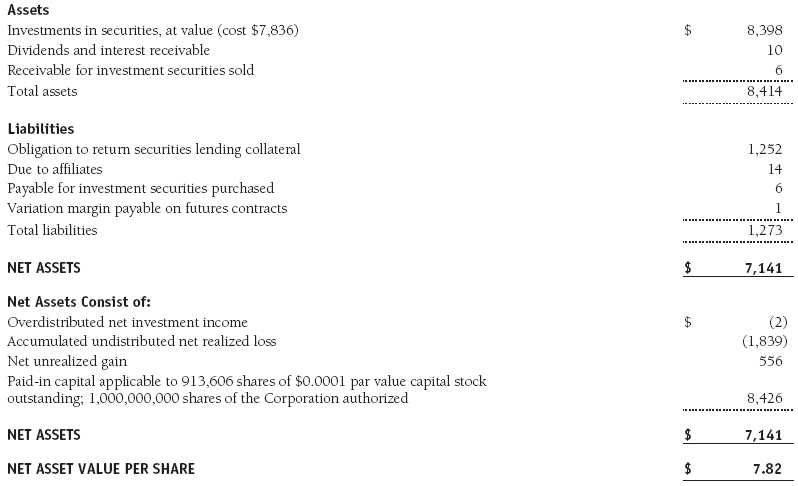
Statement of Assets and Liabilities
T. Rowe Price Equity Index 500 Portfolio
June 30, 2010 (Unaudited)
($000s, except shares and per share amounts)
The accompanying notes are an integral part of these financial statements.
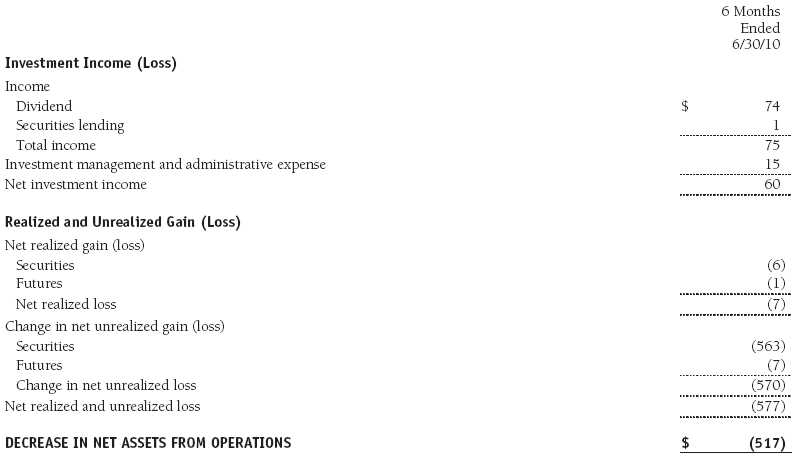
Statement of Operations
T. Rowe Price Equity Index 500 Portfolio
(Unaudited)
($000s)
The accompanying notes are an integral part of these financial statements.
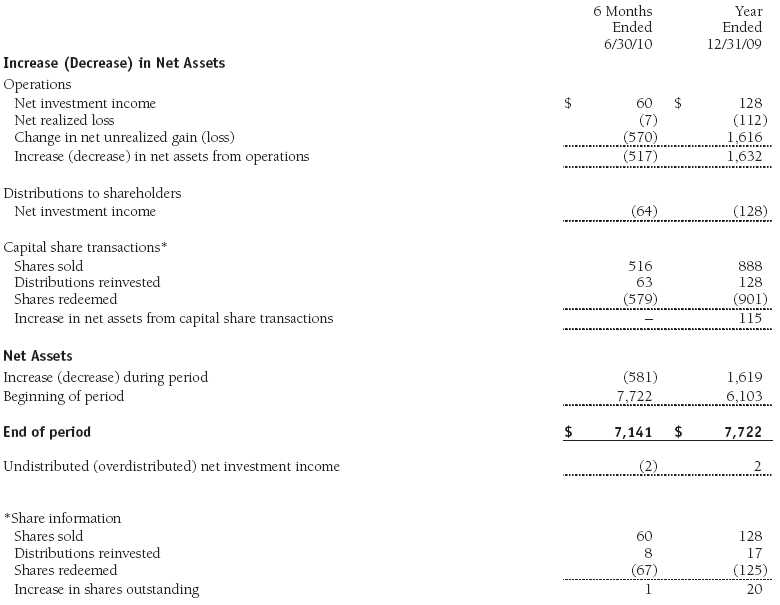
Statement of Changes in Net Assets
T. Rowe Price Equity Index 500 Portfolio
(Unaudited)
($000s)
The accompanying notes are an integral part of these financial statements.
Notes to Financial Statements
T. Rowe Price Equity Index 500 Portfolio
June 30, 2010 (Unaudited)
T. Rowe Price Equity Series, Inc. (the corporation), is registered under the Investment Company Act of 1940 (the 1940 Act). The Equity Index 500 Portfolio (the fund), a diversified, open-end management investment company, is one portfolio established by the corporation. The fund commenced operations on December 29, 2000. The fund seeks to match the performance of the Standard & Poor’s 500 Stock Index®. Shares of the fund are currently offered only through certain insurance companies as an investment medium for both variable annuity contracts and variable life insurance policies.
NOTE 1 - SIGNIFICANT ACCOUNTING POLICIES
Basis of Preparation The accompanying financial statements were prepared in accordance with accounting principles generally accepted in the United States of America (GAAP), which require the use of estimates made by fund management. Fund management believes that estimates and valuations are appropriate; however, actual results may differ from those estimates, and the valuations reflected in the accompanying financial statements may differ from the value ultimately realized upon sale of securities.
Investment Transactions, Investment Income, and Distributions Income and expenses are recorded on the accrual basis. Premiums and discounts on debt securities are amortized for financial reporting purposes. Dividends received from mutual fund investments are reflected as dividend income; capital gain distributions are reflected as realized gain/loss. Dividend income and capital gain distributions are recorded on the ex-dividend date. Income tax-related interest and penalties, if incurred, would be recorded as income tax expense. Investment transactions are accounted for on the trade date. Realized gains and losses are reported on the identified cost basis. Distributions to shareholders are recorded on the ex-dividend date. Income distributions are declared and paid quarterly. Capital gain distributions, if any, are generally declared and paid by the fund annually.
New Accounting Pronouncement On January 1, 2010, the fund adopted new accounting guidance that requires enhanced disclosures about fair value measurements in the financial statements. Adoption of this guidance had no impact on the fund’s net assets or results of operations.
NOTE 2 - VALUATION
The fund’s investments are reported at fair value as defined by GAAP. The fund determines the values of its assets and liabilities and computes its net asset value per share at the close of the New York Stock Exchange (NYSE), normally 4 p.m. ET, each day that the NYSE is open for business.
Valuation Methods Equity securities listed or regularly traded on a securities exchange or in the over-the-counter (OTC) market are valued at the last quoted sale price at the time the valuations are made, except for OTC Bulletin Board securities, which are valued at the mean of the latest bid and asked prices. A security that is listed or traded on more than one exchange is valued at the quotation on the exchange determined to be the primary market for such security. Listed securities not traded on a particular day are valued at the mean of the latest bid and asked prices. Debt securities with remaining maturities of less than one year at the time of acquisition generally use amortized cost in local currency to approximate fair value. However, if amortized cost is deemed not to reflect fair value or the fund holds a significant amount of such securities with remaining maturities of more than 60 days, the securities are valued at prices furnished by dealers who make markets in such securities or by an independent pricing service.
Investments in mutual funds are valued at the mutual fund’s closing net asset value per share on the day of valuation. Financial futures contracts are valued at closing settlement prices.
Other investments, including restricted securities, and those financial instruments for which the above valuation procedures are inappropriate or are deemed not to reflect fair value are stated at fair value as determined in good faith by the T. Rowe Price Valuation Committee, established by the fund’s Board of Directors.
Valuation Inputs Various inputs are used to determine the value of the fund’s financial instruments. These inputs are summarized in the three broad levels listed below:
Level 1 – quoted prices in active markets for identical financial instruments
Level 2 – observable inputs other than Level 1 quoted prices (including, but not limited to, quoted prices for similar financial instruments, interest rates, prepayment speeds, and credit risk)
Level 3 – unobservable inputs
Observable inputs are those based on market data obtained from sources independent of the fund, and unobservable inputs reflect the fund’s own assumptions based on the best information available. The input levels are not necessarily an indication of the risk or liquidity associated with financial instruments at that level. The following table summarizes the fund’s financial instruments, based on the inputs used to determine their values on June 30, 2010:

NOTE 3 - DERIVATIVE INSTRUMENTS
During the six months ended June 30, 2010, the fund invested in derivative instruments. As defined by GAAP, a derivative is a financial instrument whose value is derived from an underlying security price, foreign exchange rate, interest rate, index of prices or rates, or other variable; it requires little or no initial investment and permits or requires net settlement. The fund invests in derivatives only if the expected risks and rewards are consistent with its investment objectives, policies, and overall risk profile, as described in its prospectus and Statement of Additional Information. The fund may use derivatives for a variety of purposes, such as seeking to hedge against declines in principal value, increase yield, invest in an asset with greater efficiency and at a lower cost than is possible through direct investment, or to adjust credit exposure. The risks associated with the use of derivatives are different from, and potentially much greater than, the risks associated with investing directly in the instruments on which the derivatives are based. Investments in derivatives can magnify returns positively or negatively; however, the fund at all times maintains sufficient cash reserves, liquid assets, or other SEC-permitted asset types to cover the settlement obligations under its open derivative contracts.
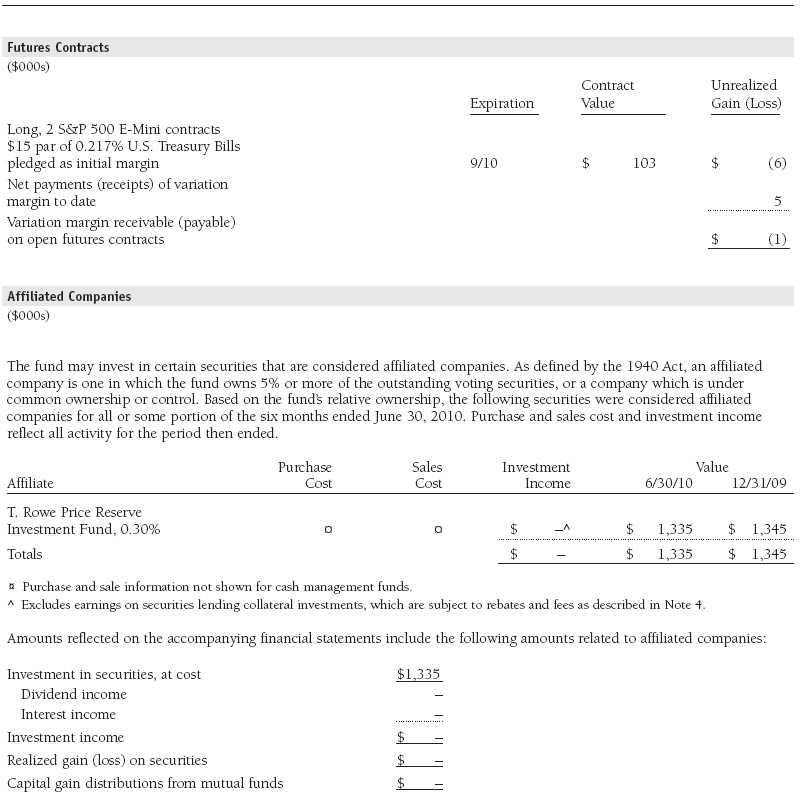
The fund values its derivatives at fair value, as described below and in Note 2, and recognizes changes in fair value currently in its results of operations. Accordingly, the fund does not follow hedge accounting, even for derivatives employed as economic hedges. The fund does not offset the fair value of derivative instruments and the right to reclaim or obligation to return collateral executed with the same counterparty under a master netting arrangement. As of June 30, 2010, the fund held equity futures with cumulative unrealized loss of $6,000; the value reflected on the accompanying Statement of Assets and Liabilities is the related unsettled variation margin.
Additionally, during the six months ended June 30, 2010, the fund recognized $1,000 of realized loss on Futures and a $7,000 change in unrealized loss on Futures related to its investments in equity derivatives; such amounts are included on the accompanying Statement of Operations.
Counterparty risk related to exchange-traded derivatives, including futures and options contracts, is minimal because the exchange’s clearinghouse provides protection against defaults. Additionally, for exchange-traded derivatives, each broker, in its sole discretion, may change margin requirements applicable to the fund.
Futures Contracts The fund is subject to equity price risk in the normal course of pursuing its investment objectives and uses futures contracts to help manage such risk. The fund may enter into futures contracts as an efficient means of maintaining liquidity while being invested in the market, to facilitate trading, and/or to reduce transaction costs. A futures contract provides for the future sale by one party and purchase by another of a specified amount of a particular underlying financial instrument at an agreed-upon price, date, time, and place. The fund currently invests only in exchange-traded futures, which generally are standardized as to maturity date, underlying financial instrument, and other contract terms. Upon entering into a futures contract, the fund is required to deposit with the broker cash or securities in an amount equal to a certain percentage of the contract value (initial margin deposit); the margin deposit must then be maintained at the established level over the life of the contract. Subsequent payments are made or received by the fund each day to settle daily fluctuations in the value of the contract (variation margin), which reflect changes in the value of the underlying financial instrument. Variation margin is recorded as unrealized gain or loss until the contract is closed. The value of a futures contract included in net assets is the amount of unsettled variation margin; net variation margin receivable is reflected as an asset, and net variation margin payable is reflected as a liability on the accompanying Statement of Assets and Liabilities. Risks related to the use of futures contracts include possible illiquidity of the futures markets, contract prices that can be highly volatile and imperfectly correlated to movements in hedged security values and potential losses in excess of the fund’s initial investment. During the six months ended June 30, 2010, the fund’s exposure to futures, based on underlying notional amounts, was generally between 0% and 1% of net assets.
NOTE 4 - OTHER INVESTMENT TRANSACTIONS
Consistent with its investment objective, the fund engages in the following practices to manage exposure to certain risks and/or to enhance performance. The investment objective, policies, program, and risk factors of the fund are described more fully in the fund’s prospectus and Statement of Additional Information.
Securities Lending The fund lends its securities to approved brokers to earn additional income. It receives as collateral cash and U.S. government securities valued at 102% to 105% of the value of the securities on loan. Cash collateral is invested by the fund’s lending agent(s) in accordance with investment guidelines approved by fund management. Although risk is mitigated by the collateral, the fund could experience a delay in recovering its securities and a possible loss of income or value if the borrower fails to return the securities or if collateral investments decline in value. Securities lending revenue recognized by the fund consists of earnings on invested collateral and borrowing fees, net of any rebates to the borrower and compensation to the lending agent. On June 30, 2010, the value of loaned securities was $1,252,000; aggregate collateral received included U.S. government securities valued at $13,000.
Other Purchases and sales of portfolio securities other than short-term securities aggregated $512,000 and $565,000, respectively, for the six months ended June 30, 2010.
NOTE 5 - FEDERAL INCOME TAXES
No provision for federal income taxes is required since the fund intends to continue to qualify as a regulated investment company under Subchapter M of the Internal Revenue Code and distribute to shareholders all of its taxable income and gains. Distributions determined in accordance with federal income tax regulations may differ in amount or character from net investment income and realized gains for financial reporting purposes. Financial reporting records are adjusted for permanent book/tax differences to reflect tax character but are not adjusted for temporary differences. The amount and character of tax-basis distributions and composition of net assets are finalized at fiscal year-end; accordingly, tax-basis balances have not been determined as of the date of this report.
In accordance with federal tax regulations, the fund recognized capital losses in the current period for tax purposes that had been recognized in the prior fiscal year for financial reporting purposes. Such deferrals relate to net capital losses realized between November 1, 2009 and December 31, 2009, and totaled $11,000. The fund intends to retain realized gains to the extent of available capital loss carryforwards. As of December 31, 2009, the fund had $1,722,000 of unused capital loss carryforwards, which expire: $15,000 in fiscal 2010, $819,000 in fiscal 2011, $111,000 in fiscal 2014, $598,000 in fiscal 2016, and $179,000 in fiscal 2017.
At June 30, 2010, the cost of investments for federal income tax purposes was $7,836,000. Net unrealized gain aggregated $556,000 at period-end, of which $1,381,000 related to appreciated investments and $825,000 related to depreciated investments.
NOTE 6 - RELATED PARTY TRANSACTIONS
The fund is managed by T. Rowe Price Associates, Inc. (the manager or Price Associates), a wholly owned subsidiary of T. Rowe Price Group, Inc. The investment management and administrative agreement between the fund and the manager provides for an all-inclusive annual fee equal to 0.40% of the fund’s average daily net assets. The fee is computed daily and paid monthly. The agreement provides that investment management, shareholder servicing, transfer agency, accounting, custody services, and directors’ fees and expenses are provided to the fund, and interest, taxes, brokerage commissions, and extraordinary expenses are paid directly by the fund.
The fund may invest in the T. Rowe Price Reserve Investment Fund and the T. Rowe Price Government Reserve Investment Fund (collectively, the T. Rowe Price Reserve Investment Funds), open-end management investment companies managed by Price Associates and considered affiliates of the fund. The T. Rowe Price Reserve Investment Funds are offered as cash management options to mutual funds, trusts, and other accounts managed by Price Associates and/or its affiliates and are not available for direct purchase by members of the public. The T. Rowe Price Reserve Investment Funds pay no investment management fees.
| Information on Proxy Voting Policies, Procedures, and Records |
A description of the policies and procedures used by T. Rowe Price funds and portfolios to determine how to vote proxies relating to portfolio securities is available in each fund’s Statement of Additional Information, which you may request by calling 1-800-225-5132 or by accessing the SEC’s Web site, www.sec.gov. The description of our proxy voting policies and procedures is also available on our Web site, www.troweprice.com. To access it, click on the words “Our Company” at the top of our corporate homepage. Then, when the next page appears, click on the words “Proxy Voting Policies” on the left side of the page.
Each fund’s most recent annual proxy voting record is available on our Web site and through the SEC’s Web site. To access it through our Web site, follow the directions above, then click on the words “Proxy Voting Records” on the right side of the Proxy Voting Policies page.
| How to Obtain Quarterly Portfolio Holdings |
The fund files a complete schedule of portfolio holdings with the Securities and Exchange Commission for the first and third quarters of each fiscal year on Form N-Q. The fund’s Form N-Q is available electronically on the SEC’s Web site (www.sec.gov); hard copies may be reviewed and copied at the SEC’s Public Reference Room, 450 Fifth St. N.W., Washington, DC 20549. For more information on the Public Reference Room, call 1-800-SEC-0330.
| Approval of Investment Management Agreement |
On March 9, 2010, the fund’s Board of Directors (Board) unanimously approved the continuation of the investment advisory contract (Contract) between the fund and its investment manager, T. Rowe Price Associates, Inc. (Adviser). The Board considered a variety of factors in connection with its review of the Contract, also taking into account information provided by the Adviser during the course of the year, as discussed below:
Services Provided by the Adviser
The Board considered the nature, quality, and extent of the services provided to the fund by the Adviser. These services included, but were not limited to, management of the fund’s portfolio and a variety of related activities, as well as financial and administrative services, reporting, and communications. The Board also reviewed the background and experience of the Adviser’s senior management team and investment personnel involved in the management of the fund. The Board concluded that it was satisfied with the nature, quality, and extent of the services provided by the Adviser.
Investment Performance of the Fund
The Board reviewed the fund’s average annual total returns over the one-, three-, and five-year and since-inception periods, as well as the fund’s year-by-year returns, and compared these returns with a wide variety of previously agreed upon comparable performance measures and market data, including those supplied by Lipper and Morningstar, which are independent providers of mutual fund data. On the basis of this evaluation and the Board’s ongoing review of investment results, and factoring in the severity of the market turmoil during 2008 and 2009, the Board concluded that the fund’s performance was satisfactory.
Costs, Benefits, Profits, and Economies of Scale
The Board reviewed detailed information regarding the revenues received by the Adviser under the Contract and other benefits that the Adviser (and its affiliates) may have realized from its relationship with the fund, including research received under “soft dollar” agreements and commission-sharing arrangements with broker-dealers. The Board considered that the Adviser may receive some benefit from its soft-dollar arrangements pursuant to which it receives research from broker-dealers that execute the applicable fund’s portfolio transactions. The Board also received information on the estimated costs incurred and profits realized by the Adviser and its affiliates from advising T. Rowe Price mutual funds. The Board did not review information regarding profits realized from managing the fund in particular because the fund had not achieved sufficient scale in terms of portfolio asset size to produce meaningful profit margin percentages. The Board concluded that the Adviser’s profits from advising T. Rowe Price mutual funds were reasonable in light of the services provided to the fund. The Board also considered whether the fund or other funds benefit under the fee levels set forth in the Contract from any economies of scale realized by the Adviser. The Board noted that, under the Contract, the fund pays the Adviser a single fee based on the fund’s assets and that the Adviser, in turn, pays all expenses of the fund, with certain exceptions. The Board concluded that, based on the profitability data it reviewed and consistent with this single-fee structure, the Contract provided for a reasonable sharing of any benefits from economies of scale with the fund.
Fees
The Board reviewed the fund’s single-fee structure and compared it with fees and expenses of other comparable funds based on information and data supplied by Lipper. The information provided to the Board indicated that the fund’s management fee rate was below the median for comparable funds and the fund’s total expense ratio was above the median for comparable funds. (For these purposes, the Board assumed the fund’s management fee rate was equal to the single fee less the fund’s operating expenses and after including any reductions of the management fee rate as a result of any applicable fee waivers or expenses paid by the Adviser.) The Board also reviewed the fee schedules for institutional accounts of the Adviser and its affiliates with smaller mandates. Management informed the Board that the Adviser’s responsibilities for institutional accounts are more limited than its responsibilities for the fund and other T. Rowe Price mutual funds that it or its affiliates advise and that the Adviser performs significant additional services and assumes greater risk for the fund and other T. Rowe Price mutual funds that it advises than it does for institutional accounts. On the basis of the information provided, the Board concluded that the fees paid by the fund under the Contract were reasonable.
Approval of the Contract
As noted, the Board approved the continuation of the Contract. No single factor was considered in isolation or to be determinative to the decision. Rather, the Board was assisted by the advice of independent legal counsel and concluded, in light of a weighting and balancing of all factors considered, that it was in the best interests of the fund to approve the continuation of the Contract, including the fees to be charged for services thereunder.
Item 2. Code of Ethics.
A code of ethics, as defined in Item 2 of Form N-CSR, applicable to its principal executive officer, principal financial officer, principal accounting officer or controller, or persons performing similar functions is filed as an exhibit to the registrant’s annual Form N-CSR. No substantive amendments were approved or waivers were granted to this code of ethics during the registrant’s most recent fiscal half-year.
Item 3. Audit Committee Financial Expert.
Disclosure required in registrant’s annual Form N-CSR.
Item 4. Principal Accountant Fees and Services.
Disclosure required in registrant’s annual Form N-CSR.
Item 5. Audit Committee of Listed Registrants.
Not applicable.
Item 6. Investments.
(a) Not applicable. The complete schedule of investments is included in Item 1 of this Form N-CSR.
(b) Not applicable.
Item 7. Disclosure of Proxy Voting Policies and Procedures for Closed-End Management Investment Companies.
Not applicable.
Item 8. Portfolio Managers of Closed-End Management Investment Companies.
Not applicable.
Item 9. Purchases of Equity Securities by Closed-End Management Investment Company and Affiliated Purchasers.
Not applicable.
Item 10. Submission of Matters to a Vote of Security Holders.
Not applicable.
Item 11. Controls and Procedures.
(a) The registrant’s principal executive officer and principal financial officer have evaluated the registrant’s disclosure controls and procedures within 90 days of this filing and have concluded that the registrant’s disclosure controls and procedures were effective, as of that date, in ensuring that information required to be disclosed by the registrant in this Form N-CSR was recorded, processed, summarized, and reported timely.
(b) The registrant’s principal executive officer and principal financial officer are aware of no change in the registrant’s internal control over financial reporting that occurred during the registrant’s second fiscal quarter covered by this report that has materially affected, or is reasonably likely to materially affect, the registrant’s internal control over financial reporting.
Item 12. Exhibits.
(a)(1) The registrant’s code of ethics pursuant to Item 2 of Form N-CSR is filed with the registrant’s annual Form N-CSR.
(2) Separate certifications by the registrant's principal executive officer and principal financial officer, pursuant to Section 302 of the Sarbanes-Oxley Act of 2002 and required by Rule 30a-2(a) under the Investment Company Act of 1940, are attached.
(3) Written solicitation to repurchase securities issued by closed-end companies: not applicable.
(b) A certification by the registrant's principal executive officer and principal financial officer, pursuant to Section 906 of the Sarbanes-Oxley Act of 2002 and required by Rule 30a-2(b) under the Investment Company Act of 1940, is attached.
| | |
SIGNATURES |
| |
| | Pursuant to the requirements of the Securities Exchange Act of 1934 and the Investment |
| Company Act of 1940, the registrant has duly caused this report to be signed on its behalf by the |
| undersigned, thereunto duly authorized. |
| |
| T. Rowe Price Equity Series, Inc. |
| |
| |
| |
| By | /s/ Edward C. Bernard |
| | Edward C. Bernard |
| | Principal Executive Officer |
| |
| Date | August 17, 2010 |
| |
| |
| |
| | Pursuant to the requirements of the Securities Exchange Act of 1934 and the Investment |
| Company Act of 1940, this report has been signed below by the following persons on behalf of |
| the registrant and in the capacities and on the dates indicated. |
| |
| |
| By | /s/ Edward C. Bernard |
| | Edward C. Bernard |
| | Principal Executive Officer |
| |
| Date | August 17, 2010 |
| |
| |
| |
| By | /s/ Gregory K. Hinkle |
| | Gregory K. Hinkle |
| | Principal Financial Officer |
| |
| Date | August 17, 2010 |