| UNITED STATES |
| SECURITIES AND EXCHANGE COMMISSION |
| Washington, D.C. 20549 |
| |
FORM N-CSR |
| |
CERTIFIED SHAREHOLDER REPORT OF REGISTERED |
MANAGEMENT INVESTMENT COMPANIES |
| |
| |
| |
| Investment Company Act File Number: 811-07143 |
|
| |
| T. Rowe Price Equity Series, Inc. |
|
| (Exact name of registrant as specified in charter) |
| |
| 100 East Pratt Street, Baltimore, MD 21202 |
|
| (Address of principal executive offices) |
| |
| David Oestreicher |
| 100 East Pratt Street, Baltimore, MD 21202 |
|
| (Name and address of agent for service) |
| |
| |
| Registrant’s telephone number, including area code: (410) 345-2000 |
| |
| |
| Date of fiscal year end: December 31 |
| |
| |
| Date of reporting period: June 30, 2010 |
Item 1: Report to Shareholders| Blue Chip Growth Portfolio | June 30, 2010 |
• Large-cap growth stocks advanced in the first quarter only to correct sharply in the second.
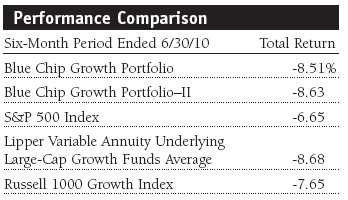
• The portfolio surpassed its Lipper peer group but trailed the S&P 500 Index and the Russell 1000 Growth Index.
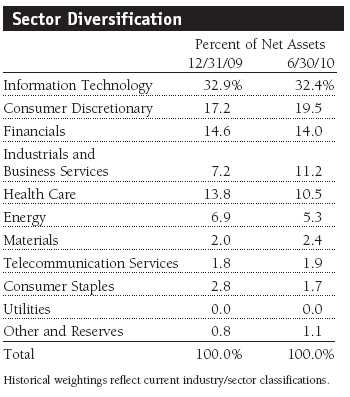
• We held onto most of our large positions in the information technology and consumer discretionary sectors through the second-quarter weakness because of our conviction in their longer-term prospects.
• We believe that many high-quality, large-cap growth companies could perform well even if the economy experiences only a modest recovery.
The views and opinions in this report were current as of June 30, 2010. They are not guarantees of performance or investment results and should not be taken as investment advice. Investment decisions reflect a variety of factors, and the managers reserve the right to change their views about individual stocks, sectors, and the markets at any time. As a result, the views expressed should not be relied upon as a forecast of the fund’s future investment intent. The report is certified under the Sarbanes-Oxley Act, which requires mutual funds and other public companies to affirm that, to the best of their knowledge, the information in their financial reports is fairly and accurately stated in all material respects.
Manager’s Letter
T. Rowe Price Blue Chip Growth Portfolio
Dear Investor
After strong performance in 2009 and a promising start to 2010, global stock markets experienced a sharp correction in the second quarter. While some retrenchment is normal given the robust rebound in stock prices, there are clearly other serious concerns for investors. Budgetary problems in several European economies led to a sharp reduction in the euro and also served to highlight strained budgetary conditions in many countries. Financial reform, health care reform, and other regulatory actions also weighed on investor sentiment. The significant Macondo oil field spill in the Gulf of Mexico created dislocation in the energy industry and will probably hinder economic growth. Efforts in China to control its robust economy also contributed to fears of slowing global growth. However, the most vexing issue for investors is very slow private sector job growth, which is arguably being dampened by many of these factors.
Although we acknowledge that uncertainty and risk are higher than normal, relatively low interest rates, attractive valuations, and continued earnings growth create the potential for many large-cap growth stocks to perform well. However, given strained budgetary conditions, policymakers will have to be adroit in fostering stronger job growth while showing greater restraint in spending and regulatory measures.
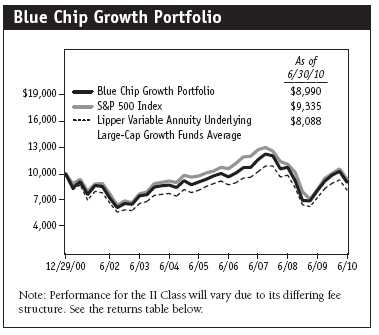
The Blue Chip Growth Portfolio returned -8.51% in the first half of 2010. Our results modestly outperformed the Lipper peer group of large-cap growth funds but trailed the S&P 500 Index and Russell 1000 Growth Index. We are disappointed that several of our largest portfolio holdings, which drove the portfolio’s strong performance in 2009 and early 2010, declined sharply in the last few months of the reporting period. (Results for the Class II were slightly lower, reflecting its differing fee structure.)
Market Environment
In our recent shareholder letters, we outlined many of the ongoing uncertainties facing investors. However, in the last six months, new shocks have occurred, and several of the risks we had noted previously have probably worsened. The current investing environment is among the most challenging we have confronted since the portfolio’s inception. Specifically, the budgetary crisis in several European economies has caused a significant devaluation in the euro and also raised questions about the effective servicing of sovereign debt by several European countries. It has also highlighted the budgetary strains in many industrialized nations, including the U.K. and the U.S. The Macondo oil spill is a major environmental and economic disaster, which will probably affect growth for some time. Some slowing in China also represents a new impediment to growth, or it at least seems to have occurred sooner and with perhaps greater magnitude than many were anticipating.
In terms of ongoing risks, we think there will be greater government regulation, taxation, and reform actions undertaken in the U.S. The health care reform legislation, for example, was broad and may have many unintended consequences due to its scope and complexity. Substantial tax increases may occur, which, in our view, could represent another hurdle for a solid economic recovery. The financial services reform actions that are likely to be enacted appear to be less onerous than some had originally feared. Nevertheless, these types of government actions reinforce the concern, correctly or incorrectly, that the level of regulation and taxation will increase for many businesses. This perception could be contributing to some restraint in private sector hiring. Ultimately, high unemployment and continued lackluster job growth in the private sector is the most serious overarching risk to a sustained economic recovery and a rebound in the stock market.
We want to be forthright about the challenges facing investors, and we also want to be clear that there are several powerful positives and solid potential rewards in many stocks. We believe that the uneven economic recovery will cause inflation and interest rates to remain subdued for longer than earlier projections. Corporate earnings at selected companies are very strong, and the second-quarter correction made stock valuations more attractive. Cost-cutting initiatives and improvement in productivity could continue to result in vibrant earnings growth for many companies, even if they experience only a moderate recovery in revenues. Many companies have free cash flow yields approaching 10%, which is very favorable relative to the roughly 3% yield on 10-year Treasury notes. In summary, while we acknowledge that the risks are greater than normal, we think there is solid opportunity in this market.
Portfolio Review
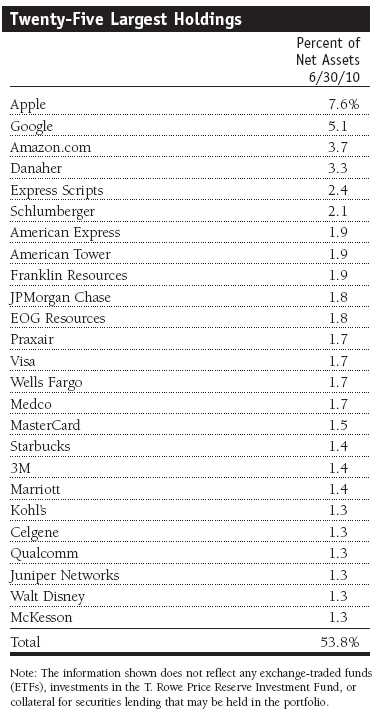
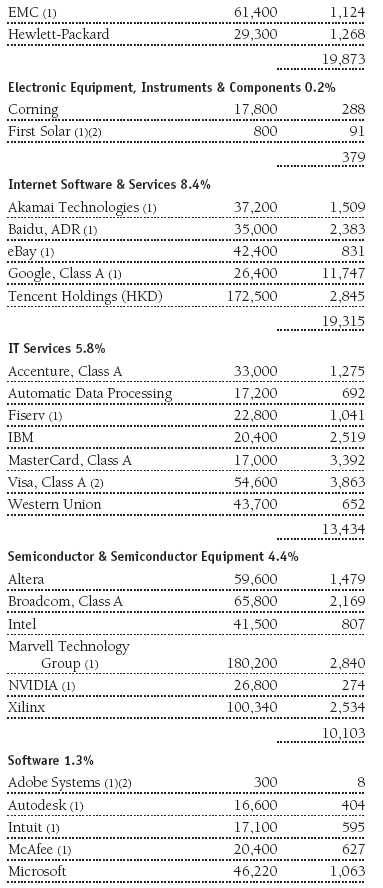
Although the information technology sector was the worst first-half performer, Apple was the portfolio’s best contributor for the last six months. The company’s iPhone and iMac personal computers continued to generate brisk sales despite the challenging economic environment, and its new iPad is selling at a rate that is well above initial projections. We feel the company is correctly viewed as well positioned for growth in mobile computing and commerce conducted using smartphones and electronic tablets. Baidu, the dominant provider of online search and advertising services in China, also prospered due to continued robust adoption of a variety of online activities. The company appears to be receiving endorsement and support from the Chinese government, and it benefited from the potential reduction in Google’s role in China due to concerns about censorship. Akamai Technologies, the leading provider of content distribution services for Internet applications, was also a top performer. The company’s network allows the customization and accelerated delivery of advertising and other content, including high-definition video, on the Internet.
Several of our worst first-half performers also came from the technology area. Google was our largest detractor. In addition to the company’s announcement that it might withdraw from the Chinese market due to censorship issues, there is concern that Apple’s rapid growth in the mobile and online commerce segments could erode Google’s market share over time. However, Google’s Android operating system is being used in a variety of phones and devices, which are selling rapidly. Google is not charging for its operating system because it believes it can stimulate search and advertising revenues where it has a dominant position. At the end of the reporting period, Google traded at approximately 12 times its 2011 estimated earnings after netting out its substantial cash reserves. We remain optimistic about the company’s prospects, and it remains the portfolio’s second-largest holding.
Qualcomm, a leading provider of semiconductors and chipsets used in wireless phones, struggled as the average selling price of its devices declined. This was in part due to the greater use of lower-priced chips in phones sold in emerging markets and inroads made by several competitors. We believe Qualcomm will show improved growth in coming quarters spurred by accelerating sales of several smartphone products. However, we sold a portion of our holding early in the period at higher prices because of our concerns about competitive products and pricing. Microsoft was also disappointing. Despite fairly strong fundamental performance, investors are worried that the company’s highly profitable business will be hurt by competition from Apple, Google, and other companies that are perceived to be better positioned in mobile and cloud computing. Our concerns about these trends led us to significantly reduce our position in the stock.
MasterCard and Visa were other major detractors. While they are classified in the information technology services segment, they are really processing companies that benefit from growing global credit and debit card use. Both companies suffered after legislation was introduced to allow greater regulation of interchange fees charged between issuing and accepting banks for credit and debit card transactions. While interchange fees are not paid to MasterCard and Visa, the network and other service fees they receive could be pressured by increased scrutiny and regulation over time. However, we think the risk/reward trade-off remains favorable for both companies, which are well managed and should benefit from increased use of debit and credit cards.
Our consumer discretionary sector holdings also produced mixed results. We had several solid contributors but more detractors overall. On the positive side, O’Reilly Automotive, a well-managed auto parts retailer, appears to be successfully integrating a large California-based acquisition. The company has generated strong organic and acquisition-related growth over a number of years. Similarly, Discovery Communications has been a consistent performer for your portfolio for several years. Its collaboration with Oprah Winfrey on a new cable channel and continued strength at its traditional cable channels should allow it to grow faster than most media companies. Despite a pullback late in the second quarter due to concerns about the economy, our large holding in Marriott generated strong gains as the robust recovery in lodging continued to surprise many investors. Starbucks was also a solid performer benefiting from efficiency improvements and widening operating margins, especially in international markets. Starbucks is expanding its consumer product offerings with appealing new products such as the Via instant single-serve coffee. We have sampled Via, including the new iced coffee version, and think it will show solid growth.
Online retailing giant Amazon.com, our third-largest holding, suffered due to perceptions that Apple’s iPad would encroach on the sales growth of its Kindle electronic book reader and related businesses. This is another area where we believe the market is growing strongly, and both companies should prosper over time. Amazon is gaining share in the online commerce market, which is also taking share from traditional retailers. The Kindle franchise is also a relatively small part of Amazon’s business and should still garner strong support from avid readers making the transition to electronic books from traditional print media.
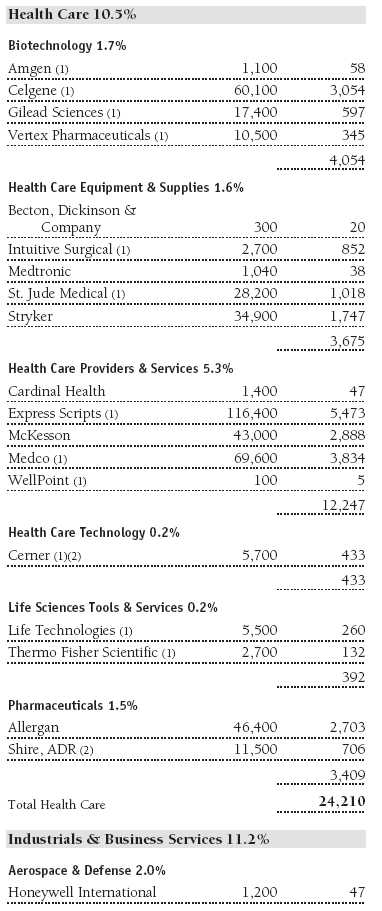
Although health care did not benefit from the sharp rebound in economically sensitive stocks, the sector generated surprisingly good results. Express Scripts, a leading pharmaceutical benefit manager, should continue to thrive as generic drug substitution and the increased use of mail order support its strong growth. Express Scripts recently purchased NextRx, the drug benefit manager division, from WellPoint, a leading HMO, and we believe the transaction will benefit earnings over time. McKesson, a leading drug distributor and health care information technology solutions provider, also performed well and may not be overly affected by regulatory reform.
After a remarkable rebound last year, financial stocks were inconsistent performers. Goldman Sachs was charged with fraud by the Securities and Exchange Commission (SEC) as a result of its involvement in underwriting the sale of certain mortgage-backed securities, and the stock has been punished. We have studied the facts of this case and agree with Warren Buffett’s view that it does not appear that Goldman engaged in any fraudulent activity, but new evidence could emerge, and the charges are serious. These charges, issues surrounding financial reform legislation, and a slowdown in several core businesses caused us to reduce our position. Shortly after the end of this reporting period, Goldman Sachs reached a settlement with the SEC that stipulated a $550 million fine. Franklin Resources, the mutual fund giant, utilized its strong position in emerging markets and fixed income investing to drive solid profitability. Nevertheless, it was one of our largest first-half detractors. We think that if financial markets continue to struggle, Franklin will be an inconsistent performer. However, the stock has an attractive valuation, and its business should not be significantly affected by regulatory reform; therefore, we have maintained a significant position.
Strategy
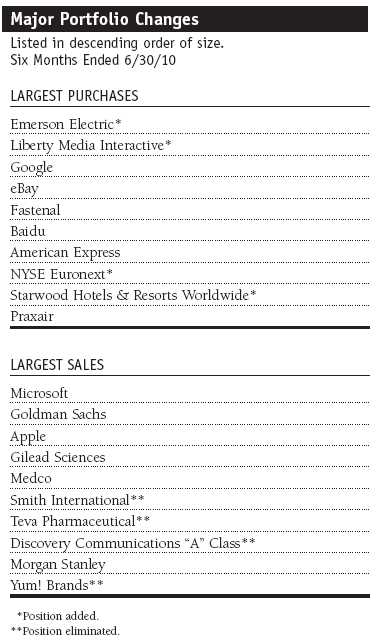
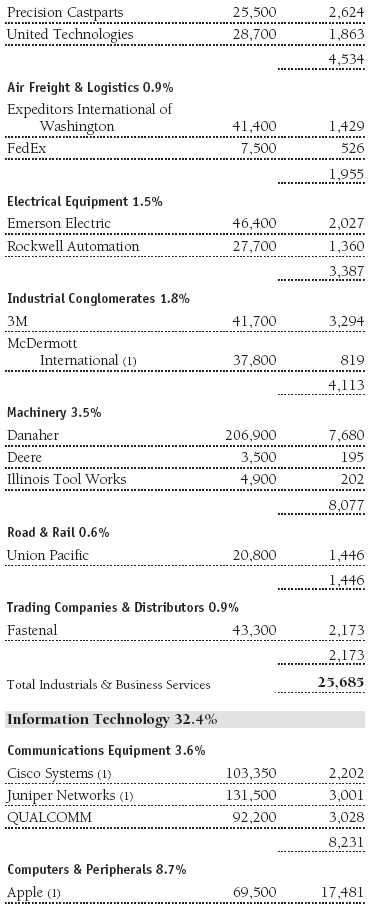
Additions to existing holdings such as Google, American Express, Baidu, Fastenal, and Praxair were significant enough to be included in the 10 largest purchases for the past six months. Among our largest additions, we initiated only four new positions. Our top purchase was Emerson Electric, a leading provider of electrical equipment. It has one of the best records of earnings and dividend growth in the S&P 500 and over 50 consecutive years of dividend increases. We feel that this company (like our large holding in 3M) is not getting the credit it deserves for its consistent growth. Both companies are well managed and could be particularly well positioned to show differentiated performance given product innovation and strong positioning in Asian markets. Liberty Media Interactive is showing solid growth from its primary asset, the QVC home shopping network. It is using the Internet and other tools to foster strong customer retention and solid earnings growth. We are also impressed with the stock’s free cash flow yield exceeding 10%. We added a new position in Starwood Hotels & Resorts to supplement our position in Marriott. Our lodging analyst is bullish on the rapid growth and improving fundamentals in the lodging industry. Starwood is favorably positioned in international markets with numerous hotels in key Asian markets and several powerful brands, including St. Regis, Le Meridian, W, Westin, and Sheraton.
Our largest sales included the elimination of Smith International, which we sold after the company agreed to be purchased by Schlumberger. We generated excellent long-term and first-half profits on this longtime holding and rolled some of the proceeds into Schlumberger. Teva Pharmaceutical was also eliminated after generating strong recent and long-term performance for your portfolio. We are generally reluctant to sell winning stocks as long as the risk/reward trade-off remains attractive. However, we became concerned that new competitive products could take significant share from Copaxone, a drug for the treatment of multiple sclerosis that constitutes a large portion of Teva’s profits. Discovery Communications “A” class (ticker DISCA) was eliminated, but some of the proceeds were used to buy its “B” shares (ticker DISCK), which trade at a large—and in our view, unwarranted—discount. We also eliminated our position in Yum! Brands because of its uneven results at Taco Bell, KFC, and Pizza Hut in the U.S. While we still have some concerns regarding execution in domestic markets, the company is showing improved growth in China. Our decision to sell was poorly timed as the stock performed well after we sold it. We would not rule out reestablishing a position if the recent correction in the stock continues.
Outlook
After experiencing an unprecedented crisis in credit and financial markets followed by a historic rebound in global stock markets, investors must now grapple with significant uncertainty. We expect that improved budget discipline in many European countries could lead to greater stability in the euro and other currencies over time. We also think that a pattern of improved spending discipline as well as more restraint in regulation could emerge in several industrialized countries including the U.K. and the U.S. Our cautious but positive long-term view is also based on the idea that China, India, and Brazil will experience some slowing in growth but continue to prosper and exhibit sound fiscal management. Improvement in the Gulf of Mexico oil spill situation should also materialize over the next several months.
It may take time for these improvements to develop in a substantial way that inspires greater confidence among business managers and investors. In a similar vein (and partially due to these key factors progressing gradually), private sector job growth may also improve slowly. Consequently, we must recognize the unusual level of uncertainty in the environment.
However, we continue to be optimistic regarding the long-term performance of stocks. While the challenges we have enumerated will certainly require time to resolve—and test the patience of policymakers and investors—the uncertain environment also contains some key positives and significant opportunity. In short, corporate earnings at selected companies could continue to impress, interest rates and inflation are subdued, and the valuations of many high-quality companies are quite reasonable. We accept that some government actions will not achieve their objectives fully because public or private sector solutions are never perfect. We also believe that the dangers of overregulation or unrestrained spending and deficits will continue to receive more attention and emphasis.
Despite the uncertainty surrounding how effective fiscal and monetary actions will be in healing the economy, there are several things working in our favor:
1. Stocks historically have performed well following a lackluster 10-year period of performance. Essentially, we have experienced two very major bear markets in the past 10 years.
2. Stock valuations are attractive, especially in relation to today’s low interest rates. The difference between the earnings yield on stocks and the 10-year Treasury rate (approximately 3%) is attractive in any historical context. The free cash flow yield of many companies exceeds 10%, which historically is also a very attractive valuation.
3. We believe that the high-quality, consistent growth companies that we seek to purchase are attractive and could conceivably perform well even if the economy experiences only a modest recovery. Stringent expense management could also support rapid earnings growth should revenues begin to accelerate.
4. Many large-cap growth companies have solid balance sheets with record amounts of cash and strong capitalization. This should allow them to manage through challenges and opportunistically invest in new products or businesses as change creates dislocation.
5. Many of our holdings generate significant free cash flow. Shareholder-oriented management can use this cash to increase dividends, repurchase shares, or make value-added acquisitions.
We continue to strive to enhance returns in a difficult environment by investing in quality companies with durable, sustainable earnings and cash flow growth. We appreciate your continued confidence in this endeavor.
Respectfully submitted,

Larry J. Puglia
Chairman of the Investment Advisory Committee
July 12, 2010
The committee chairman has day-to-day responsibility for managing the portfolio and works with committee members in developing and executing its investment program.
The portfolio’s share price can fall because of weakness in the stock markets, a particular industry, or specific holdings. Stock markets can decline for many reasons, including adverse political or economic developments, changes in investor psychology, or heavy institutional selling. The prospects for an industry or company may deteriorate because of a variety of factors, including disappointing earnings or changes in the competitive environment. In addition, the investment manager’s assessment of companies held in a fund may prove incorrect, resulting in losses or poor performance even in rising markets. Growth stocks can be volatile because these companies usually invest a high portion of earnings in their businesses, and earnings disappointments often lead to sharply falling prices. The value approach carries the risk that a security’s intrinsic value may not be recognized for a long time or that the stock may actually be appropriately priced.
Dividend yield: The annual dividend of a stock divided by the stock’s price.
Free cash flow: The excess cash a company is generating from its operations that can be taken out of the business for the benefit of shareholders, such as dividends, share repurchases, investments, and acquisitions.
Lipper averages: The average return of all portfolios in a particular category as tracked by Lipper Inc.
Price/book ratio: A valuation measure that compares a stock’s market price with its book value, i.e., the company’s net worth divided by the number of outstanding shares.
Price/earnings (P/E) ratio: A valuation measure calculated by dividing the price of a stock by its current or projected earnings per share. This ratio gives investors an idea of how much they are paying for current or future earnings power.
Russell 1000 Growth Index: Market capitalization-weighted index of those firms in the Russell 1000 with higher price-to-book ratios and higher forecasted growth values.
S&P 500 Index: An unmanaged index that tracks the stocks of 500 primarily large-cap U.S. companies.
Portfolio Highlights
Performance and Expenses
T. Rowe Price Blue Chip Growth Portfolio
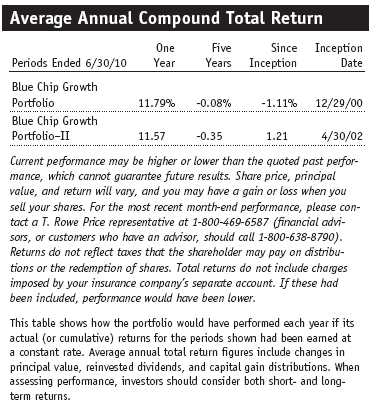
This chart shows the value of a hypothetical $10,000 investment in the portfolio over the past 10 fiscal year periods or since inception (for portfolios lacking 10-year records). The result is compared with benchmarks, which may include a broad-based market index and a peer group average or index. Market indexes do not include expenses, which are deducted from portfolio returns as well as mutual fund averages and indexes.
Fund Expense Example
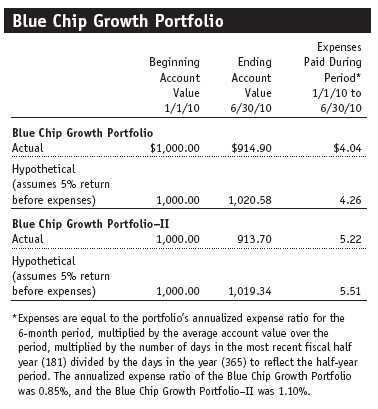
As a mutual fund shareholder, you may incur two types of costs: (1) transaction costs, such as redemption fees or sales loads, and (2) ongoing costs, including management fees, distribution and service (12b-1) fees, and other fund expenses. The following example is intended to help you understand your ongoing costs (in dollars) of investing in the fund and to compare these costs with the ongoing costs of investing in other mutual funds. The example is based on an investment of $1,000 invested at the beginning of the most recent six-month period and held for the entire period.
Shares of the fund are currently offered only through certain insurance companies as an investment medium for both variable annuity contracts and variable life insurance policies. Please note that the fund has two classes of shares: the original share class and II Class. II Class shares are sold through financial intermediaries, which are compensated for distribution, shareholder servicing, and/or certain administrative services under a Board-approved Rule 12b-1 plan.
Actual Expenses
The first line of the following table (“Actual”) provides information about actual account values and actual expenses. You may use the information in this line, together with your account balance, to estimate the expenses that you paid over the period. Simply divide your account value by $1,000 (for example, an $8,600 account value divided by $1,000 = 8.6), then multiply the result by the number in the first line under the heading “Expenses Paid During Period” to estimate the expenses you paid on your account during this period.
Hypothetical Example for Comparison Purposes
The information on the second line of the table (“Hypothetical”) is based on hypothetical account values and expenses derived from the fund’s actual expense ratio and an assumed 5% per year rate of return before expenses (not the fund’s actual return). You may compare the ongoing costs of investing in the fund with other funds by contrasting this 5% hypothetical example and the 5% hypothetical examples that appear in the shareholder reports of the other funds. The hypothetical account values and expenses may not be used to estimate the actual ending account balance or expenses you paid for the period.
You should also be aware that the expenses shown in the table highlight only your ongoing costs and do not reflect any transaction costs, such as redemption fees or sales loads. Therefore, the second line of the table is useful in comparing ongoing costs only and will not help you determine the relative total costs of owning different funds. To the extent a fund charges transaction costs, however, the total cost of owning that fund is higher.
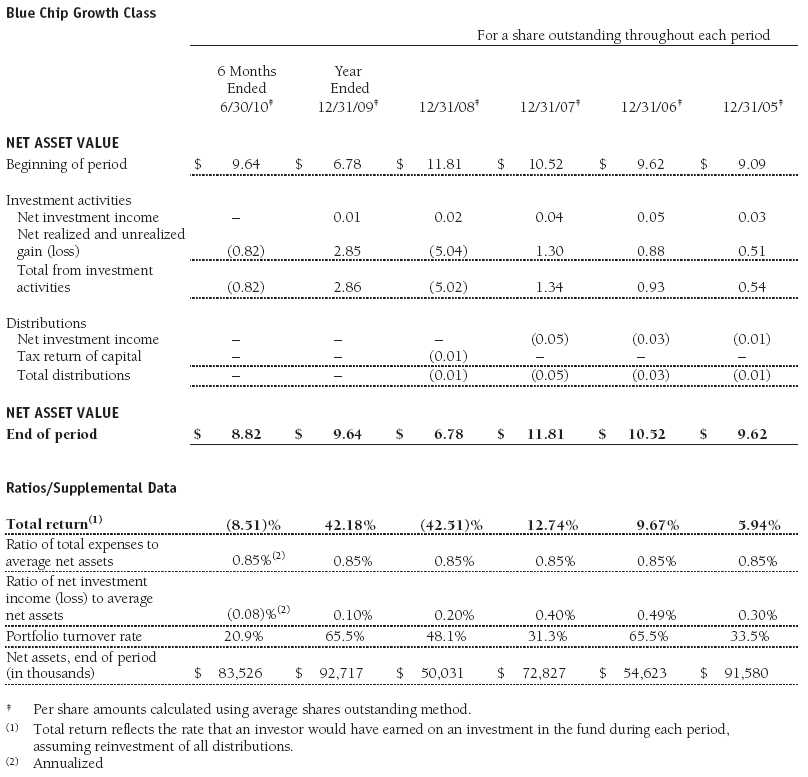
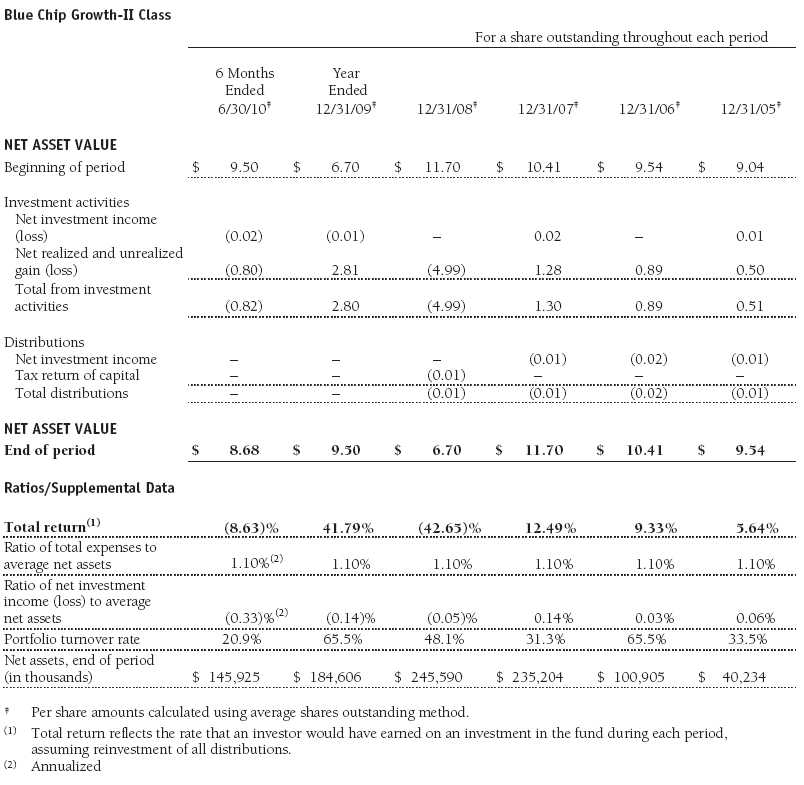
Financial Highlights
T. Rowe Price Blue Chip Growth Portfolio
(Unaudited)
The accompanying notes are an integral part of these financial statements.
Financial Highlights
T. Rowe Price Blue Chip Growth Portfolio
(Unaudited)
The accompanying notes are an integral part of these financial statements.
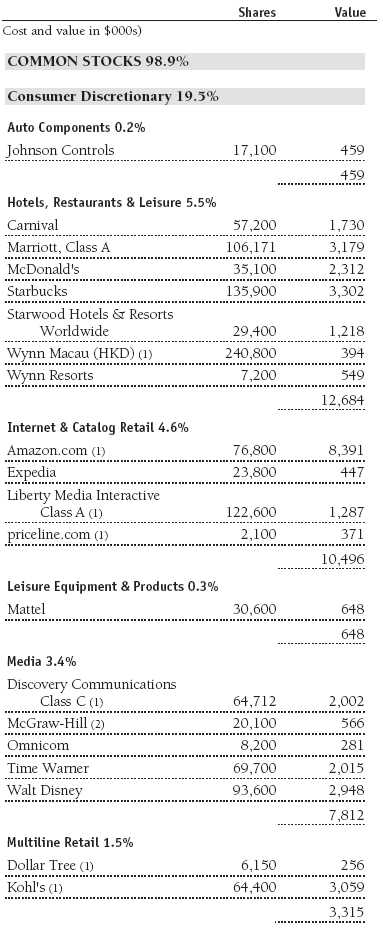
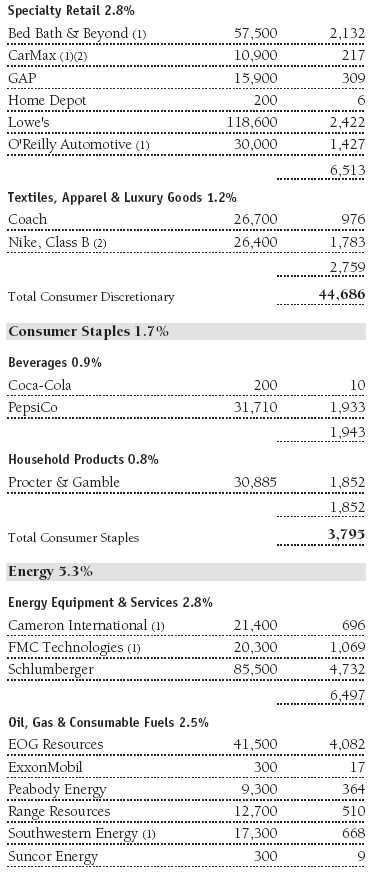
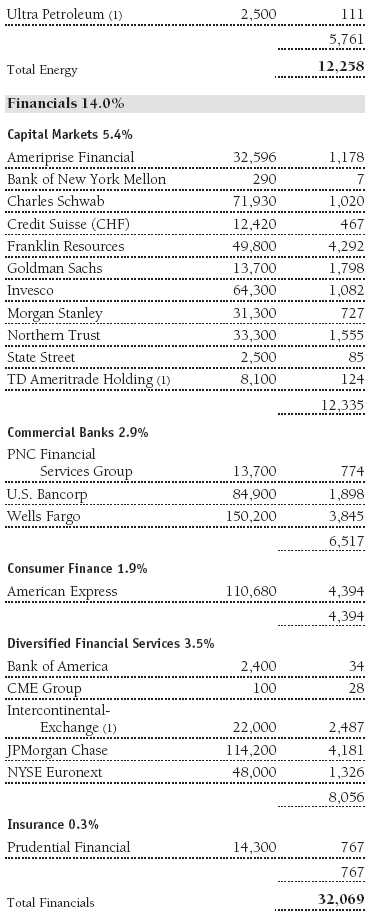
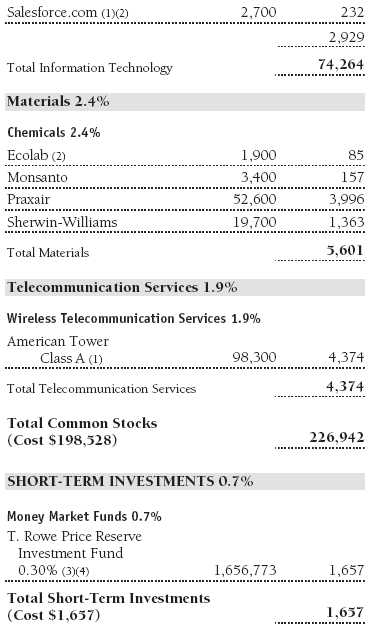
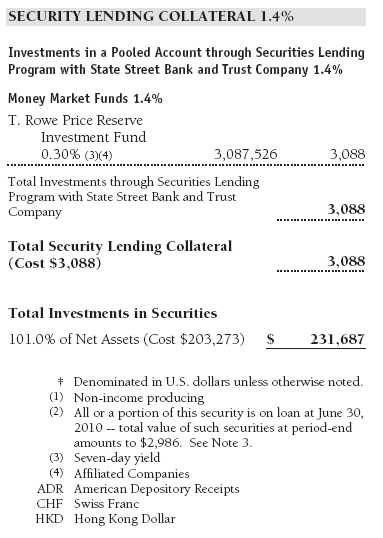
Portfolio of Investments‡
T. Rowe Price Blue Chip Growth Portfolio
June 30, 2010 (Unaudited)
The accompanying notes are an integral part of these financial statements.
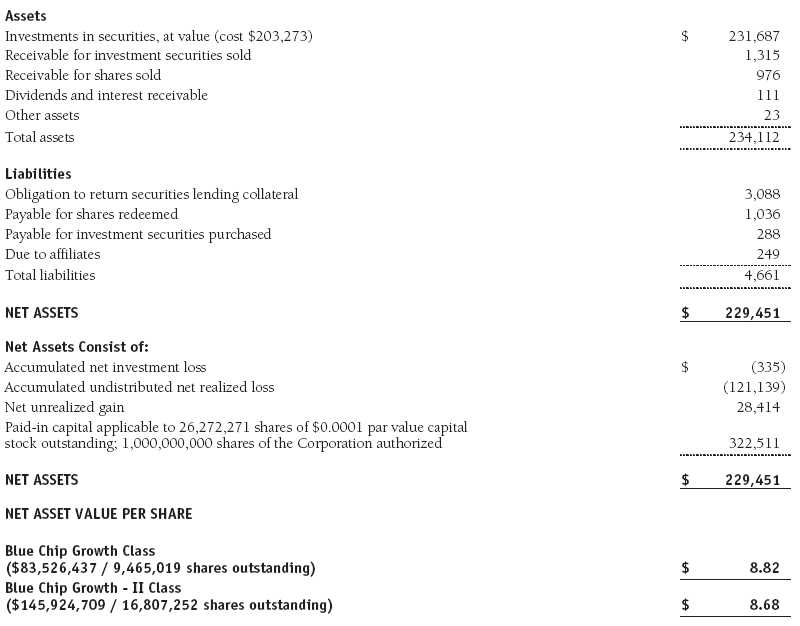
Statement of Assets and Liabilities
T. Rowe Price Blue Chip Growth Portfolio
June 30, 2010 (Unaudited)
($000s, except shares and per share amounts)
The accompanying notes are an integral part of these financial statements.
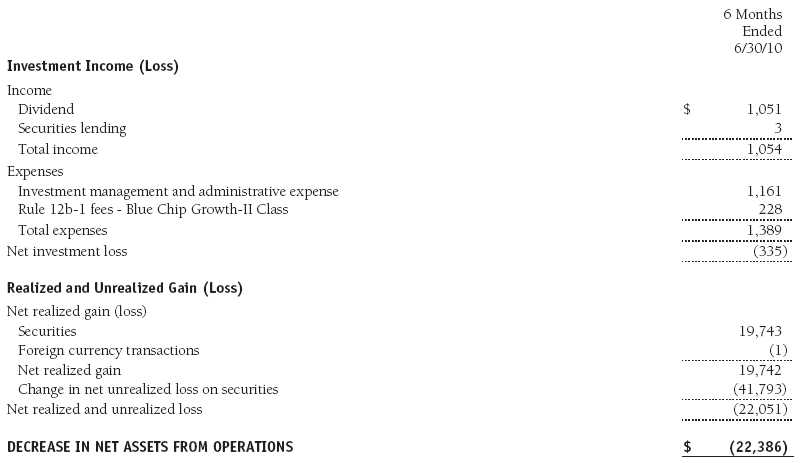
Statement of Operations
T. Rowe Price Blue Chip Growth Portfolio
(Unaudited)
($000s)
The accompanying notes are an integral part of these financial statements.
Statement of Changes in Net Assets
T. Rowe Price Blue Chip Growth Portfolio
(Unaudited)
($000s)
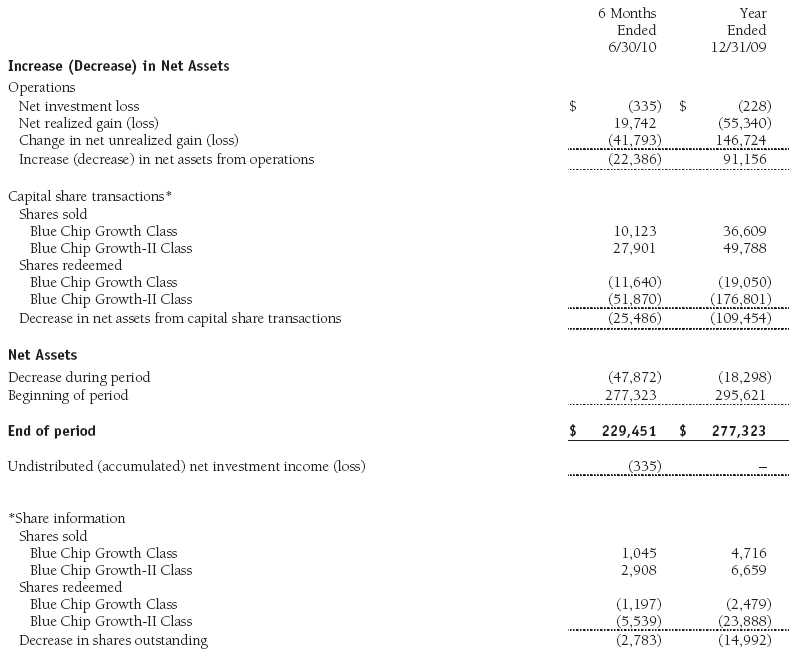
The accompanying notes are an integral part of these financial statements.
Notes to Financial Statements
T. Rowe Price Blue Chip Growth Portfolio
June 30, 2010 (Unaudited)
T. Rowe Price Equity Series, Inc. (the corporation), is registered under the Investment Company Act of 1940 (the 1940 Act). The Blue Chip Growth Portfolio (the fund) is a diversified, open-end management investment company and is one portfolio established by the corporation. The fund seeks to provide long-term capital growth. Income is a secondary objective. Shares of the fund currently are offered only through certain insurance companies as an investment medium for both variable annuity contracts and variable life insurance policies. The fund has two classes of shares: the Blue Chip Growth Portfolio original share class (Blue Chip Growth Class), offered since December 29, 2000, and the Blue Chip Growth Portfolio–II (Blue Chip Growth–II Class), offered since April 30, 2002. Blue Chip Growth–II Class shares are sold through financial intermediaries, which it compensates for distribution, shareholder servicing, and/or certain administrative services under a Board-approved Rule 12b-1 plan. Each class has exclusive voting rights on matters related solely to that class; separate voting rights on matters that relate to both classes; and, in all other respects, the same rights and obligations as the other class.
NOTE 1 - SIGNIFICANT ACCOUNTING POLICIES
Basis of Preparation The accompanying financial statements were prepared in accordance with accounting principles generally accepted in the United States of America (GAAP), which require the use of estimates made by fund management. Fund management believes that estimates and valuations are appropriate; however, actual results may differ from those estimates, and the valuations reflected in the accompanying financial statements may differ from the value ultimately realized upon sale of securities.
Investment Transactions, Investment Income, and Distributions Income and expenses are recorded on the accrual basis. Dividends received from mutual fund investments are reflected as dividend income; capital gain distributions are reflected as realized gain/loss. Dividend income and capital gain distributions are recorded on the ex-dividend date. Income tax-related interest and penalties, if incurred, would be recorded as income tax expense. Investment transactions are accounted for on the trade date. Realized gains and losses are reported on the identified cost basis. Distributions to shareholders are recorded on the ex-dividend date. Income distributions are declared and paid by each class annually. Capital gain distributions, if any, are generally declared and paid by the fund annually.
Currency Translation Assets, including investments, and liabilities denominated in foreign currencies are translated into U.S. dollar values each day at the prevailing exchange rate, using the mean of the bid and asked prices of such currencies against U.S. dollars as quoted by a major bank. Purchases and sales of securities, income, and expenses are translated into U.S. dollars at the prevailing exchange rate on the date of the transaction. The effect of changes in foreign currency exchange rates on realized and unrealized security gains and losses is reflected as a component of security gains and losses.
Class Accounting Blue Chip Growth–II pays distribution, shareholder servicing, and/or certain administrative expenses in the form of Rule 12b-1 fees, in an amount not exceeding 0.25% of the class’s average daily net assets. Investment income, investment management and administrative expense, and realized and unrealized gains and losses are allocated to the classes based upon the relative daily net assets of each class.
Rebates Subject to best execution, the fund may direct certain security trades to brokers who have agreed to rebate a portion of the related brokerage commission to the fund in cash. Commission rebates are reflected as realized gain on securities in the accompanying financial statements and totaled $2,000 for the six months ended June 30, 2010.
New Accounting Pronouncement On January 1, 2010, the fund adopted new accounting guidance that requires enhanced disclosures about fair value measurements in the financial statements. Adoption of this guidance had no impact on the fund’s net assets or results of operations.
NOTE 2 - VALUATION
The fund’s investments are reported at fair value as defined by GAAP. The fund determines the values of its assets and liabilities and computes its net asset value per share at the close of the New York Stock Exchange (NYSE), normally 4 p.m. ET, each day that the NYSE is open for business.
Valuation Methods Equity securities listed or regularly traded on a securities exchange or in the over-the-counter (OTC) market are valued at the last quoted sale price or, for certain markets, the official closing price at the time the valuations are made, except for OTC Bulletin Board securities, which are valued at the mean of the latest bid and asked prices. A security that is listed or traded on more than one exchange is valued at the quotation on the exchange determined to be the primary market for such security. Listed securities not traded on a particular day are valued at the mean of the latest bid and asked prices for domestic securities and the last quoted sale price for international securities.
Investments in mutual funds are valued at the mutual fund’s closing net asset value per share on the day of valuation.
Other investments, including restricted securities, and those financial instruments for which the above valuation procedures are inappropriate or are deemed not to reflect fair value are stated at fair value as determined in good faith by the T. Rowe Price Valuation Committee, established by the fund’s Board of Directors.
For valuation purposes, the last quoted prices of non-U.S. equity securities may be adjusted under the circumstances described below. If the fund determines that developments between the close of a foreign market and the close of the NYSE will, in its judgment, materially affect the value of some or all of its portfolio securities, the fund will adjust the previous closing prices to reflect what it believes to be the fair value of the securities as of the close of the NYSE. In deciding whether it is necessary to adjust closing prices to reflect fair value, the fund reviews a variety of factors, including developments in foreign markets, the performance of U.S. securities markets, and the performance of instruments trading in U.S. markets that represent foreign securities and baskets of foreign securities. A fund may also fair value securities in other situations, such as when a particular foreign market is closed but the fund is open. The fund uses outside pricing services to provide it with closing prices and information to evaluate and/or adjust those prices. The fund cannot predict how often it will use closing prices and how often it will determine it necessary to adjust those prices to reflect fair value. As a means of evaluating its security valuation process, the fund routinely compares closing prices, the next day’s opening prices in the same markets, and adjusted prices.
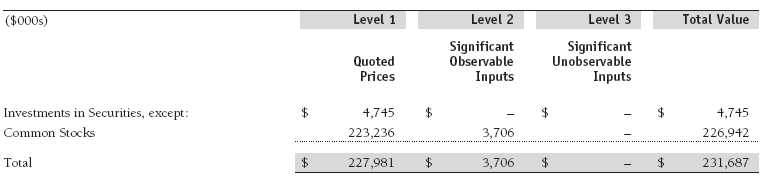
Valuation Inputs Various inputs are used to determine the value of the fund’s financial instruments. These inputs are summarized in the three broad levels listed below:
Level 1 – quoted prices in active markets for identical financial instruments
Level 2 – observable inputs other than Level 1 quoted prices (including, but not limited to, quoted prices for similar financial instruments, interest rates, prepayment speeds, and credit risk)
Level 3 – unobservable inputs
Observable inputs are those based on market data obtained from sources independent of the fund, and unobservable inputs reflect the fund’s own assumptions based on the best information available. The input levels are not necessarily an indication of the risk or liquidity associated with financial instruments at that level. For example, non-U.S. equity securities actively traded in foreign markets generally are reflected in Level 2 despite the availability of closing prices because the fund evaluates and determines whether those closing prices reflect fair value at the close of the NYSE or require adjustment, as described above. The following table summarizes the fund’s financial instruments, based on the inputs used to determine their values on June 30, 2010:
NOTE 3 - OTHER INVESTMENT TRANSACTIONS
Consistent with its investment objective, the fund engages in the following practices to manage exposure to certain risks and/or to enhance performance. The investment objective, policies, program, and risk factors of the fund are described more fully in the fund’s prospectus and Statement of Additional Information.
Securities Lending The fund lends its securities to approved brokers to earn additional income. It receives as collateral cash and U.S. government securities valued at 102% to 105% of the value of the securities on loan. Cash collateral is invested by the fund’s lending agent(s) in accordance with investment guidelines approved by fund management. Although risk is mitigated by the collateral, the fund could experience a delay in recovering its securities and a possible loss of income or value if the borrower fails to return the securities or if collateral investments decline in value. Securities lending revenue recognized by the fund consists of earnings on invested collateral and borrowing fees, net of any rebates to the borrower and compensation to the lending agent. On June 30, 2010, the value of loaned securities was $2,986,000.
Other Purchases and sales of portfolio securities other than short-term securities aggregated $56,017,000 and $82,069,000, respectively, for the six months ended June 30, 2010.
NOTE 4 - FEDERAL INCOME TAXES
No provision for federal income taxes is required since the fund intends to continue to qualify as a regulated investment company under Subchapter M of the Internal Revenue Code and distribute to shareholders all of its taxable income and gains. Distributions determined in accordance with federal income tax regulations may differ in amount or character from net investment income and realized gains for financial reporting purposes. Financial reporting records are adjusted for permanent book/tax differences to reflect tax character but are not adjusted for temporary differences. The amount and character of tax-basis distributions and composition of net assets are finalized at fiscal year-end; accordingly, tax-basis balances have not been determined as of the date of this report.
In accordance with federal tax regulations, the fund recognized capital losses in the current period for tax purposes that had been recognized in the prior fiscal year for financial reporting purposes. Such deferrals relate to net capital losses realized between November 1, 2009 and December 31, 2009 and totaled $397,000. The fund intends to retain realized gains to the extent of available capital loss carryforwards. As of December 31, 2009, the fund had $126,534,000 of unused capital loss carryforwards, which expire: $491,000 in fiscal 2010, $335,000 in fiscal 2011, $1,272,000 in fiscal 2013, $902,000 in fiscal 2014, $1,282,000 in fiscal 2015, $43,234,000 in fiscal 2016, and $79,018,000 in fiscal 2017.
At June 30, 2010, the cost of investments for federal income tax purposes was $203,273,000. Net unrealized gain aggregated $28,414,000 at period-end, of which $36,127,000 related to appreciated investments and $7,713,000 related to depreciated investments.
NOTE 5 - RELATED PARTY TRANSACTIONS
The fund is managed by T. Rowe Price Associates, Inc. (the manager or Price Associates), a wholly owned subsidiary of T. Rowe Price Group, Inc. The investment management and administrative agreement between the fund and the manager provides for an all-inclusive annual fee equal to 0.85% of the fund’s average daily net assets. The fee is computed daily and paid monthly. The agreement provides that investment management, shareholder servicing, transfer agency, accounting, custody services, and directors’ fees and expenses are provided to the fund, and interest, taxes, brokerage commissions, and extraordinary expenses are paid directly by the fund.
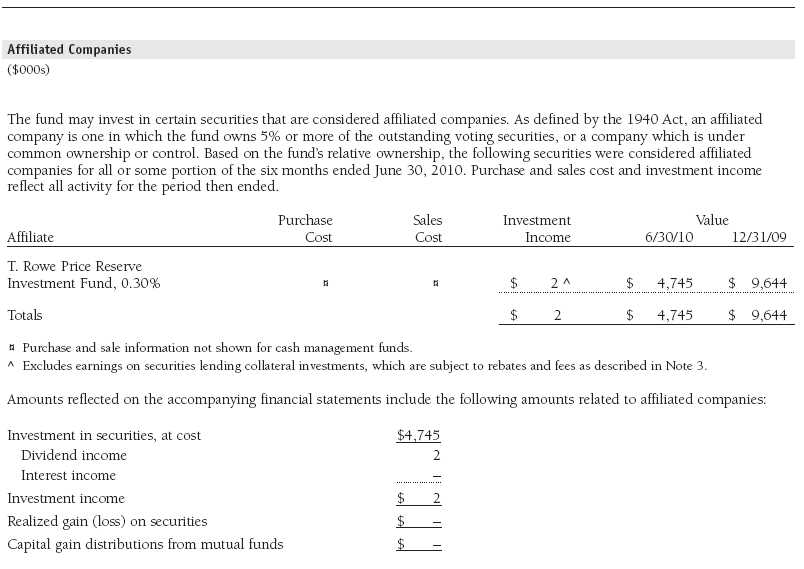
The fund may invest in the T. Rowe Price Reserve Investment Fund and the T. Rowe Price Government Reserve Investment Fund (collectively, the T. Rowe Price Reserve Investment Funds), open-end management investment companies managed by Price Associates and considered affiliates of the fund. The T. Rowe Price Reserve Investment Funds are offered as cash management options to mutual funds, trusts, and other accounts managed by Price Associates and/or its affiliates and are not available for direct purchase by members of the public. The T. Rowe Price Reserve Investment Funds pay no investment management fees.
| Information on Proxy Voting Policies, Procedures, and Records |
A description of the policies and procedures used by T. Rowe Price funds and portfolios to determine how to vote proxies relating to portfolio securities is available in each fund’s Statement of Additional Information, which you may request by calling 1-800-225-5132 or by accessing the SEC’s Web site, www.sec.gov. The description of our proxy voting policies and procedures is also available on our Web site, www.troweprice.com. To access it, click on the words “Our Company” at the top of our corporate homepage. Then, when the next page appears, click on the words “Proxy Voting Policies” on the left side of the page.
Each fund’s most recent annual proxy voting record is available on our Web site and through the SEC’s Web site. To access it through our Web site, follow the directions above, then click on the words “Proxy Voting Records” on the right side of the Proxy Voting Policies page.
| How to Obtain Quarterly Portfolio Holdings |
The fund files a complete schedule of portfolio holdings with the Securities and Exchange Commission for the first and third quarters of each fiscal year on Form N-Q. The fund’s Form N-Q is available electronically on the SEC’s Web site (www.sec.gov); hard copies may be reviewed and copied at the SEC’s Public Reference Room, 450 Fifth St. N.W., Washington, DC 20549. For more information on the Public Reference Room, call 1-800-SEC-0330.
| Approval of Investment Management Agreement |
On March 9, 2010, the fund’s Board of Directors (Board) unanimously approved the continuation of the investment advisory contract (Contract) between the fund and its investment manager, T. Rowe Price Associates, Inc. (Adviser). The Board considered a variety of factors in connection with its review of the Contract, also taking into account information provided by the Adviser during the course of the year, as discussed below:
Services Provided by the Adviser
The Board considered the nature, quality, and extent of the services provided to the fund by the Adviser. These services included, but were not limited to, management of the fund’s portfolio and a variety of related activities, as well as financial and administrative services, reporting, and communications. The Board also reviewed the background and experience of the Adviser’s senior management team and investment personnel involved in the management of the fund. The Board concluded that it was satisfied with the nature, quality, and extent of the services provided by the Adviser.
Investment Performance of the Fund
The Board reviewed the fund’s average annual total returns over the one-, three-, and five-year and since-inception periods, as well as the fund’s year-by-year returns, and compared these returns with a wide variety of previously agreed upon comparable performance measures and market data, including those supplied by Lipper and Morningstar, which are independent providers of mutual fund data. On the basis of this evaluation and the Board’s ongoing review of investment results, and factoring in the severity of the market turmoil during 2008 and 2009, the Board concluded that the fund’s performance was satisfactory.
Costs, Benefits, Profits, and Economies of Scale
The Board reviewed detailed information regarding the revenues received by the Adviser under the Contract and other benefits that the Adviser (and its affiliates) may have realized from its relationship with the fund, including research received under “soft dollar” agreements and commission-sharing arrangements with broker-dealers. The Board considered that the Adviser may receive some benefit from its soft-dollar arrangements pursuant to which it receives research from broker-dealers that execute the applicable fund’s portfolio transactions. The Board also received information on the estimated costs incurred and profits realized by the Adviser and its affiliates from advising T. Rowe Price mutual funds, as well as estimates of the gross profits realized from managing the fund in particular. The Board concluded that the Adviser’s profits were reasonable in light of the services provided to the fund. The Board also considered whether the fund or other funds benefit under the fee levels set forth in the Contract from any economies of scale realized by the Adviser. The Board noted that, under the Contract, the fund pays the Adviser a single fee based on the fund’s assets and that the Adviser, in turn, pays all expenses of the fund, with certain exceptions. The Board concluded that, based on the profitability data it reviewed and consistent with this single-fee structure, the Contract provided for a reasonable sharing of any benefits from economies of scale with the fund.
Fees
The Board reviewed the fund’s single-fee structure (for the Investor Class and II Class) and compared it with fees and expenses of other comparable funds based on information and data supplied by Lipper. The information provided to the Board indicated that the fund’s management fee rate was above the median for comparable funds. (For these purposes, the Board assumed the fund’s management fee rate was equal to the single fee less the fund’s operating expenses.) The information also indicated that the fund’s total expense ratio (for the Investor Class) was at or below the median for comparable funds, and the fund’s total expense ratio (for the II Class) was above the median for comparable funds. The Board also reviewed the fee schedules for institutional accounts of the Adviser and its affiliates with smaller mandates. Management informed the Board that the Adviser’s responsibilities for institutional accounts are more limited than its responsibilities for the fund and other T. Rowe Price mutual funds that it or its affiliates advise and that the Adviser performs significant additional services and assumes greater risk for the fund and other T. Rowe Price mutual funds that it advises than it does for institutional accounts. On the basis of the information provided, the Board concluded that the fees paid by the fund under the Contract were reasonable.
Approval of the Contract
As noted, the Board approved the continuation of the Contract. No single factor was considered in isolation or to be determinative to the decision. Rather, the Board was assisted by the advice of independent legal counsel and concluded, in light of a weighting and balancing of all factors considered, that it was in the best interests of the fund to approve the continuation of the Contract, including the fees to be charged for services thereunder.
Item 2. Code of Ethics.
A code of ethics, as defined in Item 2 of Form N-CSR, applicable to its principal executive officer, principal financial officer, principal accounting officer or controller, or persons performing similar functions is filed as an exhibit to the registrant’s annual Form N-CSR. No substantive amendments were approved or waivers were granted to this code of ethics during the registrant’s most recent fiscal half-year.
Item 3. Audit Committee Financial Expert.
Disclosure required in registrant’s annual Form N-CSR.
Item 4. Principal Accountant Fees and Services.
Disclosure required in registrant’s annual Form N-CSR.
Item 5. Audit Committee of Listed Registrants.
Not applicable.
Item 6. Investments.
(a) Not applicable. The complete schedule of investments is included in Item 1 of this Form N-CSR.
(b) Not applicable.
Item 7. Disclosure of Proxy Voting Policies and Procedures for Closed-End Management Investment Companies.
Not applicable.
Item 8. Portfolio Managers of Closed-End Management Investment Companies.
Not applicable.
Item 9. Purchases of Equity Securities by Closed-End Management Investment Company and Affiliated Purchasers.
Not applicable.
Item 10. Submission of Matters to a Vote of Security Holders.
Not applicable.
Item 11. Controls and Procedures.
(a) The registrant’s principal executive officer and principal financial officer have evaluated the registrant’s disclosure controls and procedures within 90 days of this filing and have concluded that the registrant’s disclosure controls and procedures were effective, as of that date, in ensuring that information required to be disclosed by the registrant in this Form N-CSR was recorded, processed, summarized, and reported timely.
(b) The registrant’s principal executive officer and principal financial officer are aware of no change in the registrant’s internal control over financial reporting that occurred during the registrant’s second fiscal quarter covered by this report that has materially affected, or is reasonably likely to materially affect, the registrant’s internal control over financial reporting.
Item 12. Exhibits.
(a)(1) The registrant’s code of ethics pursuant to Item 2 of Form N-CSR is filed with the registrant’s annual Form N-CSR.
(2) Separate certifications by the registrant's principal executive officer and principal financial officer, pursuant to Section 302 of the Sarbanes-Oxley Act of 2002 and required by Rule 30a-2(a) under the Investment Company Act of 1940, are attached.
(3) Written solicitation to repurchase securities issued by closed-end companies: not applicable.
(b) A certification by the registrant's principal executive officer and principal financial officer, pursuant to Section 906 of the Sarbanes-Oxley Act of 2002 and required by Rule 30a-2(b) under the Investment Company Act of 1940, is attached.
| | |
SIGNATURES |
| |
| | Pursuant to the requirements of the Securities Exchange Act of 1934 and the Investment |
| Company Act of 1940, the registrant has duly caused this report to be signed on its behalf by the |
| undersigned, thereunto duly authorized. |
| |
| T. Rowe Price Equity Series, Inc. |
| |
| |
| |
| By | /s/ Edward C. Bernard |
| | Edward C. Bernard |
| | Principal Executive Officer |
| |
| Date | August 17, 2010 |
| |
| |
| |
| | Pursuant to the requirements of the Securities Exchange Act of 1934 and the Investment |
| Company Act of 1940, this report has been signed below by the following persons on behalf of |
| the registrant and in the capacities and on the dates indicated. |
| |
| |
| By | /s/ Edward C. Bernard |
| | Edward C. Bernard |
| | Principal Executive Officer |
| |
| Date | August 17, 2010 |
| |
| |
| |
| By | /s/ Gregory K. Hinkle |
| | Gregory K. Hinkle |
| | Principal Financial Officer |
| |
| Date | August 17, 2010 |