| UNITED STATES |
| SECURITIES AND EXCHANGE COMMISSION |
| Washington, D.C. 20549 |
| |
FORM N-CSR |
| |
CERTIFIED SHAREHOLDER REPORT OF REGISTERED |
MANAGEMENT INVESTMENT COMPANIES |
| |
| |
| |
| Investment Company Act File Number: 811-07143 |
|
| |
| T. Rowe Price Equity Series, Inc. |
|
| (Exact name of registrant as specified in charter) |
| |
| 100 East Pratt Street, Baltimore, MD 21202 |
|
| (Address of principal executive offices) |
| |
| David Oestreicher |
| 100 East Pratt Street, Baltimore, MD 21202 |
|
| (Name and address of agent for service) |
| |
| |
| Registrant’s telephone number, including area code: (410) 345-2000 |
| |
| |
| Date of fiscal year end: December 31 |
| |
| |
| Date of reporting period: June 30, 2010 |
Item 1: Report to Shareholders| Health Sciences Portfolio | June 30, 2010 |
• Health care stocks declined in the six-month period ended June 30, 2010, due in part to the uncertainty that still surrounds health care reform legislation.
• The Health Sciences Portfolio outperformed the broad market, as measured by the S&P 500 Index, and its Lipper peer group in the first half of the year.
• We believe that generating outperformance in the health care sector will depend more on stock selection than on an emphasis on a particular industry within the asset class.
• We remain focused on investing in companies that are developing new and important medicines for unmet medical needs, as well as companies whose business models decrease costs or improve quality in our health care system.
The views and opinions in this report were current as of June 30, 2010. They are not guarantees of performance or investment results and should not be taken as investment advice. Investment decisions reflect a variety of factors, and the managers reserve the right to change their views about individual stocks, sectors, and the markets at any time. As a result, the views expressed should not be relied upon as a forecast of the fund’s future investment intent. The report is certified under the Sarbanes-Oxley Act, which requires mutual funds and other public companies to affirm that, to the best of their knowledge, the information in their financial reports is fairly and accurately stated in all material respects.
Manager’s Letter
T. Rowe Price Health Sciences Portfolio
Dear Investor
Health care stocks posted good gains in the first quarter but retrenched in the second. The major issues that continue to trouble the sector are uncertainty about the impact of health care reform legislation and overall decreased utilization of health care services due to the extremely weak economy. The President’s health care bill has become law, but there are still many unknowns relating to its interpretation and implementation. In this environment, health care service providers and distribution companies performed the best. At the same time, the pharmaceuticals sector generated lackluster returns. Looking ahead, we remain optimistic about the long-term potential for health care stocks.
Performance Comparison
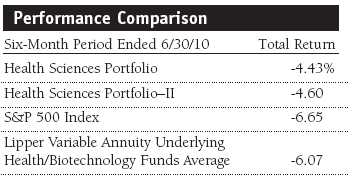
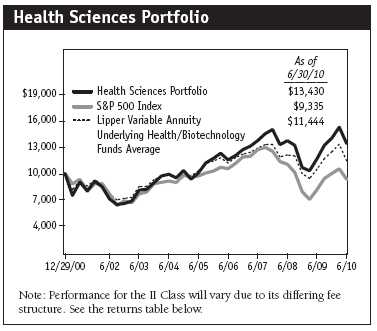
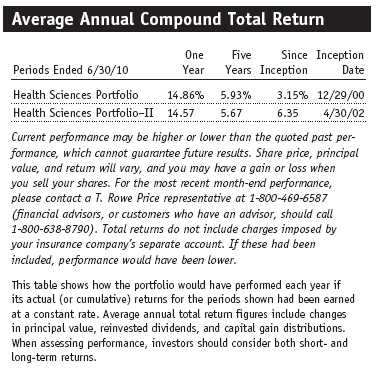
The Health Sciences Portfolio returned -4.43% but outperformed the S&P 500 Index and the Lipper Variable Annuity Underlying Health/Biotechnology Funds Average for the six months ended June 30, 2010, as shown in the Performance Comparison table. In its comparison with the Lipper peer group, the portfolio benefited from stock selection, especially in the pharmaceuticals, services, and products and devices sectors. The portfolio also benefited from overall allocation decisions, which were particularly good in pharmaceuticals and biotechnology, although stock selection in biotechnology hurt our relative results.
The Health Sciences Portfolio has delivered consistently strong longer-term performance compared with the Lipper universe of variable annuity underlying health/biotechnology funds. Lipper ranked the portfolio best in its health care funds universe for the five-year period ended June 30, 2010. (Based on cumulative total return, Lipper ranked the Health Sciences Portfolio 4 out of 30, 4 out of 29, and 1 out of 25 funds for the 1-, 3-, and 5-year periods ended June 30, 2010, respectively. Past performance cannot guarantee future results.)
Market Environment
Following a strong start in the first quarter of this year, stock markets turned lower in the second quarter. Recent economic data prompted investors to reassess the durability of the economic rebound. The remarkable market rally that started in March 2009 came to an end as risk became a central focus for investors. Within the Lipper Variable Annuity Underlying Health/Biotechnology Funds Average, every segment in the sector declined. Although sciences, biotechnology, and services were the best-performing segments in the benchmark, pharmaceuticals posted the largest losses. As we’ve written in previous shareholder reports, we select stocks based on their individual merit, and we believe stock selection will have a greater effect on our performance than industry allocation decisions.
Health Care Reform: A Game Changer
Contributing to the turmoil in the health care sector was uncertainty about one of the most sweeping pieces of reform legislation to come out of Congress in several decades. We believe there are three principal goals in the President’s health care reform initiative. The first is to decrease the number of uninsured in the country—there are now approximately 32 million uninsured that will be coming into the insurance pool starting in 2014. The second goal is to control, or at least slow, the rising cost of health care. Goal number three is to improve overall health care outcomes—providing society with more health care benefits at a lower cost. However, we are not convinced that all three can be achieved. The new law will certainly afford millions more Americans access to health care, but we think it will likely cost more, and the jury is out on whether the health care outcomes will be better. Because of the potentially negative implications for cost, there is a reasonable chance of a second round of health care reform in the coming decade.
The real question for investors is whether this legislation is good for companies in the health care sector. In a nutshell, we believe that certain companies will realize short-term benefits, but the longer-term impact on the industry is likely to be neutral to negative. We think the legislation avoided the worst possible outcomes—we did not end up with a single-payer system, and we do not have price controls. However, the bad news is that unintended consequences of the legislation may result from its scope, complexity, substantial requirement for regulatory issuance, and rushed enactment.
In broad brush strokes, we think the potential winners are going to be companies that provide Medicaid-related services, for-profit hospitals, health care information technology companies, and businesses that have a volume-driven component to them. We have less conviction that pharmaceuticals, biotechnology, and medical device companies will benefit. The managed care industry, on the other hand, will be affected negatively by reform. That said, there are going to be solid investment opportunities throughout the entire health care sector. We think it is important to remember that health care legislation is just one aspect of health care investing, and our focus remains rooted in company-specific analysis.
Strategy Review
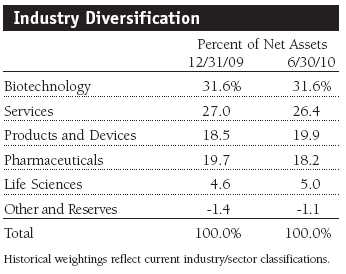
The portfolio’s large allocation to the biotechnology and pharmaceuticals segments stems from our belief that the pharmaceutical industry’s business model—the discovery, development, manufacture, and commercialization of medicines—is the primary driver of long-term value in the health care sector. Typically, large pharmaceutical companies have a broad base of revenues and income, and one drug—even if it is extremely successful—may not be enough to affect the bottom line significantly. Biotechnology companies, however, tend to be smaller, and the successful introduction of one important new medicine can materially affect a company’s revenues and earnings. Our goal in managing the portfolio is on owning the best companies that can perform well, regardless of the activities in Washington. We intend to remain focused on those companies with new and important medicines or treatments for unmet medical needs, as well as companies whose business models decrease costs or improve quality in our health care system.
Portfolio Review
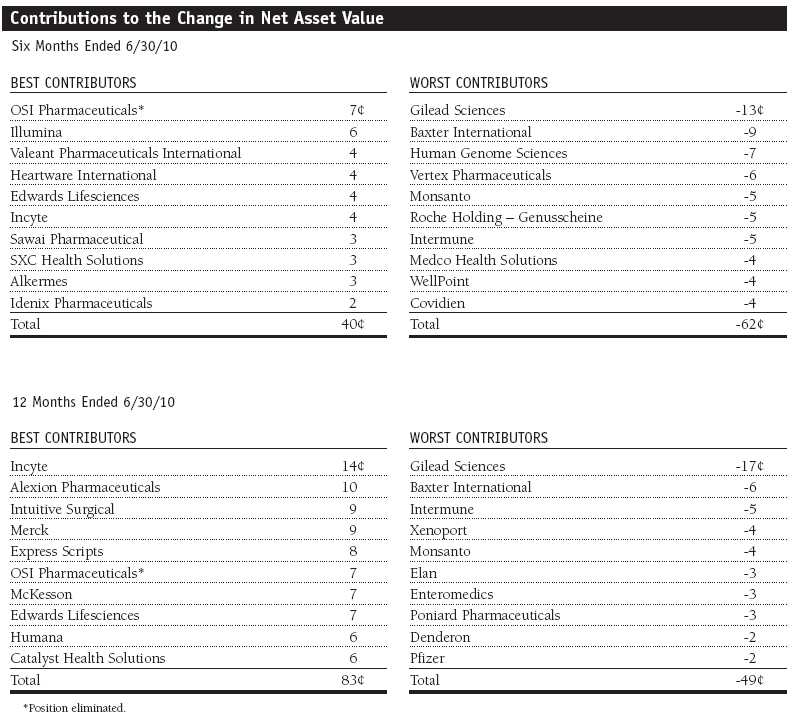
The portfolio’s best contributor in the past six months was OSI Pharmaceuticals. OSI’s shares surged due to a hostile takeover by Astellas Pharma (based in Japan). The $57.50 all-cash transaction represented a 55% premium to the stock’s price on February 26, 2010, the day prior to the announcement. We think the sale price was fair based on our assumptions of OSI’s sole product, Tarceva, and the company’s intermediate-stage pipeline of products. (Please refer to the portfolio of investments for a complete list of holdings and the amount each represents in the portfolio.)
We think it is difficult to make a case for buyouts as a consistently winning investment theme across the entirety of the small-cap biotech space. However, given the paucity of product opportunities across the global pharmaceutical industry right now—and the number of subscale “one-trick biotech ponies”—acceleration in merger and acquisition activity is likely and is part of our current investment decision-making process. Small- and mid-cap stocks in the health care sector have outperformed large-caps all year, and we think that merger activity, and the “who’s next” mentality, fueled some of the returns. We also generated solid gains when small-cap Facet Biotech was purchased by Abbott Laboratories. Consolidation is not a new theme, but the pace and breadth of the activity earlier this year amplified its importance. We have started to see investor sentiment improve, and companies with similar profiles are benefiting.
Our second-best performer, Illumina, develops, manufactures, and markets systems that analyze genetic variation and biological function. Its customers include genomic research centers, pharmaceutical companies, academic institutions, clinical research organizations, and biotechnology companies. In addition, the firm’s individual genome sequencing service can provide information about ancestry, potential response to drugs, and predisposition to health conditions for individuals. Illumina reported better-than-expected first-quarter results. Revenues were up 16% from the year-ago period, and earnings beat Wall Street’s consensus forecast.
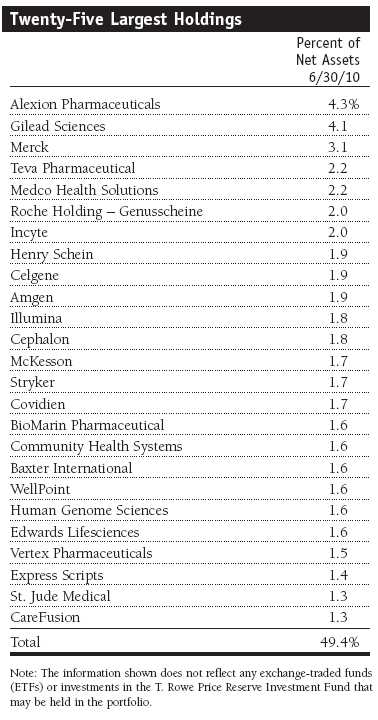
We modestly added to our Illumina position over the last six months, but the primary reason the stock has moved into our list of 25 largest holdings is its near 50% share price advance. The company’s prospects look bright. Its order backlog stands near $250 million, consumables and instrument revenues both advanced at a double-digit clip, and service revenues and gross margins were outstanding.
Incyte, another strong contributor, was among the portfolio’s top holdings, and its shares rose about 40% in the first half. The small-capitalization biotech company is engaged in small-molecule drug discovery and development focused on oncology, hematology, and chronic inflammatory and autoimmune diseases. Its major product is INCB18424 (424). The drug is in Phase III clinical trial for myelofibrosis (a disorder of the bone marrow that disrupts the body’s normal production of blood cells and can cause severe anemia, weakness, and fatigue). 424 is being developed in a partnership with Novartis.
Pharmasset, Cardiome Pharma, Acorda Therapeutics, and Regeneron Pharmaceuticals are similarly well positioned in the small-cap biotech space, and each was a good contributor for the past six months. Owning small-cap companies encompasses more risk than investing in large-caps that have a larger product base because a firm that is highly dependent on the success of a single drug can decline significantly on bad news. We manage this risk in part by owning a diversified basket of stocks and by controlling our position sizes.
The portfolio’s second-largest position, Gilead Sciences, was our largest detractor. The company is dominant in its core therapeutics business and continues to generate strong sales and earnings growth, particularly with its suite of drugs for the treatment of HIV. Gilead and pharmaceutical giant Bristol-Myers Squibb partnered to produce and market Atripla, a once-a-day pill that combines two of Gilead’s HIV medicines and one of Bristol-Myers’. The drug continues to generate robust sales. We remain impressed and confident in Gilead’s management team and its history of good execution in all aspects of its business. We believe the sell-off, on concerns about patent expirations that will occur later in the decade, is overdone.
Baxter International was another large detractor. Shares of the medical supply company cascaded in the second quarter—to multiyear lows—after the firm lowered its earnings guidance for 2010. The reduced forecast stemmed from costs associated with the health care reform legislation, soft demand for the company’s plasma products (which represent about 20% of the firm’s revenue), and news that the Food and Drug Administration (FDA) wants to recall Baxter’s Colleague infusion pumps. The FDA has asserted that the company has failed to address problems with the pumps, which could lead to a charge of approximately $400 million to $600 million for the 200,000 pumps that may be in use. Although Baxter reported double-digit revenue and earnings gains in the first quarter, full-year sales and earnings in 2010 are expected to be fairly flat. We believe the stock’s weakness is temporary and that the company can generate solid margins and earnings growth in 2011.
Human Genome Sciences, one of our best contributors in 2009, was a major detractor in the first half of 2010. The stock fell about 25% from its price at the end of 2009. The company’s success is tied to the successful launch of its lupus drug Benlysta, expected later this year or in early 2011, in a partnership agreement with GlaxoSmithKline. We favor companies that can bring to market novel drugs for unmet serious medical needs, and it seems that Benlysta is among the few of those that can—no new drugs for lupus have been approved in more than 50 years. Benlysta is currently under regulatory review in the U.S. and Europe.
While most of the portfolio’s investments are in U.S. common stocks, the portfolio will selectively invest in non-U.S. companies. Over the past six months, the portfolio’s holdings in overseas investments generated losses in part due to the strength of the U.S. dollar. Additionally, the portfolio writes call and put options primarily as a means of augmenting income. Normally, the portfolio will own the securities on which it writes these options. The premium income recovered by writing covered calls can help reduce, but not eliminate, portfolio volatility. Over the past six months, the options strategy modestly detracted from the portfolio’s results.
Outlook
The long-term outlook for the health care sector appears promising, although the shorter-term prospects remain cloudy as a result of health care reform legislation. We believe the uncertainty regarding reform has been diminished with its passage but not completely eliminated because there is ambiguity about how it will be implemented. We think that investors will begin to see the health care sector in a more favorable light if the economy continues to languish because it is one of the more stable sectors. Traditionally, health care has been in favor when there is increased concern about economic activity. When investors are concerned about slowing growth and economic turmoil, either domestic or international, the very steady returns that the health care sector provides become increasingly attractive.
From a multiyear perspective, health care looks extremely attractive on a valuation basis. We think the elements are in place for health care to be a good performer. It is likely that we will see pockets of exciting performance within the two areas that the portfolio continues to emphasize—the introduction of highly innovative, important new medical products and businesses in the health care services area that provide quality outcomes in a cost-effective manner. The other positive long-term dynamics, which we have addressed previously, include demographics (the rising number of baby boomers reaching retirement age); the pace of scientific advances and prospects for safer and better medicines; and finally, demand for a higher quality of life and society’s willingness to spend on health care.
In our view, the biggest near-term risk to performance is that areas outside of health care begin to flourish. When the broad market’s earnings prospects are improving, and investor sentiment favors riskier investments, health care could be a relative underperformer. Another significant risk for our sector is that there just isn’t a steady flow of important new therapies to really entice investors to come into health care. To compete effectively with other sectors, health care needs to improve the flow of new products that drive substantial revenue in earnings growth. Finally, we see government pricing and price controls as a potential risk for the sector. Innovation in health care is extremely difficult, time consuming, and expensive. If companies do not have the prospect of generating a decent return for all of that upfront effort, we will not have much innovation.
Despite the potential challenges and uncertainties, we think the sector holds tremendous opportunity. We have an aging population that demands the best in health care, and an explosion in scientific understanding should lead to better medicines. Much of the spending on health care is tied to Medicare, which should provide a stable source of funding. Additionally, the need for health care and medicines is not viewed as discretionary; people will spend to maintain their health no matter what the stock market does. As long as society continues to desire new therapies to soften the impact of disease and government price controls are not imposed, health care should remain an area of significant growth for the long term.
We appreciate your continued confidence and support.
Respectfully submitted,

Kris H. Jenner
Chairman of the portfolio’s Investment Advisory Committee
July 15, 2010
The committee chairman has day-to-day responsibility for managing the portfolio and works with committee members in developing and executing its investment program.
| Risks of Growth Investing |
Growth stocks can be volatile for several reasons. Since these companies usually invest a high portion of earnings in their businesses, they may lack the dividends of value stocks that can cushion stock prices in a falling market. Also, earnings disappointments often lead to sharply falling prices because investors buy growth stocks in anticipation of superior earnings growth.
| Risks of Health Sciences Portfolio Investing |
Portfolios that invest only in specific industries will experience greater volatility than portfolios investing in a broad range of industries. Companies in the health sciences field are subject to special risks such as increased competition within the health care industry, changes in legislation or government regulations, reductions in government funding, product liability or other litigation, and the obsolescence of popular products.
Lipper average: The average return of all portfolios in a particular category as tracked by Lipper Inc.
Lipper index: Fund benchmarks that consist of a small number of the largest mutual funds in a particular category as tracked by Lipper Inc.
S&P 500 Index: An index consisting of 500 stocks chosen for market size, liquidity, and industry group representation. It is a market value-weighted index, with each stock’s weight in the index proportionate to its market value.
Portfolio Highlights
Performance and Expenses
T. Rowe Price Health Sciences Portfolio
This chart shows the value of a hypothetical $10,000 investment in the portfolio over the past 10 fiscal year periods or since inception (for portfolios lacking 10-year records). The result is compared with benchmarks, which may include a broad-based market index and a peer group average or index. Market indexes do not include expenses, which are deducted from portfolio returns as well as mutual fund averages and indexes.
Fund Expense Example
As a mutual fund shareholder, you may incur two types of costs: (1) transaction costs, such as redemption fees or sales loads, and (2) ongoing costs, including management fees, distribution and service (12b-1) fees, and other fund expenses. The following example is intended to help you understand your ongoing costs (in dollars) of investing in the fund and to compare these costs with the ongoing costs of investing in other mutual funds. The example is based on an investment of $1,000 invested at the beginning of the most recent six-month period and held for the entire period.
Shares of the fund are currently offered only through certain insurance companies as an investment medium for both variable annuity contracts and variable life insurance policies. Please note that the fund has two classes of shares: the original share class and II Class. II Class shares are sold through financial intermediaries, which are compensated for distribution, shareholder servicing, and/or certain administrative services under a Board-approved Rule 12b-1 plan.
Actual Expenses
The first line of the following table (“Actual”) provides information about actual account values and actual expenses. You may use the information in this line, together with your account balance, to estimate the expenses that you paid over the period. Simply divide your account value by $1,000 (for example, an $8,600 account value divided by $1,000 = 8.6), then multiply the result by the number in the first line under the heading “Expenses Paid During Period” to estimate the expenses you paid on your account during this period.
Hypothetical Example for Comparison Purposes
The information on the second line of the table (“Hypothetical”) is based on hypothetical account values and expenses derived from the fund’s actual expense ratio and an assumed 5% per year rate of return before expenses (not the fund’s actual return). You may compare the ongoing costs of investing in the fund with other funds by contrasting this 5% hypothetical example and the 5% hypothetical examples that appear in the shareholder reports of the other funds. The hypothetical account values and expenses may not be used to estimate the actual ending account balance or expenses you paid for the period.
You should also be aware that the expenses shown in the table highlight only your ongoing costs and do not reflect any transaction costs, such as redemption fees or sales loads. Therefore, the second line of the table is useful in comparing ongoing costs only and will not help you determine the relative total costs of owning different funds. To the extent a fund charges transaction costs, however, the total cost of owning that fund is higher.

Financial Highlights
T. Rowe Price Health Sciences Portfolio
(Unaudited)
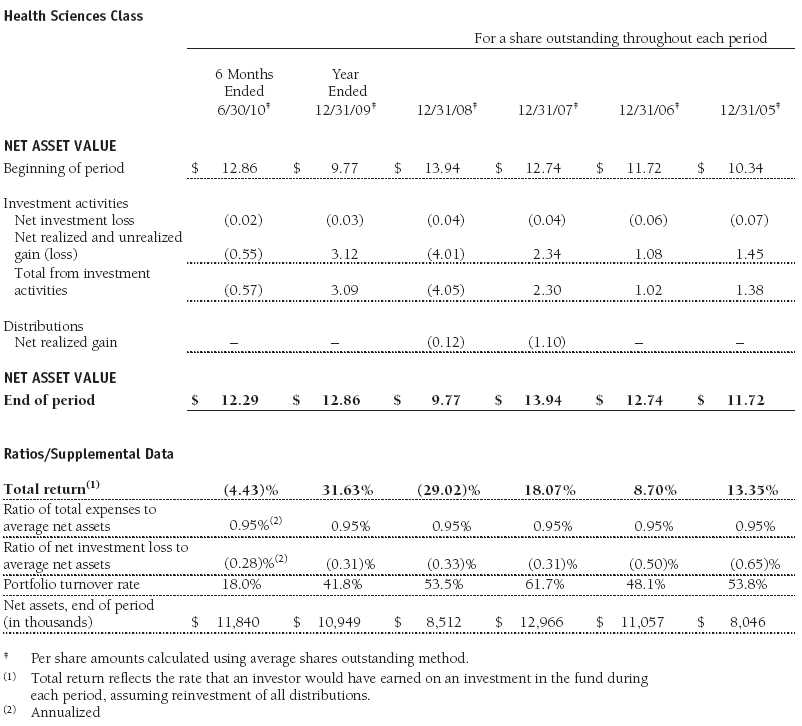
The accompanying notes are an integral part of these financial statements.
Financial Highlights
T. Rowe Price Health Sciences Portfolio
(Unaudited)
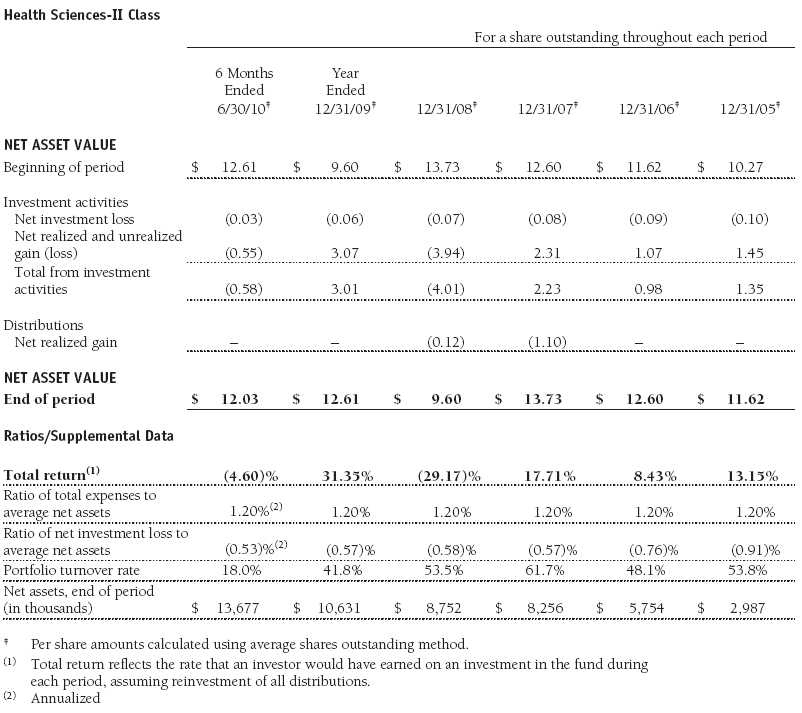
The accompanying notes are an integral part of these financial statements.
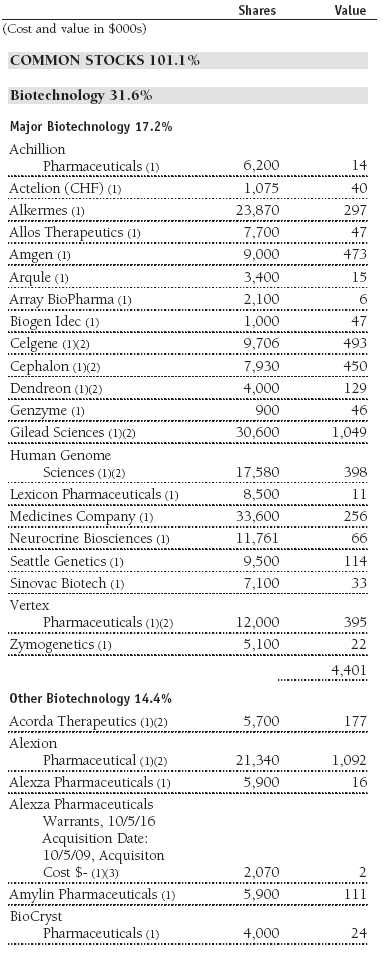
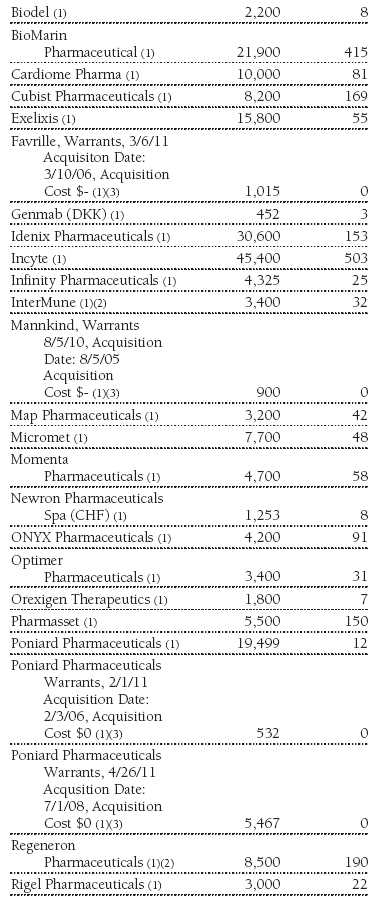
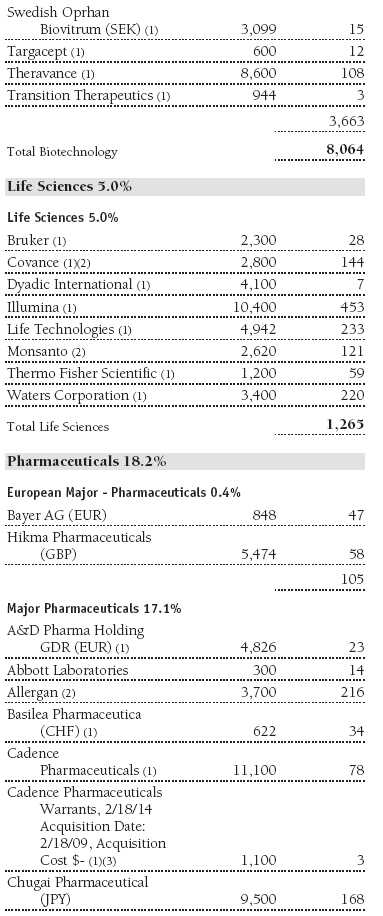
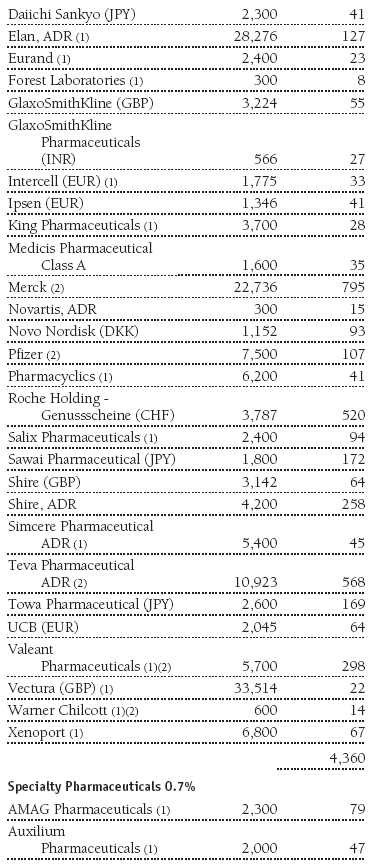
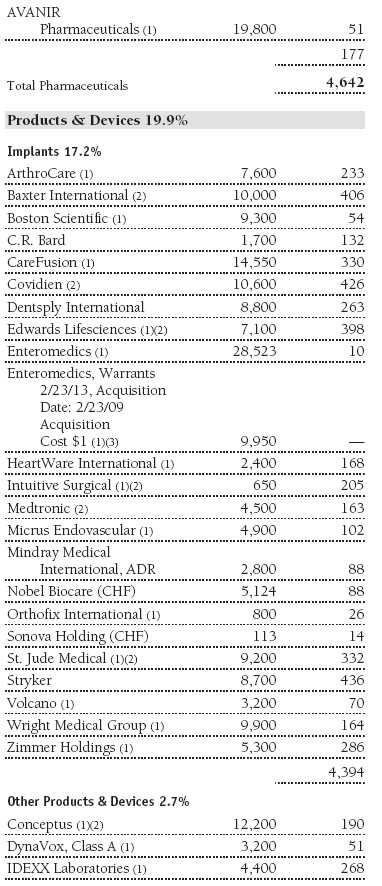
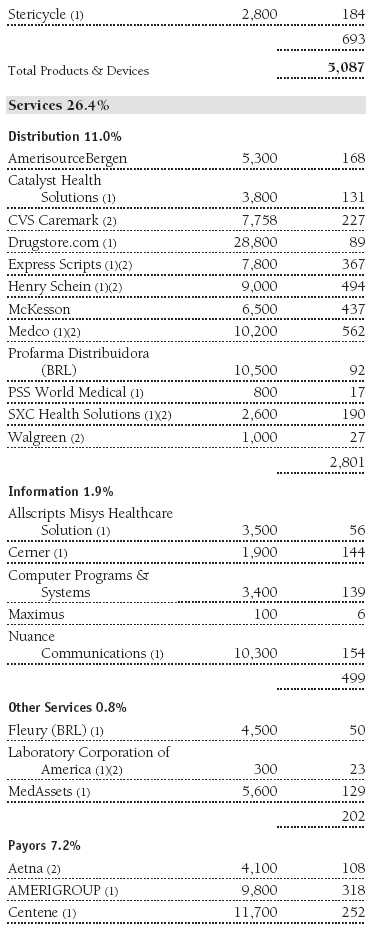
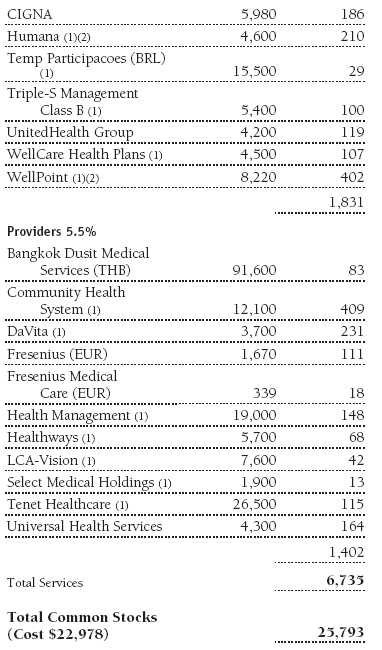
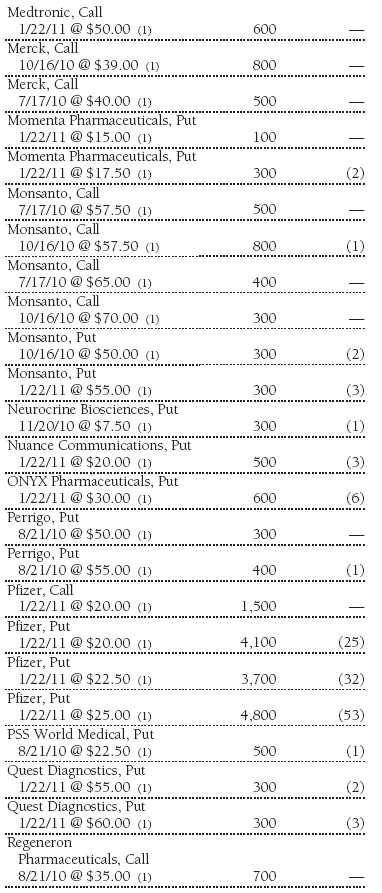
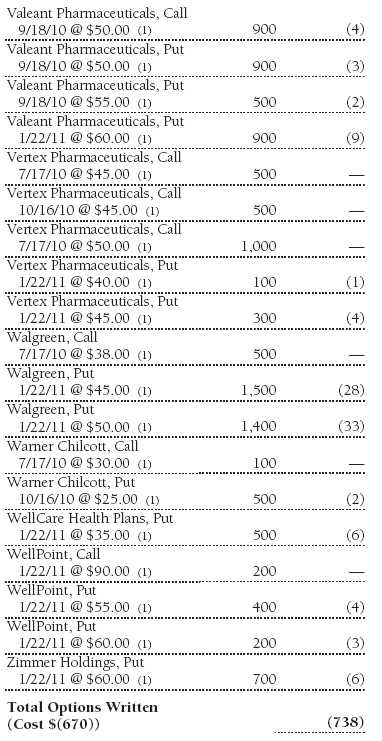
Portfolio of Investments‡
T. Rowe Price Health Sciences Portfolio
June 30, 2010 (Unaudited)


The accompanying notes are an integral part of these financial statements.
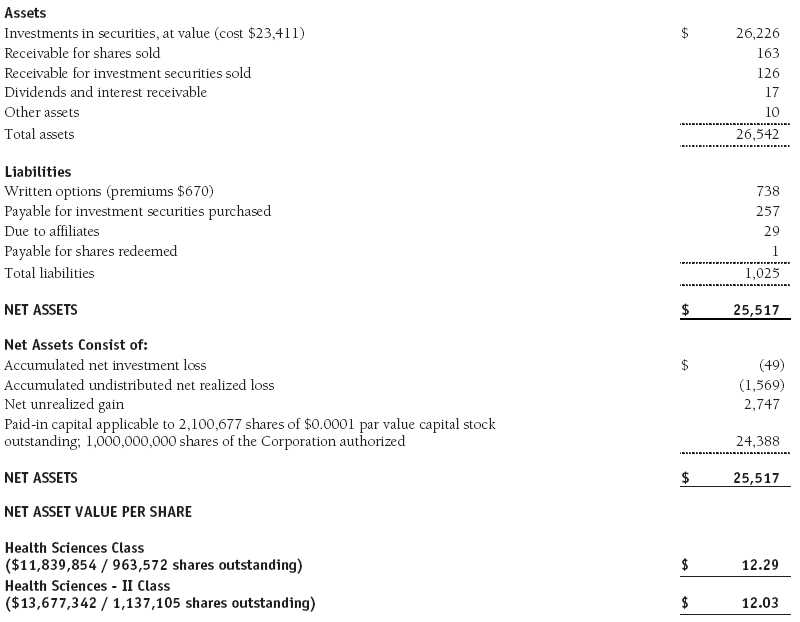
Statement of Assets and Liabilities
T. Rowe Price Health Sciences Portfolio
June 30, 2010 (Unaudited)
($000s, except shares and per share amounts)
The accompanying notes are an integral part of these financial statements.
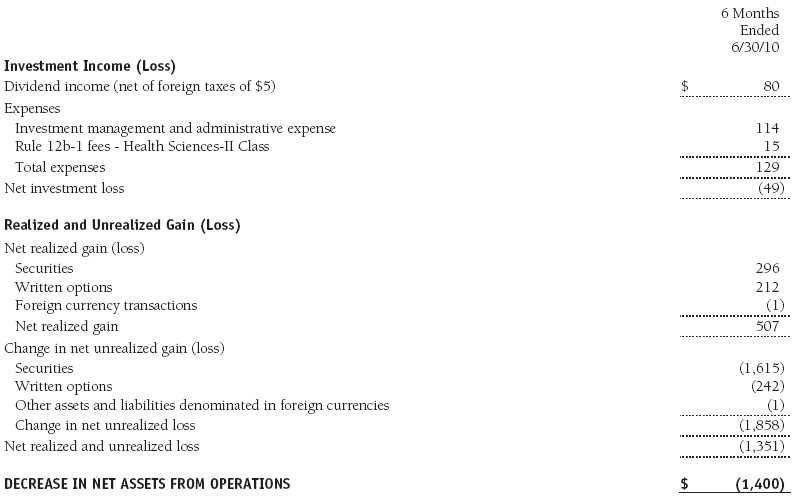
Statement of Operations
T. Rowe Price Health Sciences Portfolio
(Unaudited)
($000s)
The accompanying notes are an integral part of these financial statements.
Statement of Changes in Net Assets
T. Rowe Price Health Sciences Portfolio
(Unaudited)
($000s)

The accompanying notes are an integral part of these financial statements.
Notes to Financial Statements
T. Rowe Price Health Sciences Portfolio
June 30, 2010 (Unaudited)
T. Rowe Price Equity Series, Inc. (the corporation), is registered under the Investment Company Act of 1940 (the 1940 Act). The Health Sciences Portfolio (the fund) is a diversified, open-end management investment company and is one portfolio established by the corporation. The fund seeks long-term capital appreciation. Shares of the fund currently are offered only through certain insurance companies as an investment medium for both variable annuity contracts and variable life insurance policies. The fund has two classes of shares: the Health Sciences Portfolio original share class (Health Sciences Class), offered since December 29, 2000, and the Health Sciences Portfolio–II (Health Sciences–II Class), offered since April 30, 2002. Health Sciences–II Class shares are sold through financial intermediaries, which it compensates for distribution, shareholder servicing, and/or certain administrative services under a Board-approved Rule 12b-1 plan. Each class has exclusive voting rights on matters related solely to that class; separate voting rights on matters that relate to both classes; and, in all other respects, the same rights and obligations as the other class.
NOTE 1 - SIGNIFICANT ACCOUNTING POLICIES
Basis of Preparation The accompanying financial statements were prepared in accordance with accounting principles generally accepted in the United States of America (GAAP), which require the use of estimates made by fund management. Fund management believes that estimates and valuations are appropriate; however, actual results may differ from those estimates, and the valuations reflected in the accompanying financial statements may differ from the value ultimately realized upon sale of securities.
Investment Transactions, Investment Income, and Distributions Income and expenses are recorded on the accrual basis. Dividends received from mutual fund investments are reflected as dividend income; capital gain distributions are reflected as realized gain/loss. Dividend income and capital gain distributions are recorded on the ex-dividend date. Income tax-related interest and penalties, if incurred, would be recorded as income tax expense. Investment transactions are accounted for on the trade date. Realized gains and losses are reported on the identified cost basis. Distributions to shareholders are recorded on the ex-dividend date. Income distributions are declared and paid by each class annually. Capital gain distributions, if any, are generally declared and paid by the fund annually.
Currency Translation Assets, including investments, and liabilities denominated in foreign currencies are translated into U.S. dollar values each day at the prevailing exchange rate, using the mean of the bid and asked prices of such currencies against U.S. dollars as quoted by a major bank. Purchases and sales of securities, income, and expenses are translated into U.S. dollars at the prevailing exchange rate on the date of the transaction. The effect of changes in foreign currency exchange rates on realized and unrealized security gains and losses is reflected as a component of security gains and losses.
Class Accounting Health Sciences–II pays distribution, shareholder servicing, and/or certain administrative expenses in the form of Rule 12b-1 fees, in an amount not exceeding 0.25% of the class’s average daily net assets. Investment income, investment management and administrative expense, and realized and unrealized gains and losses are allocated to the classes based upon the relative daily net assets of each class.
Rebates Subject to best execution, the fund may direct certain security trades to brokers who have agreed to rebate a portion of the related brokerage commission to the fund in cash. Commission rebates are reflected as realized gain on securities in the accompanying financial statements.
New Accounting Pronouncement On January 1, 2010, the fund adopted new accounting guidance that requires enhanced disclosures about fair value measurements in the financial statements. Adoption of this guidance had no impact on the fund’s net assets or results of operations.
NOTE 2 - VALUATION
The fund’s investments are reported at fair value as defined by GAAP. The fund determines the values of its assets and liabilities and computes its net asset value per share at the close of the New York Stock Exchange (NYSE), normally 4 p.m. ET, each day that the NYSE is open for business.
Valuation Methods Equity securities listed or regularly traded on a securities exchange or in the over-the-counter (OTC) market are valued at the last quoted sale price or, for certain markets, the official closing price at the time the valuations are made, except for OTC Bulletin Board securities, which are valued at the mean of the latest bid and asked prices. A security that is listed or traded on more than one exchange is valued at the quotation on the exchange determined to be the primary market for such security. Listed securities not traded on a particular day are valued at the mean of the latest bid and asked prices for domestic securities and the last quoted sale price for international securities.
Investments in mutual funds are valued at the mutual fund’s closing net asset value per share on the day of valuation. Purchased and written options are valued at the mean of the closing bid and asked prices.
Other investments, including restricted securities, and those financial instruments for which the above valuation procedures are inappropriate or are deemed not to reflect fair value are stated at fair value as determined in good faith by the T. Rowe Price Valuation Committee, established by the fund’s Board of Directors.
For valuation purposes, the last quoted prices of non-U.S. equity securities may be adjusted under the circumstances described below. If the fund determines that developments between the close of a foreign market and the close of the NYSE will, in its judgment, materially affect the value of some or all of its portfolio securities, the fund will adjust the previous closing prices to reflect what it believes to be the fair value of the securities as of the close of the NYSE. In deciding whether it is necessary to adjust closing prices to reflect fair value, the fund reviews a variety of factors, including developments in foreign markets, the performance of U.S. securities markets, and the performance of instruments trading in U.S. markets that represent foreign securities and baskets of foreign securities. A fund may also fair value securities in other situations, such as when a particular foreign market is closed but the fund is open. The fund uses outside pricing services to provide it with closing prices and information to evaluate and/or adjust those prices. The fund cannot predict how often it will use closing prices and how often it will determine it necessary to adjust those prices to reflect fair value. As a means of evaluating its security valuation process, the fund routinely compares closing prices, the next day’s opening prices in the same markets, and adjusted prices.
Valuation Inputs Various inputs are used to determine the value of the fund’s financial instruments. These inputs are summarized in the three broad levels listed below:
Level 1 – quoted prices in active markets for identical financial instruments
Level 2 – observable inputs other than Level 1 quoted prices (including, but not limited to, quoted prices for similar financial instruments, interest rates, prepayment speeds, and credit risk)
Level 3 – unobservable inputs
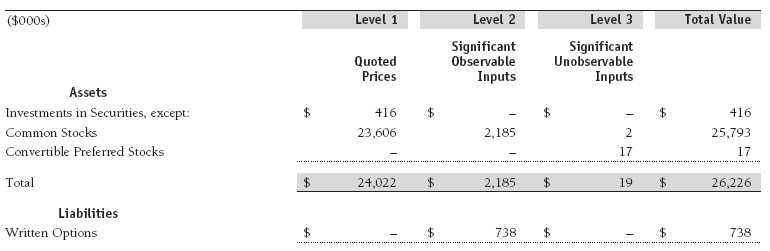
Observable inputs are those based on market data obtained from sources independent of the fund, and unobservable inputs reflect the fund’s own assumptions based on the best information available. The input levels are not necessarily an indication of the risk or liquidity associated with financial instruments at that level. For example, non-U.S. equity securities actively traded in foreign markets generally are reflected in Level 2 despite the availability of closing prices because the fund evaluates and determines whether those closing prices reflect fair value at the close of the NYSE or require adjustment, as described above. The following table summarizes the fund’s financial instruments, based on the inputs used to determine their values on June 30, 2010:
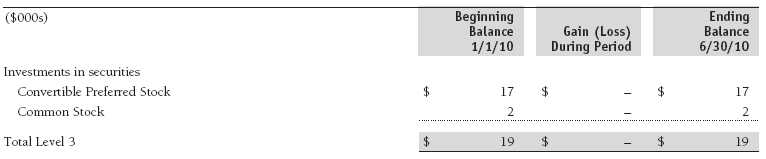
Following is a reconciliation of the fund’s Level 3 holdings for the six months ended June 30, 2010. Gain (loss) reflects both realized and change in unrealized gain (loss) on Level 3 holdings during the period, if any, and is included on the accompanying Statement of Operations. The change in unrealized gain/loss on Level 3 instruments held at June 30, 2010, totaled $0 for the six months ended June 30, 2010.
NOTE 3 - DERIVATIVE INSTRUMENTS
During the six months ended June 30, 2010, the fund invested in derivative instruments. As defined by GAAP, a derivative is a financial instrument whose value is derived from an underlying security price, foreign exchange rate, interest rate, index of prices or rates, or other variable; it requires little or no initial investment and permits or requires net settlement. The fund invests in derivatives only if the expected risks and rewards are consistent with its investment objectives, policies, and overall risk profile, as described in its prospectus and Statement of Additional Information. The fund may use derivatives for a variety of purposes, such as seeking to hedge against declines in principal value, increase yield, invest in an asset with greater efficiency and at a lower cost than is possible through direct investment, or to adjust credit exposure. The risks associated with the use of derivatives are different from, and potentially much greater than, the risks associated with investing directly in the instruments on which the derivatives are based. Investments in derivatives can magnify returns positively or negatively; however, the fund at all times maintains sufficient cash reserves, liquid assets, or other SEC-permitted asset types to cover the settlement obligations under its open derivative contracts.
The fund values its derivatives at fair value, as described below and in Note 2, and recognizes changes in fair value currently in its results of operations. Accordingly, the fund does not follow hedge accounting, even for derivatives employed as economic hedges. The fund does not offset the fair value of derivative instruments and the right to reclaim or obligation to return collateral executed with the same counterparty under a master netting arrangement. As of June 30, 2010, the fund held equity derivatives with a fair value of $738,000, included in Written Options, on the accompanying Statement of Assets and Liabilities.
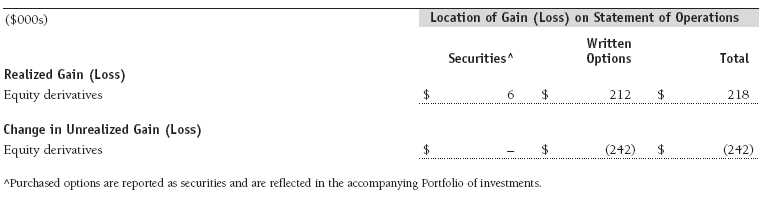
Additionally, the amount of gains and losses on derivative instruments recognized in fund earnings during the six months ended June 30, 2010, and the related location on the accompanying Statement of Operations is summarized in the following table by primary underlying risk exposure:
Counterparty risk related to exchange-traded derivatives, including futures and options contracts, is minimal because the exchange’s clearinghouse provides protection against defaults. Additionally, for exchange-traded derivatives, each broker, in its sole discretion, may change margin requirements applicable to the fund.
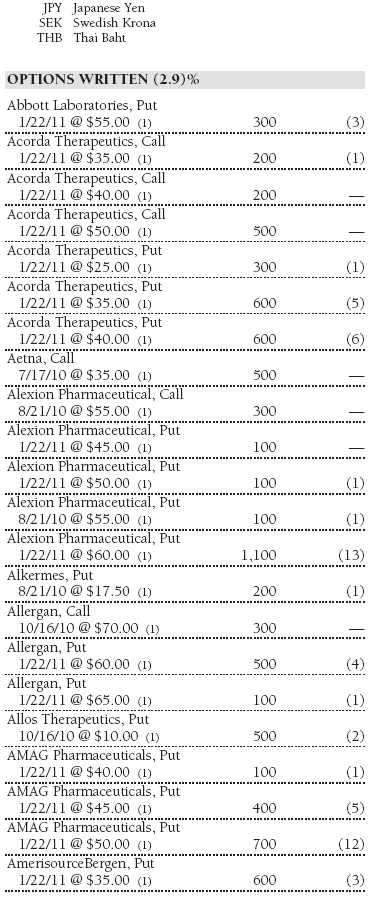
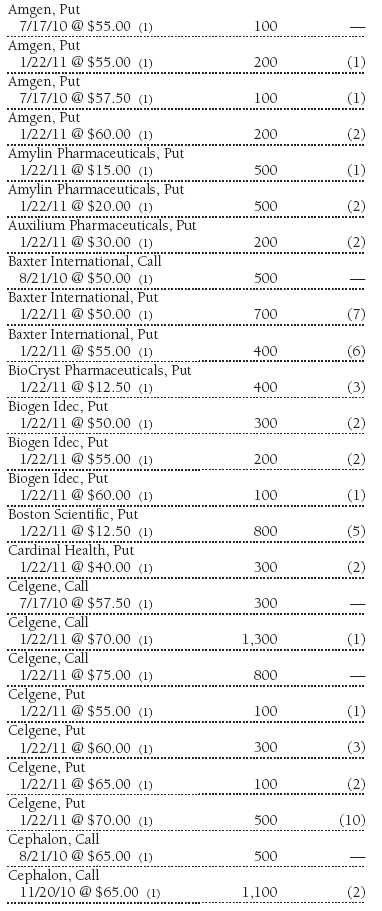
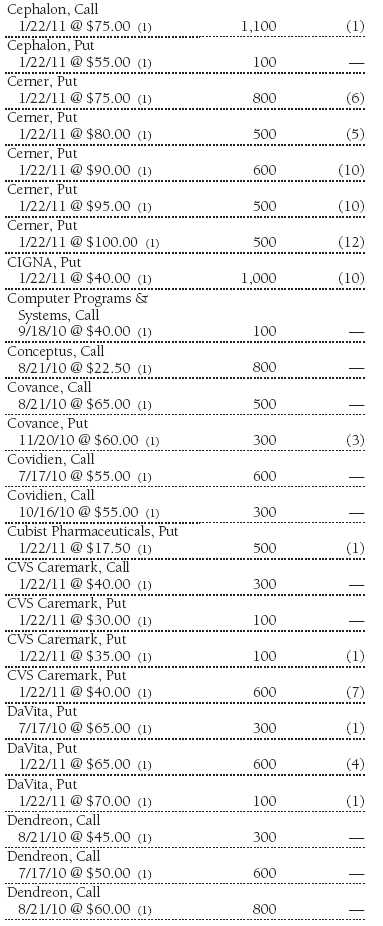
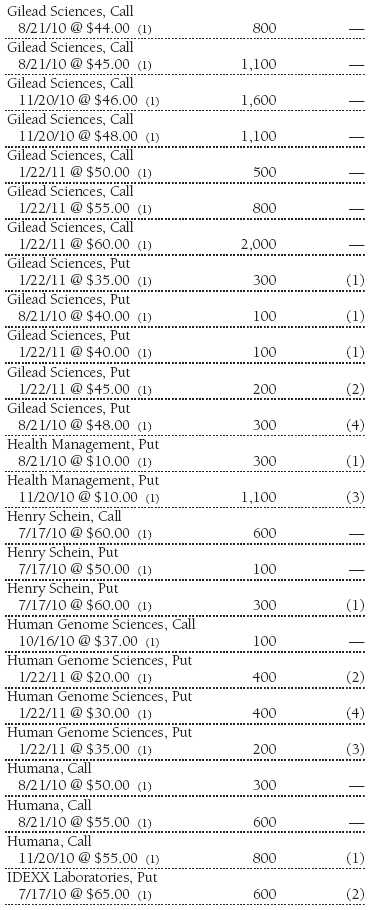
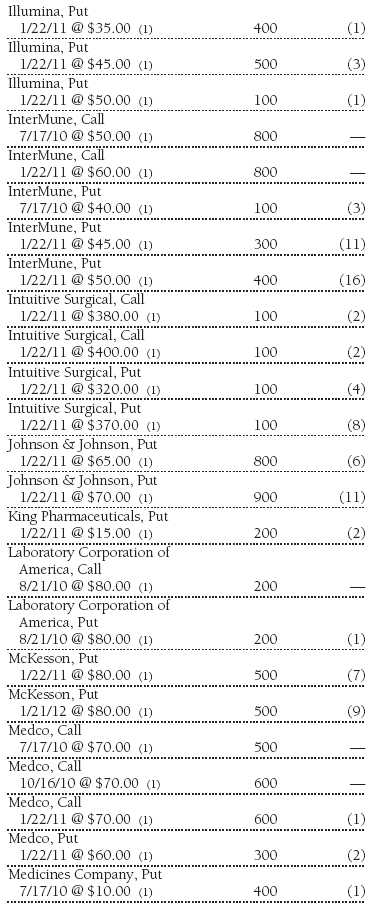
Options The fund is subject to equity price risk in the normal course of pursuing its investment objectives and uses options to help manage such risk. The fund may use call and put options to manage exposure to interest rates, security prices, foreign currencies, and credit quality; as an efficient means of adjusting exposure to all or a part of a target market; to enhance income; as a cash management tool; and/or to adjust credit exposure. Call and put options give the holder the right, in return for a premium paid, to purchase or sell, respectively, a security at a specified exercise price at any time during the period of the option. Options are included in net assets at fair value; purchased options are included in Investments in Securities; and written options are separately reflected as a liability on the accompanying Statement of Assets and Liabilities. Premiums on unexercised, expired options are recorded as realized gains or losses; premiums on exercised options are recorded as an adjustment to the proceeds from the sale or cost of the purchase. The difference between the premium and the amount received or paid in a closing transaction is also treated as realized gain or loss. Risks related to the use of options include possible illiquidity of the options markets; trading restrictions imposed by an exchange; movements in underlying security values; and for written options, potential losses in excess of the fund’s initial investment. During the six months ended June 30, 2010, the fund’s exposure to options, based on underlying notional amounts, was generally less than 1% of net assets. Transactions in written options and related premiums received during the six months ended June 30, 2010, were as follows:

NOTE 4 - OTHER INVESTMENT TRANSACTIONS
Consistent with its investment objective, the fund engages in the following practices to manage exposure to certain risks and/or to enhance performance. The investment objective, policies, program, and risk factors of the fund are described more fully in the fund’s prospectus and Statement of Additional Information.
Restricted Securities The fund may invest in securities that are subject to legal or contractual restrictions on resale. Prompt sale of such securities at an acceptable price may be difficult and may involve substantial delays and additional costs.
Other Purchases and sales of portfolio securities other than short-term securities aggregated $9,546,000 and $4,291,000, respectively, for the six months ended June 30, 2010.
NOTE 5 - FEDERAL INCOME TAXES
No provision for federal income taxes is required since the fund intends to continue to qualify as a regulated investment company under Subchapter M of the Internal Revenue Code and distribute to shareholders all of its taxable income and gains. Distributions determined in accordance with federal income tax regulations may differ in amount or character from net investment income and realized gains for financial reporting purposes. Financial reporting records are adjusted for permanent book/tax differences to reflect tax character but are not adjusted for temporary differences. The amount and character of tax-basis distributions and composition of net assets are finalized at fiscal year-end; accordingly, tax-basis balances have not been determined as of the date of this report.
In accordance with federal tax regulations, the fund recognized capital losses in the current period for tax purposes that had been recognized in the prior fiscal year for financial reporting purposes. Such deferrals relate to net capital losses realized between November 1, 2009 and December 31, 2009, and totaled $52,000. The fund intends to retain realized gains to the extent of available capital loss carryforwards. As of December 31, 2009, the fund had $1,111,000 of unused capital loss carryforwards, which expire: $201,000 in fiscal 2016 and $910,000 in fiscal 2017.
At June 30, 2010, the cost of investments for federal income tax purposes was $23,411,000. Net unrealized gain aggregated $2,747,000 at period-end, of which $4,571,000 related to appreciated investments and $1,824,000 related to depreciated investments.
NOTE 6 - FOREIGN TAXES
The fund is subject to foreign income taxes imposed by certain countries in which it invests. Acquisition of certain foreign currencies related to security transactions are also subject to tax. Additionally, capital gains realized by the fund upon disposition of securities issued in or by certain foreign countries are subject to capital gains tax imposed by those countries. All taxes are computed in accordance with the applicable foreign tax law, and, to the extent permitted, capital losses are used to offset capital gains. Tax expense attributable to income is accrued by the fund as a reduction of income. Taxes incurred on the purchase of foreign currencies are recorded as realized loss on foreign currency transactions. Current and deferred tax expense attributable to net capital gains is reflected as a component of realized and/or change in unrealized gain/loss on securities in the accompanying financial statements. At June 30, 2010, the fund had no deferred tax liability attributable to foreign securities and no foreign capital loss carryforwards.
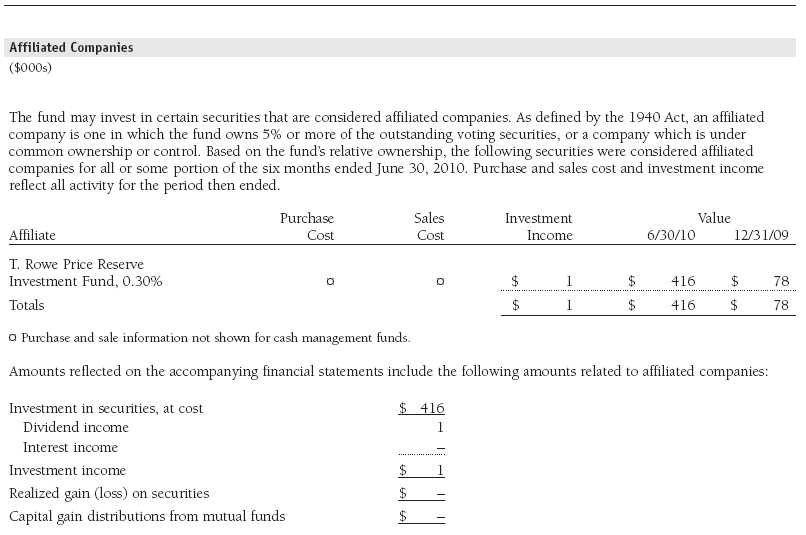
NOTE 7 - RELATED PARTY TRANSACTIONS
The fund is managed by T. Rowe Price Associates, Inc. (the manager or Price Associates), a wholly owned subsidiary of T. Rowe Price Group, Inc. The investment management and administrative agreement between the fund and the manager provides for an all-inclusive annual fee equal to 0.95% of the fund’s average daily net assets. The fee is computed daily and paid monthly. The agreement provides that investment management, shareholder servicing, transfer agency, accounting, custody services, and directors’ fees and expenses are provided to the fund, and interest, taxes, brokerage commissions, and extraordinary expenses are paid directly by the fund.
The fund may invest in the T. Rowe Price Reserve Investment Fund and the T. Rowe Price Government Reserve Investment Fund (collectively, the T. Rowe Price Reserve Investment Funds), open-end management investment companies managed by Price Associates and considered affiliates of the fund. The T. Rowe Price Reserve Investment Funds are offered as cash management options to mutual funds, trusts, and other accounts managed by Price Associates and/or its affiliates and are not available for direct purchase by members of the public. The T. Rowe Price Reserve Investment Funds pay no investment management fees.
| Information on Proxy Voting Policies, Procedures, and Records |
A description of the policies and procedures used by T. Rowe Price funds and portfolios to determine how to vote proxies relating to portfolio securities is available in each fund’s Statement of Additional Information, which you may request by calling 1-800-225-5132 or by accessing the SEC’s Web site, www.sec.gov. The description of our proxy voting policies and procedures is also available on our Web site, www.troweprice.com. To access it, click on the words “Our Company” at the top of our corporate homepage. Then, when the next page appears, click on the words “Proxy Voting Policies” on the left side of the page.
Each fund’s most recent annual proxy voting record is available on our Web site and through the SEC’s Web site. To access it through our Web site, follow the directions above, then click on the words “Proxy Voting Records” on the right side of the Proxy Voting Policies page.
| How to Obtain Quarterly Portfolio Holdings |
The fund files a complete schedule of portfolio holdings with the Securities and Exchange Commission for the first and third quarters of each fiscal year on Form N-Q. The fund’s Form N-Q is available electronically on the SEC’s Web site (www.sec.gov); hard copies may be reviewed and copied at the SEC’s Public Reference Room, 450 Fifth St. N.W., Washington, DC 20549. For more information on the Public Reference Room, call 1-800-SEC-0330.
| Approval of Investment Management Agreement |
On March 9, 2010, the fund’s Board of Directors (Board) unanimously approved the continuation of the investment advisory contract (Contract) between the fund and its investment manager, T. Rowe Price Associates, Inc. (Adviser). The Board considered a variety of factors in connection with its review of the Contract, also taking into account information provided by the Adviser during the course of the year, as discussed below:
Services Provided by the Adviser
The Board considered the nature, quality, and extent of the services provided to the fund by the Adviser. These services included, but were not limited to, management of the fund’s portfolio and a variety of related activities, as well as financial and administrative services, reporting, and communications. The Board also reviewed the background and experience of the Adviser’s senior management team and investment personnel involved in the management of the fund. The Board concluded that it was satisfied with the nature, quality, and extent of the services provided by the Adviser.
Investment Performance of the Fund
The Board reviewed the fund’s average annual total returns over the one-, three-, and five-year and since-inception periods, as well as the fund’s year-by-year returns, and compared these returns with a wide variety of previously agreed upon comparable performance measures and market data, including those supplied by Lipper and Morningstar, which are independent providers of mutual fund data. On the basis of this evaluation and the Board’s ongoing review of investment results, and factoring in the severity of the market turmoil during 2008 and 2009, the Board concluded that the fund’s performance was satisfactory.
Costs, Benefits, Profits, and Economies of Scale
The Board reviewed detailed information regarding the revenues received by the Adviser under the Contract and other benefits that the Adviser (and its affiliates) may have realized from its relationship with the fund, including research received under “soft dollar” agreements and commission-sharing arrangements with broker-dealers. The Board considered that the Adviser may receive some benefit from its soft-dollar arrangements pursuant to which it receives research from broker-dealers that execute the applicable fund’s portfolio transactions. The Board also received information on the estimated costs incurred and profits realized by the Adviser and its affiliates from advising T. Rowe Price mutual funds. The Board did not review information regarding profits realized from managing the fund in particular because the fund had not achieved sufficient scale in terms of portfolio asset size to produce meaningful profit margin percentages. The Board concluded that the Adviser’s profits from advising T. Rowe Price mutual funds were reasonable in light of the services provided to the fund. The Board also considered whether the fund or other funds benefit under the fee levels set forth in the Contract from any economies of scale realized by the Adviser. The Board noted that, under the Contract, the fund pays the Adviser a single fee based on the fund’s assets and that the Adviser, in turn, pays all expenses of the fund, with certain exceptions. The Board concluded that, based on the profitability data it reviewed and consistent with this single-fee structure, the Contract provided for a reasonable sharing of any benefits from economies of scale with the fund.
Fees
The Board reviewed the fund’s single-fee structure (for the Investor Class and II Class) and compared it with fees and expenses of other comparable funds based on information and data supplied by Lipper. The information provided to the Board indicated that the fund’s management fee rate was below the median for comparable funds. (For these purposes, the Board assumed the fund’s management fee rate was equal to the single fee less the fund’s operating expenses and after including any reductions of the management fee rate as a result of any applicable fee waivers or expenses paid by the Adviser.) The information also indicated that the fund’s total expense ratio (for both classes) was above the median for comparable funds. The Board also reviewed the fee schedules for institutional accounts of the Adviser and its affiliates with smaller mandates. Management informed the Board that the Adviser’s responsibilities for institutional accounts are more limited than its responsibilities for the fund and other T. Rowe Price mutual funds that it or its affiliates advise and that the Adviser performs significant additional services and assumes greater risk for the fund and other T. Rowe Price mutual funds that it advises than it does for institutional accounts. On the basis of the information provided, the Board concluded that the fees paid by the fund under the Contract were reasonable.
Approval of the Contract
As noted, the Board approved the continuation of the Contract. No single factor was considered in isolation or to be determinative to the decision. Rather, the Board was assisted by the advice of independent legal counsel and concluded, in light of a weighting and balancing of all factors considered, that it was in the best interests of the fund to approve the continuation of the Contract, including the fees to be charged for services thereunder.
Item 2. Code of Ethics.
A code of ethics, as defined in Item 2 of Form N-CSR, applicable to its principal executive officer, principal financial officer, principal accounting officer or controller, or persons performing similar functions is filed as an exhibit to the registrant’s annual Form N-CSR. No substantive amendments were approved or waivers were granted to this code of ethics during the registrant’s most recent fiscal half-year.
Item 3. Audit Committee Financial Expert.
Disclosure required in registrant’s annual Form N-CSR.
Item 4. Principal Accountant Fees and Services.
Disclosure required in registrant’s annual Form N-CSR.
Item 5. Audit Committee of Listed Registrants.
Not applicable.
Item 6. Investments.
(a) Not applicable. The complete schedule of investments is included in Item 1 of this Form N-CSR.
(b) Not applicable.
Item 7. Disclosure of Proxy Voting Policies and Procedures for Closed-End Management Investment Companies.
Not applicable.
Item 8. Portfolio Managers of Closed-End Management Investment Companies.
Not applicable.
Item 9. Purchases of Equity Securities by Closed-End Management Investment Company and Affiliated Purchasers.
Not applicable.
Item 10. Submission of Matters to a Vote of Security Holders.
Not applicable.
Item 11. Controls and Procedures.
(a) The registrant’s principal executive officer and principal financial officer have evaluated the registrant’s disclosure controls and procedures within 90 days of this filing and have concluded that the registrant’s disclosure controls and procedures were effective, as of that date, in ensuring that information required to be disclosed by the registrant in this Form N-CSR was recorded, processed, summarized, and reported timely.
(b) The registrant’s principal executive officer and principal financial officer are aware of no change in the registrant’s internal control over financial reporting that occurred during the registrant’s second fiscal quarter covered by this report that has materially affected, or is reasonably likely to materially affect, the registrant’s internal control over financial reporting.
Item 12. Exhibits.
(a)(1) The registrant’s code of ethics pursuant to Item 2 of Form N-CSR is filed with the registrant’s annual Form N-CSR.
(2) Separate certifications by the registrant's principal executive officer and principal financial officer, pursuant to Section 302 of the Sarbanes-Oxley Act of 2002 and required by Rule 30a-2(a) under the Investment Company Act of 1940, are attached.
(3) Written solicitation to repurchase securities issued by closed-end companies: not applicable.
(b) A certification by the registrant's principal executive officer and principal financial officer, pursuant to Section 906 of the Sarbanes-Oxley Act of 2002 and required by Rule 30a-2(b) under the Investment Company Act of 1940, is attached.
| | |
SIGNATURES |
| |
| | Pursuant to the requirements of the Securities Exchange Act of 1934 and the Investment |
| Company Act of 1940, the registrant has duly caused this report to be signed on its behalf by the |
| undersigned, thereunto duly authorized. |
| |
| T. Rowe Price Equity Series, Inc. |
| |
| |
| |
| By | /s/ Edward C. Bernard |
| | Edward C. Bernard |
| | Principal Executive Officer |
| |
| Date | August 17, 2010 |
| |
| |
| |
| | Pursuant to the requirements of the Securities Exchange Act of 1934 and the Investment |
| Company Act of 1940, this report has been signed below by the following persons on behalf of |
| the registrant and in the capacities and on the dates indicated. |
| |
| |
| By | /s/ Edward C. Bernard |
| | Edward C. Bernard |
| | Principal Executive Officer |
| |
| Date | August 17, 2010 |
| |
| |
| |
| By | /s/ Gregory K. Hinkle |
| | Gregory K. Hinkle |
| | Principal Financial Officer |
| |
| Date | August 17, 2010 |