| UNITED STATES |
| SECURITIES AND EXCHANGE COMMISSION |
| Washington, D.C. 20549 |
| |
FORM N-CSR |
| |
CERTIFIED SHAREHOLDER REPORT OF REGISTERED |
MANAGEMENT INVESTMENT COMPANIES |
| |
| |
| |
| Investment Company Act File Number: 811-07143 |
|
| |
| T. Rowe Price Equity Series, Inc. |
|
| (Exact name of registrant as specified in charter) |
| |
| 100 East Pratt Street, Baltimore, MD 21202 |
|
| (Address of principal executive offices) |
| |
| David Oestreicher |
| 100 East Pratt Street, Baltimore, MD 21202 |
|
| (Name and address of agent for service) |
| |
| |
| Registrant’s telephone number, including area code: (410) 345-2000 |
| |
| |
| Date of fiscal year end: December 31 |
| |
| |
| Date of reporting period: June 30, 2010 |
Item 1: Report to Shareholders| Personal Strategy Balanced Portfolio | June 30, 2010 |
• U.S. and international stocks declined and bond returns were mixed in the first half of 2010 as the ongoing European debt crisis, signs of a slowing U.S. recovery, and fears of cooling growth in some key emerging markets buffeted markets.
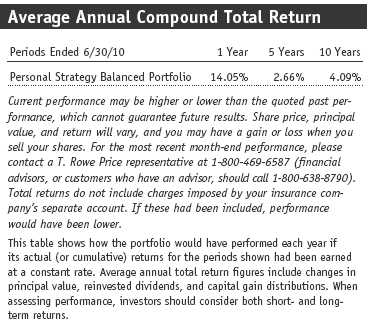
• The Personal Strategy Balanced Portfolio returned -3.47% for the six-month period ended June 30, 2010, and modestly underperformed its benchmarks.
• We favor stocks over bonds as stock valuations appear reasonable. Although volatility has increased, stocks are supported by good earnings and reasonable balance sheets in the context of a gradually improving economy.
• The U.S. economic recovery is progressing, but it may be slower and more volatile than many expected, highlighting the importance of our independent research and collaborative investment approach.
The views and opinions in this report were current as of June 30, 2010. They are not guarantees of performance or investment results and should not be taken as investment advice. Investment decisions reflect a variety of factors, and the managers reserve the right to change their views about individual stocks, sectors, and the markets at any time. As a result, the views expressed should not be relied upon as a forecast of the fund’s future investment intent. The report is certified under the Sarbanes-Oxley Act, which requires mutual funds and other public companies to affirm that, to the best of their knowledge, the information in their financial reports is fairly and accurately stated in all material respects.
Manager’s Letter
T. Rowe Price Personal Strategy Balanced Portfolio
Dear Investor
U.S. and international stocks declined overall in the first half of 2010, buffeted by concerns about the ongoing European debt crisis, signs of a slowing U.S. recovery, and fears that cooling growth in China and other key emerging markets would weigh on the global economic rebound. Domestic and emerging markets bonds gained for the period, but non-U.S. developed market debt fell.
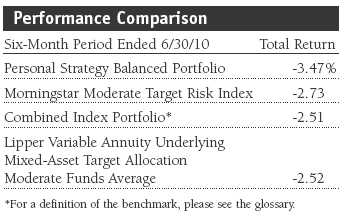
In this environment, the Personal Strategy Balanced Portfolio returned -3.47% for the six-month period ended June 30, 2010, and modestly underperformed its benchmarks, as shown in the Performance Comparison table. Results relative to the combined index portfolio were hurt by a non-benchmark allocation to non-U.S. dollar-denominated bonds, weak security selection in U.S. large-cap stocks, and an overweight to stocks, which trailed bonds during the period.
Market Environment
The year to date has been a tale of two quarters. In the first quarter, stock and bond markets recorded solid gains overall as a gradual, if not spectacular, economic recovery contributed to positive investor sentiment. Starting in late April, however, several key factors combined to undermine confidence in the pace and durability of the global economic rebound. The Chinese government implemented initiatives designed to throttle back the country’s booming economic growth. A sovereign debt crisis began in Greece and quickly spread to other developed European countries, resulting in austerity measures and a rapid decline in the value of the euro. A series of softer domestic economic data, particularly related to labor markets and housing, added to concerns about the sustainability of the U.S. economic recovery. The oil spill in the Gulf of Mexico, followed by the deepwater drilling moratorium and its legal and economic ramifications, further dimmed investor confidence. These factors, combined with the uncertainties and prospective costs surrounding U.S. government actions pertaining to the financial services and health care industries, caused investors’ appetite for riskier assets to fall rapidly.

U.S. stocks declined overall in the first half of 2010 as the market’s strong gains through April were erased by a sharp correction in May and June. Non-U.S. stocks also declined, with developed markets in Europe faring particularly poorly amid expectations for slower economic growth. Emerging equity markets also fell. A significantly stronger U.S. dollar versus many other currencies weighed on returns for U.S. investors.
U.S. bonds produced good returns in the first half of the year. Despite weakness in the second quarter, high yield bonds performed well overall as income-seeking investors continued to favor securities with a yield advantage. In the investment-grade universe, long-term Treasuries produced the strongest returns, but high-quality corporate bonds, agency mortgage-backed securities, and asset-backed securities also did reasonably well. Emerging markets debt generated solid returns as investors continued to seek bonds offering an income advantage, while developed market debt generally fell. Non-U.S. dollar-denominated bonds trailed due to credit concerns in Europe and weaker currencies relative to the U.S. dollar.
Performance and Strategy Review
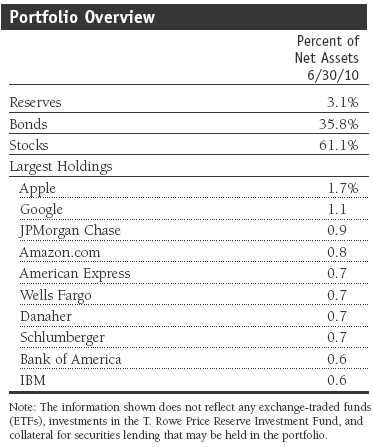
Weak security selection among our large-cap growth and large-cap value stocks was partially offset by the relatively strong performance of our small-cap stocks and non-U.S. developed market stocks. An underweight in small-cap stocks versus large-caps hurt relative performance as small-caps outpaced their larger counterparts. Among equities, our financials, information technology, and energy shares fared worst, while consumer staples, telecommunication services, and consumer discretionary posted more modest losses. At the end of the reporting period, the portfolio’s overall target equity allocation was 63% versus a neutral allocation of 60%—unchanged from our last report.
Apple was the best performer of the portfolio’s larger stock positions and was among the few bright spots in the information technology sector. Apple is in the midst of the strongest product cycle in the company’s history, with both its iPad and iPhone 4 being extraordinarily well received. Google, on the other hand, was one of our weakest performers overall during the period. Currency losses and aggressive operating expense expansion kept margins and earnings growth in check. Investors also pitted Google against Apple in the battle for smartphone adoption and were disappointed with Google’s strategies to make money on the Android system. Although we are disappointed by Google’s performance, we continue to see significant value in its technology assets, and the company’s mobile position is strong. JPMorgan Chase was down as broader concerns over looming financial regulation weighed heavily on the financials sector. However, we believe improving credit quality and finalization of regulatory reform will provide greater clarity on the earnings power of the company. (Please refer to the portfolio of investments for a complete listing of our holdings and the amount each represents in the portfolio.)
BP was also among our largest detractors in the wake of the massive oil spill in the Gulf of Mexico. We believe BP’s share price has already taken most of the punishment it is likely to receive, but we are monitoring the situation daily. In the midst of containment efforts, a cross-functional team of T. Rowe Price analysts has been busy assessing the potential ramifications on BP’s liquidity, upcoming liabilities, and future profitability. Additionally, we are evaluating the effects these events will have on the industry as a whole, as well as on other potential investments. T. Rowe Price investment professionals have been pulling together information from diverse sources and regularly communicating insights, market commentary, and key market data related to the spill. To further strengthen the firm’s overall efforts, we dispatched several of our analysts to the Gulf region. Our colleagues met with lawyers, fishermen, politicians, local journalists, and company executives in an attempt to gain a full understanding of the impact of the spill on all parties involved. After careful analysis, we have retained our position in the stock. In our view, a globally strong company like BP should be able to weather the storm and work through what has been a genuine catastrophe.
Bonds outperformed stocks on an absolute basis during the period, but our fixed income allocation underperformed the Barclays Capital U.S. Aggregate Index. Allocations to non-U.S. dollar-denominated and high yield bonds, which are not included in the Barclays index, hurt results. Additionally, weak security selection in our high yield bond allocation during the latter half of the reporting period also weighed on results. We remain overweight to investment-grade bonds relative to non-U.S. dollar-denominated bonds as improving growth prospects may benefit the U.S. dollar. Although our high yield allocation underperformed its sector, the strong absolute performance of this asset class boosted returns for the full year. At the end of the reporting period, the portfolio’s target allocation to bonds and cash was unchanged from six months ago and stood at 37% versus a 40% neutral allocation.
Outlook
In our last report, we stated that although the U.S. and global economies have started on a path to recovery, it was likely to be a gradual and uneven rebound, with more swings in store for economies and markets. Events over the latter half of our reporting period have borne this out—and we expect continued volatility amid economic uncertainty in the second half of 2010. Modest but continued economic growth would bode well for credit-sensitive bonds, such as investment-grade corporate issues. Despite cooling recently, economic expansion in emerging markets remains extremely robust.
We favor stocks over bonds as stock valuations remain reasonable. Although volatility has increased, stocks continue to be supported by a favorable earnings environment and reasonable balance sheets in the context of a gradually improving economy. We lowered our allocation to value stocks and now have a neutral stance between growth and value. While value stocks often do well as the economy and profits recover from trough levels, growth stocks are very attractively priced. We are underweighting small-cap stocks versus large-caps as strong small-cap performance in 2010 has made the small-cap sector’s valuations even richer. We have a neutral bias between U.S. and non-U.S. developed markets stocks because we believe better U.S. growth prospects are reflected in current valuations. We remain overweight in emerging markets stocks and believe that, over the long term, higher growth prospects for emerging markets should offset greater short-term volatility. However, we reduced our overweight during the period in recognition that valuations had become less compelling following the recent strong performance of emerging markets equities.
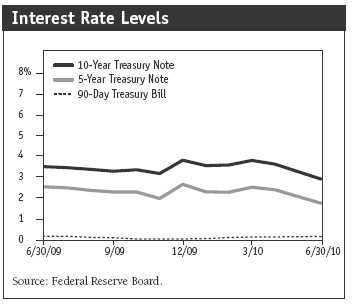
Among bonds, we are overweight in high yield relative to investment grade given a gradually improving economy and expectations for a lower default rate among high yield issuers. Yields on government bonds remain near historically low levels as events in Europe have sustained expectations for the U.S. Federal Reserve to keep rates low for an extended period, but elevated levels of new Treasury supply could be a source of upward pressure on Treasury yields. We are overweight emerging markets bonds and remain positive about the sector’s prospects. Growth opportunities remain strong relative to developed markets and, in many instances, emerging markets countries benefit from a better fiscal profile than major developed countries.
We believe a broadly diversified portfolio coupled with our emphasis on objective, proprietary research and our team-oriented investment approach will add value for investors over the long term.
Respectfully submitted,

Edmund M. Notzon III
Chairman of the portfolio’s Investment Advisory Committee
July 19, 2010
The committee chairman has day-to-day responsibility for managing the portfolio and works with committee members in developing and executing its investment programs.
As with all stock and bond mutual funds, the portfolio’s share price can fall because of weakness in the stock or bond markets, a particular industry, or specific holdings. Stock markets can decline for many reasons, including adverse political or economic developments, changes in investor psychology, or heavy institutional selling. The prospects for an industry or company may deteriorate because of a variety of factors, including disappointing earnings or changes in the competitive environment. In addition, the investment manager’s assessment of companies held in a portfolio may prove incorrect, resulting in losses or poor performance even in rising markets.
Bonds are subject to interest rate risk, the decline in bond prices that usually accompanies a rise in interest rates, and credit risk, the chance that any portfolio holding could have its credit rating downgraded or that a bond issuer will default (fail to make timely payments of interest or principal), potentially reducing the portfolio’s income level and share price. High yield corporate bonds could have greater price declines than funds that invest primarily in high-quality bonds. Companies issuing high yield bonds are not as strong financially as those with higher credit ratings, so the bonds are usually considered speculative investments.
Funds that invest overseas may carry more risk than funds that invest strictly in U.S. assets. Risks can result from varying stages of economic and political development; differing regulatory environments, trading days, and accounting standards; and higher transaction costs of non-U.S. markets. Non-U.S. investments are also subject to currency risk, or a decline in the value of a foreign currency versus the U.S. dollar, which reduces the dollar value of securities denominated in that currency.
Barclays Capital U.S. Aggregate Index: An unmanaged index that tracks investment-grade corporate and government bonds.
Citigroup 3-Month Treasury Bill Index: An unmanaged index that tracks short-term U.S. government debt instruments.
Combined index portfolio: An unmanaged portfolio composed of the following underlying indexes: 60% stocks (48% Russell 3000 Index, 12% MSCI All Country World ex-U.S. Index), 30% bonds (Barclays Capital U.S. Aggregate Index), and 10% money market securities (Citigroup 3-month Treasury Bill Index).
Credit Suisse High Yield Index: An index that tracks the performance of domestic noninvestment-grade corporate bonds.
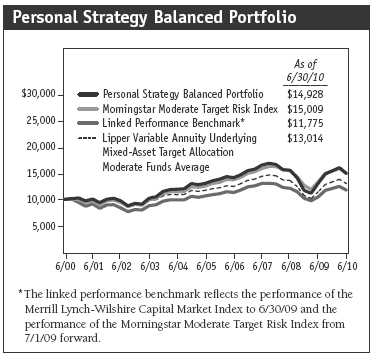
Lipper Mixed-Asset Target Allocation Moderate Funds Index: A peer group benchmark that measures the performance of similar funds with a mix of between 40% and 60% equities, with the remainder invested in bonds and short-term investments.
Merrill Lynch-Wilshire Capital Market Index: A market capitalization-weighted index including the Wilshire 5000, Merrill Lynch High Yield II, and Domestic Master indexes. This index was discontinued on June 30, 2009.
Morningstar Moderate Target Risk Index: An index that represents a portfolio of global equities (fixed at 60%), bonds, and other asset classes.
MSCI All Country World ex-U.S. Index: An index that measures equity market performance of developed and emerging countries, excluding the U.S.
MSCI Emerging Markets Index: A capitalization-weighted index of stocks from emerging market countries that only includes securities that may be traded by foreign investors.
Russell 3000 Index: An index that tracks the performance of the 3,000 largest U.S. companies, representing approximately 98% of the investable U.S. equity market.
S&P 500 Index: An index that tracks the stocks of 500 primarily large-cap U.S. companies.
Yield curve: A graphic depiction of the relationship between yields and maturity dates for a set of similar securities, such as Treasuries or municipal securities. Yield curves typically slope upward, indicating that longer maturities offer higher yields. When the yield curve is flat, there is little or no difference between the yields offered by shorter- and longer-term securities.
Portfolio Highlights
Performance and Expenses
T. Rowe Price Personal Strategy Balanced Portfolio
This chart shows the value of a hypothetical $10,000 investment in the portfolio over the past 10 fiscal year periods or since inception (for portfolios lacking 10-year records). The result is compared with benchmarks, which may include a broad-based market index and a peer group average or index. Market indexes do not include expenses, which are deducted from portfolio returns as well as mutual fund averages and indexes.
Fund Expense Example
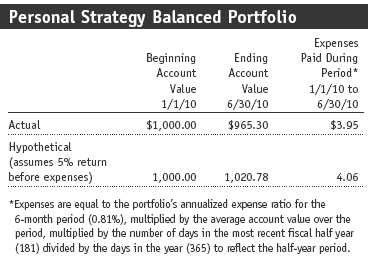
As a mutual fund shareholder, you may incur two types of costs: (1) transaction costs, such as redemption fees or sales loads, and (2) ongoing costs, including management fees, distribution and service (12b-1) fees, and other fund expenses. The following example is intended to help you understand your ongoing costs (in dollars) of investing in the fund and to compare these costs with the ongoing costs of investing in other mutual funds. The example is based on an investment of $1,000 invested at the beginning of the most recent six-month period and held for the entire period.
Actual Expenses
The first line of the following table (“Actual”) provides information about actual account values and actual expenses. You may use the information in this line, together with your account balance, to estimate the expenses that you paid over the period. Simply divide your account value by $1,000 (for example, an $8,600 account value divided by $1,000 = 8.6), then multiply the result by the number in the first line under the heading “Expenses Paid During Period” to estimate the expenses you paid on your account during this period.
Hypothetical Example for Comparison Purposes
The information on the second line of the table (“Hypothetical”) is based on hypothetical account values and expenses derived from the fund’s actual expense ratio and an assumed 5% per year rate of return before expenses (not the fund’s actual return). You may compare the ongoing costs of investing in the fund with other funds by contrasting this 5% hypothetical example and the 5% hypothetical examples that appear in the shareholder reports of the other funds. The hypothetical account values and expenses may not be used to estimate the actual ending account balance or expenses you paid for the period.
You should also be aware that the expenses shown in the table highlight only your ongoing costs and do not reflect any transaction costs, such as redemption fees or sales loads. Therefore, the second line of the table is useful in comparing ongoing costs only and will not help you determine the relative total costs of owning different funds. To the extent a fund charges transaction costs, however, the total cost of owning that fund is higher.
Financial Highlights
T. Rowe Price Personal Strategy Balanced Portfolio
(Unaudited)
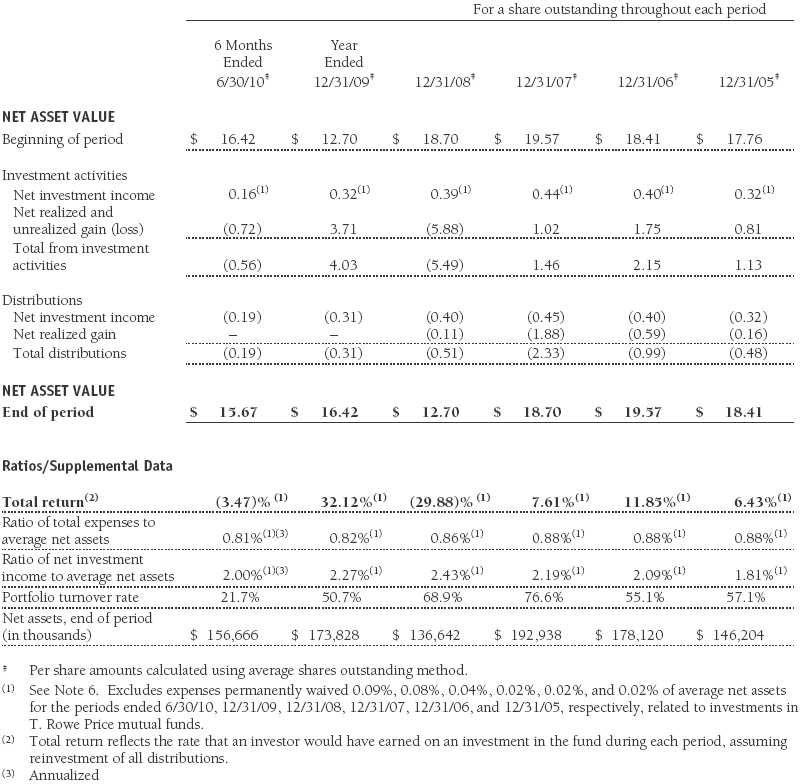
The accompanying notes are an integral part of these financial statements.
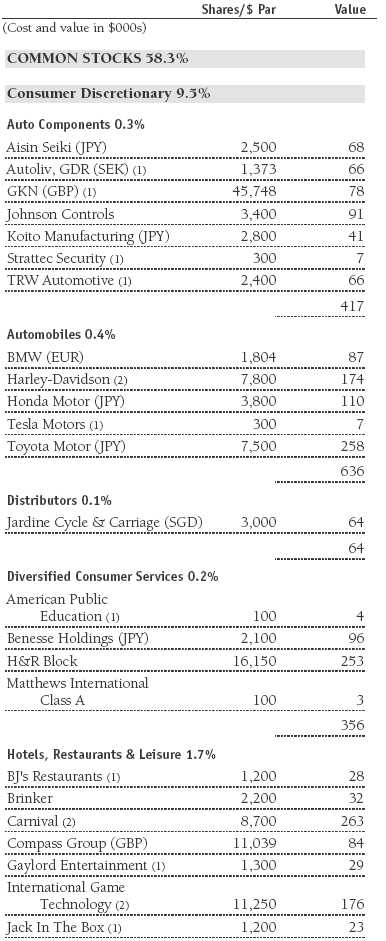
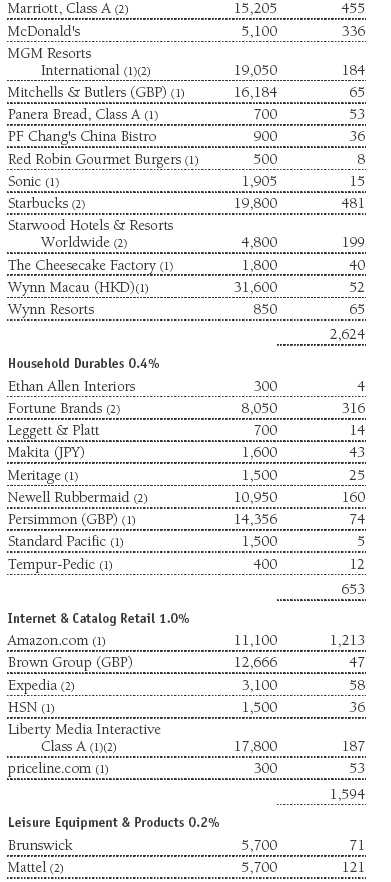
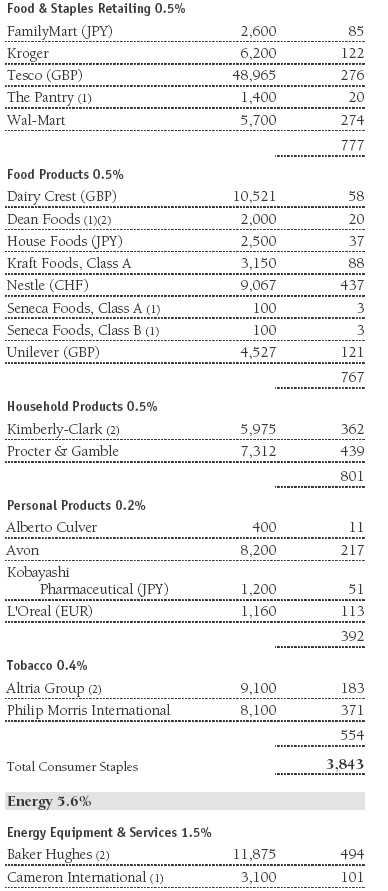
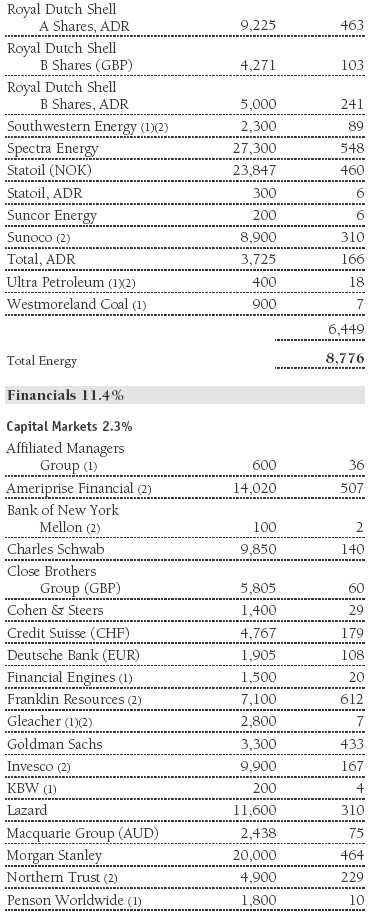
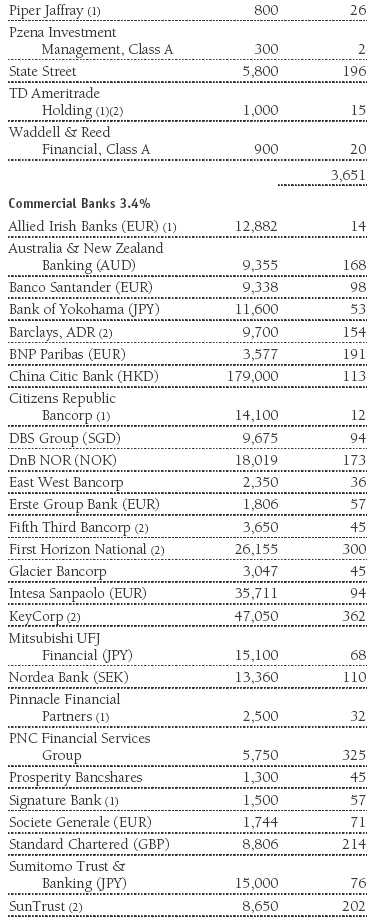
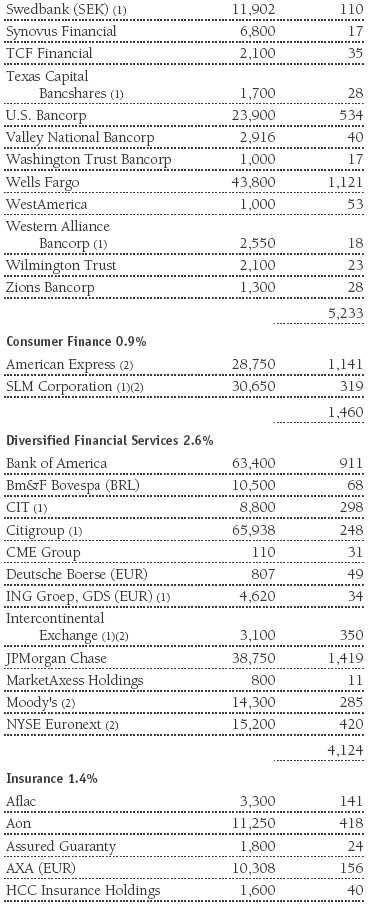
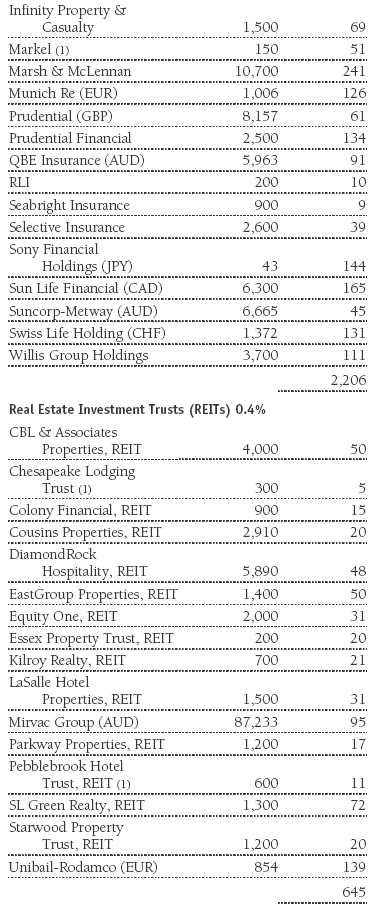
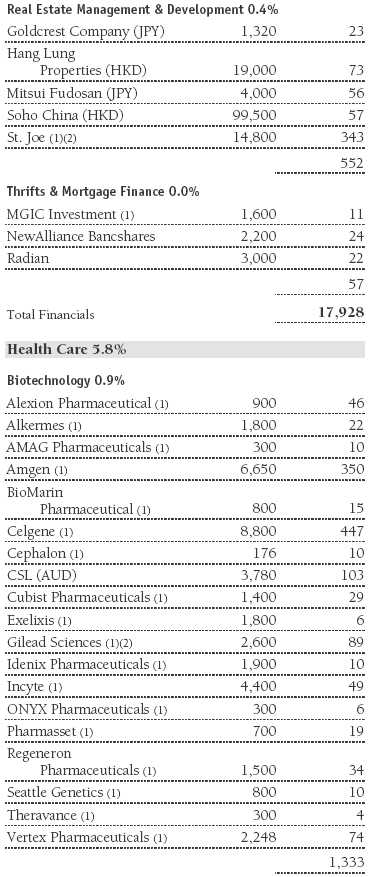
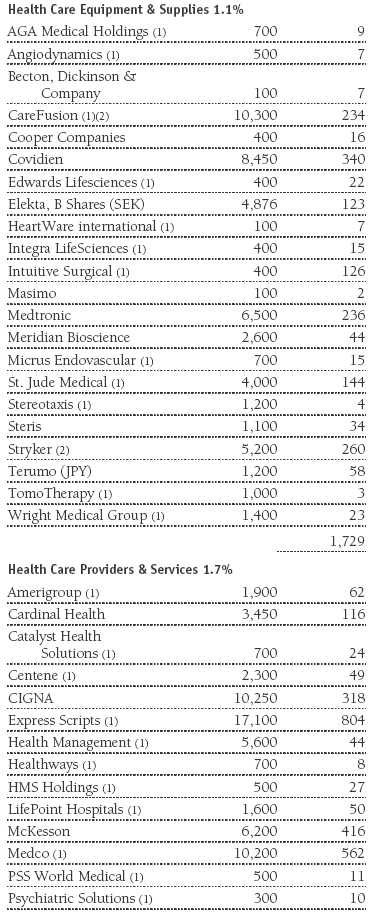
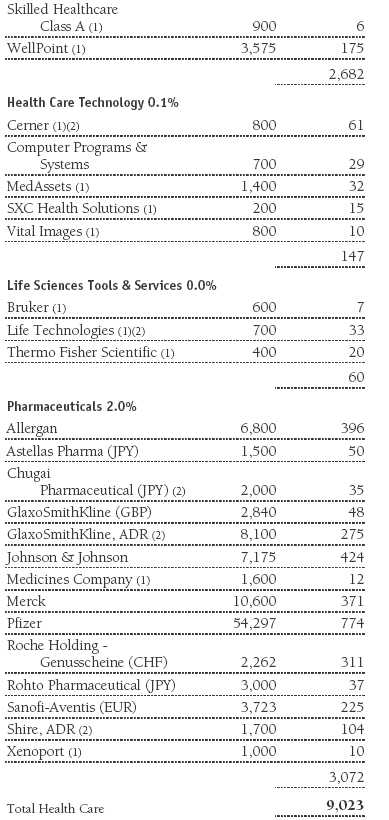
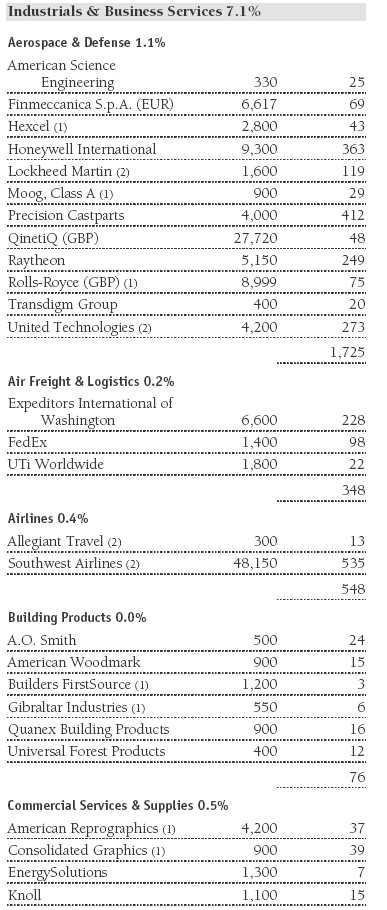
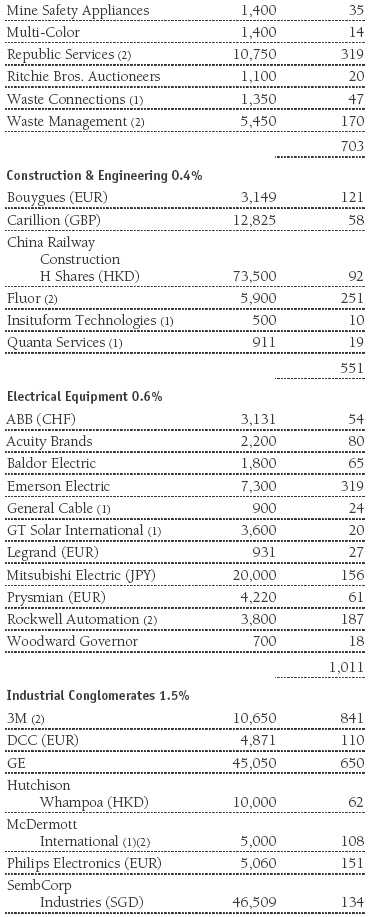
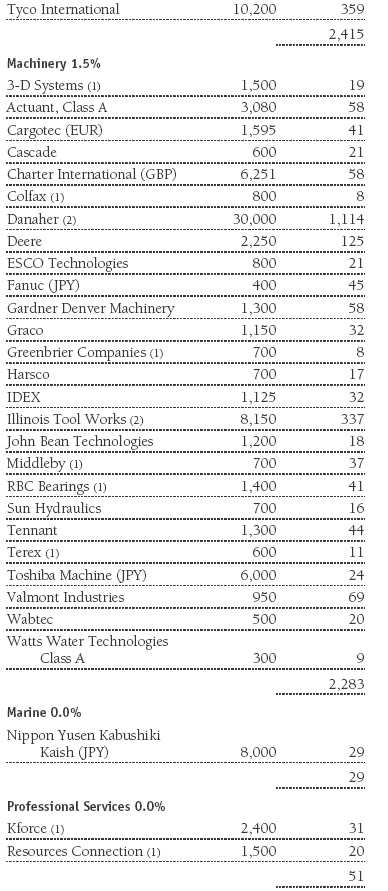
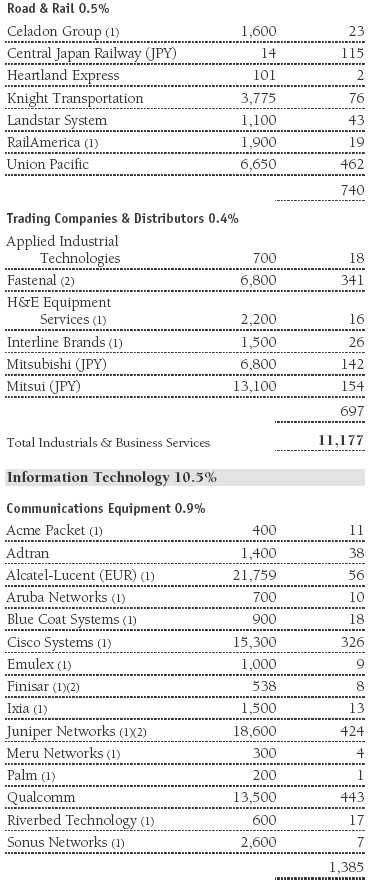
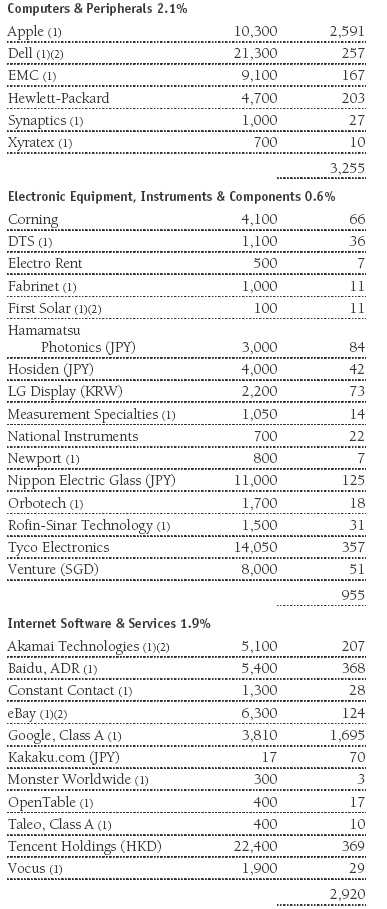
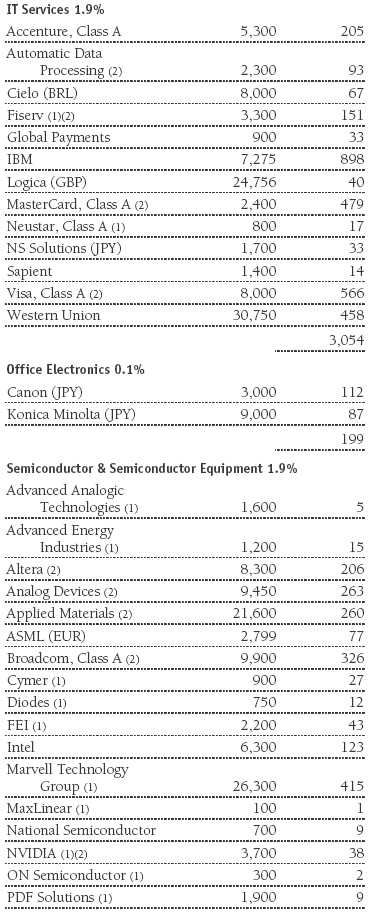
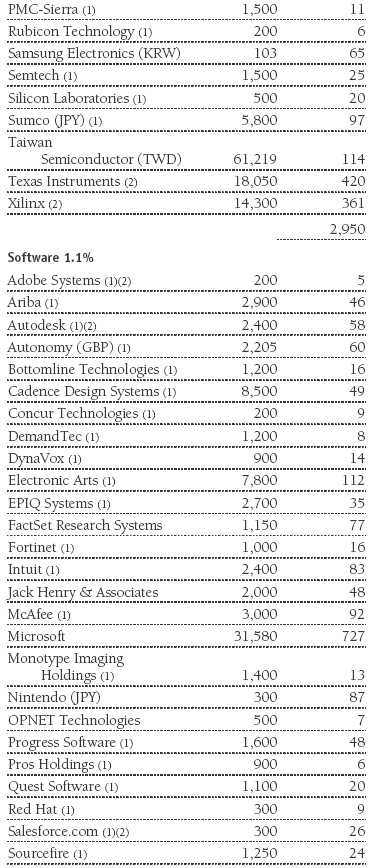
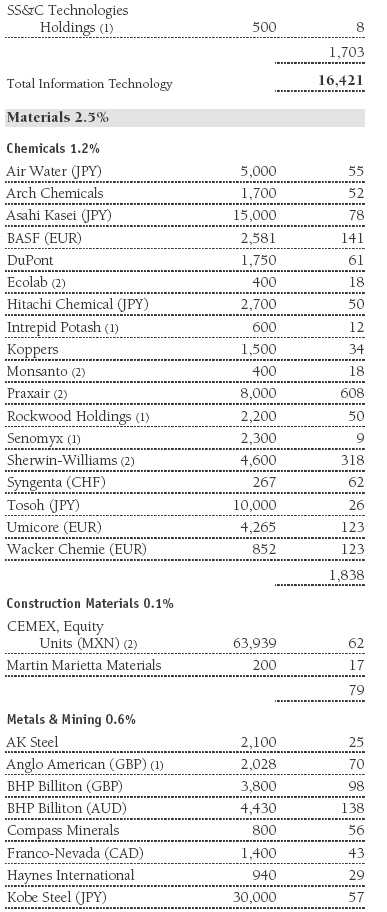
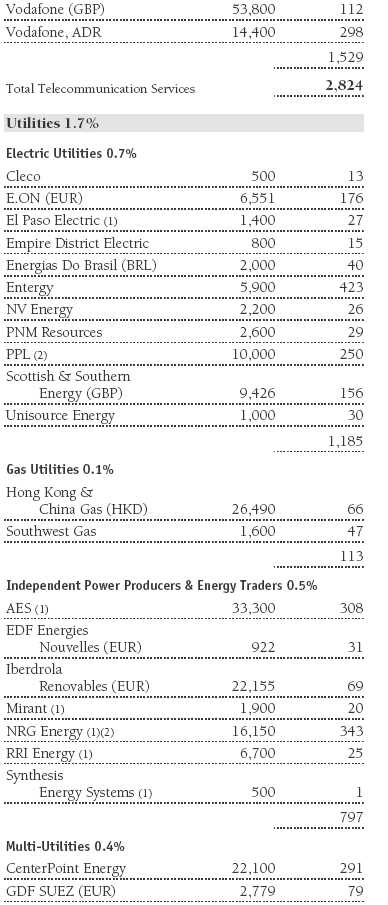
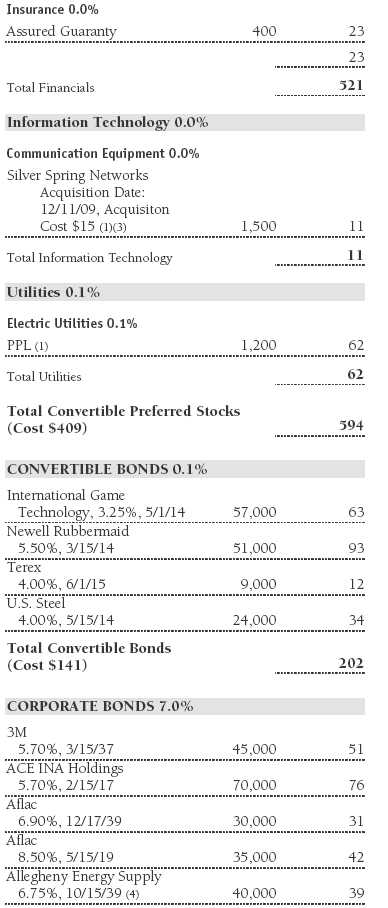
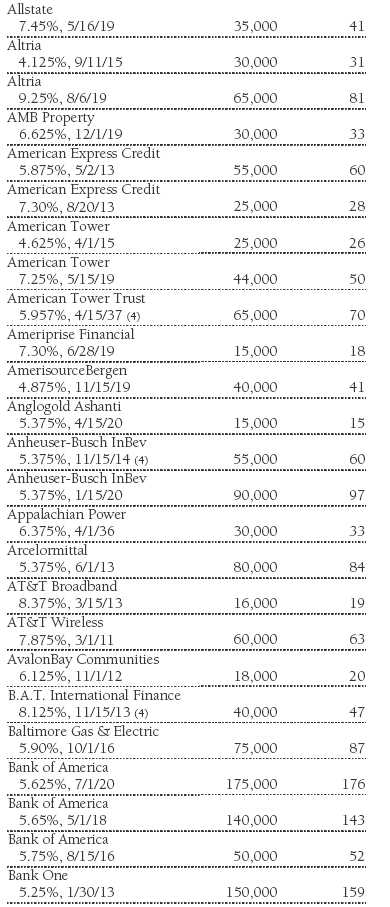
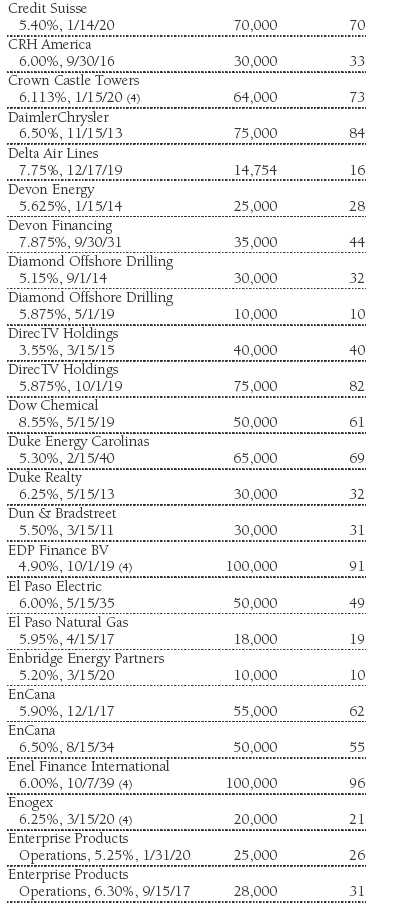
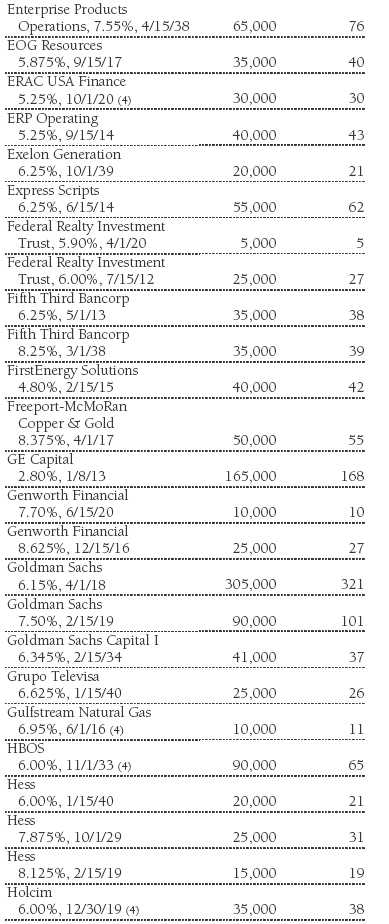
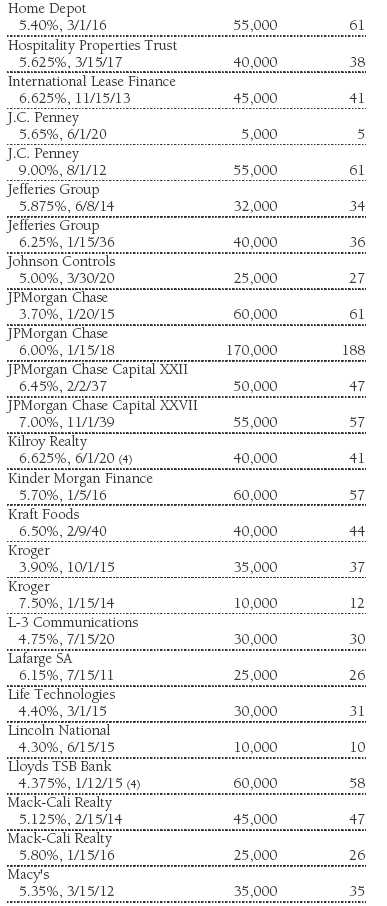
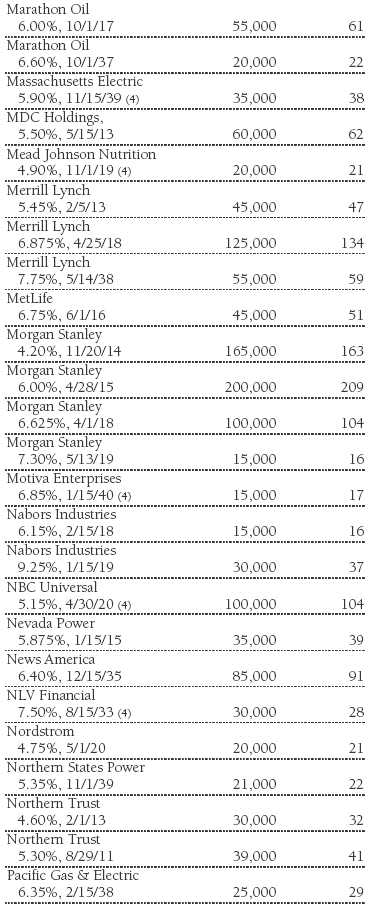
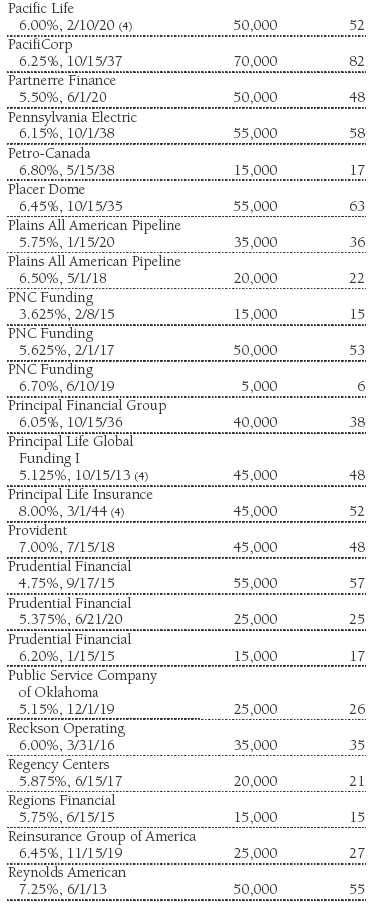
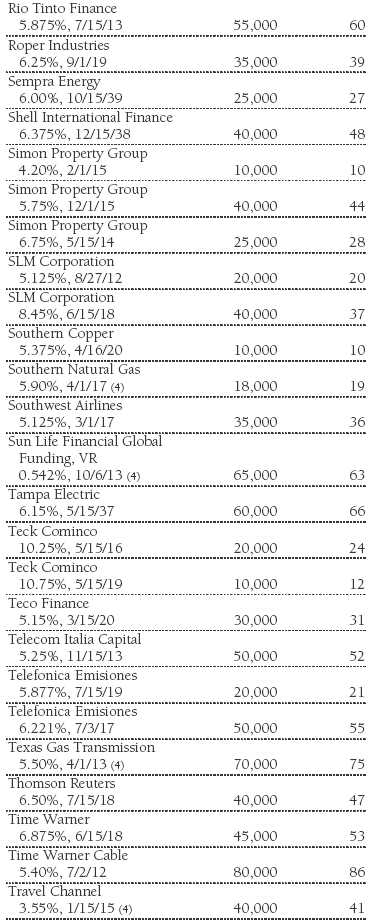
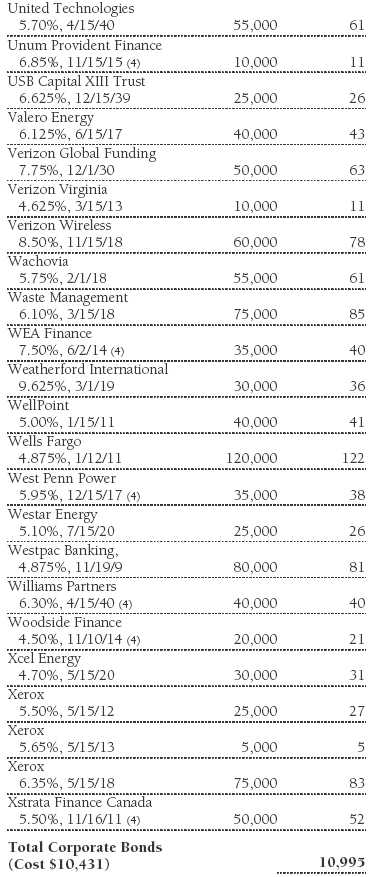
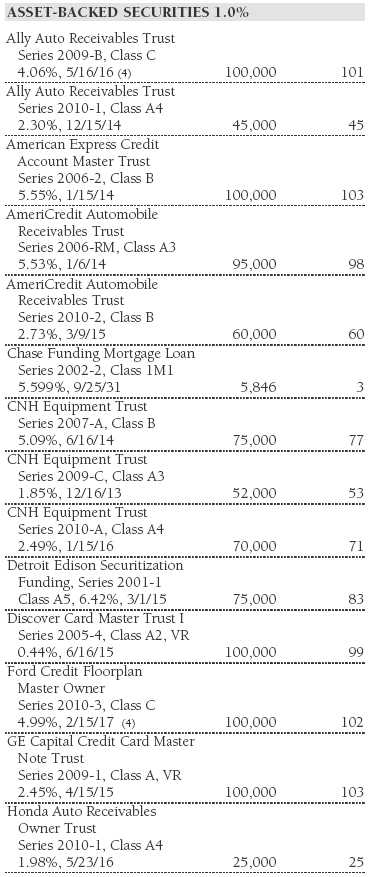
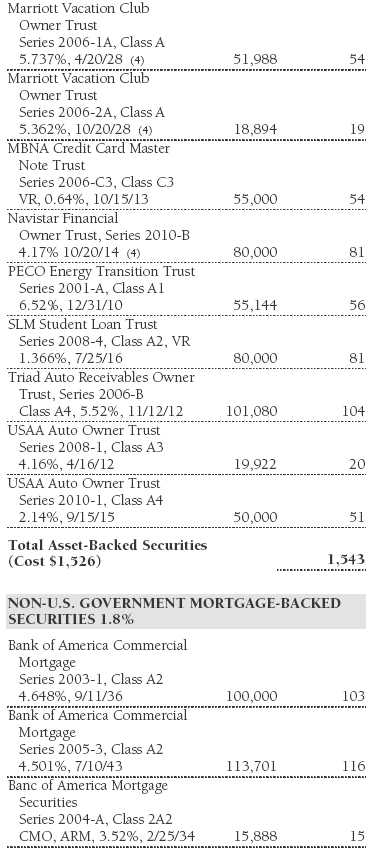
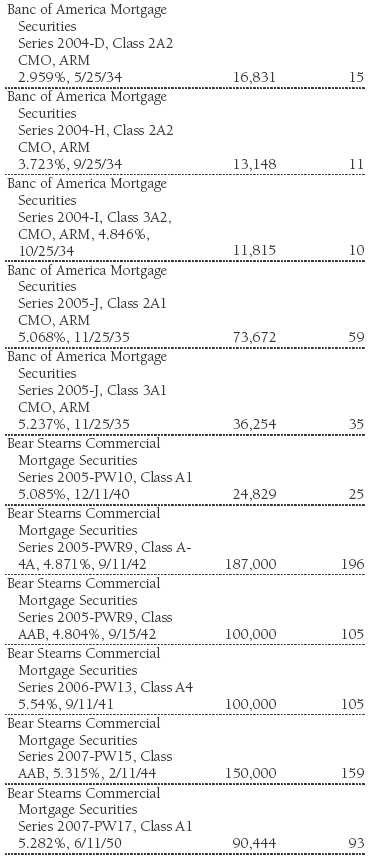
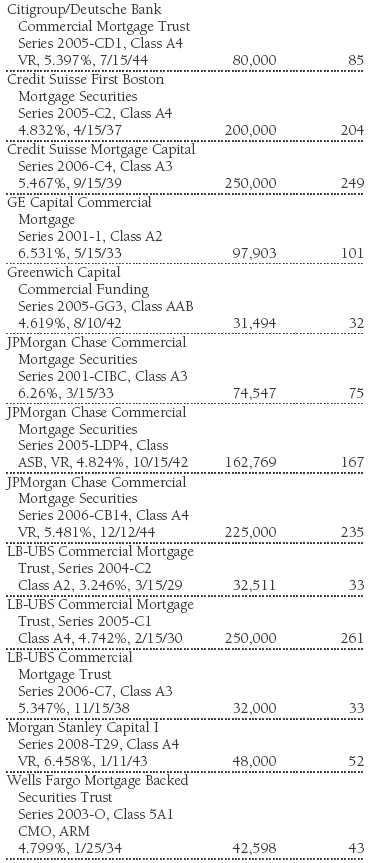
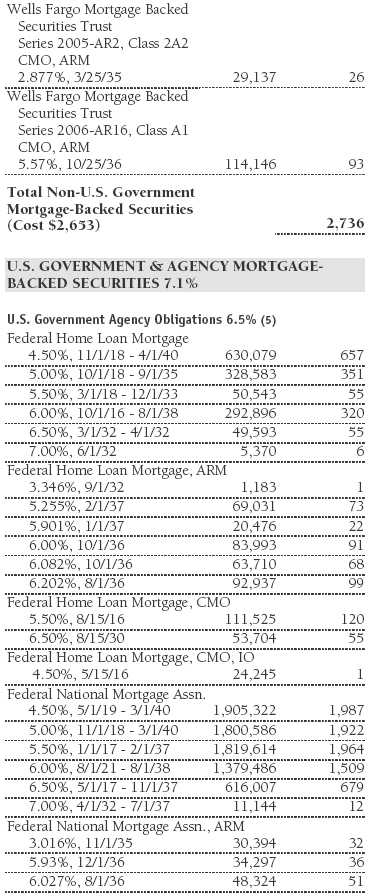
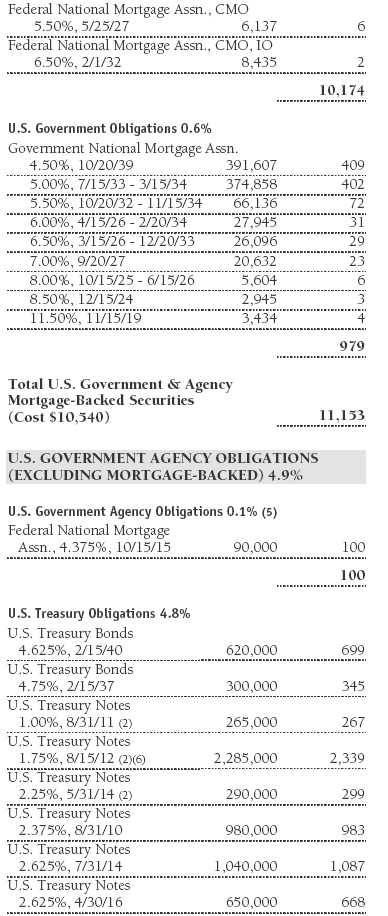
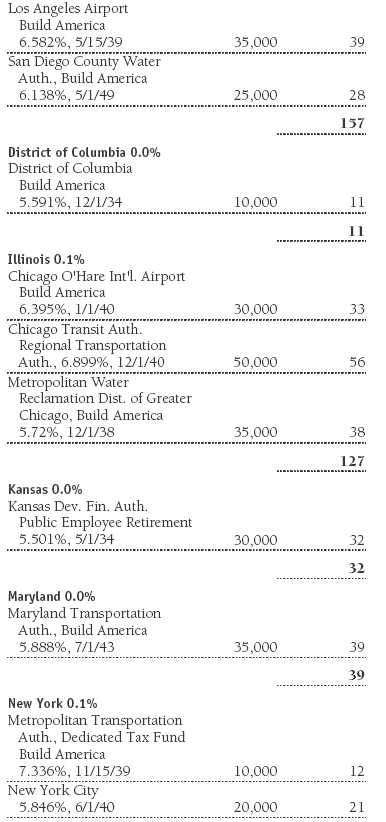
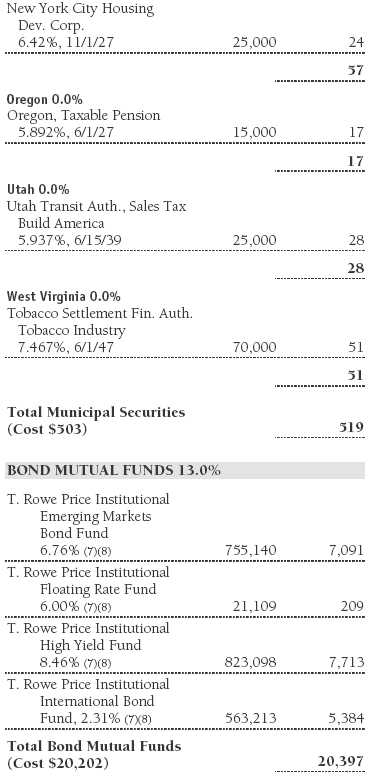
Portfolio of Investments‡
T. Rowe Price Personal Strategy Balanced Portfolio
June 30, 2010 (Unaudited)


The accompanying notes are an integral part of these financial statements.
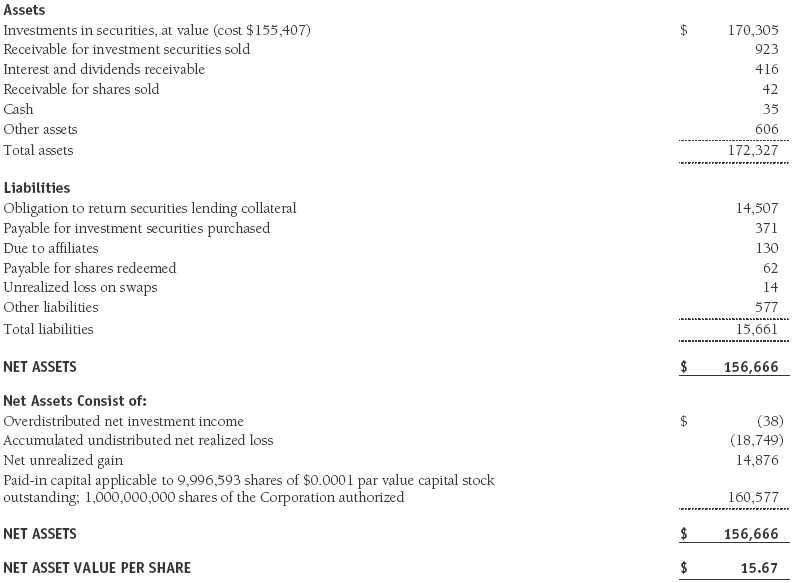
Statement of Assets and Liabilities
T. Rowe Price Personal Strategy Balanced Portfolio
June 30, 2010 (Unaudited)
($000s, except shares and per share amounts)
The accompanying notes are an integral part of these financial statements.
Statement of Operations
T. Rowe Price Personal Strategy Balanced Portfolio
(Unaudited)
($000s)

The accompanying notes are an integral part of these financial statements.
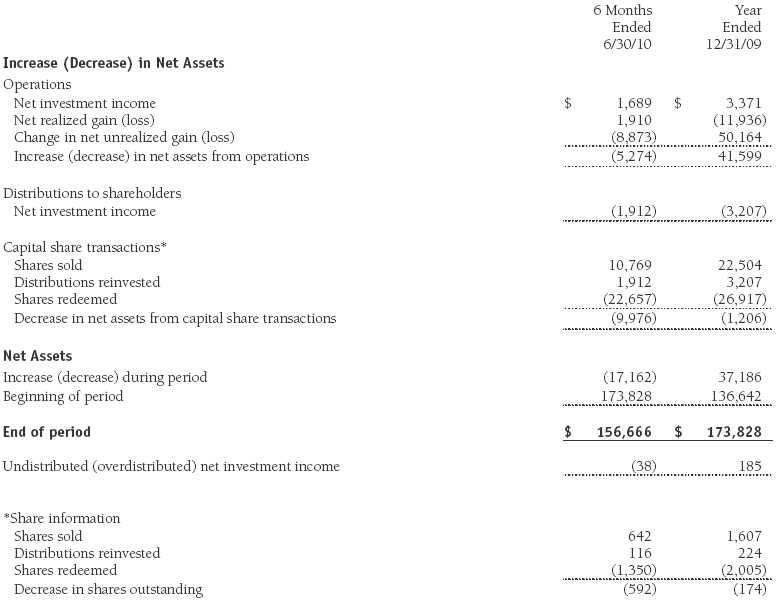
Statement of Changes in Net Assets
T. Rowe Price Personal Strategy Balanced Portfolio
(Unaudited)
($000s)
The accompanying notes are an integral part of these financial statements.
Notes to Financial Statements
T. Rowe Price Personal Strategy Balanced Portfolio
June 30, 2010 (Unaudited)
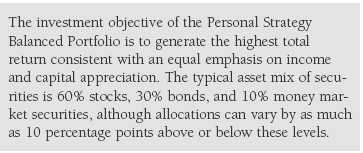
T. Rowe Price Equity Series, Inc. (the corporation), is registered under the Investment Company Act of 1940 (the 1940 Act). The Personal Strategy Balanced Portfolio (the fund), a diversified, open-end management investment company, is one portfolio established by the corporation. The fund commenced operations on December 30, 1994. The fund seeks the highest total return over time consistent with an emphasis on both capital appreciation and income. Shares of the fund are currently offered only through certain insurance companies as an investment medium for both variable annuity contracts and variable life insurance policies.
NOTE 1 - SIGNIFICANT ACCOUNTING POLICIES
Basis of Preparation The accompanying financial statements were prepared in accordance with accounting principles generally accepted in the United States of America (GAAP), which require the use of estimates made by fund management. Fund management believes that estimates and valuations are appropriate; however, actual results may differ from those estimates, and the valuations reflected in the accompanying financial statements may differ from the value ultimately realized upon sale of securities.
Investment Transactions, Investment Income, and Distributions Income and expenses are recorded on the accrual basis. Premiums and discounts on debt securities are amortized for financial reporting purposes. Paydown gains and losses are recorded as an adjustment to interest income. Dividends received from mutual fund investments are reflected as dividend income; capital gain distributions are reflected as realized gain/loss. Earnings on investments recognized as partnerships for federal income tax purposes reflect the tax character of such earnings. Dividend income and capital gain distributions are recorded on the ex-dividend date. Income tax-related interest and penalties, if incurred, would be recorded as income tax expense. Investment transactions are accounted for on the trade date. Realized gains and losses are reported on the identified cost basis. Distributions to shareholders are recorded on the ex-dividend date. Income distributions are declared and paid quarterly. Capital gain distributions, if any, are generally declared and paid by the fund annually.
Currency Translation Assets, including investments, and liabilities denominated in foreign currencies are translated into U.S. dollar values each day at the prevailing exchange rate, using the mean of the bid and asked prices of such currencies against U.S. dollars as quoted by a major bank. Purchases and sales of securities, income, and expenses are translated into U.S. dollars at the prevailing exchange rate on the date of the transaction. The effect of changes in foreign currency exchange rates on realized and unrealized security gains and losses is reflected as a component of security gains and losses.
Rebates Subject to best execution, the fund may direct certain security trades to brokers who have agreed to rebate a portion of the related brokerage commission to the fund in cash. Commission rebates are reflected as realized gain on securities in the accompanying financial statements and totaled $1,000 for the six months ended June 30, 2010.
New Accounting Pronouncement On January 1, 2010, the fund adopted new accounting guidance that requires enhanced disclosures about fair value measurements in the financial statements. Adoption of this guidance had no impact on the fund’s net assets or results of operations.
NOTE 2 - VALUATION
The fund’s investments are reported at fair value as defined by GAAP. The fund determines the values of its assets and liabilities and computes its net asset value per share at the close of the New York Stock Exchange (NYSE), normally 4 p.m. ET, each day that the NYSE is open for business.
Valuation Methods Equity securities listed or regularly traded on a securities exchange or in the over-the-counter (OTC) market are valued at the last quoted sale price or, for certain markets, the official closing price at the time the valuations are made, except for OTC Bulletin Board securities, which are valued at the mean of the latest bid and asked prices. A security that is listed or traded on more than one exchange is valued at the quotation on the exchange determined to be the primary market for such security. Listed securities not traded on a particular day are valued at the mean of the latest bid and asked prices for domestic securities and the last quoted sale price for international securities.
Debt securities are generally traded in the OTC market. Securities with remaining maturities of one year or more at the time of acquisition are valued at prices furnished by dealers who make markets in such securities or by an independent pricing service, which considers the yield or price of bonds of comparable quality, coupon, maturity, and type, as well as prices quoted by dealers who make markets in such securities. Securities with remaining maturities of less than one year at the time of acquisition generally use amortized cost in local currency to approximate fair value. However, if amortized cost is deemed not to reflect fair value or the fund holds a significant amount of such securities with remaining maturities of more than 60 days, the securities are valued at prices furnished by dealers who make markets in such securities or by an independent pricing service.
Investments in mutual funds are valued at the mutual fund’s closing net asset value per share on the day of valuation. Investments in private investment companies are valued at the entity’s net asset value (or equivalent) as of the valuation date. Financial futures contracts are valued at closing settlement prices. Swaps are valued at prices furnished by independent swap dealers or by an independent pricing service.
Other investments, including restricted securities, and those financial instruments for which the above valuation procedures are inappropriate or are deemed not to reflect fair value are stated at fair value as determined in good faith by the T. Rowe Price Valuation Committee, established by the fund’s Board of Directors.
For valuation purposes, the last quoted prices of non-U.S. equity securities may be adjusted under the circumstances described below. If the fund determines that developments between the close of a foreign market and the close of the NYSE will, in its judgment, materially affect the value of some or all of its portfolio securities, the fund will adjust the previous closing prices to reflect what it believes to be the fair value of the securities as of the close of the NYSE. In deciding whether it is necessary to adjust closing prices to reflect fair value, the fund reviews a variety of factors, including developments in foreign markets, the performance of U.S. securities markets, and the performance of instruments trading in U.S. markets that represent foreign securities and baskets of foreign securities. A fund may also fair value securities in other situations, such as when a particular foreign market is closed but the fund is open. The fund uses outside pricing services to provide it with closing prices and information to evaluate and/or adjust those prices. The fund cannot predict how often it will use closing prices and how often it will determine it necessary to adjust those prices to reflect fair value. As a means of evaluating its security valuation process, the fund routinely compares closing prices, the next day’s opening prices in the same markets, and adjusted prices.
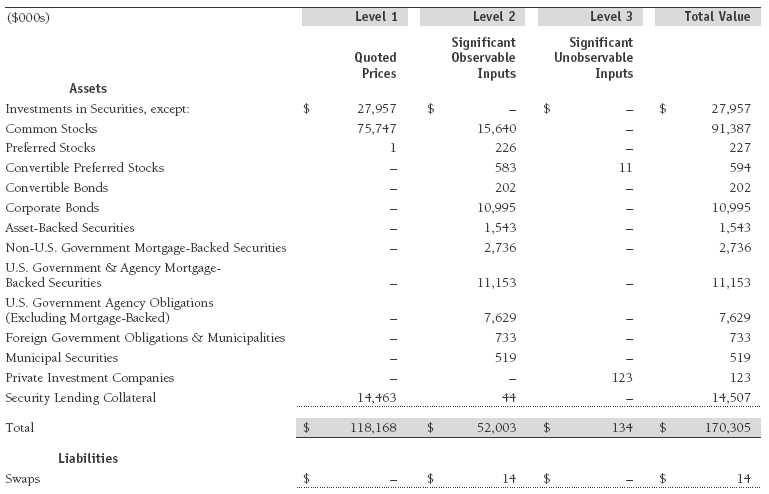
Valuation Inputs Various inputs are used to determine the value of the fund’s financial instruments. These inputs are summarized in the three broad levels listed below:
Level 1 – quoted prices in active markets for identical financial instruments
Level 2 – observable inputs other than Level 1 quoted prices (including, but not limited to, quoted prices for similar financial instruments, interest rates, prepayment speeds, and credit risk)
Level 3 – unobservable inputs
Observable inputs are those based on market data obtained from sources independent of the fund, and unobservable inputs reflect the fund’s own assumptions based on the best information available. The input levels are not necessarily an indication of the risk or liquidity associated with financial instruments at that level. For example, non-U.S. equity securities actively traded in foreign markets generally are reflected in Level 2 despite the availability of closing prices because the fund evaluates and determines whether those closing prices reflect fair value at the close of the NYSE or require adjustment, as described above. The following table summarizes the fund’s financial instruments, based on the inputs used to determine their values on June 30, 2010:
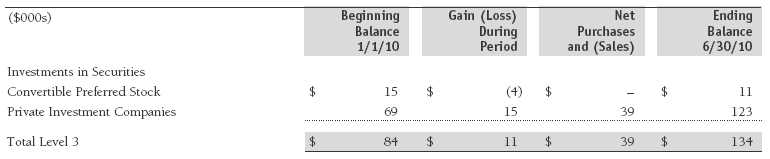
Following is a reconciliation of the fund’s Level 3 holdings for the six months ended June 30, 2010. Gain (loss) reflects both realized and change in unrealized gain (loss) on Level 3 holdings during the period, if any, and is included on the accompanying Statement of Operations. The change in unrealized gain/loss on Level 3 instruments held at June 30, 2010, totaled $11,000 for the six months ended June 30, 2010.
NOTE 3 - DERIVATIVE INSTRUMENTS
During the six months ended June 30, 2010, the fund invested in derivative instruments. As defined by GAAP, a derivative is a financial instrument whose value is derived from an underlying security price, foreign exchange rate, interest rate, index of prices or rates, or other variable; it requires little or no initial investment and permits or requires net settlement. The fund invests in derivatives only if the expected risks and rewards are consistent with its investment objectives, policies, and overall risk profile, as described in its prospectus and Statement of Additional Information. The fund may use derivatives for a variety of purposes, such as seeking to hedge against declines in principal value, increase yield, invest in an asset with greater efficiency and at a lower cost than is possible through direct investment, or to adjust credit exposure. The risks associated with the use of derivatives are different from, and potentially much greater than, the risks associated with investing directly in the instruments on which the derivatives are based. Investments in derivatives can magnify returns positively or negatively; however, the fund at all times maintains sufficient cash reserves, liquid assets, or other SEC-permitted asset types to cover the settlement obligations under its open derivative contracts.
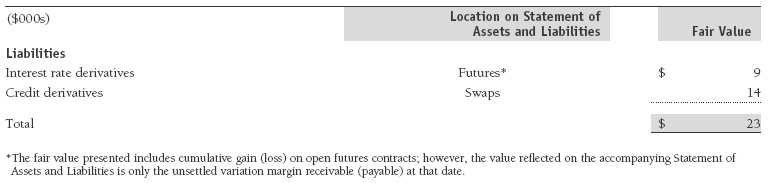
The fund values its derivatives at fair value, as described below and in Note 2, and recognizes changes in fair value currently in its results of operations. Accordingly, the fund does not follow hedge accounting, even for derivatives employed as economic hedges. The fund does not offset the fair value of derivative instruments and the right to reclaim or obligation to return collateral executed with the same counterparty under a master netting arrangement. The following table summarizes the fair value of the fund’s derivative instruments held as of June 30, 2010, and the related location on the accompanying Statement of Assets and Liabilities, presented by primary underlying risk exposure:
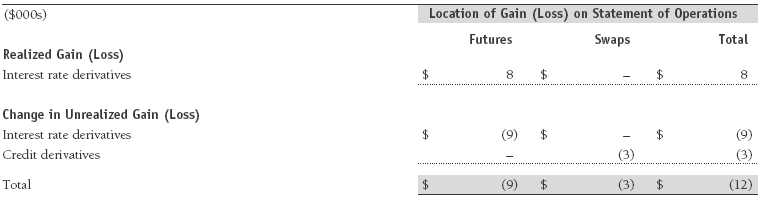
Additionally, the amount of gains and losses on derivative instruments recognized in fund earnings during the six months ended June 30, 2010, and the related location on the accompanying Statement of Operations is summarized in the following table by primary underlying risk exposure:
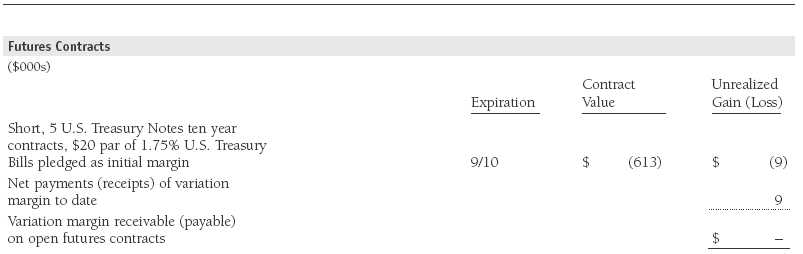
Futures Contracts The fund is subject to interest rate risk in the normal course of pursuing its investment objectives and uses futures contracts to help manage such risk. The fund may enter into futures contracts to manage exposure to interest rates, security prices, foreign currencies, and credit quality; as an efficient means of adjusting exposure to all or part of a target market; to enhance income; as a cash management tool; and/or to adjust credit exposure. A futures contract provides for the future sale by one party and purchase by another of a specified amount of a particular underlying financial instrument at an agreed-upon price, date, time, and place. The fund currently invests only in exchange-traded futures, which generally are standardized as to maturity date, underlying financial instrument, and other contract terms. Upon entering into a futures contract, the fund is required to deposit with the broker cash or securities in an amount equal to a certain percentage of the contract value (initial margin deposit); the margin deposit must then be maintained at the established level over the life of the contract. Subsequent payments are made or received by the fund each day to settle daily fluctuations in the value of the contract (variation margin), which reflect changes in the value of the underlying financial instrument. Variation margin is recorded as unrealized gain or loss until the contract is closed. The value of a futures contract included in net assets is the amount of unsettled variation margin; net variation margin receivable is reflected as an asset, and net variation margin payable is reflected as a liability on the accompanying Statement of Assets and Liabilities. Risks related to the use of futures contracts include possible illiquidity of the futures markets, contract prices that can be highly volatile and imperfectly correlated to movements in hedged security values and/or interest rates, and potential losses in excess of the fund’s initial investment. During the six months ended June 30, 2010, the fund’s exposure to futures, based on underlying notional amounts, was generally between 0% and 1% of net assets.
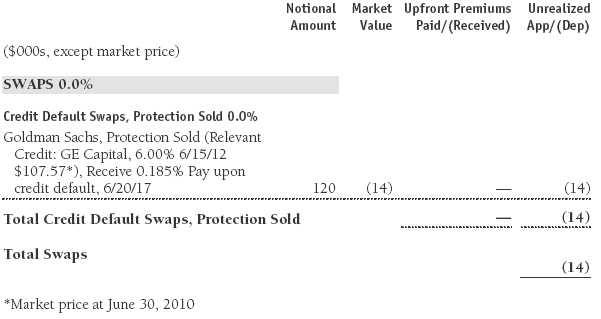
Credit Default Swaps The fund is subject to credit risk in the normal course of pursuing its investment objectives and uses swap contracts to help manage such risk. The fund may use swaps in an effort to manage exposure to changes in interest rates and credit quality, to adjust overall exposure to certain markets, to enhance total return or protect the value of portfolio securities, to serve as a cash management tool, and/or to adjust portfolio duration or credit exposure. Credit default swaps are agreements where one party (the protection buyer) agrees to make periodic payments to another party (the protection seller) in exchange for protection against specified credit events, such as certain defaults and bankruptcies related to an underlying credit instrument, index, or issuer thereof. Upon occurrence of a specified credit event, the protection seller is required to pay the buyer the difference between the notional amount of the swap and the value of the underlying credit, either in the form of a net cash settlement or by paying the gross notional amount and accepting delivery of the relevant underlying credit. Generally, the payment risk for the seller of protection is inversely related to the current market price of the underlying credit; therefore, the payment risk increases as the price of the relevant underlying credit declines due to market valuations of credit quality. As of June 30, 2010, the notional amount of protection sold by the fund totaled $120,000 (0.1% of net assets), which reflects the maximum potential amount the fund could be required to pay under such contracts. The value of a swap included in net assets is the unrealized gain or loss on the contract plus or minus any unamortized premiums paid or received, respectively. Appreciated swaps and premiums paid are reflected as assets, and depreciated swaps and premiums received are reflected as liabilities on the accompanying Statement of Assets and Liabilities. Net periodic receipts or payments required by swaps are accrued daily and are recorded as realized gain or loss for financial reporting purposes; fluctuations in the fair value of swaps are reflected in the change in net unrealized gain or loss and are reclassified to realized gain or loss upon termination prior to maturity or cash settlement. Risks related to the use of credit default swaps include the possible inability of the fund to accurately assess the current and future creditworthiness of underlying issuers, the possible failure of a counterparty to perform in accordance with the terms of the swap agreements, potential government regulation that could adversely affect the fund’s swap investments, and potential losses in excess of the fund’s initial investment. During the six months ended June 30, 2010, the fund’s exposure to swaps, based on underlying notional amounts, was generally between 0% and 1% of net assets.
Counterparty Risk and Collateral The fund has entered into collateral agreements with certain counterparties to mitigate counterparty risk associated with over-the-counter (OTC) derivatives, including swaps and forward currency exchange contracts. Subject to certain minimum exposure requirements (which range from $100,000 to $500,000), collateral generally is determined based on the net aggregate unrealized gain or loss on all OTC derivative contracts with a particular counterparty. Collateral, both pledged by and for the benefit of the fund, is held in a segregated account by a third-party agent and can be in the form of cash or debt securities issued by the U.S. government or related agencies. Securities posted as collateral by the fund are so noted in the accompanying Portfolio of Investments and remain in the fund’s net assets. As of June 30, 2010, no collateral was pledged by either the fund or counterparties.
At any point in time, the fund’s risk of loss from counterparty credit risk on OTC derivatives is the aggregate unrealized gain on appreciated contracts in excess of any collateral pledged by the counterparty for the benefit of the fund. Counterparty risk related to exchange-traded futures and options contracts is minimal because the exchange’s clearinghouse provides protection against defaults. In accordance with standard derivatives agreements, counterparties to OTC derivatives may be able to terminate derivative contracts prior to maturity in the event the fund fails to maintain sufficient asset coverage; its net assets decline by stated percentages; or it otherwise fails to meet the terms of its agreements, which would cause the fund to accelerate payment of any net liability owed to the counterparty under the contract. For exchange-traded derivatives such as futures and options, each broker, in its sole discretion, may change margin requirements applicable to the fund.
NOTE 4 - OTHER INVESTMENT TRANSACTIONS
Consistent with its investment objective, the fund engages in the following practices to manage exposure to certain risks and/or to enhance performance. The investment objective, policies, program, and risk factors of the fund are described more fully in the fund’s prospectus and Statement of Additional Information.
Noninvestment-Grade Securities At June 30, 2010, approximately 12% of the fund’s net assets were invested, either directly or through its investment in T. Rowe Price institutional funds, in noninvestment-grade debt securities, commonly referred to as “high yield” or “junk” bonds. The noninvestment-grade bond market may experience sudden and sharp price swings due to a variety of factors, including changes in economic forecasts, stock market activity, large sustained sales by major investors, a high-profile default, or a change in the market’s psychology. These events may decrease the ability of issuers to make principal and interest payments and adversely affect the liquidity or value, or both, of such securities.
Restricted Securities The fund may invest in securities that are subject to legal or contractual restrictions on resale. Prompt sale of such securities at an acceptable price may be difficult and may involve substantial delays and additional costs.
Repurchase Agreements All repurchase agreements are fully collateralized by U.S. government securities. Collateral is in the possession of the fund’s custodian or, for tri-party agreements, the custodian designated by the agreement. Collateral is evaluated daily to ensure that its market value exceeds the delivery value of the repurchase agreements at maturity. Although risk is mitigated by the collateral, the fund could experience a delay in recovering its value and a possible loss of income or value if the counterparty fails to perform in accordance with the terms of the agreement.
TBA Purchase Commitments During the six months ended June 30, 2010, the fund entered into to be announced (TBA) purchase commitments, pursuant to which it agrees to purchase mortgage-backed securities for a fixed unit price, with payment and delivery at a scheduled future date beyond the customary settlement period for that security. With TBA transactions, the particular securities to be delivered are not identified at the trade date; however, delivered securities must meet specified terms, including issuer, rate, and mortgage term, and be within industry-accepted “good delivery” standards. The fund generally enters into TBA transactions with the intention of taking possession of the underlying mortgage securities. Until settlement, the fund maintains cash reserves and liquid assets sufficient to settle its TBA commitments.
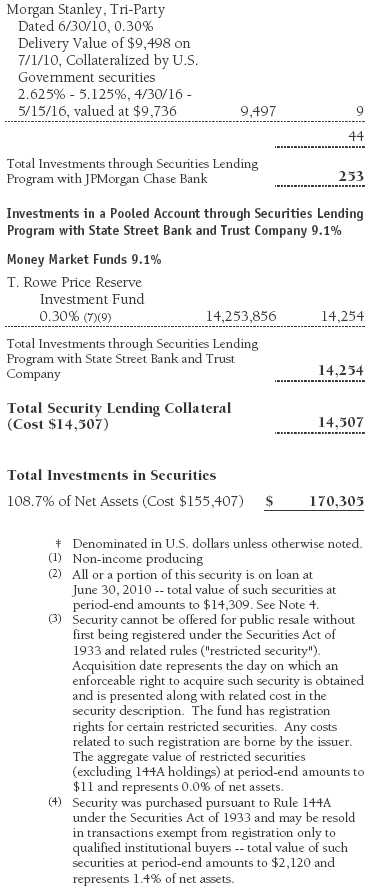
Securities Lending The fund lends its securities to approved brokers to earn additional income. It receives as collateral cash and U.S. government securities valued at 102% to 105% of the value of the securities on loan. Cash collateral is invested by the fund’s lending agent(s) in accordance with investment guidelines approved by fund management. Although risk is mitigated by the collateral, the fund could experience a delay in recovering its securities and a possible loss of income or value if the borrower fails to return the securities or if collateral investments decline in value. Securities lending revenue recognized by the fund consists of earnings on invested collateral and borrowing fees, net of any rebates to the borrower and compensation to the lending agent. On June 30, 2010, the value of loaned securities was $14,309,000; aggregate collateral received included U.S. government securities valued at $271,000.
T. Rowe Price Term Asset-Backed Opportunity Fund, L.L.C. During the six months ended June 30, 2010, the fund invested in the T. Rowe Price Term Asset-Backed Opportunity Fund, L.L.C. (private fund), a private investment company managed by Price Associates that participates in the Term Asset-Backed Securities Loan Facility (TALF) program created and administered by the Federal Reserve Bank of New York (FRBNY). The TALF program provides eligible borrowers with term loans secured by eligible asset-backed securities and/or commercial mortgage-backed securities, which are either owned by the borrower or purchased by the borrower and subsequently pledged as collateral for a TALF loan. TALF loans generally are nonrecourse in nature. The private fund is treated as a partnership for federal income tax purposes. It has a limited life extending five years from final termination of the TALF program, currently scheduled for June 30, 2010, with two possible one-year extensions. Invested capital generally will be returned to investors as underlying securities are liquidated and the TALF loans mature, with the balance paid at maturity of the private fund. Ownership interests in the private fund may not be redeemed, sold, or assigned. As of June 30, 2010, the fund had outstanding capital commitments in the amount of $73,000, which may be called at the discretion of the private fund’s manager.
Other Purchases and sales of portfolio securities other than short-term and U.S. government securities aggregated $28,544,000 and $35,356,000, respectively, for the six months ended June 30, 2010. Purchases and sales of U.S. government securities aggregated $7,046,000 and $6,274,000, respectively, for the six months ended June 30, 2010.
NOTE 5 - FEDERAL INCOME TAXES
No provision for federal income taxes is required since the fund intends to continue to qualify as a regulated investment company under Subchapter M of the Internal Revenue Code and distribute to shareholders all of its taxable income and gains. Distributions determined in accordance with federal income tax regulations may differ in amount or character from net investment income and realized gains for financial reporting purposes. Financial reporting records are adjusted for permanent book/tax differences to reflect tax character but are not adjusted for temporary differences. The amount and character of tax-basis distributions and composition of net assets are finalized at fiscal year-end; accordingly, tax-basis balances have not been determined as of the date of this report.
In accordance with federal tax regulations, the fund recognized capital losses in the current period for tax purposes that had been recognized in the prior fiscal year for financial reporting purposes. Such deferrals relate to net capital losses realized between November 1, 2009 and December 31, 2009, and totaled $40,000. The fund intends to retain realized gains to the extent of available capital loss carryforwards. As of December 31, 2009, the fund had $15,837,000 of unused capital loss carryforwards, which expire: $3,694,000 in fiscal 2016, and $12,143,000 in fiscal 2017.
At June 30, 2010, the cost of investments for federal income tax purposes was $155,407,000. Net unrealized gain aggregated $14,876,000 at period-end, of which $20,717,000 related to appreciated investments and $5,841,000 related to depreciated investments.
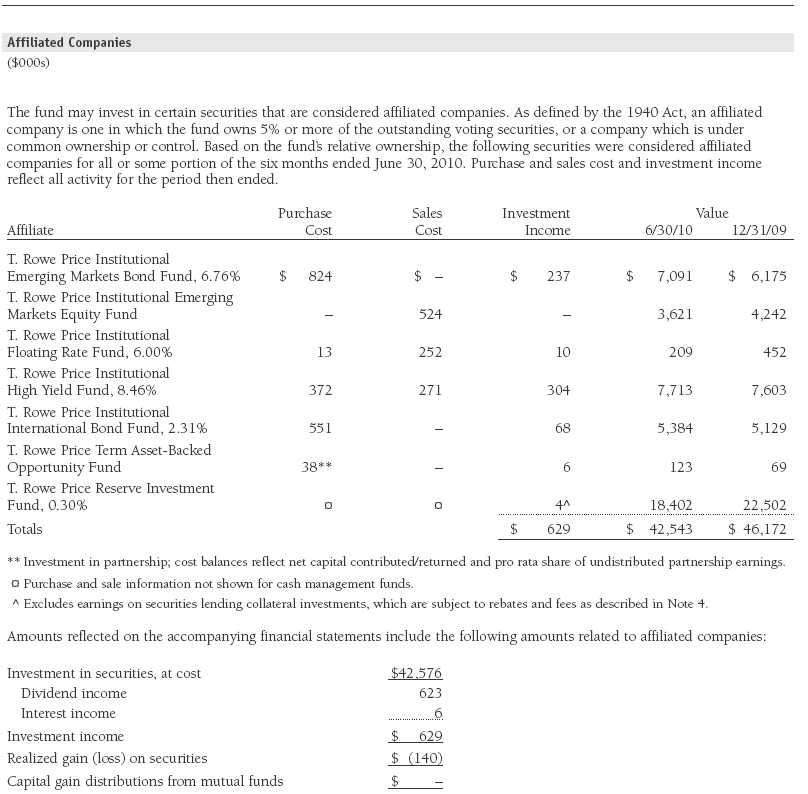
NOTE 6 - RELATED PARTY TRANSACTIONS
The fund is managed by T. Rowe Price Associates, Inc. (the manager or Price Associates), a wholly owned subsidiary of T. Rowe Price Group, Inc. The investment management and administrative agreement between the fund and the manager provides for an all-inclusive annual fee equal to 0.90% of the fund’s average daily net assets. The fee is computed daily and paid monthly. The agreement provides that investment management, shareholder servicing, transfer agency, accounting, custody services, and directors’ fees and expenses are provided to the fund, and interest, taxes, brokerage commissions, and extraordinary expenses are paid directly by the fund.
The fund may invest in the T. Rowe Price Reserve Investment Fund and the T. Rowe Price Government Reserve Investment Fund (collectively, the T. Rowe Price Reserve Investment Funds), open-end management investment companies managed by Price Associates and considered affiliates of the fund. The T. Rowe Price Reserve Investment Funds are offered as cash management options to mutual funds, trusts, and other accounts managed by Price Associates and/or its affiliates and are not available for direct purchase by members of the public. The T. Rowe Price Reserve Investment Funds pay no investment management fees.
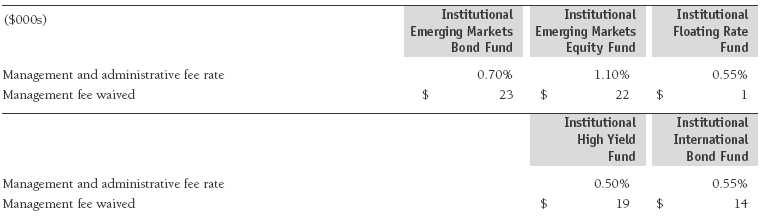
The fund may also invest in certain T. Rowe Price institutional funds (underlying institutional funds) as a means of gaining efficient and cost-effective exposure to certain markets. The underlying institutional funds are open-end management investment companies managed by Price Associates and/or T. Rowe Price International, Inc. (collectively, the Price managers) and are considered affiliates of the fund. Each underlying institutional fund pays an all-inclusive management and administrative fee to its Price manager. To ensure that the fund does not incur duplicate fees, each Price manager has agreed to permanently waive a portion of its management fee charged to the fund in an amount sufficient to fully offset the fees paid by the underlying institutional funds related to fund assets invested therein. Accordingly, the accompanying Statement of Operations includes management fees permanently waived pursuant to this agreement. Annual fee rates and amounts waived within the accompanying Statement of Operations related to shares of the underlying institutional funds for the six months ended June 30, 2010, are as follows:
| Information on Proxy Voting Policies, Procedures, and Records |
A description of the policies and procedures used by T. Rowe Price funds and portfolios to determine how to vote proxies relating to portfolio securities is available in each fund’s Statement of Additional Information, which you may request by calling 1-800-225-5132 or by accessing the SEC’s Web site, www.sec.gov. The description of our proxy voting policies and procedures is also available on our Web site, www.troweprice.com. To access it, click on the words “Our Company” at the top of our corporate homepage. Then, when the next page appears, click on the words “Proxy Voting Policies” on the left side of the page.
Each fund’s most recent annual proxy voting record is available on our Web site and through the SEC’s Web site. To access it through our Web site, follow the directions above, then click on the words “Proxy Voting Records” on the right side of the Proxy Voting Policies page.
| How to Obtain Quarterly Portfolio Holdings |
The fund files a complete schedule of portfolio holdings with the Securities and Exchange Commission for the first and third quarters of each fiscal year on Form N-Q. The fund’s Form N-Q is available electronically on the SEC’s Web site (www.sec.gov); hard copies may be reviewed and copied at the SEC’s Public Reference Room, 450 Fifth St. N.W., Washington, DC 20549. For more information on the Public Reference Room, call 1-800-SEC-0330.
| Approval of Investment Management Agreement |
On March 9, 2010, the fund’s Board of Directors (Board) unanimously approved the continuation of the investment advisory contract (Contract) between the fund and its investment manager, T. Rowe Price Associates, Inc. (Adviser). The Board considered a variety of factors in connection with its review of the Contract, also taking into account information provided by the Adviser during the course of the year, as discussed below:
Services Provided by the Adviser
The Board considered the nature, quality, and extent of the services provided to the fund by the Adviser. These services included, but were not limited to, management of the fund’s portfolio and a variety of related activities, as well as financial and administrative services, reporting, and communications. The Board also reviewed the background and experience of the Adviser’s senior management team and investment personnel involved in the management of the fund. The Board concluded that it was satisfied with the nature, quality, and extent of the services provided by the Adviser.
Investment Performance of the Fund
The Board reviewed the fund’s average annual total returns over the 1-, 3-, 5-, and 10-year periods, as well as the fund’s year-by-year returns, and compared these returns with a wide variety of previously agreed upon comparable performance measures and market data, including those supplied by Lipper and Morningstar, which are independent providers of mutual fund data. On the basis of this evaluation and the Board’s ongoing review of investment results, and factoring in the severity of the market turmoil during 2008 and 2009, the Board concluded that the fund’s performance was satisfactory.
Costs, Benefits, Profits, and Economies of Scale
The Board reviewed detailed information regarding the revenues received by the Adviser under the Contract and other benefits that the Adviser (and its affiliates) may have realized from its relationship with the fund, including research received under “soft dollar” agreements and commission-sharing arrangements with broker-dealers. The Board considered that the Adviser may receive some benefit from its soft-dollar arrangements pursuant to which it receives research from broker-dealers that execute the applicable fund’s portfolio transactions. The Board also received information on the estimated costs incurred and profits realized by the Adviser and its affiliates from advising T. Rowe Price mutual funds, as well as estimates of the gross profits realized from managing the fund in particular. The Board concluded that the Adviser’s profits were reasonable in light of the services provided to the fund. The Board also considered whether the fund or other funds benefit under the fee levels set forth in the Contract from any economies of scale realized by the Adviser. The Board noted that, under the Contract, the fund pays the Adviser a single fee based on the fund’s assets and that the Adviser, in turn, pays all expenses of the fund, with certain exceptions. The Board concluded that, based on the profitability data it reviewed and consistent with this single fee structure, the Contract provided for a reasonable sharing of any benefits from economies of scale with the fund.
Fees
The Board reviewed the fund’s single-fee structure and compared it with fees and expenses of other comparable funds based on information and data supplied by Lipper. The information provided to the Board indicated that the fund’s management fee rate and total expense ratio were above the median for comparable funds. (For these purposes, the Board assumed the fund’s management fee rate was equal to the single fee less the fund’s operating expenses.) The Board also reviewed the fee schedules for institutional accounts of the Adviser and its affiliates with smaller mandates. Management informed the Board that the Adviser’s responsibilities for institutional accounts are more limited than its responsibilities for the fund and other T. Rowe Price mutual funds that it or its affiliates advise and that the Adviser performs significant additional services and assumes greater risk for the fund and other T. Rowe Price mutual funds that it advises than it does for institutional accounts. On the basis of the information provided, the Board concluded that the fees paid by the fund under the Contract were reasonable.
Approval of the Contract
As noted, the Board approved the continuation of the Contract. No single factor was considered in isolation or to be determinative to the decision. Rather, the Board was assisted by the advice of independent legal counsel and concluded, in light of a weighting and balancing of all factors considered, that it was in the best interests of the fund to approve the continuation of the Contract, including the fees to be charged for services thereunder.
Item 2. Code of Ethics.
A code of ethics, as defined in Item 2 of Form N-CSR, applicable to its principal executive officer, principal financial officer, principal accounting officer or controller, or persons performing similar functions is filed as an exhibit to the registrant’s annual Form N-CSR. No substantive amendments were approved or waivers were granted to this code of ethics during the registrant’s most recent fiscal half-year.
Item 3. Audit Committee Financial Expert.
Disclosure required in registrant’s annual Form N-CSR.
Item 4. Principal Accountant Fees and Services.
Disclosure required in registrant’s annual Form N-CSR.
Item 5. Audit Committee of Listed Registrants.
Not applicable.
Item 6. Investments.
(a) Not applicable. The complete schedule of investments is included in Item 1 of this Form N-CSR.
(b) Not applicable.
Item 7. Disclosure of Proxy Voting Policies and Procedures for Closed-End Management Investment Companies.
Not applicable.
Item 8. Portfolio Managers of Closed-End Management Investment Companies.
Not applicable.
Item 9. Purchases of Equity Securities by Closed-End Management Investment Company and Affiliated Purchasers.
Not applicable.
Item 10. Submission of Matters to a Vote of Security Holders.
Not applicable.
Item 11. Controls and Procedures.
(a) The registrant’s principal executive officer and principal financial officer have evaluated the registrant’s disclosure controls and procedures within 90 days of this filing and have concluded that the registrant’s disclosure controls and procedures were effective, as of that date, in ensuring that information required to be disclosed by the registrant in this Form N-CSR was recorded, processed, summarized, and reported timely.
(b) The registrant’s principal executive officer and principal financial officer are aware of no change in the registrant’s internal control over financial reporting that occurred during the registrant’s second fiscal quarter covered by this report that has materially affected, or is reasonably likely to materially affect, the registrant’s internal control over financial reporting.
Item 12. Exhibits.
(a)(1) The registrant’s code of ethics pursuant to Item 2 of Form N-CSR is filed with the registrant’s annual Form N-CSR.
(2) Separate certifications by the registrant's principal executive officer and principal financial officer, pursuant to Section 302 of the Sarbanes-Oxley Act of 2002 and required by Rule 30a-2(a) under the Investment Company Act of 1940, are attached.
(3) Written solicitation to repurchase securities issued by closed-end companies: not applicable.
(b) A certification by the registrant's principal executive officer and principal financial officer, pursuant to Section 906 of the Sarbanes-Oxley Act of 2002 and required by Rule 30a-2(b) under the Investment Company Act of 1940, is attached.
| | |
SIGNATURES |
| |
| | Pursuant to the requirements of the Securities Exchange Act of 1934 and the Investment |
| Company Act of 1940, the registrant has duly caused this report to be signed on its behalf by the |
| undersigned, thereunto duly authorized. |
| |
| T. Rowe Price Equity Series, Inc. |
| |
| |
| |
| By | /s/ Edward C. Bernard |
| | Edward C. Bernard |
| | Principal Executive Officer |
| |
| Date | August 17, 2010 |
| |
| |
| |
| | Pursuant to the requirements of the Securities Exchange Act of 1934 and the Investment |
| Company Act of 1940, this report has been signed below by the following persons on behalf of |
| the registrant and in the capacities and on the dates indicated. |
| |
| |
| By | /s/ Edward C. Bernard |
| | Edward C. Bernard |
| | Principal Executive Officer |
| |
| Date | August 17, 2010 |
| |
| |
| |
| By | /s/ Gregory K. Hinkle |
| | Gregory K. Hinkle |
| | Principal Financial Officer |
| |
| Date | August 17, 2010 |