| UNITED STATES |
| SECURITIES AND EXCHANGE COMMISSION |
| Washington, D.C. 20549 |
| |
FORM N-CSR |
| |
CERTIFIED SHAREHOLDER REPORT OF REGISTERED |
MANAGEMENT INVESTMENT COMPANIES |
| |
| |
| |
| Investment Company Act File Number: 811-07143 |
|
| |
| T. Rowe Price Equity Series, Inc. |
|
| (Exact name of registrant as specified in charter) |
| |
| 100 East Pratt Street, Baltimore, MD 21202 |
|
| (Address of principal executive offices) |
| |
| David Oestreicher |
| 100 East Pratt Street, Baltimore, MD 21202 |
|
| (Name and address of agent for service) |
| |
| |
| Registrant’s telephone number, including area code: (410) 345-2000 |
| |
| |
| Date of fiscal year end: December 31 |
| |
| |
| Date of reporting period: June 30, 2009 |
Item 1: Report to Shareholders| Equity Index 500 Portfolio | June 30, 2009 |
• U.S. stocks began 2009 on a sour note as 2008’s market weakness carried over into the new year, but equities rallied sharply from their March lows amid early signs that the economy may be stabilizing.
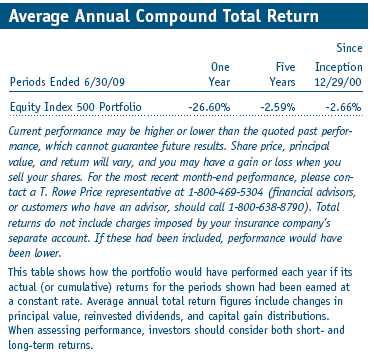
• The Equity Index 500 Portfolio returned 2.98% for the first six months of 2009 and closely tracked the returns of its unmanaged benchmark, the S&P 500 Stock Index.
• Our replication and sampling strategies are designed to keep the composition of the portfolio similar to that of the benchmark.
• Although the recent market rebound was encouraging, investors should not be surprised at a near-term pullback as the markets look for more concrete signs of improvement in the real economy.
The views and opinions in this report were current as of June 30, 2009. They are not guarantees of performance or investment results and should not be taken as investment advice. Investment decisions reflect a variety of factors, and the managers reserve the right to change their views about individual stocks, sectors, and the markets at any time. As a result, the views expressed should not be relied upon as a forecast of the fund’s future investment intent. The report is certified under the Sarbanes-Oxley Act, which requires mutual funds and other public companies to affirm that, to the best of their knowledge, the information in their financial reports is fairly and accurately stated in all material respects.
Manager’s Letter
T. Rowe Price Equity Index 500 Portfolio
Dear Investor
The historic downturn in U.S. stocks that began in 2008 extended into the early months of 2009. However, equities rallied sharply from their March lows amid scattered signs that the economy is in the process of bottoming and that government measures to stabilize the financial markets may be starting to bear fruit. The rally lost steam in June, and share prices fell in the final weeks of the period as earlier optimism receded in the face of economic news suggesting a more subdued, long-term recovery. Nevertheless, the mid-period rally was enough to lift most major stock indices into positive territory for the first six months of the year.
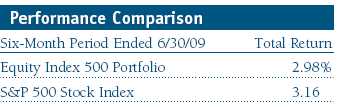
The Equity Index 500 Portfolio returned 2.98% for the first half of 2009. As shown in the accompanying table above, the portfolio’s return closely tracked the 3.16% return of its unmanaged benchmark, the S&P 500 Stock Index. Portfolio performance may differ from that of the benchmark due to the portfolio’s operating and management expenses.
Market Environment
The U.S. economy is mired in one of the deepest and longest downturns since the Great Depression, with gross domestic product contracting markedly and unemployment reaching 9.5% by the end of our reporting period.
Addressing the economic downturn, the Federal Reserve reiterated that it would keep the federal funds target rate near 0% and indicated that it would continue its policy of quantitative easing, honoring its earlier pledge to buy $300 billion in longer-term U.S. government debt by the fall and $1.45 trillion in mortgage-related debt by the end of the year. The economic recession has begun to ease, according to the Fed’s policy-setting panel, and worries about deflation (a downward spiral in prices) have been fading. The Fed indicated that rates were likely to remain low until an economic revival was under way and concerns about higher inflation down the road resurfaced.
As investors developed more confidence that perhaps the worst of the crisis was finally behind us, stocks rebounded sharply beginning in March before pulling back in late June. The investment environment assumed a more positive tone, with riskier asset classes performing best in recent months. Credit spreads have narrowed in the bond markets, and overall liquidity has improved. The federal government’s “stress test” results for 19 of the largest U.S. banks were not as bad as feared. Financial markets have responded favorably as a number of major financial institutions are raising additional capital. Financials, the worst-performing sector in the first quarter, was the strongest sector in the second quarter.
Unemployment continued to climb and is likely to rise further in the months ahead. However, the pace of job losses is slowing. While unemployment is a lagging indicator, many leading indicators, including consumer confidence, have bounced from their lows. Signs of stabilization have begun to appear in housing, particularly at the lower end, where credits for first-time home buyers have helped. In general, investors have become more optimistic that a gradual process of stabilization and recovery may be under way.
U.S. stocks gained in the first half of 2009 amid the improved investor sentiment. Growth stocks significantly outperformed value across all market capitalizations for the period. Small-cap shares performed in line with their large-cap counterparts, but both were outpaced by mid-cap stocks.
Strategy Review
The T. Rowe Price Equity Index 500 Portfolio is designed for investors who want to harness the potential for long-term capital appreciation from broad exposure to large-cap stocks. The portfolio may serve as a core holding in an investor’s portfolio, as it features attributes that many investors will find appealing.
• By investing in all 500 stocks of the benchmark S&P index, it is well diversified, which can potentially reduce the impact of negative performance from a given stock or sector on the entire portfolio.
• The portfolio tends to track its benchmark closely, using a full replication strategy so that the weightings of our holdings match those of the S&P 500 Index. We occasionally invest in securities such as futures and exchange-traded funds so that the portfolio can accommodate cash flows and remain fully invested.
• It offers instant, broad exposure to different sectors of the stock market, with sector allocations that are consistent with its benchmark. As such, changes in the portfolio’s sector diversification and other overall characteristics reflect changes in the composition of the index, rather than strategic shifts that are typical of an actively managed portfolio.
Portfolio and Performance Review
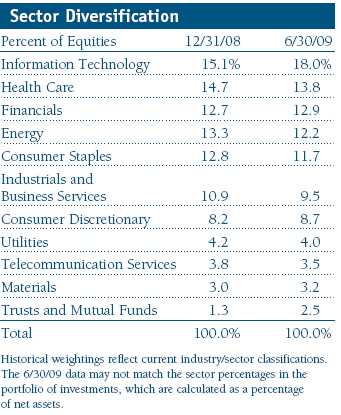
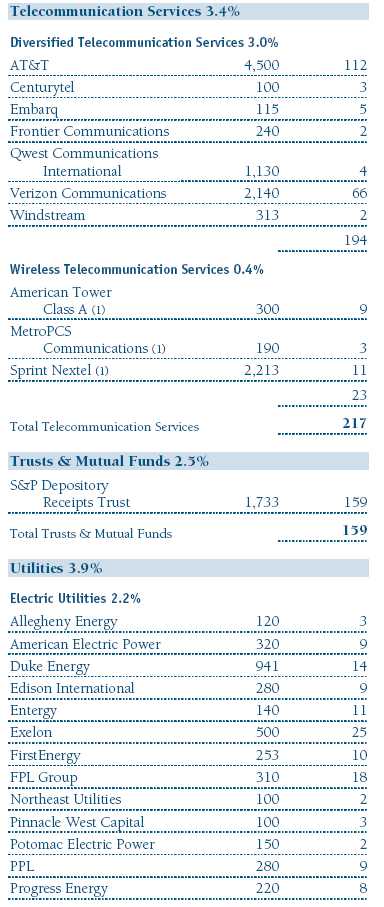
As investors focused on growth during the period, the best-performing S&P 500 sectors were information technology, materials, and consumer discretionary—traditionally seen as some of the market’s riskier sectors. At the same time, the traditional market safe havens turned in weaker performance as health care, utilities, and consumer staples were either flat or negative for the period. Viewed as the impetus and epicenter of the recent downturn, financial sector shares lost ground despite a strong rebound over the last three months of the reporting period. Industrials and business services also rallied over the closing months, but still fell for the period as the rally was not enough to overcome weakness in the first half.
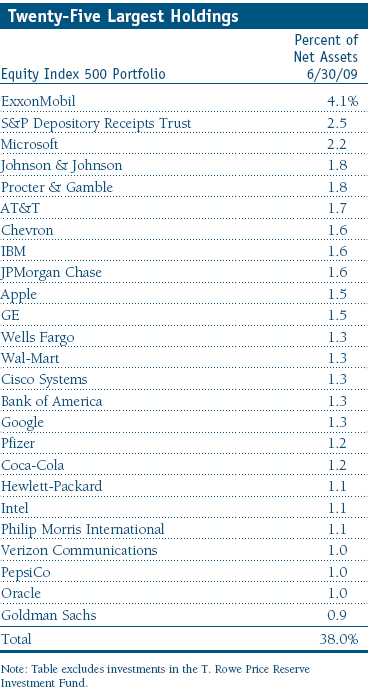
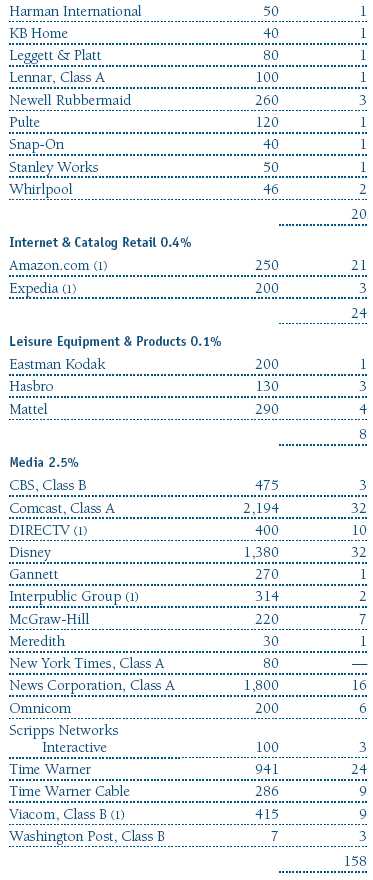
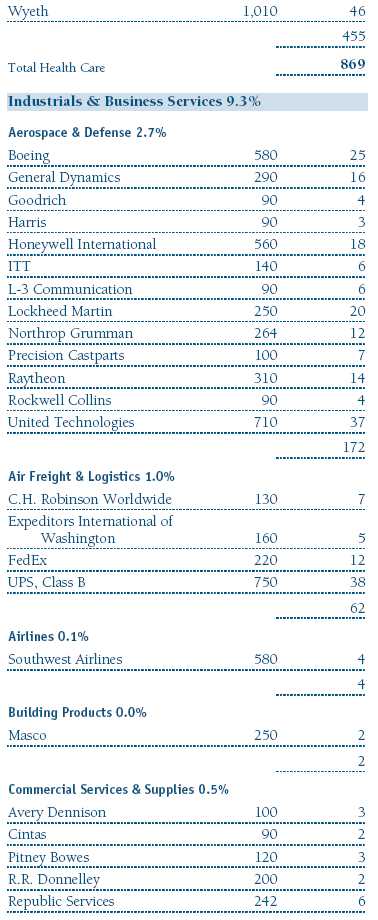
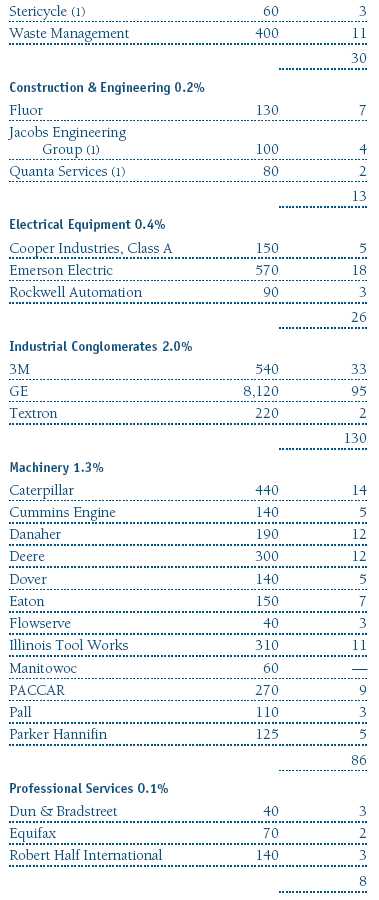
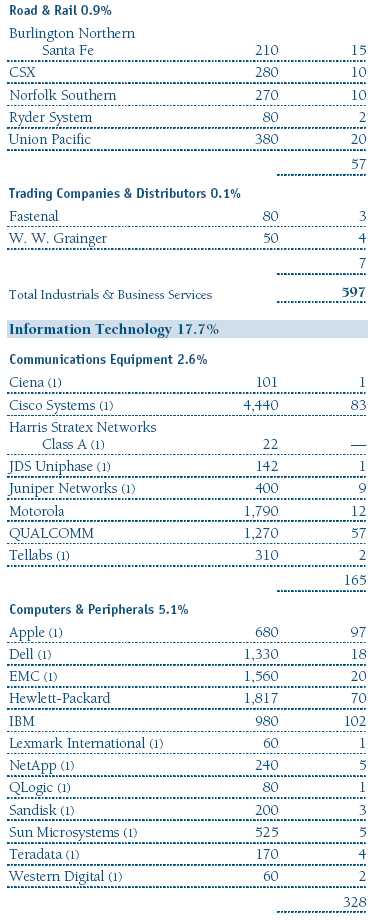
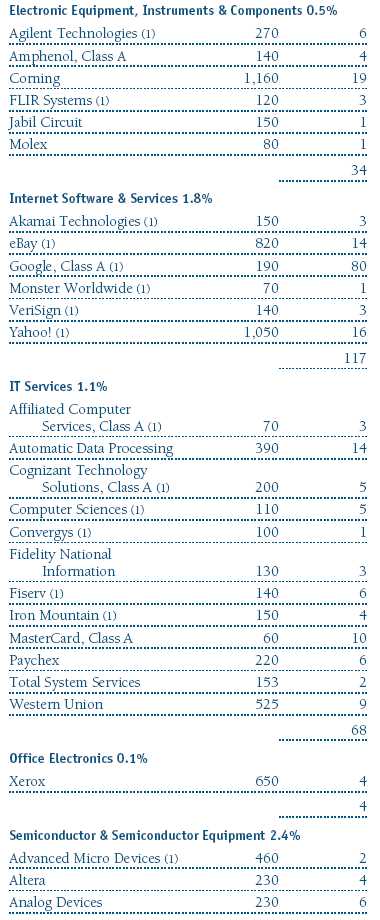
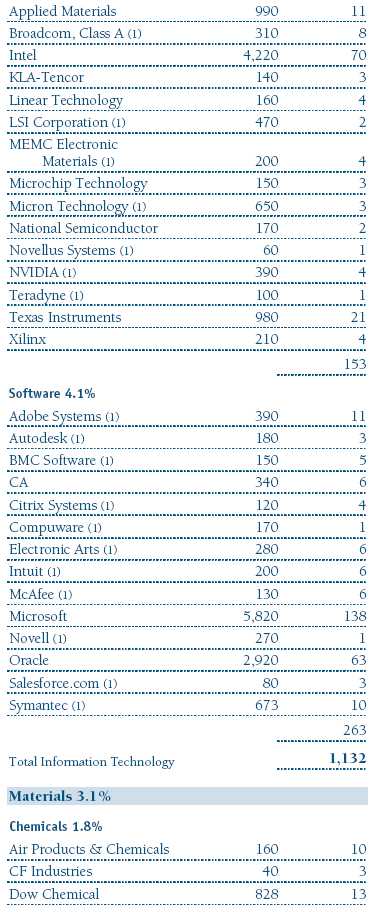
The information technology sector posted the strongest returns, with particular strength in the computers and peripherals industry. Shares of Apple performed well as the company continues to deliver superior products in large markets where it can take market share. Examples include new and updated versions of the iPhone, the iPod, and the iconic desktop computers. IBM was strong as a dominant global technology player with diversified revenue streams, deriving over 60% of revenues from outside the U.S. Microsoft shares rallied strongly in April after the world’s leading software company reported solid earnings and affirmed plans to cut costs. The office electronics space was a weak spot for the sector as Xerox continued to struggle amid slow business spending. (Please refer to the portfolio of investments for a complete listing of holdings and the amount each represents in the portfolio.)

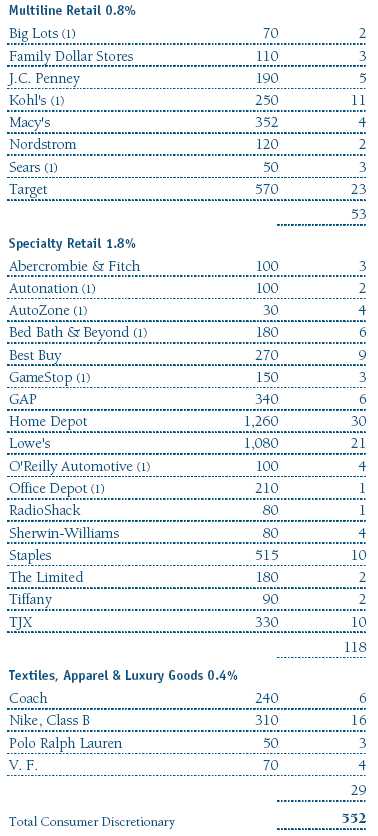
The consumer discretionary sector also gained ground as a stabilizing economy and improving consumer confidence led to expectations for increased consumer spending. Internet retailer Amazon.com continues to benefit from one of the best management teams in the business, investing in innovative products and services, taking market share, and improving the amount and quality of revenue and earnings. Multiline retailer Target and specialty retailer TJX also rose. Target is the second-largest discount retailer behind Wal-Mart, but aims for a slightly higher price point and better margins. TJX is the parent company of T.J. Maxx and Marshalls stores, specializing in higher-fashion designs at discounted prices. Shares of Ford benefited from the high-profile problems at its major competitors GM and Chrysler and some surprisingly strong product offerings. The household durables sector lost ground. In particular, home-builders Pulte and Centex continued to struggle amid the historic housing downturn.
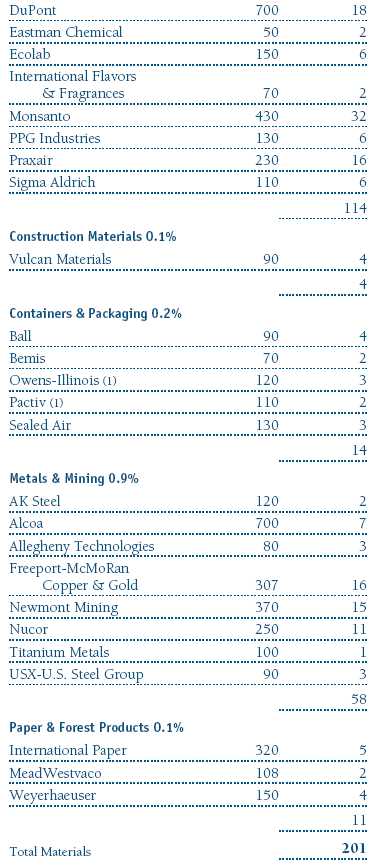
The materials sector rose on the heels of higher commodity prices. The chemicals industry was the strongest in the sector, led by industrial gas distributor Praxair, which benefited from effective cost cutting and optimism over a gradually improving global economy. Copper producer Freeport McMoRan Copper & Gold generated the best results in the sector amid strong demand and rising metals prices. Declining construction activity and expenses associated with a recent acquisition pressured shares of Vulcan Materials, a leading U.S. producer of aggregates used in concrete and asphalt.
Industrials and business services was the weakest sector for the period, with industrial conglomerates posting the largest declines. GE suffered early in the period as the economic downturn accelerated and capital expenditures ground to a virtual halt. The firm’s sizable financial services exposure further exacerbated the share price weakness as the financials sector plummeted. Tyco International struggled to grow earnings and shares took another hit when it was reincorporated in Switzerland, triggering its removal from all domestic S&P indexes, including the S&P 500 Index. However, the sector showed some positives in the professional services industry, which was led by Robert Half International, a professional staffing firm with operations in the U.S., Europe, and Asia.
The financials sector suffered during the first quarter, but surged over the second as stocks were boosted by early signs of economic recovery, better-than-feared results from the federal government’s bank “stress tests,” and news that the Treasury Department would allow several large banks to repay some of the money received last fall as part of the Troubled Asset Relief Program. Interestingly, not only did the sector contain some of the broader index’s poorest performers for the period, but also a few of its strongest. Commercial banks continued to struggle mightily in the first three months of the year. Wells Fargo shares recorded the biggest loss in the industry as the normally solid company fell with the broader sector and struggled to digest its massive acquisition of troubled Wachovia. Goldman Sachs shares posted one of the index’s strongest gains as the company was impacted less than many of its competitors by the recent financial crisis.
Standard & Poor’s authorized 14 changes to the composition of the S&P 500 Index in the first half of 2009. Please see the table on page 5 for a complete list of index changes.
Outlook
Aided by reviving credit markets and tentative signs of economic stabilization, the strong stock market rally provided welcome relief to investors over the past few months. Although we are cautiously optimistic that the worst of the global economic and market downturn is behind us, our optimism is tempered with concerns about the depth and durability of the current rebound and we believe that markets may have gotten ahead of the economic recovery. Investors should not be surprised at a pullback over the near term as the markets begin to look for the real economy to improve.
As the future environment unfolds, we will continue to focus on our role of replicating the structure and performance of the S&P 500 Stock Index to provide you with broad exposure to the large-cap segment of the U.S. stock market. Thank you for your confidence in our investment and index-tracking capabilities.
Respectfully submitted,

E. Frederick Bair
Cochairman of the Investment Advisory Committee

Ken D. Uematsu
Cochairman of the Investment Advisory Committee
July 21, 2009
The committee chairmen have day-to-day responsibility for managing the portfolio and work with committee members in developing and executing the portfolio’s investment program.
As with all stock mutual funds, the portfolio’s share price can fall because of weakness in the stock market, a particular industry, or specific holdings. Stock markets can decline for many reasons, including adverse political or economic developments, changes in investor psychology, or heavy institutional selling. The prospects for an industry or company may deteriorate because of a variety of factors, including disappointing earnings or changes in the competitive environment.
Fed funds target rate: An overnight lending rate set by the Federal Reserve and used by banks to meet reserve requirements. Banks also use the fed funds rate as a benchmark for their prime lending rates.
S&P 500 Stock Index: Tracks the stocks of 500 mostly large U.S. companies.
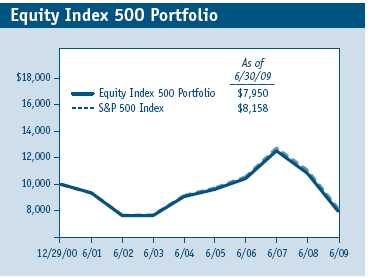
Portfolio Highlights

Performance and Expenses
T. Rowe Price Equity Index 500 Portfolio
This chart shows the value of a hypothetical $10,000 investment in the portfolio over the past 10 fiscal year periods or since inception (for portfolios lacking 10-year records). The result is compared with benchmarks, which may include a broad-based market index and a peer group average or index. Market indexes do not include expenses, which are deducted from portfolio returns as well as mutual fund averages and indexes.
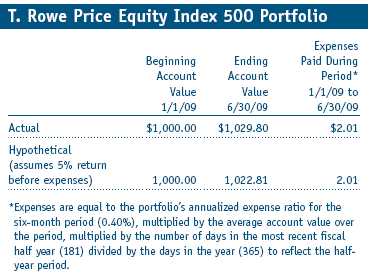
Fund Expense Example
As a mutual fund shareholder, you may incur two types of costs: (1) transaction costs, such as redemption fees or sales loads, and (2) ongoing costs, including management fees, distribution and service (12b-1) fees, and other fund expenses. The following example is intended to help you understand your ongoing costs (in dollars) of investing in the fund and to compare these costs with the ongoing costs of investing in other mutual funds. The example is based on an investment of $1,000 invested at the beginning of the most recent six-month period and held for the entire period.
Actual Expenses
The first line of the following table (“Actual”) provides information about actual account values and actual expenses. You may use the information in this line, together with your account balance, to estimate the expenses that you paid over the period. Simply divide your account value by $1,000 (for example, an $8,600 account value divided by $1,000 = 8.6), then multiply the result by the number in the first line under the heading “Expenses Paid During Period” to estimate the expenses you paid on your account during this period.
Hypothetical Example for Comparison Purposes
The information on the second line of the table (“Hypothetical”) is based on hypothetical account values and expenses derived from the fund’s actual expense ratio and an assumed 5% per year rate of return before expenses (not the fund’s actual return). You may compare the ongoing costs of investing in the fund with other funds by contrasting this 5% hypothetical example and the 5% hypothetical examples that appear in the shareholder reports of the other funds. The hypothetical account values and expenses may not be used to estimate the actual ending account balance or expenses you paid for the period.
You should also be aware that the expenses shown in the table highlight only your ongoing costs and do not reflect any transaction costs, such as redemption fees or sales loads. Therefore, the second line of the table is useful in comparing ongoing costs only and will not help you determine the relative total costs of owning different funds. To the extent a fund charges transaction costs, however, the total cost of owning that fund is higher.
Financial Highlights
T. Rowe Price Equity Index 500 Portfolio
(Unaudited)

The accompanying notes are an integral part of these financial statements.
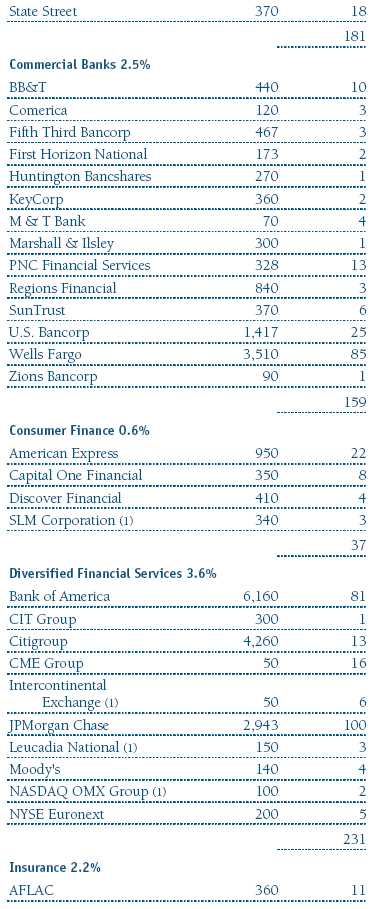
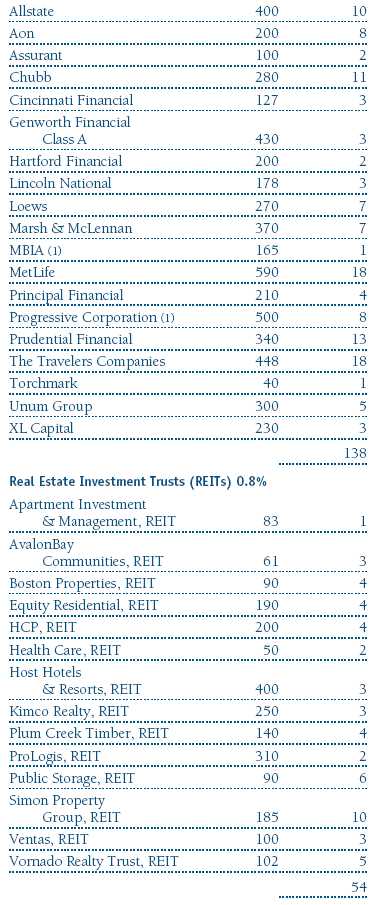
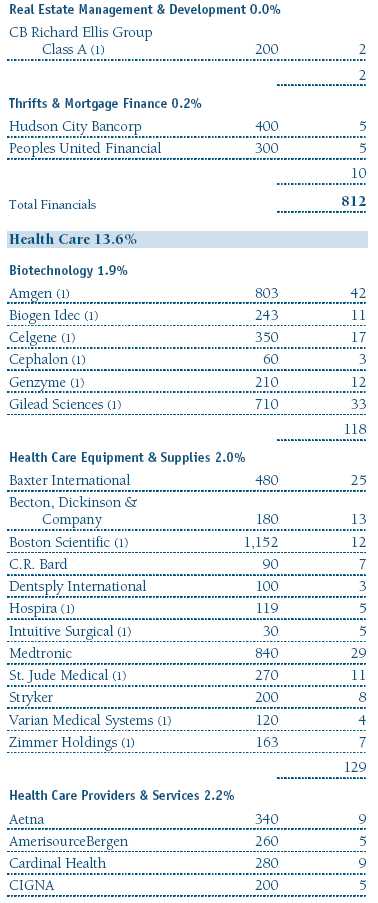
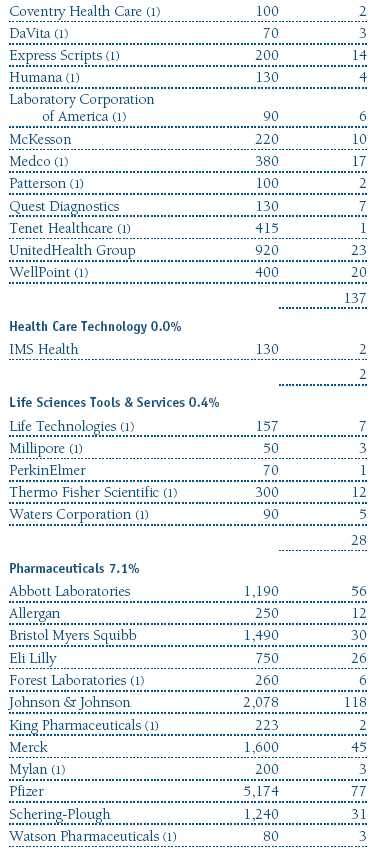
Portfolio of Investments‡
T. Rowe Price Equity Index 500 Portfolio
June 30, 2009 (Unaudited)
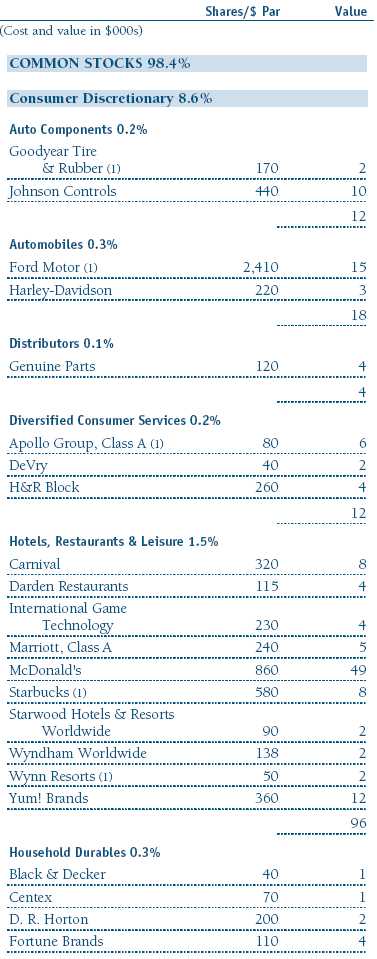


The accompanying notes are an integral part of these financial statements.
Statement of Assets and Liabilities
T. Rowe Price Equity Index 500 Portfolio
June 30, 2009 (Unaudited)
($000s, except shares and per share amounts)
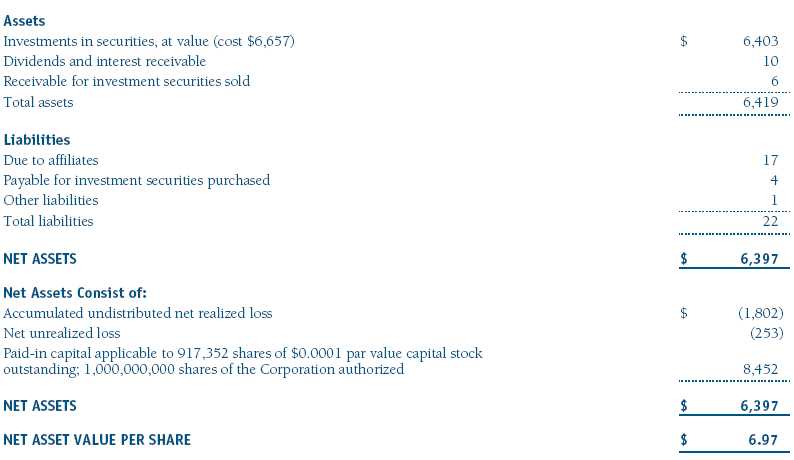
The accompanying notes are an integral part of these financial statements.
Statement of Operations
T. Rowe Price Equity Index 500 Portfolio
(Unaudited)
($000s)
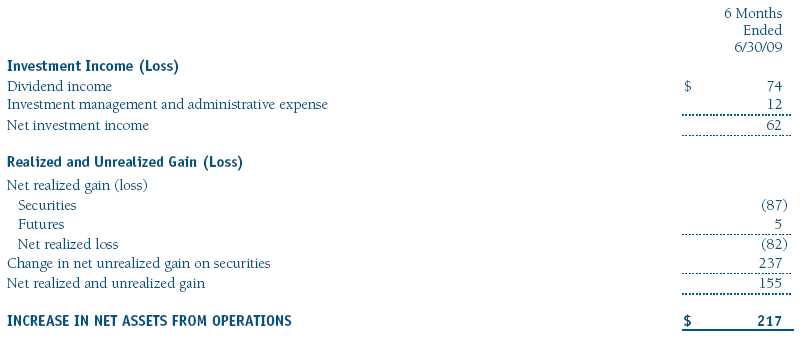
The accompanying notes are an integral part of these financial statements.
Statement of Changes in Net Assets
T. Rowe Price Equity Index 500 Portfolio
(Unaudited)
($000s)
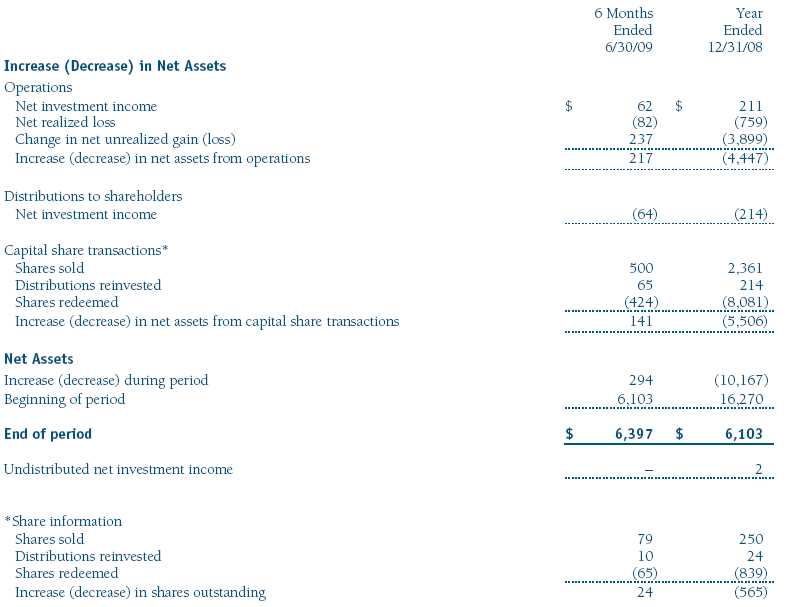
The accompanying notes are an integral part of these financial statements.
Notes to Financial Statements
T. Rowe Price Equity Index 500 Portfolio
June 30, 2009 (Unaudited)
T. Rowe Price Equity Series, Inc. (the corporation), is registered under the Investment Company Act of 1940 (the 1940 Act). The Equity Index 500 Portfolio (the fund), a diversified, open-end management investment company, is one portfolio established by the corporation. The fund commenced operations on December 29, 2000. The fund seeks to match the performance of the Standard & Poor’s 500 Stock Index®. Shares of the fund are currently offered only through certain insurance companies as an investment medium for both variable annuity contracts and variable life insurance policies.
NOTE 1 - SIGNIFICANT ACCOUNTING POLICIES
Basis of Preparation The accompanying financial statements were prepared in accordance with accounting principles generally accepted in the United States of America, which require the use of estimates made by fund management. Fund management believes that estimates and security valuations are appropriate; however, actual results may differ from those estimates, and the security valuations reflected in the financial statements may differ from the value the fund ultimately realizes upon sale of the securities. Further, fund management believes no events have occurred between June 30, 2009 and August 20, 2009, the date of issuance of the financial statements, that require adjustment of, or disclosure in, the accompanying financial statements.
Investment Transactions, Investment Income, and Distributions Income and expenses are recorded on the accrual basis. Premiums and discounts on debt securities are amortized for financial reporting purposes. Dividends received from mutual fund investments are reflected as dividend income; capital gain distributions are reflected as realized gain/loss. Dividend income and capital gain distributions are recorded on the ex-dividend date. Income tax-related interest and penalties, if incurred, would be recorded as income tax expense. Investment transactions are accounted for on the trade date. Realized gains and losses are reported on the identified cost basis. Distributions to shareholders are recorded on the ex-dividend date. Income distributions are declared and paid on a quarterly basis. Capital gain distributions, if any, are declared and paid by the fund, typically on an annual basis.
New Accounting Pronouncement On January 1, 2009, the fund adopted Statement of Financial Accounting Standards No. 161 (FAS 161), Disclosures about Derivative Instruments and Hedging Activities. FAS 161 requires enhanced disclosures about derivative and hedging activities, including how such activities are accounted for and their effect on financial position, performance and cash flows. Adoption of FAS 161 had no impact on the fund’s net assets or results of operations.
NOTE 2 - VALUATION
The fund’s investments are reported at fair value as defined under Statement of Financial Accounting Standards No. 157 (FAS 157), Fair Value Measurements. The fund values its investments and computes its net asset value per share at the close of the New York Stock Exchange (NYSE), normally 4 p.m. ET, each day that the NYSE is open for business.
Valuation Methods Equity securities listed or regularly traded on a securities exchange or in the over-the-counter (OTC) market are valued at the last quoted sale price or, for certain markets, the official closing price at the time the valuations are made, except for OTC Bulletin Board securities, which are valued at the mean of the latest bid and asked prices. A security that is listed or traded on more than one exchange is valued at the quotation on the exchange determined to be the primary market for such security. Listed securities not traded on a particular day are valued at the mean of the latest bid and asked prices for domestic securities and the last quoted sale price for international securities. Debt securities with remaining maturities of less than one year at the time of acquisition generally use amortized cost in local currency to approximate fair value. However, if amortized cost is deemed not to reflect fair value or the fund holds a significant amount of such securities with remaining maturities of more than 60 days, the securities are valued at prices furnished by dealers who make markets in such securities or by an independent pricing service.
Investments in mutual funds are valued at the mutual fund’s closing net asset value per share on the day of valuation. Financial futures contracts are valued at closing settlement prices.
Other investments, including restricted securities, and those for which the above valuation procedures are inappropriate or are deemed not to reflect fair value are stated at fair value as determined in good faith by the T. Rowe Price Valuation Committee, established by the fund’s Board of Directors.
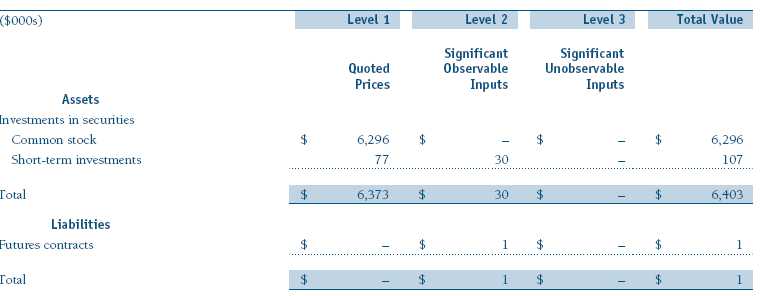
Valuation Inputs Various inputs are used to determine the value of the fund’s investments. These inputs are summarized in the three broad levels listed below:
Level 1 – quoted prices in active markets for identical securities
Level 2 – observable inputs other than Level 1 quoted prices (including, but not limited to, quoted prices for similar securities, interest rates, prepayment speeds, credit risk)
Level 3 – unobservable inputs
Observable inputs are those based on market data obtained from sources independent of the fund, and unobservable inputs reflect the fund’s own assumptions based on the best information available. The input levels are not necessarily an indication of the risk or liquidity associated with investments at that level. The following table summarizes the fund’s investments, based on the inputs used to determine their values on June 30, 2009:
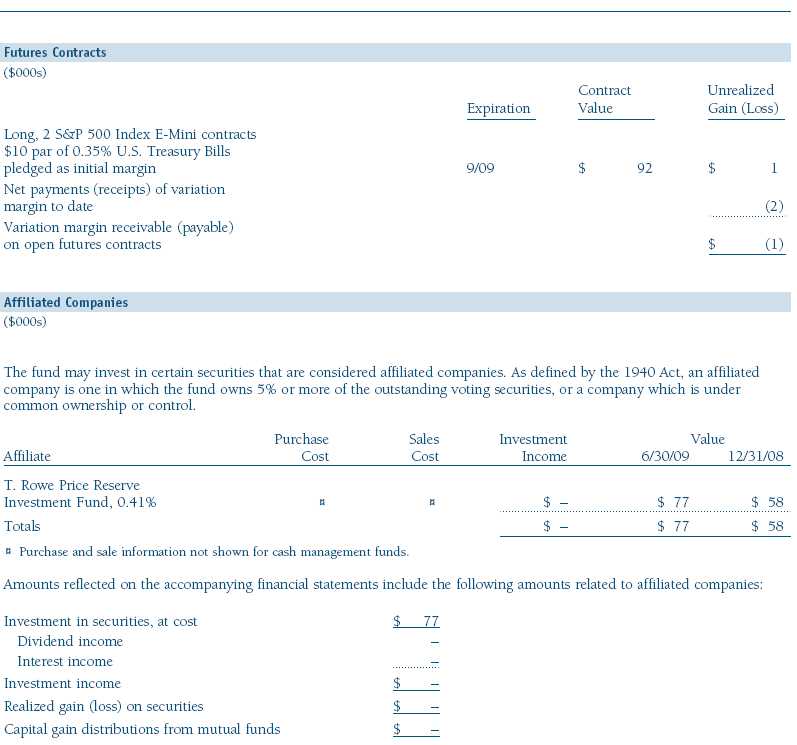
NOTE 3 - DERIVATIVE INSTRUMENTS
During the six months ended June 30, 2009, the fund invested in derivative instruments. As defined by Statement of Financial Accounting Standards No. 133 (FAS 133), Accounting for Derivative Instruments and Hedging Activities, a derivative is a financial instrument whose value is derived from an underlying security price, foreign exchange rate, interest rate, index of prices or rates, or other variable; it requires little or no initial investment and permits or requires net settlement. The fund invests in derivatives only if the expected risks and rewards are consistent with its investment objectives, policies, and overall risk profile, as described in its prospectus and Statement of Additional Information. The fund may use derivatives for a variety of purposes, such as seeking to hedge against declines in principal value, increase yield, invest in an asset with greater efficiency and at a lower cost than is possible through direct investment, or to adjust credit exposure. The risks associated with the use of derivatives are different from, and potentially much greater than, the risks associated with investing directly in the instruments on which the derivatives are based. Investments in derivatives can magnify returns positively or negatively; however, the fund at all times maintains sufficient cash reserves, liquid assets, or other SEC-permitted asset types to cover the settlement obligations under its open derivative contracts. The fund’s period-end derivatives, as presented in the Portfolio of Investments or the tables following, generally are indicative of the volume of its derivative activity during the period.
The fund values its derivatives at fair value, as described below and in Note 2, and recognizes changes in fair value currently in its results of operations. Accordingly, the fund does not follow hedge accounting as prescribed by FAS 133, even for derivatives employed as economic hedges. As of June 30, 2009, the fund held equity derivatives with cumulative unrealized gain of $1,000 on futures contracts; the value reflected in Other Liabilities on the accompanying Statement of Assets and Liabilities is the unsettled variation margin payable of $1,000.
Additionally, during the six months ended June 30, 2009, the fund recognized $5,000 gain on equity derivatives, included in realized gain(loss) on Futures on the accompanying Statement of Operations.
Counterparty risk related to exchange-traded derivatives, including futures and options contracts, is minimal because the exchange’s clearinghouse provides protection against defaults. Additionally, for exchange-traded derivatives, each broker in its sole discretion may change margin requirements applicable to the fund.
Futures Contracts The fund is subject to equity price risk in the normal course of pursuing its investment objectives and uses futures contracts to help manage such risk. The fund may enter into futures contracts as an efficient means of maintaining liquidity while being invested in the market, to facilitate trading, and/or to reduce transaction costs. A futures contract provides for the future sale by one party and purchase by another of a specified amount of a particular underlying financial instrument at an agreed upon price, date, time, and place. The fund currently invests only in exchange-traded futures, which generally are standardized as to maturity date, underlying financial instrument, and other contract terms. Upon entering into a futures contract, the fund is required to deposit with the broker cash or securities in an amount equal to a certain percentage of the contract value (initial margin deposit); the margin deposit must then be maintained at the established level over the life of the contract. Subsequent payments are made or received by the fund each day (variation margin) to settle daily fluctuations in the value of the contract, which reflect changes in the value of the underlying financial instrument. Variation margin is recorded as unrealized gain or loss until the contracts are closed. For a futures contract, the value included in net assets is the amount of unsettled variation margin; variation margin receivable is included in Other Assets and variation margin payable is included in Other Liabilities. Risks related to the use of futures contracts include possible illiquidity of the futures markets, contract prices that can be highly volatile and imperfectly correlated to movements in hedged security values, and potential losses in excess of the fund’s initial investment.
NOTE 4 - OTHER INVESTMENT TRANSACTIONS
Purchases and sales of portfolio securities other than short-term securities aggregated $484,000 and $267,000, respectively, for the six months ended June 30, 2009.
NOTE 5 - FEDERAL INCOME TAXES
No provision for federal income taxes is required since the fund intends to continue to qualify as a regulated investment company under Subchapter M of the Internal Revenue Code and distribute to shareholders all of its taxable income and gains. Distributions are determined in accordance with Federal income tax regulations, which differ from generally accepted accounting principles, and, therefore, may differ in amount or character from net investment income and realized gains for financial reporting purposes. Financial reporting records are adjusted for permanent book/tax differences to reflect tax character but are not adjusted for temporary differences. The amount and character of tax-basis distributions and composition of net assets are finalized at fiscal year-end; accordingly, tax-basis balances have not been determined as of June 30, 2009.
In accordance with federal tax regulations, the fund deferred recognition of certain capital loss amounts previously recognized in the prior fiscal year for financial reporting purposes until the current fiscal period for tax purposes. Such deferrals amounted to $95,000 and related to net capital losses realized between November 1 and the fund’s fiscal year-end date. Further, the fund intends to retain realized gains to the extent of available capital loss carryforwards. As of December 31, 2008, the fund had $1,543,000 of unused capital loss carryforwards, of which $15,000 expire in fiscal 2010, $819,000 expire in fiscal 2011, $111,000 expire in fiscal 2014, and $598,000 expire in fiscal 2016.
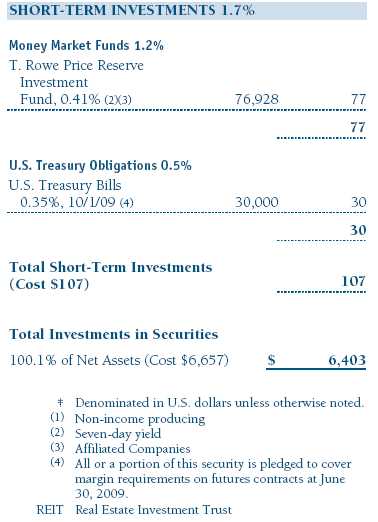
At June 30, 2009, the cost of investments for federal income tax purposes was $6,657,000. Net unrealized loss aggregated $253,000 at period-end, of which $957,000 related to appreciated investments and $1,210,000 related to depreciated investments.
NOTE 6 - RELATED PARTY TRANSACTIONS
The fund is managed by T. Rowe Price Associates, Inc. (the manager or Price Associates), a wholly owned subsidiary of T. Rowe Price Group, Inc. The investment management and administrative agreement between the fund and the manager provides for an all-inclusive annual fee equal to 0.40% of the fund’s average daily net assets. The fee is computed daily and paid monthly. The agreement provides that investment management, shareholder servicing, transfer agency, accounting, custody services, and directors’ fees and expenses are provided to the fund, and interest, taxes, brokerage commissions, and extraordinary expenses are paid directly by the fund.
The fund may invest in the T. Rowe Price Reserve Investment Fund and the T. Rowe Price Government Reserve Investment Fund (collectively, the T. Rowe Price Reserve Investment Funds), open-end management investment companies managed by Price Associates and considered affiliates of the fund. The T. Rowe Price Reserve Investment Funds are offered as cash management options to mutual funds, trusts, and other accounts managed by Price Associates and/or its affiliates and are not available for direct purchase by members of the public. The T. Rowe Price Reserve Investment Funds pay no investment management fees.
| Information on Proxy Voting Policies, Procedures, and Records |
A description of the policies and procedures used by T. Rowe Price funds and portfolios to determine how to vote proxies relating to portfolio securities is available in each fund’s Statement of Additional Information, which you may request by calling 1-800-225-5132 or by accessing the SEC’s Web site, www.sec.gov. The description of our proxy voting policies and procedures is also available on our Web site, www.troweprice.com. To access it, click on the words “Our Company” at the top of our corporate homepage. Then, when the next page appears, click on the words “Proxy Voting Policies” on the left side of the page.
Each fund’s most recent annual proxy voting record is available on our Web site and through the SEC’s Web site. To access it through our Web site, follow the directions above, then click on the words “Proxy Voting Records” on the right side of the Proxy Voting Policies page.
| How to Obtain Quarterly Portfolio Holdings |
The fund files a complete schedule of portfolio holdings with the Securities and Exchange Commission for the first and third quarters of each fiscal year on Form N-Q. The fund’s Form N-Q is available electronically on the SEC’s Web site (www.sec.gov); hard copies may be reviewed and copied at the SEC’s Public Reference Room, 450 Fifth St. N.W., Washington, DC 20549. For more information on the Public Reference Room, call 1-800-SEC-0330.
| Approval of Investment Management Agreement |
On March 10, 2009, the fund’s Board of Directors (Board) unanimously approved the investment advisory contract (Contract) between the fund and its investment manager, T. Rowe Price Associates, Inc. (Manager). The Board considered a variety of factors in connection with its review of the Contract, also taking into account information provided by the Manager during the course of the year, as discussed below:
Services Provided by the Manager
The Board considered the nature, quality, and extent of the services provided to the fund by the Manager. These services included, but were not limited to, management of the fund’s portfolio and a variety of related activities, as well as financial and administrative services, reporting, and communications. The Board also reviewed the background and experience of the Manager’s senior management team and investment personnel involved in the management of the fund. The Board concluded that it was satisfied with the nature, quality, and extent of the services provided by the Manager.
Investment Performance of the Fund
The Board reviewed the fund’s average annual total returns over the one-, three-, and five-year and since-inception periods as well as the fund’s year-by-year returns and compared these returns with previously agreed upon comparable performance measures and market data, including those supplied by Lipper and Morningstar, which are independent providers of mutual fund data. On the basis of this evaluation and the Board’s ongoing review of investment results, and factoring in the severity of the market turmoil in 2008, the Board concluded that the fund’s performance was satisfactory.
Costs, Benefits, Profits, and Economies of Scale
The Board reviewed detailed information regarding the revenues received by the Manager under the Contract and other benefits that the Manager (and its affiliates) may have realized from its relationship with the fund, including research received under “soft dollar” agreements. The Board noted that soft dollars were not used to pay for third-party, non-broker research during 2008. The Board also received information on the estimated costs incurred and profits realized by the Manager and its affiliates from advising T. Rowe Price mutual funds. The Board did not review information regarding profits realized from managing the fund in particular because the fund had not achieved sufficient scale in terms of portfolio asset size to produce meaningful profit margin percentages. The Board concluded that the Manager’s profits from advising T. Rowe Price mutual funds were reasonable in light of the services provided to the fund. The Board also considered whether the fund or other funds benefit under the fee levels set forth in the Contract from any economies of scale realized by the Manager. The Board noted that, under the Contract, the fund pays the Manager a single fee based on the fund’s assets and the Manager, in turn, pays all expenses of the fund, with certain exceptions. The Board concluded that, based on the profitability data it reviewed and consistent with this single-fee structure, the Contract provided for a reasonable sharing of benefits from any economies of scale with the fund.
Fees
The Board reviewed the fund’s single-fee structure and compared the rate with fees and expenses of other comparable funds based on information and data supplied by Lipper. (For these purposes, the Board assumed the management fee rate was equal to the single fee less the fund’s operating expenses and expense reimbursements by the Manager.) The information provided to the Board indicated that the fund’s management fee rate was below the median for comparable funds and the fund’s expense ratio was above the median for comparable funds. The Board also reviewed the fee schedules for comparable privately managed accounts of the Manager and its affiliates. Management informed the Board that the Manager’s responsibilities for privately managed accounts are more limited than its responsibilities for the fund and other T. Rowe Price mutual funds that it or its affiliates advise. On the basis of the information provided, the Board concluded that the fees paid by the fund under the Contract were reasonable.
Approval of the Contract
As noted, the Board approved the continuation of the Contract. No single factor was considered in isolation or to be determinative to the decision. Rather, the Board concluded, in light of a weighting and balancing of all factors considered, that it was in the best interests of the fund to approve the continuation of the Contract, including the fees to be charged for services thereunder.
Item 2. Code of Ethics.
A code of ethics, as defined in Item 2 of Form N-CSR, applicable to its principal executive officer, principal financial officer, principal accounting officer or controller, or persons performing similar functions is filed as an exhibit to the registrant’s annual Form N-CSR. No substantive amendments were approved or waivers were granted to this code of ethics during the registrant’s most recent fiscal half-year.
Item 3. Audit Committee Financial Expert.
Disclosure required in registrant’s annual Form N-CSR.
Item 4. Principal Accountant Fees and Services.
Disclosure required in registrant’s annual Form N-CSR.
Item 5. Audit Committee of Listed Registrants.
Not applicable.
Item 6. Investments.
(a) Not applicable. The complete schedule of investments is included in Item 1 of this Form N-CSR.
(b) Not applicable.
Item 7. Disclosure of Proxy Voting Policies and Procedures for Closed-End Management Investment Companies.
Not applicable.
Item 8. Portfolio Managers of Closed-End Management Investment Companies.
Not applicable.
Item 9. Purchases of Equity Securities by Closed-End Management Investment Company and Affiliated Purchasers.
Not applicable.
Item 10. Submission of Matters to a Vote of Security Holders.
Not applicable.
Item 11. Controls and Procedures.
(a) The registrant’s principal executive officer and principal financial officer have evaluated the registrant’s disclosure controls and procedures within 90 days of this filing and have concluded that the registrant’s disclosure controls and procedures were effective, as of that date, in ensuring that information required to be disclosed by the registrant in this Form N-CSR was recorded, processed, summarized, and reported timely.
(b) The registrant’s principal executive officer and principal financial officer are aware of no change in the registrant’s internal control over financial reporting that occurred during the registrant’s second
fiscal quarter covered by this report that has materially affected, or is reasonably likely to materially affect, the registrant’s internal control over financial reporting.
Item 12. Exhibits.
(a)(1) The registrant’s code of ethics pursuant to Item 2 of Form N-CSR is filed with the registrant’s annual Form N-CSR.
(2) Separate certifications by the registrant's principal executive officer and principal financial officer, pursuant to Section 302 of the Sarbanes-Oxley Act of 2002 and required by Rule 30a-2(a) under the Investment Company Act of 1940, are attached.
(3) Written solicitation to repurchase securities issued by closed-end companies: not applicable.
(b) A certification by the registrant's principal executive officer and principal financial officer, pursuant to Section 906 of the Sarbanes-Oxley Act of 2002 and required by Rule 30a-2(b) under the Investment Company Act of 1940, is attached.
| | |
SIGNATURES |
| |
| | Pursuant to the requirements of the Securities Exchange Act of 1934 and the Investment |
| Company Act of 1940, the registrant has duly caused this report to be signed on its behalf by the |
| undersigned, thereunto duly authorized. |
| |
| T. Rowe Price Equity Series, Inc. |
| |
| |
| |
| By | /s/ Edward C. Bernard |
| | Edward C. Bernard |
| | Principal Executive Officer |
| |
| Date | August 20, 2009 |
| |
| |
| |
| | Pursuant to the requirements of the Securities Exchange Act of 1934 and the Investment |
| Company Act of 1940, this report has been signed below by the following persons on behalf of |
| the registrant and in the capacities and on the dates indicated. |
| |
| |
| By | /s/ Edward C. Bernard |
| | Edward C. Bernard |
| | Principal Executive Officer |
| |
| Date | August 20, 2009 |
| |
| |
| |
| By | /s/ Gregory K. Hinkle |
| | Gregory K. Hinkle |
| | Principal Financial Officer |
| |
| Date | August 20, 2009 |