| UNITED STATES |
| SECURITIES AND EXCHANGE COMMISSION |
| Washington, D.C. 20549 |
| |
FORM N-CSR |
| |
CERTIFIED SHAREHOLDER REPORT OF REGISTERED |
MANAGEMENT INVESTMENT COMPANIES |
| |
| |
| |
| Investment Company Act File Number: 811-07143 |
|
| |
| T. Rowe Price Equity Series, Inc. |
|
| (Exact name of registrant as specified in charter) |
| |
| 100 East Pratt Street, Baltimore, MD 21202 |
|
| (Address of principal executive offices) |
| |
| David Oestreicher |
| 100 East Pratt Street, Baltimore, MD 21202 |
|
| (Name and address of agent for service) |
| |
| |
| Registrant’s telephone number, including area code: (410) 345-2000 |
| |
| |
| Date of fiscal year end: December 31 |
| |
| |
| Date of reporting period: June 30, 2009 |
Item 1: Report to Shareholders| Health Sciences Portfolio | June 30, 2009 |
• Health care stocks rallied in the second quarter, following a sell-off that stretched from 2008 into early 2009.
• In the first half of the year, the Health Sciences Portfolio outperformed the broad market and its benchmark, the Lipper Variable Annuity Underlying Health/Biotechnology Funds Average.
• We believe that generating outperformance in the health care sector will continue to be dependent on stock selection, rather than emphasizing a particular subsector of the health care industry.
• We remain focused on investing in companies with new and important medicines for unmet medical needs, as well as companies delivering value-added and cost-effective services.
The views and opinions in this report were current as of June 30, 2009. They are not guarantees of performance or investment results and should not be taken as investment advice. Investment decisions reflect a variety of factors, and the managers reserve the right to change their views about individual stocks, sectors, and the markets at any time. As a result, the views expressed should not be relied upon as a forecast of the fund’s future investment intent. The report is certified under the Sarbanes-Oxley Act, which requires mutual funds and other public companies to affirm that, to the best of their knowledge, the information in their financial reports is fairly and accurately stated in all material respects.
Manager’s Letter
T. Rowe Price Health Sciences Portfolio
Fellow Shareholders
Health care stocks outperformed the broad market over the last six months. Stock markets worldwide continued to experience extreme volatility, in part due to the heightened credit market turmoil and the global economic slowdown. The health care sector, which is generally viewed as a safe haven because the need for medicines and treatment is relatively stable, outperformed in the first quarter but was somewhat out of favor in the second as riskier investments surged. Your portfolio generated solid gains in this environment.

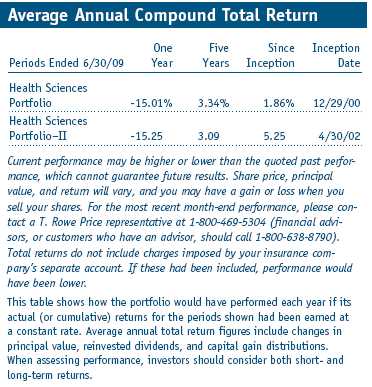
The Health Sciences Portfolio significantly outperformed the S&P 500 Stock Index and the Lipper Variable Annuity Underlying Health/Biotechnology Funds Average in the six-month period ended June 30, 2009, as shown in the Performance Comparison table above. (Results for the II Class shares were slightly lower, reflecting its higher fee structure.) Our comparison with the Lipper benchmark benefited from strong stock selection in the pharmaceuticals and services segments but gave up some ground in the biotech sector. We are hopeful that the bulk of the market weakness is behind us. Recent stock market performance suggests that the global economy and financial markets have begun to stabilize and that the environment could continue to improve over the remainder of the year. While we are pleased to report good six-month results that reversed some of last year’s losses, health care stocks remain significantly below year-ago levels. We appreciate your continued confidence in our efforts to manage your investment in these turbulent times. In our view, it is important for shareholders to follow their investment plan and regimen, especially when stocks are out of favor. Historical data suggest that stocks should continue to recover.
The Health Sciences Portfolio has delivered consistently strong longer-term performance compared with the Lipper universe of health/biotechnology funds. Lipper ranked the fund in the top 12% of its health care funds universe for the three- and five-year periods ended June 30, 2009. (Based on cumulative total return, Lipper ranked the Health Sciences Portfolio 20 out of 37, 4 out of 34, and 3 out of 31 funds for the one-, three-, and five-year periods ended June 30, 2009, respectively. Past performance cannot guarantee future results.)
Market Environment
We believe that relatively low interest rates, attractive valuations, and continued earnings growth support favorable equity market performance. Nevertheless, there are several dark clouds on the horizon. The rising unemployment rate—to 9.5% in June—is likely to get worse before it improves. The significant reform plans that Congress and President Obama are pursuing—in health care and certain other areas, on top of the huge stimulus spending already undertaken—are contributing to large current and projected budget deficits. The resultant weakness in the U.S. dollar has begun to stoke inflation fears and has probably contributed to the rise in commodity prices. Additionally, interest rates have climbed moderately, which will make servicing public and private debt more expensive and could impair an economic recovery. Government authorities are in a difficult situation—they need to continue spending in certain areas while avoiding large tax increases that could cripple growth. The U.S. economy contracted significantly over the past six months.
However, amid the dark clouds there may be a silver lining. The latest evidence suggests that the economic decline moderated significantly as the reporting period progressed. Additionally, the banking system has been recapitalized, and liquidity in the financial and credit markets has certainly improved. This has benefited investor and consumer confidence and fostered an improvement in housing turnover, retail sales, and some areas of manufacturing. Although the environment is still quite fragile, remedial fiscal and monetary actions have begun to yield results, and in our view, the economy and financial markets may have started to improve.
As investors developed a bit more confidence that the worst of the crisis was finally behind us, stocks rebounded sharply, although they pulled back from their peak levels in late June. The investment environment assumed a more positive tone, with riskier asset classes performing best in recent months. While there was little difference in returns among most small- and large-cap indexes over the first half of the year, value shares significantly trailed their growth counterparts in all market capitalizations. Uncertainty about the outcome of health care reform efforts also weighed on the sector.
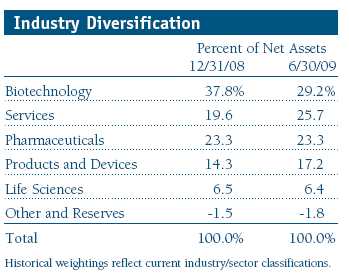
The Lipper Health/Biotechnology Funds Index outperformed the S&P 500 Index in the first half. The best-performing segments in the Lipper index over the past six months were life sciences (24.9%) and products and devices (9.5%). However, the two largest sectors within the health care benchmark, biotechnology and pharmaceuticals, posted small gains of 0.2% and 2.7%, respectively. These two segments represent approximately 60% of the benchmark and a little more than half of your portfolio. As we’ve written in previous shareholder reports, we believe stock selection will have far more bearing on our performance than sector allocation decisions.
Strategy Review
Our large allocation to the biotechnology and pharmaceuticals segments stems from our belief that the pharmaceutical industry’s business model—the discovery, development, manufacture, and commercialization of medicines—is the primary driver of long-term value in the health care sector. Typically, large pharmaceutical companies have a broad base of revenues and income, and one drug—even if it is extremely successful—may not be enough to affect the bottom line significantly. Biotechnology companies, however, tend to be smaller, and the successful introduction of one important new medicine can materially affect a company’s revenues and earnings. We are especially focused on those companies with new and important medicines or treatments for unmet medical needs. Although this strategy encompasses more risk because a firm that is highly dependent on the success of a single drug can decline significantly on bad news, we manage this risk in part by owning a diversified basket of stocks and controlling our position sizes.
Portfolio Review
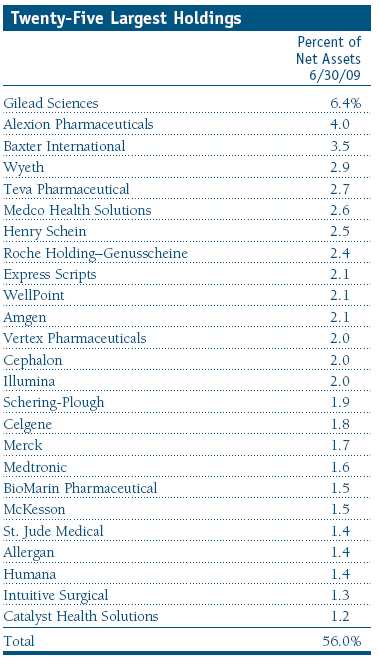
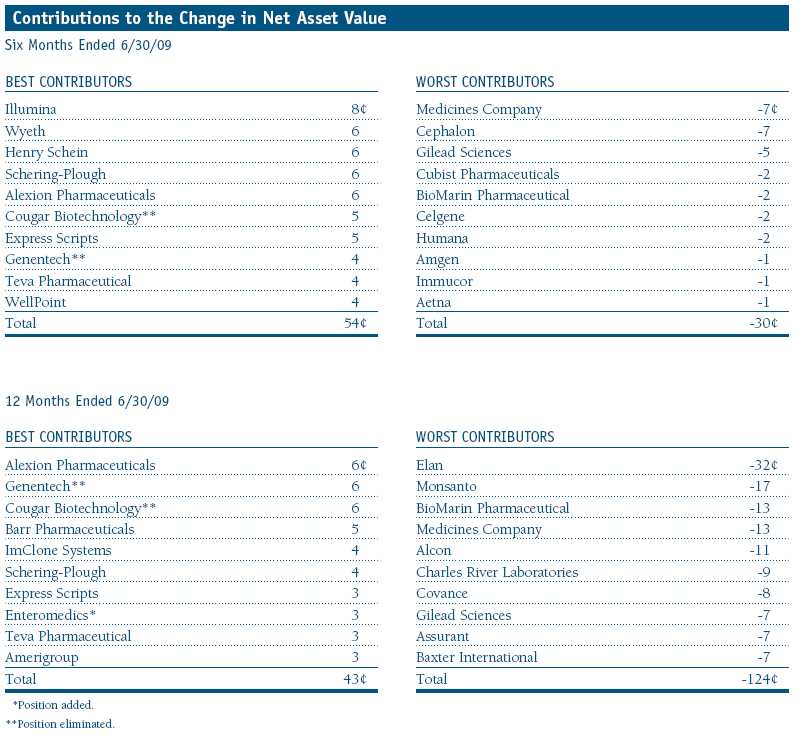
Over the last six months, health care stocks have been controversial. Investors have been more enamored of companies that benefit from an improving economy as uncertainty relating to health care reform has weighed on the sector. Many of the portfolio’s best first-half contributors were companies involved in takeovers, including Wyeth, Schering-Plough, and Genentech. In late January, Pfizer, a Dow component and one of the world’s largest drugmakers, announced its intention to buy Wyeth for $68 billion with a combination of cash and common stock. The Wyeth acquisition is expected to close in the third or fourth quarter. (Please refer to the portfolio of investments for a complete list of holdings and the amount each represents in the portfolio.)
Biotech giant Genentech generated strong results through the downturn, culminating in a lucrative buyout by Roche, the Swiss pharmaceutical company. The shares of Schering-Plough also got a healthy boost in early March after Merck made it known that it was interested in buying Schering for about $45 billion. The deal is expected to be completed in the fourth quarter and would create the world’s second-largest drug manufacturer, but it still has to pass several antitrust approvals. In each case, the buyer expects its acquisition to be accretive in a year or two and all intend to realize savings from reduced selling, general, and administrative costs as well as on research and development expenses.
In our shareholder letter six months ago, we reported on the merger of generic drug manufacturers Barr Pharmaceuticals and Teva Pharmaceutical. The newly combined company’s stock climbed, albeit unevenly, in the first half of the year. As is the case with the aforementioned companies, Teva has been a significant portfolio holding for many years. It was among our largest holdings at the end of the reporting period, representing a bit less than 3% of the portfolio. But unlike the other larger-capitalization pharmaceuticals, research and development costs for the leading generic drugmaker are a fraction of those for major drug companies. Teva looks forward to patent expirations, which are akin to its product pipeline. The company is an obvious beneficiary of what we think will be a strong period for generic drugmakers, and we expect its earnings to accelerate for the next several years.
The portfolio’s best first-half contributor was life sciences holding Illumina, a mid-cap biotech company focused on developing, manufacturing, and marketing integrated systems for analyzing genetic variation and biological functions. We believe Illumina’s fundamentals are strong. It is a technology leader in high-growth markets, and in the short term, the company should benefit from government stimulus funneled through the National Institutes of Health. Henry Schein, our largest position in the services sector, also generated strong performance thanks to its good first-quarter earnings gains. Results were ahead of the analysts’ estimates due to cost savings—although revenues were modestly below forecasts. The company is a multinational provider of an array of dental, medical, and technology products primarily for dentists, physicians, veterinary clinics, and other institutions. It also provides technology solutions, including value-added practice management software and electronic health recordkeeping. We think Schein will continue to generate strong operating margins and solid growth.
Our largest detractor in the first half was Medicines Company. The company suffered a significant share price decline as hopes for the successful development of an innovative cardiovascular medicine were not realized. Despite the near-term disappointment, we remain optimistic on the firm’s longer-term performance. Medicines Company possesses substantial expertise in acute care cardiovascular medicines and has products on the market or in development that could generate significant earnings growth. In addition, the company has modest operating costs and would be an attractive asset in today’s consolidating biopharmaceutical industry.
Despite posting solid quarterly results, Cephalon’s shares declined in the first half. We have a large position in the mid-cap biopharmaceutical company, which is involved in the discovery, development, and commercialization of drugs for the central nervous system. The stock was pressured after it announced a debt and equity sale. We have maintained our allocation in part because the valuation is undemanding, and we think the company can generate attractive earnings growth for several years. We intend to be patient as the company deploys its free cash flow and recently raised capital to rebuild its product pipeline with acquisitions.
The portfolio’s largest position, Gilead Sciences, was also among our largest detractors. The company is dominant in its core therapeutics business and continues to generate strong sales and earnings growth. It still enjoys success with its suite of drugs for the treatment of HIV. Gilead and Bristol-Myers Squibb partnered to produce and market Atripla, a once-a-day pill that combines two of Gilead’s HIV medicines and one of Bristol-Myers’. The drug continues to generate robust sales. We remain impressed with Gilead’s management team and its history of good execution in all aspects of its business. We are confident that over the next 12 months external business alliances and pipeline progress will generate greater visibility for the company.
While most of the portfolio’s investments are in U.S. common stocks, the portfolio can and will selectively invest in companies domiciled outside the country. Over the past six months, the portfolio’s holdings in overseas investments generated strong results. Additionally, the portfolio writes call and put options primarily as a means of augmenting income. Normally, the portfolio will own the securities on which it writes these options. The premium income recovered by writing covered calls can help reduce, but not eliminate, portfolio volatility. Over the past six months, options income contributed positively to portfolio results.
Outlook
The health care sector has been a defensive outperformer from mid-2008 throughout the beginning of March, when talks of health care reform began dominating the political environment. Health care reform is creating a great deal of uncertainty in the sector. This is the most politically uncertain time we have seen for the health care industry in the past 15 years, and it weighed on the sector’s performance.
On the other hand, the investment thesis—that the economy has been getting “less bad”—which drove the recent performance of more economically sensitive stocks, appears to have largely played out. We may be entering a period of anemic economic recovery. Health care companies could do well in such an environment by dint of their more stable, less economically sensitive growth. But we intend to maintain a cautious stance given that performance may be tempered by health care reform policies. With this backdrop, our strategy is to buy and hold high-conviction companies that are less likely to be affected by government reform initiatives.
Significant political pressure exists to pass major health care reform legislation by the end of 2009. While there are a number of reform initiatives that could materially impact selected companies, the proposal to create a subsidized government-run health plan stands out as the biggest risk to for-profit health care companies. Although we think this is unlikely given the public’s apprehension over a government-run health plan and the opposition from numerous influential stakeholders (e.g., hospitals, physicians, etc.), this outcome is certainly possible given powerful Democratic sponsorship.
Assuming the final legislation takes a more moderate path, it is likely to be modeled on the reform initiative enacted in Massachusetts three years ago. This initiative did not include an onerous public plan and instead relies primarily on nongovernment institutions to manage and provide care. Massachusetts has been successful from a coverage perspective. The percentage of uninsured people declined from approximately 10% to 2.6%—now the lowest rate in the nation. However, costs have significantly exceeded expectations, raising questions of sustainability. We believe that a number of for-profit companies offer solutions to the health care cost challenges that the nation faces. As a result, health care reform is likely to present both risks and opportunities.
Regardless of the outcome from Washington, our approach to managing reform risk is to continually assess the probability of outcomes. When appropriate, we will accept additional risk when the risk/reward trade-off is favorable. First and foremost, we are bottom-up stock pickers, and every decision is based on a company’s individual merit. As always, we will be buyers when we see inappropriate stock weakness—what we like to refer to as “fat pitches.”
Because health care is a heavily regulated industry, we are wary of a dramatic change in Washington, especially relating to the industry’s reimbursement and regulatory oversight. Any significant shift in what a company can expect to receive when it brings a new medicine to the marketplace would be disruptive. As we’ve said before, we think the Democrats view the national economic crisis as a clear mandate to “do something big” and see control of both the executive and legislative branches as a unique opportunity to push through long sought-after health care reform. Because the chance may not present itself again for decades, there is a sense of urgency in capitalizing on this opportunity.
Despite these potential challenges and uncertainties, we think the sector holds tremendous opportunity. We have an aging population that demands the best in health care, and an explosion in scientific understanding should lead to better medicines. Much of the spending on health care is tied to Medicare, which should provide a stable source of funding. Additionally, the need for health care and medicines is not viewed as discretionary; like consumer staples, people will spend to maintain their health no matter what the stock market does. As long as society continues to desire new therapies to soften the impact of disease and government price controls are not imposed, health care should remain an area of significant growth for the long term.
We appreciate your continued confidence and support.
Respectfully submitted,

Kris H. Jenner
President of the portfolio and chairman of its Investment Advisory Committee
July 21, 2009
The committee chairman has day-to-day responsibility for managing the portfolio and works with committee members in developing and executing its investment program.
| Risks of Growth Investing |
Growth stocks can be volatile for several reasons. Since these companies usually invest a high portion of earnings in their businesses, they may lack the dividends of value stocks that can cushion stock prices in a falling market. Also, earnings disappointments often lead to sharply falling prices because investors buy growth stocks in anticipation of superior earnings growth.
| Risks of Health Sciences Investing |
Portfolios that invest only in specific industries will experience greater volatility than those investing in a broad range of industries. Companies in the health sciences field are subject to special risks such as increased competition within the health care industry, changes in legislation or government regulations, reductions in government funding, product liability or other litigation, and the obsolescence of popular products.
Lipper averages: The average return of all portfolios in a particular category as tracked by Lipper Inc.
Lipper indexes: Fund benchmarks that consist of a small number of the largest mutual funds in a particular category as tracked by Lipper Inc.
S&P 500 Stock Index: An index consisting of 500 stocks chosen for market size, liquidity, and industry group representation. It is a market value-weighted index with each stock’s weight in the index proportionate to its market value.
Portfolio Highlights
Portfolio Highlights
Performance and Expenses
T. Rowe Price Health Sciences Portfolio
This chart shows the value of a hypothetical $10,000 investment in the portfolio over the past 10 fiscal year periods or since inception (for portfolios lacking 10-year records). The result is compared with benchmarks, which may include a broad-based market index and a peer group average or index. Market indexes do not include expenses, which are deducted from portfolio returns as well as mutual fund averages and indexes.

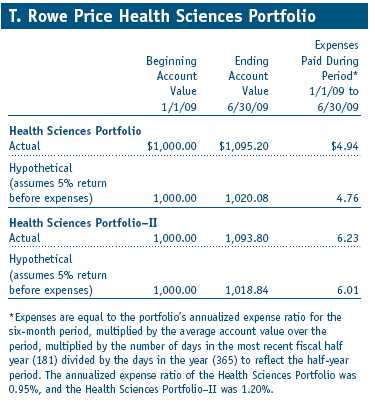
Fund Expense Example
As a mutual fund shareholder, you may incur two types of costs: (1) transaction costs, such as redemption fees or sales loads, and (2) ongoing costs, including management fees, distribution and service (12b-1) fees, and other fund expenses. The following example is intended to help you understand your ongoing costs (in dollars) of investing in the fund and to compare these costs with the ongoing costs of investing in other mutual funds. The example is based on an investment of $1,000 invested at the beginning of the most recent six-month period and held for the entire period.
Shares of the fund are currently offered only through certain insurance companies as an investment medium for both variable annuity contracts and variable life insurance policies. Please note that the fund has two classes of shares: the original share class and II Class. II Class shares are sold through financial intermediaries, which are compensated for distribution, shareholder servicing, and/or certain administrative services under a Board-approved Rule 12b-1 plan.
Actual Expenses
The first line of the following table (“Actual”) provides information about actual account values and actual expenses. You may use the information in this line, together with your account balance, to estimate the expenses that you paid over the period. Simply divide your account value by $1,000 (for example, an $8,600 account value divided by $1,000 = 8.6), then multiply the result by the number in the first line under the heading “Expenses Paid During Period” to estimate the expenses you paid on your account during this period.
Hypothetical Example for Comparison Purposes
The information on the second line of the table (“Hypothetical”) is based on hypothetical account values and expenses derived from the fund’s actual expense ratio and an assumed 5% per year rate of return before expenses (not the fund’s actual return). You may compare the ongoing costs of investing in the fund with other funds by contrasting this 5% hypothetical example and the 5% hypothetical examples that appear in the shareholder reports of the other funds. The hypothetical account values and expenses may not be used to estimate the actual ending account balance or expenses you paid for the period.
You should also be aware that the expenses shown in the table highlight only your ongoing costs and do not reflect any transaction costs, such as redemption fees or sales loads. Therefore, the second line of the table is useful in comparing ongoing costs only and will not help you determine the relative total costs of owning different funds. To the extent a fund charges transaction costs, however, the total cost of owning that fund is higher.
Financial Highlights
T. Rowe Price Health Sciences Portfolio
(Unaudited)
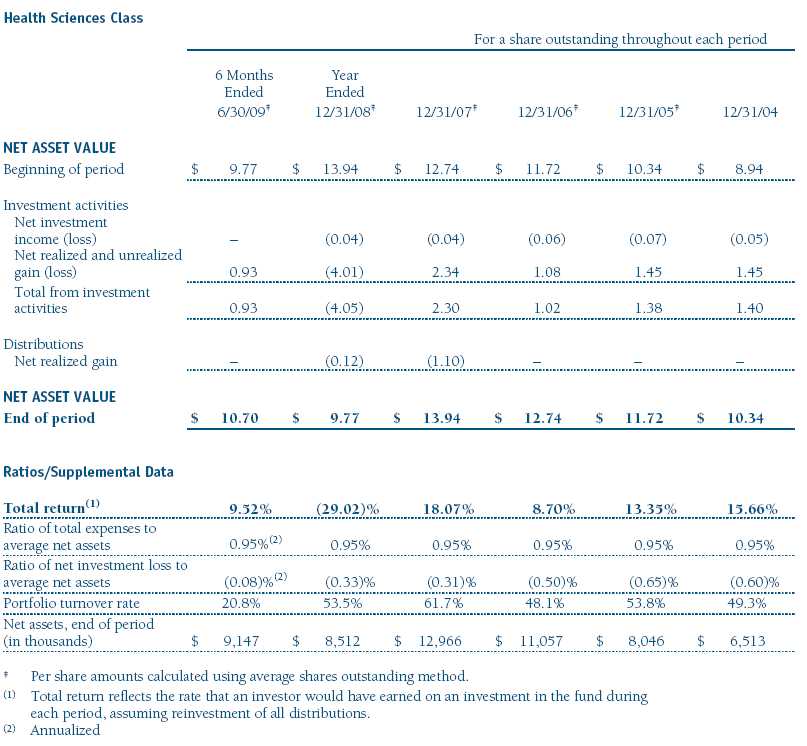
The accompanying notes are an integral part of these financial statements.
Financial Highlights
T. Rowe Price Health Sciences Portfolio
(Unaudited)
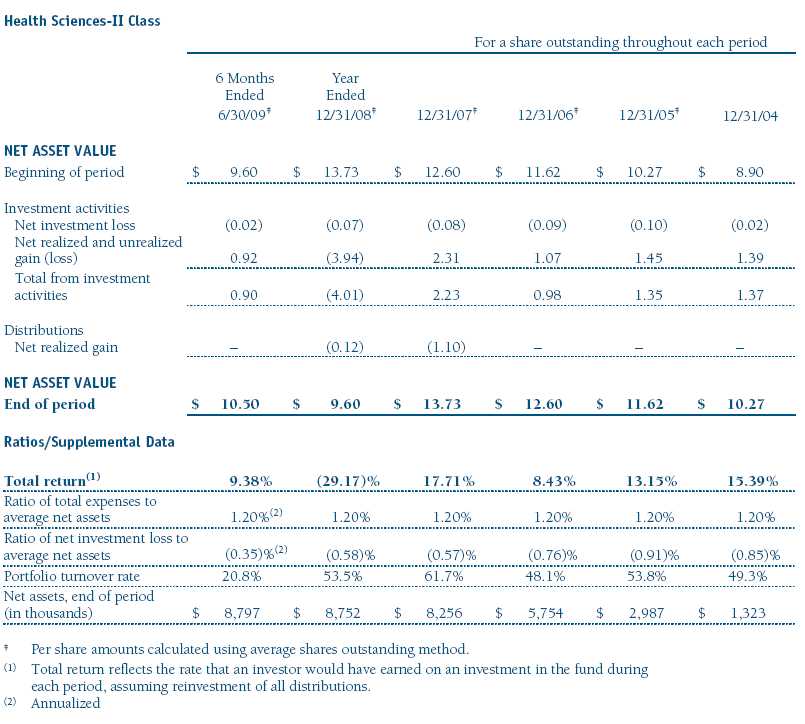
The accompanying notes are an integral part of these financial statements.
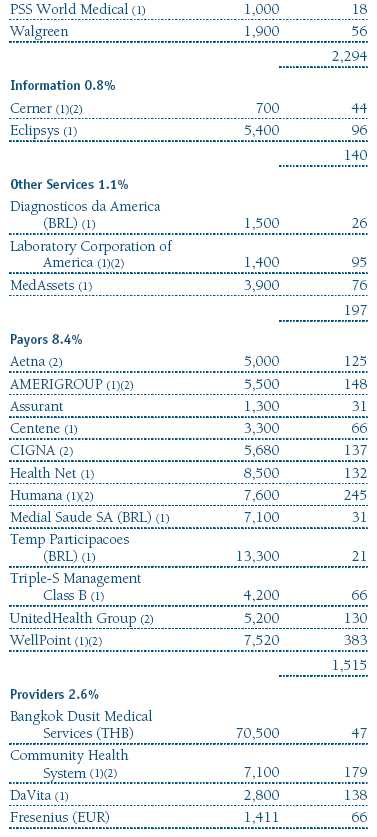
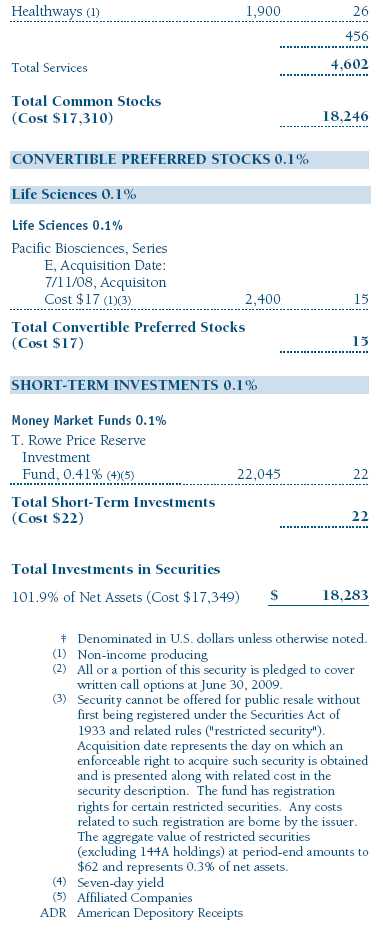
Portfolio of Investments ‡
T. Rowe Price Health Sciences Portfolio
June 30, 2009 (Unaudited)
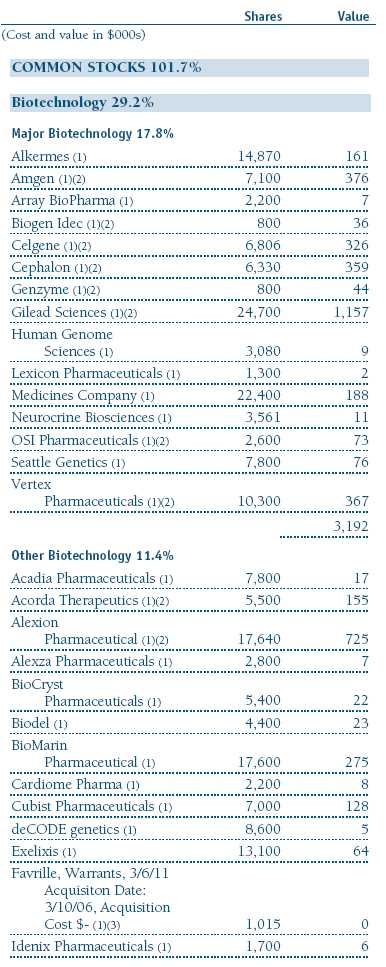
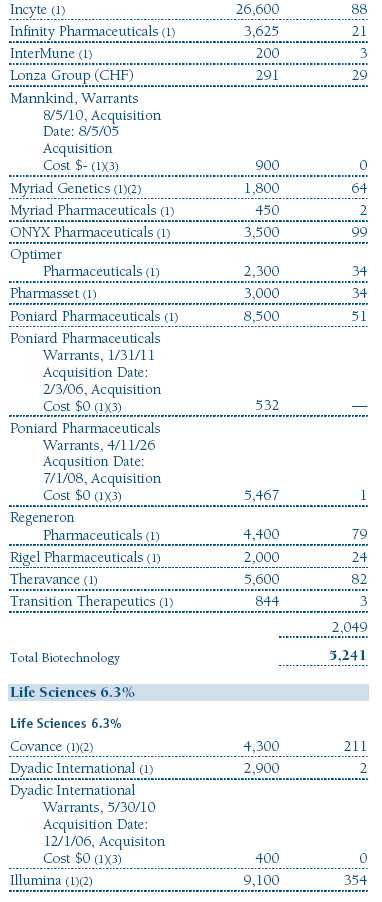
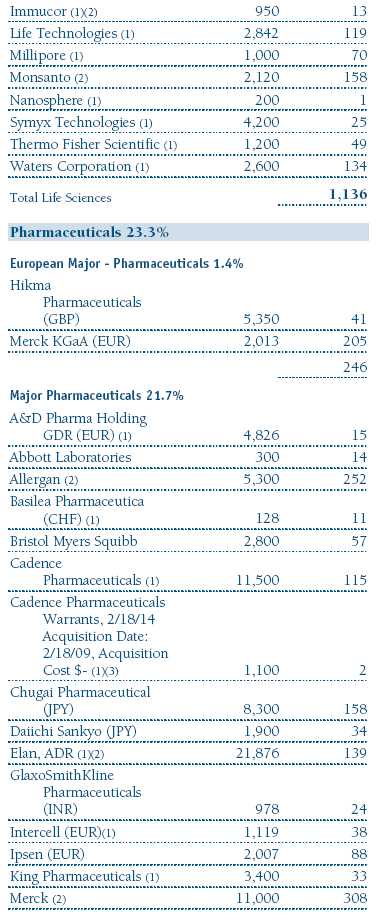
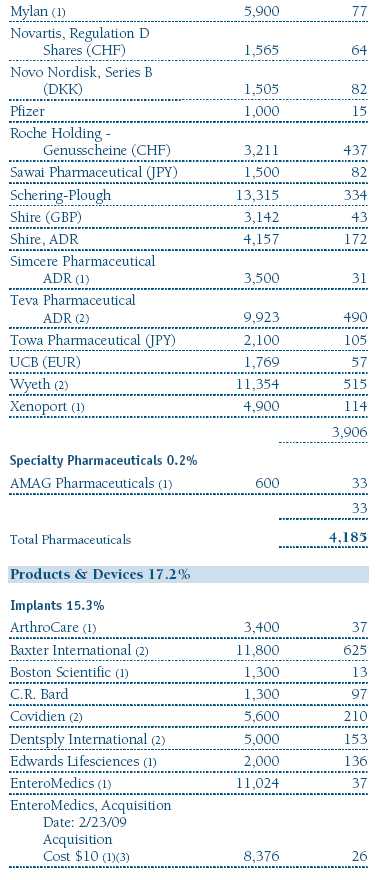
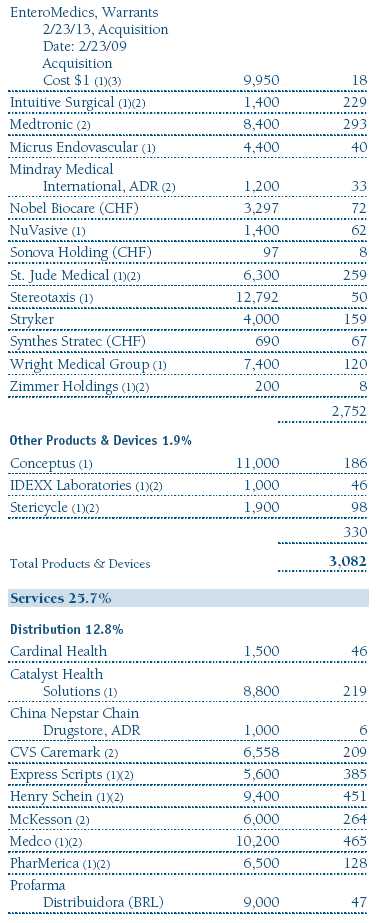


The accompanying notes are an integral part of these financial statements.
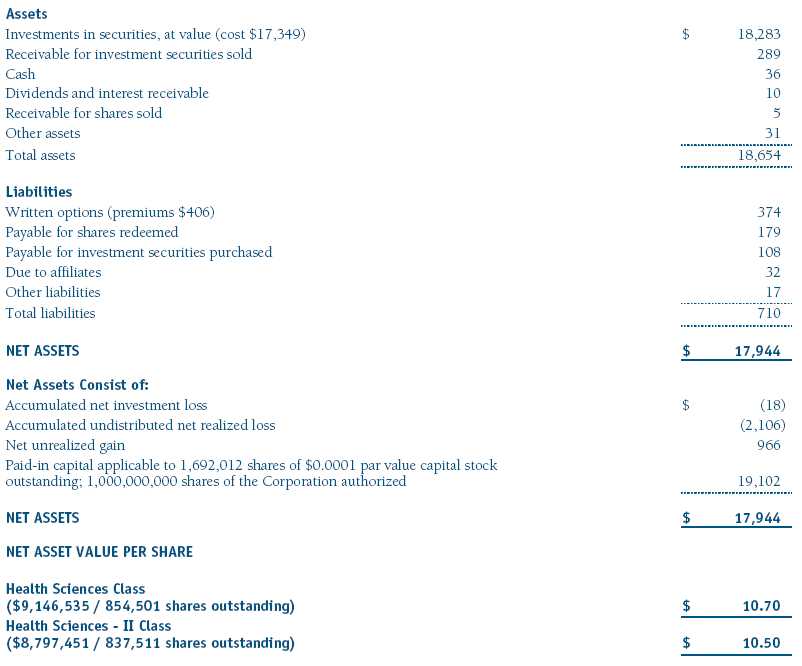
Statement of Assets and Liabilities
T. Rowe Price Health Sciences Portfolio
June 30, 2009 (Unaudited)
($000s, Unauditedexcept shares and per share amounts)
The accompanying notes are an integral part of these financial statements.
Statement of Operations
T. Rowe Price Health Sciences Portfolio
(Unaudited)
($000s)

The accompanying notes are an integral part of these financial statements.
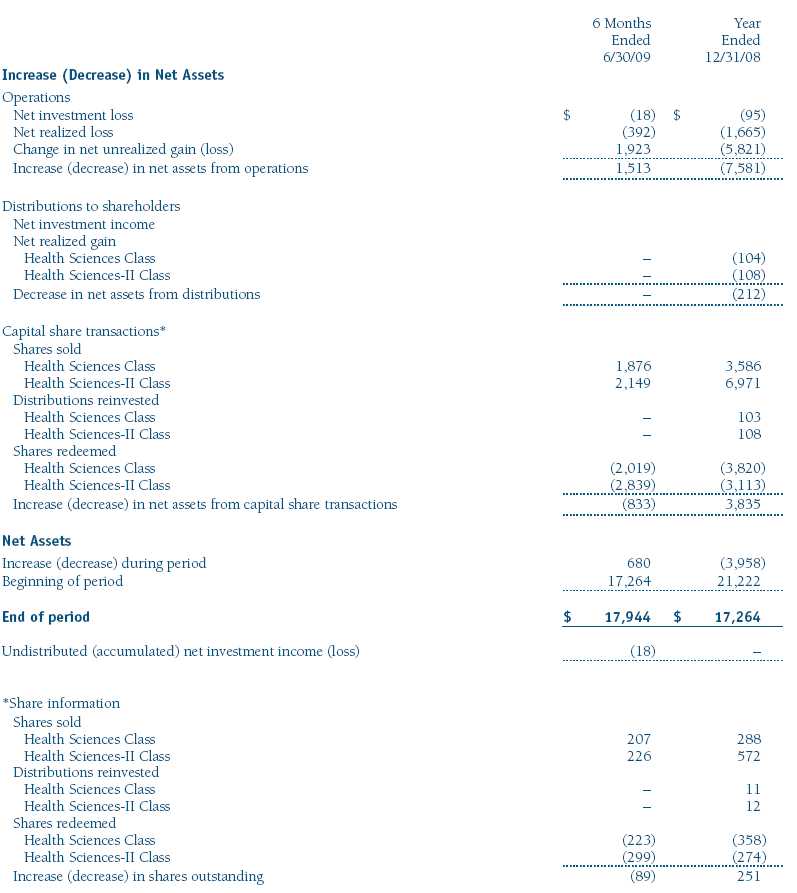
Statement of Changes in Net Assets
T. Rowe Price Health Sciences Portfolio
(Unaudited)
($000s)
The accompanying notes are an integral part of these financial statements.
Notes to Financial Statements
T. Rowe Price Health Sciences Portfolio
June 30, 2009 (Unaudited)
T. Rowe Price Equity Series, Inc. (the corporation), is registered under the Investment Company Act of 1940 (the 1940 Act). The Health Sciences Portfolio (the fund) is a diversified, open-end management investment company and is one portfolio established by the corporation. The fund seeks long-term capital appreciation. Shares of the fund currently are offered only through certain insurance companies as an investment medium for both variable annuity contracts and variable life insurance policies. The fund has two classes of shares: the Health Sciences Portfolio original share class (Health Sciences Class), offered since December 29, 2000, and Health Sciences Portfolio–II (Health Sciences-II Class), offered since April 30, 2002. Health Sciences–II Class shares are sold through financial intermediaries, which it compensates for distribution, shareholder servicing, and/or certain administrative services under a Board-approved Rule 12b-1 plan. Each class has exclusive voting rights on matters related solely to that class, separate voting rights on matters that relate to both classes, and, in all other respects, the same rights and obligations as the other class.
NOTE 1 - SIGNIFICANT ACCOUNTING POLICIES
Basis of Preparation The accompanying financial statements were prepared in accordance with accounting principles generally accepted in the United States of America, which require the use of estimates made by fund management. Fund management believes that estimates and security valuations are appropriate; however, actual results may differ from those estimates, and the security valuations reflected in the financial statements may differ from the value the fund ultimately realizes upon sale of the securities. Further, fund management believes no events have occurred between June 30, 2009 and August 20, 2009, the date of issuance of the financial statements, that require adjustment of, or disclosure in, the accompanying financial statements.
Investment Transactions, Investment Income, and Distributions Income and expenses are recorded on the accrual basis. Dividends received from mutual fund investments are reflected as dividend income; capital gain distributions are reflected as realized gain/loss. Dividend income and capital gain distributions are recorded on the ex-dividend date. Income tax-related interest and penalties, if incurred, would be recorded as income tax expense. Investment transactions are accounted for on the trade date. Realized gains and losses are reported on the identified cost basis. Distributions to shareholders are recorded on the ex-dividend date. Income distributions are declared and paid by each class on an annual basis. Capital gain distributions, if any, are declared and paid by the fund, typically on an annual basis.
Currency Translation Assets, including investments, and liabilities denominated in foreign currencies are translated into U.S. dollar values each day at the prevailing exchange rate, using the mean of the bid and asked prices of such currencies against U.S. dollars as quoted by a major bank. Purchases and sales of securities, income, and expenses are translated into U.S. dollars at the prevailing exchange rate on the date of the transaction. The effect of changes in foreign currency exchange rates on realized and unrealized security gains and losses is reflected as a component of security gains and losses.
Class Accounting Health Sciences–II pays distribution, shareholder servicing, and/or certain administrative expenses in the form of Rule 12b-1 fees, in an amount not exceeding 0.25% of the class’s average daily net assets. Investment income, investment management and administrative expense, and realized and unrealized gains and losses are allocated to the classes based upon the relative daily net assets of each class.
Rebates Subject to best execution, the fund may direct certain security trades to brokers who have agreed to rebate a portion of the related brokerage commission to the fund in cash. Commission rebates are reflected as realized gain on securities in the accompanying financial statements.
New Accounting Pronouncement On January 1, 2009, the fund adopted Statement of Financial Accounting Standards No. 161 (FAS 161), Disclosures about Derivative Instruments and Hedging Activities. FAS 161 requires enhanced disclosures about derivative and hedging activities, including how such activities are accounted for and their effect on financial position, performance and cash flows. Adoption of FAS 161 had no impact on the fund’s net assets or results of operations.
NOTE 2 - VALUATION
The fund’s investments are reported at fair value as defined under Statement of Financial Accounting Standards No. 157 (FAS 157), Fair Value Measurements. The fund values its investments and computes its net asset value per share at the close of the New York Stock Exchange (NYSE), normally 4 p.m. ET, each day that the NYSE is open for business.
Valuation Methods Equity securities listed or regularly traded on a securities exchange or in the over-the-counter (OTC) market are valued at the last quoted sale price or, for certain markets, the official closing price at the time the valuations are made, except for OTC Bulletin Board securities, which are valued at the mean of the latest bid and asked prices. A security that is listed or traded on more than one exchange is valued at the quotation on the exchange determined to be the primary market for such security. Listed securities not traded on a particular day are valued at the mean of the latest bid and asked prices for domestic securities and the last quoted sale price for international securities.
Investments in mutual funds are valued at the mutual fund’s closing net asset value per share on the day of valuation. Purchased and written options are valued at the mean of the closing bid and asked prices.
Other investments, including restricted securities, and those for which the above valuation procedures are inappropriate or are deemed not to reflect fair value are stated at fair value as determined in good faith by the T. Rowe Price Valuation Committee, established by the fund’s Board of Directors.
For valuation purposes, the last quoted prices of non-U.S. equity securities may be adjusted under the circumstances described below. If the fund determines that developments between the close of a foreign market and the close of the NYSE will, in its judgment, materially affect the value of some or all of its portfolio securities, the fund will adjust the previous closing prices to reflect what it believes to be the fair value of the securities as of the close of the NYSE. In deciding whether it is necessary to adjust closing prices to reflect fair value, the fund reviews a variety of factors, including developments in foreign markets, the performance of U.S. securities markets, and the performance of instruments trading in U.S. markets that represent foreign securities and baskets of foreign securities. A fund may also fair value securities in other situations, such as when a particular foreign market is closed but the fund is open. The fund uses outside pricing services to provide it with closing prices and information to evaluate and/or adjust those prices. The fund cannot predict how often it will use closing prices and how often it will determine it necessary to adjust those prices to reflect fair value. As a means of evaluating its security valuation process, the fund routinely compares closing prices, the next day’s opening prices in the same markets, and adjusted prices.
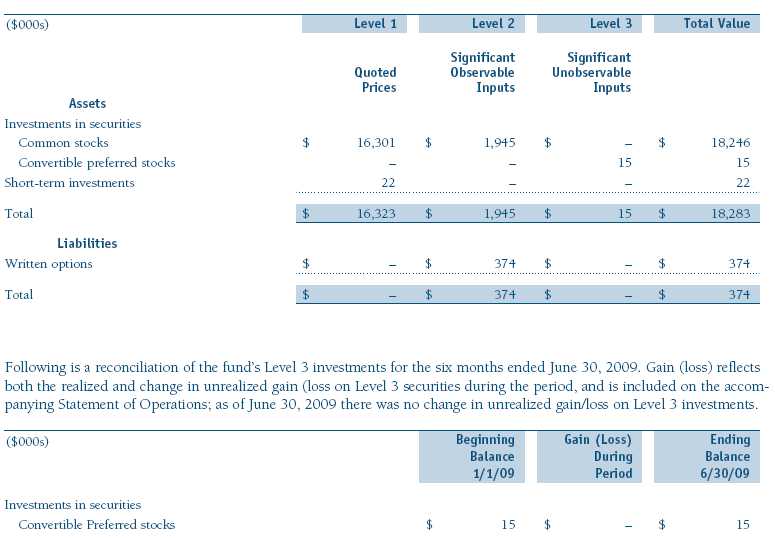
Valuation Inputs Various inputs are used to determine the value of the fund’s investments. These inputs are summarized in the three broad levels listed below:
Level 1 – quoted prices in active markets for identical securities
Level 2 – observable inputs other than Level 1 quoted prices (including, but not limited to, quoted prices for similar securities, interest rates, prepayment speeds, credit risk)
Level 3 – unobservable inputs
Observable inputs are those based on market data obtained from sources independent of the fund, and unobservable inputs reflect the fund’s own assumptions based on the best information available. The input levels are not necessarily an indication of the risk or liquidity associated with investments at that level. For example, non-U.S. equity securities actively traded in foreign markets generally are reflected in Level 2 despite the availability of closing prices because the fund evaluates and determines whether those closing prices reflect fair value at the close of the NYSE or require adjustment, as described above. The following table summarizes the fund’s investments, based on the inputs used to determine their values on June 30, 2009:
NOTE 3 - DERIVATIVE INSTRUMENTS
During the six months ended June 30, 2009, the fund invested in derivative instruments. As defined by Statement of Financial Accounting Standards No. 133 (FAS 133), Accounting for Derivative Instruments and Hedging Activities, a derivative is a financial instrument whose value is derived from an underlying security price, foreign exchange rate, interest rate, index of prices or rates, or other variable; it requires little or no initial investment and permits or requires net settlement. The fund invests in derivatives only if the expected risks and rewards are consistent with its investment objectives, policies, and overall risk profile, as described in its prospectus and Statement of Additional Information. The fund may use derivatives for a variety of purposes, such as seeking to hedge against declines in principal value, increase yield, invest in an asset with greater efficiency and at a lower cost than is possible through direct investment, or to adjust credit exposure. The risks associated with the use of derivatives are different from, and potentially much greater than, the risks associated with investing directly in the instruments on which the derivatives are based. Investments in derivatives can magnify returns positively or negatively; however, the fund at all times maintains sufficient cash reserves, liquid assets, or other SEC-permitted asset types to cover the settlement obligations under its open derivative contracts. The fund’s period-end derivatives, as presented in the Portfolio of Investments or the tables following, generally are indicative of the volume of its derivative activity during the period.
The fund values its derivatives at fair value, as described below and in Note 2, and recognizes changes in fair value currently in its results of operations. Accordingly, the fund does not follow hedge accounting as prescribed by FAS 133, even for derivatives employed as economic hedges.
As of June 30, 2009, the fund held equity derivatives with a fair value of $374,000, included in Written Options on the accompanying Statement of Assets and Liabilities.
Additionally, the amount of gains and losses on derivative instruments recognized in fund earnings during the six months ended June 30, 2009 and the related location on the accompanying Statement of Operations is summarized in the following table by primary underlying risk exposure:
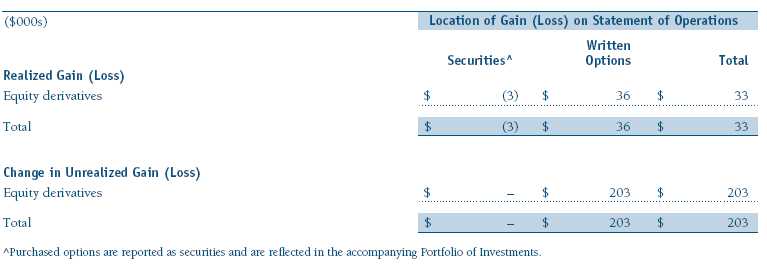
Counterparty risk related to exchange-traded derivatives, including futures and options contracts, is minimal because the exchange’s clearinghouse provides protection against defaults. Additionally, for exchange-traded derivatives, each broker in its sole discretion may change margin requirements applicable to the fund.
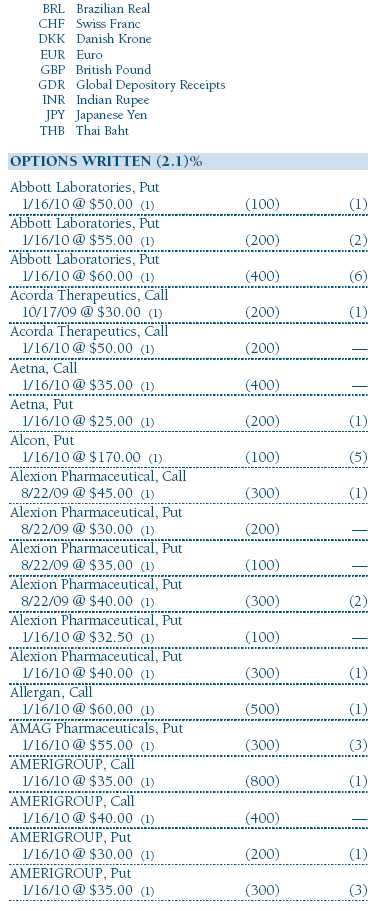
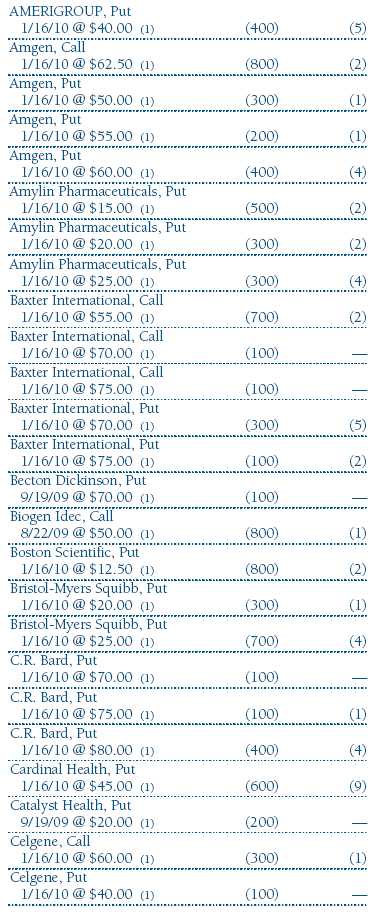
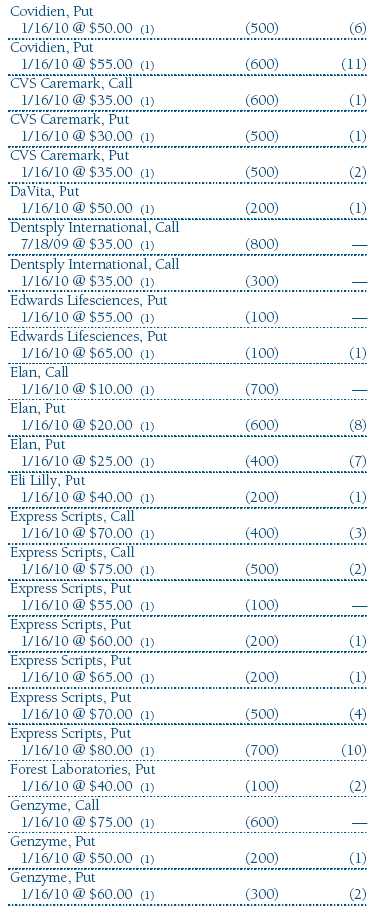
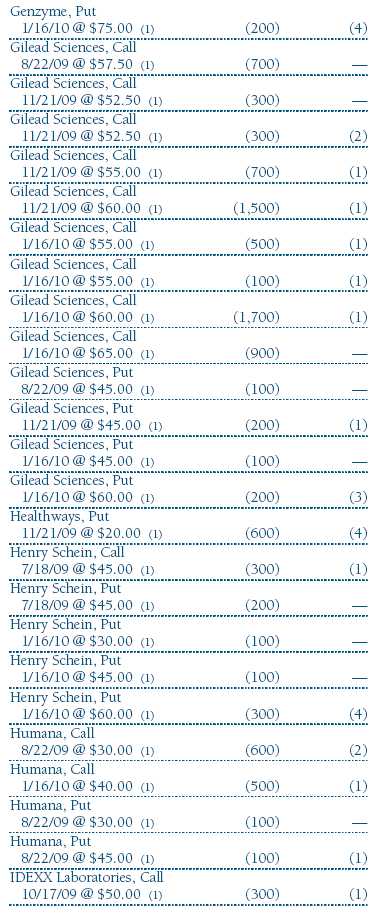
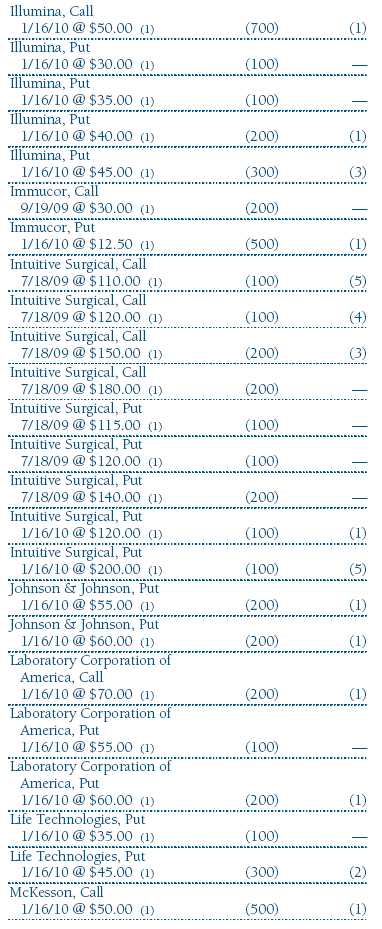
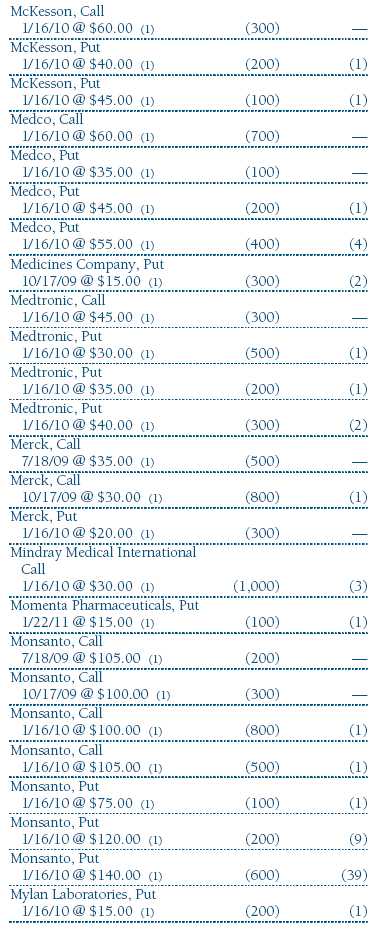
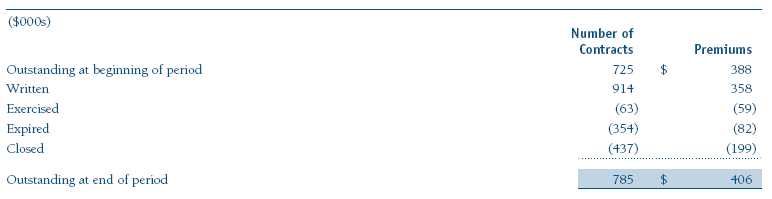
Options The fund is subject to equity price risk in the normal course of pursuing its investment objectives and uses options to help manage such risk. The fund may use call and put options to manage exposure to interest rates, security prices, foreign currencies, and credit quality; as an efficient means of adjusting exposure to all or a part of a target market; to enhance income; as a cash management tool; and/or to adjust credit exposure. Call and put options give the holder the right, in return for a premium paid, to purchase or sell, respectively, a security at a specified exercise price at any time during the period of the option. Risks related to the use of options include possible illiquidity of the options markets; trading restrictions imposed by an exchange; movements in underlying security values; and for written options, potential losses in excess of the fund’s initial investment. Options are included in net assets at fair value; purchased options are included in Investments in Securities and written options are separately reflected as a liability on the accompanying Statement of Assets and Liabilities. Transactions in written options and related premiums received during the six months ended June 30, 2009, were as follows:
NOTE 4 - OTHER INVESTMENT TRANSACTIONS
Consistent with its investment objective, the fund engages in the following practices to manage exposure to certain risks or to enhance performance. The investment objective, policies, program, and risk factors of the fund are described more fully in the fund’s prospectus and Statement of Additional Information.
Restricted Securities The fund may invest in securities that are subject to legal or contractual restrictions on resale. Prompt sale of such securities at an acceptable price may be difficult and may involve substantial delays and additional costs.
Other Purchases and sales of portfolio securities other than short-term securities aggregated $3,524,000 and $4,114,000, respectively, for the six months ended June 30, 2009.
NOTE 5 - FEDERAL INCOME TAXES
No provision for federal income taxes is required since the fund intends to continue to qualify as a regulated investment company under Subchapter M of the Internal Revenue Code and distribute to shareholders all of its taxable income and gains. Distributions are determined in accordance with Federal income tax regulations, which differ from generally accepted accounting principles, and, therefore, may differ in amount or character from net investment income and realized gains for financial reporting purposes. Financial reporting records are adjusted for permanent book/tax differences to reflect tax character but are not adjusted for temporary differences. The amount and character of tax-basis distributions and composition of net assets are finalized at fiscal year-end; accordingly, tax-basis balances have not been determined as of June 30, 2009.
In accordance with federal tax regulations, the fund deferred recognition of certain capital loss amounts previously recognized in the prior fiscal year for financial reporting purposes until the current fiscal period for tax purposes. Such deferrals amounted to $719,000 and related to net capital losses realized between November 1 and the fund’s fiscal year-end date. Further, the fund intends to retain realized gains to the extent of available capital loss carryforwards. As of December 31, 2008, the fund had $201,000 of unused capital loss carryforwards, all of which expire in fiscal 2016.
At June 30, 2009, the cost of investments for federal income tax purposes was $17,349,000. Net unrealized gain aggregated $965,000 at period-end, of which $3,089,000 related to appreciated investments and $2,124,000 related to depreciated investments.
NOTE 6 - FOREIGN TAXES
The fund is subject to foreign income taxes imposed by certain countries in which it invests. Additionally, capital gains realized by the fund upon disposition of securities issued in or by certain foreign countries are subject to capital gains tax imposed by those countries. All taxes are computed in accordance with the applicable foreign tax law, and, to the extent permitted, capital losses are used to offset capital gains. Tax expense attributable to income is accrued by the fund as a reduction of income. Current and deferred tax expense attributable to net capital gains is reflected as a component of realized and/or change in unrealized gain/loss on securities in the accompanying financial statements. At June 30, 2009, the fund had no deferred tax liability attributable to foreign securities and no foreign capital loss carryforwards.
NOTE 7 - RELATED PARTY TRANSACTIONS
The fund is managed by T. Rowe Price Associates, Inc. (the manager or Price Associates), a wholly owned subsidiary of T. Rowe Price Group, Inc. The investment management and administrative agreement between the fund and the manager provides for an all-inclusive annual fee equal to 0.95% of the fund’s average daily net assets. The fee is computed daily and paid monthly. The agreement provides that investment management, shareholder servicing, transfer agency, accounting, custody services, and directors’ fees and expenses are provided to the fund, and interest, taxes, brokerage commissions, and extraordinary expenses are paid directly by the fund.
The fund may invest in the T. Rowe Price Reserve Investment Fund and the T. Rowe Price Government Reserve Investment Fund (collectively, the T. Rowe Price Reserve Investment Funds), open-end management investment companies managed by Price Associates and considered affiliates of the fund. The T. Rowe Price Reserve Investment Funds are offered as cash management options to mutual funds, trusts, and other accounts managed by Price Associates and/or its affiliates and are not available for direct purchase by members of the public. The T. Rowe Price Reserve Investment Funds pay no investment management fees.
| Information on Proxy Voting Policies, Procedures, and Records |
A description of the policies and procedures used by T. Rowe Price funds and portfolios to determine how to vote proxies relating to portfolio securities is available in each fund’s Statement of Additional Information, which you may request by calling 1-800-225-5132 or by accessing the SEC’s Web site, www.sec.gov. The description of our proxy voting policies and procedures is also available on our Web site, www.troweprice.com. To access it, click on the words “Our Company” at the top of our corporate homepage. Then, when the next page appears, click on the words “Proxy Voting Policies” on the left side of the page.
Each fund’s most recent annual proxy voting record is available on our Web site and through the SEC’s Web site. To access it through our Web site, follow the directions above, then click on the words “Proxy Voting Records” on the right side of the Proxy Voting Policies page.
| How to Obtain Quarterly Portfolio Holdings |
The fund files a complete schedule of portfolio holdings with the Securities and Exchange Commission for the first and third quarters of each fiscal year on Form N-Q. The fund’s Form N-Q is available electronically on the SEC’s Web site (www.sec.gov); hard copies may be reviewed and copied at the SEC’s Public Reference Room, 450 Fifth St. N.W., Washington, DC 20549. For more information on the Public Reference Room, call 1-800-SEC-0330.
| Approval of Investment Management Agreement |
On March 10, 2009, the fund’s Board of Directors (Board) unanimously approved the investment advisory contract (Contract) between the fund and its investment manager, T. Rowe Price Associates, Inc. (Manager). The Board considered a variety of factors in connection with its review of the Contract, also taking into account information provided by the Manager during the course of the year, as discussed below:
Services Provided by the Manager
The Board considered the nature, quality, and extent of the services provided to the fund by the Manager. These services included, but were not limited to, management of the fund’s portfolio and a variety of related activities, as well as financial and administrative services, reporting, and communications. The Board also reviewed the background and experience of the Manager’s senior management team and investment personnel involved in the management of the fund. The Board concluded that it was satisfied with the nature, quality, and extent of the services provided by the Manager.
Investment Performance of the Fund
The Board reviewed the fund’s average annual total returns over the one-, three-, and five-year and since-inception periods as well as the fund’s year-by-year returns and compared these returns with previously agreed upon comparable performance measures and market data, including those supplied by Lipper and Morningstar, which are independent providers of mutual fund data. On the basis of this evaluation and the Board’s ongoing review of investment results, and factoring in the severity of the market turmoil in 2008, the Board concluded that the fund’s performance was satisfactory.
Costs, Benefits, Profits, and Economies of Scale
The Board reviewed detailed information regarding the revenues received by the Manager under the Contract and other benefits that the Manager (and its affiliates) may have realized from its relationship with the fund, including research received under “soft dollar” agreements. The Board noted that soft dollars were not used to pay for third-party, non-broker research during 2008. The Board also received information on the estimated costs incurred and profits realized by the Manager and its affiliates from advising T. Rowe Price mutual funds. The Board did not review information regarding profits realized from managing the fund in particular because the fund had not achieved sufficient scale in terms of portfolio asset size to produce meaningful profit margin percentages. The Board concluded that the Manager’s profits from advising T. Rowe Price mutual funds were reasonable in light of the services provided to the fund. The Board also considered whether the fund or other funds benefit under the fee levels set forth in the Contract from any economies of scale realized by the Manager. The Board noted that, under the Contract, the fund pays the Manager a single fee based on the fund’s assets and the Manager, in turn, pays all expenses of the fund, with certain exceptions. The Board concluded that, based on the profitability data it reviewed and consistent with this single-fee structure, the Contract provided for a reasonable sharing of benefits from any economies of scale with the fund.
Fees
The Board reviewed the fund’s single-fee structure and compared the rate with fees and expenses of other comparable funds based on information and data supplied by Lipper. (For these purposes, the Board assumed the management fee rate was equal to the single fee less the fund’s operating expenses and expense reimbursements by the Manager.) The information provided to the Board indicated that the fund’s management fee rate was below the median for comparable funds and the expense ratio was above the median for comparable funds. The Board also reviewed the fees and expenses of the fund’s II Class share class, which pays a 12b-1 fee in addition to the single fee, and compared the rate (also after assuming the management fee rate was equal to the single fee less the fund’s operating expenses and expense reimbursements by the Manager) with the fees and expenses of comparable funds. The information provided to the Board for the II Class indicated that the management fee rate was below the median for comparable funds and the expense ratio was above the median for comparable funds. The Board also reviewed the fee schedules for comparable privately managed accounts of the Manager and its affiliates. Management informed the Board that the Manager’s responsibilities for privately managed accounts are more limited than its responsibilities for the fund and other T. Rowe Price mutual funds that it or its affiliates advise. On the basis of the information provided, the Board concluded that the fees paid by the fund under the Contract were reasonable.
Approval of the Contract
As noted, the Board approved the continuation of the Contract. No single factor was considered in isolation or to be determinative to the decision. Rather, the Board concluded, in light of a weighting and balancing of all factors considered, that it was in the best interests of the fund to approve the continuation of the Contract, including the fees to be charged for services thereunder.
Item 2. Code of Ethics.
A code of ethics, as defined in Item 2 of Form N-CSR, applicable to its principal executive officer, principal financial officer, principal accounting officer or controller, or persons performing similar functions is filed as an exhibit to the registrant’s annual Form N-CSR. No substantive amendments were approved or waivers were granted to this code of ethics during the registrant’s most recent fiscal half-year.
Item 3. Audit Committee Financial Expert.
Disclosure required in registrant’s annual Form N-CSR.
Item 4. Principal Accountant Fees and Services.
Disclosure required in registrant’s annual Form N-CSR.
Item 5. Audit Committee of Listed Registrants.
Not applicable.
Item 6. Investments.
(a) Not applicable. The complete schedule of investments is included in Item 1 of this Form N-CSR.
(b) Not applicable.
Item 7. Disclosure of Proxy Voting Policies and Procedures for Closed-End Management Investment Companies.
Not applicable.
Item 8. Portfolio Managers of Closed-End Management Investment Companies.
Not applicable.
Item 9. Purchases of Equity Securities by Closed-End Management Investment Company and Affiliated Purchasers.
Not applicable.
Item 10. Submission of Matters to a Vote of Security Holders.
Not applicable.
Item 11. Controls and Procedures.
(a) The registrant’s principal executive officer and principal financial officer have evaluated the registrant’s disclosure controls and procedures within 90 days of this filing and have concluded that the registrant’s disclosure controls and procedures were effective, as of that date, in ensuring that information required to be disclosed by the registrant in this Form N-CSR was recorded, processed, summarized, and reported timely.
(b) The registrant’s principal executive officer and principal financial officer are aware of no change in the registrant’s internal control over financial reporting that occurred during the registrant’s second fiscal quarter covered by this report that has materially affected, or is reasonably likely to materially affect, the registrant’s internal control over financial reporting.
Item 12. Exhibits.
(a)(1) The registrant’s code of ethics pursuant to Item 2 of Form N-CSR is filed with the registrant’s annual Form N-CSR.
(2) Separate certifications by the registrant's principal executive officer and principal financial officer, pursuant to Section 302 of the Sarbanes-Oxley Act of 2002 and required by Rule 30a-2(a) under the Investment Company Act of 1940, are attached.
(3) Written solicitation to repurchase securities issued by closed-end companies: not applicable.
(b) A certification by the registrant's principal executive officer and principal financial officer, pursuant to Section 906 of the Sarbanes-Oxley Act of 2002 and required by Rule 30a-2(b) under the Investment Company Act of 1940, is attached.
| | |
SIGNATURES |
| |
| | Pursuant to the requirements of the Securities Exchange Act of 1934 and the Investment |
| Company Act of 1940, the registrant has duly caused this report to be signed on its behalf by the |
| undersigned, thereunto duly authorized. |
| |
| T. Rowe Price Equity Series, Inc. |
| |
| |
| |
| By | /s/ Edward C. Bernard |
| | Edward C. Bernard |
| | Principal Executive Officer |
| |
| Date | August 20, 2009 |
| |
| |
| |
| | Pursuant to the requirements of the Securities Exchange Act of 1934 and the Investment |
| Company Act of 1940, this report has been signed below by the following persons on behalf of |
| the registrant and in the capacities and on the dates indicated. |
| |
| |
| By | /s/ Edward C. Bernard |
| | Edward C. Bernard |
| | Principal Executive Officer |
| |
| Date | August 20, 2009 |
| |
| |
| |
| By | /s/ Gregory K. Hinkle |
| | Gregory K. Hinkle |
| | Principal Financial Officer |
| |
| Date | August 20, 2009 |