| UNITED STATES |
| SECURITIES AND EXCHANGE COMMISSION |
| Washington, D.C. 20549 |
| |
FORM N-CSR |
| |
CERTIFIED SHAREHOLDER REPORT OF REGISTERED |
MANAGEMENT INVESTMENT COMPANIES |
| |
| |
| |
| Investment Company Act File Number: 811-07143 |
|
| |
| T. Rowe Price Equity Series, Inc. |
|
| (Exact name of registrant as specified in charter) |
| |
| 100 East Pratt Street, Baltimore, MD 21202 |
|
| (Address of principal executive offices) |
| |
| David Oestreicher |
| 100 East Pratt Street, Baltimore, MD 21202 |
|
| (Name and address of agent for service) |
| |
| |
| Registrant’s telephone number, including area code: (410) 345-2000 |
| |
| |
| Date of fiscal year end: December 31 |
| |
| |
| Date of reporting period: June 30, 2008 |
Item 1: Report to Shareholders| Health Sciences Portfolio | June 30, 2008 |
The views and opinions in this report were current as of June 30, 2008. They are not guarantees of performance or investment results and should not be taken as investment advice. Investment decisions reflect a variety of factors, and the managers reserve the right to change their views about individual stocks, sectors, and the markets at any time. As a result, the views expressed should not be relied upon as a forecast of the fund’s future investment intent. The report is certified under the Sarbanes-Oxley Act, which requires mutual funds and other public companies to affirm that, to the best of their knowledge, the information in their financial reports is fairly and accurately stated in all material respects.
Manager's Letter
T. Rowe Price Health Sciences Portfolio
Dear Investor
Equities were volatile and trended lower over the past six months due to dislocations in the financial system, increasing concern about inflation, and an ongoing steep decline in the housing sector. Within the health care sector, as measured by the Lipper Health/Biotechnology Funds Index, biotechnology stocks performed best, while services, pharmaceuticals, and life sciences stocks posted double-digit declines. In this environment, the Health Sciences Portfolio recorded losses but our returns were modestly better than the benchmarks.

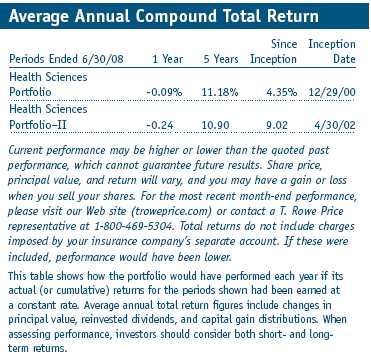
The portfolio returned -8.54% for the six months ended June 30, 2008. As shown in the table, the portfolio outperformed its Lipper Variable Annuity Underlying Health/Biotechnology Funds Average and the S&P 500. (The result for II Class shares varied slightly, reflecting their different fee structure.) Our strong relative results versus the Lipper benchmark were helped by stock selection in the pharmaceuticals segment and to a lesser extent in health care services and life sciences. Stock selection in biotechnology detracted.
The Health Sciences Portfolio has delivered consistently strong long-term performance compared with the Lipper universe of health care portfolios. Lipper ranked the portfolio in the top 17% of its health care portfolio universe for the past one- and five-year periods and in the top 4% for the three-year period ended June 30, 2008. (Based on cumulative total return, Lipper ranked the Health Sciences Portfolio six out of 35, one out of 32, and three out of 28 portfolios for the one-, three-, and five-year periods ended June 30, 2008, respectively. Past performance cannot guarantee future results.)
Market Environment
The economy entered 2008 on a distinctly downbeat note. The housing slump appeared to worsen, employers began to cut back on payrolls, and consumers struggled with high heating and gasoline costs due to record-high oil prices. Problems in the real economy were amplified in the financial sector. Rising mortgage defaults led to steep markdowns of mortgage-backed securities on the books of banks and institutional investors. By early March, several prominent financial firms seemed on the verge of collapse. Worried investors, in turn, dumped stocks and their riskiest assets.
Inflation remained elevated throughout much of the period—an uncomfortable situation that reminded some of the stagflation of the 1970s. Rising food and energy costs were clearly the main culprits, but investors were also concerned about rising import costs resulting from the falling U.S. dollar. Federal Reserve Chairman Bernanke and other officials began to warn of the inflation threat in stronger terms, and the Fed decided not to lower rates at its late June meeting for the first time since September 2007.
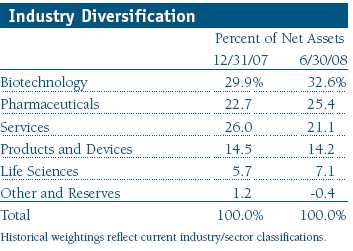
The generally defensive health care sector was not entirely steady through the turbulence. Although the biotechnology and the products and devices industries held up better than the overall market, health care services (especially managed care providers), pharmaceuticals, and life sciences stocks fell during the past six months.
• Health care stocks and the broad market endured a volatile six-month period as investors worried about falling housing prices, rising inflation, and turmoil in financials.
• The portfolio outperformed the broad market, as measured by the S&P 500, and its Lipper peer group average in the first half.
• The portfolio’s major focus is on companies with new and important medicines for unmet medical needs.
• We believe that stock selection will continue to be the key to strong performance in the health care sector, rather than an emphasis on a particular subsector of the health care industry.
Portfolio Review
Biotechnology and Pharmaceuticals
Our large allocation to the biotechnology and pharmaceuticals sectors stems from our belief in the power of their business models—the discovery, development, manufacture, and commercialization of medicines or therapeutic devices. We believe many of the best investments in health care will come from therapeutics companies, those that produce medicines that prevent disease, relieve symptoms, and provide cures. About three-quarters of the portfolio is invested in therapeutics-based companies.
In addition, seasoned pharmaceutical companies have a large base of revenues and income, and one drug—even if it is extremely successful—may not be enough to affect the bottom line significantly. Biotechnology companies, however, tend to be smaller, and the successful introduction of one drug can materially affect their revenues and earnings. We are especially focused on companies with new and important medicines or treatments for unmet medical needs. Although this strategy encompasses more risk because a firm that is highly dependent on the success of a single drug can decline significantly on bad news, we manage this risk in part by owning a diversified basket of stocks and controlling our position sizes.
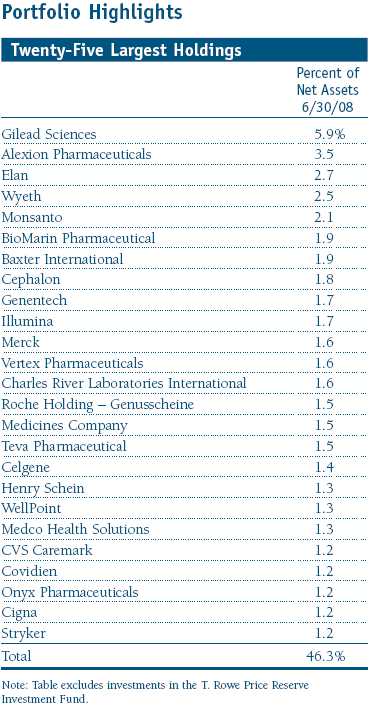
In the first half of 2008, five of the portfolio’s top 10 contributors were major biotechnology firms. The portfolio’s largest holding and second-best contributor was Gilead Sciences, which climbed more than 20%, largely due to the ongoing success of its suite of drugs for the treatment of HIV. Gilead and Bristol-Myers Squibb partnered to produce and market Atripla, a once-a-day pill that combines two of Gilead’s HIV medicines and one of Bristol-Myers’. The drug continued to generate robust sales. We are impressed with Gilead’s management team and its history of good execution in all aspects of its business. The company is dominant in its core therapeutics business and continued to generate strong sales and earnings growth. (Please refer to the portfolio of investments for a complete list of holdings and the amount each represents in the portfolio.)
The portfolio’s strongest first-half contributor was Elan. Several years ago, its multiple sclerosis medication Tysabri—at that time the most promising drug we had ever evaluated—suffered a near-fatal blow due to revelations that it was associated with a very rare and serious side effect called PML (progressive multifocal leukoencephalopathy). Three patients taking Tysabri in combination with other drugs contracted this viral infection while on the drug in clinical trials. After voluntarily withdrawing Tysabri from the market in 2005, Elan reintroduced it in mid-2006 after the risk of contracting PML was better characterized and a risk-management program was implemented. More than 31,000 patients are currently taking Tysabri, and we believe the drug will enjoy strong sales so long as the risk of PML remains low.
Elan is also developing a promising Alzheimer’s drug (Bapineuzumab) through a partnership with Wyeth, another top portfolio contributor. Alzheimer’s is a devastating disease that is growing in incidence as the population ages, and current treatment options are inadequate at best. Promising data on Bapineuzumab were recently released, and we are cautiously optimistic regarding its prospects. However, as with all drugs in the development process, risks remain, though the potential payoffs for patients and investors are exciting.
Vertex Pharmaceuticals and Celgene, a pair of major biotechnology companies, were also among our top performers in the first half. Vertex develops small-molecule drugs for the treatment of serious diseases worldwide. The company’s leading products in its development pipeline include Telaprevir, in Phase 3 clinical trials, for the treatment of hepatitis C and other products for the treatment of rheumatoid arthritis, inflammatory diseases, and cancer. Celgene has been a core portfolio holding for the past several years. The stock has been volatile: It rallied strongly in the first half of 2008 after a sharp sell-off in the fourth quarter of 2007. The company’s primary product is Revlimid, an important new medicine for multiple myeloma and potentially other blood-borne cancers, which should generate significant earnings growth for the next several years.
Within the biotech/pharma sector, several of our large positions detracted from first-half results. The portfolio’s second-largest holding and 2007’s best performer, Alexion Pharmaceuticals, declined during the past six months. Despite the near-term weakness, we think this core small-cap specialty pharmaceutical holding can be a long-term winner.
BioMarin Pharmaceutical is another of our top 10 holdings that posted losses during this reporting period. The stock generated strong gains in 2007 but stumbled in the first half of 2008, falling 18% and providing us with an opportunity to add to our positions at lower prices. The keys to BioMarin’s future success are commercial execution of its existing product portfolio and progress in developing its product pipeline.
Services
The portfolio’s largest first-half detractors came from our health care services holdings. The payors subset within this sector declined approximately 40% in the first half, as measured by the Morgan Stanley Healthcare Payors Index. The trouble in the managed health care segment surfaced in mid-March when WellPoint reduced its earnings outlook for 2008, citing an unexpected rise in medical costs, lower-than-anticipated enrollments, and the weakness in the broad economy. Even as the first quarter came to a close, it wasn’t clear if WellPoint’s woes were company-specific or more broad-based and would hurt other managed care companies in the portfolio such as Humana, Aetna, and Cigna. At the time, it seemed that Aetna and Cigna would be able to dodge much of the malaise—each confirmed its earnings targets for the year—and much of the bad news was already priced into their stocks. Nevertheless, the group was punished in the second quarter, although Aetna and Cigna posted more moderate declines. Second-quarter earnings results, due in the latter half of July, should be much better than the first and may signal a turning point for the group.
Overall, the rest of the industries in the health care services sector posted losses but none were as significant as the managed care segment. Among the bright spots were Matria Healthcare, which was acquired by Inverness Medical Innovations, and Psychiatric Solutions, which owns and operates psychiatric hospitals. At this point we intend to maintain our cautious stance on these stocks.
While most of our investments are in U.S. common stocks, the fund can and will selectively invest in companies domiciled outside the country. Over the past six months, the portfolio’s holdings in overseas investments generated solid results. Additionally, the portfolio writes call and put options primarily as a means of augmenting income. Normally, we will own the securities on which it writes these options. The premium income recovered by writing covered calls can help reduce but not eliminate portfolio volatility. Over the past six months, options income contributed to portfolio results.
Outlook
We believe that generating outperformance in the health care sector will be increasingly dependent on effective stock selection, rather than an emphasis on a particular subsector of the health care industry. As always, we seek the strongest companies in each of the four main areas of health care: pharmaceuticals, biotechnology, services, and medical devices. Although each subsector offers attractive growth opportunities, we favor therapeutic companies developing novel products for unmet medical needs.
The current environment for health care earnings is generally stable, and should remain so, regardless of global economic developments. We believe the relative performance of the stocks in the health care sector is going to be more dependent on the S&P 500’s earnings results than earnings in the health care sector itself. Our reasoning is as follows: If the S&P 500’s earnings slow, as Wall Street currently projects, then investors are likely to gravitate toward health care stocks because of their earnings stability. If the market’s earnings expand rapidly, then the health care sector will likely continue to be an average performer.
Because health care is a heavily regulated industry, we think the key risk for the sector is a dramatic change in Washington, especially relating to the industry’s reimbursement and regulatory oversight. Consensus wisdom views a potential Obama administration as generally negative for the health care sector. Given Obama’s lead in the polls, concerns regarding the policies his administration would pursue, if elected, may persist. Sectors particularly sensitive to election-related sentiment include the managed care industry and the large-cap pharmaceutical companies.
On the flip side, we think the sector holds tremendous opportunity. We have an aging population that demands the best in health care, an explosion in scientific understanding that should lead to better medicines, and many diseases for which we have no therapies. As long as society continues to desire new therapies to soften the impact of disease and government price controls are not imposed, health care should remain an area of significant growth for the long term.
We appreciate your continued confidence and support.
Respectfully submitted,

Kris H. Jenner
President of the portfolio and chairman of its Investment Advisory Committee
July 22, 2008
The committee chairman has day-to-day responsibility for managing the portfolio and works with committee members in developing and executing its investment program.
Growth stocks can be volatile for several reasons. Since these companies usually invest a high portion of earnings in their businesses, they may lack the dividends of value stocks that can cushion stock prices in a falling market. Also, earnings disappointments often lead to sharply falling prices because investors buy growth stocks in anticipation of superior earnings growth.
| Risk of Health Sciences Investing |
Portfolios that invest only in specific industries will experience greater volatility than portfolios investing in a broad range of industries. Companies in the health sciences field are subject to special risks such as increased competition within the health care industry, changes in legislation or government regulations, reductions in government funding, product liability or other litigation, and the obsolescence of popular products.
Lipper averages: The average return of all portfolios in a particular category as tracked by Lipper Inc.
Lipper index: Fund benchmarks that consist of a small number of the largest mutual funds in a particular category as tracked by Lipper Inc.
S&P 500 Stock Index: An index consisting of 500 stocks chosen for market size, liquidity, and industry group representation. It is a market value-weighted index, with each stock’s weight in the index proportionate to its market value.

Performance and Expenses
T. Rowe Price Health Sciences Portfolio
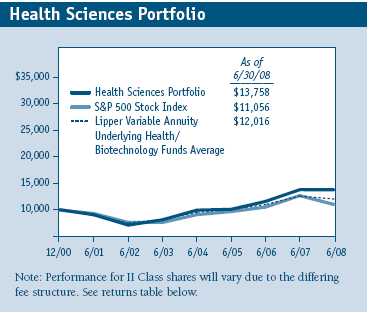
This chart shows the value of a hypothetical $10,000 investment in the portfolio over the past 10 fiscal year periods or since inception (for portfolios lacking 10-year records). The result is compared with benchmarks, which may include a broad-based market index and a peer group average or index. Market indexes do not include expenses, which are deducted from portfolio returns as well as mutual fund averages and indexes.
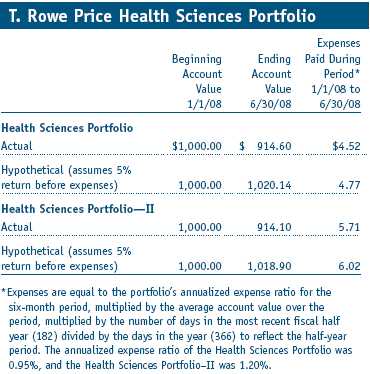
Fund Expense Example
As a mutual fund shareholder, you may incur two types of costs: (1) transaction costs, such as redemption fees or sales loads, and (2) ongoing costs, including management fees, distribution and service (12b-1) fees, and other fund expenses. The following example is intended to help you understand your ongoing costs (in dollars) of investing in the fund and to compare these costs with the ongoing costs of investing in other mutual funds. The example is based on an investment of $1,000 invested at the beginning of the most recent six-month period and held for the entire period.
Shares of the fund are currently offered only through certain insurance companies as an investment medium for both variable annuity contracts and variable life insurance policies. Please note that the fund has two classes of shares: the original share class and II Class. II Class shares are sold through financial intermediaries, which are compensated for distribution, shareholder servicing, and/or certain administrative services under a Board-approved Rule 12b-1 plan.
Actual Expenses
The first line of the following table (“Actual”) provides information about actual account values and actual expenses. You may use the information in this line, together with your account balance, to estimate the expenses that you paid over the period. Simply divide your account value by $1,000 (for example, an $8,600 account value divided by $1,000 = 8.6), then multiply the result by the number in the first line under the heading “Expenses Paid During Period” to estimate the expenses you paid on your account during this period.
Hypothetical Example for Comparison Purposes
The information on the second line of the table (“Hypothetical”) is based on hypothetical account values and expenses derived from the fund’s actual expense ratio and an assumed 5% per year rate of return before expenses (not the fund’s actual return). You may compare the ongoing costs of investing in the fund with other funds by contrasting this 5% hypothetical example and the 5% hypothetical examples that appear in the shareholder reports of the other funds. The hypothetical account values and expenses may not be used to estimate the actual ending account balance or expenses you paid for the period.
You should also be aware that the expenses shown in the table highlight only your ongoing costs and do not reflect any transaction costs, such as redemption fees or sales loads. Therefore, the second line of the table is useful in comparing ongoing costs only and will not help you determine the relative total costs of owning different funds. To the extent a fund charges transaction costs, however, the total cost of owning that fund is higher.
Financial Highlights
T. Rowe Price Health Sciences Portfolio
(Unaudited)
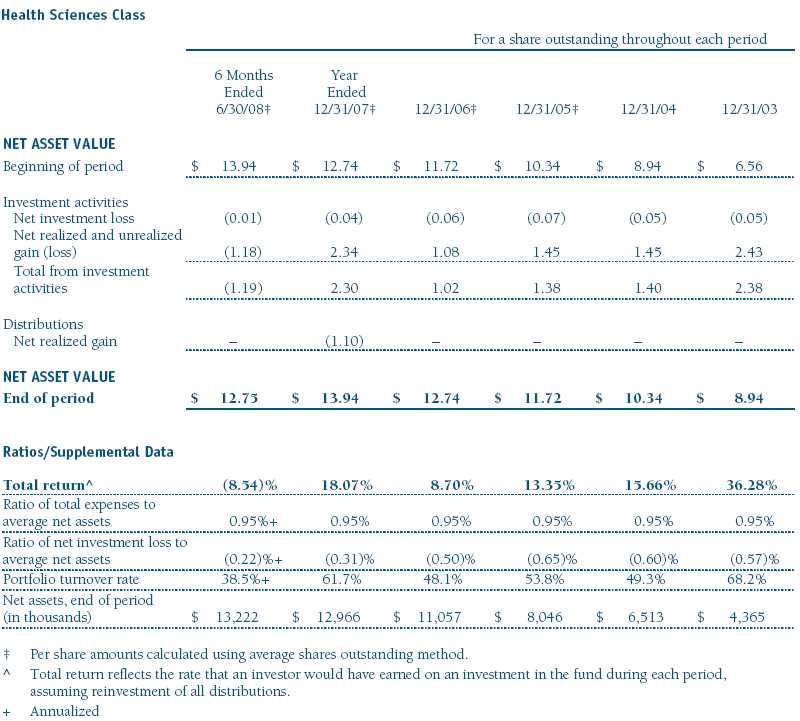
The accompanying notes are an integral part of these financial statements.
Financial Highlights
T. Rowe Price Health Sciences Portfolio
(Unaudited)
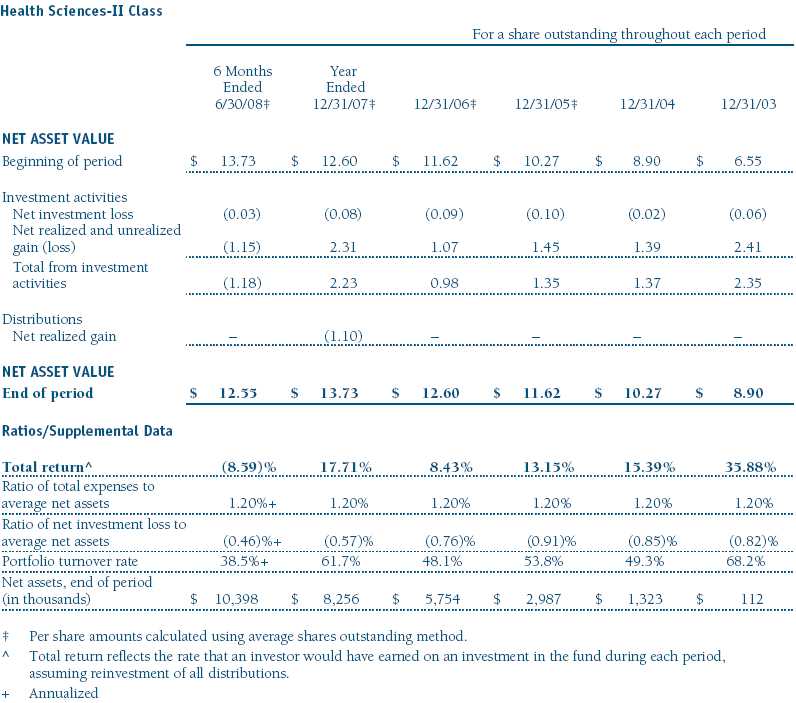
The accompanying notes are an integral part of these financial statements.
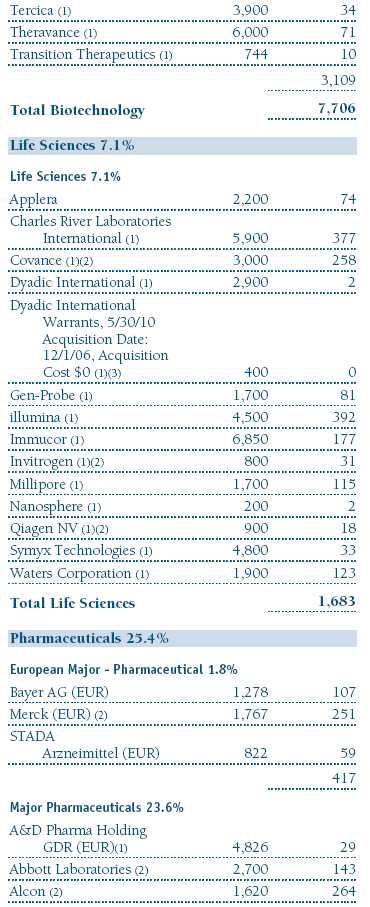
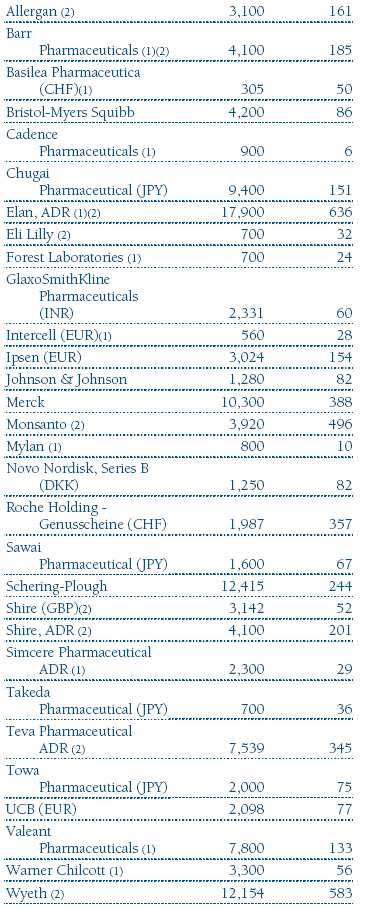
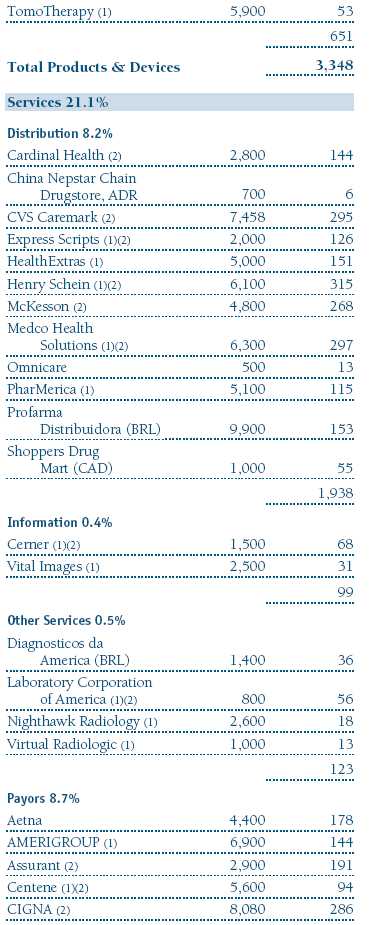
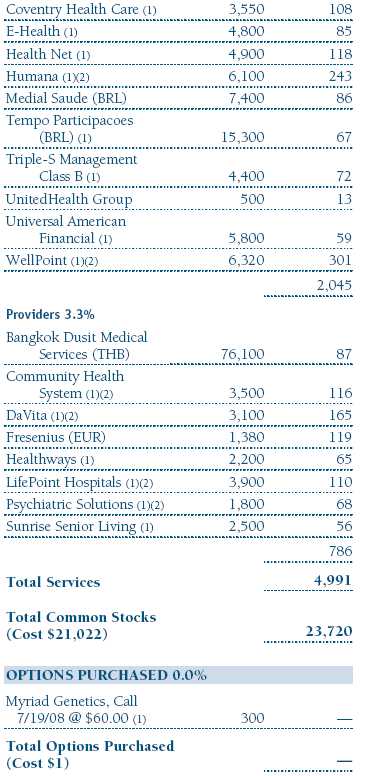
Portfolio of Investments ‡
T. Rowe Price Health Sciences Portfolio
June 30, 2008 (Unaudited)

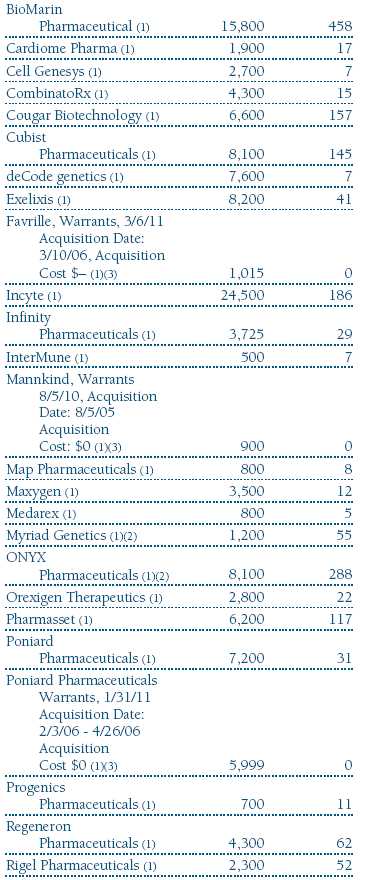


The accompanying notes are an integral part of these financial statements.
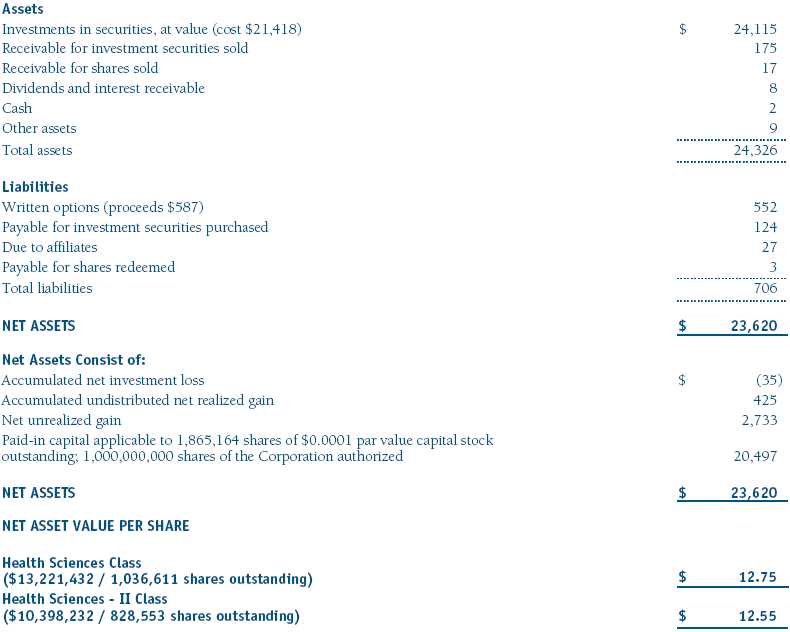
Statement of Assets and Liabilities
T. Rowe Price Health Sciences Portfolio
June 30, 2008 (Unaudited)
($000s, except shares and per share amounts)
The accompanying notes are an integral part of these financial statements.
Statement of Operations
T. Rowe Price Health Sciences Portfolio
(Unaudited)
($000s)

The accompanying notes are an integral part of these financial statements.
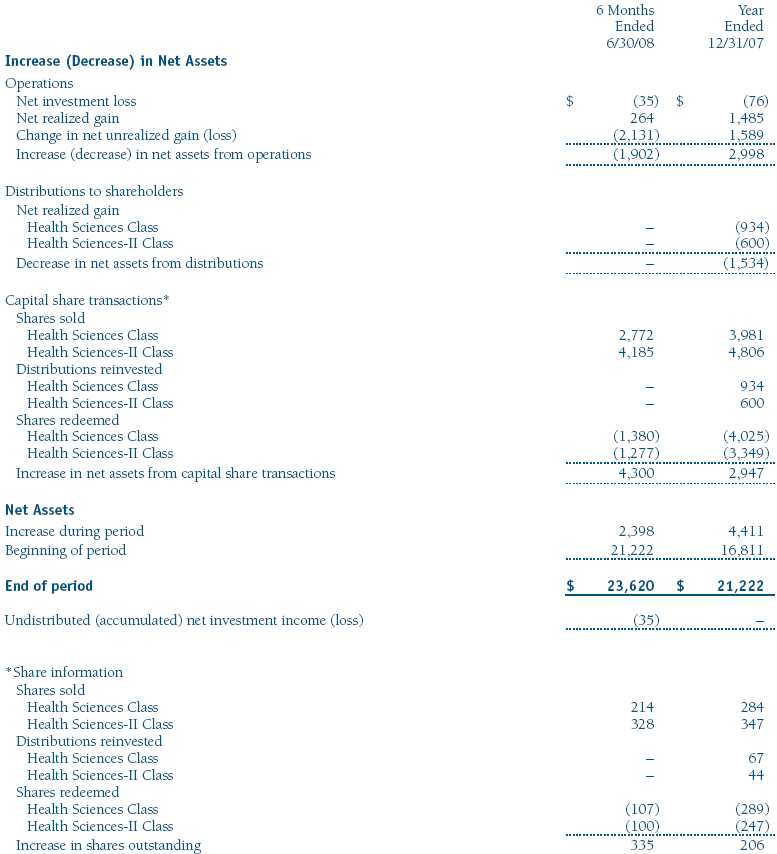
Statement of Changes in Net Assets
T. Rowe Price Health Sciences Portfolio
(Unaudited)
($000s)
The accompanying notes are an integral part of these financial statements.
Notes to Financial Statements
T. Rowe Price Health Sciences Portfolio
June 30, 2008 (Unaudited)
T. Rowe Price Equity Series, Inc. (the corporation), is registered under the Investment Company Act of 1940 (the 1940 Act). The Health Sciences Portfolio (the fund) is a diversified, open-end management investment company and is one portfolio established by the corporation. The fund seeks long-term capital appreciation. Shares of the fund currently are offered only through certain insurance companies as an investment medium for both variable annuity contracts and variable life insurance policies. The fund has two classes of shares: the Health Sciences Portfolio original share class (Health Sciences Class), offered since December 29, 2000, and Health Sciences Portfolio–II (Health Sciences–II Class), offered since April 30, 2002. Health Sciences–II Class shares are sold through financial intermediaries, which it compensates for distribution, shareholder servicing, and/or certain administrative services under a Board-approved Rule 12b-1 plan. Each class has exclusive voting rights on matters related solely to that class, separate voting rights on matters that relate to both classes, and, in all other respects, the same rights and obligations as the other class.
NOTE 1 - SIGNIFICANT ACCOUNTING POLICIES
Basis of Preparation The accompanying financial statements were prepared in accordance with accounting principles generally accepted in the United States of America, which require the use of estimates made by fund management. Fund management believes that estimates and security valuations are appropriate; however, actual results may differ from those estimates, and the security valuations reflected in the financial statements may differ from the value the fund ultimately realizes upon sale of the securities.
Investment Transactions, Investment Income, and Distributions Income and expenses are recorded on the accrual basis. Premiums and discounts on debt securities are amortized for financial reporting purposes. Dividends received from mutual fund investments are reflected as dividend income; capital gain distributions are reflected as realized gain/loss. Dividend income and capital gain distributions are recorded on the ex-dividend date. Income tax-related interest and penalties, if incurred, would be recorded as income tax expense. Investment transactions are accounted for on the trade date. Realized gains and losses are reported on the identified cost basis. Distributions to shareholders are recorded on the ex-dividend date. Income distributions are declared and paid by each class on an annual basis. Capital gain distributions, if any, are declared and paid by the fund, typically on an annual basis.
Currency Translation Assets, including investments, and liabilities denominated in foreign currencies are translated into U.S. dollar values each day at the prevailing exchange rate, using the mean of the bid and asked prices of such currencies against U.S. dollars as quoted by a major bank. Purchases and sales of securities, income, and expenses are translated into U.S. dollars at the prevailing exchange rate on the date of the transaction. The effect of changes in foreign currency exchange rates on realized and unrealized security gains and losses is reflected as a component of security gains and losses.
Class Accounting Health Sciences–II pays distribution, shareholder servicing, and/or certain administrative expenses in the form of Rule 12b-1 fees, in an amount not exceeding 0.25% of the class’s average daily net assets. Shareholder servicing, prospectus, and shareholder report expenses incurred by each class are charged directly to the class to which they relate. Investment income, investment management and administrative expense, and realized and unrealized gains and losses are allocated to the classes based upon the relative daily net assets of each class.
Rebates Subject to best execution, the fund may direct certain security trades to brokers who have agreed to rebate a portion of the related brokerage commission to the fund in cash. Commission rebates are reflected as realized gain on securities in the accompanying financial statements.
New Accounting Pronouncements On January 1, 2008, the fund adopted Statement of Financial Accounting Standards No. 157 (FAS 157), Fair Value Measurements. FAS 157 defines fair value, establishes the framework for measuring fair value, and expands the disclosures of fair value measurements in the financial statements. Adoption of FAS 157 did not have a material impact on the fund’s net assets or results of operations.
In March 2008, the Financial Accounting Standards Board issued Statement of Financial Accounting Standards No. 161, Disclosures about Derivative Instruments and Hedging Activities (FAS 161), which is effective for fiscal years and interim periods beginning after November 15, 2008. FAS 161 requires enhanced disclosures about derivative and hedging activities, including how such activities are accounted for and their effect on financial position, performance and cash flows. Management is currently evaluating the impact the adoption of FAS 161 will have on the fund’s financial statements and related disclosures.
NOTE 2 - VALUATION
The fund’s investments are reported at fair value as defined under FAS 157. The fund values its investments and computes its net asset value per share at the close of the New York Stock Exchange (NYSE), normally 4 p.m. ET, each day that the NYSE is open for business.
Valuation Methods Equity securities listed or regularly traded on a securities exchange or in the over-the-counter (OTC) market are valued at the last quoted sale price or, for certain markets, the official closing price at the time the valuations are made, except for OTC Bulletin Board securities, which are valued at the mean of the latest bid and asked prices. A security that is listed or traded on more than one exchange is valued at the quotation on the exchange determined to be the primary market for such security. Listed securities not traded on a particular day are valued at the mean of the latest bid and asked prices for domestic securities and the last quoted sale price for international securities.
Debt securities with remaining maturities of less than one year at the time of acquisition generally use amortized cost in local currency to approximate fair value. However, if amortized cost is deemed not to reflect fair value or the fund holds a significant amount of such securities with remaining maturities of more than 60 days, the securities are valued at prices furnished by dealers who make markets in such securities or by an independent pricing service.
Investments in mutual funds are valued at the mutual fund’s closing net asset value per share on the day of valuation. Purchased and written options are valued at the mean of the closing bid and asked prices.
Other investments, including restricted securities, and those for which the above valuation procedures are inappropriate or are deemed not to reflect fair value are stated at fair value as determined in good faith by the T. Rowe Price Valuation Committee, established by the fund’s Board of Directors.
For valuation purposes, the last quoted prices of non-U.S. equity securities may be adjusted under the circumstances described below. If the fund determines that developments between the close of a foreign market and the close of the NYSE will, in its judgment, materially affect the value of some or all of its portfolio securities, the fund will adjust the previous closing prices to reflect what it believes to be the fair value of the securities as of the close of the NYSE. In deciding whether it is necessary to adjust closing prices to reflect fair value, the fund reviews a variety of factors, including developments in foreign markets, the performance of U.S. securities markets, and the performance of instruments trading in U.S. markets that represent foreign securities and baskets of foreign securities. A fund may also fair value securities in other situations, such as when a particular foreign market is closed but the fund is open. The fund uses outside pricing services to provide it with closing prices and information to evaluate and/or adjust those prices. The fund cannot predict how often it will use closing prices and how often it will determine it necessary to adjust those prices to reflect fair value. As a means of evaluating its security valuation process, the fund routinely compares closing prices, the next day’s opening prices in the same markets, and adjusted prices.
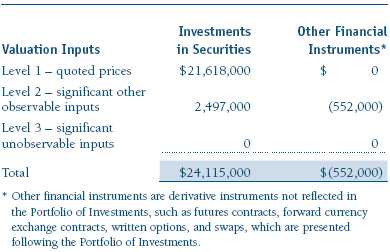
Valuation Inputs Various inputs are used to determine the value of the fund’s investments. These inputs are summarized in the three broad levels listed below:
Level 1 – quoted prices in active markets for identical securities
Level 2 – observable inputs other than Level 1 quoted prices (including, but not limited to, quoted prices for similar securities, interest rates, prepayment speeds, credit risk)
Level 3 – unobservable inputs
Observable inputs are those based on market data obtained from sources independent of the fund, and unobservable inputs reflect the fund’s own assumptions based on the best information available. The input levels are not necessarily an indication of the risk or liquidity associated with investments at that level. For example, non-U.S. equity securities actively traded in foreign markets generally are reflected in Level 2 despite the availability of closing prices, because the fund evaluates and determines whether those closing prices reflect fair value at the close of the NYSE or require adjustment, as described above. The following table summarizes the fund’s investments, based on the inputs used to determine their values on June 30, 2008:
NOTE 3 - INVESTMENT TRANSACTIONS
Consistent with its investment objective, the fund engages in the following practices to manage exposure to certain risks or to enhance performance. The investment objective, policies, program, and risk factors of the fund are described more fully in the fund’s prospectus and Statement of Additional Information.
Restricted Securities The fund may invest in securities that are subject to legal or contractual restrictions on resale. Prompt sale of such securities at an acceptable price may be difficult and may involve substantial delays and additional costs.
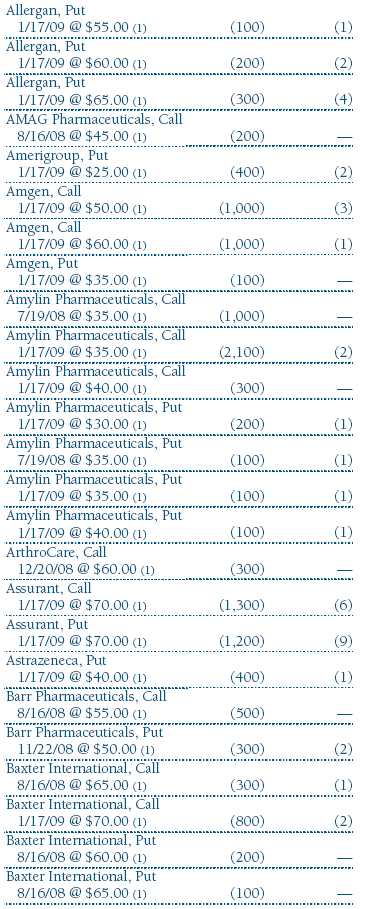
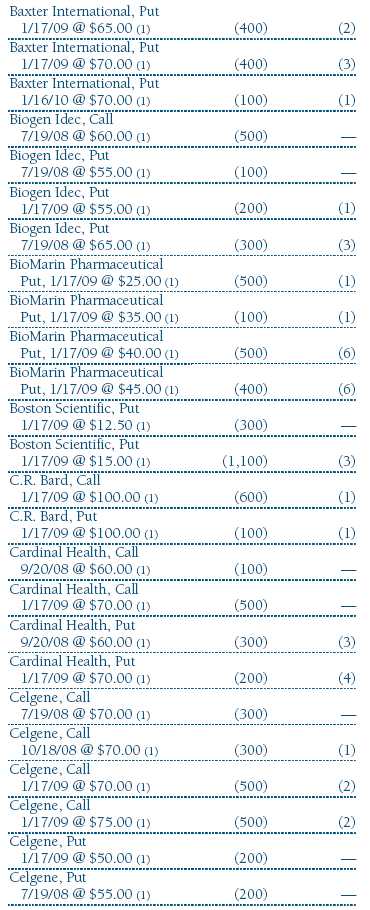
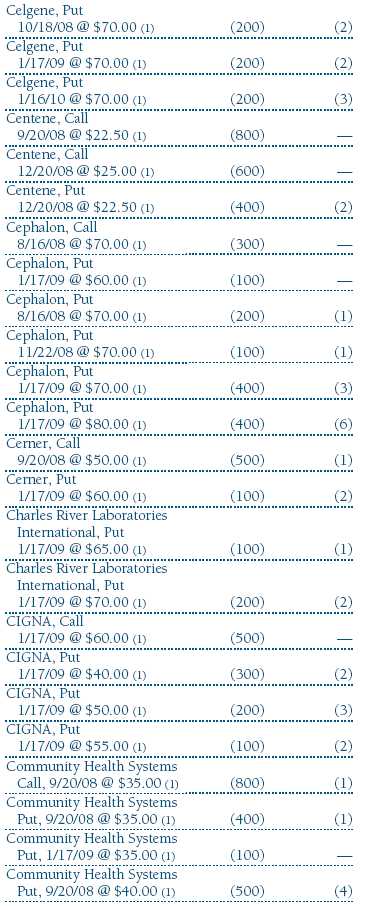
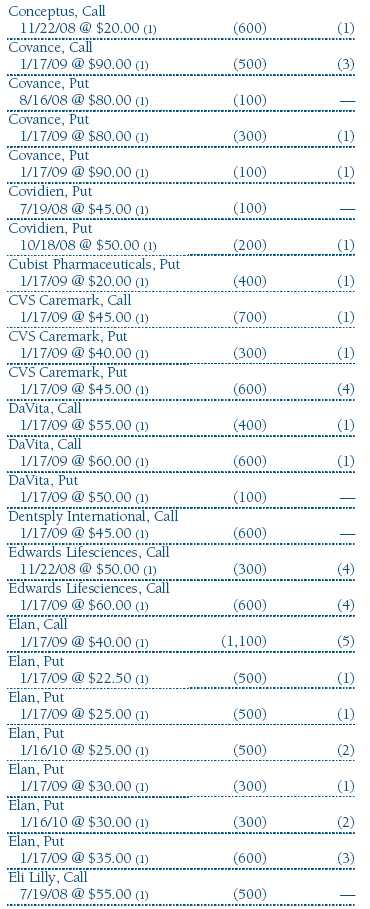
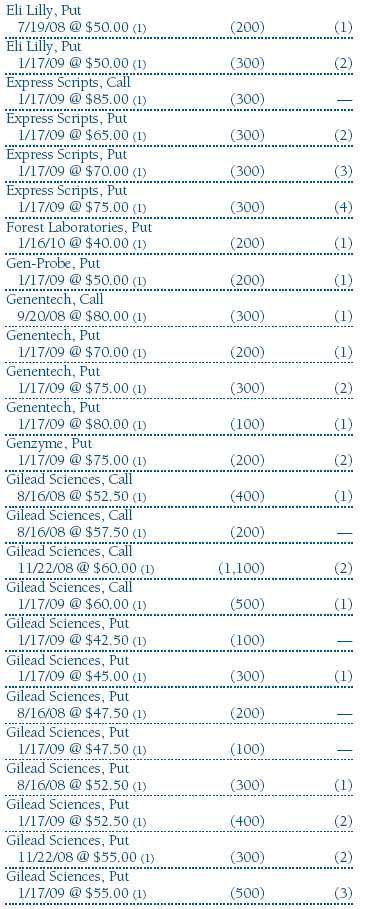
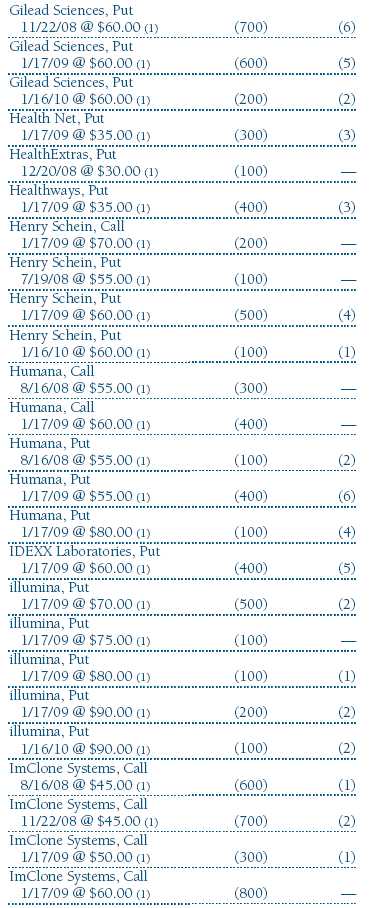
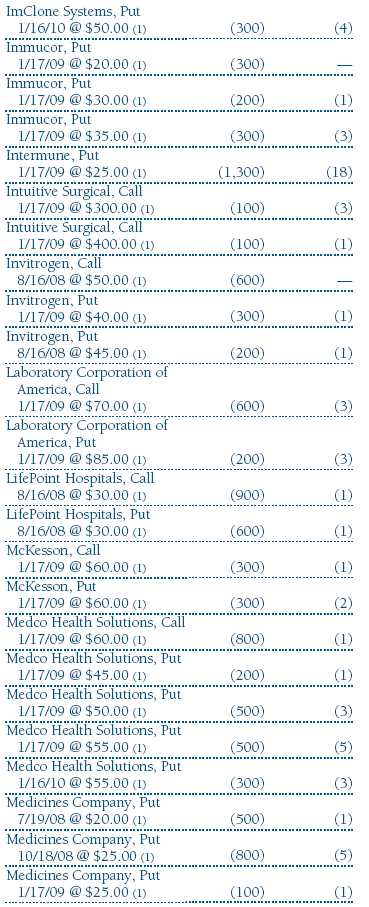
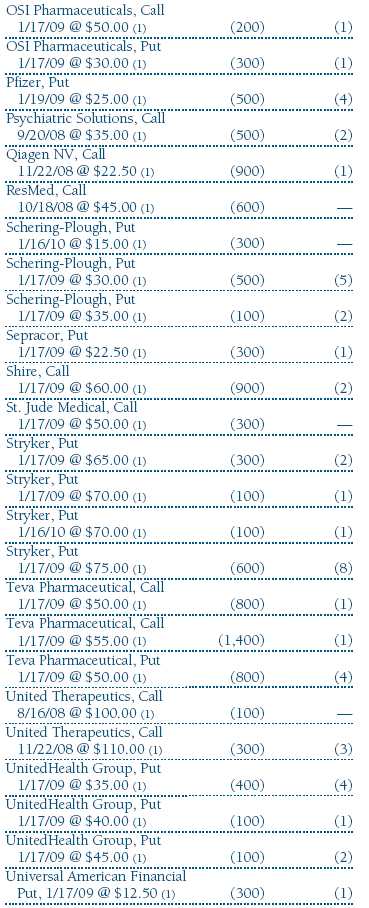
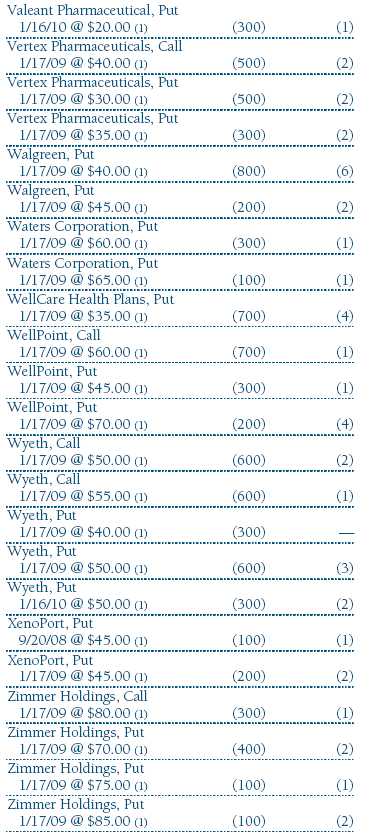
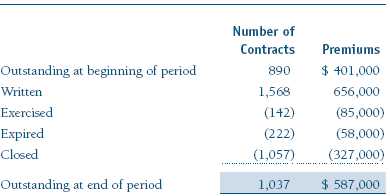
Options Call and put options give the holder the right to purchase and sell, respectively, a security at a specified price on a certain date. Risks arise from possible illiquidity of the options market and from movements in security values. Purchased options are reflected in the accompanying Portfolio of Investments at market value. Written options are reflected in the accompanying Statement of Assets and Liabilities at market value. Transactions in options written and related premiums received during the six months ended June 30, 2008, were as follows:
Other Purchases and sales of portfolio securities, other than short-term securities, aggregated $9,061,000 and $4,288,000, respectively, for the six months ended June 30, 2008.
NOTE 4 - FEDERAL INCOME TAXES
No provision for federal income taxes is required since the fund intends to continue to qualify as a regulated investment company under Subchapter M of the Internal Revenue Code and distribute to shareholders all of its taxable income and gains. Distributions are determined in accordance with Federal income tax regulations, which differ from generally accepted accounting principles, and, therefore, may differ in amount or character from net investment income and realized gains for financial reporting purposes. Financial reporting records are adjusted for permanent book/tax differences to reflect tax character but are not adjusted for temporary differences. The amount and character of tax-basis distributions and composition of net assets are finalized at fiscal year-end; accordingly, tax-basis balances have not been determined as of June 30, 2008.
In accordance with federal tax regulations, the fund deferred recognition of certain capital loss amounts previously recognized in the prior fiscal year for financial reporting purposes until the current fiscal period for tax purposes. Such deferrals amounted to $29,000 and related to net capital losses realized between November 1 and the fund’s fiscal year-end date.
At June 30, 2008, the cost of investments for federal income tax purposes was $21,418,000. Net unrealized gain aggregated $2,733,000 at period-end, of which $4,440,000 related to appreciated investments and $1,707,000 related to depreciated investments.
NOTE 5 - FOREIGN TAXES
The fund is subject to foreign income taxes imposed by certain countries in which it invests. Additionally, capital gains realized by the fund upon disposition of securities issued in or by certain foreign countries are subject to capital gains tax imposed by those countries. All taxes are computed in accordance with the applicable foreign tax law, and, to the extent permitted, capital losses are used to offset capital gains. Tax expense attributable to income is accrued by the fund as a reduction of income. Current and deferred tax expense attributable to net capital gains is reflected as a component of realized and/or change in unrealized gain/loss on securities in the accompanying financial statements. At June 30, 2008, the fund had no deferred tax liability attributable to foreign securities and no foreign capital loss carryforwards.
NOTE 6 - RELATED PARTY TRANSACTIONS
The fund is managed by T. Rowe Price Associates, Inc. (the manager or Price Associates), a wholly owned subsidiary of T. Rowe Price Group, Inc. The investment management and administrative agreement between the fund and the manager provides for an all-inclusive annual fee equal to 0.95% of the fund’s average daily net assets. The fee is computed daily and paid monthly. The agreement provides that investment management, shareholder servicing, transfer agency, accounting, custody services, and directors’ fees and expenses are provided to the fund, and interest, taxes, brokerage commissions, and extraordinary expenses are paid directly by the fund.
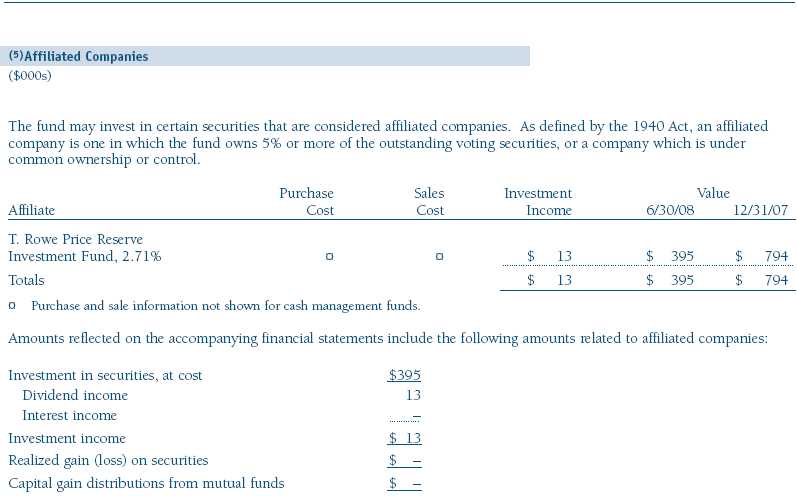
The fund may invest in the T. Rowe Price Reserve Investment Fund and the T. Rowe Price Government Reserve Investment Fund (collectively, the T. Rowe Price Reserve Investment Funds), open-end management investment companies managed by Price Associates and considered affiliates of the fund. The T. Rowe Price Reserve Investment Funds are offered as cash management options to mutual funds, trusts, and other accounts managed by Price Associates and/ or its affiliates and are not available for direct purchase by members of the public. The T. Rowe Price Reserve Investment Funds pay no investment management fees.
| Information on Proxy Voting Policies, Procedures, and Records |
A description of the policies and procedures used by T. Rowe Price funds and portfolios to determine how to vote proxies relating to portfolio securities is available in each fund’s Statement of Additional Information, which you may request by calling 1-800-225-5132 or by accessing the SEC’s Web site, www.sec.gov. The description of our proxy voting policies and procedures is also available on our Web site, www.troweprice.com. To access it, click on the words “Company Info” at the top of our homepage for individual investors. Then, in the window that appears, click on the “Proxy Voting Policy” navigation button in the top left corner.
Each fund’s most recent annual proxy voting record is available on our Web site and through the SEC’s Web site. To access it through our Web site, follow the directions above, then click on the words “Proxy Voting Record” at the bottom of the Proxy Voting Policy page.
| How to Obtain Quarterly Portfolio Holding |
The fund files a complete schedule of portfolio holdings with the Securities and Exchange Commission for the first and third quarters of each fiscal year on Form N-Q. The fund’s Form N-Q is available electronically on the SEC’s Web site (www.sec.gov); hard copies may be reviewed and copied at the SEC’s Public Reference Room, 450 Fifth St. N.W., Washington, DC 20549. For more information on the Public Reference Room, call 1-800-SEC-0330.
| Approval of Investment Management Agreement |
On March 4, 2008, the fund’s Board of Directors (Board) unanimously approved the investment advisory contract (Contract) between the fund and its investment manager, T. Rowe Price Associates, Inc. (Manager). The Board considered a variety of factors in connection with its review of the Contract, also taking into account information provided by the Manager during the course of the year, as discussed below:
Services Provided by the Manager
The Board considered the nature, quality, and extent of the services provided to the fund by the Manager. These services included, but were not limited to, management of the fund’s portfolio and a variety of related activities, as well as financial and administrative services, reporting, and communications. The Board also reviewed the background and experience of the Manager’s senior management team and investment personnel involved in the management of the fund. The Board concluded that it was satisfied with the nature, quality, and extent of the services provided by the Manager.
Investment Performance of the Fund
The Board reviewed the fund’s average annual total returns over the one-, three-, and five-year and since-inception periods as well as the fund’s year-by-year returns and compared these returns with previously agreed upon comparable performance measures and market data, including those supplied by Lipper and Morningstar, which are independent providers of mutual fund data. On the basis of this evaluation and the Board’s ongoing review of investment results, the Board concluded that the fund’s performance was satisfactory.
Costs, Benefits, Profits, and Economies of Scale
The Board reviewed detailed information regarding the revenues received by the Manager under the Contract and other benefits that the Manager (and its affiliates) may have realized from its relationship with the fund, including research received under “soft dollar” agreements. The Board noted that soft dollars were not used to pay for third-party, non-broker research. The Board also received information on the estimated costs incurred and profits realized by the Manager and its affiliates from advising T. Rowe Price mutual funds. The Board concluded that the Manager’s profits from advising T. Rowe Price mutual funds were reasonable in light of the services provided to the fund. The Board also considered whether the fund or other funds benefit under the fee levels set forth in the Contract from any economies of scale realized by the Manager. The Board noted that, under the Contract, the fund pays the Manager a single fee based on the fund’s assets and the Manager, in turn, pays all expenses of the fund, with certain exceptions. The Board concluded that, based on the profitability data it reviewed and consistent with this single-fee structure, the Contract provided for a reasonable sharing of benefits from any economies of scale with the fund.
Fees
The Board reviewed the fund’s single-fee structure (for the Investor Class and II Class) and compared the rate with fees and expenses of other comparable funds based on information and data supplied by Lipper. (For these purposes, the Board assumed the management fee was equal to the single fee less the fund’s operating expenses.) The information provided to the Board for the Investor Class indicated that the fund’s management fee rate (including any applicable fee waivers or expenses paid by the Manager or reimbursements by the fund) was below the median for comparable funds and the fund’s expense ratio was above the median for comparable funds. The Board also reviewed the fees and expenses of the fund’s Class II share class, which pays a 12b-1 fee in addition to the single fee, and compared this expense ratio to the fees and expenses of comparable funds. The information provided to the Board for the Class II share class indicated that the management fee rate (including any applicable fee waivers or expenses paid by the Manager or reimbursements by the fund) was at or below the median for comparable funds and the expense ratio was above the median for comparable funds. The Board also reviewed the fee schedules for comparable privately managed accounts of the Manager and its affiliates. Management informed the Board that the Manager’s responsibilities for privately managed accounts are more limited than its responsibilities for the fund and other T. Rowe Price mutual funds that it or its affiliates advise. On the basis of the information provided, the Board concluded that the fees paid by the fund under the Contract were reasonable.
Approval of the Contract
As noted, the Board approved the continuation of the Contract. No single factor was considered in isolation or to be determinative to the decision. Rather, the Board concluded, in light of a weighting and balancing of all factors considered, that it was in the best interests of the fund to approve the continuation of the Contract, including the fees to be charged for services thereunder.
Item 2. Code of Ethics.
A code of ethics, as defined in Item 2 of Form N-CSR, applicable to its principal executive officer, principal financial officer, principal accounting officer or controller, or persons performing similar functions is filed as an exhibit to the registrant’s annual Form N-CSR. No substantive amendments were approved or waivers were granted to this code of ethics during the registrant’s most recent fiscal half-year.
Item 3. Audit Committee Financial Expert.
Disclosure required in registrant’s annual Form N-CSR.
Item 4. Principal Accountant Fees and Services.
Disclosure required in registrant’s annual Form N-CSR.
Item 5. Audit Committee of Listed Registrants.
Not applicable.
Item 6. Investments.
(a) Not applicable. The complete schedule of investments is included in Item 1 of this Form N-CSR.
(b) Not applicable.
Item 7. Disclosure of Proxy Voting Policies and Procedures for Closed-End Management Investment Companies.
Not applicable.
Item 8. Portfolio Managers of Closed-End Management Investment Companies.
Not applicable.
Item 9. Purchases of Equity Securities by Closed-End Management Investment Company and Affiliated Purchasers.
Not applicable.
Item 10. Submission of Matters to a Vote of Security Holders.
Not applicable.
Item 11. Controls and Procedures.
(a) The registrant’s principal executive officer and principal financial officer have evaluated the registrant’s disclosure controls and procedures within 90 days of this filing and have concluded that the registrant’s disclosure controls and procedures were effective, as of that date, in ensuring that information required to be disclosed by the registrant in this Form N-CSR was recorded, processed, summarized, and reported timely.
(b) The registrant’s principal executive officer and principal financial officer are aware of no change in the registrant’s internal control over financial reporting that occurred during the registrant’s second fiscal quarter covered by this report that has materially affected, or is reasonably likely to materially affect, the registrant’s internal control over financial reporting.
Item 12. Exhibits.
(a)(1) The registrant’s code of ethics pursuant to Item 2 of Form N-CSR is filed with the registrant’s annual Form N-CSR.
(2) Separate certifications by the registrant's principal executive officer and principal financial officer, pursuant to Section 302 of the Sarbanes-Oxley Act of 2002 and required by Rule 30a-2(a) under the Investment Company Act of 1940, are attached.
(3) Written solicitation to repurchase securities issued by closed-end companies: not applicable.
(b) A certification by the registrant's principal executive officer and principal financial officer, pursuant to Section 906 of the Sarbanes-Oxley Act of 2002 and required by Rule 30a-2(b) under the Investment Company Act of 1940, is attached.
| | |
SIGNATURES |
| |
| | Pursuant to the requirements of the Securities Exchange Act of 1934 and the Investment |
| Company Act of 1940, the registrant has duly caused this report to be signed on its behalf by the |
| undersigned, thereunto duly authorized. |
| |
| T. Rowe Price Equity Series, Inc. |
| |
| |
| |
| By | /s/ Edward C. Bernard |
| | Edward C. Bernard |
| | Principal Executive Officer |
| |
| Date | August 20, 2008 |
| |
| |
| |
| | Pursuant to the requirements of the Securities Exchange Act of 1934 and the Investment |
| Company Act of 1940, this report has been signed below by the following persons on behalf of |
| the registrant and in the capacities and on the dates indicated. |
| |
| |
| By | /s/ Edward C. Bernard |
| | Edward C. Bernard |
| | Principal Executive Officer |
| |
| Date | August 20, 2008 |
| |
| |
| |
| By | /s/ Gregory K. Hinkle |
| | Gregory K. Hinkle |
| | Principal Financial Officer |
| |
| Date | August 20, 2008 |