| UNITED STATES |
| SECURITIES AND EXCHANGE COMMISSION |
| Washington, D.C. 20549 |
| |
FORM N-CSR |
| |
CERTIFIED SHAREHOLDER REPORT OF REGISTERED |
MANAGEMENT INVESTMENT COMPANIES |
| |
| |
| |
| Investment Company Act File Number: 811-07143 |
|
| |
| T. Rowe Price Equity Series, Inc. |
|
| (Exact name of registrant as specified in charter) |
| |
| 100 East Pratt Street, Baltimore, MD 21202 |
|
| (Address of principal executive offices) |
| |
| David Oestreicher |
| 100 East Pratt Street, Baltimore, MD 21202 |
|
| (Name and address of agent for service) |
| |
| |
| Registrant’s telephone number, including area code: (410) 345-2000 |
| |
| |
| Date of fiscal year end: December 31 |
| |
| |
| Date of reporting period: June 30, 2009 |
Item 1: Report to Shareholders| Equity Income Portfolio | June 30, 2009 |
• A sharp second-quarter rebound in equity prices followed the sell-off that continued into the early months of 2009.
• The fund posted a modest gain for the six-month period ended June 30, 2009. Fund results lagged the broad S&P 500 Index, as some measures of value stocks posted losses during the first half.
• Fund results were buoyed by holdings across various sectors but were restrained by mixed performance in financials and some longtime fund investments.
• There are some indications that the worst may be behind us as federal fiscal initiatives and a supportive monetary policy pave the way for an economic rebound.
The views and opinions in this report were current as of June 30, 2009. They are not guarantees of performance or investment results and should not be taken as investment advice. Investment decisions reflect a variety of factors, and the managers reserve the right to change their views about individual stocks, sectors, and the markets at any time. As a result, the views expressed should not be relied upon as a forecast of the fund’s future investment intent. The report is certified under the Sarbanes-Oxley Act, which requires mutual funds and other public companies to affirm that, to the best of their knowledge, the information in their financial reports is fairly and accurately stated in all material respects.
Manager’s Letter
T. Rowe Price Equity Income Portfolio
Dear Investor
The first six months of the year were extremely tumultuous for investors and consisted of two distinct investment environments. The first couple of months were characterized by a sharp decline, with the S&P 500 Index reaching a cyclical low on March 9. The selling was very much a continuation of the 2008 market downturn, precipitated by the financial crisis and global recession. What followed was a significant market rebound through the end of the second quarter, as the S&P 500 advanced about 40% at its peak from the early March level. Toward the end of June, the rebound began to lose some momentum as investors debated the question of whether the equity market had moved too far too quickly in light of the still-struggling economy.
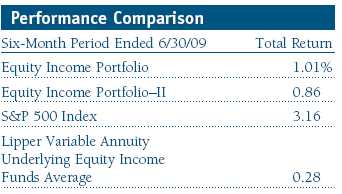
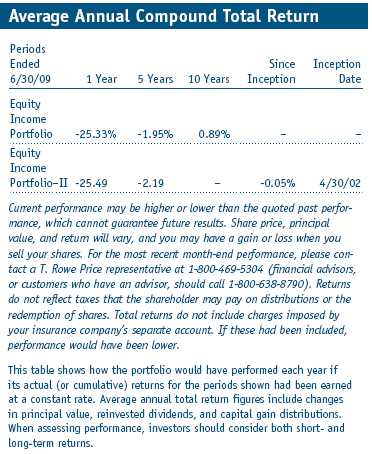
As shown in the Performance Comparison table, your portfolio returned 1.01% compared with 0.28% for the Lipper Variable Annuity Underlying Equity Income Funds Average and 3.16% for the S&P 500 Index. (Performance for the Equity Income Portfolio–II was lower due to its different expense ratio.) The gains came against the backdrop of a dismal 12-month period for stocks overall. We are hopeful that the bulk of the market weakness is behind us. Recent stock market performance suggests that financial markets and the global economy have begun to stabilize and that the investment environment will continue to improve over the remainder of the year.
Dividend Distribution
On June 25, 2009, your portfolio’s Board of Directors declared a second-quarter income dividend of $0.07 per share to shareholders of record on that day. The dividend was paid on June 29. The most recent dividend distribution brings total dividends paid in 2009 to $0.16 per share. (Dividends were slightly lower for the Portfolio–II.)
Portfolio Review

The market’s strength in the second quarter offset first-quarter weakness and put several major equity indexes in positive territory for the first half of 2009. (The widely followed Dow Jones Industrial Average was down slightly, as were several measures of performance for value stocks.) We were happy to see that portfolio performance through most of the second quarter was particularly strong, as investor sentiment improved in response to the better workings of the money and credit markets, as well as to growing anticipation that an end to the economic downturn was finally in sight. While the timing of a sustained upturn in equities is always uncertain, legendary investor Warren Buffett frequently points out that recoveries have always followed sell-offs sooner or later. While this may sound simplistic to some, it is nonetheless true and reflects the incontrovertible fact that both economic and financial market performance is cyclical in nature. While there is no guarantee that this will always be so, it is unwise to ignore the lessons of history.
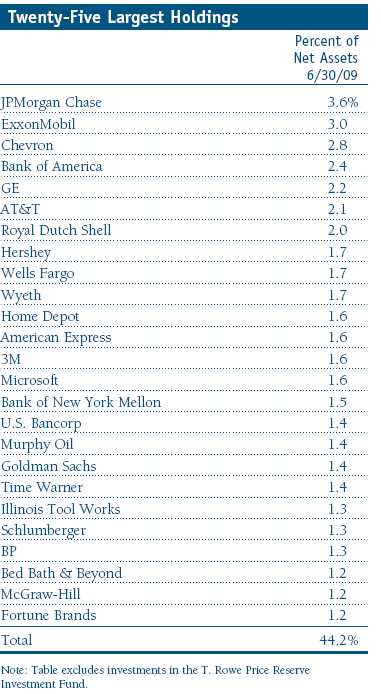
Several crosscurrents affected portfolio performance in the first six months of the year. The S&P 500 Index’s modest gain, notwithstanding the strong advance of the past few months, is testimony to the ebbs and flows of investor expectations. Portfolio performance was buoyed by a number of holdings that generated strong returns. For example, energy equipment and services company Schlumberger, paper and forest products firm International Paper, hotels and leisure company Marriott, consumer finance giant American Express, and capital markets leader Goldman Sachs were particularly notable in assisting portfolio performance. Our investment in pharmaceuticals company Wyeth proved beneficial as Pfizer launched a takeover of the company earlier in the year. (Please refer to the portfolio of investments for a complete listing of holdings and the amount each represents in the portfolio.)
Performance was mixed for our diversified financial services companies, with JPMorgan Chase doing well and Bank of America detracting from portfolio results. While much attention has been focused on the strong rebound of financial services companies, their performance during the entire six-month period left much to be desired. (Financials was the weakest sector in the first quarter and the strongest in the second.) Portfolio performance was also hampered by several of our longstanding investments, including ExxonMobil, GE, and AT&T, all of which posted negative returns for the first six months. One particularly bright spot was our exposure to several leading technology firms. Software leader Microsoft, IT services firm Computer Sciences, Internet software and services company eBay, and semiconductor and semiconductor equipment holding Analog Devices generated healthy returns.
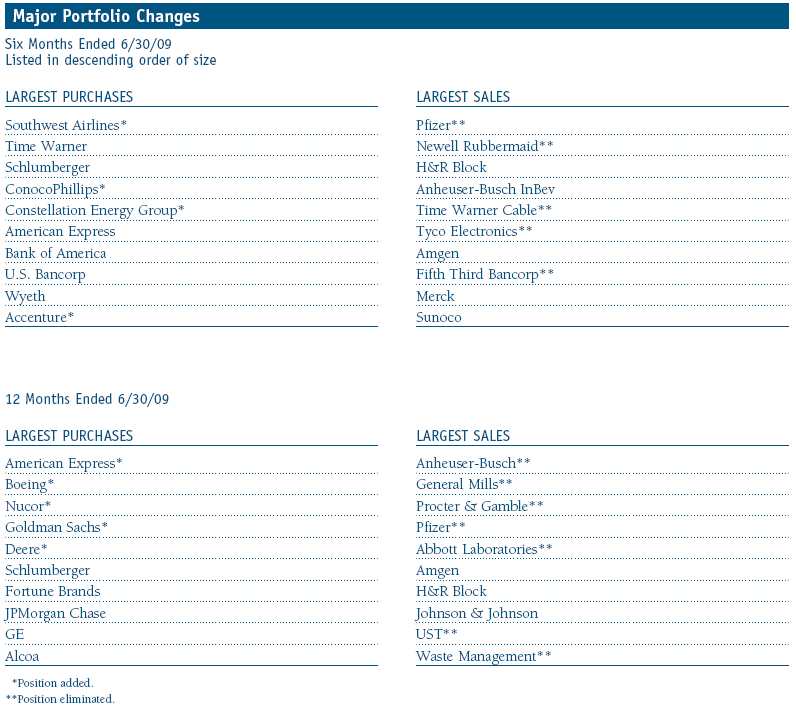
Regarding portfolio activity, the Major Portfolio Changes table following this letter shows many of the companies in which we increased or reduced exposure. It’s worth looking at a few of them to illustrate what we look for in new investments. We seek out interesting valuation opportunities in companies with good competitive positions. The stock price of Southwest Airlines, for example, had fallen for several years as concerns about the economy and fuel costs impaired the company’s results. When conditions begin to improve, however, Southwest will likely enjoy a strong competitive advantage. ConocoPhillips is another example of a company whose stock price fell sharply over the last year and, consequently, sold at an attractive valuation level with a healthy dividend yield. Accenture is a high-quality company operating in the global management consulting, technology services, and outsourcing sphere, whose severe stock price decline created what we believe was a good chance to invest in a company with a strong market position.
The common themes linking many of the portfolio’s additions are cyclicality and exposure to the financial services sector. In addition, we made a new investment in the utilities sector—Constellation Energy Group, which we successfully bought and sold several years ago. Disappointing performance resulted in a sell-off in the company’s share price, lowering it to an attractive valuation level in our view. We continue to believe that companies with earnings cyclicality, operating leverage, and financial exposure will benefit as we transition from economic recession to a period of renewed economic growth.
We reduced our exposure to, or eliminated, companies with more defensive characteristics and questionable earnings reliability, including Pfizer (mentioned earlier), Time Warner Cable, Anheuser-Busch InBev, Amgen, and Merck.
Outlook
We believe that economic and financial market conditions are slowly on the mend. Nonetheless, nothing moves consistently in a steady direction, so it would not be surprising to see some ups and downs in terms of both economic data and stock market movement in the months ahead.
Over the last 18 months, we’ve suffered through one of the most damaging bear markets in history as the global financial crisis exacerbated an already weakened global economy. The credit and money markets ground to a virtual halt, and equity markets plummeted in the wake of Lehman Brothers’ demise, the problems besetting AIG, and the collapse of many other firms that played central roles in the housing and financial crises.
Today, halfway through 2009, the system feels as though it has stabilized. Markets are functioning well. Companies can raise capital by issuing debt and equity securities, and much of the stress is gone from the money markets. There are some indications that the worst is probably behind us. Even the automotive and housing sectors appear to be exhibiting some dim light at the end of the tunnel. We have no way of telling exactly when the economic recovery will occur, but the wide range of federal fiscal initiatives and a supportive monetary policy will ultimately lead to an economic rebound. We believe that the best time to invest is often when the prevailing headwinds are blowing hardest. This has been the case during the past few months, as a significant market rebound lifted stock prices from their earlier lows and rewarded investors who maintained their long-term investment perspectives. We will continue to look for opportunities to invest in solid companies, whose shares are selling at appealing prices.
Once again, we thank you for your continued confidence and support.
Respectfully submitted,

Brian C. Rogers
President of the portfolio and chairman of its Investment Advisory Committee
July 17, 2009
The committee chairman has day-to-day responsibility for managing the portfolio and works with committee members in developing and executing the portfolio’s investment program.
| Risks of Investing in the Portfolio |
Value investors seek to invest in companies whose stock prices are low in relation to their real worth or future prospects. By identifying companies whose stocks are currently out of favor or misunderstood, value investors hope to realize significant appreciation as other investors recognize the stock’s intrinsic value and the price rises accordingly. The value approach carries the risk that the market will not recognize a security’s intrinsic value for a long time, or that a stock judged to be undervalued may actually be appropriately priced.
Lipper index: An index of mutual fund performance returns for specified periods in defined categories as tracked by Lipper Inc.
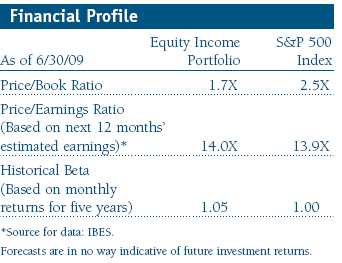
Price/earnings ratio: Calculated by dividing a stock’s market value per share by the company’s earnings per share for the past 12 months or by expected earnings for the coming year.
S&P 500 Index: A market cap-weighted index of 500 widely held stocks often used as a proxy for the overall stock market. Performance is reported on a total return basis.
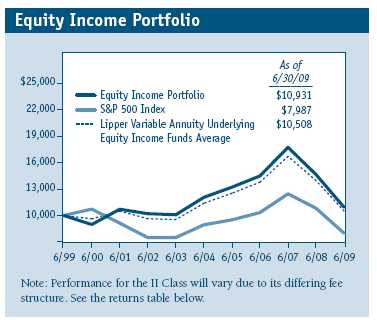
Portfolio Highlights
Portfolio Highlights
Performance and Expenses
T. Rowe Price Equity Income Portfolio
This chart shows the value of a hypothetical $10,000 investment in the fund over the past 10 fiscal year periods or since inception (for funds lacking 10-year records). The result is compared with benchmarks, which may include a broad-based market index and a peer group average or index. Market indexes do not include expenses, which are deducted from fund returns as well as mutual fund averages and indexes.
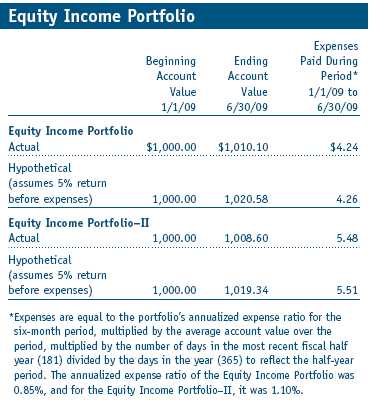
Fund Expense Example
As a mutual fund shareholder, you may incur two types of costs: (1) transaction costs, such as redemption fees or sales loads, and (2) ongoing costs, including management fees, distribution and service (12b-1) fees, and other fund expenses. The following example is intended to help you understand your ongoing costs (in dollars) of investing in the fund and to compare these costs with the ongoing costs of investing in other mutual funds. The example is based on an investment of $1,000 invested at the beginning of the most recent six-month period and held for the entire period.
Shares of the fund are currently offered only through certain insurance companies as an investment medium for both variable annuity contracts and variable life insurance policies. Please note that the fund has two classes of shares: the original share class and II Class. II Class shares are sold through financial intermediaries, which are compensated for distribution, shareholder servicing, and/or certain administrative services under a Board-approved Rule 12b-1 plan.
Actual Expenses
The first line of the following table (“Actual”) provides information about actual account values and actual expenses. You may use the information in this line, together with your account balance, to estimate the expenses that you paid over the period. Simply divide your account value by $1,000 (for example, an $8,600 account value divided by $1,000 = 8.6), then multiply the result by the number in the first line under the heading “Expenses Paid During Period” to estimate the expenses you paid on your account during this period.
Hypothetical Example for Comparison Purposes
The information on the second line of the table (“Hypothetical”) is based on hypothetical account values and expenses derived from the fund’s actual expense ratio and an assumed 5% per year rate of return before expenses (not the fund’s actual return). You may compare the ongoing costs of investing in the fund with other funds by contrasting this 5% hypothetical example and the 5% hypothetical examples that appear in the shareholder reports of the other funds. The hypothetical account values and expenses may not be used to estimate the actual ending account balance or expenses you paid for the period.
You should also be aware that the expenses shown in the table highlight only your ongoing costs and do not reflect any transaction costs, such as redemption fees or sales loads. Therefore, the second line of the table is useful in comparing ongoing costs only and will not help you determine the relative total costs of owning different funds. To the extent a fund charges transaction costs, however, the total cost of owning that fund is higher.
Financial Highlights
T. Rowe Price Equity Income Portfolio
(Unaudited)

The accompanying notes are an integral part of these financial statements.
Financial Highlights
T. Rowe Price Equity Income Portfolio
(Unaudited)

The accompanying notes are an integral part of these financial statements.
Portfolio of Investments ‡
T. Rowe Price Equity Income Portfolio
June 30, 2009 (Unaudited)
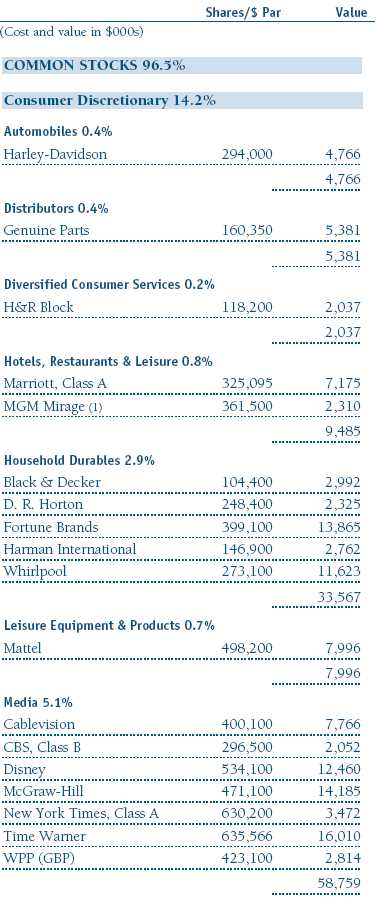
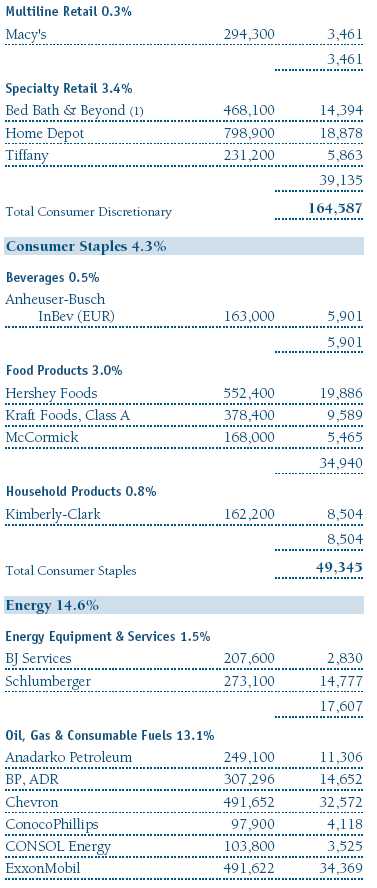
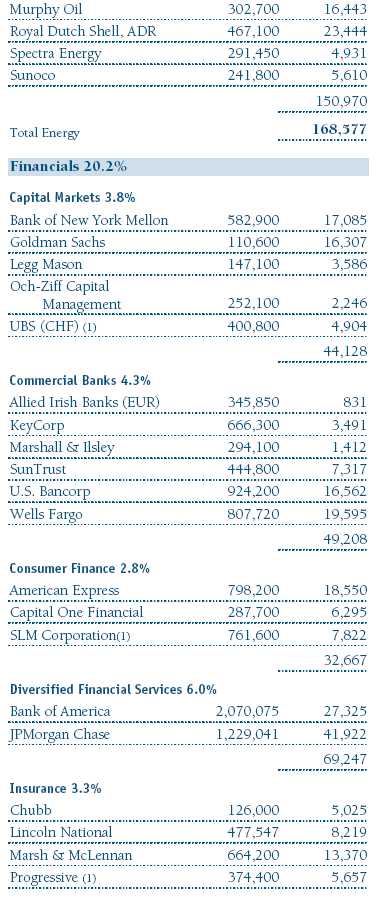
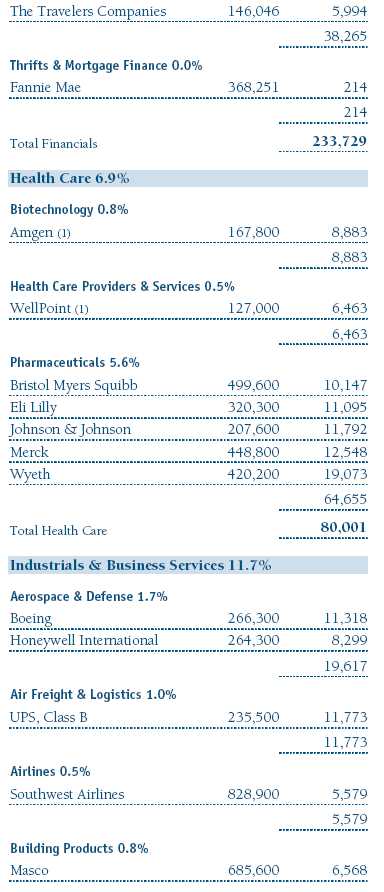
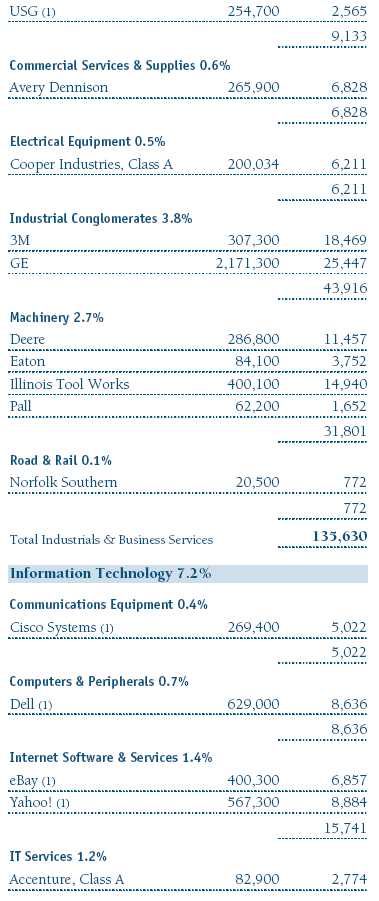
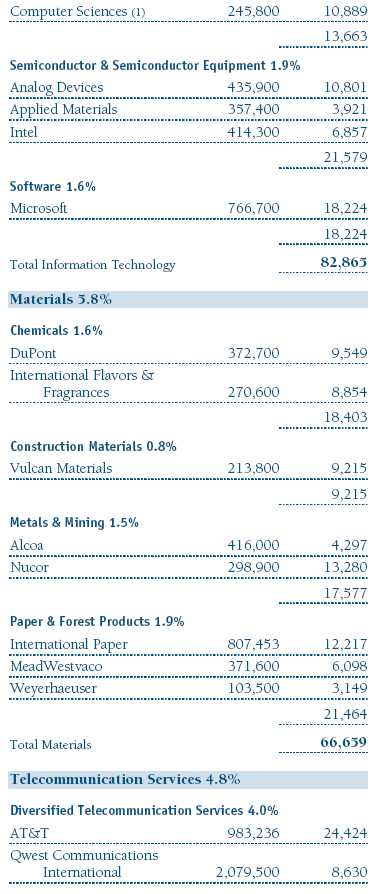

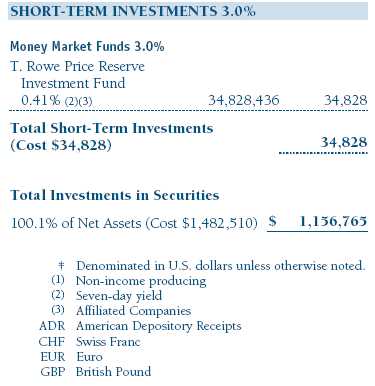
The accompanying notes are an integral part of these financial statements.
Statement of Assets and Liabilities
T. Rowe Price Equity Income Portfolio
June 30, 2009 (Unaudited)
($000s, except shares and per share amounts)
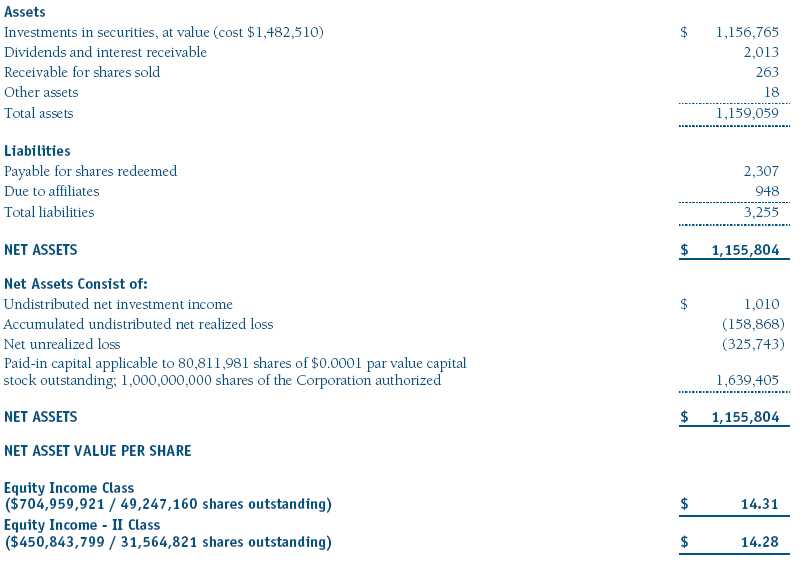
The accompanying notes are an integral part of these financial statements.
Statement of Operations
T. Rowe Price Equity Income Portfolio
(Unaudited)
($000s)
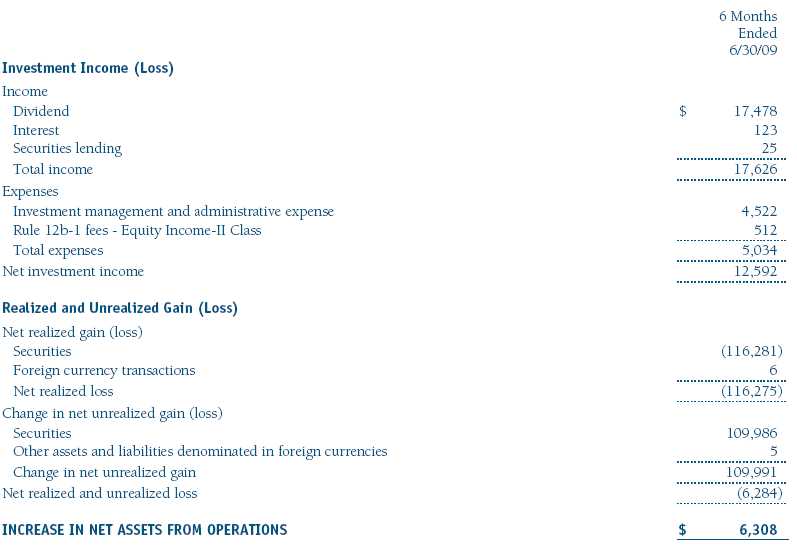
The accompanying notes are an integral part of these financial statements.
Statement of Changes in Net Assets
T. Rowe Price Equity Income Portfolio
(Unaudited)
($000s)
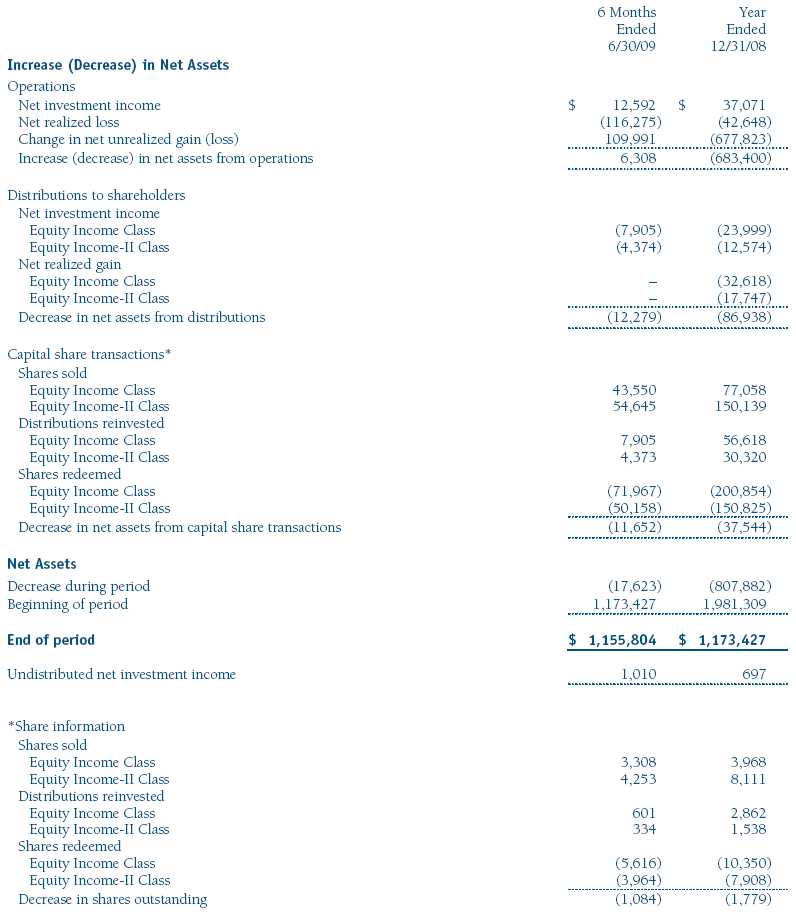
The accompanying notes are an integral part of these financial statements.
Notes to Financial Statements
T. Rowe Price Equity Income Portfolio
June 30, 2009 (Unaudited)
T. Rowe Price Equity Series, Inc. (the corporation), is registered under the Investment Company Act of 1940 (the 1940 Act). The Equity Income Portfolio (the fund) is a diversified, open-end management investment company and is one portfolio established by the corporation. The fund seeks to provide substantial dividend income as well as long-term growth of capital through investments in the common stocks of established companies. Shares of the fund currently are offered only through certain insurance companies as an investment medium for both variable annuity contracts and variable life insurance policies. The fund has two classes of shares: the Equity Income Portfolio original share class (Equity Income Class), offered since March 31, 1994, and Equity Income Portfolio–II (Equity Income-II Class), offered since April 30, 2002. Equity Income–II Class shares are sold through financial intermediaries, which it compensates for distribution, shareholder servicing, and/or certain administrative services under a Board-approved Rule 12b-1 plan. Each class has exclusive voting rights on matters related solely to that class, separate voting rights on matters that relate to both classes, and, in all other respects, the same rights and obligations as the other class.
NOTE 1 - SIGNIFICANT ACCOUNTING POLICIES
Basis of Preparation The accompanying financial statements were prepared in accordance with accounting principles generally accepted in the United States of America, which require the use of estimates made by fund management. Fund management believes that estimates and security valuations are appropriate; however, actual results may differ from those estimates, and the security valuations reflected in the financial statements may differ from the value the fund ultimately realizes upon sale of the securities. Further, fund management believes no events have occurred between June 30, 2009 and August 20, 2009, the date of issuance of the financial statements, that require adjustment of, or disclosure in, the accompanying financial statements.
Investment Transactions, Investment Income, and Distributions Income and expenses are recorded on the accrual basis. Premiums and discounts on debt securities are amortized for financial reporting purposes. Dividends received from mutual fund investments are reflected as dividend income; capital gain distributions are reflected as realized gain/loss. Dividend income and capital gain distributions are recorded on the ex-dividend date. Income tax-related interest and penalties, if incurred, would be recorded as income tax expense. Investment transactions are accounted for on the trade date. Realized gains and losses are reported on the identified cost basis. Distributions to shareholders are recorded on the ex-dividend date. Income distributions are declared and paid by each class on a quarterly basis. Capital gain distributions, if any, are declared and paid by the fund, typically on an annual basis.
Currency Translation Assets, including investments, and liabilities denominated in foreign currencies are translated into U.S. dollar values each day at the prevailing exchange rate, using the mean of the bid and asked prices of such currencies against U.S. dollars as quoted by a major bank. Purchases and sales of securities, income, and expenses are translated into U.S. dollars at the prevailing exchange rate on the date of the transaction. The effect of changes in foreign currency exchange rates on realized and unrealized security gains and losses is reflected as a component of security gains and losses.
Class Accounting Equity Income–II pays distribution, shareholder servicing, and/or certain administrative expenses in the form of Rule 12b-1 fees, in an amount not exceeding 0.25% of the class’s average daily net assets. Investment income, investment management and administrative expense, and realized and unrealized gains and losses are allocated to the classes based upon the relative daily net assets of each class.
Rebates Subject to best execution, the fund may direct certain security trades to brokers who have agreed to rebate a portion of the related brokerage commission to the fund in cash. Commission rebates are reflected as realized gain on securities in the accompanying financial statements and totaled $7,000 for the six months ended June 30, 2009.
New Accounting Pronouncement On January 1, 2009, the fund adopted Statement of Financial Accounting Standards No. 161 (FAS 161), Disclosures about Derivative Instruments and Hedging Activities. FAS 161 requires enhanced disclosures about derivative and hedging activities, including how such activities are accounted for and their effect on financial position, performance and cash flows. Adoption of FAS 161 had no impact on the fund’s net assets or results of operations.
NOTE 2 - VALUATION
The fund’s investments are reported at fair value as defined under Statement of Financial Accounting Standards No. 157 (FAS 157), Fair Value Measurements. The fund values its investments and computes its net asset value per share at the close of the New York Stock Exchange (NYSE), normally 4 p.m. ET, each day that the NYSE is open for business.
Valuation Methods Equity securities listed or regularly traded on a securities exchange or in the over-the-counter (OTC) market are valued at the last quoted sale price or, for certain markets, the official closing price at the time the valuations are made, except for OTC Bulletin Board securities, which are valued at the mean of the latest bid and asked prices. A security that is listed or traded on more than one exchange is valued at the quotation on the exchange determined to be the primary market for such security. Listed securities not traded on a particular day are valued at the mean of the latest bid and asked prices for domestic securities and the last quoted sale price for international securities.
Debt securities are generally traded in the OTC market. Securities with remaining maturities of one year or more at the time of acquisition are valued at prices furnished by dealers who make markets in such securities or by an independent pricing service, which considers the yield or price of bonds of comparable quality, coupon, maturity, and type, as well as prices quoted by dealers who make markets in such securities. Securities with remaining maturities of less than one year at the time of acquisition generally use amortized cost in local currency to approximate fair value. However, if amortized cost is deemed not to reflect fair value or the fund holds a significant amount of such securities with remaining maturities of more than 60 days, the securities are valued at prices furnished by dealers who make markets in such securities or by an independent pricing service.
Investments in mutual funds are valued at the mutual fund’s closing net asset value per share on the day of valuation.
Other investments, including restricted securities, and those for which the above valuation procedures are inappropriate or are deemed not to reflect fair value are stated at fair value as determined in good faith by the T. Rowe Price Valuation Committee, established by the fund’s Board of Directors.
For valuation purposes, the last quoted prices of non-U.S. equity securities may be adjusted under the circumstances described below. If the fund determines that developments between the close of a foreign market and the close of the NYSE will, in its judgment, materially affect the value of some or all of its portfolio securities, the fund will adjust the previous closing prices to reflect what it believes to be the fair value of the securities as of the close of the NYSE. In deciding whether it is necessary to adjust closing prices to reflect fair value, the fund reviews a variety of factors, including developments in foreign markets, the performance of U.S. securities markets, and the performance of instruments trading in U.S. markets that represent foreign securities and baskets of foreign securities. A fund may also fair value securities in other situations, such as when a particular foreign market is closed but the fund is open. The fund uses outside pricing services to provide it with closing prices and information to evaluate and/or adjust those prices. The fund cannot predict how often it will use closing prices and how often it will determine it necessary to adjust those prices to reflect fair value. As a means of evaluating its security valuation process, the fund routinely compares closing prices, the next day’s opening prices in the same markets, and adjusted prices.
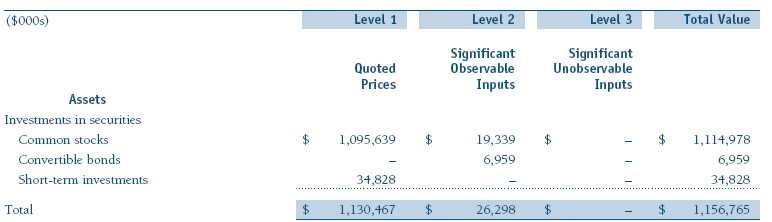
Valuation Inputs Various inputs are used to determine the value of the fund’s investments. These inputs are summarized in the three broad levels listed below:
Level 1 – quoted prices in active markets for identical securities
Level 2 – observable inputs other than Level 1 quoted prices (including, but not limited to, quoted prices for similar securities, interest rates, prepayment speeds, credit risk)
Level 3 – unobservable inputs
Observable inputs are those based on market data obtained from sources independent of the fund, and unobservable inputs reflect the fund’s own assumptions based on the best information available. The input levels are not necessarily an indication of the risk or liquidity associated with investments at that level. For example, non-U.S. equity securities actively traded in foreign markets generally are reflected in Level 2 despite the availability of closing prices because the fund evaluates and determines whether those closing prices reflect fair value at the close of the NYSE or require adjustment, as described above. The following table summarizes the fund’s investments, based on the inputs used to determine their values on June 30, 2009:
NOTE 3 - OTHER INVESTMENT TRANSACTIONS
Consistent with its investment objective, the fund engages in the following practices to manage exposure to certain risks or to enhance performance. The investment objective, policies, program, and risk factors of the fund are described more fully in the fund’s prospectus and Statement of Additional Information.
Securities Lending The fund lends its securities to approved brokers to earn additional income. It receives as collateral cash and U.S. government securities valued at 102% to 105% of the value of the securities on loan. Cash collateral is invested by the fund’s lending agent(s) in accordance with investment guidelines approved by fund management. Although risk is mitigated by the collateral, the fund could experience a delay in recovering its securities and a possible loss of income or value if the borrower fails to return the securities or if collateral investments decline in value. Securities lending revenue recognized by the fund consists of earnings on invested collateral and borrowing fees, net of any rebates to the borrower and compensation to the lending agent. At June 30, 2009, there were no securities on loan.
Other Purchases and sales of portfolio securities other than short-term securities aggregated $82,171,000 and $80,370,000, respectively, for the six months ended June 30, 2009.
NOTE 4 - FEDERAL INCOME TAXES
No provision for federal income taxes is required since the fund intends to continue to qualify as a regulated investment company under Subchapter M of the Internal Revenue Code and distribute to shareholders all of its taxable income and gains. Distributions are determined in accordance with Federal income tax regulations, which differ from generally accepted accounting principles, and, therefore, may differ in amount or character from net investment income and realized gains for financial reporting purposes. Financial reporting records are adjusted for permanent book/tax differences to reflect tax character but are not adjusted for temporary differences. The amount and character of tax-basis distributions and composition of net assets are finalized at fiscal year-end; accordingly, tax-basis balances have not been determined as of June 30, 2009.
In accordance with federal tax regulations, the fund deferred recognition of certain capital loss amounts previously recognized in the prior fiscal year for financial reporting purposes until the current fiscal period for tax purposes. Such deferrals amounted to $18,864,000 and related to net capital losses realized between November 1 and the fund’s fiscal year-end date. Further, the fund intends to retain realized gains to the extent of available capital loss carryforwards. As of December 31, 2008, the fund had $15,688,000 of unused capital loss carryforwards, all of which expire in fiscal 2016.
At June 30, 2009, the cost of investments for federal income tax purposes was $1,482,510,000. Net unrealized loss aggregated $325,743,000 at period-end, of which $82,516,000 related to appreciated investments and $408,259,000 related to depreciated investments.
NOTE 5 - RELATED PARTY TRANSACTIONS
The fund is managed by T. Rowe Price Associates, Inc. (the manager or Price Associates), a wholly owned subsidiary of T. Rowe Price Group, Inc. The investment management and administrative agreement between the fund and the manager provides for an all-inclusive annual fee equal to 0.85% of the fund’s average daily net assets. The fee is computed daily and paid monthly. The agreement provides that investment management, shareholder servicing, transfer agency, accounting, custody services, and directors’ fees and expenses are provided to the fund, and interest, taxes, brokerage commissions, and extraordinary expenses are paid directly by the fund.
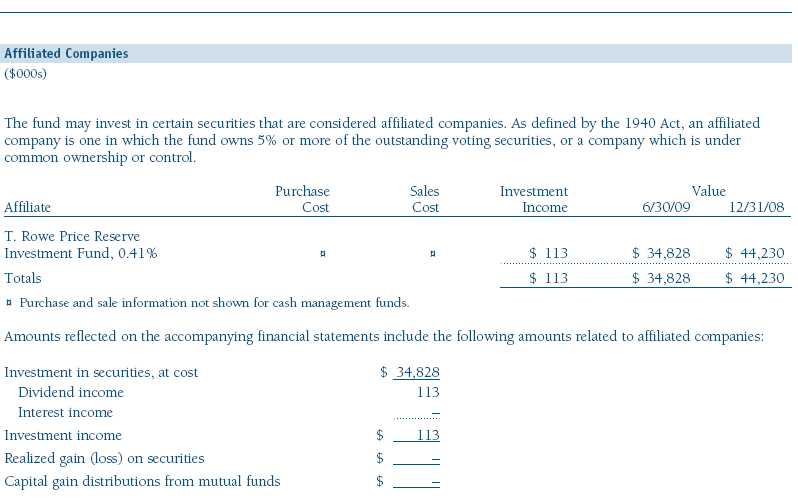
The fund may invest in the T. Rowe Price Reserve Investment Fund and the T. Rowe Price Government Reserve Investment Fund (collectively, the T. Rowe Price Reserve Investment Funds), open-end management investment companies managed by Price Associates and considered affiliates of the fund. The T. Rowe Price Reserve Investment Funds are offered as cash management options to mutual funds, trusts, and other accounts managed by Price Associates and/or its affiliates and are not available for direct purchase by members of the public. The T. Rowe Price Reserve Investment Funds pay no investment management fees.
| Information on Proxy Voting Policies, Procedures, and Records |
A description of the policies and procedures used by T. Rowe Price funds and portfolios to determine how to vote proxies relating to portfolio securities is available in each fund’s Statement of Additional Information, which you may request by calling 1-800-225-5132 or by accessing the SEC’s Web site, www.sec.gov. The description of our proxy voting policies and procedures is also available on our Web site, www.troweprice.com. To access it, click on the words “Our Company” at the top of our corporate homepage. Then, when the next page appears, click on the words “Proxy Voting Policies” on the left side of the page.
Each fund’s most recent annual proxy voting record is available on our Web site and through the SEC’s Web site. To access it through our Web site, follow the directions above, then click on the words “Proxy Voting Records” on the right side of the Proxy Voting Policies page.
| How to Obtain Quarterly Portfolio Holdings |
The fund files a complete schedule of portfolio holdings with the Securities and Exchange Commission for the first and third quarters of each fiscal year on Form N-Q. The fund’s Form N-Q is available electronically on the SEC’s Web site (www.sec.gov); hard copies may be reviewed and copied at the SEC’s Public Reference Room, 450 Fifth St. N.W., Washington, DC 20549. For more information on the Public Reference Room, call 1-800-SEC-0330.
| Approval of Investment Management Agreement |
On March 10, 2009, the fund’s Board of Directors (Board) unanimously approved the investment advisory contract (Contract) between the fund and its investment manager, T. Rowe Price Associates, Inc. (Manager). The Board considered a variety of factors in connection with its review of the Contract, also taking into account information provided by the Manager during the course of the year, as discussed below:
Services Provided by the Manager
The Board considered the nature, quality, and extent of the services provided to the fund by the Manager. These services included, but were not limited to, management of the fund’s portfolio and a variety of related activities, as well as financial and administrative services, reporting, and communications. The Board also reviewed the background and experience of the Manager’s senior management team and investment personnel involved in the management of the fund. The Board concluded that it was satisfied with the nature, quality, and extent of the services provided by the Manager.
Investment Performance of the Fund
The Board reviewed the fund’s average annual total returns over the 1-, 3-, 5-, and 10-year periods as well as the fund’s year-by-year returns and compared these returns with previously agreed upon comparable performance measures and market data, including those supplied by Lipper and Morningstar, which are independent providers of mutual fund data. On the basis of this evaluation and the Board’s ongoing review of investment results, and factoring in the severity of the market turmoil in 2008, the Board concluded that the fund’s performance was satisfactory.
Costs, Benefits, Profits, and Economies of Scale
The Board reviewed detailed information regarding the revenues received by the Manager under the Contract and other benefits that the Manager (and its affiliates) may have realized from its relationship with the fund, including research received under “soft dollar” agreements. The Board noted that soft dollars were not used to pay for third-party, non-broker research during 2008. The Board also received information on the estimated costs incurred and profits realized by the Manager and its affiliates from advising T. Rowe Price mutual funds, as well as estimates of the gross profits realized from managing the fund in particular. The Board concluded that the Manager’s profits were reasonable in light of the services provided to the fund. The Board also considered whether the fund or other funds benefit under the fee levels set forth in the Contract from any economies of scale realized by the Manager. The Board noted that, under the Contract, the fund pays the Manager a single fee based on the fund’s assets and the Manager, in turn, pays all expenses of the fund, with certain exceptions. The Board concluded that, based on the profitability data it reviewed and consistent with this single-fee structure, the Contract provided for a reasonable sharing of benefits from any economies of scale with the fund.
Fees
The Board reviewed the fund’s single-fee structure and compared the rate with fees and expenses of other comparable funds based on information and data supplied by Lipper. (For these purposes, the Board assumed the management fee rate was equal to the single fee less the fund’s operating expenses.) The information provided to the Board indicated that the fund’s management fee rate was above the median for comparable funds and the expense ratio was at or below the median for comparable funds. The Board also reviewed the fees and expenses of the fund’s II Class share class, which pays a 12b-1 fee in addition to the single fee, and compared the rate (also after assuming the management fee rate was equal to the single fee less the fund’s operating expenses) with the fees and expenses of comparable funds. The information provided to the Board indicated that the management fee rate and expense ratio for the II Class were above the median for comparable funds. The Board also reviewed the fee schedules for comparable privately managed accounts of the Manager and its affiliates. Management informed the Board that the Manager’s responsibilities for privately managed accounts are more limited than its responsibilities for the fund and other T. Rowe Price mutual funds that it or its affiliates advise. On the basis of the information provided, the Board concluded that the fees paid by the fund under the Contract were reasonable.
Approval of the Contract
As noted, the Board approved the continuation of the Contract. No single factor was considered in isolation or to be determinative to the decision. Rather, the Board concluded, in light of a weighting and balancing of all factors considered, that it was in the best interests of the fund to approve the continuation of the Contract, including the fees to be charged for services thereunder.
Item 2. Code of Ethics.
A code of ethics, as defined in Item 2 of Form N-CSR, applicable to its principal executive officer, principal financial officer, principal accounting officer or controller, or persons performing similar functions is filed as an exhibit to the registrant’s annual Form N-CSR. No substantive amendments were approved or waivers were granted to this code of ethics during the registrant’s most recent fiscal half-year.
Item 3. Audit Committee Financial Expert.
Disclosure required in registrant’s annual Form N-CSR.
Item 4. Principal Accountant Fees and Services.
Disclosure required in registrant’s annual Form N-CSR.
Item 5. Audit Committee of Listed Registrants.
Not applicable.
Item 6. Investments.
(a) Not applicable. The complete schedule of investments is included in Item 1 of this Form N-CSR.
(b) Not applicable.
Item 7. Disclosure of Proxy Voting Policies and Procedures for Closed-End Management Investment Companies.
Not applicable.
Item 8. Portfolio Managers of Closed-End Management Investment Companies.
Not applicable.
Item 9. Purchases of Equity Securities by Closed-End Management Investment Company and Affiliated Purchasers.
Not applicable.
Item 10. Submission of Matters to a Vote of Security Holders.
Not applicable.
Item 11. Controls and Procedures.
(a) The registrant’s principal executive officer and principal financial officer have evaluated the registrant’s disclosure controls and procedures within 90 days of this filing and have concluded that the registrant’s disclosure controls and procedures were effective, as of that date, in ensuring that information required to be disclosed by the registrant in this Form N-CSR was recorded, processed, summarized, and reported timely.
(b) The registrant’s principal executive officer and principal financial officer are aware of no change in the registrant’s internal control over financial reporting that occurred during the registrant’s second fiscal quarter covered by this report that has materially affected, or is reasonably likely to materially affect, the registrant’s internal control over financial reporting.
Item 12. Exhibits.
(a)(1) The registrant’s code of ethics pursuant to Item 2 of Form N-CSR is filed with the registrant’s annual Form N-CSR.
(2) Separate certifications by the registrant's principal executive officer and principal financial officer, pursuant to Section 302 of the Sarbanes-Oxley Act of 2002 and required by Rule 30a-2(a) under the Investment Company Act of 1940, are attached.
(3) Written solicitation to repurchase securities issued by closed-end companies: not applicable.
(b) A certification by the registrant's principal executive officer and principal financial officer, pursuant to Section 906 of the Sarbanes-Oxley Act of 2002 and required by Rule 30a-2(b) under the Investment Company Act of 1940, is attached.
| | |
SIGNATURES |
| |
| | Pursuant to the requirements of the Securities Exchange Act of 1934 and the Investment |
| Company Act of 1940, the registrant has duly caused this report to be signed on its behalf by the |
| undersigned, thereunto duly authorized. |
| |
| T. Rowe Price Equity Series, Inc. |
| |
| |
| |
| By | /s/ Edward C. Bernard |
| | Edward C. Bernard |
| | Principal Executive Officer |
| |
| Date | August 20, 2009 |
| |
| |
| |
| | Pursuant to the requirements of the Securities Exchange Act of 1934 and the Investment |
| Company Act of 1940, this report has been signed below by the following persons on behalf of |
| the registrant and in the capacities and on the dates indicated. |
| |
| |
| By | /s/ Edward C. Bernard |
| | Edward C. Bernard |
| | Principal Executive Officer |
| |
| Date | August 20, 2009 |
| |
| |
| |
| By | /s/ Gregory K. Hinkle |
| | Gregory K. Hinkle |
| | Principal Financial Officer |
| |
| Date | August 20, 2009 |