| UNITED STATES |
| SECURITIES AND EXCHANGE COMMISSION |
| Washington, D.C. 20549 |
| |
FORM N-CSR |
| |
CERTIFIED SHAREHOLDER REPORT OF REGISTERED |
MANAGEMENT INVESTMENT COMPANIES |
| |
| |
| |
| Investment Company Act File Number: 811-07143 |
|
| |
| T. Rowe Price Equity Series, Inc. |
|
| (Exact name of registrant as specified in charter) |
| |
| 100 East Pratt Street, Baltimore, MD 21202 |
|
| (Address of principal executive offices) |
| |
| David Oestreicher |
| 100 East Pratt Street, Baltimore, MD 21202 |
|
| (Name and address of agent for service) |
| |
| |
| Registrant’s telephone number, including area code: (410) 345-2000 |
| |
| |
| Date of fiscal year end: December 31 |
| |
| |
| Date of reporting period: June 30, 2008 |
Item 1: Report to Shareholders| Personal Strategy Balanced Portfolio | June 30, 2008 |
The views and opinions in this report were current as of June 30, 2008. They are not guarantees of performance or investment results and should not be taken as investment advice. Investment decisions reflect a variety of factors, and the managers reserve the right to change their views about individual stocks, sectors, and the markets at any time. As a result, the views expressed should not be relied upon as a forecast of the fund’s future investment intent. The report is certified under the Sarbanes-Oxley Act, which requires mutual funds and other public companies to affirm that, to the best of their knowledge, the information in their financial reports is fairly and accurately stated in all material respects.
Manager’s Letter
T. Rowe Price Personal Strategy Balanced Portfolio
Dear Investor
A weakening U.S. economy and turmoil in global financial markets drove equity markets lower for the six-month period ended June 30, 2008. Much of the loss came from weak U.S. equity market performance early in the year and again at the end of the reporting period. Internationally, equities in developed and emerging markets have struggled since November. Investment-grade bonds, especially Treasury securities, performed well in both periods, as investors fled to relatively safe havens after financial institutions reported massive mortgage-related losses and significantly curtailed lending. The Federal Reserve slashed short-term interest rates and took other extraordinary actions in an attempt to encourage lending, increase liquidity, and keep credit market distress from pushing the economy into a recession. The turbulence in the equity and fixed-income markets since the beginning of the year led to weak results for the Personal Strategy Balanced Portfolio during the six-month period ended June 30, 2008.
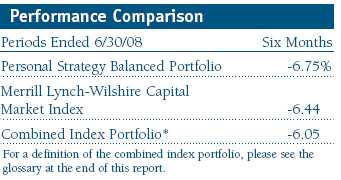
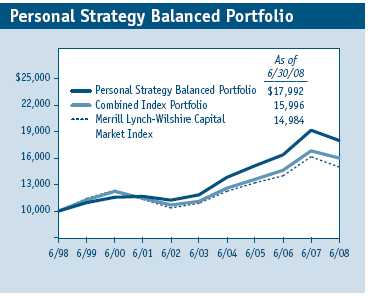
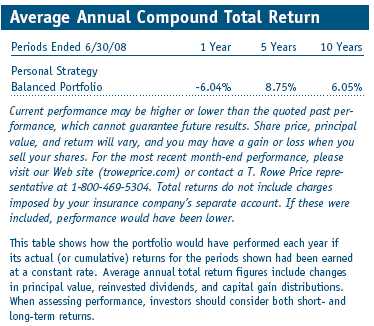
The Personal Strategy Balanced Portfolio posted a loss for the six-month period ended June 30, 2008, as shown in the table. The portfolio slightly underperformed the combined index portfolio and the Merrill Lynch-Wilshire Capital Market Index.
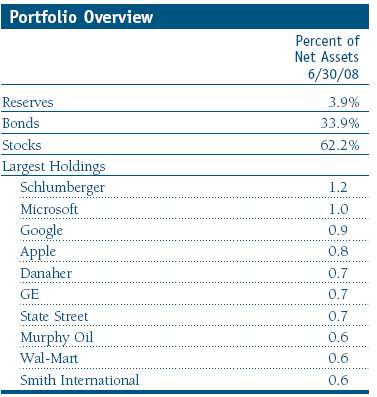
We continue to underweight fixed income in favor of equities. The portfolio’s cash and fixed-income target allocation ended the reporting period at 35%, less than our neutral level of 40%. We maintain a relatively heavier stock allocation, with a 65% targeted equity allocation compared with a neutral weighting of 60%. Among the stocks, we maintain an underweight to small-caps and favor large-cap growth names. Over the last six months, we reduced the target allocation to U.S. equity holdings of large-cap growth, large-cap value, and small-cap stocks, in order to add to our holdings of international stocks.
• Concerns about global credit markets, higher oil prices, and a weaker U.S. economy created volatile conditions in stock and bond markets. Stocks lost ground but bonds were able to hold their own during the first half of the year.
• The Personal Strategy Balanced Portfolio posted weak results during the six-month period ended June 30, 2008.
• The economy and corporate profits are likely to grow at a slower pace for the remainder of the year, but we believe our disciplined strategy, broad diversification across asset classes, and long-term focus positions us well regardless of short-term economic or market conditions.
Market Environment
Economic growth has slowed dramatically since last summer. The economy expanded at an annualized rate of 1.0% in the first quarter of 2008, following an anemic growth of 0.6% in the last quarter of 2007. The housing market continued to deteriorate, and total employment fell during the first few months of the year. In addition, output in manufacturing and services sectors showed little or no growth, and inflation eroded consumers’ purchasing power. As a result, the economy may be headed toward or be in a recession—popularly defined as two consecutive quarters of negative gross domestic product (GDP) growth.
In response to turmoil in the credit markets generated by subprime mortgage losses and the curtailing of lending among financial institutions, the Federal Reserve took several extraordinary actions to boost market liquidity. It created new credit facilities that allow investment banks and broker-dealers to borrow directly from its discount window and helped facilitate J.P. Morgan’s purchase of Bear Stearns in an effort to stabilize financial markets and restore confidence on Wall Street. The central bank also aggressively cut the fed funds target rate—an interbank lending rate that banks also use as a benchmark for their prime consumer lending rates—to 2.00% by the end of April.
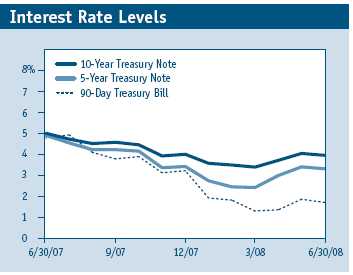
As shown in the graph, Treasury bill yields—which tend to track the federal funds target rate—and intermediate-term Treasury note yields have fallen sharply since last autumn. Long-term yields fell to a lesser extent, reflecting investor concerns about elevated inflation. As a result, the Treasury yield curve, a graphic depiction of the relationship between the yields and maturities of government bonds, steepened significantly compared with a year ago when it was essentially flat.
U.S. stocks declined over the last six months in response to weaker consumer activity and corporate profit growth. Surging food and commodity prices, tighter lending conditions, mortgage-related losses, and the continuing downturn in housing also weighed on investor sentiment. Small-cap shares held up better than large-caps, but large-cap growth stocks held up much better than large-cap value stocks.
Domestic bonds produced mostly positive returns, but certain sectors—high yield, investment-grade corporates, and asset-backed securities posted losses. The slowing economy and credit market turmoil prompted investors to flee to the relative safety of the Treasury market. As a result, U.S. government securities were the best-performing fixed-income sector. In the last six months, shorter- and intermediate-term Treasury securities led with moderate gains.
International stocks declined in the last six months. Developed markets as a group declined, though the strength of foreign currencies relative to the U.S. dollar helped the performance of non-U.S. equities in dollar terms. Overseas, developed and emerging markets lost ground in the first half of the year, but the developed markets held up better than emerging.
Performance and Strategy Review
The Personal Strategy Balanced Portfolio’s investment objective is to generate the highest total return consistent with an equal emphasis on income and capital appreciation. The typical asset mix of securities is 60% stocks, 30% bonds, and 10% cash, although allocations can vary by as much as 10 percentage points above or below these levels.
A year ago, we announced that we would be making two changes to the Personal Strategy Balanced Portfolio’s overall composition. First, we increased the neutral allocation to international equities. After considerable analysis, the T. Rowe Price Asset Allocation Committee decided to increase non-U.S. equity exposure to better reflect the growing share of non-U.S. markets within the global investment universe. Developed and emerging non-U.S. equity markets have increased their share of the total global equity market in recent years, and companies in these markets have become more significant contributors to global earnings growth.
Second, we also added a dedicated emerging markets stock allocation to the portfolio by investing a portion of our international equity holdings in the T. Rowe Price Institutional Emerging Markets Equity Fund. Our analysis determined that the capitalization of emerging markets has grown to the point where it represents a significant portion of the total global equity market and an important investment opportunity. The Asset Allocation Committee concluded that the growing importance of emerging markets stocks over the long term warranted direct allocation to this asset class.
During the last six months, we completed the changes needed to reach our targeted international and emerging markets allocations. We changed the U.S. and the non-U.S. equities index in our combined index portfolio (which is defined in the glossary) on July 1, 2008, to better reflect the asset classes in which we are investing. The Russell 3000 Index replaced the Wilshire 5000 Total Market Index as the representative benchmark for our domestic equities allocation because we feel it is a better representation of the available U.S. equity opportunity set. For our overseas investments, we replaced the MSCI EAFE Index with the MSCI All Country World ex U.S. Index because it includes developed and emerging markets, making it a better broad representation of the international equities asset class.
In the Personal Strategy Balanced Portfolio, economic fundamentals and market conditions drive allocation changes among the asset classes. Allocations can vary by 10 percentage points above or below the neutral weightings that have been established, and the T. Rowe Price Asset Allocation Committee meets monthly to adjust the weightings of stocks, bonds, and money market securities within the appropriate ranges.
While there is considerable uncertainty about the direction of the U.S. economy at present, we have increased our overweight to equities based on attractive valuations and the potential of an economic impact from lower interest rates and fiscal stimulus. With bonds outperforming stocks during the last six-month and one-year periods, this emphasis on stocks hurt performance.
Within U.S. equities, we are overweighting large-cap growth and underweighting large-cap value as relative valuations and the outlook for earnings growth favor the growth sector, particularly large-cap growth. In a lower growth environment, large-cap growth companies that can offer consistent earnings growth should command a premium as many companies report slowing rates of growth. We are underweight in small-caps as valuations remain rich relative to large-caps. Earnings growth for large-cap stocks relative to small-cap stocks should further benefit from greater exposure to faster growing regions outside the U.S.
Although stock returns for most categories were negative during the six-month period, the higher exposure to growth stocks helped returns as growth stocks generally outperformed value stocks. While we maintain a strong overweight in large-cap growth relative to large-cap value, we have moderated the strength of our view. Our overweight in large-cap stocks relative to small-caps detracted from performance, as large-caps trailed small-cap stocks during the six-month period.
Over the last six months, international equities modestly trailed U.S. stocks. The portfolio maintained a neutral allocation to international stocks, but the portfolio’s selection of international stocks underperformed the MSCI EAFE Index. Valuations are reasonable in developed international markets, but stronger currencies are likely to impede earnings growth for many export-oriented non-U.S. companies.
A year ago, we began investing in the T. Rowe Price Institutional International Bond Fund to gain exposure more efficiently to the non-U.S. fixed-income market. Investing through the fund offers a more diversified exposure to the nondollar fixed-income market than our previous practice of buying individual issues. (Of course, diversification cannot assure a profit or protect against a loss in a declining market.) Our allocation to the sector was a positive contributor to portfolio performance over the six-month period, as non-U.S. dollar bonds benefited from a strengthening of foreign currencies relative to the U.S. dollar in both periods.
We are underweighting high-yield bonds relative to investment-grade bonds as fundamental and technical factors for the sector prove more challenging in 2008. High-yield spreads have widened year-to-date, reflecting expectations for a significant increase in defaults from historically low levels.
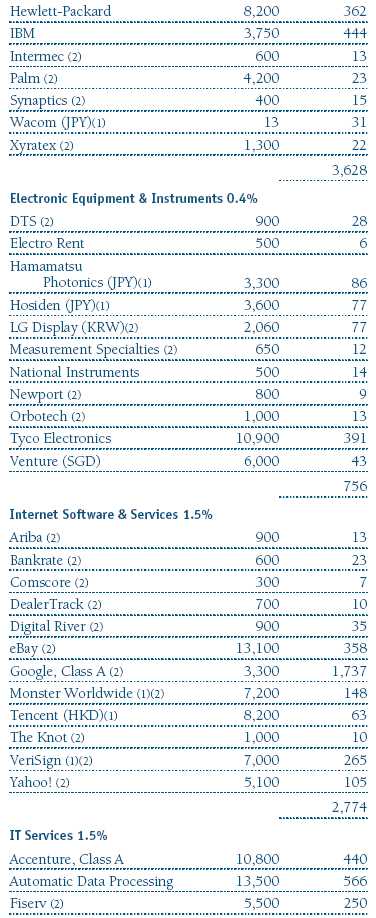
Among our major equity holdings, we find oil services giant Schlumberger attractive because of its dominant position in the field, strong demand for its geophysical and well-drilling services, and strong research and development efforts. Internet search company Google also is the leader in the search and Internet advertising field and continues its impressive growth rate in revenues and earnings. Microsoft continues to control the global software market for personal computers and generates solid sales growth across its product lines. (Please refer to the portfolio of investments for a complete listing of holdings and the amount each represents in the portfolio.)
Outlook
As we write this letter, equity and fixed-income markets around the world are in a period of heightened volatility. Although we do not necessarily believe that equity markets will outperform fixed income for the next three to six months, we believe the environment remains supportive for stocks in light of reasonable equity valuations and the prospect that fixed-income markets may be challenged by upward pressure on interest rates. This period of economic uncertainty also emphasizes the benefits of strong fundamental research in the security selection process to help in identifying strong companies with seasoned management teams that are best positioned to weather this more difficult environment. We believe our investment approach, which incorporates a disciplined strategy, broad diversification, and a long-term focus, should serve shareholders’ long-term interests well regardless of short-term economic conditions and market volatility.
Respectfully submitted,

Edmund M. Notzon III
Chairman of the portfolio’s Investment Advisory Committee
July 17, 2008
The committee chairman has day-to-day responsibility for managing the portfolio and works with committee members in developing and executing the portfolio’s investment program.
As with all stock and bond mutual funds, each fund’s share price can fall because of weakness in the stock or bond markets, a particular industry, or specific holdings. Stock markets can decline for many reasons, including adverse political or economic developments, changes in investor psychology, or heavy institutional selling. The prospects for an industry or company may deteriorate because of a variety of factors, including disappointing earnings or changes in the competitive environment. In addition, the investment manager’s assessment of companies held in a fund may prove incorrect, resulting in losses or poor performance even in rising markets.
Bonds are subject to interest rate risk, the decline in bond prices that usually accompanies a rise in interest rates, and credit risk, the chance that any fund holding could have its credit rating downgraded or that a bond issuer will default (fail to make timely payments of interest or principal), potentially reducing the fund’s income level and share price. High-yield corporate bonds could have greater price declines than funds that invest primarily in high-quality bonds. Companies issuing high-yield bonds are not as strong financially as those with higher credit ratings, so the bonds are usually considered speculative investments.
Funds that invest overseas may carry more risk than funds that invest strictly in U.S. assets. Risks can result from varying stages of economic and political development; differing regulatory environments, trading days, and accounting standards; and higher transaction costs of non-U.S. markets. Non-U.S. investments are also subject to currency risk, or a decline in the value of a foreign currency versus the U.S. dollar, which reduces the dollar value of securities denominated in that currency.
Citigroup 3-month Treasury Bill Index: An unmanaged index that tracks short-term U.S. government debt instruments.
Combined index portfolio: An unmanaged portfolio composed of the following underlying indexes: 60% stocks (48% Dow Jones Wilshire 5000 Composite Index, 12% MSCI EAFE Index), 30% bonds (Lehman Brothers U.S. Aggregate Index), and 10% money market securities (Citigroup 3-Month Treasury Bill Index).
Credit Suisse High Yield Index: Tracks the performance of domestic noninvestment-grade corporate bonds.
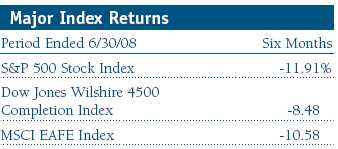
Dow Jones Wilshire 4500 Completion Index: An unmanaged index that tracks the performance of all stocks in the Dow Jones Wilshire 5000 Composite Index, excluding those found in the S&P 500 Index.
Dow Jones Wilshire 5000 Composite Index: A widely watched total market index that attempts to track the direction of most of the widely traded shares on U.S. exchanges, including small-, mid-, and large-cap issues.
Duration: The average time (expressed in years) it takes investors to receive the present value of the future cash flows on their investment. It is used to measure the sensitivity of bond prices to interest rate changes (the shorter the duration, the less the bond’s price will rise or fall in value when interest rates change). Duration is affected by maturity, the coupon, and the time interval between payments. Other things being equal, a bond with a higher coupon will have a shorter duration, while zero-coupon bonds have the longest.
Lehman Brothers U.S. Aggregate Index: An unmanaged index that tracks investment-grade corporate and government bonds.
Merrill Lynch-Wilshire Capital Market Index: A market capitalization-weighted index including the Wilshire 5000 and Merrill Lynch High Yield II and Domestic Master Indexes.
MSCI EAFE Index: An unmanaged index that tracks the stocks of about 1,000 companies in Europe, Australasia, and the Far East (EAFE).
MSCI Emerging Markets Index: A capitalization-weighted index of stocks from 26 emerging market countries that only includes securities that may be traded by foreign investors.
Russell 2000 Index: Consists of the smallest 2,000 companies in the Russell 3000 Index. Performance is reported on a total return basis.
S&P 500 Stock Index: An unmanaged index that tracks the stocks of 500 primarily large-cap U.S. companies.
Yield curve: A graphic depiction of the relationship between yields and maturity dates for a set of similar securities, such as Treasuries or municipal securities. Yield curves typically slope upward, indicating that longer maturities offer higher yields. When the yield curve is flat, there is little or no difference between the yields offered by shorter- and longer-term securities.
Portfolio Highlights
Performance and Expenses
T. Rowe Price Personal Strategy Balanced Portfolio
This chart shows the value of a hypothetical $10,000 investment in the portfolio over the past 10 fiscal year periods or since inception (for portfolios lacking 10-year records). The result is compared with benchmarks, which may include a broad-based market index and a peer group average or index. Market indexes do not include expenses, which are deducted from portfolio returns as well as mutual fund averages and indexes.
Fund Expense Example
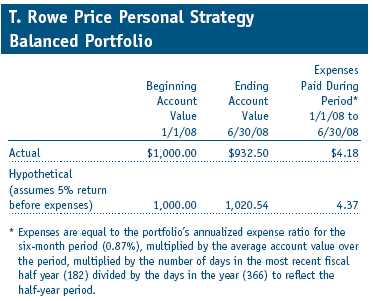
As a mutual fund shareholder, you may incur two types of costs: (1) transaction costs, such as redemption fees or sales loads, and (2) ongoing costs, including management fees, distribution and service (12b-1) fees, and other fund expenses. The following example is intended to help you understand your ongoing costs (in dollars) of investing in the fund and to compare these costs with the ongoing costs of investing in other mutual funds. The example is based on an investment of $1,000 invested at the beginning of the most recent six-month period and held for the entire period.
Actual Expenses
The first line of the following table (“Actual”) provides information about actual account values and actual expenses. You may use the information in this line, together with your account balance, to estimate the expenses that you paid over the period. Simply divide your account value by $1,000 (for example, an $8,600 account value divided by $1,000 = 8.6), then multiply the result by the number in the first line under the heading “Expenses Paid During Period” to estimate the expenses you paid on your account during this period.
Hypothetical Example for Comparison Purposes
The information on the second line of the table (“Hypothetical”) is based on hypothetical account values and expenses derived from the fund’s actual expense ratio and an assumed 5% per year rate of return before expenses (not the fund’s actual return). You may compare the ongoing costs of investing in the fund with other funds by contrasting this 5% hypothetical example and the 5% hypothetical examples that appear in the shareholder reports of the other funds. The hypothetical account values and expenses may not be used to estimate the actual ending account balance or expenses you paid for the period.
You should also be aware that the expenses shown in the table highlight only your ongoing costs and do not reflect any transaction costs, such as redemption fees or sales loads. Therefore, the second line of the table is useful in comparing ongoing costs only and will not help you determine the relative total costs of owning different funds. To the extent a fund charges transaction costs, however, the total cost of owning that fund is higher.
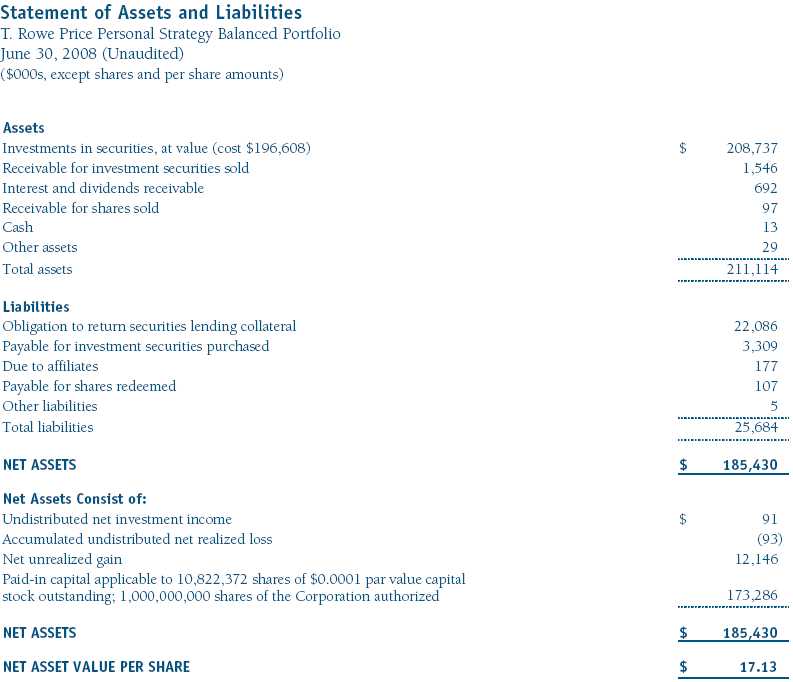
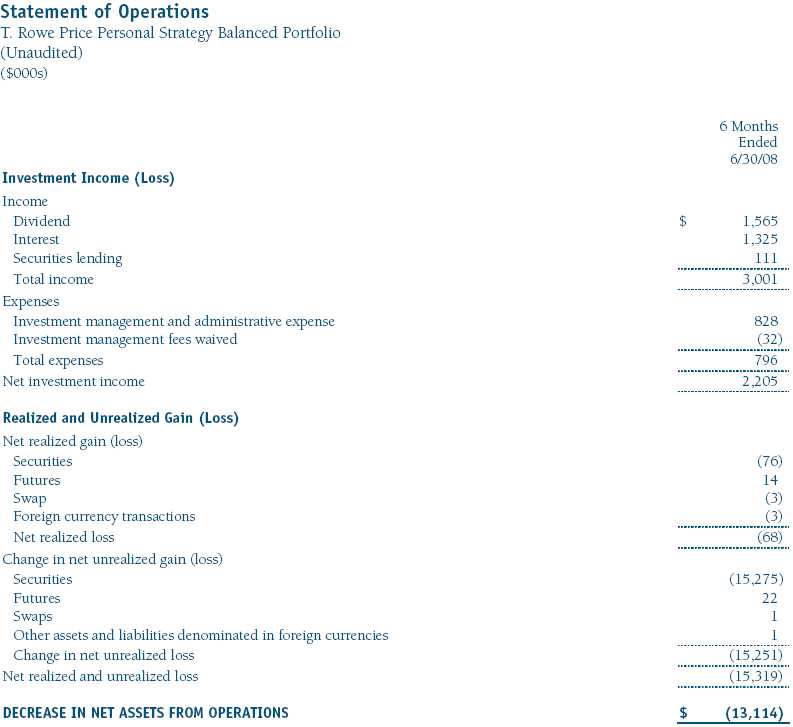
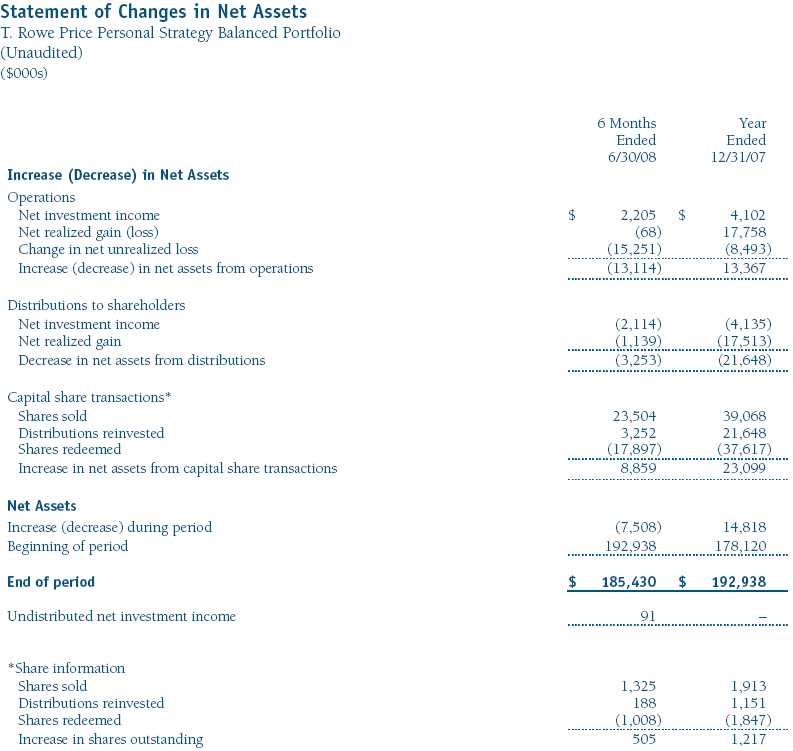
Financial Highlights
T. Rowe Price Personal Strategy Balanced Portfolio
(Unaudited)
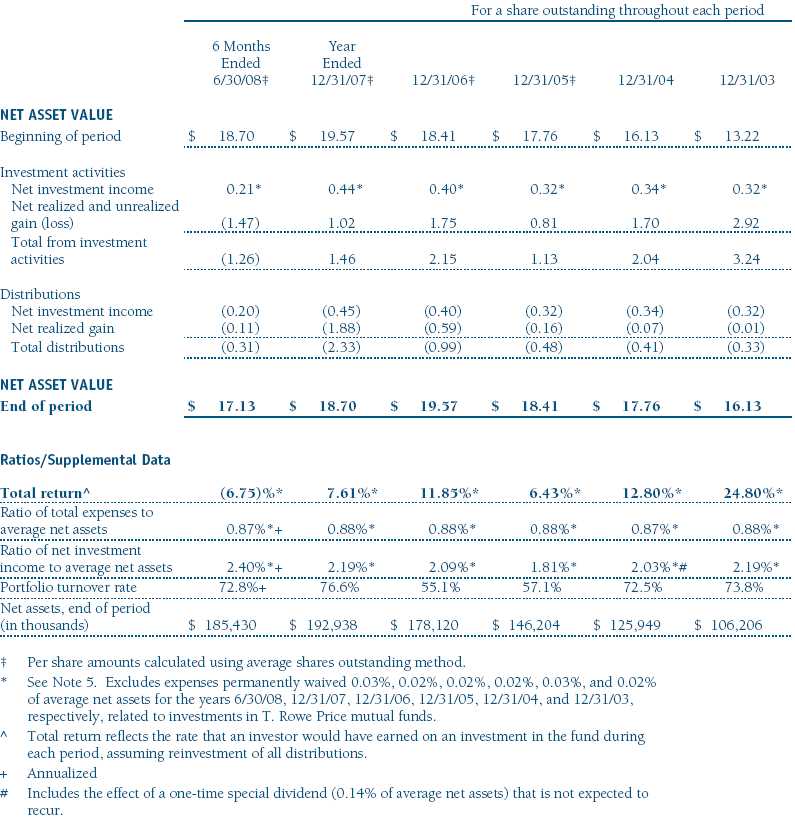
The accompanying notes are an integral part of these financial statements.
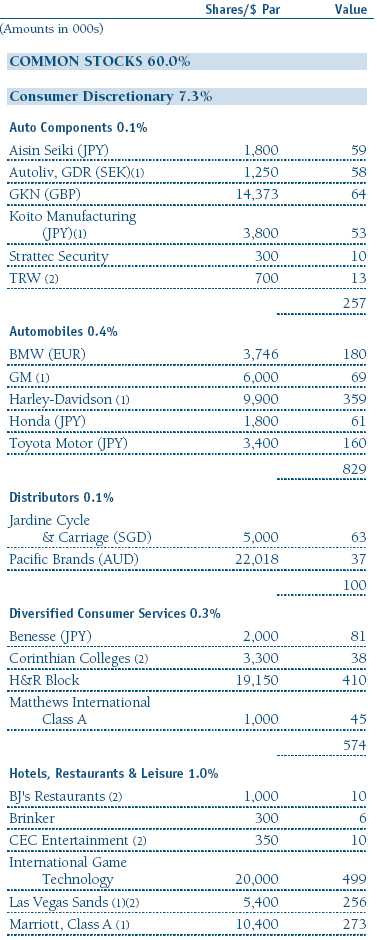
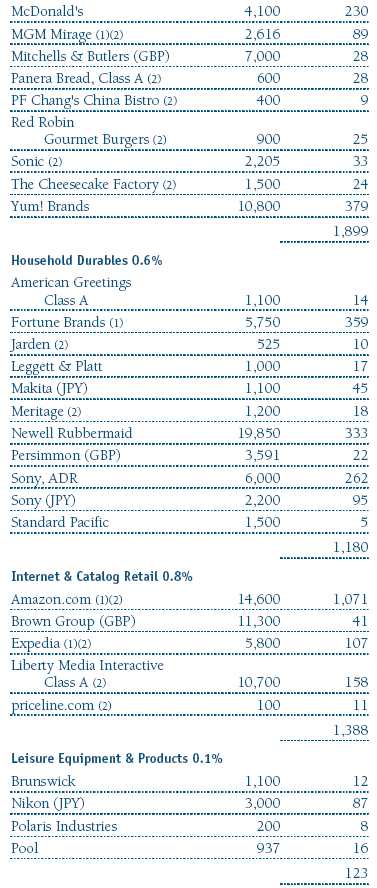
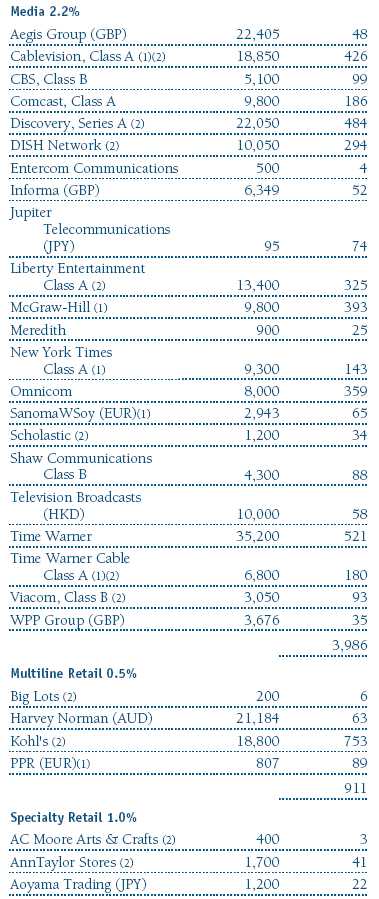
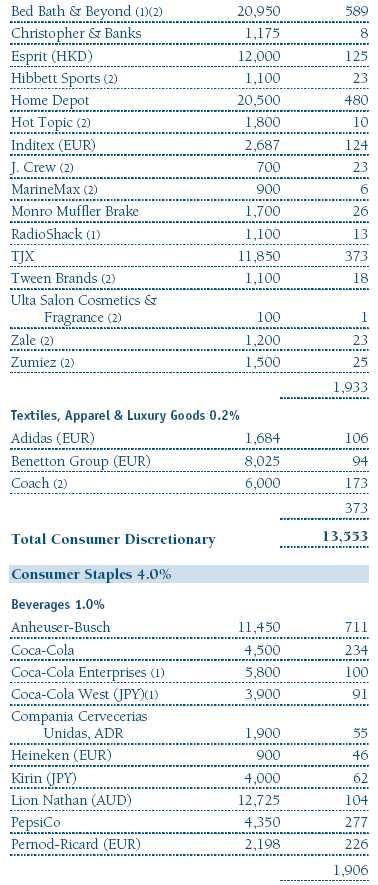
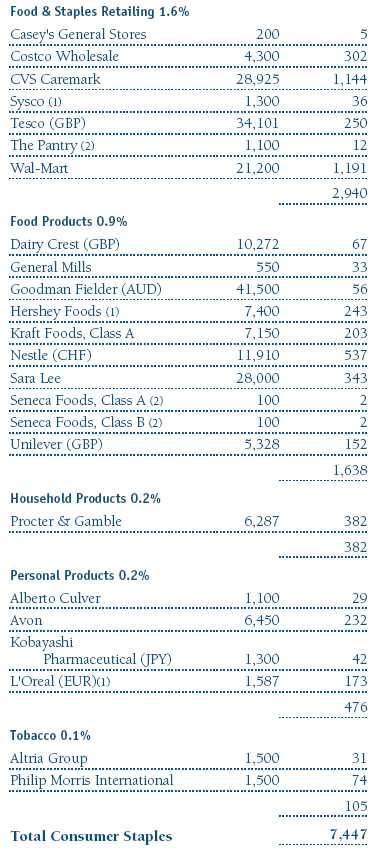
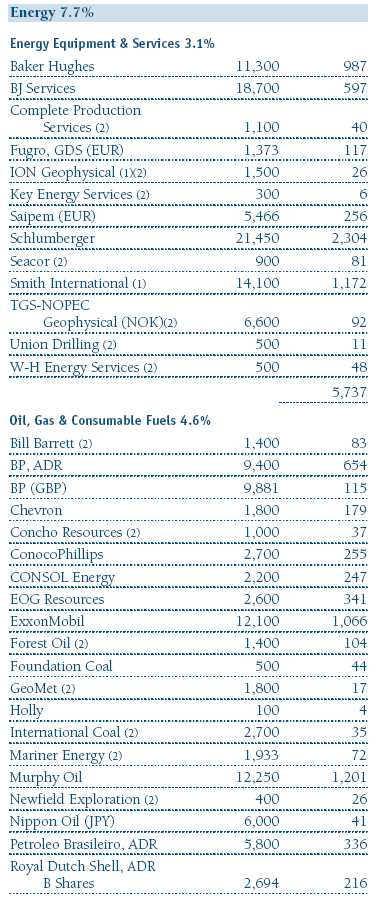
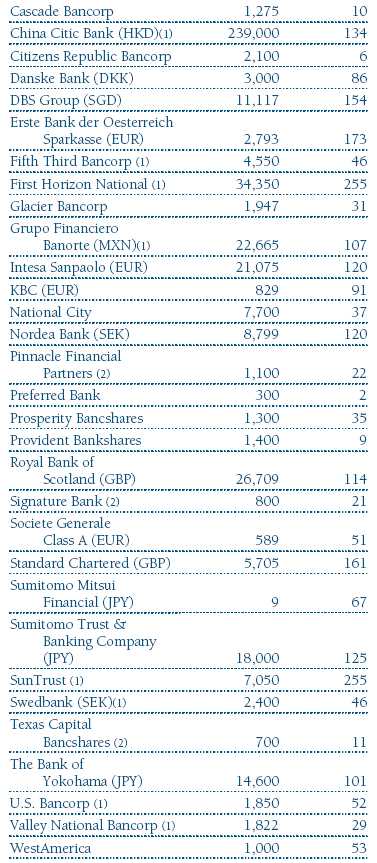
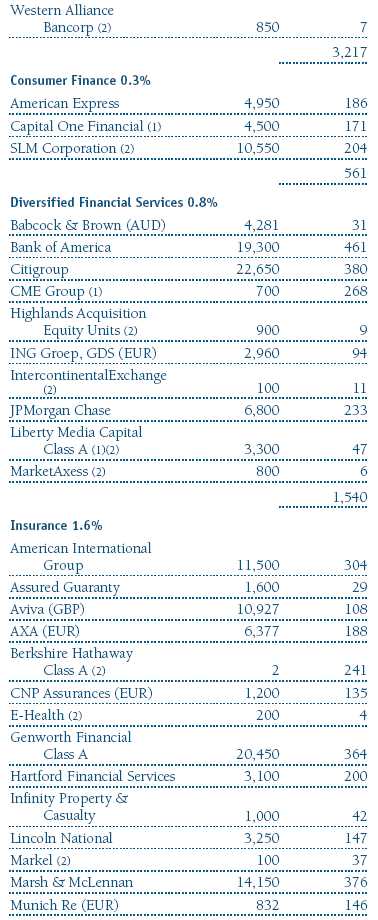
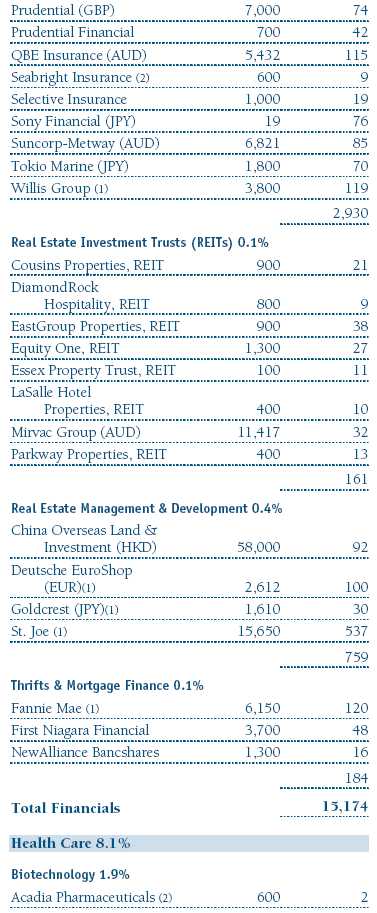
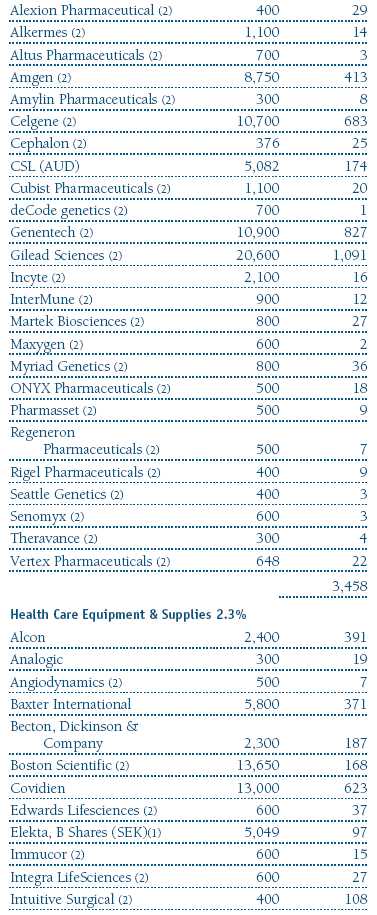
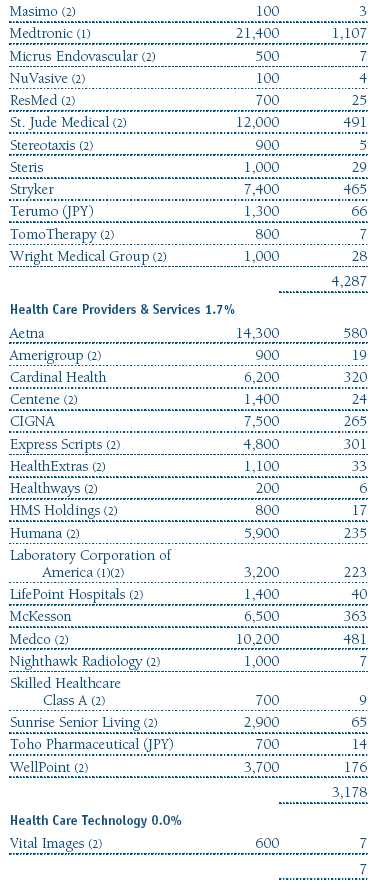
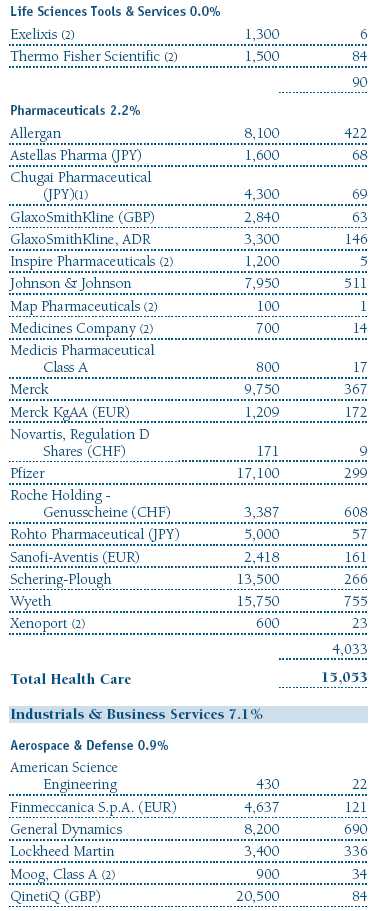
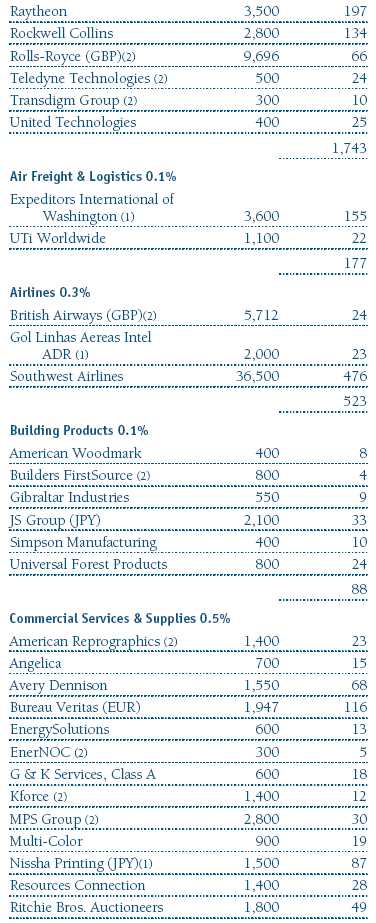
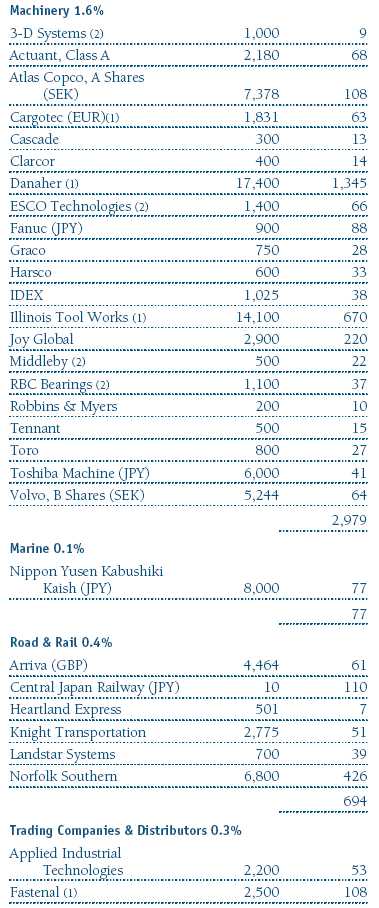
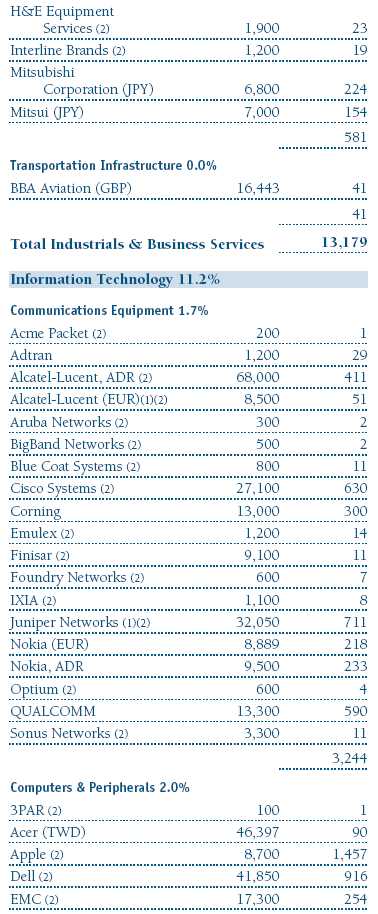
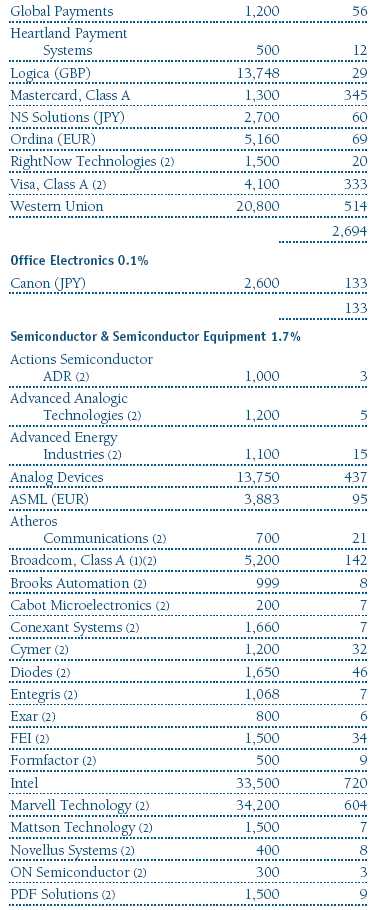
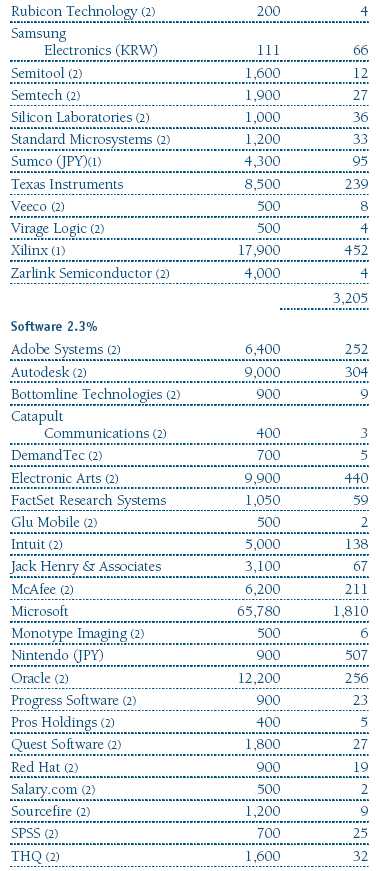
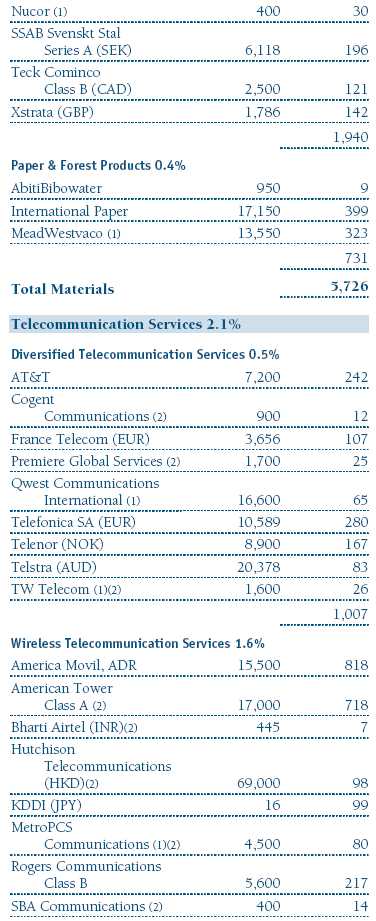
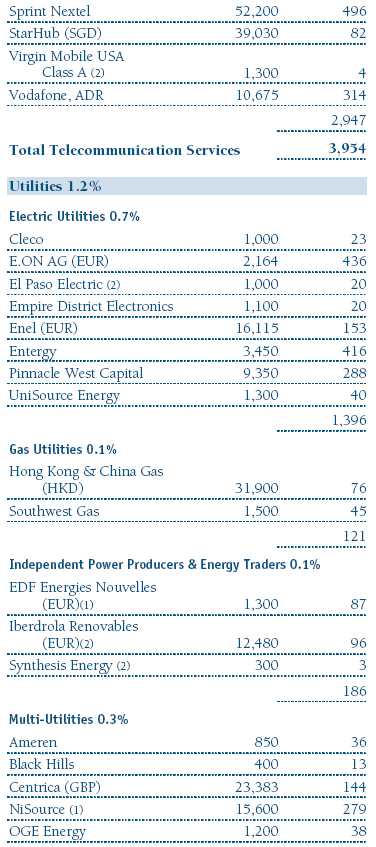
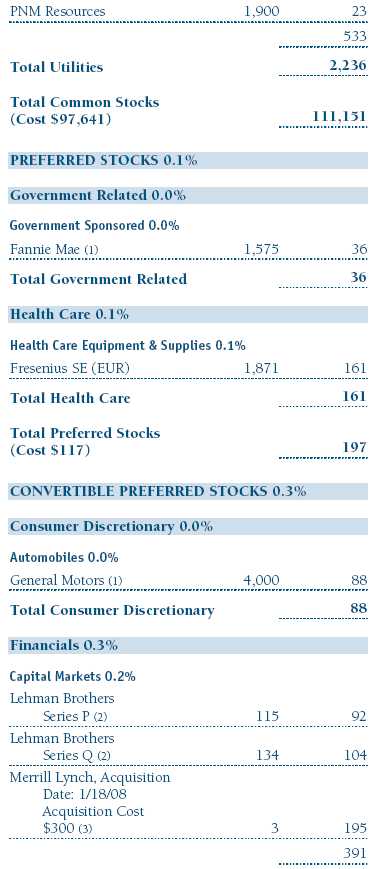
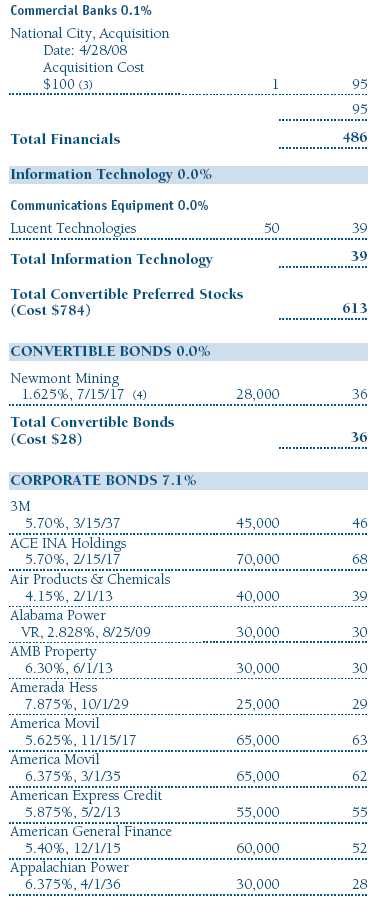
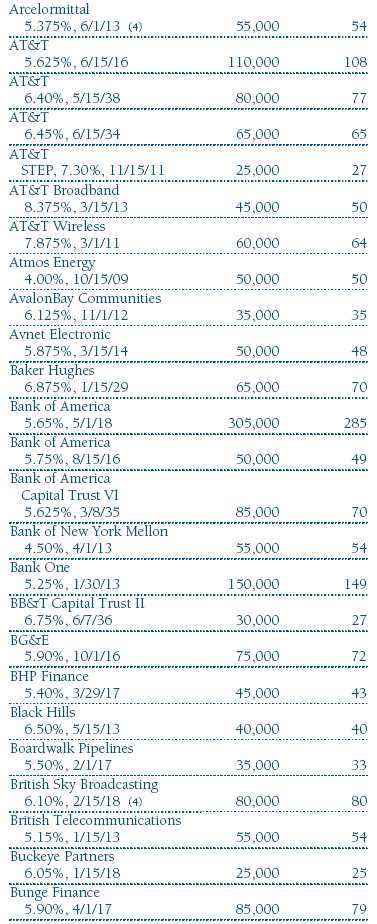
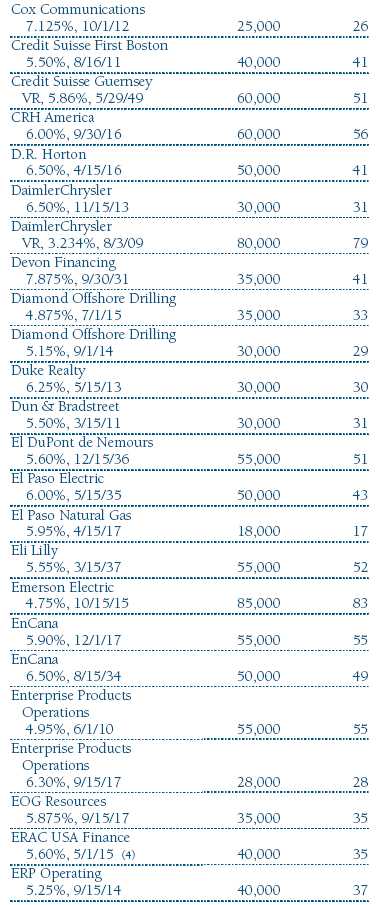
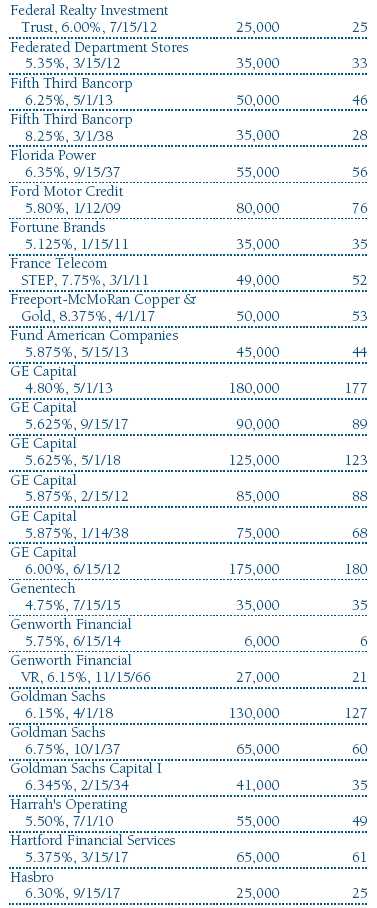
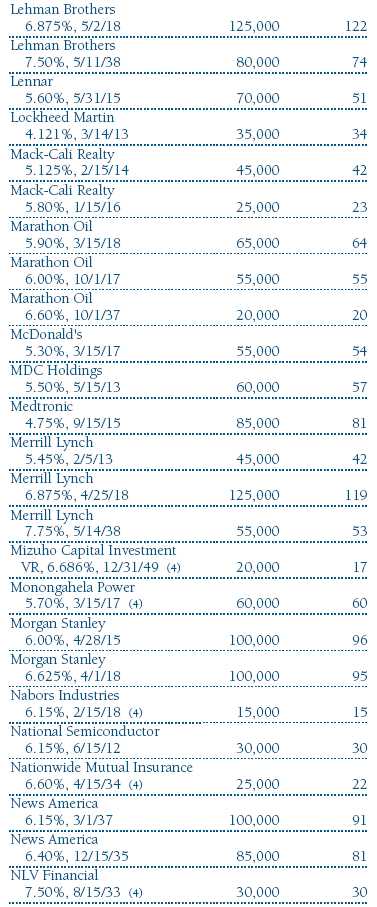
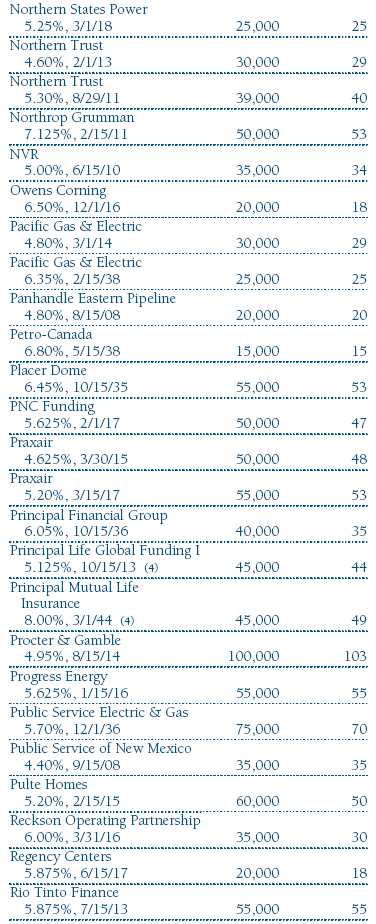
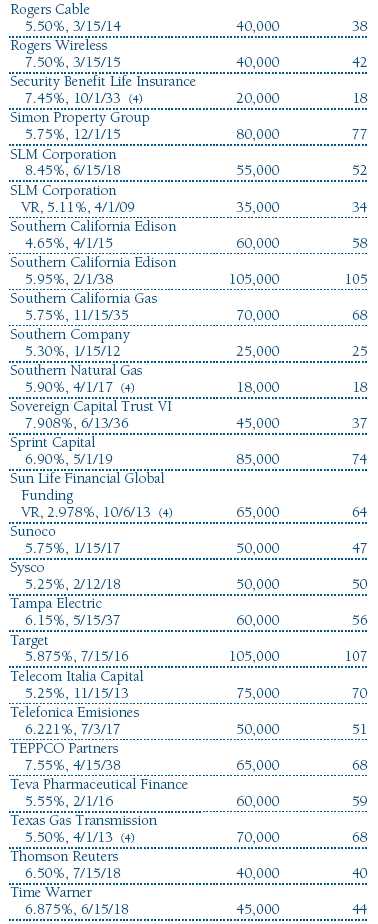
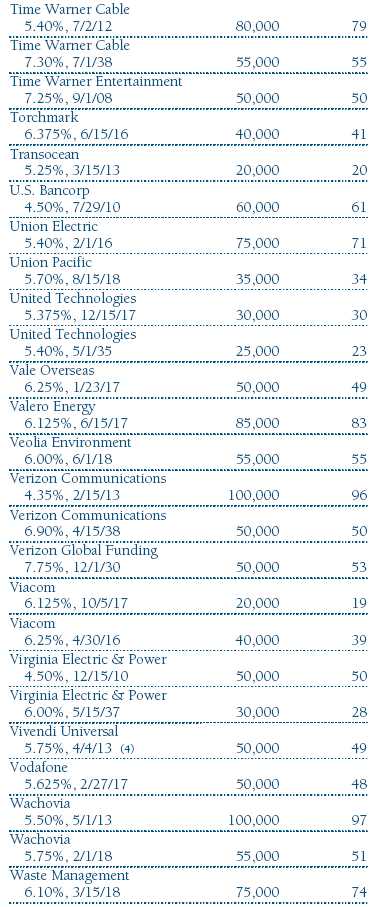
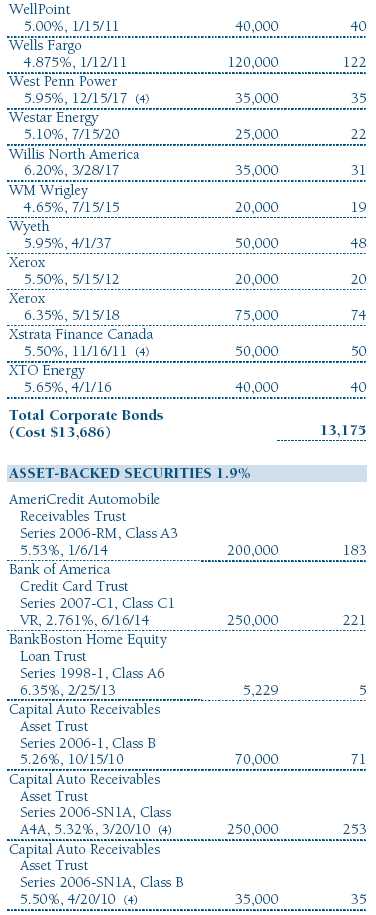
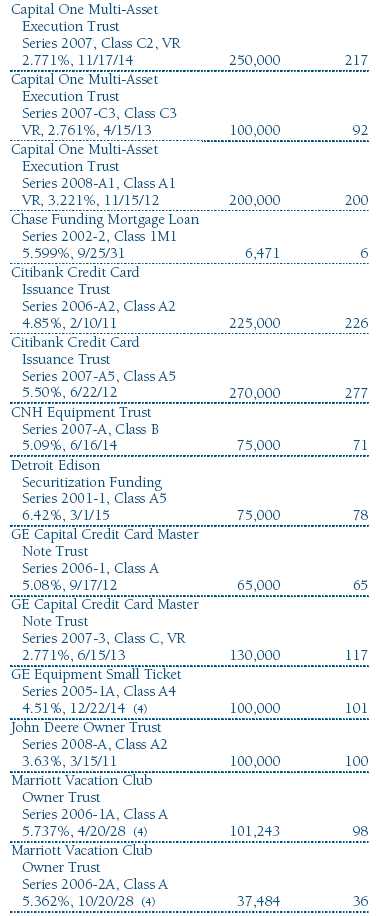
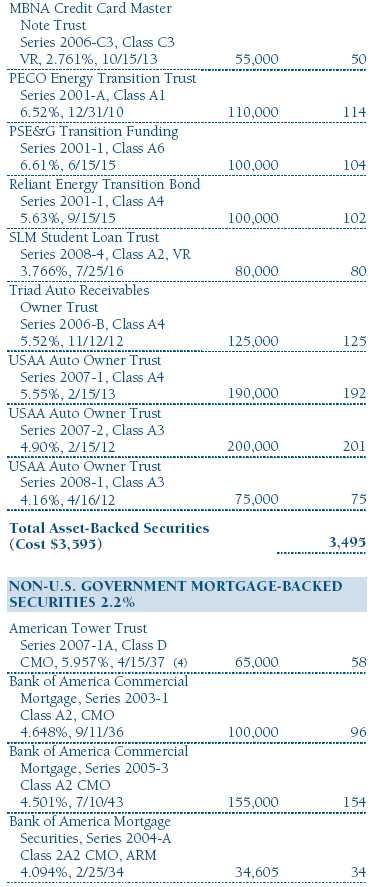
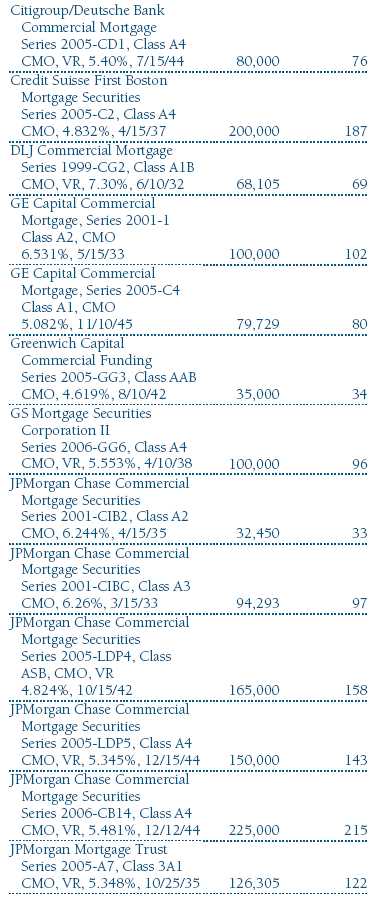
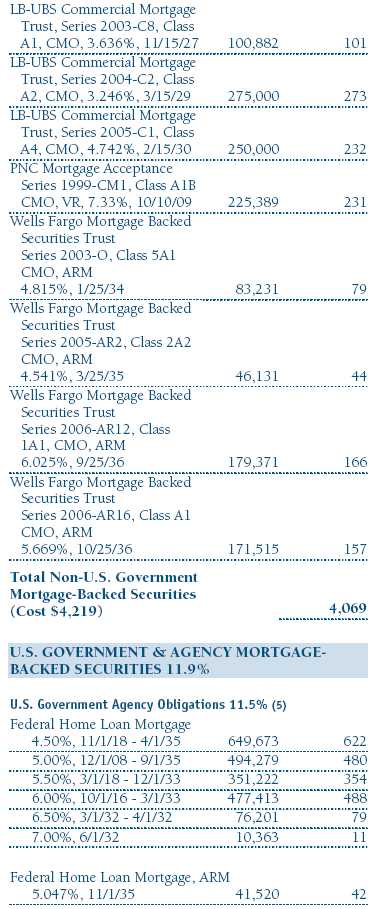
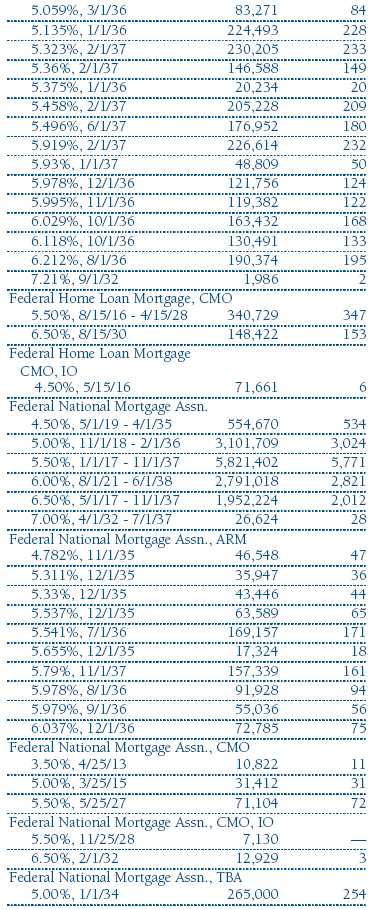
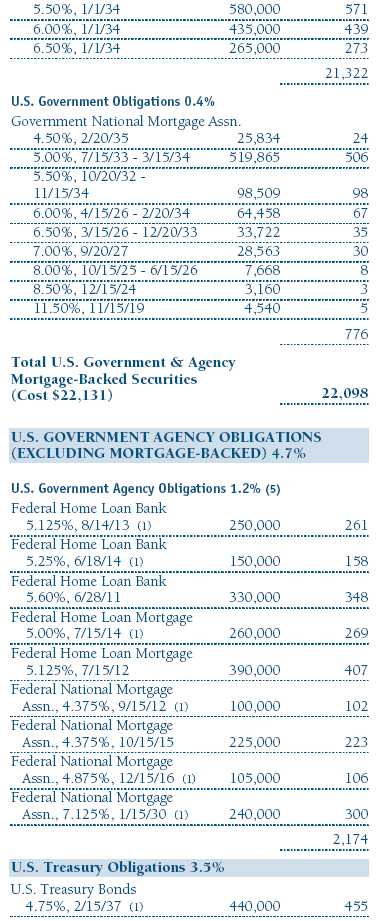
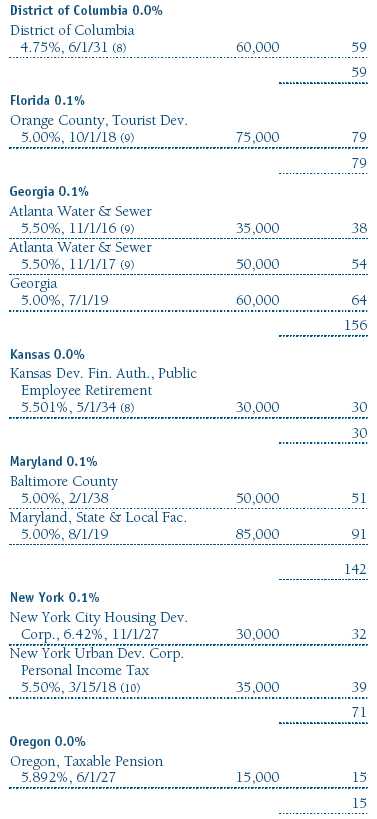
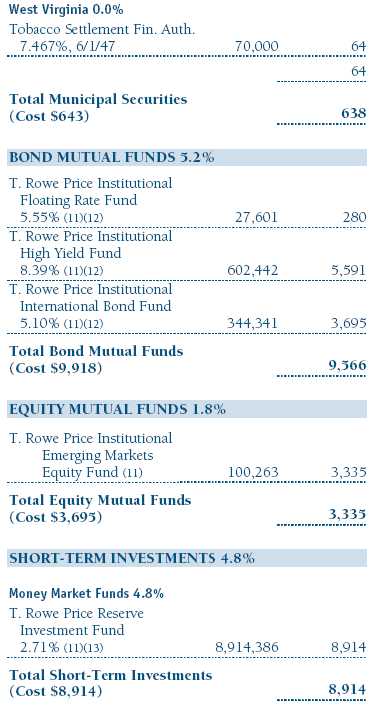
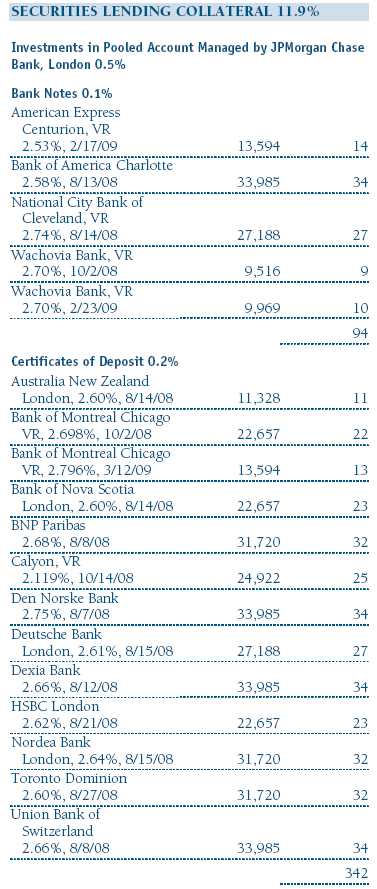
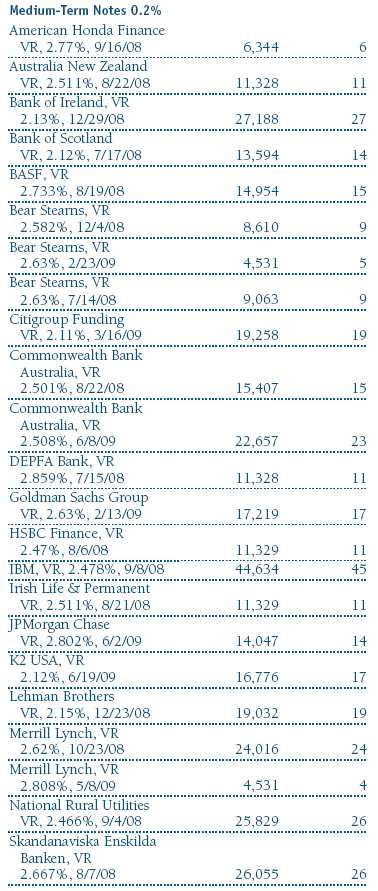
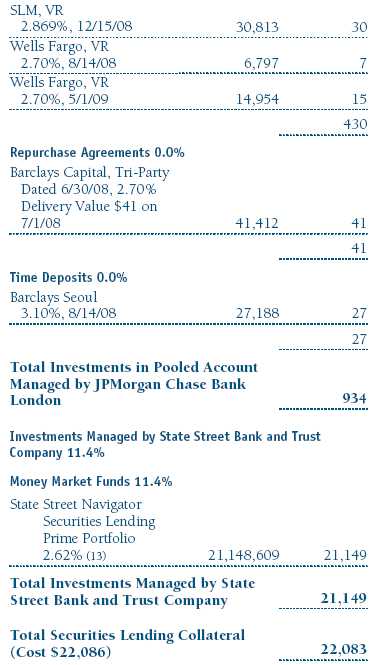
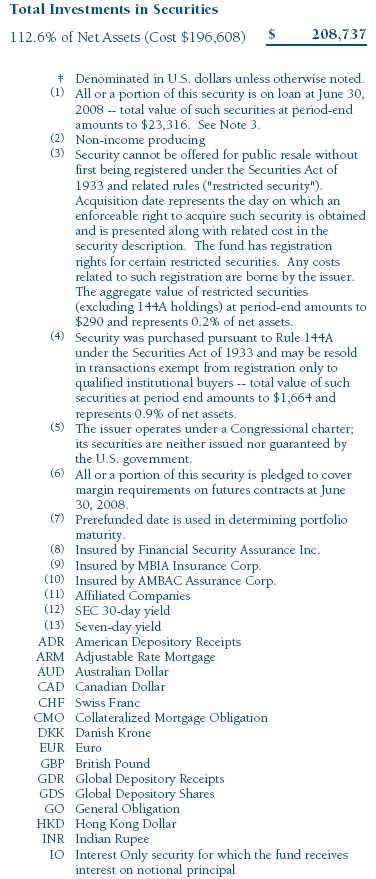
Portfolio of Investments ‡
T. Rowe Price Personal Strategy Balanced Portfolio
June 30, 2008 (Unaudited)


The accompanying notes are an integral part of these financial statements.
The accompanying notes are an integral part of these financial statements.
The accompanying notes are an integral part of these financial statements.
The accompanying notes are an integral part of these financial statements.
Notes to Financial Statements
T. Rowe Price Personal Strategy Balanced Portfolio
June 30, 2008 (Unaudited)
T. Rowe Price Equity Series, Inc. (the corporation), is registered under the Investment Company Act of 1940 (the 1940 Act). The Personal Strategy Balanced Portfolio (the fund), a diversified, open-end management investment company, is one portfolio established by the corporation. The fund commenced operations on December 30, 1994. The fund seeks the highest total return over time consistent with an emphasis on both capital appreciation and income. Shares of the fund are currently offered only through certain insurance companies as an investment medium for both variable annuity contracts and variable life insurance policies.
NOTE 1 - SIGNIFICANT ACCOUNTING POLICIES
Basis of Preparation The accompanying financial statements were prepared in accordance with accounting principles generally accepted in the United States of America, which require the use of estimates made by fund management. Fund management believes that estimates and security valuations are appropriate; however, actual results may differ from those estimates, and the security valuations reflected in the financial statements may differ from the value the fund ultimately realizes upon sale of the securities.
Investment Transactions, Investment Income, and Distributions Income and expenses are recorded on the accrual basis. Premiums and discounts on debt securities are amortized for financial reporting purposes. Inflation adjustments to the principal amount of inflation-indexed bonds are reflected as interest income. Dividends received from mutual fund investments are reflected as dividend income; capital gain distributions are reflected as realized gain/loss. Dividend income and capital gain distributions are recorded on the ex-dividend date. Income tax-related interest and penalties, if incurred, would be recorded as income tax expense. Investment transactions are accounted for on the trade date. Realized gains and losses are reported on the identified cost basis. Payments (“variation margin”) made or received to settle the daily fluctuations in the value of futures contracts are recorded as unrealized gains or losses until the contracts are closed. Unsettled variation margin on futures contracts is reflected as other assets or liabilities, and unrealized gains and losses on futures contracts are reflected as the change in net unrealized gain or loss in the accompanying financial statements. Net periodic receipts or payments required by swaps are accrued daily and recorded as realized gain or loss in the accompanying financial statements. Fluctuations in the fair value of swaps are reflected in the change in net unrealized gain or loss and are reclassified to realized gain or loss upon termination prior to maturity. Paydown gains and losses are recorded as an adjustment to interest income. Distributions to shareholders are recorded on the ex-dividend date. Income distributions are declared and paid on a quarterly basis. Capital gain distributions, if any, are declared and paid by the fund, typically on an annual basis.
Currency Translation Assets, including investments, and liabilities denominated in foreign currencies are translated into U.S. dollar values each day at the prevailing exchange rate, using the mean of the bid and asked prices of such currencies against U.S. dollars as quoted by a major bank. Purchases and sales of securities, income, and expenses are translated into U.S. dollars at the prevailing exchange rate on the date of the transaction. The effect of changes in foreign currency exchange rates on realized and unrealized security gains and losses is reflected as a component of security gains and losses.
Rebates Subject to best execution, the fund may direct certain security trades to brokers who have agreed to rebate a portion of the related brokerage commission to the fund in cash. Commission rebates are reflected as realized gain on securities in the accompanying financial statements and totaled $1,000 for the six months ended June 30, 2008.
New Accounting Pronouncements On January 1, 2008, the fund adopted Statement of Financial Accounting Standards No. 157 (FAS 157), Fair Value Measurements. FAS 157 defines fair value, establishes the framework for measuring fair value, and expands the disclosures of fair value measurements in the financial statements. Adoption of FAS 157 did not have a material impact on the fund’s net assets or results of operations.
In March 2008, the Financial Accounting Standards Board issued Statement of Financial Accounting Standards No. 161, Disclosures about Derivative Instruments and Hedging Activities (FAS 161), which is effective for fiscal years and interim periods beginning after November 15, 2008. FAS 161 requires enhanced disclosures about derivative and hedging activities, including how such activities are accounted for and their effect on financial position, performance and cash flows. Management is currently evaluating the impact the adoption of FAS 161 will have on the fund’s financial statements and related disclosures.
NOTE 2 - VALUATION
The fund’s investments are reported at fair value as defined under FAS 157. The fund values its investments and computes its net asset value per share at the close of the New York Stock Exchange (NYSE), normally 4 p.m. ET, each day that the NYSE is open for business.
Valuation Methods Equity securities listed or regularly traded on a securities exchange or in the over-the-counter (OTC) market are valued at the last quoted sale price or, for certain markets, the official closing price at the time the valuations are made, except for OTC Bulletin Board securities, which are valued at the mean of the latest bid and asked prices. A security that is listed or traded on more than one exchange is valued at the quotation on the exchange determined to be the primary market for such security. Listed securities not traded on a particular day are valued at the mean of the latest bid and asked prices for domestic securities and the last quoted sale price for international securities.
Debt securities are generally traded in the OTC market. Securities with remaining maturities of one year or more at the time of acquisition are valued at prices furnished by dealers who make markets in such securities or by an independent pricing service, which considers the yield or price of bonds of comparable quality, coupon, maturity, and type, as well as prices quoted by dealers who make markets in such securities. Securities with remaining maturities of less than one year at the time of acquisition generally use amortized cost in local currency to approximate fair value. However, if amortized cost is deemed not to reflect fair value or the fund holds a significant amount of such securities with remaining maturities of more than 60 days, the securities are valued at prices furnished by dealers who make markets in such securities or by an independent pricing service.
Investments in mutual funds are valued at the mutual fund’s closing net asset value per share on the day of valuation. Financial futures contracts are valued at closing settlement prices. Swaps are valued at net present value of the contract as furnished by counterparties or by an independent pricing service.
Other investments, including restricted securities, and those for which the above valuation procedures are inappropriate or are deemed not to reflect fair value are stated at fair value as determined in good faith by the T. Rowe Price Valuation Committee, established by the fund’s Board of Directors.
For valuation purposes, the last quoted prices of non-U.S. equity securities may be adjusted under the circumstances described below. If the fund determines that developments between the close of a foreign market and the close of the NYSE will, in its judgment, materially affect the value of some or all of its portfolio securities, the fund will adjust the previous closing prices to reflect what it believes to be the fair value of the securities as of the close of the NYSE. In deciding whether it is necessary to adjust closing prices to reflect fair value, the fund reviews a variety of factors, including developments in foreign markets, the performance of U.S. securities markets, and the performance of instruments trading in U.S. markets that represent foreign securities and baskets of foreign securities. A fund may also fair value securities in other situations, such as when a particular foreign market is closed but the fund is open. The fund uses outside pricing services to provide it with closing prices and information to evaluate and/or adjust those prices. The fund cannot predict how often it will use closing prices and how often it will determine it necessary to adjust those prices to reflect fair value. As a means of evaluating its security valuation process, the fund routinely compares closing prices, the next day’s opening prices in the same markets, and adjusted prices.
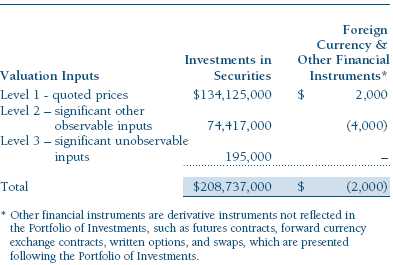
Valuation Inputs Various inputs are used to determine the value of the fund’s investments. These inputs are summarized in the three broad levels listed below:
Level 1 – quoted prices in active markets for identical securities
Level 2 – observable inputs other than Level 1 quoted prices (including, but not limited to, quoted prices for similar securities, interest rates, prepayment speeds, credit risk)
Level 3 – unobservable inputs
Observable inputs are those based on market data obtained from sources independent of the fund, and unobservable inputs reflect the fund’s own assumptions based on the best information available. The input levels are not necessarily an indication of the risk or liquidity associated with investments at that level. For example, non-U.S. equity securities actively traded in foreign markets generally are reflected in Level 2 despite the availability of closing prices, because the fund evaluates and determines whether those closing prices reflect fair value at the close of the NYSE or require adjustment, as described above. The following table summarizes the fund’s investments, based on the inputs used to determine their values on June 30, 2008:
NOTE 3 - INVESTMENT TRANSACTIONS
Consistent with its investment objective, the fund engages in the following practices to manage exposure to certain risks or to enhance performance. The investment objective, policies, program, and risk factors of the fund are described more fully in the fund’s prospectus and Statement of Additional Information.
Restricted Securities The fund may invest in securities that are subject to legal or contractual restrictions on resale. Prompt sale of such securities at an acceptable price may be difficult and may involve substantial delays and additional costs.
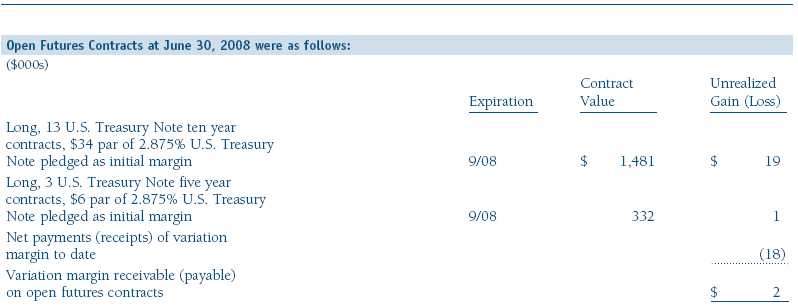
Futures Contracts During the six months ended June 30, 2008, the fund was a party to futures contracts, which provide for the future sale by one party and purchase by another of a specified amount of a specific financial instrument at an agreed upon price, date, time, and place. Risks arise from possible illiquidity of the futures market and from movements in security values and/or interest rates.
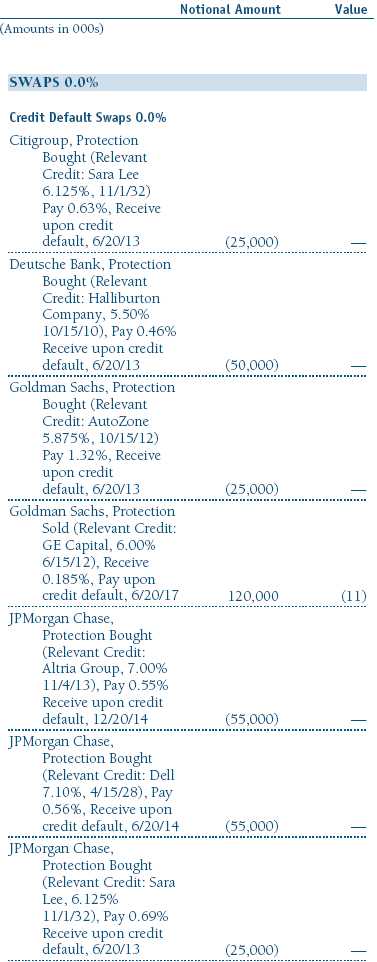
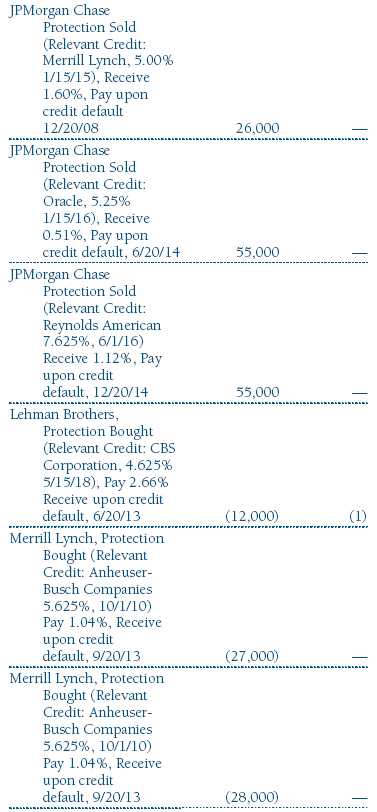
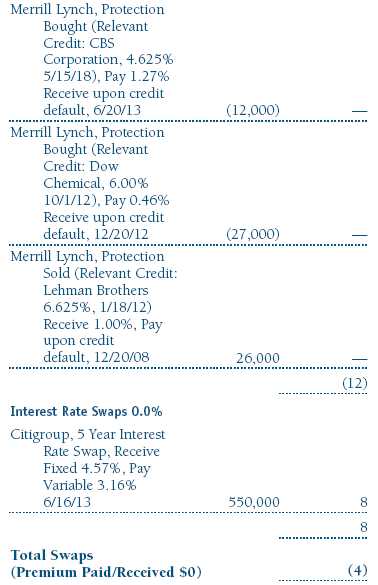
Swaps During the six months ended June 30, 2008, the fund was a party to interest rate swaps under which it is obligated to exchange cash flows based on the difference between specified interest rates applied to a notional principal amount for a specified period of time. Risks arise from the possible inability of counterparties to meet the terms of their agreements and from movements in interest rates. During the six months ended June 30, 2008, the fund was a party to credit default swaps under which it buys or sells credit protection against a defined-issuer credit event. Upon a defined-issuer credit event, the fund is required to either deliver the notional amount of the contract in cash and take delivery of the relevant credit or deliver cash approximately equal to the notional amount of the contract less market value of the relevant credit at the time of the credit event. Risks arise from the possible inability of counterparties to meet the terms of their agreements and from changes in creditworthiness of the relevant underlying issuer. In order to mitigate counterparty risk and subject to specific contractual arrangements, the fund may receive eligible security collateral from such counterparties upon unrealized gain amounts reaching certain thresholds. Eligible security collateral generally includes debt securities issued by the U.S. government or related agencies. At June 30, 2008, no such collateral was received.
Repurchase Agreements All repurchase agreements are fully collateralized by U.S. government securities or AAA-rated asset-backed securities. Collateral is in the possession of the fund’s custodian or, for tri-party agreements, the custodian designated by the agreement. Collateral is evaluated daily to ensure that its market value exceeds the delivery value of the repurchase agreements at maturity. Although risk is mitigated by the collateral, the fund could experience a delay in recovering its value and a possible loss of income or value if the counter-party fails to perform in accordance with the terms of the agreement.
TBA Purchase Commitments During the six months ended June 30, 2008, the fund entered into to be announced (TBA) purchase commitments, pursuant to which it agrees to purchase mortgage-backed securities for a fixed unit price, with payment and delivery at a scheduled future date beyond the customary settlement period for that security. With TBA transactions, the particular securities to be delivered are not identified at the trade date; however, delivered securities must meet specified terms, including issuer, rate, and mortgage term, and be within industry-accepted “good delivery” standards. The fund generally enters into TBAs with the intention of taking possession of the underlying mortgage securities. Until settlement, the fund maintains cash reserves and liquid assets sufficient to settle its TBAs.
Securities Lending The fund lends its securities to approved brokers to earn additional income. It receives as collateral cash and U.S. government securities valued at 102% to 105% of the value of the securities on loan. Cash collateral is invested by the fund’s lending agent(s) in accordance with investment guidelines approved by fund management. Although risk is mitigated by the collateral, the fund could experience a delay in recovering its securities and a possible loss of income or value if the borrower fails to return the securities or if collateral investments decline in value. Securities lending revenue recognized by the fund consists of earnings on invested collateral and borrowing fees, net of any rebates to the borrower and compensation to the lending agent. On June 30, 2008, the value of loaned securities was $23,316,000; aggregate collateral received included U.S. government securities valued at $2,002,000.
Other Purchases and sales of portfolio securities, other than short-term and U.S. government securities, aggregated $39,038,000 and $28,498,000, respectively, for the six months ended June 30, 2008. Purchases and sales of U.S. government securities aggregated $31,606,000 and $37,121,000, respectively, for the six months ended June 30, 2008.
NOTE 4 - FEDERAL INCOME TAXES
No provision for federal income taxes is required since the fund intends to continue to qualify as a regulated investment company under Subchapter M of the Internal Revenue Code and distribute to shareholders all of its taxable income and gains. Distributions are determined in accordance with Federal income tax regulations, which differ from generally accepted accounting principles, and, therefore, may differ in amount or character from net investment income and realized gains for financial reporting purposes. Financial reporting records are adjusted for permanent book/tax differences to reflect tax character but are not adjusted for temporary differences. The amount and character of tax-basis distributions and composition of net assets are finalized at fiscal year-end; accordingly, tax-basis balances have not been determined as of June 30, 2008.
At June 30, 2008, the cost of investments for federal income tax purposes was $196,608,000. Net unrealized gain aggregated $12,146,000 at period-end, of which $24,227,000 related to appreciated investments and $12,081,000 related to depreciated investments.
NOTE 5 - RELATED PARTY TRANSACTIONS
The fund is managed by T. Rowe Price Associates, Inc. (the manager or Price Associates), a wholly owned subsidiary of T. Rowe Price Group, Inc. The investment management and administrative agreement between the fund and the manager provides for an all-inclusive annual fee equal to 0.90% of the fund’s average daily net assets. The fee is computed daily and paid monthly. The agreement provides that investment management, shareholder servicing, transfer agency, accounting, custody services, and directors’ fees and expenses are provided to the fund, and interest, taxes, brokerage commissions, and extraordinary expenses are paid directly by the fund.
The fund may invest in the T. Rowe Price Reserve Investment Fund and the T. Rowe Price Government Reserve Investment Fund (collectively, the T. Rowe Price Reserve Investment Funds), open-end management investment companies managed by Price Associates and considered affiliates of the fund. The T. Rowe Price Reserve Investment Funds are offered as cash management options to mutual funds, trusts, and other accounts managed by Price Associates and/or its affiliates and are not available for direct purchase by members of the public. The T. Rowe Price Reserve Investment Funds pay no investment management fees.
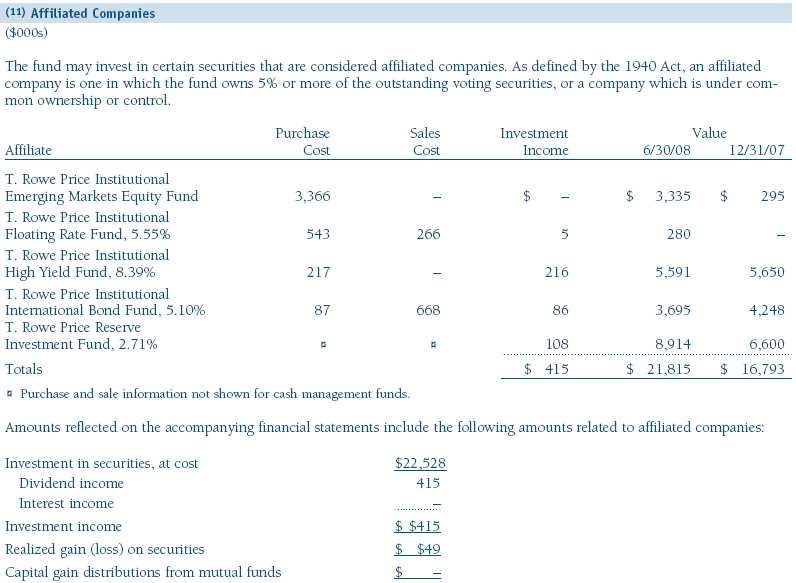
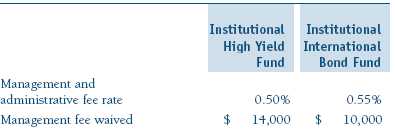
The fund may also invest in certain T. Rowe Price institutional funds (underlying institutional funds) as a means of gaining efficient and cost-effective exposure to certain markets. The underlying institutional funds are open-end management investment companies managed by Price Associates and/or T. Rowe Price International, Inc. (collectively, the Price managers) and are considered affiliates of the fund. Each underlying institutional fund pays an all-inclusive management and administrative fee to its Price manager. To ensure that the fund does not incur duplicate fees, each Price manager has agreed to permanently waive a portion of its management fee charged to the fund in an amount sufficient to fully offset the fees paid by the underlying institutional funds related to fund assets invested therein. Accordingly, the accompanying Statement of Operations includes management fees permanently waived pursuant to this agreement. Annual fee rates and amounts waived within the accompanying Statement of Operations related to shares of the underlying institutional funds for the six months ended June 30, 2008 are as follows:

| Information on Proxy Voting Policies, Procedures, and Records |
A description of the policies and procedures used by T. Rowe Price funds and portfolios to determine how to vote proxies relating to portfolio securities is available in each fund’s Statement of Additional Information, which you may request by calling 1-800-225-5132 or by accessing the SEC’s Web site, www.sec.gov. The description of our proxy voting policies and procedures is also available on our Web site, www.troweprice.com. To access it, click on the words “Company Info” at the top of our homepage for individual investors. Then, in the window that appears, click on the “Proxy Voting Policy” navigation button in the top left corner.
Each fund’s most recent annual proxy voting record is available on our Web site and through the SEC’s Web site. To access it through our Web site, follow the directions above, then click on the words “Proxy Voting Record” at the bottom of the Proxy Voting Policy page.
| How to Obtain Quarterly Portfolio Holdings |
The fund files a complete schedule of portfolio holdings with the Securities and Exchange Commission for the first and third quarters of each fiscal year on Form N-Q. The fund’s Form N-Q is available electronically on the SEC’s Web site (www.sec.gov); hard copies may be reviewed and copied at the SEC’s Public Reference Room, 450 Fifth St. N.W., Washington, DC 20549. For more information on the Public Reference Room, call 1-800-SEC-0330.
| Approval of Investment Management Agreement |
On March 4, 2008, the fund’s Board of Directors (Board) unanimously approved the investment advisory contract (Contract) between the fund and its investment manager, T. Rowe Price Associates, Inc. (Manager). The Board considered a variety of factors in connection with its review of the Contract, also taking into account information provided by the Manager during the course of the year, as discussed below:
Services Provided by the Manager
The Board considered the nature, quality, and extent of the services provided to the fund by the Manager. These services included, but were not limited to, management of the fund’s portfolio and a variety of related activities, as well as financial and administrative services, reporting, and communications. The Board also reviewed the background and experience of the Manager’s senior management team and investment personnel involved in the management of the fund. The Board concluded that it was satisfied with the nature, quality, and extent of the services provided by the Manager.
Investment Performance of the Fund
The Board reviewed the fund’s average annual total returns over the 1-, 3-, 5-, and 10-year periods, as well as the fund’s year-by-year returns, and compared these returns with previously agreed upon comparable performance measures and market data, including those supplied by Lipper and Morningstar, which are independent providers of mutual fund data. On the basis of this evaluation and the Board’s ongoing review of investment results, the Board concluded that the fund’s performance was satisfactory.
Costs, Benefits, Profits, and Economies of Scale
The Board reviewed detailed information regarding the revenues received by the Manager under the Contract and other benefits that the Manager (and its affiliates) may have realized from its relationship with the fund, including research received under “soft dollar” agreements. The Board noted that soft dollars were not used to pay for third-party, non-broker research. The Board also received information on the estimated costs incurred and profits realized by the Manager and its affiliates from advising T. Rowe Price mutual funds, as well as estimates of the gross profits realized from managing the fund in particular. The Board concluded that the Manager’s profits were reasonable in light of the services provided to the fund. The Board also considered whether the fund or other funds benefit under the fee levels set forth in the Contract from any economies of scale realized by the Manager. The Board noted that, under the Contract, the fund pays the Manager a single fee based on the fund’s assets and the Manager, in turn, pays all expenses of the fund, with certain exceptions. The Board concluded that, based on the profitability data it reviewed and consistent with this single-fee structure, the Contract provided for a reasonable sharing of benefits from any economies of scale with the fund.
Fees
The Board reviewed the fund’s single-fee structure and compared the rate with fees and expenses of other comparable funds based on information and data supplied by Lipper. (For these purposes, the Board assumed the management fee was equal to the single fee less the fund’s operating expenses.) The information provided to the Board indicated that the fund’s management fee rate and expense ratio were above the median for comparable funds. The Board also reviewed the fee schedules for comparable privately managed accounts of the Manager and its affiliates. Management informed the Board that the Manager’s responsibilities for privately managed accounts are more limited than its responsibilities for the fund and other T. Rowe Price mutual funds that it or its affiliates advise. On the basis of the information provided, the Board concluded that the fees paid by the fund under the Contract were reasonable.
Approval of the Contract
As noted, the Board approved the continuation of the Contract. No single factor was considered in isolation or to be determinative to the decision. Rather, the Board concluded, in light of a weighting and balancing of all factors considered, that it was in the best interests of the fund to approve the continuation of the Contract, including the fees to be charged for services thereunder.
Item 2. Code of Ethics.
A code of ethics, as defined in Item 2 of Form N-CSR, applicable to its principal executive officer, principal financial officer, principal accounting officer or controller, or persons performing similar functions is filed as an exhibit to the registrant’s annual Form N-CSR. No substantive amendments were approved or waivers were granted to this code of ethics during the registrant’s most recent fiscal half-year.
Item 3. Audit Committee Financial Expert.
Disclosure required in registrant’s annual Form N-CSR.
Item 4. Principal Accountant Fees and Services.
Disclosure required in registrant’s annual Form N-CSR.
Item 5. Audit Committee of Listed Registrants.
Not applicable.
Item 6. Investments.
(a) Not applicable. The complete schedule of investments is included in Item 1 of this Form N-CSR.
(b) Not applicable.
Item 7. Disclosure of Proxy Voting Policies and Procedures for Closed-End Management Investment Companies.
Not applicable.
Item 8. Portfolio Managers of Closed-End Management Investment Companies.
Not applicable.
Item 9. Purchases of Equity Securities by Closed-End Management Investment Company and Affiliated Purchasers.
Not applicable.
Item 10. Submission of Matters to a Vote of Security Holders.
Not applicable.
Item 11. Controls and Procedures.
(a) The registrant’s principal executive officer and principal financial officer have evaluated the registrant’s disclosure controls and procedures within 90 days of this filing and have concluded that the registrant’s disclosure controls and procedures were effective, as of that date, in ensuring that information required to be disclosed by the registrant in this Form N-CSR was recorded, processed, summarized, and reported timely.
(b) The registrant’s principal executive officer and principal financial officer are aware of no change in the registrant’s internal control over financial reporting that occurred during the registrant’s second fiscal quarter covered by this report that has materially affected, or is reasonably likely to materially affect, the registrant’s internal control over financial reporting.
Item 12. Exhibits.
(a)(1) The registrant’s code of ethics pursuant to Item 2 of Form N-CSR is filed with the registrant’s annual Form N-CSR.
(2) Separate certifications by the registrant's principal executive officer and principal financial officer, pursuant to Section 302 of the Sarbanes-Oxley Act of 2002 and required by Rule 30a-2(a) under the Investment Company Act of 1940, are attached.
(3) Written solicitation to repurchase securities issued by closed-end companies: not applicable.
(b) A certification by the registrant's principal executive officer and principal financial officer, pursuant to Section 906 of the Sarbanes-Oxley Act of 2002 and required by Rule 30a-2(b) under the Investment Company Act of 1940, is attached.
| | |
SIGNATURES |
| |
| | Pursuant to the requirements of the Securities Exchange Act of 1934 and the Investment |
| Company Act of 1940, the registrant has duly caused this report to be signed on its behalf by the |
| undersigned, thereunto duly authorized. |
| |
| T. Rowe Price Equity Series, Inc. |
| |
| |
| |
| By | /s/ Edward C. Bernard |
| | Edward C. Bernard |
| | Principal Executive Officer |
| |
| Date | August 20, 2008 |
| |
| |
| |
| | Pursuant to the requirements of the Securities Exchange Act of 1934 and the Investment |
| Company Act of 1940, this report has been signed below by the following persons on behalf of |
| the registrant and in the capacities and on the dates indicated. |
| |
| |
| By | /s/ Edward C. Bernard |
| | Edward C. Bernard |
| | Principal Executive Officer |
| |
| Date | August 20, 2008 |
| |
| |
| |
| By | /s/ Gregory K. Hinkle |
| | Gregory K. Hinkle |
| | Principal Financial Officer |
| |
| Date | August 20, 2008 |