Item 1: Report to Shareholders| Blue Chip Growth Portfolio | June 30, 2007 |
The views and opinions in this report were current as of June 30, 2007. They are not guarantees of performance or investment results and should not be taken as investment advice. Investment decisions reflect a variety of factors, and the managers reserve the right to change their views about individual stocks, sectors, and the markets at any time. As a result, the views expressed should not be relied upon as a forecast of the fund’s future investment intent. The report is certified under the Sarbanes-Oxley Act, which requires mutual funds and other public companies to affirm that, to the best of their knowledge, the information in their financial reports is fairly and accurately stated in all material respects.
Manager’s Letter
T. Rowe Price Blue Chip Growth Portfolio
Fellow Shareholders
Global stock markets performed well in the first half of 2007. Investors responded favorably to improving corporate earnings driven by strong growth in several key international economies. A slowdown in housing (and the overall U.S. economy), related subprime mortgage woes, and rising energy prices are valid concerns. However, we continue to believe that moderate interest rates, reasonable valuations, and corporate earnings gains are supportive of favorable investment performance, particularly for large-cap growth stocks.
• The portfolio generated good results for the 6- and 12-month periods ended June 30, 2007, that outperformed its benchmarks.
• Our holdings in the information technology, energy, and consumer discretionary sectors were the portfolio’s best contributors for the past six months.
• We believe corporate earnings, interest rates (inflation), and valuation will be the primary determinants of stock performance.
• We think high-quality, consistent-growth companies appear attractive, and we believe a solid case can be made for investing in large-cap growth stocks.

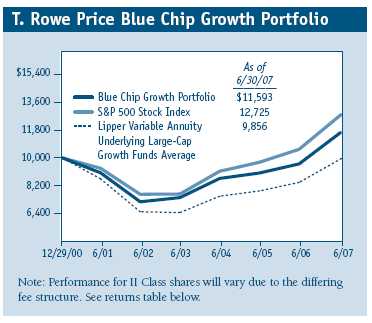
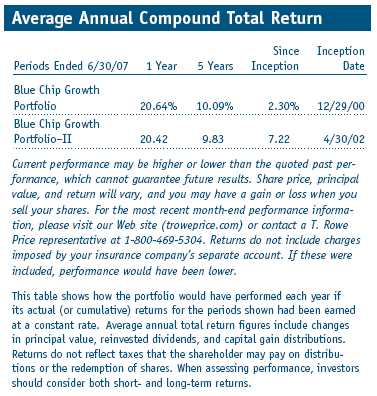
The portfolio produced strong absolute and relative returns that outperformed the S&P 500, the style-specific Russell 1000 Growth Index, and the Lipper average for the 6- and 12-month periods ended June 30, 2007. (Results for the II Class varied slightly, reflecting its different fee structure.)
The Blue Chip Growth Portfolio continued to compare quite favorably relative to its peer group over the longer term. Lipper ranked the portfolio in the top 22% of its large-cap growth funds universe for the one- and five-year periods ended June 30, 2007. (Based on cumulative total return, Lipper ranked the Blue Chip Growth Portfolio 37 out of 194, 62 out of 182, and 31 out of 143 funds in its Variable Annuity Underlying Large-Cap Growth Funds universe for the one-, three-, and five-year periods ended June 30, 2007, respectively. Past performance cannot guarantee future results.)
Market Environment
The Federal Reserve’s program of increasing interest rates has been on hold for the past year, and weakness in manufacturing and a continued housing slump have led to some slowing in inflation. However, energy and other commodity prices have risen, in part due to strength in Asian economies. There are also signs that U.S. economic growth may be rebounding from the first quarter’s anemic pace. Consequently, we think the Fed will be reluctant to lower short-term rates. Additionally, many of the world’s central banks continue to raise rates in response to robust growth in their economies. This also limits the flexibility the Fed has to lower rates in the U.S. This is especially true if the central bank wants to maintain interest rate parity and not contribute to additional dollar weakness.
The market faces issues that could impede further gains. Weakness in the housing market and the inability of some subprime mortgage borrowers to make their mortgage payments have led to a sharp increase in delinquencies and, ultimately, losses for subprime mortgage holders. Because a number of these mortgages have been packaged and sold in various financial instruments such as collateralized debt obligations (CDOs), there is some fear that there will be significant additional losses for investors in these securities. An increase in mortgage losses is certainly noteworthy, and several major CDO holders have already experienced difficulties. We are watching the developments in this area carefully. While we believe that some financial companies, without significant direct exposure to this market, have been incorrectly punished, more serious deterioration in housing and mortgage credit quality is a significant risk for the economy and financial markets.
We believe that corporate earnings, interest rates (inflation), and valuation will continue to be the primary determinants of long-term stock performance. As we noted in our year-end letter, discerning the direction of these indicators is perhaps more challenging than usual, and the recent strength in energy and other commodities, as well as general economic resilience, argue against the Federal Reserve lowering rates in the near future. However, the strong growth in Asia, Europe, and many international markets augurs well for earnings growth at many multinational companies. Finally, valuation is often underestimated as a determinant of future stock performance. While we recognize that valuation is less supportive given the strong stock market gains over the last year, we believe that valuations are reasonable, particularly for many large-cap, consistent-growth companies.
Portfolio Review
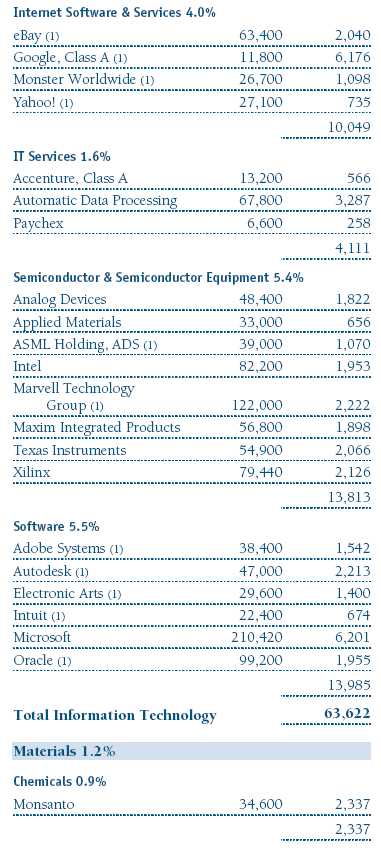
Information technology stocks were the portfolio’s largest first-half contributors. As is frequently the case in investing, a controversial area can subsequently yield good results, particularly if stock selection is sound. Apple continued to generate substantial gains for your portfolio as it launched several innovative products. While the iPhone appears to have generated the most interest, Apple TV—a product designed to link televisions and computers more effectively—and enhancements to the iPod and Macintosh personal computer are also noteworthy. Google was also a standout performer. The company continued to take market share in Internet search, and it expanded profitably into banner advertising, video and applications software, and security. Juniper Networks recorded good gains thanks to key management changes and the launch of several new products. It has also benefited, along with Cisco Systems, from growing networking infrastructure spending in global markets. Nokia generated robust sales of advanced wireless handsets, as did one of its key suppliers, Texas Instruments. Patience with tech leaders EMC and Intel also paid off. EMC has had tremendous success with its WMware virtual software and storage products, and Intel appears to have reestablished product innovation and cost leadership. Software manufacturers Autodesk, a leading maker of computer-aided drafting applications, and Oracle contributed solid gains. (Please refer to the portfolio of investments for a complete listing of holdings and the amount each represents in the portfolio.)
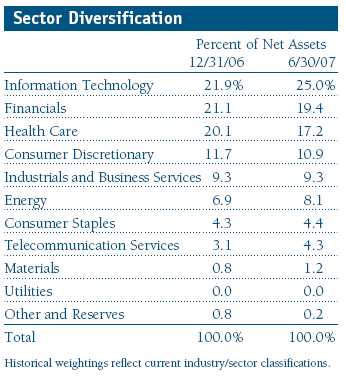
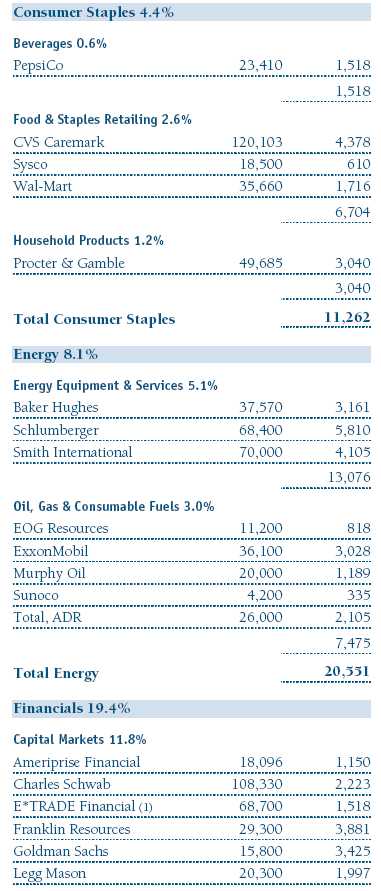
Energy was the second-largest sector contributor to the portfolio’s six-month results. Our energy analyst has had some keen insights in the services area. He has favored Schlumberger, Smith International, and Baker Hughes, and each has been a major long-term winner. All of these companies are industry leaders, and generate strong free cash flow and return on equity. Total and ExxonMobil have also been well managed, and both stocks performed well.
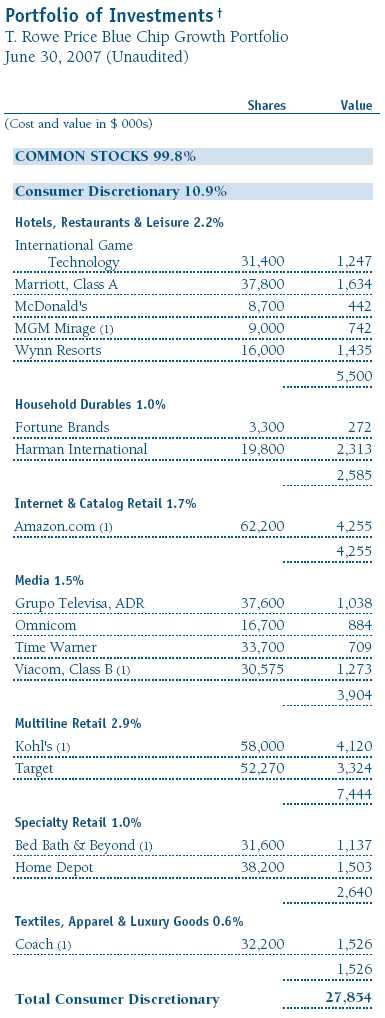
Consumer discretionary is a diverse sector that contained several big gainers for the portfolio. Online retailer Amazon.com was our best contributor for the last six months. Our analyst correctly foresaw that the company’s operating margins would begin to expand just at the time that several new product initiatives were accelerating revenues. Traditional multiline retailers, Target and Kohl’s, also performed quite well. While retailing stocks have come under pressure recently, we believe these two companies will continue to take market share and grow profitably. As large-cap growth managers, we typically have not had many companies acquired by private capital concerns. However, Harman International (a leader in navigation and entertainment systems for autos and boats) received a purchase offer resulting in solid appreciation.
Although our holdings in the telecommunication services sector are somewhat limited, we had several major winners. America Movil, a dominant provider of wireless telecom services in Latin America, has been a stellar performer for the portfolio for several years. It has more than 125 million subscribers in 15 countries and generates strong free cash flow. Rogers Communications also produced excellent gains. It is a leading provider of wireless and cable services in Canada and is enjoying faster subscriber growth than most of its competitors. American Tower was another solid first-half gainer. The company continued to benefit from growth in wireless voice and data communications. It has a very stable, profitable business model and benefits from the price escalators incorporated in its long-term contracts.
Health care was another positive sector worthy of mention. Pharmacy benefits managers continued to generate good earnings and free cash flow growth as mail order and generic drugs proliferate. Medco and Express Scripts, and CVS Caremark, now categorized as a consumer staples holding, were solid first-half performers. While CVS Caremark faces a challenging merger integration, we think highly of the management team and like the core drugstore operation, which is a highly profitable and growing business.
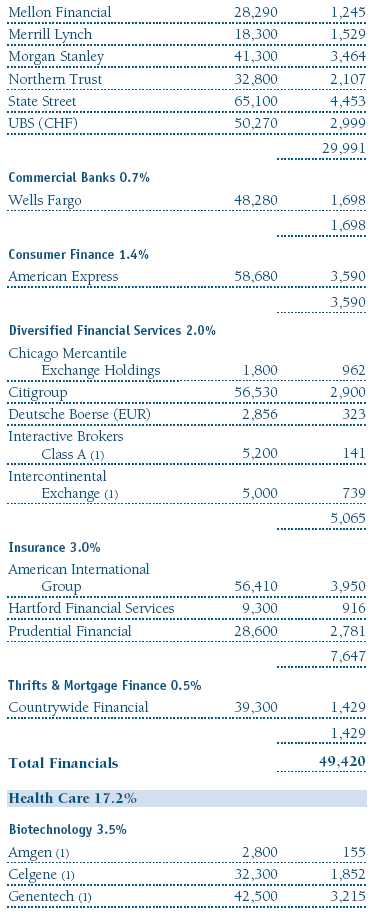
We had a few significant negative performers in the health care sector as well. Biotech giant Amgen was the portfolio’s largest detractor for the six-month period. The company suffered a number of setbacks in its largest class of products, which includes Aranesp, used to help chemotherapy patients battle anemia. The Food and Drug Administration cited concerns regarding the drug’s safety and efficacy. Amgen also experienced some disappointment with a major product in its pipeline (Vectibix, for colon cancer). While we think it is possible for Amgen to overcome these issues, we significantly reduced our position because Aranesp represents such a large portion of the company’s revenues.
Drug manufacturer Sepracor and biotech holding Genentech were also disappointing. Sepracor suffered due to a severe reduction in reimbursement for one of its key respiratory products and slower-than-expected growth for insomnia drug Lunesta. Genentech’s stock fell because investors feared that Avastin, its major cancer drug, would generate less-than-expected growth after a key trial showed that a reduced dose was just as effective for lung cancer patients. While we are wary that Avastin could prove to be disappointing, we think that other products and the firm’s research and development efforts are doing well. We believe the stock is as inexpensive as it has been in several years and added to our holdings during the period.
Several financial stocks, including Citigroup, Merrill Lynch, and Countrywide Financial, performed poorly in the first half due to rising interest rates and concerns surrounding credit quality and the subprime mortgage debacle. As noted earlier, our view of the housing market, subprime mortgage quality, and overall credit quality caused us to be cautious. However, that view did not lead us to believe that all financial stocks would underperform, and several financial stocks were, in fact, solid first-half performers.
Strategy
We target companies with durable, sustainable earnings and cash flow growth. The free cash flow we prize has become even more valuable now that tax laws treat dividends more favorably.
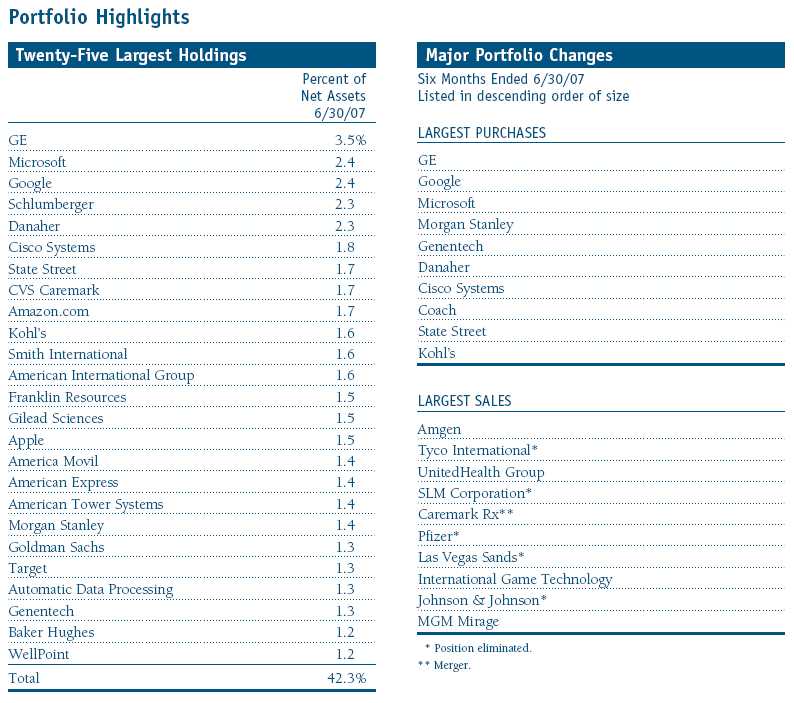
Over the past six months we made substantial additions to existing holdings, including GE, Google, and Microsoft, as shown in our table of largest purchases on page 6. Drug makers Merck and Schering-Plough were our largest purchases among our new holdings in the first half of 2007. Merck continued to generate earnings surprises as new products such as diabetes drug Januvia and cervical cancer vaccine Gardasil thrive and expenses are tightly controlled. Schering-Plough continues to show industry-leading earnings growth due to the strength of its cholesterol-lowering drug franchise. Foster Wheeler, a leading engineering and construction company, was also among our largest purchases and a new portfolio holding that has already performed well. Our analyst believes that it will continue to excel, based on the company’s large and growing backlog of energy and power projects and its focus on maintaining industry-leading profit margins.
Our most significant sales included Amgen and UnitedHealth Group and eliminations of Tyco International, SLM Corporation, Pfizer, and Johnson & Johnson. Tyco had been a good performer but we decided to eliminate the position before it split into three companies. SLM received an acquisition offer from a private capital firm, and we locked in healthy gains on the position (the stock subsequently headed lower as there appears to be a possibility that the offer will be rescinded). Pfizer and Johnson & Johnson were eliminated due to concerns regarding their ability to show consistently strong earnings growth. Our analyst felt that there were several alternatives (including Merck and Schering-Plough) that were more compelling.
Outlook
Stocks have posted strong gains over the past year. Although we anticipated a decline in housing activity and housing prices, the correction could ultimately be worse than our fairly pessimistic view. If the problems in sub-prime mortgages spread, causing broad deterioration in credit quality or a contraction in credit, it would certainly be problematic for the stock market. Energy and commodity prices remain uncooperative, and geopolitical events could rattle the markets. Investors are also fixated on the Federal Reserve’s commentary. However, in our view, the Fed is unlikely to ease rates over the near term.
We have tried to carefully weigh these risks. We think the housing correction and subprime woes may be stubborn but still manageable in terms of their effect on economic growth. We are not looking for the Fed to cut rates but would also be surprised if rates were hiked significantly. Ultimately, we feel the prospects for corporate earnings growth and relatively stable interest rates are favorable. Valuations are clearly not as supportive as they were six or 12 months ago, given the recent gains. However, we think that high-quality, consistent-growth companies appear attractive. We believe a solid case can be made for investing in U.S. stocks for the following reasons:
1. Earnings growth remains strong at many high-quality U.S. companies, many of which do not need a robust economic recovery to produce strong profit growth.
2. The stocks of many consistent-growth companies remain reasonably valued despite the recent market rebound.
3. Companies have reduced expenses significantly. Consequently, a continued pickup in revenue growth could result in strong profit growth.
4. Many of our holdings generate significant free cash flow, and free cash flow margins are at multi-decade highs. Shareholder-oriented management can use this cash to pay dividends, repurchase shares, or make value-added acquisitions.
We continue to strive to enhance returns while managing risk by investing in quality companies with durable, sustainable earnings and cash flow growth. We appreciate your continued confidence in this endeavor.
Respectfully submitted,

Larry J. Puglia
President and Chairman of the Investment Advisory Committee
July 20, 2007
The committee chairman has day-to-day responsibility for managing the portfolio and works with committee members in developing and executing the portfolio’s investment program.
The portfolio’s share price can fall because of weakness in the stock markets, a particular industry, or specific holdings. Stock markets can decline for many reasons, including adverse political or economic developments, changes in investor psychology, or heavy institutional selling. The prospects for an industry or company may deteriorate because of a variety of factors, including disappointing earnings or changes in the competitive environment. In addition, the investment manager’s assessment of companies held in a portfolio may prove incorrect, resulting in losses or poor performance even in rising markets. Growth stocks can be volatile because these companies usually invest a high portion of earnings in their businesses, and earnings disappointments often lead to sharply falling prices. The value approach carries the risk that a security’s intrinsic value may not be recognized for a long time or that the stock may actually be appropriately priced.
Dividend yield: The annual dividend of a stock divided by the stock’s price.
Free cash flow: The excess cash a company is generating from its operations that can be taken out of the business for the benefit of shareholders, such as dividends, share repurchases, investments, and acquisitions.
Lipper averages: The average returns of all portfolios in a particular category as tracked by Lipper Inc.
Price/book ratio: A valuation measure that compares a stock’s market price to its book value, i.e., the company’s net worth divided by the number of outstanding shares.
Price/earnings ratio (P/E): A valuation measure calculated by dividing the price of a stock by its current or projected earnings per share. This ratio gives investors an idea of how much they are paying for current or future earnings power.
Russell 1000 Growth Index: Market capitalization-weighted index of those firms in the Russell 1000 with higher price-to-book ratios and higher forecasted growth values.
S&P 500 Stock Index: An unmanaged index that tracks the stocks of 500 primarily large-cap U.S. companies.
Performance and Expenses
T. Rowe Price Blue Chip Growth Portfolio
This chart shows the value of a hypothetical $10,000 investment in the fund over the past 10 fiscal year periods or since inception (for funds lacking 10-year records). The result is compared with benchmarks, which may include a broad-based market index and a peer group average or index. Market indexes do not include expenses, which are deducted from fund returns as well as mutual fund averages and indexes.
Fund Expense Example
As a mutual fund shareholder, you may incur two types of costs: (1) transaction costs, such as redemption fees or sales loads, and (2) ongoing costs, including management fees, distribution and service (12b-1) fees, and other fund expenses. The following example is intended to help you understand your ongoing costs (in dollars) of investing in the fund and to compare these costs with the ongoing costs of investing in other mutual funds. The example is based on an investment of $1,000 invested at the beginning of the most recent six-month period and held for the entire period.
Shares of the fund are currently offered only through certain insurance companies as an investment medium for both variable annuity contracts and variable life insurance policies. Please note that the fund has two classes of shares: the original share class and II Class. II Class shares are sold through financial intermediaries, which are compensated for distribution, shareholder servicing, and/or certain administrative services under a Board-approved Rule 12b-1 plan.
Actual Expenses
The first line of the following table (“Actual”) provides information about actual account values and actual expenses. You may use the information in this line, together with your account balance, to estimate the expenses that you paid over the period. Simply divide your account value by $1,000 (for example, an $8,600 account value divided by $1,000 = 8.6), then multiply the result by the number in the first line under the heading “Expenses Paid During Period” to estimate the expenses you paid on your account during this period.
Hypothetical Example for Comparison Purposes
The information on the second line of the table (“Hypothetical”) is based on hypothetical account values and expenses derived from the fund’s actual expense ratio and an assumed 5% per year rate of return before expenses (not the fund’s actual return). You may compare the ongoing costs of investing in the fund with other funds by contrasting this 5% hypothetical example and the 5% hypothetical examples that appear in the shareholder reports of the other funds. The hypothetical account values and expenses may not be used to estimate the actual ending account balance or expenses you paid for the period.
You should also be aware that the expenses shown in the table highlight only your ongoing costs and do not reflect any transaction costs, such as redemption fees or sales loads. Therefore, the second line of the table is useful in comparing ongoing costs only, and will not help you determine the relative total costs of owning different funds. To the extent a fund charges transaction costs, however, the total cost of owning that fund is higher.

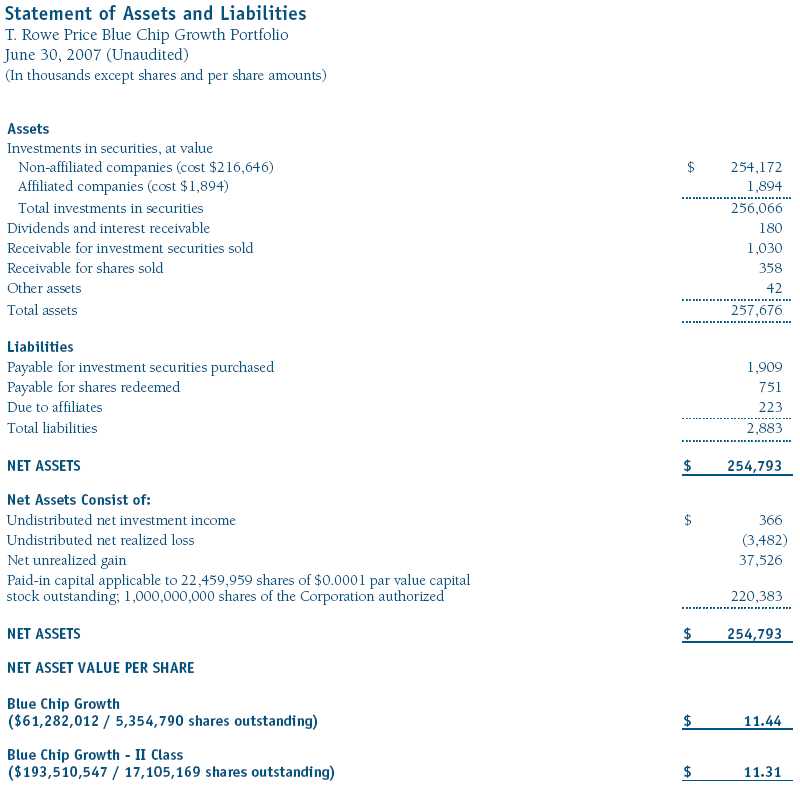
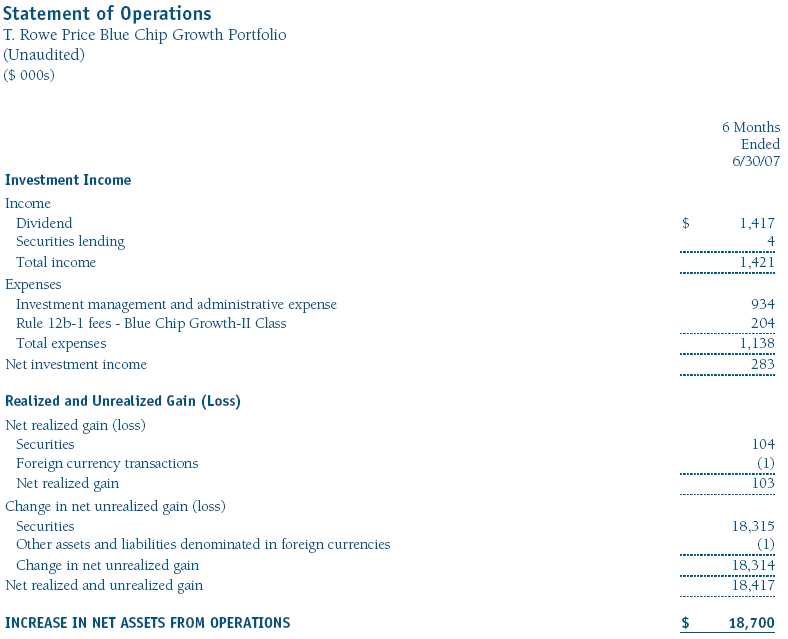
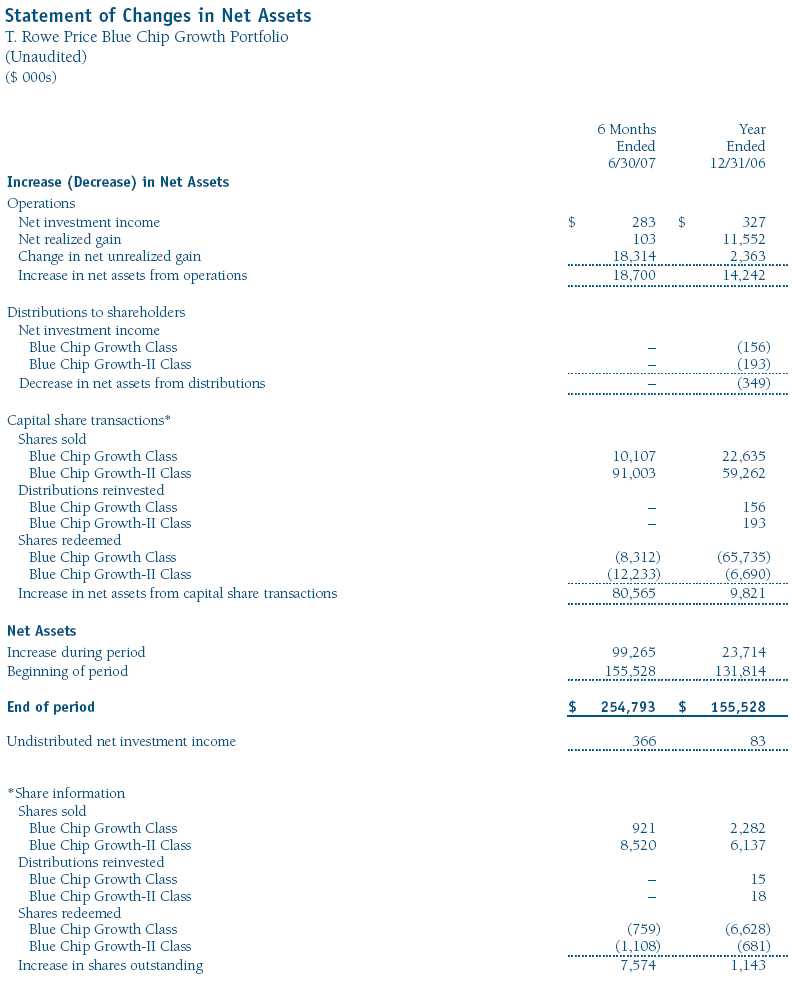
The accompanying notes are an integral part of these financial statements.
The accompanying notes are an integral part of these financial statements.


The accompanying notes are an integral part of these financial statements.
The accompanying notes are an integral part of these financial statements.
The accompanying notes are an integral part of these financial statements.
The accompanying notes are an integral part of these financial statements.
Notes to Financial Statements
T. Rowe Price Blue Chip Growth Portfolio
June 30, 2007 (Unaudited)
NOTE 1 - SIGNIFICANT ACCOUNTING POLICIES
T. Rowe Price Equity Series, Inc. (the corporation), is registered under the Investment Company Act of 1940 (the 1940 Act). The Blue Chip Growth Portfolio (the fund) is a diversified, open-end management investment company and is one portfolio established by the corporation. The fund seeks to provide long-term capital growth. Income is a secondary objective. Shares of the fund are currently offered only through certain insurance companies as an investment medium for both variable annuity contracts and variable life insurance policies. The fund has two classes of shares: the Blue Chip Growth Portfolio original share class (Blue Chip Growth Class), offered since December 29, 2000, and Blue Chip Growth–II (Blue Chip Growth-II Class), offered since April 30, 2002. Blue Chip Growth Portfolio–II Class shares are sold through financial intermediaries, which it compensates for distribution, shareholder servicing, and/or certain administrative services under a Board-approved Rule 12b-1 plan. Each class has exclusive voting rights on matters related solely to that class, separate voting rights on matters that relate to both classes, and, in all other respects, the same rights and obligations as the other class.
The accompanying financial statements were prepared in accordance with accounting principles generally accepted in the United States of America, which require the use of estimates made by fund management. Fund management believes that estimates and security valuations are appropriate; however, actual results may differ from those estimates, and the security valuations reflected in the financial statements may differ from the value the fund ultimately realizes upon sale of the securities.
Valuation The fund values its investments and computes its net asset value per share at the close of the New York Stock Exchange (NYSE), normally 4 p.m. ET, each day that the NYSE is open for business. Equity securities listed or regularly traded on a securities exchange or in the over-the-counter (OTC) market are valued at the last quoted sale price or, for certain markets, the official closing price at the time the valuations are made, except for OTC Bulletin Board securities, which are valued at the mean of the latest bid and asked prices. A security that is listed or traded on more than one exchange is valued at the quotation on the exchange determined to be the primary market for such security. Listed securities not traded on a particular day are valued at the mean of the latest bid and asked prices for domestic securities and the last quoted sale price for international securities. Investments in mutual funds are valued at the mutual fund’s closing net asset value per share on the day of valuation.
Other investments, including restricted securities, and those for which the above valuation procedures are inappropriate or are deemed not to reflect fair value are stated at fair value as determined in good faith by the T. Rowe Price Valuation Committee, established by the fund’s Board of Directors.
Most foreign markets close before the close of trading on the NYSE. If the fund determines that developments between the close of a foreign market and the close of the NYSE will, in its judgment, materially affect the value of some or all of its portfolio securities, which in turn will affect the fund’s share price, the fund will adjust the previous closing prices to reflect the fair value of the securities as of the close of the NYSE, as determined in good faith by the T. Rowe Price Valuation Committee, established by the fund’s Board of Directors. A fund may also fair value securities in other situations, such as when a particular foreign market is closed but the fund is open. In deciding whether to make fair value adjustments, the fund reviews a variety of factors, including developments in foreign markets, the performance of U.S. securities markets, and the performance of instruments trading in U.S. markets that represent foreign securities and baskets of foreign securities. The fund uses outside pricing services to provide it with closing market prices and information used for adjusting those prices. The fund cannot predict when and how often it will use closing prices and when it will adjust those prices to reflect fair value. As a means of evaluating its fair value process, the fund routinely compares closing market prices, the next day’s opening prices in the same markets, and adjusted prices.
Currency Translation Assets, including investments, and liabilities denominated in foreign currencies are translated into U.S. dollar values each day at the prevailing exchange rate, using the mean of the bid and asked prices of such currencies against U.S. dollars as quoted by a major bank. Purchases and sales of securities, income, and expenses are translated into U.S. dollars at the prevailing exchange rate on the date of the transaction. The effect of changes in foreign currency exchange rates on realized and unrealized security gains and losses is reflected as a component of security gains and losses.
Class Accounting Blue Chip Growth–II pays distribution, shareholder servicing, and/or certain administrative expenses in the form of Rule 12b-1 fees, in an amount not exceeding 0.25% of the class’s average daily net assets. Management and administrative fee expenses, investment income, and realized and unrealized gains and losses are allocated to the classes based upon the relative daily net assets of each class.
Rebates Subject to best execution, the fund may direct certain security trades to brokers who have agreed to rebate a portion of the related brokerage commission to the fund in cash. Commission rebates are reflected as realized gain on securities in the accompanying financial statements and totaled $4,000 for the six months ended June 30, 2007.
Investment Transactions, Investment Income, and Distributions Income and expenses are recorded on the accrual basis. Dividends received from mutual fund investments are reflected as dividend income; capital gain distributions are reflected as realized gain/loss. Dividend income and capital gain distributions are recorded on the ex-dividend date. Any income tax-related interest and penalties would be classified as income tax expense. Investment transactions are accounted for on the trade date. Realized gains and losses are reported on the identified cost basis. Distributions to shareholders are recorded on the ex-dividend date. Income distributions are declared and paid by each class on an annual basis. Capital gain distributions, if any, are declared and paid by the fund, typically on an annual basis.
New Accounting Pronouncements Effective June 29, 2007, the fund adopted Financial Accounting Standards Board (“FASB”) Interpretation No. 48 (“FIN 48”), Accounting for Uncertainty in Income Taxes, a clarification of FASB Statement No. 109, Accounting for Income Taxes. FIN 48 establishes financial accounting and disclosure requirements for recognition and measurement of tax positions taken or expected to be taken on an income tax return. The adoption of FIN 48 had no impact on the fund’s net assets or results of operations.
In September 2006, the FASB released the Statement of Financial Accounting Standard No. 157 (“FAS 157”), Fair Value Measurements. FAS 157 clarifies the definition of fair value and establishes the framework for measuring fair value, as well as proper disclosure of this methodology in the financial statements. It will be effective for the fund’s fiscal year beginning January 1, 2008. Management is evaluating the effects of FAS 157; however, it is not expected to have a material impact on the fund’s net assets or results of operations.
NOTE 2 - INVESTMENT TRANSACTIONS
Consistent with its investment objective, the fund engages in the following practices to manage exposure to certain risks or to enhance performance. The investment objective, policies, program, and risk factors of the fund are described more fully in the fund’s prospectus and Statement of Additional Information.
Securities Lending The fund lends its securities to approved brokers to earn additional income. It receives as collateral cash and U.S. government securities valued at 102% to 105% of the value of the securities on loan. Cash collateral is invested in a money market pooled trust managed by the fund’s lending agent in accordance with investment guidelines approved by fund management. Collateral is maintained over the life of the loan in an amount not less than the value of loaned securities, as determined at the close of fund business each day; any additional collateral required due to changes in security values is delivered to the fund the next business day. Although risk is mitigated by the collateral, the fund could experience a delay in recovering its securities and a possible loss of income or value if the borrower fails to return the securities. Securities lending revenue recognized by the fund consists of earnings on invested collateral and borrowing fees, net of any rebates to the borrower and compensation to the lending agent. At June 30, 2007, there were no securities on loan.
Other Purchases and sales of portfolio securities, other than short-term and U.S. government securities, aggregated $104,645,000 and $23,125,000, respectively, for the six months ended June 30, 2007.
NOTE 3 - FEDERAL INCOME TAXES
No provision for federal income taxes is required since the fund intends to continue to qualify as a regulated investment company under Subchapter M of the Internal Revenue Code and distribute to shareholders all of its taxable income and gains. Federal income tax regulations differ from generally accepted accounting principles; therefore, distributions determined in accordance with tax regulations may differ in amount or character from net investment income and realized gains for financial reporting purposes. Financial reporting records are adjusted for permanent book/tax differences to reflect tax character. Financial records are not adjusted for temporary differences. The amount and character of tax-basis distributions and composition of net assets are finalized at fiscal year-end; accordingly, tax-basis balances have not been determined as of June 30, 2007.
The fund intends to retain realized gains to the extent of available capital loss carryforwards. As of December 31, 2006, the fund had $3,584,000 of unused capital loss carryforwards, of which $435,000 expire in 2009, $491,000 expire in 2010, $335,000 expire in 2011, $1,272,000 expire in 2013, and $1,051,000 expire in 2014.
At June 30, 2007, the cost of investments for federal income tax purposes was $218,540,000. Net unrealized gain aggregated $37,526,000 at period-end, of which $39,221,000 related to appreciated investments and $1,695,000 related to depreciated investments.
NOTE 4 - RELATED PARTY TRANSACTIONS
The fund is managed by T. Rowe Price Associates, Inc. (the manager or Price Associates), a wholly owned subsidiary of T. Rowe Price Group, Inc. The investment management and administrative agreement between the fund and the manager provides for an all-inclusive annual fee equal to 0.85% of the fund’s average daily net assets. The fee is computed daily and paid monthly. The agreement provides that investment management, shareholder servicing, transfer agency, accounting, custody services, and directors’ fees and expenses are provided to the fund, and interest, taxes, brokerage commissions, and extraordinary expenses are paid directly by the fund.
The fund may invest in the T. Rowe Price Reserve Investment Fund and the T. Rowe Price Government Reserve Investment Fund (collectively, the T. Rowe Price Reserve Investment Funds), open-end management investment companies managed by Price Associates and affiliates of the fund. The T. Rowe Price Reserve Investment Funds are offered as cash management options to mutual funds, trusts, and other accounts managed by Price Associates and/or its affiliates, and are not available for direct purchase by members of the public. The T. Rowe Price Reserve Investment Funds pay no investment management fees. During the six months ended June 30, 2007, dividend income from the T. Rowe Price Reserve Investment Funds totaled $84,000, and the value of shares of the T. Rowe Price Reserve Investment Funds held at June 30, 2007, and December 31, 2006, was $1,894,000 and $1,343,000, respectively.
| Information on Proxy Voting Policies, Procedures, and Records |
A description of the policies and procedures used by T. Rowe Price funds and portfolios to determine how to vote proxies relating to portfolio securities is available in each fund’s Statement of Additional Information, which you may request by calling 1-800-225-5132 or by accessing the SEC’s Web site, www.sec.gov. The description of our proxy voting policies and procedures is also available on our Web site, www.troweprice.com. To access it, click on the words “Company Info” at the top of our homepage for individual investors. Then, in the window that appears, click on the “Proxy Voting Policy” navigation button in the top left corner.
Each fund’s most recent annual proxy voting record is available on our Web site and through the SEC’s Web site. To access it through our Web site, follow the directions above, then click on the words “Proxy Voting Record” at the bottom of the Proxy Voting Policy page.
| How to Obtain Quarterly Portfolio Holdings |
The fund files a complete schedule of portfolio holdings with the Securities and Exchange Commission for the first and third quarters of each fiscal year on Form N-Q. The fund’s Form N-Q is available electronically on the SEC’s Web site (www.sec.gov); hard copies may be reviewed and copied at the SEC’s Public Reference Room, 450 Fifth St. N.W., Washington, DC 20549. For more information on the Public Reference Room, call 1-800-SEC-0330.
| Approval of Investment Management Agreement |
On March 7, 2007, the fund’s Board of Directors (Board) unanimously approved the investment advisory contract (Contract) between the fund and its investment manager, T. Rowe Price Associates, Inc. (Manager). The Board considered a variety of factors in connection with its review of the Contract, also taking into account information provided by the Manager during the course of the year, as discussed below:
Services Provided by the Manager
The Board considered the nature, quality, and extent of the services provided to the fund by the Manager. These services included, but were not limited to, management of the fund’s portfolio and a variety of related activities, as well as financial and administrative services, reporting, and communications. The Board also reviewed the background and experience of the Manager’s senior management team and investment personnel involved in the management of the fund. The Board concluded that it was satisfied with the nature, quality, and extent of the services provided by the Manager.
Investment Performance of the Fund
The Board reviewed the fund’s average annual total return over the 1-, 3-, 5-, and 10-year and since-inception periods as well as the fund’s year-by-year returns and compared these returns with previously agreed upon comparable performance measures and market data, including those supplied by Lipper and Morningstar, which are independent providers of mutual fund data. On the basis of this evaluation and the Board’s ongoing review of investment results, the Board concluded that the fund’s performance was satisfactory.
Costs, Benefits, Profits, and Economies of Scale
The Board reviewed detailed information regarding the revenues received by the Manager under the Contract and other benefits that the Manager (and its affiliates) may have realized from its relationship with the fund, including research received under “soft dollar” agreements. The Board noted that soft dollars were not used to pay for third-party, non-broker research. The Board also received information on the estimated costs incurred and profits realized by the Manager and its affiliates from advising T. Rowe Price mutual funds, as well as estimates of the gross profits realized from managing the fund in particular. The Board concluded that the Manager’s profits were reasonable in light of the services provided to the fund. The Board also considered whether the fund or other funds benefit under the fee levels set forth in the Contract from any economies of scale realized by the Manager. The Board noted that, under the Contract, the fund pays the Manager a single fee based on the fund’s assets and the Manager, in turn, pays all expenses of the fund, with certain exceptions. The Board concluded that, based on the profitability data it reviewed and consistent with this single-fee structure, the Contract provided for a reasonable sharing of benefits from any economies of scale with the fund.
Fees
The Board reviewed the fund’s single-fee structure and compared the rate with fees and expenses of other comparable funds based on information and data supplied by Lipper. The information provided to the Board indicated that the fund’s single-fee rate was generally at or below the median management fee rate and expense ratio for comparable funds. The Board also reviewed the expense ratio of the fund’s Class II share class, which pays a 12b-1 fee in addition to the single fee, and compared this expense ratio to the fees and expenses of comparable funds. The information provided to the Board indicated that the expense ratio for the Class II share class was generally below the median expense ratio for comparable funds. The Board also reviewed the fee schedules for comparable privately managed accounts of the Manager and its affiliates. Management informed the Board that the Manager’s responsibilities for privately managed accounts are more limited than its responsibilities for the fund and other T. Rowe Price mutual funds that it or its affiliates advise. On the basis of the information provided, the Board concluded that the fees paid by the fund under the Contract were reasonable.
Approval of the Contract
As noted, the Board approved the continuation of the Contract. No single factor was considered in isolation or to be determinative to the decision. Rather, the Board concluded, in light of a weighting and balancing of all factors considered, that it was in the best interests of the fund to approve the continuation of the Contract, including the fees to be charged for services thereunder.
Item 2. Code of Ethics.
A code of ethics, as defined in Item 2 of Form N-CSR, applicable to its principal executive officer, principal financial officer, principal accounting officer or controller, or persons performing similar functions is filed as an exhibit to the registrant’s annual Form N-CSR. No substantive amendments were approved or waivers were granted to this code of ethics during the registrant’s most recent fiscal half-year.
Item 3. Audit Committee Financial Expert.
Disclosure required in registrant’s annual Form N-CSR.
Item 4. Principal Accountant Fees and Services.
Disclosure required in registrant’s annual Form N-CSR.
Item 5. Audit Committee of Listed Registrants.
Not applicable.
Item 6. Schedule of Investments.
Not applicable. The complete schedule of investments is included in Item 1 of this Form N-CSR.
Item 7. Disclosure of Proxy Voting Policies and Procedures for Closed-End Management Investment Companies.
Not applicable.
Item 8. Portfolio Managers of Closed-End Management Investment Companies.
Not applicable.
Item 9. Purchases of Equity Securities by Closed-End Management Investment Company and Affiliated Purchasers.
Not applicable.
Item 10. Submission of Matters to a Vote of Security Holders.
Not applicable.
Item 11. Controls and Procedures.
(a) The registrant’s principal executive officer and principal financial officer have evaluated the registrant’s disclosure controls and procedures within 90 days of this filing and have concluded that the registrant’s disclosure controls and procedures were effective, as of that date, in ensuring that information required to be disclosed by the registrant in this Form N-CSR was recorded, processed, summarized, and reported timely.
(b) The registrant’s principal executive officer and principal financial officer are aware of no change in the registrant’s internal control over financial reporting that occurred during the registrant’s second fiscal quarter covered by this report that has materially affected, or is reasonably likely to materially affect, the registrant’s internal control over financial reporting.
Item 12. Exhibits.(a)(1) The registrant’s code of ethics pursuant to Item 2 of Form N-CSR is filed with the registrant’s annual Form N-CSR.
(2) Separate certifications by the registrant's principal executive officer and principal financial officer, pursuant to Section 302 of the Sarbanes-Oxley Act of 2002 and required by Rule 30a-2(a) under the Investment Company Act of 1940, are attached.
(3) Written solicitation to repurchase securities issued by closed-end companies: not applicable.
(b) A certification by the registrant's principal executive officer and principal financial officer, pursuant to Section 906 of the Sarbanes-Oxley Act of 2002 and required by Rule 30a-2(b) under the Investment Company Act of 1940, is attached.
| |
| | |
SIGNATURES |
| |
| | Pursuant to the requirements of the Securities Exchange Act of 1934 and the Investment |
| Company Act of 1940, the registrant has duly caused this report to be signed on its behalf by the |
| undersigned, thereunto duly authorized. |
| |
| T. Rowe Price Equity Series, Inc. |
| |
| |
| By | /s/ Edward C. Bernard |
| | Edward C. Bernard |
| | Principal Executive Officer |
| |
| Date | August 17, 2007 |
| |
| |
| |
| | Pursuant to the requirements of the Securities Exchange Act of 1934 and the Investment |
| Company Act of 1940, this report has been signed below by the following persons on behalf of |
| the registrant and in the capacities and on the dates indicated. |
| |
| |
| By | /s/ Edward C. Bernard |
| | Edward C. Bernard |
| | Principal Executive Officer |
| |
| Date | August 17, 2007 |
| |
| |
| |
| By | /s/ Joseph A. Carrier |
| | Joseph A. Carrier |
| | Principal Financial Officer |
| |
| Date | August 17, 2007 |