| UNITED STATES |
| SECURITIES AND EXCHANGE COMMISSION |
| Washington, D.C. 20549 |
| |
FORM N-CSR |
| |
CERTIFIED SHAREHOLDER REPORT OF REGISTERED |
MANAGEMENT INVESTMENT COMPANIES |
| |
| |
| |
| Investment Company Act File Number: 811-07143 |
|
| |
| T. Rowe Price Equity Series, Inc. |
|
| (Exact name of registrant as specified in charter) |
| |
| 100 East Pratt Street, Baltimore, MD 21202 |
|
| (Address of principal executive offices) |
| |
| David Oestreicher |
| 100 East Pratt Street, Baltimore, MD 21202 |
|
| (Name and address of agent for service) |
| |
| |
| Registrant’s telephone number, including area code: (410) 345-2000 |
| |
| |
| Date of fiscal year end: December 31 |
| |
| |
| Date of reporting period: June 30, 2008 |
Item 1: Report to Shareholders| New America Growth Portfolio | June 30, 2008 |
The views and opinions in this report were current as of June 30, 2008. They are not guarantees of performance or investment results and should not be taken as investment advice. Investment decisions reflect a variety of factors, and the managers reserve the right to change their views about individual stocks, sectors, and the markets at any time. As a result, the views expressed should not be relied upon as a forecast of the fund’s future investment intent. The report is certified under the Sarbanes-Oxley Act, which requires mutual funds and other public companies to affirm that, to the best of their knowledge, the information in their financial reports is fairly and accurately stated in all material respects.
Manager’s Letter
T. Rowe Price New America Growth Portfolio
Dear Investor
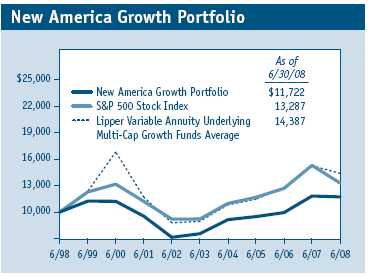
Larger-cap growth stocks delivered negative returns in the six-month period, plagued by numerous concerns such as record energy prices, rising unemployment, falling home values, and the continued crisis of confidence in the credit and financial markets. The New America Growth Portfolio was not able to escape the sell-off but delivered superior relative results. The portfolio outperformed its benchmark index and the Lipper peer group average by a substantial margin in the past six months.
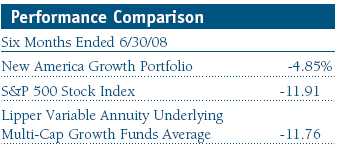
In the first half of 2008, our benchmarks, the S&P 500 Stock Index and the Lipper Variable Annuity Underlying Multi-Cap Growth Funds Average, declined 11.91% and 11.76%, respectively. While I’m never pleased to report a loss, I can take some solace in reporting that your fund declined a more modest 4.85% in the last six months. The portfolio outperformed thanks in large part to solid stock selection. Our holdings in the industrials and business services, information technology, and health care sectors all handily outperformed their respective sectors in the benchmark. The portfolio’s comparison with the benchmark also benefited from its minimal allocation in financials, which were the worst performers in the S&P 500.
Market Environment
There has been plenty of bad news so far in 2008, led by the continued increase in the price of oil, which rose approximately 40% during the past six months. The prices of other key commodities such as natural gas, steel, and food rose as well, further fueling inflation. The Commodity Research Bureau Index (CRB), a widely followed measure of commonly used commodities, rose approximately 30% in the past six months and has surged about 150% over the past five years.
Concurrent with the spike in commodity prices this year, the U.S. economy slowed significantly. While technically not yet in recession, commonly defined by two consecutive quarters of gross domestic product (GDP) contraction, the economy is soft and likely in recession as of this writing.
The financial crisis that began in mid-2007 continued to weigh on stocks during the first half of 2008. Since the near-collapse of Bear Stearns in March, numerous other investment and commercial banks have continued to write off billions of dollars of mortgage-backed securities, and many have been forced to raise additional capital while restraining loan growth just to remain solvent.
Housing prices continued to fall, setting off a wave of foreclosures across the United States. While the problems in the so-called subprime category of mortgages are well known, the past few months have seen an alarming uptick in delinquencies by those considered to be “prime” borrowers.
The seemingly daily chorus of bad news on inflation, the slowing economy, the financial sector, home prices, and rising unemployment created a very tough environment for equities—except for energy and commodity-related stocks. Energy was once again the best-performing sector during the first half of 2008 by a wide margin, rising almost 9% as a group within the S&P 500.
• Market volatility was extremely high in the first half of the year; larger-capitalization growth stocks generally outperformed their value counterparts.
• The New America Growth Portfolio posted a loss for the six months ended June 30, 2008, but outperformed its benchmark index and its Lipper peer group.
• Our energy and materials holdings were the best contributors for the past six months, while technology and consumer-related holdings detracted.
• We intend to maintain our disciplined investment approach and remain focused on a long-term time horizon to generate investment returns.
Of the other nine S&P 500 sectors, eight declined during the first half, and six posted double-digit losses. Financials were the worst performers, falling more than 30% in the period. The information technology, health care, industrials and business services, telecommunication services, and consumer discretionary groups each declined between 10% and 20%.
Portfolio Review
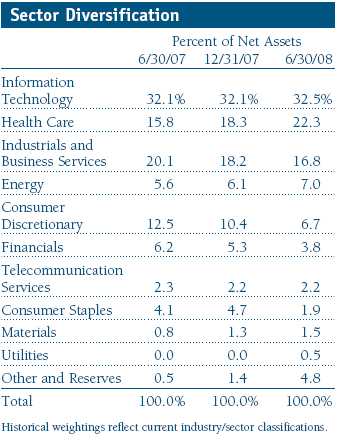
The portfolio remained broadly diversified with no single sector driving results. Our exposure to the energy sector helped the portfolio’s returns, as did our continued low exposure to financial stocks. On the other hand, the consumer-related sectors remained difficult, and our holdings in those areas hurt our performance. Health care and information technology continue to be significant areas of investment for the portfolio. Our performance within both of these sectors was mixed and driven by stock-specific issues.
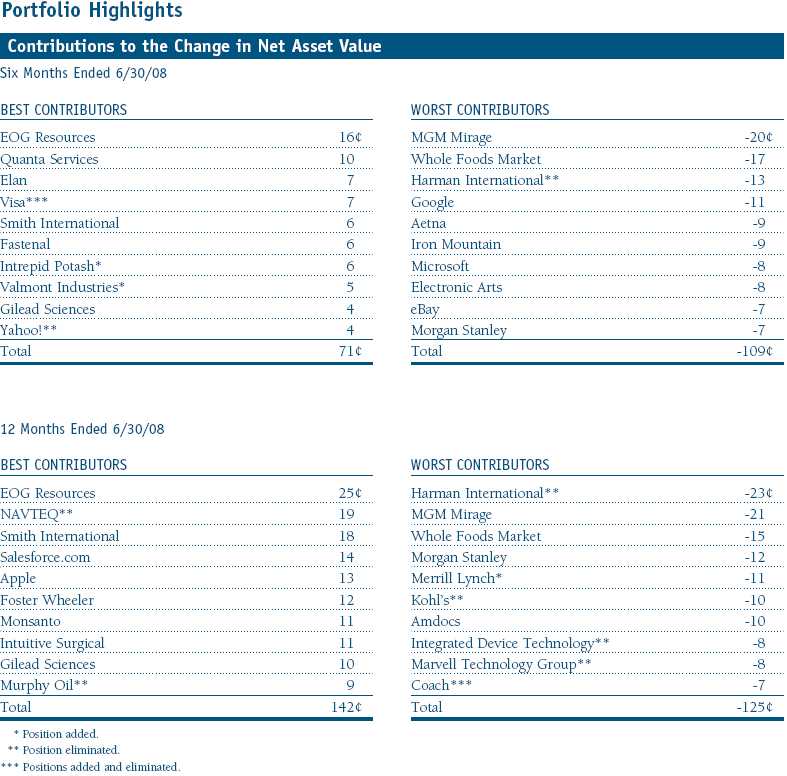
During the past six months, the portfolio’s top contributors came from a cross section of sectors. Among our 10 leading contributors to six-month performance, two came from the energy sector, three from industrials, two from health care, and one each from materials, technology, and financials.
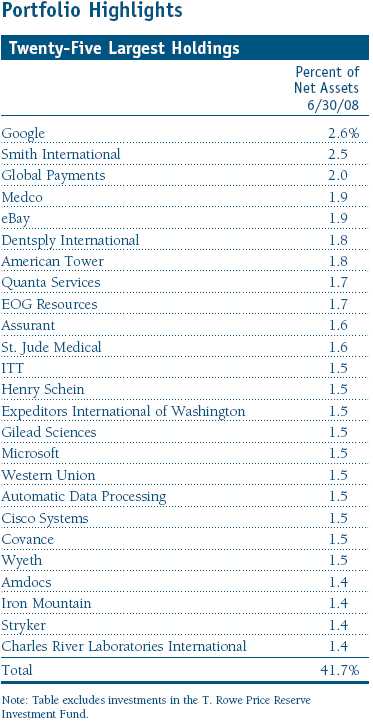
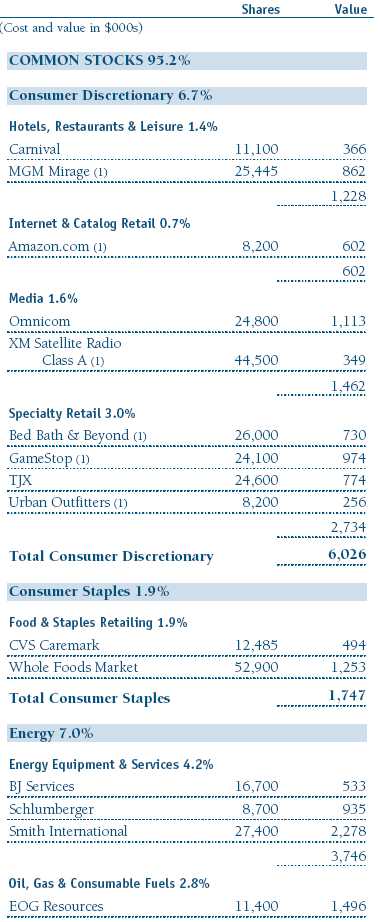
Our best contributor and longtime holding EOG Resources is an independent oil and gas exploration and production company. The stock rose significantly during the period thanks to higher energy prices and continued good news on the exploration front. Over the years, I have come to think of EOG as one of the most attractive and well-managed energy companies, which is why I continue to own a large stake. However, I have taken some profits from time to time as the position has grown.
I last wrote about Quanta Services a year ago, highlighting it as the type of company in which your portfolio seeks to invest. Quanta is a dominant player in the movement to remake the United States’ outdated electric transmission grid by providing labor and expertise to utilities. The stock has performed well, and the company has generated good revenue and earnings results. We are positive on its long-term prospects, which are supported by a significant number of new contracts—several are alternative-energy projects, including wind power.
Elan was the portfolio’s third-best contributor during the period. Longtime shareholders may remember that in early 2005, Elan’s promising new multiple sclerosis drug, Tysabri, was pulled from the market after several fatalities were reported. The stock fell as much as 85% in the ensuing months, but I maintained my position at the time because Elan was also developing a promising Alzheimer’s drug (bapineuzumab). Alzheimer’s is a devastating disease that is growing in incidence as the population ages, and current treatment options are inadequate at best. Elan’s drug has shown promising results and recently has moved into its final phase of development, surprising many naysayers and driving the stock’s good performance thus far in 2008. Like any major new drug development company, the risks to Elan remain very high, but the potential payoff could be the most transforming drug of the early years of this century.
The portfolio also benefited from acquisitions during the past six months. Yahoo! became the target of Microsoft’s $31 per share buyout offer earlier this year, driving the stock up about 50%. I chose to eliminate Yahoo! as it approached the buyout price when it became clear to me that Yahoo! management was more concerned with its own self-preservation than doing what is in the best interests of shareholders.
Another core holding, ChoicePoint, was also engaged in a takeover, although this one was a friendly offer from European rival Reed Elsevier. Admittedly, ChoicePoint had been a frustrating investment over the past few years, but my positive long-term view of its business, and my belief that the strong management team would ultimately create shareholder value, paid off in the end.
The portfolio’s largest performance detractors during the six-month period were not quite as broad-based as the contributors—half of our top 10 detractors were consumer-oriented stocks.
The portfolio’s biggest detractor for the past six months was casino operator MGM Mirage, which fell sharply during the period as Las Vegas tourism softened. While the short-term negative trends are undeniable, I continue to like MGM longer term. I see the current downturn in Vegas vacations as more cyclical than permanent, and I like management’s longer-term business strategy, including selling off some of its highly valued real estate holdings.
Whole Foods Market was our second-biggest detractor, again plagued by softening consumer spending. Once a consistent double-digit same-store sales grower, Whole Food’s sales have slipped to the mid-single digits in recent periods and could fall further in the near term. Once again, I believe taking a longer-term view will pay off. The Whole Foods business model is strong, and I still believe the trend toward healthier eating and organics will strengthen in the future. The company continues to be the leader in the category, even more so now that it has acquired the number-two player, Wild Oats. Yet, with fewer than 300 stores in the United States and Europe, I believe the concept has many more years of growth ahead of it. Meanwhile, I expect management to take steps to align the business with the current consumer reality, meaning more of a focus on expense reduction and a slower pace of new-store growth. While it is tough to predict the near-term performance, I believe Whole Foods will be a solid contributor over the long term.
Harman International was also a significant detractor. Internally, the company is still reeling from the failed acquisition by KKR last year, although new management is in place and has a solid long-term plan for improving the performance of the business. Unfortunately, external factors, such as weak consumer spending and falling automotive production are likely to continue to weigh on the stock.
Some of the portfolio’s more significant purchases during the first six months included Medco Health Solutions and GameStop. Medco is a high-quality pharmacy benefit manager (PBM) whose growth is largely being driven by the adoption of lower-cost generic drugs. Each year, more expensive branded drugs “go generic” as patents expire. With the biggest wave of patent expirations slated for the period 2010 to 2012, we believe Medco should continue to prosper and grow its profits at well-above-average rates for many more years to come.
GameStop is the leading video game hardware and software retailer. The company is benefiting from recently introduced game hardware such as the highly successful Nintendo Wii and the ensuing cycle of new game titles. The company also has a unique and highly profitable used game business whereby it purchases used games at discount prices, putting money in its consumer’s pocket in the process, and then resells them with a nice markup. Despite having some of the best fundamentals in the consumer space and a bright outlook, the stock has suffered the same fate as most retailers.
Outlook
I do not expect many of the clouds hanging over the market to lift before year-end. Housing will likely remain weak, unemployment could climb further, and more bad news could surface in the financial sector, possibly including some bank failures. Additionally, energy and food inflation are likely to remain problematic, although we are starting to see demand for oil soften a bit as economies in the United States and Western Europe slow. This could, at the very least, lessen the chances of another spike in oil prices, although I recognize there are factors beyond analysis at play—such as geopolitical events and speculation—which could impact the price of oil. Regardless of the near-term direction of oil, I am expecting the consumer to remain under pressure through the balance of the year. As a result, I continue to be wary of raising our exposure to consumer and financial stocks.
The silver lining in all of this bad news is that, while the second half of 2008 may remain difficult and uncertain, my investing time horizon is longer than six months, and the proverbial wall of worry that exists today in the market is creating some attractive longer-term opportunities. I continue to focus on high-quality growth companies, with a specific eye on companies that have good fundamentals, generate solid growth, sport attractive valuations, and have low expectations. If I select stocks well in this environment, we, as shareholders, should all see a payoff over the longer term.
As I write this letter, I not only reflect on the first half of 2008 but also the past six years I’ve had the privilege of managing the portfolio. While 2008 may prove to be the most challenging year of my tenure, I’m confident that by learning from past experiences, sticking to a disciplined approach to investing, and taking a longer-term view, shareholders will benefit over future periods. I look forward to updating you on the fund’s progress at year-end.
Respectfully submitted,

Joseph M. Milano
Chairman of the portfolio’s Investment Advisory Committee
July 10, 2008
The committee chairman has day-to-day responsibility for managing the portfolio and works with committee members in developing and executing its investment program.
The fund’s share price can fall because of weakness in the stock markets, a particular industry, or specific holdings. Stock markets can decline for many reasons, including adverse political or economic developments, changes in investor psychology, or heavy institutional selling. The prospects for an industry or company may deteriorate because of a variety of factors, including disappointing earnings or changes in the competitive environment. In addition, the investment manager’s assessment of companies held in a fund may prove incorrect, resulting in losses or poor performance even in rising markets.
Lipper averages: The average return of all portfolios in a particular category as tracked by Lipper Inc.
Russell 1000 Growth Index: An index that tracks the performance of large-cap stocks with higher price-to-book ratios and higher forecasted growth values.
Russell 1000 Value Index: An index that tracks the performance of large-cap stocks with lower price-to-book ratios and lower forecasted growth values.
Russell 2000 Growth Index: An index that tracks the performance of small-cap stocks with higher price-to-book ratios and higher forecasted growth values.
Russell 2000 Value Index: An index that tracks the performance of small-cap stocks with lower price-to-book ratios and lower forecasted growth values.
Russell Midcap Growth Index: An index that tracks the performance of mid-cap stocks with higher price-to-book ratios and higher forecasted growth values.
Russell Midcap Value Index: An index that tracks the performance of mid-cap stocks with lower price-to-book ratios and lower forecasted growth values.
S&P 500 Stock Index: An unmanaged index that tracks the stocks of 500 primarily large-cap U.S. companies.
Performance and Expenses
T. Rowe Price New America Growth Portfolio
This chart shows the value of a hypothetical $10,000 investment in the portfolio over the past 10 fiscal year periods or since inception (for portfolios lacking 10-year records). The result is compared with benchmarks, which may include a broad-based market index and a peer group average or index. Market indexes do not include expenses, which are deducted from portfolio returns as well as mutual fund averages and indexes.

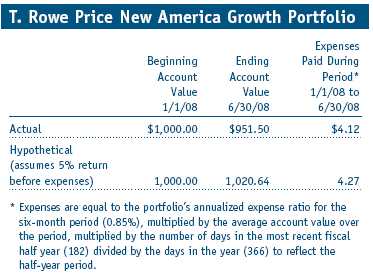
Fund Expense Example
As a mutual fund shareholder, you may incur two types of costs: (1) transaction costs, such as redemption fees or sales loads, and (2) ongoing costs, including management fees, distribution and service (12b-1) fees, and other fund expenses. The following example is intended to help you understand your ongoing costs (in dollars) of investing in the fund and to compare these costs with the ongoing costs of investing in other mutual funds. The example is based on an investment of $1,000 invested at the beginning of the most recent six-month period and held for the entire period.
Actual Expenses
The first line of the following table (“Actual”) provides information about actual account values and actual expenses. You may use the information in this line, together with your account balance, to estimate the expenses that you paid over the period. Simply divide your account value by $1,000 (for example, an $8,600 account value divided by $1,000 = 8.6), then multiply the result by the number in the first line under the heading “Expenses Paid During Period” to estimate the expenses you paid on your account during this period.
Hypothetical Example for Comparison Purposes
The information on the second line of the table (“Hypothetical”) is based on hypothetical account values and expenses derived from the fund’s actual expense ratio and an assumed 5% per year rate of return before expenses (not the fund’s actual return). You may compare the ongoing costs of investing in the fund with other funds by contrasting this 5% hypothetical example and the 5% hypothetical examples that appear in the shareholder reports of the other funds. The hypothetical account values and expenses may not be used to estimate the actual ending account balance or expenses you paid for the period.
You should also be aware that the expenses shown in the table highlight only your ongoing costs and do not reflect any transaction costs, such as redemption fees or sales loads. Therefore, the second line of the table is useful in comparing ongoing costs only and will not help you determine the relative total costs of owning different funds. To the extent a fund charges transaction costs, however, the total cost of owning that fund is higher.
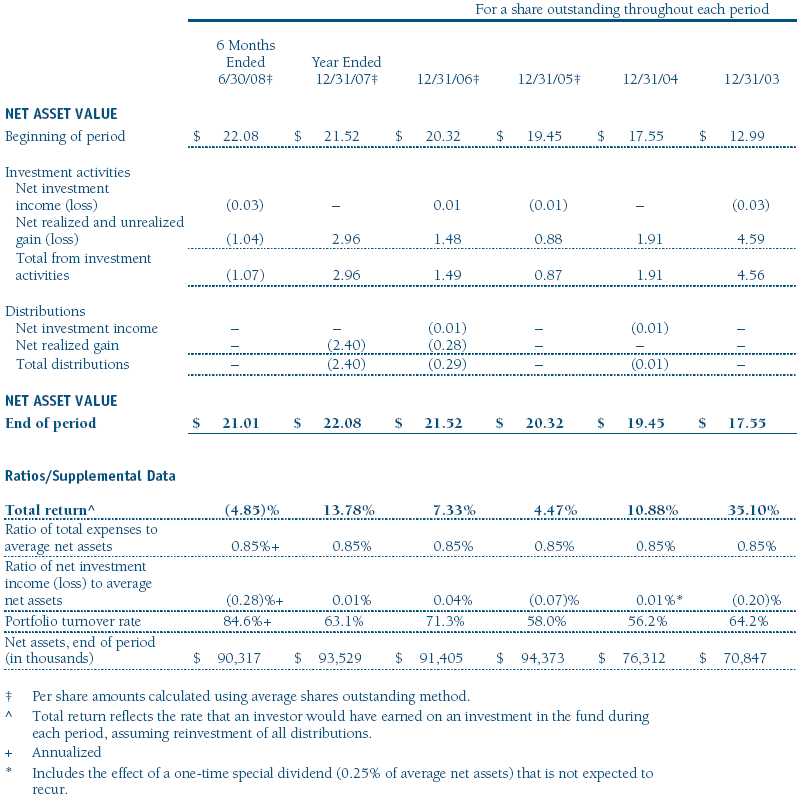
Financial Highlights
T. Rowe Price New America Growth Portfolio
(Unaudited)
The accompanying notes are an integral part of these financial statements.
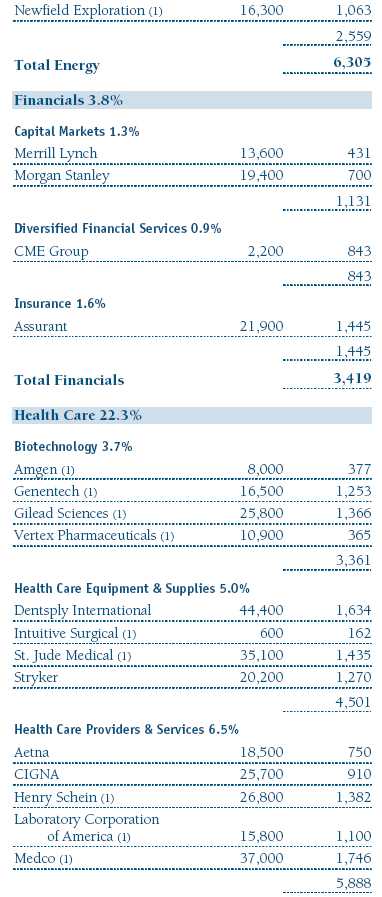
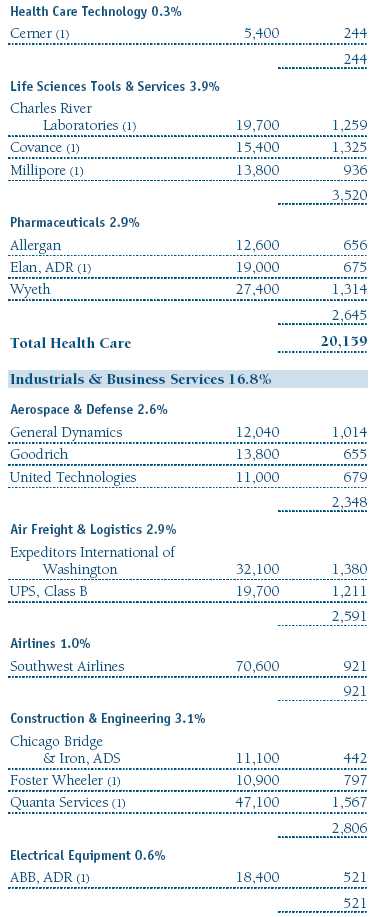
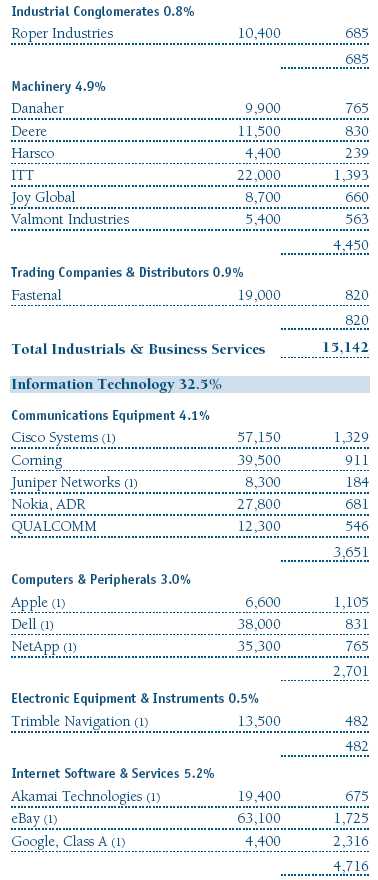
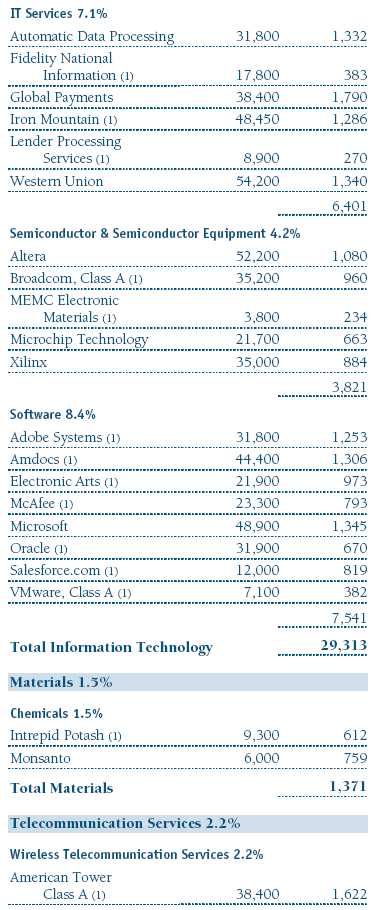
Portfolio of Investments ‡
T. Rowe Price New America Growth Portfolio
June 30, 2008 (Unaudited)
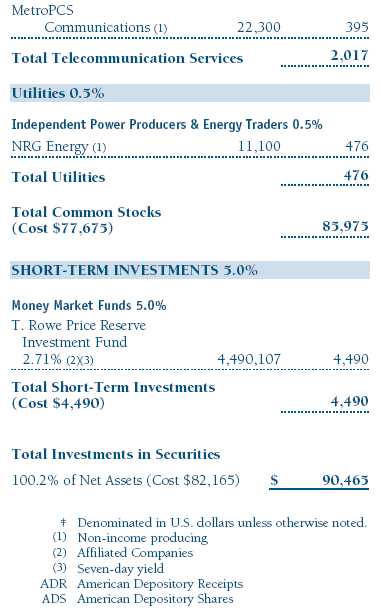
The accompanying notes are an integral part of these financial statements.
Statement of Assets and Liabilities
T. Rowe Price New America Growth Portfolio
June 30, 2008 (Unaudited)
($000s, except shares and per share amounts)
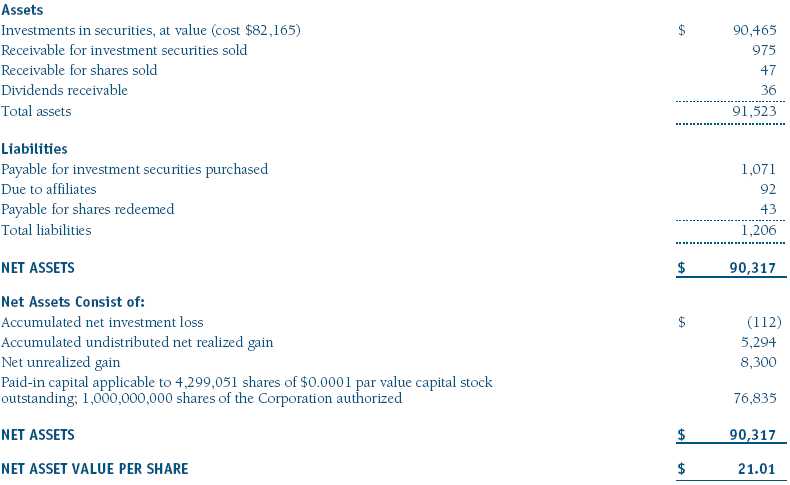
The accompanying notes are an integral part of these financial statements.
Statement of Operations
T. Rowe Price New America Growth Portfolio
(Unaudited)
($000s)

The accompanying notes are an integral part of these financial statements.
Statement of Changes in Net Assets
T. Rowe Price New America Growth Portfolio
(Unaudited)
($000s)
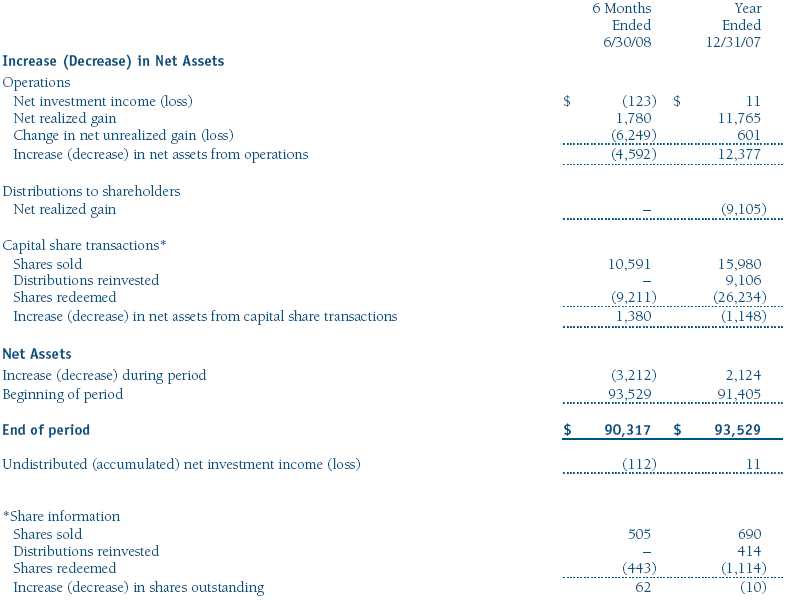
The accompanying notes are an integral part of these financial statements.
Notes to Financial Statements
T. Rowe Price New America Growth Portfolio
June 30, 2008 (Unaudited)
T. Rowe Price Equity Series, Inc. (the corporation), is registered under the Investment Company Act of 1940 (the 1940 Act). The New America Growth Portfolio (the fund), a diversified, open-end management investment company, is one portfolio established by the corporation. The fund commenced operations on March 31, 1994. The fund seeks to provide long-term capital growth by investing primarily in the common stocks of growth companies. Shares of the fund are currently offered only through certain insurance companies as an investment medium for both variable annuity contracts and variable life insurance policies.
NOTE 1 - SIGNIFICANT ACCOUNTING POLICIES
Basis of Preparation The accompanying financial statements were prepared in accordance with accounting principles generally accepted in the United States of America, which require the use of estimates made by fund management. Fund management believes that estimates and security valuations are appropriate; however, actual results may differ from those estimates, and the security valuations reflected in the financial statements may differ from the value the fund ultimately realizes upon sale of the securities.
Investment Transactions, Investment Income, and Distributions Income and expenses are recorded on the accrual basis. Dividends received from mutual fund investments are reflected as dividend income; capital gain distributions are reflected as realized gain/loss. Dividend income and capital gain distributions are recorded on the ex-dividend date. Income tax-related interest and penalties, if incurred, would be recorded as income tax expense. Investment transactions are accounted for on the trade date. Realized gains and losses are reported on the identified cost basis. Distributions to shareholders are recorded on the ex-dividend date. Income distributions are declared and paid on an annual basis. Capital gain distributions, if any, are declared and paid by the fund, typically on an annual basis.
Rebates Subject to best execution, the fund may direct certain security trades to brokers who have agreed to rebate a portion of the related brokerage commission to the fund in cash. Commission rebates are reflected as realized gain on securities in the accompanying financial statements and totaled $2,000 for the six months ended June 30, 2008.
New Accounting Pronouncements On January 1, 2008, the fund adopted Statement of Financial Accounting Standards No. 157 (FAS 157), Fair Value Measurements. FAS 157 defines fair value, establishes the framework for measuring fair value, and expands the disclosures of fair value measurements in the financial statements. Adoption of FAS 157 did not have a material impact on the fund’s net assets or results of operations.
In March 2008, the Financial Accounting Standards Board issued Statement of Financial Accounting Standards No. 161, Disclosures about Derivative Instruments and Hedging Activities (FAS 161), which is effective for fiscal years and interim periods beginning after November 15, 2008. FAS 161 requires enhanced disclosures about derivative and hedging activities, including how such activities are accounted for and their effect on financial position, performance and cash flows. Management is currently evaluating the impact the adoption of FAS 161 will have on the fund’s financial statements and related disclosures.
NOTE 2 - VALUATION
The fund’s investments are reported at fair value as defined under FAS 157. The fund values its investments and computes its net asset value per share at the close of the New York Stock Exchange (NYSE), normally 4 p.m. ET, each day that the NYSE is open for business.
Valuation Methods Equity securities listed or regularly traded on a securities exchange or in the over-the-counter (OTC) market are valued at the last quoted sale price or, for certain markets, the official closing price at the time the valuations are made, except for OTC Bulletin Board securities, which are valued at the mean of the latest bid and asked prices. A security that is listed or traded on more than one exchange is valued at the quotation on the exchange determined to be the primary market for such security. Listed securities not traded on a particular day are valued at the mean of the latest bid and asked prices for domestic securities and the last quoted sale price for international securities.
Investments in mutual funds are valued at the mutual fund’s closing net asset value per share on the day of valuation.
Other investments, including restricted securities, and those for which the above valuation procedures are inappropriate or are deemed not to reflect fair value are stated at fair value as determined in good faith by the T. Rowe Price Valuation Committee, established by the fund’s Board of Directors.
Valuation Inputs Various inputs are used to determine the value of the fund’s investments. These inputs are summarized in the three broad levels listed below:
Level 1 – quoted prices in active markets for identical securities
Level 2 – observable inputs other than Level 1 quoted prices (including, but not limited to, quoted prices for similar securities, interest rates, prepayment speeds, credit risk)
Level 3 – unobservable inputs
Observable inputs are those based on market data obtained from sources independent of the fund, and unobservable inputs reflect the fund’s own assumptions based on the best information available. The input levels are not necessarily an indication of the risk or liquidity associated with investments at that level. The following table summarizes the fund’s investments, based on the inputs used to determine their values on June 30, 2008:

NOTE 3 - INVESTMENT TRANSACTIONS
Purchases and sales of portfolio securities, other than short-term securities, aggregated $36,921,000 and $38,664,000, respectively, for the six months ended June 30, 2008.
NOTE 4 - FEDERAL INCOME TAXES
No provision for federal income taxes is required since the fund intends to continue to qualify as a regulated investment company under Subchapter M of the Internal Revenue Code and distribute to shareholders all of its taxable income and gains. Distributions are determined in accordance with Federal income tax regulations, which differ from generally accepted accounting principles, and, therefore, may differ in amount or character from net investment income and realized gains for financial reporting purposes. Financial reporting records are adjusted for permanent book/tax differences to reflect tax character but are not adjusted for temporary differences. The amount and character of tax-basis distributions and composition of net assets are finalized at fiscal year-end; accordingly, tax-basis balances have not been determined as of June 30, 2008.
At June 30, 2008, the cost of investments for federal income tax purposes was $82,165,000. Net unrealized gain aggregated $8,300,000 at period-end, of which $13,437,000 related to appreciated investments and $5,137,000 related to depreciated investments.
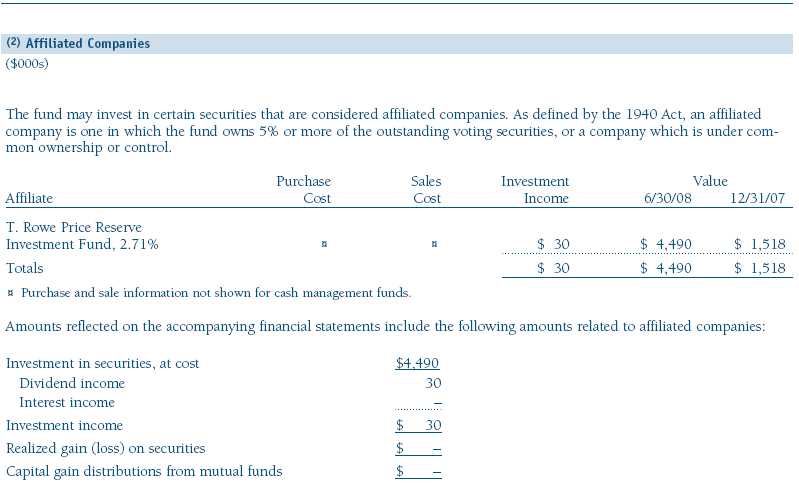
NOTE 5 - RELATED PARTY TRANSACTIONS
The fund is managed by T. Rowe Price Associates, Inc. (the manager or Price Associates), a wholly owned subsidiary of T. Rowe Price Group, Inc. The investment management and administrative agreement between the fund and the manager provides for an all-inclusive annual fee equal to 0.85% of the fund’s average daily net assets. The fee is computed daily and paid monthly. The agreement provides that investment management, shareholder servicing, transfer agency, accounting, custody services, and directors’ fees and expenses are provided to the fund, and interest, taxes, brokerage commissions, and extraordinary expenses are paid directly by the fund.
The fund may invest in the T. Rowe Price Reserve Investment Fund and the T. Rowe Price Government Reserve Investment Fund (collectively, the T. Rowe Price Reserve Investment Funds), open-end management investment companies managed by Price Associates and considered affiliates of the fund. The T. Rowe Price Reserve Investment Funds are offered as cash management options to mutual funds, trusts, and other accounts managed by Price Associates and/or its affiliates and are not available for direct purchase by members of the public. The T. Rowe Price Reserve Investment Funds pay no investment management fees.
| Information on Proxy Voting Policies, Procedures, and Records |
A description of the policies and procedures used by T. Rowe Price funds and portfolios to determine how to vote proxies relating to portfolio securities is available in each fund’s Statement of Additional Information, which you may request by calling 1-800-225-5132 or by accessing the SEC’s Web site, www.sec.gov. The description of our proxy voting policies and procedures is also available on our Web site, www.troweprice.com. To access it, click on the words “Company Info” at the top of our homepage for individual investors. Then, in the window that appears, click on the “Proxy Voting Policy” navigation button in the top left corner.
Each fund’s most recent annual proxy voting record is available on our Web site and through the SEC’s Web site. To access it through our Web site, follow the directions above, then click on the words “Proxy Voting Record” at the bottom of the Proxy Voting Policy page.
| How to Obtain Quarterly Portfolio Holdings |
The fund files a complete schedule of portfolio holdings with the Securities and Exchange Commission for the first and third quarters of each fiscal year on Form N-Q. The fund’s Form N-Q is available electronically on the SEC’s Web site (www.sec.gov); hard copies may be reviewed and copied at the SEC’s Public Reference Room, 450 Fifth St. N.W., Washington, DC 20549. For more information on the Public Reference Room, call 1-800-SEC-0330.
| Approval of Investment Management Agreement |
On March 4, 2008, the fund’s Board of Directors (Board) unanimously approved the investment advisory contract (Contract) between the fund and its investment manager, T. Rowe Price Associates, Inc. (Manager). The Board considered a variety of factors in connection with its review of the Contract, also taking into account information provided by the Manager during the course of the year, as discussed below:
Services Provided by the Manager
The Board considered the nature, quality, and extent of the services provided to the fund by the Manager. These services included, but were not limited to, management of the fund’s portfolio and a variety of related activities, as well as financial and administrative services, reporting, and communications. The Board also reviewed the background and experience of the Manager’s senior management team and investment personnel involved in the management of the fund. The Board concluded that it was satisfied with the nature, quality, and extent of the services provided by the Manager.
Investment Performance of the Fund
The Board reviewed the fund’s average annual total returns over the 1-, 3-, 5-, and 10-year periods as well as the fund’s year-by-year returns and compared these returns with previously agreed upon comparable performance measures and market data, including those supplied by Lipper and Morningstar, which are independent providers of mutual fund data. On the basis of this evaluation and the Board’s ongoing review of investment results, the Board concluded that the fund’s performance was satisfactory.
Costs, Benefits, Profits, and Economies of Scale
The Board reviewed detailed information regarding the revenues received by the Manager under the Contract and other benefits that the Manager (and its affiliates) may have realized from its relationship with the fund, including research received under “soft dollar” agreements. The Board noted that soft dollars were not used to pay for third-party, non-broker research. The Board also received information on the estimated costs incurred and profits realized by the Manager and its affiliates from advising T. Rowe Price mutual funds. The Board concluded that the Manager’s profits from advising T. Rowe Price mutual funds were reasonable in light of the services provided to the fund. The Board also considered whether the fund or other funds benefit under the fee levels set forth in the Contract from any economies of scale realized by the Manager. The Board noted that, under the Contract, the fund pays the Manager a single fee based on the fund’s assets and the Manager, in turn, pays all expenses of the fund, with certain exceptions. The Board concluded that, based on the profitability data it reviewed and consistent with this single-fee structure, the Contract provided for a reasonable sharing of benefits from any economies of scale with the fund.
Fees
The Board reviewed the fund’s single-fee structure and compared the rate with fees and expenses of other comparable funds based on information and data supplied by Lipper. (For these purposes, the Board assumed the management fee was equal to the single fee less the fund’s operating expenses.) The information provided to the Board indicated that the fund’s management fee rate and expense ratio were at or below the median for comparable funds. The Board also reviewed the fee schedules for comparable privately managed accounts of the Manager and its affiliates. Management informed the Board that the Manager’s responsibilities for privately managed accounts are more limited than its responsibilities for the fund and other T. Rowe Price mutual funds that it or its affiliates advise. On the basis of the information provided, the Board concluded that the fees paid by the fund under the Contract were reasonable.
Approval of the Contract
As noted, the Board approved the continuation of the Contract. No single factor was considered in isolation or to be determinative to the decision. Rather, the Board concluded, in light of a weighting and balancing of all factors considered, that it was in the best interests of the fund to approve the continuation of the Contract, including the fees to be charged for services thereunder.
Item 2. Code of Ethics.
A code of ethics, as defined in Item 2 of Form N-CSR, applicable to its principal executive officer, principal financial officer, principal accounting officer or controller, or persons performing similar functions is filed as an exhibit to the registrant’s annual Form N-CSR. No substantive amendments were approved or waivers were granted to this code of ethics during the registrant’s most recent fiscal half-year.
Item 3. Audit Committee Financial Expert.
Disclosure required in registrant’s annual Form N-CSR.
Item 4. Principal Accountant Fees and Services.
Disclosure required in registrant’s annual Form N-CSR.
Item 5. Audit Committee of Listed Registrants.
Not applicable.
Item 6. Investments.
(a) Not applicable. The complete schedule of investments is included in Item 1 of this Form N-CSR.
(b) Not applicable.
Item 7. Disclosure of Proxy Voting Policies and Procedures for Closed-End Management Investment Companies.
Not applicable.
Item 8. Portfolio Managers of Closed-End Management Investment Companies.
Not applicable.
Item 9. Purchases of Equity Securities by Closed-End Management Investment Company and Affiliated Purchasers.
Not applicable.
Item 10. Submission of Matters to a Vote of Security Holders.
Not applicable.
Item 11. Controls and Procedures.
(a) The registrant’s principal executive officer and principal financial officer have evaluated the registrant’s disclosure controls and procedures within 90 days of this filing and have concluded that the registrant’s disclosure controls and procedures were effective, as of that date, in ensuring that information required to be disclosed by the registrant in this Form N-CSR was recorded, processed, summarized, and reported timely.
(b) The registrant’s principal executive officer and principal financial officer are aware of no change in the registrant’s internal control over financial reporting that occurred during the registrant’s second fiscal quarter covered by this report that has materially affected, or is reasonably likely to materially affect, the registrant’s internal control over financial reporting.
Item 12. Exhibits.
(a)(1) The registrant’s code of ethics pursuant to Item 2 of Form N-CSR is filed with the registrant’s annual Form N-CSR.
(2) Separate certifications by the registrant's principal executive officer and principal financial officer, pursuant to Section 302 of the Sarbanes-Oxley Act of 2002 and required by Rule 30a-2(a) under the Investment Company Act of 1940, are attached.
(3) Written solicitation to repurchase securities issued by closed-end companies: not applicable.
(b) A certification by the registrant's principal executive officer and principal financial officer, pursuant to Section 906 of the Sarbanes-Oxley Act of 2002 and required by Rule 30a-2(b) under the Investment Company Act of 1940, is attached.
| | |
SIGNATURES |
| |
| | Pursuant to the requirements of the Securities Exchange Act of 1934 and the Investment |
| Company Act of 1940, the registrant has duly caused this report to be signed on its behalf by the |
| undersigned, thereunto duly authorized. |
| |
| T. Rowe Price Equity Series, Inc. |
| |
| |
| |
| By | /s/ Edward C. Bernard |
| | Edward C. Bernard |
| | Principal Executive Officer |
| |
| Date | August 20, 2008 |
| |
| |
| |
| | Pursuant to the requirements of the Securities Exchange Act of 1934 and the Investment |
| Company Act of 1940, this report has been signed below by the following persons on behalf of |
| the registrant and in the capacities and on the dates indicated. |
| |
| |
| By | /s/ Edward C. Bernard |
| | Edward C. Bernard |
| | Principal Executive Officer |
| |
| Date | August 20, 2008 |
| |
| |
| |
| By | /s/ Gregory K. Hinkle |
| | Gregory K. Hinkle |
| | Principal Financial Officer |
| |
| Date | August 20, 2008 |