| UNITED STATES |
| SECURITIES AND EXCHANGE COMMISSION |
| Washington, D.C. 20549 |
| |
FORM N-CSR |
| |
CERTIFIED SHAREHOLDER REPORT OF REGISTERED |
MANAGEMENT INVESTMENT COMPANIES |
| |
| |
| |
| Investment Company Act File Number: 811-07143 |
|
| |
| T. Rowe Price Equity Series, Inc. |
|
| (Exact name of registrant as specified in charter) |
| |
| 100 East Pratt Street, Baltimore, MD 21202 |
|
| (Address of principal executive offices) |
| |
| David Oestreicher |
| 100 East Pratt Street, Baltimore, MD 21202 |
|
| (Name and address of agent for service) |
| |
| |
| Registrant’s telephone number, including area code: (410) 345-2000 |
| |
| |
| Date of fiscal year end: December 31 |
| |
| |
| Date of reporting period: June 30, 2008 |
Item 1: Report to Shareholders| Blue Chip Growth Portfolio | June 30, 2008 |
The views and opinions in this report were current as of June 30, 2008. They are not guarantees of performance or investment results and should not be taken as investment advice. Investment decisions reflect a variety of factors, and the managers reserve the right to change their views about individual stocks, sectors, and the markets at any time. As a result, the views expressed should not be relied upon as a forecast of the fund’s future investment intent. The report is certified under the Sarbanes-Oxley Act, which requires mutual funds and other public companies to affirm that, to the best of their knowledge, the information in their financial reports is fairly and accurately stated in all material respects.
Manager’s Letter
T. Rowe Price Blue Chip Growth Portfolio
Dear Investor
Global stock markets were under significant pressure in the first half of 2008. A sharp decline in housing, deteriorating credit quality and constrained liquidity in lending and financial markets, and rising energy prices have combined to create daunting challenges for consumers and corporations. Risks to the financial system appeared to lessen following forceful intervention by the Federal Reserve concurrent with the crisis at Bear Stearns. However, financial markets and financial companies are likely to experience liquidity and credit-quality issues for some time. We believe that relatively low interest rates, reasonable valuations, and continued earnings growth are supportive of favorable investment performance, particularly for large-cap growth stocks.

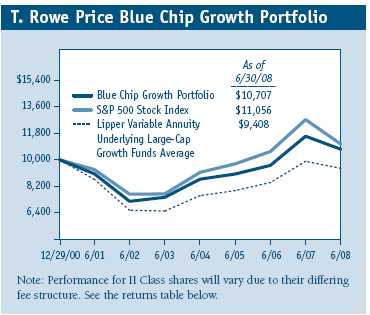
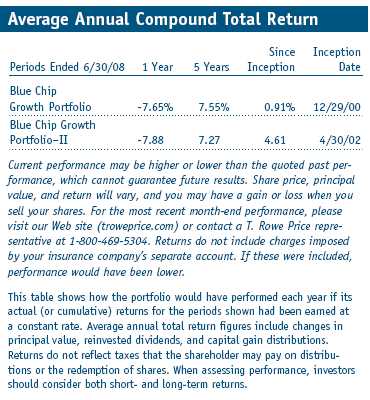
Despite the market’s poor performance in the six-month period ended June 30, 2008, the Blue Chip Growth Portfolio outperformed the S&P 500 Index. However, the portfolio underperformed its style-specific benchmark, the Russell 1000 Growth Index, and the Lipper average for large-cap growth funds in the period. (Results for the II Class were slightly lower, reflecting its higher fee structure.)
• Large-cap growth stocks struggled in the first six months of the year as a sharp slowdown in housing, related subprime mortgage woes, and soaring energy and commodity prices created challenges for consumers and corporate earnings.
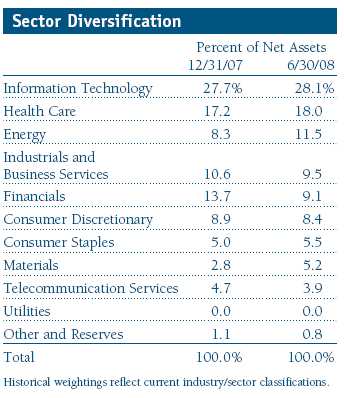
• Portfolio holdings in the energy and materials sectors were the best contributors for the past six months; information technology and financials detracted.
• Our first-half results surpassed the S&P 500 Index but trailed the Lipper peer group of large-cap growth funds.
• We believe a solid case can be made for investing in high-quality, consistent-growth companies.
Market Environment
The current market environment is perhaps the most challenging we have seen in the past 15 years. Weakness in housing and the inability of some homeowners to pay their mortgages have led to a sharp increase in delinquencies and, ultimately, foreclosures. Poorly structured mortgage-backed securities and a general deterioration in credit quality have caused unprecedented losses for many financial companies. The resulting sharp reduction in liquidity and lending and the turmoil in financial markets contributed to an economic slowdown.
Unfortunately, buoyant energy and commodity prices and ongoing weakness in the dollar hampered the Federal Reserve’s ability to deal with the mortgage problems and related economic weakness. High energy prices and significant flooding in the U.S. contributed to higher prices for corn and most food products. Ultimately, slowing economic growth and rising productivity could dampen or offset factors such as rising unit labor costs and energy prices contributing to inflation and make the Fed’s job more manageable. However, that is certainly not apparent or assured. Currently, the Federal Reserve has reached the conclusion (with which we concur) that additional interest rate cuts would probably do little good for the economy and might even contribute to dollar weakness and oil and commodity price inflation.
After the Fed stopped cutting interest rates in April, the dollar strengthened a bit, and oil and commodity prices have eased modestly. However, it will probably take time for energy and commodity prices to moderate significantly. Patience will also be required for problems in the financial system to dissipate, even though many financial companies have already recorded huge losses and raised substantial amounts of capital. Unfortunately, there are probably more problems that will surface as the credit cycle progresses, and we’ll see more regulation enacted to try to lessen the chance of future crises. In this regard, we would be remiss if we did not also acknowledge that the U.S. markets must deal with the uncertainty of a presidential election, where both candidates favor policy initiatives that could have a material effect on various industries.
In summary, financial markets are faced with several stern challenges. The healing or resolution of many of these problems—particularly credit issues at financial companies and energy and food price inflation—will take time and entail a good deal of uncertainty. Corporate earnings, inflation (as well as interest rates), and valuation will continue to be dominant determinants of stock performance. Excluding large write-downs at several financials firms, we believe that corporate earnings could continue to be solid for many companies. Inflation and interest rates should remain moderate given slowing economic growth. Finally, valuation is a positive given the sharp declines in many stocks.
Portfolio Review
The energy sector was the portfolio’s largest first-half contributor. Energy services companies Schlumberger, Smith International, and Baker Hughes were among our best performers, and each generated strong free cash flow and return on equity. They continue to be among our analysts’ favorite holdings and have generated good multiyear returns.
In the oil and gas exploration and production area, Murphy Oil posted good first-half gains. The company is benefiting from the strength in crude oil prices, rising sales volumes, and its new production capabilities in Malaysia. Petroleo Brasileiro (Petrobras) also performed quite well. It has one of the fastest reserve growth profiles among the major energy companies due to large finds, such as the Tupi field off the coast of Brazil. EOG Resources has industry-leading technology in horizontal and other innovative drilling techniques, strong gas and oil production capabilities, and excellent profitability. The company has generated solid returns for many years.
Several industrials and business services companies with ties to the energy industry also performed well. Joy Global, a dominant provider of mining equipment with a large services component to their business, and McDermott International, a leading engineering and construction firm with operations engaged in the manufacture of boilers, energy drilling platforms, and nuclear power plants, posted strong results.
Although the materials industry is a small part of the portfolio, several holdings produced significant gains. Monsanto has been one of our best performers over the last few years. The company has a dominant position in genome-based biotech seeds for corn, soybeans, fruits, and vegetables. Its genetically modified seed for several crops should allow the company to generate strong growth for years. Industrial gas distributor Praxair is a high-quality company with a consistent record of profitability and growth. Its long-term contracts with customers in various industries and reputation for reliability have resulted in solid earnings and stock performance. Our analysts are also quite keen on Potash Corporation of Saskatchewan, a leading fertilizer producer, and Freeport-McMoRan Copper & Gold, a leading producer of copper, gold, and molybdenum. Both companies possess high-quality reserves, and it is difficult for competitors to bring on additional capacity. In fact, potash deposits are owned and mined by only a few companies, and a cartel has helped fertilizer prices strengthen as worldwide demand for food has increased. Freeport is benefiting from the rise in copper prices and solid demand from China—which has limited copper production capabilities—and from the difficulty of substituting other metals for copper.
Consumer staples stocks also performed relatively well in the first half. Although your portfolio does not have a significant amount of exposure in this area, our investments in Wal-Mart, Costco, and CVS Caremark outperformed in a turbulent market. Consumers are definitely embracing the overall value proposition that Wal-Mart offers. However, there are also signs that Wal-Mart’s merchandising effort in electronics and clothing is improving. The company’s efforts to be more energy efficient and promote conservation seem to be resonating well with consumers and assisting the retailing giant’s efforts to cultivate better community relations. Costco and CVS Caremark are also well-run companies with earnings growth rates and profitability that compare favorably with their peers.
Not surprisingly, given the economic slowdown, our health care holdings provided several of the portfolio’s major contributors. Biotech was an especially positive area. Celgene, which produces an impressive collection of products used to treat cancers, such as multiple myeloma, was a strong performer. Gilead Sciences, a leading manufacturer of drugs to treat HIV-positive patients, also posted good gains. It is developing products in several other areas including treatments for hypertension and hepatitis. Genentech was another strong biotech holding, even though investors have worried that its key product, Avastin, would experience disappointing growth. However, our research indicates growing use of the drug for the treatment of breast cancer, and favorable data in an ongoing trial for colon cancer could be an even greater boon for the company.
In the health care equipment and supplies segment, our longtime holding in Alcon (a leading manufacturer of ophthalmology products) performed well. It reported strong first-quarter sales and income and, shortly thereafter, Novartis completed the purchase of a major stake in the company from Nestle. Medtronic and St. Jude Medical are leading manufacturers of medical devices, including highly technical products such as implantable cardiac defibrillators. Recent quarterly results support the view that this product area is experiencing renewed growth. Pharmaceutical companies Wyeth and Roche also performed well, with much of Wyeth’s recent strong results driven by positive data released on a compound being developed with Elan for the treatment of Alzheimer’s.
Information technology, the portfolio’s largest sector allocation, had several outstanding performers despite the dismal environment. For example, Visa was our top contributor in the first half of 2008. We took a big position in the initial public offering of the credit card processor’s stock. MasterCard, Accenture (a leading consulting services provider), and Western Union were also strong performers. Our patience with several semiconductor and communications equipment companies also paid off. Marvell Technology Group, one of our largest detractors last year, generated outstanding results in the past six months. The company still has several issues but recently reported strong first-quarter bookings and earnings. Qualcomm, Broadcom, and Xilinx are other technology companies with components that are engineered into some of the fastest-growing new products, including the Apple iPhone and other mobile interactive devices.
We had several major losers in the first half. As always, we try to carefully discern whether there are significant fundamental problems causing the poor performance, or whether there are non-fundamental issues such as profit taking or misperceptions. We held several stocks in each camp. In our view, Google, our largest detractor for the six-month period, suffered to a certain degree simply because it had performed so well last year. There were also fundamental challenges for the company, including Microsoft’s efforts to acquire Yahoo! and fear that Google’s business model had not been tested in a recession. While it is true that Google has not had to manage through a recession, our analysis (and the company’s solid first-quarter results) indicate that so far the company continues to take market share and generate extraordinary profitability. We think Google has excellent long-term growth prospects in video (YouTube), mobile, and display advertising, as well as a dominant position in Internet search.
Microsoft was another major disappointment. Although the stock has had periods of strong performance, its shares lagged the market over the last six months despite the company’s solid earnings growth. We are somewhat frustrated that several new products including the important operating system Vista have not been engineered as well as they could have been, given their importance to Microsoft’s continued leadership position. We also think that its effort to buy Yahoo! has ultimately proven to be a costly distraction for management and a burden on the stock. Management acknowledges the need to develop its next operating system using a more elegant and modular code structure enabling it to be more flexible and ultimately allow faster development of a better product. Management also understands and is addressing the threats that Apple, Google, and other forces, such as software as a service (SaaS), represent to the company. Although we trimmed a small amount of our position, the company has the strengths needed to deal with the challenges we have noted. Our analyst remains positive on the company, it trades at a compelling valuation, and we think that it can generate solid growth.
GE and WellPoint are examples of companies that generated disappointing first-quarter results, which has shaken our confidence and caused us to sharply reduce our position size. For GE, it is fair to acknowledge that the company generates 50% of earnings from its financial services operation. Consequently, it is a victim, to a certain degree, of the difficult conditions in lending and real estate. However, GE also posted disappointing results in several other areas, including health care equipment. Additionally, the quality of the company’s earnings has been mediocre with non-recurring gains often bolstering results. We think GE is a cheap stock and could still be viewed favorably. However, we concur with our analyst’s view that there are better ideas in the industrials and business services segment, and it could take an extended amount of time before GE gets back on a solid double-digit growth trajectory.
Juniper Networks and State Street are examples of stocks that were quite disappointing but where we believe the fundamentals are largely intact. Juniper has generated solid earnings results and has been a strong performer sporadically. In our view, its recent stock weakness is largely attributable to the challenging macroeconomic environment. Certainly, if a sharp global recession develops, Juniper’s business will suffer. However, our information from its customers, suppliers, and competitors tells us that so far its business is holding up well. More importantly, these conversations reveal that Juniper’s products are technologically advanced and instrumental in the continued build-out of global telecom infrastructure.
In a similar way, we think that State Street continues to execute well in a poor stock market environment. The company had to raise capital to deal with the possibility that some commercial paper facilities that it provides for clients could wind up back on its balance sheet (essentially purchased by State Street). Nevertheless, State Street’s core businesses continue to deliver solid results. The company has dominant market share, continues to win large global custodial and securities processing mandates, and generates strong recurring revenue.
Strategy
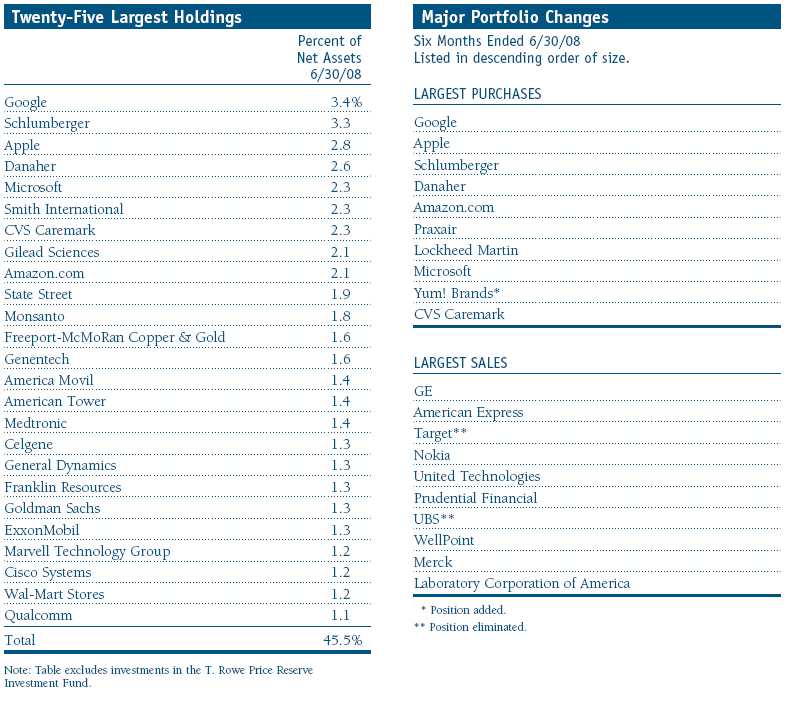
Additions to existing holdings such as Google, Apple, Praxair, Lockheed Martin, and Schlumberger were significant enough to be included among our 10 largest purchases for the past six months. We also initiated several new positions, including Yum! Brands, the operator of Taco Bell, Pizza Hut, and KFC restaurants. The company has a large and growing presence in China, and the segment could become a significant company on a standalone basis in a few years. This rapidly growing business is a substantial portion of the company’s value, but the management is also pursuing important improvements in domestic operations. In particular, product innovations at Taco Bell and Pizza Hut appear to be driving improved sales. Although the restaurant business is challenging, operators such as McDonald’s, which has been a strong performer for the portfolio for several years, and Yum! Brands, generate strong and consistent cash flow growth. We also added a position in Petrobras during the first half. As discussed earlier in this letter, the global energy giant has enjoyed rapid growth in reserves and has boosted its production of oil and gas. We are also encouraged by the company’s recent mammoth discoveries of light crude oil in coastal Brazilian waters. These finds lead our analysts to conclude that Petrobras could continue to generate strong reserve and production growth for many years.
Our largest sales included the elimination of Target and UBS. We sold Target because, in our view, Wal-Mart is better positioned for growth in the current environment due to improved execution, and Target’s strategy is somewhat less value oriented. We also believed that Target’s large credit card portfolio could hurt results in the current challenging credit environment. Wal-Mart has outperformed Target by a meaningful margin since we made the sale and swapped some of the proceeds into our existing Wal-Mart position.
We sold UBS at prices substantially higher than current prices as we became concerned that its large portfolio of mortgage-backed securities could result in significant losses requiring the company to raise additional capital. The losses recorded on its mortgage investments, and the amount of capital it has had to raise, were actually well beyond what we originally estimated. A similar analysis of potential problems also led us to sell several other financial holdings in 2007 and early 2008. Although we have taken some lumps in the financials sector, we were fortunate to have reduced our holdings and avoided some of the worst first-half performers.
Outlook
Stocks have stumbled badly in the last six months. We anticipated a decline in housing activity and housing prices, but the correction has been worse than even our fairly pessimistic view. The problems in subprime mortgages have spread and influenced liquidity in certain lending and financial markets. This has contributed to the slowdown in the domestic economy. The extent of the slowing and whether international economies can decouple (and escape the negative impact) are important considerations. Energy and commodity prices remain uncooperative, and geopolitical events could disturb investors. All of these factors create a more challenging situation for monetary authorities, policymakers, and, ultimately, investors.
We have tried to weigh these risks carefully. Clearly, the risk of a recession has increased. However, we also believe that the economic slowdown could help dampen some of the factors that are contributing to inflation. We think that the prospects for corporate earnings growth at many companies are favorable and that relatively stable interest rates are probable. Valuations are reasonable and have become more supportive due to the recent market decline. Given the challenging economic and investing environment, we continue to believe that high-quality, consistent-growth companies appear attractive for long-term investors. We think a solid case can be made for investing in U.S. stocks for the following reasons:
1. Earnings growth remains strong at many high-quality U.S. companies, many of which do not need a robust economic recovery to produce strong profit growth. The recent gains in many health care stocks reflect these attributes.
2. The stocks of many consistent-growth companies remain reasonably valued.
3. Many large U.S. multinational growth companies are well diversified by product and geography. This helps them benefit from the growth in Asia and other faster-growing markets, and also provides greater ability to weather external change or difficult conditions in a particular business or region.
4. Many large-cap growth companies have solid balance sheets with record amounts of cash and strong capital bases. This should allow them to withstand challenges and also to be opportunistic in investing in products or other businesses.
5. Many of our holdings generate significant free cash flow. Shareholder-oriented managements can use this cash to pay dividends (which receive more favorable tax treatment than they did a few years ago), repurchase shares, or make value-added acquisitions.
We continue to strive to enhance returns in a difficult environment by investing in quality companies with durable, sustainable earnings and cash flow growth. We appreciate your continued confidence in this endeavor.
Respectfully submitted,

Larry J. Puglia
President and Chairman of the Investment
Advisory Committee
July 14, 2008
The committee chairman has day-to-day responsibility for managing the portfolio and works with committee members in developing and executing its investment program.
The portfolio’s share price can fall because of weakness in the stock markets, a particular industry, or specific holdings. Stock markets can decline for many reasons, including adverse political or economic developments, changes in investor psychology, or heavy institutional selling. The prospects for an industry or company may deteriorate because of a variety of factors, including disappointing earnings or changes in the competitive environment. In addition, the investment manager’s assessment of companies held in a portfolio may prove incorrect, resulting in losses or poor performance even in rising markets. Growth stocks can be volatile because these companies usually invest a high portion of earnings in their businesses, and earnings disappointments often lead to sharply falling prices. The value approach carries the risk that a security’s intrinsic value may not be recognized for a long time or that the stock may actually be appropriately priced.
Dividend yield: The annual dividend of a stock divided by the stock’s price.
Free cash flow: The excess cash a company is generating from its operations that can be taken out of the business for the benefit of shareholders, such as dividends, share repurchases, investments, and acquisitions.
Lipper averages: The average return of all portfolios in a particular category as tracked by Lipper Inc.
Price/book ratio: A valuation measure that compares a stock’s market price to its book value, i.e., the company’s net worth divided by the number of outstanding shares.
Price/earnings ratio (P/E): A valuation measure calculated by dividing the price of a stock by its current or projected earnings per share. This ratio gives investors an idea of how much they are paying for current or future earnings power.
Russell 1000 Growth Index: A market capitalization-weighted index of those firms in the Russell 1000 with higher price-to-book ratios and higher forecasted growth values.
S&P 500 Stock Index: An unmanaged index that tracks the stocks of 500 primarily large-cap U.S. companies.
Portfolio Highlights
Performance and Expenses
T. Rowe Price Blue Chip Growth Portfolio
This chart shows the value of a hypothetical $10,000 investment in the portfolio over the past 10 fiscal year periods or since inception (for portfolios lacking 10-year records). The result is compared with benchmarks, which may include a broad-based market index and a peer group average or index. Market indexes do not include expenses, which are deducted from portfolio returns as well as mutual fund averages and indexes.
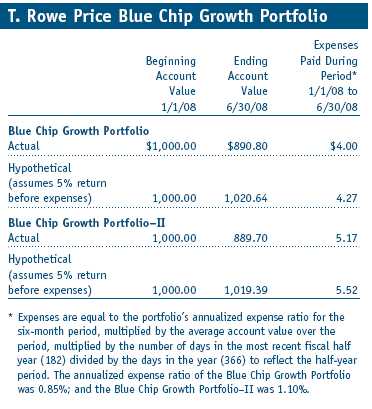
Fund Expense Example
As a mutual fund shareholder, you may incur two types of costs: (1) transaction costs, such as redemption fees or sales loads, and (2) ongoing costs, including management fees, distribution and service (12b-1) fees, and other fund expenses. The following example is intended to help you understand your ongoing costs (in dollars) of investing in the fund and to compare these costs with the ongoing costs of investing in other mutual funds. The example is based on an investment of $1,000 invested at the beginning of the most recent six-month period and held for the entire period.
Shares of the fund are currently offered only through certain insurance companies as an investment medium for both variable annuity contracts and variable life insurance policies. Please note that the fund has two classes of shares: the original share class and II Class. II Class shares are sold through financial intermediaries, which are compensated for distribution, shareholder servicing, and/or certain administrative services under a Board-approved Rule 12b-1 plan.
Actual Expenses
The first line of the following table (“Actual”) provides information about actual account values and actual expenses. You may use the information in this line, together with your account balance, to estimate the expenses that you paid over the period. Simply divide your account value by $1,000 (for example, an $8,600 account value divided by $1,000 = 8.6), then multiply the result by the number in the first line under the heading “Expenses Paid During Period” to estimate the expenses you paid on your account during this period.
Hypothetical Example for Comparison Purposes
The information on the second line of the table (“Hypothetical”) is based on hypothetical account values and expenses derived from the fund’s actual expense ratio and an assumed 5% per year rate of return before expenses (not the fund’s actual return). You may compare the ongoing costs of investing in the fund with other funds by contrasting this 5% hypothetical example and the 5% hypothetical examples that appear in the shareholder reports of the other funds. The hypothetical account values and expenses may not be used to estimate the actual ending account balance or expenses you paid for the period.
You should also be aware that the expenses shown in the table highlight only your ongoing costs and do not reflect any transaction costs, such as redemption fees or sales loads. Therefore, the second line of the table is useful in comparing ongoing costs only and will not help you determine the relative total costs of owning different funds. To the extent a fund charges transaction costs, however, the total cost of owning that fund is higher.
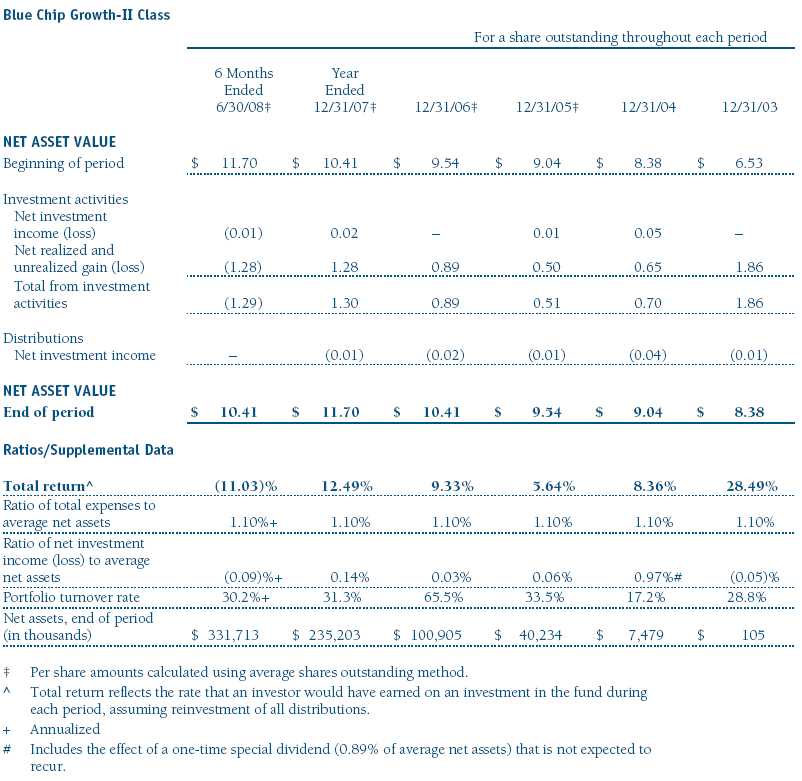
Financial Highlights
T. Rowe Price Blue Chip Growth Portfolio
(Unaudited)
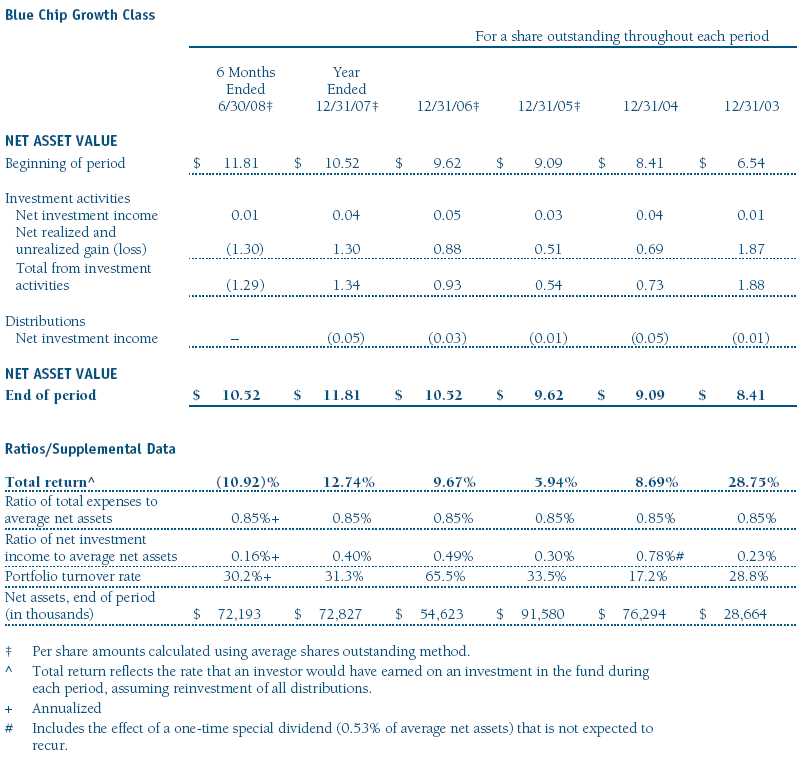
The accompanying notes are an integral part of these financial statements.
Financial Highlights
T. Rowe Price Blue Chip Growth Portfolio
(Unaudited)
The accompanying notes are an integral part of these financial statements.
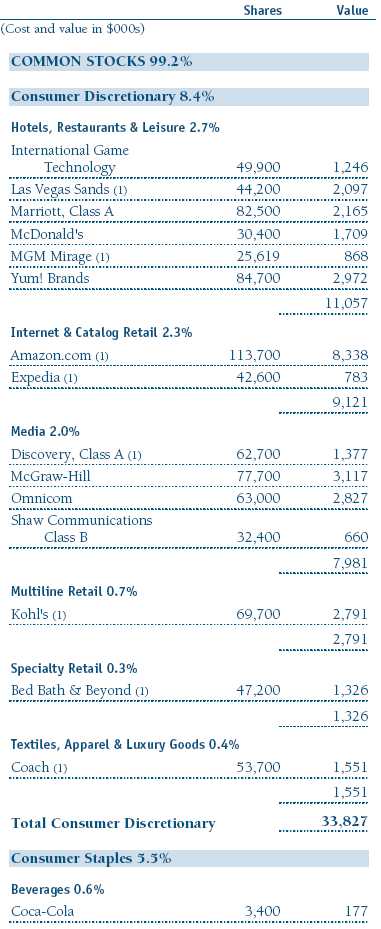
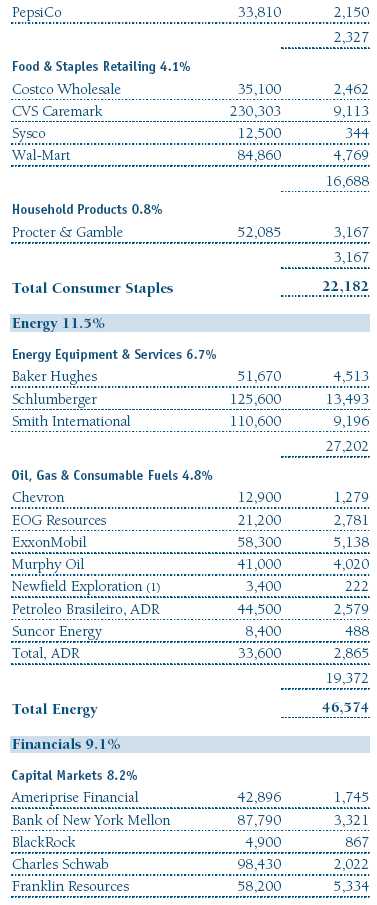
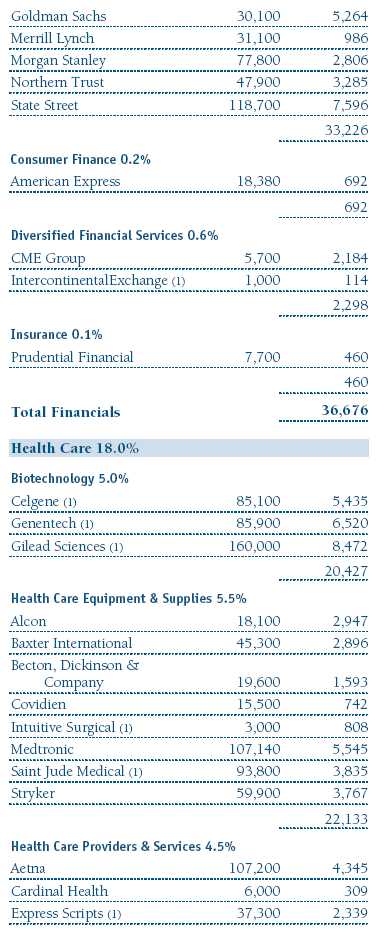
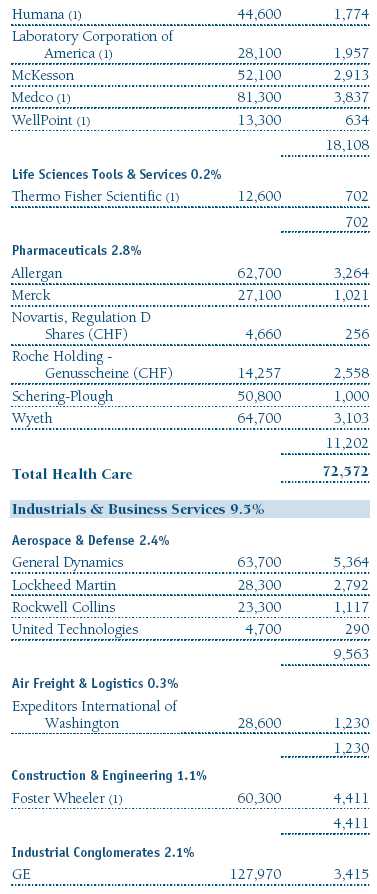
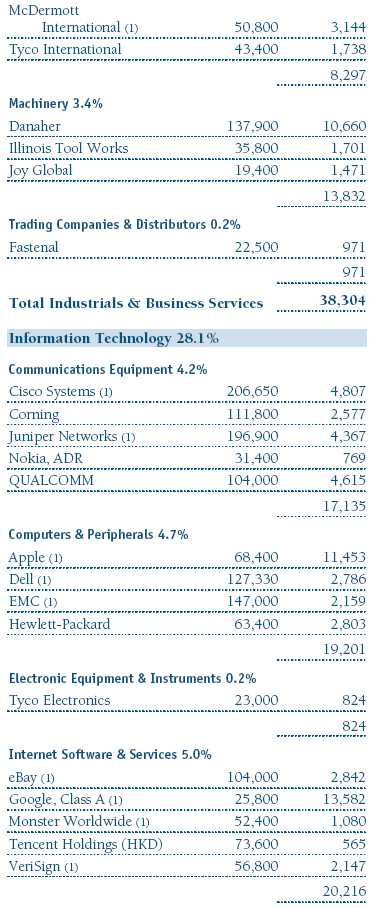
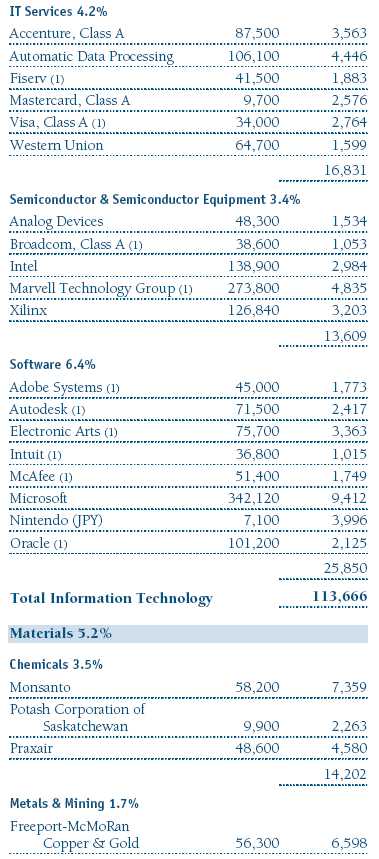
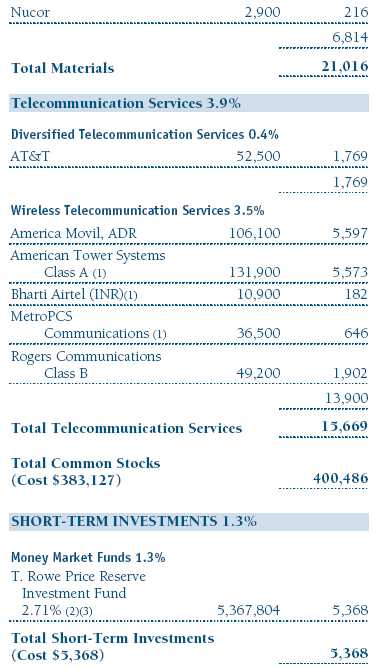
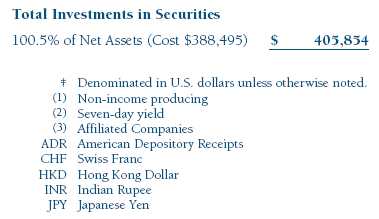
Portfolio of Investments ‡
T. Rowe Price Blue Chip Growth Portfolio
June 30, 2008 (Unaudited)
The accompanying notes are an integral part of these financial statements.
Statement of Assets and Liabilities
T. Rowe Price Blue Chip Growth Portfolio
June 30, 2008 (Unaudited)
($000s, except shares and per share amounts)
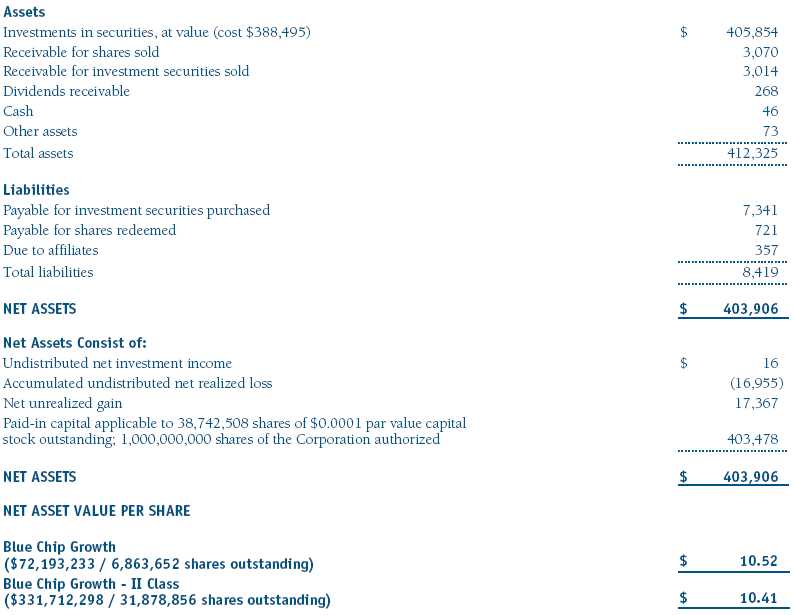
The accompanying notes are an integral part of these financial statements.
Statement of Operations
T. Rowe Price Blue Chip Growth Portfolio
(Unaudited)
($000s)
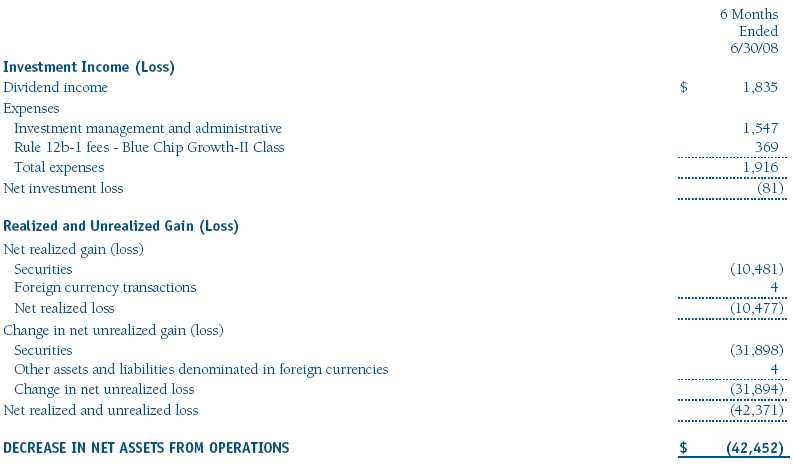
The accompanying notes are an integral part of these financial statements.
Statement of Changes in Net Assets
T. Rowe Price Blue Chip Growth Portfolio
(Unaudited)
($000s)
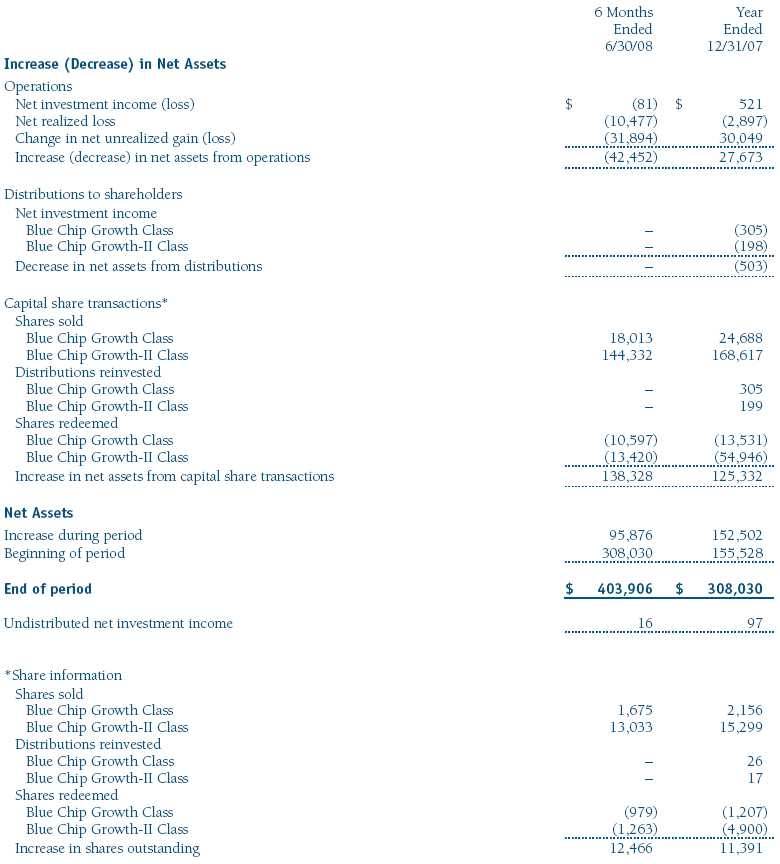
The accompanying notes are an integral part of these financial statements.
Notes to Financial Statements
T. Rowe Price Blue Chip Growth Portfolio
June 30, 2008 (Unaudited)
T. Rowe Price Equity Series, Inc. (the corporation), is registered under the Investment Company Act of 1940 (the 1940 Act). The Blue Chip Growth Portfolio (the fund) is a diversified, open-end management investment company and is one portfolio established by the corporation. The fund seeks to provide long-term capital growth. Income is a secondary objective. Shares of the fund currently are offered only through certain insurance companies as an investment medium for both variable annuity contracts and variable life insurance policies. The fund has two classes of shares: the Blue Chip Growth Portfolio original share class (Blue Chip Growth Class), offered since December 29, 2000, and Blue Chip Growth Portfolio–II (Blue Chip Growth–II Class), offered since April 30, 2002. Blue Chip Growth–II Class shares are sold through financial intermediaries, which it compensates for distribution, shareholder servicing, and/or certain administrative services under a Board-approved Rule 12b-1 plan. Each class has exclusive voting rights on matters related solely to that class, separate voting rights on matters that relate to both classes, and, in all other respects, the same rights and obligations as the other class.
NOTE 1 - SIGNIFICANT ACCOUNTING POLICIES
Basis of Preparation The accompanying financial statements were prepared in accordance with accounting principles generally accepted in the United States of America, which require the use of estimates made by fund management. Fund management believes that estimates and security valuations are appropriate; however, actual results may differ from those estimates, and the security valuations reflected in the financial statements may differ from the value the fund ultimately realizes upon sale of the securities.
Investment Transactions, Investment Income, and Distributions Income and expenses are recorded on the accrual basis. Dividends received from mutual fund investments are reflected as dividend income; capital gain distributions are reflected as realized gain/loss. Dividend income and capital gain distributions are recorded on the ex-dividend date. Income tax-related interest and penalties, if incurred, would be recorded as income tax expense. Investment transactions are accounted for on the trade date. Realized gains and losses are reported on the identified cost basis. Distributions to shareholders are recorded on the ex-dividend date. Income distributions are declared and paid by each class on an annual basis. Capital gain distributions, if any, are declared and paid by the fund, typically on an annual basis.
Currency Translation Assets, including investments, and liabilities denominated in foreign currencies are translated into U.S. dollar values each day at the prevailing exchange rate, using the mean of the bid and asked prices of such currencies against U.S. dollars as quoted by a major bank. Purchases and sales of securities, income, and expenses are translated into U.S. dollars at the prevailing exchange rate on the date of the transaction. The effect of changes in foreign currency exchange rates on realized and unrealized security gains and losses is reflected as a component of security gains and losses.
Class Accounting Blue Chip Growth–II pays distribution, shareholder servicing, and/or certain administrative expenses in the form of Rule 12b-1 fees, in an amount not exceeding 0.25% of the class’s average daily net assets. Investment income, investment management and administrative expense, and realized and unrealized gains and losses are allocated to the classes based upon the relative daily net assets of each class.
Rebates Subject to best execution, the fund may direct certain security trades to brokers who have agreed to rebate a portion of the related brokerage commission to the fund in cash. Commission rebates are reflected as realized gain on securities in the accompanying financial statements and totaled $3,000 for the six months ended June 30, 2008.
New Accounting Pronouncements On January 1, 2008, the fund adopted Statement of Financial Accounting Standards No. 157 (FAS 157), Fair Value Measurements. FAS 157 defines fair value, establishes the framework for measuring fair value, and expands the disclosures of fair value measurements in the financial statements. Adoption of FAS 157 did not have a material impact on the fund’s net assets or results of operations.
In March 2008, the Financial Accounting Standards Board issued Statement of Financial Accounting Standards No. 161, Disclosures about Derivative Instruments and Hedging Activities (FAS 161), which is effective for fiscal years and interim periods beginning after November 15, 2008. FAS 161 requires enhanced disclosures about derivative and hedging activities, including how such activities are accounted for and their effect on financial position, performance and cash flows. Management is currently evaluating the impact the adoption of FAS 161 will have on the fund’s financial statements and related disclosures.
NOTE 2 - VALUATION
The fund’s investments are reported at fair value as defined under FAS 157. The fund values its investments and computes its net asset value per share at the close of the New York Stock Exchange (NYSE), normally 4 p.m. ET, each day that the NYSE is open for business.
Valuation Methods Equity securities listed or regularly traded on a securities exchange or in the over-the-counter (OTC) market are valued at the last quoted sale price or, for certain markets, the official closing price at the time the valuations are made, except for OTC Bulletin Board securities, which are valued at the mean of the latest bid and asked prices. A security that is listed or traded on more than one exchange is valued at the quotation on the exchange determined to be the primary market for such security. Listed securities not traded on a particular day are valued at the mean of the latest bid and asked prices for domestic securities and the last quoted sale price for international securities.
Investments in mutual funds are valued at the mutual fund’s closing net asset value per share on the day of valuation.
Other investments, including restricted securities, and those for which the above valuation procedures are inappropriate or are deemed not to reflect fair value are stated at fair value as determined in good faith by the T. Rowe Price Valuation Committee, established by the fund’s Board of Directors.
For valuation purposes, the last quoted prices of non-U.S. equity securities may be adjusted under the circumstances described below. If the fund determines that developments between the close of a foreign market and the close of the NYSE will, in its judgment, materially affect the value of some or all of its portfolio securities, the fund will adjust the previous closing prices to reflect what it believes to be the fair value of the securities as of the close of the NYSE. In deciding whether it is necessary to adjust closing prices to reflect fair value, the fund reviews a variety of factors, including developments in foreign markets, the performance of U.S. securities markets, and the performance of instruments trading in U.S. markets that represent foreign securities and baskets of foreign securities. A fund may also fair value securities in other situations, such as when a particular foreign market is closed but the fund is open. The fund uses outside pricing services to provide it with closing prices and information to evaluate and/or adjust those prices. The fund cannot predict how often it will use closing prices and how often it will determine it necessary to adjust those prices to reflect fair value. As a means of evaluating its security valuation process, the fund routinely compares closing prices, the next day’s opening prices in the same markets, and adjusted prices.
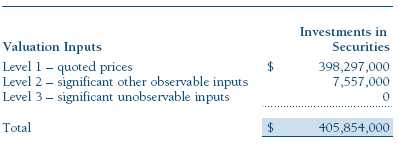
Valuation Inputs Various inputs are used to determine the value of the fund’s investments. These inputs are summarized in the three broad levels listed below:
Level 1 – quoted prices in active markets for identical securities
Level 2 – observable inputs other than Level 1 quoted prices (including, but not limited to, quoted prices for similar securities, interest rates, prepayment speeds, credit risk)
Level 3 – unobservable inputs
Observable inputs are those based on market data obtained from sources independent of the fund, and unobservable inputs reflect the fund’s own assumptions based on the best information available. The input levels are not necessarily an indication of the risk or liquidity associated with investments at that level. For example, non-U.S. equity securities actively traded in foreign markets generally are reflected in Level 2 despite the availability of closing prices, because the fund evaluates and determines whether those closing prices reflect fair value at the close of the NYSE or require adjustment, as described above. The following table summarizes the fund’s investments, based on the inputs used to determine their values on June 30, 2008:
NOTE 3 - INVESTMENT TRANSACTIONS
Purchases and sales of portfolio securities, other than short-term securities, aggregated $192,567,000 and $54,330,000, respectively, for the six months ended June 30, 2008.
NOTE 4 - FEDERAL INCOME TAXES
No provision for federal income taxes is required since the fund intends to continue to qualify as a regulated investment company under Subchapter M of the Internal Revenue Code and distribute to shareholders all of its taxable income and gains. Distributions are determined in accordance with Federal income tax regulations, which differ from generally accepted accounting principles, and, therefore, may differ in amount or character from net investment income and realized gains for financial reporting purposes. Financial reporting records are adjusted for permanent book/tax differences to reflect tax character but are not adjusted for temporary differences. The amount and character of tax-basis distributions and composition of net assets are finalized at fiscal year-end; accordingly, tax-basis balances have not been determined as of June 30, 2008.
In accordance with federal tax regulations, the fund deferred recognition of certain capital loss amounts previously recognized in the prior fiscal year for financial reporting purposes until the current fiscal period for tax purposes. Such deferrals amounted to $1,762,000 and related to net capital losses realized between November 1 and the fund’s fiscal year-end date. Further, the fund intends to retain realized gains to the extent of available capital loss carryforwards. As of December 31, 2007, the fund had $4,716,000 of unused capital loss carryforwards, of which $435,000 expire in fiscal 2009, $491,000 expire in fiscal 2010, $335,000 expire in fiscal 2011, $1,272,000 expire in fiscal 2013, $902,000 expire in fiscal 2014, and $1,281,000 expire in fiscal 2015.
At June 30, 2008, the cost of investments for federal income tax purposes was $388,495,000. Net unrealized gain aggregated $17,367,000 at period-end, of which $41,969,000 related to appreciated investments and $24,602,000 related to depreciated investments.
NOTE 5 - RELATED PARTY TRANSACTIONS
The fund is managed by T. Rowe Price Associates, Inc. (the manager or Price Associates), a wholly owned subsidiary of T. Rowe Price Group, Inc. The investment management and administrative agreement between the fund and the manager provides for an all-inclusive annual fee equal to 0.85% of the fund’s average daily net assets. The fee is computed daily and paid monthly. The agreement provides that investment management, shareholder servicing, transfer agency, accounting, custody services, and directors’ fees and expenses are provided to the fund, and interest, taxes, brokerage commissions, and extraordinary expenses are paid directly by the fund.
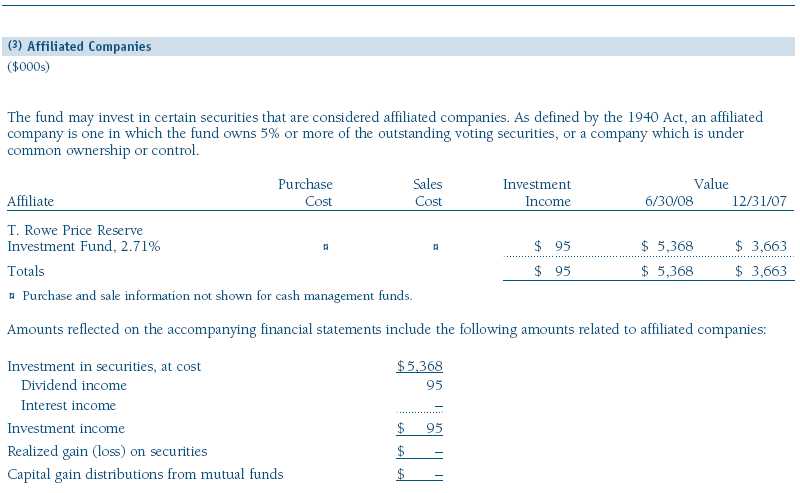
The fund may invest in the T. Rowe Price Reserve Investment Fund and the T. Rowe Price Government Reserve Investment Fund (collectively, the T. Rowe Price Reserve Investment Funds), open-end management investment companies managed by Price Associates and considered affiliates of the fund. The T. Rowe Price Reserve Investment Funds are offered as cash management options to mutual funds, trusts, and other accounts managed by Price Associates and/or its affiliates and are not available for direct purchase by members of the public. The T. Rowe Price Reserve Investment Funds pay no investment management fees.
| Information on Proxy Voting Policies, Procedures, and Records |
A description of the policies and procedures used by T. Rowe Price funds and portfolios to determine how to vote proxies relating to portfolio securities is available in each fund’s Statement of Additional Information, which you may request by calling 1-800-225-5132 or by accessing the SEC’s Web site, www.sec.gov. The description of our proxy voting policies and procedures is also available on our Web site, www.troweprice.com. To access it, click on the words “Company Info” at the top of our homepage for individual investors. Then, in the window that appears, click on the “Proxy Voting Policy” navigation button in the top left corner.
Each fund’s most recent annual proxy voting record is available on our Web site and through the SEC’s Web site. To access it through our Web site, follow the directions above, then click on the words “Proxy Voting Record” at the bottom of the Proxy Voting Policy page.
| How to Obtain Quarterly Portfolio Holdings |
The fund files a complete schedule of portfolio holdings with the Securities and Exchange Commission for the first and third quarters of each fiscal year on Form N-Q. The fund’s Form N-Q is available electronically on the SEC’s Web site (www.sec.gov); hard copies may be reviewed and copied at the SEC’s Public Reference Room, 450 Fifth St. N.W., Washington, DC 20549. For more information on the Public Reference Room, call 1-800-SEC-0330.
| Approval of Investment Management Agreement |
On March 4, 2008, the fund’s Board of Directors (Board) unanimously approved the investment advisory contract (Contract) between the fund and its investment manager, T. Rowe Price Associates, Inc. (Manager). The Board considered a variety of factors in connection with its review of the Contract, also taking into account information provided by the Manager during the course of the year, as discussed below:
Services Provided by the Manager
The Board considered the nature, quality, and extent of the services provided to the fund by the Manager. These services included, but were not limited to, management of the fund’s portfolio and a variety of related activities, as well as financial and administrative services, reporting, and communications. The Board also reviewed the background and experience of the Manager’s senior management team and investment personnel involved in the management of the fund. The Board concluded that it was satisfied with the nature, quality, and extent of the services provided by the Manager.
Investment Performance of the Fund
The Board reviewed the fund’s average annual total returns over the 1-, 3-, 5-, and 10-year periods as well as the fund’s year-by-year returns and compared these returns with previously agreed upon comparable performance measures and market data, including those supplied by Lipper and Morningstar, which are independent providers of mutual fund data. On the basis of this evaluation and the Board’s ongoing review of investment results, the Board concluded that the fund’s performance was satisfactory.
Costs, Benefits, Profits, and Economies of Scale
The Board reviewed detailed information regarding the revenues received by the Manager under the Contract and other benefits that the Manager (and its affiliates) may have realized from its relationship with the fund, including research received under “soft dollar” agreements. The Board noted that soft dollars were not used to pay for third-party, non-broker research. The Board also received information on the estimated costs incurred and profits realized by the Manager and its affiliates from advising T. Rowe Price mutual funds, as well as estimates of the gross profits realized from managing the fund in particular. The Board concluded that the Manager’s profits were reasonable in light of the services provided to the fund. The Board also considered whether the fund or other funds benefit under the fee levels set forth in the Contract from any economies of scale realized by the Manager. The Board noted that, under the Contract, the fund pays the Manager a single fee based on the fund’s assets and the Manager, in turn, pays all expenses of the fund, with certain exceptions. The Board concluded that, based on the profitability data it reviewed and consistent with this single-fee structure, the Contract provided for a reasonable sharing of benefits from any economies of scale with the fund.
Fees
The Board reviewed the fund’s single-fee structure (for the Investor Class and II Class) and compared the rate with fees and expenses of other comparable funds based on information and data supplied by Lipper. (For these purposes, the Board assumed the management fee was equal to the single fee less the fund’s operating expenses.) The information provided to the Board for the Investor Class indicated that the fund’s management fee rate was above the median for comparable funds and the expense ratio was at or below the median for comparable funds. The Board also reviewed the fees and expenses of the fund’s Class II share class, which pays a 12b-1 fee in addition to the single fee, and compared this expense ratio to the fees and expenses of comparable funds. The information provided to the Board indicated that the management fee and expense ratio for the Class II share class were above the median for comparable funds. The Board also reviewed the fee schedules for comparable privately managed accounts of the Manager and its affiliates. Management informed the Board that the Manager’s responsibilities for privately managed accounts are more limited than its responsibilities for the fund and other T. Rowe Price mutual funds that it or its affiliates advise. On the basis of the information provided, the Board concluded that the fees paid by the fund under the Contract were reasonable.
Approval of the Contract
As noted, the Board approved the continuation of the Contract. No single factor was considered in isolation or to be determinative to the decision. Rather, the Board concluded, in light of a weighting and balancing of all factors considered, that it was in the best interests of the fund to approve the continuation of the Contract, including the fees to be charged for services thereunder.
Item 2. Code of Ethics.
A code of ethics, as defined in Item 2 of Form N-CSR, applicable to its principal executive officer, principal financial officer, principal accounting officer or controller, or persons performing similar functions is filed as an exhibit to the registrant’s annual Form N-CSR. No substantive amendments were approved or waivers were granted to this code of ethics during the registrant’s most recent fiscal half-year.
Item 3. Audit Committee Financial Expert.
Disclosure required in registrant’s annual Form N-CSR.
Item 4. Principal Accountant Fees and Services.
Disclosure required in registrant’s annual Form N-CSR.
Item 5. Audit Committee of Listed Registrants.
Not applicable.
Item 6. Investments.
(a) Not applicable. The complete schedule of investments is included in Item 1 of this Form N-CSR.
(b) Not applicable.
Item 7. Disclosure of Proxy Voting Policies and Procedures for Closed-End Management Investment Companies.
Not applicable.
Item 8. Portfolio Managers of Closed-End Management Investment Companies.
Not applicable.
Item 9. Purchases of Equity Securities by Closed-End Management Investment Company and Affiliated Purchasers.
Not applicable.
Item 10. Submission of Matters to a Vote of Security Holders.
Not applicable.
Item 11. Controls and Procedures.
(a) The registrant’s principal executive officer and principal financial officer have evaluated the registrant’s disclosure controls and procedures within 90 days of this filing and have concluded that the registrant’s disclosure controls and procedures were effective, as of that date, in ensuring that information required to be disclosed by the registrant in this Form N-CSR was recorded, processed, summarized, and reported timely.
(b) The registrant’s principal executive officer and principal financial officer are aware of no change in the registrant’s internal control over financial reporting that occurred during the registrant’s second fiscal quarter covered by this report that has materially affected, or is reasonably likely to materially affect, the registrant’s internal control over financial reporting.
Item 12. Exhibits.
(a)(1) The registrant’s code of ethics pursuant to Item 2 of Form N-CSR is filed with the registrant’s annual Form N-CSR.
(2) Separate certifications by the registrant's principal executive officer and principal financial officer, pursuant to Section 302 of the Sarbanes-Oxley Act of 2002 and required by Rule 30a-2(a) under the Investment Company Act of 1940, are attached.
(3) Written solicitation to repurchase securities issued by closed-end companies: not applicable.
(b) A certification by the registrant's principal executive officer and principal financial officer, pursuant to Section 906 of the Sarbanes-Oxley Act of 2002 and required by Rule 30a-2(b) under the Investment Company Act of 1940, is attached.
| | |
SIGNATURES |
| |
| | Pursuant to the requirements of the Securities Exchange Act of 1934 and the Investment |
| Company Act of 1940, the registrant has duly caused this report to be signed on its behalf by the |
| undersigned, thereunto duly authorized. |
| |
| T. Rowe Price Equity Series, Inc. |
| |
| |
| |
| By | /s/ Edward C. Bernard |
| | Edward C. Bernard |
| | Principal Executive Officer |
| |
| Date | August 20, 2008 |
| |
| |
| |
| | Pursuant to the requirements of the Securities Exchange Act of 1934 and the Investment |
| Company Act of 1940, this report has been signed below by the following persons on behalf of |
| the registrant and in the capacities and on the dates indicated. |
| |
| |
| By | /s/ Edward C. Bernard |
| | Edward C. Bernard |
| | Principal Executive Officer |
| |
| Date | August 20, 2008 |
| |
| |
| |
| By | /s/ Gregory K. Hinkle |
| | Gregory K. Hinkle |
| | Principal Financial Officer |
| |
| Date | August 20, 2008 |