Item 1: Report to Shareholders| New America Growth Portfolio | June 30, 2007 |
The views and opinions in this report were current as of June 30, 2007. They are not guarantees of performance or investment results and should not be taken as investment advice. Investment decisions reflect a variety of factors, and the managers reserve the right to change their views about individual stocks, sectors, and the markets at any time. As a result, the views expressed should not be relied upon as a forecast of the fund’s future investment intent. The report is certified under the Sarbanes-Oxley Act, which requires mutual funds and other public companies to affirm that, to the best of their knowledge, the information in their financial reports is fairly and accurately stated in all material respects.
Manager’s Letter
T. Rowe Price New America Growth Portfolio
Dear Investor
The equity markets rallied broadly during the first half of the year, with most of the gains recorded in the second quarter. Stocks benefited from better-than-expected first-quarter profit growth, the Federal Reserve’s steady monetary policy, signs of an economic pickup in the second quarter, and substantial merger and acquisition activity, including a marked increase in leveraged buyout offers from private-equity firms. This environment was conducive to New America Growth’s six-month performance.
• For the first time in many years, growth stocks outperformed value stocks across the market-cap spectrum.
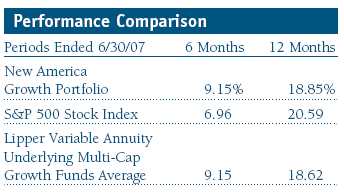
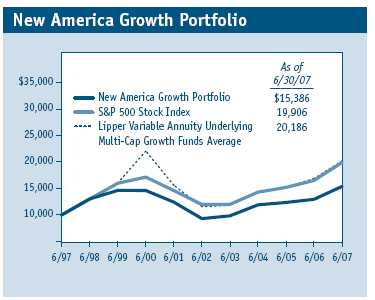
• During the six-month period, the portfolio generated a 9.15% return, which outpaced the S&P 500 and was the same as the Lipper average.
• While valuations are not as attractive as they were a year ago, they remain reasonable for the universe of larger-cap growth companies in which the portfolio invests.
• New America Growth enters the back half of 2007 fully invested and heavily weighted toward higher-growth sectors.
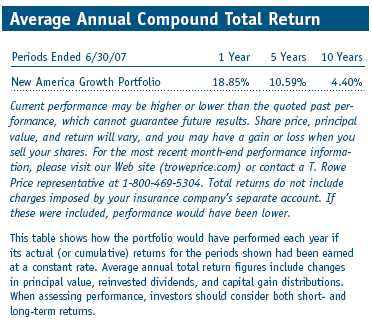
During the six-month period, the portfolio generated a 9.15% return, which outpaced the S&P 500’s 6.96% result and was identical to the Lipper Variable Annuity Underlying Multi-Cap Growth Funds Average. For the trailing 12-month period, the portfolio’s 18.85% return lagged the S&P 500 Index and narrowly surpassed our Lipper peer group.
Market Environment
Inflation fears remained front and center on investors’ minds during the first half of 2007 as energy and food prices rose. Despite the increase in so-called headline inflation, the Federal Reserve did not adjust interest rates during the period. Additionally, the housing market weakened and the subprime mortgage market collapsed. Yet there was plenty of good news in the form of continued strong corporate earnings growth and a deluge of merger and acquisition activity, including the announced acquisitions by private-equity firms of long-time fund holdings Harman International, First Data, and Affiliated Computer Services. (Please refer to the portfolio of investments for a complete listing of holdings and the amount each represents in the portfolio.)
Almost all S&P 500 sectors rose during the period. Overall, I’d describe sector returns as roughly neutral for the portfolio. Our primary areas of focus were mixed with technology performing above average, health care about average, and consumer discretionary below average. Financials were the worst-performing sector, while telecommunication services and materials were two of the three best performers; none of these three sectors are a significant area of investment for the portfolio.

Continuing a longtime trend, large-cap growth stocks underperformed their mid- and small-cap growth counterparts during the first half. The Russell 1000 Growth Index, a proxy for the performance of large-cap, growth-oriented stocks, rose 8.13% during the six-month period. This compares with Russell’s mid-cap growth and small-cap growth index returns of 10.97% and 9.33%, respectively. On the other hand, for the first time in many years, growth stocks outperformed value stocks across the market-cap spectrum. As shown in the table on page 1, large- and mid-cap growth stocks outperformed value shares by approximately two percentage points. In the small-cap universe, the performance disparity between growth and value was even greater.
Portfolio Review
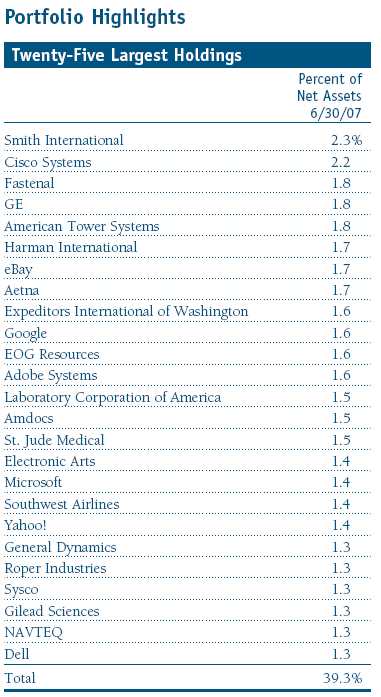
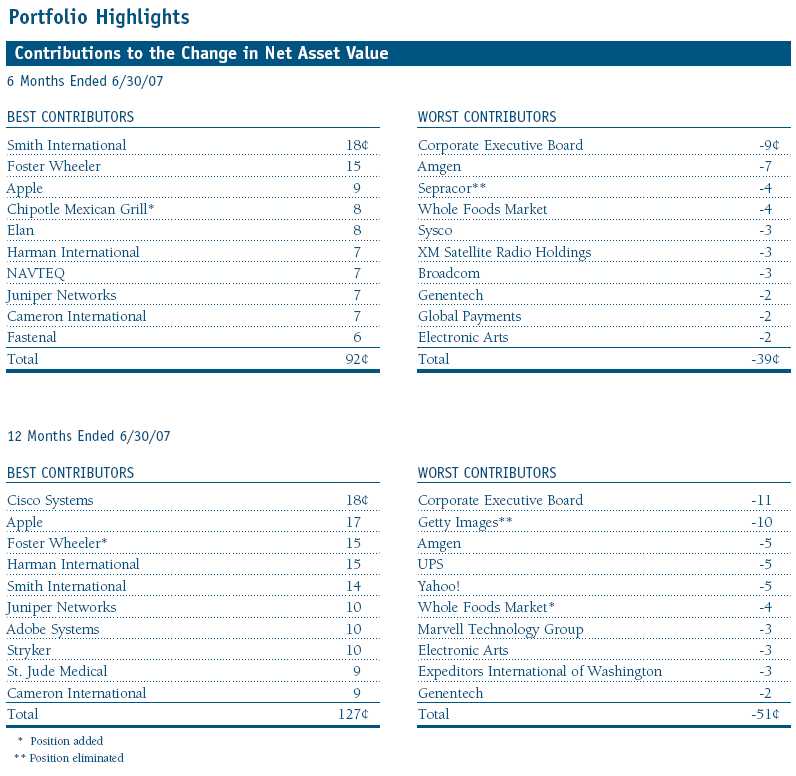
The portfolio’s three largest performance contributors over the past six months were Smith International, Foster Wheeler, and Apple. Oilfield services company Smith International has been highlighted in this letter on several occasions over the last few years. The stock remained in favor given strong energy demand and its earnings growth has been impressive. While I have trimmed the stock along the way to manage position size, Smith continued to be the portfolio’s largest holding at the end of June.
Foster Wheeler, a newer name in the portfolio, has paid quick dividends. Foster is an engineering and construction company focused on building energy processing facilities, such as oil refineries. The company is benefiting from strong worldwide demand for its services and has enjoyed rapidly expanding profit margins. The company’s first-quarter results were outstanding, and the stock has roughly doubled since the start of 2007.
Apple performed well across its core businesses, the Macintosh line of computers and iPods, and benefited from enthusiasm for its recently launched iPhone. Apple continues to redefine itself as a company selling innovative products and experiences, rather than just computer hardware, and its stock has reached new all-time highs as a result.
Top performers for the 12-month period included Cisco Systems, Apple, and Foster Wheeler. Cisco, a large position and longtime holding, is a global leader in the design, manufacture, and marketing of telecommunications equipment, including routers, switching systems, work stations, and home networking products. The company generated solid revenue and earnings gains, and the share price advanced about 50% over the past 12 months.
Harman International, another strong 6- and 12-month contributor, is also worthy of mention. Harman has been a significant position in the portfolio for several years. Our confidence in this leading global manufacturer of automotive navigation systems and maker of JBL, Infinity, and Mark Levinson brands was rewarded in April when the shares jumped in response to a cash buyout offer for $120 per share.
Top detractors during the six-month period included Corporate Executive Board, Amgen, Sepracor, and Whole Foods Market. Corporate Executive Board declined after missing first-half profit targets due to sales force execution issues. While this was disappointing, the company is still growing at above-average rates and is attractively valued; as such, we have maintained a position in the stock.
Amgen, which has been one of the portfolio’s larger holdings for the past few years, hit the skids in the first half of the year. The stock is off about 20% from its peak share price, falling to $55 in late June. This biotech’s woes stem from the Food and Drug Administration’s warning labels on its top-selling anti-anemia drugs Aranesp and Epogen. Sepracor’s shares, which have historically been volatile, declined since the announcement that reimbursements for its blockbuster drug Xopenex (which accounted for almost half of the firm’s first-quarter revenues) would be reduced.
Although we’ve maintained a stake in Amgen, we decided to sell our entire Sepracor position.
Whole Foods’ shares declined sharply in the second quarter as same-store sales growth moderated from its torrid pace of the past three years. Additionally, the company’s margins decreased as new stores opened, which pressured earnings. While I expect this profit margin squeeze to persist through the rest of 2007 and into 2008, I favor the accelerated rate of new-store openings as Whole Foods could at least double its current store count of 200 in the United States. In my view, the long-term growth outlook remains solid, as demand for natural and organic foods continues to be strong.
Investment Strategy
The New America Growth Portfolio seeks to invest in America’s best larger-growth companies. We are attracted to companies that serve large and growing markets, enjoy high and/or rising profit margins and returns, feature a strong balance sheet, and generate above-average free cash flow. Experienced, capable management is critical, as well.
One of the portfolio’s largest first-half purchases was Quanta Services. This Houston-based company is a full-service infrastructure contractor that provides design, engineering, installation, maintenance, and repairs for the electric power, natural gas, telecommunications, and cable television industries. My key investment thesis is that the United States electric grid—its transmission and distribution (T&D) infrastructure—has suffered from underinvestment over the past 20 years. Given the increasing demand for power, the rising congestion and incidence of outages, and recent moves by utilities to invest more in T&D, I believe electric utilities may be in the early stages of a significant multiyear investment program to improve the grid. After many years of low single-digit spending growth on T&D infrastructure, I think annual growth in this market could accelerate to a double-digit range over the near to intermediate te rm.
Quanta is well positioned to take advantage of this attractive backdrop of increased spending and a declining workforce. Over the past two decades, the utility industry has been shedding workers, and a large number of power industry workers will be eligible to retire in the coming years. In a market full of smaller, niche players, the company has emerged as the largest T&D network service provider in the U.S. Its national coverage, reputation, and scope of services are especially attractive in light of the developing shortage of power industry workers.
Quanta’s strong competitive position, coupled with accelerating T&D spending and a growing electric utility labor shortage, should help to generate double-digit revenue growth for the company and boost its profit margins. As a result, I think Quanta can provide 20% annual earnings gains for the next three to five years. Although this company is hardly a household name today, if I’m right about its future growth, Quanta is a name you will be hearing more about, and one that I expect to own for many years to come.
Outlook
I continue to be optimistic about the portfolio’s prospects for the rest of the year. I expect strong earnings growth from our holdings, and while valuations are not as attractive as they were one year ago, they remain reasonable for the universe of larger-cap growth companies in which I invest.
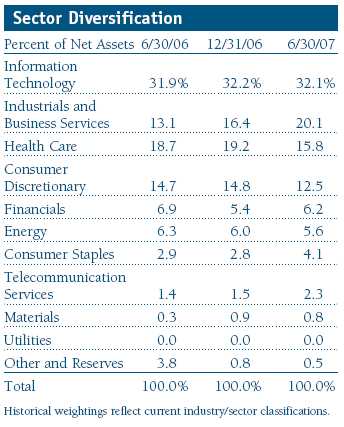
Aside from valuation, risks ahead include rising inflation, the resilience of the consumer given the housing market downturn, and uncertainty about the 2008 elections. I believe that the Federal Reserve is in the late innings of raising interest rates to fight inflation, that the consumer seems to be bending but not breaking, and that the 2008 elections are too early to call in terms of a discernible market impact. So, while I am mindful of these risks, I continue to manage the portfolio with an offensive posture. The New America Growth Portfolio enters the back half of 2007 fully invested and heavily weighted toward higher-growth sectors including information technology, industrials and business services, health care, and consumer discretionary. As has been the case historically, we have minimal exposure to slower-growth areas such as financials and utilities.
In my day-to-day management of the portfolio, I continue to focus on finding and investing in high-quality growth companies that fit my investment discipline, as I have for nearly five years now. As always, I look forward to updating shareholders at year-end on the portfolio’s progress.
Respectfully submitted,

Joseph M. Milano
Chairman of the portfolio’s Investment Advisory Committee
July 20, 2007
The committee chairman has day-to-day responsibility for managing the portfolio and works with committee members in developing and executing the investment program.
The portfolio’s share price can fall because of weakness in the stock markets, a particular industry, or specific holdings. Stock markets can decline for many reasons, including adverse political or economic developments, changes in investor psychology, or heavy institutional selling. The prospects for an industry or company may deteriorate because of a variety of factors, including disappointing earnings or changes in the competitive environment. In addition, the investment manager’s assessment of companies held in a portfolio may prove incorrect, resulting in losses or poor performance even in rising markets.
Dividend yield: The annual dividend of a stock divided by the stock’s price.
Free cash flow: The excess cash a company is generating from its operations that can be taken out of the business for the benefit of shareholders, such as dividends, share repurchases, investments, and acquisitions.
Lipper averages: The average returns of all portfolios in a particular category as tracked by Lipper Inc.
Price/book ratio: A valuation measure that compares a stock’s market price to its book value, i.e., the company’s net worth divided by the number of outstanding shares.
Price/earnings ratio (P/E): A valuation measure calculated by dividing the price of a stock by its current or projected earnings per share. This ratio gives investors an idea of how much they are paying for current or future earnings power.
Russell 1000 Growth Index: An index that tracks the performance of large-cap stocks with higher price-to-book ratios and higher forecasted growth values.
Russell 1000 Value Index: An index that tracks the performance of large-cap stocks with lower price-to-book ratios and lower forecasted growth values.
Russell 2000 Growth Index: An index that tracks the performance of small-cap stocks with higher price-to-book ratios and higher forecasted growth values.
Russell 2000 Value Index: An index that tracks the performance of small-cap stocks with lower price-to-book ratios and lower forecasted growth values.
Russell Midcap Growth Index: An index that tracks the performance of mid-cap stocks with higher price-to-book ratios and higher forecasted growth values.
Russell Midcap Value Index: An index that tracks the performance of mid-cap stocks with lower price-to-book ratios and lower forecasted growth values.
S&P 500 Stock Index: An unmanaged index that tracks the stocks of 500 primarily large-cap U.S. companies.
Performance and Expenses
T. Rowe Price New America Growth Portfolio
This chart shows the value of a hypothetical $10,000 investment in the fund over the past 10 fiscal year periods or since inception (for funds lacking 10-year records). The result is compared with benchmarks, which may include a broad-based market index and a peer group average or index. Market indexes do not include expenses, which are deducted from fund returns as well as mutual fund averages and indexes.
Fund Expense Example
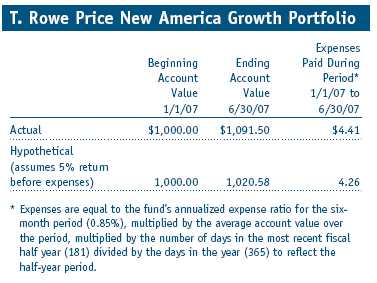
As a mutual fund shareholder, you may incur two types of costs: (1) transaction costs, such as redemption fees or sales loads, and (2) ongoing costs, including management fees, distribution and service (12b-1) fees, and other fund expenses. The following example is intended to help you understand your ongoing costs (in dollars) of investing in the fund and to compare these costs with the ongoing costs of investing in other mutual funds. The example is based on an investment of $1,000 invested at the beginning of the most recent six-month period and held for the entire period.
Actual Expenses
The first line of the following table (“Actual”) provides information about actual account values and actual expenses. You may use the information in this line, together with your account balance, to estimate the expenses that you paid over the period. Simply divide your account value by $1,000 (for example, an $8,600 account value divided by $1,000 = 8.6), then multiply the result by the number in the first line under the heading “Expenses Paid During Period” to estimate the expenses you paid on your account during this period.
Hypothetical Example for Comparison Purposes
The information on the second line of the table (“Hypothetical”) is based on hypothetical account values and expenses derived from the fund’s actual expense ratio and an assumed 5% per year rate of return before expenses (not the fund’s actual return). You may compare the ongoing costs of investing in the fund with other funds by contrasting this 5% hypothetical example and the 5% hypothetical examples that appear in the shareholder reports of the other funds. The hypothetical account values and expenses may not be used to estimate the actual ending account balance or expenses you paid for the period.
You should also be aware that the expenses shown in the table highlight only your ongoing costs and do not reflect any transaction costs, such as redemption fees or sales loads. Therefore, the second line of the table is useful in comparing ongoing costs only, and will not help you determine the relative total costs of owning different funds. To the extent a fund charges transaction costs, however, the total cost of owning that fund is higher.
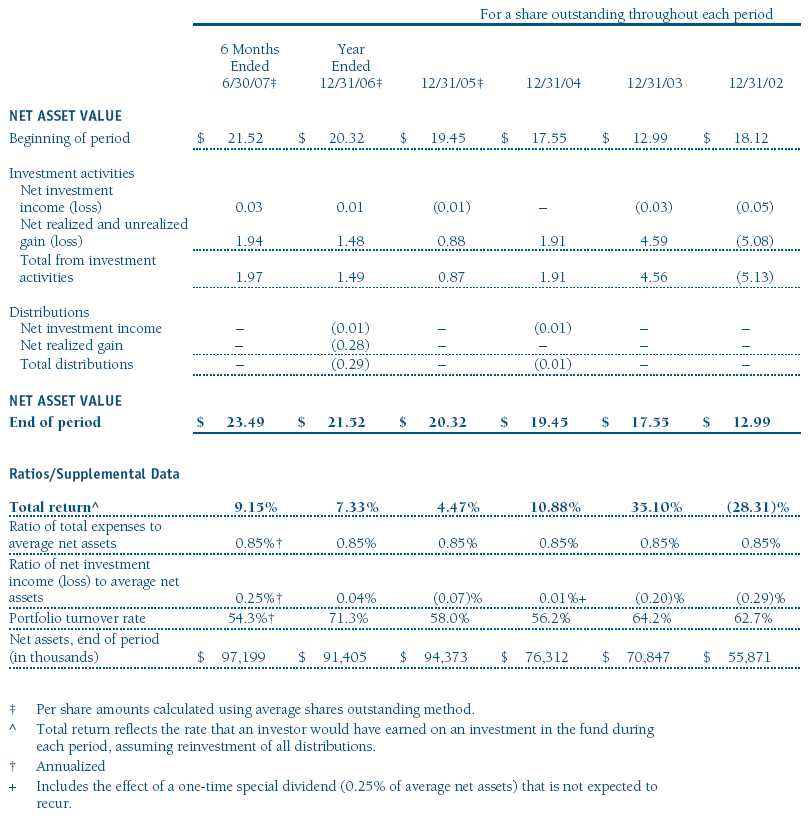
Financial Highlights
T. Rowe Price New America Growth Portfolio
(Unaudited)
The accompanying notes are an integral part of these financial statements.
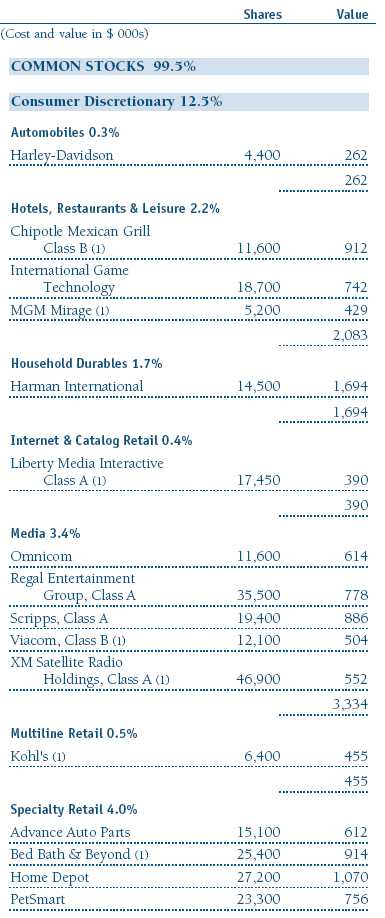
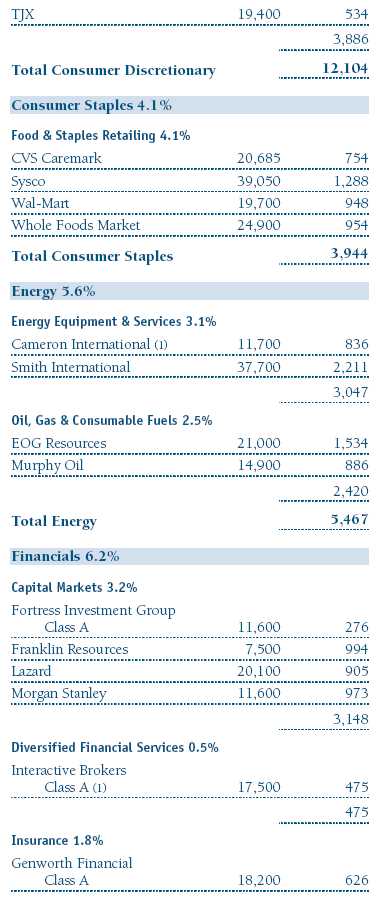
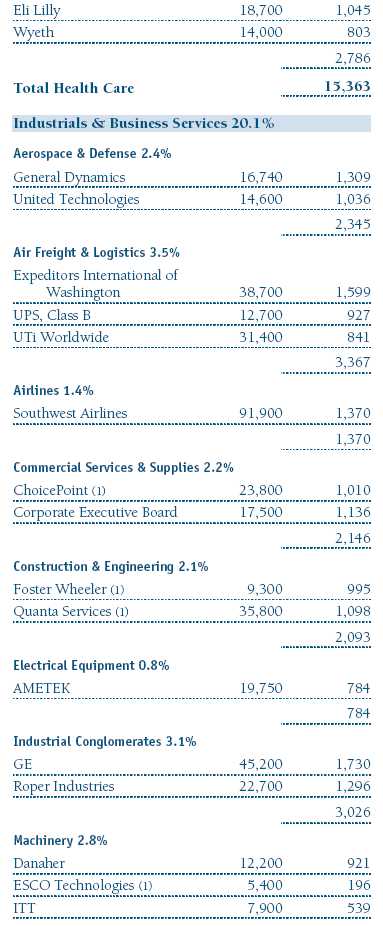
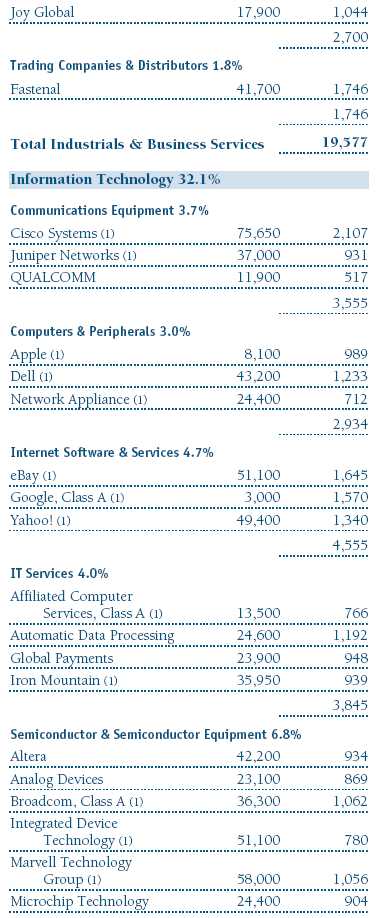
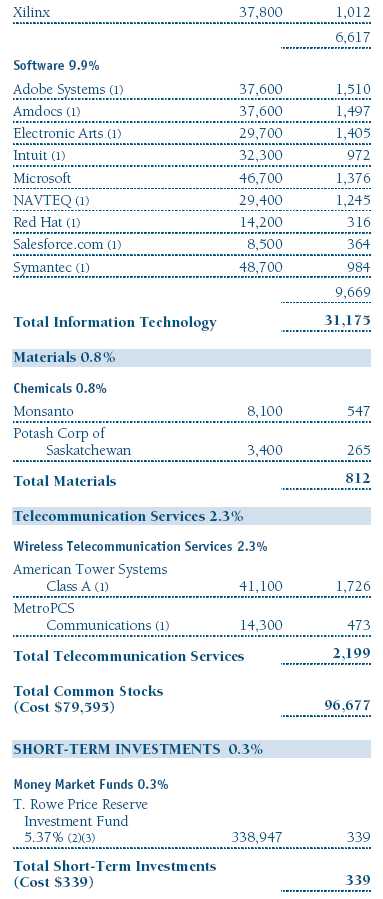
Portfolio of Investments †
T. Rowe Price New America Growth Portfolio
June 30, 2007 (Unaudited)

The accompanying notes are an integral part of these financial statements.
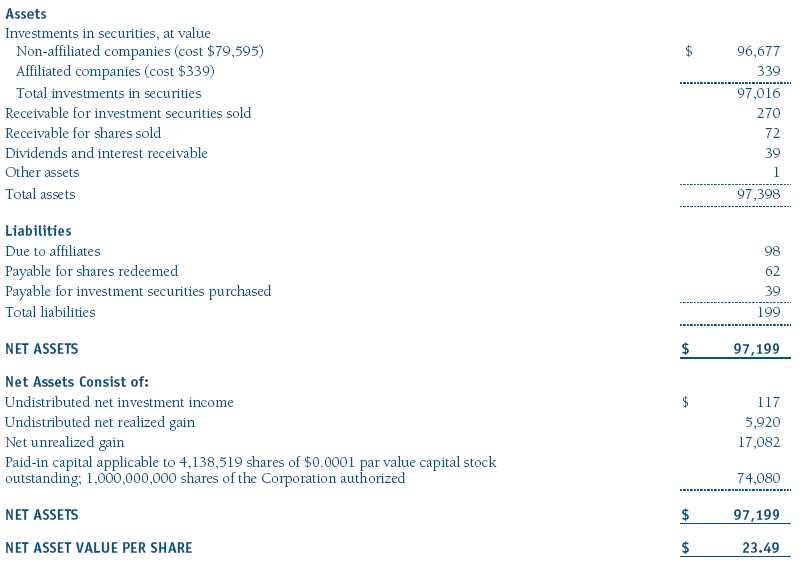
Statement of Assets and Liabilities
T. Rowe Price New America Growth Portfolio
June 30, 2007 (Unaudited)
(In thousands except shares and per share amounts)
The accompanying notes are an integral part of these financial statements.
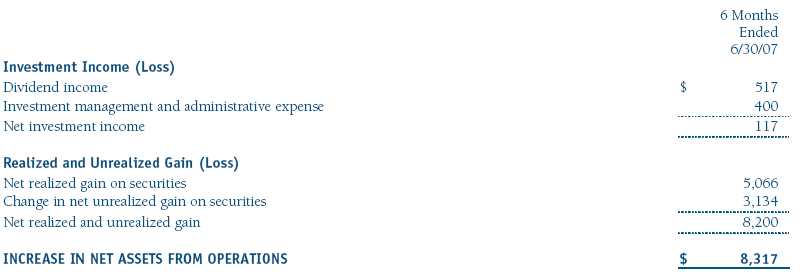
Statement of Operations
T. Rowe Price New America Growth Portfolio
(Unaudited)
($ 000s)
The accompanying notes are an integral part of these financial statements.
Statement of Changes in Net Assets
T. Rowe Price New America Growth Portfolio
(Unaudited)
($ 000s)

The accompanying notes are an integral part of these financial statements.
Notes to Financial Statements
T. Rowe Price New America Growth Portfolio
June 30, 2007 (Unaudited)
NOTE 1 - SIGNIFICANT ACCOUNTING POLICIES
T. Rowe Price Equity Series, Inc. (the corporation), is registered under the Investment Company Act of 1940 (the 1940 Act). The New America Growth Portfolio (the fund), a diversified, open-end management investment company, is one portfolio established by the corporation. The fund commenced operations on March 31, 1994. The fund seeks to provide long-term capital growth by investing primarily in the common stocks of growth companies. Shares of the fund are currently offered only through certain insurance companies as an investment medium for both variable annuity contracts and variable life insurance policies.
The accompanying financial statements were prepared in accordance with accounting principles generally accepted in the United States of America, which require the use of estimates made by fund management. Fund management believes that estimates and security valuations are appropriate; however, actual results may differ from those estimates, and the security valuations reflected in the financial statements may differ from the value the fund ultimately realizes upon sale of the securities.
Valuation The fund values its investments and computes its net asset value per share at the close of the New York Stock Exchange (NYSE), normally 4 p.m. ET, each day that the NYSE is open for business. Equity securities listed or regularly traded on a securities exchange or in the over-the-counter (OTC) market are valued at the last quoted sale price or, for certain markets, the official closing price at the time the valuations are made, except for OTC Bulletin Board securities, which are valued at the mean of the latest bid and asked prices. A security that is listed or traded on more than one exchange is valued at the quotation on the exchange determined to be the primary market for such security. Listed securities not traded on a particular day are valued at the mean of the latest bid and asked prices for domestic securities and the last quoted sale price for international securities.
Investments in mutual funds are valued at the mutual fund’s closing net asset value per share on the day of valuation.
Other investments, including restricted securities, and those for which the above valuation procedures are inappropriate or are deemed not to reflect fair value are stated at fair value as determined in good faith by the T. Rowe Price Valuation Committee, established by the fund’s Board of Directors.
Rebates Subject to best execution, the fund may direct certain security trades to brokers who have agreed to rebate a portion of the related brokerage commission to the fund in cash. Commission rebates are reflected as realized gain on securities in the accompanying financial statements and totaled $3,000 for the six months ended June 30, 2007.
Investment Transactions, Investment Income, and Distributions Income and expenses are recorded on the accrual basis. Dividends received from mutual fund investments are reflected as dividend income; capital gain distributions are reflected as realized gain/loss. Dividend income and capital gain distributions are recorded on the ex-dividend date. Any income tax-related interest and penalties would be classified as income tax expense. Investment transactions are accounted for on the trade date. Realized gains and losses are reported on the identified cost basis. Distributions to shareholders are recorded on the ex-dividend date. Income distributions are declared and paid on an annual basis. Capital gain distributions, if any, are declared and paid by the fund, typically on an annual basis.
New Accounting Pronouncements Effective June 29, 2007, the fund adopted Financial Accounting Standards Board (“FASB”) Interpretation No. 48 (“FIN 48”), Accounting for Uncertainty in Income Taxes, a clarification of FASB Statement No. 109, Accounting for Income Taxes. FIN 48 establishes financial accounting and disclosure requirements for recognition and measurement of tax positions taken or expected to be taken on an income tax return. The adoption of FIN 48 had no impact on the fund’s net assets or results of operations.
In September 2006, the FASB released the Statement of Financial Accounting Standard No. 157 (“FAS 157”), Fair Value Measurements. FAS 157 clarifies the definition of fair value and establishes the framework for measuring fair value, as well as proper disclosure of this methodology in the financial statements. It will be effective for the fund’s fiscal year beginning January 1, 2008. Management is evaluating the effects of FAS 157; however, it is not expected to have a material impact on the fund’s net assets or results of operations.
NOTE 2 - INVESTMENT TRANSACTIONS
Purchases and sales of portfolio securities, other than short-term securities, aggregated $25,381,000 and $27,518,000, respectively, for the six months ended June 30, 2007.
NOTE 3 - FEDERAL INCOME TAXES
No provision for federal income taxes is required since the fund intends to continue to qualify as a regulated investment company under Subchapter M of the Internal Revenue Code and distribute to shareholders all of its taxable income and gains. Federal income tax regulations differ from generally accepted accounting principles; therefore, distributions determined in accordance with tax regulations may differ in amount or character from net investment income and realized gains for financial reporting purposes. Financial reporting records are adjusted for permanent book/tax differences to reflect tax character. Financial records are not adjusted for temporary differences. The amount and character of tax-basis distributions and composition of net assets are finalized at fiscal year-end; accordingly, tax-basis balances have not been determined as of June 30, 2007.
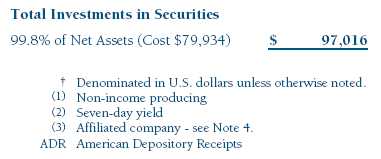
At June 30, 2007, the cost of investments for federal income tax purposes was $79,934,000. Net unrealized gain aggregated $17,082,000 at period-end, of which $18,914,000 related to appreciated investments and $1,832,000 related to depreciated investments.
NOTE 4 - RELATED PARTY TRANSACTIONS
The fund is managed by T. Rowe Price Associates, Inc. (the manager or Price Associates), a wholly owned subsidiary of T. Rowe Price Group, Inc. The investment management and administrative agreement between the fund and the manager provides for an all-inclusive annual fee equal to 0.85% of the fund’s average daily net assets. The fee is computed daily and paid monthly. The agreement provides that investment management, shareholder servicing, transfer agency, accounting, custody services, and directors’ fees and expenses are provided to the fund, and interest, taxes, brokerage commissions, and extraordinary expenses are paid directly by the fund.
The fund may invest in the T. Rowe Price Reserve Investment Fund and the T. Rowe Price Government Reserve Investment Fund (collectively, the T. Rowe Price Reserve Investment Funds), open-end management investment companies managed by Price Associates and affiliates of the fund. The T. Rowe Price Reserve Investment Funds are offered as cash management options to mutual funds, trusts, and other accounts managed by Price Associates and/or its affiliates, and are not available for direct purchase by members of the public. The T. Rowe Price Reserve Investment Funds pay no investment management fees. During the six months ended June 30, 2007, dividend income from the T. Rowe Price Reserve Investment Funds totaled $21,000, and the value of shares of the T. Rowe Price Reserve Investment Funds held at June 30, 2007, and December 31, 2006, was $339,000 and $1,382,000, respectively.
| Information on Proxy Voting Policies, Procedures, and Records |
A description of the policies and procedures used by T. Rowe Price funds and portfolios to determine how to vote proxies relating to portfolio securities is available in each fund’s Statement of Additional Information, which you may request by calling 1-800-225-5132 or by accessing the SEC’s Web site, www.sec.gov. The description of our proxy voting policies and procedures is also available on our Web site, www.troweprice.com. To access it, click on the words “Company Info” at the top of our homepage for individual investors. Then, in the window that appears, click on the “Proxy Voting Policy” navigation button in the top left corner.
Each fund’s most recent annual proxy voting record is available on our Web site and through the SEC’s Web site. To access it through our Web site, follow the directions above, then click on the words “Proxy Voting Record” at the bottom of the Proxy Voting Policy page.
| How to Obtain Quarterly Portfolio Holdings |
The fund files a complete schedule of portfolio holdings with the Securities and Exchange Commission for the first and third quarters of each fiscal year on Form N-Q. The fund’s Form N-Q is available electronically on the SEC’s Web site (www.sec.gov); hard copies may be reviewed and copied at the SEC’s Public Reference Room, 450 Fifth St. N.W., Washington, DC 20549. For more information on the Public Reference Room, call 1-800-SEC-0330.
| Approval of Investment Management Agreement |
On March 7, 2007, the fund’s Board of Directors (Board) unanimously approved the investment advisory contract (Contract) between the fund and its investment manager, T. Rowe Price Associates, Inc. (Manager). The Board considered a variety of factors in connection with its review of the Contract, also taking into account information provided by the Manager during the course of the year, as discussed below:
Services Provided by the Manager
The Board considered the nature, quality, and extent of the services provided to the fund by the Manager. These services included, but were not limited to, management of the fund’s portfolio and a variety of related activities, as well as financial and administrative services, reporting, and communications. The Board also reviewed the background and experience of the Manager’s senior management team and investment personnel involved in the management of the fund. The Board concluded that it was satisfied with the nature, quality, and extent of the services provided by the Manager.
Investment Performance of the Fund
The Board reviewed the fund’s average annual total return over the 1-, 3-, 5-, and 10-year periods as well as the fund’s year-by-year returns and compared these returns with previously agreed upon comparable performance measures and market data, including those supplied by Lipper and Morningstar, which are independent providers of mutual fund data. On the basis of this evaluation and the Board’s ongoing review of investment results, the Board concluded that the fund’s performance was satisfactory.
Costs, Benefits, Profits, and Economies of Scale
The Board reviewed detailed information regarding the revenues received by the Manager under the Contract and other benefits that the Manager (and its affiliates) may have realized from its relationship with the fund, including research received under “soft dollar” agreements. The Board noted that soft dollars were not used to pay for third-party, non-broker research. The Board also received information on the estimated costs incurred and profits realized by the Manager and its affiliates from advising T. Rowe Price mutual funds, as well as estimates of the gross profits realized from managing the fund in particular. The Board concluded that the Manager’s profits were reasonable in light of the services provided to the fund. The Board also considered whether the fund or other funds benefit under the fee levels set forth in the Contract from any economies of scale realized by the Manager. The Board noted that, under the Contract, the fund pays the Manager a single fee based on the fund’s assets and the Manager, in turn, pays all expenses of the fund, with certain exceptions. The Board concluded that, based on the profitability data it reviewed and consistent with this single-fee structure, the Contract provided for a reasonable sharing of benefits from any economies of scale with the fund.
Fees
The Board reviewed the fund’s single-fee structure and compared the rate with fees and expenses of other comparable funds based on information and data supplied by Lipper. The information provided to the Board indicated that the fund’s single-fee rate was at or below the median management fee rate and expense ratio for comparable funds. The Board also reviewed the fee schedules for comparable privately managed accounts of the Manager and its affiliates. Management informed the Board that the Manager’s responsibilities for privately managed accounts are more limited than its responsibilities for the fund and other T. Rowe Price mutual funds that it or its affiliates advise. On the basis of the information provided, the Board concluded that the fees paid by the fund under the Contract were reasonable.
Approval of the Contract
As noted, the Board approved the continuation of the Contract. No single factor was considered in isolation or to be determinative to the decision. Rather, the Board concluded, in light of a weighting and balancing of all factors considered, that it was in the best interests of the fund to approve the continuation of the Contract, including the fees to be charged for services thereunder.
Item 2. Code of Ethics.
A code of ethics, as defined in Item 2 of Form N-CSR, applicable to its principal executive officer, principal financial officer, principal accounting officer or controller, or persons performing similar functions is filed as an exhibit to the registrant’s annual Form N-CSR. No substantive amendments were approved or waivers were granted to this code of ethics during the registrant’s most recent fiscal half-year.
Item 3. Audit Committee Financial Expert.
Disclosure required in registrant’s annual Form N-CSR.
Item 4. Principal Accountant Fees and Services.
Disclosure required in registrant’s annual Form N-CSR.
Item 5. Audit Committee of Listed Registrants.
Not applicable.
Item 6. Schedule of Investments.
Not applicable. The complete schedule of investments is included in Item 1 of this Form N-CSR.
Item 7. Disclosure of Proxy Voting Policies and Procedures for Closed-End Management Investment Companies.
Not applicable.
Item 8. Portfolio Managers of Closed-End Management Investment Companies.
Not applicable.
Item 9. Purchases of Equity Securities by Closed-End Management Investment Company and Affiliated Purchasers.
Not applicable.
Item 10. Submission of Matters to a Vote of Security Holders.
Not applicable.
Item 11. Controls and Procedures.
(a) The registrant’s principal executive officer and principal financial officer have evaluated the registrant’s disclosure controls and procedures within 90 days of this filing and have concluded that the registrant’s disclosure controls and procedures were effective, as of that date, in ensuring that information required to be disclosed by the registrant in this Form N-CSR was recorded, processed, summarized, and reported timely.
(b) The registrant’s principal executive officer and principal financial officer are aware of no change in the registrant’s internal control over financial reporting that occurred during the registrant’s second fiscal quarter covered by this report that has materially affected, or is reasonably likely to materially affect, the registrant’s internal control over financial reporting.
Item 12. Exhibits.(a)(1) The registrant’s code of ethics pursuant to Item 2 of Form N-CSR is filed with the registrant’s annual Form N-CSR.
(2) Separate certifications by the registrant's principal executive officer and principal financial officer, pursuant to Section 302 of the Sarbanes-Oxley Act of 2002 and required by Rule 30a-2(a) under the Investment Company Act of 1940, are attached.
(3) Written solicitation to repurchase securities issued by closed-end companies: not applicable.
(b) A certification by the registrant's principal executive officer and principal financial officer, pursuant to Section 906 of the Sarbanes-Oxley Act of 2002 and required by Rule 30a-2(b) under the Investment Company Act of 1940, is attached.
| |
| | |
SIGNATURES |
| |
| | Pursuant to the requirements of the Securities Exchange Act of 1934 and the Investment |
| Company Act of 1940, the registrant has duly caused this report to be signed on its behalf by the |
| undersigned, thereunto duly authorized. |
| |
| T. Rowe Price Equity Series, Inc. |
| |
| |
| By | /s/ Edward C. Bernard |
| | Edward C. Bernard |
| | Principal Executive Officer |
| |
| Date | August 17, 2007 |
| |
| |
| |
| | Pursuant to the requirements of the Securities Exchange Act of 1934 and the Investment |
| Company Act of 1940, this report has been signed below by the following persons on behalf of |
| the registrant and in the capacities and on the dates indicated. |
| |
| |
| By | /s/ Edward C. Bernard |
| | Edward C. Bernard |
| | Principal Executive Officer |
| |
| Date | August 17, 2007 |
| |
| |
| |
| By | /s/ Joseph A. Carrier |
| | Joseph A. Carrier |
| | Principal Financial Officer |
| |
| Date | August 17, 2007 |