Item 1: Report to Shareholders| Equity Index 500 Portfolio | June 30, 2007 |
The views and opinions in this report were current as of June 30, 2007. They are not guarantees of performance or investment results and should not be taken as investment advice. Investment decisions reflect a variety of factors, and the managers reserve the right to change their views about individual stocks, sectors, and the markets at any time. As a result, the views expressed should not be relied upon as a forecast of the fund’s future investment intent. The report is certified under the Sarbanes-Oxley Act, which requires mutual funds and other public companies to affirm that, to the best of their knowledge, the information in their financial reports is fairly and accurately stated in all material respects.
Manager’s Letter
T. Rowe Price Equity Index 500 Portfolio
Dear Investor
In the first six months of 2007, the U.S. stock market cooked up another solid rally, maintaining its momentum after four straight years of positive performance. The recipe for success involved many of the same ingredients as in recent years—better-than-expected earnings growth, a liberal amount of mergers and acquisitions, and a dash of economic resilience. The end result was some savory stock market gains as the broad S&P 500 index advanced by approximately 7%.
• Better-than-expected earnings, mergers and acquisitions, and the resilient economy lifted U.S. equities in the first half of 2007.
• The Equity Index 500 Portfolio closely tracked its unmanaged benchmark, the S&P 500 Index.
• Using a full replication strategy, we keep the composition of the portfolio in line with the benchmark.
• Economic and market fundamentals in the near term seem likely to remain favorable, but we will not attempt to determine which stocks or sectors are likely to perform best. Our main task is to replicate the structure and performance of the S&P 500.
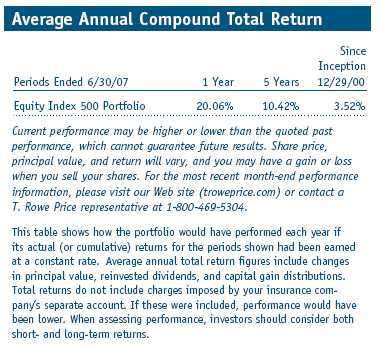
The portfolio returned 6.79% for the first six months of 2007 and 20.06% for the 12-month period ended June 30, 2007. As the accompanying table shows, the portfolio closely tracked the performance of its benchmark, the S&P 500 Stock Index, in both periods. The portfolio’s performance tends to lag that of the benchmark due to annual operating and management expenses.
Market Environment
Economic conditions continued to moderate in the first half of 2007. After growing by 3.3% in 2006, the U.S. economy grew at a meager 0.7% annualized rate in the first quarter of 2007 as further weakness in the housing market had an adverse impact on consumer spending. However, economic data improved in the second quarter, led by persistent strength in the labor market. Inflation, on the other hand, remained above the Federal Reserve’s comfort level, in part because of an increase in energy and commodity prices during the period. While the Fed kept the fed funds target rate at 5.25% throughout the first half of the year, investors reassessed their expectations for a Fed rate cut, pushing it out from the second half of 2007 to early 2008.
Reflecting the moderating economic environment, corporate profit growth also eased during the period, bringing an end to the record streak of double-digit earnings growth the S&P 500 had delivered every quarter since mid-2002. Despite the slowdown, however, earnings continued to exceed market expectations, which provided a positive backdrop for stocks. In addition, mergers and acquisitions were on pace to outstrip last year’s record amount as private-equity firms continued to pursue leveraged buyouts.
Portfolio and Performance Review
The T. Rowe Price Equity Index 500 Portfolio is designed for investors who want to harness the potential for long-term capital appreciation from broad exposure to large-cap stocks. This portfolio could serve as a core holding, as it offers many attributes that most investors will find appealing.
• It is well diversified, which can reduce the potentially negative impact of a given stock on the entire portfolio. The portfolio invests in all S&P 500 Index stocks.
• It tends to closely track its benchmark. The portfolio uses a full replication strategy so that the weightings of our holdings match those of the S&P 500 Index. We occasionally invest in securities such as futures and exchange-traded funds (ETFs) so that the portfolio can accommodate cash flows and remain fully invested.
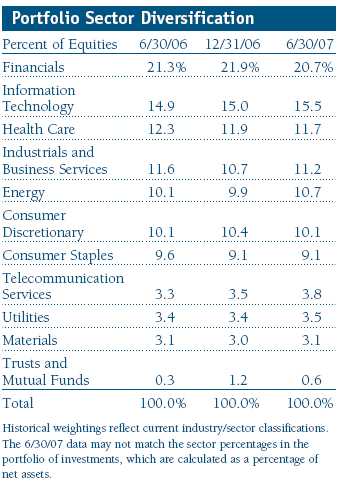
• It offers instant, broad exposure to different sectors of the stock market, and the portfolio’s sector allocations are consistent with the benchmark’s sector breakdown. As such, changes in sector diversification will reflect changes in the composition of the index, rather than strategic shifts that are typical of an actively managed portfolio.
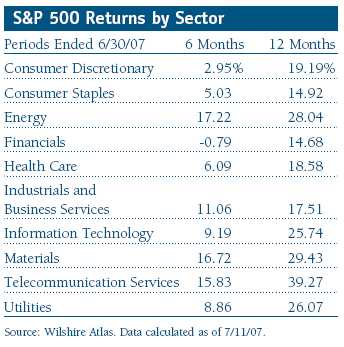
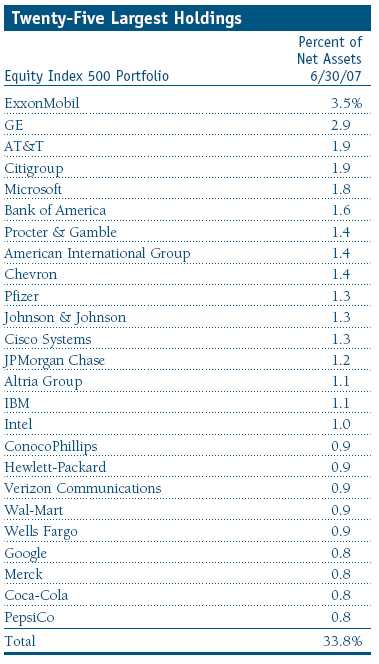
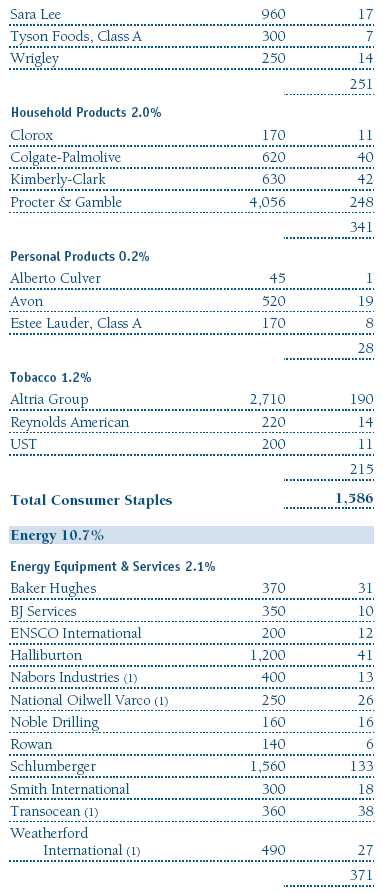
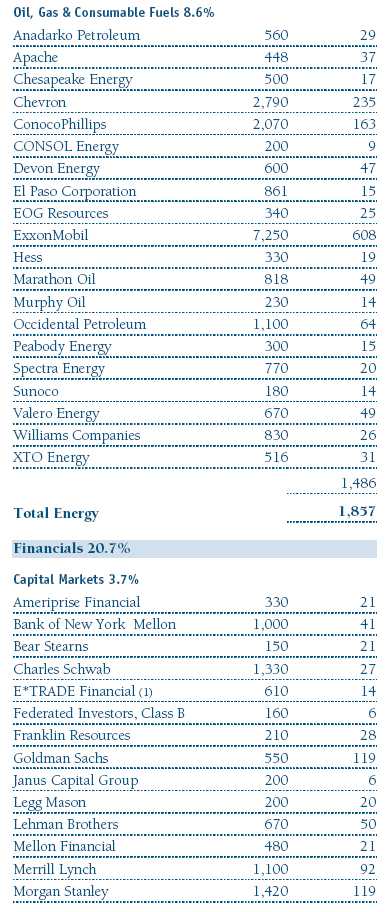
Nine of the 10 major sectors in the S&P 500 advanced for the six months. The top-performing sector was energy, which benefited from a 16% increase in the price of oil. Rising gasoline prices also supported energy stocks as refining profit margins expanded. Four of the portfolio’s top 10 performance contributors came from this sector, led by the portfolio’s largest holding, oil and gas producer ExxonMobil. Other top contributors included oilfield services provider Schlumberger, oil and gas producer Chevron, and oil refiner Valero Energy. (Please refer to the portfolio of investments for a complete listing of holdings and the amount each represents in the portfolio.)
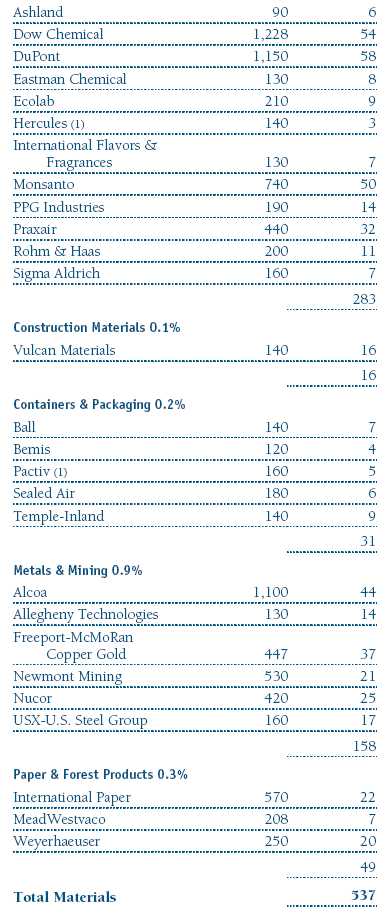
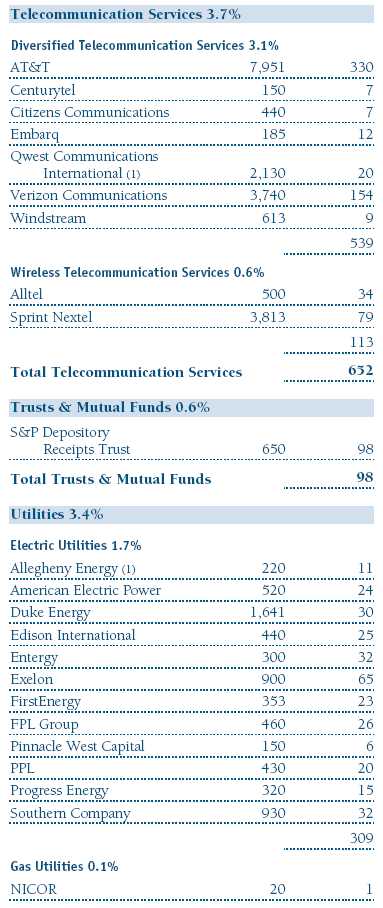
The materials and telecommunication services sectors, which are relatively small segments of the index, also generated strong results. Metals and mining stocks were the best performers in the materials sector, thanks to merger deals and speculation and a firming of some commodity prices. The leading contributors were aluminum producer Alcoa and copper producer Freeport-McMoRan Copper & Gold. In the telecom sector, takeover activity and speculation also contributed to our performance. For example, wireless provider Alltel rose after agreeing to be acquired by a pair of private-equity firms. Telecom giant AT&T was the portfolio’s second-best contributor as earnings exceeded expectations thanks to strength in its wireless business.
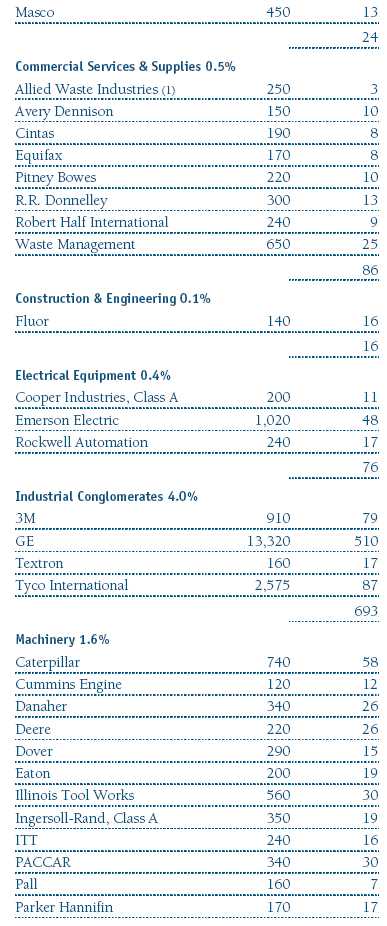
The industrials and business services sector enjoyed double-digit gains for the six-month period. Machinery manufacturers led the advance in this sector. Heavy machinery maker Caterpillar posted robust profit growth as strong construction and mining demand overseas helped overcome weak demand in the U.S. Also, General Electric continued to shed lower-growth businesses and redeploy capital into faster-growing areas, and this strategy began to pay off in the form of better earnings.
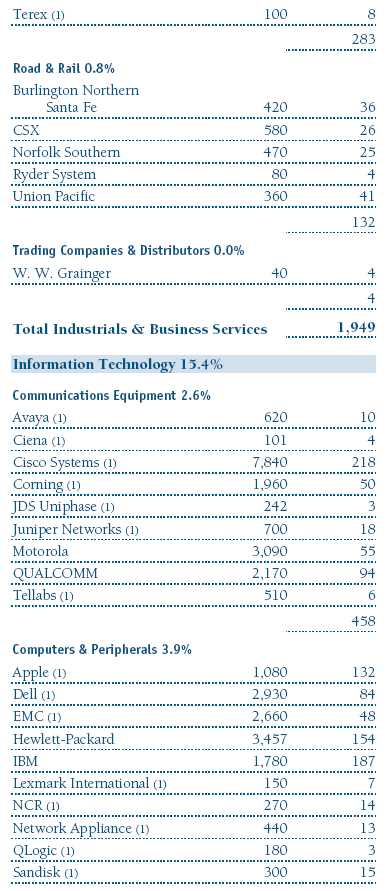
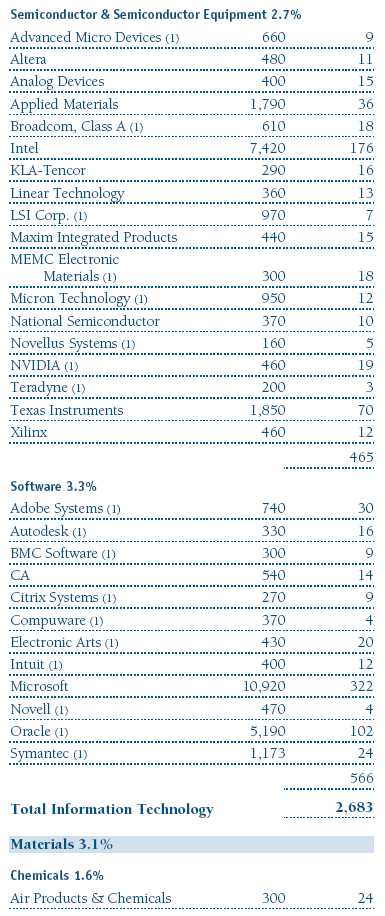
Information technology stocks performed better than the broad stock market for the six months. Computer and peripherals makers and semiconductor manufacturers fared best. Apple continued to benefit from the explosive growth of the iPod and another potential blockbuster in the iPhone. Intel recovered from a rough 2006 by regaining market share from rival Advanced Micro Devices. Search engine firm Google and chip-maker Texas Instruments were also among the top contributors in the technology sector.
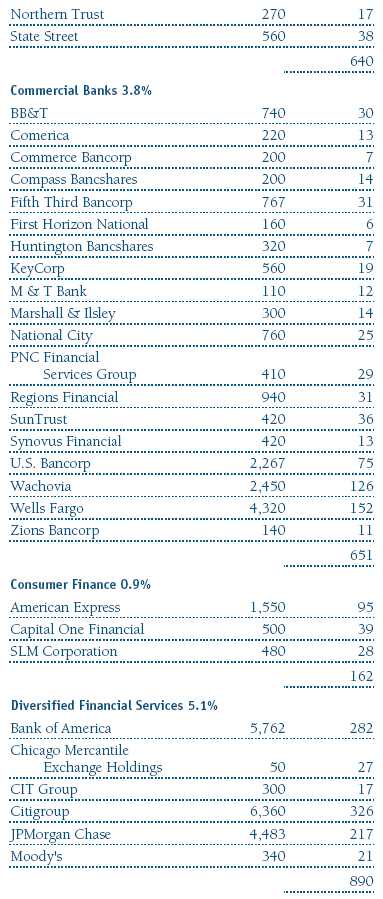
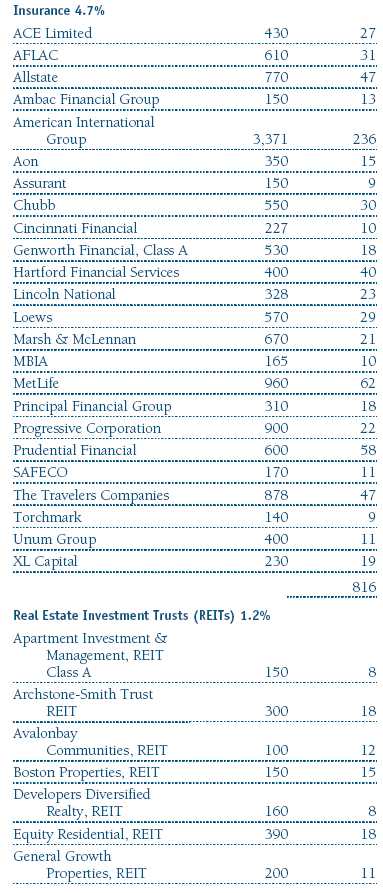
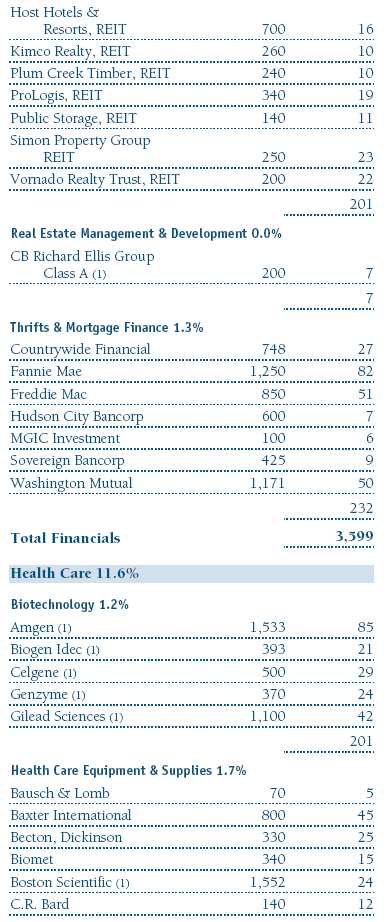
Financials, the largest sector weighting in the portfolio and index, was the only sector to decline during the period. Rising interest rates and the debacle in the subprime mortgage market combined to push financial stocks modestly lower. Some of the largest detractors in the portfolio came from the financial sector—financial services titans Citigroup and Bank of America, commercial banks Wachovia and U.S. Bancorp, and capital markets firm Merrill Lynch.
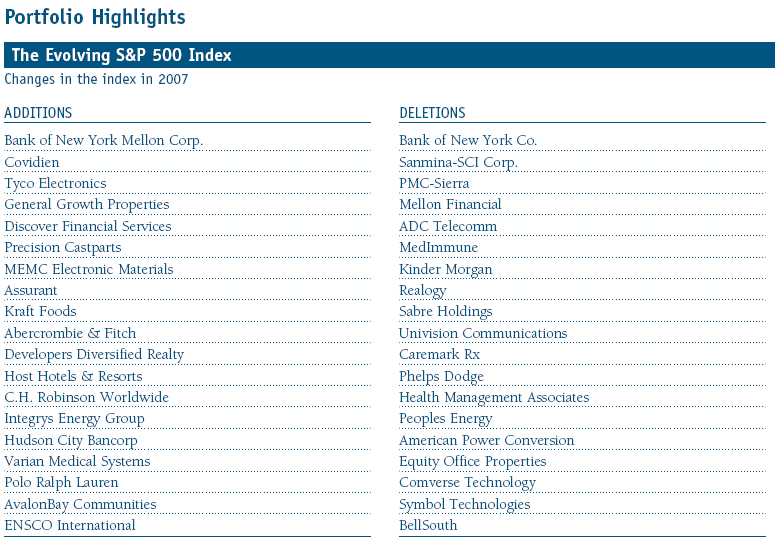
Standard & Poor’s authorized 19 changes to the composition of the S&P 500 Index in the first half of 2007. Many of the stocks that left the index were acquired by other companies or taken private via leveraged buyouts. Please see the table on page 5 for a complete list of index changes thus far in 2007.
Outlook
The U.S. economy seems to be getting a second wind following a year-long slowdown, and global economic growth is likely to remain favorable in the near term. This should be supportive of corporate earnings growth and, in turn, the stock market. Equities could also continue to benefit from vigorous merger and leveraged buyout activity, but rising interest rates and energy cost inflation could keep the economy and equity market in check.
In any event, as bullish and bearish forces manifest themselves in the form of daily market volatility, we will not attempt to determine which stocks or sectors are likely to perform best. Our main task is to replicate the structure and performance of the S&P 500 Index to provide you with broad exposure to the large-cap segment of the U.S. stock market.
Respectfully submitted,

E. Frederick Bair
Chairman of the portfolio’s Investment Advisory Committee
July 23, 2007
The committee chairman has day-to-day responsibility for managing the portfolio and works with committee members in developing and executing the portfolio’s investment program.
As with all stock mutual funds, the portfolio’s share price can fall because of weakness in the stock market, a particular industry, or specific holdings. Stock markets can decline for many reasons, including adverse political or economic developments, changes in investor psychology, or heavy institutional selling. The prospects for an industry or company may deteriorate because of a variety of factors, including disappointing earnings or changes in the competitive environment.
Fed funds target rate: An overnight lending rate set by the Federal Reserve and used by banks to meet reserve requirements. Banks also use the fed funds rate as a benchmark for their prime lending rates.
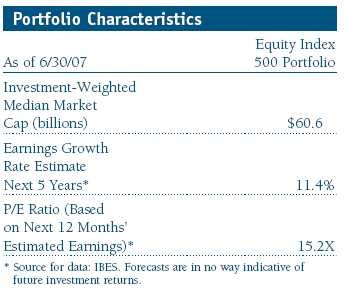
Price/earnings (P/E) ratio: A ratio that shows the “multiple” of earnings at which a stock is selling. It is calculated by dividing a stock’s current price by its earnings per share. For example, if a stock’s price is $60 per share and the issuing company earns $2 per share, the P/E ratio is $60/$2, or 30.
S&P 500 Stock Index: Tracks the stocks of 500 mostly large U.S. companies.
Performance and Expenses
T. Rowe Price Equity Index 500 Portfolio
This chart shows the value of a hypothetical $10,000 investment in the fund over the past 10 fiscal year periods or since inception (for funds lacking 10-year records). The result is compared with benchmarks, which may include a broad-based market index and a peer group average or index. Market indexes do not include expenses, which are deducted from fund returns as well as mutual fund averages and indexes.

Fund Expense Example
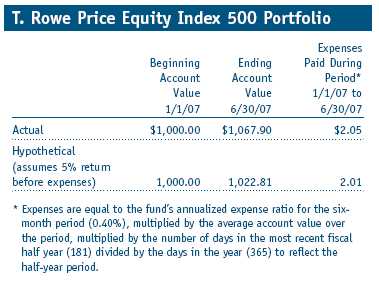
As a mutual fund shareholder, you may incur two types of costs: (1) transaction costs, such as redemption fees or sales loads, and (2) ongoing costs, including management fees, distribution and service (12b-1) fees, and other fund expenses. The following example is intended to help you understand your ongoing costs (in dollars) of investing in the fund and to compare these costs with the ongoing costs of investing in other mutual funds. The example is based on an investment of $1,000 invested at the beginning of the most recent six-month period and held for the entire period.
Actual Expenses
The first line of the following table (“Actual”) provides information about actual account values and actual expenses. You may use the information in this line, together with your account balance, to estimate the expenses that you paid over the period. Simply divide your account value by $1,000 (for example, an $8,600 account value divided by $1,000 = 8.6), then multiply the result by the number in the first line under the heading “Expenses Paid During Period” to estimate the expenses you paid on your account during this period.
Hypothetical Example for Comparison Purposes
The information on the second line of the table (“Hypothetical”) is based on hypothetical account values and expenses derived from the fund’s actual expense ratio and an assumed 5% per year rate of return before expenses (not the fund’s actual return). You may compare the ongoing costs of investing in the fund with other funds by contrasting this 5% hypothetical example and the 5% hypothetical examples that appear in the shareholder reports of the other funds. The hypothetical account values and expenses may not be used to estimate the actual ending account balance or expenses you paid for the period.
You should also be aware that the expenses shown in the table highlight only your ongoing costs and do not reflect any transaction costs, such as redemption fees or sales loads. Therefore, the second line of the table is useful in comparing ongoing costs only and will not help you determine the relative total costs of owning different funds. To the extent a fund charges transaction costs, however, the total cost of owning that fund is higher.
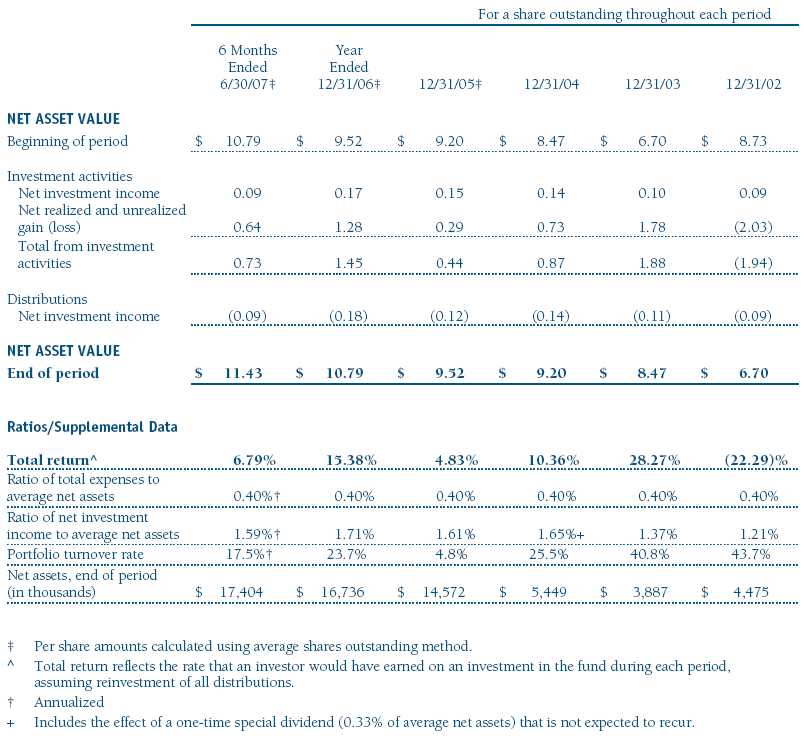
Financial Highlights
T. Rowe Price Equity Index 500 Portfolio
(Unaudited)
The accompanying notes are an integral part of these financial statements.
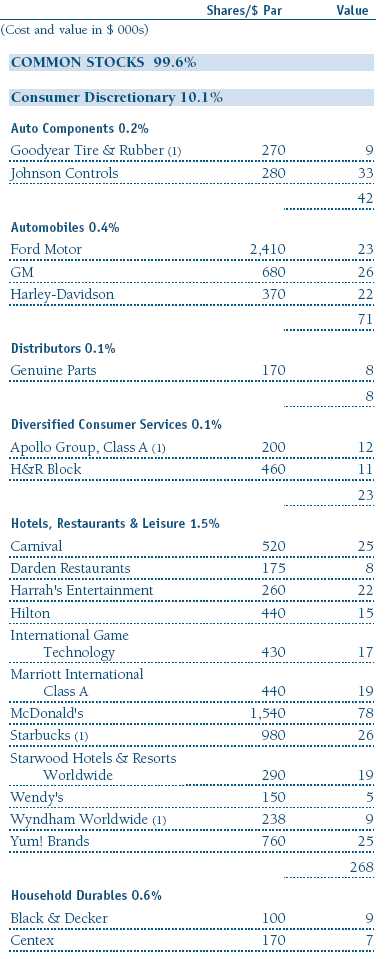
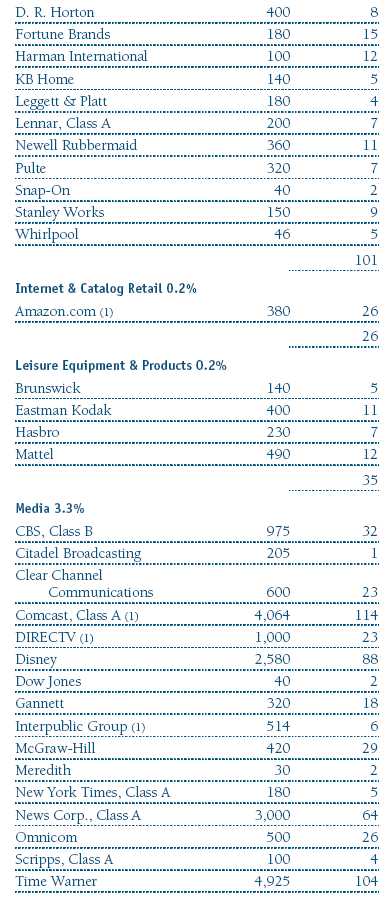
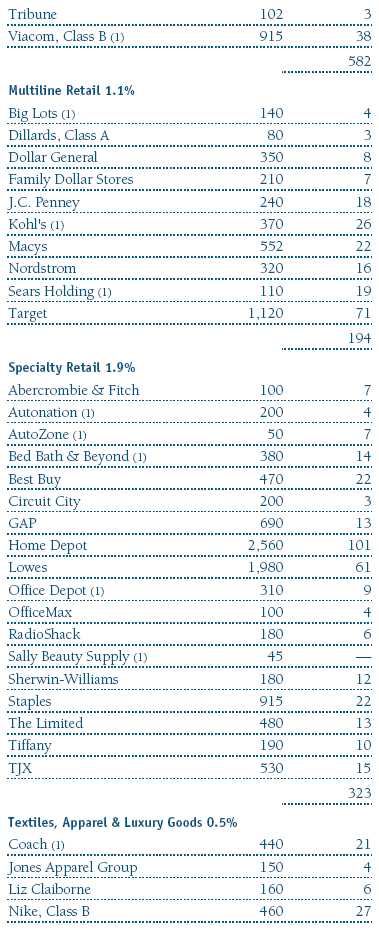
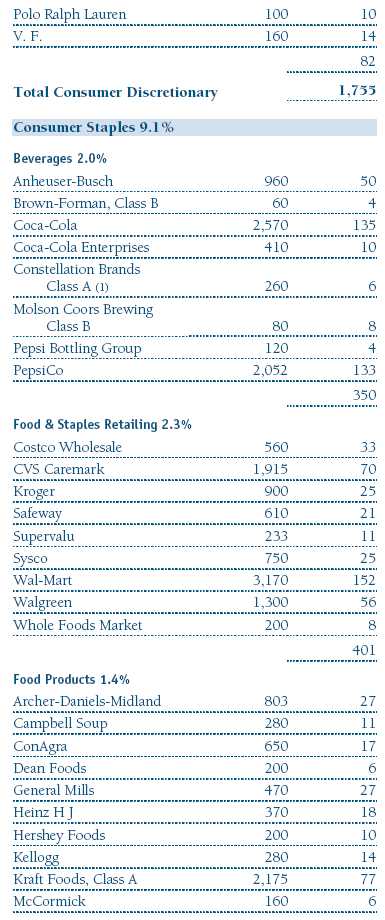
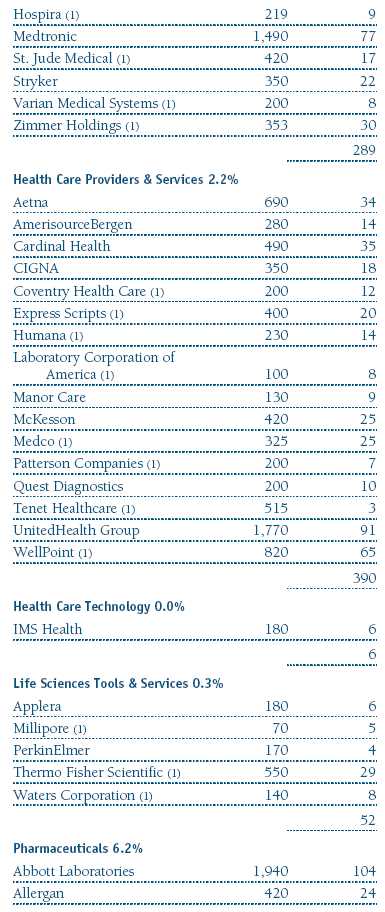
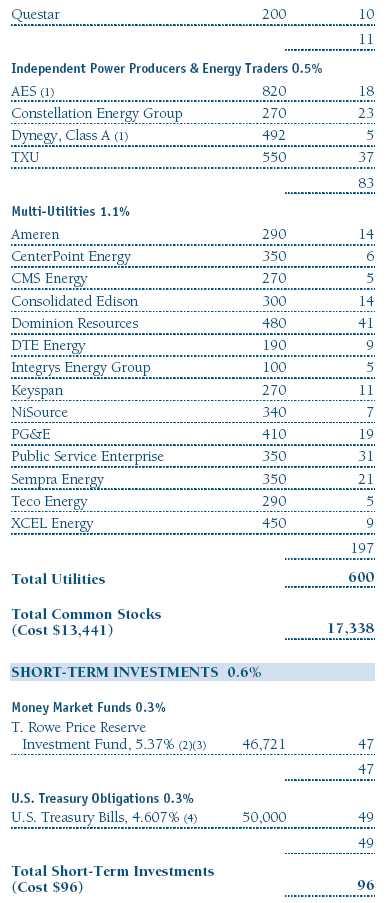
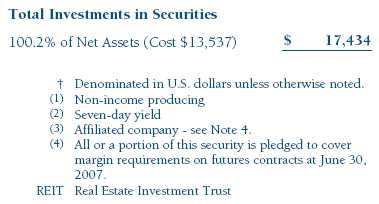
Portfolio of Investments †
T. Rowe Price Equity Index 500 Portfolio
June 30, 2007 (Unaudited)


The accompanying notes are an integral part of these financial statements.
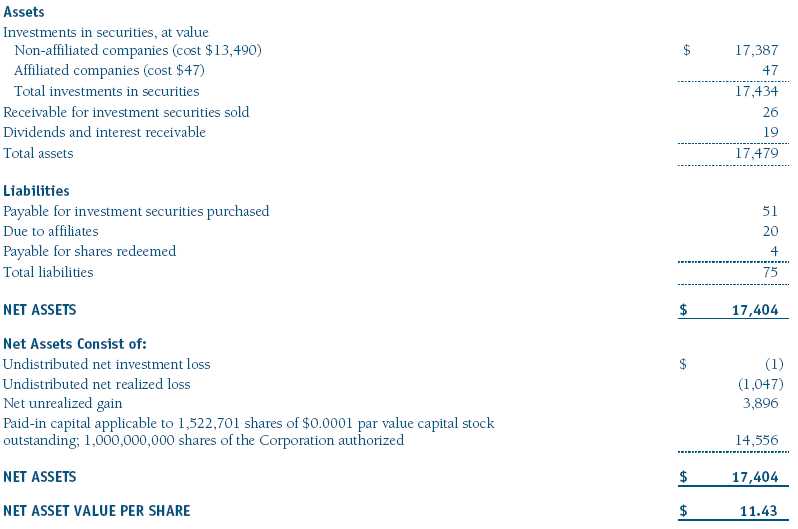
Statement of Assets and Liabilities
T. Rowe Price Equity Index 500 Portfolio
June 30, 2007 (Unaudited)
(In thousands except shares and per share amounts)
The accompanying notes are an integral part of these financial statements.
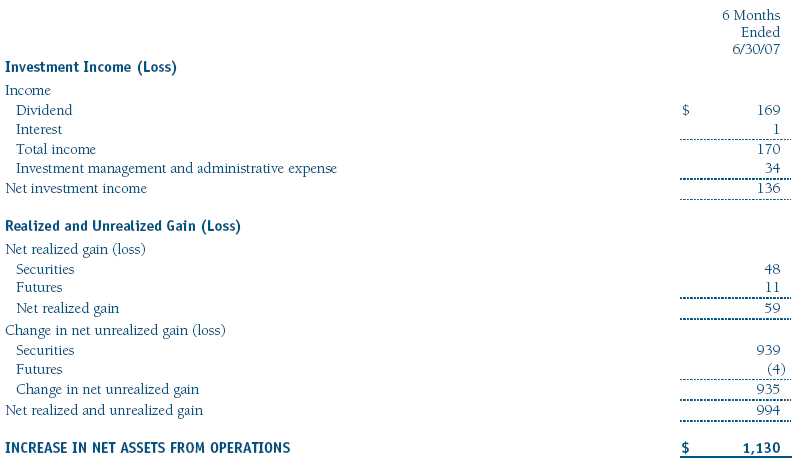
Statement of Operations
T. Rowe Price Equity Index 500 Portfolio
(Unaudited)
($ 000s)
The accompanying notes are an integral part of these financial statements.
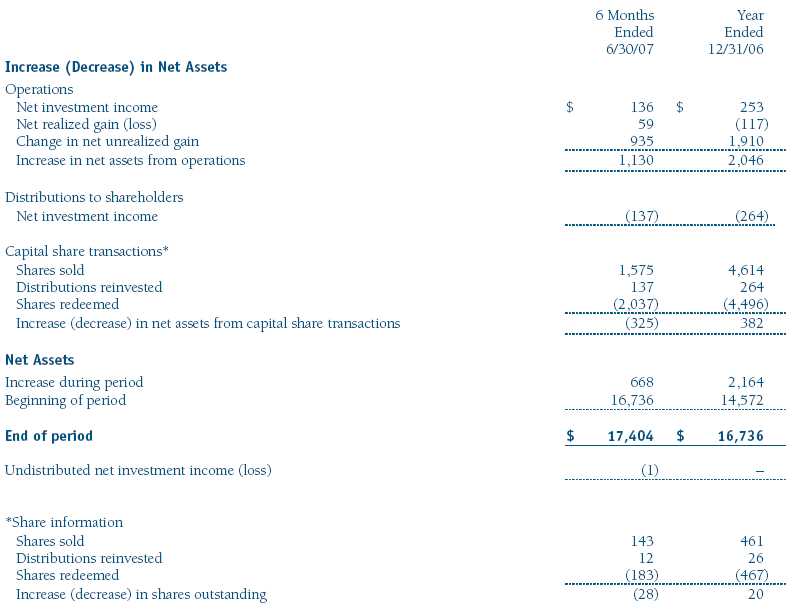
Statement of Changes in Net Assets
T. Rowe Price Equity Index 500 Portfolio
(Unaudited)
($ 000s)
The accompanying notes are an integral part of these financial statements.
Notes to Financial Statements
T. Rowe Price Equity Index 500 Portfolio
June 30, 2007 (Unaudited)
NOTE 1 - SIGNIFICANT ACCOUNTING POLICIES
T. Rowe Price Equity Series, Inc. (the corporation), is registered under the Investment Company Act of 1940 (the 1940 Act). The Equity Index 500 Portfolio (the fund), a diversified, open-end management investment company, is one portfolio established by the corporation. The fund commenced operations on December 29, 2000. The fund seeks to match the performance of the Standard & Poor’s 500 Stock Index®. Shares of the fund are currently offered only through certain insurance companies as an investment medium for both variable annuity contracts and variable life insurance policies.
The accompanying financial statements were prepared in accordance with accounting principles generally accepted in the United States of America, which require the use of estimates made by fund management. Fund management believes that estimates and security valuations are appropriate; however, actual results may differ from those estimates, and the security valuations reflected in the financial statements may differ from the value the fund ultimately realizes upon sale of the securities.
Valuation The fund values its investments and computes its net asset value per share at the close of the New York Stock Exchange (NYSE), normally 4 p.m. ET, each day that the NYSE is open for business. Equity securities listed or regularly traded on a securities exchange or in the over-the-counter (OTC) market are valued at the last quoted sale price at the time the valuations are made, except for OTC Bulletin Board securities, which are valued at the mean of the latest bid and asked prices. A security that is listed or traded on more than one exchange is valued at the quotation on the exchange determined to be the primary market for such security. Listed securities not traded on a particular day are valued at the mean of the latest bid and asked prices. Debt securities with original maturities of less than one year are valued at amortized cost in local currency, which approximates fair value when combined with accrued interest.
Investments in mutual funds are valued at the mutual fund’s closing net asset value per share on the day of valuation. Financial futures contracts are valued at closing settlement prices.
Other investments, including restricted securities, and those for which the above valuation procedures are inappropriate or are deemed not to reflect fair value are stated at fair value as determined in good faith by the T. Rowe Price Valuation Committee, established by the fund’s Board of Directors.
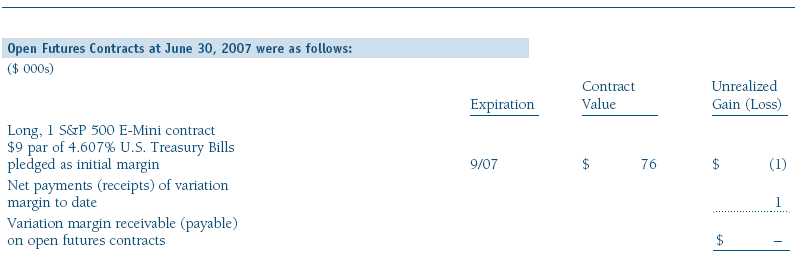
Investment Transactions, Investment Income, and Distributions Income and expenses are recorded on the accrual basis. Premiums and discounts on debt securities are amortized for financial reporting purposes. Dividends received from mutual fund investments are reflected as dividend income; capital gain distributions are reflected as realized gain/loss. Dividend income and capital gain distributions are recorded on the ex-dividend date. Any income tax-related interest and penalties would be classified as income tax expense. Investment transactions are accounted for on the trade date. Realized gains and losses are reported on the identified cost basis. Payments (“variation margin”) made or received to settle the daily fluctuations in the value of futures contracts are recorded as unrealized gains or losses until the contracts are closed. Unsettled variation margin on futures contracts is reflected as other assets or liabilities, and unrealized gains and losses on futures contracts are reflected as the change in net unrealized gain or loss in the accompanying financial statements. Distributions to shareholders are recorded on the ex-dividend date. Income distributions are declared and paid on a quarterly basis. Capital gain distributions, if any, are declared and paid by the fund, typically on an annual basis.
New Accounting Pronouncements Effective June 29, 2007, the fund adopted Financial Accounting Standards Board (“FASB”) Interpretation No. 48 (“FIN 48”), Accounting for Uncertainty in Income Taxes, a clarification of FASB Statement No. 109, Accounting for Income Taxes. FIN 48 establishes financial accounting and disclosure requirements for recognition and measurement of tax positions taken or expected to be taken on an income tax return. The adoption of FIN 48 had no impact on the fund’s net assets or results of operations.
In September 2006, the FASB released the Statement of Financial Accounting Standard No. 157 (“FAS 157”), Fair Value Measurements. FAS 157 clarifies the definition of fair value and establishes the framework for measuring fair value, as well as proper disclosure of this methodology in the financial statements. It will be effective for the fund’s fiscal year beginning January 1, 2008. Management is evaluating the effects of FAS 157; however, it is not expected to have a material impact on the fund’s net assets or results of operations.
NOTE 2 - INVESTMENT TRANSACTIONS
Consistent with its investment objective, the fund engages in the following practices to manage exposure to certain risks or to enhance performance. The investment objective, policies, program, and risk factors of the fund are described more fully in the fund’s prospectus and Statement of Additional Information.
Futures Contracts During the six months ended June 30, 2007, the fund was a party to futures contracts, which provide for the future sale by one party and purchase by another of a specified amount of a specific financial instrument at an agreed upon price, date, time, and place. Risks arise from possible illiquidity of the futures market and from movements in security values.
Other Purchases and sales of portfolio securities, other than short-term securities, aggregated $1,749,000 and $1,471,000, respectively, for the six months ended June 30, 2007.
NOTE 3 - FEDERAL INCOME TAXES
No provision for federal income taxes is required since the fund intends to continue to qualify as a regulated investment company under Subchapter M of the Internal Revenue Code and distribute to shareholders all of its taxable income and gains. Federal income tax regulations differ from generally accepted accounting principles; therefore, distributions determined in accordance with tax regulations may differ in amount or character from net investment income and realized gains for financial reporting purposes. Financial reporting records are adjusted for permanent book/tax differences to reflect tax character. Financial records are not adjusted for temporary differences. The amount and character of tax-basis distributions and composition of net assets are finalized at fiscal year-end; accordingly, tax-basis balances have not been determined as of June 30, 2007.
The fund intends to retain realized gains to the extent of available capital loss carryforwards. As of December 31, 2006, the fund had $1,103,000 of unused capital loss carryforwards, of which $173,000 expire in 2010, $819,000 expire in 2011, and $111,000 expire in 2014.
At June 30, 2007, the cost of investments for federal income tax purposes was $13,537,000. Net unrealized gain aggregated $3,896,000 at period-end, of which $4,016,000 related to appreciated investments and $120,000 related to depreciated investments.
NOTE 4 - RELATED PARTY TRANSACTIONS
The fund is managed by T. Rowe Price Associates, Inc. (the manager or Price Associates), a wholly owned subsidiary of T. Rowe Price Group, Inc. The investment management and administrative agreement between the fund and the manager provides for an all-inclusive annual fee equal to 0.40% of the fund’s average daily net assets. The fee is computed daily and paid monthly. The agreement provides that investment management, shareholder servicing, transfer agency, accounting, custody services, and directors’ fees and expenses are provided to the fund, and interest, taxes, brokerage commissions, and extraordinary expenses are paid directly by the fund.
The fund may invest in the T. Rowe Price Reserve Investment Fund and the T. Rowe Price Government Reserve Investment Fund (collectively, the T. Rowe Price Reserve Investment Funds), open-end management investment companies managed by Price Associates and affiliates of the fund. The T. Rowe Price Reserve Investment Funds are offered as cash management options to mutual funds, trusts, and other accounts managed by Price Associates and/or its affiliates, and are not available for direct purchase by members of the public. The T. Rowe Price Reserve Investment Funds pay no investment management fees. During the six months ended June 30, 2007, dividend income from the T. Rowe Price Reserve Investment Funds totaled $10,000, and the value of shares of the T. Rowe Price Reserve Investment Funds held at June 30, 2007, and December 31, 2006, was $47,000 and $547,000, respectively.
| Information on Proxy Voting Policies, Procedures, and Records |
A description of the policies and procedures used by T. Rowe Price funds and portfolios to determine how to vote proxies relating to portfolio securities is available in each fund’s Statement of Additional Information, which you may request by calling 1-800-225-5132 or by accessing the SEC’s Web site, www.sec.gov. The description of our proxy voting policies and procedures is also available on our Web site, www.troweprice.com. To access it, click on the words “Company Info” at the top of our homepage for individual investors. Then, in the window that appears, click on the “Proxy Voting Policy” navigation button in the top left corner.
Each fund’s most recent annual proxy voting record is available on our Web site and through the SEC’s Web site. To access it through our Web site, follow the directions above, then click on the words “Proxy Voting Record” at the bottom of the Proxy Voting Policy page.
| How to Obtain Quarterly Portfolio Holdings |
The fund files a complete schedule of portfolio holdings with the Securities and Exchange Commission for the first and third quarters of each fiscal year on Form N-Q. The fund’s Form N-Q is available electronically on the SEC’s Web site (www.sec.gov); hard copies may be reviewed and copied at the SEC’s Public Reference Room, 450 Fifth St. N.W., Washington, DC 20549. For more information on the Public Reference Room, call 1-800-SEC-0330.
| Approval of Investment Management Agreement |
On March 7, 2007, the fund’s Board of Directors (Board) unanimously approved the investment advisory contract (Contract) between the fund and its investment manager, T. Rowe Price Associates, Inc. (Manager). The Board considered a variety of factors in connection with its review of the Contract, also taking into account information provided by the Manager during the course of the year, as discussed below:
Services Provided by the Manager
The Board considered the nature, quality, and extent of the services provided to the fund by the Manager. These services included, but were not limited to, management of the fund’s portfolio and a variety of related activities, as well as financial and administrative services, reporting, and communications. The Board also reviewed the background and experience of the Manager’s senior management team and investment personnel involved in the management of the fund. The Board concluded that it was satisfied with the nature, quality, and extent of the services provided by the Manager.
Investment Performance of the Fund
The Board reviewed the fund’s average annual total return over the one-, three-, and five-year and since-inception periods as well as the fund’s year-by-year returns and compared these returns with previously agreed upon comparable performance measures and market data, including those supplied by Lipper and Morningstar, which are independent providers of mutual fund data. On the basis of this evaluation and the Board’s ongoing review of investment results, the Board concluded that the fund’s performance was satisfactory.
Costs, Benefits, Profits, and Economies of Scale
The Board reviewed detailed information regarding the revenues received by the Manager under the Contract and other benefits that the Manager (and its affiliates) may have realized from its relationship with the fund, including research received under “soft dollar” agreements. The Board noted that soft dollars were not used to pay for third-party, non-broker research. The Board also received information on the estimated costs incurred and profits realized by the Manager and its affiliates from advising T. Rowe Price mutual funds, as well as estimates of the gross profits realized from managing the fund in particular. The Board concluded that the Manager’s profits were reasonable in light of the services provided to the fund. The Board also considered whether the fund or other funds benefit under the fee levels set forth in the Contract from any economies of scale realized by the Manager. The Board noted that, under the Contract, the fund pays the Manager a single fee based on the fund’s assets and the Manager, in turn, pays all expenses of the fund, with certain exceptions. The Board concluded that, based on the profitability data it reviewed and consistent with this single fee structure, the Contract provided for a reasonable sharing of benefits from any economies of scale with the fund.
Fees
The Board reviewed the fund’s single-fee structure and compared the rate with fees and expenses of other comparable funds based on information and data supplied by Lipper. The information provided to the Board indicated that the fund’s single fee rate was below the median management fee rate and expense ratio for comparable funds. The Board also reviewed the fee schedules for comparable privately managed accounts of the Manager and its affiliates. Management informed the Board that the Manager’s responsibilities for privately managed accounts are more limited than its responsibilities for the fund and other T. Rowe Price mutual funds that it or its affiliates advise. On the basis of the information provided, the Board concluded that the fees paid by the fund under the Contract were reasonable.
Approval of the Contract
As noted, the Board approved the continuation of the Contract. No single factor was considered in isolation or to be determinative to the decision. Rather, the Board concluded, in light of a weighting and balancing of all factors considered, that it was in the best interests of the fund to approve the continuation of the Contract, including the fees to be charged for services thereunder.
Item 2. Code of Ethics.
A code of ethics, as defined in Item 2 of Form N-CSR, applicable to its principal executive officer, principal financial officer, principal accounting officer or controller, or persons performing similar functions is filed as an exhibit to the registrant’s annual Form N-CSR. No substantive amendments were approved or waivers were granted to this code of ethics during the registrant’s most recent fiscal half-year.
Item 3. Audit Committee Financial Expert.
Disclosure required in registrant’s annual Form N-CSR.
Item 4. Principal Accountant Fees and Services.
Disclosure required in registrant’s annual Form N-CSR.
Item 5. Audit Committee of Listed Registrants.
Not applicable.
Item 6. Schedule of Investments.
Not applicable. The complete schedule of investments is included in Item 1 of this Form N-CSR.
Item 7. Disclosure of Proxy Voting Policies and Procedures for Closed-End Management Investment Companies.
Not applicable.
Item 8. Portfolio Managers of Closed-End Management Investment Companies.
Not applicable.
Item 9. Purchases of Equity Securities by Closed-End Management Investment Company and Affiliated Purchasers.
Not applicable.
Item 10. Submission of Matters to a Vote of Security Holders.
Not applicable.
Item 11. Controls and Procedures.
(a) The registrant’s principal executive officer and principal financial officer have evaluated the registrant’s disclosure controls and procedures within 90 days of this filing and have concluded that the registrant’s disclosure controls and procedures were effective, as of that date, in ensuring that information required to be disclosed by the registrant in this Form N-CSR was recorded, processed, summarized, and reported timely.
(b) The registrant’s principal executive officer and principal financial officer are aware of no change in the registrant’s internal control over financial reporting that occurred during the registrant’s second fiscal quarter covered by this report that has materially affected, or is reasonably likely to materially affect, the registrant’s internal control over financial reporting.
Item 12. Exhibits.(a)(1) The registrant’s code of ethics pursuant to Item 2 of Form N-CSR is filed with the registrant’s annual Form N-CSR.
(2) Separate certifications by the registrant's principal executive officer and principal financial officer, pursuant to Section 302 of the Sarbanes-Oxley Act of 2002 and required by Rule 30a-2(a) under the Investment Company Act of 1940, are attached.
(3) Written solicitation to repurchase securities issued by closed-end companies: not applicable.
(b) A certification by the registrant's principal executive officer and principal financial officer, pursuant to Section 906 of the Sarbanes-Oxley Act of 2002 and required by Rule 30a-2(b) under the Investment Company Act of 1940, is attached.
| | |
SIGNATURES |
| |
| | Pursuant to the requirements of the Securities Exchange Act of 1934 and the Investment |
| Company Act of 1940, the registrant has duly caused this report to be signed on its behalf by the |
| undersigned, thereunto duly authorized. |
| |
| T. Rowe Price Equity Series, Inc. |
| |
| |
| By | /s/ Edward C. Bernard |
| | Edward C. Bernard |
| | Principal Executive Officer |
| |
| Date | August 17, 2007 |
| |
| |
| |
| | Pursuant to the requirements of the Securities Exchange Act of 1934 and the Investment |
| Company Act of 1940, this report has been signed below by the following persons on behalf of |
| the registrant and in the capacities and on the dates indicated. |
| |
| |
| By | /s/ Edward C. Bernard |
| | Edward C. Bernard |
| | Principal Executive Officer |
| |
| Date | August 17, 2007 |
| |
| |
| |
| By | /s/ Joseph A. Carrier |
| | Joseph A. Carrier |
| | Principal Financial Officer |
| |
| Date | August 17, 2007 |