Item 1: Report to Shareholders| Health Sciences Portfolio | June 30, 2006 |
The views and opinions in this report were current as of June 30, 2006. They are not guarantees of performance or investment results and should not be taken as investment advice. Investment decisions reflect a variety of factors, and the managers reserve the right to change their views about individual stocks, sectors, and the markets at any time. As a result, the views expressed should not be relied upon as a forecast of the fund’s future investment intent. The report is certified under the Sarbanes-Oxley Act of 2002, which requires mutual funds and other public companies to affirm that, to the best of their knowledge, the information in their financial reports is fairly and accurately stated in all material respects.
Fellow Shareholders
U.S. stocks posted modest gains for the first half of 2006, but sharp declines in May and June erased most of the market’s strong advances earlier in the year. Investor sentiment, which had been favorable amid hopes that the Federal Reserve would soon stop increasing short-term interest rates, deteriorated in May due to concerns that rising inflation would force the central bank to raise rates more than investors had expected.
Small-cap stocks (Russell 2000 Index) easily surpassed large-caps (S&P 500 Index) over the past six months, although they surrendered a significant part of their performance advantage at the end of the period. Value shares outperformed growth across all market capitalizations. Health care stocks struggled in this environment, as investors grew cautious and shunned traditional growth sectors—except for information technology, health care was the weakest sector in the S&P 500 through midyear.
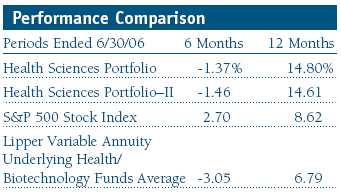
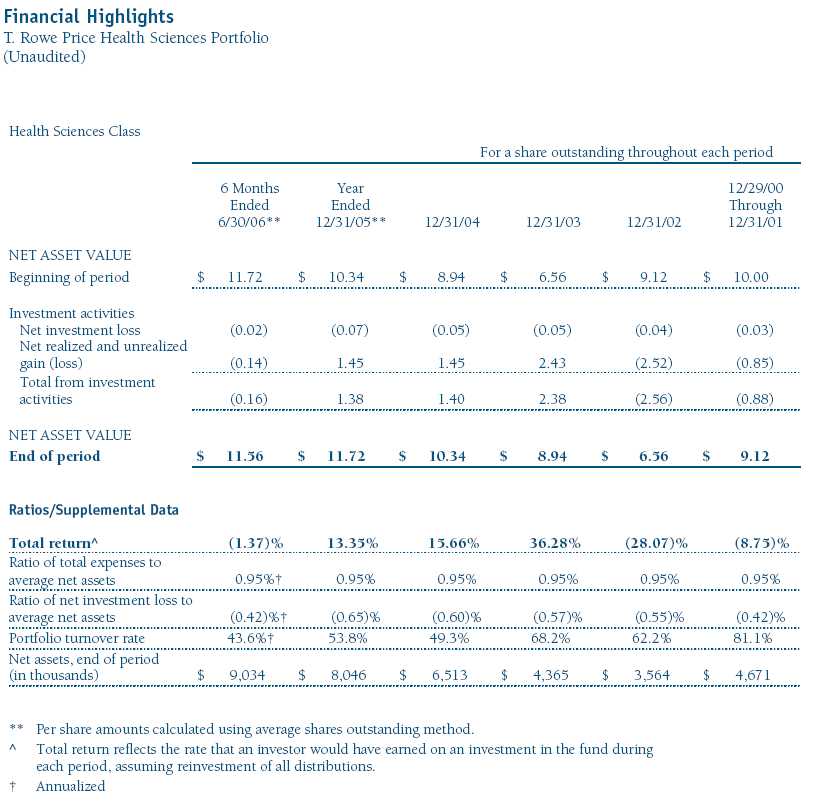
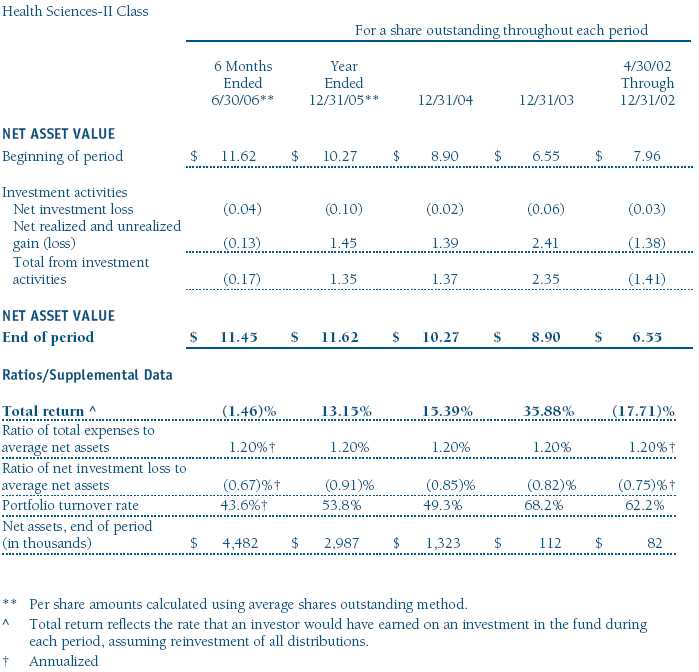
Your portfolio returned -1.37% in the first half of the year and 14.80% for the 12-month period ended June 30, 2006. As shown in the Performance Comparison table, the portfolio outpaced its Lipper peer group for both periods. The main drivers of our relative outperformance were strong stock selection in the biotechnology and pharmaceuticals segments. We trailed the S&P 500 Index for the past six months and outperformed the blue chip benchmark for 12 months. (Results for Portfolio–II shares were slightly lower, reflecting their different fee structure.)
The Health Sciences Portfolio has delivered consistently strong performance compared with the universe of health care funds. Lipper ranked the fund in the top 7% of the Lipper variable annuity health/biotechnology funds universe for the one-year period ended June 30, 2006. Lipper also placed the portfolio in the top 20% of its category for the three-year period ended June 30, 2006. (Based on total return, Lipper ranked the Health Sciences Portfolio 2 out of 28, 5 out of 25, and 4 out of 17 funds for the one-, three-, and five-year periods ended June 30, 2006, respectively. Past performance cannot guarantee future results.)
MARKET ENVIRONMENT
Growth stocks—and the health care sector in particular—underperformed the broad market as measured by the S&P 500 Index in the first half due to weakness in biotechnology and health care services. The Nasdaq Biotech Index climbed to a five-year high in the first quarter but retreated approximately 20% from its peak in the second quarter. Small-cap stocks led the first-quarter performance charge, when all health care industries except for products and devices delivered gains. They also led the second-quarter retreat. The Lipper Health/Biotechnology Index declined 3.05% in the first half. Within the benchmark, products and devices, services, and the biotechnology industries were the poorest performers. The pharmaceuticals industry posted modest losses for the past six months, and life sciences eked out a small gain.
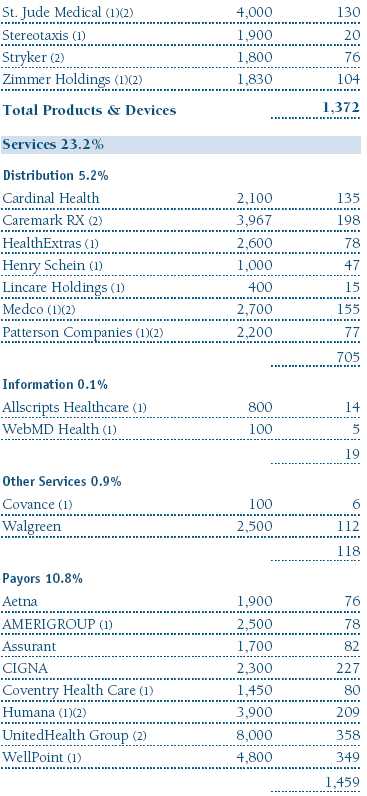
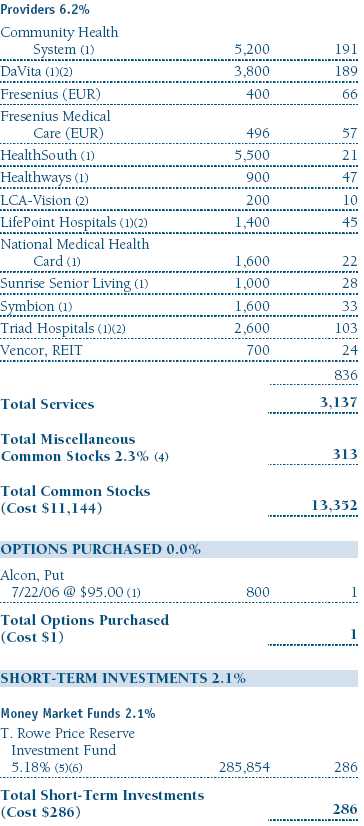
Some of the biggest and worst news in the first half came from the services industry. UnitedHealth Group, a large portfolio holding, announced in mid-May that controversial stock option granting practices could force the company to restate its reported net income for the past three years. The health insurance giant received a subpoena from the U.S. Attorney for the Southern District of New York seeking documents relating to stock options grants. UnitedHealth also received a request from the IRS for documents relating to stock options and other compensation for several executives, and the Securities and Exchange Commission is conducting an inquiry. Though the ultimate outcome of these investigations is uncertain, we are monitoring the situation extremely closely. For now, UnitedHealth Group remains a top holding. (Please refer to the portfolio of investments for a complete list of holdings and the amount each represents in the portfolio.)
PORTFOLIO REVIEW
Biotechnology and Pharmaceuticals
In many instances, Wall Street refers to smaller, therapeutic-based companies as biotechs. Originally, a firm was classified as a biotech because its research and development focused on large molecules, or proteins, which usually lead to injectable therapeutics. On the other hand, pharmaceutical firms typically work with small molecules and develop pills, tablets, or capsules. However, the labels no longer describe a meaningful distinction.
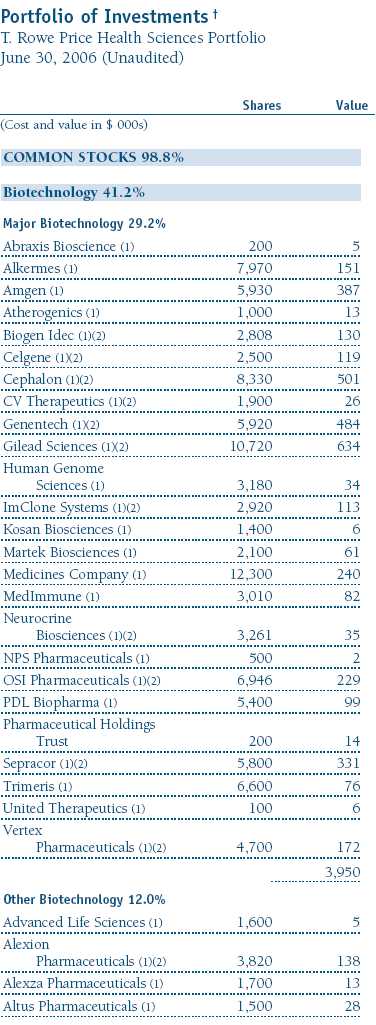
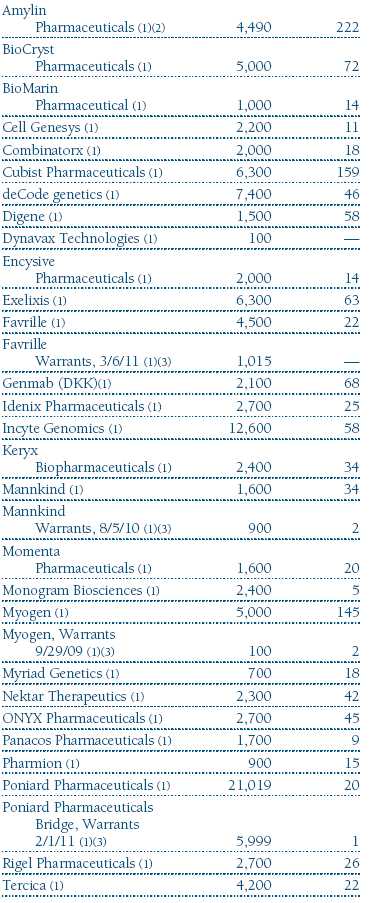
Our large allocation to the biotechnology sector (41.5% of net assets) stems from our belief in the power of the pharmaceutical industry’s business model—the discovery, development, manufacture, and commercialization of medicines or therapeutic devices. But large pharmaceutical companies also have a large base of revenues and income; and one drug—even if it is extremely successful—may not be enough to affect the bottom line significantly, or “move the needle.” Biotechnology companies, however, tend to be smaller and the successful introduction into the market of one drug can transform a whole company. We are especially focused on those companies with new and important medicines or treatments for unmet medical needs. Although this strategy encompasses more risk because a firm that is highly dependent on the success of a single drug can decline significantly on bad news, we attempt to lighten the risk by owning a basket of stocks.
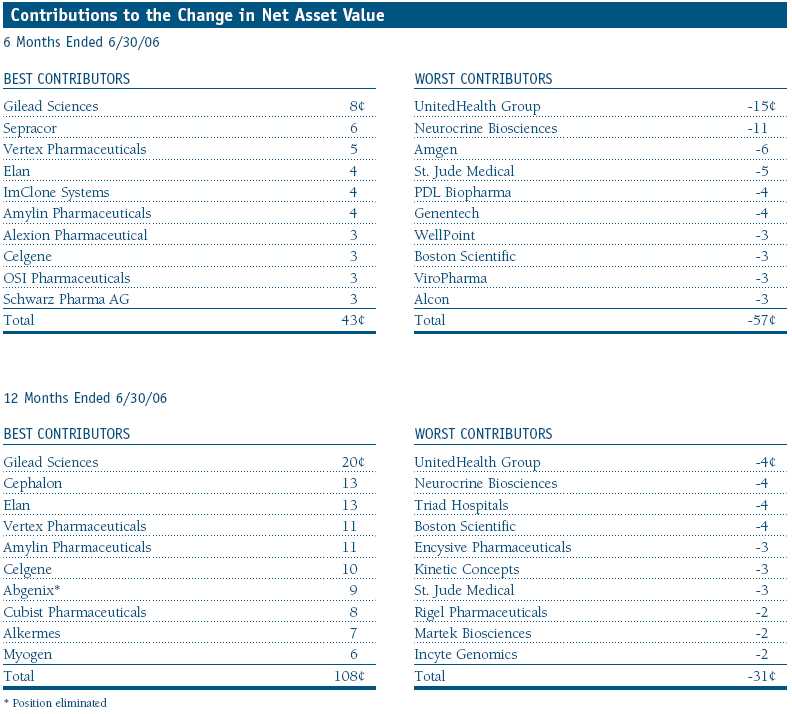
Your portfolio’s largest holding, Gilead Sciences, was the best contributor as its suite of drugs for the treatment of HIV enjoyed continued success. In fact, Gilead Sciences and Bristol-Myers Squibb recently received Food and Drug Administration (FDA) approval for Atripla, a codeveloped pill that combines two of Gilead’s HIV medicines and one of Bristol-Myers’. This will be the first once-a-day cocktail for HIV patients.
Sepracor (medications for the treatment of asthma and insomnia) and Vertex Pharmaceuticals (developing a potential hepatitis C medicine) were the second- and third-best contributors for the past six months. Sepracor’s shares advanced in May on news that a large-dosage, time-release version of rival Neurocrine Biosciences’ sleeping pill Indiplon failed to gain FDA approval. Sepracor’s shares climbed even higher toward the end of June on speculation that the company might be a takeover target for a large pharmaceutical company. Unfortunately, what was good for Sepracor was not for Neurocrine (the portfolio’s second-largest detractor), which lost more than half of its value on the news concerning Indiplon. Shares of Neurocrine fell even further after Pfizer and Neurocrine announced the termination of their collaboration on the drug. Vertex rose after it released favorable clinical results for VX-950, its potential hepatitis C drug. Preliminary results showed that none of the patients in the 12-patient trial who used the hepatitis drug in conjunction with two other drugs showed any sign of the virus in their bloodstream after 28 days.
On the negative side of the ledger, several of the portfolio’s biotechnology holdings detracted from performance. Amgen’s shares weakened as the market grew more concerned about potential new competition for its extremely profitable products for the treatment of anemia. Cephalon, a longtime holding, gave back some of its 2005 gains as caution arose regarding its FDA application for a new attention deficit hyperactivity disorder (ADHD) medication.
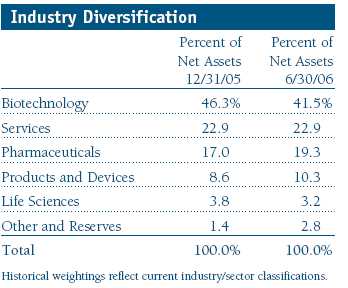
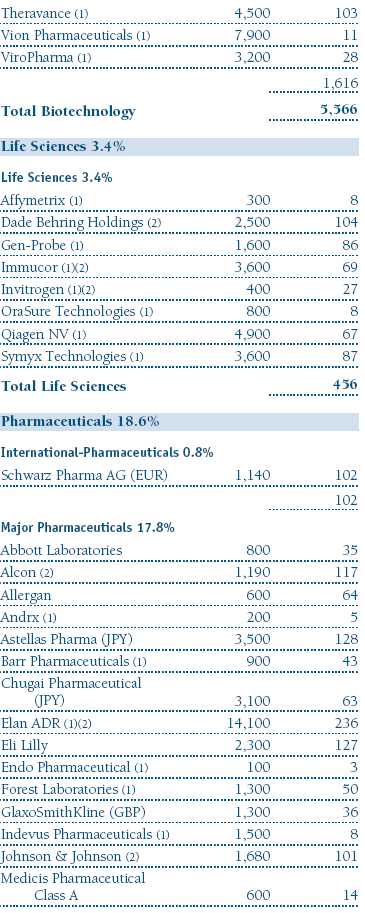
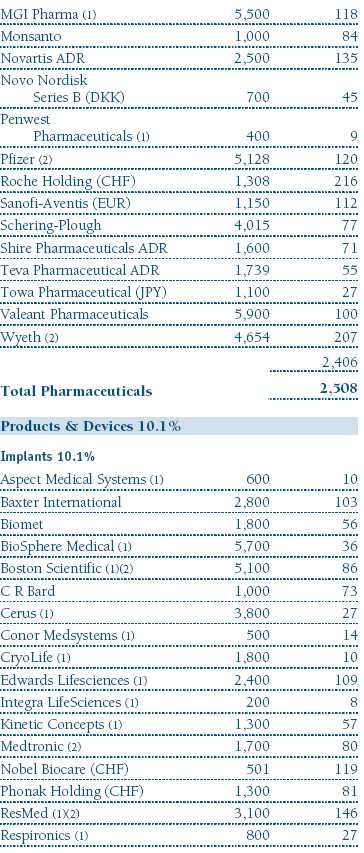
We continue to be extremely selective in our large-cap pharmaceutical investments, and our exposure to the health care universe’s largest segment remains lower than our peer group. Our relative underweight in U.S. pharmaceutical stocks is not due to the negative publicity surrounding the industry over the past few years and has been in place for a considerable period. However, the industry’s troubles are well known and seem to be reflected in current valuations, which are below the market’s average. We think that the shares may have bottomed. That does not mean that we expect it to be smooth sailing going forward. We are closely monitoring developments in the pharmaceutical industry and have increased our weighting to 19.3% of the portfolio from 17.0% six months ago, though that is still well below the benchmark’s allocation.
Our largest pharmaceutical holdings, Elan and Roche Holding, were solid first-half contributors, while New Jersey-based Wyeth detracted. Elan’s shares were hurt last year by a voluntary marketing suspension of the multiple sclerosis (MS) drug Tysabri—jointly developed with Biogen Idec. The Dublin, Ireland-based Elan’s share price has more than tripled from its low in mid-2005, and by the end of the reporting period, the FDA and the European Union regulatory authorities approved the reintroduction of Tysabri for the treatment of MS. Roche, the Basel, Switzerland-based pharmaceutical giant, posted sales that were above expectations due in part to its avian flu treatment Tamiflu, but mostly thanks to its non-U.S. sales of Genentech’s cancer drugs, Avastin and Herceptin. Wyeth’s stock fell in the first half after the firm disclosed a manufacturing issue involving one of its plants and as the market digested clinical trial results for a key pipeline drug. We believe Wyeth’s shares are attractively valued, and it remains a top holding.
We continually look for good investment opportunities in companies based outside the U.S. There is less competition for investments outside of the U.S., and we have been able to purchase strong companies at prices we view as exceptionally attractive. Furthermore, foreign holdings benefit the portfolio from a risk-control perspective by providing added diversification. Over the past six months, we have added significantly to our foreign holdings. We highlighted Astellas, one of Japan’s major pharmaceutical companies, in our last shareholder report. The company was formed when one of our long-term holdings, Yamanouchi Pharmaceuticals, merged with Fujisawa. We believe the combined company can benefit from lower costs, will be able to return a greater percentage of its net income to shareholders, and will have the necessary size and scale to participate in markets outside Japan.
We added two more Japanese pharmaceutical companies in the first half, Takeda and Chugai Pharmaceutical. Takeda, which derives close to 70% of its sales outside the U.S., is attractively valued by our measures, and its sales and earnings have a low correlation with domestic pharmaceutical companies. We think Chugai, a majority-owned affiliate of Roche, can generate significant earnings growth from the commercialization of the Genentech/ Roche oncology products in Japan as well as benefit from other new product introductions that will increase its share of the large Japanese pharmaceutical market.
Services
Our two largest managed health care services companies, WellPoint and UnitedHealth Group, were significant six-month detractors. The two most critical variables in managed care are pricing and medical cost trends. When the system is working properly, pricing and medical costs will move in tandem, allowing companies to maintain margins. If costs rise above projections or pricing deteriorates, it would be difficult for managed care providers to maintain their margins. During the second quarter, fears arose in the market that pricing was weakening, and the stocks of our managed care holdings suffered. We do not believe there is widespread deterioration in pricing; the second-quarter sell-off seems to have been an overreaction. Managed care remains a significant position in the fund, with UnitedHealth, WellPoint, Cigna, and Humana all among our top-25 holdings.
OUTLOOK
We seek the strongest companies in each of the four main areas of health care—the pharmaceutical, biotechnology, services, and medical devices industries. Although each subsector offers attractive growth opportunities, we will continue to favor therapeutic companies leveraged to novel products for unmet medical needs.
We believe that pharmaceutical valuations have bottomed. We do not expect prices to surge from current levels, but we believe that the worst is behind us. Over the next 12 to 24 months, pharmaceutical firms stand to benefit from Medicare D legislation. Drug utilization should increase, as medicines will be more accessible. However, over the longer term, this law will eventually make the government the dominant health care consumer, putting downward pressure on prescription prices. The impact on services firms should be more favorable, as the group is likely to benefit from higher utilization.
Biotechnology shares have delivered strong returns over each of the last three years. In 2005, strong gains by several large-cap firms, in particular, led the way. Several smaller companies also posted strong results. These are signs that the industry is no longer in its infancy. As a result, it is less likely that individual company successes will drive industry performance. Instead, each stock should rise or fall on its own merits.
While large-cap companies (both pharmaceuticals and biotechs) may face significant challenges, many smaller biotechnology firms can be transformed if they are able to gain approval for a product that wins significant market share. Positive news flow often drives the shares of such companies, and more good news is likely. As long as society continues to desire new therapies to soften the impact of disease and price controls are not imposed, health care should remain an area of significant growth for the long term.
We appreciate your continued confidence and support.
Respectfully submitted,

Kris H. Jenner
President of the portfolio and chairman of its Investment
Advisory Committee
July 18, 2006
The committee chairman has day-to-day responsibility for managing the portfolio and works with committee members in developing and executing the portfolio’s investment program.
Growth stocks can be volatile for several reasons. Since these companies usually invest a high portion of earnings in their businesses, they may lack the dividends of value stocks that can cushion stock prices in a falling market. Also, earnings disappointments often lead to sharply falling prices because investors buy growth stocks in anticipation of superior earnings growth.
| Risk of Health Sciences Investing |
Portfolios that invest only in specific industries will experience greater volatility than those investing in a broad range of industries. Companies in the health sciences field are subject to special risks such as increased competition within the health care industry, changes in legislation or government regulations, reductions in government funding, product liability or other litigation, and the obsolescence of popular products.
Lipper averages: The averages of available mutual fund performance returns for specified periods in defined categories as tracked by Lipper Inc.
Russell 2000 Index: Consists of the smallest 2,000 companies in the Russell 3000 Index. Performance is reported on a total-return basis.
S&P 500 Stock Index: An index consisting of 500 stocks chosen for market size, liquidity, and industry group representation. It is a market-value weighted index, with each stock’s weight in the index proportionate to its market value.

This chart shows the value of a hypothetical $10,000 investment in the fund over the past 10 fiscal year periods or since inception (for funds lacking 10-year records). The result is compared with benchmarks, which may include a broad-based market index and a peer group average or index. Market indexes do not include expenses, which are deducted from fund returns as well as mutual fund averages and indexes.
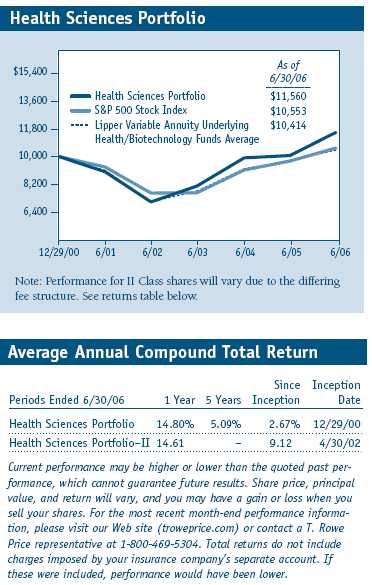
This table shows how the portfolio would have performed each year if its actual (or cumulative) returns for the periods shown had been earned at a constant rate. Average annual total return figures include changes in principal value, reinvested dividends, and capital gain distributions. When assessing performance, investors should consider both short- and long-term returns.
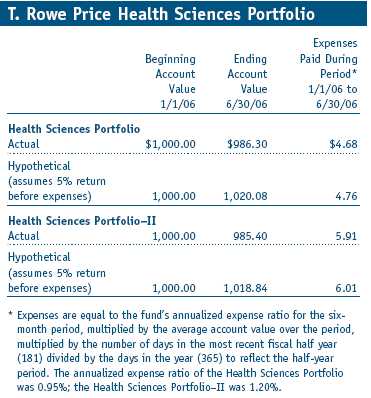
Fund Expense Example
As a mutual fund shareholder, you may incur two types of costs: (1) transaction costs, such as redemption fees or sales loads, and (2) ongoing costs, including management fees, distribution and service (12b-1) fees, and other fund expenses. The following example is intended to help you understand your ongoing costs (in dollars) of investing in the fund and to compare these costs with the ongoing costs of investing in other mutual funds. The example is based on an investment of $1,000 invested at the beginning of the most recent six-month period and held for the entire period.
Shares of the fund are currently offered only through certain insurance companies as an investment medium for both variable annuity contracts and variable life insurance policies. Please note that the fund has two classes of shares: the original share class and II class. II class shares are sold through financial intermediaries, which are compensated for distribution, shareholder servicing, and/or certain administrative services under a Board-approved Rule 12b-1 plan.
Actual Expenses
The first line of the following table (“Actual”) provides information about actual account values and actual expenses. You may use the information in this line, together with your account balance, to estimate the expenses that you paid over the period. Simply divide your account value by $1,000 (for example, an $8,600 account value divided by $1,000 = 8.6), then multiply the result by the number in the first line under the heading “Expenses Paid During Period” to estimate the expenses you paid on your account during this period.
Hypothetical Example for Comparison Purposes
The information on the second line of the table (“Hypothetical”) is based on hypothetical account values and expenses derived from the fund’s actual expense ratio and an assumed 5% per year rate of return before expenses (not the fund’s actual return). You may compare the ongoing costs of investing in the fund with other funds by contrasting this 5% hypothetical example and the 5% hypothetical examples that appear in the shareholder reports of the other funds. The hypothetical account values and expenses may not be used to estimate the actual ending account balance or expenses you paid for the period.
You should also be aware that the expenses shown in the table highlight only your ongoing costs and do not reflect any transaction costs, such as redemption fees or sales loads. Therefore, the second line of the table is useful in comparing ongoing costs only, and will not help you determine the relative total costs of owning different funds. To the extent a fund charges transaction costs, however, the total cost of owning that fund is higher.
The accompanying notes are an integral part of these financial statements.
The accompanying notes are an integral part of these financial statements.
The accompanying notes are an integral part of these financial statements.

The accompanying notes are an integral part of these financial statements.
The accompanying notes are an integral part of these financial statements.
The accompanying notes are an integral part of these financial statements.
Notes to Financial Statements
T. Rowe Price Health Sciences Portfolio
June 30, 2006 (Unaudited)
NOTE 1 - SIGNIFICANT ACCOUNTING POLICIES
T. Rowe Price Equity Series, Inc. (the corporation), is registered under the Investment Company Act of 1940 (the 1940 Act). The Health Sciences Portfolio (the fund) is a diversified, open-end management investment company and is one portfolio established by the corporation. The fund seeks long-term capital appreciation. Shares of the fund are currently offered only through certain insurance companies as an investment medium for both variable annuity contracts and variable life insurance policies. The fund has two classes of shares: the Health Sciences Portfolio original share class (Health Sciences class), offered since December 29, 2000, and Health Sciences Portfolio–II (Health Sciences-II class), offered since April 30,2002. Health Sciences–II class shares are sold through financial intermediaries, which it compensates for distribution, shareholder servicing, and/or certain administrative services under a Board-approved Rule 12b-1 plan. Each class has exclusive voting rights on matters related solely to that class, separate voting rights on matters that relate to both classes, and, in all other respects, the same rights and obligations as the other class.
The accompanying financial statements were prepared in accordance with accounting principles generally accepted in the United States of America, which require the use of estimates made by fund management. Fund management believes that estimates and security valuations are appropriate; however, actual results may differ from those estimates, and the security valuations reflected in the financial statements may differ from the value the fund ultimately realizes upon sale of the securities.
Valuation The fund values its investments and computes its net asset value per share at the close of the New York Stock Exchange (NYSE), normally 4 p.m. ET, each day that the NYSE is open for business. Equity securities listed or regularly traded on a securities exchange or in the over-the-counter (OTC) market are valued at the last quoted sale price or, for certain markets, the official closing price at the time the valuations are made, except for OTC Bulletin Board securities, which are valued at the mean of the latest bid and asked prices. A security that is listed or traded on more than one exchange is valued at the quotation on the exchange determined to be the primary market for such security. Listed securities not traded on a particular day are valued at the mean of the latest bid and asked prices for domestic securities and the last quoted sale price for international securities.
Debt securities are generally traded in the over-the-counter market. Securities with original maturities of one year or more are valued at prices furnished by dealers who make markets in such securities or by an independent pricing service, which considers yield or price of bonds of comparable quality, coupon, maturity, and type, as well as prices quoted by dealers who make markets in such securities. Securities with original maturities of less than one year are valued at amortized cost in local currency, which approximates fair value when combined with accrued interest.
Investments in mutual funds are valued at the mutual fund’s closing net asset value per share on the day of valuation. Purchased and written options are valued at the mean of the closing bid and asked prices.
Other investments, including restricted securities, and those for which the above valuation procedures are inappropriate or are deemed not to reflect fair value are stated at fair value as determined in good faith by the T. Rowe Price Valuation Committee, established by the fund’s Board of Directors.
Most foreign markets close before the close of trading on the NYSE. If the fund determines that developments between the close of a foreign market and the close of the NYSE will, in its judgment, materially affect the value of some or all of its portfolio securities, which in turn will affect the fund’s share price, the fund will adjust the previous closing prices to reflect the fair value of the securities as of the close of the NYSE, as determined in good faith by the T. Rowe Price Valuation Committee, established by the fund’s Board of Directors. A fund may also fair value securities in other situations, such as when a particular foreign market is closed but the fund is open. In deciding whether to make fair value adjustments, the fund reviews a variety of factors, including developments in foreign markets, the performance of U.S. securities markets, and the performance of instruments trading in U.S. markets that represent foreign securities and baskets of foreign securities. The fund uses outside pricing services to provide it with closing market prices and information used for adjusting those prices. The fund cannot predict when and how often it will use closing prices and when it will adjust those prices to reflect fair value. As a means of evaluating its fair value process, the fund routinely compares closing market prices, the next day’s opening prices in the same markets, and adjusted prices.
Currency Translation Assets, including investments, and liabilities denominated in foreign currencies are translated into U.S. dollar values each day at the prevailing exchange rate, using the mean of the bid and asked prices of such currencies against U.S. dollars as quoted by a major bank. Purchases and sales of securities, income, and expenses are translated into U.S. dollars at the prevailing exchange rate on the date of the transaction. The effect of changes in foreign currency exchange rates on realized and unrealized security gains and losses is reflected as a component of security gains and losses.
Class Accounting Health Sciences–II pays distribution, shareholder servicing, and/or certain administrative expenses in the form of Rule 12b-1 fees, in an amount not exceeding 0.25% of the class’s average daily net assets. Management and administrative fee expenses, investment income, and realized and unrealized gains and losses are allocated to the classes based upon the relative daily net assets of each class.
Investment Transactions, Investment Income, and Distributions Income and expenses are recorded on the accrual basis. Premiums and discounts on debt securities are amortized for financial reporting purposes. Dividends received from mutual fund investments are reflected as dividend income; capital gain distributions are reflected as realized gain/loss. Dividend income and capital gain distributions are recorded on the ex-dividend date. Investment transactions are accounted for on the trade date. Realized gains and losses are reported on the identified cost basis. Distributions to shareholders are recorded on the ex-dividend date. Income distributions are declared and paid by each class on an annual basis. Capital gain distributions, if any, are declared and paid by the fund, typically on an annual basis.
NOTE 2 - INVESTMENT TRANSACTIONS
Consistent with its investment objective, the fund engages in the following practices to manage exposure to certain risks or to enhance performance. The investment objective, policies, program, and risk factors of the fund are described more fully in the fund’s prospectus and Statement of Additional Information.
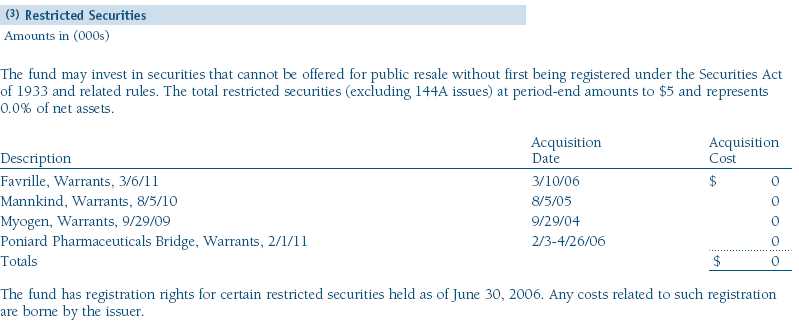
Restricted Securities The fund may invest in securities that are subject to legal or contractual restrictions on resale. Although certain of these securities may be readily sold, for example, under Rule 144A, others may be illiquid, their sale may involve substantial delays and additional costs, and prompt sale at an acceptable price may be difficult.
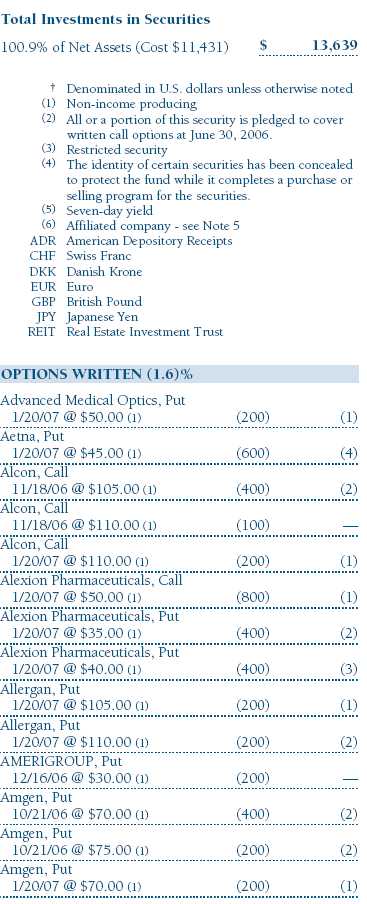
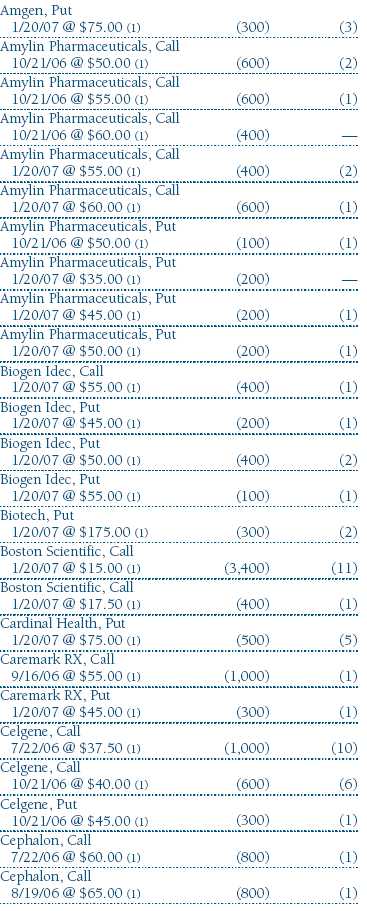
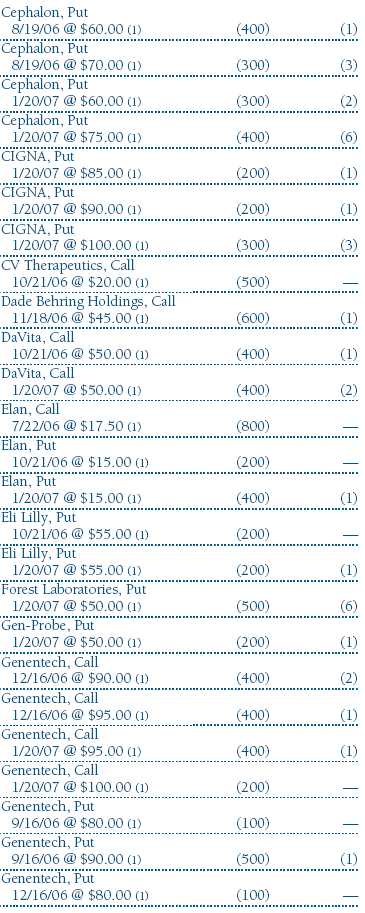
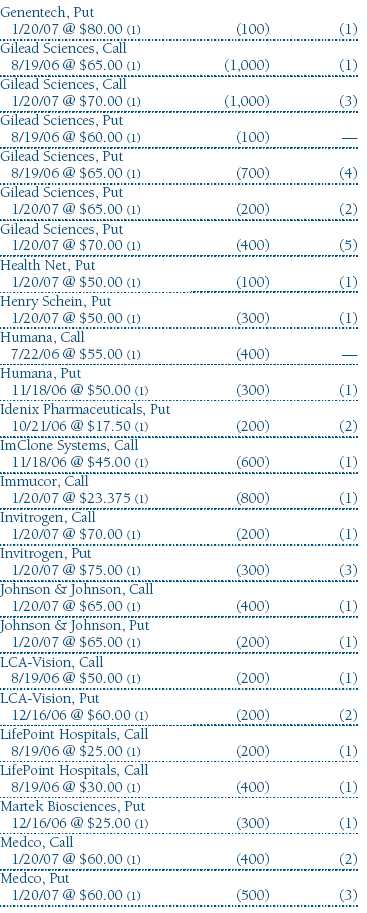
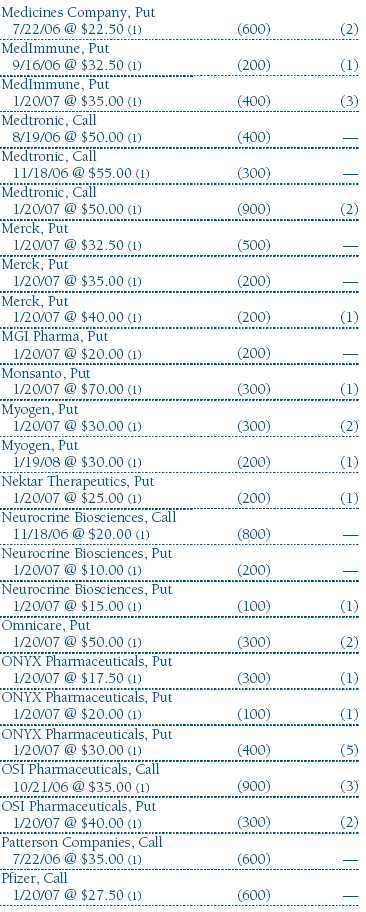
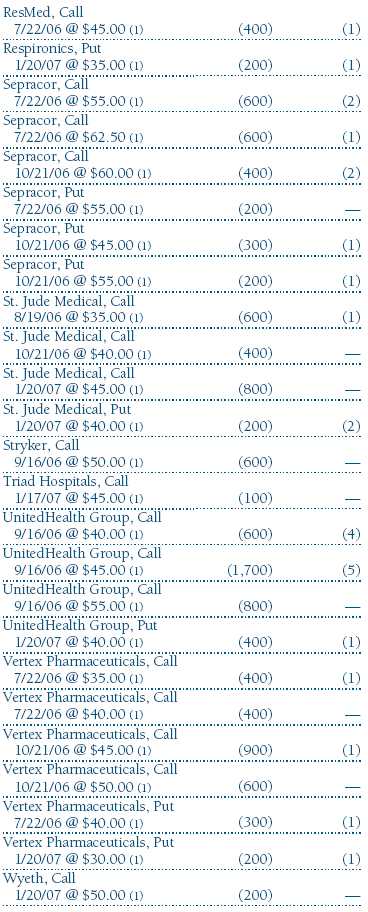
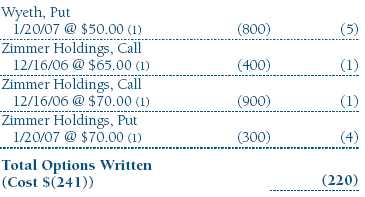
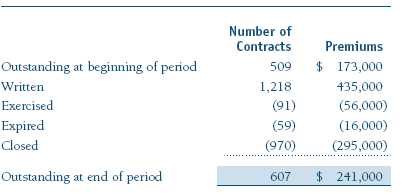
Options Call and put options give the holder the right to purchase or sell, respectively, a security at a specified price on a certain date. Risks arise from possible illiquidity of the options market and from movements in security values. Purchased options are reflected in the accompanying Portfolio of Investments at market value. Written options are reflected in the accompanying Statement of Assets and Liabilities at market value. Transactions in options written and related premiums received during the six months ended June 30, 2006, were as follows:
Other Purchases and sales of portfolio securities, other than short-term securities, aggregated $5,469,000 and $2,787,000, respectively, for the six months ended June 30, 2006.
NOTE 3 - FEDERAL INCOME TAXES
No provision for federal income taxes is required since the fund intends to continue to qualify as a regulated investment company under Subchapter M of the Internal Revenue Code and distribute to shareholders all of its taxable income and gains. Federal income tax regulations differ from generally accepted accounting principles; therefore, distributions determined in accordance with tax regulations may differ in amount or character from net investment income and realized gains for financial reporting purposes. Financial reporting records are adjusted for permanent book/tax differences to reflect tax character. Financial records are not adjusted for temporary differences. The amount and character of tax-basis distributions and composition of net assets are finalized at fiscal year-end; accordingly, tax-basis balances have not been determined as of June 30, 2006.
The fund intends to retain realized gains to the extent of available capital loss carryforwards. As of December 31, 2005, the fund had $154,000 of unused capital loss carryforwards, of which $17,000 expire in 2010 and $137,000 expire in 2011.
At June 30, 2006, the cost of investments for federal income tax purposes was $11,431,000. Net unrealized gain aggregated $2,229,000 at period-end, of which $2,812,000 related to appreciated investments and $583,000 related to depreciated investments.
NOTE 4 - FOREIGN TAXES
The fund is subject to foreign income taxes imposed by certain countries in which it invests. Additionally, capital gains realized by the fund upon disposition of securities issued in or by certain foreign countries are subject to capital gains tax imposed by those countries, which is payable prior to repatriation of sale proceeds. Similarly, a tax on net profits, including interest income and realized and unrealized capital gains, is imposed by certain other countries. All taxes are computed in accordance with the applicable foreign tax law, and, to the extent permitted, capital losses are used to offset capital gains. Tax expense attributable to income is accrued by the fund as a reduction of income. Current and deferred tax expense attributable to net capital gains is reflected as a component of realized and/or change in unrealized gain/loss on securities in the accompanying financial statements.
NOTE 5 - RELATED PARTY TRANSACTIONS
The fund is managed by T. Rowe Price Associates, Inc. (the manager or Price Associates), a wholly owned subsidiary of T. Rowe Price Group, Inc. The investment management and administrative agreement between the fund and the manager provides for an all-inclusive annual fee equal to 0.95% of the fund’s average daily net assets. The fee is computed daily and paid monthly. The agreement provides that investment management, shareholder servicing, transfer agency, accounting, and custody services are provided to the fund, and interest, taxes, brokerage commissions, directors’ fees and expenses, and extraordinary expenses are paid directly by the fund.
The fund may invest in the T. Rowe Price Reserve Investment Fund and the T. Rowe Price Government Reserve Investment Fund (collectively, the T. Rowe Price Reserve Funds), open-end management investment companies managed by Price Associates and affiliates of the fund. The T. Rowe Price Reserve Funds are offered as cash management options to mutual funds, trusts, and other accounts managed by Price Associates and/or its affiliates, and are not available for direct purchase by members of the public. The T. Rowe Price Reserve Funds pay no investment management fees. During the six months ended June 30, 2006, dividend income from the T. Rowe Price Reserve Funds totaled $7,000, and the value of shares of the T. Rowe Price Reserve Funds held at June 30, 2006, and December 31, 2005, was $286,000 and $196,000, respectively.
| Information on Proxy Voting Policies, Procedures, and Records |
A description of the policies and procedures used by T. Rowe Price funds and portfolios to determine how to vote proxies relating to portfolio securities is available in each fund’s Statement of Additional Information, which you may request by calling 1-800-225-5132 or by accessing the SEC’s Web site, www.sec.gov. The description of our proxy voting policies and procedures is also available on our Web site, www.troweprice.com. To access it, click on the words “Company Info” at the top of our homepage for individual investors. Then, in the window that appears, click on the “Proxy Voting Policy” navigation button in the top left corner.
Each fund’s most recent annual proxy voting record is available on our Web site and through the SEC’s Web site. To access it through our Web site, follow the directions above, then click on the words “Proxy Voting Record” at the bottom of the Proxy Voting Policy page.
| How to Obtain Quarterly Portfolio Holdings |
The fund files a complete schedule of portfolio holdings with the Securities and Exchange Commission for the first and third quarters of each fiscal year on Form N-Q. The fund’s Form N-Q is available electronically on the SEC’s Web site (www.sec.gov); hard copies may be reviewed and copied at the SEC’s Public Reference Room, 450 Fifth St. N.W., Washington, DC 20549. For more information on the Public Reference Room, call 1-800-SEC-0330.
| Approval of Investment Management Agreement |
On March 8, 2006, the fund’s Board of Directors unanimously approved the investment advisory contract (Contract) between the fund and its investment manager, T. Rowe Price Associates, Inc. (Manager). The Board considered a variety of factors in connection with its review of the Contract, also taking into account information provided by the Manager during the course of the year, as discussed below:
Services Provided by the Manager
The Board considered the nature, quality, and extent of the services provided to the fund by the Manager. These services included, but were not limited to, management of the fund’s portfolio and a variety of activities related to portfolio management. The Board also reviewed the background and experience of the Manager’s senior management team and investment personnel involved in the management of the fund. The Board concluded that it was satisfied with the nature, quality, and extent of the services provided by the Manager.
Investment Performance of the Fund
The Board reviewed the fund’s average annual total return over the one-, three-, and five-year periods as well as the fund’s year-by-year returns and compared these returns with previously agreed upon comparable performance measures and market data, including those supplied by Lipper and Morningstar, which are independent providers of mutual fund data. On the basis of this evaluation and the Board’s ongoing review of investment results, the Board concluded that the fund’s performance was satisfactory.
Costs, Benefits, Profits, and Economies of Scale
The Board reviewed detailed information regarding the revenues received by the Manager under the Contract and other benefits that the Manager (and its affiliates) may have realized from its relationship with the fund, including research received under “soft dollar” agreements. The Board noted that the use of soft dollars as a means of paying for third-party, non-broker research had been eliminated. The Board also received information on the estimated costs incurred and profits realized by the Manager and its affiliates from advising T. Rowe Price mutual funds, as well as estimates of the gross profits realized from managing the fund in particular. The Board concluded that the Manager’s profits were reasonable in light of the services provided to the fund. The Board also considered whether the fund or other funds benefit under the fee levels set forth in the Contract from any economies of scale realized by the Manager. The Board noted that, under the Contract, the fund pays the Manager a single fee based on the fund’s assets and the Manager, in turn, pays all expenses of the fund, with certain exceptions. The Board concluded that, based on the profitability data it reviewed and consistent with this single fee structure, the Contract provided for a reasonable sharing of benefits from any economies of scale with the fund.
Fees
The Board reviewed the fund’s single-fee structure and compared the rate with fees and expenses of other comparable funds based on information and data supplied by Lipper. The information provided to the Board indicated that the fund’s single fee rate was generally below the median management fee rate and expense ratio for comparable funds. The Board also reviewed the expense ratio of the fund’s Class II share class, which pays a 12b-1 fee in addition to the single fee, and compared this expense ratio to the fees and expenses of comparable funds. The information provided to the Board indicated that the expense ratio for the Class II share class was generally below the median expense ratio for comparable funds. The Board also reviewed the fee schedules for comparable privately managed accounts of the Manager and its affiliates. Management informed the Board that the Manager’s responsibilities for privately managed accounts are more limited than its responsibilities for the fund and other T. Rowe Price mutual funds that it or its affiliates advise. On the basis of the information provided, the Board concluded that the fees paid by the fund under the Contract were reasonable.
Approval of the Contract
As noted, the Board approved the continuation of the Contract. No single factor was considered in isolation or to be determinative to the decision. Rather, the Board concluded, in light of a weighting and balancing of all factors considered, that it was in the best interests of the fund to approve the continuation of the Contract, including the fees to be charged for services thereunder.
 Item 2. Code of Ethics.
A code of ethics, as defined in Item 2 of Form N-CSR, applicable to its principal executive officer, principal financial officer, principal accounting officer or controller, or persons performing similar functions is filed as an exhibit to the registrant’s annual Form N-CSR. No substantive amendments were approved or waivers were granted to this code of ethics during the registrant’s most recent fiscal half-year.
Item 3. Audit Committee Financial Expert.
Disclosure required in registrant’s annual Form N-CSR.
Item 4. Principal Accountant Fees and Services.
Disclosure required in registrant’s annual Form N-CSR.
Item 5. Audit Committee of Listed Registrants.
Not applicable.
Item 6. Schedule of Investments.
Not applicable. The complete schedule of investments is included in Item 1 of this Form N-CSR.
Item 7. Disclosure of Proxy Voting Policies and Procedures for Closed-End Management Investment Companies.
Not applicable.
Item 8. Portfolio Managers of Closed-End Management Investment Companies.
Not applicable.
Item 9. Purchases of Equity Securities by Closed-End Management Investment Company and Affiliated Purchasers.
Not applicable.
Item 10. Submission of Matters to a Vote of Security Holders.
Not applicable.
Item 11. Controls and Procedures.
(a) The registrant’s principal executive officer and principal financial officer have evaluated the registrant’s disclosure controls and procedures within 90 days of this filing and have concluded that the registrant’s disclosure controls and procedures were effective, as of that date, in ensuring that information required to be disclosed by the registrant in this Form N-CSR was recorded, processed, summarized, and reported timely.
(b) The registrant’s principal executive officer and principal financial officer are aware of no change in the registrant’s internal control over financial reporting that occurred during the registrant’s second fiscal quarter covered by this report that has materially affected, or is reasonably likely to materially affect, the registrant’s internal control over financial reporting.
Item 12. Exhibits.(a)(1) The registrant’s code of ethics pursuant to Item 2 of Form N-CSR is filed with the registrant’s annual Form N-CSR.
(2) Separate certifications by the registrant's principal executive officer and principal financial officer, pursuant to Section 302 of the Sarbanes-Oxley Act of 2002 and required by Rule 30a-2(a) under the Investment Company Act of 1940, are attached.
(3) Written solicitation to repurchase securities issued by closed-end companies: not applicable.
(b) A certification by the registrant's principal executive officer and principal financial officer, pursuant to Section 906 of the Sarbanes-Oxley Act of 2002 and required by Rule 30a-2(b) under the Investment Company Act of 1940, is attached.
| |
SIGNATURES |
| |
| | Pursuant to the requirements of the Securities Exchange Act of 1934 and the Investment |
| Company Act of 1940, the registrant has duly caused this report to be signed on its behalf by the |
| undersigned, thereunto duly authorized. |
| |
| T. Rowe Price Equity Series, Inc. |
| |
| |
| By | /s/ Edward C. Bernard |
| | Edward C. Bernard |
| | Principal Executive Officer |
| |
| Date | October 25, 2006 |
| |
| |
| | Pursuant to the requirements of the Securities Exchange Act of 1934 and the Investment |
| Company Act of 1940, this report has been signed below by the following persons on behalf of |
| the registrant and in the capacities and on the dates indicated. |
| |
| |
| By | /s/ Edward C. Bernard |
| | Edward C. Bernard |
| | Principal Executive Officer |
| |
| Date | October 25, 2006 |
| |
| |
| By | /s/ Joseph A. Carrier |
| | Joseph A. Carrier |
| | Principal Financial Officer |
| |
| Date | October 25, 2006 |