Item 1: Report to Shareholders| New America Growth Portfolio | June 30, 2006 |
The views and opinions in this report were current as of June 30, 2006. They are not guarantees of performance or investment results and should not be taken as investment advice. Investment decisions reflect a variety of factors, and the managers reserve the right to change their views about individual stocks, sectors, and the markets at any time. As a result, the views expressed should not be relied upon as a forecast of the fund’s future investment intent. The report is certified under the Sarbanes-Oxley Act of 2002, which requires mutual funds and other public companies to affirm that, to the best of their knowledge, the information in their financial reports is fairly and accurately stated in all material respects.
Dear Investor
The first half of 2006 was a difficult period for large-cap growth stocks. Stocks were roughly flat, as concerns over rising interest rates and record-high oil prices continued to offset solid corporate profit growth. Benefiting from industry consolidation, telecommunication services stocks were the best performers in the benchmark S&P 500 Index during the six-month period. The most economically sensitive sectors of the market—energy, materials, and industrials and business services—also performed well. In contrast, the traditional growth sectors suffered the largest declines, led by information technology and health care, which felt the repercussions from the widening investigation of backdating stock options.
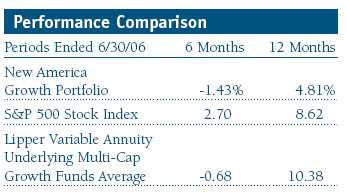
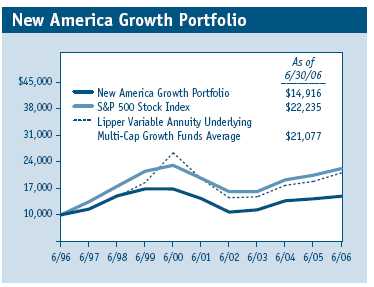
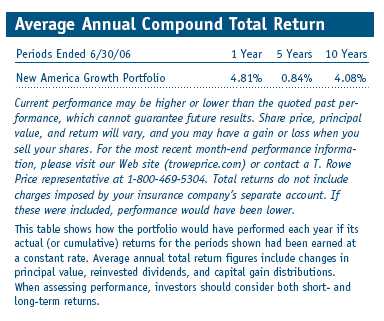
During the six-month period, the New America Growth Portfolio generated a -1.43% return, compared with 2.70% and -0.68% for the S&P 500 Index and the Lipper Variable Annuity Underlying Multi-Cap Growth Funds Average, respectively. For the past 12 months, the portfolio generated a 4.81% return, which trailed the S&P 500’s 8.62% return and Lipper’s 10.38% gain. Clearly, our emphasis on growth stocks, which under-performed value, and larger-capitalization companies, which lagged small- and mid-caps, hurt our comparisons with our benchmarks.
MARKET ENVIRONMENT
The key story during the first six months of the year was higher-than-expected inflation readings, which led to continued interest rate hikes and investor concern that the Federal Reserve may continue to tighten further in the coming months. Additionally, energy prices remained historically high and the housing market began to slow. All of these forces combined to slow consumer spending during the first half.
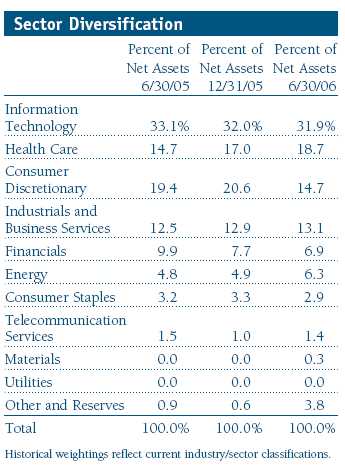
Broad sector performance looked quite similar to recent periods. Within the S&P 500 Index, the top-performing sectors included energy, telecommunication services, materials, and industrials and business services. The fastest-growing sectors, where we have the majority of the portfolio’s assets, suffered. For example, in the first half, health care and technology posted negative returns, and the next weakest sector performer was consumer discretionary. These three sectors were the largest in the portfolio, accounting for approximately 65% of assets at the end of June. Allegations of improperly backdating stock options took their toll on the technology and health care sectors. We take the possibility that management may have acted inappropriately quite seriously, but we’re reserving judgment on our affected holdings until more complete information is available.
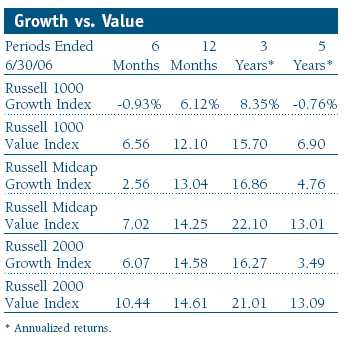
During the past six months, the ongoing theme for our shareholders was that value stocks continued outperforming growth stocks across all market capitalizations. Among large-caps, growth stocks in the Russell 1000 returned -0.93% while value stocks rose 6.56%. In the mid-cap space, growth stocks returned 2.56% while value stocks gained 7.02%. Small-cap value stocks also outperformed growth 10.44% versus 6.07%. This has become a common refrain over the years. Consider that over the past five years, large-cap growth stocks have cumulatively returned -3.75% versus large-cap value stocks’ 39.57% return (6.90% annually); it was the same for the mid-caps—growth gained a bit more than 26% over the past five years while value advanced 84% (13.01% annually); and among small-caps, value’s cumulative gain was almost 85% (13.09% annually) while small growth shares gained just 18.70% (3.49% per year). The annualized numbers in the table show how much smaller-capitalization stocks have o utperformed large-caps, and how consistently value has outperformed growth over the past five years. This environment did not play positively into New America’s focus on larger-cap growth stocks. Although we don’t know when, we remain optimistic that there will be reversion to the mean; therefore, we intend to add to the high-quality, market-leading growth companies that make up the core of this portfolio.
PORTFOLIO REVIEW
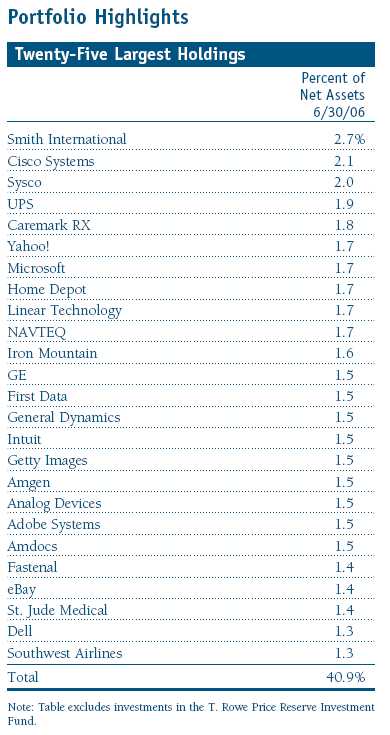
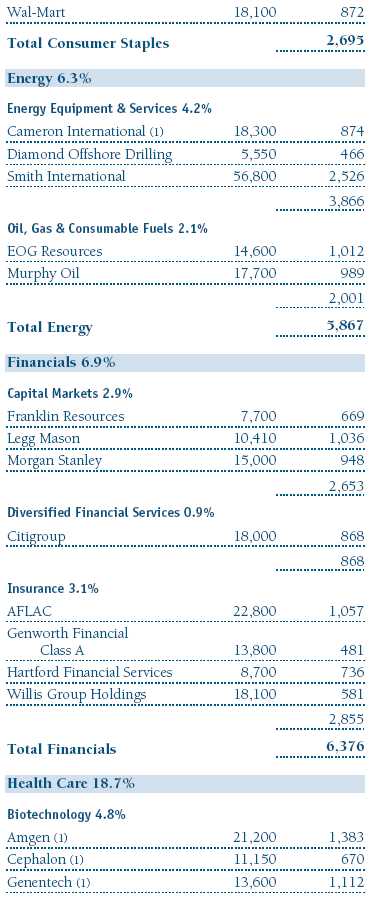
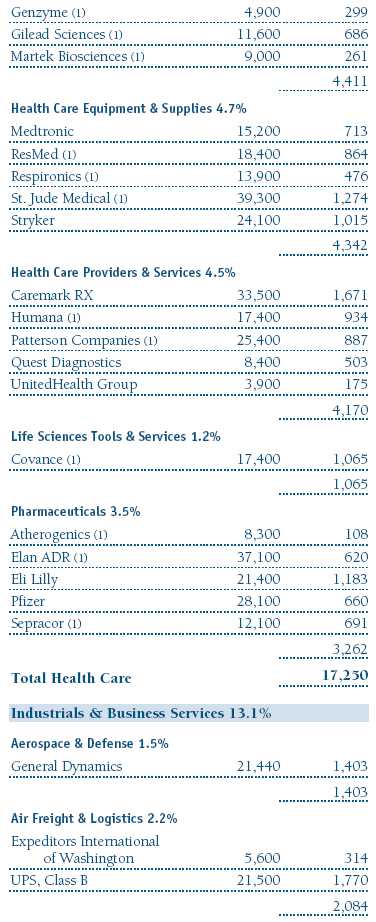
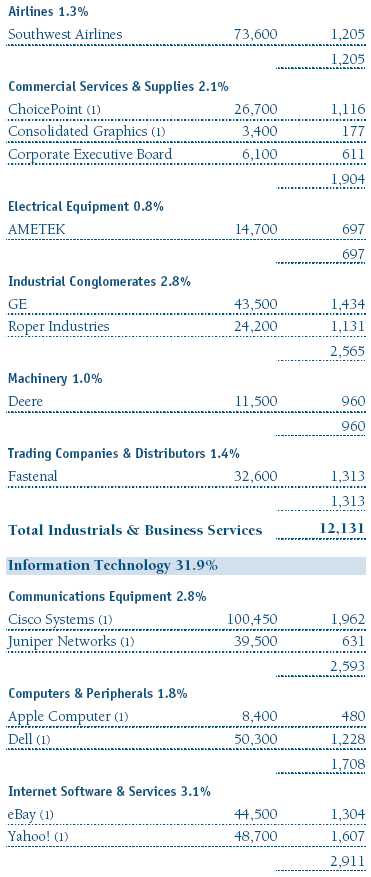
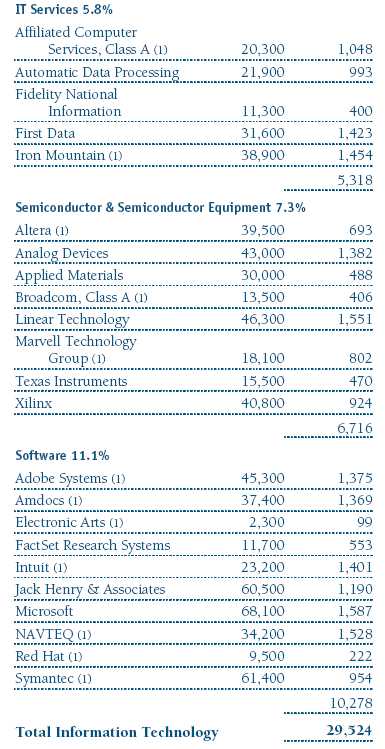
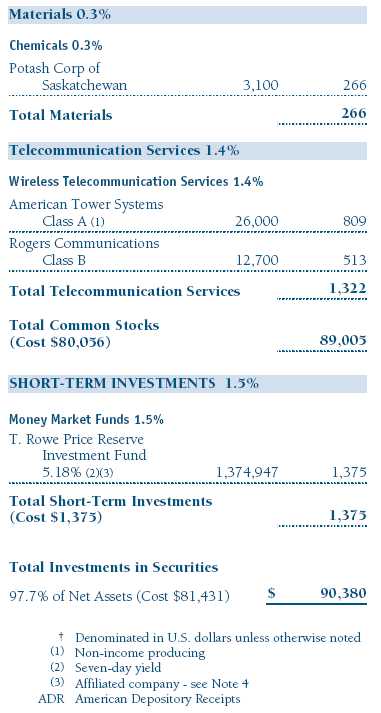
The portfolio’s largest performance contributors over the past six months were Smith International, Amdocs, and Cisco Systems. (Please refer to the portfolio of investments for a complete listing of the portfolio's holdings and the amount each represents of the portfolio.)
Oil field services company Smith International, highlighted a year ago in the Investment Strategy portion of this letter, is still our largest holding. During the period, Smith's stock responded positively to continued strong earnings growth thanks, in part, to the well-documented rising energy prices.
Another top performer was Amdocs, the world’s leading provider of billing software and services to the telecom industry. The company is benefiting in general from several positive trends in the overall telecom market. The most notable is the proliferation and convergence of video, voice, and data services, for which its customers need updated billing systems. Amdocs signed several major new deals and delivered excellent revenue and earnings results during the first half of the year. Cisco Systems also benefited from strong results during the period, buoyed by a solid demand environment for telecommunications equipment.
Top performers for the 12-month period included Smith International, Intuit, and Navteq. Intuit, highlighted six months ago in this letter, continued to perform well as the company posted stronger-than-expected results due in part to the excellent performance of its market-leading TurboTax product. Intuit also benefited from the launch of a new version of its QuickBooks accounting product last fall. Navteq is the leading provider of digital maps and “points of interest” databases used in automotive and portable navigation systems with over 75% market share. The use of navigation systems is expanding rapidly, and I believe Navteq is well positioned to deliver above-average earnings growth for several years.
Our largest detractors during the six-month period included eBay, Expedia, and Getty Images. Although eBay continues to deliver strong earnings growth, its stock has been plagued by fears of slowing growth and concerns that Google is becoming a more formidable competitor for both eBay and its payment-processing arm, PayPal. My expectation is that both will prove to be true; eBay’s growth will inevitably slow, and Google will almost certainly make competitive inroads. However, I believe the market is overly focused on these issues, and that eBay is attractively valued at less than 20 times 2008 earnings and generates strong free cash flow. As such, I added to the position, and it has become a top-25 position.
Expedia missed its first-quarter earnings forecast, and the stock was punished. Booking travel via the Internet continues to be a growing consumer trend, but Expedia is struggling in a robust travel market, and it seems that its hotel suppliers are relying less on them to provide customers. Expedia’s new management team has also spent excessively on advertising, which hurt the bottom line. These developments prompted us to sell a portion of our stake in this holding.
Longtime holding Getty Images stumbled in the first quarter, and the stock declined significantly. Getty is the leading provider of stock digital photography to advertisers and Web sites, and its revenues fell modestly short of Wall Street’s expectations, fueling concerns that its multi-year run was over. I think Getty can continue to grow its revenue and earnings at above-average rates and generate attractive margins and cash flow. Despite the recent slide, it remains a significant holding in the fund.
INVESTMENT STRATEGY
The New America Growth Portfolio seeks to invest in America’s best larger-cap growth companies. We are attracted to companies that serve large and growing markets, enjoy high or rising profit margins and returns, feature a strong balance sheet, and generate above-average free cash flow. Experienced, capable management is critical, as well.
One of our largest purchases during the six-month period was Fastenal, a leading retailer of fasteners and other supplies used mainly in construction and industrial applications. Through its nationwide network of over 1,800 stores, Fastenal reported more than $1.5 billion in revenues in 2005 and at the end of June sported a $6 billion market capitalization. Although it appears that residential construction is slowing substantially, Fastenal’s business is largely focused on nonresidential construction, which should be in the earlier innings of a multiyear expansion.
I view Fastenal as a specialty retailer with above-average same-store sales and store growth. Stores are growing in the mid-teens range and same-store sales, which are somewhat cyclical, have recently been running in the low double digits. This combination of store growth and same-store sales should help Fastenal deliver 15% to 20% revenue growth annually over the next several years. The company’s superb management team has instilled a culture of continuous improvement, and this, in turn, should deliver profit gains from initiatives in its supply chain and procurement and from better use of technology.
OUTLOOK
The portfolio’s performance in the back half of 2006 largely depends upon how aggressively the Fed fights inflation through interest rate hikes and how much rising energy costs and interest rates sap the consumer. Shareholders should know that the portfolio is aggressively postured because I think we are in the later innings of Fed rate hikes and consumer spending will slow down but not collapse. The portfolio and my investing universe of higher-quality, larger-growth companies feature attractive valuations, as well.
In the meantime, I continue to apply our investment discipline and use a longer-term time horizon in making portfolio decisions.
Respectfully submitted,

Joseph M. Milano
Chairman of the portfolio’s Investment Advisory Committee
July 20, 2006
The committee chairman has day-to-day responsibility for managing the portfolio and works with committee members in developing and executing the investment program.
The portfolio’s share price can fall because of weakness in the stock markets, a particular industry, or specific holdings. Stock markets can decline for many reasons, including adverse political or economic developments, changes in investor psychology, or heavy institutional selling. The prospects for an industry or company may deteriorate because of a variety of factors, including disappointing earnings or changes in the competitive environment. In addition, the investment manager’s assessment of companies held in a fund may prove incorrect, resulting in losses or poor performance even in rising markets.
Dividend yield: The annual dividend of a stock divided by the stock’s price.
Free cash flow: The excess cash a company is generating from its operations that can be taken out of the business for the benefit of shareholders, such as dividends, share repurchases, investments, and acquisitions.
Lipper averages: The averages of available mutual fund performance returns for specified periods in defined categories as tracked by Lipper Inc.
Price/book ratio: A valuation measure that compares a stock’s market price with its book value, i.e., the company’s net worth divided by the number of outstanding shares.
Price/earnings ratio (P/E): A valuation measure calculated by dividing the price of a stock by its current or projected earnings per share. This ratio gives investors an idea of how much they are paying for current or future earnings power.
S&P 500 Stock Index: An unmanaged index that tracks the stocks of 500 primarily large-cap U.S. companies.

This chart shows the value of a hypothetical $10,000 investment in the fund over the past 10 fiscal year periods or since inception (for funds lacking 10-year records). The result is compared with benchmarks, which may include a broad-based market index and a peer group average or index. Market indexes do not include expenses, which are deducted from fund returns as well as mutual fund averages and indexes.
Fund Expense Example
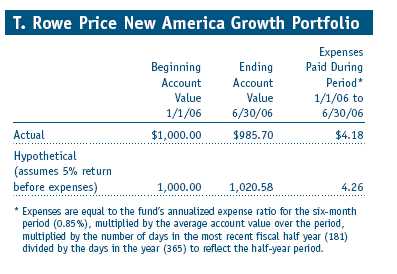
As a mutual fund shareholder, you may incur two types of costs: (1) transaction costs, such as redemption fees or sales loads, and (2) ongoing costs, including management fees, distribution and service (12b-1) fees, and other fund expenses. The following example is intended to help you understand your ongoing costs (in dollars) of investing in the fund and to compare these costs with the ongoing costs of investing in other mutual funds. The example is based on an investment of $1,000 invested at the beginning of the most recent six-month period and held for the entire period.
Actual Expenses
The first line of the following table (“Actual”) provides information about actual account values and actual expenses. You may use the information in this line, together with your account balance, to estimate the expenses that you paid over the period. Simply divide your account value by $1,000 (for example, an $8,600 account value divided by $1,000 = 8.6), then multiply the result by the number in the first line under the heading “Expenses Paid During Period” to estimate the expenses you paid on your account during this period.
Hypothetical Example for Comparison Purposes
The information on the second line of the table (“Hypothetical”) is based on hypothetical account values and expenses derived from the fund’s actual expense ratio and an assumed 5% per year rate of return before expenses (not the fund’s actual return). You may compare the ongoing costs of investing in the fund with other funds by contrasting this 5% hypothetical example and the 5% hypothetical examples that appear in the shareholder reports of the other funds. The hypothetical account values and expenses may not be used to estimate the actual ending account balance or expenses you paid for the period.
You should also be aware that the expenses shown in the table highlight only your ongoing costs and do not reflect any transaction costs, such as redemption fees or sales loads. Therefore, the second line of the table is useful in comparing ongoing costs only, and will not help you determine the relative total costs of owning different funds. To the extent a fund charges transaction costs, however, the total cost of owning that fund is higher.
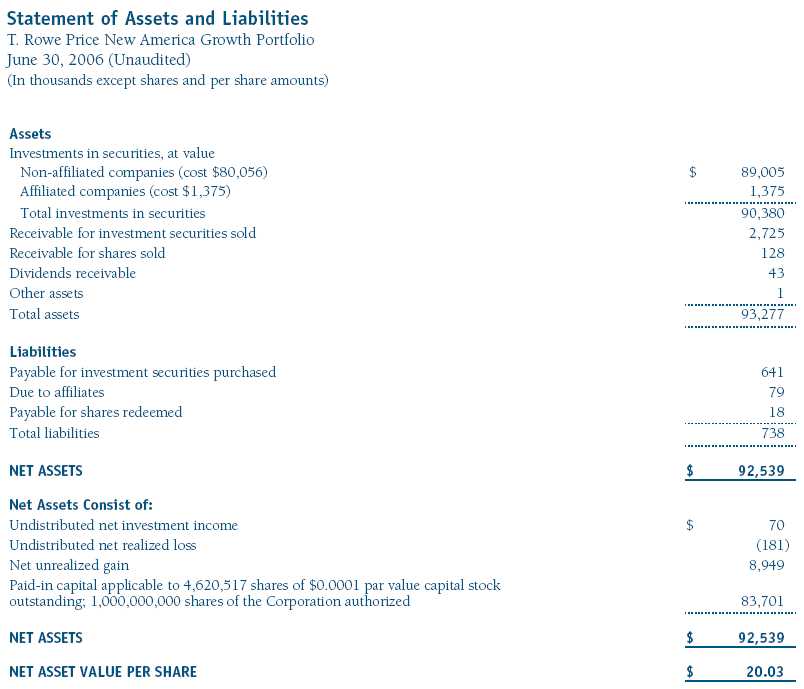
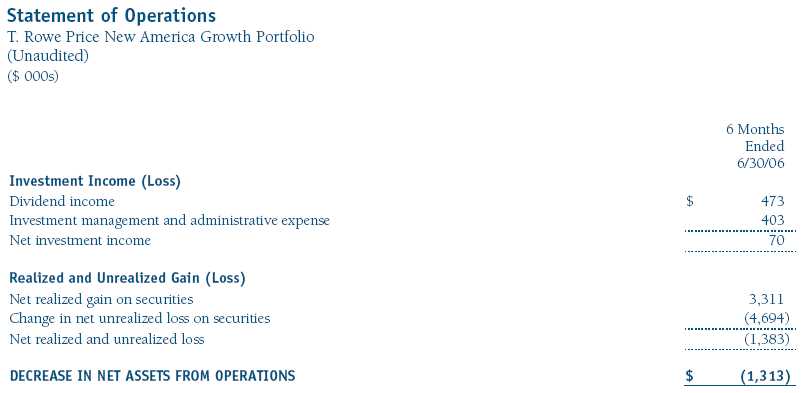
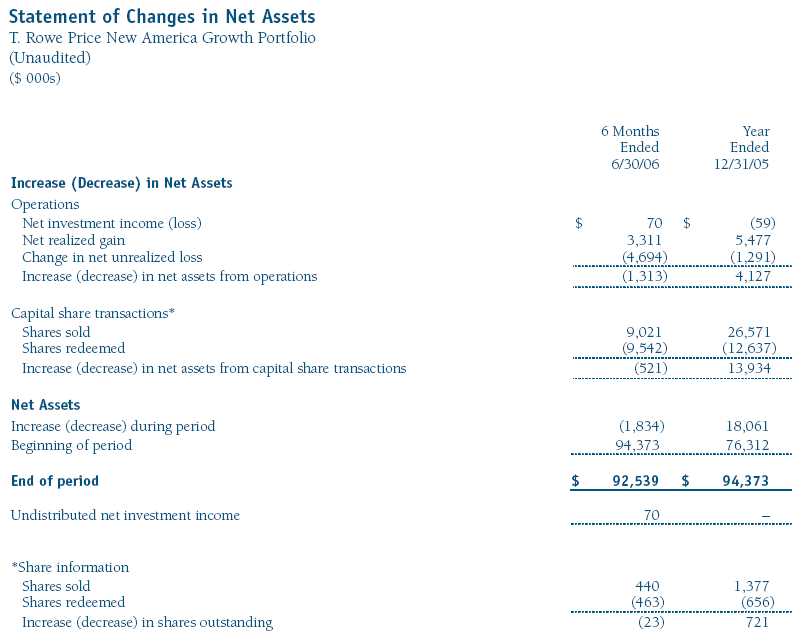
The accompanying notes are an integral part of these financial statements.

The accompanying notes are an integral part of these financial statements.
The accompanying notes are an integral part of these financial statements.
The accompanying notes are an integral part of these financial statements.
The accompanying notes are an integral part of these financial statements.
Notes to Financial Statements
T. Rowe Price New America Growth Portfolio
June 30, 2006 (Unaudited)
NOTE 1 - SIGNIFICANT ACCOUNTING POLICIES
T. Rowe Price Equity Series, Inc. (the corporation), is registered under the Investment Company Act of 1940 (the 1940 Act). The New America Growth Portfolio (the fund), a diversified, open-end management investment company, is one portfolio established by the corporation. The fund commenced operations on March 31, 1994. The fund seeks to provide long-term capital growth by investing primarily in the common stocks of growth companies. Shares of the fund are currently offered only through certain insurance companies as an investment medium for both variable annuity contracts and variable life insurance policies.
The accompanying financial statements were prepared in accordance with accounting principles generally accepted in the United States of America, which require the use of estimates made by fund management. Fund management believes that estimates and security valuations are appropriate; however, actual results may differ from those estimates, and the security valuations reflected in the financial statements may differ from the value the fund ultimately realizes upon sale of the securities.
Valuation The fund values its investments and computes its net asset value per share at the close of the New York Stock Exchange (NYSE), normally 4 p.m. ET, each day that the NYSE is open for business. Equity securities listed or regularly traded on a securities exchange or in the over-the-counter (OTC) market are valued at the last quoted sale price or, for certain markets, the official closing price at the time the valuations are made, except for OTC Bulletin Board securities, which are valued at the mean of the latest bid and asked prices. A security that is listed or traded on more than one exchange is valued at the quotation on the exchange determined to be the primary market for such security. Listed securities not traded on a particular day are valued at the mean of the latest bid and asked prices for domestic securities and the last quoted sale price for international securities.
Investments in mutual funds are valued at the mutual fund's closing net asset value per share on the day of valuation.
Other investments, including restricted securities, and those for which the above valuation procedures are inappropriate or are deemed not to reflect fair value are stated at fair value as determined in good faith by the T. Rowe Price Valuation Committee, established by the fund’s Board of Directors.
Rebates Subject to best execution, the fund may direct certain security trades to brokers who have agreed to rebate a portion of the related brokerage commission to the fund in cash. Commission rebates are reflected as realized gain on securities in the accompanying financial statements.
Investment Transactions, Investment Income, and Distributions Income and expenses are recorded on the accrual basis. Dividends received from mutual fund investments are reflected as dividend income; capital gain distributions are reflected as realized gain/loss. Dividend income and capital gain distributions are recorded on the ex-dividend date. Investment transactions are accounted for on the trade date. Realized gains and losses are reported on the identified cost basis. Distributions to shareholders are recorded on the ex-dividend date. Income distributions are declared and paid on an annual basis. Capital gain distributions, if any, are declared and paid by the fund, typically on an annual basis.
NOTE 2 - INVESTMENT TRANSACTIONS
Purchases and sales of portfolio securities, other than short-term securities, aggregated $31,641,000 and $35,031,000, respectively, for the six months ended June 30, 2006.
NOTE 3 - FEDERAL INCOME TAXES
No provision for federal income taxes is required since the fund intends to continue to qualify as a regulated investment company under Subchapter M of the Internal Revenue Code and distribute to shareholders all of its taxable income and gains. Federal income tax regulations differ from generally accepted accounting principles; therefore, distributions determined in accordance with tax regulations may differ in amount or character from net investment income and realized gains for financial reporting purposes. Financial reporting records are adjusted for permanent book/tax differences to reflect tax character. Financial records are not adjusted for temporary differences. The amount and character of tax-basis distributions and composition of net assets are finalized at fiscal year-end; accordingly, tax-basis balances have not been determined as of June 30, 2006.
The fund intends to retain realized gains to the extent of available capital loss carryforwards. As of December 31, 2005 the fund had $3,492,000 of unused capital loss carryforwards, of which $3,281,000 expire in 2010, and $211,000 expire in 2011.
At June 30, 2006, the cost of investments for federal income tax purposes was $81,431,000. Net unrealized gain aggregated $8,949,000 at period-end, of which $12,165,000 related to appreciated investments and $3,216,000 related to depreciated investments.
NOTE 4 - RELATED PARTY TRANSACTIONS
The fund is managed by T. Rowe Price Associates, Inc. (the manager or Price Associates), a wholly owned subsidiary of T. Rowe Price Group, Inc. The investment management and administrative agreement between the fund and the manager provides for an all-inclusive annual fee equal to 0.85% of the fund’s average daily net assets. The fee is computed daily and paid monthly. The agreement provides that investment management, shareholder servicing, transfer agency, accounting, and custody services are provided to the fund, and interest, taxes, brokerage commissions, directors’ fees and expenses, and extraordinary expenses are paid directly by the fund.
The fund may invest in the T. Rowe Price Reserve Investment Fund and the T. Rowe Price Government Reserve Investment Fund (collectively, the T. Rowe Price Reserve Funds), open-end management investment companies managed by Price Associates and affiliates of the fund. The T. Rowe Price Reserve Funds are offered as cash management options to mutual funds, trusts, and other accounts managed by Price Associates and/or its affiliates, and are not available for direct purchase by members of the public. The T. Rowe Price Reserve Funds pay no investment management fees. During the six months ended June 30, 2006, dividend income from the T. Rowe Price Reserve Funds totaled $15,000 and the value of shares of the T. Rowe Price Reserve Funds held at June 30, 2006, and December 31, 2005, was $1,375,000 and $474,000, respectively.
| Information on Proxy Voting Policies, Procedures, and Records |
A description of the policies and procedures used by T. Rowe Price funds and portfolios to determine how to vote proxies relating to portfolio securities is available in each fund’s Statement of Additional Information, which you may request by calling 1-800-225-5132 or by accessing the SEC’s Web site, www.sec.gov. The description of our proxy voting policies and procedures is also available on our Web site, www.troweprice.com. To access it, click on the words “Company Info” at the top of our homepage for individual investors. Then, in the window that appears, click on the “Proxy Voting Policy” navigation button in the top left corner.
Each fund’s most recent annual proxy voting record is available on our Web site and through the SEC’s Web site. To access it through our Web site, follow the directions above, then click on the words “Proxy Voting Record” at the bottom of the Proxy Voting Policy page.
| How to Obtain Quarterly Portfolio Holdings |
The fund files a complete schedule of portfolio holdings with the Securities and Exchange Commission for the first and third quarters of each fiscal year on Form N-Q. The fund’s Form N-Q is available electronically on the SEC’s Web site (www.sec.gov); hard copies may be reviewed and copied at the SEC’s Public Reference Room, 450 Fifth St. N.W., Washington, DC 20549. For more information on the Public Reference Room, call 1-800-SEC-0330.
| Approval of Investment Management Agreement |
On March 8, 2006, the fund’s Board of Directors unanimously approved the investment advisory contract (Contract) between the fund and its investment manager, T. Rowe Price Associates, Inc. (Manager). The Board considered a variety of factors in connection with its review of the Contract, also taking into account information provided by the Manager during the course of the year, as discussed below:
Services Provided by the Manager
The Board considered the nature, quality, and extent of the services provided to the fund by the Manager. These services included, but were not limited to, management of the fund’s portfolio and a variety of activities related to portfolio management. The Board also reviewed the background and experience of the Manager’s senior management team and investment personnel involved in the management of the fund. The Board concluded that it was satisfied with the nature, quality, and extent of the services provided by the Manager.
Investment Performance of the Fund
The Board reviewed the fund’s average annual total return over the 1-, 3-, 5-, and 10-year periods as well as the fund’s year-by-year returns and compared these returns with previously agreed upon comparable performance measures and market data, including those supplied by Lipper and Morningstar, which are independent providers of mutual fund data. On the basis of this evaluation and the Board’s ongoing review of investment results, the Board concluded that the fund’s performance was satisfactory.
Costs, Benefits, Profits, and Economies of Scale
The Board reviewed detailed information regarding the revenues received by the Manager under the Contract and other benefits that the Manager (and its affiliates) may have realized from its relationship with the fund, including research received under “soft dollar” agreements. The Board noted that the use of soft dollars as a means of paying for third-party, non-broker research had been eliminated. The Board also received information on the estimated costs incurred and profits realized by the Manager and its affiliates from advising T. Rowe Price mutual funds, as well as estimates of the gross profits realized from managing the fund in particular. The Board concluded that the Manager’s profits were reasonable in light of the services provided to the fund. The Board also considered whether the fund or other funds benefit under the fee levels set forth in the Contract from any economies of scale realized by the Manager. The Board noted that, under the Contract, the fund pays the Manager a single fee based on the fund’s assets and the Manager, in turn, pays all expenses of the fund, with certain exceptions. The Board concluded that, based on the profitability data it reviewed and consistent with this single fee structure, the Contract provided for a reasonable sharing of benefits from any economies of scale with the fund.
Fees
The Board reviewed the fund’s single-fee structure and compared the rate with fees and expenses of other comparable funds based on information and data supplied by Lipper. The information provided to the Board indicated that the fund’s single fee rate was at or below the median management fee rate and expense ratio for comparable funds. The Board also reviewed the fee schedules for comparable privately managed accounts of the Manager and its affiliates. Management informed the Board that the Manager’s responsibilities for privately managed accounts are more limited than its responsibilities for the fund and other T. Rowe Price mutual funds that it or its affiliates advise. On the basis of the information provided, the Board concluded that the fees paid by the fund under the Contract were reasonable.
Approval of the Contract
As noted, the Board approved the continuation of the Contract. No single factor was considered in isolation or to be determinative to the decision. Rather, the Board concluded, in light of a weighting and balancing of all factors considered, that it was in the best interests of the fund to approve the continuation of the Contract, including the fees to be charged for services thereunder.
 Item 2. Code of Ethics.
A code of ethics, as defined in Item 2 of Form N-CSR, applicable to its principal executive officer, principal financial officer, principal accounting officer or controller, or persons performing similar functions is filed as an exhibit to the registrant’s annual Form N-CSR. No substantive amendments were approved or waivers were granted to this code of ethics during the registrant’s most recent fiscal half-year.
Item 3. Audit Committee Financial Expert.
Disclosure required in registrant’s annual Form N-CSR.
Item 4. Principal Accountant Fees and Services.
Disclosure required in registrant’s annual Form N-CSR.
Item 5. Audit Committee of Listed Registrants.
Not applicable.
Item 6. Schedule of Investments.
Not applicable. The complete schedule of investments is included in Item 1 of this Form N-CSR.
Item 7. Disclosure of Proxy Voting Policies and Procedures for Closed-End Management Investment Companies.
Not applicable.
Item 8. Portfolio Managers of Closed-End Management Investment Companies.
Not applicable.
Item 9. Purchases of Equity Securities by Closed-End Management Investment Company and Affiliated Purchasers.
Not applicable.
Item 10. Submission of Matters to a Vote of Security Holders.
Not applicable.
Item 11. Controls and Procedures.
(a) The registrant’s principal executive officer and principal financial officer have evaluated the registrant’s disclosure controls and procedures within 90 days of this filing and have concluded that the registrant’s disclosure controls and procedures were effective, as of that date, in ensuring that information required to be disclosed by the registrant in this Form N-CSR was recorded, processed, summarized, and reported timely.
(b) The registrant’s principal executive officer and principal financial officer are aware of no change in the registrant’s internal control over financial reporting that occurred during the registrant’s second fiscal quarter covered by this report that has materially affected, or is reasonably likely to materially affect, the registrant’s internal control over financial reporting.
Item 12. Exhibits.(a)(1) The registrant’s code of ethics pursuant to Item 2 of Form N-CSR is filed with the registrant’s annual Form N-CSR.
(2) Separate certifications by the registrant's principal executive officer and principal financial officer, pursuant to Section 302 of the Sarbanes-Oxley Act of 2002 and required by Rule 30a-2(a) under the Investment Company Act of 1940, are attached.
(3) Written solicitation to repurchase securities issued by closed-end companies: not applicable.
(b) A certification by the registrant's principal executive officer and principal financial officer, pursuant to Section 906 of the Sarbanes-Oxley Act of 2002 and required by Rule 30a-2(b) under the Investment Company Act of 1940, is attached.
| | |
SIGNATURES |
| |
| | Pursuant to the requirements of the Securities Exchange Act of 1934 and the Investment |
| Company Act of 1940, the registrant has duly caused this report to be signed on its behalf by the |
| undersigned, thereunto duly authorized. |
| |
| T. Rowe Price Equity Series, Inc. |
| |
| |
| By | /s/ Edward C. Bernard |
| | Edward C. Bernard |
| | Principal Executive Officer |
| |
| Date | August 18, 2006 |
| |
| |
| | Pursuant to the requirements of the Securities Exchange Act of 1934 and the Investment |
| Company Act of 1940, this report has been signed below by the following persons on behalf of |
| the registrant and in the capacities and on the dates indicated. |
| |
| |
| By | /s/ Edward C. Bernard |
| | Edward C. Bernard |
| | Principal Executive Officer |
| |
| Date | August 18, 2006 |
| |
| |
| By | /s/ Joseph A. Carrier |
| | Joseph A. Carrier |
| | Principal Financial Officer |
| |
| Date | August 18, 2006 |