Item 1: Report to Shareholders| Mid-Cap Growth Portfolio | June 30, 2005 |
The views and opinions in this report were current as of June 30, 2005. They are not guarantees of performance or investment results and should not be taken as investment advice. Investment decisions reflect a variety of factors, and the managers reserve the right to change their views about individual stocks, sectors, and the markets at any time. As a result, the views expressed should not be relied upon as a forecast of the fund’s future investment intent. The report is certified under the Sarbanes-Oxley Act of 2002, which requires mutual funds and other public companies to affirm that, to the best of their knowledge, the information in their financial reports is fairly and accurately stated in all material respects.
Dear Investor
Stocks struggled in the first half of 2005, although a second-quarter rebound lifted mid-cap shares to a modest advance. The market was held in check by concerns about the pace of economic growth amid surging oil prices and rising short-term interest rates. Large-cap shares held up slightly better than small-caps, but mid-cap stocks outperformed both segments. Despite a late rebound by growth stocks, value shares continued to outperform.
| Periods Ended 6/30/05 | 6 Months | 12 Months |
| Mid-Cap Growth Portfolio | 1.70% | 11.71% |
| Mid-Cap Growth Portfolio–II | 1.58 | 11.49 |
| S&P MidCap 400 Index | 3.85 | 14.03 |
| Russell Midcap Growth Index | 1.70 | 10.86 |
| Lipper Variable Annuity |
| Underlying Mid-Cap Growth |
| Funds Average | 0.32 | 8.59 |
The Mid-Cap Growth Portfolio returned 1.70% during the first six months of 2005, lagging the S&P MidCap 400 Index and in line with the aggressive-growth Russell Midcap Growth Index, as shown in the table. The portfolio outperformed its average competitor, as represented by the Lipper Variable Annuity Underlying Mid-Cap Growth Funds Average. For the 12 months, our 11.71% return trailed the S&P index but beat the Russell and Lipper benchmarks. (Returns for Mid-Cap Growth Portfolio–II were slightly lower, reflecting its differing fee structure.) Results were aided by solid contributions from our energy and telecommunications holdings. However, portfolio results relative to the S&P benchmark were hampered by our minimal exposure to value-oriented sectors such as utilities, which have performed well in recent years.
MARKET ENVIRONMENT
Economic conditions were mostly favorable in the first half of 2005. Although the manufacturing sector decelerated somewhat, the economy continued to expand at a steady pace. New job growth continued at a reasonable rate, the unemployment rate hovered slightly above 5%, and inflation remained contained, despite surging oil prices.
Relatively low interest rates continued to provide a stimulus to the economy. Although short-term bond yields increased as the Federal Reserve raised the fed funds target rate from 2.25% to 3.25%, long-term interest rates unexpectedly declined. The result was a “flattening” of the Treasury yield curve, that is, the difference between short- and long-term Treasury yields narrowed. This situation can sometimes foreshadow an economic slowdown but so far there has been little impact to corporate earnings, and balance sheets appear to be extremely healthy as businesses remain focused on controlling costs and maximizing productivity.
After starting the year with modest gains, U.S. stocks declined sharply in March and April amid fears of slower economic growth accompanied by higher inflation. However, Federal Reserve officials eased investor worries by asserting that the economy was on a “reasonably firm footing” and that “underlying inflation remains contained.” Brisk merger activity and generally favorable corporate earnings news helped lift stocks in the second quarter, though a late-June spike in oil prices and the likelihood that the central bank would continue raising short-term interest rates appeared to cap the market’s advance.
| Periods Ended | 6 | 12 | 3 | 5 |
| 6/30/05 | Months | Months | Years | Years |
| Russell Midcap | | | | |
| Growth Index | 1.70% | 10.86% | 51.53% | -23.55% |
| Russell Midcap | | | | |
| Value Index | 5.51 | 21.80 | 58.31 | 99.96 |
| Cumulative returns. | | | | |
Mid-caps continued to inhabit the sweet spot in the market, outperforming both large- and small-cap stocks. Within the mid-cap universe, value stocks maintained their dominance over growth during the last six months, as shown in the accompanying table. It has now been more than five years since the technology bubble burst, and during this stretch we have experienced a number of economic and geopolitical shocks, including terrorist attacks, wars in Afghanistan and Iraq, recession, corporate scandals, and surging oil prices. In times of uncertainty, it is not surprising that investors would avoid riskier market segments and seek out less aggressive alternatives. What is surprising is the magnitude of the swing toward value, especially in our mid-cap segment: the Russell Midcap Value Index has virtually doubled over the past five years while the Russell Midcap Growth Index has lost nearly a quarter of its value. While we can’t predict when balance will be restored between growth and value, it is clear that the long-term outperformance of value stocks has—somewhat paradoxically—left growth stocks more attractively valued.
PORTFOLIO REVIEW
Energy and financial stocks were the top contributors to the portfolio in the first half of 2005 while some of our health care and consumer holdings lagged.
Given the surge in oil prices, from $43 at the beginning of the year to more than $60 in late June, it is not surprising that several of our energy producers were among the portfolio’s top contributors in the first half of the year. EOG Resources, Murphy Oil, and XTO Energy all experienced rapid earnings growth amid the best industry backdrop in more than two decades. The stocks of energy service holdings Smith International and BJ Services also performed well.
| Percent of | Percent of |
| Net Assets | Net Assets |
| | 12/31/04 | 6/30/05 |
| Information Technology | 25.2% | 24.5% |
| Health Care | 19.2 | 18.1 |
| Consumer Discretionary | 15.2 | 18.0 |
| Industrials and Business Services | 13.1 | 13.5 |
| Financials | 9.2 | 9.4 |
| Energy | 6.8 | 7.2 |
| Telecommunications Services | 3.3 | 2.8 |
| Consumer Staples | 1.8 | 1.5 |
| Materials | 2.6 | 0.6 |
| Utilities | 0.0 | 0.0 |
| Other and Reserves | 3.6 | 4.4 |
| Total | 100.0% | 100.0% |
| Historical weightings reflect current industry/sector classifications. |
Two financial stocks were among our best contributors. Discount brokerage firm AmeriTrade gained on its merger announcement with TD Waterhouse. The combination should create a powerful franchise in asset gathering and online brokerage, and significant scale economies should drive enhanced profit growth. Legg Mason surged after its decision to swap its brokerage unit for Citigroup’s asset management division. With Citigroup under pressure to divest its asset management business, we think Legg Mason purchased this business advantageously.
The telecommunications services sector was another key contributor during the period. Wireless services were the primary source of strength as continued subscriber growth and industry consolidation benefited our holdings. Rogers Communications, the Canadian cable and wireless operator, announced a series of strategic moves that positions it well to capture a greater share of consumer demand for video, data, and telephone services. Nextel Partners is generating strong growth in under-penetrated, mid-size, and rural U.S. markets, and with the pending acquisition of Nextel by Sprint, is likely to be acquired by the combined entity. The portfolio sold its shares of Western Wireless, another rural wireless firm and a longtime holding, after it announced its sale to Alltel. Wireless companies have been huge winners for us over the long term, but most mid-cap players have now been purchased. We continue to participate in the industry through Rogers, Nextel Partners, Telus (a second Canadian wireless and wireline company), and Crown Castle, a tower company that hosts many of the carriers’ cell sites.
Health care stocks generally hurt our portfolio in the first half, but there were exceptions. Omnicare, which is the leading provider of pharmacy services to long-term care facilities, rebounded from weakness in 2004 to be the portfolio’s third-best contributor. The company’s business appears to be stabilizing and margins are improving. As we said in our last report, despite some difficulties relating to restrictions on government reimbursement and heightened competition from smaller firms, we like Omnicare’s experienced management and strong business model.
Other health care holdings—especially pharmaceuticals—weighed on performance, however. Elan was our largest detractor after it voluntarily recalled its multiple sclerosis drug, Tysabri. Two patients died from a rare disease that may have been triggered by the drug. Tysabri was expected to be a blockbuster drug, and we believe that it still has reasonable potential to return to the market. We added to our Elan holdings. Other detractors included wound-care company Kinetic Concepts and biotechs Eyetech Pharmaceuticals and Cephalon. Kinetic Concepts was a big winner for the portfolio in 2004, but growth has slowed of late and the stock has drifted lower. Eyetech declined sharply as data began to emerge that a competing drug currently in development may be more effective than Eyetech’s treatment for age-related macular degeneration. We eliminated our position in the second quarter. Cephalon’s stock was weak as investors fretted about patent challenges to an important drug, Provigil. However, the company has a rich product pipeline, and we think it will do well even without Provigil, though we do not think Cephalon’s losing the patent case is the foregone conclusion that the stock’s valuation seems to suggest. We maintain our positive view on the company.
Several of our consumer holdings lagged. Garmin, a leader in global positioning system (GPS) products, declined on concerns about increased competition. We think there’s room for several players in this fast-growing sector. The company’s fundamentals are intact, and we maintained our position. Boat maker Brunswick fell on concerns of a slowdown in consumer spending. However, we believe the company’s innovative engine technology and solid dealer network will allow it to continue to capture market share. Another laggard was Family Dollar Stores, which struggled as high gas prices particularly hurt its lower-income customers. Citadel Broadcasting also fell. Radio stocks continue to languish because of a sluggish recovery in advertising spending. The Internet appears to be siphoning off some advertisers, and portable digital entertainment alternatives such as satellite radio and iPods seem to be harming radio more rapidly than we anticipated.
As we mentioned in our letter six months ago, we began to reduce the portfolio’s cyclical tilt in late 2004 as the economic recovery matured. In 2005, we have continued to lower our cyclical bias by eliminating two very successful investments—Potash Corp., a fertilizer company that has benefited from particularly strong price increases triggered by a significant upsurge in demand for potash, and steel maker Nucor, a well-run company that maintained positive earnings in the downturn and benefited nicely during the steel recovery. International steel prices have fallen and the global steel cycle may be peaking.
INVESTMENT STRATEGY AND OUTLOOK
While the stock market basically treaded water in the first half of 2005, there were surprises: long-term interest rates fell in spite of continuing Federal Reserve tightening; energy prices pressed ever higher; and the dollar reversed its three-year decline against the euro. Nevertheless, our investment outlook has not shifted significantly from the beginning of the year. While we select stocks using a fundamental, bottom-up approach, our portfolio positioning does implicitly reflect our perspective on certain macro issues, and it is worth noting several investment views that currently influence our portfolio.
In the last few months, concerns about a real estate bubble have been amply aired in the press. The term “bubble” connotes extreme overvaluation, and this probably overstates the reality of residential real estate in the United States. However, there is plenty of evidence that this market is frothy: interest-only, adjustable-rate mortgages are commonplace; a disproportionate number of purchases are being made for investment purposes or for second homes; anecdotal evidence of rabid speculation in condos abounds; and billboards along interstate highways, which a few years ago advertised cell phones and Internet connectivity, now trumpet new home developments, mortgage brokers, and real estate agencies. Investors who were burned by technology stocks five years ago are flocking to real estate, secure in the belief that home prices rarely fall. The current situation reminds us of a white-hot IPO market: it’s fun while it lasts, every participant knows it will end, and everyone is sure they’ll be out before the music stops.
Real estate speculation is a natural outgrowth of the Federal Reserve’s easy money policy that was intended to cushion the collapse of the Internet stock bubble (and that was a bubble). The appreciation of residential real estate has contributed to an asset-based savings mindset. A generation ago, many Americans would buy a home by putting 20% equity down and financing the rest with a 30-year, fixed-rate mortgage. They would gradually pay down the mortgage and increase their equity. At the same time, they were saving 10% to 12% of their paychecks. Today, a new homeowner is more likely to buy a home with little or no equity, and repeatedly refinance the mortgage to cash out equity appreciation as the home’s value rises. In further contrast to earlier years, Americans today are saving almost none of their income, and if their leveraged assets such as homes continue to appreciate, painlessly saving for them, why should they?
This new philosophy toward real estate, debt, and savings has two underpinnings: low and declining interest rates, and rising home prices. This can’t and won’t last forever. While low rates may or may not persist, asset classes don’t appreciate at high rates forever. If the residential real estate market even stagnates, rather than falls, consumers will be unable to sustain their pace of spending. And if asset inflation stalls for a long period, the personal savings rate will have to rise, further cutting into consumer spending.
The Fed does appear to be concerned about real estate. Although higher energy prices have caused reported inflation measures to rise slightly, inflation in most goods and services remains modest. Nevertheless, the Fed has raised short-term rates steadily to a point we would consider “normal” at this point in the economic cycle. Additional increases are likely, in our view, as the Fed tries to dampen real estate speculation. Regulators are also tightening standards by encouraging financial institutions to be more discerning in their loans, particularly in home equity lines of credit, mortgages, and credit card receivables.
From a practical standpoint, how do our views affect the composition of the portfolio? We remain leery of home-builders and other housing-related stocks. We are somewhat cautious on the consumer sector, though we like selected issues.
We also generally think that financial issues have benefited from lower rates and now bask in credit conditions that get no better. We need to plumb the deep recesses of our memories to recall the last time investors were concerned about credit card or mortgage delinquencies. Our financial holdings are inordinately skewed toward investment management companies and discount brokers, many of which were added to the portfolio during the bear market several years ago. If the bull market in these issues persists, we may have to begin to pare back some of these holdings.
As we said at year-end, a plausible and bullish longer-term scenario for the American economy would be a gradual shift from its dependency on the consumer to growth predicated on a revival of business capital investment. U.S. companies certainly have the wherewithal to drive this process as balance sheets are in the best condition we’ve seen in many years and cash balances are particularly high. We have significant holdings in a number of industrial companies that would benefit from such a trend, though the recent upward trend in the dollar could temporarily interrupt their progress. Our holdings in the technology sector should benefit from increased capital spending too, and our weighting in this sector is higher than at any point in recent years. While we think many tech stocks are reasonably attractive, this sector moves quickly based on small shifts in investor sentiment, and our conviction in the long term is less fervent.
It is worth noting our views on energy in the context of business spending. We were early in identifying energy as having significant growth potential when we raised our sector exposure back in 2001 and 2002. In the second half of 2004 and early 2005, we pared our holdings somewhat, feeling that the stocks had appreciated too far, too quickly. However, as the price of oil and gas has continued to rise, this decision has proved to be a mistake.
Longer-term, it’s hard to conjure up a scenario where energy prices revert to the low levels of the last two decades. Even if demand from developing nations such as India and China grows much more slowly in the next five to 10 years than it has in the last five, the world’s ability to produce adequate supplies of hydrocarbons will be challenged. Many of the world’s major fields are mature and have declining production profiles. The global energy industry underinvested during the prolonged period of low energy prices, and significant capital will be needed to meet global energy needs. Producers are beginning to respond, but there should be years of opportunity for companies that are able to conduct productive exploration and development programs, and for those that provide value-added services to producers. This could be one of the longest secular investment themes in our portfolio. Nevertheless, investors are increasingly pricing in optimism, and even though we believe strongly in the long-term secular thesis, short-term cyclical factors (or even a warm winter) could quickly cool investors’ ardor. We are inclined to wait for a cyclical interruption in the long-term uptrend to reestablish an overweight position in energy.
Small- and mid-cap stocks tend to experience long periods of out- and underperformance relative to their large-cap brethren. The current mid-cap outperformance cycle began in April 1999 and now slightly exceeds the average duration for an upcycle. Many believe that this period of small- and mid-cap outperformance is about to reverse, and they may be right. However, it is worth noting that some cycles have lasted considerably longer than six years (1973-1983, for example); the annualized outperformance by mid-caps relative to large-caps this cycle has been well below average; mid-caps trade at only a modest premium to large-caps (well within normal parameters, in our opinion); and the speculative fervor that often signals a subsequent change in leadership seems absent.
Within the U.S. stock market, the most significant anomaly we see is the relationship between growth and value stocks. Across the entire capitalization spectrum, growth appears uncommonly cheap relative to value. This is probably a natural reaction to the carnage of the post-bubble bear market, but for those willing to take slightly more risk, the opportunity appears significant.
There are many cross-currents in the present environment and in the mid-cap growth sector specifically, but we are optimistic your portfolio is well positioned for the long term. We appreciate your continued confidence in T. Rowe Price.
Respectfully submitted,

Brian W.H. Berghuis
President of the portfolio and chairman of its Investment Advisory Committee

John F. Wakeman
Executive vice president of the portfolio
July 21, 2005
The committee chairman has day-to-day responsibility for managing the portfolio and works with committee members in developing and executing the portfolio’s investment program.
As with all stock and bond mutual funds, the portfolio’s share price can fall because of weakness in the stock or bond markets, a particular industry, or specific holdings. The financial markets can decline for many reasons, including adverse political or economic developments, changes in investor psychology, or heavy institutional selling. The prospects for an industry or company may deteriorate because of a variety of factors, including disappointing earnings or changes in the competitive environment. In addition, the investment manager’s assessment of companies held in a fund may prove incorrect, resulting in losses or poor performance even in rising markets. The stocks of mid-cap companies entail greater risk and are usually more volatile than the shares of larger companies. In addition, growth stocks can be volatile for several reasons. Since they usually reinvest a high proportion of earnings in their own businesses, they may lack the dividends usually associated with value stocks that can cushion their decline in a falling market. Also, since investors buy these stocks because of their expected superior earnings growth, earnings disappointments often result in sharp price declines.
Lipper indexes: Fund benchmarks that consist of a small number of the largest mutual funds in a particular category as tracked by Lipper Inc.
S&P 500 Stock Index: An unmanaged index that tracks the stocks of 500 primarily large-cap U.S. companies.
S&P MidCap 400 Index: An unmanaged index that tracks the stocks of 400 mid-cap U.S. companies.
Russell Midcap Growth Index: An unmanaged index that measures the performance of Russell Midcap companies with higher price-to-book ratios and higher forecasted growth values.
Russell Midcap Value Index: An unmanaged index that measures the performance of Russell Midcap companies with lower price-to-book ratios and lower forecasted growth values.
Portfolio Highlights
| Twenty-Five Largest Holdings |
| | Percent of |
| | Net Assets |
| | 6/30/05 |
| Omnicare | 1.6% |
| Rockwell Collins | 1.5 |
| Roper Industries | 1.4 |
| MedImmune | 1.3 |
| Murphy Oil | 1.3 |
| Harris | 1.3 |
| BJ Services | 1.2 |
| Best Buy | 1.2 |
| EOG Resources | 1.2 |
| AmeriTrade | 1.2 |
| Manor Care | 1.2 |
| Alliant Techsystems | 1.2 |
| Fairmont Hotels | 1.1 |
| Certegy | 1.1 |
| Rogers Communications | 1.1 |
| VeriSign | 1.1 |
| ChoicePoint | 1.1 |
| Smith International | 1.1 |
| Gilead Sciences | 1.1 |
| Assurant | 1.1 |
| XTO Energy | 1.0 |
| Nextel Partners | 1.0 |
| Brunswick | 1.0 |
| IVAX | 1.0 |
| Laboratory Corporation of America | 1.0 |
| Total | 29.4% |
| Note: Table excludes investments in the T. Rowe Price Reserve Investment Fund. |
| |
Portfolio Highlights
| Contributions to the Change in Net Asset Value Per Share |
| 6 Months Ended 6/30/05 |
| BEST CONTRIBUTORS | | | WORST CONTRIBUTORS | |
| EOG Resources | 10¢ | | Elan | -10¢ |
| Murphy Oil | 7 | | Citadel Broadcasting | -7 |
| Omnicare | 7 | | Garmin | -6 |
| AmeriTrade | 7 | | Kinetic Concepts | -5 |
| Legg Mason | 7 | | Cephalon | -4 |
| Rockwell Collins | 6 | | Manpower | -4 |
| IVAX | 6 | | Eyetech Pharmaceuticals** | -4 |
| XTO Energy | 6 | | ChoicePoint | -4 |
| Nextel Partners | 6 | | Waddell & Reed Financial | -4 |
| Western Wireless** | 5 | | Valeant Pharmaceuticals | -4 |
| Total | 67¢ | | Total | -52¢ |
| 12 Months Ended 6/30/05 |
| |
| BEST CONTRIBUTORS | | | WORST CONTRIBUTORS | |
| Potash Corp./Saskatchewan** | 14¢ | | Elan* | -10¢ |
| EOG Resources | 13 | | ImClone Systems** | -7 |
| Diamond Offshore Drilling** | 12 | | Cott | -6 |
| Rockwell Collins | 11 | | Manpower | -6 |
| AmeriTrade | 11 | | Cephalon | -5 |
| Rogers Communications | 11 | | Citadel Broadcasting | -4 |
| McAfee | 10 | | ChoicePoint | -4 |
| Murphy Oil | 10 | | Red Hat | -4 |
| Legg Mason | 9 | | JetBlue Airways | -4 |
| XTO Energy | 9 | | Ceridian** | -4 |
| Total | 110¢ | | Total | -54¢ |
| * Position added | | | | |
| ** Position eliminated | | | | |
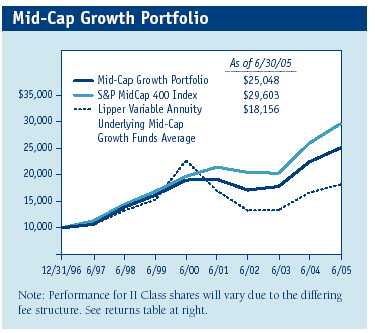
This chart shows the value of a hypothetical $10,000 investment in the fund over the past 10 fiscal year periods or since inception (for funds lacking 10-year records). The result is compared with benchmarks, which may include a broad-based market index and a peer group average or index. Market indexes do not include expenses, which are deducted from fund returns as well as mutual fund averages and indexes.
| Average Annual Compound Total Return |
| Periods Ended | | | Since | Inception |
| 6/30/05 | 1 Year | 5 Years | Inception | Date |
| |
| Mid-Cap Growth | | | | |
| Portfolio | 11.71% | 5.69% | 11.42% | 12/31/96 |
| S&P MidCap 400 Index | 14.03 | 8.49 | 13.63 | – |
| Russell Midcap | | | | |
| Growth Index | 10.86 | -5.23 | 7.67 | – |
| Lipper Variable | | | | |
| Annuity Underlying | | | | |
| Mid-Cap Growth | | | | |
| Funds Average | 8.59 | -5.24 | 6.91 | – |
| Mid-Cap Growth | | | | |
| Portfolio–II | 11.49% | – | 9.44% | 4/30/02 |
| S&P MidCap 400 Index | 14.03 | – | 9.17 | – |
| Russell Midcap | | | | |
| Growth Index | 10.86 | – | 8.85 | – |
| Lipper Variable | | | | |
| Annuity Underlying | | | | |
| Mid-Cap Growth | | | | |
| Funds Average | 8.59 | – | 6.20 | – |
| Current performance may be higher or lower than the quoted past per- |
| formance, which cannot guarantee future results. Share price, principal |
| value, and return will vary, and you may have a gain or loss when you |
| sell your shares. For the most recent month-end performance informa- |
| tion, please visit our Web site (troweprice.com) or contact a T. Rowe |
| Price representative at 1-800-469-5304. |
| This table shows how the portfolios would have performed each year if their |
| actual (or cumulative) returns for the periods shown had been earned at a |
| constant rate. Average annual total return figures include changes in principal |
| value, reinvested dividends, and capital gain distributions. Returns do not |
| reflect taxes that the shareholder may pay on distributions or the redemption |
| of shares. Total returns do not include charges imposed by your insurance |
| company’s separate account. If these were included, performance would |
| have been lower. When assessing performance, investors should consider |
| both short- and long-term returns. |
Fund Expense Example
As a mutual fund shareholder, you may incur two types of costs: (1) transaction costs such as redemption fees or sales loads and (2) ongoing costs, including management fees, distribution and service (12b-1) fees, and other fund expenses. The following example is intended to help you understand your ongoing costs (in dollars) of investing in the fund and to compare these costs with the ongoing costs of investing in other mutual funds. The example is based on an investment of $1,000 invested at the beginning of the most recent six-month period and held for the entire period.
Shares of the fund are currently offered only through certain insurance companies as an investment medium for both variable annuity contracts and variable life insurance policies. Please note that the fund has two classes of shares: the original share class and II class. II class shares are sold through financial intermediaries, which are compensated for distribution, shareholder servicing, and/or certain administrative services under a Board-approved Rule 12b-1 plan.
Actual Expenses
The first line of the following table (“Actual”) provides information about actual account values and actual expenses. You may use the information in this line, together with your account balance, to estimate the expenses that you paid over the period. Simply divide your account value by $1,000 (for example, an $8,600 account value divided by $1,000 = 8.6), then multiply the result by the number in the first line under the heading “Expenses Paid During Period” to estimate the expenses you paid on your account during this period.
Hypothetical Example for Comparison Purposes
The information on the second line of the table (“Hypothetical”) is based on hypothetical account values and expenses derived from the fund’s actual expense ratio and an assumed 5% per year rate of return before expenses (not the fund’s actual return). You may compare the ongoing costs of investing in the fund with other funds by contrasting this 5% hypothetical example and the 5% hypothetical examples that appear in the shareholder reports of the other funds. The hypothetical account values and expenses may not be used to estimate the actual ending account balance or expenses you paid for the period.
You should also be aware that the expenses shown in the table highlight only your ongoing costs and do not reflect any transaction costs, such as redemption fees or sales loads. Therefore, the second line of the table is useful in comparing ongoing costs only, and will not help you determine the relative total costs of owning different funds. To the extent a fund charges transaction costs, however, the total cost of owning that fund is higher.
| T. Rowe Price Mid-Cap Growth Portfolio |
| | | | Expenses |
| | Beginning | Ending | Paid During |
| | Account | Account | Period* |
| | Value | Value | 1/1/05 to |
| | 1/1/05 | 6/30/05 | 6/30/05 |
| |
| Mid-Cap Growth Portfolio | | | |
| Actual | $1,000.00 | $1,017.00 | $4.25 |
| Hypothetical (assumes | | | |
| 5% return before | | | |
| expenses) | 1,000.00 | 1,020.58 | 4.26 |
| |
| Mid-Cap Growth Portfolio – II | | |
| Actual | 1,000.00 | 1,015.80 | 5.50 |
| Hypothetical (assumes | | | |
| 5% return before | | | |
| expenses) | 1,000.00 | 1,019.34 | 5.51 |
| |
| *Expenses are equal to the fund’s annualized expense ratio for the six-month |
| period, multiplied by the average account value over the period, multiplied by |
| the number of days in the most recent fiscal half year (181) divided by the |
| days in the year (365) to reflect the half year period. The annualized expense |
| ratio of the Mid-Cap Growth Portfolio was 0.85%, the Mid-Cap Growth |
| Portfolio–II was 1.10%. | | | |
Financial Highlights
Unaudited
| For a share outstanding throughout each period |
| |
| Mid-Cap Growth Class | | | | | | | | | | | | |
| | 6 Months | | Year | | | | | | | | |
| | | Ended | | Ended | | | | | | | | |
| | | 6/30/05** | 12/31/04 | 12/31/03 | 12/31/02 | 12/31/01 | 12/31/00 |
| NET ASSET VALUE | | | | | | | | | | | | |
| Beginning of period | $ | 23.55 | $ | 19.90 | $ | 14.38 | $ | 18.26 | $ | 18.43 | $ | 17.46 |
|
|
| Investment activities | | | | | | | | | | | | |
| Net investment income (loss) | | (0.03) | | (0.09) | | (0.06) | | (0.08) | | (0.05) | | – |
| Net realized and unrealized | | | | | | | | | | | | |
| gain (loss) | | 0.43 | | 3.74 | | 5.58 | | (3.80) | | (0.12) | | 1.29 |
|
|
| Total from investment activities | | 0.40 | | 3.65 | | 5.52 | | (3.88) | | (0.17) | | 1.29 |
|
|
| Distributions | | | | | | | | | | | | |
| Net realized gain | | – | | – | | – | | – | | – | | (0.32) |
|
|
| |
| NET ASSET VALUE | | | | | | | | | | | | |
| End of period | $ | 23.95 | $ | 23.55 | $ | 19.90 | $ | 14.38 | $ | 18.26 | $ | 18.43 |
|
|
| |
| Ratios/Supplemental Data | | | | | | | | | | | | |
| Total return^ | | 1.70% | | 18.34% | | 38.39% | | (21.25)% | | (0.92)% | | 7.41% |
| Ratio of total expenses to average | | | | | | | | | | | | |
| net assets | | 0.85%† | | 0.85% | | 0.85% | | 0.85% | | 0.85% | | 0.85% |
| Ratio of net investment income | | | | | | | | | | | | |
| (loss) to average net assets | | (0.29)%† | | (0.41)% | | (0.43)% | | (0.48)% | | (0.29)% | | (0.01)% |
| Portfolio turnover rate | | 24.3%† | | 31.0% | | 32.6% | | 33.7% | | 41.8% | | 46.3% |
| Net assets, end of period | | | | | | | | | | | | |
| (in thousands) | $ | 592,128 | $ | 598,124 | $ | 485,700 | $ | 298,288 | $ | 350,094 | $ | 311,604 |
| ** | Per share amounts calculated using average daily shares outstanding method. |
| ^ | Total return reflects the rate that an investor would have earned on an investment in the fund during |
| | each period, assuming reinvestment of all distributions |
| † | Annualized |
The accompanying notes are an integral part of these financial statements.
| |
| |
| Mid-Cap Growth–II Class | | | | | | | | |
| | 6 Months | | Year | | | | 4/30/02 |
| | | Ended | | Ended | | | Through |
| | | 6/30/05** | 12/31/04 | 12/31/03 | 12/31/02 |
| NET ASSET VALUE | | | | | | | | |
| Beginning of period | $ | 23.41 | $ | 19.83 | $ | 14.36 | $ | 17.87 |
|
|
| Investment activities | | | | | | | | |
| Net investment income (loss) | | (0.06) | | (0.14) | | (0.07) | | (0.02) |
| Net realized and unrealized gain (loss) | | 0.43 | | 3.72 | | 5.54 | | (3.49) |
|
|
| Total from investment activities | | 0.37 | | 3.58 | | 5.47 | | (3.51) |
|
|
| |
| NET ASSET VALUE | | | | | | | | |
| End of period | $ | 23.78 | $ | 23.41 | $ | 19.83 | $ | 14.36 |
|
|
| |
| Ratios/Supplemental Data | | | | | | | | |
| Total return^ | | 1.58% | | 18.05% | | 38.09% | | (19.64)% |
| Ratio of total expenses to average net assets | | 1.10%† | | 1.10% | | 1.10% | | 1.10%† |
| Ratio of net investment income (loss) to average | | | | | | | | |
| net assets | | (0.54)%† | | (0.65)% | | (0.64)% | | (0.63)%† |
| Portfolio turnover rate | | 24.3%† | | 31.0% | | 32.6% | | 33.7% |
| Net assets, end of period (in thousands) | $ | 49,694 | $ | 59,768 | $ | 38,263 | $ | 3,988 |
| ** | Per share amounts calculated using average daily shares outstanding method. |
| ^ | Total return reflects the rate that an investor would have earned on an investment in the fund |
| | during each period, assuming reinvestment of all distributions |
| † | Annualized |
The accompanying notes are an integral part of these financial statements.
Portfolio of Investments (1)
(Unaudited)
| | Shares | Value |
| (Cost and value in $ 000s) | | |
| |
| COMMON STOCKS 95.6% | | |
| |
| CONSUMER DISCRETIONARY 18.0% | |
| Auto Components 1.5% | | |
| Gentex | 304,000 | 5,533 |
| TRW * | 161,000 | 3,946 |
| | | 9,479 |
| Diversified Consumer Services 1.1% | |
| Apollo Group, Class A * | 36,000 | 2,816 |
| Education Management * | 118,000 | 3,980 |
| | | 6,796 |
| Hotels, Restaurants & Leisure 2.2% | |
| Fairmont Hotels | 210,000 | 7,314 |
| PF Chang’s China Bistro * | 46,000 | 2,713 |
| The Cheesecake Factory * | 119,000 | 4,133 |
| | | 14,160 |
| Household Durables 1.2% | | |
| Garmin | 86,000 | 3,677 |
| Harman International | 53,000 | 4,312 |
| | | 7,989 |
| Internet & Catalog Retail 0.5% | | |
| Amazon.com * | 99,000 | 3,275 |
| | | 3,275 |
| Leisure Equipment & Products 1.0% | |
| Brunswick | 151,000 | 6,541 |
| | | 6,541 |
| Media 4.8% | | |
| Catalina Marketing | 136,000 | 3,456 |
| Citadel Broadcasting * | 392,000 | 4,488 |
| Cox Radio, Class A * | 114,000 | 1,796 |
| Dreamworks Animation | | |
| Class A * | 87,000 | 2,279 |
| Entercom Communications * | 40,000 | 1,332 |
| Getty Images * | 24,000 | 1,782 |
| Rogers Communications, Class B | 218,000 | 7,168 |
| Scholastic * | 54,000 | 2,082 |
| Univision Communications | | |
| Class A * | 164,000 | 4,518 |
| XM Satellite Radio Holdings | | |
| Class A * | 61,000 | 2,053 |
| | | 30,954 |
| Multiline Retail 1.2% | | |
| Dollar General | 161,000 | 3,278 |
| Family Dollar Stores | 178,000 | 4,646 |
| | | 7,924 |
| Specialty Retail 4.5% | | |
| Best Buy | 116,000 | 7,952 |
| CarMax * | 90,000 | 2,399 |
| O’Reilly Automotive * | 151,000 | 4,501 |
| PETsMART | 187,000 | 5,675 |
| Ross Stores | 143,000 | 4,134 |
| Williams-Sonoma * | 100,000 | 3,957 |
| | | 28,618 |
| Total Consumer Discretionary | | 115,736 |
| |
| CONSUMER STAPLES 1.5% | | |
| Beverages 0.6% | | |
| Cott * | 186,000 | 4,061 |
| | | 4,061 |
| Food & Staples Retailing 0.9% | | |
| Shoppers Drug Mart (CAD) | 82,000 | 2,843 |
| Whole Foods Market | 23,000 | 2,721 |
| | | 5,564 |
| Total Consumer Staples | | 9,625 |
| |
| ENERGY 7.2% | | |
| Energy Equipment & Services 3.0% | |
| BJ Services | 152,000 | 7,977 |
| FMC Technologies * | 135,000 | 4,316 |
| Smith International | 109,000 | 6,943 |
| | | 19,236 |
| Oil, Gas & Consumable Fuels 4.2% | | |
| EOG Resources | 139,000 | 7,895 |
| Murphy Oil | 159,000 | 8,305 |
| Western Gas Resources | 112,000 | 3,909 |
| XTO Energy | 196,000 | 6,662 |
| | | 26,771 |
| Total Energy | | 46,007 |
| |
| FINANCIALS 9.4% | | |
| Capital Markets 5.0% | | |
| AmeriTrade * | 405,000 | 7,529 |
| E*TRADE Financial * | 278,000 | 3,889 |
| Eaton Vance | 185,000 | 4,423 |
| Federated Investors, Class B | 75,000 | 2,251 |
| Investors Financial Services | 27,000 | 1,021 |
| John Nuveen | 93,000 | 3,499 |
| Legg Mason | 58,000 | 6,039 |
| Waddell & Reed Financial | | |
| Class A | 198,000 | 3,663 |
| | | 32,314 |
| Commercial Banks 0.2% | | |
| SVB Financial Group * | 30,000 | 1,437 |
| | | 1,437 |
| Consumer Finance 0.6% | | |
| Moneygram International | 201,000 | 3,843 |
| | | 3,843 |
| Diversified Financial Services 1.2% | |
| CapitalSource * | 172,000 | 3,376 |
| Principal Financial Group | 100,000 | 4,190 |
| | | 7,566 |
| Insurance 2.4% | | |
| Assurant | 191,000 | 6,895 |
| Axis Capital Holdings | 97,000 | 2,745 |
| Protective Life | 48,000 | 2,026 |
| Willis Group Holdings | 105,000 | 3,436 |
| | | 15,102 |
| Total Financials | | 60,262 |
| |
| HEALTH CARE 18.1% | | |
| Biotechnology 5.5% | | |
| Abgenix * | 111,000 | 952 |
| Alkermes * | 145,000 | 1,917 |
| Amylin Pharmaceuticals * | 77,000 | 1,612 |
| Celgene * | 58,000 | 2,365 |
| Cephalon * | 110,000 | 4,379 |
| Gilead Sciences * | 157,000 | 6,906 |
| Human Genome Sciences * | 120,000 | 1,390 |
| MedImmune * | 318,000 | 8,497 |
| Neurocrine Biosciences * | 60,000 | 2,523 |
| OSI Pharmaceuticals * | 24,000 | 981 |
| Protein Design Labs * | 88,000 | 1,778 |
| Vertex Pharmaceuticals * | 107,000 | 1,802 |
| | | 35,102 |
| Health Care Equipment & Supplies 2.9% | |
| Bausch & Lomb | 24,000 | 1,992 |
| Edwards Lifesciences * | 102,000 | 4,388 |
| Gen-Probe * | 56,000 | 2,029 |
| INAMED * | 25,000 | 1,674 |
| Kinetic Concepts * | 71,000 | 4,260 |
| Varian Medical Systems * | 45,000 | 1,680 |
| Waters Corporation * | 70,000 | 2,602 |
| | | 18,625 |
| Health Care Providers & Services 6.1% | |
| Community Health System * | 110,000 | 4,157 |
| Coventry Health Care * | 46,000 | 3,254 |
| DaVita * | 43,000 | 1,956 |
| Health Management, Class A | 214,000 | 5,603 |
| Laboratory Corporation | | |
| of America * | 126,000 | 6,287 |
| Manor Care | 189,000 | 7,509 |
| Omnicare | 243,000 | 10,310 |
| | | 39,076 |
| Pharmaceuticals 3.6% | | |
| Andrx * | 118,000 | 2,397 |
| Barr Pharmaceuticals * | 122,000 | 5,946 |
| Elan ADR * | 296,000 | 2,019 |
| IVAX * | 298,000 | 6,407 |
| Sepracor * | 57,000 | 3,421 |
| Taro Pharmaceuticals * | 62,000 | 1,802 |
| Valeant Pharmaceuticals | 86,000 | 1,516 |
| | | 23,508 |
| Total Health Care | | 116,311 |
| |
| INDUSTRIALS & BUSINESS SERVICES 13.5% | |
| Aerospace & Defense 3.2% | | |
| Alliant Techsystems * | 106,000 | 7,484 |
| Goodrich | 83,000 | 3,400 |
| Rockwell Collins | 199,000 | 9,488 |
| | | 20,372 |
| Air Freight & Logistics 0.8% | | |
| C.H. Robinson Worldwide | 62,000 | 3,609 |
| Expeditors International | | |
| of Washington | 25,000 | 1,245 |
| | | 4,854 |
| Airlines 1.3% | | |
| JetBlue Airways * | 152,000 | 3,107 |
| Southwest Airlines | 382,000 | 5,321 |
| | | 8,428 |
| Building Products 0.7% | | |
| American Standard | 115,000 | 4,821 |
| | | 4,821 |
| Commercial Services & Supplies 2.7% | |
| ChoicePoint * | 176,000 | 7,049 |
| Manpower | 144,000 | 5,728 |
| Robert Half International | 102,000 | 2,547 |
| Viad | 63,000 | 1,785 |
| | | 17,109 |
| Industrial Conglomerates 2.2% | | |
| Roper Industries | 128,000 | 9,135 |
| Teleflex | 84,000 | 4,987 |
| | | 14,122 |
| Machinery 2.5% | | |
| Danaher | 84,000 | 4,397 |
| ITT Industries | 61,000 | 5,955 |
| Oshkosh Truck | 74,000 | 5,793 |
| | | 16,145 |
| Trading Companies & Distributors 0.1% | |
| MSC Industrial Direct | 26,000 | 877 |
| | | 877 |
| Total Industrials & Business Services | 86,728 |
| |
| INFORMATION TECHNOLOGY 24.5% | |
| Communications Equipment 3.0% | | |
| ADTRAN | 188,000 | 4,660 |
| Comverse Technology * | 89,000 | 2,105 |
| Harris | 260,000 | 8,115 |
| Juniper Networks * | 100,000 | 2,518 |
| Research In Motion * | 27,000 | 1,991 |
| | | 19,389 |
| Computers & Peripherals 0.6% | | |
| Diebold | 82,000 | 3,699 |
| | | 3,699 |
| Electronic Equipment & Instruments 3.8% | |
| CDW | 84,000 | 4,796 |
| Cogent * | 46,100 | 1,316 |
| Dolby Laboratories, Class A * | 123,000 | 2,713 |
| Flextronics * | 419,000 | 5,535 |
| FLIR Systems * | 140,000 | 4,178 |
| Jabil Circuit * | 193,000 | 5,931 |
| | | 24,469 |
| Internet Software & Services 2.3% | | |
| CNET Networks * | 280,000 | 3,287 |
| Monster Worldwide * | 144,000 | 4,130 |
| VeriSign * | 248,000 | 7,133 |
| | | 14,550 |
| IT Services 5.3% | | |
| CACI International, Class A * | 74,000 | 4,674 |
| Certegy | 188,000 | 7,185 |
| Checkfree * | 99,000 | 3,372 |
| DST Systems * | 132,000 | 6,177 |
| Global Payments | 62,000 | 4,204 |
| Iron Mountain * | 192,000 | 5,956 |
| SunGard Data Systems * | 78,000 | 2,743 |
| | | 34,311 |
| Semiconductor & Semiconductor Equipment 4.5% | |
| AMIS Holdings * | 126,000 | 1,681 |
| Integrated Circuit Systems * | 126,000 | 2,601 |
| Intersil Holding, Class A | 261,000 | 4,899 |
| Marvell Technology Group * | 29,000 | 1,103 |
| Microchip Technology | 195,000 | 5,776 |
| Novellus Systems * | 185,000 | 4,571 |
| PMC-Sierra * | 195,000 | 1,819 |
| Semtech * | 119,000 | 1,981 |
| Xilinx | 175,000 | 4,463 |
| | | 28,894 |
| Software 5.0% | | |
| Activision * | 159,000 | 2,627 |
| Adobe Systems | 102,000 | 2,919 |
| Cadence Design Systems * | 352,000 | 4,808 |
| Intuit * | 41,000 | 1,850 |
| Jack Henry & Associates | 140,000 | 2,563 |
| Macromedia * | 35,000 | 1,338 |
| McAfee * | 233,000 | 6,100 |
| Mercury Interactive * | 76,000 | 2,915 |
| NAVTEQ * | 129,000 | 4,796 |
| Red Hat * | 175,000 | 2,293 |
| | | 32,209 |
| Total Information Technology | | 157,521 |
| |
| MATERIALS 0.6% | | |
| Metals & Mining 0.6% | | |
| Newmont Mining | 94,000 | 3,669 |
| Total Materials | | 3,669 |
| |
| TELECOMMUNICATION SERVICES 2.7% | |
| Diversified Telecommunication Services 0.7% | |
| Telus (CAD) | 132,000 | 4,637 |
| | | 4,637 |
| Wireless Telecommunication Services 2.0% | |
| Crown Castle International * | 302,000 | 6,137 |
| Nextel Partners, Class A * | 260,000 | 6,544 |
| | | 12,681 |
| Total Telecommunication Services | 17,318 |
| Total Miscellaneous Common Stocks 0.1% ** | 380 |
| | | |
| Total Common Stocks (Cost $441,763) | 613,557 |
| SHORT-TERM INVESTMENTS 4.6% | |
| Money Market Fund 4.6% | | |
| T. Rowe Price Government Reserve | |
| Investment Fund | | |
| 2.94% #† | 29,572,855 | 29,573 |
| Total Short-Term Investments | |
| (Cost $29,573) | | 29,573 |
| |
| Total Investments in Securities | |
| 100.2% of Net Assets (Cost $471,336) | $ 643,130 |
| (1) | Denominated in U.S. dollars unless otherwise noted |
| # | Seven-day yield |
| * | Non-income producing |
| ** | The identity of certain securities has been concealed to pro- |
| | tect the fund while it completes a purchase or selling pro- |
| | gram for the securities |
| † | Affiliated company – See Note 4. |
| ADR | American Depository Receipts |
| CAD | Canadian dollar |
The accompanying notes are an integral part of these financial statements.
Statement of Assets and Liabilities
(Unaudited)
(In thousands except shares and per share amounts)
| Assets | | |
| Investments in securities, at value | | |
| Affiliated companies (cost $29,573) | $ | 29,573 |
| Non-affiliated companies (cost $441,763) | | 613,557 |
|
|
| Total investments in securities | | 643,130 |
| Cash | | 39 |
| Dividends receivable | | 297 |
| Receivable for investment securities sold | | 621 |
| Receivable for shares sold | | 83 |
| Other assets | | 47 |
|
|
| Total assets | | 644,217 |
|
|
| |
| Liabilities | | |
| Payable for investment securities purchased | | 1,869 |
| Payable for shares redeemed | | 54 |
| Due to affiliates | | 472 |
|
|
| Total liabilities | | 2,395 |
|
|
| |
| NET ASSETS | $ | 641,822 |
|
|
| Net Assets Consist of: | | |
| Undistributed net investment income (loss) | $ | (981) |
| Undistributed net realized gain (loss) | | 22,842 |
| Net unrealized gain (loss) | | 171,794 |
| Paid-in-capital applicable to 26,808,400 shares of | | |
| $0.0001 par value capital stock outstanding; | | |
| 1,000,000,000 shares of the Corporation authorized | | 448,167 |
|
|
| |
| NET ASSETS | $ | 641,822 |
|
|
| NET ASSET VALUE PER SHARE | | |
| Mid-Cap Growth Class | | |
| ($592,128,034/24,719,069 shares outstanding) | $ | 23.95 |
|
|
| Mid-Cap Growth–II Class | | |
| ($49,694,250/2,089,331 shares outstanding) | $ | 23.78 |
|
|
The accompanying notes are an integral part of these financial statements.
Statement of Operations
(Unaudited)
($ 000s)
| | | 6 Months |
| | | Ended |
| | | 6/30/05 |
| Investment Income (Loss) | | |
| Dividend income | $ | 1,746 |
|
|
| Expenses | | |
| Investment management and administrative | | 2,660 |
| Rule 12b-1 fees - Mid-Cap Growth–II Class | | 67 |
|
|
| Total Expenses | | 2,727 |
|
|
| Net investment income (loss) | | (981) |
|
|
| Realized and Unrealized Gain (Loss) | | |
| Net realized gain (loss) on securities | | 34,394 |
|
|
| Change in net unrealized gain (loss) on securities | | (23,113) |
|
|
| Net realized and unrealized gain (loss) | | 11,281 |
|
|
| |
| INCREASE (DECREASE) IN NET | | |
| ASSETS FROM OPERATIONS | $ | 10,300 |
|
|
The accompanying notes are an integral part of these financial statements.
Statement of Changes in Net Assets
(Unaudited)
($ 000s)
| | | 6 Months | | Year |
| | | Ended | | Ended |
| | | 6/30/05 | | 12/31/04 |
| |
| Increase (Decrease) in Net Assets | | | | |
| Operations | | | | |
| Net investment income (loss) | $ | (981) | $ | (2,512) |
| Net realized gain (loss) | | 34,394 | | 28,256 |
| Change in net unrealized gain (loss) | | (23,113) | | 75,469 |
|
|
| Increase (decrease) in net assets from operations | | 10,300 | | 101,213 |
|
|
| Capital share transactions * | | | | |
| Shares sold | | | | |
| Mid-Cap Growth Class | | 17,565 | | 69,466 |
| Mid-Cap Growth–II Class | | 13,809 | | 30,649 |
| Shares redeemed | | | | |
| Mid-Cap Growth Class | | (33,157) | | (48,844) |
| Mid-Cap Growth–II Class | | (24,588) | | (18,554) |
|
|
| Increase (decrease) in net assets from | | | | |
| capital share transactions | | (26,371) | | 32,717 |
|
|
| |
| Net Assets | | | | |
| Increase (decrease) during period | | (16,071) | | 133,930 |
| Beginning of period | | 657,893 | | 523,963 |
|
|
| |
| End of period | $ | 641,822 | $ | 657,893 |
|
|
| (Including undistributed net investment income (loss) of $(981) at 6/30/05 |
| and $0 at 12/31/04) | | | | |
| |
| *Share information | | | | |
| Shares sold | | | | |
| Mid-Cap Growth Class | | 763 | | 3,329 |
| Mid-Cap Growth–II Class | | 603 | | 1,499 |
| Shares redeemed | | | | |
| Mid-Cap Growth Class | | (1,442) | | (2,341) |
| Mid-Cap Growth–II Class | | (1,067) | | (876) |
|
|
| Increase (decrease) in shares outstanding | | (1,143) | | 1,611 |
The accompanying notes are an integral part of these financial statements.
Notes to Financial Statements
(Unaudited)
NOTE 1 - SIGNIFICANT ACCOUNTING POLICIES
T. Rowe Price Equity Series, Inc. (the corporation) is registered under the Investment Company Act of 1940 (the 1940 Act). The Mid-Cap Growth Portfolio (the fund) is a diversified, open-end management investment company and is one portfolio established by the corporation. The fund seeks to provide long-term capital appreciation by investing in mid-cap stocks with potential for above-average earnings growth. Shares of the fund are currently offered only through certain insurance companies as an investment medium for both variable annuity contracts and variable life insurance policies. The fund has two classes of shares: the Mid-Cap Growth Portfolio original share class (Mid-Cap Growth class), offered since December 31, 1996, and Mid-Cap Growth Portfolio–II (Mid-Cap Growth–II class), offered since April 30, 2002. Mid-Cap Growth–II shares are sold through financial intermediaries, which it compensates for distribution, shareholder servicing, and/or certain administrative services under a Board-approved Rule 12b-1 plan. Each class has exclusive voting rights on matters related solely to that class, separate voting rights on matters that relate to both classes, and, in all other respects, the same rights and obligations as the other class.
The accompanying financial statements were prepared in accordance with accounting principles generally accepted in the United States of America, which require the use of estimates made by fund management. Fund management believes that estimates and security valuations are appropriate; however actual results may differ from those estimates, and the security valuations reflected in the financial statements may differ from the value the fund receives upon sale of the securities.
Valuation The fund values its investments and computes its net asset value per share at the close of the New York Stock Exchange (NYSE), normally 4 p.m. ET, each day that the NYSE is open for business. Equity securities listed or regularly traded on a securities exchange or in the over-the-counter market are valued at the last quoted sale price or, for certain markets, the official closing price at the time the valuations are made, except for OTC Bulletin Board securities, which are valued at the mean of the latest bid and asked prices. A security that is listed or traded on more than one exchange is valued at the quotation on the exchange determined to be the primary market for such security. Listed securities not traded on a particular day are valued at the mean of the latest bid and asked prices for domestic securities and the last quoted sale price for international securities. Investments in mutual funds are valued at the mutual fund’s closing net asset value per share on the day of valuation.
Other investments, including restricted securities, and those for which the above valuation procedures are inappropriate or are deemed not to reflect fair value are stated at fair value as determined in good faith by the T. Rowe Price Valuation Committee, established by the fund’s Board of Directors.
Most foreign markets close before the close of trading on the NYSE. If the fund determines that developments between the close of a foreign market and the close of the NYSE will, in its judgment, materially affect the value of some or all of its portfolio securities, which in turn will affect the fund’s share price, the fund will adjust the previous closing prices to reflect the fair value of the securities as of the close of the NYSE, as determined in good faith by the T. Rowe Price Valuation Committee, established by the fund’s Board of Directors. A fund may also fair value securities in other situations, such as when a particular foreign market is closed but the fund is open. In deciding whether to make fair value adjustments, the fund reviews a variety of factors, including developments in foreign markets, the performance of U.S. securities markets, and the performance of instruments trading in U.S. markets that represent foreign securities and baskets of foreign securities. The fund uses outside pricing services to provide it with closing market prices and information used for adjusting those prices. The fund cannot predict when and how often it will use closing prices and when it will adjust those prices to reflect fair value. As a means of evaluating its fair value process, the fund routinely compares closing market prices, the next day’s opening prices in the same markets, and adjusted prices.
Currency Translation Assets, including investments, and liabilities denominated in foreign currencies are translated into U.S. dollar values each day at the prevailing exchange rate, using the mean of the bid and asked prices of such currencies against U.S. dollars as quoted by a major bank. Purchases and sales of securities, income, and expenses are translated into U.S. dollars at the prevailing exchange rate on the date of the transaction. The effect of changes in foreign currency exchange rates on realized and unrealized security gains and losses is reflected as a component of security gains and losses.
Class Accounting Mid-Cap Growth–II pays distribution, shareholder servicing, and/or certain administrative expenses in the form of Rule 12b-1 fees, in an amount not exceeding 0.25% of the class’s average daily net assets. Management and administrative fee expenses, investment income, and realized and unrealized gains and losses are allocated to the classes based upon the relative daily net assets of each class.
Investment Transactions, Investment Income, and Distributions Income and expenses are recorded on the accrual basis. Dividends received from mutual fund investments are reflected as dividend income; capital gain distributions are reflected as realized gain/loss. Dividend income and capital gain distributions are recorded on the ex-dividend date. Investment transactions are accounted for on the trade date. Realized gains and losses are reported on the identified cost basis. Distributions to shareholders are recorded on the ex-dividend date. Income distributions are declared and paid by each class on an annual basis. Capital gain distributions, if any, are declared and paid by the fund, typically on an annual basis.
NOTE 2 - INVESTMENT TRANSACTIONS
Consistent with its investment objective, the fund engages in the following practices to manage exposure to certain risks or enhance performance. The investment objective, policies, program, and risk factors of the fund are described more fully in the fund’s prospectus and Statement of Additional Information.
Restricted Securities The fund may invest in securities that are subject to legal or contractual restrictions on resale. Although certain of these securities may be readily sold, for example, under Rule 144A, others may be illiquid, their sale may involve substantial delays and additional costs, and prompt sale at an acceptable price may be difficult.
Other Purchases and sales of portfolio securities, other than short-term securities, aggregated $73,932,000 and $106,151,000, respectively, for the six months ended June 30, 2005.
NOTE 3 - FEDERAL INCOME TAXES
No provision for federal income taxes is required since the fund intends to continue to qualify as a regulated investment company under Subchapter M of the Internal Revenue Code and distribute to shareholders all of its taxable income and gains. Federal income tax regulations differ from generally accepted accounting principles; therefore, distributions determined in accordance with tax regulations may differ in amount or character from net investment income and realized gains for financial reporting purposes. Financial reporting records are adjusted for permanent book/tax differences to reflect tax character. Financial records are not adjusted for temporary differences. The amount and character of tax-basis distributions and composition of net assets are finalized at fiscal year-end; accordingly, tax-basis balances have not been determined as of June 30, 2005.
The fund intends to retain realized gains to the extent of available capital loss carryforwards. As of December 31, 2004, the fund had $11,552,000 of unused capital loss carryforwards, of which $11,552,000 expire in 2010.
At June 30, 2005, the cost of investments for federal income tax purposes was $471,336,000. Net unrealized gain aggregated $171,794,000 at period-end, of which $190,145,000 related to appreciated investments and $18,351,000 related to depreciated investments.
NOTE 4 - RELATED PARTY TRANSACTIONS
The fund is managed by T. Rowe Price Associates, Inc. (the manager or Price Associates), a wholly owned subsidiary of T. Rowe Price Group, Inc. The investment management and administrative agreement between the fund and the manager provides for an all-inclusive annual fee equal to 0.85% of the fund’s average daily net assets. The fee is computed daily and paid monthly. The agreement provides that investment management, shareholder servicing, transfer agency, accounting, and custody services are provided to the fund, and interest, taxes, brokerage commissions, directors’ fees and expenses, and extraordinary expenses are paid directly by the fund.
The fund may invest in the T. Rowe Price Reserve Investment Fund and the T. Rowe Price Government Reserve Investment Fund (collectively, the Reserve Funds), open-end management investment companies managed by Price Associates and affiliates of the fund. The Reserve Funds are offered as cash management options to mutual funds, trusts, and other accounts managed by Price Associates and/or its affiliates, and are not available for direct purchase by members of the public. The Reserve Funds pay no investment management fees. During the six months ended June 30, 2005, dividend income from the Reserve Funds totaled $348,000, and the value of shares of the Reserve Funds held at June 30, 2005 and December 31, 2004 was $29,573,000 and $23,374,000, respectively.
| Information on Proxy Voting Policies, Procedures, and Records |
A description of the policies and procedures used by T. Rowe Price funds and portfolios to determine how to vote proxies relating to portfolio securities is available in each fund’s Statement of Additional Information, which you may request by calling 1-800-225-5132 or by accessing the SEC’s Web site, www.sec.gov. The description of our proxy voting policies and procedures is also available on our Web site, www.troweprice.com. To access it, click on the words “Company Info” at the top of our homepage for individual investors. Then, in the window that appears, click on the “Proxy Voting Policy” navigation button in the top left corner.
Each fund’s most recent annual proxy voting record is available on our Web site and through the SEC’s Web site. To access it through our Web site, follow the directions above, then click on the words “Proxy Voting Record” at the bottom of the Proxy Voting Policy page.
| How to Obtain Quarterly Portfolio Holdings |
The fund files a complete schedule of portfolio holdings with the Securities and Exchange Commission for the first and third quarters of each fiscal year on Form N-Q. The fund’s Form N-Q is available electronically on the SEC’s Web site (www.sec.gov); hard copies may be reviewed and copied at the SEC’s Public Reference Room, 450 Fifth St. N.W., Washington, DC 20549. For more information on the Public Reference Room, call 1-800-SEC-0330.
| Approval of Investment Management Agreement |
On March 2, 2005, the fund’s Board of Directors unanimously approved the investment advisory contract (“Contract”) between the fund and its investment manager, T. Rowe Price Associates, Inc. (“Manager”). The Board considered a variety of factors in connection with its review of the Contract, also taking into account information provided by the Manager during the course of the year, as discussed below:
Services Provided by the Manager
The Board considered the nature, quality, and extent of the services provided to the fund by the Manager. These services included, but were not limited to, management of the fund’s portfolio and a variety of activities related to portfolio management. The Board also reviewed the background and experience of the Manager’s senior management team and investment personnel involved in the management of the fund. The Board concluded that it was satisfied with the nature, quality, and extent of the services provided by the Manager.
Investment Performance of the Fund
The Board reviewed the fund’s average annual total return over the 1-, 3-, and 5-year periods as well as the fund’s year-by-year returns and compared these returns to previously agreed upon comparable performance measures and market data, including those supplied by Lipper and Morningstar, which are independent providers of mutual fund data. On the basis of this evaluation and the Board’s ongoing review of investment results, the Board concluded that the fund’s performance was satisfactory.
Costs, Benefits, Profits, and Economies of Scale
The Board reviewed detailed information regarding the revenues received by the Manager under the Contract and other benefits that the Manager (and its affiliates) may have realized from its relationship with the fund, including research received under “soft dollar” agreements. The Board also received information on the estimated costs incurred and profits realized by the Manager and its affiliates from advising T. Rowe Price mutual funds, as well as estimates of the gross profits realized from managing the fund in particular. The Board concluded that the Manager’s profits were reasonable in light of the services provided to the fund. The Board also considered whether the fund or other funds benefit under the fee levels set forth in the Contract from any economies of scale realized by the Manager. The Board noted that, under the Contract, the fund pays the Manager a single fee based on the fund’s assets and the Manager, in turn, pays all expenses of the fund, with certain exceptions. The Board concluded that, based on the profitability data it reviewed and consistent with this single fee structure, the Contract provided for a reasonable sharing of benefits from any economies of scale with the fund.
Fees
The Board reviewed the fund’s single-fee structure and compared the rate to fees and expenses of other comparable funds based on information and data supplied by Lipper. The information provided to the Board indicated that the fund’s single fee rate was generally above the median management fee rate for comparable funds, but generally below the median expense ratio for comparable funds. The Board also reviewed the expense ratio of the fund’s II Class, which pays a 12b-1 fee in addition to the single fee, and compared this expense ratio to the fees and expenses of comparable funds. The information provided to the Board indicated that the expense ratio for the II Class was generally below the median expense ratio for comparable funds. The Board also reviewed the fee schedules for comparable privately managed accounts of the Manager and its affiliates. Management informed the Board that the Manager’s responsibilities for privately managed accounts are more limited than its responsibilities for the fund and other T. Rowe Price mutual funds that it or its affiliates advise. On the basis of the information provided, the Board concluded that the fees paid by the fund under the Contract were reasonable.
Approval of the Contract
As noted, the Board approved the continuation of the Contract. No single factor was considered in isolation or to be determinative to the decision. Rather, the Board concluded, in light of a weighting and balancing of all factors considered, that it was in the best interests of the fund to approve the continuation of the Contract, including the fees to be charged for services thereunder.
Item 2. Code of Ethics.A code of ethics, as defined in Item 2 of Form N-CSR, applicable to its principal executive officer, principal financial officer, principal accounting officer or controller, or persons performing similar functions is filed as an exhibit to the registrant’s annual Form N-CSR. No substantive amendments were approved or waivers were granted to this code of ethics during the registrant’s most recent fiscal half-year.
Item 3. Audit Committee Financial Expert.
Disclosure required in registrant’s annual Form N-CSR.
Item 4. Principal Accountant Fees and Services.
Disclosure required in registrant’s annual Form N-CSR.
Item 5. Audit Committee of Listed Registrants.
Not applicable.
Item 6. Schedule of Investments.
Not applicable. The complete schedule of investments is included in Item 1 of this Form N-CSR.
Item 7. Disclosure of Proxy Voting Policies and Procedures for Closed-End Management Investment Companies.
Not applicable.
Item 8. Portfolio Managers of Closed-End Management Investment Companies.
Not applicable.
Item 9. Purchases of Equity Securities by Closed-End Management Investment Company and Affiliated Purchasers.
Not applicable.
Item 10. Submission of Matters to a Vote of Security Holders.
Not applicable.
Item 11. Controls and Procedures.
(a) The registrant’s principal executive officer and principal financial officer have evaluated the registrant’s disclosure controls and procedures within 90 days of this filing and have concluded that the registrant’s disclosure controls and procedures were effective, as of that date, in ensuring that information required to be disclosed by the registrant in this Form N-CSR was recorded, processed, summarized, and reported timely.
(b) The registrant’s principal executive officer and principal financial officer are aware of no change in the registrant’s internal control over financial reporting that occurred during the registrant’s second fiscal quarter covered by this report that has materially affected, or is reasonably likely to materially affect, the registrant’s internal control over financial reporting.
Item 12. Exhibits.
(a)(1) The registrant’s code of ethics pursuant to Item 2 of Form N-CSR is filed with the registrant’s annual Form N-CSR.
(2) Separate certifications by the registrant's principal executive officer and principal financial officer, pursuant to Section 302 of the Sarbanes-Oxley Act of 2002 and required by Rule 30a-2(a) under the Investment Company Act of 1940, are attached.
(3) Written solicitation to repurchase securities issued by closed-end companies: not applicable.
(b) A certification by the registrant's principal executive officer and principal financial officer, pursuant to Section 906 of the Sarbanes-Oxley Act of 2002 and required by Rule 30a-2(b) under the Investment Company Act of 1940, is attached.
| | |
| SIGNATURES |
| |
| | Pursuant to the requirements of the Securities Exchange Act of 1934 and the Investment |
| Company Act of 1940, the registrant has duly caused this report to be signed on its behalf by the |
| undersigned, thereunto duly authorized. |
| |
| T. Rowe Price Equity Series, Inc. |
| |
| By | /s/ James S. Riepe |
| | James S. Riepe |
| | Principal Executive Officer |
| |
| Date | August 18, 2005 |
| |
| |
| | Pursuant to the requirements of the Securities Exchange Act of 1934 and the Investment |
| Company Act of 1940, this report has been signed below by the following persons on behalf of |
| the registrant and in the capacities and on the dates indicated. |
| |
| |
| By | /s/ James S. Riepe |
| | James S. Riepe |
| | Principal Executive Officer |
| |
| Date | August 18, 2005 |
| |
| |
| |
| By | /s/ Joseph A. Carrier |
| | Joseph A. Carrier |
| | Principal Financial Officer |
| |
| Date | August 18, 2005 |