Item 1: Report to Shareholders| Equity Income Portfolio | June 30, 2005 |
The views and opinions in this report were current as of June 30, 2005. They are not guarantees of performance or investment results and should not be taken as investment advice. Investment decisions reflect a variety of factors, and the managers reserve the right to change their views about individual stocks, sectors, and the markets at any time. As a result, the views expressed should not be relied upon as a forecast of the fund’s future investment intent. The report is certified under the Sarbanes-Oxley Act of 2002, which requires mutual funds and other public companies to affirm that, to the best of their knowledge, the information in their financial reports is fairly and accurately stated in all material respects.
Dear Investor
The first six months of 2005 left us with little to cheer about. The first quarter was weak while the second quarter was somewhat more encouraging, resulting in a generally dull market overall. Dull is not necessarily a bad thing, however, particularly after two good years for equities in 2003 and 2004. Most stock categories struggled over the first half, except for mid-cap shares and select value segments, which bucked the overall trend. Value stocks have outperformed growth across the various market caps for the year so far.
| Periods Ended 6/30/05 | 6 Months | 12 Months |
| Equity Income Portfolio | -0.43% | 9.51% |
| Equity Income Portfolio–II | -0.57 | 9.22 |
| S&P 500 Index | -0.81 | 6.32 |
| Lipper Variable Annuity | | |
| Underlying Equity Income | | |
| Funds Average | 0.72 | 10.25 |
As shown in the Performance Comparison table, your fund returned -0.43% over the six-month period and 9.51% for the 12 months ended June 30, 2005. (Portfolio–II share returns were slightly lower reflecting its higher expense ratio.) These results outpaced the S&P 500 Stock Index over both periods but trailed the Lipper Variable Annuity Underlying Equity Income Funds Average. Performance through the first half was heavily influenced by relative exposure to the energy and utility sectors, which posted strong returns; the table on this page shows that our allocation to energy has slipped a bit since the end of 2004, while portfolio exposure to utilities rose by a wider margin.
Dividend Distribution
Your Board of Trustees declared a second-quarter income dividend of $0.08 per share for shareholders of record on June 27, bringing the total for 2005 to $0.15 per share.
Portfolio Review
Stock and sector performance was mixed in the first half of 2005, as the fund benefited from areas of strength but was hampered by other investments that have not yet panned out. The energy and utility sectors were notable for their strong performance in a lackluster year so far, but it is not the purpose or the investment style of this fund to concentrate fund assets in narrow segments of the market. Our positions in energy giants Amerada Hess, Anadarko Petroleum, and Unocal were extremely beneficial to absolute and relative performance. We eliminated Unocal in the face of the Chevron takeover proposal at a significant profit and would have done even better had we waited until the announcement of the bid from a Chinese energy company. Our electric utilities investments were also quite rewarding, as we enjoyed excellent results from holdings such as Constellation Energy Group, Duke Energy, and FirstEnergy. (Please refer to our portfolio of investments for a complete listing of fund holdings and the amount each represents of the portfolio.)
| | Percent of | Percent of |
| | Net Assets | Net Assets |
| | 12/31/04 | 6/30/05 |
| Financials | 18.5% | 18.6% |
| Consumer Discretionary | 17.1 | 15.8 |
| Industrials and Business Services | 12.0 | 11.8 |
| Consumer Staples | 7.6 | 8.7 |
| Energy | 8.8 | 8.5 |
| Health Care | 9.3 | 8.4 |
| Information Technology | 5.2 | 7.9 |
| Telecommunication Services | 5.8 | 5.7 |
| Utilities | 4.6 | 5.3 |
| Materials | 6.3 | 4.7 |
| Other and Reserves | 4.8 | 4.6 |
| Total | 100.0% | 100.0% |
| Historical weightings reflect current industry/sector |
| classifications. |
After disappointing us for several years, May Department Stores finally lived up to expectations following a takeover announcement by Federated Department Stores. We had our laggards as well, including investments in a few cyclical and newspaper companies. We were particularly disappointed by paper and forest products stock International Paper in that we thought the company was better positioned to improve performance than has been evident thus far. In addition, our investments in media companies Dow Jones and New York Times stymied fund performance during the first half. These companies remain excellent franchises, in our view, but both have made expensive acquisitions that hurt their share prices.We made a number of portfolio changes during the period, initiating or adding to positions in some areas and reducing or eliminating stocks that had performed quite well. As a reminder, we emphasize new investments in larger-capitalization companies selling at attractive valuation levels (generally with attractive price/earnings multiples and healthy dividend yields). In many cases, these companies had suffered due to some investor concerns or uncertainties, resulting in good valuation opportunities. Conversely, many of the companies we sell had been good performers whose share prices rose to levels that no longer offered compelling valuations.
As shown in the Major Portfolio Changes table following this letter, we invested in some stocks that are a bit unusual for us—companies that could be described as large-capitalization growth franchises. We did this following our assessment of the value structure of the equities market, which indicated that the share prices of many growth companies had fallen to attractive valuation levels and were, therefore, suitable for inclusion in our portfolio. These stocks include Anheuser-Busch, Wal-Mart, IBM, State Street, Analog Devices, and American International Group—growth companies whose stocks had fallen within the value parameters we look for. Our largest new investment in the first half was Anheuser-Busch, a company with great brands, a strong market position, and good management. Because the stock has languished for several years, it suddenly appeared attractive to us. With a 2% dividend yield and a steady record of stock repurchases, this investment provides an annual cash return to investors in the 4% to 5% range. We believe its other valuation characteristics are attractive as well since we look for strong companies that are out of favor with investors, with good balance sheets, astute managements, and attractive stock valuation. These attributes, of course, do not guarantee that any investment will prosper, but we like the odds that they might over time.
The companies in which we reduced portfolio exposure fell generally into sectors such as energy (Unocal), utilities (TXU), lodging (Starwood Hotels & Resorts Worldwide and Hilton), and selected cyclicals (Dow Chemical and Nucor). The lodging industry is illustrative of how companies move in and out of investor favor. We increased our exposure to this area in the post-9/11 environment when concerns arose about the future of travel and the prospects for the lodging industry. Since then, as the economy recovered and investor concern dissipated, the companies have turned out to be very good investments. Now that there is more widespread confidence in their prospects, we believe it is time for us to move on and look for more controversial and attractively valued companies in which to invest.
| | Equity Income | S&P 500 |
| As of 6/30/05 | Portfolio | Stock Index |
| Average Company Yield | 2.3% | 1.9% |
| Price/Book Ratio | 2.9X | 3.3X |
| Price/Earnings Ratio | | |
| (2005 estimated EPS) | 15.0X | 15.4X |
| Historical Beta* | | |
| (based on monthly | | |
| returns for 5 years) | 0.72 | 1.00 |
| * Source data: IBES. Forecasts are in no way indicative of invest- |
| ment returns. |
Outlook
Considering that the first six months of 2005 were characterized by good corporate earnings and dividend growth, strong cash flow and balance sheet improvement, a fair amount of merger and acquisition activity, and a generally supportive economic backdrop, investors had a right to expect the equities market to perform better than it did. Valuations in general seem reasonable relative to interest rate and expected inflation levels. Concerns abound, of course. Investors are legitimately worried about the effect of record high oil prices on consumer spending. In addition, the wars in Iraq and Afghanistan threaten global stability, as the horrific terrorist attacks in London all too vividly reminded us. Yet markets have remained resilient in the face of bad news. All things considered, we believe that stock market returns should outpace bond and money market returns in the intermediate term, and we are constructive on the prospects for the types of dividend-paying stocks with attractive valuations that we seek for your portfolio.
We appreciate your continued confidence and support.
Respectfully submitted,

Brian C. Rogers
President of the fund and chairman of its Investment Advisory Committee
July 21, 2005
The committee chairman has day-to-day responsibility for managing the portfolio and works with committee members in developing and executing the fund’s investment program.
| Risks of Investing in the Fund |
Value investors seek to invest in companies whose stock prices are low in relation to their real worth or future prospects. By identifying companies whose stocks are currently out of favor or misunderstood, value investors hope to realize significant appreciation as other investors recognize the stock’s intrinsic value and the price rises accordingly. The value approach carries the risk that the market will not recognize a security’s intrinsic value for a long time, or that a stock judged to be undervalued may actually be appropriately priced.
Lipper index: An index of mutual fund performance returns for specified periods in defined categories as tracked by Lipper Inc.
S&P 500 Stock Index: A market cap-weighted index of 500 widely held stocks often used as a proxy for the overall stock market. Performance is reported on a total return basis.
Price/earnings ratio: Calculated by dividing a stock’s market value per share by the company’s earnings per share for the past 12 months or by expected earnings for the coming year.
Portfolio Highlights
| Twenty-Five Largest Holdings |
| | Percent of |
| | Net Assets |
| | 6/30/05 |
| J.P. Morgan Chase | 2.0% |
| ExxonMobil | 1.9 |
| GE | 1.8 |
| Chevron | 1.8 |
| Royal Dutch Petroleum | 1.5 |
| Marsh & McLennan | 1.4 |
| Merck | 1.4 |
| Honeywell International | 1.4 |
| Hewlett-Packard | 1.3 |
| Morgan Stanley | 1.3 |
| Viacom | 1.3 |
| Coca-Cola | 1.3 |
| Bank of America | 1.3 |
| Time Warner | 1.3 |
| Anheuser-Busch | 1.3 |
| Union Pacific | 1.3 |
| Johnson & Johnson | 1.3 |
| Amerada Hess | 1.2 |
| Colgate-Palmolive | 1.2 |
| New York Times | 1.2 |
| Comcast | 1.2 |
| Sprint | 1.1 |
| Wyeth | 1.1 |
| Bristol Myers Squibb | 1.1 |
| NiSource | 1.1 |
| Total | 34.1% |
| |
| Note: Table excludes investments in the T. Rowe Price Reserve Investment Fund. |
| 6 Months Ended 6/30/05 | |
| Listed in descending order of size | |
| |
| LARGEST PURCHASES | LARGEST SALES |
| Anheuser-Busch* | Dow Chemical |
| Wal-Mart* | Unocal** |
| IBM* | Cardinal Health** |
| Tribune* | Starwood Hotels & Resorts Worldwide** |
| State Street* | Gannett** |
| American International Group* | Nucor** |
| Analog Devices* | XL Capital** |
| Boston Scientific* | Hilton |
| Avery Dennison* | TXU** |
| Progress Energy | Rockwell Collins |
| |
| |
| 12 Months Ended 6/30/05 | |
| |
| LARGEST PURCHASES | LARGEST SALES |
| Anheuser-Busch* | TXU** |
| Coca-Cola* | CIGNA** |
| Wal-Mart* | Nucor** |
| IBM* | Starwood Hotels & Resorts Worldwide** |
| Tribune* | Dow Chemical |
| Marsh & McLennan | Cardinal Health** |
| State Street* | Unocal** |
| Progress Energy* | Gannett** |
| Colgate-Palmolive | Amerada Hess |
| American International Group* | Hilton |
| * Position added. | |
| ** Position eliminated. | |
| Note: Table may not include holdings that were both purchased and sold within the specified time period. |
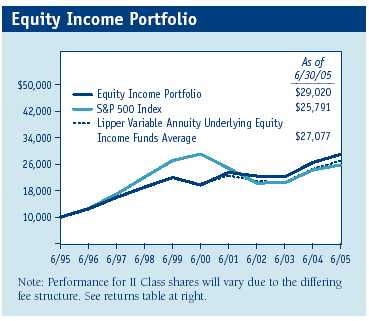
This chart shows the value of a hypothetical $10,000 investment in the fund over the past 10 fiscal year periods or since inception (for funds lacking 10-year records). The result is compared with benchmarks, which may include a broad-based market index and a peer group average or index. Market indexes do not include expenses, which are deducted from fund returns as well as mutual fund averages and indexes.
| Average Annual Compound Total Return |
| Periods Ended | | | | Since | Inception |
| 6/30/05 | 1 Year | 5 Years | 10 Years | Inception | Date |
| |
| Equity | | | | | |
| Income | | | | | |
| Portfolio | 9.51% | 8.03% | 11.24% | – | 3/31/94 |
| S&P 500 | | | | | |
| Stock Index | 6.32 | -2.37 | 9.94 | – | – |
| Lipper | | | | | |
| Variable | | | | | |
| Annuity | | | | | |
| Underlying | | | | | |
| Equity | | | | | |
| Income | | | | | |
| Funds | | | | | |
| Average | 10.25 | 5.21 | 10.45 | – | – |
| Equity | | | | | |
| Income | | | | | |
| Portfolio–II | 9.22% | – | – | 6.36% | 4/30/02 |
| S&P 500 | | | | | |
| Stock Index | 6.32 | – | – | 5.10 | – |
| Lipper | | | | | |
| Variable | | | | | |
| Annuity | | | | | |
| Underlying | | | | | |
| Equity | | | | | |
| Income | | | | | |
| Funds | | | | | |
| Average | 10.25 | – | – | 6.63 | – |
| |
| Current performance may be higher or lower than the quoted past per- |
| formance, which cannot guarantee future results. Share price, principal |
| value, and return will vary, and you may have a gain or loss when you |
| sell your shares. For the most recent month-end performance informa- |
| tion, please visit our Web site (troweprice.com) or contact a T. Rowe |
| Price representative at 1-800-469-5304. | | |
| This table shows how the portfolio would have performed each year if its |
| actual (or cumulative) returns for the periods shown had been earned at a |
| constant rate. Average annual total return figures include changes in principal |
| value, reinvested dividends, and capital gain distributions. Total returns do |
| not include charges imposed by your insurance company’s separate account. |
| If these were included, performance would have been lower. When assessing |
| performance, investors should consider both short- and long-term returns. |
Fund Expense Example
As a mutual fund shareholder, you may incur two types of costs: (1) transaction costs such as redemption fees or sales loads and (2) ongoing costs, including management fees, distribution and service (12b-1) fees, and other fund expenses. The following example is intended to help you understand your ongoing costs (in dollars) of investing in the fund and to compare these costs with the ongoing costs of investing in other mutual funds. The example is based on an investment of $1,000 invested at the beginning of the most recent six-month period and held for the entire period.
Shares of the fund are currently offered only through certain insurance companies as an investment medium for both variable annuity contracts and variable life insurance policies. Please note that the fund has two classes of shares: the original share Class and II Class. II Class shares are sold through financial intermediaries, which it compensates for distribution, shareholder servicing, and/or certain administrative services under a Board-approved Rule 12b-1 plan.
Actual Expenses
The first line of the following table (“Actual”) provides information about actual account values and actual expenses. You may use the information in this line, together with your account balance, to estimate the expenses that you paid over the period. Simply divide your account value by $1,000 (for example, an $8,600 account value divided by $1,000 = 8.6), then multiply the result by the number in the first line under the heading “Expenses Paid During Period” to estimate the expenses you paid on your account during this period.
Hypothetical Example for Comparison Purposes
The information on the second line of the table (“Hypothetical”) is based on hypothetical account values and expenses derived from the fund’s actual expense ratio and an assumed 5% per year rate of return before expenses (not the fund’s actual return). You may compare the ongoing costs of investing in the fund with other funds by contrasting this 5% hypothetical example and the 5% hypothetical examples that appear in the shareholder reports of the other funds. The hypothetical account values and expenses may not be used to estimate the actual ending account balance or expenses you paid for the period.
You should also be aware that the expenses shown in the table highlight only your ongoing costs and do not reflect any transaction costs, such as redemption fees or sales loads. Therefore, the second line of the table is useful in comparing ongoing costs only, and will not help you determine the relative total costs of owning different funds. To the extent a fund charges transaction costs, however, the total cost of owning that fund is higher.
| T. Rowe Price Equity Income Portfolio |
| | | | Expenses |
| | Beginning | Ending | Paid During |
| | Account | Account | Period* |
| | Value | Value | 1/1/05 to |
| | 1/1/05 | 6/30/05 | 6/30/05 |
| |
| Equity Income Portfolio | | | |
| Actual | $1,000.00 | $995.70 | $4.21 |
| Hypothetical | | | |
| (assumes 5% return | | | |
| before expenses) | 1,000.00 | 1,020.58 | 4.26 |
| |
| Equity Income Portfolio–II | | |
| Actual | 1,000.00 | 994.30 | 5.44 |
| Hypothetical | | | |
| (assumes 5% return | | | |
| before expenses) | 1,000.00 | 1,019.34 | 5.51 |
| |
| *Expenses are equal to the fund’s annualized expense ratio for the six-month |
| period, multiplied by the average account value over the period, multiplied |
| by the number of days in the most recent fiscal half year (181) divided by |
| the days in the year (365) to reflect the half-year period. The annualized |
| expense ratio of the Investor Class was 0.85%, the II Class was 1.10%. |
Financial Highlights
T. Rowe Price Equity Income Portfolio
(Unaudited)
| For a share outstanding throughout each period |
| Equity Income Class | | | | | | | | | | | | |
| | 6 Months | | Year | | | | | | | | |
| | | Ended | | Ended | | | | | | | | |
| | | 6/30/05** | 12/31/04 | 12/31/03 | 12/31/02 | 12/31/01 | 12/31/00 |
| NET ASSET VALUE | | | | | | | | | | | | |
| Beginning of period | $ | 22.34 | $ | 20.19 | $ | 16.36 | $ | 19.17 | $ | 19.55 | $ | 18.73 |
|
|
| Investment activities | | | | | | | | | | | | |
| Net investment income (loss) | | 0.16 | | 0.32 | | 0.30 | | 0.29 | | 0.28 | | 0.37 |
| Net realized and | | | | | | | | | | | | |
| unrealized gain (loss) | | (0.26) | | 2.65 | | 3.83 | | (2.79) | | (0.02) | | 1.95 |
|
|
| | | | | | | | | | | | |
| Total from | |
| investment activities | | (0.10) | | 2.97 | | 4.13 | | (2.50) | | 0.26 | | 2.32 |
|
|
| | | | | | | | | | | | |
| Distributions | | | | | | | | | | | | |
| Net investment income | | (0.15) | | (0.33) | | (0.30) | | (0.29) | | (0.28) | | (0.37) |
| Net realized gain | | (0.16) | | (0.49) | | – | | (0.02) | | (0.36) | | (1.13) |
|
|
| Total distributions | | (0.31) | | (0.82) | | (0.30) | | (0.31) | | (0.64) | | (1.50) |
|
|
| NET ASSET VALUE | | | | | | | | | | | | |
| End of period | $ | 21.93 | $ | 22.34 | $ | 20.19 | $ | 16.36 | $ | 19.17 | $ | 19.55 |
|
|
| |
| Ratios/Supplemental Data | | | | | | | | | | | | |
| Total return^ | | (0.43%) | | 14.92% | | 25.50% | | (13.12%) | | 1.46% | | 13.05% |
| Ratio of total expenses to | | | | | | | | | | | | |
| average net assets | | 0.85%† | | 0.85% | | 0.85% | | 0.85% | | 0.85% | | 0.85% |
| Ratio of net investment | | | | | | | | | | | | |
| income (loss) to average | | | | | | | | | | | | |
| net assets | | 1.49%† | | 1.57%+ | | 1.73% | | 1.66% | | 1.50% | | 1.98% |
| Portfolio turnover rate | | 16.1%† | | 17.1% | | 12.7% | | 17.1% | | 17.2% | | 38.7% |
| Net assets, end of period | | | | | | | | | | | | |
| (in thousands) | $ 1,383,476 | $1,316,471 | $1,051,180 | $ 753,065 | $ 775,573 | $ 645,106 |
| ^ | | Total return reflects the rate that an investor would have earned on an investment in the fund during each period, assuming reinvestment of all distributions. |
| ** | | Per share amounts calculated using average shares outstanding method. |
| + | | Includes the effect of a one-time special dividend (0.12% of average net assets) that is not expected to recur. |
| † | | Annualized |
The accompanying notes are an integral part of these financial statements.
| For a share outstanding throughout each period |
| Equity Income–II Class | | | | | | | | |
| | 6 Months | | Year | | | | 4/30/02 |
| | | Ended | | Ended | | | Through |
| | | 6/30/05** | 12/31/04 | 12/31/03 | 12/31/02 |
| NET ASSET VALUE | | | | | | | | |
| Beginning of period | $ | 22.31 | $ | 20.17 | $ | 16.35 | $ | 19.43 |
|
|
| | | | | | | | |
| Investment activities | | | | | | | | |
| Net investment income | | 0.13 | | 0.27 | | 0.24 | | 0.21 |
| Net realized and | | | | | | | | |
| unrealized gain (loss) | | (0.26) | | 2.64 | | 3.84 | | (3.08) |
|
|
| Total from investment activities | | (0.13) | | 2.91 | | 4.08 | | (2.87) |
|
|
| Distributions | | | | | | | | |
| Net investment income | | (0.13) | | (0.28) | | (0.26) | | (0.21) |
| Net realized gain | | (0.16) | | (0.49) | | – | | – |
|
|
| Total distributions | | (0.29) | | (0.77) | | (0.26) | | (0.21) |
|
|
| NET ASSET VALUE | | | | | | | | |
| End of period | $ | 21.89 | $ | 22.31 | $ | 20.17 | $ | 16.35 |
|
|
| |
| Ratios/Supplemental Data | | | | | | | | |
| Total return^ | | (0.57%) | | 14.62% | | 25.17% | | (14.79%) |
| Ratio of total expenses to | | | | | | | | |
| average net assets | | 1.10%† | | 1.10% | | 1.10% | | 1.10%† |
| Ratio of net investment | | | | | | | | |
| income (loss) to average | | | | | | | | |
| net assets | | 1.24%† | | 1.40%+ | | 1.54% | | 2.15%† |
| Portfolio turnover rate | | 16.1%† | | 17.1% | | 12.7% | | 17.1% |
| Net assets, end of period | | | | | | | | |
| (in thousands) | $ | 268,985 | $ | 176,049 | $ | 56,676 | $ | 672 |
| ^ | | Total return reflects the rate that an investor would have earned on an investment in the fund during each period, assuming reinvestment of all distributions. |
| ** | | Per share amounts calculated using average shares outstanding method. |
| + | | Includes the effect of a one-time special dividend (0.16% of average net assets) that is not expected to recur. |
| † | | Annualized. |
The accompanying notes are an integral part of these financial statements.
Portfolio of Investments (1)
T. Rowe Price Equity Income Portfolio
June 30, 2005 (Unaudited)
| | Shares/$ Par | Value |
| (Cost and value in $ 000s) | | |
| |
| COMMON STOCKS 94.9% | | |
| |
| CONSUMER DISCRETIONARY 15.8% | |
| Automobiles 0.2% | | |
| GM | 100,500 | 3,417 |
| | | 3,417 |
| Distributors 0.6% | | |
| Genuine Parts | 251,550 | 10,336 |
| | | 10,336 |
| Hotels, Restaurants & Leisure 0.8% | |
| Hilton | 172,900 | 4,124 |
| McDonald’s | 326,100 | 9,049 |
| | | 13,173 |
| Household Durables 2.6% | | |
| Fortune Brands | 145,600 | 12,929 |
| Newell Rubbermaid | 693,000 | 16,521 |
| Sony (JPY) | 223,800 | 7,707 |
| Whirlpool | 80,600 | 5,651 |
| | | 42,808 |
| Leisure Equipment & Products 1.7% | |
| Eastman Kodak | 440,400 | 11,825 |
| Mattel | 855,500 | 15,655 |
| | | 27,480 |
| Media 8.3% | | |
| Comcast, Class A * | 636,963 | 19,555 |
| Disney | 580,600 | 14,619 |
| Dow Jones | 371,000 | 13,152 |
| EchoStar Communications | | |
| Class A | 139,900 | 4,218 |
| Knight-Ridder | 131,000 | 8,035 |
| New York Times, Class A | 630,200 | 19,631 |
| Time Warner * | 1,253,000 | 20,938 |
| Tribune | 419,000 | 14,740 |
| Viacom, Class B | 682,100 | 21,841 |
| | | 136,729 |
| Multiline Retail 0.6% | | |
| May Department Stores | 266,200 | 10,691 |
| | | 10,691 |
| Specialty Retail 1.0% | | |
| Home Depot | 257,800 | 10,029 |
| RadioShack | 292,200 | 6,770 |
| | | 16,799 |
| Total Consumer Discretionary | 261,433 |
| CONSUMER STAPLES 8.7% | | |
| Beverages 2.6% | | |
| Anheuser-Busch | 456,500 | 20,885 |
| Coca-Cola | 512,000 | 21,376 |
| | | 42,261 |
| Food & Staples Retailing 1.0% | | |
| Wal-Mart | 336,900 | 16,238 |
| | | 16,238 |
| Food Products 2.3% | | |
| Campbell Soup | 423,300 | 13,025 |
| ConAgra | 254,200 | 5,887 |
| General Mills | 252,100 | 11,796 |
| Unilever NV (EUR) | 113,300 | 7,333 |
| | | 38,041 |
| Household Products 2.0% | | |
| Clorox | 24,800 | 1,382 |
| Colgate-Palmolive | 396,800 | 19,804 |
| Kimberly-Clark | 193,500 | 12,111 |
| | | 33,297 |
| Tobacco 0.8% | | |
| Altria Group | 87,900 | 5,684 |
| UST | 182,000 | 8,310 |
| | | 13,994 |
| Total Consumer Staples | | 143,831 |
| |
| ENERGY 8.5% | | |
| Energy Equipment & Services 0.4% | |
| Schlumberger | 101,100 | 7,678 |
| | | 7,678 |
| Oil, Gas & Consumable Fuels 8.1% | |
| Amerada Hess | 189,800 | 20,216 |
| Anadarko Petroleum | 154,200 | 12,667 |
| BP ADR | 255,596 | 15,944 |
| Chevron | 523,352 | 29,266 |
| ExxonMobil | 532,522 | 30,604 |
| Royal Dutch Petroleum ADS | 385,800 | 25,038 |
| | | 133,735 |
| Total Energy | | 141,413 |
| |
| FINANCIALS 18.4% | | |
| Capital Markets 4.6% | | |
| Charles Schwab | 1,308,600 | 14,761 |
| Janus Capital Group | 203,400 | 3,059 |
| Mellon Financial | 544,000 | 15,608 |
| Morgan Stanley | 419,700 | 22,022 |
| Northern Trust | 113,300 | 5,165 |
| State Street | 327,300 | 15,792 |
| | | 76,407 |
| Commercial Banks 3.9% | | |
| Bank of America | 460,940 | 21,023 |
| Bank of Ireland (EUR) | 432,300 | 6,948 |
| Mercantile Bankshares | 117,750 | 6,068 |
| National City | 172,300 | 5,879 |
| SunTrust | 196,300 | 14,181 |
| Wells Fargo | 114,460 | 7,048 |
| Wilmington Trust | 76,200 | 2,744 |
| | | 63,891 |
| Consumer Finance 0.5% | | |
| American Express | 163,500 | 8,703 |
| | | 8,703 |
| Diversified Financial Services 2.5% | |
| Citigroup | 183,364 | 8,477 |
| J.P. Morgan Chase | 942,941 | 33,305 |
| | | 41,782 |
| Insurance 5.8% | | |
| American International Group | 207,100 | 12,032 |
| Chubb | 132,400 | 11,335 |
| Lincoln National | 277,747 | 13,032 |
| Marsh & McLennan | 862,900 | 23,902 |
| SAFECO | 194,700 | 10,580 |
| St. Paul Companies | 342,646 | 13,545 |
| UnumProvident | 577,600 | 10,582 |
| | | 95,008 |
| Real Estate 0.5% | | |
| Simon Property Group, REIT | 101,836 | 7,382 |
| | | 7,382 |
| Thrifts & Mortgage Finance 0.6% | | |
| Fannie Mae | 177,000 | 10,337 |
| | | 10,337 |
| Total Financials | | 303,510 |
| |
| HEALTH CARE 8.4% | | |
| Biotechnology 0.6% | | |
| MedImmune * | 390,000 | 10,421 |
| | | 10,421 |
| Health Care Equipment & Supplies 1.4% | |
| Baxter International | 369,500 | 13,708 |
| Boston Scientific * | 315,400 | 8,516 |
| | | 22,224 |
| Pharmaceuticals 6.4% | | |
| Abbott Laboratories | 250,700 | 12,287 |
| Bristol Myers Squibb | 747,700 | 18,677 |
| Johnson & Johnson | 319,100 | 20,741 |
| Merck | 754,800 | 23,248 |
| Pfizer | 66,200 | 1,826 |
| Schering-Plough | 535,300 | 10,203 |
| Wyeth | 423,900 | 18,864 |
| | | 105,846 |
| Total Health Care | | 138,491 |
| |
| INDUSTRIALS & BUSINESS SERVICES 11.8% | |
| Aerospace & Defense 3.9% | | |
| Honeywell International | 629,500 | 23,058 |
| Lockheed Martin | 251,900 | 16,341 |
| Raytheon | 371,600 | 14,537 |
| Rockwell Collins | 215,600 | 10,280 |
| | | 64,216 |
| Commercial Services & Supplies 1.8% | |
| Avery Dennison | 169,900 | 8,998 |
| Cendant | 345,100 | 7,720 |
| Waste Management | 438,872 | 12,438 |
| | | 29,156 |
| Electrical Equipment 1.4% | | |
| Cooper Industries, Class A | 193,767 | 12,382 |
| Emerson Electric | 94,800 | 5,937 |
| Rockwell Automation | 109,900 | 5,353 |
| | | 23,672 |
| Industrial Conglomerates 1.8% | | |
| GE | 858,300 | 29,740 |
| | | 29,740 |
| Machinery 1.1% | | |
| Eaton | 105,700 | 6,332 |
| Pall | 397,600 | 12,071 |
| | | 18,403 |
| Road & Rail 1.8% | | |
| Norfolk Southern | 309,400 | 9,579 |
| Union Pacific | 321,500 | 20,833 |
| | | 30,412 |
| Total Industrials & Business Services | 195,599 |
| |
| INFORMATION TECHNOLOGY 7.6% | |
| Communications Equipment 2.0% | | |
| Cisco Systems * | 338,400 | 6,467 |
| Lucent Technologies * | 863,800 | 2,514 |
| Motorola | 703,000 | 12,837 |
| Nokia ADR | 671,600 | 11,175 |
| | | 32,993 |
| Computers & Peripherals 2.3% | | |
| Hewlett-Packard | 943,736 | 22,187 |
| IBM | 210,500 | 15,619 |
| | | 37,806 |
| Electronic Equipment & Instruments 0.2% | |
| Agilent Technologies * | 160,100 | 3,686 |
| | | 3,686 |
| Semiconductor & Semiconductor Equipment 2.1% | |
| Analog Devices | 311,000 | 11,603 |
| Intel | 324,400 | 8,454 |
| Texas Instruments | 520,300 | 14,605 |
| | | 34,662 |
| Software 1.0% | | |
| Microsoft | 681,500 | 16,928 |
| | | 16,928 |
| Total Information Technology | | 126,075 |
| |
| MATERIALS 4.7% | | |
| Chemicals 1.9% | | |
| Dow Chemical | 25,300 | 1,127 |
| DuPont | 253,200 | 10,890 |
| Great Lakes Chemical | 170,600 | 5,369 |
| Hercules * | 358,000 | 5,066 |
| International Flavors | | |
| & Fragrances | 230,800 | 8,359 |
| | | 30,811 |
| Construction Materials 0.6% | | |
| Vulcan Materials | 155,000 | 10,073 |
| | | 10,073 |
| Metals & Mining 0.7% | | |
| Alcoa | 440,400 | 11,508 |
| | | 11,508 |
| Paper & Forest Products 1.5% | | |
| International Paper | 588,053 | 17,765 |
| MeadWestvaco | 256,700 | 7,198 |
| | | 24,963 |
| Total Materials | | 77,355 |
| TELECOMMUNICATION SERVICES 5.7% | |
| Diversified Telecommunication Services 5.7% | |
| Alltel | 297,700 | 18,541 |
| AT&T | 570,640 | 10,865 |
| Qwest Communications | | |
| International * | 2,796,800 | 10,376 |
| SBC Communications | 583,668 | 13,862 |
| Sprint | 755,500 | 18,956 |
| Telus (CAD) | 64,800 | 2,276 |
| Telus (Non-voting shares) | 95,000 | 3,231 |
| Verizon Communications | 450,042 | 15,549 |
| Total Telecommunication Services | 93,656 |
| |
| UTILITIES 5.3% | | |
| Electric Utilities 2.3% | | |
| FirstEnergy | 199,420 | 9,594 |
| Progress Energy | 305,800 | 13,834 |
| Teco Energy | 200,500 | 3,792 |
| XCEL Energy | 565,300 | 11,035 |
| | | 38,255 |
| Gas Utilities 1.1% | | |
| NiSource | 749,900 | 18,545 |
| | | 18,545 |
| Independent Power Producers & Energy Traders 1.9% |
| Constellation Energy Group | 209,000 | 12,057 |
| Duke Energy | 608,000 | 18,076 |
| | | 30,133 |
| Total Utilities | | 86,933 |
| Total Common Stocks | | |
| (Cost $1,390,971) | | 1,568,296 |
| |
| CONVERTIBLE PREFERRED STOCKS 0.2% | |
| |
| FINANCIALS 0.2% | | |
| Insurance 0.2% | | |
| UnumProvident | 114,700 | 3,429 |
| Total Convertible Preferred Stocks | |
| (Cost $2,868) | | 3,429 |
| CONVERTIBLE BONDS 0.3% | | |
| |
| INFORMATION TECHNOLOGY 0.3% | | |
| Communications Equipment 0.3% | | |
| Lucent Technologies | | | |
| 8.00%, 8/1/31 | | | |
| (Tender 8/2/07) | 5,035,000 | | 5,211 |
| Total Convertible Bonds (Cost $5,448) | | 5,211 |
| |
| SHORT-TERM INVESTMENTS 4.8% | | |
| | | | |
| Money Market Fund 4.8% | | | |
| T. Rowe Price Reserve Investment | | |
| Fund, 3.14% #† | 78,451,254 | | 78,451 |
| Total Short-Term Investments | | |
| (Cost $78,451) | | | 78,451 |
| |
| Total Investments in Securities | | |
| 100.2% of Net Assets (Cost $1,477,738) | $ 1,655,387 |
| (1) | | Denominated in U.S dollars unless otherwise noted |
| # | | Seven-day yield |
| * | | Non-income producing |
| † | | Affiliated company — See Note 4 |
| ADR | | American Depository Receipts |
| ADS | | American Depository Shares |
| CAD | | Canadian dollar |
| EUR | | Euro |
| JPY | | Japanese yen |
| REIT | | Real Estate Investment Trust |
The accompanying notes are an integral part of these financial statements.
Statement of Assets and Liabilities
T. Rowe Price Equity Income Portfolio
June 30, 2005 (Unaudited)
(In thousands except shares and per share amounts)
| Assets | | |
| Investments in securities, at value | | |
| Affiliated companies (cost $78,451) | $ | 78,451 |
| Non-affiliated companies (cost $1,399,287) | | 1,576,936 |
|
|
| Total investments in securities | | 1,655,387 |
| Dividends and interest receivable | | 2,608 |
| Receivable for investment securities sold | | 1,050 |
| Receivable for shares sold | | 2,046 |
| Other assets | | 49 |
|
|
| Total assets | | 1,661,140 |
|
|
| |
| Liabilities | | |
| Payable for investment securities purchased | | 7,062 |
| Payable for shares redeemed | | 378 |
| Due to affiliates | | 1,232 |
| Other liabilities | | 7 |
|
|
| Total liabilities | | 8,679 |
|
|
| |
| NET ASSETS | $ | 1,652,461 |
|
|
| Net Assets Consist of: | | |
| Undistributed net investment income (loss) | $ | 494 |
| Undistributed net realized gain (loss) | | 41,019 |
| Net unrealized gain (loss) | | 177,647 |
| Paid-in-capital applicable to 75,385,112 shares of | | |
| $0.0001 par value capital stock outstanding; | | |
| 1,000,000,000 shares of the Corporation authorized | | 1,433,301 |
|
|
| |
| NET ASSETS | $ | 1,652,461 |
|
|
| NET ASSET VALUE PER SHARE | | |
| Equity Income Class | | |
| ($1,383,476,353/63,096,970 shares outstanding) | $ | 21.93 |
|
|
| Equity Income–II Class | | |
| ($268,984,855/12,288,142 shares outstanding) | $ | 21.89 |
|
|
The accompanying notes are an integral part of these financial statements.
Statement of Operations
T. Rowe Price Equity Income Portfolio
(Unaudited)
($ 000s)
| | | 6 Months |
| | | Ended |
| | | 6/30/05 |
| Investment Income (Loss) | | |
| Income | | |
| Dividend | $ | 17,836 |
| Interest | | 199 |
| Securities lending | | 27 |
|
|
| Total income | | 18,062 |
|
|
| Expenses | | |
| Investment management and administrative expense | | 6,559 |
| Rule 12b-1 fees - Equity Income–II Class | | 269 |
|
|
| Total expenses | | 6,828 |
|
|
| Net investment income (loss) | | 11,234 |
|
|
| Realized and Unrealized Gain (Loss) | | |
| Net realized gain (loss) | | |
| Securities | | 41,122 |
| Foreign currency transactions | | (10) |
|
|
| Net realized gain (loss) | | 41,112 |
|
|
| Change in net unrealized gain (loss) | |
| Securities | | (58,740) |
| Other assets and liabilities | | |
| denominated in foreign currencies | | (4) |
|
|
| Change in net unrealized gain (loss) | | (58,744) |
|
|
| Net realized and unrealized gain (loss) | | (17,632) |
|
|
| |
| INCREASE (DECREASE) IN NET | | |
| ASSETS FROM OPERATIONS | $ | (6,398) |
|
|
The accompanying notes are an integral part of these financial statements.
Statement of Changes in Net Assets
T. Rowe Price Equity Income Portfolio
(Unaudited)
($ 000s)
| | | 6 Months | | Year |
| | | Ended | | Ended |
| | | 6/30/05 | | 12/31/04 |
| |
| Increase (Decrease) in Net Assets | | | | |
| Operations | | | | |
| Net investment income (loss) | $ | 11,234 | $ | 19,273 |
| Net realized gain (loss) | | 41,112 | | 37,156 |
| Change in net unrealized gain (loss) | | (58,744) | | 126,338 |
|
|
| Increase (decrease) in net assets from operations | | (6,398) | | 182,767 |
|
|
| Distributions to shareholders | | | | |
| Net investment income | | | | |
| Equity Income Class | | (9,244) | | (18,263) |
| Equity Income–II Class | | (1,445) | | (1,682) |
| Net realized gain | | | | |
| Equity Income Class | | (9,687) | | (27,650) |
| Equity Income–II Class | | (1,582) | | (3,286) |
|
|
| Decrease in net assets from distributions | | (21,958) | | (50,881) |
|
|
| Capital share transactions * | | | | |
| Shares sold | | | | |
| Equity Income Class | | 134,864 | | 222,198 |
| Equity Income–II Class | | 111,593 | | 116,651 |
| Distributions reinvested | | | | |
| Equity Income Class | | 18,931 | | 45,913 |
| Equity Income–II Class | | 3,027 | | 4,968 |
| Shares redeemed | | | | |
| Equity Income Class | | (62,210) | | (121,468) |
| Equity Income–II Class | | (17,908) | | (15,484) |
|
|
| Increase (decrease) in net assets from | | | | |
| capital share transactions | | 188,297 | | 252,778 |
|
|
| |
| Net Assets | | | | |
| Increase (decrease) during period | | 159,941 | | 384,664 |
| Beginning of period | | 1,492,520 | | 1,107,856 |
|
|
| |
| End of period | $ | 1,652,461 | $ | 1,492,520 |
|
|
| (Including undistributed net investment income (loss) | | | | |
| of $494 at 6/30/05 and $(51) at 12/31/04) | | | | |
| *Share information | | | | |
| Shares sold | | | | |
| Equity Income Class | | 6,121 | | 10,614 |
| Equity Income–II Class | | 5,069 | | 5,589 |
| Distributions reinvested | | | | |
| Equity Income Class | | 870 | | 2,135 |
| Equity Income–II Class | | 139 | | 229 |
| Shares redeemed | | | | |
| Equity Income Class | | (2,832) | | (5,864) |
| Equity Income–II Class | | (812) | | (736) |
|
|
| Increase (decrease) in shares outstanding | | 8,555 | | 11,967 |
The accompanying notes are an integral part of these financial statements.
Notes to Financial Statements
T. Rowe Price Equity Income Portfolio
June 30, 2005
(Unaudited)
NOTE 1 - SIGNIFICANT ACCOUNTING POLICIES
T. Rowe Price Equity Series, Inc. (the corporation) is registered under the Investment Company Act of 1940 (the 1940 Act). The Equity Income Portfolio (the fund) is a diversified, open-end management investment company and is one portfolio established by the corporation. The fund seeks to provide substantial dividend income as well as long-term growth of capital through investments in the common stocks of established companies. Shares of the fund are currently offered only through certain insurance companies as an investment medium for both variable annuity contracts and variable life insurance policies. The fund has two classes of shares: the Equity Income Portfolio original share class (Equity Income Class, offered since March 31, 1994, and Equity Income Portfolio–II (Equity Income–II class), offered since April 30, 2002. Equity Income–II shares are sold through financial intermediaries, which it compensates for distribution, shareholder servicing, and/or certain administrative services under a Board-approved Rule 12b-1 plan. Each class has exclusive voting rights on matters related solely to that class, separate voting rights on matters that relate to both classes, and, in all other respects, the same rights and obligations as the other class.
The accompanying financial statements were prepared in accordance with accounting principles generally accepted in the United States of America, which require the use of estimates made by fund management. Fund management believes that estimates and security valuations are appropriate; however actual results may differ from those estimates, and the security valuations reflected in the financial statements may differ from the value the fund receives upon sale of the securities.
Valuation The fund values its investments and computes its net asset value per share at the close of the New York Stock Exchange (NYSE), normally 4 p.m. ET, each day that the NYSE is open for business. Equity securities listed or regularly traded on a securities exchange or in the over-the-counter market are valued at the last quoted sale price or, for certain markets, the official closing price at the time the valuations are made, except for OTC Bulletin Board securities, which are valued at the mean of the latest bid and asked prices. A security that is listed or traded on more than one exchange is valued at the quotation on the exchange determined to be the primary market for such security. Listed securities not traded on a particular day are valued at the mean of the latest bid and asked prices for domestic securities and the last quoted sale price for international securities.
Debt securities are generally traded in the over-the-counter market. Securities with original maturities of one year or more are valued at prices furnished by dealers who make markets in such securities or by an independent pricing service, which considers yield or price of bonds of comparable quality, coupon, maturity, and type, as well as prices quoted by dealers who make markets in such securities. Securities with original maturities of less than one year are valued at amortized cost in local currency, which approximates fair value when combined with accrued interest.
Investments in mutual funds are valued at the mutual fund’s closing net asset value per share on the day of valuation.
Other investments, including restricted securities, and those for which the above valuation procedures are inappropriate or are deemed not to reflect fair value are stated at fair value as determined in good faith by the T. Rowe Price Valuation Committee, established by the fund’s Board of Directors.
Most foreign markets close before the close of trading on the NYSE. If the fund determines that developments between the close of a foreign market and the close of the NYSE will, in its judgment, materially affect the value of some or all of its portfolio securities, which in turn will affect the fund’s share price, the fund will adjust the previous closing prices to reflect the fair value of the securities as of the close of the NYSE, as determined in good faith by the T. Rowe Price Valuation Committee, established by the fund’s Board of Directors. A fund may also fair value securities in other situations, such as when a particular foreign market is closed but the fund is open. In deciding whether to make fair value adjustments, the fund reviews a variety of factors, including developments in foreign markets, the performance of U.S. securities markets, and the performance of instruments trading in U. S. markets that represent foreign securities and baskets of foreign securities. The fund uses outside pricing services to provide it with closing market prices and information used for adjusting those prices. The fund cannot predict when and how often it will use closing prices and when it will adjust those prices to reflect fair value. As a means of evaluating its fair value process, the fund routinely compares closing market prices, the next day’s opening prices in the same markets, and adjusted prices.
Currency Translation Assets, including investments, and liabilities denominated in foreign currencies are translated into U.S. dollar values each day at the prevailing exchange rate, using the mean of the bid and asked prices of such currencies against U.S. dollars as quoted by a major bank. Purchases and sales of securities, income, and expenses are translated into U.S. dollars at the prevailing exchange rate on the date of the transaction. The effect of changes in foreign currency exchange rates on realized and unrealized security gains and losses is reflected as a component of security gains and losses.
Class Accounting Equity Income–II pays distribution, shareholder servicing, and/or certain administrative expenses in the form of Rule 12b-1 fees, in an amount not exceeding 0.25% of the class’s average daily net assets. Management and administrative fee expenses, investment income, and realized and unrealized gains and losses are allocated to the classes based upon the relative daily net assets of each class.
Investment Transactions, Investment Income, and Distributions Income and expenses are recorded on the accrual basis. Premiums and discounts on debt securities are amortized for financial reporting purposes. Dividends received from mutual fund investments are reflected as dividend income; capital gain distributions are reflected as realized gain/loss. Dividend income and capital gain distributions are recorded on the ex-dividend date. Investment transactions are accounted for on the trade date. Realized gains and losses are reported on the identified cost basis. Distributions to shareholders are recorded on the ex-dividend date. Income distributions are declared and paid by each class on a quarterly basis. Capital gain distributions, if any, are declared and paid by the fund, typically on an annual basis.
NOTE 2 - INVESTMENT TRANSACTIONS
Consistent with its investment objective, the fund engages in the following practices to manage exposure to certain risks or enhance performance. The investment objective, policies, program, and risk factors of the fund are described more fully in the fund’s prospectus and Statement of Additional Information.
Securities Lending The fund lends its securities to approved brokers to earn additional income. It receives as collateral cash and U.S. government securities valued at 102% to 105% of the value of the securities on loan. Cash collateral is invested in a money market pooled account managed by the fund’s lending agent in accordance with investment guidelines approved by fund management. Collateral is maintained over the life of the loan in an amount not less than the value of loaned securities, as determined at the close of fund business each day; any additional collateral required due to changes in security values is delivered to the fund the next business day. Although risk is mitigated by the collateral, the fund could experience a delay in recovering its securities and a possible loss of income or value if the borrower fails to return the securities. Securities lending revenue recognized by the fund consists of earnings on invested collateral and borrowing fees, net of any rebates to the borrower and compensation to the lending agent. At June 30, 2005, there were no securities on loan.
Other Purchases and sales of portfolio securities, other than short-term and U.S. government securities, aggregated $293,232,000 and $119,236,000, respectively, for the six months ended June 30, 2005.
NOTE 3 - FEDERAL INCOME TAXES
No provision for federal income taxes is required since the fund intends to continue to qualify as a regulated investment company under Subchapter M of the Internal Revenue Code and distribute to shareholders all of its taxable income and gains. Federal income tax regulations differ from generally accepted accounting principles; therefore, distributions determined in accordance with tax regulations may differ in amount or character from net investment income and realized gains for financial reporting purposes. Financial reporting records are adjusted for permanent book/tax differences to reflect tax character. Financial records are not adjusted for temporary differences. The amount and character of tax-basis distributions and composition of net assets are finalized at fiscal year-end; accordingly, tax-basis balances have not been determined as of June 30, 2005.
At June 30, 2005, the cost of investments for federal income tax purposes was $1,477,738,000. Net unrealized gain aggregated $177,647,000 at period-end, of which $257,358,000 related to appreciated investments and $79,711,000 related to depreciated investments.
NOTE 4 - RELATED PARTY TRANSACTIONS
The fund is managed by T. Rowe Price Associates, Inc. (the manager or Price Associates), a wholly owned subsidiary of T. Rowe Price Group, Inc. The investment management and administrative agreement between the fund and the manager provides for an all-inclusive annual fee equal to 0.85% of the fund’s average daily net assets. The fee is computed daily and paid monthly. The agreement provides that investment management, shareholder servicing, transfer agency, accounting, and custody services are provided to the fund, and interest, taxes, brokerage commissions, directors’ fees and expenses, and extraordinary expenses are paid directly by the fund.
The fund may invest in the T. Rowe Price Reserve Investment Fund and the T. Rowe Price Government Reserve Investment Fund (collectively, the Reserve Funds), open-end management investment companies managed by Price Associates and affiliates of the fund. The Reserve Funds are offered as cash management options to mutual funds, trusts, and other accounts managed by Price Associates and/or its affiliates, and are not available for direct purchase by members of the public. The Reserve Funds pay no investment management fees. During the six months ended June 30, 2005, dividend income from the Reserve Funds totaled $1,050,000, and the value of shares of the Reserve Funds held at June 30, 2005 and December 31, 2004 was $78,451,000 and $72,901,000, respectively.
| Information on Proxy Voting Policies, Procedures, and Records |
A description of the policies and procedures used by T. Rowe Price funds and portfolios to determine how to vote proxies relating to portfolio securities is available in each fund’s Statement of Additional Information, which you may request by calling 1-800-225-5132 or by accessing the SEC’s Web site, www.sec.gov. The description of our proxy voting policies and procedures is also available on our Web site, www.troweprice.com. To access it, click on the words "Company Info" at the top of our homepage for individual investors. Then, in the window that appears, click on the "Proxy Voting Policy" navigation button in the top left corner.
Each fund’s most recent annual proxy voting record is available on our Web site and through the SEC’s Web site. To access it through our Web site, follow the directions above, then click on the words "Proxy Voting Record" at the bottom of the Proxy Voting Policy page.
| How to Obtain Quarterly Portfolio Holdings |
The fund files a complete schedule of portfolio holdings with the Securities and Exchange Commission for the first and third quarters of each fiscal year on Form N-Q. The fund’s Form N-Q is available electronically on the SEC’s Web site (www.sec.gov); hard copies may be reviewed and copied at the SEC’s Public Reference Room, 450 Fifth St. N.W., Washington, DC 20549. For more information on the Public Reference Room, call 1-800-SEC-0330.
| Approval of Investment Management Agreement |
On March 2, 2005, the fund’s Board of Directors unanimously approved the investment advisory contract ("Contract") between the fund and its investment manager, T. Rowe Price Associates, Inc. ("Manager"). The Board considered a variety of factors in connection with its review of the Contract, also taking into account information provided by the Manager during the course of the year, as discussed below:
Services Provided by the Manager
The Board considered the nature, quality, and extent of the services provided to the fund by the Manager. These services included, but were not limited to, management of the fund’s portfolio and a variety of activities related to portfolio management. The Board also reviewed the background and experience of the Manager’s senior management team and investment personnel involved in the management of the fund. The Board concluded that it was satisfied with the nature, quality, and extent of the services provided by the Manager.
Investment Performance of the Fund
The Board reviewed the fund’s average annual total return over the 1-, 3-, 5-, and 10-year periods, as well as the fund’s year-by-year returns, and compared these returns to previously agreed upon comparable performance measures and market data, including those supplied by Lipper and Morningstar, which are independent providers of mutual fund data. On the basis of this evaluation and the Board’s ongoing review of investment results, the Board concluded that the fund’s performance was satisfactory.
Costs, Benefits, Profits, and Economies of Scale
The Board reviewed detailed information regarding the revenues received by the Manager under the Contract and other benefits that the Manager (and its affiliates) may have realized from its relationship with the fund, including research received under “soft dollar” agreements. The Board also received information on the estimated costs incurred and profits realized by the Manager and its affiliates from advising T. Rowe Price mutual funds, as well as estimates of the gross profits realized from managing the fund in particular. The Board concluded that the Manager’s profits were reasonable in light of the services provided to the fund. The Board also considered whether the fund or other funds benefit under the fee levels set forth in the Contract from any economies of scale realized by the Manager. The Board noted that, under the Contract, the fund pays the Manager a single fee based on the fund’s assets and the Manager, in turn, pays all expenses of the fund, with certain exceptions. The Board concluded that, based on the profitability data it reviewed and consistent with this single fee structure, the Contract provided for a reasonable sharing of benefits from any economies of scale with the fund.
Fees
The Board reviewed the fund’s single-fee structure and compared the rate to fees and expenses of other comparable funds based on information and data supplied by Lipper. The information provided to the Board indicated that the fund’s single fee rate was generally above the median management fee rate for comparable funds, but generally below the median expense ratio for comparable funds. The Board also reviewed the expense ratio of the fund’s Class II share class, which pays a 12b-1 fee in addition to the single fee, and compared this expense ratio to the fees and expenses of comparable funds. The information provided to the Board indicated that the expense ratio for the Class II shares was generally below the median expense ratio for comparable funds. The Board also reviewed the fee schedules for comparable privately managed accounts of the Manager and its affiliates. Management informed the Board that the Manager’s responsibilities for privately managed accounts are more limited than its responsibilities for the fund and other T. Rowe Price mutual funds that it or its affiliates advise. On the basis of the information provided, the Board concluded that the fees paid by the fund under the Contract were reasonable.
Approval of the Contract
As noted, the Board approved the continuation of the Contract. No single factor was considered in isolation or to be determinative to the decision. Rather, the Board concluded, in light of a weighting and balancing of all factors considered, that it was in the best interests of the fund to approve the continuation of the Contract, including the fees to be charged for services thereunder.
Item 2. Code of Ethics.A code of ethics, as defined in Item 2 of Form N-CSR, applicable to its principal executive officer, principal financial officer, principal accounting officer or controller, or persons performing similar functions is filed as an exhibit to the registrant’s annual Form N-CSR. No substantive amendments were approved or waivers were granted to this code of ethics during the registrant’s most recent fiscal half-year.
Item 3. Audit Committee Financial Expert.
Disclosure required in registrant’s annual Form N-CSR.
Item 4. Principal Accountant Fees and Services.
Disclosure required in registrant’s annual Form N-CSR.
Item 5. Audit Committee of Listed Registrants.
Not applicable.
Item 6. Schedule of Investments.
Not applicable. The complete schedule of investments is included in Item 1 of this Form N-CSR.
Item 7. Disclosure of Proxy Voting Policies and Procedures for Closed-End Management Investment Companies.
Not applicable.
Item 8. Portfolio Managers of Closed-End Management Investment Companies.
Not applicable.
Item 9. Purchases of Equity Securities by Closed-End Management Investment Company and Affiliated Purchasers.
Not applicable.
Item 10. Submission of Matters to a Vote of Security Holders.
Not applicable.
Item 11. Controls and Procedures.
(a) The registrant’s principal executive officer and principal financial officer have evaluated the registrant’s disclosure controls and procedures within 90 days of this filing and have concluded that the registrant’s disclosure controls and procedures were effective, as of that date, in ensuring that information required to be disclosed by the registrant in this Form N-CSR was recorded, processed, summarized, and reported timely.
(b) The registrant’s principal executive officer and principal financial officer are aware of no change in the registrant’s internal control over financial reporting that occurred during the registrant’s second
fiscal quarter covered by this report that has materially affected, or is reasonably likely to materially affect, the registrant’s internal control over financial reporting.
Item 12. Exhibits.
(a)(1) The registrant’s code of ethics pursuant to Item 2 of Form N-CSR is filed with the registrant’s annual Form N-CSR.
(2) Separate certifications by the registrant's principal executive officer and principal financial officer, pursuant to Section 302 of the Sarbanes-Oxley Act of 2002 and required by Rule 30a-2(a) under the Investment Company Act of 1940, are attached.
(3) Written solicitation to repurchase securities issued by closed-end companies: not applicable.
(b) A certification by the registrant's principal executive officer and principal financial officer, pursuant to Section 906 of the Sarbanes-Oxley Act of 2002 and required by Rule 30a-2(b) under the Investment Company Act of 1940, is attached.
SIGNATURES |
| |
| |
| | Pursuant to the requirements of the Securities Exchange Act of 1934 and the Investment |
| Company Act of 1940, the registrant has duly caused this report to be signed on its behalf by the |
| undersigned, thereunto duly authorized. |
| |
| T. Rowe Price Equity Series, Inc. |
| |
| By | /s/ James S. Riepe |
| | James S. Riepe |
| | Principal Executive Officer |
| |
| Date | August 18, 2005 |
| |
| |
| | Pursuant to the requirements of the Securities Exchange Act of 1934 and the Investment |
| Company Act of 1940, this report has been signed below by the following persons on behalf of |
| the registrant and in the capacities and on the dates indicated. |
| |
| |
| By | /s/ James S. Riepe |
| | James S. Riepe |
| | Principal Executive Officer |
| |
| Date | August 18, 2005 |
| |
| |
| |
| By | /s/ Joseph A. Carrier |
| | Joseph A. Carrier |
| | Principal Financial Officer |
| |
| Date | August 18, 2005 |