Item 1: Report to Shareholders| Blue Chip Growth Portfolio | June 30, 2005 |
The views and opinions in this report were current as of June 30, 2005. They are not guarantees of performance or investment results and should not be taken as investment advice. Investment decisions reflect a variety of factors, and the managers reserve the right to change their views about individual stocks, sectors, and the markets at any time. As a result, the views expressed should not be relied upon as a forecast of the fund’s future investment intent. The report is certified under the Sarbanes-Oxley Act of 2002, which requires mutual funds and other public companies to affirm that, to the best of their knowledge, the information in their financial reports is fairly and accurately stated in all material respects.
Dear Investor
Stocks struggled in the first half of 2005 (much as they did in the first half of 2004). Continued increases in energy prices, rising short-term interest rates, and pockets of global economic slowing contributed to investor pessimism. However, stocks produced good returns in the second quarter, and large-cap growth shares began showing improved relative performance. We continue to believe that interest rates and corporate earnings are supportive of favorable investment returns, particularly for large-cap growth stocks.
| Performance Comparison |
| Periods Ended 6/30/05 | 6 Months | 12 Months |
| Blue Chip Growth Portfolio | | -1.65% | 4.05% |
| Blue Chip Growth Portfolio–II | -1.77 | 3.84 |
| S&P 500 Stock Index | | -0.81 | 6.32 |
| Lipper Variable Annuity | | | |
| Underlying Large-Cap | | | |
| Growth Funds Average | | -1.42 | 4.12 |
| Russell 1000 Growth Index | | -1.72 | 1.68 |
Your portfolio produced six-month returns that slightly lagged the benchmark S&P 500 Index and the average large-cap growth fund tracked by Lipper. For the past 12 months, the portfolio trailed the S&P 500 and performed in line with its Lipper benchmark. Our first-half results were in line with the growth-oriented, style-specific Russell 1000 Growth Index, and 12-month returns were better. (Results for II Class shares were slightly lower, reflecting their higher expense ratios.)
Market Environment
After several years of relatively mediocre performance, large growth stocks have begun to advance. Your portfolio’s returns were significantly stronger on an absolute and relative basis in the second quarter, largely due to a powerful rally in the last two months of the period. In May, large-cap growth stocks posted their best one-month return since October 2003.
The market has been stymied by rising energy prices and the Federal Reserve’s nine short-term interest rate increases. The Fed’s strategy is intended to contain inflation but also may be directed at a perceived overheating in the housing market. While buoyant real estate prices would generally not be of concern, speculation and a resulting correction could affect consumer confidence and overall economic activity. A sharp rebound in the dollar and concerns about the economy and the political future of the European Union also rattled investors.
Despite these issues, we think the environment is quite supportive for stocks. Strong corporate profits, increased free cash flow, and slowly improving capital expenditures are major positives. Additionally, cash in corporate coffers is at record levels and capital spending appears to be at unsustainably low levels. Valuations are reasonable, particularly for many large-cap growth companies that have shown stagnant stock performance but solid earnings growth. Dividend increases, which are more prevalent at large-cap growth companies, could also support investment gains.
Portfolio Review
The health care sector contained some major winners as investors began to worry about the ability of more cyclical stocks to sustain performance. UnitedHealth Group and WellPoint have been major outperformers for your portfolio for several years, and this pattern continued in the first half of 2005. The health care services industry continues to consolidate and both companies announced key mergers. Efficiency improvements and rising medical costs, which are rising more slowly than insurance pricing, should continue to drive strong earnings growth. (Please refer to the portfolio of investments for a complete listing of holdings and the amount each represents of the portfolio.)
Genentech and Gilead Sciences were outstanding performers in the biotech area. Genentech has received approval for several favorable indications for Avastin and other cancer products while Gilead continues to dominate in the anti-viral area (particularly in HIV treatment). Although the medical device area has been volatile, Medtronic and St. Jude Medical made solid contributions to first-half performance.
| Sector Diversification |
| | Percent of | Percent of |
| | Net Assets | Net Assets |
| | 12/31/04 | 6/30/05 |
| Information Technology | 20.4% | 23.5% |
| Financials | 22.5 | 20.5 |
| Health Care | 15.7 | 16.3 |
| Consumer Discretionary | 16.7 | 15.9 |
| Industrials and Business | | |
| Services | 11.3 | 9.5 |
| Energy | 4.4 | 5.5 |
| Consumer Staples | 4.2 | 5.4 |
| Telecommunication Services | 2.0 | 2.1 |
| Materials | 1.5 | 0.5 |
| Utilities | 0.0 | 0.0 |
| Others and Reserves | 1.3 | 0.8 |
| Total | 100.0% | 100.0% |
| Historical weightings reflect current industry/sector classifications. |
Financial stocks made good progress in the second quarter. Legg Mason vaulted to all-time highs after agreeing to swap its brokerage business (plus some equity and cash consideration) for Citigroup’s substantial money management operation. The deal positions Legg as one of the world’s largest global money managers and provides for enhanced distribution via Citigroup. Industry consolidation also benefited discount broker AmeriTrade, which announced plans to buy Toronto-Dominion’s Waterhouse unit. The deal should lead to greater efficiency and improved earnings. Franklin Resources, the manager of the Franklin Templeton funds, is a well-balanced asset manager that generated strong stock returns. Hartford Financial Services, a leading provider of annuities and insurance, also produced solid gains but remains undervalued, in our view.
Although we maintained an underweight in the energy sector (versus the S&P 500), we have been overweight in the oil services industry for several years. We believe the industry has consolidated and finding reserves will require increased spending, even if energy prices moderate. Baker Hughes, Schlumberger, Smith International, and Transocean were strong first-half performers.
The retail area also had several significant contributors, including Kohl’s, CVS, Target, and Best Buy. Our analyst on Kohl’s deserves special recognition because it has been a controversial stock, and his positive view appears to be well supported by the improved operating results.
Google was our second-largest contributor during the period. However, we sold some of our position following its strong appreciation. The company possesses an outstanding business model, which could continue to generate robust earnings and cash flow growth. While we are mindful of the rich valuation, which explains why we took some profits, we feel the upside potential merits retaining a position.
Corning, a communications equipment holding, was another solid information technology performer. Its leadership in producing glass for flat panel digital video screens is driving solid growth. Intel is steadily improving its products (with new dual core processors) and its overall operating performance. A recent product win with Apple illustrates the company is more nimble and proactive. Texas Instruments and Nokia were also strong first-half stocks. Their managements have launched innovative products, improved manufacturing efficiency, and used strong free cash flow to increase share repurchases and dividends.
Our largest second-half detractor was Internet auctioneer eBay. We have owned eBay for several years and reduced our position at higher prices. Slowing in its U.S. and German markets, and the perception that other companies (including Google) are growing more rapidly and may emerge as direct competitors, hurt the stock. We share the concern that competition could intensify. However, eBay is responding to these pressures, and we believe the company can generate solid growth.
After a notable multi-year rebound, Tyco International stumbled in the first half of 2005. The company experienced slowing demand in several businesses, cost control initiatives stalled, and cash flow generation slipped. We were concerned enough to trim some of our position. However, we think this is a very cheap industrial stock, and management can be trusted to fix certain problems and deploy cash flow wisely. Therefore, we decided to maintain a position while carefully monitoring the company’s progress.
American International Group, a longtime holding, was another disappointing first-half performer. Despite various regulatory concerns, which prompted us to reduce our position, the clouds over the company should slowly dissipate. AIG recently reported results that were reassuring for its key business lines, and the stock rallied at the end of the reporting period.
Elan and Biogen Idec, a pair of health care holdings, round out the portfolio’s five largest first-half performance detractors. We established a position in these stocks primarily on the basis of Tysabri, a product that appeared to represent a significant improvement in the treatment of multiple sclerosis. The drug was selling at a rate that would have easily made it a multi-billion dollar blockbuster. Unfortunately, the product was found to contribute to a rare brain disorder in a very limited number of cases. Even though Tysabri could return to the market, we sold Elan and reduced our position in Biogen, which is less dependent on Tysabri revenues for growth.
Microsoft and GE declined moderately in the first half, but they are large portfolio positions, and the impact was noticeable. Investors are concerned that Microsoft faces formidable competition (especially in Internet services), and new products such as its Longhorn operating system will not be innovative. GE has been a somewhat better performer and the new management team has executed superbly over the past year, investing in higher-return businesses such as health care and entertainment. Most of its businesses are producing excellent results, and power systems (power turbines and services) and transportation (jet engines and services) are particularly strong. We’ve added to both stocks because we believe their lackluster performance is in part attributable to large growth companies being out of favor. These are solid companies and we intend to be patient with both positions.
Strategy
We target companies with durable, sustainable earnings and cash flow growth. The free cash flow we prize has become even more valuable now that tax laws give dividends more favorable treatment.
Additions to existing holdings such as ExxonMobil, Gillette, Nokia, Kohl’s, Monsanto, Automatic Data Processing, Intel, and Genentech were significant enough to be included in the 10-largest purchases for the past six months. EMC was our largest new holding. As noted in previous shareholder reports, we have become more positive on selected technology companies, especially those that have had lackluster stock performance while their underlying fundamentals improved. EMC is the dominant provider of storage hardware and systems and had produced solid growth in earnings and cash flow. Its stock has appreciated since our purchase, but we continue to believe it is reasonably valued, given its solid fundamentals and growth potential. Harrah’s Entertainment was the other new holding included in the top-10 purchases for the first half. Harrah’s is the world’s largest provider of branded casino entertainment with its recent acquisition of Caesar’s. More important, Harrah’s has a well-balanced set of properties with a significant presence in Las Vegas, Atlantic City, and other U.S. markets, in addition to significant growth potential in the Far East. The company generates strong free cash flow and has been a savvy user of systems to garner customer loyalty and improve efficiency.
Our largest sale was a reduction in UPS. The company faces challenges from Federal Express and DHL (which is partially subsidized by the German government). We trimmed Best Buy due to concerns relating to competition from online providers of music and personal computers and questions regarding their new store formats and selling practices. Fortunately, we maintained most of our position because Best Buy generated improving results and sharp stock appreciation as the period progressed. We continued to reduce Pfizer due to concerns regarding patent expirations and the patent challenge to Lipitor, which we outlined in our last letter.
We sharply reduced our position in BHP Billiton as our analyst wanted to realize large gains given weakening metal prices. We have a large and talented pool of analysts at T. Rowe Price who help me run the portfolio. Financial holdings Freddie Mac and Fannie Mae were sold because we became uncomfortable with the regulatory environment and the growth potential for these stocks. We also sold Harley-Davidson after it announced excess inventory and a reduction in its production plans for the next few years. SAP, a global enterprise software provider, was eliminated because we thought Oracle offered better fundamental value.
Outlook
There are plenty of issues of concern for investors. Energy prices are rising and the Federal Reserve is likely to continue to raise short-term interest rates. Long-term interest rates are at very low levels, which are contributing to tremendous strength in housing prices. Concern over housing values may spur the Fed to tighten rates for a sustained period. Ultimately, a sharp decline in housing prices (or additional large increases in energy prices) could hurt consumer confidence, economic growth, and stock prices. There is also the threat of global terrorism, as the recent tragic London bombings remind us. Finally, stocks have rallied from the April lows, adding a measure of valuation risk.
However, we believe that the outlook is reasonably good for stocks. This is particularly true for high-quality, consistent-growth companies that have lagged. Ultimately, there is a solid case for investing in U.S. stocks:
1.
| Earnings growth remains strong at many high-quality U.S. companies, many of which do not need a robust economic recovery to produce strong profit growth. |
| |
2.
| Valuations have increased as the market has rallied. However, many consistent-growth companies’ shares have moved up only moderately and remain reasonably valued. |
| |
3.
| Companies have reduced expenses significantly. Consequently, a pickup in revenue growth could result in strong profit growth. |
| |
4.
| Many of our holdings generate significant free cash flow, and free cash flow margins are at multi-decade highs. Shareholder-oriented management can use this cash to pay dividends, which now receive more favorable tax treatment, repurchase shares, or make value-added acquisitions. |
| |
As always, we continue to strive to enhance returns while managing risk by investing in quality companies with durable, sustainable earnings and cash flow growth. We appreciate your continued confidence in this endeavor.
Respectfully submitted,

Larry J. Puglia
Executive vice president and chairman of the Investment Advisory Committee
July 12, 2005
The committee chairman has day-to-day responsibility for managing the portfolio and works with committee members in developing and executing the portfolio’s investment program.
The portfolio’s share price can fall because of weakness in the stock markets, a particular industry, or specific holdings. Stock markets can decline for many reasons, including adverse political or economic developments, changes in investor psychology, or heavy institutional selling. The prospects for an industry or company may deteriorate because of a variety of factors, including disappointing earnings or changes in the competitive environment. In addition, the investment manager’s assessment of companies held in a fund may prove incorrect, resulting in losses or poor performance even in rising markets.Dividend yield: The annual dividend of a stock divided by the stock’s price.Free cash flow: The excess cash a company is generating from its operations that can be taken out of the business for the benefit of shareholders, such as dividends, share repurchases, investments, and acquisitions.
Lipper averages: The averages of all mutual funds in a particular category as tracked by Lipper Inc.
Price/book ratio: A valuation measure that compares a stock’s market price to its book value, i.e., the company’s net worth divided by the number of outstanding shares.
Price/earnings ratio (P/E): A valuation measure calculated by dividing the price of a stock by its current or projected earnings per share. This ratio gives investors an idea of how much they are paying for current or future earnings power.
Russell 1000 Index: An unmanaged index that tracks 1,000 large-cap U.S. stocks.
Russell 1000 Growth Index: A market-capitalization weighted index of those firms in the Russell 1000 with higher price-to-book ratios and higher forecasted growth values.
S&P 500 Stock Index: An unmanaged index that tracks the stocks of 500 primarily large-cap U.S. companies.
| Twenty-Five Largest Holdings |
| | Percent of |
| | Net Assets |
| | 6/30/05 |
| UnitedHealth Group | 3.6% |
| Citigroup | 3.4 |
| GE | 3.1 |
| Microsoft | 3.1 |
| WellPoint | 2.2 |
| Danaher | 2.1 |
| Dell | 2.0 |
| State Street | 1.8 |
| Wal-Mart | 1.8 |
| Intel | 1.7 |
| Target | 1.6 |
| American International Group | 1.6 |
| Schlumberger | 1.5 |
| Amgen | 1.5 |
| Tyco International | 1.5 |
| Carnival | 1.4 |
| Home Depot | 1.4 |
| Cisco Systems | 1.4 |
| Franklin Resources | 1.4 |
| Legg Mason | 1.4 |
| American Express | 1.3 |
| Johnson & Johnson | 1.3 |
| Medtronic | 1.2 |
| Yahoo! | 1.2 |
| Baker Hughes | 1.2 |
| Total | 45.7% |
| |
| Note: Table excludes investments in the T. Rowe Price Reserve Investment Fund. |
| Major Portfolio Changes |
| Listed in descending order of size |
| Six Months Ended 6/30/05 |
| |
| LARGEST PURCHASES |
| Gillette |
| ExxonMobil |
| Nokia |
| Kohl’s |
| GE |
| Microsoft |
| EMC* |
| Citigroup |
| Harrah’s Entertainment* |
| Intel |
| |
| LARGEST SALES |
| UPS |
| Nucor** |
| Chevron** |
| BHP Billiton |
| Harley-Davidson** |
| Freddie Mac** |
| SAP** |
| eBay |
| Affiliated Computer Services |
| Pfizer |
| * Position added |
| ** Position eliminated |
This chart shows the value of a hypothetical $10,000 investment in the fund over the past 10 fiscal year periods or since inception (for funds lacking 10-year records). The result is compared with benchmarks, which may include a broad-based market index and a peer group average or index. Market indexes do not include expenses, which are deducted from fund returns as well as mutual fund averages and indexes.
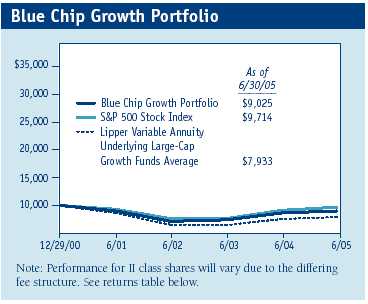
| Average Annual Compound Total Return |
| | | Since | Inception |
| Periods Ended 6/30/05 | 1 Year | Inception | Date |
| Blue Chip Growth Portfolio | 4.05% | -2.25% | 12/29/00 |
| S&P 500 Stock Index | 6.32 | -0.64 | – |
| Lipper Variable Annuity Underlying | | | |
| Large-Cap Growth Funds Average | 4.12 | -5.18 | – |
| Blue Chip Growth Portfolio–II | 3.84 | 3.71 | 4/30/02 |
| S&P 500 Stock Index | 6.32 | 5.10 | – |
| Lipper Variable Annuity Underlying | | | |
| Large-Cap Growth Funds Average | 4.12 | 2.74 | – |
| Current performance may be higher or lower than the quoted past performance, which cannot guarantee future results. Share price, principal value, and return will vary, and you may have a gain or loss when you sell your shares. For the most recent month-end performance information, please visit our Web site (troweprice.com) or contact a T. Rowe Price representative at 1-800-469-5304. Returns do not include charges imposed by your insurance company’s separate account. If these were included, performance would have been lower. |
| This table shows how the portfolios and their benchmarks would have performed each year if their actual (or cumulative) returns for the periods shown had been earned at a constant rate. Average annual total return figures include changes in principal value, reinvested dividends, and capital gain distributions. Returns do not reflect taxes that the shareholder may pay on distributions or the redemption of shares. When assessing performance, investors should consider both short- and long-term returns. |
Fund Expense Example
As a mutual fund shareholder, you may incur two types of costs: (1) transaction costs such as redemption fees or sales loads and (2) ongoing costs, including management fees, distribution and service (12b-1) fees, and other fund expenses. The following example is intended to help you understand your ongoing costs (in dollars) of investing in the fund and to compare these costs with the ongoing costs of investing in other mutual funds. The example is based on an investment of $1,000 invested at the beginning of the most recent six-month period and held for the entire period.
Shares of the fund are currently offered only through certain insurance companies as an investment medium for both variable annuity contracts and variable life insurance policies. Please note that the fund has two classes of shares: the original share class and II class. II class shares are sold through financial intermediaries, which it compensates for distribution, shareholder servicing, and/or certain administrative services under a Board-approved Rule 12b-1 plan.
Actual Expenses
The first line of the following table (“Actual”) provides information about actual account values and actual expenses. You may use the information in this line, together with your account balance, to estimate the expenses that you paid over the period. Simply divide your account value by $1,000 (for example, an $8,600 account value divided by $1,000 = 8.6), then multiply the result by the number in the first line under the heading “Expenses Paid During Period” to estimate the expenses you paid on your account during this period.
Hypothetical Example for Comparison Purposes
The information on the second line of the table (“Hypothetical”) is based on hypothetical account values and expenses derived from the fund’s actual expense ratio and an assumed 5% per year rate of return before expenses (not the fund’s actual return). You may compare the ongoing costs of investing in the fund with other funds by contrasting this 5% hypothetical example and the 5% hypothetical examples that appear in the shareholder reports of the other funds. The hypothetical account values and expenses may not be used to estimate the actual ending account balance or expenses you paid for the period.
You should also be aware that the expenses shown in the table highlight only your ongoing costs and do not reflect any transaction costs, such as redemption fees or sales loads. Therefore, the second line of the table is useful in comparing ongoing costs only and will not help you determine the relative total costs of owning different funds. To the extent a fund charges transaction costs, however, the total cost of owning that fund is higher.
| T. Rowe Price Blue Chip Growth Portfolio |
| | | | Expenses |
| | Beginning | Ending | Paid During |
| | Account | Account | Period* |
| | Value | Value | 1/1/05 to |
| | 1/1/05 | 6/30/05 | 6/30/05 |
| |
| Blue Chip Growth Portfolio | | |
| Actual | $1,000.00 | $ 983.50 | $4.18 |
| Hypothetical | | | |
| (assumes 5% return | | | |
| before expenses) | 1,000.00 | 1,020.58 | 4.26 |
| |
| Blue Chip Growth Portfolio-II | | |
| Actual | 1,000.00 | 982.30 | 5.41 |
| Hypothetical | | | |
| (assumes 5% return | | | |
| before expenses) | 1,000.00 | 1,019.34 | 5.51 |
| * | Expenses are equal to the fund’s annualized expense ratio for the six-month period, multiplied by the average account value over the period, multiplied by the number of days in the most recent fiscal half year (181) divided by the days in the year (365) to reflect the half-year period. The annualized expense ratio of the Blue Chip Growth Portfolio was 0.85%; the Blue Chip Growth Portfolio-II was 1.10%. |
Financial Highlights
T. Rowe Price Blue Chip Growth Portfolio
Unaudited
| For a share outstanding throughout each period |
| |
| Blue Chip Growth Class | |
| | 6 Months | | Year | | | | | 12/29/00 |
| | | Ended | | Ended | | | | | Through |
| | | 6/30/05** | | 12/31/04 | 12/31/03 | 12/31/02 | 12/31/01 |
| NET ASSET VALUE | | | | | | | | | | |
| Beginning of period | $ | 9.09 | $ | 8.41 | $ | 6.54 | $ | 8.61 | $ | 10.00 |
|
|
| Investment activities | | | | | | | | | | |
| Net investment income (loss) | | 0.02 | | 0.04 | | 0.01 | | 0.01 | | 0.01 |
| Net realized and | | | | | | | | | | |
| unrealized gain (loss) | | (0.17) | | 0.69 | | 1.87 | | (2.07) | | (1.39) |
|
|
| Total from | | | | | | | | | | |
| investment activities | | (0.15) | | 0.73 | | 1.88 | | (2.06) | | (1.38) |
|
|
| Distributions | | | | | | | | | | |
| Net investment income | | – | | (0.05) | | (0.01) | | (0.01) | | (0.01) |
|
|
| NET ASSET VALUE | | | | | | | | | | |
| End of period | $ | 8.94 | $ | 9.09 | $ | 8.41 | $ | 6.54 | $ | 8.61 |
|
|
| |
| Ratios/Supplemental Data | | | | | | | | | | |
| Total return^ | | (1.65)% | | 8.69% | | 28.75% | (23.93)% | (13.73)% |
| Ratio of total expenses to | | | | | | | | | | |
| average net assets | | 0.85%† | | 0.85% | | 0.85% | | 0.85% | | 0.85% |
| Ratio of net investment | | | | | | | | | | |
| income (loss) to average | | | | | | | | | | |
| net assets | | 0.37%† | | 0.78%+ | | 0.23% | | 0.14% | | 0.14% |
| Portfolio turnover rate | | 41.5%† | | 17.2% | | 28.8% | | 39.9% | | 42.2% |
| Net assets, end of period | | | | | | | | | | |
| (in thousands) | $ | 77,337 | $ | 76,294 | $ | 28,664 | $ | 7,134 | $ | 6,030 |
| ** | Per share amounts calculated using average shares outstanding method. |
| ^ | Total return reflects the rate that an investor would have earned on an investment in the fund during each period, assuming reinvestment of all distributions. |
| † | Annualized |
| + | Includes the effect of a one-time special dividend (0.53% of average net assets) that is not expected to recur. |
| The accompanying notes are an integral part of these financial statements. |
| For a share outstanding throughout each period |
| Blue Chip Growth–II Class | | | | | | | | |
| | 6 Months | | Year | | | | 4/30/02 |
| | | Ended | | Ended | | | Through |
| | | 6/30/05** | | 12/31/04 | 12/31/03 | 12/31/02 |
| NET ASSET VALUE | | | | | | | | |
| Beginning of period | $ | 9.04 | $ | 8.38 | $ | 6.53 | $ | 7.97 |
|
|
| Investment activities | | | | | | | | |
| Net investment income (loss) | | 0.01 | | 0.05 | | – | | – |
| Net realized and | | | | | | | | |
| unrealized gain (loss) | | (0.17) | | 0.65 | | 1.86 | | (1.43) |
|
|
| Total from | | | | | | | | |
| investment activities | | (0.16) | | 0.70 | | 1.86 | | (1.43) |
|
|
| Distributions | | | | | | | | |
| Net investment income | | – | | (0.04) | | (0.01) | | (0.01) |
|
|
| |
| NET ASSET VALUE | | | | | | | | |
| End of period | $ | 8.88 | $ | 9.04 | $ | 8.38 | $ | 6.53 |
|
|
| |
| Ratios/Supplemental Data | | | | | | | | |
| Total return^ | | (1.77)% | | 8.36% | | 28.49% | | (17.94)% |
|
|
| Ratio of total expenses to average net assets | | 1.10%† | | 1.10% | | 1.10% | | 1.10%† |
|
|
| Ratio of net investment income (loss) | | | | | | | | |
| to average net assets | | 0.15%† | | 0.97%+ | | (0.05)% | | – |
|
|
| Portfolio turnover rate | | 41.5%† | | 17.2% | | 28.8% | | 39.9% |
|
|
| Net assets, end of period (in thousands) | $ | 15,337 | $ | 7,479 | $ | 105 | $ | 82 |
|
|
| ** | Per share amounts calculated using average shares outstanding method. |
| ^ | Total return reflects the rate that an investor would have earned on an investment in the fund during each period, assuming reinvestment of all distributions. |
| † | Annualized |
| + | Includes the effect of a one-time special dividend (0.89% of average net assets) that is not expected to recur. |
| |
| The accompanying notes are an integral part of these financial statements. |
Portfolio of Investments (1)
T. Rowe Price Blue Chip Growth Portfolio
June 30, 2005 (Unaudited)
| | Shares | Value |
| (Cost and value in $ 000s) | | |
| |
| COMMON STOCKS 99.2% | | |
| |
| CONSUMER DISCRETIONARY 15.9% | |
| Diversified Consumer Services 0.9% | | |
| Apollo Group, Class A * | 10,800 | 845 |
| | | 845 |
| Hotels, Restaurants & Leisure 3.8% | | |
| Carnival | 23,900 | 1,304 |
| Harrah’s Entertainment | 7,100 | 512 |
| International Game Technology | 20,500 | 577 |
| Marriott, Class A | 6,600 | 450 |
| McDonald’s | 12,200 | 338 |
| Starbucks * | 1,700 | 88 |
| Wynn Resorts * | 5,700 | 269 |
| | | 3,538 |
| Household Durables 0.3% | | |
| Fortune Brands | 3,600 | 320 |
| | | 320 |
| Internet & Catalog Retail 0.9% | | |
| Amazon.com * | 10,600 | 351 |
| eBay * | 14,100 | 465 |
| | | 816 |
| Media 5.1% | | |
| Comcast, Special Class A * | 24,850 | 744 |
| Disney | 3,000 | 75 |
| Liberty Media, Class A * | 37,200 | 379 |
| McGraw-Hill | 4,700 | 208 |
| News Corp., Class A | 37,800 | 611 |
| Omnicom | 3,390 | 271 |
| Rogers Communications, Class B | 5,800 | 191 |
| Scripps, Class A | 11,000 | 537 |
| Time Warner * | 57,200 | 956 |
| Viacom, Class B | 23,851 | 764 |
| | | 4,736 |
| Multiline Retail 2.7% | | |
| Kohl’s * | 17,800 | 995 |
| Target | 27,070 | 1,473 |
| | | 2,468 |
| Specialty Retail 2.2% | | |
| Best Buy | 10,450 | 716 |
| Home Depot | 33,100 | 1,288 |
| | | 2,004 |
| Total Consumer Discretionary | | 14,727 |
| CONSUMER STAPLES 5.4% | | |
| Beverages 1.1% | | |
| Coca-Cola | 4,550 | 190 |
| PepsiCo | 15,210 | 820 |
| | | 1,010 |
| Food & Staples Retailing 2.6% | | |
| CVS | 13,000 | 378 |
| Sysco | 10,400 | 376 |
| Wal-Mart | 34,460 | 1,661 |
| | | 2,415 |
| Household Products 0.4% | | |
| Procter & Gamble | 7,600 | 401 |
| | | 401 |
| Personal Products 0.9% | | |
| Gillette | 16,300 | 826 |
| | | 826 |
| Tobacco 0.4% | | |
| Altria Group | 6,050 | 391 |
| | | 391 |
| Total Consumer Staples | | 5,043 |
| |
| ENERGY 5.5% | | |
| Energy Equipment & Services 4.2% | | |
| Baker Hughes | 21,370 | 1,093 |
| BJ Services | 2,940 | 154 |
| Schlumberger | 18,300 | 1,390 |
| Smith International | 15,100 | 962 |
| Transocean * | 4,400 | 238 |
| | | 3,837 |
| Oil, Gas & Consumable Fuels 1.3% | | |
| ExxonMobil | 13,600 | 782 |
| Murphy Oil | 7,400 | 386 |
| Total ADR | 500 | 58 |
| | | 1,226 |
| Total Energy | | 5,063 |
| |
| FINANCIALS 20.5% | | |
| Capital Markets 9.5% | | |
| AmeriTrade * | 36,600 | 680 |
| Bank of New York | 5,100 | 147 |
| Charles Schwab | 47,330 | 534 |
| Franklin Resources | 16,500 | 1,270 |
| Goldman Sachs | 7,300 | 745 |
| Legg Mason | 12,200 | 1,270 |
| Mellon Financial | 15,790 | 453 |
| Merrill Lynch | 16,400 | 902 |
| Morgan Stanley | 5,020 | 263 |
| Northern Trust | 17,800 | 812 |
| State Street | 35,100 | 1,694 |
| | | 8,770 |
| Commercial Banks 2.4% | | |
| Bank of America | 21,300 | 971 |
| U.S. Bancorp | 14,100 | 412 |
| Wells Fargo | 13,540 | 834 |
| | | 2,217 |
| Consumer Finance 2.0% | | |
| American Express | 22,680 | 1,207 |
| SLM Corporation | 13,100 | 666 |
| | | 1,873 |
| Diversified Financial Services 3.4% | | |
| Citigroup | 67,530 | 3,122 |
| | | 3,122 |
| Insurance 3.2% | | |
| AFLAC | 1,100 | 48 |
| American International Group | 25,110 | 1,459 |
| Hartford Financial Services | 12,700 | 950 |
| Marsh & McLennan | 17,600 | 487 |
| Willis Group Holdings | 900 | 29 |
| | | 2,973 |
| Total Financials | | 18,955 |
| |
| HEALTH CARE 16.3% | | |
| Biotechnology 3.7% | | |
| Amgen * | 22,500 | 1,360 |
| Biogen Idec * | 4,800 | 165 |
| Genentech * | 12,400 | 996 |
| Gilead Sciences * | 20,400 | 898 |
| | | 3,419 |
| Health Care Equipment & Supplies 2.7% | |
| Biomet | 11,400 | 395 |
| Boston Scientific * | 4,100 | 111 |
| Medtronic | 21,840 | 1,131 |
| St. Jude Medical * | 9,800 | 427 |
| Stryker | 9,200 | 438 |
| | | 2,502 |
| Health Care Providers & Services 6.1% | |
| Caremark RX * | 7,000 | 312 |
| UnitedHealth Group | 64,600 | 3,368 |
| WellPoint * | 29,200 | 2,033 |
| | | 5,713 |
| Pharmaceuticals 3.8% | | |
| Abbott Laboratories | 3,900 | 191 |
| Eli Lilly | 1,000 | 56 |
| IVAX * | 2,100 | 45 |
| Johnson & Johnson | 18,500 | 1,202 |
| Pfizer | 33,548 | 925 |
| Sepracor * | 1,100 | 66 |
| Teva Pharmaceutical ADR | 14,000 | 436 |
| Wyeth | 13,000 | 579 |
| | | 3,500 |
| Total Health Care | | 15,134 |
| |
| INDUSTRIALS & BUSINESS SERVICES 9.5% | |
| Aerospace & Defense 1.8% | | |
| General Dynamics | 2,900 | 318 |
| Honeywell International | 16,700 | 612 |
| Lockheed Martin | 8,700 | 564 |
| Rockwell Collins | 3,000 | 143 |
| | | 1,637 |
| Air Freight & Logistics 0.1% | | |
| UPS, Class B | 900 | 62 |
| | | 62 |
| Commercial Services & Supplies 0.4% | |
| Cendant | 10,100 | 226 |
| ChoicePoint * | 2,600 | 104 |
| | | 330 |
| Industrial Conglomerates 4.5% | | |
| GE | 82,370 | 2,854 |
| Tyco International | 46,330 | 1,353 |
| | | 4,207 |
| Machinery 2.7% | | |
| Danaher | 36,700 | 1,921 |
| Deere | 9,400 | 616 |
| | | 2,537 |
| Road & Rail 0.0% | | |
| Union Pacific | 700 | 45 |
| | | 45 |
| Total Industrials & Business Services | 8,818 |
| |
| INFORMATION TECHNOLOGY 23.5% | |
| Communications Equipment 4.2% | | |
| Cisco Systems * | 66,950 | 1,279 |
| Corning * | 36,200 | 602 |
| Juniper Networks * | 18,500 | 466 |
| Nokia ADR | 46,100 | 767 |
| QUALCOMM | 15,500 | 512 |
| Research In Motion * | 3,900 | 287 |
| | | 3,913 |
| Computers & Peripherals 2.7% | | |
| Dell * | 47,830 | 1,890 |
| EMC * | 42,200 | 578 |
| | | 2,468 |
| Internet Software & Services 2.7% | | |
| Google, Class A * | 3,500 | 1,029 |
| IAC/InterActiveCorp * | 15,000 | 361 |
| Yahoo! * | 32,200 | 1,116 |
| | | 2,506 |
| IT Services 2.3% | | |
| Accenture, Class A * | 15,100 | 342 |
| Affiliated Computer Services | | |
| Class A * | 300 | 15 |
| Automatic Data Processing | 15,000 | 630 |
| First Data | 14,880 | 597 |
| Fiserv * | 8,700 | 374 |
| Paychex | 5,400 | 176 |
| | | 2,134 |
| Semiconductor & Semiconductor Equipment 6.1% | |
| Analog Devices | 22,300 | 832 |
| Intel | 59,900 | 1,561 |
| KLA-Tencor | 2,800 | 123 |
| Linear Technology | 5,700 | 209 |
| Marvell Technology Group * | 9,600 | 365 |
| Maxim Integrated Products | 25,500 | 974 |
| Microchip Technology | 5,600 | 166 |
| Samsung Electronics (KRW) | 300 | 142 |
| Texas Instruments | 22,900 | 643 |
| Xilinx | 24,640 | 628 |
| | | 5,643 |
| Software 5.5% | | |
| Adobe Systems | 16,400 | 469 |
| Intuit * | 12,800 | 578 |
| Microsoft | 114,020 | 2,832 |
| Oracle * | 59,600 | 787 |
| VERITAS Software * | 19,000 | 464 |
| | | 5,130 |
| Total Information Technology | | 21,794 |
| MATERIALS 0.5% | | |
| Chemicals 0.5% | | |
| Monsanto | 6,800 | 427 |
| | | 427 |
| Metals & Mining 0.0% | | |
| BHP Billiton (AUD) | 1,100 | 15 |
| | | 15 |
| Total Materials | | 442 |
| |
| TELECOMMUNICATION SERVICES 2.1% | |
| Diversified Telecommunication Services 0.5% | |
| Telus (Non-voting shares) | 12,400 | 422 |
| | | 422 |
| Wireless Telecommunication Services 1.6% | |
| America Movil ADR, Series L | 6,000 | 357 |
| Nextel Communications | | |
| Class A * | 33,300 | 1,076 |
| Nextel Partners, Class A * | 2,900 | 73 |
| | | 1,506 |
| Total Telecommunication Services | 1,928 |
| Total Common Stocks (Cost $82,792) | 91,904 |
| |
| SHORT-TERM INVESTMENTS 1.7% | |
| Money Market Fund 1.7% | | |
| T. Rowe Price Reserve Investment | |
| Fund, 3.14% #† | 1,567,782 | 1,568 |
| Total Short-Term Investments | |
| (Cost $1,568) | | 1,568 |
| |
| Total Investments in Securities | | |
| 100.9% of Net Assets | | |
| (Cost $84,360) | | $ 93,472 |
| (1) | Denominated in U.S. dollars unless otherwise noted |
| # | Seven-day yield |
| * | Non-income producing |
| † | Affiliated company – See Note 4 |
| ADR | American Depository Receipts |
| AUD | Australian dollar |
| KRW | South Korean won |
| The accompanying notes are an integral part of these financial statements. |
Statement of Assets and Liabilities
T. Rowe Price Blue Chip Growth Portfolio
June 30, 2005 (Unaudited)
(In thousands except shares and per share amounts)
| Assets | | |
| Investments in securities, at value | | |
| Affiliated companies (cost $1,568) | $ | 1,568 |
| Non-affiliated companies (cost $82,792) | | 91,904 |
|
|
| Total investments in securities | | 93,472 |
| Cash | | 48 |
| Dividends receivable | | 79 |
| Receivable for investment securities sold | | 136 |
| Receivable for shares sold | | 93 |
| Total assets | | 93,828 |
|
|
| |
| Liabilities | | |
| Payable for investment securities purchased | | 993 |
| Payable for shares redeemed | | 93 |
| Due to affiliates | | 68 |
|
|
| Total liabilities | | 1,154 |
|
|
| |
| NET ASSETS | $ | 92,674 |
|
|
| Net Assets Consist of: | | |
| Undistributed net investment income (loss) | $ | 146 |
| Undistributed net realized gain (loss) | | (2,631) |
| Net unrealized gain (loss) | | 9,112 |
| Paid-in-capital applicable to 10,373,938 shares of | | |
| $0.0001 par value capital stock outstanding; | | |
| 1,000,000,000 shares of the Corporation authorized | | 86,047 |
|
|
| |
| NET ASSETS | $ | 92,674 |
|
|
| NET ASSET VALUE PER SHARE | | |
| Blue Chip Growth Class | | |
| ($77,337,093/8,646,929 shares outstanding) | $ | 8.94 |
|
|
| Blue Chip Growth–II Class | | |
| ($15,337,183/1,727,009 shares outstanding) | $ | 8.88 |
|
|
| | |
|
|
| The accompanying notes are an integral part of these financial statements. | | |
Statement of Operations
T. Rowe Price Blue Chip Growth Portfolio
(Unaudited)
($ 000s)
| | | 6 Months |
| | | Ended |
| | | 6/30/05 |
| Investment Income (Loss) | | |
| Income | | |
| Dividend | $ | 515 |
| Securities lending | | 1 |
|
|
| Total income | | 516 |
|
|
| Expenses | | |
| Investment management and administrative | | 358 |
| Rule 12b-1 fees - Blue Chip Growth–II Class | | 12 |
|
|
| Total expenses | | 370 |
|
|
| Net investment income (loss) | | 146 |
|
|
| Realized and Unrealized Gain (Loss) | | |
| Net realized gain (loss) | | |
| Securities | | (1,368) |
| Foreign currency transactions | | (2) |
|
|
| Net realized gain (loss) | | (1,370) |
|
|
| Change in net unrealized gain (loss) on securities | | 31 |
|
|
| Net realized and unrealized gain (loss) | | (1,339) |
|
|
| |
| INCREASE (DECREASE) IN NET | | |
| ASSETS FROM OPERATIONS | $ | (1,193) |
|
|
| |
| The accompanying notes are an integral part of these financial statements. |
Statement of Changes in Net Assets
T. Rowe Price Blue Chip Growth Portfolio
(Unaudited)
($ 000s)
| | | 6 Months | | Year |
| | | Ended | | Ended |
| | | 6/30/05 | | 12/31/04 |
| |
| Increase (Decrease) in Net Assets | | | | |
| Operations | | | | |
| Net investment income (loss) | $ | 146 | $ | 386 |
| Net realized gain (loss) | | (1,370) | | 39 |
| Change in net unrealized gain (loss) | | 31 | | 5,761 |
|
|
| Increase (decrease) in net assets from operations | | (1,193) | | 6,186 |
|
|
| Distributions to shareholders | | | | |
| Net investment income | | | | |
| Blue Chip Growth Class | | – | | (404) |
| Blue Chip Growth–II Class | | – | | (30) |
|
|
| Decrease in net assets from distributions | | – | | (434) |
|
|
| Capital share transactions * | | | | |
| Shares sold | | | | |
| Blue Chip Growth Class | | 11,108 | | 45,269 |
| Blue Chip Growth–II Class | | 8,198 | | 7,068 |
| Distributions reinvested | | | | |
| Blue Chip Growth Class | | – | | 404 |
| Blue Chip Growth–II Class | | – | | 30 |
| Shares redeemed | | | | |
| Blue Chip Growth Class | | (8,912) | | (3,311) |
| Blue Chip Growth–II Class | | (300) | | (209) |
|
|
| Increase (decrease) in net assets from | | | | |
| capital share transactions | | 10,094 | | 49,251 |
|
|
| |
| Net Assets | | | | |
| Increase (decrease) during period | | 8,901 | | 55,003 |
| Beginning of period | | 83,773 | | 28,770 |
|
|
| |
| End of period | $ | 92,674 | $ | 83,773 |
|
|
| (Including undistributed net investment income | | | | |
| of $146 at 6/30/05 and $0 at 12/31/04) | | | | |
| |
| *Share information | | | | |
| Shares sold | | | | |
| Blue Chip Growth Class | | 1,271 | | 5,323 |
| Blue Chip Growth–II Class | | 934 | | 835 |
| Distributions reinvested | | | | |
| Blue Chip Growth Class | | – | | 45 |
| Blue Chip Growth–II Class | | – | | 3 |
| Shares redeemed | | | | |
| Blue Chip Growth Class | | (1,015) | | (386) |
| Blue Chip Growth–II Class | | (34) | | (24) |
|
|
| Increase (decrease) in shares outstanding | | 1,156 | | 5,796 |
| |
| The accompanying notes are an integral part of these financial statements. |
Notes to Financial Statements
T. Rowe Price Blue Chip Growth Portfolio
June 30, 2005 (Unaudited)
NOTE 1 - SIGNIFICANT ACCOUNTING POLICIES
T. Rowe Price Equity Series, Inc. (the corporation) is registered under the Investment Company Act of 1940 (the 1940 Act). The Blue Chip Growth Portfolio (the fund) is a diversified, open-end management investment company and is one portfolio established by the corporation. The fund seeks to provide long-term capital growth. Income is a secondary objective. Shares of the fund are currently offered only through certain insurance companies as an investment medium for both variable annuity contracts and variable life insurance policies. The fund has two classes of shares: the Blue Chip Growth Portfolio original share class (Blue Chip Growth Class), offered since December 29, 2000, and Blue Chip Growth Portfolio–II (Blue Chip Growth–II Class), offered since April 30, 2002. Blue Chip Growth–II shares are sold through financial intermediaries, which it compensates for distribution, shareholder servicing, and/or certain administrative services under a Board-approved Rule 12b-1 plan. Each class has exclusive voting rights on matters related solely to that class, separate voting rights on matters that relate to both classes, and, in all other respects, the same rights and obligations as the other class.
The accompanying financial statements were prepared in accordance with accounting principles generally accepted in the United States of America, which require the use of estimates made by fund management. Fund management believes that estimates and security valuations are appropriate; however, actual results may differ from those estimates, and the security valuations reflected in the financial statements may differ from the value the fund receives upon sale of the securities.
Valuation The fund values its investments and computes its net asset value per share at the close of the New York Stock Exchange (NYSE), normally 4 p.m. ET, each day that the NYSE is open for business. Equity securities listed or regularly traded on a securities exchange or in the over-the-counter market are valued at the last quoted sale price or, for certain markets, the official closing price at the time the valuations are made, except for OTC Bulletin Board securities, which are valued at the mean of the latest bid and asked prices. A security that is listed or traded on more than one exchange is valued at the quotation on the exchange determined to be the primary market for such security. Listed securities not traded on a particular day are valued at the mean of the latest bid and asked prices for domestic securities and the last quoted sale price for international securities. Investments in mutual funds are valued at the mutual fund’s closing net asset value per share on the day of valuation.
Other investments, including restricted securities, and those for which the above valuation procedures are inappropriate or are deemed not to reflect fair value are stated at fair value as determined in good faith by the T. Rowe Price Valuation Committee, established by the fund’s Board of Directors.
Most foreign markets close before the close of trading on the NYSE. If the fund determines that developments between the close of a foreign market and the close of the NYSE will, in its judgment, materially affect the value of some or all of its portfolio securities, which in turn will affect the fund’s share price, the fund will adjust the previous closing prices to reflect the fair value of the securities as of the close of the NYSE, as determined in good faith by the T. Rowe Price Valuation Committee, established by the fund’s Board of Directors. A fund may also fair value securities in other situations, such as when a particular foreign market is closed but the fund is open. In deciding whether to make fair value adjustments, the fund reviews a variety of factors, including developments in foreign markets, the performance of U.S. securities markets, and the performance of instruments trading in U.S. markets that represent foreign securities and baskets of foreign securities. The fund uses outside pricing services to provide it with closing market prices and information used for adjusting those prices. The fund cannot predict when and how often it will use closing prices and when it will adjust those prices to reflect fair value. As a means of evaluating its fair value process, the fund routinely compares closing market prices, the next day’s opening prices in the same markets, and adjusted prices.
Currency Translation Assets, including investments, and liabilities denominated in foreign currencies are translated into U.S. dollar values each day at the prevailing exchange rate, using the mean of the bid and asked prices of such currencies against U.S. dollars as quoted by a major bank. Purchases and sales of securities, income, and expenses are translated into U.S. dollars at the prevailing exchange rate on the date of the transaction. The effect of changes in foreign currency exchange rates on realized and unrealized security gains and losses is reflected as a component of security gains and losses.
Class Accounting Blue Chip Growth–II pays distribution, shareholder servicing, and/or certain administrative expenses in the form of Rule 12b-1 fees, in an amount not exceeding 0.25% of the class’s average daily net assets. Management and administrative fee expenses, investment income, and realized and unrealized gains and losses are allocated to the classes based upon the relative daily net assets of each class.
Investment Transactions, Investment Income, and Distributions Income and expenses are recorded on the accrual basis. Dividends received from mutual fund investments are reflected as dividend income; capital gain distributions are reflected as realized gain/loss. Dividend income and capital gain distributions are recorded on the ex-dividend date. Investment transactions are accounted for on the trade date. Realized gains and losses are reported on the identified cost basis. Distributions to shareholders are recorded on the ex-dividend date. Income distributions are declared and paid by each class on an annual basis. Capital gain distributions, if any, are declared and paid by the fund, typically on an annual basis.
NOTE 2 - INVESTMENT TRANSACTIONS
Consistent with its investment objective, the fund engages in the following practices to manage exposure to certain risks or enhance performance. The investment objective, policies, program, and risk factors of the fund are described more fully in the fund’s prospectus and Statement of Additional Information.
Securities Lending The fund lends its securities to approved brokers to earn additional income. It receives as collateral cash and U.S. government securities valued at 102% to 105% of the value of the securities on loan. Cash collateral is invested in a money market pooled trust managed by the fund’s lending agent in accordance with investment guidelines approved by fund management. Collateral is maintained over the life of the loan in an amount not less than the value of loaned securities, as determined at the close of fund business each day; any additional collateral required due to changes in security values is delivered to the fund the next business day. Although risk is mitigated by the collateral, the fund could experience a delay in recovering its securities and a possible loss of income or value if the borrower fails to return the securities. Securities lending revenue recognized by the fund consists of earnings on invested collateral and borrowing fees, net of any rebates to the borrower and compensation to the lending agent. At June 30, 2005, there were no securities on loan.
Other Purchases and sales of portfolio securities, other than short-term securities, aggregated $28,072,000 and $17,491,000, respectively, for the six months ended June 30, 2005.
NOTE 3 - FEDERAL INCOME TAXES
No provision for federal income taxes is required since the fund intends to continue to qualify as a regulated investment company under Subchapter M of the Internal Revenue Code and distribute to shareholders all of its taxable income and gains. Federal income tax regulations differ from generally accepted accounting principles; therefore, distributions determined in accordance with tax regulations may differ in amount or character from net investment income and realized gains for financial reporting purposes. Financial reporting records are adjusted for permanent book/tax differences to reflect tax character. Financial records are not adjusted for temporary differences. The amount and character of tax-basis distributions and composition of net assets are finalized at fiscal year-end; accordingly, tax-basis balances have not been determined as of June 30, 2005.
The fund intends to retain realized gains to the extent of available capital loss carryforwards. As of December 31, 2004, the fund had $1,261,000 of unused capital loss carryforwards, of which $435,000 expire in 2009, $491,000 expire in 2010, and $335,000 expire in 2011.
At June 30, 2005, the cost of investments for federal income tax purposes was $84,360,000. Net unrealized gain aggregated $9,112,000 at period-end, of which $10,841,000 related to appreciated investments and $1,729,000 related to depreciated investments.
NOTE 4 - RELATED PARTY TRANSACTIONS
The fund is managed by T. Rowe Price Associates, Inc. (the manager or Price Associates), a wholly owned subsidiary of T. Rowe Price Group, Inc. The investment management and administrative agreement between the fund and the manager provides for an all-inclusive annual fee equal to 0.85% of the fund’s average daily net assets. The fee is computed daily and paid monthly. The agreement provides that investment management, shareholder servicing, transfer agency, accounting, and custody services are provided to the fund, and interest, taxes, brokerage commissions, directors’ fees and expenses, and extraordinary expenses are paid directly by the fund.
The fund may invest in the T. Rowe Price Reserve Investment Fund and the T. Rowe Price Government Reserve Investment Fund (collectively, the Reserve Funds), open-end management investment companies managed by Price Associates and affiliates of the fund. The Reserve Funds are offered as cash management options to mutual funds, trusts, and other accounts managed by Price Associates and/or its affiliates, and are not available for direct purchase by members of the public. The Reserve Funds pay no investment management fees. During the six months ended June 30, 2005, dividend income from the Reserve Funds totaled $15,000, and the value of shares of the Reserve Funds held at June 30, 2005 and December 31, 2004 was $1,568,000 and $1,826,000, respectively.| Information on Proxy Voting Policies, Procedures, and Records |
A description of the policies and procedures used by T. Rowe Price funds and portfolios to determine how to vote proxies relating to portfolio securities is available in each fund’s Statement of Additional Information, which you may request by calling 1-800-225-5132 or by accessing the SEC’s Web site, www.sec.gov. The description of our proxy voting policies and procedures is also available on our Web site, www.troweprice.com. To access it, click on the words “Company Info” at the top of our homepage for individual investors. Then, in the window that appears, click on the “Proxy Voting Policy” navigation button in the top left corner.
Each fund’s most recent annual proxy voting record is available on our Web site and through the SEC’s Web site. To access it through our Web site, follow the directions above, then click on the words “Proxy Voting Record” at the bottom of the Proxy Voting Policy page.
| How to Obtain Quarterly Portfolio Holdings |
The fund files a complete schedule of portfolio holdings with the Securities and Exchange Commission for the first and third quarters of each fiscal year on Form N-Q. The fund’s Form N-Q is available electronically on the SEC’s Web site (www.sec.gov); hard copies may be reviewed and copied at the SEC’s Public Reference Room, 450 Fifth St. N.W., Washington, DC 20549. For more information on the Public Reference Room, call 1-800-SEC-0330.
| Approval of Investment Management Agreement |
On March 2, 2005, the fund’s Board of Directors unanimously approved the investment advisory contract (“Contract”) between the fund and its investment manager, T. Rowe Price Associates, Inc. (“Manager”). The Board considered a variety of factors in connection with its review of the Contract, also taking into account information provided by the Manager during the course of the year, as discussed below:
Services Provided by the Manager
The Board considered the nature, quality, and extent of the services provided to the fund by the Manager. These services included, but were not limited to, management of the fund’s portfolio and a variety of activities related to portfolio management. The Board also reviewed the background and experience of the Manager’s senior management team and investment personnel involved in the management of the fund. The Board concluded that it was satisfied with the nature, quality, and extent of the services provided by the Manager.
Investment Performance of the Fund
The Board reviewed the fund’s year-by-year returns and compared these returns to previously agreed upon comparable performance measures and market data, including those supplied by Lipper and Morningstar, which are independent providers of mutual fund data. On the basis of this evaluation and the Board’s ongoing review of investment results, the Board concluded that the fund’s performance was satisfactory.
Costs, Benefits, Profits, and Economies of Scale
The Board reviewed detailed information regarding the revenues received by the Manager under the Contract and other benefits that the Manager (and its affiliates) may have realized from its relationship with the fund, including research received under “soft dollar” agreements. The Board also received information on the estimated costs incurred and profits realized by the Manager and its affiliates from advising T. Rowe Price mutual funds, as well as estimates of the gross profits realized from managing the fund in particular. The Board concluded that the Manager’s profits were reasonable in light of the services provided to the fund. The Board also considered whether the fund or other funds benefit under the fee levels set forth in the Contract from any economies of scale realized by the Manager. The Board noted that, under the Contract, the fund pays the Manager a single fee based on the fund’s assets and the Manager, in turn, pays all expenses of the fund, with certain exceptions. The Board concluded that, based on the profitability data it reviewed and consistent with this single fee structure, the Contract provided for a reasonable sharing of benefits from any economies of scale with the fund.
Fees
The Board reviewed the fund’s single-fee structure and compared the rate to fees and expenses of other comparable funds based on information and data supplied by Lipper. The information provided to the Board indicated that the fund’s single fee rate was generally below the median management fee rate and expense ratio for comparable funds. The Board also reviewed the expense ratio of the fund’s Class II share class, which pays a 12b-1 fee in addition to the single fee, and compared this expense ratio to the fees and expenses of comparable funds. The information provided to the Board indicated that the expense ratio for the Class II share class was generally below the median expense ratio for comparable funds. The Board also reviewed the fee schedules for comparable privately managed accounts of the Manager and its affiliates. Management informed the Board that the Manager’s responsibilities for privately managed accounts are more limited than its responsibilities for the fund and other T. Rowe Price mutual funds that it or its affiliates advise. On the basis of the information provided, the Board concluded that the fees paid by the fund under the Contract were reasonable.
Approval of the Contract
As noted, the Board approved the continuation of the Contract. No single factor was considered in isolation or to be determinative to the decision. Rather, the Board concluded, in light of a weighting and balancing of all factors considered, that it was in the best interests of the fund to approve the continuation of the Contract, including the fees to be charged for services thereunder.
Item 2. Code of Ethics.
A code of ethics, as defined in Item 2 of Form N-CSR, applicable to its principal executive officer, principal financial officer, principal accounting officer or controller, or persons performing similar functions is filed as an exhibit to the registrant’s annual Form N-CSR. No substantive amendments were approved or waivers were granted to this code of ethics during the registrant’s most recent fiscal half-year.
Item 3. Audit Committee Financial Expert.
Disclosure required in registrant’s annual Form N-CSR.
Item 4. Principal Accountant Fees and Services.
Disclosure required in registrant’s annual Form N-CSR.
Item 5. Audit Committee of Listed Registrants.
Not applicable.
Item 6. Schedule of Investments.
Not applicable. The complete schedule of investments is included in Item 1 of this Form N-CSR.
Item 7. Disclosure of Proxy Voting Policies and Procedures for Closed-End Management Investment Companies.
Not applicable.
Item 8. Portfolio Managers of Closed-End Management Investment Companies.
Not applicable.
Item 9. Purchases of Equity Securities by Closed-End Management Investment Company and Affiliated Purchasers.
Not applicable.
Item 10. Submission of Matters to a Vote of Security Holders.
Not applicable.
Item 11. Controls and Procedures.
(a) The registrant’s principal executive officer and principal financial officer have evaluated the registrant’s disclosure controls and procedures within 90 days of this filing and have concluded that the registrant’s disclosure controls and procedures were effective, as of that date, in ensuring that information required to be disclosed by the registrant in this Form N-CSR was recorded, processed, summarized, and reported timely.
(b) The registrant’s principal executive officer and principal financial officer are aware of no change in the registrant’s internal control over financial reporting that occurred during the registrant’s second
fiscal quarter covered by this report that has materially affected, or is reasonably likely to materially affect, the registrant’s internal control over financial reporting.
Item 12. Exhibits.
(a)(1) The registrant’s code of ethics pursuant to Item 2 of Form N-CSR is filed with the registrant’s annual Form N-CSR.
(2) Separate certifications by the registrant's principal executive officer and principal financial officer, pursuant to Section 302 of the Sarbanes-Oxley Act of 2002 and required by Rule 30a-2(a) under the Investment Company Act of 1940, are attached.
(3) Written solicitation to repurchase securities issued by closed-end companies: not applicable.
(b) A certification by the registrant's principal executive officer and principal financial officer, pursuant to Section 906 of the Sarbanes-Oxley Act of 2002 and required by Rule 30a-2(b) under the Investment Company Act of 1940, is attached.
SIGNATURES |
| |
| | Pursuant to the requirements of the Securities Exchange Act of 1934 and the Investment |
| Company Act of 1940, the registrant has duly caused this report to be signed on its behalf by the |
| undersigned, thereunto duly authorized. |
| |
| T. Rowe Price Equity Series, Inc. |
| |
| By | /s/ James S. Riepe |
| | James S. Riepe |
| | Principal Executive Officer |
| |
| Date | August 18, 2005 |
| |
| |
| | Pursuant to the requirements of the Securities Exchange Act of 1934 and the Investment |
| Company Act of 1940, this report has been signed below by the following persons on behalf of |
| the registrant and in the capacities and on the dates indicated. |
| |
| |
| By | /s/ James S. Riepe |
| | James S. Riepe |
| | Principal Executive Officer |
| |
| Date | August 18, 2005 |
| |
| |
| |
| By | /s/ Joseph A. Carrier |
| | Joseph A. Carrier |
| | Principal Financial Officer |
| |
| Date | August 18, 2005 |