Item 1: Report to Shareholders| Personal Strategy Balanced Portfolio | June 30, 2005 |
The views and opinions in this report were current as of June 30, 2005. They are not guarantees of performance or investment results and should not be taken as investment advice. Investment decisions reflect a variety of factors, and the managers reserve the right to change their views about individual stocks, sectors, and the markets at any time. As a result, the views expressed should not be relied upon as a forecast of the fund’s future investment intent. The report is certified under the Sarbanes-Oxley Act of 2002, which requires mutual funds and other public companies to affirm that, to the best of their knowledge, the information in their financial reports is fairly and accurately stated in all material respects.
Fellow Shareholders
Stronger stock markets during the first half of the Personal Strategy Balanced Portfolio’s fiscal year more than offset weakness over the second half, producing favorable returns for the 12-month period ended June 30, 2005. Even though the Federal Reserve raised short-term interest rates nine times since mid-2004, investment-grade bonds, particularly long-term issues, produced unexpectedly good returns in both periods. Non-U.S. equities in developed countries performed on par with their domestic counterparts in the last six months primarily because the U.S. dollar rebounded from multiyear lows, but they strongly outperformed for the 12-month period. Your portfolio, aided by higher exposure to stocks, registered solid gains for the 12 months but posted a slight gain for the six-month period.
Market Environment
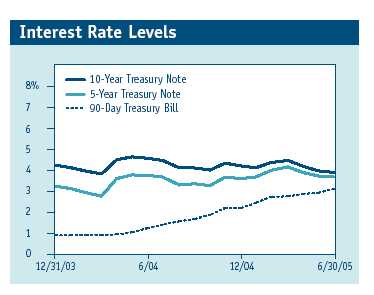
Twelve months ago, strong U.S. economic growth and signs of rising inflation prompted the Federal Reserve to warn investors that it would soon begin raising rates from the low levels that had prevailed for several years. From June 2004 through June 2005, the central bank gradually lifted the federal funds target rate—an overnight intrabank lending rate—from a 46-year low of 1.00% to 3.25% in nine quarter-point increments. Despite these rate increases and higher oil prices, the economy expanded—albeit with some “soft patches.”
Money market yields, which closely track the fed funds rate, rose substantially during the last 12 months. In contrast, long-term interest rates declined, an unexpected development that Federal Reserve Chairman Alan Greenspan called a “conundrum.” As a result, the difference between short- and long-term interest rates significantly narrowed during our fiscal year, generating a flattened Treasury yield curve (a graphic depiction of the relationship between short- and longer-term yields).
Despite rising short-term rates in the U.S., bond returns were generally favorable in the last six months. Treasuries, investment-grade corporates, mortgage-backed securities, and high-yield securities (below investment-grade) posted positive returns. For the 12-month period, bond returns were more robust. High-yield securities strongly outperformed, followed by investment-grade corporate bonds and Treasuries. Mortgage-backed securities trailed but still performed well.
U.S. stocks advanced over the last 12 months, overcoming concerns about high oil prices, rising interest rates, and periodic reports of slowing growth and job creation. Large-cap shares fared better than their small-cap counterparts in the last six months, but the reverse was true for the one-year period. Among large-cap stocks, value stocks outpaced growth for the 6- and 12-month periods.
| Major Index Returns |
| Periods Ended 6/30/05 | 6 Months | 12 Months |
| S&P 500 Stock Index | -0.81% | 6.32% |
| Dow Jones Wilshire 4500 Index | 2.19 | 14.49 |
| MSCI EAFE Index | -0.85 | 14.13 |
Non-U.S. stocks in developed markets produced solid returns in local currency over the last six months. However, a stronger dollar during this period eroded returns to U.S. investors. Returns for the full year were strong in local currency and for U.S. investors. European shares fared better than Japanese stocks in both periods.
Performance Review
The Personal Strategy Balanced Portfolio’s investment objective is to generate the highest total return consistent with an equal emphasis on income and capital appreciation. The typical asset mix of securities is 60% stocks, 30% bonds, and 10% cash, although allocations can vary by as much as 10 percentage points above or below these levels.
| Performance Comparison |
| Periods Ended 6/30/05 | 6 Months | 12 Months |
| Personal Strategy | | |
| Balanced Portfolio | 0.46% | 9.51% |
| Combined Index Portfolio* | 0.86 | 7.91 |
| Merrill Lynch-Wilshire Capital | |
| Market Index | 0.82 | 7.79 |
| * An unmanaged portfolio composed of 60% stocks (51% |
| Wilshire 5000, 9% MSCI EAFE Index), 30% bonds (Lehman |
| Brothers U.S. Aggregate Index), and 10% money market |
| securities (Citigroup 3-Month Treasury Bill Index). |
The Personal Strategy Balanced Portfolio posted gains for the six and 12 months ended June 30, 2005, as shown in the table. The portfolio outpaced the Combined Index Portfolio benchmark and the Merrill Lynch-Wilshire Capital Market Index for the 12-month period, aided by our heavier exposure to stocks relative to bonds and the strong performance of our non-U.S. equities. For the most recent six months, the portfolio lagged slightly behind the two indices. The non-U.S. equity holdings helped performance, but the allocations to large-cap growth stocks and high-yield bonds modestly hurt results relative to the benchmark.
Reflecting our decision to reduce fixed-income exposure, the portfolio’s bond allocation of 27.2% was significantly lower than 12 months ago. The fund’s cash position was increased to 6.0%, a healthy increase from the end of June 2004. During the year, as mentioned in the Portfolio Review section, we reallocated our stock holdings, reducing small-cap, large-cap value, and non-U.S. equity positions and supplementing our large-cap growth holdings.
Portfolio Review
The portfolio’s investment committee meets on a monthly basis during the year to adjust the weightings of stocks, bonds, and money market securities within the appropriate ranges for each fund. Economic fundamentals and market conditions drive these allocation changes.
In the spring of 2004, the economy was showing signs of sustained recovery. We anticipated that the Fed would begin a tightening process, so we continued decreasing our allocation to bonds and increasing our holdings of stocks and cash. With stocks outperforming bonds for the 12-month period, the increased allocation to stocks was beneficial. In addition, by adding to our cash position, we were able to capture rising short-term yields.
Within our stock holdings, we reduced our allocation to small-caps and increased our large-cap allocation. We believed the strong multiyear rally in small-caps was losing its momentum and that small-cap valuations were no longer compelling. Our underweight in this sector was beneficial over the last six months as small-caps posted negative returns, although this underweight was a slightly negative contributor over the full 12 months. We redirected assets from small-cap to our large-cap holdings, particularly large-cap growth stocks. With the economic recovery and corporate profit growth leveling off, we believed that investors would follow historical precedents and pay a premium for those high-quality large-cap companies whose earnings grow faster than the market. Our overweighting in large-cap growth holdings detracted slightly from the portfolios’ performance relative to their weighted benchmarks for the fiscal year.
Strong returns in non-U.S. markets in 2004 boosted the fund’s performance for the fiscal year. However, given several years of solid performance by non-U.S. equities and the prospects of formidable profit growth in U.S. companies, we reduced our allocation to non-U.S. equities in early 2005 and increased our purchases of U.S. equities, continuing a trend we began in 2004.
In anticipation of higher interest rates, we embarked on a defensive strategy with our fixed-income allocation. Over the past 12 months, we reduced the overall allocation of bonds, shortened maturities within the bond portfolio, and reduced our high-yield bond allocation in favor of investment-grade issues.
Among our major equity holdings, Microsoft, which maintains a large cash hoard even after distributing a $32 billion special dividend in late 2004, generates solid revenue and earnings and maintains its 60% operating margins. Nevertheless, it continues to trade at a discount relative to its peers. The company is no longer solely a software company. Microsoft has expanded into home entertainment with its Xbox video game console and is likely to solidify its presence with the 2007 release of its next generation operating systems software. Through its recent acquisitions, UnitedHealth Group has gained market share while maintaining a strong balance sheet. The company has diversified its revenue base and improved its operating margins. Although American International Group shares tumbled after it disclosed there had been improper accounting of certain transactions, it finished the quarter with much improved results and stock performance. We believe the company has a strong business and will overcome its current difficulties. Citigroup is benefiting from increased investment banking activity, continued credit improvements, below-average interest rate sensitivity, and prudent capital management. The economy’s recovery is improving fundamentals across General Electric’s business lines. The company’s largest businesses, power and aerospace, are poised to generate double-digit earnings per share growth during the next two years. Also, the health care division is introducing new products, and NBC/Universal is improving despite the loss of some key programs. (Please refer to our portfolio of investments for a complete listing of its holdings and the amount each represents in the portfolio.)
Outlook
The Federal Reserve has not given any sign that it is about to change its policy and stop the measured, upward climb in short-term interest rates, and, therefore, it is quite likely that short-term rates will continue to rise. Determining when long-term rates begin to move in the same direction as short-term rates is the enigma that even Mr. Greenspan can’t seem to answer. We are not certain that the equity markets will outperform bonds or cash in the next three to six months, but we believe that equities will outperform bonds over the intermediate and longer terms, hence our current overweighting in equities. The portfolio also maintains solid allocations in fixed income and cash to dampen overall portfolio volatility and moderate risk. Investors should be well served by this fundamental commitment to diversification across asset classes.
Respectfully submitted,

Edmund M. Notzon III
Chairman of the portfolio’s Investment Advisory Committee
July 22, 2005
The committee chairman has day-to-day responsibility for managing the portfolio and works with committee members in developing and executing the portfolio’s investment program.
As with all stock and bond mutual funds, each fund’s share price can fall because of weakness in the stock or bond markets, a particular industry, or specific holdings. Stock markets can decline for many reasons, including adverse political or economic developments, changes in investor psychology, or heavy institutional selling. The prospects for an industry or company may deteriorate because of a variety of factors, including disappointing earnings or changes in the competitive environment. In addition, the investment manager’s assessment of companies held in a fund may prove incorrect, resulting in losses or poor performance even in rising markets.
Bonds are subject to interest rate risk, the decline in bond prices that usually accompanies a rise in interest rates, and credit risk, the chance that any fund holding could have its credit rating downgraded or that a bond issuer will default (fail to make timely payments of interest or principal), potentially reducing the fund’s income level and share price. High-yield corporate bonds could have greater price declines than funds that invest primarily in high-quality bonds. Companies issuing high-yield bonds are not as strong financially as those with higher credit ratings, so the bonds are usually considered speculative investments.
Funds that invest overseas may carry more risk than funds that invest strictly in U.S. assets. Risks can result from varying stages of economic and political development; differing regulatory environments, trading days, and accounting standards; and higher transaction costs of non-U.S. markets. Non-U.S. investments are also subject to currency risk, or a decline in the value of a foreign currency versus the U.S. dollar, which reduces the dollar value of securities denominated in that currency.
Citigroup 3-Month Treasury Bill Index: An unmanaged index that tracks short-term U.S. government debt instruments.
CS First Boston High Yield Index: An unmanaged index constructed to mirror the high-yield debt market.
Dow Jones Wilshire 4500 Index: An unmanaged index that tracks the performance of all stocks in the Wilshire 5000 Equity Index, excluding those found in the S&P 500 Stock Index.
Dow Jones Wilshire 5000 Index: An unmanaged index that tracks the performance of the most active stocks in the broad U.S. market.
Duration: The average time (expressed in years) it takes investors to receive the present value of the future cash flows on their investment. It is used to measure the sensitivity of bond prices to interest rate changes (the shorter the duration, the less the bond’s price will rise or fall in value when interest rates change). Duration is affected by maturity, the coupon, and the time interval between payments. Other things being equal, a bond with a higher coupon will have a shorter duration, while zero-coupon bonds have the longest.
Lehman Brothers U.S. Aggregate Index: An unmanaged index that tracks investment-grade corporate and government bonds.
Merrill Lynch-Wilshire Capital Market Index: A market capitalization-weighted index including the Wilshire 5000 and Merrill Lynch High Yield II and Domestic Master indexes.
MSCI EAFE Index: An unmanaged index that tracks the stocks of about 1,000 companies in Europe, Australasia, and the Far East (EAFE).
S&P 500 Stock Index: An unmanaged index that tracks the stocks of 500 primarily large-cap U.S. companies.
Portfolio Highlights
| | Percent of |
| | Net Assets |
| | 6/30/05 |
| Reserves | 6.0% |
| Money Market Funds | 6.8 |
| Other Assets Less Liabilities | -0.8 |
| Bonds | 27.2% |
| Stocks | 66.8% |
| Largest Holdings | |
| Microsoft | 1.7% |
| UnitedHealth Group | 1.1 |
| American International Group | 1.0 |
| Citigroup | 1.0 |
| First Data | 0.9 |
| GE | 0.9 |
| Tyco International | 0.9 |
| Intel | 0.8 |
| Home Depot | 0.8 |
| Baker Hughes | 0.7 |
This chart shows the value of a hypothetical $10,000 investment in the fund over the past 10 fiscal year periods or since inception (for funds lacking 10-year records). The result is compared with benchmarks, which may include a broad-based market index and a peer group average or index. Market indexes do not include expenses, which are deducted from fund returns as well as mutual fund averages and indexes.

| Average Annual Compound Total Return |
| Periods Ended 6/30/05 | 1 Year | 5 Years | 10 Years |
| Personal Strategy Balanced Portfolio | 9.51% | 5.53% | 9.55% |
| Combined Index Portfolio* | 7.91 | 2.14 | 8.37 |
| Merrill Lynch-Wilshire Capital | | | |
| Market Index | 7.79 | 1.32 | 8.61 |
| * | An unmanaged portfolio composed of 60% stocks (51% Wilshire 5000, 9% |
| | MSCI EAFE Index), 30% bonds (Lehman Brothers U.S. Aggregate Index), and |
| | 10% money market securities (Citigroup 3-Month Treasury Bill Index). |
Current performance may be higher or lower than the quoted past performance, which cannot guarantee future results. Share price, principal value, and return will vary, and you may have a gain or loss when you sell your shares. For the most recent month-end performance information, please visit our Web site (troweprice.com) or contact a T. Rowe Price representative at 1-800-469-5304.
This table shows how the portfolio would have performed each year if its actual (or cumulative) returns for the periods shown had been earned at a constant rate. Average annual total return figures include changes in principal value, reinvested dividends, and capital gain distributions. Total returns do not include charges imposed by your insurance company’s separate account. If these were included, performance would have been lower. When assessing performance, investors should consider both short- and long-term returns.
Fund Expense Example
As a mutual fund shareholder, you may incur two types of costs: (1) transaction costs such as redemption fees or sales loads and (2) ongoing costs, including management fees, distribution and service (12b-1) fees, and other fund expenses. The following example is intended to help you understand your ongoing costs (in dollars) of investing in the fund and to compare these costs with the ongoing costs of investing in other mutual funds. The example is based on an investment of $1,000 invested at the beginning of the most recent six-month period and held for the entire period.
Actual Expenses
The first line of the following table (“Actual”) provides information about actual account values and actual expenses. You may use the information in this line, together with your account balance, to estimate the expenses that you paid over the period. Simply divide your account value by $1,000 (for example, an $8,600 account value divided by $1,000 = 8.6), then multiply the result by the number in the first line under the heading “Expenses Paid During Period” to estimate the expenses you paid on your account during this period.
Hypothetical Example for Comparison Purposes
The information on the second line of the table (“Hypothetical”) is based on hypothetical account values and expenses derived from the fund’s actual expense ratio and an assumed 5% per year rate of return before expenses (not the fund’s actual return). You may compare the ongoing costs of investing in the fund with other funds by contrasting this 5% hypothetical example and the 5% hypothetical examples that appear in the shareholder reports of the other funds. The hypothetical account values and expenses may not be used to estimate the actual ending account balance or expenses you paid for the period.
You should also be aware that the expenses shown in the table highlight only your ongoing costs and do not reflect any transaction costs, such as redemption fees or sales loads. Therefore, the second line of the table is useful in comparing ongoing costs only, and will not help you determine the relative total costs of owning different funds. To the extent a fund charges transaction costs, however, the total cost of owning that fund is higher.
T. Rowe Price Personal Strategy
Balanced Portfolio |
|
| | | | Expenses |
| | Beginning | Ending | Paid During |
| | Account | Account | Period* |
| | Value | Value | 1/1/05 to |
| | 1/1/05 | 6/30/05 | 6/30/05 |
| Actual | $1,000.00 | $1,004.60 | $4.37 |
| Hypothetical | | | |
| (assumes 5% return | | | |
| before expenses) | 1,000.00 | 1,020.43 | 4.41 |
| * Expenses are equal to the fund’s annualized expense ratio for the six-month |
| period (0.88%), multiplied by the average account value over the period, mul- |
| tiplied by the number of days in the most recent fiscal half year (181) divided |
| by the days in the year (365) to reflect the half-year period. |
Financial Highlights
T. Rowe Price Personal Strategy Balanced Portfolio
(Unaudited)
| | For a share outstanding throughout each period |
|
|
| |
| | | 6 Months | | Year | | | | | | | | |
| | | Ended | | Ended | | | | | | | | |
| | | 6/30/05** | | 12/31/04 | | 12/31/03 | | 12/31/02 | | 12/31/01 | | 12/31/00 |
| NET ASSET VALUE | | | | | | | | | | | | |
| Beginning of period | $ | 17.76 | $ | 16.13 | $ | 13.22 | $ | 14.72 | $ | 15.54 | $ | 16.00 |
|
|
| Investment activities | | | | | | | | | | | | |
| Net investment income (loss) | | 0.17* | | 0.34* | | 0.32* | | 0.36 | | 0.43 | | 0.49 |
| Net realized and | | | | | | | | | | | | |
| unrealized gain (loss) | | (0.09) | | 1.70 | | 2.92 | | (1.50) | | (0.82) | | 0.35 |
|
|
| Total from | | | | | | | | | | | | |
| investment activities | | 0.08 | | 2.04 | | 3.24 | | (1.14) | | (0.39) | | 0.84 |
|
|
| Distributions | | | | | | | | | | | | |
| Net investment income | | (0.16) | | (0.34) | | (0.32) | | (0.36) | | (0.43) | | (0.48) |
| Net realized gain | | – | | (0.07) | | (0.01) | | – | | – | | (0.82) |
|
|
| Total distributions | | (0.16) | | (0.41) | | (0.33) | | (0.36) | | (0.43) | | (1.30) |
|
|
| NET ASSET VALUE | | | | | | | | | | | | |
| End of period | $ | 17.68 | $ | 17.76 | $ | 16.13 | $ | 13.22 | $ | 14.72 | $ | 15.54 |
|
|
| |
| Ratios/Supplemental Data | | | | | | | | | | | | |
| Total return^ | | 0.46%* | | 12.80%* | | 24.80%* | | (7.80)% | | (2.41)% | | 5.41% |
| Ratio of total expenses to | | | | | | | | | | | | |
| average net assets | | 0.88%*† | | 0.87%* | | 0.88%* | | 0.90% | | 0.90% | | 0.90% |
| Ratio of net investment | | | | | | | | | | | | |
| income (loss) to average | | | | | | | | | | | | |
| net assets | | 1.92%*† | | 2.03%*+ | | 2.19%* | | 2.57% | | 2.91% | | 3.08% |
| Portfolio turnover rate | | 65.3%¤† | | 72.5% | | 73.8% | | 100.9% | | 81.5% | | 55.4% |
| Net assets, end of period | | | | | | | | | | | | |
| (in thousands) | $ | 130,570 | $ | 125,949 | $ | 106,206 | $ | 89,690 | $ | 103,413 | $ | 109,713 |
| ^ | Total return reflects the rate that an investor would have earned on an investment in the fund during |
| | each period, assuming reinvestment of all distributions. |
| * | See Note 4. Excludes expenses permanently waived of 0.02%, 0.03%, and 0.02% of average net assets for |
| the periods ended 6/30/05, 12/31/04, and 12/31/03 respectively, related to investments in TRP mutual funds. |
| + | Includes the effect of a one-time special dividend (0.14% of average net assets) that is not expected to recur. |
| ** | Per share amounts calculated using average shares outstanding method. |
| ¤ | The portfolio turnover rate calculation includes purchases and sales from mortgage dollar roll transactions |
| | (see Note 2); had these transactions been excluded from the calculation, the portfolio turnover for the year |
| ended June 30, 2005, would have been 62.5%. |
| † | Annualized |
The accompanying notes are an integral part of these financial statements.Portfolio of Investments (1)
T. Rowe Price Personal Strategy Balanced Portfolio
June 30, 2005 (Unaudited)
| Shares/$ Par | Value |
| (Cost and value in $000s) | | |
| |
| COMMON STOCKS 66.8% | | |
| |
| CONSUMER DISCRETIONARY 9.5% | |
| Auto Components 0.2% | | |
| Autoliv GDR (SEK) § | 1,700 | 74 |
| Bridgestone (JPY) § | 1,000 | 19 |
| GKN (GBP) | 6,613 | 31 |
| Keystone Automotive *§ | 700 | 17 |
| Koito Manufacturing (JPY) | 3,800 | 40 |
| Strattec Security * | 300 | 16 |
| TRW * | 700 | 17 |
| | | 214 |
| Automobiles 0.4% | | |
| Bayerische Motoren Werke (EUR) | 1,417 | 65 |
| Ford Motor § | 21,600 | 221 |
| Honda (JPY) | 900 | 44 |
| Renault (EUR) § | 706 | 62 |
| Toyota Motor (JPY) | 3,800 | 136 |
| Winnebago § | 100 | 3 |
| | | 531 |
| Distributors 0.0% | | |
| Cycle & Carriage (SGD) | 501 | 4 |
| Pacific Brands (AUD) | 11,153 | 19 |
| | | 23 |
| Diversified Consumer Services 0.3% | | |
| Apollo Group, Class A * | 4,250 | 332 |
| Corinthian Colleges * | 700 | 9 |
| Education Management * | 400 | 14 |
| Matthews International, Class A | 1,500 | 58 |
| | | 413 |
| Hotels, Restaurants & Leisure 1.6% | | |
| Applebee’s | 662 | 18 |
| BJ’s Restaurants *§ | 800 | 16 |
| Carnival | 10,200 | 556 |
| CEC Entertainment * | 550 | 23 |
| Great Wolf Resorts *§ | 400 | 8 |
| Harrah’s Entertainment | 3,000 | 216 |
| International Game Technology | 9,500 | 267 |
| Marriott, Class A | 3,000 | 205 |
| McDonald’s | 4,400 | 122 |
| Mitchells & Butlers (GBP) | 6,028 | 36 |
| Panera Bread, Class A *§ | 600 | 37 |
| PF Chang’s China Bistro *§ | 500 | 30 |
| Red Robin Gourmet Burgers *§ | 300 | 19 |
| Ruby Tuesday § | 500 | 13 |
| Sonic *§ | 1,437 | 44 |
| Starbucks * | 600 | 31 |
| Starwood Hotels & Resorts | | |
| Worldwide, Equity Units | 4,900 | 287 |
| Texas Roadhouse, Class A *§ | 100 | 3 |
| The Cheesecake Factory * | 1,300 | 45 |
| Wynn Resorts *§ | 2,300 | 109 |
| | | 2,085 |
| Household Durables 0.8% | | |
| Fortune Brands | 1,500 | 133 |
| Goldcrest Company (JPY) § | 600 | 34 |
| Jarden *§ | 950 | 51 |
| Newell Rubbermaid § | 23,200 | 553 |
| Persimmon (GBP) | 3,321 | 47 |
| Philips Electronics (EUR) | 1,550 | 39 |
| Pioneer (JPY) § | 2,000 | 30 |
| Sony (JPY) | 2,500 | 86 |
| THOMSON Multimedia (EUR) § | 3,164 | 75 |
| | | 1,048 |
| Internet & Catalog Retail 0.3% | | |
| Amazon.com *§ | 4,700 | 155 |
| eBay * | 6,200 | 205 |
| J. Jill Group *§ | 1,200 | 16 |
| priceline.com *§ | 600 | 14 |
| | | 390 |
| Leisure Equipment & Products 0.3% | |
| Brunswick | 1,300 | 56 |
| Eastman Kodak | 8,200 | 220 |
| MarineMax *§ | 800 | 25 |
| Nikon (JPY) | 2,000 | 23 |
| Polaris Industries § | 200 | 11 |
| SCP Pool | 737 | 26 |
| | | 361 |
| Media 2.8% | | |
| Aegis Group (GBP) | 27,094 | 48 |
| Comcast | | |
| Class A * | 17,116 | 526 |
| Special Class A * | 11,200 | 335 |
| Disney | 13,200 | 332 |
| Emmis Communications *§ | 800 | 14 |
| Entercom Communications * | 500 | 17 |
| Gestevision Telecino (EUR) | 1,139 | 27 |
| Getty Images *§ | 200 | 15 |
| Liberty Media, Class A * | 15,600 | 159 |
| McGraw-Hill | 1,700 | 75 |
| New York Times, Class A § | 14,700 | 458 |
| News Corp., Class A | 16,300 | 264 |
| Omnicom | 1,100 | 88 |
| Publicis (EUR) § | 2,220 | 65 |
| Rogers Communications | | |
| Class B § | 2,600 | 85 |
| Scholastic * | 1,500 | 58 |
| Scripps, Class A | 4,300 | 210 |
| Singapore Press (SGD) | 7,500 | 19 |
| Time Warner * | 25,400 | 424 |
| Viacom, Class B | 10,490 | 336 |
| WPP Group (GBP) | 5,021 | 52 |
| WPP Group ADR | 450 | 23 |
| Young Broadcasting *§ | 500 | 2 |
| | | 3,632 |
| Multiline Retail 1.1% | | |
| Big Lots * | 900 | 12 |
| Kohl’s * | 6,900 | 386 |
| Nordstrom | 6,300 | 428 |
| Target | 11,300 | 615 |
| | | 1,441 |
| Specialty Retail 1.6% | | |
| AC Moore Arts & Crafts *§ | 400 | 13 |
| AnnTaylor Stores * | 2,200 | 53 |
| Aoyama Trading (JPY) | 700 | 17 |
| Best Buy | 4,400 | 302 |
| Charles Voegele (CHF) | 410 | 26 |
| Christopher & Banks § | 1,075 | 20 |
| Dixons Group (GBP) | 11,503 | 32 |
| DSW, Class A * | 100 | 2 |
| Esprit Holdings (HKD) | 4,600 | 33 |
| Gymboree * | 1,200 | 16 |
| Home Depot | 27,500 | 1,070 |
| Hot Topic *§ | 1,500 | 29 |
| Kesa Electricals (GBP) | 2,784 | 14 |
| Linens ‘n Things * | 800 | 19 |
| Monro Muffler Brake *§ | 800 | 24 |
| Nobia (SEK) | 1,898 | 28 |
| RadioShack | 17,000 | 394 |
| Select Comfort *§ | 700 | 15 |
| The Finish Line, Class A | 600 | 11 |
| Zumiez *§ | 200 | 6 |
| | | 2,124 |
| Textiles, Apparel, & Luxury Goods 0.1% | |
| Adidas-Salomon (EUR) | 243 | 41 |
| Columbia Sportswear *§ | 600 | 30 |
| Culp *§ | 100 | 0 |
| Warnaco Group * | 1,800 | 42 |
| World (JPY) § | 500 | 17 |
| | | 130 |
| Total Consumer Discretionary | | 12,392 |
| |
| CONSUMER STAPLES 5.1% | | |
| Beverages 1.0% | | |
| Allied Domecq (GBP) | 5,168 | 63 |
| Asahi Breweries (JPY) § | 2,600 | 31 |
| Coca-Cola | 20,300 | 848 |
| Kirin Brewery (JPY) | 5,000 | 48 |
| Lion Nathan (NZD) | 5,125 | 29 |
| PepsiCo | 5,850 | 315 |
| | | 1,334 |
| Food & Staples Retailing 1.8% | | |
| Casey’s General Stores | 2,400 | 48 |
| Casino Guichard-Perrachon (EUR) § | 799 | 56 |
| Coles Myer (AUD) § | 6,501 | 46 |
| CVS | 33,200 | 965 |
| J Sainsbury (GBP) | 6,275 | 32 |
| Matsumotokiyoshi (JPY) | 1,000 | 27 |
| METRO (EUR) | 2,271 | 112 |
| Organizacion Soriana, | | |
| Series B (MXN) * | 10,600 | 44 |
| Performance Food Group * | 1,600 | 48 |
| Sysco | 4,600 | 166 |
| Tesco (GBP) | 10,470 | 60 |
| Wal-Mart | 15,000 | 723 |
| Wal-Mart de Mexico, | | |
| Series V (MXN) | 16,100 | 65 |
| Wild Oats Markets *§ | 1,100 | 13 |
| York-Benimaru (JPY) § | 800 | 22 |
| | | 2,427 |
| Food Products 0.7% | | |
| American Italian Pasta, Class A § | 400 | 8 |
| Associated British Foods (GBP) | 3,692 | 55 |
| Campbell Soup | 7,700 | 237 |
| General Mills | 7,860 | 368 |
| Koninklijke Wessanen GDS (EUR) | 2,609 | 37 |
| Nestle (CHF) | 462 | 118 |
| Seneca Foods | | |
| Class A * | 300 | 5 |
| Class B * | 100 | 1 |
| Unilever (GBP) | 9,788 | 94 |
| | | 923 |
| Household Products 0.5% | | |
| Colgate-Palmolive | 9,160 | 457 |
| Procter & Gamble | 3,000 | 159 |
| | | 616 |
| Personal Products 0.3% | | |
| Chattem *§ | 300 | 12 |
| Gillette | 6,800 | 344 |
| L’Oreal (EUR) | 257 | 19 |
| | | 375 |
| Tobacco 0.8% | | |
| Altria Group | 12,680 | 820 |
| UST | 4,630 | 211 |
| | | 1,031 |
| Total Consumer Staples | | 6,706 |
| |
| ENERGY 4.9% | | |
| Energy Equipment & Services 1.9% | | |
| Baker Hughes | 18,900 | 967 |
| BJ Services | 1,700 | 89 |
| FMC Technologies * | 1,900 | 61 |
| Grant Prideco * | 3,500 | 92 |
| Hanover Compressor *§ | 1,800 | 21 |
| Hydril * | 400 | 22 |
| Key Energy Services * | 800 | 9 |
| Lone Star Technologies * | 500 | 23 |
| Saipem (EUR) | 2,116 | 28 |
| Schlumberger | 7,700 | 585 |
| Seacor Holdings *§ | 1,000 | 64 |
| Smith International | 6,200 | 395 |
| Transocean * | 2,000 | 108 |
| W-H Energy Services * | 600 | 15 |
| | | 2,479 |
| Oil, Gas & Consumable Fuels 3.0% | | |
| Bill Barrett *§ | 1,200 | 36 |
| BP (GBP) | 11,862 | 123 |
| BP ADR | 9,138 | 570 |
| Chevron | 6,548 | 366 |
| China Shenhua Energy (HKD) * | 29,000 | 28 |
| Eni S.p.A. (EUR) | 6,478 | 166 |
| ExxonMobil | 13,726 | 789 |
| Forest Oil * | 1,600 | 67 |
| INPEX (JPY) | 3 | 17 |
| Marathon Oil | 5,560 | 297 |
| Murphy Oil | 2,600 | 136 |
| Neste Oil (EUR) * | 800 | 21 |
| Noble Energy | 300 | 23 |
| Oil Search (AUD) | 24,410 | 57 |
| OMV (EUR) | 72 | 31 |
| Petroleo Brasileiro (Petrobras) ADR | |
| (1 ADR represents | | |
| 1 preference share) | 3,200 | 147 |
| Shell Transport & Trading (GBP) | 18,310 | 178 |
| Shell Transport & Trading ADR § | 400 | 23 |
| Statoil ASA (NOK) | 6,226 | 126 |
| TonenGeneral Sekiyu (JPY) § | 2,000 | 22 |
| Total (EUR) | 883 | 207 |
| Total ADR § | 200 | 23 |
| Unocal | 6,630 | 431 |
| | | 3,884 |
| Total Energy | | 6,363 |
| |
| FINANCIALS 13.9% | | |
| Capital Markets 3.4% | | |
| Affiliated Managers Group *§ | 600 | 41 |
| AmeriTrade * | 16,700 | 310 |
| Bank of New York | 1,900 | 55 |
| Charles Schwab | 21,450 | 242 |
| Credit Suisse Group (CHF) | 2,379 | 93 |
| Franklin Resources | 6,700 | 516 |
| Goldman Sachs | 3,200 | 326 |
| Investors Financial Services § | 800 | 30 |
| Legg Mason | 5,250 | 547 |
| Macquarie Bank (AUD) | 2,332 | 106 |
| Mellon Financial | 18,580 | 533 |
| Merrill Lynch | 6,600 | 363 |
| Morgan Stanley | 2,700 | 142 |
| National Financial Partners | 400 | 16 |
| Northern Trust | 7,300 | 333 |
| Piper Jaffray * | 1,000 | 30 |
| State Street | 14,700 | 709 |
| | | 4,392 |
| Commercial Banks 3.1% | | |
| ABN AMRO (EUR) | 2,982 | 73 |
| Alliance & Leicester (GBP) | 3,398 | 53 |
| Allied Irish Banks (EUR) | 1,893 | 40 |
| Amegy Bancorp § | 2,500 | 56 |
| Australia & New Zealand | | |
| Banking (AUD) | 7,621 | 126 |
| Australia & New Zealand | | |
| Banking ADR | 100 | 8 |
| Banca Intesa (EUR) | 12,839 | 59 |
| Banco Santander Central | | |
| Hispano (EUR) | 6,959 | 80 |
| Bank Austria Creditanstalt (EUR) § | 819 | 85 |
| Bank of America | 16,800 | 766 |
| Bank of Fukuoka (JPY) | 6,000 | 35 |
| Bank of Ireland (EUR) | 3,661 | 59 |
| Barclays (GBP) | 18,900 | 188 |
| BNP Paribas (EUR) § | 1,858 | 127 |
| Boston Private Financial § | 700 | 18 |
| Cascade Bancorp § | 600 | 13 |
| Chittenden | 2,143 | 58 |
| Citizens Banking | 1,700 | 51 |
| DBS Group (SGD) | 7,789 | 66 |
| Dexia (EUR) | 1,994 | 44 |
| Glacier Bancorp | 1,165 | 30 |
| Grupo Financiero Banorte (MXN) | 23,297 | 154 |
| HBOS (GBP) | 6,268 | 96 |
| HSBC (GBP) | 4,167 | 66 |
| Joyo (JPY) | 9,000 | 44 |
| Mitsubishi Tokyo Financial (JPY) § | 8 | 67 |
| National Australia Bank (AUD) § | 4,816 | 113 |
| NORDEA (SEK) | 12,040 | 109 |
| Pinnacle Financial Partners *§ | 200 | 5 |
| Provident Bankshares | 900 | 29 |
| Royal Bank of Scotland (GBP) | 6,029 | 182 |
| S-E-Banken (SEK) | 2,499 | 41 |
| Sandy Spring Bancorp § | 1,000 | 35 |
| Signature Bank *§ | 100 | 2 |
| Sumitomo Trust & Banking (JPY) | 10,000 | 61 |
| Svenska Handelsbanken, | | |
| Series A (SEK) | 4,344 | 89 |
| Texas Capital Bancshares *§ | 1,100 | 22 |
| The Bank of Yokohama (JPY) | 10,600 | 61 |
| U.S. Bancorp | 14,000 | 409 |
| UniCredito (EUR) § | 10,034 | 53 |
| Valley National Bancorp § | 1,594 | 37 |
| Wells Fargo | 5,000 | 308 |
| WestAmerica | 1,300 | 69 |
| | | 4,087 |
| Consumer Finance 1.0% | | |
| AIFUL (JPY) | 800 | 59 |
| American Express | 16,450 | 876 |
| SLM Corporation | 6,000 | 305 |
| | | 1,240 |
| Diversified Financial Services 1.5% | | |
| Aktiv Kapital (NOK) | 2,900 | 44 |
| Babcock & Brown (AUD) * | 5,958 | 62 |
| Citigroup | 28,650 | 1,325 |
| ING Groep GDS (EUR) | 2,570 | 72 |
| J.P. Morgan Chase | 13,414 | 474 |
| | | 1,977 |
| Insurance 3.7% | | |
| AFLAC | 500 | 22 |
| Aioi Insurance (JPY) § | 6,000 | 31 |
| American International Group | 23,098 | 1,342 |
| Aspen Insurance Holdings | 1,400 | 39 |
| Assured Guaranty | 2,000 | 47 |
| Aviva (GBP) | 3,830 | 43 |
| AXA (EUR) | 4,628 | 115 |
| Bristol West Holdings § | 1,300 | 24 |
| Brown & Brown | 100 | 4 |
| CNP Assurances (EUR) § | 1,101 | 70 |
| Friends Provident (GBP) | 9,734 | 32 |
| Genworth Financial, Class A | 9,900 | 299 |
| Hannover Rueckversicherung (EUR) | 795 | 30 |
| Harleysville Group | 200 | 4 |
| Hartford Financial Services | 5,400 | 404 |
| Horace Mann Educators | 1,900 | 36 |
| Infinity Property & Casualty | 1,100 | 38 |
| Insurance Australia (AUD) | 5,764 | 26 |
| Markel * | 130 | 44 |
| Marsh & McLennan | 30,500 | 845 |
| Mitsui Sumitomo Insurance (JPY) | 4,300 | 38 |
| Ohio Casualty | 2,700 | 65 |
| PartnerRe | 700 | 45 |
| QBE Insurance (AUD) | 3,607 | 44 |
| SAFECO | 8,000 | 435 |
| Selective Insurance § | 700 | 35 |
| St. Paul Companies | 10,000 | 395 |
| Unipol (EUR) § | 11,812 | 45 |
| W. R. Berkley | 337 | 12 |
| Willis Group Holdings § | 400 | 13 |
| XL Capital | 2,500 | 186 |
| | | 4,808 |
| Real Estate 0.8% | | |
| Arden Realty, REIT | 800 | 29 |
| China Overseas Land & | | |
| Investment (HKD) § | 120,000 | 22 |
| EastGroup Properties, REIT § | 900 | 38 |
| Equity Lifestyle Properties, REIT | 400 | 16 |
| Essex Property Trust, REIT | 100 | 8 |
| Federal Realty Investment Trust, | | |
| REIT | 5,200 | 307 |
| Gables Residential Trust, REIT | 900 | 39 |
| GPT Group, Equity Units (AUD) * | 20,980 | 58 |
| LaSalle Hotel Properties, REIT | 500 | 16 |
| Mirvac Group (AUD) | 6,894 | 19 |
| Parkway Properties, REIT | 300 | 15 |
| Reckson Associates Realty, REIT | 326 | 11 |
| Simon Property Group, REIT | 5,096 | 370 |
| Sun Hung Kai Properties (HKD) | 4,200 | 41 |
| Washington SBI, REIT | 1,000 | 31 |
| Wheelock (HKD) | 8,600 | 14 |
| | | 1,034 |
| Thrifts & Mortgage Finance 0.4% | | |
| Bradford Bingley (GBP) | 9,953 | 58 |
| Fannie Mae | 6,120 | 357 |
| First Niagra Financial | 1,000 | 15 |
| Harbor Florida Bancshares § | 1,300 | 49 |
| Hypo Real Estate Holding (EUR) | 1,961 | 74 |
| Triad Guaranty *§ | 300 | 15 |
| | | 568 |
| Total Financials | | 18,106 |
| |
| HEALTH CARE 8.5% | | |
| Biotechnology 1.3% | | |
| Abgenix *§ | 200 | 2 |
| Alexion Pharmaceutical *§ | 400 | 9 |
| Alkermes *§ | 1,100 | 15 |
| Amgen * | 9,700 | 586 |
| Amylin Pharmaceuticals *§ | 700 | 15 |
| Anadys Pharmaceuticals *§ | 600 | 5 |
| Biogen Idec * | 2,400 | 83 |
| Cephalon *§ | 376 | 15 |
| CSL Limited (AUD) | 1,166 | 30 |
| Cubist Pharmaceuticals *§ | 1,200 | 16 |
| CV Therapeutics *§ | 200 | 4 |
| Cytogen *§ | 400 | 2 |
| Cytokinetics *§ | 100 | 1 |
| deCode genetics *§ | 1,000 | 9 |
| Exelixis * | 1,100 | 8 |
| Genentech * | 4,900 | 393 |
| Gilead Sciences * | 8,200 | 361 |
| InterMune *§ | 1,100 | 14 |
| Martek Biosciences *§ | 700 | 27 |
| Memory Pharmaceuticals * | 400 | 1 |
| Myriad Genetics *§ | 900 | 14 |
| Neurocrine Biosciences *§ | 500 | 21 |
| NPS Pharmaceuticals *§ | 300 | 3 |
| ONYX Pharmaceuticals *§ | 300 | 7 |
| Rigel Pharmaceuticals *§ | 500 | 10 |
| Trimeris *§ | 600 | 6 |
| Vertex Pharmaceuticals *§ | 1,648 | 28 |
| | | 1,685 |
| Health Care Equipment & Supplies 1.5% | |
| Advanced Neuromodulation | | |
| Systems *§ | 1,200 | 47 |
| Analogic § | 500 | 25 |
| Baxter International | 14,600 | 542 |
| Biomet | 4,500 | 156 |
| Boston Scientific * | 2,700 | 73 |
| DJ Orthopedics * | 900 | 25 |
| Edwards Lifesciences * | 600 | 26 |
| Elekta, Series B (SEK) * | 1,083 | 45 |
| Greatbatch *§ | 600 | 14 |
| Integra LifeSciences *§ | 1,300 | 38 |
| Medtronic | 9,500 | 492 |
| NuVasive *§ | 700 | 11 |
| ResMed *§ | 1,300 | 86 |
| St. Jude Medical * | 3,600 | 157 |
| Steris | 1,000 | 26 |
| Stryker | 4,000 | 190 |
| Thoratec *§ | 700 | 11 |
| Wright Medical Group *§ | 500 | 13 |
| | | 1,977 |
| Health Care Providers & Services 2.6% | |
| Accredo Health * | 1,300 | 59 |
| Alliance UniChem (GBP) | 1,973 | 30 |
| AmerisourceBergen § | 6,600 | 456 |
| Caremark RX * | 2,200 | 98 |
| Celesio (EUR) | 658 | 52 |
| Henry Schein * | 1,400 | 58 |
| LabOne *§ | 400 | 16 |
| LCA-Vision § | 300 | 15 |
| Lifeline Systems *§ | 800 | 26 |
| LifePoint Hospitals * | 200 | 10 |
| Odyssey Healthcare *§ | 800 | 12 |
| Sunrise Senior Living *§ | 1,500 | 81 |
| Symbion *§ | 1,000 | 24 |
| United Surgical Partners | | |
| International *§ | 1,100 | 57 |
| UnitedHealth Group | 27,800 | 1,449 |
| VistaCare, Class A *§ | 100 | 2 |
| WellChoice * | 500 | 35 |
| WellPoint * | 12,800 | 891 |
| | | 3,371 |
| Pharmaceuticals 3.1% | | |
| Abbott Laboratories | 2,200 | 108 |
| AstraZeneca ADR | 1,700 | 70 |
| Atherogenics *§ | 800 | 13 |
| Dainippon Pharma (JPY) § | 2,000 | 19 |
| Eisai (JPY) § | 1,100 | 37 |
| Eli Lilly | 900 | 50 |
| Eon Labs * | 500 | 15 |
| GlaxoSmithKline (GBP) | 5,940 | 143 |
| GlaxoSmithKline ADR | 900 | 44 |
| Hisamitsu Pharmaceutical (JPY) § | 1,400 | 37 |
| Inspire Pharmaceuticals *§ | 1,300 | 11 |
| IVAX * | 900 | 19 |
| Johnson & Johnson | 7,460 | 485 |
| Kobayashi Pharmaceutical (JPY) § | 1,000 | 27 |
| Medicines Company * | 300 | 7 |
| Merck | 23,000 | 708 |
| Nektar Therapeutics *§ | 300 | 5 |
| Novartis (CHF) | 3,619 | 172 |
| Noven Pharmaceuticals *§ | 1,200 | 21 |
| Pfizer | 13,400 | 370 |
| Sanofi-Aventis (EUR) | 1,516 | 124 |
| Schering-Plough | 18,400 | 351 |
| Sepracor * | 500 | 30 |
| Takeda Chemical Industries (JPY) | 900 | 45 |
| Teva Pharmaceutical ADR § | 6,600 | 206 |
| Theravance *§ | 200 | 3 |
| UCB (EUR) | 1,095 | 53 |
| Wyeth | 21,380 | 951 |
| | | 4,124 |
| Total Health Care | | 11,157 |
| |
| INDUSTRIALS & BUSINESS SERVICES 7.0% | |
| Aerospace & Defense 1.1% | | |
| Armor Holdings *§ | 1,600 | 63 |
| BAE Systems (GBP) | 8,367 | 43 |
| General Dynamics | 1,200 | 131 |
| Honeywell International | 7,700 | 282 |
| Lockheed Martin | 13,100 | 850 |
| Mercury Computer Systems * | 500 | 14 |
| Rockwell Collins | 1,300 | 62 |
| Rolls-Royce (GBP) * | 4,580 | 24 |
| | | 1,469 |
| Air Freight & Logistics 0.1% | | |
| EGL *§ | 1,200 | 24 |
| Exel (GBP) | 1,644 | 25 |
| Pacer International * | 600 | 13 |
| Ryder System | 300 | 11 |
| UPS, Class B | 600 | 41 |
| UTi Worldwide § | 400 | 28 |
| Yamato Transport (JPY) | 2,000 | 28 |
| | | 170 |
| Airlines 0.0% | | |
| Frontier Airlines *§ | 900 | 9 |
| Midwest Express Holdings *§ | 900 | 2 |
| Qantas Airways (AUD) | 8,810 | 23 |
| | | 34 |
| Building Products 0.1% | | |
| Pilkington (GBP) | 21,311 | 46 |
| Quixote § | 300 | 6 |
| Trex *§ | 600 | 15 |
| | | 67 |
| Commercial Services & Supplies 1.0% | |
| Angelica § | 700 | 17 |
| Cendant | 5,300 | 119 |
| Central Parking § | 500 | 7 |
| ChoicePoint * | 1,300 | 52 |
| Consolidated Graphics * | 1,100 | 45 |
| Downer EDI (AUD) | 6,504 | 26 |
| First Advantage, Class A * | 200 | 5 |
| G & K Services, Class A | 1,000 | 38 |
| Herman Miller | 1,800 | 55 |
| Intersections *§ | 200 | 2 |
| Kforce * | 1,600 | 14 |
| LECG *§ | 1,000 | 21 |
| R.R. Donnelley | 11,600 | 400 |
| Resources Global Professionals *§ | 1,600 | 37 |
| Ritchie Bros Auctioneers | 700 | 27 |
| Synagro Technologies *§ | 2,200 | 11 |
| Tetra Tech * | 1,590 | 22 |
| Waste Connections * | 700 | 26 |
| Waste Management | 15,022 | 426 |
| West Corporation * | 400 | 15 |
| | | 1,365 |
| Construction & Engineering 0.2% | | |
| Acciona (EUR) | 1,160 | 115 |
| China State Construction (HKD) * | 6,666 | 0 |
| Insituform Technologies *§ | 800 | 13 |
| JGC (JPY) § | 4,000 | 49 |
| NCC AB, Series B (SEK) | 4,045 | 60 |
| | | 237 |
| Electrical Equipment 0.1% | | |
| A.O. Smith § | 1,800 | 48 |
| Artesyn Technologies *§ | 1,400 | 12 |
| Baldor Electric § | 1,400 | 34 |
| Sumitomo | | |
| Electric Industries (JPY) § | 3,000 | 31 |
| Woodward Governor | 100 | 8 |
| | | 133 |
| Industrial Conglomerates 2.0% | | |
| DCC (EUR) | 3,830 | 76 |
| GE | 35,200 | 1,220 |
| Hutchison Whampoa (HKD) | 7,000 | 63 |
| Sembcorp (SGD) | 41,360 | 65 |
| Siemens (EUR) | 1,368 | 100 |
| Tyco International | 39,252 | 1,146 |
| | | 2,670 |
| Machinery 1.5% | | |
| 3-D Systems *§ | 100 | 2 |
| Accuride * | 600 | 6 |
| Actuant, Class A *§ | 940 | 45 |
| Cargotec (EUR) * | 920 | 26 |
| Cascade § | 600 | 26 |
| Danaher | 15,400 | 806 |
| Deere | 11,800 | 773 |
| Fanuc (JPY) | 800 | 51 |
| Graco | 1,050 | 36 |
| Harsco | 1,200 | 65 |
| IDEX | 450 | 17 |
| Lindsay Manufacturing § | 1,200 | 28 |
| SKF AB (Redemption shares) | | |
| Series B (SEK) | 2,700 | 28 |
| Toro | 1,700 | 66 |
| | | 1,975 |
| Marine 0.1% | | |
| Nippon Yusen (JPY) | 12,000 | 69 |
| | | 69 |
| Road & Rail 0.7% | | |
| Arriva (GBP) | 5,657 | 55 |
| Burlington Northern Santa Fe | 8,000 | 377 |
| Genesee & Wyoming, Class A *§ | 200 | 5 |
| Heartland Express | 776 | 15 |
| Knight Transportation § | 1,450 | 35 |
| Nippon Express (JPY) § | 4,000 | 17 |
| Norfolk Southern | 11,400 | 353 |
| Union Pacific | 100 | 7 |
| | | 864 |
| Trading Companies & Distributors 0.1% | |
| Electro Rent *§ | 600 | 9 |
| Interline Brands * | 600 | 12 |
| Mitsubishi (JPY) § | 4,900 | 66 |
| Sumitomo (JPY) | 4,000 | 32 |
| | | 119 |
| Total Industrials & Business Services | 9,172 |
| |
| INFORMATION TECHNOLOGY 11.6% | |
| Communications Equipment 2.1% | | |
| ADTRAN | 1,900 | 47 |
| Belden CDT § | 1,400 | 30 |
| Cisco Systems * | 28,400 | 543 |
| Corning * | 56,300 | 936 |
| F5 Networks * | 200 | 9 |
| Juniper Networks * | 7,400 | 186 |
| Lucent Technologies *§ | 65,500 | 190 |
| Nokia ADR | 19,600 | 326 |
| Nokia OYJ (EUR) | 7,715 | 128 |
| Packeteer *§ | 400 | 6 |
| QUALCOMM | 7,000 | 231 |
| Research In Motion * | 1,500 | 111 |
| Riverstone Networks * | 2,000 | 1 |
| Tekelec *§ | 400 | 7 |
| | | 2,751 |
| Computers & Peripherals 0.9% | | |
| Creative Technology (SGD) | 1,200 | 8 |
| Dell * | 20,300 | 802 |
| EMC * | 16,500 | 226 |
| Emulex * | 1,200 | 22 |
| Gateway *§ | 6,700 | 22 |
| Synaptics *§ | 600 | 13 |
| Toshiba (JPY) | 8,000 | 32 |
| | | 1,125 |
| Electronic Equipment & Instruments 0.2% | |
| Cogent *§ | 300 | 9 |
| DTS *§ | 700 | 12 |
| Global Imaging Systems * | 900 | 29 |
| Hamamatsu Photonics (JPY) | 1,100 | 24 |
| KEMET *§ | 2,200 | 14 |
| Kyocera (JPY) | 300 | 23 |
| Littelfuse *§ | 900 | 25 |
| Methode Electronics | 1,200 | 14 |
| National Instruments § | 600 | 13 |
| Newport * | 900 | 12 |
| Orbotech * | 500 | 11 |
| Plexus * | 2,200 | 31 |
| Shimadzu (JPY) § | 8,000 | 50 |
| TDK (JPY) | 300 | 20 |
| Woodhead Industries | 1,200 | 15 |
| | | 302 |
| Internet Software & Services 0.9% | | |
| Digital Insight * | 1,200 | 29 |
| Digital River *§ | 300 | 10 |
| Google, Class A * | 1,600 | 471 |
| IAC/InterActiveCorp *§ | 6,000 | 144 |
| MatrixOne *§ | 1,900 | 9 |
| Yahoo! * | 13,600 | 471 |
| | | 1,134 |
| IT Services 1.8% | | |
| Accenture, Class A * | 6,600 | 150 |
| Affiliated Computer | | |
| Services, Class A * | 400 | 21 |
| Automatic Data Processing | 6,600 | 277 |
| BISYS Group * | 1,300 | 19 |
| CACI International, Class A *§ | 800 | 51 |
| First Data | 30,668 | 1,231 |
| Fiserv * | 3,900 | 168 |
| Global Payments § | 900 | 61 |
| Indra Sistemas (EUR) | 3,566 | 70 |
| Iron Mountain * | 1,825 | 57 |
| Logica (GBP) | 3,673 | 11 |
| Maximus | 1,200 | 42 |
| MPS Group * | 2,800 | 26 |
| Paychex | 2,500 | 81 |
| RightNow Technologies *§ | 1,200 | 14 |
| Trans Cosmos (JPY) | 800 | 32 |
| | | 2,311 |
| Office Electronics 0.1% | | |
| Canon (JPY) | 1,400 | 73 |
| Neopost (EUR) | 472 | 42 |
| | | 115 |
| Semiconductor & Semiconductor | | |
| Equipment 2.8% | | |
| AMIS Holdings * | 900 | 12 |
| Analog Devices | 9,300 | 347 |
| Atheros Communications *§ | 200 | 2 |
| ATMI *§ | 1,000 | 29 |
| Brooks-Pri Automation * | 1,200 | 18 |
| Cabot Microelectronics *§ | 500 | 14 |
| Credence Systems *§ | 1,500 | 14 |
| Cymer *§ | 1,300 | 34 |
| Cypress Semiconductor *§ | 600 | 8 |
| Entegris * | 1,700 | 17 |
| Exar * | 1,400 | 21 |
| FEI *§ | 700 | 16 |
| Intel | 42,300 | 1,102 |
| KLA-Tencor | 1,200 | 52 |
| Lattice Semiconductor * | 2,500 | 11 |
| Linear Technology | 2,800 | 103 |
| Marvell Technology Group * | 3,900 | 148 |
| Maxim Integrated Products | 11,300 | 432 |
| Microchip Technology | 3,200 | 95 |
| Microsemi *§ | 300 | 6 |
| MKS Instruments * | 1,800 | 30 |
| Mykrolis *§ | 1,600 | 23 |
| PDF Solutions *§ | 1,400 | 18 |
| Power Integrations *§ | 700 | 15 |
| Rohm Company (JPY) | 100 | 10 |
| Samsung Electronics (KRW) | 100 | 47 |
| Semiconductor | | |
| Manufacturing ADR *§ | 900 | 9 |
| Semtech * | 1,900 | 32 |
| Silicon Laboratories *§ | 700 | 18 |
| Texas Instruments | 24,600 | 690 |
| Virage Logic *§ | 200 | 2 |
| Xilinx | 10,300 | 263 |
| | | 3,638 |
| Software 2.8% | | |
| Adobe Systems | 6,600 | 189 |
| Altiris *§ | 800 | 12 |
| Blackbaud § | 100 | 1 |
| Catapult Communications *§ | 500 | 9 |
| CCC Information Services *§ | 800 | 19 |
| FactSet Research Systems § | 1,350 | 48 |
| FileNet * | 1,600 | 40 |
| Hyperion Solutions * | 500 | 20 |
| Internet Security Systems * | 900 | 18 |
| Intuit * | 5,300 | 239 |
| Jack Henry & Associates | 3,200 | 59 |
| Kronos * | 1,000 | 40 |
| Mercury Interactive * | 300 | 12 |
| Microsoft | 89,480 | 2,223 |
| Motive * | 900 | 9 |
| NetIQ * | 1,584 | 18 |
| Open Solutions *§ | 400 | 8 |
| Oracle * | 26,100 | 345 |
| Progress Software * | 1,000 | 30 |
| Quest Software * | 1,500 | 20 |
| Red Hat *§ | 1,000 | 13 |
| RSA Security * | 1,200 | 14 |
| SAP (EUR) | 460 | 80 |
| SPSS * | 400 | 8 |
| Trend Micro (JPY) § | 500 | 18 |
| VERITAS Software * | 8,175 | 199 |
| Verity *§ | 1,500 | 13 |
| | | 3,704 |
| Total Information Technology | | 15,080 |
| |
| MATERIALS 3.0% | | |
| Chemicals 1.3% | | |
| Airgas | 3,000 | 74 |
| Arch Chemicals § | 1,200 | 30 |
| BASF (EUR) | 1,096 | 73 |
| Dow Chemical | 8,800 | 392 |
| DSM (EUR) | 538 | 37 |
| DuPont | 7,184 | 309 |
| Ferro | 2,000 | 40 |
| Kaneka (JPY) | 4,000 | 45 |
| MacDermid | 700 | 22 |
| Material Sciences * | 800 | 12 |
| Minerals Technologies | 700 | 43 |
| Mitsubishi Gas Chemical (JPY) | 6,000 | 30 |
| Mitsui Chemicals (JPY) § | 4,000 | 23 |
| Monsanto | 2,700 | 170 |
| Potash Corp./Saskatchewan | 4,000 | 382 |
| Symyx Technologies *§ | 800 | 22 |
| Yara International (NOK) | 2,742 | 43 |
| | | 1,747 |
| Construction Materials 0.2% | | |
| Boral (AUD) | 18,744 | 92 |
| Cemex (MXN) | 19,516 | 83 |
| Holcim (CHF) | 558 | 34 |
| | | 209 |
| Containers & Packaging 0.0% | | |
| Chesapeake Corp. | 700 | 15 |
| DS Smith (GBP) | 15,467 | 40 |
| Smurfit-Stone Container * | 300 | 3 |
| | | 58 |
| Metals & Mining 1.2% | | |
| Alcoa | 5,868 | 153 |
| Anglo American (GBP) | 2,776 | 65 |
| BHP Billiton (AUD) § | 2,800 | 38 |
| BlueScope Steel (AUD) § | 17,233 | 107 |
| Corus Group (GBP) * | 56,812 | 42 |
| Gibraltar Industries § | 450 | 8 |
| Lihir Gold (AUD) * | 8,500 | 8 |
| Meridian Gold * | 1,900 | 34 |
| Nippon Steel (JPY) § | 34,000 | 79 |
| Nucor § | 6,300 | 288 |
| Phelps Dodge | 6,200 | 574 |
| SSAB Svenskt Stal, Series A (SEK) | 3,215 | 74 |
| Voestalpine (EUR) § | 717 | 50 |
| | | 1,520 |
| Paper & Forest Products 0.3% | | |
| Buckeye Technologies * | 1,900 | 15 |
| MeadWestvaco | 5,700 | 160 |
| UPM-Kymmene (EUR) | 703 | 13 |
| Weyerhaeuser | 3,800 | 242 |
| | | 430 |
| Total Materials | | 3,964 |
| |
| TELECOMMUNICATION SERVICES 1.7% | |
| Diversified Telecommunication Services 0.7% | |
| China Telecom (HKD) | 93,000 | 33 |
| Compania de Telecomunics | | |
| Chile ADR § | 2,700 | 27 |
| Eircom Group (EUR) | 24,733 | 55 |
| Sprint | 13,300 | 334 |
| Tele Danmark (DKK) | 2,312 | 99 |
| Tele Norte Leste ADR § | 2,900 | 48 |
| Telenor ASA (NOK) | 13,393 | 106 |
| Telus (Non-voting shares) | 4,400 | 150 |
| | | 852 |
| Wireless Telecommunication Services 1.0% | |
| America Movil ADR, Series L § | 4,400 | 262 |
| Bouygues (EUR) | 2,185 | 91 |
| China Unicom (HKD) | 17,000 | 14 |
| KDDI (JPY) | 13 | 60 |
| MobilCom AG (EUR) | 2,872 | 62 |
| Nextel Communications | | |
| Class A * | 14,100 | 456 |
| Nextel Partners, Class A * | 1,500 | 38 |
| SBA Communications *§ | 100 | 1 |
| SpectraSite * | 900 | 67 |
| Starhub (SGD) * | 24,000 | 26 |
| Vodafone ADR | 9,200 | 224 |
| | | 1,301 |
| Total Telecommunication Services | 2,153 |
| |
| UTILITIES 1.6% | | |
| Electric Utilities 0.8% | | |
| Cleco | 800 | 17 |
| E.ON AG (EUR) | 2,507 | 223 |
| El Paso Electric * | 600 | 12 |
| Exelon | 5,550 | 285 |
| FirstEnergy | 6,087 | 293 |
| Hong Kong Electric (HKD) | 4,600 | 21 |
| Iberdrola, (EUR) | 2,976 | 78 |
| TEPCO (JPY) | 2,500 | 60 |
| Unisource Energy | 1,300 | 40 |
| | | 1,029 |
| Gas Utilities 0.1% | | |
| Australian Gas Light (AUD) | 2,475 | 27 |
| Centrica (GBP) | 17,767 | 74 |
| Southwest Gas | 300 | 8 |
| Toho Gas (JPY) | 16,000 | 66 |
| | | 175 |
| Independent Power Producers & Energy Traders 0.7% | |
| Black Hills | 400 | 15 |
| Constellation Energy Group | 3,900 | 225 |
| TXU | 7,240 | 601 |
| | | 841 |
| Multi-Utilities 0.0% | | |
| United Utilities (GBP) | 3,754 | 44 |
| | | 44 |
| Total Utilities | | 2,089 |
| Total Common Stocks (Cost $65,979) | 87,182 |
| |
| PREFERRED STOCKS 0.0% | | |
| Fresenius (EUR) | 393 | 45 |
| Total Preferred Stocks (Cost $19) | 45 |
| |
| CORPORATE BONDS 4.0% | | |
| ABN Amro Bank (Chicago) | | |
| 7.125%, 6/18/07 | 40,000 | 42 |
| ACE INA Holdings | | |
| 5.875%, 6/15/14 | 35,000 | 37 |
| AIG Sunamerica Global | | |
| Financing XII | | |
| 144A, 5.30%, 5/30/07 | 100,000 | 102 |
| Alabama Power | | |
| VR, 3.484%, 8/25/09 | 35,000 | 35 |
| Allstate Financial Global Funding | |
| 144A, 5.25%, 2/1/07 | 35,000 | 36 |
| Amerada Hess, 7.875%, 10/1/29 | 30,000 | 38 |
| America Movil, 5.50%, 3/1/14 | 30,000 | 30 |
| Amgen, 4.00%, 11/18/09 | 30,000 | 30 |
| AOL Time Warner | | |
| 7.625%, 4/15/31 | 45,000 | 56 |
| AT&T Broadband | | |
| 8.375%, 3/15/13 | 50,000 | 61 |
| AT&T Wireless, 8.75%, 3/1/31 | 40,000 | 56 |
| Atmos Energy, 4.00%, 10/15/09 | 50,000 | 49 |
| Baker Hughes, 6.875%, 1/15/29 | 65,000 | 81 |
| Bank of America Capital Trust | | |
| 5.625%, 3/8/35 | 50,000 | 53 |
| Bank One, 5.25%, 1/30/13 | 85,000 | 88 |
| BB&T, 6.50%, 8/1/11 | 20,000 | 22 |
| Belo, 8.00%, 11/1/08 | 5,000 | 5 |
| Black Hills, 6.50%, 5/15/13 | 40,000 | 43 |
| Bunge Limited Finance | | |
| 4.375%, 12/15/08 | 45,000 | 45 |
| Canadian National Railway | | |
| 6.25%, 8/1/34 | 50,000 | 59 |
| Capital One Bank | | |
| 6.50%, 6/13/13 | 30,000 | 33 |
| CE Electric UK Funding | | |
| 144A, 6.995%, 12/30/07 | 35,000 | 36 |
| Celulosa Arauco y Constitucion | | |
| 5.125%, 7/9/13 | 40,000 | 40 |
| Centerpoint Energy | | |
| 7.25%, 9/1/10 | 30,000 | 33 |
| CIT Group, 5.00%, 2/1/15 | 80,000 | 81 |
| Comcast, 5.65%, 6/15/35 | 30,000 | 30 |
| ConocoPhillips | | |
| 5.90%, 10/15/32 | 45,000 | 50 |
| Countrywide Home Loans | | |
| 4.125%, 9/15/09 | 50,000 | 49 |
| CVS, 4.00%, 9/15/05 | 25,000 | 25 |
| DaimlerChrysler | | |
| 6.50%, 11/15/13 | 50,000 | 54 |
| Deutsche Telekom International | | |
| Finance | | |
| VR, STEP, 8.75%, 6/15/30 | 35,000 | 47 |
| Developers Diversified Realty | | |
| 3.875%, 1/30/09 | 35,000 | 34 |
| Devon Financing | | |
| 7.875%, 9/30/31 | 40,000 | 52 |
| Diamond Offshore Drilling | | |
| 5.15%, 9/1/14 | 30,000 | 31 |
| 144A, 4.875%, 7/1/15 | 35,000 | 35 |
| Dow Chemical, 6.125%, 2/1/11 | 30,000 | 33 |
| Duke Capital | | |
| 4.302%, 5/18/06 | 25,000 | 25 |
| 6.25%, 2/15/13 | 40,000 | 43 |
| Encana Holdings Finance | | |
| 5.80%, 5/1/14 | 50,000 | 54 |
| EOP Operating, 4.65%, 10/1/10 | 35,000 | 35 |
| ERAC USA Finance Company | | |
| 144A, 5.60%, 5/1/15 | 40,000 | 41 |
| Exelon Generation | | |
| 5.35%, 1/15/14 | 35,000 | 36 |
| Ford Motor Credit | | |
| 5.80%, 1/12/09 | 140,000 | 134 |
| VR, 4.218%, 11/16/06 | 25,000 | 25 |
| France Telecom, VR, STEP | | |
| 8.50%, 3/1/11 | 40,000 | 46 |
| Franklin Resources | | |
| 3.70%, 4/15/08 | 15,000 | 15 |
| Fund American Companies | | |
| 5.875%, 5/15/13 | 45,000 | 47 |
| General Electric Capital | | |
| 6.00%, 6/15/12 | 60,000 | 65 |
| General Motors Acceptance Corp. | | |
| 8.00%, 11/1/31 | 35,000 | 31 |
| Genworth Financial | | |
| 5.75%, 6/15/14 | 45,000 | 48 |
| GlaxoSmithKline Capital | | |
| 5.375%, 4/15/34 | 30,000 | 32 |
| Goldman Sachs Capital I | | |
| 6.345%, 2/15/34 | 90,000 | 98 |
| GTECH Holdings | | |
| 4.50%, 12/1/09 | 25,000 | 25 |
| Harrah’s Operating | | |
| 5.50%, 7/1/10 | 25,000 | 26 |
| HBOS, 144A, 6.00%, 11/1/33 | 40,000 | 45 |
| Hearst-Argyle, 7.00%, 1/15/18 | 5,000 | 5 |
| Highmark, 144A, 6.80%, 8/15/13 | 35,000 | 39 |
| Hospira, 4.95%, 6/15/09 | 45,000 | 46 |
| HSBC Finance, 5.00%, 6/30/15 | 60,000 | 61 |
| Huntington National Bank | | |
| 4.375%, 1/15/10 | 50,000 | 50 |
| International Lease Finance | | |
| 6.375%, 3/15/09 | 45,000 | 48 |
| International Speedway | | |
| 4.20%, 4/15/09 | 20,000 | 20 |
| iStar Financial, 5.125%, 4/1/11 | 45,000 | 45 |
| John Deere Capital | | |
| 7.00%, 3/15/12 | 55,000 | 63 |
| Kaneb Pipe Line Operations | | |
| 7.75%, 2/15/12 | 25,000 | 28 |
| Kraft Foods, 5.625%, 11/1/11 | 45,000 | 48 |
| Kroger, 8.05%, 2/1/10 | 45,000 | 51 |
| Legg Mason, 6.75%, 7/2/08 | 25,000 | 27 |
| Lehman Brothers Holdings | | |
| 3.50%, 8/7/08 | 70,000 | 69 |
| Lennar, 144A, 5.60%, 5/31/15 | 40,000 | 41 |
| MBNA America Bank | | |
| 4.625%, 8/3/09 | 50,000 | 51 |
| McCormick, 6.40%, 2/1/06 | 125,000 | 127 |
| MDC Holdings, 5.50%, 5/15/13 | 60,000 | 61 |
| Motorola, 5.80%, 10/15/08 | 45,000 | 47 |
| Nationwide Financial Services | | |
| 5.90%, 7/1/12 | 55,000 | 59 |
| Nationwide Mutual Insurance | | |
| 144A, 6.60%, 4/15/34 | 25,000 | 27 |
| Newmont Mining | | |
| 5.875%, 4/1/35 | 55,000 | 56 |
| News America, 6.20%, 12/15/34 | 30,000 | 32 |
| NLV Financial | | |
| 144A, 7.50%, 8/15/33 | 30,000 | 35 |
| Norfolk Southern | | |
| 6.00%, 4/30/08 | 60,000 | 62 |
| Northern Trust, 4.60%, 2/1/13 | 30,000 | 30 |
| NVR, 5.00%, 6/15/10 | 35,000 | 35 |
| Panhandle Eastern Pipeline | | |
| 4.80%, 8/15/08 | 20,000 | 20 |
| Pemex Project Funding Master Trust | |
| 7.375%, 12/15/14 | 30,000 | 34 |
| 144A, VR, 4.71%, 6/15/10 | 45,000 | 46 |
| PG&E | | |
| 6.05%, 3/1/34 | 35,000 | 39 |
| VR, 3.82%, 4/3/06 | 3,000 | 3 |
| Pinnacle West Capital | | |
| 6.40%, 4/1/06 | 45,000 | 46 |
| PPL Capital Funding | | |
| 4.33%, 3/1/09 | 45,000 | 44 |
| Principal Life Global Funding | | |
| 144A, 5.125%, 10/15/13 | 45,000 | 46 |
| Principal Mutual Life Insurance | | |
| 144A, 8.00%, 3/1/44 | 45,000 | 54 |
| Progress Energy, 6.75%, 3/1/06 | 30,000 | 30 |
| Prudential Financial | | |
| 3.75%, 5/1/08 | 40,000 | 40 |
| Public Service of New Mexico | | |
| 4.40%, 9/15/08 | 35,000 | 35 |
| Pulte Homes, 7.875%, 8/1/11 | 35,000 | 40 |
| Residential Capital | | |
| 144A, 6.375%, 6/30/10 | 15,000 | 15 |
| Rogers Cable, 5.50%, 3/15/14 | 40,000 | 38 |
| Ryland Group, 5.375%, 7/15/05 | 20,000 | 20 |
| Sealed Air | | |
| 144A, 5.375%, 4/15/08 | 40,000 | 41 |
| Security Benefit Life Insurance | | |
| 144A, 7.45%, 10/1/33 | 20,000 | 23 |
| Simon Property Group | | |
| 3.75%, 1/30/09 | 45,000 | 44 |
| SLM Corporation | | |
| VR, 3.361%, 1/26/09 | 50,000 | 50 |
| VR, 4.13%, 4/1/09 | 35,000 | 35 |
| Sprint Capital, 7.625%, 1/30/11 | 55,000 | 63 |
| Telecom Italia Capital | | |
| 5.25%, 11/15/13 | 45,000 | 46 |
| Telefonos de Mexico | | |
| 144A, 5.50%, 1/27/15 | 35,000 | 35 |
| Telus, 8.00%, 6/1/11 | 30,000 | 35 |
| TGT Pipeline | | |
| 144A, 5.50%, 2/1/17 | 15,000 | 15 |
| Transamerica Capital | | |
| 144A, 7.65%, 12/1/26 | 25,000 | 30 |
| Transocean, 7.50%, 4/15/31 | 30,000 | 39 |
| TXU Energy, VR, 3.92%, 1/17/06 | 10,000 | 10 |
| U.S. Bank, 2.87%, 2/1/07 | 40,000 | 39 |
| United Technologies | | |
| 5.40%, 5/1/35 | 40,000 | 42 |
| Verizon Global Funding | | |
| 7.75%, 12/1/30 | 45,000 | 58 |
| Wachovia, 6.40%, 4/1/08 | 20,000 | 21 |
| Webster Financial | | |
| 5.125%, 4/15/14 | 45,000 | 46 |
| Wells Fargo, VR, 3.512%, 3/23/07 | 55,000 | 55 |
| Westar Energy, 5.10%, 7/15/20 | 25,000 | 25 |
| Western Power Distribution Holdings | |
| 144A, 6.875%, 12/15/07 | 25,000 | 26 |
| Western Resources, 7.875%, | | |
| 5/1/07 | 25,000 | 27 |
| XTO Energy, 6.25%, 4/15/13 | 30,000 | 32 |
| Yum! Brands, 7.70%, 7/1/12 | 45,000 | 53 |
| Total Corporate Bonds (Cost $5,026) | 5,205 |
| |
| ASSET-BACKED SECURITIES 0.5% | | |
| BankBoston Home Equity Loan Trust | |
| Series 1998-1, Class A6 | | |
| 6.35%, 2/25/13 | 56,375 | 58 |
| Chase Funding Mortgage Loan | | |
| Series 2002-2, Class 1M1 | | |
| 5.599%, 9/25/31 | 20,000 | 20 |
| Chase Manhattan Auto Owner Trust | |
| Series 2001-B, Class CTFS | | |
| 3.75%, 5/15/08 | 13,694 | 14 |
| Series 2003-A, Class A4 | | |
| 2.06%, 12/15/09 | 80,000 | 78 |
| Countrywide Asset-Backed Certificates | |
| Series 2003-5, Class AF3 | | |
| 3.613%, 4/25/30 | 58,807 | 59 |
| New Century Home Equity Loan Trust | |
| Series 2005-A, Class A6 | | |
| VR, 4.954%, 8/25/35 | 135,000 | 136 |
| Series 2005-A, Class M2 | | |
| VR, 5.344%, 8/25/35 | 50,000 | 50 |
| Peco Energy Transition Trust | | |
| Series 2001-A, Class A1 | | |
| 6.52%, 12/31/10 | 110,000 | 121 |
| Reliant Energy Transition Bond | | |
| Series 2001-1, Class A4 | | |
| 5.63%, 9/15/15 | 100,000 | 108 |
| Total Asset-Backed Securities | | |
| (Cost $635) | | 644 |
| |
| FOREIGN GOVERNMENT OBLIGATIONS | |
| & MUNICIPALITIES 0.9% | | |
| Asian Development Bank | | |
| 6.25%, 6/15/11 (AUD) | 295,000 | 234 |
| European Investment Bank | | |
| 5.75%, 9/15/09 (AUD) | 100,000 | 77 |
| Federal Republic of Germany | | |
| 3.25%, 4/9/10 (EUR) | 280,000 | 351 |
| Government of Canada | | |
| 5.25%, 6/1/12 (CAD) | 365,000 | 327 |
| Republic of South Africa | | |
| 6.50%, 6/2/14 § | 70,000 | 78 |
| United Mexican States | | |
| 6.375%, 1/16/13 § | 55,000 | 59 |
| Total Foreign Government Obligations & | |
| Municipalities (Cost $1,018) | | 1,126 |
| |
| NON-U.S. GOVERNMENT MORTGAGE-BACKED | |
| SECURITIES 1.5% | | |
| Banc of America Commercial Mortgage | |
| Series 2003-1, Class A2 | | |
| CMO, 4.648%, 9/11/36 | 100,000 | 101 |
| Series 2004-6, Class A1 | | |
| CMO, 3.801%, 12/10/42 | 23,099 | 23 |
| Bank of America Mortgage Securities | |
| Series 2003-L, Class 2A2 | | |
| CMO, VR, 4.276% | | |
| 1/24/34 | 122,138 | 123 |
| Series 2004-1, Class 3A2 | | |
| CMO, VR, 4.971% | | |
| 10/25/34 | 45,894 | 46 |
| Series 2004-A, Class 2A2 | | |
| CMO, VR, 4.133%, | | |
| 2/25/34 | 65,177 | 65 |
| Series 2004-D, Class 2A2 | | |
| CMO, VR, 4.51%, 5/25/34 | 49,284 | 49 |
| Series 2004-H, Class 2A2 | | |
| CMO, VR, 4.79%, 9/25/34 | 42,331 | 43 |
| Bear Stearns Commercial Mortgage Securities | |
| Series 2004-PWR6, Class A1 | | |
| CMO, 3.688%, 11/11/41 | 16,114 | 16 |
| Series 2004-T14, Class A2 | | |
| CMO, 4.17%, 1/12/41 | 225,000 | 224 |
| Series 2005-PWR8, Class A4 | | |
| CMO, 4.674%, 6/11/41 | 140,000 | 141 |
| Series 2005-T18, Class A1 | | |
| CMO, 4.274%, 2/13/42 | 97,837 | 98 |
| Citigroup Commercial Mortgage Trust | |
| Series 2004-C2, Class A1 | | |
| CMO, 3.787%, 10/15/41 | 13,938 | 14 |
| Commercial Mortgage | | |
| Series 2005-LP5, Class A1 | | |
| CMO, 4.235%, 5/10/43 | 97,520 | 98 |
| DLJ Commercial Mortgage | | |
| Series 1999-CG2, Class A1B | | |
| CMO, 7.30%, 6/10/32 | 75,000 | 82 |
| GE Capital Commercial Mortgage | |
| Series 2001-1, Class A2 | | |
| CMO, 6.531%, 5/15/33 | 100,000 | 110 |
| GMAC Commercial Mortgage Securities | |
| Series 2001-C2, Class A1 | | |
| CMO, 6.25%, 4/15/34 | 102,044 | 106 |
| Greenwich Capital Commercial Funding | |
| Series 2004-GG1A, Class A2 | | |
| CMO, 3.835%, 6/10/36 | 84,887 | 84 |
| Series 2005-GG3, Class AAB | | |
| CMO, VR, 4.619% | | |
| 8/10/42 | 35,000 | 35 |
| J.P. Morgan Chase Commercial Mortgage Securities | |
| Series 2001-CIB2, Class A2 | | |
| CMO, 6.244%, 4/15/35 | 100,000 | 105 |
| Series 2001-CIBC, Class A3 | | |
| CMO, 6.26%, 3/15/33 | 100,000 | 109 |
| LB-UBS Commercial Mortgage Trust | |
| Series 2004-C2, Class A2 | | |
| CMO, 3.246%, 3/15/29 | 125,000 | 121 |
| Series 2004-C4, Class A2 | | |
| CMO, VR, 4.567%, | | |
| 5/15/29 | 125,000 | 126 |
| Washington Mutual | | |
| Series 2004-AR1, Class A, CMO | |
| VR, 4.229%, 3/25/34 | 42,229 | 41 |
| Total Non-U.S. Government | | |
| Mortgage-Backed Securities (Cost $1,972) | 1,960 |
| |
| U.S. GOVERNMENT & AGENCY MORTGAGE-BACKED | |
| SECURITIES 7.3% | | |
| U.S. Government Agency Obligations ± 6.1% | |
| Federal Home Loan Mortgage | | |
| 4.50%, 11/1/18 - 5/1/19 | 260,084 | 259 |
| 5.00%, 12/1/08 - 11/1/18 | 280,870 | 284 |
| 5.50%, 9/1 - 12/1/33 | 59,845 | 61 |
| 6.00%, 10/1/16 - 3/1/33 | 422,231 | 434 |
| 7.00%, 6/1/32 | 32,810 | 35 |
| ARM, 4.573%, 9/1/32 | 28,497 | 29 |
| CMO | | |
| 4.50%, 3/15/16 | 175,000 | 174 |
| 5.00%, 10/15 - 11/15/27 | 225,000 | 227 |
| 5.50%, 4/15/28 | 200,000 | 205 |
| CMO, IO | | |
| 4.50%, 7/15/11 - 5/15/16 | 257,000 | 25 |
| TBA, 5.00%, 1/1/35 | 255,000 | 255 |
| Federal National Mortgage Assn. | | |
| 4.50%, 5/1/18 - 1/1/19 | 501,554 | 501 |
| 5.50%, 1/1/17 - 1/1/35 | 2,175,567 | 2,217 |
| 6.00%, | | |
| 10/1/13 - 11/1/34 | 1,428,228 | 1,467 |
| 6.50%, 5/1/17 - 12/1/32 | 290,236 | 301 |
| 7.00%, 4/1/32 | 10,371 | 11 |
| CMO | | |
| 2.91%, 11/25/33 | 27,713 | 27 |
| 3.50%, 4/25/13 | 75,000 | 74 |
| 5.00%, 3/25/15 | 125,000 | 126 |
| CMO, IO | | |
| 5.50%, 11/25/28 | 44,333 | 3 |
| 6.50%, 2/1/32 | 26,487 | 4 |
| TBA | | |
| 4.50%, 1/1/35 | 25,000 | 24 |
| 5.00%, 1/1/33 | 896,000 | 894 |
| 6.00%, 1/1/34 | 300,000 | 308 |
| | | 7,945 |
| U.S. Government Obligations 1.2% | |
| Government National Mortgage Assn. | |
| 5.00%, 7/15/33 - 3/20/34 | 855,391 | 864 |
| 5.50%, 1/20 - 5/20/34 | 392,722 | 401 |
| 6.00%, 4/15/26 - 2/20/34 | 106,176 | 110 |
| 6.50%, 3/15/26 - 12/20/33 | 91,107 | 95 |
| 7.00%, 9/20/27 | 58,636 | 62 |
| 8.00%, 10/15/25 - 6/15/26 | 24,114 | 26 |
| 8.50%, 12/15/24 | 6,977 | 8 |
| 11.50%, 11/15/19 | 7,675 | 9 |
| CMO, 2.946%, 3/16/19 | 60,000 | 58 |
| | | 1,633 |
| Total U.S. Government & | | |
| Agency Mortgage-Backed | | |
| Securities (Cost $9,556) | | 9,578 |
| |
| U.S. GOVERNMENT AGENCY OBLIGATIONS | |
| (EXCLUDING MORTGAGE-BACKED) 10.1% | |
| U.S. Government Agency Obligations ± 1.6% | |
| Federal Home Loan Bank | | |
| 5.75%, 5/15/12 | 330,000 | 362 |
| Federal Home Loan Mortgage | | |
| 2.75%, 3/15/08 | 87,000 | 85 |
| 4.625%, 2/15/07 (EUR) | 315,000 | 396 |
| 5.125%, 7/15/12 | 135,000 | 144 |
| Federal National Mortgage Assn. | | |
| 3.25%, 8/15/08 | 160,000 | 157 |
| 4.375%, 9/15/12 | 100,000 | 102 |
| 6.00%, 5/15/11 | 310,000 | 341 |
| 7.125%, 6/15/10 - 1/15/30 | 360,000 | 465 |
| | | 2,052 |
| U.S. Treasury Obligations 8.5% | | |
| U.S. Treasury Bonds | | |
| 5.375%, 2/15/31 | 35,000 | 41 |
| 6.00%, 2/15/26 | 590,000 | 728 |
| 6.25%, 8/15/23 - 5/15/30 | 380,000 | 481 |
| 6.375%, 8/15/27 | 140,000 | 182 |
| 7.50%, 11/15/16 | 95,000 | 125 |
| 7.625%, 2/15/25 | 30,000 | 43 |
| 8.50%, 2/15/20 | 185,000 | 271 |
| U.S. Treasury Inflation-Indexed Bonds | |
| 2.375%, 1/15/25 | 268,359 | 294 |
| U.S. Treasury Inflation-Indexed Notes | |
| 2.00%, 7/15/14 | 273,520 | 282 |
| 3.625%, 1/15/08 | 150,535 | 159 |
| U.S. Treasury Notes | | |
| 1.50%, 3/31/06 | 465,000 | 458 |
| 1.875%, 11/30/05 ++ | 1,895,000 | 1,884 |
| 3.375%, 2/28/07 - | | |
| 12/15/08 | 2,180,000 | 2,164 |
| 3.50%, 11/15/06 - | | |
| 2/15/10 | 1,085,000 | 1,084 |
| 4.00%, 6/15/09 | 105,000 | 106 |
| 4.25%, 11/15/13 | 890,000 | 913 |
| 4.75%, 5/15/14 | 20,000 | 21 |
| 5.00%, 8/15/11 | 400,000 | 427 |
| 5.75%, 8/15/10 | 1,280,000 | 1,399 |
| | | 11,062 |
| Total U.S. Government Agency Obligations | |
| (excluding Mortgage-Backed) | | |
| (Cost $12,628) | | 13,114 |
| |
| MUNICIPAL BONDS 0.5% | | |
| Atlanta Airport | | |
| 5.00%, 1/1/33 | | |
| (FSA Insured) | 95,000 | 100 |
| California, GO | | |
| 5.25%, 4/1/34 | 20,000 | 22 |
| Economic Recovery | | |
| 5.00%, 7/1/16 | 25,000 | 27 |
| Clark County School Dist., GO | | |
| 5.00%, 6/15/18 | | |
| (MBIA Insured) | 50,000 | 55 |
| District of Columbia, GO | | |
| 5.00%, 6/1/16 | | |
| (MBIA Insured) | 65,000 | 71 |
| Houston Water & Sewer | | |
| 5.25%, 5/15/16 | | |
| (MBIA Insured) | 80,000 | 89 |
| Kansas Dev. Fin. Auth. | | |
| Public Employee Retirement | | |
| 5.501%, 5/1/34 | | |
| (FSA Insured) | 30,000 | 33 |
| New York City, GO | | |
| 5.00%, 8/1/15 | 60,000 | 65 |
| New York State Urban Dev. Corp. | |
| Corrections & Youth Fac. | |
| 5.25%, 1/1/21 | | |
| (Tender 1/1/09) | 50,000 | 53 |
| North Carolina, GO | | |
| 5.25%, 3/1/13 | 145,000 | 164 |
| Oregon, Taxable Pension, GO | |
| 5.892%, 6/1/27 | 15,000 | 17 |
| Total Municipal Bonds (Cost $685) | 696 |
| |
| SHORT-TERM INVESTMENTS 6.8% | |
| Money Market Fund 6.8% | |
| T. Rowe Price Reserve Investment Fund | |
| 3.14% #† | 8,859,076 | 8,859 |
| Total Short-Term Investments | |
| (Cost $8,859) | | 8,859 |
| |
| DOMESTIC BOND MUTUAL FUNDS 2.4% | |
| T. Rowe Price Institutional High Yield Fund | |
| 7.31% p† | 297,172 | 3,141 |
| Total Domestic Bond Mutual Funds | |
| (Cost $3,117) | | 3,141 |
| |
| SECURITIES LENDING COLLATERAL 5.7% | |
| Money Market Pooled Account 1.1% | |
| Investment in money market pooled | |
| account managed by JP Morgan | |
| Chase Bank, London, | |
| 3.198% # | 1,517,950 | 1,518 |
| Money Market Trust 4.6% | |
| State Street Bank and Trust Company | |
| of New Hampshire N.A. Securities | |
| Lending Quality Trust units, | |
| 3.194% # | 5,959,808 | 5,960 |
| Total Securities Lending Collateral | |
| (Cost $7,478) | | 7,478 |
| |
| FUTURES CONTRACTS 0.0% | |
| Variation margin receivable (payable) | |
| on open futures contracts (2) | (1) |
| Total Futures Contracts | (1) |
| Total Investments in Securities | | |
| 106.5% of Net Assets (Cost $116,972) | | $ 139,027 |
| (1) | Denominated in U.S. dollars unless otherwise noted |
| # | Seven-day yield |
| * | Non-income producing |
| § | All or a portion of this security is on loan at June 30, 2005— |
| | See Note 2 |
| ± | The issuer operates under a congressional charter; its securi- |
| | ties are neither issued nor guaranteed by the U.S. government |
| ++ | All or a portion of this security is pledged to cover margin |
| | requirements on futures contracts at June 30, 2005 |
| † | Affiliated company—See Note 4 |
| p | SEC Yield |
| 144A | Security was purchased pursuant to Rule 144A under the |
| | Securities Act of 1933 and may be resold in transactions |
| | exempt from registration only to qualified institutional |
| | buyers—total value of such securities at period-end |
| | amounts to $768 and represents 0.6% of net assets |
| ADR | American Depository Receipts |
| ARM | Adjustable Rate Mortgage |
| AUD | Australian dollar |
| CAD | Canadian dollar |
| CHF | Swiss franc |
| CMO | Collateralized Mortgage Obligation |
| DKK | Danish krone |
| EUR | Euro |
| FSA | Financial Security Assurance Inc. |
| GBP | British pound |
| GDR | Global Depository Receipts |
| GDS | Global Depository Shares |
| GO | General Obligation |
| HKD | Hong Kong dollar |
| IO | Interest Only security for which the fund receives interest |
| | on notional principal (par) |
| JPY | Japanese yen |
| KRW | South Korean yen |
| MBIA | MBIA Insurance Corp. |
| MXN | Mexican peso |
| NOK | Norwegian krone |
| NZD | New Zealand dollar |
| REIT | Real Estate Investment Trust |
| SEK | Swedish krona |
| SGD | Singapore dollar |
| STEP | Stepped coupon bond for which the coupon rate of interest |
| | will adjust on specified future date(s) |
| TBA | To Be Announced security was purchased on a forward |
| | commitment basis |
| VR | Variable Rate; rate shown is effective rate at period-end |
| (2) Open Futures Contracts at June 30, 2005, were as follows: |
| ($ 000s) | | | | | |
| | | Contract | Unrealized |
| | Expiration | Value | Gain (Loss) |
| Short, 8 U.S. Treasury five year contracts, | | | | | |
| $15 par of 1.875% U.S. Treasury Notes | | | | | |
| pledged as initial margin | 9/05 | $ | (871) | $ | (3) |
| Net payments (receipts) of variation | | | | | |
| margin to date | | | | | 2 |
| Variation margin receivable (payable) | | | | | |
| on open futures contracts | | | | $ | (1) |
The accompanying notes are an integral part of these financial statements.
Statement of Assets and Liabilities
T. Rowe Price Personal Strategy Balanced Portfolio
June 30, 2005 (Unaudited)
(In thousands except shares and per share amounts)
| Assets | | |
| Investments in securities, at value | | |
| Affiliated companies (cost $11,976) | $ | 12,000 |
| Non-affiliated companies (cost $104,996) | | 127,027 |
|
|
| Total investments in securities | | 139,027 |
| Dividends and interest receivable | | 444 |
| Receivable for investment securities sold | | 1,208 |
| Receivable for shares sold | | 213 |
| Other assets | | 4 |
|
|
| Total assets | | 140,896 |
|
|
| |
| Liabilities | | |
| Payable for investment securities purchased | | 2,698 |
| Payable for shares redeemed | | 27 |
| Obligation to return securities lending collateral | | 7,478 |
| Due to affiliates | | 114 |
| Other liabilities | | 9 |
|
|
| Total liabilities | | 10,326 |
|
|
| |
| NET ASSETS | $ | 130,570 |
|
|
| Net Assets Consist of: | | |
| Undistributed net investment income (loss) | $ | 41 |
| Undistributed net realized gain (loss) | | (536) |
| Net unrealized gain (loss) | | 22,052 |
| Paid-in-capital applicable to 7,383,718 shares of | | |
| $0.0001 par value capital stock outstanding; | | |
| 1,000,000,000 shares of the Corporation authorized | | 109,013 |
|
|
| |
| NET ASSETS | $ | 130,570 |
|
|
| NET ASSET VALUE PER SHARE | $ | 17.68 |
|
|
The accompanying notes are an integral part of these financial statements.
Statement of Operations
T. Rowe Price Personal Strategy Balanced Portfolio
(Unaudited)
($000s)
| | | 6 Months |
| | | Ended |
| | | 6/30/05 |
| Investment Income (Loss) | | |
| Income | | |
| Dividend | $ | 1,078 |
| Interest | | 668 |
| Securities lending | | 11 |
|
|
| Total income | | 1,757 |
|
|
| Expenses | | |
| Investment management and administrative | | 566 |
| Investment management fees waived | | (13) |
|
|
| Total expenses | | 553 |
|
|
| Net investment income (loss) | | 1,204 |
|
|
| Realized and Unrealized Gain (Loss) | | |
| Net realized gain (loss) | | |
| Affiliated securities | | (23) |
| Non-affiliated securities | | 2,956 |
| Futures | | (2) |
| Foreign currency transactions | | (20) |
|
|
| Net realized gain (loss) | | 2,911 |
|
|
| Change in net unrealized gain (loss) | | |
| Securities | | (3,446) |
| Other assets and liabilities | | |
| denominated in foreign currencies | | (4) |
|
|
| Change in net unrealized gain (loss) | | (3,450) |
|
|
| Net realized and unrealized gain (loss) | | (539) |
|
|
| |
| INCREASE (DECREASE) IN NET | | |
| ASSETS FROM OPERATIONS | $ | 665 |
|
|
The accompanying notes are an integral part of these financial statements.
Statement of Changes in Net Assets
T. Rowe Price Personal Strategy Balanced Portfolio
(Unaudited)
($ 000s)
| | | 6 Months | | Year |
| | | Ended | | Ended |
| | | 6/30/05 | | 12/31/04 |
| |
| Increase (Decrease) in Net Assets | | | | |
| Operations | | | | |
| Net investment income (loss) | $ | 1,204 | $ | 2,254 |
| Net realized gain (loss) | | 2,911 | | 4,465 |
| Change in net unrealized gain (loss) | | (3,450) | | 7,129 |
|
|
| Increase (decrease) in net assets from operations | | 665 | | 13,848 |
|
|
| Distributions to shareholders | | | | |
| Net investment income | | (1,163) | | (2,285) |
| Net realized gain | | – | | (480) |
|
|
| Decrease in net assets from distributions | | (1,163) | | (2,765) |
|
|
| Capital share transactions * | | | | |
| Shares sold | | 12,591 | | 22,337 |
| Distributions reinvested | | 1,163 | | 2,765 |
| Shares redeemed | | (8,635) | | (16,442) |
|
|
| Increase (decrease) in net assets from capital | | | | |
| share transactions | | 5,119 | | 8,660 |
|
|
| |
| Net Assets | | | | |
| Increase (decrease) during period | | 4,621 | | 19,743 |
| Beginning of period | | 125,949 | | 106,206 |
|
|
| |
| End of period | $ | 130,570 | $ | 125,949 |
|
|
| (Including undistributed net investment income | | | | |
| of $41 at 6/30/05 and $0 at 12/31/04) | | | | |
| |
| *Share information | | | | |
| Shares sold | | 718 | | 1,336 |
| Distributions reinvested | | 66 | | 163 |
| Shares redeemed | | (492) | | (992) |
|
|
| Increase (decrease) in shares outstanding | | 292 | | 507 |
| The accompanying notes are an integral part of these financial statements. |
Notes to Financial Statements
T. Rowe Price Personal Strategy Balanced Portfolio
June 30, 2005 (Unaudited)
NOTE 1 - SIGNIFICANT ACCOUNTING POLICIES
T. Rowe Price Equity Series, Inc. (the corporation) is registered under the Investment Company Act of 1940 (the 1940 Act). The Personal Strategy Balanced Portfolio (the fund), a diversified, open-end management investment company, is one portfolio established by the corporation. The fund commenced operations on December 30, 1994. The fund seeks the highest total return over time consistent with an emphasis on both capital appreciation and income. Shares of the fund are currently offered only through certain insurance companies as an investment medium for both variable annuity contracts and variable life insurance policies.
The accompanying financial statements were prepared in accordance with accounting principles generally accepted in the United States of America, which require the use of estimates made by fund management. Fund management believes that estimates and security valuations are appropriate; however actual results may differ from those estimates, and the security valuations reflected in the financial statements may differ from the value the fund receives upon sale of the securities.
Valuation The fund values its investments and computes its net asset value per share at the close of the New York Stock Exchange (NYSE), normally 4 p.m. ET, each day that the NYSE is open for business. Equity securities listed or regularly traded on a securities exchange or in the over-the-counter market are valued at the last quoted sale price or, for certain markets, the official closing price at the time the valuations are made, except for OTC Bulletin Board securities, which are valued at the mean of the latest bid and asked prices. A security that is listed or traded on more than one exchange is valued at the quotation on the exchange determined to be the primary market for such security. Listed securities not traded on a particular day are valued at the mean of the latest bid and asked prices for domestic securities and the last quoted sale price for international securities.
Debt securities are generally traded in the over-the-counter market. Securities with original maturities of one year or more are valued at prices furnished by dealers who make markets in such securities or by an independent pricing service, which considers yield or price of bonds of comparable quality, coupon, maturity, and type, as well as prices quoted by dealers who make markets in such securities. Securities with original maturities of less than one year are valued at amortized cost in local currency, which approximates fair value when combined with accrued interest.
Investments in mutual funds are valued at the mutual fund’s closing net asset value per share on the day of valuation. Financial futures contracts are valued at closing settlement prices.
Other investments, including restricted securities, and those for which the above valuation procedures are inappropriate or are deemed not to reflect fair value are stated at fair value as determined in good faith by the T. Rowe Price Valuation Committee, established by the fund’s Board of Directors.
Most foreign markets close before the close of trading on the NYSE. If the fund determines that developments between the close of a foreign market and the close of the NYSE will, in its judgment, materially affect the value of some or all of its portfolio securities, which in turn will affect the fund’s share price, the fund will adjust the previous closing prices to reflect the fair value of the securities as of the close of the NYSE, as determined in good faith by the T. Rowe Price Valuation Committee, established by the fund’s Board of Directors. A fund may also fair value securities in other situations, such as when a particular foreign market is closed but the fund is open. In deciding whether to make fair value adjustments, the fund reviews a variety of factors, including developments in foreign markets, the performance of U.S. securities markets, and the performance of instruments trading in U. S. markets that represent foreign securities and baskets of foreign securities. The fund uses outside pricing services to provide it with closing market prices and information used for adjusting those prices. The fund cannot predict when and how often it will use closing prices and when it will adjust those prices to reflect fair value. As a means of evaluating its fair value process, the fund routinely compares closing market prices, the next day’s opening prices in the same markets, and adjusted prices.
Currency Translation Assets, including investments, and liabilities denominated in foreign currencies are translated into U.S. dollar values each day at the prevailing exchange rate, using the mean of the bid and asked prices of such currencies against U.S. dollars as quoted by a major bank. Purchases and sales of securities, income, and expenses are translated into U.S. dollars at the prevailing exchange rate on the date of the transaction. The effect of changes in foreign currency exchange rates on realized and unrealized security gains and losses is reflected as a component of security gains and losses.
Investment Transactions, Investment Income, and Distributions Income and expenses are recorded on the accrual basis. Premiums and discounts on debt securities are amortized for financial reporting purposes. Inflation adjustments to the principal amount of inflation-indexed bonds are included in interest income. Dividends received from mutual fund investments are reflected as dividend income; capital gain distributions are reflected as realized gain/loss. Dividend income and capital gain distributions are recorded on the ex-dividend date. Investment transactions are accounted for on the trade date. Realized gains and losses are reported on the identified cost basis. Payments (“variation margin”) made or received to settle the daily fluctuations in the value of futures contracts are recorded as unrealized gains or losses until the contracts are closed. Unsettled variation margin on futures contracts is included in investments in securities, and unrealized gains and losses on futures contracts are included in the change in net unrealized gain or loss in the accompanying financial statements. Paydown gains and losses are recorded as an adjustment to interest income. Distributions to shareholders are recorded on the ex-dividend date. Income distributions are declared and paid on a quarterly basis. Capital gain distributions, if any, are declared and paid by the fund, typically on an annual basis.
NOTE 2 - INVESTMENT TRANSACTIONS
Consistent with its investment objective, the fund engages in the following practices to manage exposure to certain risks or enhance performance. The investment objective, policies, program, and risk factors of the fund are described more fully in the fund’s prospectus and Statement of Additional Information.
Restricted Securities The fund may invest in securities that are subject to legal or contractual restrictions on resale. Although certain of these securities may be readily sold, for example, under Rule 144A, others may be illiquid, their sale may involve substantial delays and additional costs, and prompt sale at an acceptable price may be difficult.
Futures Contracts During the six months ended June 30, 2005, the fund was a party to futures contracts, which provide for the future sale by one party and purchase by another of a specified amount of a specific financial instrument at an agreed upon price, date, time, and place. Risks arise from possible illiquidity of the futures market and from movements in security values and/or interest rates.
Forward Commitments and Dollar Rolls During the six months ended June 30, 2005, the fund purchased To Be Announced (TBA) mortgage backed securities on a forward commitment basis, with payment and delivery at an agreed-upon later date. The fund purchases TBAs with the intention of taking possession of the underlying mortgage securities. The fund may also enter dollar roll transactions, in which it sells a mortgage-backed security and simultaneously purchases a similar, but not identical, TBA with the same issuer, coupon, and terms. The fund accounts for dollar roll transactions as purchases and sales. Accordingly, these transactions increase the fund’s portfolio turnover rate. Losses may occur due to changes in market conditions or the failure of counterparties to perform under the contracts, and actual mortgages received may be less favorable than those anticipated by the fund.
Securities Lending The fund lends its securities to approved brokers to earn additional income. It receives as collateral cash and U.S. government securities valued at 102% to 105% of the value of the securities on loan. Cash collateral is invested in money market pooled accounts managed by the fund’s lending agents in accordance with investment guidelines approved by fund management. Collateral is maintained over the life of the loan in an amount not less than the value of loaned securities, as determined at the close of fund business each day; any additional collateral required due to changes in security values is delivered to the fund the next business day. Although risk is mitigated by the collateral, the fund could experience a delay in recovering its securities and a possible loss of income or value if the borrower fails to return the securities. Securities lending revenue recognized by the fund consists of earnings on invested collateral and borrowing fees, net of any rebates to the borrower and compensation to the lending agent. At June 30, 2005, the value of loaned securities was $7,203,000; aggregate collateral consisted of $7,478,000 in money market pooled accounts.
Other Purchases and sales of portfolio securities, other than short-term and U.S. government securities, aggregated $25,104,000 and $23,644,000, respectively, for the six months ended June 30, 2005. Purchases and sales of U.S. government securities aggregated $20,159,000 and $15,473,000, respectively, for the six months ended June 30, 2005.
NOTE 3 - FEDERAL INCOME TAXES
No provision for federal income taxes is required since the fund intends to continue to qualify as a regulated investment company under Subchapter M of the Internal Revenue Code and distribute to shareholders all of its taxable income and gains. Federal income tax regulations differ from generally accepted accounting principles; therefore, distributions determined in accordance with tax regulations may differ in amount or character from net investment income and realized gains for financial reporting purposes. Financial reporting records are adjusted for permanent book/tax differences to reflect tax character. Financial records are not adjusted for temporary differences. The amount and character of tax-basis distributions and composition of net assets are finalized at fiscal year-end; accordingly, tax-basis balances have not been determined as of June 30, 2005.
The fund intends to retain realized gains to the extent of available capital loss carryforwards. As of December 31, 2004, the fund had $3,398,000 of unused capital loss carryforwards, of which $885,000 expire in 2010 and $2,513,000 expire in 2011.
At June 30, 2005, the cost of investments for federal income tax purposes was $116,972,000. Net unrealized gain aggregated $22,052,000 at period-end, of which $23,645,000 related to appreciated investments and $1,593,000 related to depreciated investments.
NOTE 4 - RELATED PARTY TRANSACTIONS
The fund is managed by T. Rowe Price Associates, Inc. (the manager or Price Associates), a wholly owned subsidiary of T. Rowe Price Group, Inc. The investment management and administrative agreement between the fund and the manager provides for an all-inclusive annual fee equal to 0.90% of the fund’s average daily net assets. The fee is computed daily and paid monthly. The agreement provides that investment management, shareholder servicing, transfer agency, accounting, and custody services are provided to the fund, and interest, taxes, brokerage commissions, directors’ fees and expenses, and extraordinary expenses are paid directly by the fund.
The fund may invest in the T. Rowe Price Reserve Investment Fund and the T. Rowe Price Government Reserve Investment Fund (collectively, the Reserve Funds), open-end management investment companies managed by Price Associates and affiliates of the fund.
The Reserve Funds are offered as cash management options to mutual funds, trusts, and other accounts managed by Price Associates and/or its affiliates, and are not available for direct purchase by members of the public. The Reserve Funds pay no investment management fees. During the six months ended June 30, 2005, dividend income from the Reserve Funds totaled $100,000, and the value of shares of the Reserve Funds held at June 30, 2005, and December 31, 2004, was $8,859,000 and $5,878,000, respectively.
The fund may invest in the T. Rowe Price Institutional High Yield Fund, Inc. (High Yield Fund) as a means of gaining efficient and cost-effective exposure to the high-yield bond markets. The High Yield Fund is an open-end management investment company managed by Price Associates, and an affiliate of the fund. The High Yield Fund pays an annual all-inclusive management and administrative fee to Price Associates equal to 0.50% of average daily net assets. To ensure that Personal Strategy Balanced Portfolio does not incur duplicate fees for its assets invested in High Yield Fund, Price Associates has agreed to reduce its management fee to the fund. Accordingly, the management fee waiver reflected on the accompanying Statement of Operations includes $13,000 of management fees permanently waived pursuant to this agreement. During the six months ended June 30, 2005, purchases and sales of High Yield Fund were $212,000 and $2,623,000, respectively. Realized losses during the period were $23,000, and investment income during the period was $192,000. At June 30, 2005, and December 31, 2004, the value of shares of High Yield Fund held were $3,141,000 and $5,750,000, respectively.
| Information on Proxy Voting Policies, Procedures, and Records |
A description of the policies and procedures used by T. Rowe Price funds and portfolios to determine how to vote proxies relating to portfolio securities is available in each fund’s Statement of Additional Information, which you may request by calling 1-800-225-5132 or by accessing the SEC’s Web site, www.sec.gov. The description of our proxy voting policies and procedures is also available on our Web site, www.troweprice.com. To access it, click on the words “Company Info” at the top of our homepage for individual investors. Then, in the window that appears, click on the “Proxy Voting Policy” navigation button in the top left corner.
Each fund’s most recent annual proxy voting record is available on our Web site and through the SEC’s Web site. To access it through our Web site, follow the directions above, then click on the words “Proxy Voting Record” at the bottom of the Proxy Voting Policy page.
| How to Obtain Quarterly Portfolio Holdings |
The fund files a complete schedule of portfolio holdings with the Securities and Exchange Commission for the first and third quarters of each fiscal year on Form N-Q. The fund’s Form N-Q is available electronically on the SEC’s Web site (www.sec.gov); hard copies may be reviewed and copied at the SEC’s Public Reference Room, 450 Fifth St. N.W., Washington, DC 20549. For more information on the Public Reference Room, call 1-800-SEC-0330.
| Approval of Investment Management Agreement |
On March 2, 2005, the fund’s Board of Directors unanimously approved the investment advisory contract (“Contract”) between the fund and its investment manager, T. Rowe Price Associates, Inc. (“Manager”). The Board considered a variety of factors in connection with its review of the Contract, also taking into account information provided by the Manager during the course of the year, as discussed below:
Services Provided by the Manager
The Board considered the nature, quality, and extent of the services provided to the fund by the Manager. These services included, but were not limited to, management of the fund’s portfolio and a variety of activities related to portfolio management. The Board also reviewed the background and experience of the Manager’s senior management team and investment personnel involved in the management of the fund. The Board concluded that it was satisfied with the nature, quality, and extent of the services provided by the Manager.
Investment Performance of the Fund
The Board reviewed the fund’s average annual total return over the 1-, 3-, 5-, and 10-year periods as well as the fund’s year-by-year returns and compared these returns to previously agreed upon comparable performance measures and market data, including those supplied by Lipper and Morningstar, which are independent providers of mutual fund data. On the basis of this evaluation and the Board’s ongoing review of investment results, the Board concluded that the fund’s performance was satisfactory.
Costs, Benefits, Profits and Economies of Scale
The Board reviewed detailed information regarding the revenues received by the Manager under the Contract and other benefits that the Manager (and its affiliates) may have realized from its relationship with the fund, including research received under “soft dollar” agreements. The Board also received information on the estimated costs incurred and profits realized by the Manager and its affiliates from advising T. Rowe Price mutual funds, as well as estimates of the gross profits realized from managing the fund in particular. The Board concluded that the Manager’s profits were reasonable in light of the services provided to the fund. The Board also considered whether the fund or other funds benefit under the fee levels set forth in the Contract from any economies of scale realized by the Manager. The Board noted that, under the Contract, the fund pays the Manager a single fee based on the fund’s assets and the Manager, in turn, pays all expenses of the fund, with certain exceptions. The Board concluded that, based on the profitability data it reviewed and consistent with this single fee structure, the Contract provided for a reasonable sharing of benefits from any economies of scale with the fund.
Fees
The Board reviewed the fund’s single-fee structure and compared the rate to fees and expenses of other comparable funds based on information and data supplied by Lipper. The information provided to the Board indicated that the fund’s single fee rate was at or below the median management fee rate and expense ratio for comparable funds. The Board also reviewed the fee schedules for comparable privately managed accounts of the Manager and its affiliates. Management informed the Board that the Manager’s responsibilities for privately managed accounts are more limited than its responsibilities for the fund and other T. Rowe Price mutual funds that it or its affiliates advise. On the basis of the information provided, the Board concluded that the fees paid by the fund under the Contract were reasonable.
Approval of the Contract
As noted, the Board approved the continuation of the Contract. No single factor was considered in isolation or to be determinative to the decision. Rather, the Board concluded, in light of a weighting and balancing of all factors considered, that it was in the best interests of the fund to approve the continuation of the Contract, including the fees to be charged for services thereunder.
Item 2. Code of Ethics.
A code of ethics, as defined in Item 2 of Form N-CSR, applicable to its principal executive officer, principal financial officer, principal accounting officer or controller, or persons performing similar functions is filed as an exhibit to the registrant’s annual Form N-CSR. No substantive amendments were approved or waivers were granted to this code of ethics during the registrant’s most recent fiscal half-year.
Item 3. Audit Committee Financial Expert.
Disclosure required in registrant’s annual Form N-CSR.
Item 4. Principal Accountant Fees and Services.
Disclosure required in registrant’s annual Form N-CSR.
Item 5. Audit Committee of Listed Registrants.
Not applicable.
Item 6. Schedule of Investments.
Not applicable. The complete schedule of investments is included in Item 1 of this Form N-CSR.
Item 7. Disclosure of Proxy Voting Policies and Procedures for Closed-End Management Investment Companies.
Not applicable.
Item 8. Portfolio Managers of Closed-End Management Investment Companies.
Not applicable.
Item 9. Purchases of Equity Securities by Closed-End Management Investment Company and Affiliated Purchasers.
Not applicable.
Item 10. Submission of Matters to a Vote of Security Holders.
Not applicable.
Item 11. Controls and Procedures.
(a) The registrant’s principal executive officer and principal financial officer have evaluated the registrant’s disclosure controls and procedures within 90 days of this filing and have concluded that the registrant’s disclosure controls and procedures were effective, as of that date, in ensuring that information required to be disclosed by the registrant in this Form N-CSR was recorded, processed, summarized, and reported timely.
(b) The registrant’s principal executive officer and principal financial officer are aware of no change in the registrant’s internal control over financial reporting that occurred during the registrant’s second fiscal quarter covered by this report that has materially affected, or is reasonably likely to materially affect, the registrant’s internal control over financial reporting.
Item 12. Exhibits.
(a)(1) The registrant’s code of ethics pursuant to Item 2 of Form N-CSR is filed with the registrant’s annual Form N-CSR.
(2) Separate certifications by the registrant's principal executive officer and principal financial officer, pursuant to Section 302 of the Sarbanes-Oxley Act of 2002 and required by Rule 30a-2(a) under the Investment Company Act of 1940, are attached.
(3) Written solicitation to repurchase securities issued by closed-end companies: not applicable.
(b) A certification by the registrant's principal executive officer and principal financial officer, pursuant to Section 906 of the Sarbanes-Oxley Act of 2002 and required by Rule 30a-2(b) under the Investment Company Act of 1940, is attached.
| | |
SIGNATURES |
| |
| | Pursuant to the requirements of the Securities Exchange Act of 1934 and the Investment |
| Company Act of 1940, the registrant has duly caused this report to be signed on its behalf by the |
| undersigned, thereunto duly authorized. |
| |
| T. Rowe Price Equity Series, Inc. |
| |
| By | /s/ James S. Riepe |
| | James S. Riepe |
| | Principal Executive Officer |
| |
| Date | August 18, 2005 |
| |
| |
| | Pursuant to the requirements of the Securities Exchange Act of 1934 and the Investment |
| Company Act of 1940, this report has been signed below by the following persons on behalf of |
| the registrant and in the capacities and on the dates indicated. |
| |
| |
| By | /s/ James S. Riepe |
| | James S. Riepe |
| | Principal Executive Officer |
| |
| Date | August 18, 2005 |
| |
| |
| |
| By | /s/ Joseph A. Carrier |
| | Joseph A. Carrier |
| | Principal Financial Officer |
| |
| Date | August 18, 2005 |