Item 1: Report to Shareholders| New America Growth Portfolio | June 30, 2005 |
The views and opinions in this report were current as of June 30, 2005. They are not guarantees of performance or investment results and should not be taken as investment advice. Investment decisions reflect a variety of factors, and the managers reserve the right to change their views about individual stocks, sectors, and the markets at any time. As a result, the views expressed should not be relied upon as a forecast of the fund’s future investment intent. The report is certified under the Sarbanes-Oxley Act of 2002, which requires mutual funds and other public companies to affirm that, to the best of their knowledge, the information in their financial reports is fairly and accurately stated in all material respects.
Dear Investor
Equity markets struggled during the first half of 2005, as solid corporate profit growth was offset by concerns over rising interest rates and record-high oil prices. Stocks trended lower for the first four months of the year before staging a powerful rally in May and June. Despite a late-period pickup, large-cap value shares outperformed large growth over the past six months.
| Performance Comparison |
| Periods Ended 6/30/05 | 6 Months | 12 Months |
| New America | | |
| Growth Portfolio | -1.75% | 3.74% |
| S&P 500 Stock Index | -0.81 | 6.32 |
| Lipper Variable Annuity | | |
| Underlying Multi-Cap Growth | |
| Funds Average | -0.33 | 5.55 |
For the six months ended June 30, the New America Growth Portfolio returned -1.75%. Our performance trailed the Lipper Variable Annuity Underlying Multi-Cap Growth Funds Average and the S&P 500, as shown in the table. Our results versus the S&P 500 benefited from strong stock selection, especially in information technology and financials, but suffered due to allocation decisions—overweighting technology and underweighting energy and utilities. Over the past 12 months, the portfolio generated a 3.74% return that lagged the 6.32% and 5.55% results for the S&P 500 and the Lipper peer group, respectively.
MARKET ENVIRONMENT
The twin negatives of rising short-term interest rates and higher oil prices remained front and center on most investors’ minds, offsetting good corporate profit results. The Federal Reserve continued its series of short-term rate increases, hiking the fed funds rate in quarter-point increments four times in the first half. Oil prices rose from the low $40s at the beginning of the year to above $60 in late June. Both issues created a drag on consumer spending, and are perceived to threaten the strength of the economy.
Growth stocks continued to underperform value during the period. For example, the Russell 1000 Growth Index (a yardstick for large-cap growth stocks) fell 1.7% over the past six months, compared to the Russell 1000 Value Index’s gain of 1.8%, leading to a 3.5% difference. This disparity is greater for the past 12 months when the growth index gained 1.7% and the value index returned 14.1%, leading to a 12.4% gap.
In the first half, the S&P 500’s two best-performing sectors were energy (+20%), which benefited from the surge in oil prices, and utilities (+15%), which drew attention from investors in search of lower risk and higher yields in the low-rate environment. Other than a modest gain in health care stocks, the remaining sectors all declined with the materials and information technology sectors posting the largest losses. New America Growth continues to have a fair amount of exposure to energy and tech stocks, but limited exposure to utilities and materials—sectors that typically do not meet our growth hurdles.
PORTFOLIO REVIEW
The portfolio’s best first-half contributors were Genentech, Smith International, and UnitedHealth Group. Leading biotech company Genentech rose sharply during the period thanks to its cancer drug Avastin, which showed positive results in breast and lung cancer trials. This is a large opportunity for the company that raises our confidence about Genentech’s ability to grow rapidly for the remainder of this decade. Smith International, which is featured later in the Investment Strategy portion of the letter, is a leading oil services company. Buoyed by persistently rising energy prices, the demand for Smith’s services has been strong, driving excellent earnings growth and a rising stock price. UnitedHealth Group, the country’s largest managed care company, continued to benefit from above-average earnings growth. It was also among the portfolio’s top contributors for the past 12 months. (Please refer to our portfolio of investments for a complete listing of the portfolio’s holdings and the amount each represents of the portfolio.)
Other standouts for the past 12 months were Diamond Offshore, a longtime energy holding that benefited from the same positive sector backdrop as Smith International, and Legg Mason, which posted strong earnings results and continued success in transitioning its business into a more highly valued “asset manager.” In late June, this transition was punctuated by the company’s sale of its retail brokerage business and the simultaneous acquisition of Citigroup’s asset management business, a move that Wall Street cheered enthusiastically.
The portfolio’s largest first-half detractors included United Parcel Service, International Game Technology, and Elan. UPS missed its fourth-quarter earnings estimates due to the competitive environment and poor weather. Slot machine maker IGT fell as its earnings growth stalled on a slowdown in replacement sales and concerns about increasing competition and delays in the opening of new jurisdictions. Elan dropped sharply after having to suspend sales of its promising new multiple sclerosis drug Tysabri, due to safety concerns.
We added several significant new holdings over the past six months. Our largest purchase was Brunswick, a dominant boat and boat engine (Mercury) manufacturer. We believe the company’s recreational products will benefit from rising demand from our aging population. Management has engineered a turnaround over the past few years, and we think we’ll see further profit margin improvements. The company should also generate roughly 20% earnings growth this year and next. The bottom line on Brunswick: at about 10 times next year’s expected earnings the stock is very cheap relative to its expected earnings growth.
| Periods Ended | 6/30/04 | 12/31/04 | 6/30/05 |
| Information | | | |
| Technology | 28.3% | 29.8% | 32.1% |
| Consumer | | | |
| Discretionary | 18.3 | 18.0 | 21.3 |
| Health Care | 17.2 | 16.8 | 14.5 |
| Industrials and | | | |
| Business Services | 11.1 | 12.2 | 12.4 |
| Financials | 11.7 | 11.2 | 9.7 |
| Energy | 5.2 | 4.3 | 4.6 |
| Consumer Staples | 2.9 | 3.1 | 3.1 |
| Telecommunication | | | |
| Services | 2.8 | 1.3 | 1.4 |
| Materials | 0.5 | 0.4 | 0.0 |
| Utilities | 0.0 | 0.0 | 0.0 |
| Other and Reserves | 2.0 | 2.9 | 0.9 |
| Total | 100.0% | 100.0% | 100.0% |
| Historical weightings reflect current industry/sector classifications. |
Our next-largest first-half purchase was Harman International. In addition to owning leading audio brands such as JBL and Infinity, the company is the worldwide leader in automotive navigation systems, with major customers including BMW, Mercedes, Audi, and Chrysler. We think this market will generate rapid growth over the next five years as penetration rates rise and navigation systems migrate into the automotive mass market. Harman is well positioned and should benefit from further profit margin expansion that could drive 20% earnings growth for the next three to five years.
Our largest sales over the past six months were UPS and Sungard Data Systems. We still own a sizable position in UPS, but we decided to lighten our exposure until the competitive environment improves. In March, longtime holding Sungard Data announced it would be acquired by a consortium of seven private equity firms in a deal valued at approximately $11.4 billion. We locked in a sizable gain and closed out our position in late June.
INVESTMENT STRATEGY
New America Growth seeks to invest in America’s best larger-cap growth stocks. We are attracted to firms that serve large and growing markets, enjoy solid profit margins and returns, feature strong balance sheets, generate above-average free cash flow, and have an experienced and capable management team. We believe this investment strategy and discipline can generate solid results for our shareholders over the long run.
Smith International
Smith International was our second-largest holding at the end of the reporting period and is a prime example of our investment strategy. Smith is a leading oilfield services company based in Houston and has been a fixture in the portfolio for many years. The company provides a broad set of products and services, including drilling fluids, drill bits, and production chemicals to its customer base of oil and gas exploration and production (E&P) companies. In a nutshell, Smith provides technologies that enable E&P companies to produce oil and gas more efficiently. With oil prices hitting all-time highs in recent months, there is a favorable backdrop for Smith’s products.
Strong demand drove revenues up 23% in 2004 and 27% in the first quarter of 2005 (versus year-ago results). Profit margins are also rising. In its core business, Smith’s operating profit margin recently matched its prior cycle’s peak, yet increases in its prices and a more favorable product mix set the stage for additional margin improvement this year. Furthermore, this well-managed company generates strong cash flow and has been buying back stock—something we like to see. Following a stellar 2004 in which earnings per share jumped 61%, we expect a 40% earnings increase this year, which would make it one of the portfolio’s fastest-growing names.
OUTLOOK
There’s no secret that the environment for larger growth stocks has been extremely challenging. For the past five years, the Russell 1000 Growth Index declined 10.4% per year on an annualized basis, while the Russell 1000 Value Index gained an average of 6.6% per year. It’s hard to fathom, but the fact is roughly one-third of New America Growth’s assets are invested in companies with stock prices that are lower today than they were five years ago. We are referring to high-quality names including General Electric, Microsoft, Wal-Mart, Home Depot, and Dell. These companies have expanded sales and profits annually for the five-year period, and concurrently endured a P/E multiple contraction from an average of more than 35 five years to roughly 20 today (based on 2001 and 2006 earnings, respectively).
Looking ahead, the equity markets face the headwinds already discussed in addition to the potential of a weakening euro, which could cause the revenue growth for multinational companies to slow, and stock options expensing, which is likely to increase the P/E multiples for many growth companies. I think these issues are already somewhat factored into stock prices in the form of improved valuations, helping to create more opportunities to buy high-quality growth companies that fit into our investing regimen at attractive prices.
I am optimistic about our portfolio of investments. The portfolio is following a sound long-term investment strategy, and I remain focused on long-term performance measured in years, not weeks or months. I look forward to updating shareholders on our progress at year-end.
Respectfully submitted,

Joseph M. Milano
Chairman of the portfolio’s Investment Advisory Committee
July 18, 2005
The committee chairman has day-to-day responsibility for managing the portfolio and works with committee members in developing and executing the investment program.
The portfolio’s share price can fall because of weakness in the stock markets, a particular industry, or specific holdings. Stock markets can decline for many reasons, including adverse political or economic developments, changes in investor psychology, or heavy institutional selling. The prospects for an industry or company may deteriorate because of a variety of factors, including disappointing earnings or changes in the competitive environment. In addition, the investment manager’s assessment of companies may prove incorrect, resulting in losses or poor performance even in rising markets.
Dividend yield: The annual dividend of a stock divided by the stock’s price.
Free cash flow: The excess cash a company is generating from its operations that can be taken out of the business for the benefit of shareholders, such as dividends, share repurchases, investments, and acquisitions.
Lipper averages: The averages of all mutual funds in a particular category as tracked by Lipper Inc.
Price/book ratio: A valuation measure that compares a stock’s market price to its book value, i.e., the company’s net worth divided by the number of outstanding shares.
Price/earnings ratio (P/E): A valuation measure calculated by dividing the price of a stock by its current or projected earnings per share. This ratio gives investors an idea of how much they are paying for current or future earnings power.
Russell 1000 Index: A stock market index of 1,000 large-cap U.S. companies.
Russell 1000 Growth Index: An index of those firms in the Russell 1000 with higher price-to-book ratios and higher forecast growth rates.
Russell 1000 Value Index: An index of those firms in the Russell 1000 with lower price-to-book ratios and lower forecast growth rates.
S&P 500 Stock Index: An unmanaged index that tracks the stocks of 500 primarily large-cap U.S. companies.
Portfolio Highlights
| Twenty-Five Largest Holdings |
| | Percent of |
| | Net Assets |
| | 6/30/05 |
| Dell | 3.2% |
| Smith International | 2.2 |
| Cisco Systems | 1.9 |
| Microsoft | 1.9 |
| Sysco | 1.7 |
| Roper Industries | 1.6 |
| First Data | 1.6 |
| Intuit | 1.6 |
| ChoicePoint | 1.6 |
| UnitedHealth Group | 1.5 |
| Medtronic | 1.5 |
| Getty Images | 1.5 |
| Brunswick | 1.5 |
| Intel | 1.5 |
| Harman International | 1.4 |
| Certegy | 1.4 |
| Amgen | 1.4 |
| GE | 1.4 |
| UPS | 1.4 |
| Wal-Mart | 1.4 |
| PETsMART | 1.4 |
| Lockheed Martin | 1.4 |
| Affiliated Computer Services | 1.3 |
| Royal Caribbean Cruises | 1.3 |
| Analog Devices | 1.3 |
| Total | 39.9% |
Portfolio Highlights
| Contributions to the Change in Net Asset Value |
| 6 Months Ended 6/30/05 |
| BEST CONTRIBUTORS | | | WORST CONTRIBUTORS | |
| |
|
| Genentech | 7¢ | | UPS | -9¢ |
| Smith International | 5 | | International Game Technology | -6 |
| UnitedHealth Group | 5 | | Elan | -6 |
| Legg Mason | 5 | | ChoicePoint | -6 |
| SunGard Data Systems * | 4 | | CDW | -5 |
| Diamond Offshore Drilling | 4 | | Harman International | -5 |
| Lockheed Martin | 4 | | Family Dollar Stores | -4 |
| Murphy Oil | 4 | | American International Group | -4 |
| Roper Industries | 4 | | PETsMART | -3 |
| ResMed | 4 | | Xilinx | -3 |
| |
|
| Total | 46¢ | | Total | -51¢ |
| |
|
| |
| 12 Months Ended 6/30/05 | | | | |
| |
| BEST CONTRIBUTORS | | | WORST CONTRIBUTORS | |
| |
|
| Diamond Offshore Drilling | 14¢ | | International Game Technology | -10¢ |
| UnitedHealth Group | 13 | | Cisco Systems | -7 |
| Legg Mason ** | 8 | | Forest Laboratories * | -7 |
| Genentech | 8 | | Intersil Holding * | -6 |
| Getty Images | 8 | | Pfizer | -6 |
| Franklin Resources | 7 | | American International Group | -6 |
| Dell | 6 | | Microsoft | -6 |
| Lockheed Martin | 6 | | ChoicePoint | -6 |
| SunGard Data Systems * | 6 | | Boston Scientific | -5 |
| PF Chang’s China Bistro | 6 | | Omnicare * | -5 |
| |
|
| Total | 82¢ | | Total | -64¢ |
| |
|
| * Position eliminated |
| ** Position added |
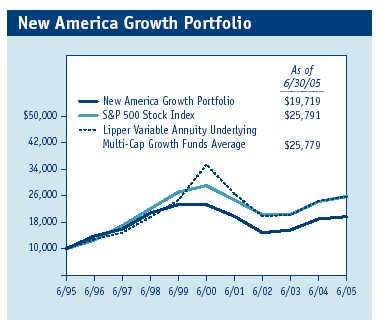
This chart shows the value of a hypothetical $10,000 investment in the fund over the past 10 fiscal year periods or since inception (for funds lacking 10-year records). The result is compared with benchmarks, which may include a broad-based market index and a peer group average or index. Market indexes do not include expenses, which are deducted from fund returns as well as mutual fund averages and indexes.
| Average Annual Compound Total Return |
| Periods Ended 6/30/05 | 1 Year | 5 Years | 10 Years |
| New America Growth Portfolio | 3.74% | -3.31% | 7.03% |
| S&P 500 Stock Index | 6.32 | -2.37 | 9.94 |
| Lipper Variable Annuity | | | |
| Underlying Multi-Cap Growth | | | |
| Funds Average | 5.55 | -7.99 | 9.15 |
Current performance may be higher or lower than the quoted past performance, which cannot guarantee future results. Share price, principal value, and return will vary, and you may have a gain or loss when you sell your shares. For the most recent month-end performance information, please visit our Web site (troweprice.com) or contact a T. Rowe Price representative at 1-800-469-5304. Total returns do not include charges imposed by your insurance company’s separate account. If these were included, performance would have been lower.
This table shows how the portfolio and its benchmarks would have performed each year if their actual (or cumulative) returns for the periods shown had been earned at a constant rate. Average annual total return figures include changes in principal value, reinvested dividends, and capital gain distributions. When assessing performance, investors should consider both short- and long-term returns.
Fund Expense Example
As a mutual fund shareholder, you may incur two types of costs: (1) transaction costs such as redemption fees or sales loads and (2) ongoing costs, including management fees, distribution and service (12b-1) fees, and other fund expenses. The following example is intended to help you understand your ongoing costs (in dollars) of investing in the fund and to compare these costs with the ongoing costs of investing in other mutual funds. The example is based on an investment of $1,000 invested at the beginning of the most recent six-month period and held for the entire period.
Actual Expenses
The first line of the following table (“Actual”) provides information about actual account values and actual expenses. You may use the information in this line, together with your account balance, to estimate the expenses that you paid over the period. Simply divide your account value by $1,000 (for example, an $8,600 account value divided by $1,000 = 8.6), then multiply the result by the number in the first line under the heading “Expenses Paid During Period” to estimate the expenses you paid on your account during this period.
Hypothetical Example for Comparison Purposes
The information on the second line of the table (“Hypothetical”) is based on hypothetical account values and expenses derived from the fund’s actual expense ratio and an assumed 5% per year rate of return before expenses (not the fund’s actual return). You may compare the ongoing costs of investing in the fund with other funds by contrasting this 5% hypothetical example and the 5% hypothetical examples that appear in the shareholder reports of the other funds. The hypothetical account values and expenses may not be used to estimate the actual ending account balance or expenses you paid for the period.
You should also be aware that the expenses shown in the table highlight only your ongoing costs and do not reflect any transaction costs, such as redemption fees or sales loads. Therefore, the second line of the table is useful in comparing ongoing costs only, and will not help you determine the relative total costs of owning different funds. To the extent a fund charges transaction costs, however, the total cost of owning that fund is higher.
| T. Rowe Price New America Growth Portfolio |
| | | | Expenses |
| | Beginning | Ending | Paid During |
| | Account | Account | Period* |
| | Value | Value | 1/1/05 to |
| | 1/1/05 | 6/30/05 | 6/30/05 |
| Actual | $1,000.00 | $ 982.50 | $4.18 |
| Hypothetical | | | |
| (assumes 5% return | | | |
| before expenses) | 1,000.00 | 1,020.58 | 4.26 |
| * Expenses are equal to the fund’s annualized expense ratio for the six-month |
| period (0.85%), multiplied by the average account value over the period, |
| multiplied by the number of days in the most recent fiscal half year (181) |
| divided by the days in the year (365) to reflect the half-year period. |
Financial Highlights
T. Rowe Price New America Growth Portfolio
(Unaudited)
| | For a share outstanding throughout each period |
|
|
| |
| | | 6 Months | | Year | | | | | | | | |
| | | Ended | | Ended | | | | | | | | |
| | | 6/30/05** | | 12/31/04 | | 12/31/03 | | 12/31/02 | | 12/31/01 | | 12/31/00 |
| NET ASSET VALUE | | | | | | | | | | | | |
| Beginning of period | $ | 19.45 | $ | 17.55 | $ | 12.99 | $ | 18.12 | $ | 20.91 | $ | 26.18 |
|
|
| Investment activities | | | | | | | | | | | | |
| Net investment income (loss) | | – | | – | | (0.03) | | (0.05) | | (0.04) | | (0.04) |
| Net realized and | | | | | | | | | | | | |
| unrealized gain (loss) | | (0.34) | | 1.91 | | 4.59 | | (5.08) | | (2.44) | | (2.64) |
|
|
| Total from | | | | | | | | | | | | |
| investment activities | | (0.34) | | 1.91 | | 4.56 | | (5.13) | | (2.48) | | (2.68) |
|
|
| Distributions | | | | | | | | | | | | |
| Net investment income | | – | | (0.01) | | – | | – | | – | | – |
| Net realized gain | | – | | – | | – | | – | | (0.31) | | (2.59) |
|
|
| Total distributions | | – | | (0.01) | | – | | – | | (0.31) | | (2.59) |
|
|
| |
| NET ASSET VALUE | | | | | | | | | | | | |
| End of period | $ | 19.11 | $ | 19.45 | $ | 17.55 | $ | 12.99 | $ | 18.12 | $ | 20.91 |
|
|
| |
| Ratios/Supplemental Data | | | | | | | | | | | | |
| Total return^ | | (1.75)% | | 10.88% | | 35.10% | | (28.31)% | | (11.84)% | | (10.62)% |
| Ratio of total expenses to | | | | | | | | | | | | |
| average net assets | | 0.85%† | | 0.85% | | 0.85% | | 0.85% | | 0.85% | | 0.85% |
| Ratio of net investment | | | | | | | | | | | | |
| income (loss) to average | | | | | | | | | | | | |
| net assets | | (0.04)%† | | 0.01%+ | | (0.20)% | | (0.29)% | | (0.20)% | | (0.18)% |
| Portfolio turnover rate | | 57.4%† | | 56.2% | | 64.2% | | 62.7% | | 56.4% | | 89.2% |
| Net assets, end of period | | | | | | | | | | | | |
| (in thousands) | $ | 76,280 | $ | 76,312 | $ | 70,847 | $ | 55,871 | $ | 90,282 | $ | 108,835 |
| ^ Total return reflects the rate that an investor would have earned on an investment in the fund during each period, assuming reinvestment |
| of all distributions. |
| † Annualized |
| **Per share amounts calculated using average shares outstanding method. |
| + Includes the effect of a one-time special dividend (0.25% of average net assets) that is not expected to recur. |
| |
| The accompanying notes are an integral part of these financial statements. |
Portfolio of Investments (1)
T. Rowe Price New America Growth Portfolio
June 30, 2005 (Unaudited)
| | Shares | Value |
|
| (Cost and value in $ 000s) | | |
| |
| COMMON STOCKS 99.1% | | |
| |
| CONSUMER DISCRETIONARY 21.3% | |
| Automobiles 0.7% | | |
| Harley-Davidson | 10,500 | 521 |
| | | 521 |
| Diversified Consumer Services 1.8% | | |
| Apollo Group, Class A * | 11,300 | 884 |
| Education Management * | 15,800 | 533 |
| | | 1,417 |
| Hotels, Restaurants & Leisure 4.1% | | |
| International Game Technology | 34,300 | 965 |
| Outback Steakhouse | 13,700 | 620 |
| PF Chang’s China Bistro * | 8,500 | 501 |
| Royal Caribbean Cruises | 21,000 | 1,016 |
| | | 3,102 |
| Household Durables 1.9% | | |
| Garmin | 8,600 | 368 |
| Harman International | 13,400 | 1,090 |
| | | 1,458 |
| Internet & Catalog Retail 0.9% | | |
| eBay * | 19,900 | 657 |
| | | 657 |
| Leisure Equipment & Products 1.5% | |
| Brunswick | 25,700 | 1,113 |
| | | 1,113 |
| Media 5.3% | | |
| Getty Images * | 15,000 | 1,114 |
| Liberty Media, Class A * | 85,600 | 872 |
| News Corp., Class A | 23,200 | 376 |
| Scripps, Class A | 17,200 | 839 |
| Viacom, Class B | 26,301 | 842 |
| | | 4,043 |
| Multiline Retail 1.9% | | |
| Family Dollar Stores | 29,600 | 773 |
| Kohl’s * | 12,900 | 721 |
| | | 1,494 |
| Specialty Retail 3.2% | | |
| Home Depot | 18,100 | 704 |
| PETsMART | 34,200 | 1,038 |
| Staples | 31,950 | 681 |
| | | 2,423 |
| Total Consumer Discretionary | | 16,228 |
| CONSUMER STAPLES 3.1% | | |
| Food & Staples Retailing 3.1% | | |
| Sysco | 36,650 | 1,326 |
| Wal-Mart | 21,800 | 1,051 |
| Total Consumer Staples | | 2,377 |
| |
| ENERGY 4.6% | | |
| Energy Equipment & Services 3.9% | | |
| Baker Hughes | 5,025 | 257 |
| Cooper Cameron * | 9,700 | 602 |
| Diamond Offshore Drilling | 8,350 | 446 |
| Smith International | 26,100 | 1,663 |
| | | 2,968 |
| Oil, Gas & Consumable Fuels 0.7% | | |
| Murphy Oil | 11,000 | 574 |
| | | 574 |
| Total Energy | | 3,542 |
| |
| FINANCIALS 9.7% | | |
| Capital Markets 4.3% | | |
| Franklin Resources | 8,300 | 639 |
| Goldman Sachs | 4,950 | 505 |
| Investors Financial Services | 3,700 | 140 |
| Lazard * | 17,200 | 400 |
| Legg Mason | 5,600 | 583 |
| Lehman Brothers | 5,800 | 576 |
| Morgan Stanley | 7,900 | 414 |
| | | 3,257 |
| Diversified Financial Services 1.0% | | |
| Citigroup | 17,300 | 800 |
| | | 800 |
| Insurance 4.4% | | |
| AFLAC | 14,100 | 610 |
| American International Group | 10,600 | 616 |
| Assurant | 14,100 | 509 |
| Genworth Financial, Class A | 13,100 | 396 |
| Hartford Financial Services | 7,900 | 591 |
| Progressive Corporation | 6,600 | 652 |
| | | 3,374 |
| Total Financials | | 7,431 |
| HEALTH CARE 14.5% | | |
| Biotechnology 4.9% | | |
| Amgen * | 17,600 | 1,064 |
| Amylin Pharmaceuticals * | 11,200 | 234 |
| Celgene * | 4,300 | 175 |
| Cephalon * | 10,950 | 436 |
| Genentech * | 9,400 | 755 |
| Gilead Sciences * | 11,700 | 515 |
| Martek Biosciences * | 3,000 | 114 |
| Neurocrine Biosciences * | 5,200 | 219 |
| OSI Pharmaceuticals * | 5,100 | 208 |
| | | 3,720 |
| Health Care Equipment & Supplies 3.6% | |
| Boston Scientific * | 14,600 | 394 |
| Medtronic | 22,200 | 1,150 |
| ResMed * | 10,700 | 706 |
| Stryker | 10,600 | 504 |
| | | 2,754 |
| Health Care Providers & Services 3.7% | |
| Henry Schein * | 12,400 | 515 |
| Laboratory Corporation of | | |
| America * | 5,500 | 275 |
| Quest Diagnostics | 16,600 | 884 |
| UnitedHealth Group | 22,600 | 1,178 |
| | | 2,852 |
| Pharmaceuticals 2.3% | | |
| Atherogenics * | 5,500 | 88 |
| Elan ADR * | 17,800 | 121 |
| Johnson & Johnson | 11,000 | 715 |
| Pfizer | 21,400 | 590 |
| Sepracor * | 3,900 | 234 |
| | | 1,748 |
| Total Health Care | | 11,074 |
| |
| INDUSTRIALS & BUSINESS SERVICES 12.4% | |
| Aerospace & Defense 1.3% | | |
| Lockheed Martin | 15,900 | 1,031 |
| | | 1,031 |
| Air Freight & Logistics 2.7% | | |
| C.H. Robinson Worldwide | 8,600 | 501 |
| Expeditors International of | | |
| Washington | 9,700 | 483 |
| UPS, Class B | 15,200 | 1,051 |
| | | 2,035 |
| Airlines 0.9% | | |
| Southwest Airlines | 49,700 | 692 |
| | | 692 |
| Commercial Services & Supplies 3.0% | |
| ChoicePoint * | 29,900 | 1,197 |
| Cintas | 17,300 | 668 |
| Consolidated Graphics * | 9,900 | 404 |
| | | 2,269 |
| Industrial Conglomerates 3.0% | | |
| GE | 30,600 | 1,061 |
| Roper Industries | 16,900 | 1,206 |
| | | 2,267 |
| Machinery 1.5% | | |
| Danaher | 8,600 | 450 |
| Deere | 10,700 | 701 |
| | | 1,151 |
| Total Industrials & Business Services | 9,445 |
| |
| INFORMATION TECHNOLOGY 32.1% | |
| Communications Equipment 3.0% | | |
| Cisco Systems * | 77,250 | 1,476 |
| Juniper Networks * | 20,400 | 514 |
| Research In Motion * | 4,200 | 310 |
| | | 2,300 |
| Computers & Peripherals 3.2% | | |
| Dell * | 61,600 | 2,434 |
| | | 2,434 |
| Electronic Equipment & Instruments 1.3% | |
| CDW | 17,100 | 976 |
| | | 976 |
| IT Services 7.0% | | |
| Affiliated Computer Services | | |
| Class A * | 20,100 | 1,027 |
| Automatic Data Processing | 12,900 | 541 |
| Certegy | 28,300 | 1,082 |
| First Data | 30,000 | 1,204 |
| Iron Mountain * | 30,000 | 931 |
| Paychex | 16,900 | 550 |
| | | 5,335 |
| Semiconductor & Semiconductor Equipment 7.9% | |
| Altera * | 27,000 | 535 |
| Analog Devices | 26,900 | 1,004 |
| Intel | 42,700 | 1,113 |
| Linear Technology | 17,600 | 646 |
| Maxim Integrated Products | 11,100 | 424 |
| Microchip Technology | 30,700 | 909 |
| Texas Instruments | 19,700 | 553 |
| Xilinx | 34,400 | 877 |
| | | 6,061 |
| Software 9.7% | | |
| Adobe Systems | 16,300 | 466 |
| Amdocs * | 18,000 | 476 |
| Electronic Arts * | 5,300 | 300 |
| Intuit * | 26,600 | 1,200 |
| Jack Henry & Associates | 51,400 | 941 |
| Mercury Interactive * | 15,450 | 593 |
| Microsoft | 58,900 | 1,463 |
| NAVTEQ * | 20,600 | 766 |
| Red Hat * | 15,200 | 199 |
| Symantec * | 44,500 | 967 |
| | | 7,371 |
| Total Information Technology | | 24,477 |
| |
| TELECOMMUNICATION SERVICES 1.4% | |
| Diversified Telecommunication Services 0.6% | |
| Sprint | 18,000 | 452 |
| | | 452 |
| Wireless Telecommunication Services 0.8% | |
| Nextel Communications | | |
| Class A * | 12,700 | 410 |
| Nextel Partners, Class A * | 7,500 | 189 |
| | | 599 |
| Total Telecommunication Services | 1,051 |
| Total Common Stocks (Cost $64,205) | 75,625 |
| |
| SHORT-TERM INVESTMENTS 0.9% | |
| | | |
| Money Market Fund 0.9% | | |
| T. Rowe Price Reserve Investment | |
| Fund, 3.14% #† | 718,809 | 719 |
| Total Short-Term Investments | | |
| (Cost $719) | | 719 |
| Total Investments in Securities | | |
| 100% of Net Assets (Cost $64,924) | $ | 76,344 |
| (1) | Denominated in U.S. dollars unless otherwise noted |
| # | Seven-day yield |
| * | Non-income producing |
| † | Affiliated company – See Note 4. |
| ADR | American Depository Receipts |
The accompanying notes are an integral part of these financial statements.
Statement of Assets and Liabilities
T. Rowe Price New America Growth Portfolio
June 30, 2005 (Unaudited)
(In thousands except shares and per share amounts)
| Assets | | |
| Investments in securities, at value | | |
| Affiliated companies (cost $719) | $ | 719 |
| Non-affiliated companies (cost $64,205) | | 75,625 |
|
|
| Total investments in securities | | 76,344 |
| Cash | | 1 |
| Dividends receivable | | 38 |
| Receivable for investment securities sold | | 242 |
| Receivable for shares sold | | 52 |
|
|
| Total assets | | 76,677 |
|
|
| |
| Liabilities | | |
| Payable for investment securities purchased | | 299 |
| Payable for shares redeemed | | 27 |
| Due to affiliates | | 71 |
|
|
| Total liabilities | | 397 |
|
|
| |
| NET ASSETS | $ | 76,280 |
|
|
| Net Assets Consist of: | | |
| Undistributed net investment income (loss) | $ | (16) |
| Undistributed net realized gain (loss) | | (6,725) |
| Net unrealized gain (loss) | | 11,420 |
| Paid-in-capital applicable to 3,992,036 shares of | | |
| $0.0001 par value capital stock outstanding; | | |
| 1,000,000,000 shares of the Corporation authorized | | 71,601 |
|
|
| |
| NET ASSETS | $ | 76,280 |
|
|
| NET ASSET VALUE PER SHARE | $ | 19.11 |
|
|
The accompanying notes are an integral part of these financial statements.
Statement of Operations
T. Rowe Price New America Growth Portfolio
(Unaudited)
($ 000s)
| | | 6 Months |
| | | Ended |
| | | 6/30/05 |
| Investment Income (Loss) | | |
| Dividend income | $ | 298 |
| Investment management and administrative expense | | 314 |
|
|
| Net investment income (loss) | | (16) |
|
|
| Realized and Unrealized Gain (Loss) | | |
| Net realized gain (loss) on securities | | 2,244 |
| Change in net unrealized gain (loss) on securities | | (3,514) |
|
|
| Net realized and unrealized gain (loss) | | (1,270) |
|
|
| INCREASE (DECREASE) IN NET | | |
| ASSETS FROM OPERATIONS | $ | (1,286) |
|
|
The accompanying notes are an integral part of these financial statements.
Statement of Changes in Net Assets
T. Rowe Price New America Growth Portfolio
(Unaudited)
($ 000s)
| | | 6 Months | | Year |
| | | Ended | | Ended |
| | | 6/30/05 | | 12/31/04 |
| |
| Increase (Decrease) in Net Assets | | | | |
| Operations | | | | |
| Net investment income (loss) | $ | (16) | $ | 8 |
| Net realized gain (loss) | | 2,244 | | 7,930 |
| Change in net unrealized gain (loss) | | (3,514) | | (613) |
|
|
| Increase (decrease) in net assets from operations | | (1,286) | | 7,325 |
|
|
| Distributions to shareholders | | | | |
| Net investment income | | – | | (38) |
|
|
| Capital share transactions * | | | | |
| Shares sold | | 7,916 | | 11,771 |
| Distributions reinvested | | – | | 38 |
| Shares redeemed | | (6,662) | | (13,631) |
|
|
| Increase (decrease) in net assets from capital | | | | |
| share transactions | | 1,254 | | (1,822) |
|
|
| |
| Net Assets | | | | |
| Increase (decrease) during period | | (32) | | 5,465 |
| Beginning of period | | 76,312 | | 70,847 |
|
|
| |
| End of period | $ | 76,280 | $ | 76,312 |
|
|
| (Including undistributed net investment income (loss) | | | | |
| of $(16) at 6/30/05 and $0 at 12/31/04) | | | | |
| |
| *Share information | | | | |
| Shares sold | | 424 | | 638 |
| Distributions reinvested | | – | | 2 |
| Shares redeemed | | (355) | | (755) |
|
|
| Increase (decrease) in shares outstanding | | 69 | | (115) |
The accompanying notes are an integral part of these financial statements.
Notes to Financial Statements
T. Rowe Price New America Growth Portfolio
June 30, 2005
(Unaudited)
NOTE 1 - SIGNIFICANT ACCOUNTING POLICIES
T. Rowe Price Equity Series, Inc. (the corporation) is registered under the Investment Company Act of 1940 (the 1940 Act). The New America Growth Portfolio (the fund), a diversified, open-end management investment company, is one portfolio established by the corporation. The fund commenced operations on March 31, 1994. The fund seeks to provide long-term growth of capital by investing primarily in the common stocks of companies operating in sectors T. Rowe Price believes will be the fastest growing in the United States. Shares of the fund are currently offered only through certain insurance companies as an investment medium for both variable annuity contracts and variable life insurance policies.
The accompanying financial statements were prepared in accordance with accounting principles generally accepted in the United States of America, which require the use of estimates made by fund management. Fund management believes that estimates and security valuations are appropriate; however actual results may differ from those estimates, and the security valuations reflected in the financial statements may differ from the value the fund receives upon sale of the securities.
Valuation The fund values its investments and computes its net asset value per share at the close of the New York Stock Exchange (NYSE), normally 4 p.m. ET, each day that the NYSE is open for business. Equity securities listed or regularly traded on a securities exchange or in the over-the-counter market are valued at the last quoted sale price or, for certain markets, the official closing price at the time the valuations are made, except for OTC Bulletin Board securities, which are valued at the mean of the latest bid and asked prices. A security that is listed or traded on more than one exchange is valued at the quotation on the exchange determined to be the primary market for such security. Listed securities not traded on a particular day are valued at the mean of the latest bid and asked prices for domestic securities and the last quoted sale price for international securities.
Investments in mutual funds are valued at the mutual fund’s closing net asset value per share on the day of valuation.
Other investments, including restricted securities, and those for which the above valuation procedures are inappropriate or are deemed not to reflect fair value are stated at fair value as determined in good faith by the T. Rowe Price Valuation Committee, established by the fund’s Board of Directors.
Investment Transactions, Investment Income, and Distributions Income and expenses are recorded on the accrual basis. Dividends received from mutual fund investments are reflected as dividend income; capital gain distributions are reflected as realized gain/loss. Dividend income and capital gain distributions are recorded on the ex-dividend date. Investment transactions are accounted for on the trade date. Realized gains and losses are reported on the identified cost basis. Distributions to shareholders are recorded on the ex-dividend date. Income distributions are declared and paid on an annual basis. Capital gain distributions, if any, are declared and paid by the fund, typically on an annual basis.
NOTE 2 - INVESTMENT TRANSACTIONS
Purchases and sales of portfolio securities, other than short-term securities, aggregated $23,972,000 and $21,178,000, respectively, for the six months ended June 30, 2005.
NOTE 3 - FEDERAL INCOME TAXES
No provision for federal income taxes is required since the fund intends to continue to qualify as a regulated investment company under Subchapter M of the Internal Revenue Code and distribute to shareholders all of its taxable income and gains. Federal income tax regulations differ from generally accepted accounting principles; therefore, distributions determined in accordance with tax regulations may differ in amount or character from net investment income and realized gains for financial reporting purposes. Financial reporting records are adjusted for permanent book/tax differences to reflect tax character. Financial records are not adjusted for temporary differences. The amount and character of tax-basis distributions and composition of net assets are finalized at fiscal year-end; accordingly, tax-basis balances have not been determined as of June 30, 2005.
The fund intends to retain realized gains to the extent of available capital loss carryforwards. As of December 31, 2004, the fund had $8,969,000 of unused capital loss carryforwards, of which $8,758,000 expire in 2010 and $211,000 expire in 2011.
At June 30, 2005, the cost of investments for federal income tax purposes was $64,924,000. Net unrealized gain aggregated $11,420,000 at period-end, of which $13,080,000 related to appreciated investments and $1,660,000 related to depreciated investments.
NOTE 4 - RELATED PARTY TRANSACTIONS
The fund is managed by T. Rowe Price Associates, Inc. (the manager or Price Associates), a wholly owned subsidiary of T. Rowe Price Group, Inc. The investment management and administrative agreement between the fund and the manager provides for an all-inclusive annual fee equal to 0.85% of the fund’s average daily net assets. The fee is computed daily and paid monthly. The agreement provides that investment management, shareholder servicing, transfer agency, accounting, and custody services are provided to the fund, and interest, taxes, brokerage commissions, directors’ fees and expenses, and extraordinary expenses are paid directly by the fund.
The fund may invest in the T. Rowe Price Reserve Investment Fund and the T. Rowe Price Government Reserve Investment Fund (collectively, the Reserve Funds), open-end management investment companies managed by Price Associates and affiliates of the fund. The Reserve Funds are offered as cash management options to mutual funds, trusts, and other accounts managed by Price Associates and/or its affiliates, and are not available for direct purchase by members of the public. The Reserve Funds pay no investment management fees. During the six months ended June 30, 2005, dividend income from the Reserve Funds totaled $12,000, and the value of shares of the Reserve Funds held at June 30, 2005 and December 31, 2004 was $719,000 and $4,443,000, respectively.
| Information on Proxy Voting Policies, Procedures, and Records |
A description of the policies and procedures used by T. Rowe Price funds and portfolios to determine how to vote proxies relating to portfolio securities is available in each fund’s Statement of Additional Information, which you may request by calling 1-800-225-5132 or by accessing the SEC’s Web site, www.sec.gov. The description of our proxy voting policies and procedures is also available on our Web site, www.troweprice.com. To access it, click on the words “Company Info” at the top of our homepage for individual investors. Then, in the window that appears, click on the “Proxy Voting Policy” navigation button in the top left corner.
Each fund’s most recent annual proxy voting record is available on our Web site and through the SEC’s Web site. To access it through our Web site, follow the directions above, then click on the words “Proxy Voting Record” at the bottom of the Proxy Voting Policy page.
| How to Obtain Quarterly Portfolio Holdings |
The fund files a complete schedule of portfolio holdings with the Securities and Exchange Commission for the first and third quarters of each fiscal year on Form N-Q. The fund’s Form N-Q is available electronically on the SEC’s Web site (www.sec.gov); hard copies may be reviewed and copied at the SEC’s Public Reference Room, 450 Fifth St. N.W., Washington, DC 20549. For more information on the Public Reference Room, call 1-800-SEC-0330.
| Approval of Investment Management Agreement |
On March 2, 2005, the fund’s Board of Directors unanimously approved the investment advisory contract (“Contract”) between the fund and its investment manager, T. Rowe Price Associates, Inc. (“Manager”). The Board considered a variety of factors in connection with its review of the Contract, also taking into account information provided by the Manager during the course of the year, as discussed below:
Services Provided by the Manager
The Board considered the nature, quality, and extent of the services provided to the fund by the Manager. These services included, but were not limited to, management of the fund’s portfolio and a variety of activities related to portfolio management. The Board also reviewed the background and experience of the Manager’s senior management team and investment personnel involved in the management of the fund. The Board concluded that it was satisfied with the nature, quality, and extent of the services provided by the Manager.
Investment Performance of the Fund
The Board reviewed the fund’s average annual total return over the 1-, 3-, 5-, and 10-year periods as well as the fund’s year-by-year returns and compared these returns to previously agreed upon comparable performance measures and market data, including those supplied by Lipper and Morningstar, which are independent providers of mutual fund data. On the basis of this evaluation and the Board’s ongoing review of investment results, the Board concluded that the fund’s performance was satisfactory.
Costs, Benefits, Profits and Economies of Scale
The Board reviewed detailed information regarding the revenues received by the Manager under the Contract and other benefits that the Manager (and its affiliates) may have realized from its relationship with the fund, including research received under “soft dollar” agreements. The Board also received information on the estimated costs incurred and profits realized by the Manager and its affiliates from advising T. Rowe Price mutual funds, as well as estimates of the gross profits realized from managing the fund in particular. The Board concluded that the Manager’s profits were reasonable in light of the services provided to the fund. The Board also considered whether the fund or other funds benefit under the fee levels set forth in the Contract from any economies of scale realized by the Manager. The Board noted that, under the Contract, the fund pays the Manager a single fee based on the fund’s assets and the Manager, in turn, pays all expenses of the fund, with certain exceptions. The Board concluded that, based on the profitability data it reviewed and consistent with this single fee structure, the Contract provided for a reasonable sharing of benefits from any economies of scale with the fund.
Fees
The Board reviewed the fund’s single-fee structure and compared the rate to fees and expenses of other comparable funds based on information and data supplied by Lipper. The information provided to the Board indicated that the fund’s single fee rate was at or below the median management fee rate and expense ratio for comparable funds. The Board also reviewed the fee schedules for comparable privately managed accounts of the Manager and its affiliates. Management informed the Board that the Manager’s responsibilities for privately managed accounts are more limited than its responsibilities for the fund and other T. Rowe Price mutual funds that it or its affiliates advise. On the basis of the information provided, the Board concluded that the fees paid by the fund under the Contract were reasonable.
Approval of the Contract
As noted, the Board approved the continuation of the Contract. No single factor was considered in isolation or to be determinative to the decision. Rather, the Board concluded, in light of a weighting and balancing of all factors considered, that it was in the best interests of the fund to approve the continuation of the Contract, including the fees to be charged for services thereunder.
Item 2. Code of Ethics.
A code of ethics, as defined in Item 2 of Form N-CSR, applicable to its principal executive officer, principal financial officer, principal accounting officer or controller, or persons performing similar functions is filed as an exhibit to the registrant’s annual Form N-CSR. No substantive amendments were approved or waivers were granted to this code of ethics during the registrant’s most recent fiscal half-year.
Item 3. Audit Committee Financial Expert.
Disclosure required in registrant’s annual Form N-CSR.
Item 4. Principal Accountant Fees and Services.
Disclosure required in registrant’s annual Form N-CSR.
Item 5. Audit Committee of Listed Registrants.
Not applicable.
Item 6. Schedule of Investments.
Not applicable. The complete schedule of investments is included in Item 1 of this Form N-CSR.
Item 7. Disclosure of Proxy Voting Policies and Procedures for Closed-End Management Investment Companies.
Not applicable.
Item 8. Portfolio Managers of Closed-End Management Investment Companies.
Not applicable.
Item 9. Purchases of Equity Securities by Closed-End Management Investment Company and Affiliated Purchasers.
Not applicable.
Item 10. Submission of Matters to a Vote of Security Holders.
Not applicable.
Item 11. Controls and Procedures.
(a) The registrant’s principal executive officer and principal financial officer have evaluated the registrant’s disclosure controls and procedures within 90 days of this filing and have concluded that the registrant’s disclosure controls and procedures were effective, as of that date, in ensuring that information required to be disclosed by the registrant in this Form N-CSR was recorded, processed, summarized, and reported timely.
(b) The registrant’s principal executive officer and principal financial officer are aware of no change in the registrant’s internal control over financial reporting that occurred during the registrant’s second fiscal quarter covered by this report that has materially affected, or is reasonably likely to materially affect, the registrant’s internal control over financial reporting.
Item 12. Exhibits.
(a)(1) The registrant’s code of ethics pursuant to Item 2 of Form N-CSR is filed with the registrant’s annual Form N-CSR.
(2) Separate certifications by the registrant's principal executive officer and principal financial officer, pursuant to Section 302 of the Sarbanes-Oxley Act of 2002 and required by Rule 30a-2(a) under the Investment Company Act of 1940, are attached.
(3) Written solicitation to repurchase securities issued by closed-end companies: not applicable.
(b) A certification by the registrant's principal executive officer and principal financial officer, pursuant to Section 906 of the Sarbanes-Oxley Act of 2002 and required by Rule 30a-2(b) under the Investment Company Act of 1940, is attached.
| | |
| SIGNATURES |
| |
| | Pursuant to the requirements of the Securities Exchange Act of 1934 and the Investment |
| Company Act of 1940, the registrant has duly caused this report to be signed on its behalf by the |
| undersigned, thereunto duly authorized. |
| |
| T. Rowe Price Equity Series, Inc. |
| |
| By | /s/ James S. Riepe |
| | James S. Riepe |
| | Principal Executive Officer |
| |
| Date | August 18, 2005 |
| |
| |
| | Pursuant to the requirements of the Securities Exchange Act of 1934 and the Investment |
| Company Act of 1940, this report has been signed below by the following persons on behalf of |
| the registrant and in the capacities and on the dates indicated. |
| |
| |
| By | /s/ James S. Riepe |
| | James S. Riepe |
| | Principal Executive Officer |
| |
| Date | August 18, 2005 |
| |
| |
| |
| By | /s/ Joseph A. Carrier |
| | Joseph A. Carrier |
| | Principal Financial Officer |
| |
| Date | August 18, 2005 |