Item 1: Report to Shareholders| Blue Chip Growth Portfolio | June 30, 2006 |
The views and opinions in this report were current as of June 30, 2006. They are not guarantees of performance or investment results and should not be taken as investment advice. Investment decisions reflect a variety of factors, and the managers reserve the right to change their views about individual stocks, sectors, and the markets at any time. As a result, the views expressed should not be relied upon as a forecast of the fund’s future investment intent. The report is certified under the Sarbanes-Oxley Act of 2002, which requires mutual funds and other public companies to affirm that, to the best of their knowledge, the information in their financial reports is fairly and accurately stated in all material respects.
Dear Investor
Solid first-quarter gains for U.S. stocks eroded during a second-quarter correction. Investors continue to be concerned primarily with increased energy prices and rising short-term interest rates. Over the past six months, large-cap growth stocks lagged the overall market as industries typically favored by value investors, including energy, materials, and utilities, outperformed traditional growth areas such as health care and technology. We believe that strong corporate earnings and the potential for moderating interest rates should support favorable investment performance, particularly for large-cap growth stocks.
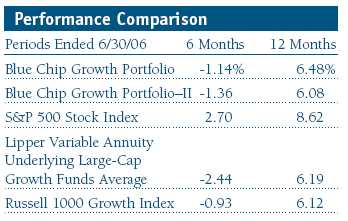
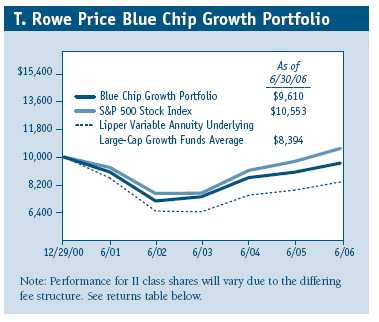
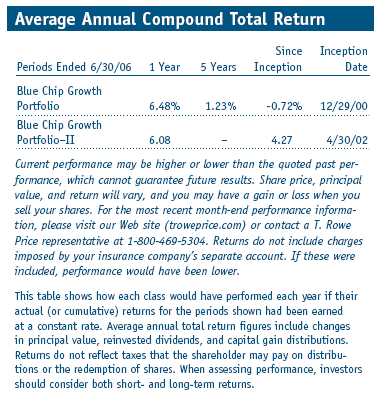
The portfolio’s 6- and 12-month returns outpaced our peer group, the Lipper Variable Annuity Underlying Large-Cap Growth Funds Average, and were mixed versus the Russell 1000 Growth Index. However, because large-cap value stocks outperformed large-cap growth shares in the first half, we trailed the S&P 500 for the six months and the year ended June 30, 2006. (Performance for II class shares were slightly lower, reflecting their differing fee structure.)
Market Environment
Strong performance by large-cap growth stocks in late 2005 proved unsustainable in the first half of 2006, but the market has faced some unique challenges that we think could dissipate over time. The market has been stymied by rising energy prices and 17 quarter-point interest rate increases. Geopolitical risks are also weighing on investors. North Korea’s recent missile launches add to concerns regarding the war in Iraq and global terrorism. Investors are wary as upcoming midterm elections and partisan politics raise questions about the government’s effectiveness in dealing with these challenges.
In our view, the sharp second-quarter correction in global stock prices was driven primarily by fears that rising core inflation could result in much higher interest rates, which would slow growth and hurt corporate earnings. Foreign and small-cap stocks corrected the most because they are generally more volatile and had been extremely strong performers. However, there is some evidence that suggests economic growth and core inflation could ease over time. For example, the correction in housing prices (which we think should be moderate and manageable) could intensify enough to affect consumer confidence and overall economic activity. We believe that the Federal Reserve took this into account when it announced that economic growth could be moderating. While we recognize that additional interest rate hikes are possible, we think short-term rates will not rise significantly above current levels.
We believe an economic growth slowdown is inevitable, but it could turn out to be the “soft landing” that the Fed is trying to engineer. Free cash flow margins and cash on corporate balance sheets stand at multi-decade highs. We also believe that progress in Iraq or an easing of other geopolitical concerns could result in declining energy prices. The midterm elections will probably yield some surprises, but the results should reduce uncertainty. Finally, valuation is often underestimated as a determinant of future stock performance, and we think valuations are reasonable, particularly for many large-cap, consistent-growth companies.
Portfolio Review
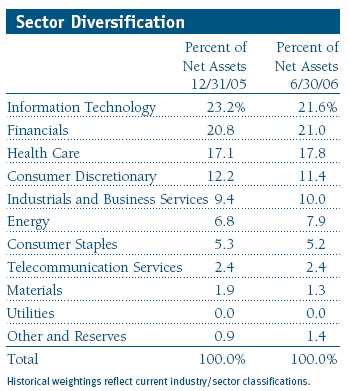
Energy stocks were the largest first-half performance contributors. Although we were underweight in the energy sector versus the S&P 500 (because of our growth orientation), we have been overweight in the oil services industry for several years. We believe that finding reserves will require increased spending, even if energy prices moderate. Schlumberger, Baker Hughes, and Smith International were strong first-half performers in the oil services industry. Exxon Mobil and Consol Energy, a leading coal and methane gas producer, were also solid contributors.
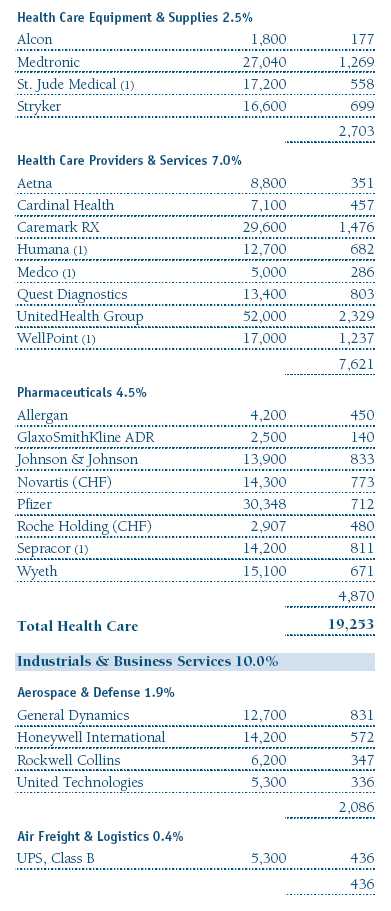
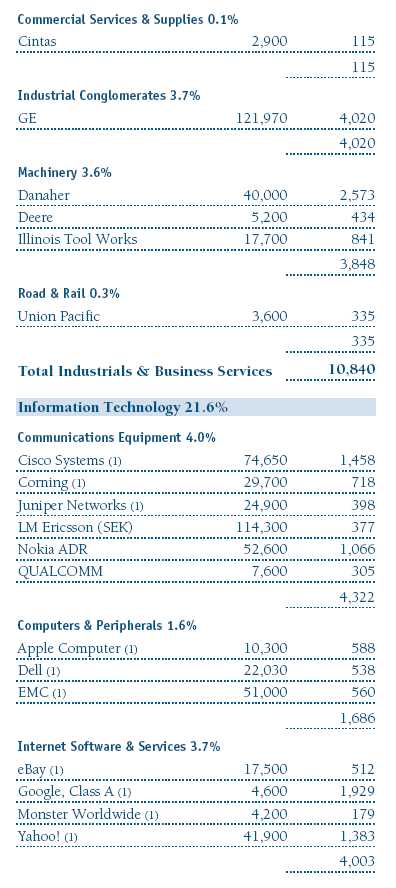
Many of our industrials and business services stocks generated good results after lagging more cyclical companies in 2005. For example, top 10 holding Danaher rose as investors began to appreciate the consistency of its growth. We think the company’s expanding presence in water treatment, dental supplies, and other less-cyclical areas position it for stable growth, even if the economy slows. Aerospace and defense leaders General Dynamics, Honeywell, and Rockwell Collins also gained ground on solid financial results.
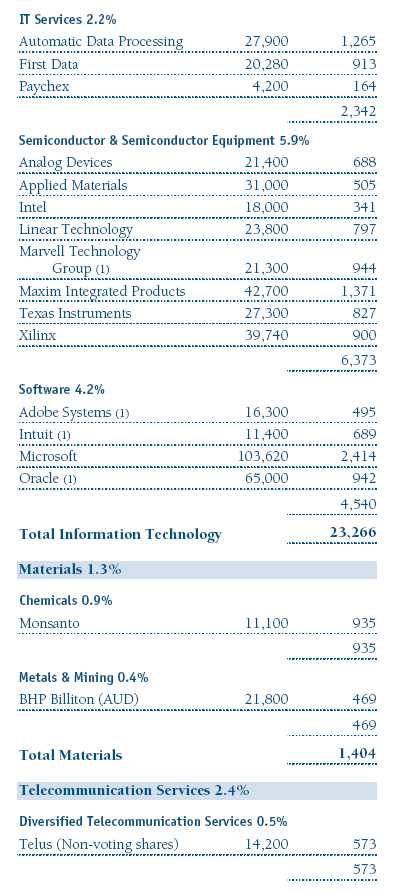
While there are few materials companies that meet our growth and quality criteria, Nucor and BHP Billiton are low-cost producers and global leaders that we have held for several years. We reluctantly eliminated Nucor, which generated significant long-term gains and hit our price target. BHP is a larger and more diversified company than Nucor and is a primary supplier to China. This holding has also performed well, and we reduced our position over the past six months. Monsanto generated good results, and it appears well positioned to continue posting strong growth based upon its leadership in genomic seeds and agricultural productivity.
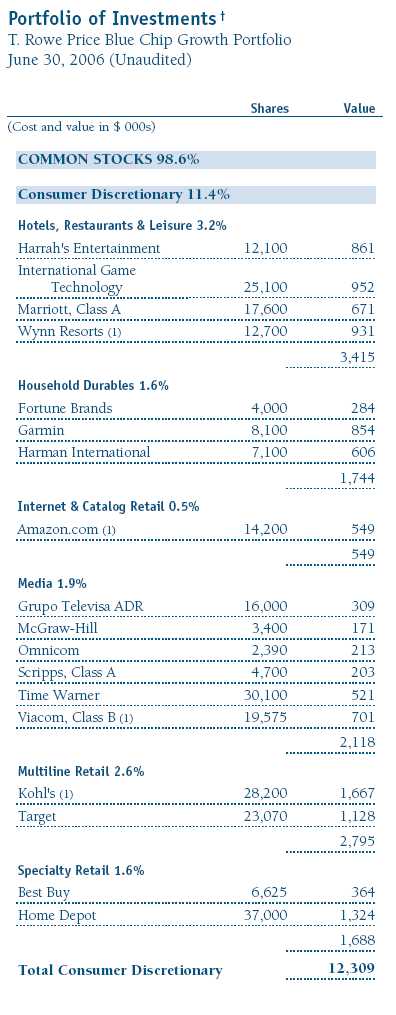
Consumer discretionary stocks from several industries also made solid contributions. Hotel and gaming leaders Wynn Resorts, which has a sizable presence in Las Vegas and Macau (off the southern coast of China), and Marriott produced strong gains. We’ve owned gaming equipment leader International Game Technology for several years, and it has begun to perform well. Our analyst on Garmin deserves special recognition; his thorough analysis and strong conviction caused us to hold a significant position. He recognized that this high-quality leader in navigation systems for autos and boats was poised to benefit from the growth in hand-held personal navigation devices. Kohl’s was initially disappointing but has generated strong performance over the past six months due to better same-store sales growth. Best Buy also produced solid financial results and good stock gains.
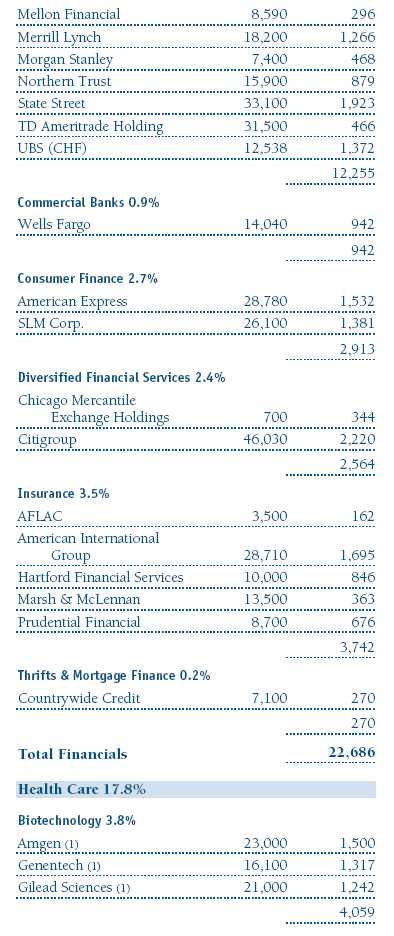
The financials sector included some of our best contributors but in aggregate yielded mixed results. Capital markets and brokerage stocks such as Goldman Sachs, UBS (Union Bank of Switzerland), State Street, Northern Trust, Charles Schwab, and E*Trade Financial produced strong gains. However, many of these stocks corrected significantly in the second quarter on inflation and interest rate fears. Unfortunately, TD AmeriTrade Holding and Legg Mason were major first-half detractors.
Our other substantial contributors came from a variety of industries. For example, communications equipment leaders Corning and Cisco Systems rallied sharply. Several dominant technology companies that we have held for several years, including Oracle, Nokia, and Intuit, also produced strong first-half results and bucked the generally poor performance plaguing many technology stocks. In similar fashion, Quest Diagnostics, a leading blood-testing laboratory, and biotech leaders Sepracor and Gilead Sciences produced good returns in an environment where many health care stocks struggled. Leading drugstore chain CVS benefited from its successful integration of several acquisitions.
We had several significant losers in the first half as well. Some were multiyear winners, including UnitedHealth Group, while others, such as Microsoft, have been ongoing disappointments. In managing the portfolio, we have learned that a careful analysis of such losers (and adding to holdings or cutting losses) is often an important determinant of subsequent performance. Following several years of excellent returns, UnitedHealth Group was far and away our largest first-half detractor. We reduced our position significantly as concerns arose relating to management’s potential backdating of stock option grants. We take the possibility that management may have acted inappropriately quite seriously and recognize that it could lead to disruptive management changes. However, the company’s fundamentals appear to be quite strong. We also recognize that more than 70 companies have options-related investigations underway. Consequently, we are inclined to hold our large (but substantially reduced) position pending the results of the investigation.
Microsoft was our second-largest detractor. Microsoft shocked the investment community when it announced a delay to the Vista operating system and said it would spend over a billion dollars above initial projections to become more competitive in its online efforts. While we have always respected management’s vision and competitive prowess, we are disappointed that it is not executing in its core business as crisply as we would like. This major spending initiative will blunt some of the earnings growth we had counted on from the Vista launch and several other new products. As a result, we sold a portion of our position. However, Microsoft is now fundamentally cheaper than it has been in many years and our analyst gives it his highest rating. We still think the company can prosper over time, and we are not willing to give up on Microsoft at current prices.
Amgen and American International Group (AIG) fit into the category of large-cap losers that have executed reasonably well. Each stock is quite cheap based on historical relative valuation measures. Amgen struggled in recent quarters due to the threat of new competitors’ products, such as Roche’s CERA. AIG continues to resolve many of the regulatory concerns that led to the replacement of longtime leader Maurice Greenberg. The new CEO, Martin Sullivan, appears to be an effective leader, but the company’s growth will probably not be as visible as it has been historically. We intend to maintain significant positions in both stocks based on our current analysis.
Medtronic and St. Jude Medical disappointed as sales of their implantable cardiac defibrillators (ICDs) slowed. Much of the deceleration is directly attributable to product-quality problems experienced by a competitor (Guidant), which caused delays in new implants and also utilized existing doctor and facility capacity to replace faulty product. St. Jude appears more vulnerable in the near term, but Medtronic recently reported solid financial results. Both companies continue to diversify and have been solid growers over time. Because of these factors—cheap valuations and our view that growth in the ICD area could improve over time—we intend to maintain our positions for the time being.
We would be remiss if we did not mention our trying investments in the semiconductor area. While we sold some Intel at much higher prices and missed some of the damage, our investment in specialty semiconductor companies such as Marvell Technology Group, Maxim Integrated Products, and Xilinx, hurt performance. Investors are fearful of a slowing in business, and most of these companies are being examined for possible violations in their granting of, or accounting for, stock options. Our analyst is quite positive on the stocks based upon their valuations and his view that their business prospects should remain strong. While we are not buying aggressively, given our already significant investment in the group, we think the risk/reward tradeoff is attractive and that these stocks could perform well as the stock option issue is resolved.
Strategy
We target companies with durable, sustainable earnings and cash flow growth, and the free cash flow we prize has become even more valuable now that tax laws treat dividends more favorably.
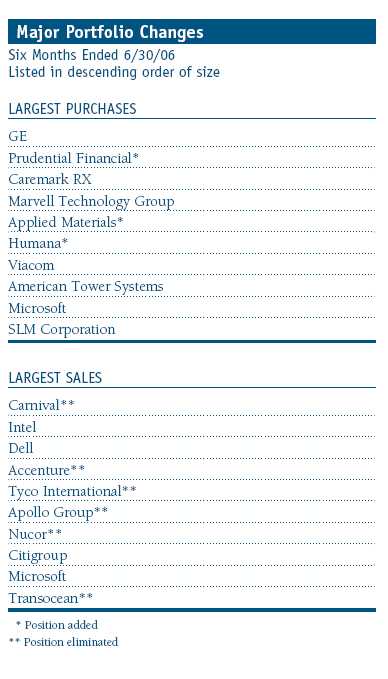
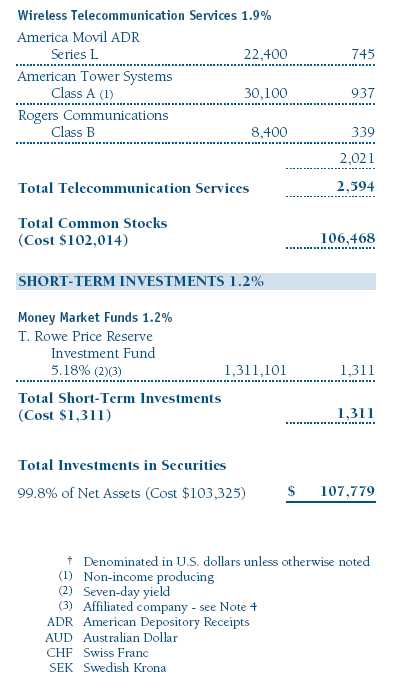
Additions to existing holdings such as Marvell Technology, GE, Caremark RX, and American Tower Systems were significant enough to be included in the 10 largest purchases for the past six months. Prudential Financial was the portfolio’s largest new purchase in the six-month period. Prudential Financial performed well through the recent market correction due to strong growth in its investment and retirement products and solid gains in international markets. Applied Materials and Humana are two other large new purchases in the first half of 2006. Applied Materials is the dominant provider of semiconductor capital equipment. We built our position because we agree with our analyst’s belief that the company is executing well and can generate solid growth for several years. Humana is well positioned to generate solid enrollment gains due to the new Medicare drug plan and other enhancements to the program. The company should have one of the highest earnings growth rates in health care services over the next several years. In a similar vein, we established a moderately sized position in LM Ericsson, the dominant provider of telecommunications equipment. Like many technology companies, Ericsson has fallen out of favor, but the company is well positioned to show strong growth over the next few years as telecom providers modernize and implement third-generation systems, especially in rapidly growing international markets.
Our largest sale was the elimination of Carnival. In addition to the burden of higher fuel prices, the company has missed earnings expectations in several quarters as bookings in the important Caribbean market have disappointed. Given its execution issues and new capacity additions, we decided to move on to higher-conviction investment ideas. We eliminated Accenture as it approached our price target and because it has had some issues with large consulting contracts. We sold Tyco International after the stock had recovered from a major crisis because we began to question how strongly the company would grow over time. We concluded that alternative industrial conglomerates such as GE and Danaher had much better growth prospects. We also took profits in Apollo Group, Nucor, and Transocean and redeployed the proceeds in more attractive growth opportunities.
We sold significant amounts of Dell, Intel, and Microsoft during the reporting period due to the fundamental issues we outlined in this and prior reports. However, we think these stocks are now approaching valuations that could support better performance because they have been taking remedial action to improve their products and market share. Our analyst has been concerned for some time regarding the ability of Qualcomm to defend its intellectual property. We reduced our position because of his concerns and because Nokia continues to pressure its royalty rates. We trimmed Citigroup earlier in the year when we had some concerns regarding the company’s earnings quality; however, first-quarter results were much improved, and it remains one of our 10 largest holdings.
Outlook
Stocks are struggling, and large-cap growth stocks continue to lag. There are plenty of issues to concern investors. Energy prices have begun to rise again, and the Federal Reserve may continue to increase rates. A sharp decline in housing prices, additional large increases in energy prices, or geopolitical events could hurt consumer confidence, economic growth, and stock prices. Since the market became concerned with Fed Chairman Ben Bernanke’s commentary on inflation risks in the second quarter, growth stocks and especially technology stocks have suffered. The scrutiny of stock option practices has also weighed heavily on tech and other growth stocks.
However, we continue to believe that the outlook is reasonably good for stocks—and the more people fret, the better the potential gains could be. This is particularly true for high-quality, consistent-growth companies that have lagged the market. We believe a solid case can be made for investing in U.S. stocks for the following reasons:
1. Earnings growth remains strong at most high-quality U.S. companies, many of which do not need a robust economic recovery to produce strong profit growth.
2. The stocks of many consistent-growth companies remain reasonably valued, and the recent market correction only increases their valuation appeal.
3. Many of the issues noted above, such as stock option regulatory concerns, are not likely to be long-term fundamental negatives. It is often helpful to ask if seemingly vexing issues will be material concerns in a year.
4. Companies have reduced expenses significantly. Consequently, a continued pickup in revenue growth could result in strong profit growth.
5. Many of our holdings generate significant free cash flow, and free cash flow margins are at multi-decade highs. Shareholder-oriented management can use this cash to pay dividends, which now receive more favorable tax treatment, repurchase shares, or make value-added acquisitions.
We will continue to strive to enhance returns while managing risk by investing in quality companies with durable, sustainable earnings and cash flow growth. We appreciate your continued confidence in this endeavor.
Respectfully submitted,

Larry J. Puglia
Executive vice president and chairman of the Investment Advisory Committee
July 14, 2006
The committee chairman has day-to-day responsibility for managing the portfolio and works with committee members in developing and executing the portfolio’s investment program.
The portfolio’s share price can fall because of weakness in the stock markets, a particular industry, or specific holdings. Stock markets can decline for many reasons, including adverse political or economic developments, changes in investor psychology, or heavy institutional selling. The prospects for an industry or company may deteriorate because of a variety of factors, including disappointing earnings or changes in the competitive environment. In addition, the investment manager’s assessment of companies held in a fund may prove incorrect, resulting in losses or poor performance even in rising markets.
Dividend yield: The annual dividend of a stock divided by the stock’s price.
Free cash flow: The excess cash a company is generating from its operations that can be taken out of the business for the benefit of shareholders, such as dividends, share repurchases, investments, and acquisitions.
Lipper averages: The averages of all portfolios in a particular category as tracked by Lipper Inc.
Price/book ratio: A valuation measure that compares a stock’s market price with its book value; i.e., the company’s net worth divided by the number of outstanding shares.
Price/earnings ratio (P/E): A valuation measure calculated by dividing the price of a stock by its current or projected earnings per share. This ratio gives investors an idea of how much they are paying for current or future earnings power.
Russell 1000 Growth Index: Market capitalization-weighted index of those firms in the Russell 1000 with higher price-to-book ratios and higher forecasted growth values.
S&P 500 Stock Index: An unmanaged index that tracks the stocks of 500 primarily large-cap U.S. companies.
This chart shows the value of a hypothetical $10,000 investment in the fund over the past 10 fiscal year periods or since inception (for funds lacking 10-year records). The result is compared with benchmarks, which may include a broad-based market index and a peer group average or index. Market indexes do not include expenses, which are deducted from fund returns as well as mutual fund averages and indexes.
Fund Expense Example
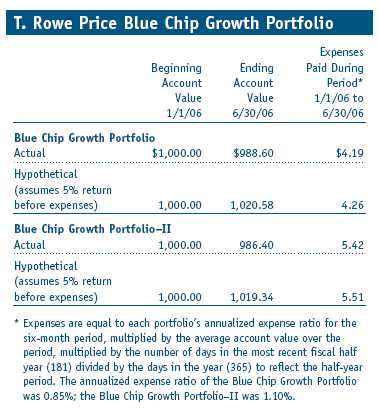
As a mutual fund shareholder, you may incur two types of costs: (1) transaction costs, such as redemption fees or sales loads, and (2) ongoing costs, including management fees, distribution and service (12b-1) fees, and other fund expenses. The following example is intended to help you understand your ongoing costs (in dollars) of investing in the fund and to compare these costs with the ongoing costs of investing in other mutual funds. The example is based on an investment of $1,000 invested at the beginning of the most recent six-month period and held for the entire period.
Shares of the fund are currently offered only through certain insurance companies as an investment medium for both variable annuity contracts and variable life insurance policies. Please note that the fund has two classes of shares: the original share class and II class. II class shares are sold through financial intermediaries, which are compensated for distribution, shareholder servicing, and/or certain administrative services under a Board-approved Rule 12b-1 plan.
Actual Expenses
The first line of the following table (“Actual”) provides information about actual account values and actual expenses. You may use the information in this line, together with your account balance, to estimate the expenses that you paid over the period. Simply divide your account value by $1,000 (for example, an $8,600 account value divided by $1,000 = 8.6), then multiply the result by the number in the first line under the heading “Expenses Paid During Period” to estimate the expenses you paid on your account during this period.
Hypothetical Example for Comparison Purposes
The information on the second line of the table (“Hypothetical”) is based on hypothetical account values and expenses derived from the fund’s actual expense ratio and an assumed 5% per year rate of return before expenses (not the fund’s actual return). You may compare the ongoing costs of investing in the fund with other funds by contrasting this 5% hypothetical example and the 5% hypothetical examples that appear in the shareholder reports of the other funds. The hypothetical account values and expenses may not be used to estimate the actual ending account balance or expenses you paid for the period.
You should also be aware that the expenses shown in the table highlight only your ongoing costs and do not reflect any transaction costs, such as redemption fees or sales loads. Therefore, the second line of the table is useful in comparing ongoing costs only and will not help you determine the relative total costs of owning different funds. To the extent a fund charges transaction costs, however, the total cost of owning that fund is higher.
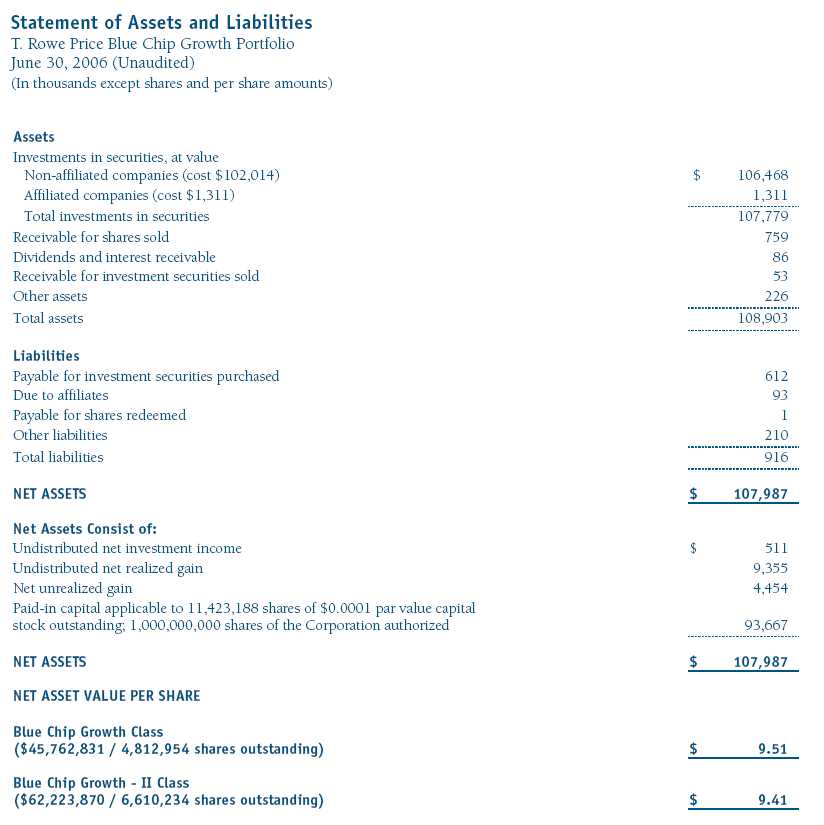
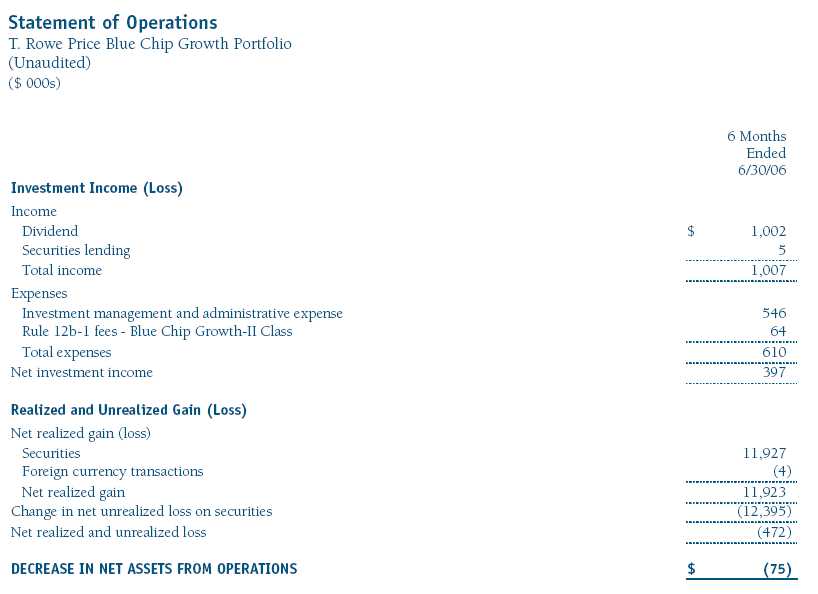
The accompanying notes are an integral part of these financial statements.
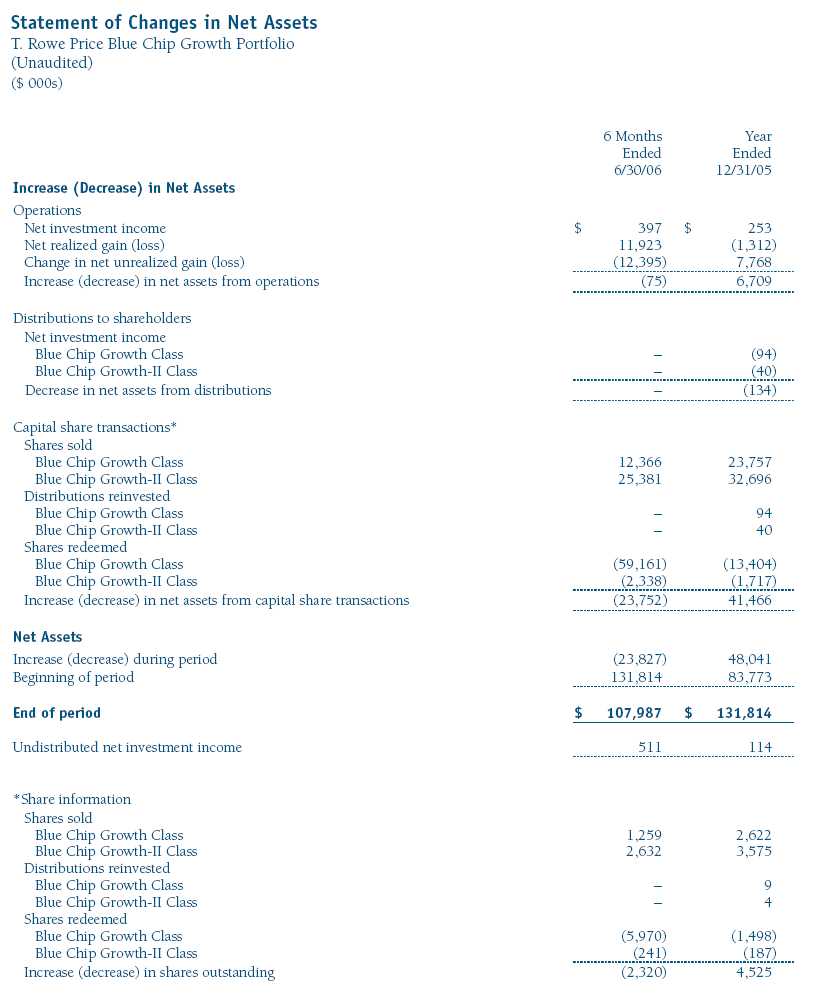
The accompanying notes are an integral part of these financial statements.

The accompanying notes are an integral part of these financial statements.
The accompanying notes are an integral part of these financial statements.
The accompanying notes are an integral part of these financial statements.
The accompanying notes are an integral part of these financial statements.
Notes to Financial Statements
T. Rowe Price Blue Chip Growth Portfolio June 30, 2006 (Unaudited)
NOTE 1 - SIGNIFICANT ACCOUNTING POLICIES
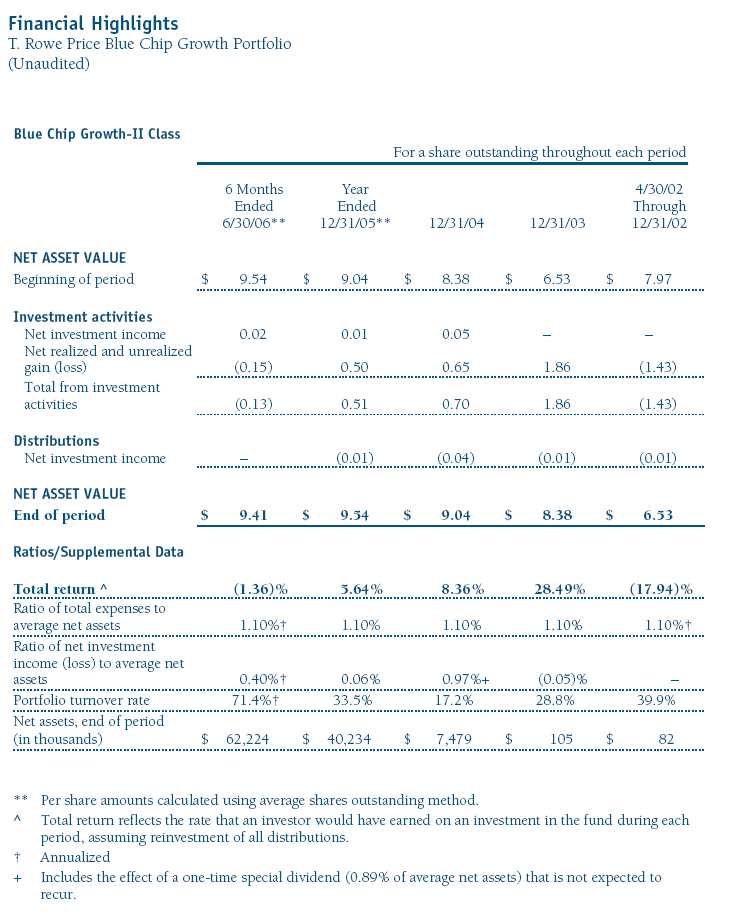
T. Rowe Price Equity Series, Inc. (the corporation), is registered under the Investment Company Act of 1940 (the 1940 Act). The Blue Chip Growth Portfolio (the fund) is a diversified, open-end management investment company and is one portfolio established by the corporation. The fund seeks to provide long-term capital growth. Income is a secondary objective. Shares of the fund are currently offered only through certain insurance companies as an investment medium for both variable annuity contracts and variable life insurance policies. The fund has two classes of shares: the Blue Chip Growth Portfolio original share class (Blue Chip Growth class), offered since December 29, 2000, and Blue Chip Growth Portfolio–II (Blue Chip Growth–II class), offered since April 30, 2002. Blue Chip Growth–II class shares are sold through financial intermediaries, which it compensates for distribution, shareholder servicing, and/or certain administrative services under a Board-approved Rule 12b-1 plan. Each class has exclusive voting rights on matters related solely to that class, separate voting rights on matters that relate to both classes, and, in all other respects, the same rights and obligations as the other class.
The accompanying financial statements were prepared in accordance with accounting principles generally accepted in the United States of America, which require the use of estimates made by fund management. Fund management believes that estimates and security valuations are appropriate; however, actual results may differ from those estimates, and the security valuations reflected in the financial statements may differ from the value the fund ultimately realizes upon sale of the securities.
Valuation The fund values its investments and computes its net asset value per share at the close of the New York Stock Exchange (NYSE), normally 4 p.m. ET, each day that the NYSE is open for business. Equity securities listed or regularly traded on a securities exchange or in the over-the-counter (OTC) market are valued at the last quoted sale price or, for certain markets, the official closing price at the time the valuations are made, except for OTC Bulletin Board securities, which are valued at the mean of the latest bid and asked prices. A security that is listed or traded on more than one exchange is valued at the quotation on the exchange determined to be the primary market for such security. Listed securities not traded on a particular day are valued at the mean of the latest bid and asked prices for domestic securities and the last quoted sale price for international securities.
Investments in mutual funds are valued at the mutual fund’s closing net asset value per share on the day of valuation.
Other investments, including restricted securities, and those for which the above valuation procedures are inappropriate or are deemed not to reflect fair value are stated at fair value as determined in good faith by the T. Rowe Price Valuation Committee, established by the fund’s Board of Directors.
Most foreign markets close before the close of trading on the NYSE. If the fund determines that developments between the close of a foreign market and the close of the NYSE will, in its judgment, materially affect the value of some or all of its portfolio securities, which in turn will affect the fund’s share price, the fund will adjust the previous closing prices to reflect the fair value of the securities as of the close of the NYSE, as determined in good faith by the T. Rowe Price Valuation Committee, established by the fund’s Board of Directors. A fund may also fair value securities in other situations, such as when a particular foreign market is closed but the fund is open. In deciding whether to make fair value adjustments, the fund reviews a variety of factors, including developments in foreign markets, the performance of U.S. securities markets, and the performance of instruments trading in U.S. markets that represent foreign securities and baskets of foreign securities. The fund uses outside pricing services to provide it with closing market prices and information used for adjusting those prices. The fund cannot predict when and how often it will use closing prices and when it will adjust those prices to reflect fair value. As a means of evaluating its fair value process, the fund routinely compares closing market prices, the next day’s opening prices in the same markets, and adjusted prices.
Currency Translation Assets, including investments, and liabilities denominated in foreign currencies are translated into U.S. dollar values each day at the prevailing exchange rate, using the mean of the bid and asked prices of such currencies against U.S. dollars as quoted by a major bank. Purchases and sales of securities, income, and expenses are translated into U.S. dollars at the prevailing exchange rate on the date of the transaction. The effect of changes in foreign currency exchange rates on realized and unrealized security gains and losses is reflected as a component of security gains and losses.
Class Accounting Blue Chip Growth–II pays distribution, shareholder servicing, and/or certain administrative expenses in the form of Rule 12b-1 fees, in an amount not exceeding 0.25% of the class’s average daily net assets. Management and administrative fee expenses, investment income, and realized and unrealized gains and losses are allocated to the classes based upon the relative daily net assets of each class.
In-Kind Redemptions In accordance with guidelines described in the fund’s prospectus, the fund may distribute portfolio securities rather than cash as payment for a redemption of fund shares (in-kind redemption). For financial reporting purposes, the fund recognizes a gain on in-kind redemptions to the extent the value of the distributed securities on the date of redemption exceeds the cost of those securities. Gains and losses realized on in-kind redemptions are not recognized for tax purposes and are reclassified from undistributed realized gain (loss) to paid-in capital. During the six months ended June 30, 2006, the fund realized $12,578,000 of net gain on $49,724,000 of in-kind redemptions.
Investment Transactions, Investment Income, and Distributions Income and expenses are recorded on the accrual basis. Dividends received from mutual fund investments are reflected as dividend income; capital gain distributions are reflected as realized gain/loss. Dividend income and capital gain distributions are recorded on the ex-dividend date. Investment transactions are accounted for on the trade date. Realized gains and losses are reported on the identified cost basis. Distributions to shareholders are recorded on the ex-dividend date. Income distributions are declared and paid by each class on an annual basis. Capital gain distributions, if any, are declared and paid by the fund, typically on an annual basis.
NOTE 2 - INVESTMENT TRANSACTIONS
Consistent with its investment objective, the fund engages in the following practices to manage exposure to certain risks or to enhance performance. The investment objective, policies, program, and risk factors of the fund are described more fully in the fund’s prospectus and Statement of Additional Information.
Securities Lending The fund lends its securities to approved brokers to earn additional income. It receives as collateral cash and U.S. government securities valued at 102% to 105% of the value of the securities on loan. Cash collateral is invested in a money market pooled trust managed by the fund’s lending agent in accordance with investment guidelines approved by fund management. Collateral is maintained over the life of the loan in an amount not less than the value of loaned securities, as determined at the close of fund business each day; any additional collateral required due to changes in security values is delivered to the fund the next business day. Although risk is mitigated by the collateral, the fund could experience a delay in recovering its securities and a possible loss of income or value if the borrower fails to return the securities. Securities lending revenue recognized by the fund consists of earnings on invested collateral and borrowing fees, net of any rebates to the borrower and compensation to the lending agent. At June 30, 2006, there were no securities on loan.
Other Purchases and sales of portfolio securities, other than short-term securities, aggregated $44,176,000 and $67,831,000, respectively, for the six months ended June 30, 2006.
NOTE 3 - FEDERAL INCOME TAXES
No provision for federal income taxes is required since the fund intends to continue to qualify as a regulated investment company under Subchapter M of the Internal Revenue Code and distribute to shareholders all of its taxable income and gains. Federal income tax regulations differ from generally accepted accounting principles; therefore, distributions determined in accordance with tax regulations may differ in amount or character from net investment income and realized gains for financial reporting purposes. Financial reporting records are adjusted for permanent book/tax differences to reflect tax character. Financial records are not adjusted for temporary differences. The amount and character of tax-basis distributions and composition of net assets are finalized at fiscal year-end; accordingly, tax-basis balances have not been determined as of June 30, 2006.
The fund intends to retain realized gains to the extent of available capital loss carryforwards. As of December 31, 2005, the fund had $2,532,000 of unused capital loss carryforwards, of which $434,000 expire in 2009, $491,000 expire in 2010, and $1,607,000 expire thereafter through 2013.
At June 30, 2006, the cost of investments for federal income tax purposes was $103,325,000. Net unrealized gain aggregated $4,454,000 at period-end, of which $9,102,000 related to appreciated investments and $4,648,000 related to depreciated investments.
NOTE 4 - RELATED PARTY TRANSACTIONS
The fund is managed by T. Rowe Price Associates, Inc. (the manager or Price Associates), a wholly owned subsidiary of T. Rowe Price Group, Inc. The investment management and administrative agreement between the fund and the manager provides for an all-inclusive annual fee equal to 0.85% of the fund’s average daily net assets. The fee is computed daily and paid monthly. The agreement provides that investment management, shareholder servicing, transfer agency, accounting, and custody services are provided to the fund, and interest, taxes, brokerage commissions, directors’ fees and expenses, and extraordinary expenses are paid directly by the fund.
The fund may invest in the T. Rowe Price Reserve Investment Fund and the T. Rowe Price Government Reserve Investment Fund (collectively, the T. Rowe Price Reserve Funds), open-end management investment companies managed by Price Associates and affiliates of the fund. The T. Rowe Price Reserve Funds are offered as cash management options to mutual funds, trusts, and other accounts managed by Price Associates and/or its affiliates, and are not available for direct purchase by members of the public. The T. Rowe Price Reserve Funds pay no investment management fees. During the six months ended June 30, 2006, dividend income from the T. Rowe Price Reserve Funds totaled $37,000, and the value of shares of the T. Rowe Price Reserve Funds held at June 30, 2006, and December 31, 2005, was $1,311,000 and $1,956,000, respectively.
| Information on Proxy Voting Policies, Procedures, and Records |
A description of the policies and procedures used by T. Rowe Price funds and portfolios to determine how to vote proxies relating to portfolio securities is available in each fund’s Statement of Additional Information, which you may request by calling 1-800-225-5132 or by accessing the SEC’s Web site, www.sec.gov. The description of our proxy voting policies and procedures is also available on our Web site, www.troweprice.com. To access it, click on the words “Company Info” at the top of our homepage for individual investors. Then, in the window that appears, click on the “Proxy Voting Policy” navigation button in the top left corner.
Each fund’s most recent annual proxy voting record is available on our Web site and through the SEC’s Web site. To access it through our Web site, follow the directions above, then click on the words “Proxy Voting Record” at the bottom of the Proxy Voting Policy page.
| How to Obtain Quarterly Portfolio Holdings |
The fund files a complete schedule of portfolio holdings with the Securities and Exchange Commission for the first and third quarters of each fiscal year on Form N-Q. The fund’s Form N-Q is available electronically on the SEC’s Web site (www.sec.gov); hard copies may be reviewed and copied at the SEC’s Public Reference Room, 450 Fifth St. N.W., Washington, DC 20549. For more information on the Public Reference Room, call 1-800-SEC-0330.
| Approval of Investment Management Agreement |
On March 8, 2006, the fund’s Board of Directors unanimously approved the investment advisory contract (Contract) between the fund and its investment manager, T. Rowe Price Associates, Inc. (Manager). The Board considered a variety of factors in connection with its review of the Contract, also taking into account information provided by the Manager during the course of the year, as discussed below:
Services Provided by the Manager
The Board considered the nature, quality, and extent of the services provided to the fund by the Manager. These services included, but were not limited to, management of the fund’s portfolio and a variety of activities related to portfolio management. The Board also reviewed the background and experience of the Manager’s senior management team and investment personnel involved in the management of the fund. The Board concluded that it was satisfied with the nature, quality, and extent of the services provided by the Manager.
Investment Performance of the Fund
The Board reviewed the fund’s average annual total return over the one-, three-, and five-year and since-inception periods as well as the fund’s year-by-year returns and compared these returns with previously agreed upon comparable performance measures and market data, including those supplied by Lipper and Morningstar, which are independent providers of mutual fund data. On the basis of this evaluation and the Board’s ongoing review of investment results, the Board concluded that the fund’s performance was satisfactory.
Costs, Benefits, Profits, and Economies of Scale
The Board reviewed detailed information regarding the revenues received by the Manager under the Contract and other benefits that the Manager (and its affiliates) may have realized from its relationship with the fund, including research received under “soft dollar” agreements. The Board noted that the use of soft dollars as a means of paying for third-party, non-broker research had been eliminated. The Board also received information on the estimated costs incurred and profits realized by the Manager and its affiliates from advising T. Rowe Price mutual funds, as well as estimates of the gross profits realized from managing the fund in particular. The Board concluded that the Manager’s profits were reasonable in light of the services provided to the fund. The Board also considered whether the fund or other funds benefit under the fee levels set forth in the Contract from any economies of scale realized by the Manager. The Board noted that, under the Contract, the fund pays the Manager a single fee based on the fund’s assets and the Manager, in turn, pays all expenses of the fund, with certain exceptions. The Board concluded that, based on the profitability data it reviewed and consistent with this single fee structure, the Contract provided for a reasonable sharing of benefits from any economies of scale with the fund.
Fees
The Board reviewed the fund’s single-fee structure and compared the rate with fees and expenses of other comparable funds based on information and data supplied by Lipper. The information provided to the Board indicated that the fund’s single fee rate was generally at or below the median management fee rate and expense ratio for comparable funds. The Board also reviewed the expense ratio of the fund’s Class II share class, which pays a 12b-1 fee in addition to the single fee, and compared this expense ratio with the fees and expenses of comparable funds. The information provided to the Board indicated that the expense ratio for the Class II share class was generally at or below the median expense ratio for comparable funds. The Board also reviewed the fee schedules for comparable privately managed accounts of the Manager and its affiliates. Management informed the Board that the Manager’s responsibilities for privately managed accounts are more limited than its responsibilities for the fund and other T. Rowe Price mutual funds that it or its affiliates advise. On the basis of the information provided, the Board concluded that the fees paid by the fund under the Contract were reasonable.
Approval of the Contract
As noted, the Board approved the continuation of the Contract. No single factor was considered in isolation or to be determinative to the decision. Rather, the Board concluded, in light of a weighting and balancing of all factors considered, that it was in the best interests of the fund to approve the continuation of the Contract, including the fees to be charged for services thereunder.

Item 2. Code of Ethics.
A code of ethics, as defined in Item 2 of Form N-CSR, applicable to its principal executive officer, principal financial officer, principal accounting officer or controller, or persons performing similar functions is filed as an exhibit to the registrant’s annual Form N-CSR. No substantive amendments were approved or waivers were granted to this code of ethics during the registrant’s most recent fiscal half-year.
Item 3. Audit Committee Financial Expert.
Disclosure required in registrant’s annual Form N-CSR.
Item 4. Principal Accountant Fees and Services.
Disclosure required in registrant’s annual Form N-CSR.
Item 5. Audit Committee of Listed Registrants.
Not applicable.
Item 6. Schedule of Investments.
Not applicable. The complete schedule of investments is included in Item 1 of this Form N-CSR.
Item 7. Disclosure of Proxy Voting Policies and Procedures for Closed-End Management Investment Companies.
Not applicable.
Item 8. Portfolio Managers of Closed-End Management Investment Companies.
Not applicable.
Item 9. Purchases of Equity Securities by Closed-End Management Investment Company and Affiliated Purchasers.
Not applicable.
Item 10. Submission of Matters to a Vote of Security Holders.
Not applicable.
Item 11. Controls and Procedures.
(a) The registrant’s principal executive officer and principal financial officer have evaluated the registrant’s disclosure controls and procedures within 90 days of this filing and have concluded that the registrant’s disclosure controls and procedures were effective, as of that date, in ensuring that information required to be disclosed by the registrant in this Form N-CSR was recorded, processed, summarized, and reported timely.
(b) The registrant’s principal executive officer and principal financial officer are aware of no change in the registrant’s internal control over financial reporting that occurred during the registrant’s second fiscal quarter covered by this report that has materially affected, or is reasonably likely to materially affect, the registrant’s internal control over financial reporting.
Item 12. Exhibits.(a)(1) The registrant’s code of ethics pursuant to Item 2 of Form N-CSR is filed with the registrant’s annual Form N-CSR.
(2) Separate certifications by the registrant's principal executive officer and principal financial officer, pursuant to Section 302 of the Sarbanes-Oxley Act of 2002 and required by Rule 30a-2(a) under the Investment Company Act of 1940, are attached.
(3) Written solicitation to repurchase securities issued by closed-end companies: not applicable.
(b) A certification by the registrant's principal executive officer and principal financial officer, pursuant to Section 906 of the Sarbanes-Oxley Act of 2002 and required by Rule 30a-2(b) under the Investment Company Act of 1940, is attached.
| | |
SIGNATURES |
| |
| | Pursuant to the requirements of the Securities Exchange Act of 1934 and the Investment |
| Company Act of 1940, the registrant has duly caused this report to be signed on its behalf by the |
| undersigned, thereunto duly authorized. |
| |
| T. Rowe Price Equity Series, Inc. |
| |
| |
| By | /s/ Edward C. Bernard |
| | Edward C. Bernard |
| | Principal Executive Officer |
| |
| Date | August 18, 2006 |
| |
| |
| | Pursuant to the requirements of the Securities Exchange Act of 1934 and the Investment |
| Company Act of 1940, this report has been signed below by the following persons on behalf of |
| the registrant and in the capacities and on the dates indicated. |
| |
| |
| By | /s/ Edward C. Bernard |
| | Edward C. Bernard |
| | Principal Executive Officer |
| |
| Date | August 18, 2006 |
| |
| |
| By | /s/ Joseph A. Carrier |
| | Joseph A. Carrier |
| | Principal Financial Officer |
| |
| Date | August 18, 2006 |