Item 1: Report to Shareholders| Mid-Cap Growth Portfolio | June 30, 2006 |
The views and opinions in this report were current as of June 30, 2006. They are not guarantees of performance or investment results and should not be taken as investment advice. Investment decisions reflect a variety of factors, and the managers reserve the right to change their views about individual stocks, sectors, and the markets at any time. As a result, the views expressed should not be relied upon as a forecast of the fund’s future investment intent. The report is certified under the Sarbanes-Oxley Act of 2002, which requires mutual funds and other public companies to affirm that, to the best of their knowledge, the information in their financial reports is fairly and accurately stated in all material respects.
Dear Investors
The market ended modestly higher in 2006’s first half. Stocks rallied fairly robustly in the first four months of the year but gave back most of their gains in May and June amid growing pessimism over rising interest rates and a slowing economy. The rally early in the year was heavily momentum driven, as investors poured money into stocks that were doing well and companies that were enjoying rapidly increasing earnings. Such an environment did not favor our emphasis on reasonably priced growth stocks, and our performance was somewhat disappointing as a result. Our heavy weighting in the technology sector also weighed on our returns.
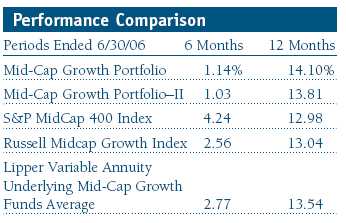
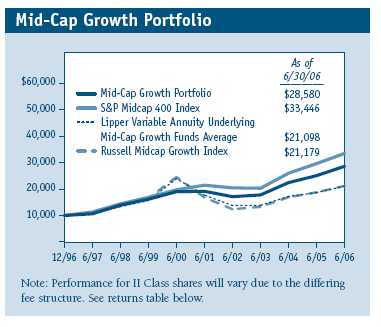
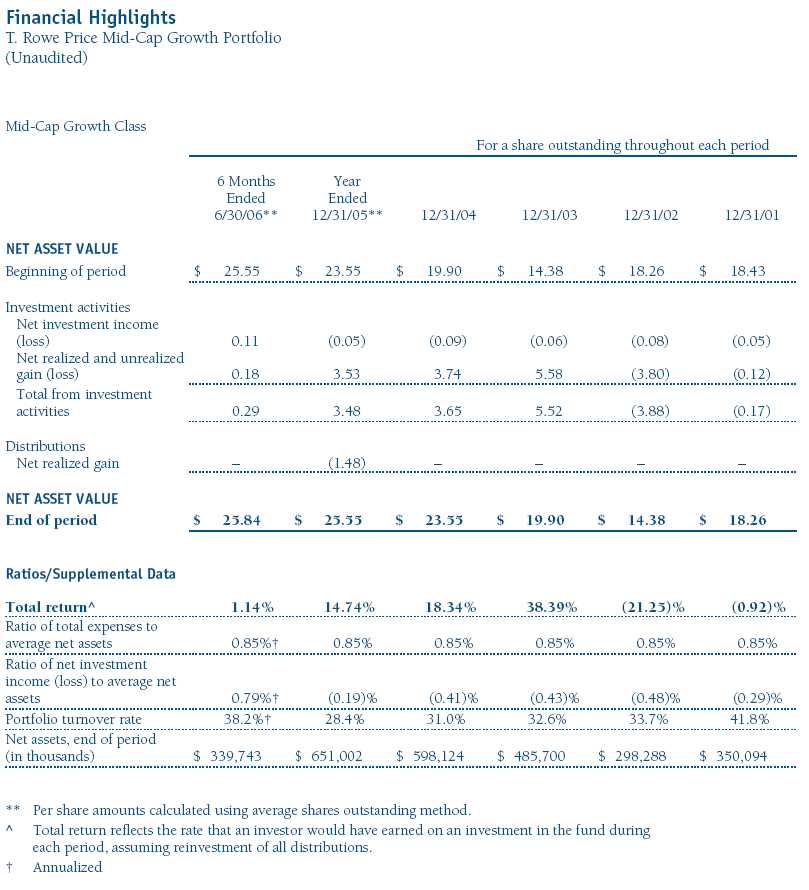
The Mid-Cap Growth Portfolio returned 1.14% and the Mid-Cap Growth Portfolio–II returned 1.03% during the past six months, lagging the S&P MidCap 400 Index, the aggressive-growth-oriented Russell Midcap Growth Index, and the peer group of funds tracked in the Lipper Variable Annuity Underlying Mid-Cap Growth Funds Average. For the 12-month period, however, the Mid-Cap Growth Portfolio’s return of 14.10% and the Mid-Cap Growth Portfolio–II’s return of 13.81% outperformed the benchmarks.
Our results relative to our competitors are strong over longer time periods. The Mid-Cap Growth Portfolio ranked near the top quartile of its peer group for the three-year period ended in June and within the top decile for the five-year period. (Based on cumulative total return, Lipper ranked the Mid-Cap Growth Portfolio 67 out of 138, 35 out of 127, 8 out of 87, and 2 out of 23 funds in the Variable Annuity Underlying Mid-Cap Growth Funds category for the one-, three-, and five-year and since-inception periods ended June 30, 2006, respectively.) The Mid-Cap Growth Portfolio–II ranked in the top 34% of the Lipper variable annuity underlying mid-cap growth funds category for the three-year period ended June 30, 2006. (Based on cumulative total return, Lipper ranked the Mid-Cap Growth Portfolio–II 71 out of 138, 43 out of 127, and 19 out of 107 in the category for the one- and three-year and since-inception periods ended June 30, 2006, respectively. Past performance cannot guarantee future results.)
MARKET ENVIRONMENT
While still moving forward, economic growth appears to have ebbed somewhat over the past six months. The Fed has continued to raise interest rates, lifting them in four quarter-point increments between January and June. The fed funds rate is now 5.25%, up from 1% just two years ago. Nevertheless, core inflation—which excludes food and energy prices—has trended higher in recent months. This implies the Fed may have waited too long during this economic expansion to raise rates, and as a result, we are experiencing slightly higher inflation. The Fed’s easy money policies also encouraged speculative activity in markets across the globe. Recently, the monetary tightening by the Fed and other central banks has begun to reverse this process, causing a flight from riskier assets such as small-cap and emerging markets stocks.
Influencing the inflation data (and seemingly everything else) has been oil prices, which, after some signs of moderating, rebounded to near-record levels of approximately $75 per barrel at the end of June. This has taken a particularly large toll on low-income consumers who have begun to adjust their spending habits in order to cope with $3 gasoline. For the most part, workers have been unable to turn to fatter paychecks for help: while the job market has improved, and unemployment has fallen to a very low 4.6%, wage gains have been subdued. What has been bad for workers has been good for inflation, however, as labor costs are a key input in overall price pressures.
Higher-income consumers have been better able to fill their tanks and keep spending, but they have faced a new set of worries triggered by the weakening housing market. Rising mortgage interest rates have eliminated most refinancing opportunities and made the purchase of new homes more expensive. Home prices have stopped rising, and they have even begun to decline in some regions. Price declines will especially hurt speculators who invested in overpriced properties, but the larger impact of a moribund housing market may be that Americans are less able to use mortgage equity withdrawals and refinancings to bankroll other forms of consumption. A key driver of consumer spending over the last several years has been removed.
Strong international economic growth has been generally favorable for the U.S. economy and good for profits of domestic companies. While we have witnessed considerable geopolitical unrest recently, this has always been a sporadic feature of the investment landscape. A larger concern might be the increasing pressure on prices, particularly for commodities, emanating from rapid growth in developing nations such as China and India. Some worry that China and India might even feed a period of U.S. stagflation, or slowing growth paired with inflation, but this ignores the fact that a recession here would likely result in slower growth for our trading partners.
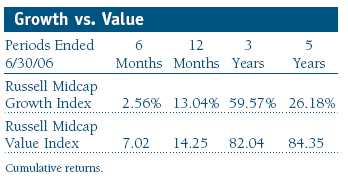
Because of high commodity prices and strong capital investment, a robust world economy has showered most of its benefits on the energy, materials, and industrials sectors. Their recent dominance has somewhat echoed the late-1990s supremacy of technology, media, and telecommunications shares, leading some to remark that the reign of “TMT” (tech, media, and telecom) has been supplanted by the ascendance of “EMI” (energy, materials, and industrials). EMI shares historically have been heavily represented in the value indexes, while TMT traditionally has been the province of growth investors. Not surprisingly from this perspective, at least, value stocks have continued to outperform growth shares over the past six months. Small-cap shares also defied many predictions by continuing to outperform large-cap shares in the period.
PORTFOLIO REVIEW
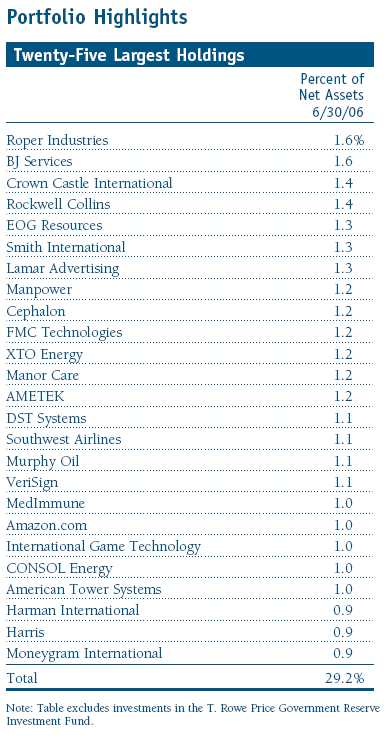
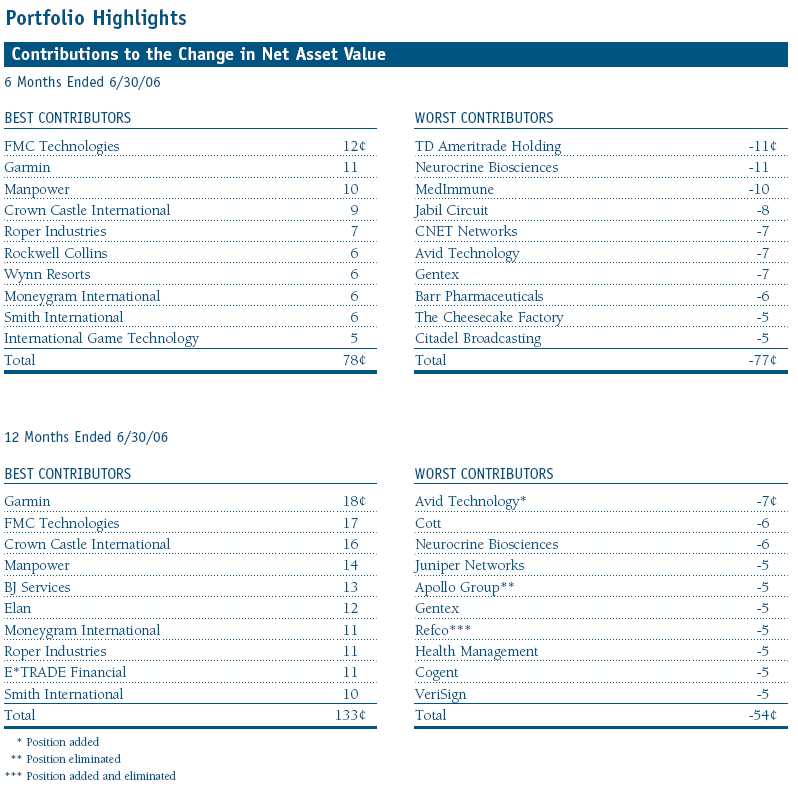
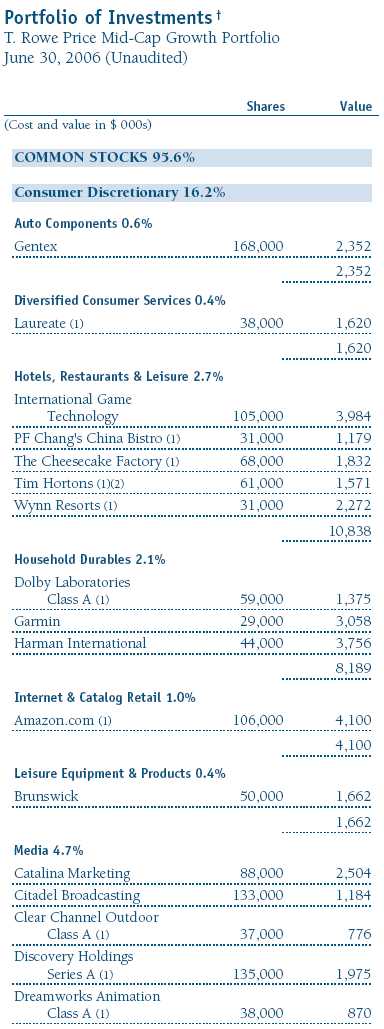
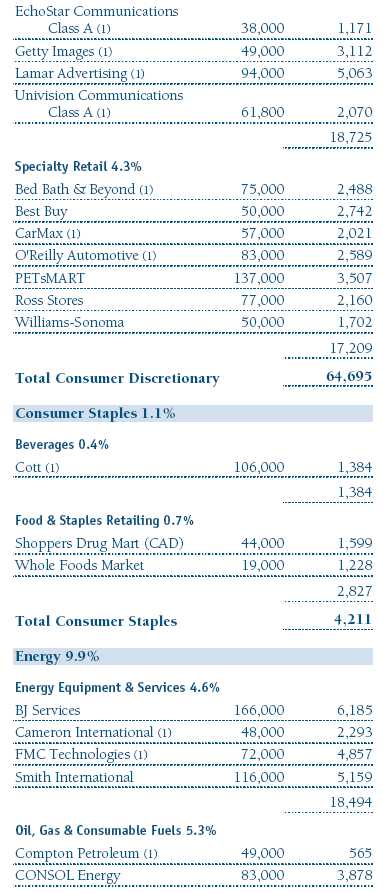
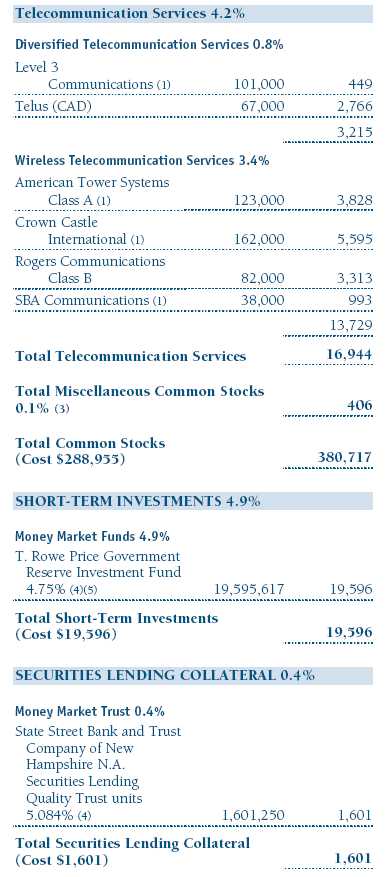
Consistent with the reign of EMI, our energy and industrials holdings contributed significantly to our performance over the past six months (the portfolio has only small holdings in the materials sector). Our top contributor for the period was FMC Technologies, an energy equipment and services firm that had lagged some of its competitors because of an unfavorable contract to provide Algeria with subsea trees, devices used to control flows from undersea wells. Now that the contract is behind the company, investors are turning their attention to the true potential of FMC’s lucrative business. Smith International, another equipment and services firm, also rebounded and contributed nicely to results. We have recently added a couple of new energy holdings, most notably coal producer Consol Energy. We believe that coal companies are attractive relative to oil companies, and this company has prodigious reserves in Northern Appalachia. Consol Energy’s production, while of high BTU content, has traditionally been viewed as less desirable because of its high sulfur content. However, many coal plants are installing scrubber technology which should obviate this key disadvantage. The company also controls significant reserves of natural gas. (Please see the portfolio of investments for a complete listing of the portfolio’s holdings and the amount each represents in the portfolio.)
Within the industrials and business services sector, we had several strong performers. Employment services firm Manpower has benefited from the global outsourcing trend, and we believe it can continue to increase its margins over time. Aviation electronics manufacturer Rockwell Collins benefited from strong demand for its diverse product line and from the military’s increased dependence on technology. Diversified industrial growth company Roper Industries gained after the company reported record sales, profitability, and cash flow across all business segments. A disappointment in the sector was JetBlue, which was hurt by rising fuel costs, increased competition, and complications associated with adding a new type of aircraft to its fleet. We eliminated our position.
Top contributors came from a variety of other sectors as well. We have been cautious on consumer-oriented stocks, but they are starting to look more interesting as the sector has been punished by worried investors. Garmin, a leader in portable navigation products that we have owned since its initial public offering in 2000, continued to surprise investors with strong results fueled by a stream of new products. Much less attention has been devoted to the company’s avionics business which we think is even better positioned than its consumer products area. Wynn Resorts is off to a good start at its Las Vegas casino, and investors are optimistic about its pending opening of its new resort in Macau. Of course, we were unable to escape the downdraft in consumer stocks entirely, and restaurant companies such as The Cheesecake Factory were some of our worst performers as cash-strapped families shunned restaurants and investors sold the stocks.

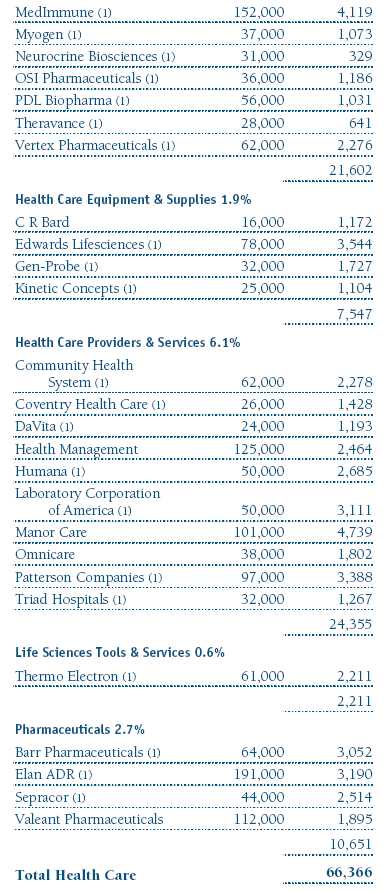
Our health care holdings represent 16.7% of the portfolio, and these added only marginally to results due to weakness in biotechnology shares. Neurocrine Biosciences detracted significantly when its new sleep medication drug, Indoplin, was not approved by the FDA at higher doses. As anyone who has watched television commercials lately knows, sleep medication is a crowded playing field, and investors quickly determined that the drug had little future. MedImmune fell as its leading drug, Synagis, which is used to prevent respiratory syncytial virus in infants, exhibited slowing growth in the half. However, Synagis is still a block-buster medication for this common condition, and MedImmune remains one of our larger holdings.
We have been leery of financials because we believe that credit conditions can get no better. We have also been wary of rising interest rates; at this juncture, we are ambivalent about where rates might head from here. We lightened up on our capital markets exposure in the first half, having added to it significantly in the market downturn in 2002 and early 2003. However, the portfolio’s worst detractor over the period was online brokerage firm TD Ameritrade Holding which deferred some of the benefits from a recent acquisition.
We noted that TMT stocks have been out of favor recently, but it is only partially true that our disappointments were clustered in this segment of the market. Overall, our media holdings performed reasonably well, and our telecommunications holdings actually added significantly to our results. This was largely due to the strong performance of Crown Castle International, an operator of communications towers. Crown’s business is highly scalable and additional contracts with wireless carriers have high incremental margins. The company continues to deploy its free cash flow to aggressively reduce its share count. We added a similar firm, SBA Communications, during the period.
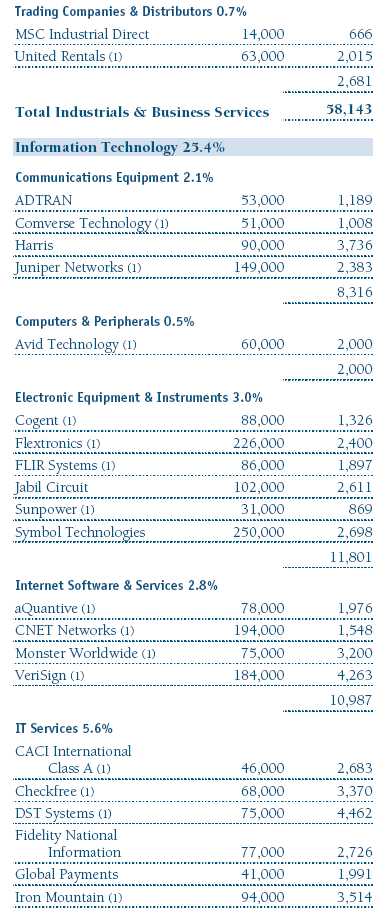
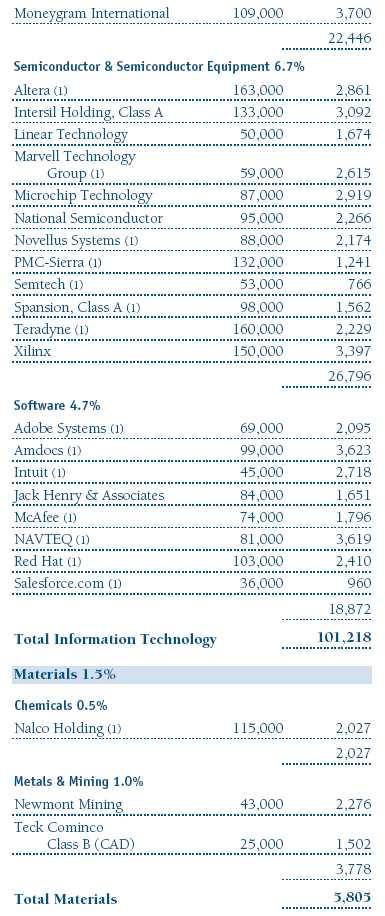
It is true, however, that the other “T,” technology, was a substantial drag on our results in the period. Jabil Circuit announced an earnings disappointment due to several execution issues. However, we still think the company is the best provider in the field of electronic manufacturing services. CNET Networks suffered along with the Internet sector. Digital media firm Avid Technology was hurt by continuing reverberations from an acquisition a year ago. We underestimated these issues when we first purchased the stock, but we have added to our position as we think Avid should benefit from the ongoing conversion of analog media to digital. We have also recently purchased aQuantive, an online advertising agency that also uses technology to place appropriate ads on Web sites based on the visitor’s IP address.
One reason that technology shares have struggled lately is the recent controversy over options grants to top executives—a key form of compensation in the tech sector. Inappropriate manipulation of these grants in the form of backdating options has emerged as an issue endemic to technology companies as well as a few others. The consequences are likely to be restated financial statements, management changes, civil and criminal penalties, and a prolonged period of uncertainty. All of this is profoundly disappointing; we are essentially dealing with reverberations of the technology bubble more than six years after the stocks peaked. We have traditionally had more modest weightings in the technology sector, but in recent quarters had felt that the companies’ prospects and valuations were reasonable. In retrospect, we were at best early in thinking the coast was clear; in the short term, our view has been dead wrong.
INVESTMENT STRATEGY AND OUTLOOK
Looking forward, we see two competing trends driving market dynamics: one should work for us, and the other may work against us. In our favor may be a shift in market leadership toward growth stocks. The cycle of value dominance, which began in March 2000, has become inordinately long in duration. While there had been some signs that the cycle was beginning to turn late last year, value reasserted its leadership during the market’s sell-off in May and June. After years of superior performance, value stocks are relatively expensive and growth stocks are comparatively cheap. Indeed, it is difficult to distinguish between growth and value at the top of the economic cycle because investors tend to confuse cyclical growth with persistent growth. The thrashing being applied to growth stocks in recent months strikes us as a sign that growth stock capitulation is upon us. Brighter days will follow in time.
On the other hand, working against us may be a similar shift in leadership away from smaller stocks toward large-caps, which have also lagged over the past seven years. Investors’ recent risk aversion may represent an inflection point in this cycle and usher in a period of large-cap relative outperformance. Mid-caps tend to follow small-caps, though usually with more modest amplitude. We do believe that the modest valuation premium accorded mid-cap stocks relative to their larger peers may be warranted by mid-caps’ generally better balance sheets, simpler business models, and faster growth. On balance, therefore, we are optimistic that a shift away from mid-caps may be outweighed by a more significant shift into growth stocks. This would provide a reasonable backdrop for the mid-cap growth universe in the next few years, though not as favorable as the last few years.
We would also highlight another recent trend that has not received sufficient attention. Merger and acquisition activity has been rising lately, often in the form of leveraged buyouts of public companies. These buyouts can be very lucrative for the investment bankers, private equity firms, and company managements involved in the transactions. With interest rates low and healthy operating environments as a backdrop, these buyout groups are often able to pay back the money they have borrowed to finance the transaction within only a few years.
In too many cases, however, the price the buyout groups offer existing shareholders does not reflect the true value of the company—at least for long-term investors like us, who are willing to wait and benefit as these companies grow. Indeed, International Strategy & Investment (ISI) recently noted that takeover premiums, or the amount by which offer prices exceed the current stock value, are the lowest they have been in ten years. In the first half of the year, the portfolio had two holdings—Fairmont Hotels and Education Management—taken private at prices we felt did not reflect the long-term value of the businesses. We opposed both transactions but were in a distinct minority of shareholders in so doing.
That noted, there remain plenty of attractive investment candidates for mid-cap growth investors, and we continue to scout for exciting new areas for investment. For instance, we have added two small alternative energy investments, a sector that strikes us as being at a similar point in its evolution as biotechnology was in the early 1980s. Many companies are developing new techniques to meet our energy needs in more environmentally acceptable ways and with lower probabilities of politically induced supply disruptions. We are not sure we have yet identified alternative energy’s Amgen or Genentech, but we are confident they are out there.
Overall, we remain optimistic about the portfolio’s prospects, even as we are somewhat guarded about the economic environment. We will continue to utilize the same techniques for finding reasonably priced growth stocks that have served well in the past, and we look forward to reporting to you on our progress in six months.
We appreciate your continued confidence in T. Rowe Price.
Respectfully submitted,

Brian W.H. Berghuis
Chairman of the portfolio’s Investment Advisory Committee

John F. Wakeman
Vice president
July 21, 2006
The committee chairman has day-to-day responsibility for managing the portfolio and works with committee members in developing and executing the portfolio’s investment program.
As with all stock and bond mutual funds, the fund’s share price can fall because of weakness in the stock or bond markets, a particular industry, or specific holdings. The financial markets can decline for many reasons, including adverse political or economic developments, changes in investor psychology, or heavy institutional selling. The prospects for an industry or company may deteriorate because of a variety of factors, including disappointing earnings or changes in the competitive environment. In addition, the investment manager’s assessment of companies held in a fund may prove incorrect, resulting in losses or poor performance even in rising markets. The stocks of mid-cap companies entail greater risk and are usually more volatile than the shares of larger companies. In addition, growth stocks can be volatile for several reasons. Since they usually reinvest a high proportion of earnings in their own businesses, they may lack the dividends usually associated with value stocks that can cushion their decline in a falling market. Also, since investors buy these stocks because of their expected superior earnings growth, earnings disappointments often result in sharp price declines.
Lipper averages: The averages of available mutual fund performance returns for specified time periods in defined categories as tracked by Lipper Inc.
S&P 500 Stock Index: An unmanaged index that tracks the stocks of 500 primarily large-cap U.S. companies.
S&P MidCap 400 Index: An unmanaged index that tracks the stocks of 400 mid-cap U.S. companies.
Russell Midcap Growth Index: An unmanaged index that measures the performance of those Russell Midcap companies with higher price-to-book ratios and higher forecasted growth values.
Russell Midcap Value Index: An unmanaged index that measures the performance of those Russell Midcap companies with lower price-to-book ratios and lower forecasted growth values.
This chart shows the value of a hypothetical $10,000 investment in the fund over the past 10 fiscal year periods or since inception (for funds lacking 10-year records). The result is compared with benchmarks, which may include a broad-based market index and a peer group average or index. Market indexes do not include expenses, which are deducted from fund returns as well as mutual fund averages and indexes.

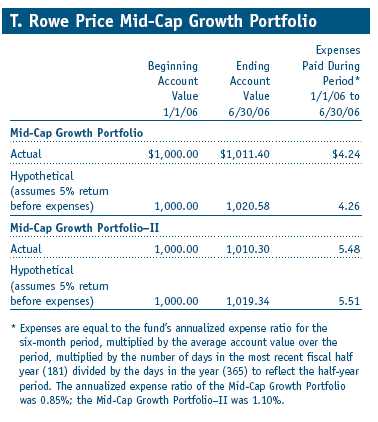
Fund Expense Example
As a mutual fund shareholder, you may incur two types of costs: (1) transaction costs, such as redemption fees or sales loads, and (2) ongoing costs, including management fees, distribution and service (12b-1) fees, and other fund expenses. The following example is intended to help you understand your ongoing costs (in dollars) of investing in the fund and to compare these costs with the ongoing costs of investing in other mutual funds. The example is based on an investment of $1,000 invested at the beginning of the most recent six-month period and held for the entire period.
Shares of the fund are currently offered only through certain insurance companies as an investment medium for both variable annuity contracts and variable life insurance policies. Please note that the fund has two classes of shares: the original share class and II Class. II Class shares are sold through financial intermediaries, which are compensated for distribution, shareholder servicing, and/or certain administrative services under a Board-approved Rule 12b-1 plan.
Actual Expenses
The first line of the following table (“Actual”) provides information about actual account values and actual expenses. You may use the information in this line, together with your account balance, to estimate the expenses that you paid over the period. Simply divide your account value by $1,000 (for example, an $8,600 account value divided by $1,000 = 8.6), then multiply the result by the number in the first line under the heading “Expenses Paid During Period” to estimate the expenses you paid on your account during this period.
Hypothetical Example for Comparison Purposes
The information on the second line of the table (“Hypothetical”) is based on hypothetical account values and expenses derived from the fund’s actual expense ratio and an assumed 5% per year rate of return before expenses (not the fund’s actual return). You may compare the ongoing costs of investing in the fund with other funds by contrasting this 5% hypothetical example and the 5% hypothetical examples that appear in the shareholder reports of the other funds. The hypothetical account values and expenses may not be used to estimate the actual ending account balance or expenses you paid for the period.
You should also be aware that the expenses shown in the table highlight only your ongoing costs and do not reflect any transaction costs, such as redemption fees or sales loads. Therefore, the second line of the table is useful in comparing ongoing costs only, and will not help you determine the relative total costs of owning different funds. To the extent a fund charges transaction costs, however, the total cost of owning that fund is higher.
The accompanying notes are an integral part of these financial statements.

The accompanying notes are an integral part of these financial statements.


The accompanying notes are an integral part of these financial statements.
The accompanying notes are an integral part of these financial statements.

The accompanying notes are an integral part of these financial statements.
The accompanying notes are an integral part of these financial statements.
Notes to Financial Statements
T. Rowe Price Mid-Cap Growth Portfolio
June 30, 2006 (Unaudited)
NOTE 1 - SIGNIFICANT ACCOUNTING POLICIES
T. Rowe Price Equity Series, Inc. (the corporation), is registered under the Investment Company Act of 1940 (the 1940 Act). The Mid-Cap Growth Portfolio (the fund) is a diversified, open-end management investment company and is one portfolio established by the corporation. The fund seeks to provide long-term capital appreciation by investing in mid-cap stocks with potential for above-average earnings growth. Shares of the fund are currently offered only through certain insurance companies as an investment medium for both variable annuity contracts and variable life insurance policies. The fund has two classes of shares: the Mid-Cap Growth Portfolio original share class (Mid-Cap Growth class), offered since December 31, 1996, and Mid-Cap Growth Portfolio–II (Mid-Cap Growth–II class), offered since April 30, 2002. Mid-Cap Growth–II class shares are sold through financial intermediaries, which it compensates for distribution, shareholder servicing, and/or certain administrative services under a Board-approved Rule 12b-1 plan. Each class has exclusive voting rights on matters related solely to that class, separate voting rights on matters that relate to both classes, and, in all other respects, the same rights and obligations as the other class.
The accompanying financial statements were prepared in accordance with accounting principles generally accepted in the United States of America, which require the use of estimates made by fund management. Fund management believes that estimates and security valuations are appropriate; however, actual results may differ from those estimates, and the security valuations reflected in the financial statements may differ from the value the fund ultimately realizes upon sale of the securities.
Valuation The fund values its investments and computes its net asset value per share at the close of the New York Stock Exchange (NYSE), normally 4 p.m. ET, each day that the NYSE is open for business. Equity securities listed or regularly traded on a securities exchange or in the over-the-counter (OTC) market are valued at the last quoted sale price or, for certain markets, the official closing price at the time the valuations are made, except for OTC Bulletin Board securities, which are valued at the mean of the latest bid and asked prices. A security that is listed or traded on more than one exchange is valued at the quotation on the exchange determined to be the primary market for such security. Listed securities not traded on a particular day are valued at the mean of the latest bid and asked prices for domestic securities and the last quoted sale price for international securities.
Investments in mutual funds are valued at the mutual fund’s closing net asset value per share on the day of valuation.
Other investments, including restricted securities, and those for which the above valuation procedures are inappropriate or are deemed not to reflect fair value are stated at fair value as determined in good faith by the T. Rowe Price Valuation Committee, established by the fund’s Board of Directors.
Most foreign markets close before the close of trading on the NYSE. If the fund determines that developments between the close of a foreign market and the close of the NYSE will, in its judgment, materially affect the value of some or all of its portfolio securities, which in turn will affect the fund’s share price, the fund will adjust the previous closing prices to reflect the fair value of the securities as of the close of the NYSE, as determined in good faith by the T. Rowe Price Valuation Committee, established by the fund’s Board of Directors. A fund may also fair value securities in other situations, such as when a particular foreign market is closed but the fund is open. In deciding whether to make fair value adjustments, the fund reviews a variety of factors, including developments in foreign markets, the performance of U.S. securities markets, and the performance of instruments trading in U.S. markets that represent foreign securities and baskets of foreign securities. The fund uses outside pricing services to provide it with closing market prices and information used for adjusting those prices. The fund cannot predict when and how often it will use closing prices and when it will adjust those prices to reflect fair value. As a means of evaluating its fair value process, the fund routinely compares closing market prices, the next day’s opening prices in the same markets, and adjusted prices.
Currency Translation Assets, including investments, and liabilities denominated in foreign currencies are translated into U.S. dollar values each day at the prevailing exchange rate, using the mean of the bid and asked prices of such currencies against U.S. dollars as quoted by a major bank. Purchases and sales of securities, income, and expenses are translated into U.S. dollars at the prevailing exchange rate on the date of the transaction. The effect of changes in foreign currency exchange rates on realized and unrealized security gains and losses is reflected as a component of security gains and losses.
Class Accounting Mid-Cap Growth–II pays distribution, shareholder servicing, and/or certain administrative expenses in the form of Rule 12b-1 fees, in an amount not exceeding 0.25% of the class’s average daily net assets. Management and administrative fee expenses, investment income, and realized and unrealized gains and losses are allocated to the classes based upon the relative daily net assets of each class.
Rebates Subject to best execution, the fund may direct certain security trades to brokers who have agreed to rebate a portion of the related brokerage commission to the fund in cash. Commission rebates are reflected as realized gain on securities in the accompanying financial statements and totaled $1,000 for the six months ended June 30, 2006.
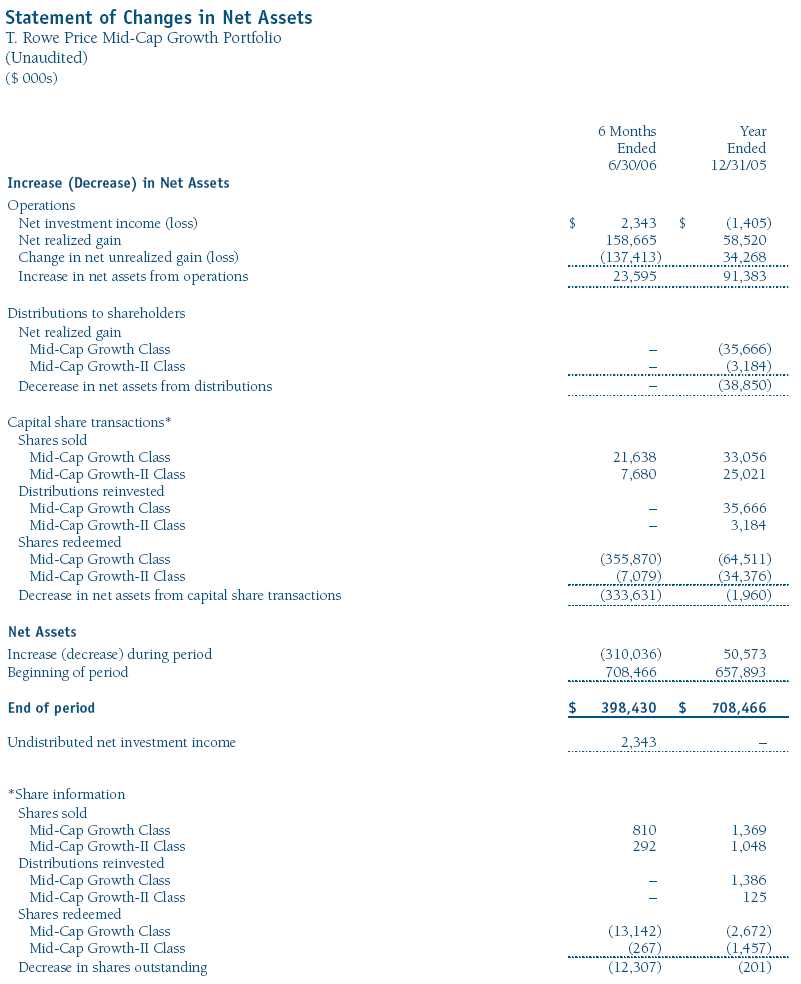
In-Kind Redemptions In accordance with guidelines described in the fund’s prospectus, the fund may distribute portfolio securities rather than cash as payment for a redemption of fund shares (in-kind redemption). For financial reporting purposes, the fund recognizes a gain on in-kind redemptions to the extent the value of the distributed securities on the date of redemption exceeds the cost of those securities. Gains and losses realized on in-kind redemptions are not recognized for tax purposes and are reclassified from undistributed realized gain (loss) to paid-in capital. During the six months ended June 30, 2006, the fund realized $121,201,000 of net gain on $307,613,000 of in-kind redemptions.
Investment Transactions, Investment Income, and Distributions Income and expenses are recorded on the accrual basis. Dividends received from mutual fund investments are reflected as dividend income; capital gain distributions are reflected as realized gain/loss. Dividend income and capital gain distributions are recorded on the ex-dividend date. Investment transactions are accounted for on the trade date. Realized gains and losses are reported on the identified cost basis. Distributions to shareholders are recorded on the ex-dividend date. Income distributions are declared and paid by each class on an annual basis. Capital gain distributions, if any, are declared and paid by the fund, typically on an annual basis.
NOTE 2 - INVESTMENT TRANSACTIONS
Consistent with its investment objective, the fund engages in the following practices to manage exposure to certain risks or to enhance performance. The investment objective, policies, program, and risk factors of the fund are described more fully in the fund’s prospectus and Statement of Additional Information.
Restricted Securities The fund may invest in securities that are subject to legal or contractual restrictions on resale. Although certain of these securities may be readily sold, for example, under Rule 144A, others may be illiquid, their sale may involve substantial delays and additional costs, and prompt sale at an acceptable price may be difficult.
Securities Lending The fund lends its securities to approved brokers to earn additional income. It receives as collateral cash and U.S. government securities valued at 102% to 105% of the value of the securities on loan. Cash collateral is invested in a money market pooled trust managed by the fund’s lending agent in accordance with investment guidelines approved by management. Collateral is maintained over the life of the loan in an amount not less than the value of loaned securities, as determined at the close of fund business each day; any additional collateral required due to changes in security values is delivered to the fund the next business day. Although risk is mitigated by the collateral, the fund could experience a delay in recovering its securities and a possible loss of income or value if the borrower fails to return the securities. Securities lending revenue recognized by the fund consists of earnings on invested collateral and borrowing fees, net of any rebates to the borrower and compensation to the lending agent. At June 30, 2006, the value of loaned securities was $1,571,000; aggregate collateral consisted of $1,601,000 in the money market pooled trust.
Other Purchases and sales of portfolio securities, other than short-term securities, aggregated $108,789,000 and $434,696,000, respectively, for the six months ended June 30, 2006.
NOTE 3 - FEDERAL INCOME TAXES
No provision for federal income taxes is required since the fund intends to continue to qualify as a regulated investment company under Subchapter M of the Internal Revenue Code and distribute to shareholders all of its taxable income and gains. Federal income tax regulations differ from generally accepted accounting principles; therefore, distributions determined in accordance with tax regulations may differ in amount or character from net investment income and realized gains for financial reporting purposes. Financial reporting records are adjusted for permanent book/tax differences to reflect tax character. Financial records are not adjusted for temporary differences. The amount and character of tax-basis distributions and composition of net assets are finalized at fiscal year-end; accordingly, tax-basis balances have not been determined as of June 30, 2006.
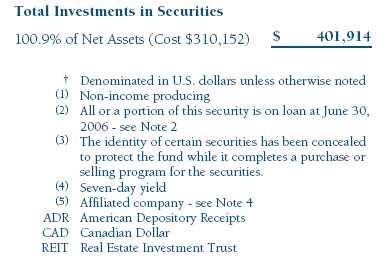
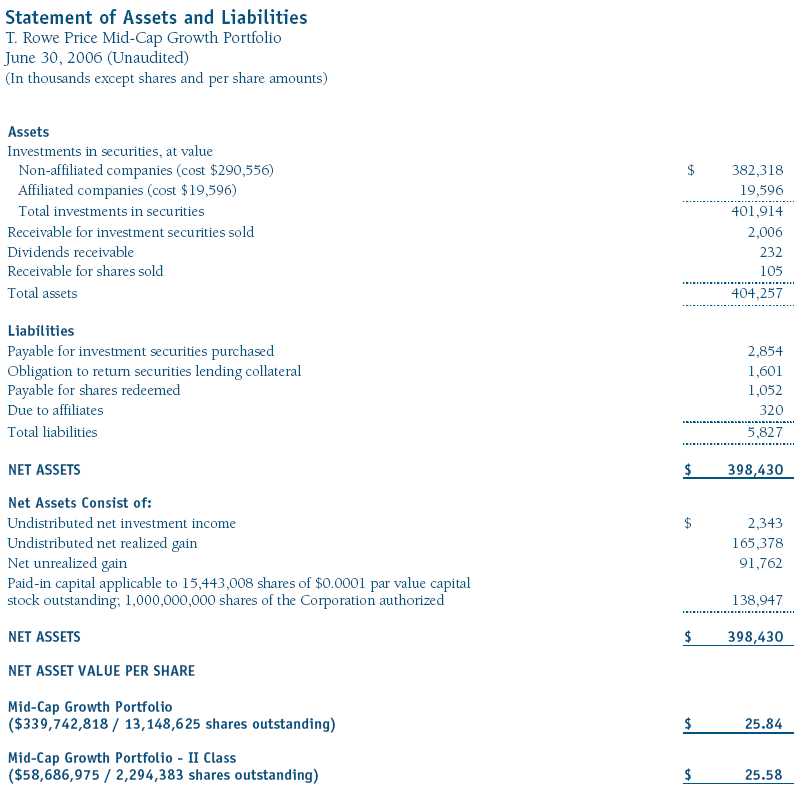
At June 30, 2006, the cost of investments for federal income tax purposes was $310,152,000. Net unrealized gain aggregated $91,762,000 at period-end, of which $109,113,000 related to appreciated investments and $17,351,000 related to depreciated investments.
NOTE 4 - RELATED PARTY TRANSACTIONS
The fund is managed by T. Rowe Price Associates, Inc. (the manager or Price Associates), a wholly owned subsidiary of T. Rowe Price Group, Inc. The investment management and administrative agreement between the fund and the manager provides for an all-inclusive annual fee equal to 0.85% of the fund’s average daily net assets. The fee is computed daily and paid monthly. The agreement provides that investment management, shareholder servicing, transfer agency, accounting, and custody services are provided to the fund, and interest, taxes, brokerage commissions, directors’ fees and expenses, and extraordinary expenses are paid directly by the fund.
The fund may invest in the T. Rowe Price Reserve Investment Fund and the T. Rowe Price Government Reserve Investment Fund (collectively, the T. Rowe Price Reserve Funds), open-end management investment companies managed by Price Associates and affiliates of the fund. The T. Rowe Price Reserve Funds are offered as cash management options to mutual funds, trusts, and other accounts managed by Price Associates and/or its affiliates, and are not available for direct purchase by members of the public. The T. Rowe Price Reserve Funds pay no investment management fees. During the six months ended June 30, 2006, dividend income from the T. Rowe Price Reserve Funds totaled $579,000, and the value of shares of the T. Rowe Price Reserve Funds held at June 30, 2006, and December 31, 2005, was $19,596,000 and $22,041,000, respectively.
| Information on Proxy Voting Policies, Procedures, and Records |
A description of the policies and procedures used by T. Rowe Price funds and portfolios to determine how to vote proxies relating to portfolio securities is available in each fund’s Statement of Additional Information, which you may request by calling 1-800-225-5132 or by accessing the SEC’s Web site, www.sec.gov. The description of our proxy voting policies and procedures is also available on our Web site, www.troweprice.com. To access it, click on the words “Company Info” at the top of our homepage for individual investors. Then, in the window that appears, click on the “Proxy Voting Policy” navigation button in the top left corner.
Each fund’s most recent annual proxy voting record is available on our Web site and through the SEC’s Web site. To access it through our Web site, follow the directions above, then click on the words “Proxy Voting Record” at the bottom of the Proxy Voting Policy page.
| How to Obtain Quarterly Portfolio Holdings |
The fund files a complete schedule of portfolio holdings with the Securities and Exchange Commission for the first and third quarters of each fiscal year on Form N-Q. The fund’s Form N-Q is available electronically on the SEC’s Web site (www.sec.gov); hard copies may be reviewed and copied at the SEC’s Public Reference Room, 450 Fifth St. N.W., Washington, DC 20549. For more information on the Public Reference Room, call 1-800-SEC-0330.
| Approval of Investment Management Agreement |
On March 8, 2006, the fund’s Board of Directors unanimously approved the investment advisory contract (Contract) between the fund and its investment manager, T. Rowe Price Associates, Inc. (Manager). The Board considered a variety of factors in connection with its review of the Contract, also taking into account information provided by the Manager during the course of the year, as discussed below:
Services Provided by the Manager
The Board considered the nature, quality, and extent of the services provided to the fund by the Manager. These services included, but were not limited to, management of the fund’s portfolio and a variety of activities related to portfolio management. The Board also reviewed the background and experience of the Manager’s senior management team and investment personnel involved in the management of the fund. The Board concluded that it was satisfied with the nature, quality, and extent of the services provided by the Manager.
Investment Performance of the Fund
The Board reviewed the fund’s average annual total return over the one-, three-, and five-year and since-inception periods as well as the fund’s year-by-year returns and compared these returns with previously agreed upon comparable performance measures and market data, including those supplied by Lipper and Morningstar, which are independent providers of mutual fund data. On the basis of this evaluation and the Board’s ongoing review of investment results, the Board concluded that the fund’s performance was satisfactory.
Costs, Benefits, Profits, and Economies of Scale
The Board reviewed detailed information regarding the revenues received by the Manager under the Contract and other benefits that the Manager (and its affiliates) may have realized from its relationship with the fund, including research received under “soft dollar” agreements. The Board noted that the use of soft dollars as a means of paying for third-party, non-broker research had been eliminated. The Board also received information on the estimated costs incurred and profits realized by the Manager and its affiliates from advising T. Rowe Price mutual funds, as well as estimates of the gross profits realized from managing the fund in particular. The Board concluded that the Manager’s profits were reasonable in light of the services provided to the fund. The Board also considered whether the fund or other funds benefit under the fee levels set forth in the Contract from any economies of scale realized by the Manager. The Board noted that, under the Contract, the fund pays the Manager a single fee based on the fund’s assets and the Manager, in turn, pays all expenses of the fund, with certain exceptions. The Board concluded that, based on the profitability data it reviewed and consistent with this single fee structure, the Contract provided for a reasonable sharing of benefits from any economies of scale with the fund.
Fees
The Board reviewed the fund’s single-fee structure and compared the rate with fees and expenses of other comparable funds based on information and data supplied by Lipper. The information provided to the Board indicated that the fund’s single fee rate was generally above the median management fee rate for comparable funds, but generally below the median expense ratio for comparable funds. The Board also reviewed the expense ratio of the fund’s II Class share class, which pays a 12b-1 fee in addition to the single fee, and compared this expense ratio with the fees and expenses of comparable funds. The information provided to the Board indicated that the expense ratio for the II Class share class was generally below the median expense ratio for comparable funds. The Board also reviewed the fee schedules for comparable privately managed accounts of the Manager and its affiliates. Management informed the Board that the Manager’s responsibilities for privately managed accounts are more limited than its responsibilities for the fund and other T. Rowe Price mutual funds that it or its affiliates advise. On the basis of the information provided, the Board concluded that the fees paid by the fund under the Contract were reasonable.
Approval of the Contract
As noted, the Board approved the continuation of the Contract. No single factor was considered in isolation or to be determinative to the decision. Rather, the Board concluded, in light of a weighting and balancing of all factors considered, that it was in the best interests of the fund to approve the continuation of the Contract, including the fees to be charged for services thereunder.
Item 2. Code of Ethics.
A code of ethics, as defined in Item 2 of Form N-CSR, applicable to its principal executive officer, principal financial officer, principal accounting officer or controller, or persons performing similar functions is filed as an exhibit to the registrant’s annual Form N-CSR. No substantive amendments were approved or waivers were granted to this code of ethics during the registrant’s most recent fiscal half-year.
Item 3. Audit Committee Financial Expert.
Disclosure required in registrant’s annual Form N-CSR.
Item 4. Principal Accountant Fees and Services.
Disclosure required in registrant’s annual Form N-CSR.
Item 5. Audit Committee of Listed Registrants.
Not applicable.
Item 6. Schedule of Investments.
Not applicable. The complete schedule of investments is included in Item 1 of this Form N-CSR.
Item 7. Disclosure of Proxy Voting Policies and Procedures for Closed-End Management Investment Companies.
Not applicable.
Item 8. Portfolio Managers of Closed-End Management Investment Companies.
Not applicable.
Item 9. Purchases of Equity Securities by Closed-End Management Investment Company and Affiliated Purchasers.
Not applicable.
Item 10. Submission of Matters to a Vote of Security Holders.
Not applicable.
Item 11. Controls and Procedures.
(a) The registrant’s principal executive officer and principal financial officer have evaluated the registrant’s disclosure controls and procedures within 90 days of this filing and have concluded that the registrant’s disclosure controls and procedures were effective, as of that date, in ensuring that information required to be disclosed by the registrant in this Form N-CSR was recorded, processed, summarized, and reported timely.
(b) The registrant’s principal executive officer and principal financial officer are aware of no change in the registrant’s internal control over financial reporting that occurred during the registrant’s second fiscal quarter covered by this report that has materially affected, or is reasonably likely to materially affect, the registrant’s internal control over financial reporting.
Item 12. Exhibits.(a)(1) The registrant’s code of ethics pursuant to Item 2 of Form N-CSR is filed with the registrant’s annual Form N-CSR.
(2) Separate certifications by the registrant's principal executive officer and principal financial officer, pursuant to Section 302 of the Sarbanes-Oxley Act of 2002 and required by Rule 30a-2(a) under the Investment Company Act of 1940, are attached.
(3) Written solicitation to repurchase securities issued by closed-end companies: not applicable.
(b) A certification by the registrant's principal executive officer and principal financial officer, pursuant to Section 906 of the Sarbanes-Oxley Act of 2002 and required by Rule 30a-2(b) under the Investment Company Act of 1940, is attached.
| | |
SIGNATURES |
| |
| | Pursuant to the requirements of the Securities Exchange Act of 1934 and the Investment |
| Company Act of 1940, the registrant has duly caused this report to be signed on its behalf by the |
| undersigned, thereunto duly authorized. |
| |
| T. Rowe Price Equity Series, Inc. |
| |
| |
| By | /s/ Edward C. Bernard |
| | Edward C. Bernard |
| | Principal Executive Officer |
| |
| Date | August 18, 2006 |
| |
| |
| | Pursuant to the requirements of the Securities Exchange Act of 1934 and the Investment |
| Company Act of 1940, this report has been signed below by the following persons on behalf of |
| the registrant and in the capacities and on the dates indicated. |
| |
| |
| By | /s/ Edward C. Bernard |
| | Edward C. Bernard |
| | Principal Executive Officer |
| |
| Date | August 18, 2006 |
| |
| |
| By | /s/ Joseph A. Carrier |
| | Joseph A. Carrier |
| | Principal Financial Officer |
| |
| Date | August 18, 2006 |