Item 1: Report to Shareholders| Personal Strategy Balanced Portfolio | June 30, 2006 |
The views and opinions in this report were current as of June 30, 2006. They are not guarantees of performance or investment results and should not be taken as investment advice. Investment decisions reflect a variety of factors, and the managers reserve the right to change their views about individual stocks, sectors, and the markets at any time. As a result, the views expressed should not be relied upon as a forecast of the fund’s future investment intent. The report is certified under the Sarbanes-Oxley Act of 2002, which requires mutual funds and other public companies to affirm that, to the best of their knowledge, the information in their financial reports is fairly and accurately stated in all material respects.
Dear Investor
Undeterred by rising oil prices and the Fed’s short-term interest rate increases, U.S. stocks rose moderately and helped the Personal Strategy Balanced Portfolio generate positive returns for the 6- and 12-month periods ended June 30, 2006. Fears that rising inflation would force the Federal Reserve to lift short-term rates more than expected precipitated a global stock market decline in May and June that trimmed returns in both periods. With rising interest rates, investment-grade bond returns declined for the first half of the year. Despite weakening in May, non-U.S. stocks strongly outpaced their U.S. counterparts in both periods.
Personal Strategy Balanced Portfolio
The Personal Strategy Balanced Portfolio’s investment objective is to generate the highest total return consistent with an equal emphasis on income and capital appreciation. The typical asset mix of securities is 60% stocks, 30% bonds, and 10% cash, although allocations can vary by as much as 10 percentage points above or below these levels.
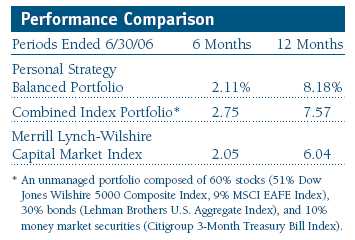
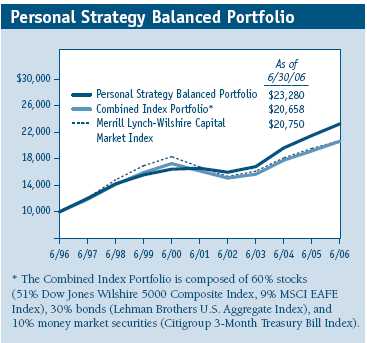
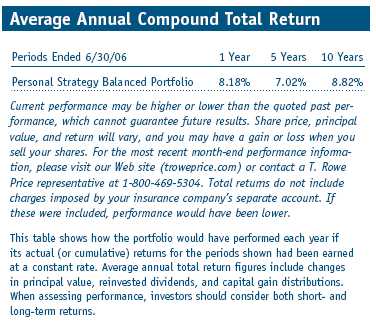
The Personal Strategy Balanced Portfolio posted gains for the six and 12 months ended June 30, 2006, as shown in the table. The fund outpaced the Combined Index Portfolio and the Merrill Lynch-Wilshire Capital Market Index for the 12-month period, aided by our heavier exposure to stocks relative to bonds and the strong performance of our non-U.S. equities. We underperformed the Combined Index Portfolio over the last six months as our overweight to large-cap growth stocks, during a period when this sector posted negative returns, detracted from performance.
Market Environment
The economy accelerated at the beginning of 2006, expanding at a robust annualized rate of 5% in the first quarter compared with a sluggish 1.7% in the final quarter of 2005. Manufacturing activity was sturdy, business and consumer spending patterns appeared to be healthy, and the unemployment rate dipped to 4.6% in May. The red-hot housing market cooled off and so far has not caused a noticeable disruption to the nation’s economy. Inflation remained generally contained, but by the end of the reporting period, it appeared that elevated energy costs were beginning to leak through to non-energy prices.
Central bank officials believe that stronger-than-expected economic growth and a renewed increase in energy costs have the potential to push inflation higher. In response, the Federal Reserve—now led by Ben Bernanke—raised the federal funds target rate to 5.25%, a level the short-term benchmark has not seen in five years. The central bank has now lifted the target rate 17 times since mid-2004.
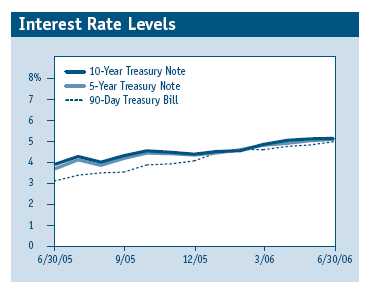
Yields on 90-day Treasury bills rose in tandem with the fed funds rate, increasing by slightly less than 200 basis points in the past year. (One hundred basis points equal one percentage point.) Intermediate-term rates rose to a lesser extent, and long-term rates climbed only slightly more than 100 basis points. As a result, the yield difference across the maturity spectrum narrowed—also known as a flattening of the Treasury yield curve.
Despite 12 months of rising interest rates and commodity prices, U.S. stocks rose, supported by solid economic and corporate profit growth and merger activity. Small-cap shares topped their larger peers: in the first half of our fiscal year ended June 30, 2006, the small- and mid-cap Dow Jones Wilshire 4500 Completion Index returned 5.51% compared with a 2.70% gain for the large-cap S&P 500 Index. For past 12 months, the Wilshire index’s gain of 13.87% outstripped the S&P 500’s return of 8.62%. As measured by various indexes, value stocks generally outperformed their growth counterparts across all market capitalizations in both periods, though for the one-year period, small-cap growth and value stocks did about the same.
Investment-grade bond returns were narrowly mixed in both the 6- and 12-month periods ended June 30, as falling bond prices in a rising interest rate environment offset income. In both periods, mortgage- and asset-backed securities produced modest gains, but Treasuries and investment-grade corporate bonds declined, particularly long-term issues. High-yield bonds greatly outperformed investment-grade securities. The Lehman Brothers U.S. Aggregate Index, which measures the performance of domestic investment-grade taxable bonds, returned -0.72% in the last six months and -0.81% for the one-year period.
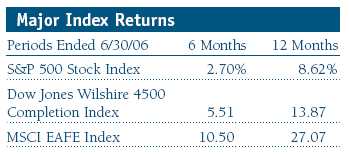
Non-U.S. stocks, however, were the star performers, with the MSCI EAFE Index, which measures the performance of large-cap shares in Europe, Australasia, and the Far East, handily beating U.S. indexes. The MSCI EAFE Index returned 10.50% in the first half of our fiscal year and 27.07% for the 12-month period.
Portfolio Review
The portfolio’s investment committee meets monthly to adjust the weightings of stocks, bonds, and money market securities within the appropriate ranges for each fund. Economic fundamentals and market conditions drive these allocation changes.
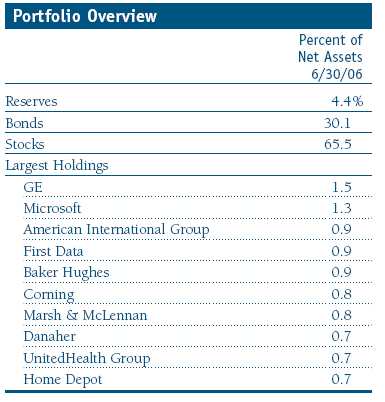
We continue to underweight fixed income, but over the past six months, we increased the target allocation by 1%. The fund’s fixed-income allocation ended the reporting period at 35.5%, slightly less than our neutral level of 40%. Within fixed income, bonds made up 30.1% of the portfolio at the end of June, while the fund’s cash position has decreased to 4.4%, slightly lower than six months ago. We still maintain a relatively heavier stock allocation (65.0% compared with a neutral weighting of 60.0%). Among the stocks, we maintain an underweight to small-caps and favor large-cap growth names. Stocks have outperformed bonds in the past 12 months, and our increased allocation to stocks was beneficial. However, three times within the past year (August 2005 and April and May 2006), we shifted some of our assets from stocks into bonds, realizing our gains and reducing our overexposure to equities. Given the prospects for continued economic growth and the associate d upward pressure on interest rates, we are still maintaining our generally heavier exposure to equities. Within our fixed-income holdings, our allocation to cash and short-term bonds helped mitigate the impact of rising interest rates while capturing the rise in short-term yields.
Within our stock holdings, we maintained an overweight to high-quality large-cap growth stocks. We believe we have entered a period of solid but slowing earnings growth and that investors are likely to pay a premium for those high-quality large-caps whose earnings grow faster than the market. Following a prolonged period of outperformance, we continued to underweight our allocation to small-cap companies, whose valuations are no longer as compelling as they had been earlier.
Strong returns in non-U.S. markets extended their multi-year rally into 2006 and boosted the funds’ performance for the period despite the May downturn. Given several years of solid performance by non-U.S. equities and the prospects of more favorable profit growth in U.S. companies, we have a neutral weighting in non-U.S. equity markets. In the EAFE-related markets, we believe valuations are reasonable. Even though economic growth in the developed markets of Europe and Japan has been lackluster, many companies have been able to use productivity gains to squeeze more earnings out of their modest revenue growth.
Within our fixed-income holdings, we have increased our allocation over the past 12 months to investment-grade bonds but are still underweight. Because strong corporate profits and historically low default rates are fully priced into high-yield bond valuations, we remain close to neutral in high-yield bonds.
Among our major equity holdings, GE is well positioned to benefit from a growing U.S. and global economy. The company’s largest businesses, power and aerospace, are poised to generate double-digit earnings per share growth during the next few years. We believe GE’s jet engine should sell well to airlines buying new lightweight, fuel-efficient planes to replace their aging fleets. The expanded sales of their engines also opens the opportunity for servicing contracts that generate handsome margins without large capital investments. We believe that Microsoft is attractively valued. The software giant continues to report higher profits but was punished for missing Wall Street earnings expectations because of higher-than-expected costs from its Xbox 360 business unit and for announcing the release of its new Vista operating system would be delayed un til early 2007. American International Group, the large international insurance company, continues to post strong results and continues to execute important strategic initiatives. The company appears to have put the disruption from the change in top management last year and the restatement of five years of annual earnings behind it. Baker Hughes, an oil services company, is an established competitor in the oil service industry. Thanks to high gas and oil prices, the company’s customers are in a position to pay for high-end equipment and services, which should generate solid growth in revenue and earnings. (Please refer to our portfolio of investments for a complete listing of the portfolio’s holdings and the amount each represents in the portfolio.)
Outlook
Although we do not necessarily believe that equity markets will outperform fixed income for the next three to six months, we believe that they will outperform over the next couple of years. Profit growth will likely remain solid, but the rate of growth should decelerate as higher interest rates and energy costs take their toll on corporate earnings growth. The recent volatility is normal in investing and points to what we believe is the strength of our investment approach, which incorporates a disciplined strategy, broad diversification, and a long-term focus. Whatever the near term holds, we believe that shareholders will be well-served by the funds’ varying investment objectives and the fundamental commitment to diversification across asset classes.
Respectfully submitted,

Edmund M. Notzon III
Chairman of the portfolio’s Investment Advisory Committee
July 19, 2006
The committee chairman has day-to-day responsibility for managing the portfolio and works with committee members in developing and executing the portfolio’s investment program.
As with all stock and bond mutual funds, each fund’s share price can fall because of weakness in the stock or bond markets, a particular industry, or specific holdings. Stock markets can decline for many reasons, including adverse political or economic developments, changes in investor psychology, or heavy institutional selling. The prospects for an industry or company may deteriorate because of a variety of factors, including disappointing earnings or changes in the competitive environment. In addition, the investment manager’s assessment of companies held in a fund may prove incorrect, resulting in losses or poor performance even in rising markets.Bonds are subject to interest rate risk, the decline in bond prices that usually accompanies a rise in interest rates, and credit risk, the chance that any fund holding could have its credit rating downgraded or that a bond issuer will default (fail to make timely payments of interest or principal), potentially reducing the fund’s income level and share price. High-yield corporate bonds could have greater price declines than funds that invest primarily in high-quality bonds. Companies issuing high-yield bonds are not as strong financially as those with higher credit ratings, so the bonds are usually considered speculative investments.
Funds that invest overseas may carry more risk than funds that invest strictly in U.S. assets. Risks can result from varying stages of economic and political development; differing regulatory environments, trading days, and accounting standards; and higher transaction costs of non-U.S. markets. Non-U.S. investments are also subject to currency risk, or a decline in the value of a foreign currency versus the U.S. dollar, which reduces the dollar value of securities denominated in that currency.
Citigroup 3-Month Treasury Bill Index: An unmanaged index that tracks short-term U.S. government debt instruments.Combined Index Portfolio: Unmanaged portfolio composed of the following underlying indexes:
- Personal Strategy Balanced—60% stocks (51% Dow Jones Wilshire 5000 Composite Index, 9% MSCI EAFE Index), 30% bonds (Lehman Brothers U.S. Aggregate Index), and 10% money market securities (Citigroup 3-Month Treasury Bill Index).
Credit Suisse High Yield Index: An unmanaged index constructed to mirror the high-yield debt market.
Dow Jones Wilshire 4500 Completion Index: An unmanaged index that tracks the performance of all stocks in the Dow Jones Wilshire 5000 Composite Index, excluding those found in the S&P 500 Stock Index.
Dow Jones Wilshire 5000 Composite Index: An unmanaged index that tracks the performance of the most active stocks in the broad U.S. market.
Duration: The average time (expressed in years) it takes investors to receive the present value of the future cash flows on their investment. It is used to measure the sensitivity of bond prices to interest rate changes (the shorter the duration, the less the bond’s price will rise or fall when interest rates change). Duration is affected by maturity, the coupon, and the time interval between payments. Other things being equal, a bond with a higher coupon will have a shorter duration, while zero-coupon bonds have the longest.
Lehman Brothers U.S. Aggregate Index: An unmanaged index that tracks investment-grade corporate and government bonds.
Merrill Lynch-Wilshire Capital Market Index: A market capitalization-weighted index including the Wilshire 5000 and Merrill Lynch High Yield II and Domestic Master indexes.
MSCI EAFE Index: An unmanaged index that tracks the stocks of about 1,000 companies in Europe, Australasia, and the Far East (EAFE).
S&P 500 Index: An unmanaged index that tracks the stocks of 500 primarily large-cap U.S. companies.
Yield curve: A graphic depiction of the relationship between yields and maturity dates for a set of similar securities, such as Treasuries or municipal securities. Yield curves typically slope upward, indicating that longer maturities offer higher yields. When the yield curve is flat, there is little or no difference between the yields offered by shorter- and longer-term securities.
Portfolio Highlights
This chart shows the value of a hypothetical $10,000 investment in the fund over the past 10 fiscal year periods or since inception (for funds lacking 10-year records). The result is compared with benchmarks, which may include a broad-based market index and a peer group average or index. Market indexes do not include expenses, which are deducted from fund returns as well as mutual fund averages and indexes.
Fund Expense Example
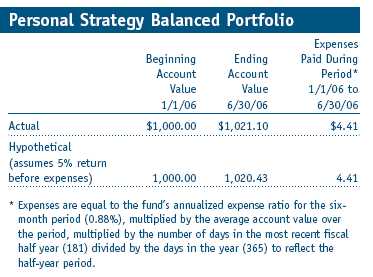
As a mutual fund shareholder, you may incur two types of costs: (1) transaction costs, such as redemption fees or sales loads, and (2) ongoing costs, including management fees, distribution and service (12b-1) fees, and other fund expenses. The following example is intended to help you understand your ongoing costs (in dollars) of investing in the fund and to compare these costs with the ongoing costs of investing in other mutual funds. The example is based on an investment of $1,000 invested at the beginning of the most recent six-month period and held for the entire period.
Actual Expenses
The first line of the following table (“Actual”) provides information about actual account values and actual expenses. You may use the information in this line, together with your account balance, to estimate the expenses that you paid over the period. Simply divide your account value by $1,000 (for example, an $8,600 account value divided by $1,000 = 8.6), then multiply the result by the number in the first line under the heading “Expenses Paid During Period” to estimate the expenses you paid on your account during this period.
Hypothetical Example for Comparison Purposes
The information on the second line of the table (“Hypothetical”) is based on hypothetical account values and expenses derived from the fund’s actual expense ratio and an assumed 5% per year rate of return before expenses (not the fund’s actual return). You may compare the ongoing costs of investing in the fund with other funds by contrasting this 5% hypothetical example and the 5% hypothetical examples that appear in the shareholder reports of the other funds. The hypothetical account values and expenses may not be used to estimate the actual ending account balance or expenses you paid for the period.
You should also be aware that the expenses shown in the table highlight only your ongoing costs and do not reflect any transaction costs, such as redemption fees or sales loads. Therefore, the second line of the table is useful in comparing ongoing costs only, and will not help you determine the relative total costs of owning different funds. To the extent a fund charges transaction costs, however, the total cost of owning that fund is higher.
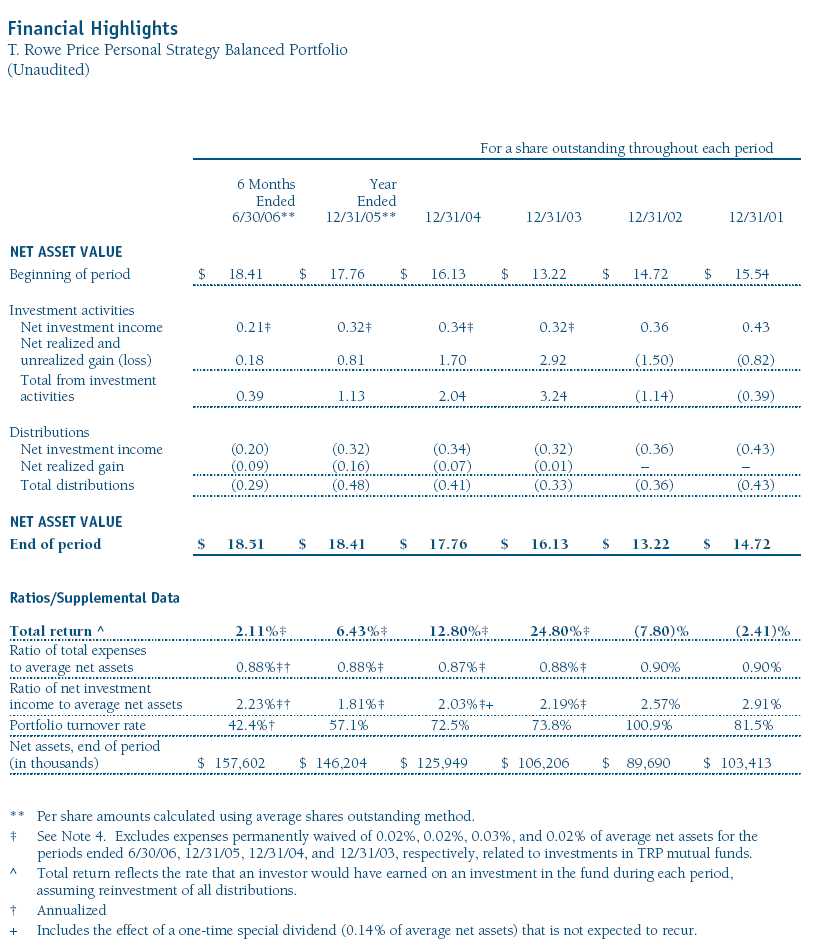
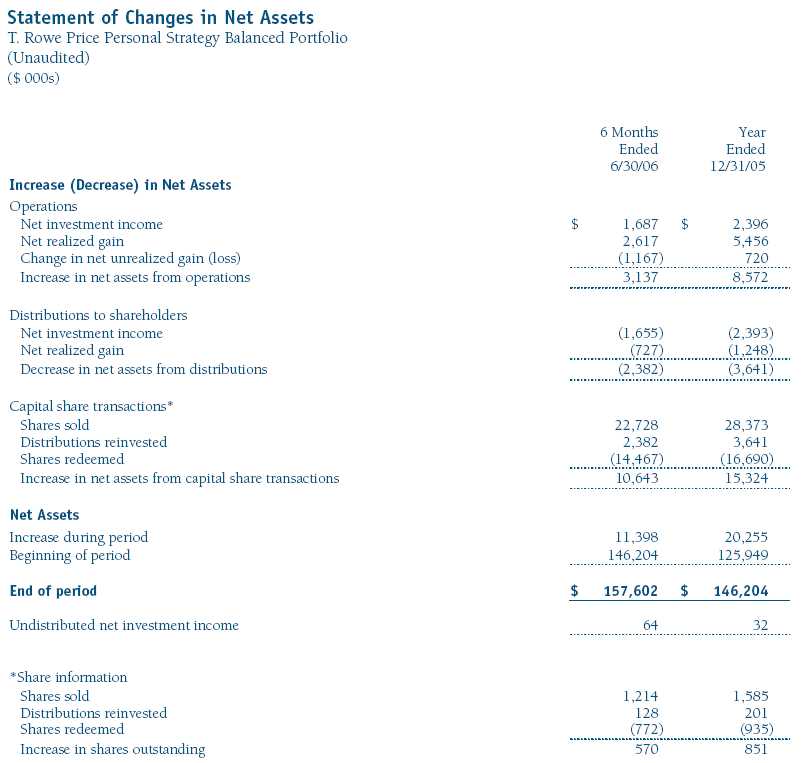
The accompanying notes are an integral part of these financial statements.


The accompanying notes are an integral part of these financial statements.
The accompanying notes are an integral part of these financial statements.

The accompanying notes are an integral part of these financial statements.
The accompanying notes are an integral part of these financial statements.
Notes to Financial Statements
T. Rowe Price Personal Strategy Balanced Portfolio
June 30, 2006 (Unaudited)
NOTE 1 - SIGNIFICANT ACCOUNTING POLICIES
T. Rowe Price Equity Series, Inc. (the corporation), is registered under the Investment Company Act of 1940 (the 1940 Act). The Personal Strategy Balanced Portfolio (the fund), a diversified, open-end management investment company, is one portfolio established by the corporation. The fund commenced operations on December 30, 1994. The fund seeks the highest total return over time consistent with an emphasis on both capital appreciation and income. Shares of the fund are currently offered only through certain insurance companies as an investment medium for both variable annuity contracts and variable life insurance policies.
The accompanying financial statements were prepared in accordance with accounting principles generally accepted in the United States of America, which require the use of estimates made by fund management. Fund management believes that estimates and security valuations are appropriate; however, actual results may differ from those estimates, and the security valuations reflected in the financial statements may differ from the value the fund ultimately realizes upon sale of the securities.
Valuation The fund values its investments and computes its net asset value per share at the close of the New York Stock Exchange (NYSE), normally 4 p.m. ET, each day that the NYSE is open for business. Equity securities listed or regularly traded on a securities exchange or in the over-the-counter (OTC) market are valued at the last quoted sale price or, for certain markets, the official closing price at the time the valuations are made, except for OTC Bulletin Board securities, which are valued at the mean of the latest bid and asked prices. A security that is listed or traded on more than one exchange is valued at the quotation on the exchange determined to be the primary market for such security. Listed securities not traded on a particular day are valued at the mean of the latest bid and asked prices for domestic securities and the last quoted sale price for international securities.
Debt securities are generally traded in the over-the-counter market. Securities with original maturities of one year or more are valued at prices furnished by dealers who make markets in such securities or by an independent pricing service, which considers yield or price of bonds of comparable quality, coupon, maturity, and type, as well as prices quoted by dealers who make markets in such securities. Securities with original maturities of less than one year are valued at amortized cost in local currency, which approximates fair value when combined with accrued interest.
Investments in mutual funds are valued at the mutual fund’s closing net asset value per share on the day of valuation. Financial futures contracts are valued at closing settlement prices.
Other investments, including restricted securities, and those for which the above valuation procedures are inappropriate or are deemed not to reflect fair value are stated at fair value as determined in good faith by the T. Rowe Price Valuation Committee, established by the fund’s Board of Directors.
Most foreign markets close before the close of trading on the NYSE. If the fund determines that developments between the close of a foreign market and the close of the NYSE will, in its judgment, materially affect the value of some or all of its portfolio securities, which in turn will affect the fund’s share price, the fund will adjust the previous closing prices to reflect the fair value of the securities as of the close of the NYSE, as determined in good faith by the T. Rowe Price Valuation Committee, established by the fund’s Board of Directors. A fund may also fair value securities in other situations, such as when a particular foreign market is closed but the fund is open. In deciding whether to make fair value adjustments, the fund reviews a variety of factors, including developments in foreign markets, the performance of U.S. securities markets, and the performance of instruments trading in U.S. markets that represent foreign securities and baskets of foreign securities . The fund uses outside pricing services to provide it with closing market prices and information used for adjusting those prices. The fund cannot predict when and how often it will use closing prices and when it will adjust those prices to reflect fair value. As a means of evaluating its fair value process, the fund routinely compares closing market prices, the next day’s opening prices in the same markets, and adjusted prices.
Currency Translation Assets, including investments, and liabilities denominated in foreign currencies are translated into U.S. dollar values each day at the prevailing exchange rate, using the mean of the bid and asked prices of such currencies against U.S. dollars as quoted by a major bank. Purchases and sales of securities, income, and expenses are translated into U.S. dollars at the prevailing exchange rate on the date of the transaction. The effect of changes in foreign currency exchange rates on realized and unrealized security gains and losses is reflected as a component of security gains and losses.
Investment Transactions, Investment Income, and Distributions Income and expenses are recorded on the accrual basis. Premiums and discounts on debt securities are amortized for financial reporting purposes. Inflation adjustments to the principal amount of inflation-indexed bonds are reflected as interest income. Dividends received from mutual fund investments are reflected as dividend income; capital gain distributions are reflected as realized gain/loss. Dividend income and capital gain distributions are recorded on the ex-dividend date. Investment transactions are accounted for on the trade date. Realized gains and losses are reported on the identified cost basis. Payments (“variation margin”) made or received to settle the daily fluctuations in the value of futures contracts are recorded as unrealized gains or losses until the contracts are closed. Unsettled variation margin on futures contracts is reflected as other assets or liabilities, and unreal ized gains and losses on futures contracts are reflected as the change in net unrealized gain or loss in the accompanying financial statements. Paydown gains and losses are recorded as an adjustment to interest income. Distributions to shareholders are recorded on the ex-dividend date. Income distributions are declared and paid on a quarterly basis. Capital gain distributions, if any, are declared and paid by the fund, typically on an annual basis.
NOTE 2 - INVESTMENT TRANSACTIONS
Consistent with its investment objective, the fund engages in the following practices to manage exposure to certain risks or to enhance performance. The investment objective, policies, program, and risk factors of the fund are described more fully in the fund’s prospectus and Statement of Additional Information.
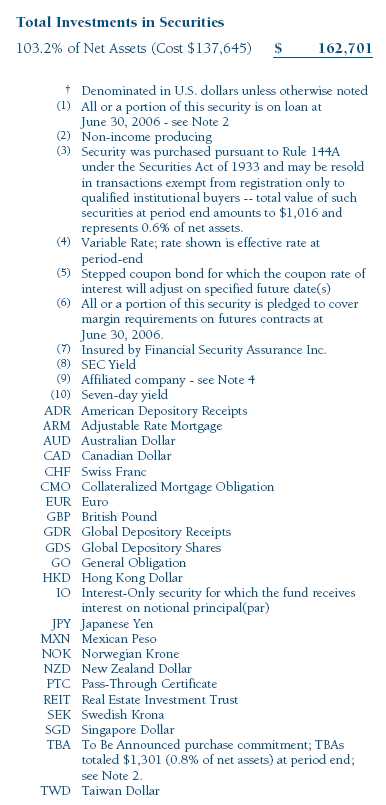
Restricted Securities The fund may invest in securities that are subject to legal or contractual restrictions on resale. Although certain of these securities may be readily sold, for example, under Rule 144A, others may be illiquid, their sale may involve substantial delays and additional costs, and prompt sale at an acceptable price may be difficult.
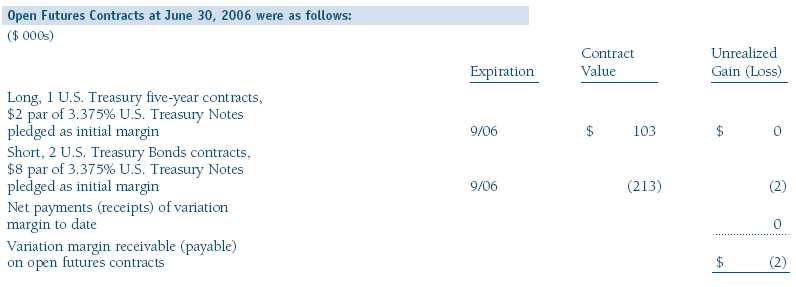
Futures Contracts During the six months ended June 30, 2006, the fund was a party to futures contracts, which provide for the future sale by one party and purchase by another of a specified amount of a specific financial instrument at an agreed upon price, date, time, and place. Risks arise from possible illiquidity of the futures market and from movements in security values and/or interest rates.
TBA Purchase Commitments During the six months ended June 30, 2006, the fund entered into to be announced (TBA) purchase commitments, pursuant to which it agrees to purchase mortgage-backed securities for a fixed unit price, with payment and delivery at a scheduled future date beyond the customary settlement period for that security. With TBA transactions, the particular securities to be delivered are not identified at the trade date; however, delivered securities must meet specified terms, including issuer, rate, and mortgage term, and be within industry-accepted “good delivery” standards. The fund generally enters into TBAs with the intention of taking possession of the underlying mortgage securities. Until settlement, the fund maintains cash reserves and liquid assets sufficient to settle its TBAs.
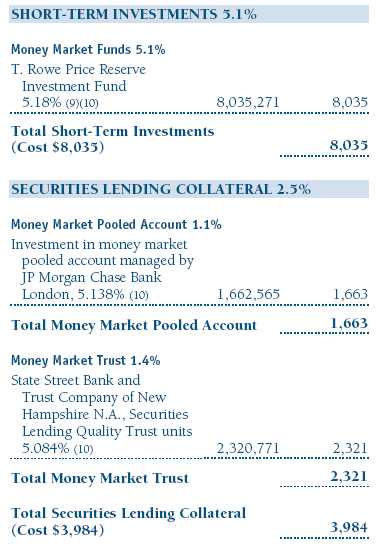
Securities Lending The fund lends its securities to approved brokers to earn additional income. It receives as collateral cash and U.S. government securities valued at 102% to 105% of the value of the securities on loan. Cash collateral is invested in money market pooled accounts managed by the fund’s lending agents in accordance with investment guidelines approved by fund management. Collateral is maintained over the life of the loan in an amount not less than the value of loaned securities, as determined at the close of fund business each day; any additional collateral required due to changes in security values is delivered to the fund the next business day. Although risk is mitigated by the collateral, the fund could experience a delay in recovering its securities and a possible loss of income or value if the borrower fails to return the securities. Securities lending revenue recognized by the fund consists of earnings on invested collateral and borrowin g fees, net of any rebates to the borrower and compensation to the lending agent. At June 30, 2006, the value of loaned securities was $3,869,000; aggregate collateral consisted of $3,984,000 in money market pooled accounts.
Other Purchases and sales of portfolio securities, other than short-term and U.S. government securities, aggregated $27,052,000 and $18,611,000, respectively, for the six months ended June 30, 2006. Purchases and sales of U.S. government securities aggregated $15,281,000 and $11,990,000, respectively, for the six months ended June 30, 2006.
NOTE 3 - FEDERAL INCOME TAXES
No provision for federal income taxes is required since the fund intends to continue to qualify as a regulated investment company under Subchapter M of the Internal Revenue Code and distribute to shareholders all of its taxable income and gains. Federal income tax regulations differ from generally accepted accounting principles; therefore, distributions determined in accordance with tax regulations may differ in amount or character from net investment income and realized gains for financial reporting purposes. Financial reporting records are adjusted for permanent book/tax differences to reflect tax character. Financial records are not adjusted for temporary differences. The amount and character of tax-basis distributions and composition of net assets are finalized at fiscal year-end; accordingly, tax-basis balances have not been determined as of June 30, 2006.
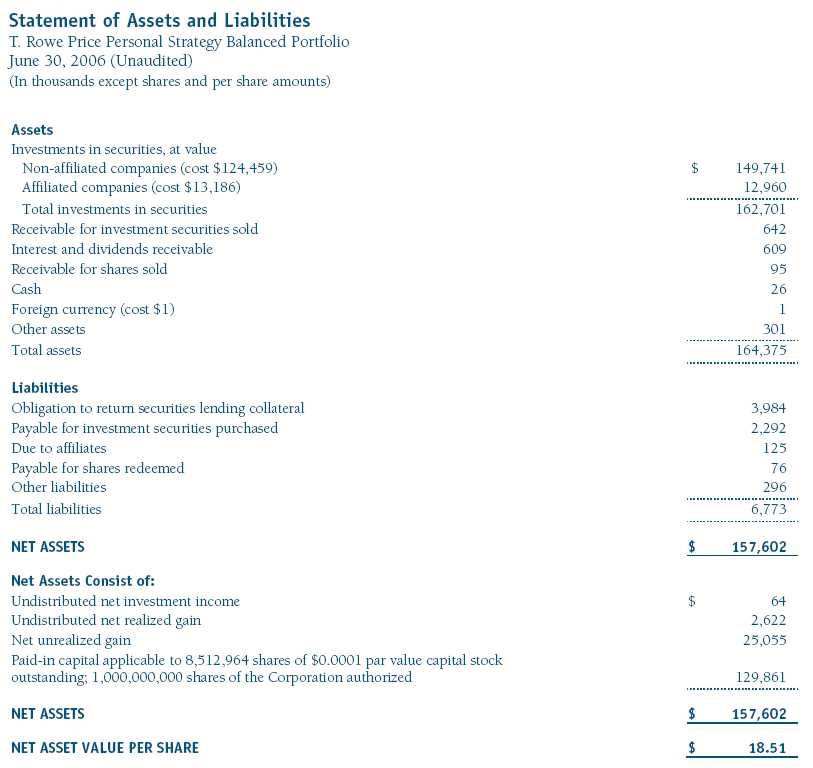
At June 30, 2006, the cost of investments for federal income tax purposes was $137,645,000. Net unrealized gain aggregated $25,055,000 at period-end, of which $28,722,000 related to appreciated investments and $3,667,000 related to depreciated investments.
NOTE 4 - RELATED PARTY TRANSACTIONS
The fund is managed by T. Rowe Price Associates, Inc. (the manager or Price Associates), a wholly owned subsidiary of T. Rowe Price Group, Inc. The investment management and administrative agreement between the fund and the manager provides for an all-inclusive annual fee equal to 0.90% of the fund’s average daily net assets. The fee is computed daily and paid monthly. The agreement provides that investment management, shareholder servicing, transfer agency, accounting, and custody services are provided to the fund, and interest, taxes, brokerage commissions, directors’ fees and expenses, and extraordinary expenses are paid directly by the fund.
The fund may invest in the T. Rowe Price Reserve Investment Fund and the T. Rowe Price Government Reserve Investment Fund (collectively, the T. Rowe Price Reserve Funds), open-end management investment companies managed by Price Associates and affiliates of the fund. The T. Rowe Price Reserve Funds are offered as cash management options to mutual funds, trusts, and other accounts managed by Price Associates and/ or its affiliates, and are not available for direct purchase by members of the public. The T. Rowe Price Reserve Funds pay no investment management fees. During the six months ended June 30, 2006, dividend income from the T. Rowe Price Reserve Funds totaled $198,000, and the value of shares of the T. Rowe Price Reserve Funds held at June 30, 2006, and December 31, 2005 was $8,035,000 and $8,668,000, respectively.
The fund may invest in the T. Rowe Price Institutional High Yield Fund, Inc. (High Yield Fund) as a means of gaining efficient and cost-effective exposure to the high-yield bond markets. The High Yield Fund is an open-end management investment company managed by Price Associates, and an affiliate of the fund. The High Yield Fund pays an annual all-inclusive management and administrative fee to Price Associates equal to 0.50% of average daily net assets. To ensure that Personal Strategy Balanced Portfolio does not incur duplicate fees for its assets invested in the High Yield Fund, Price Associates has agreed to reduce its management fee to the fund. Accordingly, the management fee waiver reflected on the accompanying Statement of Operations includes $12,000 of management fees permanently waived pursuant to this agreement. During the six months ended June 30, 2006, purchases and sales of the High Yield Fund were $981,000 and $0, respectively. For the six months then ended, net investment in come was $187,000. At June 30, 2006, and December 31, 2005 the value of shares of the High Yield Fund held were $4,925,000 and $4,035,000, respectively.
| Information on Proxy Voting Policies, Procedures, and Records |
A description of the policies and procedures used by T. Rowe Price funds and portfolios to determine how to vote proxies relating to portfolio securities is available in each fund’s Statement of Additional Information, which you may request by calling 1-800-225-5132 or by accessing the SEC’s Web site, www.sec.gov. The description of our proxy voting policies and procedures is also available on our Web site, www.troweprice.com. To access it, click on the words “Company Info” at the top of our homepage for individual investors. Then, in the window that appears, click on the “Proxy Voting Policy” navigation button in the top left corner.Each fund’s most recent annual proxy voting record is available on our Web site and through the SEC’s Web site. To access it through our Web site, follow the directions above, then click on the words “Proxy Voting Record” at the bottom of the Proxy Voting Policy page.
| How to Obtain Quarterly Portfolio Holdings |
The fund files a complete schedule of portfolio holdings with the Securities and Exchange Commission for the first and third quarters of each fiscal year on Form N-Q. The fund’s Form N-Q is available electronically on the SEC’s Web site (www.sec.gov); hard copies may be reviewed and copied at the SEC’s Public Reference Room, 450 Fifth St. N.W., Washington, DC 20549. For more information on the Public Reference Room, call 1-800-SEC-0330.
| Approval of Investment Management Agreement |
On March 8, 2006, the fund’s Board of Directors unanimously approved the investment advisory contract (Contract) between the fund and its investment manager, T. Rowe Price Associates, Inc. (Manager). The Board considered a variety of factors in connection with its review of the Contract, also taking into account information provided by the Manager during the course of the year, as discussed below:Services Provided by the Manager
The Board considered the nature, quality, and extent of the services provided to the fund by the Manager. These services included, but were not limited to, management of the fund’s portfolio and a variety of activities related to portfolio management. The Board also reviewed the background and experience of the Manager’s senior management team and investment personnel involved in the management of the fund. The Board concluded that it was satisfied with the nature, quality, and extent of the services provided by the Manager.
Investment Performance of the Fund
The Board reviewed the fund’s average annual total return over the 1-, 3-, 5-, and 10-year periods as well as the fund’s year-by-year returns and compared these returns with previously agreed upon comparable performance measures and market data, including those supplied by Lipper, an independent provider of mutual fund data. On the basis of this evaluation and the Board’s ongoing review of investment results, the Board concluded that the fund’s performance was satisfactory.
Costs, Benefits, Profits, and Economies of Scale
The Board reviewed detailed information regarding the revenues received by the Manager under the Contract and other benefits that the Manager (and its affiliates) may have realized from its relationship with the fund, including research received under “soft dollar” agreements. The Board noted that the use of soft dollars as a means of paying for third-party, non-broker research had been eliminated. The Board also received information on the estimated costs incurred and profits realized by the Manager and its affiliates from advising T. Rowe Price mutual funds, as well as estimates of the gross profits realized from managing the fund in particular. The Board concluded that the Manager’s profits were reasonable in light of the services provided to the fund. The Board also considered whether the fund or other funds benefit under the fee levels set forth in the Contract from any economies of scale realized by the Manager. The Board noted that, under the Contract, the fund pays the Manager a single fee based on the fund’s assets and the Manager, in turn, pays all expenses of the fund, with certain exceptions. The Board concluded that, based on the profitability data it reviewed and consistent with this single fee structure, the Contract provided for a reasonable sharing of benefits from any economies of scale with the fund.
Fees
The Board reviewed the fund’s single-fee structure and compared the rate with fees and expenses of other comparable funds based on information and data supplied by Lipper. The information provided to the Board indicated that the fund’s single fee rate was generally above the median management fee rate but generally below the median expense ratio for comparable funds. The Board also reviewed the fee schedules for comparable privately managed accounts of the Manager and its affiliates. Management informed the Board that the Manager’s responsibilities for privately managed accounts are more limited than its responsibilities for the fund and other T. Rowe Price mutual funds that it or its affiliates advise. On the basis of the information provided, the Board concluded that the fees paid by the fund under the Contract were reasonable.
Approval of the Contract
As noted, the Board approved the continuation of the Contract. No single factor was considered in isolation or to be determinative to the decision. Rather, the Board concluded, in light of a weighting and balancing of all factors considered, that it was in the best interests of the fund to approve the continuation of the Contract, including the fees to be charged for services thereunder.
A code of ethics, as defined in Item 2 of Form N-CSR, applicable to its principal executive officer, principal financial officer, principal accounting officer or controller, or persons performing similar functions is filed as an exhibit to the registrant’s annual Form N-CSR. No substantive amendments were approved or waivers were granted to this code of ethics during the registrant’s most recent fiscal half-year.
Disclosure required in registrant’s annual Form N-CSR.
Disclosure required in registrant’s annual Form N-CSR.
Not applicable.
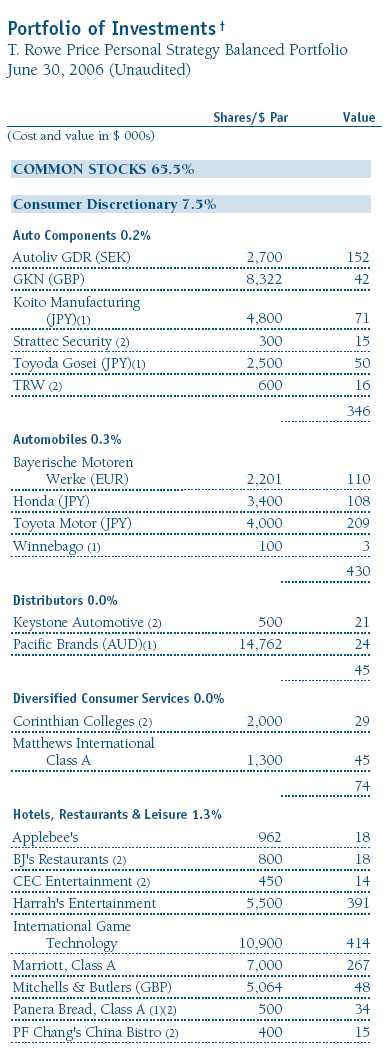
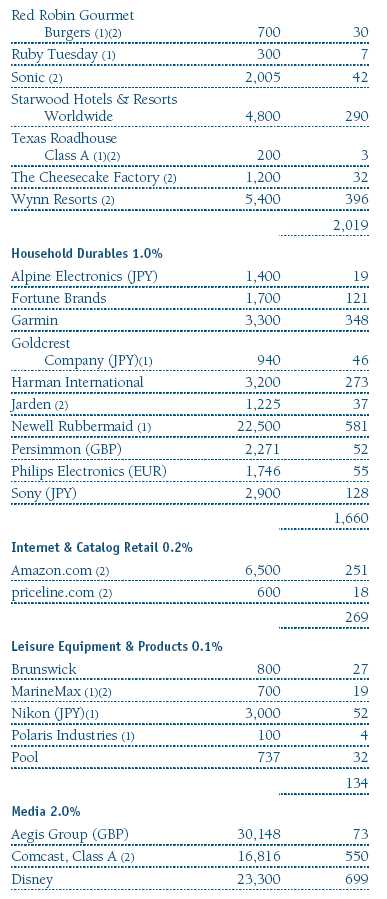
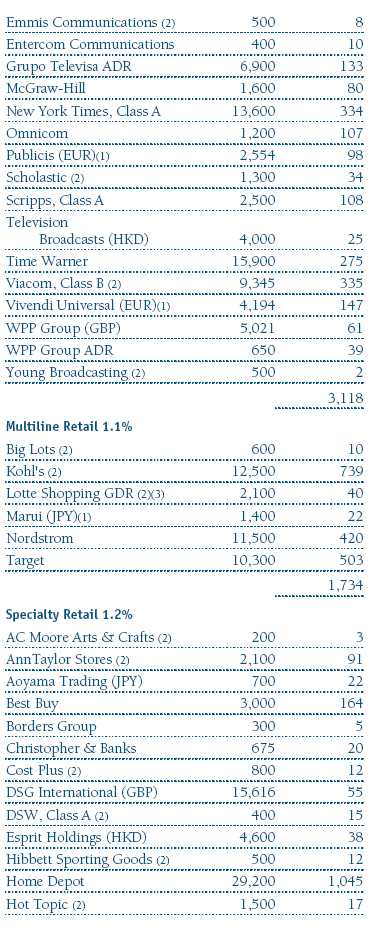
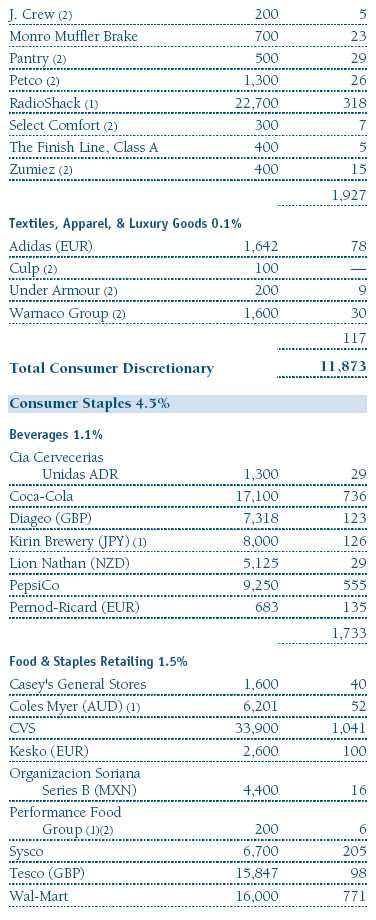
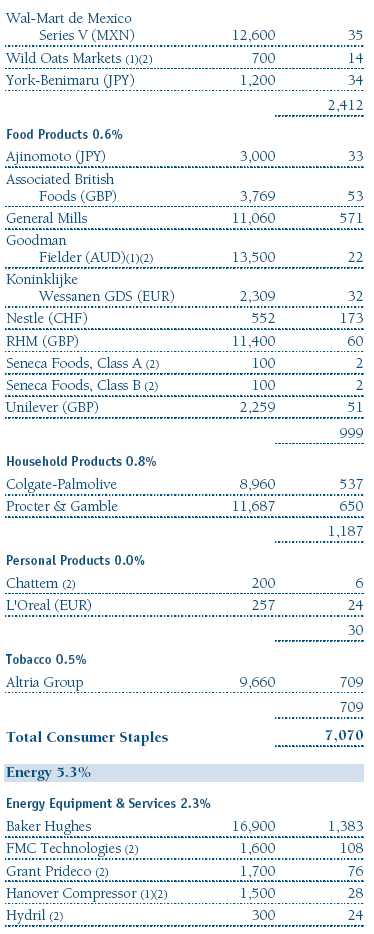
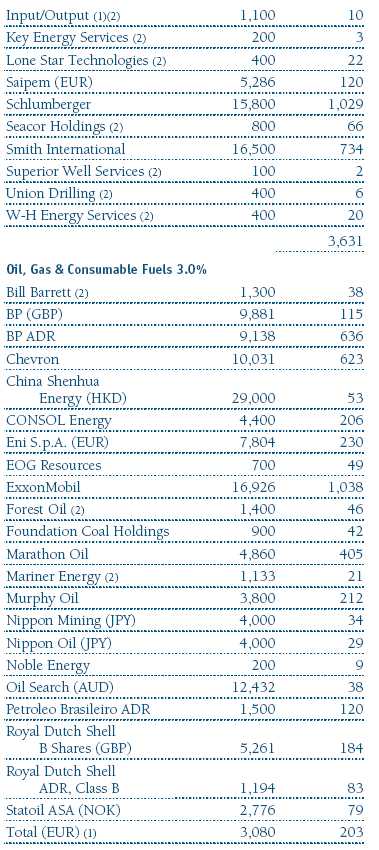
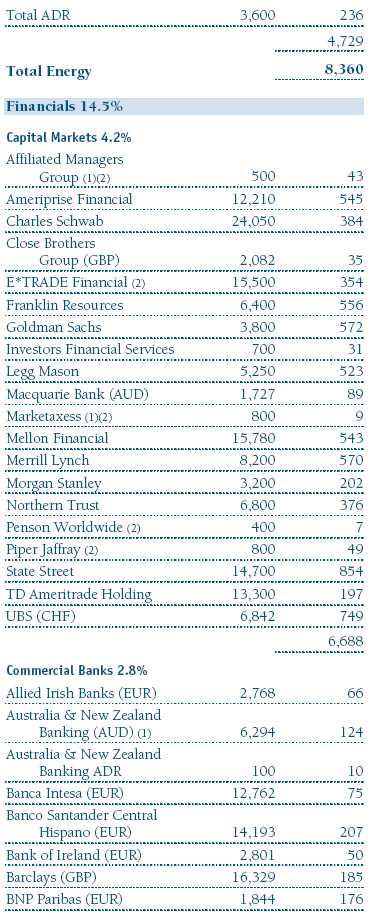
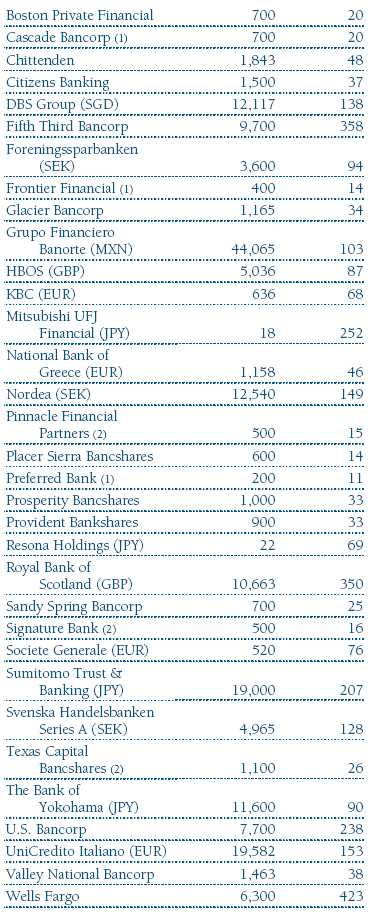
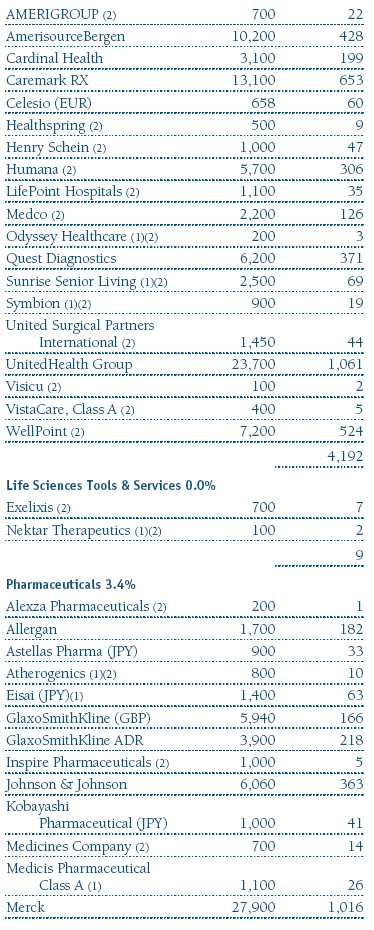
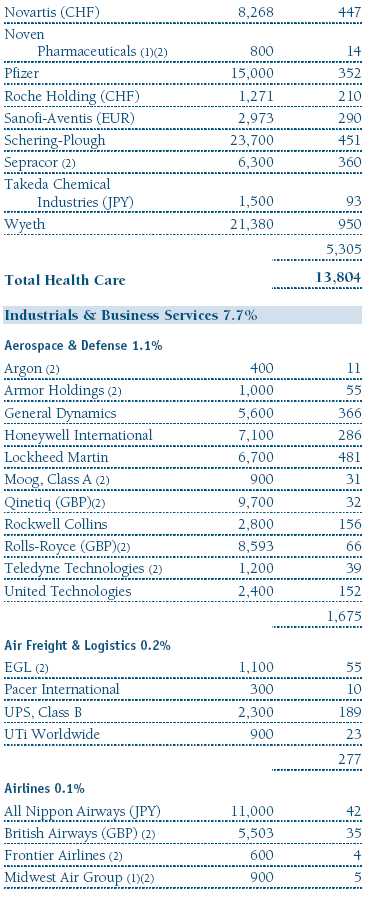
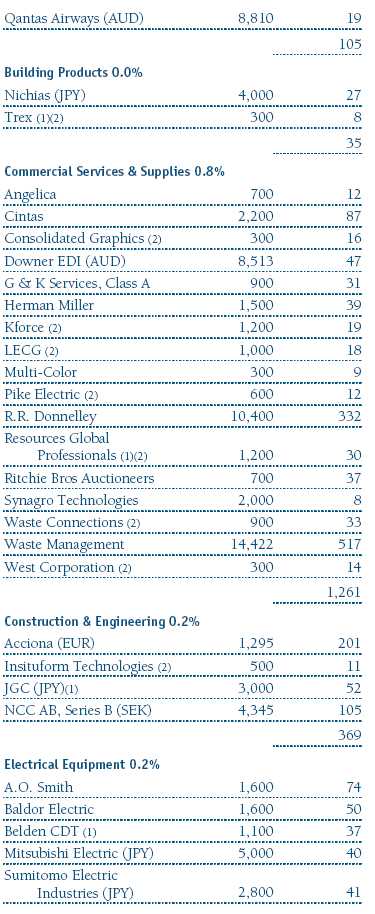
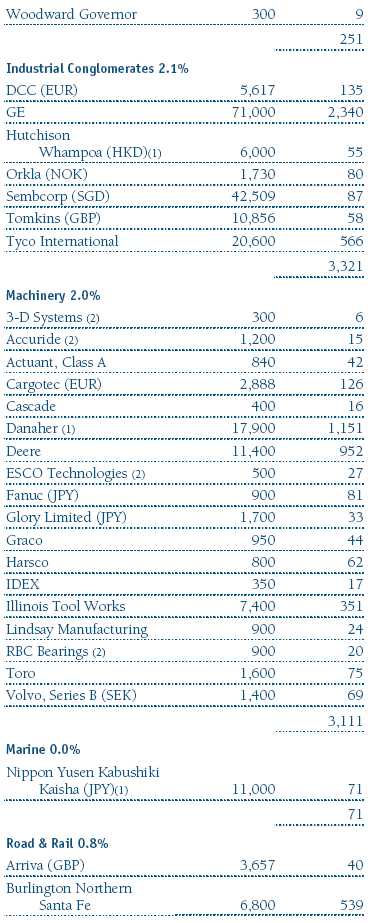
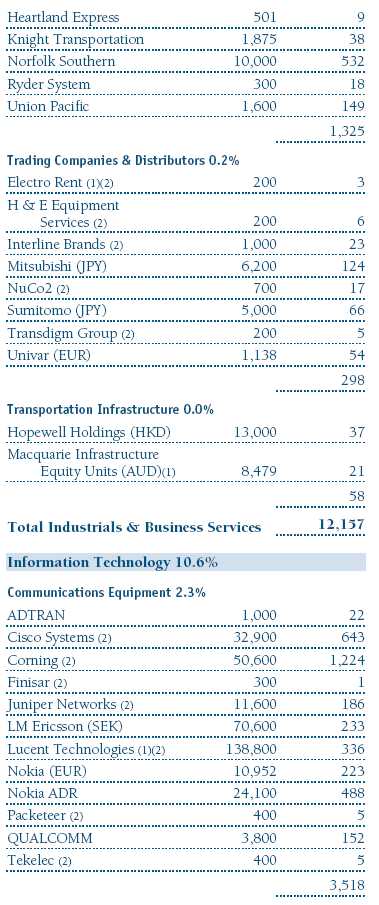
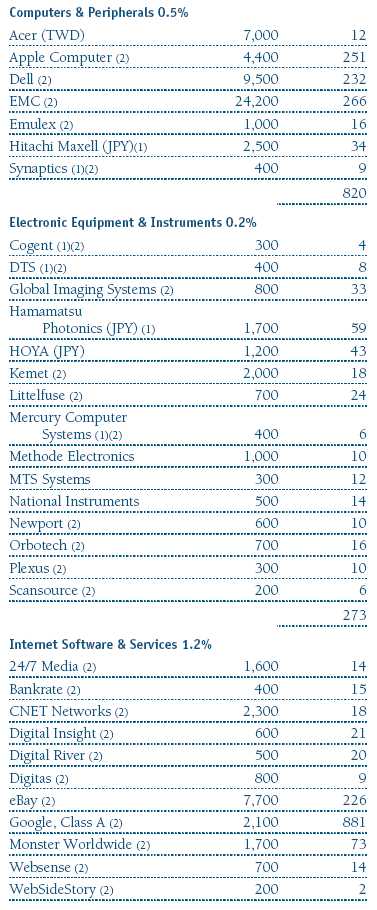
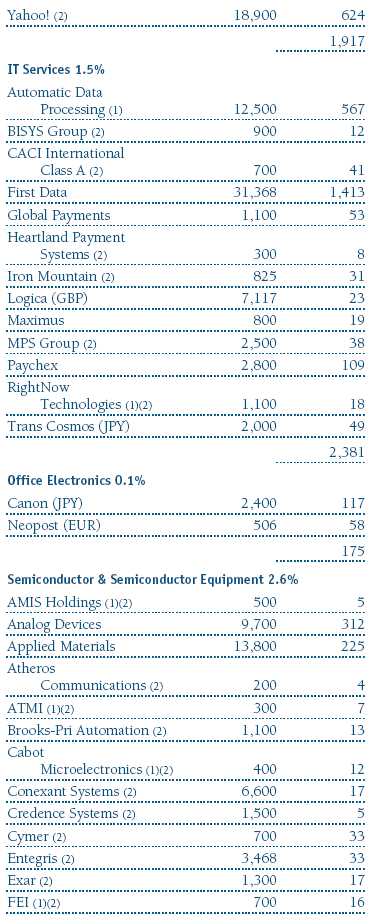
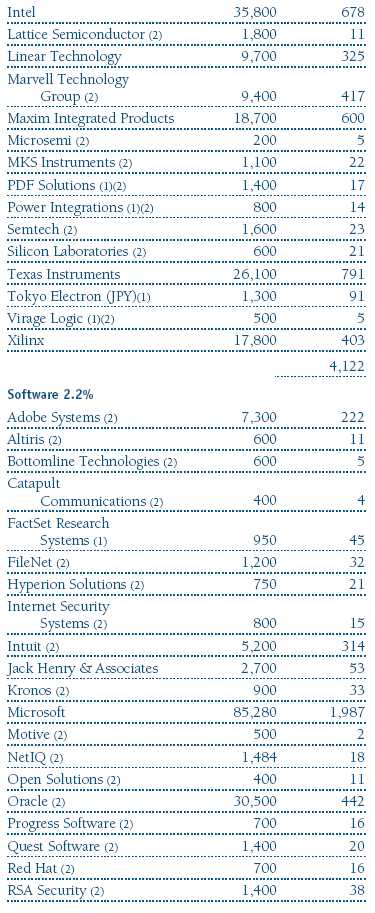
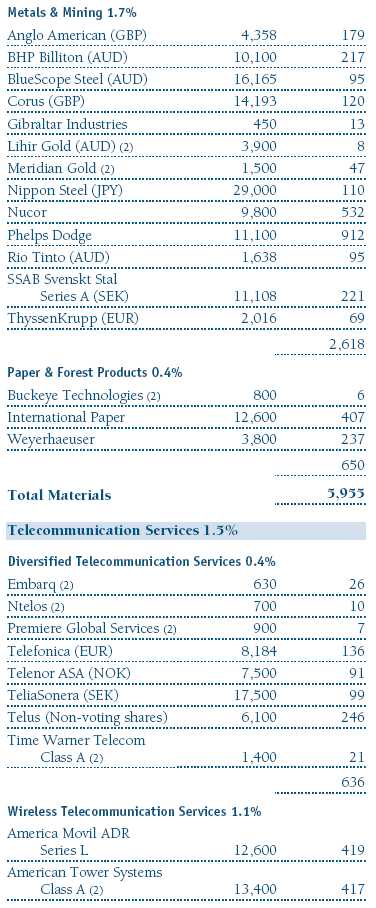
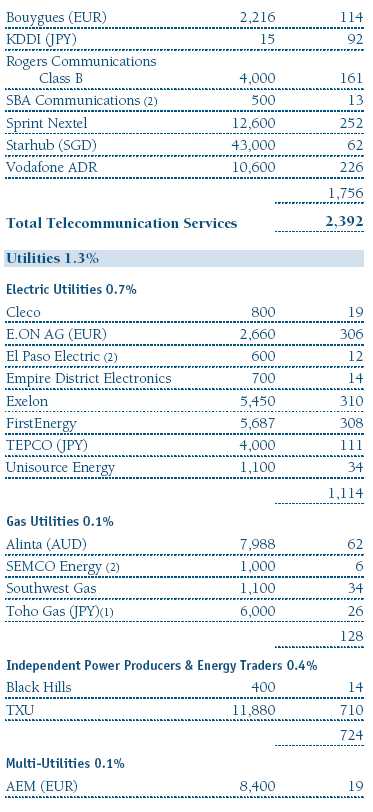
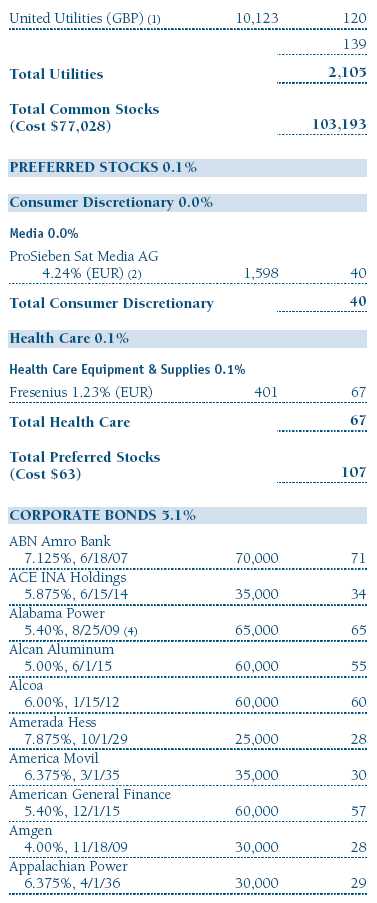
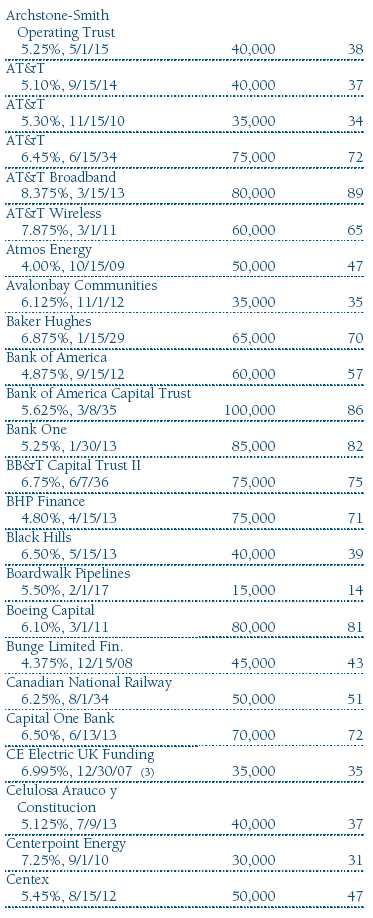
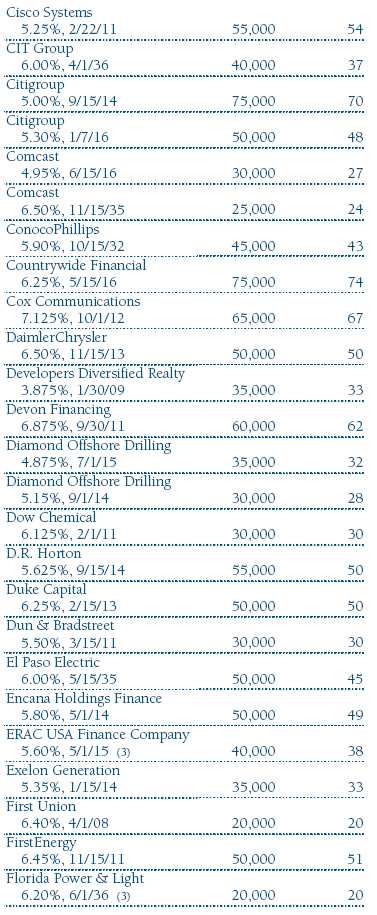
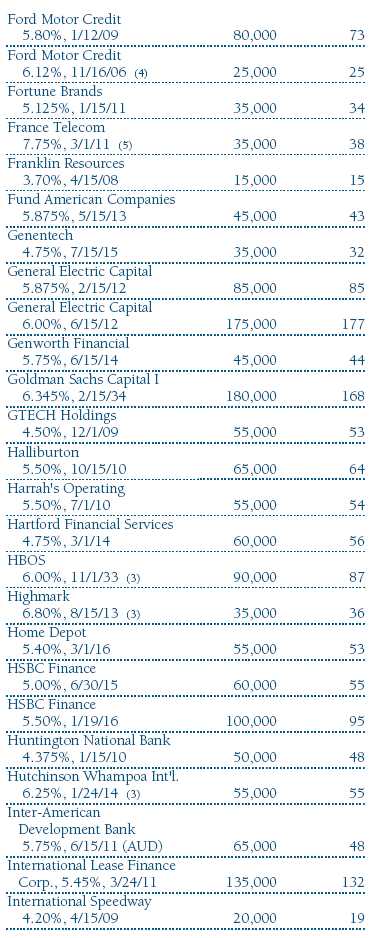
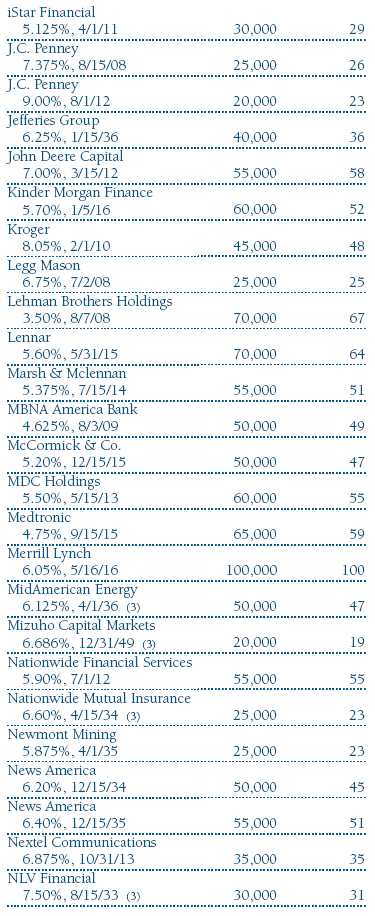
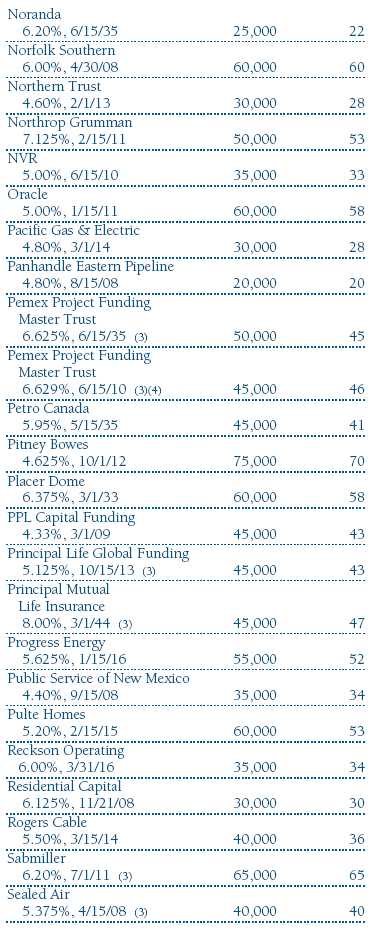
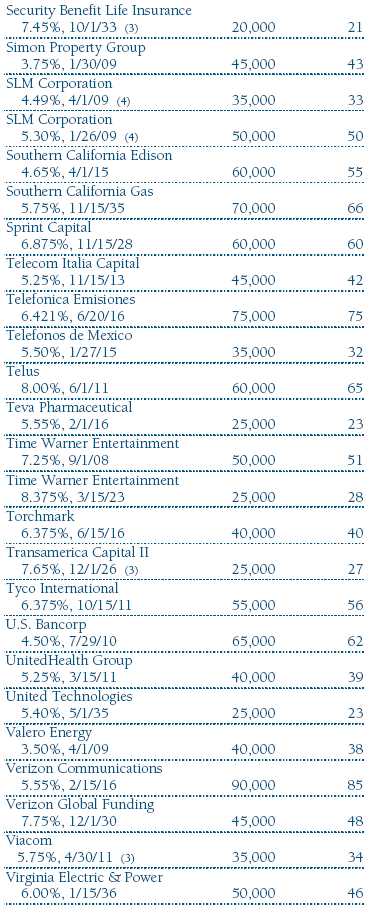
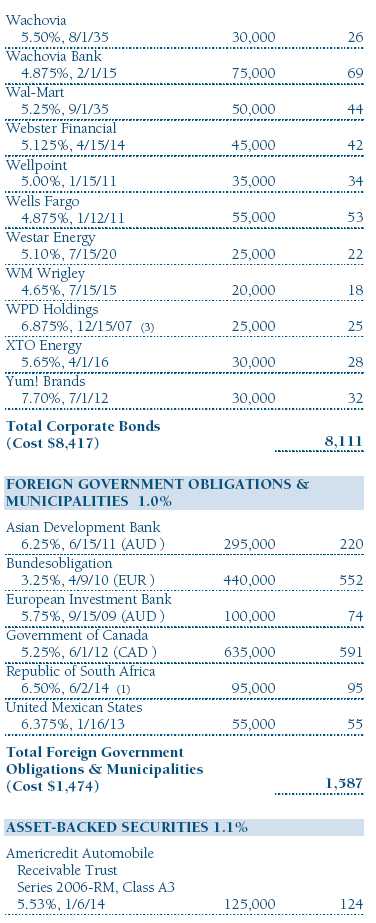
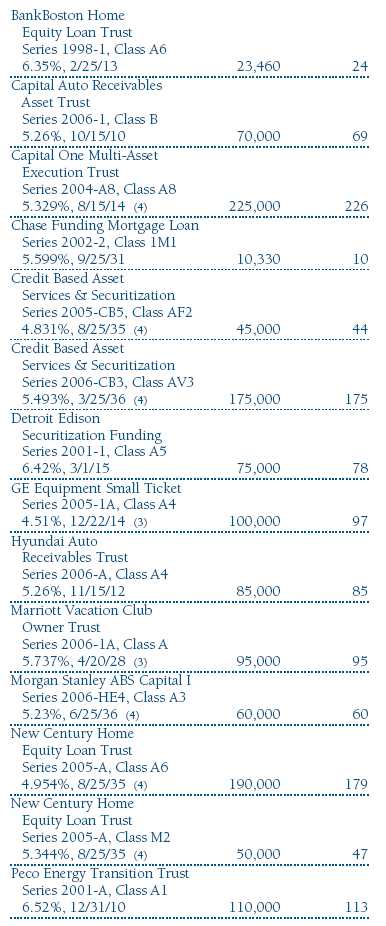
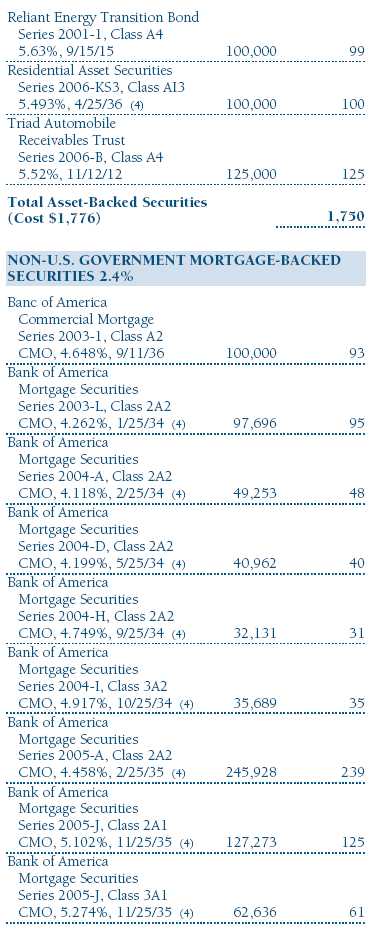
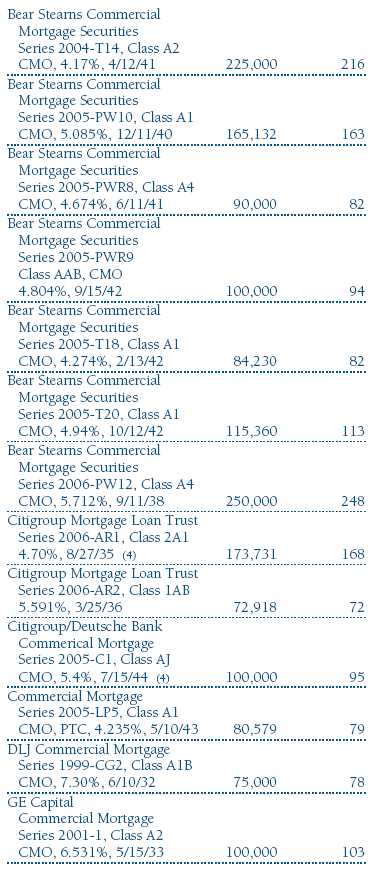
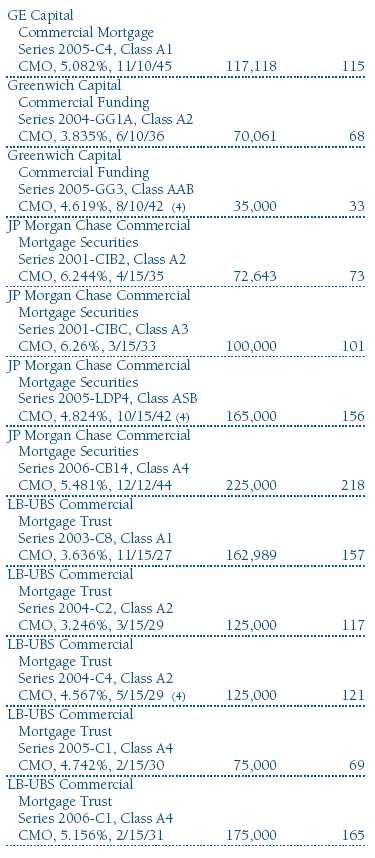
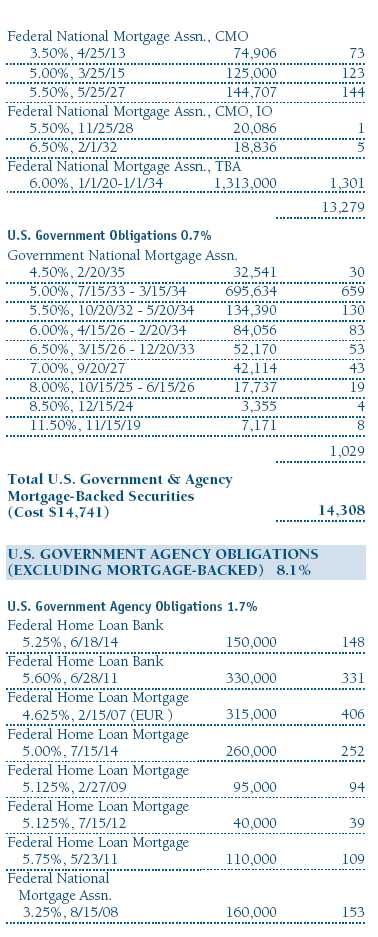
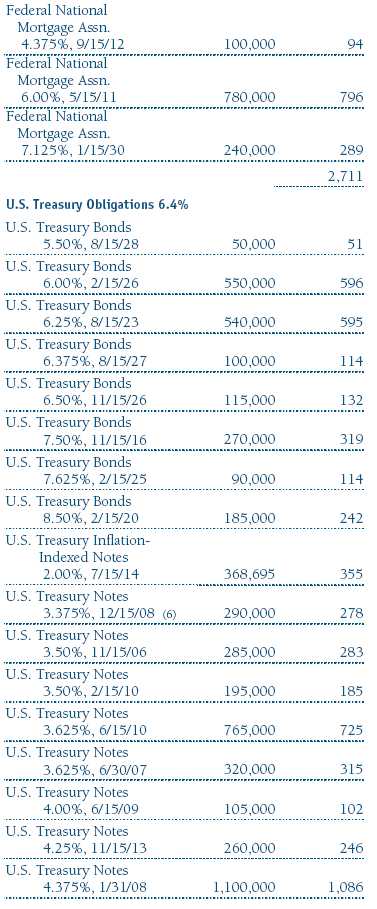
Not applicable. The complete schedule of investments is included in Item 1 of this Form N-CSR.
Not applicable.
Not applicable.
Not applicable.
Not applicable.
(a) The registrant’s principal executive officer and principal financial officer have evaluated the registrant’s disclosure controls and procedures within 90 days of this filing and have concluded that the registrant’s disclosure controls and procedures were effective, as of that date, in ensuring that information required to be disclosed by the registrant in this Form N-CSR was recorded, processed, summarized, and reported timely.
(b) The registrant’s principal executive officer and principal financial officer are aware of no change in the registrant’s internal control over financial reporting that occurred during the registrant’s second fiscal quarter covered by this report that has materially affected, or is reasonably likely to materially affect, the registrant’s internal control over financial reporting.
(a)(1) The registrant’s code of ethics pursuant to Item 2 of Form N-CSR is filed with the registrant’s annual Form N-CSR.
(2) Separate certifications by the registrant's principal executive officer and principal financial officer, pursuant to Section 302 of the Sarbanes-Oxley Act of 2002 and required by Rule 30a-2(a) under the Investment Company Act of 1940, are attached.
(3) Written solicitation to repurchase securities issued by closed-end companies: not applicable.
(b) A certification by the registrant's principal executive officer and principal financial officer, pursuant to Section 906 of the Sarbanes-Oxley Act of 2002 and required by Rule 30a-2(b) under the Investment Company Act of 1940, is attached.