UNITED STATES
SECURITIES AND EXCHANGE COMMISSION
Washington, D.C. 20549
FORM N-CSR
CERTIFIED SHAREHOLDER REPORT OF REGISTERED
MANAGEMENT INVESTMENT COMPANIES
Investment Company Act File Number: 811-07143
| T. Rowe Price Equity Series, Inc. |
|
| (Exact name of registrant as specified in charter) |
| |
| 100 East Pratt Street, Baltimore, MD 21202 |
|
| (Address of principal executive offices) |
| |
| David Oestreicher |
| 100 East Pratt Street, Baltimore, MD 21202 |
|
| (Name and address of agent for service) |
Registrant’s telephone number, including area code: (410) 345-2000
Date of fiscal year end: December 31
Date of reporting period: June 30, 2013
Item 1. Report to Shareholders
| Mid-Cap Growth Portfolio | June 30, 2013 |
- Mid-cap growth stocks posted strong gains and modestly outpaced the overall market in the first half of 2013.
- The Mid-Cap Growth Portfolio outperformed its peer group and benchmarks in the period.
- We enjoyed good returns from a number of sectors, with consumer discretionary and health care holdings contributing the most to results; our small allocation to the materials sector was the sole segment to detract from returns.
- We believe our focus on responsibly managed and durable growth companies positions the fund well for an era of higher interest rates once the Federal Reserve switches course.
The views and opinions in this report were current as of June 30, 2013. They are not guarantees of performance or investment results and should not be taken as investment advice. Investment decisions reflect a variety of factors, and the managers reserve the right to change their views about individual stocks, sectors, and the markets at any time. As a result, the views expressed should not be relied upon as a forecast of the fund’s future investment intent. The report is certified under the Sarbanes-Oxley Act, which requires mutual funds and other public companies to affirm that, to the best of their knowledge, the information in their financial reports is fairly and accurately stated in all material respects.
Manager’s Letter
T. Rowe Price Mid-Cap Growth Portfolio
Dear Investor
A small stumble in June kept the market from posting six straight months of gains in the first half of 2013, a very encouraging performance against a backdrop of a slow-growth economy and modest corporate profit gains. Mid-cap growth stocks outperformed the overall market, and we are pleased to report that our portfolio did a bit better still. As we discuss below, however, we always have an eye on trends that appear to be unsustainable, whether in the context of individual stocks or the overall economy. We are keeping a particularly close eye on the Federal Reserve’s ballooning balance sheet, which has been deployed to keep long-term interest rates artificially low. When its bond purchases stop growing, as they eventually must, rising interest rates threaten to remove one prop from the bull market and send investors scrambling. Our mission is to find companies that are poised to prosper in a normalized interest rate environment and in an economy that grows slowly on its own.
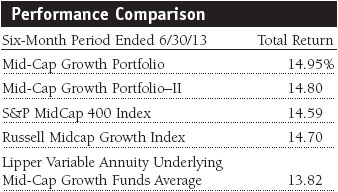
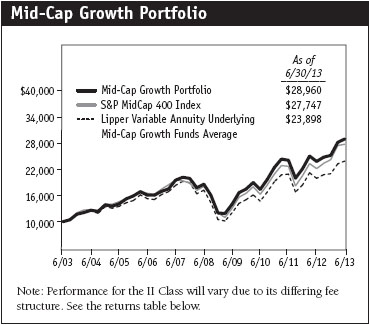
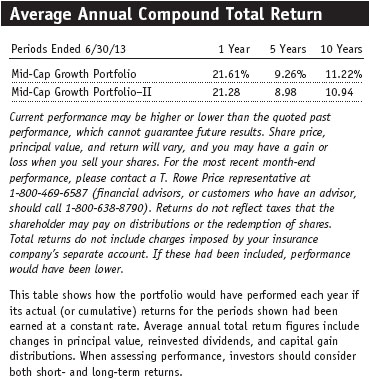
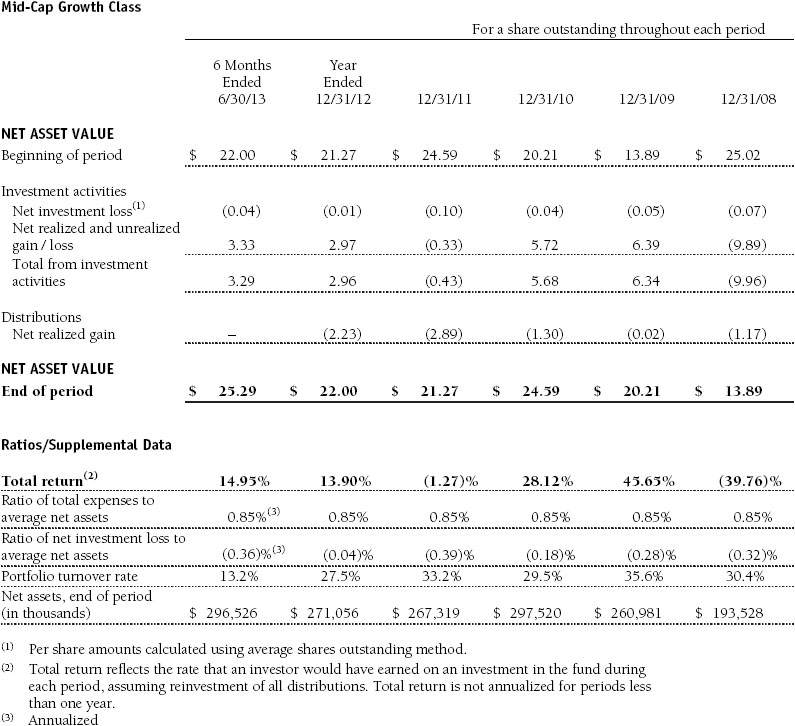
The Mid-Cap Growth Portfolio returned 14.95% in the six months ended June 30, 2013; the Mid-Cap Growth Portfolio–II returned 14.80% over the same period. Our portfolio modestly outperformed both its Russell and S&P indexes in the period, as well as its Lipper peer group. The portfolio remained favorably ranked relative to its competitors over all time periods. (Based on cumulative total return, Lipper ranked the Mid-Cap Growth Portfolio 39 of 120, 29 of 117, 13 of 104, and 11 of 82 funds in the variable annuity underlying mid-cap growth funds category for the 1-, 3-, 5-, and 10-year periods ended June 30, 2013, respectively. Lipper ranked the Mid-Cap Growth Portfolio–II 49 of 120, 46 of 117, 20 of 104, and 18 of 82 funds in the variable annuity underlying mid-cap growth funds category for the 1-, 3-, 5-, and 10-year periods ended June 30, 2013, respectively. Past performance cannot guarantee future results.) Please note that in future communications, we will not refer to the S&P MidCap 400 Index, which does not reflect the performance of our growth-oriented investment universe as well as the Russell and Lipper indexes.
In the first half of 2013, stocks continued the impressive rally they began last fall, building, in turn, on the bull market that has continued mostly unabated since the depths of the financial crisis. By late May, the surge took the Russell Midcap Growth Index up by over 27% from its lows six months earlier, sending the index further into record territory. At its highs in May, the index had more than tripled off the bear market bottom it established only four years ago.
Though the duration and magnitude of the current bull market are now about average for the postwar period, the advance in recent months generally reflected fundamentals: The U.S. economy continues to heal; the federal government budget deficit is shrinking at a rapid pace, in spite of Washington’s gridlock; state budgets are growing again; consumer balance sheets are improving; housing prices are recovering; the country is becoming more energy self-sufficient by the day; and evidence of the manufacturing renaissance we have discussed in many of our letters over the past few years is becoming more abundant. Equally, if not more important, stocks remain a compelling alternative to bonds, which yield very little, and cash, which offers almost no yield at all. Even after further gains, stocks remained reasonably valued overall relative to historical norms, even when adjusting for a more normalized interest rate environment.
To be sure, the interest rate setting was far from normal in the past six months. The Federal Reserve continued to put downward pressure on long-term interest rates through its massive monthly purchases of long-term agency mortgage-backed securities and Treasury bonds, a program popularly known as “QE3.” While part of the Fed’s intention was to keep lending rates low for businesses and consumers—and record-low mortgage rates appeared to have helped establish the rebound in the housing sector—the program has forced investors looking for yield into riskier assets, including equities. Indeed, typically defensive and high-yielding utilities and consumer staples stocks outperformed the broader market in early 2013 as many investors who might otherwise have purchased bonds sought alternatives to record-low nominal yields.
To us and many others, the Fed’s plan to stimulate the economy by manipulating asset prices and encouraging risk taking seems ill-advised and increasingly ineffective. If 0% short-term interest rates are the equivalent of “spiking the punch bowl,” to borrow a metaphor from a former Fed official, then manipulating the yield on the 10-year Treasury note below the rate of inflation seems akin to adding a powerful hallucinogenic to the mix. The Fed’s policy has distorted markets by encouraging excessive risk taking by banks and institutions such as pension funds. Moreover, this is a particularly bitter potion to some constituencies, such as retirees, who need to earn income from low-risk investments.
Nevertheless, the party on Wall Street rumbled on, with a modest interruption toward the end of the first half. On June 19, Fed Chairman Ben Bernanke announced that risks to the economy had diminished since the inception of the QE3 program last fall, and, therefore, the Fed might begin to reduce asset purchases in the coming months should the recovery remain on track. Though this seemed like a benign statement of the obvious, it set off a brief rout in the equity and bond markets, both in the U.S. and overseas. Fed officials quickly sought to calm fears that higher rates were imminent, and markets recovered to end the period just below the highs they had established in mid-May. Nevertheless, the market’s brief tantrum portends volatility ahead when the Fed finally does begin to move toward more normalized credit conditions.

Mid-cap growth shares underperformed their value counterparts over the past six months and lagged substantially over the past year; we view growth as more attractive than value at this juncture. Mid-cap valuations are generally in line with historical averages, with only isolated indications of “frothiness” in the investment universe. However, large-cap growth shares, after underperforming over much of the past decade, appear somewhat cheaper and more compelling.
Portfolio Review
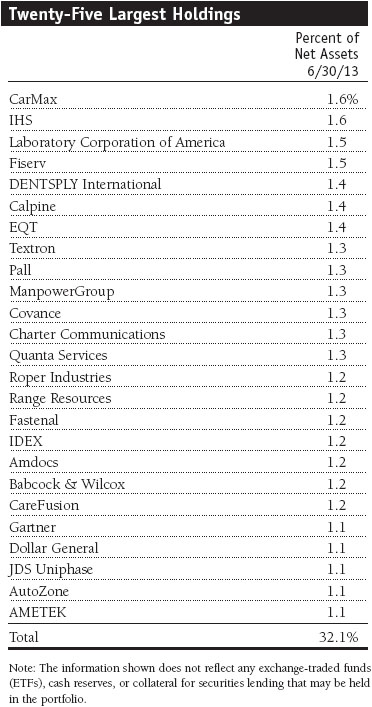
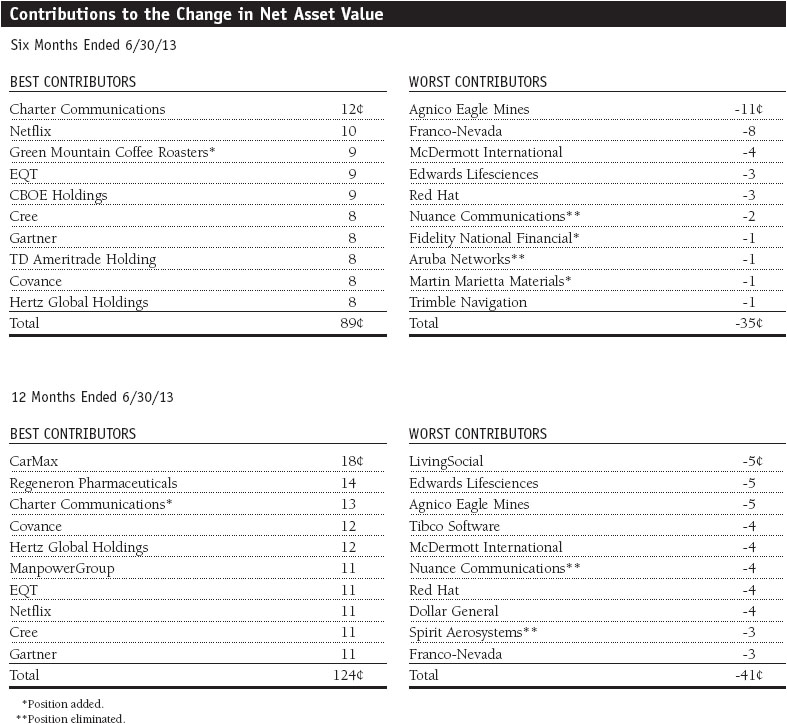
In past letters, we have described our wariness toward consumer discretionary stocks, as household debt burdens, though improved, remain high. At least in the short term, it has been a mistake to be so cautious, but the sector has delivered good results for the portfolio nonetheless. One of our top consumer performers was video streaming and DVD rental provider Netflix. The company has had more than its share of ups and downs in recent years, and we took advantage of a period of extreme investor skepticism to buy the shares in late 2011. Netflix was the top performer in the S&P 500 early in 2013 as the company reported healthy subscriber growth; its initial foray into original programming was a critical success; and investors concluded that the industry pioneer was destined to maintain its dominant lead in online entertainment. An even bigger contributor to the portfolio was cable operator Charter Communications. The stock benefited from an investment by John Malone’s Liberty Media, which provided a stamp of approval from the industry’s most legendary investor and attested to the quality of Charter’s management team, which has led an impressive turnaround at the company. (Please refer to the portfolio of investments for a complete list of our holdings and the amount each represents in the portfolio.)
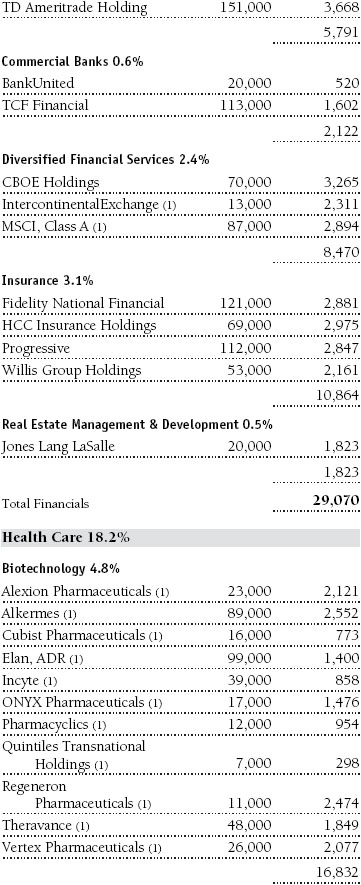
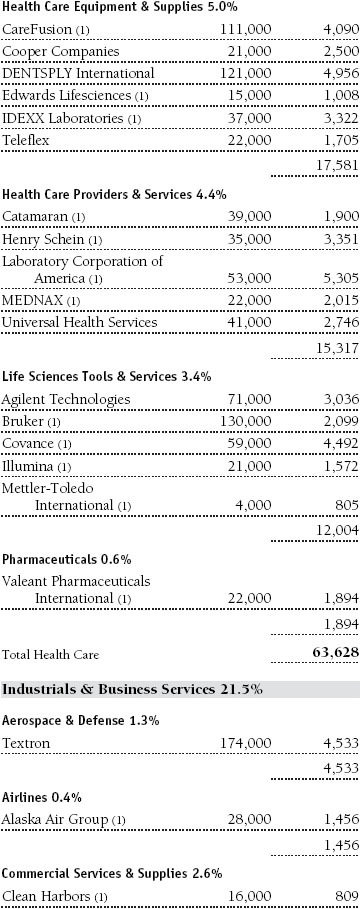
Health care is another key focus of our portfolio and also contributed significantly to results, thanks in large part to several biotechnology holdings. One of our leading contributors was a new position in Vertex Pharmaceuticals, a biotechnology company that announced exciting clinical data for its new cystic fibrosis drug. Health care providers and medical technology firms also offer good growth opportunities. Covance, a global provider of drug development services, performed well thanks to growing sales of late-stage drug development, such as conducting lab tests for clinical trials. A notable detractor in the period was device maker Edwards Lifesciences. The company experienced poor uptake in the U.S. market of its minimally invasive heart valve product, and investors worried about competition on the horizon.
Technology shares lagged the overall market, but our holdings in the sector performed substantially better and contributed solidly to our results. Akamai Technologies exceeded market expectations, reporting robust growth in its content distribution business. The company’s platform enables enterprises to provide secure and sophisticated content to any device in any location. On-demand travel and expense software provider Concur Technologies also contributed to our performance. The company continues to innovate and is pioneering a more efficient business travel “ecosystem” with its mobile platform and tools that provide location-based, real-time services. We eliminated voice recognition software firm Nuance Communications. We believe voice recognition will be one of the key growth technologies of the coming decade, but we were discouraged by Nuance’s unfocused investment in too many areas, its high level of debt, and its poor corporate governance. Technology services firm Gartner was one of our leading contributors, but we trimmed our large holding in the belief that its valuation was a tad rich.
Financials is a relatively small part of the portfolio, but two holdings contributed strong performances, while one notably detracted. Options and futures exchange operator CBOE Holdings reported solid quarterly earnings growth driven by cost controls and, more importantly, increased volumes in proprietary volatility and option products. TD Ameritrade Holding, a leading discount broker, continued to gain market share and provided investors a glimpse of how its earnings might grow in a rising interest rate environment. In retrospect, we purchased title insurer Fidelity National Financial a little too soon, as investors have punished the stock over worries over rising interest rates and falling mortgage refinance volumes. We believe a healthier new home purchase market will eventually more than offset the imminent decline in refinancings for this industry leader. This is an excellent example of a situation where we are willing to ride through a few quarters of volatility while we wait for what we believe will be a handsome payoff for a strong business in two to three years. While many investors are focused on the short term, we believe our willingness to evaluate businesses based on where we think they will be several years hence has been a key component in the long-term success of our portfolio.
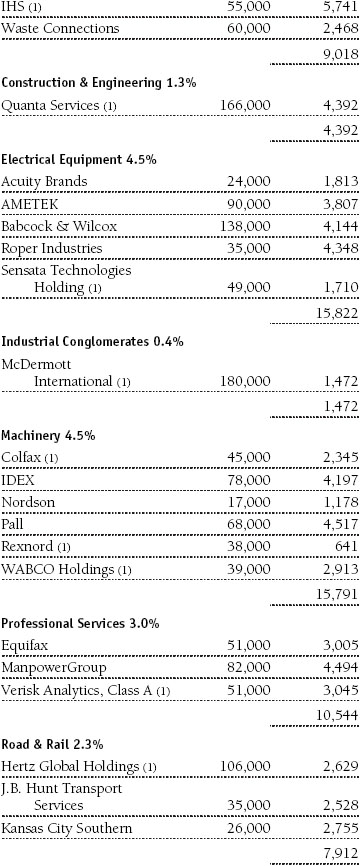
Industrials remain a key focus for the portfolio, but we have recently modestly trimmed our exposure in an effort to moderate some of the cyclicality within the portfolio. Somewhat unusually for us, only one industrial stock cracked the list of our top 10 contributors over the past six months, but we enjoyed solid results from a number of holdings. Conversely, one of our leading detractors was McDermott International, a global engineering and construction firm focused on the offshore oil and natural gas industry. In recent months, the firm has executed poorly on several projects that resulted in charges to earnings. During the period, we initiated a position in Nordson, a leading manufacturer of adhesive and coating equipment for electronics and industrials markets, and we eliminated machinery firm Gardner Denver, which was purchased by private-equity firm KKR.
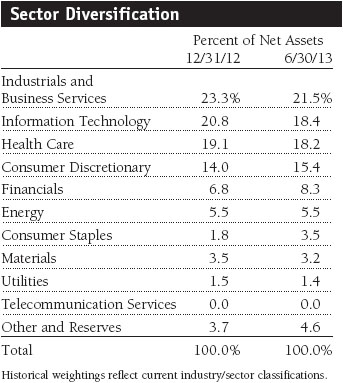
Materials holdings were the sole segment to weigh on results in the period. Gold prices plunged as investors became more secure in global economic prospects and long-term bond yields became somewhat more attractive. This took a heavy toll on our gold-related holdings Franco-Nevada and Agnico Eagle Mines. Energy holdings fared somewhat better over the past six months after being a drag on performance in 2012. In fact, EQT was one of our leading contributors after reporting impressive production growth in its wells in the Marcellus shale field in Pennsylvania and West Virginia. Our energy analysts believe the Permian Basin in West Texas holds greater potential for long-lived, low-cost horizontal oil inventory than any other area in the United States, and we recently added Concho Resources, a well-placed producer in that region, to our portfolio.
Investment Strategy and Outlook
In past letters, we have described what distinguishes our style of valuation-conscious growth investing from a “momentum” approach. Momentum growth investors seek companies that demonstrate high and accelerating growth rates. While this investing philosophy is sometimes practiced by simply extrapolating past gains into future ones, momentum investing can be better justified on the basis that stellar profit growth is symptomatic of some special advantage—perhaps a revolutionary technology or a booming new market—that will persist into the future.
The mid-cap growth sector is a prime hunting ground for momentum chasers, and we are presented with these investment opportunities on a regular basis. We are often visited by company managements that have achieved extraordinary results for a few quarters or even several years. Advocates of these companies tend to argue that their high valuations are justified by their high growth rates. These companies dominated the technology investment landscape in the late 1990s, but they continue to pop up today in industries as divergent as cloud-based software and high-end retailing.
The key, of course, is the persistency or duration of their high levels of growth. Some companies really do continue to grow at extraordinary rates for years and years, but they are rare. In the vast majority of cases, these hyper-growth companies will downshift over time as their markets attract other entrants, competitive advantages fade, they make a small misstep, or their growth simply degrades as they battle the law of large numbers—trees don’t grow to the sky, as the saying goes, and neither do profits. When growth does slow, the consequences to their highflying valuations can be severe. Even a small earnings or revenue miss can send a stock sharply lower, and yesterday’s market darling can be transformed into a has-been. The best way for a momentum investor to profit is to get out just before the momentum slows—a trick few manage with any consistency.
Our investment approach is very different. Our goal is to own companies for several years—we have owned a few for a decade or more—a period that will include some setbacks. On a broader level, it is also a strategy predicated on the knowledge that economic growth will slow or turn negative and weigh on profits for even the best firms at times.
With the global economy continuing a multiyear recovery from the financial crisis, it seems unlikely that many companies will be able to grow profits at very high rates in the coming years, even if economic activity picks up. Given that revenue growth is likely to remain subdued, and with fewer cost-cutting options available to companies to boost the bottom line, we are devoting increasing attention to how companies allocate their capital. Shareholder-friendly policies can be an important way for companies to improve their returns on capital. While heavily focused on dividends in recent months, investors have generally been less attuned to the important role of well-timed stock buybacks, in particular. The massive amount of cash on companies’ books suggests ample room for incremental buybacks should stock prices pull back again in the coming months.
More generally, we believe our focus on investing in strong and steady firms has positioned the portfolio for an era of higher interest rates and less stimulus-reliant growth—an environment that will reward companies with responsible managements and real competitive advantages. To be sure, weaning the markets off of Fed stimulus will be difficult, and we would not be surprised to see further “taper tantrums” such as markets experienced in June. On balance, however, we are optimistic that the real economy will remain on track and continue to create opportunities for long-term investors.
Respectfully submitted,

Brian W.H. Berghuis
Chairman of the portfolio’s Investment Advisory Committee

John F. Wakeman
Executive vice president of the portfolio
July 23, 2013
The committee chairman has day-to-day responsibility for managing the portfolio and works with committee members in developing and executing the portfolio’s investment program.
As with all stock and bond mutual funds, the fund’s share price can fall because of weakness in the stock or bond markets, a particular industry, or specific holdings. The financial markets can decline for many reasons, including adverse political or economic developments, changes in investor psychology, or heavy institutional selling. The prospects for an industry or company may deteriorate because of a variety of factors, including disappointing earnings or changes in the competitive environment. In addition, the investment manager’s assessment of companies held in a fund may prove incorrect, resulting in losses or poor performance even in rising markets. The stocks of mid-cap companies entail greater risk and are usually more volatile than the shares of larger companies. In addition, growth stocks can be volatile for several reasons. Since they usually reinvest a high proportion of earnings in their own businesses, they may lack the dividends usually associated with value stocks that can cushion their decline in a falling market. Also, since investors buy these stocks because of their expected superior earnings growth, earnings disappointments often result in sharp price declines.
Lipper averages: The averages of available mutual fund performance returns for specified time periods in categories defined by Lipper Inc.
Russell Midcap Growth Index: An unmanaged index that measures the performance of those Russell Midcap companies with higher price-to-book ratios and higher forecast growth values.
Russell Midcap Value Index: An unmanaged index that measures the performance of those Russell Midcap companies with lower price-to-book ratios and lower forecast growth values.
S&P 500 Index: An unmanaged index that tracks the stocks of 500 primarily large-cap U.S. companies.
S&P MidCap 400 Index: An unmanaged index that tracks the stocks of 400 U.S. mid-cap companies.
Note: Russell Investment Group is the source and owner of the trademarks, service marks, and copyrights related to the Russell indexes. Russell® is a trademark of Russell Investment Group.
Portfolio Highlights
Performance and Expenses
T. Rowe Price Mid-Cap Growth Portfolio
This chart shows the value of a hypothetical $10,000 investment in the portfolio over the past 10 fiscal year periods or since inception (for portfolios lacking 10-year records). The result is compared with benchmarks, which may include a broad-based market index and a peer group average or index. Market indexes do not include expenses, which are deducted from portfolio returns as well as mutual fund averages and indexes.
Fund Expense Example
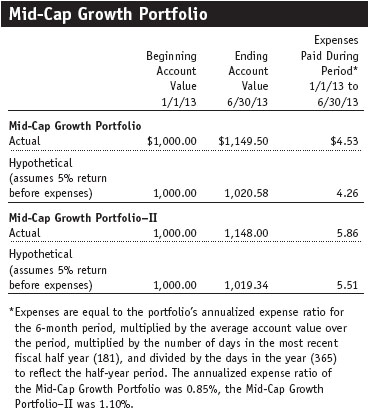
As a mutual fund shareholder, you may incur two types of costs: (1) transaction costs, such as redemption fees or sales loads, and (2) ongoing costs, including management fees, distribution and service (12b-1) fees, and other fund expenses. The following example is intended to help you understand your ongoing costs (in dollars) of investing in the fund and to compare these costs with the ongoing costs of investing in other mutual funds. The example is based on an investment of $1,000 invested at the beginning of the most recent six-month period and held for the entire period.
Shares of the fund are currently offered only through certain insurance companies as an investment medium for both variable annuity contracts and variable life insurance policies. Please note that the fund has two classes of shares: the original share class and II Class. II Class shares are sold through financial intermediaries, which are compensated for distribution, shareholder servicing, and/or certain administrative services under a Board-approved Rule 12b-1 plan.
Actual Expenses
The first line of the following table (Actual) provides information about actual account values and actual expenses. You may use the information on this line, together with your account balance, to estimate the expenses that you paid over the period. Simply divide your account value by $1,000 (for example, an $8,600 account value divided by $1,000 = 8.6), then multiply the result by the number on the first line under the heading “Expenses Paid During Period” to estimate the expenses you paid on your account during this period.
Hypothetical Example for Comparison Purposes
The information on the second line of the table (Hypothetical) is based on hypothetical account values and expenses derived from the fund’s actual expense ratio and an assumed 5% per year rate of return before expenses (not the fund’s actual return). You may compare the ongoing costs of investing in the fund with other funds by contrasting this 5% hypothetical example and the 5% hypothetical examples that appear in the shareholder reports of the other funds. The hypothetical account values and expenses may not be used to estimate the actual ending account balance or expenses you paid for the period.
You should also be aware that the expenses shown in the table highlight only your ongoing costs and do not reflect any transaction costs, such as redemption fees or sales loads. Therefore, the second line of the table is useful in comparing ongoing costs only and will not help you determine the relative total costs of owning different funds. To the extent a fund charges transaction costs, however, the total cost of owning that fund is higher.
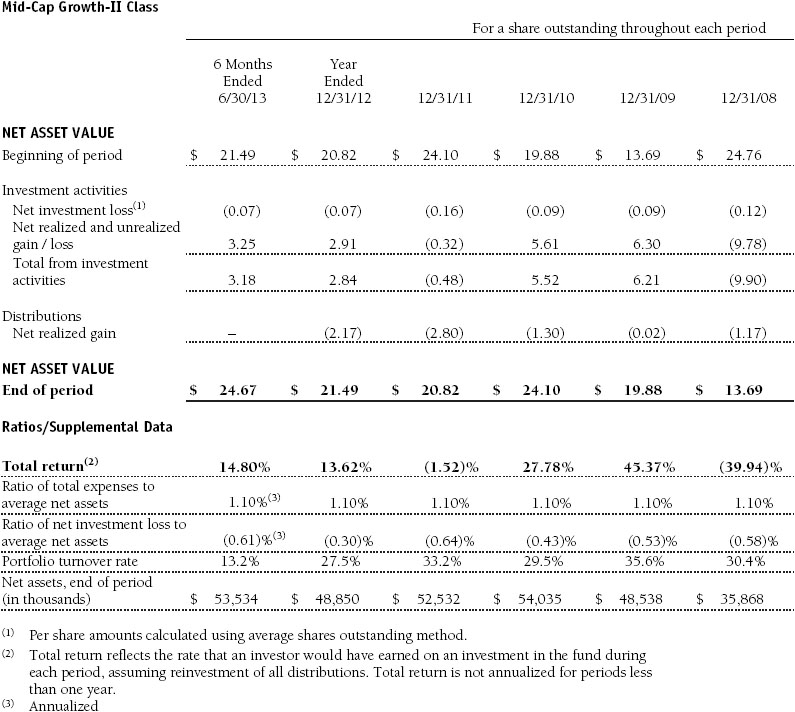
Financial Highlights
T. Rowe Price Mid-Cap Growth Portfolio
(Unaudited)
The accompanying notes are an integral part of these financial statements.
Financial Highlights
T. Rowe Price Mid-Cap Growth Portfolio
(Unaudited)
The accompanying notes are an integral part of these financial statements.
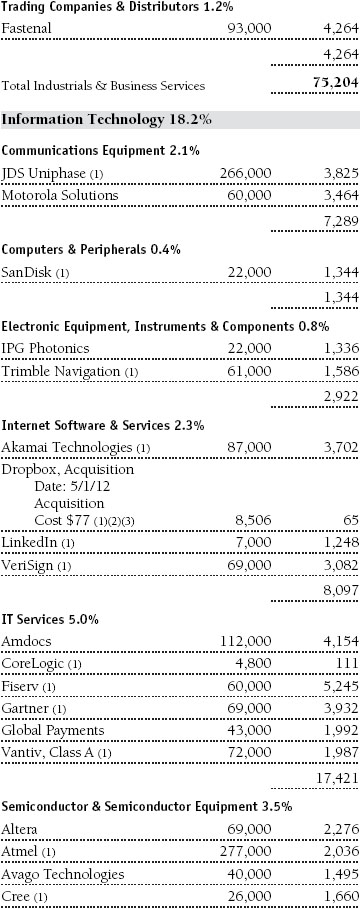
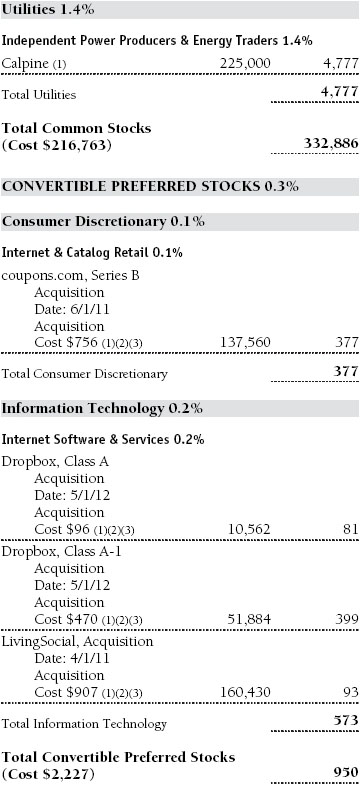
Portfolio of Investments‡
T. Rowe Price Mid-Cap Growth Portfolio
June 30, 2013 (Unaudited)


The accompanying notes are an integral part of these financial statements.
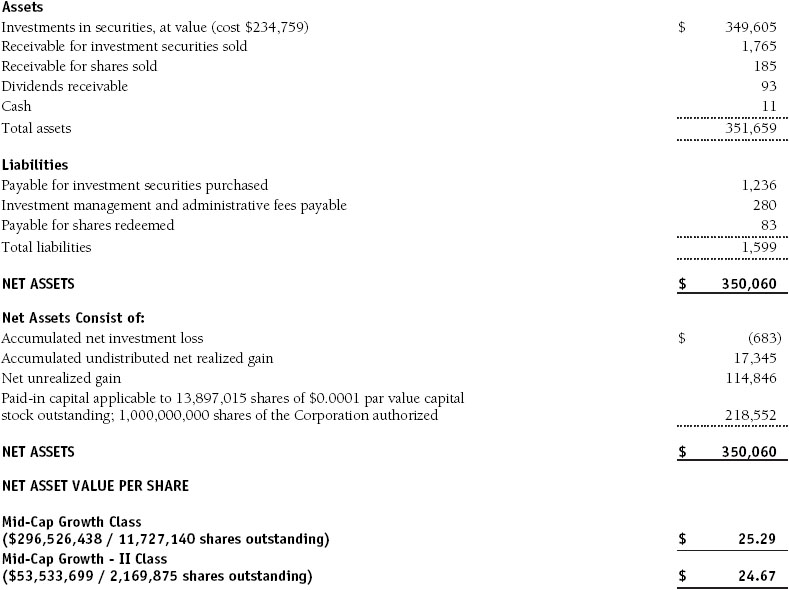
Statement of Assets and Liabilities
T. Rowe Price Mid-Cap Growth Portfolio
June 30, 2013 (Unaudited)
($000s, except shares and per share amounts)
The accompanying notes are an integral part of these financial statements.
Statement of Operations
T. Rowe Price Mid-Cap Growth Portfolio
(Unaudited)
($000s)

The accompanying notes are an integral part of these financial statements.
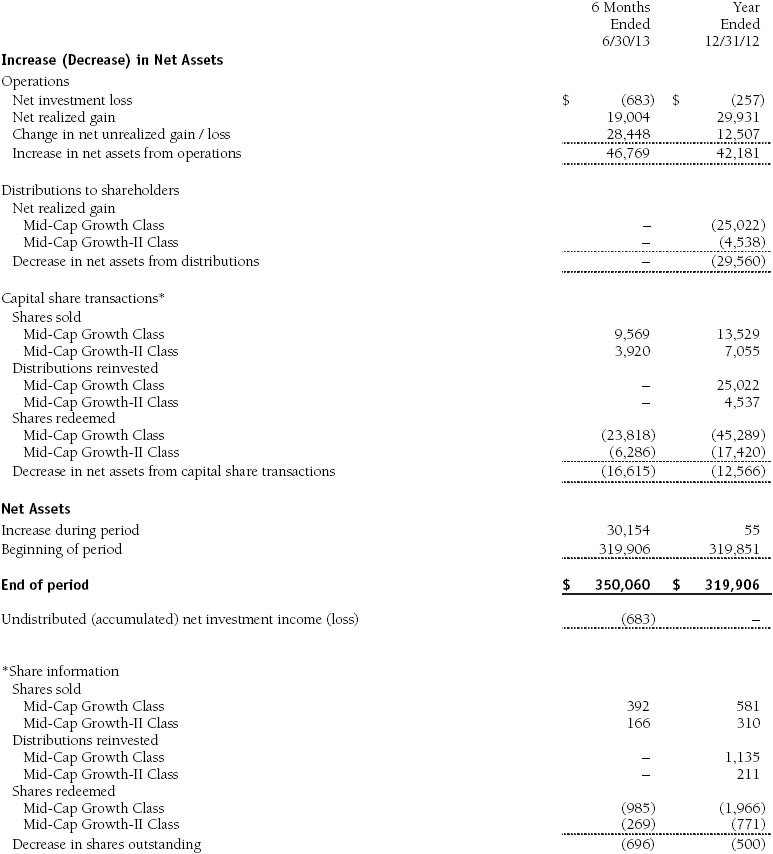
Statement of Changes in Net Assets
T. Rowe Price Mid-Cap Growth Portfolio
(Unaudited)
($000s)
The accompanying notes are an integral part of these financial statements.
Notes to Financial Statements
T. Rowe Price Mid-Cap Growth Portfolio
June 30, 2013 (Unaudited)
T. Rowe Price Equity Series, Inc. (the corporation), is registered under the Investment Company Act of 1940 (the 1940 Act). The Mid-Cap Growth Portfolio (the fund) is a diversified, open-end management investment company established by the corporation. Shares of the fund currently are offered only through certain insurance companies as an investment medium for both variable annuity contracts and variable life insurance policies. The fund seeks to provide long-term capital appreciation by investing in mid-cap stocks with potential for above-average earnings growth. The fund has two classes of shares: the Mid-Cap Growth Portfolio original share class (Mid-Cap Growth Class), offered since December 31, 1996, and the Mid-Cap Growth Portfolio–II (Mid-Cap Growth–II Class), offered since April 30, 2002. Mid-Cap Growth–II Class shares are sold through financial intermediaries, which it compensates for distribution, shareholder servicing, and/or certain administrative services under a Board-approved Rule 12b-1 plan. Each class has exclusive voting rights on matters related solely to that class; separate voting rights on matters that relate to both classes; and, in all other respects, the same rights and obligations as the other class.
NOTE 1 - SIGNIFICANT ACCOUNTING POLICIES
Basis of Preparation The accompanying financial statements were prepared in accordance with accounting principles generally accepted in the United States of America (GAAP), which require the use of estimates made by management. Management believes that estimates and valuations are appropriate; however, actual results may differ from those estimates, and the valuations reflected in the accompanying financial statements may differ from the value ultimately realized upon sale or maturity.
Investment Transactions, Investment Income, and Distributions Income and expenses are recorded on the accrual basis. Dividends received from mutual fund investments are reflected as dividend income; capital gain distributions are reflected as realized gain/loss. Dividend income and capital gain distributions are recorded on the ex-dividend date. Income tax-related interest and penalties, if incurred, would be recorded as income tax expense. Investment transactions are accounted for on the trade date. Realized gains and losses are reported on the identified cost basis. Distributions to shareholders are recorded on the ex-dividend date. Income distributions are declared and paid by each class annually. Capital gain distributions, if any, are generally declared and paid by the fund annually.
Currency Translation Assets, including investments, and liabilities denominated in foreign currencies are translated into U.S. dollar values each day at the prevailing exchange rate, using the mean of the bid and asked prices of such currencies against U.S. dollars as quoted by a major bank. Purchases and sales of securities, income, and expenses are translated into U.S. dollars at the prevailing exchange rate on the date of the transaction. The effect of changes in foreign currency exchange rates on realized and unrealized security gains and losses is reflected as a component of security gains and losses.
Class Accounting Mid-Cap Growth–II pays distribution, shareholder servicing, and/or certain administrative expenses in the form of Rule 12b-1 fees, in an amount not exceeding 0.25% of the class’s average daily net assets. Investment income, investment management and administrative expense, and realized and unrealized gains and losses are allocated to the classes based upon the relative daily net assets of each class.
Rebates Subject to best execution, the fund may direct certain security trades to brokers who have agreed to rebate a portion of the related brokerage commission to the fund in cash. Commission rebates are reflected as realized gain on securities in the accompanying financial statements and totaled $5,000 for the six months ended June 30, 2013.
Credits Credits are earned on the fund’s temporarily uninvested cash balances held at the custodian and such credits reduce the amount paid by the manager for custody of the fund’s assets. In order to pass the benefit of custody credits to the fund, the manager has voluntarily reduced its investment management and administrative expense in the accompanying financial statements.
New Accounting Guidance In December 2011, the Financial Accounting Standards Board issued amended guidance requiring an entity to disclose information about offsetting and related arrangements to enable users of its financial statements to understand the effect of those arrangements on its financial position. The guidance is effective for fiscal years and interim periods beginning on or after January 1, 2013. Adoption had no effect on the fund’s net assets or results of operations.
NOTE 2 - VALUATION
The fund’s financial instruments are valued and each class’s net asset value (NAV) per share is computed at the close of the New York Stock Exchange (NYSE), normally 4 p.m. ET, each day the NYSE is open for business.
Fair Value The fund’s financial instruments are reported at fair value, which GAAP defines as the price that would be received to sell an asset or paid to transfer a liability in an orderly transaction between market participants at the measurement date. The T. Rowe Price Valuation Committee (the Valuation Committee) has been established by the fund’s Board of Directors (the Board) to ensure that financial instruments are appropriately priced at fair value in accordance with GAAP and the 1940 Act. Subject to oversight by the Board, the Valuation Committee develops and oversees pricing-related policies and procedures and approves all fair value determinations. Specifically, the Valuation Committee establishes procedures to value securities; determines pricing techniques, sources, and persons eligible to effect fair value pricing actions; oversees the selection, services, and performance of pricing vendors; oversees valuation-related business continuity practices; and provides guidance on internal controls and valuation-related matters. The Valuation Committee reports to the fund’s Board; is chaired by the fund’s treasurer; and has representation from legal, portfolio management and trading, operations, and risk management.
Various valuation techniques and inputs are used to determine the fair value of financial instruments. GAAP establishes the following fair value hierarchy that categorizes the inputs used to measure fair value:
Level 1 – quoted prices (unadjusted) in active markets for identical financial instruments that the fund can access at the reporting date
Level 2 – inputs other than Level 1 quoted prices that are observable, either directly or indirectly (including, but not limited to, quoted prices for similar financial instruments in active markets, quoted prices for identical or similar financial instruments in inactive markets, interest rates and yield curves, implied volatilities, and credit spreads)
Level 3 – unobservable inputs
Observable inputs are developed using market data, such as publicly available information about actual events or transactions, and reflect the assumptions that market participants would use to price the financial instrument. Unobservable inputs are those for which market data are not available and are developed using the best information available about the assumptions that market participants would use to price the financial instrument. GAAP requires valuation techniques to maximize the use of relevant observable inputs and minimize the use of unobservable inputs. When multiple inputs are used to derive fair value, the financial instrument is assigned to the level within the fair value hierarchy based on the lowest-level input that is significant to the fair value of the financial instrument. Input levels are not necessarily an indication of the risk or liquidity associated with financial instruments at that level but rather the degree of judgment used in determining those values.
Valuation Techniques Equity securities listed or regularly traded on a securities exchange or in the over-the-counter (OTC) market are valued at the last quoted sale price or, for certain markets, the official closing price at the time the valuations are made. OTC Bulletin Board securities are valued at the mean of the closing bid and asked prices. A security that is listed or traded on more than one exchange is valued at the quotation on the exchange determined to be the primary market for such security. Listed securities not traded on a particular day are valued at the mean of the closing bid and asked prices for domestic securities and the last quoted sale or closing price for international securities.
For valuation purposes, the last quoted prices of non-U.S. equity securities may be adjusted to reflect the fair value of such securities at the close of the NYSE. If the fund determines that developments between the close of a foreign market and the close of the NYSE will, in its judgment, materially affect the value of some or all of its portfolio securities, the fund will adjust the previous quoted prices to reflect what it believes to be the fair value of the securities as of the close of the NYSE. In deciding whether it is necessary to adjust quoted prices to reflect fair value, the fund reviews a variety of factors, including developments in foreign markets, the performance of U.S. securities markets, and the performance of instruments trading in U.S. markets that represent foreign securities and baskets of foreign securities. The fund may also fair value securities in other situations, such as when a particular foreign market is closed but the fund is open. The fund uses outside pricing services to provide it with quoted prices and information to evaluate and/or adjust those prices. The fund cannot predict how often it will use quoted prices and how often it will determine it necessary to adjust those prices to reflect fair value. As a means of evaluating its security valuation process, the fund routinely compares quoted prices, the next day’s opening prices in the same markets, and adjusted prices.
Actively traded domestic equity securities generally are categorized in Level 1 of the fair value hierarchy. Non-U.S. equity securities generally are categorized in Level 2 of the fair value hierarchy despite the availability of quoted prices because, as described above, the fund evaluates and determines whether those quoted prices reflect fair value at the close of the NYSE or require adjustment. OTC Bulletin Board securities, certain preferred securities, and equity securities traded in inactive markets generally are categorized in Level 2 of the fair value hierarchy.
Investments in mutual funds are valued at the mutual fund’s closing net asset value per share on the day of valuation and are categorized in Level 1 of the fair value hierarchy. Assets and liabilities other than financial instruments, including short-term receivables and payables, are carried at cost, or estimated realizable value, if less, which approximates fair value.
Thinly traded financial instruments and those for which the above valuation procedures are inappropriate or are deemed not to reflect fair value are stated at fair value as determined in good faith by the Valuation Committee. The objective of any fair value pricing determination is to arrive at a price that could reasonably be expected from a current sale. Financial instruments fair valued by the Valuation Committee are primarily private placements, restricted securities, warrants, rights, and other securities that are not publicly traded.
Subject to oversight by the Board, the Valuation Committee regularly makes good faith judgments to establish and adjust the fair valuations of certain securities as events occur and circumstances warrant. For instance, in determining the fair value of an equity investment with limited market activity, such as a private placement or a thinly traded public company stock, the Valuation Committee considers a variety of factors, which may include, but are not limited to, the issuer’s business prospects, its financial standing and performance, recent investment transactions in the issuer, new rounds of financing, negotiated transactions of significant size between other investors in the company, relevant market valuations of peer companies, strategic events affecting the company, market liquidity for the issuer, and general economic conditions and events. In consultation with the investment and pricing teams, the Valuation Committee will determine an appropriate valuation technique based on available information, which may include both observable and unobservable inputs. The Valuation Committee typically will afford greatest weight to actual prices in arm’s length transactions, to the extent they represent orderly transactions between market participants; transaction information can be reliably obtained; and prices are deemed representative of fair value. However, the Valuation Committee may also consider other valuation methods such as market-based valuation multiples; a discount or premium from market value of a similar, freely traded security of the same issuer; or some combination. Fair value determinations are reviewed on a regular basis and updated as information becomes available, including actual purchase and sale transactions of the issue. Because any fair value determination involves a significant amount of judgment, there is a degree of subjectivity inherent in such pricing decisions and fair value prices determined by the Valuation Committee could differ from those of other market participants. Depending on the relative significance of unobservable inputs, including the valuation technique(s) used, fair valued securities may be categorized in Level 2 or 3 of the fair value hierarchy.
Valuation Inputs The following table summarizes the fund’s financial instruments, based on the inputs used to determine their fair values on June 30, 2013:
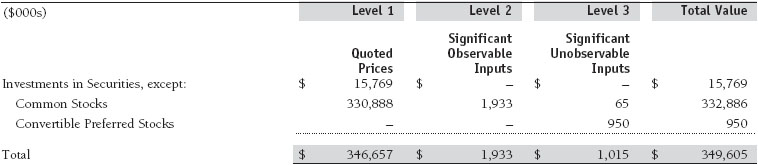
There were no material transfers between Levels 1 and 2 during the period.
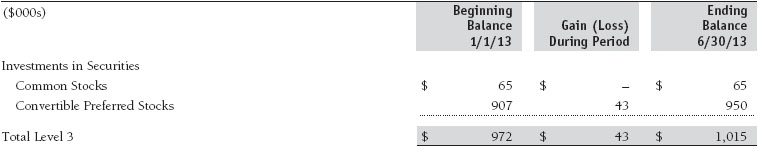
Following is a reconciliation of the fund’s Level 3 holdings for the six months ended June 30, 2013. Gain (loss) reflects both realized and change in unrealized gain/loss on Level 3 holdings during the period, if any, and is included on the accompanying Statement of Operations. The change in unrealized gain/loss on Level 3 instruments held at June 30, 2013, totaled $43,000 for the six months ended June 30, 2013.
NOTE 3 - OTHER INVESTMENT TRANSACTIONS
Consistent with its investment objective, the fund engages in the following practices to manage exposure to certain risks and/or to enhance performance. The investment objective, policies, program, and risk factors of the fund are described more fully in the fund’s prospectus and Statement of Additional Information.
Restricted Securities The fund may invest in securities that are subject to legal or contractual restrictions on resale. Prompt sale of such securities at an acceptable price may be difficult and may involve substantial delays and additional costs.
Securities Lending The fund lends its securities to approved brokers to earn additional income. Its securities lending activities are administered by a lending agent in accordance with a securities lending agreement. It receives as collateral cash and U.S. government securities valued at 102% to 105% of the value of the securities on loan. Collateral is maintained over the life of the loan in an amount not less than the value of loaned securities; any additional collateral required due to changes in security values is delivered to the fund the next business day. Cash collateral is invested by the fund’s lending agent(s) in accordance with investment guidelines approved by management. Additionally, the lending agent indemnifies the fund against losses resulting from borrower default. Although risk is mitigated by the collateral, the fund could experience a delay in recovering its securities and a possible loss of income or value if the borrower fails to return the securities, collateral investments decline in value, or the lending agent fails to perform. Securities lending revenue recognized by the fund consists of earnings on invested collateral and borrowing fees, net of any rebates to the borrower, compensation to the lending agent and other administrative costs. In accordance with GAAP, investments made with cash collateral are reflected in the accompanying financial statements, but collateral received in the form of securities is not. At June 30, 2013, there were no securities on loan.
Other Purchases and sales of portfolio securities other than short-term and U.S. government securities aggregated $43,226,000 and $64,877,000, respectively, for the six months ended June 30, 2013.
NOTE 4 - FEDERAL INCOME TAXES
No provision for federal income taxes is required since the fund intends to continue to qualify as a regulated investment company under Subchapter M of the Internal Revenue Code and distribute to shareholders all of its taxable income and gains. Distributions determined in accordance with federal income tax regulations may differ in amount or character from net investment income and realized gains for financial reporting purposes. Financial reporting records are adjusted for permanent book/tax differences to reflect tax character but are not adjusted for temporary differences. The amount and character of tax-basis distributions and composition of net assets are finalized at fiscal year-end; accordingly, tax-basis balances have not been determined as of the date of this report.
The fund intends to retain realized gains to the extent of available capital loss carryforwards. Net realized capital losses may be carried forward indefinitely to offset future realized capital gains. As of December 31, 2012, the fund had $694,000 of available capital loss carryforwards.
At June 30, 2013, the cost of investments for federal income tax purposes was $236,254,000. Net unrealized gain aggregated $113,351,000 at period-end, of which $118,647,000 related to appreciated investments and $5,296,000 related to depreciated investments.
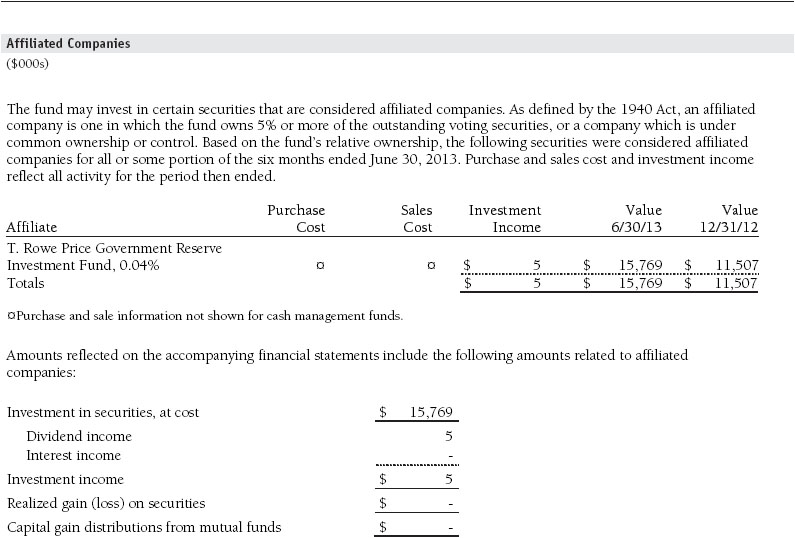
NOTE 5 - RELATED PARTY TRANSACTIONS
The fund is managed by T. Rowe Price Associates, Inc. (Price Associates), a wholly owned subsidiary of T. Rowe Price Group, Inc. (Price Group). The investment management and administrative agreement between the fund and Price Associates provides for an all-inclusive annual fee equal to 0.85% of the fund’s average daily net assets. The fee is computed daily and paid monthly. The all-inclusive fee covers investment management, shareholder servicing, transfer agency, accounting, and custody services provided to the fund, as well as fund directors’ fees and expenses. Interest, taxes, brokerage commissions, and extraordinary expenses are paid directly by the fund.
The fund may invest in the T. Rowe Price Reserve Investment Fund and the T. Rowe Price Government Reserve Investment Fund (collectively, the T. Rowe Price Reserve Investment Funds), open-end management investment companies managed by Price Associates and considered affiliates of the fund. The T. Rowe Price Reserve Investment Funds are offered as cash management options to mutual funds, trusts, and other accounts managed by Price Associates and/or its affiliates and are not available for direct purchase by members of the public. The T. Rowe Price Reserve Investment Funds pay no investment management fees.
| Information on Proxy Voting Policies, Procedures, and Records |
A description of the policies and procedures used by T. Rowe Price funds and portfolios to determine how to vote proxies relating to portfolio securities is available in each fund’s Statement of Additional Information. You may request this document by calling 1-800-225-5132 or by accessing the SEC’s website, sec.gov.
The description of our proxy voting policies and procedures is also available on our website, troweprice.com. To access it, click on the words “Social Responsibility” at the top of our corporate homepage. Next, click on the words “Conducting Business Responsibly” on the left side of the page that appears. Finally, click on the words “Proxy Voting Policies” on the left side of the page that appears.
Each fund’s most recent annual proxy voting record is available on our website and through the SEC’s website. To access it through our website, follow the directions above to reach the “Conducting Business Responsibly” page. Click on the words “Proxy Voting Records” on the left side of that page, and then click on the “View Proxy Voting Records” link at the bottom of the page that appears.
| How to Obtain Quarterly Portfolio Holdings |
The fund files a complete schedule of portfolio holdings with the Securities and Exchange Commission for the first and third quarters of each fiscal year on Form N-Q. The fund’s Form N-Q is available electronically on the SEC’s website (sec.gov); hard copies may be reviewed and copied at the SEC’s Public Reference Room, 100 F St. N.E., Washington, DC 20549. For more information on the Public Reference Room, call 1-800-SEC-0330.
| Approval of Investment Management Agreement |
On March 5, 2013, the fund’s Board of Directors (Board), including a majority of the fund’s independent directors, approved the continuation of the investment management agreement (Advisory Contract) between the fund and its investment advisor, T. Rowe Price Associates, Inc. (Advisor). In connection with its deliberations, the Board requested, and the Advisor provided, such information as the Board (with advice from independent legal counsel) deemed reasonably necessary. The Board considered a variety of factors in connection with its review of the Advisory Contract, also taking into account information provided by the Advisor during the course of the year, as discussed below:Services Provided by the Advisor
The Board considered the nature, quality, and extent of the services provided to the fund by the Advisor. These services included, but were not limited to, directing the fund’s investments in accordance with its investment program and the overall management of the fund’s portfolio, as well as a variety of related activities such as financial, investment operations, and administrative services; compliance; maintaining the fund’s records and registrations; and shareholder communications. The Board also reviewed the background and experience of the Advisor’s senior management team and investment personnel involved in the management of the fund, as well as the Advisor’s compliance record. The Board concluded that it was satisfied with the nature, quality, and extent of the services provided by the Advisor.
Investment Performance of the Fund
The Board reviewed the fund’s three-month, one-year, and year-by-year returns, as well as the fund’s average annualized total returns over the 3-, 5-, and 10-year periods, and compared these returns with a wide variety of previously agreed-upon comparable performance measures and market data, including those supplied by Lipper and Morningstar, which are independent providers of mutual fund data.
On the basis of this evaluation and the Board’s ongoing review of investment results, and factoring in the relative market conditions during certain of the performance periods, the Board concluded that the fund’s performance was satisfactory.
Costs, Benefits, Profits, and Economies of Scale
The Board reviewed detailed information regarding the revenues received by the Advisor under the Advisory Contract and other benefits that the Advisor (and its affiliates) may have realized from its relationship with the fund, including any research received under “soft dollar” agreements and commission-sharing arrangements with broker-dealers. The Board considered that the Advisor may receive some benefit from soft-dollar arrangements pursuant to which research is received from broker-dealers that execute the applicable fund’s portfolio transactions. The Board received information on the estimated costs incurred and profits realized by the Advisor from managing T. Rowe Price mutual funds. The Board also reviewed estimates of the profits realized from managing the fund in particular, and the Board concluded that the Advisor’s profits were reasonable in light of the services provided to the fund.
The Board also considered whether the fund benefits under the fee levels set forth in the Advisory Contract from any economies of scale realized by the Advisor. The Board noted that, under the Advisory Contract, the fund pays the Advisor a single fee based on the fund’s average daily net assets that includes investment management services and provides for the Advisor to pay all expenses of the fund’s operations except for interest, taxes, portfolio transaction fees, and any non-recurring extraordinary expenses that may arise. The Board concluded that, based on the profitability data it reviewed and consistent with this single-fee structure, the Advisory Contract provided for a reasonable sharing of any benefits from economies of scale with the fund.
Fees
The Board was provided with information regarding industry trends in management fees and expenses, and the Board reviewed the fund’s single-fee structure in comparison with fees and expenses of other comparable funds based on information and data supplied by Lipper (for the Investor Class and II Class). For these purposes, the Board assumed that the fund’s management fee rate was equal to the single fee less the fund’s operating expenses. The information provided to the Board indicated that the fund’s management fee rate was at or below the median for comparable funds, the total expense ratio for the Investor Class was below the median for comparable funds, and the total expense ratio for the II Class was above the median for comparable funds.
The Board also reviewed the fee schedules for institutional accounts and private accounts with similar mandates that are advised or subadvised by the Advisor and its affiliates. Management provided the Board with information about the Advisor’s responsibilities and services provided to institutional account clients, including information about how the requirements and economics of the institutional business are fundamentally different from those of the mutual fund business. The Board considered information showing that the mutual fund business is generally more complex from a business and compliance perspective than the institutional business and that the Advisor generally performs significant additional services and assumes greater risk in managing the fund and other T. Rowe Price mutual funds than it does for institutional account clients.
On the basis of the information provided and the factors considered, the Board concluded that the fees paid by the fund under the Advisory Contract are reasonable.
Approval of the Advisory Contract
As noted, the Board approved the continuation of the Advisory Contract. No single factor was considered in isolation or to be determinative to the decision. Rather, the Board concluded, in light of a weighting and balancing of all factors considered, that it was in the best interests of the fund and its shareholders for the Board to approve the continuation of the Advisory Contract (including the fees to be charged for services thereunder). The independent directors were advised throughout the process by independent legal counsel.
Item 2. Code of Ethics.
A code of ethics, as defined in Item 2 of Form N-CSR, applicable to its principal executive officer, principal financial officer, principal accounting officer or controller, or persons performing similar functions is filed as an exhibit to the registrant’s annual Form N-CSR. No substantive amendments were approved or waivers were granted to this code of ethics during the registrant’s most recent fiscal half-year.
Item 3. Audit Committee Financial Expert.
Disclosure required in registrant’s annual Form N-CSR.
Item 4. Principal Accountant Fees and Services.
Disclosure required in registrant’s annual Form N-CSR.
Item 5. Audit Committee of Listed Registrants.
Not applicable.
Item 6. Investments.
(a) Not applicable. The complete schedule of investments is included in Item 1 of this Form N-CSR.
(b) Not applicable.
Item 7. Disclosure of Proxy Voting Policies and Procedures for Closed-End Management Investment Companies.
Not applicable.
Item 8. Portfolio Managers of Closed-End Management Investment Companies.
Not applicable.
Item 9. Purchases of Equity Securities by Closed-End Management Investment Company and Affiliated Purchasers.
Not applicable.
Item 10. Submission of Matters to a Vote of Security Holders.
Not applicable.
Item 11. Controls and Procedures.
(a) The registrant’s principal executive officer and principal financial officer have evaluated the registrant’s disclosure controls and procedures within 90 days of this filing and have concluded that the registrant’s disclosure controls and procedures were effective, as of that date, in ensuring that information required to be disclosed by the registrant in this Form N-CSR was recorded, processed, summarized, and reported timely.
(b) The registrant’s principal executive officer and principal financial officer are aware of no change in the registrant’s internal control over financial reporting that occurred during the registrant’s second fiscal quarter covered by this report that has materially affected, or is reasonably likely to materially affect, the registrant’s internal control over financial reporting.
Item 12. Exhibits.
(a)(1) The registrant’s code of ethics pursuant to Item 2 of Form N-CSR is filed with the registrant’s annual Form N-CSR.
(2) Separate certifications by the registrant's principal executive officer and principal financial officer, pursuant to Section 302 of the Sarbanes-Oxley Act of 2002 and required by Rule 30a-2(a) under the Investment Company Act of 1940, are attached.
(3) Written solicitation to repurchase securities issued by closed-end companies: not applicable.
(b) A certification by the registrant's principal executive officer and principal financial officer, pursuant to Section 906 of the Sarbanes-Oxley Act of 2002 and required by Rule 30a-2(b) under the Investment Company Act of 1940, is attached.
SIGNATURES
Pursuant to the requirements of the Securities Exchange Act of 1934 and the Investment Company Act of 1940, the registrant has duly caused this report to be signed on its behalf by the undersigned, thereunto duly authorized.
T. Rowe Price Equity Series, Inc.
| | By | /s/ Edward C. Bernard |
| | Edward C. Bernard |
| | Principal Executive Officer |
| |
| Date August 16, 2013 | | |
Pursuant to the requirements of the Securities Exchange Act of 1934 and the Investment Company Act of 1940, this report has been signed below by the following persons on behalf of the registrant and in the capacities and on the dates indicated.
| | By | /s/ Edward C. Bernard |
| | Edward C. Bernard |
| | Principal Executive Officer |
| |
| Date August 16, 2013 | | |
| |
| |
| By | /s/ Gregory K. Hinkle |
| | Gregory K. Hinkle |
| | Principal Financial Officer |
| |
| Date August 16, 2013 | | |