UNITED STATES
SECURITIES AND EXCHANGE COMMISSION
Washington, D.C. 20549
FORM N-CSR
CERTIFIED SHAREHOLDER REPORT OF REGISTERED
MANAGEMENT INVESTMENT COMPANIES
Investment Company Act File Number: 811-07143
| T. Rowe Price Equity Series, Inc. |
|
| (Exact name of registrant as specified in charter) |
| |
| 100 East Pratt Street, Baltimore, MD 21202 |
|
| (Address of principal executive offices) |
| |
| David Oestreicher |
| 100 East Pratt Street, Baltimore, MD 21202 |
|
| (Name and address of agent for service) |
Registrant’s telephone number, including area code: (410) 345-2000
Date of fiscal year end: December 31
Date of reporting period: June 30, 2012
Item 1. Report to Shareholders
| New America Growth Portfolio | June 30, 2012 |
- After a strong start to the year, the stock rally faltered in the second quarter, but markets ended the first half of 2012 with solid gains.
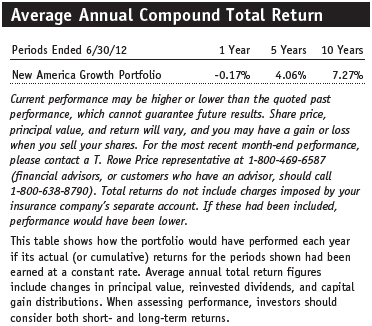
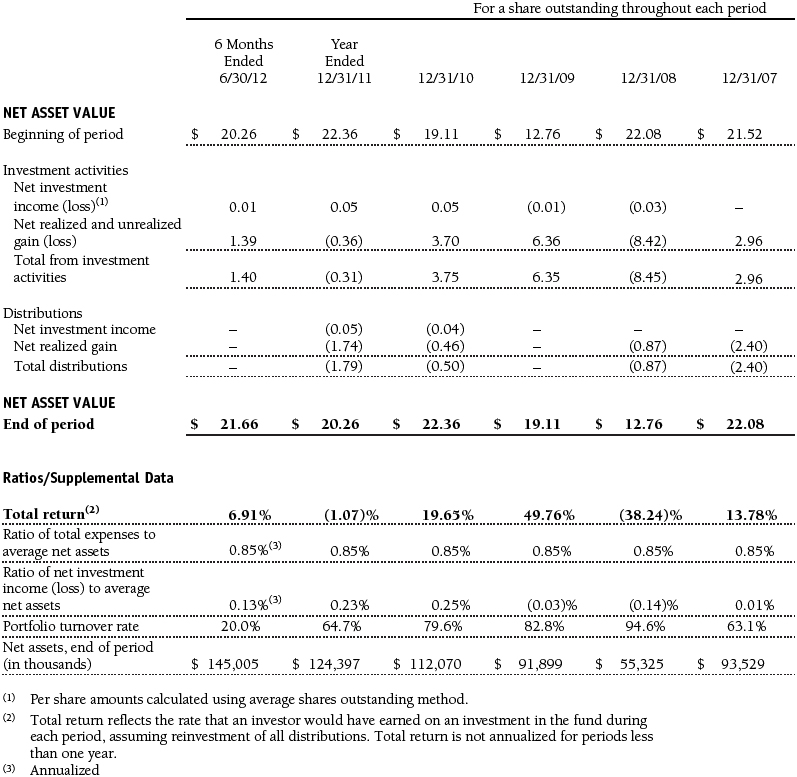
- The New America Growth Portfolio returned 6.91% but trailed the S&P 500 in the six-month reporting period.
- The portfolio remained focused on identifying the most promising larger-capitalization stocks in the fastest-growing sectors of the market.
- There are several factors that could dampen near-term economic growth and stock market performance, but the prospects for the portfolio’s holdings over the long term remain positive.
The views and opinions in this report were current as of June 30, 2012. They are not guarantees of performance or investment results and should not be taken as investment advice. Investment decisions reflect a variety of factors, and the managers reserve the right to change their views about individual stocks, sectors, and the markets at any time. As a result, the views expressed should not be relied upon as a forecast of the fund’s future investment intent. The report is certified under the Sarbanes-Oxley Act, which requires mutual funds and other public companies to affirm that, to the best of their knowledge, the information in their financial reports is fairly and accurately stated in all material respects.
Manager’s Letter
T. Rowe Price New America Growth Portfolio
Dear Investor
Equity markets rose during the first six months of 2012 despite more bad news out of Europe and slowing growth in China. Once again, it was somewhat of a wild ride, with the market starting the year off strongly only to give up some of those gains during the second quarter. The New America Growth Portfolio posted a solid gain but underperformed its benchmark and Lipper peer group for the six-month period. The portfolio’s results reflected our conservative positioning in what we expected to be a tough environment for stocks—in other words, we did not take enough risk, particularly during the strong first-quarter market rally.
Portfolio Performance

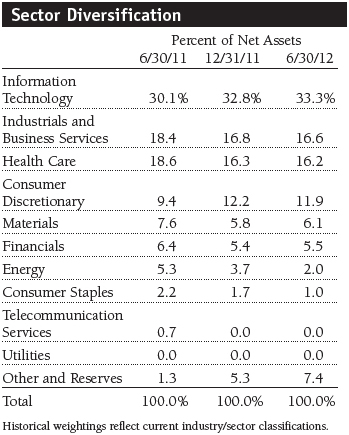
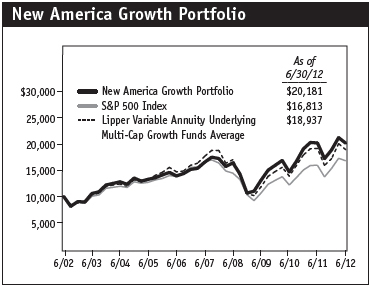
The New America Growth Portfolio returned 6.91% in the six months ended June 30, 2012. The portfolio trailed the 9.49% return for the S&P 500 Index and the 9.20% return for the Lipper Variable Annuity Underlying Multi-Cap Growth Funds Average. The portfolio’s largest sector allocations, information technology, industrials and business services, and health care, generated strong absolute performance in the six-month period. Our comparison with the S&P 500 was hurt by stock selection in the consumer discretionary and industrials and business services sectors. As shown in the Growth of $10,000 chart on page 6, the portfolio has outpaced the S&P 500 Index and its Lipper peer group over the past 10 years.
Market Environment
During the first half of 2012, the market remained volatile and was largely driven by macroeconomic forces. Early in the year, equities rallied on optimism that Europe would get its arms around its sovereign debt problems and that China would stimulate its slowing economy. Meanwhile, business conditions in the U.S. started the year strong, helped by favorable weather and modest improvements in employment and housing. This drove stocks higher in the first quarter.
By the time spring rolled around, it had become clear that Europe’s situation was still fragile, and China’s growth continued to slow without any new meaningful stimulus. Conditions in the U.S. remained stable, but doubts about the back half began to creep into investors’ minds. The market gave back some of its first-quarter gains in the second quarter but remained positive for the six-month period.
Most sectors notched gains during the first half of 2012, with health care, consumer discretionary, information technology, financials, and telecommunications services posting double-digit returns. Your portfolio benefited from large exposures to technology and health care. On the downside, energy was the weakest-performing sector due to worries about faltering global oil and gas demand and an oversupply of natural gas.
As we move into the back half of the year, the risk of slowing growth in Europe and China remains. More importantly, I expect heightened political uncertainty to at least temporarily slow the U.S. economy before the elections in November—my recent travels around the country to visit with senior managements partly informs this view. Thus, I’d expect the market to remain choppy between now and November. I’ll discuss my outlook in more detail at the end of this letter.
Portfolio Review
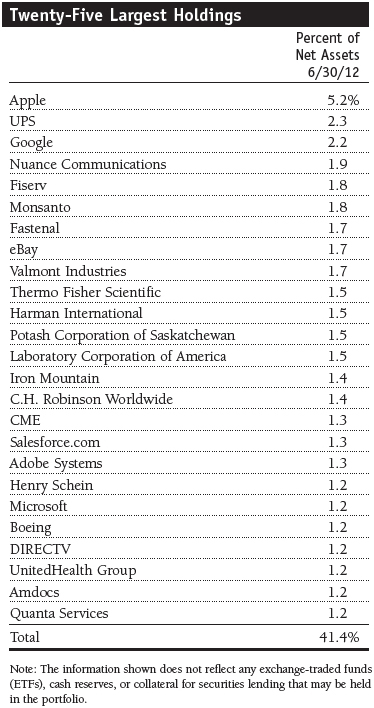
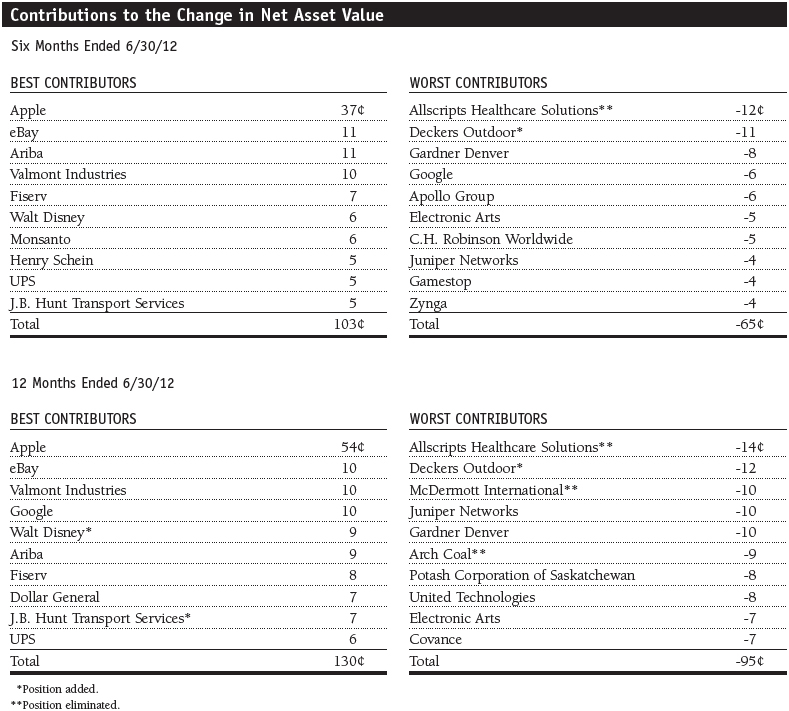
During the six-month period, the portfolio’s three best performance contributors were Apple, eBay, and Ariba. Apple continued to dominate the technology world with its innovative products, led by the iPhone and iPad. Newer versions of these products have been well received, and the market is optimistic about future enhancements, along with the potential for Apple to enter new markets, such as television, in a more significant way. Additionally, Apple announced its first ever dividend and share buyback, which further bolstered the shares. Apple continues to be the largest holding in the fund. (Please refer to the portfolio of investments for a complete list of holdings and the amount each represents in the portfolio.)
Longtime holding eBay performed well. There are two key reasons for this. First, eBay owns PayPal, which is far and away the leader in online and mobile payments. This business continued to execute well, and the market has come to appreciate its terrific growth potential. Additionally, eBay’s core online shopping business, known as Marketplace, is in the process of engineering a comeback, following several tough years. Under its new leadership team, I’m optimistic that Marketplace can continue its turnaround and that the combination of PayPal plus Marketplace can continue to drive eBay’s stock for the foreseeable future.
Ariba is a newer holding, added to the portfolio in mid-2011. In May, European software company SAP announced that it would acquire Ariba for $45 per share in cash, leading Ariba to be a top contributor during the period. I have been reducing the size of this holding since then because the stock is trading at approximately a 1% discount to the takeover price.
The portfolio’s largest detractors for the six-month period were Allscripts Healthcare Solutions, Deckers Outdoor, and Gardner Denver. Allscripts, a leading health care technology software and systems provider, had a series of serious issues during the period that led to a significant stock decline. Chief among the issues was infighting among the leadership team that ultimately led to the resignations of several Board members, the departure of the chief financial officer (CFO), and news that the company’s fundamental performance was falling short of expectations. In a situation like this, as painful as it is, I decided to take the loss and sell the stock. I can be patient with faltering fundamentals if I remain confident in the long-term performance of a company, but when the Board and a CFO decide to vote with their feet, it becomes hard to have any real confidence in the company’s future.
Deckers Outdoor is the maker of the popular UGG branded boots. With one of the warmest winters on record this year, Deckers posted disappointing sales and earnings results, and the stock suffered accordingly. This miss has brought out the doubters who claim UGG has lost relevance with consumers. Unfortunately, the stock will likely remain in the penalty box until we see how the brand performs in a more “normal” winter.
Gardner Denver sells industrial and energy-related products throughout the world. Its stock has been plagued by concerns over its exposure to Europe, where the company derives almost one-third of its sales. Despite the current macroeconomic headwinds, I like the company’s long-term prospects and believe management will be proactive in growing the business and cutting costs throughout Europe in order to protect profitability.
Outlook
The investing environment is as tricky as I’ve ever encountered. Growth is slowing almost everywhere in the world, including the longtime global beacon of growth, China, and the more developed countries of Europe. At the same time, we are just months away from the presidential elections in the United States, which could contribute to a temporary global growth slowdown.
Yet, despite the negatives, equities rose nicely during the first half of the year. Naturally, given my more balanced and conservative view, the market’s more positive tone so far this year drives me to both better understand the rally and also to challenge my own strategy and portfolio positioning. In sum, I think the rally has legitimate roots—namely, the better-than-expected U.S. economy, reasonable valuations, and solid corporate performance.
Another significant driver is investors’ ongoing hope for further global stimulus. However, I am not in this camp. I believe further fiscal stimulus will be difficult to execute given the poor financial shape of most countries throughout the world. I also believe that while central banks may, in fact, engage in further “monetary easing,” it will do little to fix many countries’ (including our own) fundamental problem. In my view, most countries already have too much debt and continue to spend more than they make—so-called quantitative easing does little to address this problem.
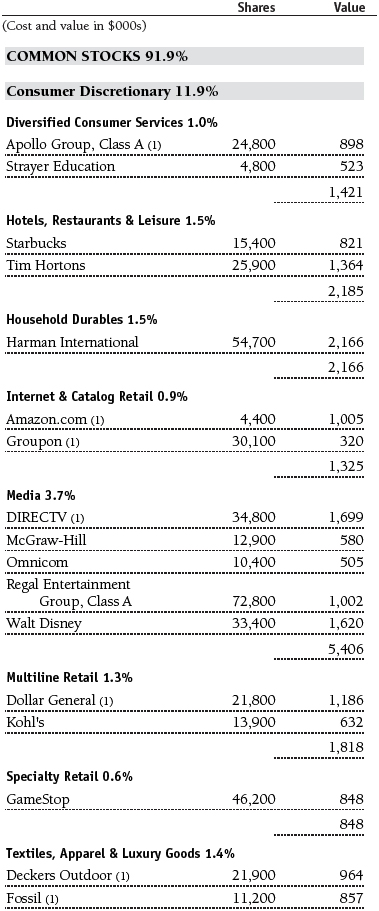
There are additional risks on the near-term horizon. There is increasing evidence that, while still very resilient, the U.S. consumer is beginning to spend less. Given that the consumer drives 70% of the U.S. economy, this could pose an incremental headwind to our economy later this year, while challenging the fundamentals of many consumer companies. Admittedly, I’ve held this view for a while and have been too early, but I continue to minimize the portfolio’s exposure to the consumer discretionary sector. Furthermore, as I look around the world, I also worry about the rising tensions between Israel and Iran. A breakout in violence between those two countries could send crude oil prices significantly higher, which would seriously challenge global growth.
Simply put, as I analyze the overall landscape, I continue to feel largely the same as I have for over a year now—fairly balanced and still hesitant to add a lot more risk to the portfolio in the near term. I maintain the view that near-term results from many companies could soften, that further stimulus is unlikely to drive significantly higher returns, and that long-term growth could be challenged if governments around the world do not shrink their fiscal deficits and arrest their growing debt burden.
As the manager of this portfolio, I would love to be able post strong results in every six-month period. Yet, this is an unrealistic pursuit and not my primary goal. Rather, I remain focused, as I have for my nearly 10 years at the fund’s helm, on delivering superior long-term performance and doing so without taking unfavorable risks with your money. This overall philosophy and our fundamental process for selecting stocks hasn’t always led to the best six-month results, but it has, indeed, generated relatively strong performance over the last 10 years.
I expect the back half of 2012 to be as interesting as ever. I look forward to updating you on the full-year results in six months.
Respectfully submitted,
 Joseph M. Milano
Chairman of the portfolio’s Investment Advisory CommitteeJuly 13, 2012
The committee chairman has day-to-day responsibility for managing the portfolio and works with committee members in developing and executing its investment program.
The portfolio’s share price can fall because of weakness in the stock markets, a particular industry, or specific holdings. Stock markets can decline for many reasons, including adverse political or economic developments, changes in investor psychology, or heavy institutional selling. The prospects for an industry or company may deteriorate because of a variety of factors, including disappointing earnings or changes in the competitive environment. In addition, the investment manager’s assessment of companies held in a portfolio may prove incorrect, resulting in losses or poor performance even in rising markets.
Lipper averages: The average return of all portfolios in a particular category as defined by Lipper Inc.
S&P 500 Index: An unmanaged index that tracks the stocks of 500 primarily large-cap U.S. companies.
Portfolio Highlights
Performance and Expenses
T. Rowe Price New America Growth Portfolio
This chart shows the value of a hypothetical $10,000 investment in the portfolio over the past 10 fiscal year periods or since inception (for portfolios lacking 10-year records). The result is compared with benchmarks, which may include a broad-based market index and a peer group average or index. Market indexes do not include expenses, which are deducted from portfolio returns as well as mutual fund averages and indexes.
Fund Expense Example
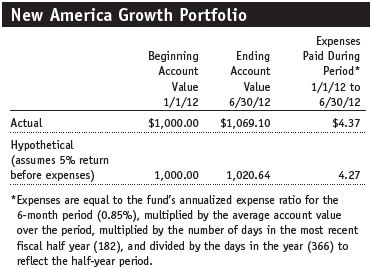
As a mutual fund shareholder, you may incur two types of costs: (1) transaction costs, such as redemption fees or sales loads, and (2) ongoing costs, including management fees, distribution and service (12b-1) fees, and other fund expenses. The following example is intended to help you understand your ongoing costs (in dollars) of investing in the fund and to compare these costs with the ongoing costs of investing in other mutual funds. The example is based on an investment of $1,000 invested at the beginning of the most recent six-month period and held for the entire period.
Actual Expenses
The first line of the following table (Actual) provides information about actual account values and actual expenses. You may use the information on this line, together with your account balance, to estimate the expenses that you paid over the period. Simply divide your account value by $1,000 (for example, an $8,600 account value divided by $1,000 = 8.6), then multiply the result by the number on the first line under the heading “Expenses Paid During Period” to estimate the expenses you paid on your account during this period.
Hypothetical Example for Comparison Purposes
The information on the second line of the table (Hypothetical) is based on hypothetical account values and expenses derived from the fund’s actual expense ratio and an assumed 5% per year rate of return before expenses (not the fund’s actual return). You may compare the ongoing costs of investing in the fund with other funds by contrasting this 5% hypothetical example and the 5% hypothetical examples that appear in the shareholder reports of the other funds. The hypothetical account values and expenses may not be used to estimate the actual ending account balance or expenses you paid for the period.
You should also be aware that the expenses shown in the table highlight only your ongoing costs and do not reflect any transaction costs, such as redemption fees or sales loads. Therefore, the second line of the table is useful in comparing ongoing costs only and will not help you determine the relative total costs of owning different funds. To the extent a fund charges transaction costs, however, the total cost of owning that fund is higher.
Financial Highlights
T. Rowe Price New America Growth Portfolio
(Unaudited)
The accompanying notes are an integral part of these financial statements.
Portfolio of Investments‡
T. Rowe Price New America Growth Portfolio
June 30, 2012 (Unaudited)
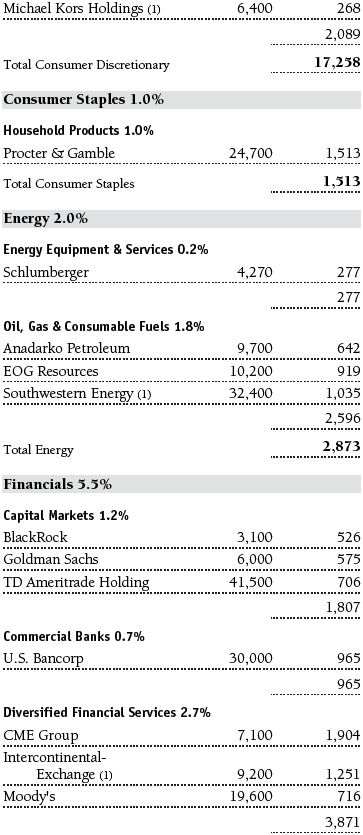
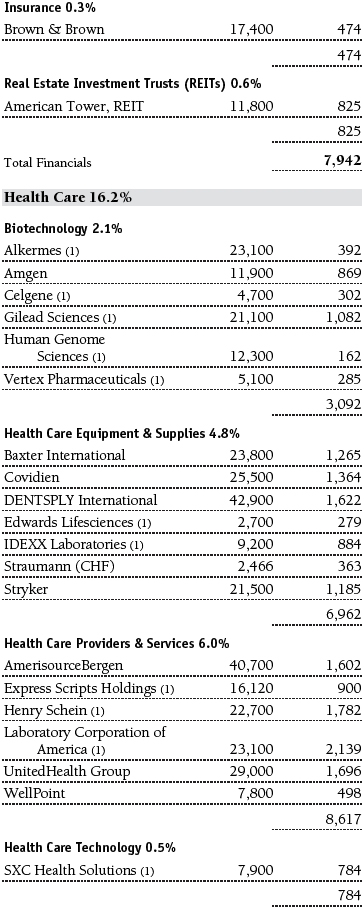

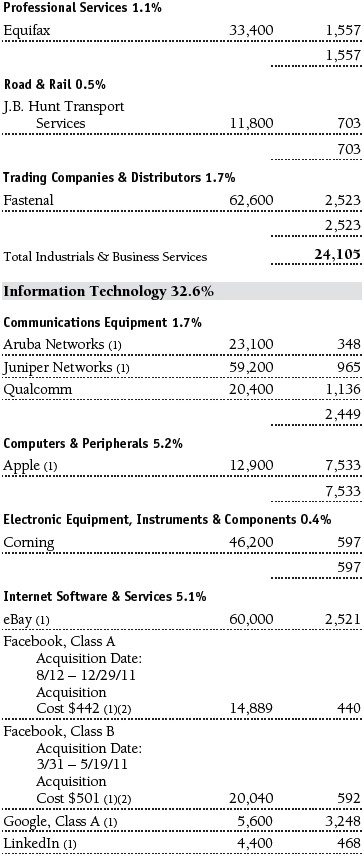
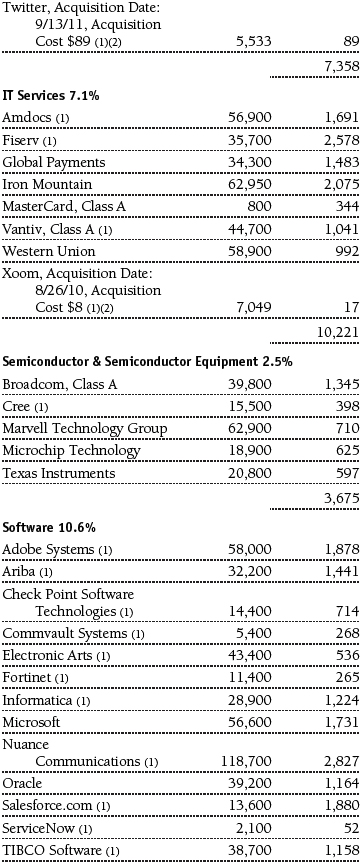
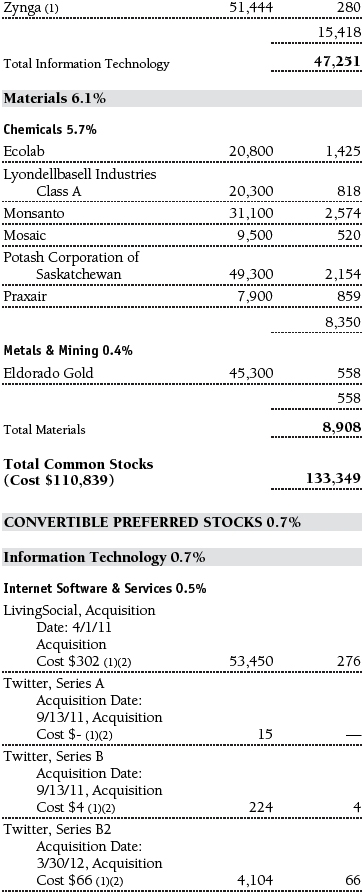


The accompanying notes are an integral part of these financial statements.
Statement of Assets and Liabilities
T. Rowe Price New America Growth Portfolio
June 30, 2012 (Unaudited)
($000s, except shares and per share amounts)
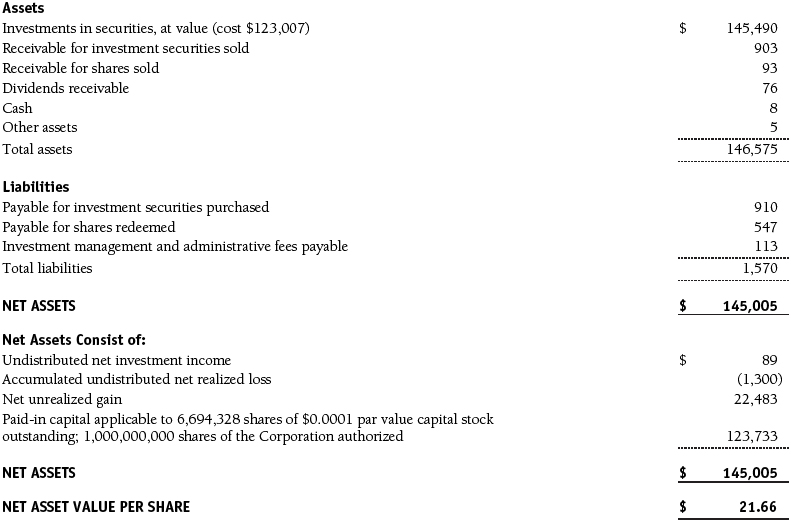
The accompanying notes are an integral part of these financial statements.
Statement of Operations
T. Rowe Price New America Growth Portfolio
(Unaudited)
($000s)

The accompanying notes are an integral part of these financial statements.
Statement of Changes in Net Assets
T. Rowe Price New America Growth Portfolio
(Unaudited)
($000s)
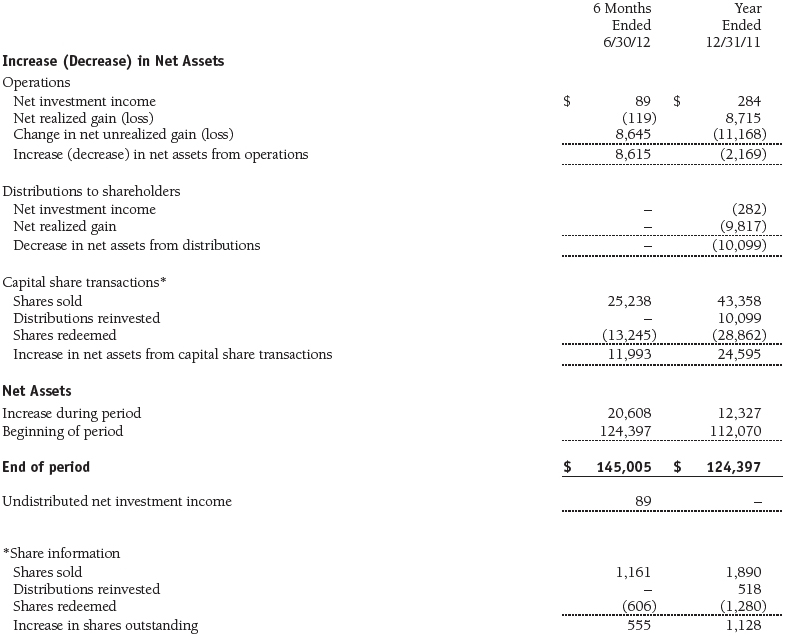
The accompanying notes are an integral part of these financial statements.
Notes to Financial Statements
T. Rowe Price New America Growth Portfolio
June 30, 2012 (Unaudited)
T. Rowe Price Equity Series, Inc. (the corporation), is registered under the Investment Company Act of 1940 (the 1940 Act). The New America Growth Portfolio (the fund) is a diversified, open-end management investment company established by the corporation. The fund commenced operations on March 31, 1994. The fund seeks to provide long-term capital growth by investing primarily in the common stocks of growth companies. Shares of the fund are currently offered only through certain insurance companies as an investment medium for both variable annuity contracts and variable life insurance policies.
NOTE 1 - SIGNIFICANT ACCOUNTING POLICIES
Basis of Preparation The accompanying financial statements were prepared in accordance with accounting principles generally accepted in the United States of America (GAAP), which require the use of estimates made by management. Management believes that estimates and valuations are appropriate; however, actual results may differ from those estimates, and the valuations reflected in the accompanying financial statements may differ from the value ultimately realized upon sale or maturity.
Investment Transactions, Investment Income, and Distributions Income and expenses are recorded on the accrual basis. Dividends received from mutual fund investments are reflected as dividend income; capital gain distributions are reflected as realized gain/loss. Dividend income and capital gain distributions are recorded on the ex-dividend date. Income tax-related interest and penalties, if incurred, would be recorded as income tax expense. Investment transactions are accounted for on the trade date. Realized gains and losses are reported on the identified cost basis. Distributions to shareholders are recorded on the ex-dividend date. Income distributions are declared and paid annually. Capital gain distributions, if any, are generally declared and paid by the fund annually.
Currency Translation Assets, including investments, and liabilities denominated in foreign currencies are translated into U.S. dollar values each day at the prevailing exchange rate, using the mean of the bid and asked prices of such currencies against U.S. dollars as quoted by a major bank. Purchases and sales of securities, income, and expenses are translated into U.S. dollars at the prevailing exchange rate on the date of the transaction. The effect of changes in foreign currency exchange rates on realized and unrealized security gains and losses is reflected as a component of security gains and losses.
Rebates Subject to best execution, the fund may direct certain security trades to brokers who have agreed to rebate a portion of the related brokerage commission to the fund in cash. Commission rebates are reflected as realized gain on securities in the accompanying financial statements and totaled $1,000 for the six months ended June 30, 2012.
Credits Credits are earned on the fund’s temporarily uninvested cash balances held at the custodian and such credits reduce the amount paid by the manager for custody of the fund’s assets. In order to pass the benefit of custody credits to the fund, the manager has voluntarily reduced its investment management and administrative expense in the accompanying financial statements.
New Accounting Pronouncements In May 2011, the Financial Accounting Standards Board (FASB) issued amended guidance to align fair value measurement and disclosure requirements in U.S. GAAP with International Financial Reporting Standards. The guidance is effective for fiscal years and interim periods beginning on or after December 15, 2011. Adoption had no effect on net assets or results of operations.
In December 2011, the FASB issued amended guidance to enhance disclosure for offsetting assets and liabilities. The guidance is effective for fiscal years and interim periods beginning on or after January 1, 2013. Adoption will have no effect on the fund’s net assets or results of operations.
NOTE 2 - VALUATION
The fund’s financial instruments are reported at fair value as defined by GAAP. The fund determines the values of its assets and liabilities and computes its net asset value per share at the close of the New York Stock Exchange (NYSE), normally 4 p.m. ET, each day that the NYSE is open for business.
Valuation Methods Equity securities listed or regularly traded on a securities exchange or in the over-the-counter (OTC) market are valued at the last quoted sale price or, for certain markets, the official closing price at the time the valuations are made, except for OTC Bulletin Board securities, which are valued at the mean of the latest bid and asked prices. A security that is listed or traded on more than one exchange is valued at the quotation on the exchange determined to be the primary market for such security. Listed securities not traded on a particular day are valued at the mean of the latest bid and asked prices for domestic securities and the last quoted sale price for international securities.
Investments in mutual funds are valued at the mutual fund’s closing net asset value per share on the day of valuation.
Other investments, including restricted securities and private placements, and those financial instruments for which the above valuation procedures are inappropriate or are deemed not to reflect fair value, are stated at fair value as determined in good faith by the T. Rowe Price Valuation Committee, established by the fund’s Board of Directors (the Board). Subject to oversight by the Board, the Valuation Committee develops pricing-related policies and procedures and approves all fair-value determinations. The Valuation Committee regularly makes good faith judgments, using a wide variety of sources and information, to establish and adjust valuations of certain securities as events occur and circumstances warrant. For instance, in determining the fair value of private-equity instruments, the Valuation Committee considers a variety of factors, including the company’s business prospects, its financial performance, strategic events impacting the company, relevant valuations of similar companies, new rounds of financing, and any negotiated transactions of significant size between other investors in the company. Because any fair-value determination involves a significant amount of judgment, there is a degree of subjectivity inherent in such pricing decisions.
For valuation purposes, the last quoted prices of non-U.S. equity securities may be adjusted under the circumstances described below. If the fund determines that developments between the close of a foreign market and the close of the NYSE will, in its judgment, materially affect the value of some or all of its portfolio securities, the fund will adjust the previous closing prices to reflect what it believes to be the fair value of the securities as of the close of the NYSE. In deciding whether it is necessary to adjust closing prices to reflect fair value, the fund reviews a variety of factors, including developments in foreign markets, the performance of U.S. securities markets, and the performance of instruments trading in U.S. markets that represent foreign securities and baskets of foreign securities. A fund may also fair value securities in other situations, such as when a particular foreign market is closed but the fund is open. The fund uses outside pricing services to provide it with closing prices and information to evaluate and/or adjust those prices. The fund cannot predict how often it will use closing prices and how often it will determine it necessary to adjust those prices to reflect fair value. As a means of evaluating its security valuation process, the fund routinely compares closing prices, the next day’s opening prices in the same markets, and adjusted prices. Additionally, trading in the underlying securities of the fund may take place in various foreign markets on certain days when the fund is not open for business and does not calculate a net asset value. As a result, net asset values may be significantly affected on days when shareholders cannot make transactions.
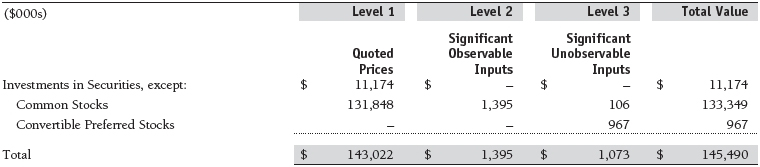
Valuation Inputs Various inputs are used to determine the value of the fund’s financial instruments. These inputs are summarized in the three broad levels listed below:
Level 1 – quoted prices in active markets for identical financial instruments
Level 2 – observable inputs other than Level 1 quoted prices (including, but not limited to, quoted prices for similar financial instruments, interest rates, prepayment speeds, and credit risk)
Level 3 – unobservable inputs
Observable inputs are those based on market data obtained from sources independent of the fund, and unobservable inputs reflect the fund’s own assumptions based on the best information available. The input levels are not necessarily an indication of the risk or liquidity associated with financial instruments at that level. For example, non-U.S. equity securities actively traded in foreign markets generally are reflected in Level 2 despite the availability of closing prices because the fund evaluates and determines whether those closing prices reflect fair value at the close of the NYSE or require adjustment, as described above. The following table summarizes the fund’s financial instruments, based on the inputs used to determine their values on June 30, 2012:
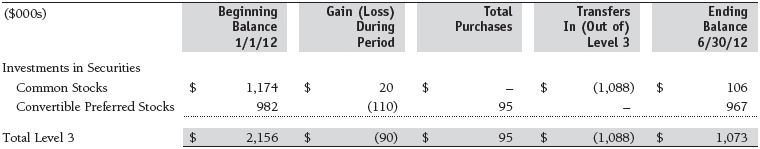
Following is a reconciliation of the fund’s Level 3 holdings for the six months ended June 30, 2012. Transfers into and out of Level 3 are reflected at the value of the financial instrument at the beginning of the period. Gain (loss) reflects both realized and change in unrealized gain (loss) on Level 3 holdings during the period, if any, and is included on the accompanying Statement of Operations. The change in unrealized gain (loss) on Level 3 instruments held at June 30, 2012, totaled $90,000 for the six months ended June 30, 2012.
NOTE 3 - OTHER INVESTMENT TRANSACTIONS
Consistent with its investment objective, the fund engages in the following practices to manage exposure to certain risks and/or to enhance performance. The investment objective, policies, program, and risk factors of the fund are described more fully in the fund’s prospectus and Statement of Additional Information.
Restricted Securities The fund may invest in securities that are subject to legal or contractual restrictions on resale. Prompt sale of such securities at an acceptable price may be difficult and may involve substantial delays and additional costs.
Securities Lending The fund lends its securities to approved brokers to earn additional income. It receives as collateral cash and U.S. government securities valued at 102% to 105% of the value of the securities on loan. Collateral is maintained over the life of the loan in an amount not less than the value of loaned securities as determined at the close of fund business each day; any additional collateral required due to changes in security values is delivered to the fund the next business day. Cash collateral is invested by the fund’s lending agent(s) in accordance with investment guidelines approved by management. Although risk is mitigated by the collateral, the fund could experience a delay in recovering its securities and a possible loss of income or value if the borrower fails to return the securities or if collateral investments decline in value. Securities lending revenue recognized by the fund consists of earnings on invested collateral and borrowing fees, net of any rebates to the borrower and compensation to the lending agent. In accordance with GAAP, investments made with cash collateral are reflected in the accompanying financial statements, but collateral received in the form of securities are not. At June 30, 2012, there were no securities on loan.
Other Purchases and sales of portfolio securities other than short-term securities aggregated $34,980,000 and $26,590,000, respectively, for the six months ended June 30, 2012.
NOTE 4 - FEDERAL INCOME TAXES
No provision for federal income taxes is required since the fund intends to continue to qualify as a regulated investment company under Subchapter M of the Internal Revenue Code and distribute to shareholders all of its taxable income and gains. Distributions determined in accordance with federal income tax regulations may differ in amount or character from net investment income and realized gains for financial reporting purposes. Financial reporting records are adjusted for permanent book/tax differences to reflect tax character but are not adjusted for temporary differences. The amount and character of tax-basis distributions and composition of net assets are finalized at fiscal year-end; accordingly, tax-basis balances have not been determined as of the date of this report.
The fund intends to retain realized gains to the extent of available capital loss carryforwards. Net realized capital losses may be carried forward indefinitely to offset future realized capital gains. As of December 31, 2011, the fund had $184,000 of available capital loss carryforwards.
At June 30, 2012, the cost of investments for federal income tax purposes was $124,402,000. Net unrealized gain aggregated $21,088,000 at period-end, of which $27,949,000 related to appreciated investments and $6,861,000 related to depreciated investments.
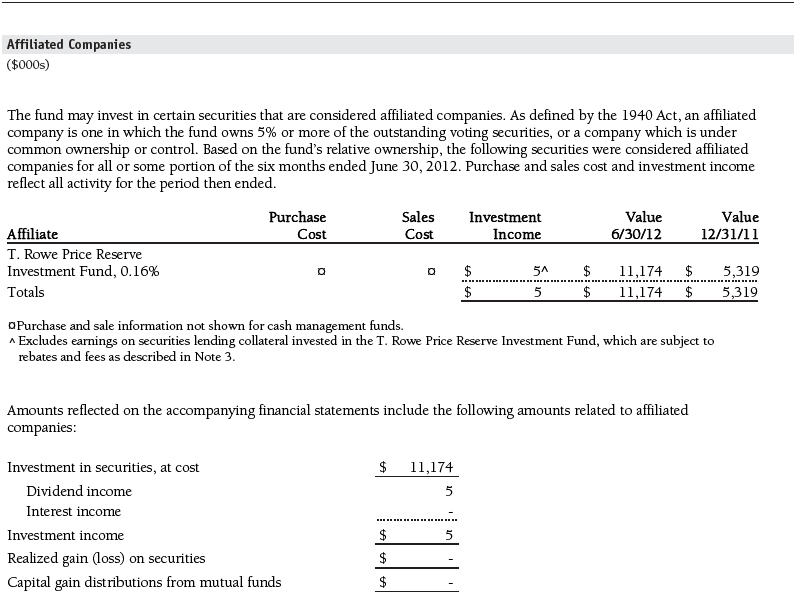
NOTE 5 - RELATED PARTY TRANSACTIONS
The fund is managed by T. Rowe Price Associates, Inc. (Price Associates), a wholly owned subsidiary of T. Rowe Price Group, Inc. (Price Group). The investment management and administrative agreement between the fund and Price Associates provides for an all-inclusive annual fee equal to 0.85% of the fund’s average daily net assets. The fee is computed daily and paid monthly. The all-inclusive fee covers investment management, shareholder servicing, transfer agency, accounting, and custody services provided to the fund, as well as fund directors’ fees and expenses; interest, taxes, brokerage commissions, and extraordinary expenses are paid directly by the fund.
The fund may invest in the T. Rowe Price Reserve Investment Fund and the T. Rowe Price Government Reserve Investment Fund (collectively, the T. Rowe Price Reserve Investment Funds), open-end management investment companies managed by Price Associates and considered affiliates of the fund. The T. Rowe Price Reserve Investment Funds are offered as cash management options to mutual funds, trusts, and other accounts managed by Price Associates and/or its affiliates and are not available for direct purchase by members of the public. The T. Rowe Price Reserve Investment Funds pay no investment management fees.
| Information on Proxy Voting Policies, Procedures, and Records |
A description of the policies and procedures used by T. Rowe Price funds and portfolios to determine how to vote proxies relating to portfolio securities is available in each fund’s Statement of Additional Information, which you may request by calling 1-800-225-5132 or by accessing the SEC’s website, sec.gov. The description of our proxy voting policies and procedures is also available on our website, troweprice.com. To access it, click on the words “Our Company” at the top of our corporate homepage. Then, when the next page appears, click on the words “Proxy Voting Policies” on the left side of the page.
Each fund’s most recent annual proxy voting record is available on our website and through the SEC’s website. To access it through our website, follow the directions above, then click on the words “Proxy Voting Records” on the right side of the Proxy Voting Policies page.
| How to Obtain Quarterly Portfolio Holdings |
The fund files a complete schedule of portfolio holdings with the Securities and Exchange Commission for the first and third quarters of each fiscal year on Form N-Q. The fund’s Form N-Q is available electronically on the SEC’s website (sec.gov); hard copies may be reviewed and copied at the SEC’s Public Reference Room, 100 F St. N.E., Washington, DC 20549. For more information on the Public Reference Room, call 1-800-SEC-0330.
| Approval of Investment Management Agreement |
On March 6, 2012, the fund’s Board of Directors (Board), including a majority of the fund’s independent directors, approved the continuation of the investment management agreement (Advisory Contract) between the fund and its investment advisor, T. Rowe Price Associates, Inc. (Advisor). In connection with its deliberations, the Board requested, and the Advisor provided, such information as the Board (with advice from independent legal counsel) deemed reasonably necessary. The Board considered a variety of factors in connection with its review of the Advisory Contract, also taking into account information provided by the Advisor during the course of the year, as discussed below:
Services Provided by the Advisor
The Board considered the nature, quality, and extent of the services provided to the fund by the Advisor. These services included, but were not limited to, directing the fund’s investments in accordance with its investment program and the overall management of the fund’s portfolio, as well as a variety of related activities such as financial, investment operations, and administrative services; compliance; maintaining the fund’s records and registrations; and shareholder communications. The Board also reviewed the background and experience of the Advisor’s senior management team and investment personnel involved in the management of the fund, as well as the Advisor’s compliance record. The Board concluded that it was satisfied with the nature, quality, and extent of the services provided by the Advisor.
Investment Performance of the Fund
The Board reviewed the fund’s average annual total returns over the three-month and 1-, 3-, 5-, and 10-year periods, as well as the fund’s year-by-year returns, and compared these returns with a wide variety of previously agreed upon comparable performance measures and market data, including those supplied by Lipper and Morningstar, which are independent providers of mutual fund data.
On the basis of this evaluation and the Board’s ongoing review of investment results, and factoring in the relative market conditions during certain of the performance periods, the Board concluded that the fund’s performance was satisfactory.
Costs, Benefits, Profits, and Economies of Scale
The Board reviewed detailed information regarding the revenues received by the Advisor under the Advisory Contract and other benefits that the Advisor (and its affiliates) may have realized from its relationship with the fund, including any research received under “soft dollar” agreements and commission-sharing arrangements with broker-dealers. The Board considered that the Advisor may receive some benefit from soft-dollar arrangements pursuant to which research is received from broker-dealers that execute the applicable fund’s portfolio transactions. The Board received information on the estimated costs incurred and profits realized by the Advisor from managing T. Rowe Price mutual funds. The Board also reviewed estimates of the profits realized from managing the fund in particular, and the Board concluded that the Advisor’s profits were reasonable in light of the services provided to the fund.
The Board also considered whether the fund benefits under the fee levels set forth in the Advisory Contract from any economies of scale realized by the Advisor. The Board noted that, under the Advisory Contract, the fund pays the Advisor a single fee based on the fund’s average daily net assets that includes investment management services and provides for the Advisor to pay all expenses of the fund’s operations except for interest, taxes, portfolio transaction fees, and any nonrecurring extraordinary expenses that may arise. The Board concluded that, based on the profitability data it reviewed and consistent with this single-fee structure, the Advisory Contract provided for a reasonable sharing of any benefits from economies of scale with the fund.
Fees
The Board was provided with information regarding industry trends in management fees and expenses, and the Board reviewed the fund’s single-fee structure in comparison with fees and expenses of other comparable funds based on information and data supplied by Lipper. For these purposes, the Board assumed that the fund’s management fee rate was equal to the single fee less the fund’s operating expenses. The information provided to the Board indicated that the fund’s management fee rate was above the median for comparable funds and that the fund’s total expense ratio was at or below the median for comparable funds.
The Board also reviewed the fee schedules for institutional accounts and private accounts with similar mandates that are advised or subadvised by the Advisor and its affiliates. Management provided the Board with information about the Advisor’s responsibilities and services provided to institutional account clients, including information about how the requirements and economics of the institutional business are fundamentally different from those of the mutual fund business. The Board considered information showing that the mutual fund business is generally more complex from a business and compliance perspective than the institutional business and that the Advisor generally performs significant additional services and assumes greater risk in managing the fund and other T. Rowe Price mutual funds than it does for institutional account clients.
On the basis of the information provided and the factors considered, the Board concluded that the fees paid by the fund under the Advisory Contract are reasonable.
Approval of the Advisory Contract
As noted, the Board approved the continuation of the Advisory Contract. No single factor was considered in isolation or to be determinative to the decision. Rather, the Board concluded, in light of a weighting and balancing of all factors considered, that it was in the best interests of the fund and its shareholders for the Board to approve the continuation of the Advisory Contract (including the fees to be charged for services thereunder). The independent directors were advised throughout the process by independent legal counsel.
Item 2. Code of Ethics.
A code of ethics, as defined in Item 2 of Form N-CSR, applicable to its principal executive officer, principal financial officer, principal accounting officer or controller, or persons performing similar functions is filed as an exhibit to the registrant’s annual Form N-CSR. No substantive amendments were approved or waivers were granted to this code of ethics during the registrant’s most recent fiscal half-year.
Item 3. Audit Committee Financial Expert.
Disclosure required in registrant’s annual Form N-CSR.
Item 4. Principal Accountant Fees and Services.
Disclosure required in registrant’s annual Form N-CSR.
Item 5. Audit Committee of Listed Registrants.
Not applicable.
Item 6. Investments.
(a) Not applicable. The complete schedule of investments is included in Item 1 of this Form N-CSR.
(b) Not applicable.
Item 7. Disclosure of Proxy Voting Policies and Procedures for Closed-End Management Investment Companies.
Not applicable.
Item 8. Portfolio Managers of Closed-End Management Investment Companies.
Not applicable.
Item 9. Purchases of Equity Securities by Closed-End Management Investment Company and Affiliated Purchasers.
Not applicable.
Item 10. Submission of Matters to a Vote of Security Holders.
Not applicable.
Item 11. Controls and Procedures.
(a) The registrant’s principal executive officer and principal financial officer have evaluated the registrant’s disclosure controls and procedures within 90 days of this filing and have concluded that the registrant’s disclosure controls and procedures were effective, as of that date, in ensuring that information required to be disclosed by the registrant in this Form N-CSR was recorded, processed, summarized, and reported timely.
(b) The registrant’s principal executive officer and principal financial officer are aware of no change in the registrant’s internal control over financial reporting that occurred during the registrant’s second fiscal quarter covered by this report that has materially affected, or is reasonably likely to materially affect, the registrant’s internal control over financial reporting.
Item 12. Exhibits.
(a)(1) The registrant’s code of ethics pursuant to Item 2 of Form N-CSR is filed with the registrant’s annual Form N-CSR.
(2) Separate certifications by the registrant's principal executive officer and principal financial officer, pursuant to Section 302 of the Sarbanes-Oxley Act of 2002 and required by Rule 30a-2(a) under the Investment Company Act of 1940, are attached.
(3) Written solicitation to repurchase securities issued by closed-end companies: not applicable.
(b) A certification by the registrant's principal executive officer and principal financial officer, pursuant to Section 906 of the Sarbanes-Oxley Act of 2002 and required by Rule 30a-2(b) under the Investment Company Act of 1940, is attached.
SIGNATURES
Pursuant to the requirements of the Securities Exchange Act of 1934 and the Investment Company Act of 1940, the registrant has duly caused this report to be signed on its behalf by the undersigned, thereunto duly authorized.
T. Rowe Price Equity Series, Inc.
| By | /s/ Edward C. Bernard |
| | Edward C. Bernard |
| | Principal Executive Officer |
| | |
| Date August 16, 2012 | | |
Pursuant to the requirements of the Securities Exchange Act of 1934 and the Investment Company Act of 1940, this report has been signed below by the following persons on behalf of the registrant and in the capacities and on the dates indicated.
| By | /s/ Edward C. Bernard |
| | Edward C. Bernard |
| | Principal Executive Officer |
| | |
| Date August 16, 2012 | | |
| | |
| | |
| By | /s/ Gregory K. Hinkle |
| | Gregory K. Hinkle |
| | Principal Financial Officer |
| | |
| Date August 16, 2012 | | |