UNITED STATES
SECURITIES AND EXCHANGE COMMISSION
Washington, D.C. 20549
FORM N-CSR
CERTIFIED SHAREHOLDER REPORT OF REGISTERED
MANAGEMENT INVESTMENT COMPANIES
Investment Company Act File Number: 811-07143
| T. Rowe Price Equity Series, Inc. |
|
| (Exact name of registrant as specified in charter) |
| |
| 100 East Pratt Street, Baltimore, MD 21202 |
|
| (Address of principal executive offices) |
| |
| David Oestreicher |
| 100 East Pratt Street, Baltimore, MD 21202 |
|
| (Name and address of agent for service) |
Registrant’s telephone number, including area code: (410) 345-2000
Date of fiscal year end: December 31
Date of reporting period: June 30, 2013
Item 1. Report to Shareholders
| New America Growth Portfolio | June 30, 2013 |
- Large-cap growth stocks posted strong gains in the first six months of the year.
- The New America Growth Portfolio returned 10.50% but trailed the S&P 500 and the Lipper peer group in the six-month reporting period due to stock selection in several sectors.
- The portfolio remained focused on identifying the most promising, larger-capitalization growth stocks in the fastest-growing sectors of the market.
- We are concerned about the political and economic turmoil overseas, but U.S. growth seems to be on firm footing. Monetary policy is likely to change in the coming months, but we believe that any further rise in interest rates would not derail stocks, as long as the increases are gradual.
The views and opinions in this report were current as of June 30, 2013. They are not guarantees of performance or investment results and should not be taken as investment advice. Investment decisions reflect a variety of factors, and the managers reserve the right to change their views about individual stocks, sectors, and the markets at any time. As a result, the views expressed should not be relied upon as a forecast of the fund’s future investment intent. The report is certified under the Sarbanes-Oxley Act, which requires mutual funds and other public companies to affirm that, to the best of their knowledge, the information in their financial reports is fairly and accurately stated in all material respects.
Manager’s Letter
T. Rowe Price New America Growth Portfolio
Dear Investor
Large-cap growth stocks rose during the first half of 2013. However, the period ended on a weak note after Federal Reserve Chairman Ben Bernanke unnerved markets when he commented that the Fed might scale back its monthly asset purchases later this year. In addition, first-quarter U.S. economic growth was revised downward from earlier estimates, which led to heightened volatility for equities. In this environment, the New America Growth Portfolio posted a solid gain.
Portfolio Performance
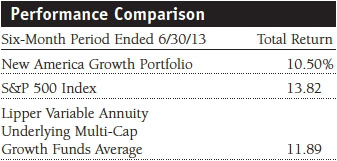
The New America Growth Portfolio returned 10.50% in the six months ended June 30, 2013. Although our absolute results were strong, the portfolio trailed the 13.82% return for the S&P 500 Index and the 11.89% return for the Lipper Variable Annuity Underlying Multi-Cap Growth Funds Average. Your portfolio’s largest sector allocations, information technology, consumer discretionary, and health care, generated strong contributions. Our comparison with the S&P 500 was hampered by stock selection in industrials and business services and information technology. However, our positioning in the consumer discretionary and financials sectors helped performance.
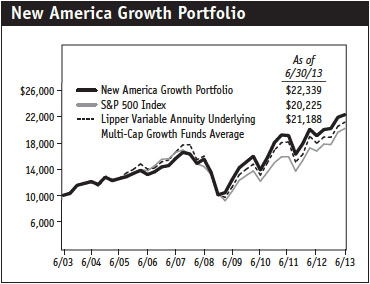
As shown in the Growth of $10,000 chart on page 6, your portfolio outpaced the S&P 500 Index and its Lipper peer group for the 10-year period ended June 30, 2013. Lipper also ranked the portfolio in the upper half of its category for the 5- and 10-year periods ended June 30, 2013. (Based on cumulative total return, Lipper ranked the New America Growth Portfolio 65 of 106, 54 of 96, 16 of 92, and 24 of 77 portfolios in its multi-cap growth funds universe for the 1-, 3-, 5-, and 10-year periods ended June 30, 2013, respectively. Past performance cannot guarantee future results.)
Market Environment
The U.S. economy steadily improved in the first half of 2013. Unlike the past two years, when signs of strength early in the year gave way to spring slowdowns, the economy was resilient despite federal spending cuts and higher tax rates that became effective in the first quarter. Home prices and consumer confidence levels surged to multiyear highs in May, while the jobless rate declined from 7.9% in January to 7.6% in June. The quickening economy raised speculation that the Fed would start winding down its monthly $85 billion asset purchase program, otherwise known as quantitative easing. Those expectations were affirmed most recently in June, when Federal Reserve Chairman Ben Bernanke said the Fed expects to scale back its asset purchases later this year, and possibly end them by mid-2014, if the U.S. economy continues to improve as expected. Bond yields surged and stocks sold off in the wake of Bernanke’s remarks as investors digested news of the impending tightening of monetary policy.
All sectors in the S&P 500 Index advanced over the past six months, but gains varied widely. Defensive sectors, including health care, utilities, and consumer staples, fared well early in the year as investors sought stocks with steady dividend payments in the low interest rate environment. More economically sensitive sectors such as consumer discretionary and financials gained favor in late April. During the reporting period, technology stocks were lackluster performers due to a general reluctance among businesses to invest in costly technology projects. Materials were pressured by weaker raw materials demand due to slowing growth in emerging markets including Brazil and China and, to a lesser extent, the ongoing recession in Europe.
Portfolio Review

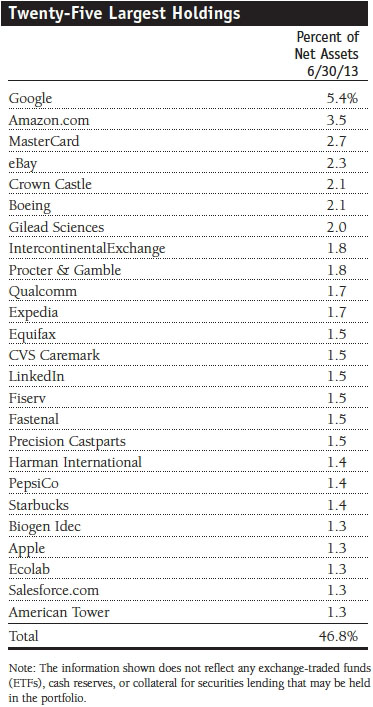
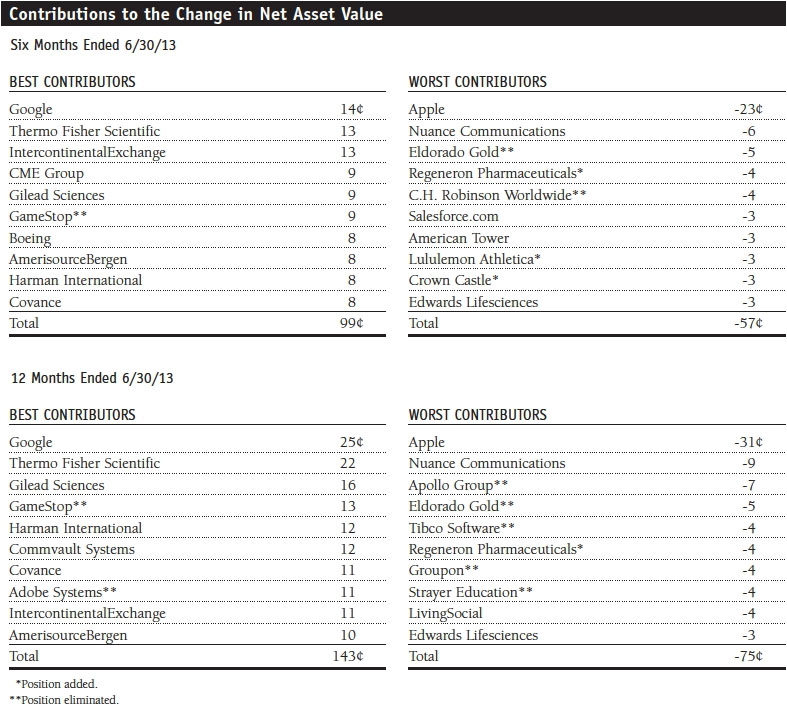
Over the past six months, the portfolio’s three best contributors were Google, Thermo Fisher Scientific, and IntercontinentalExchange (ICE). We significantly added to our position in Google, which we believe is a very high-quality company and has a great collection of assets and a visionary management team. It is also taking market share in the cyclical advertising market. The stock has certainly endured its share of fits and starts over the past few years, but in the past six months, the company seemed to be firing on all cylinders. On balance, we are impressed with the company’s Google+ initiative in social networking; its continued efforts in mobile, video, and display; and its Chrome search engine and software products. While the company’s growth is moderating, we think the stock valuation more than reflects this, allowing us to snap up shares at attractive prices. (Please refer to the portfolio of investments for a complete list of holdings and the amount each represents in the portfolio.)
The portfolio has been overweight in information technology for several years, but our emphasis shifted during the reporting period, and we significantly trimmed our allocation to the sector. Enterprise technology, in particular, has come under pressure, with many key companies trying to determine the shape and scope of the next tech generation. The markets for tablets and smartphones have matured. As a result, many firms have put their spending plans on hold. Cloud computing has grown, but there are few companies that offer direct exposure to this segment given our larger-capitalization focus.
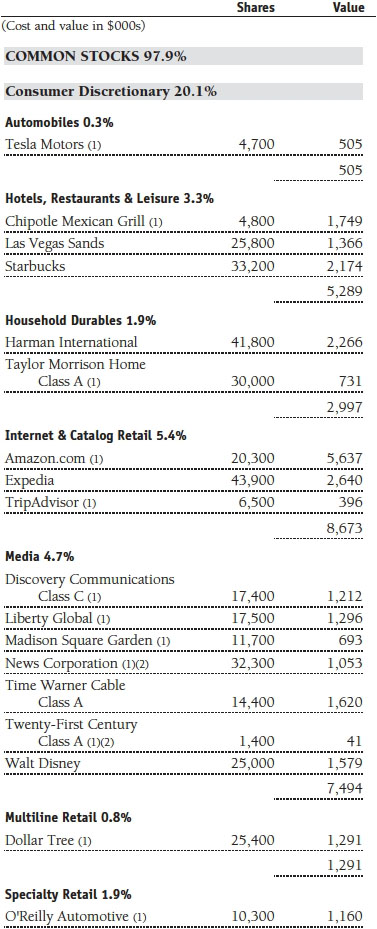
We increased our allocation to the consumer discretionary sector to benefit from improved household finances and positive labor and housing market trends. Inflation remains low, and we expect that dynamic to continue through the second half of the year. Consumer discretionary now accounts for about 20% of the portfolio, second behind our roughly 25% allocation to information technology.
Thermo Fisher Scientific has been a longtime holding and strong performer. The company is a global leader in the life sciences, tools, and services industry. Thermo derives the bulk of its $13 billion in annual sales from its life sciences products. The company’s services segment helps customers solve complex analytical challenges, improve patient diagnostics, and increase laboratory productivity. This year’s biggest catalyst for stellar share price performance was the acquisition of Life Technologies, which expands the firm’s capabilities and depth in genetic testing. Thermo has generated solid organic revenue growth and earnings. The company has regularly surpassed Wall Street’s earnings forecasts, and we expect revenues and earnings to climb at a double-digit rate through 2014.
Energy trading company IntercontinentalExchange was our third-best relative performance contributor in the first half of the year. It operates regulated global markets, clearinghouses, and a global electronic futures and over-the-counter market for trading derivatives based on energy, agricultural commodities, and financial assets in North America, the UK, and Brazil. ICE is the second-largest futures exchange in the U.S., primarily serving energy and utility companies, investment banks, hedge funds, and algorithmic traders. The company’s revenues are derived from trading volumes and, because of its fixed-cost business model, generates solid operating margins. We expect that the company can grow revenue by about 10% through 2014, which could translate into approximately 15% annual earnings growth. Late in the reporting period, ICE received unconditional approval from the European Commission for the acquisition of NYSE Euronext. However, the completion of the merger depends on approval by the Euronext College of Regulators, the Securities and Exchange Commission, and other regulators.
Apple was the portfolio’s largest first-half detractor. Apple was our largest position in 2012, accounting for about 5% of the portfolio for much of the year. Although the stock was our best contributor in 2012, it was our largest sale in the first half of this year. We concluded early in the year that Apple may not be able to grow its earnings in 2013. Of course, the company is launching several products that could revitalize growth, and we can certainly rebuild our position if we deem that appropriate. However, even when the company was executing flawlessly and experiencing strong growth, investors assigned a relatively low valuation to the company. We certainly considered this in making large sales of Apple, and we will continue to incorporate that into our thinking as we weigh the attractiveness of the stock relative to investment alternatives.
Our other largest detractors, Nuance Communications and Eldorado Gold, had far less impact on the portfolio’s results. Nuance is a global provider of voice recognition products for mobile computing and the health care industry. However, the stock sold off in February after the company reported weak fiscal first-quarter earnings, which were mostly in line with expectations. Guidance for the second quarter and fiscal year were substantially below consensus estimates and that may have been more damaging to the share price, which plunged about 20% immediately after the release. CEO Paul Ricci said that European revenues were slowing on macroeconomic concerns. Our thesis for owning the stock has deteriorated, and we trimmed the position, regrettably into weakness. The short explanation for Eldorado Gold’s poor performance is in its name. Gold has fallen more than 30% since its peak near $1,900 per ounce last year, and mining companies have suffered. We took our lumps and eliminated our position in Eldorado.
Outlook
The U.S. economy continues to expand at a stronger pace than most of the developed world. We are transitioning from a stimulus-driven to a market-driven U.S. economic environment as the Fed begins to ratchet down its asset purchase program and eventually starts to raise interest rates. This changing dynamic should prove healthy over the long run since stocks will be influenced more by fundamental factors than by monetary easing. While we don’t expect the second half of the year to be as robust as the first half, most investors have been underexposed to equities in recent years. A shift from fixed income to stocks in the coming months, should that occur, will serve to underpin equity prices down the road.
As always, our investment strategy relies on our fundamental research and bottom-up stock selection as we attempt to position the fund for the best opportunities in our investment universe. We remain optimistic about our ability to deliver favorable relative returns over the long term.
Finally, I wish to inform you that Joe Milano, the manager of your portfolio since 2002, has left T. Rowe Price to pursue other opportunities. I worked with Joe for several years, and I would like to acknowledge the success he had in managing this portfolio. On May 13, 2013, I assumed the role of portfolio manager of the New America Growth Portfolio and chairman of its Investment Advisory Committee. Under the transition plan, I will hand off my responsibilities as portfolio manager of the T. Rowe Price Media & Telecommunications Fund on October 1, 2013.
Respectfully submitted,
 Daniel Martino
Chairman of the portfolio’s Investment Advisory CommitteeJuly 19, 2013
The committee chairman has day-to-day responsibility for managing the portfolio and works with committee members in developing and executing its investment program.
The portfolio’s share price can fall because of weakness in the stock markets, a particular industry, or specific holdings. Stock markets can decline for many reasons, including adverse political or economic developments, changes in investor psychology, or heavy institutional selling. The prospects for an industry or company may deteriorate because of a variety of factors, including disappointing earnings or changes in the competitive environment. In addition, the investment manager’s assessment of companies held in a portfolio may prove incorrect, resulting in losses or poor performance even in rising markets.
Lipper averages: The average return of all portfolios in a particular category as defined by Lipper Inc.
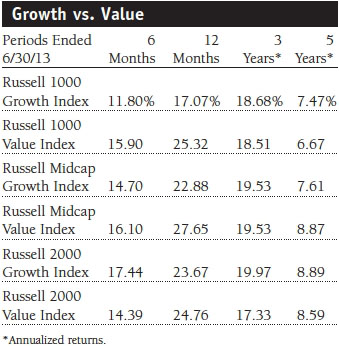
Russell 1000 Growth Index: An index that tracks the performance of large-cap stocks with higher price-to-book ratios and higher forecast growth values.
Russell 1000 Value Index: An index that tracks the performance of large-cap stocks with lower price-to-book ratios and lower forecast growth values.
Russell 2000 Growth Index: An index that tracks the performance of small-cap stocks with higher price-to-book ratios and higher forecast growth values.
Russell 2000 Value Index: An index that tracks the performance of small-cap stocks with lower price-to-book ratios and lower forecast growth values.
Russell Midcap Growth Index: An index that tracks the performance of mid-cap stocks with higher price-to-book ratios and higher forecast growth values.
Russell Midcap Value Index: An index that tracks the performance of mid-cap stocks with lower price-to-book ratios and lower forecast growth values.
S&P 500 Index: An unmanaged index that tracks the stocks of 500 primarily large-cap U.S. companies.
Note: Russell Investment Group is the source and owner of the trademarks, service marks, and copyrights related to the Russell indexes. Russell® is a trademark of Russell Investment Group.
Portfolio Highlights
Performance and Expenses
T. Rowe Price New America Growth Portfolio
This chart shows the value of a hypothetical $10,000 investment in the portfolio over the past 10 fiscal year periods or since inception (for portfolios lacking 10-year records). The result is compared with benchmarks, which may include a broad-based market index and a peer group average or index. Market indexes do not include expenses, which are deducted from portfolio returns as well as mutual fund averages and indexes.

Fund Expense Example
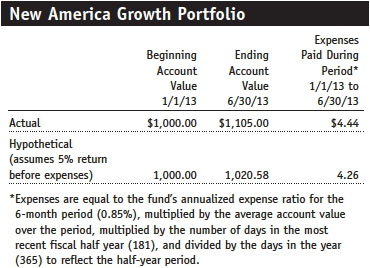
As a mutual fund shareholder, you may incur two types of costs: (1) transaction costs, such as redemption fees or sales loads, and (2) ongoing costs, including management fees, distribution and service (12b-1) fees, and other fund expenses. The following example is intended to help you understand your ongoing costs (in dollars) of investing in the fund and to compare these costs with the ongoing costs of investing in other mutual funds. The example is based on an investment of $1,000 invested at the beginning of the most recent six-month period and held for the entire period.
Actual Expenses
The first line of the following table (Actual) provides information about actual account values and actual expenses. You may use the information on this line, together with your account balance, to estimate the expenses that you paid over the period. Simply divide your account value by $1,000 (for example, an $8,600 account value divided by $1,000 = 8.6), then multiply the result by the number on the first line under the heading “Expenses Paid During Period” to estimate the expenses you paid on your account during this period.
Hypothetical Example for Comparison Purposes
The information on the second line of the table (Hypothetical) is based on hypothetical account values and expenses derived from the fund’s actual expense ratio and an assumed 5% per year rate of return before expenses (not the fund’s actual return). You may compare the ongoing costs of investing in the fund with other funds by contrasting this 5% hypothetical example and the 5% hypothetical examples that appear in the shareholder reports of the other funds. The hypothetical account values and expenses may not be used to estimate the actual ending account balance or expenses you paid for the period.
You should also be aware that the expenses shown in the table highlight only your ongoing costs and do not reflect any transaction costs, such as redemption fees or sales loads. Therefore, the second line of the table is useful in comparing ongoing costs only and will not help you determine the relative total costs of owning different funds. To the extent a fund charges transaction costs, however, the total cost of owning that fund is higher.
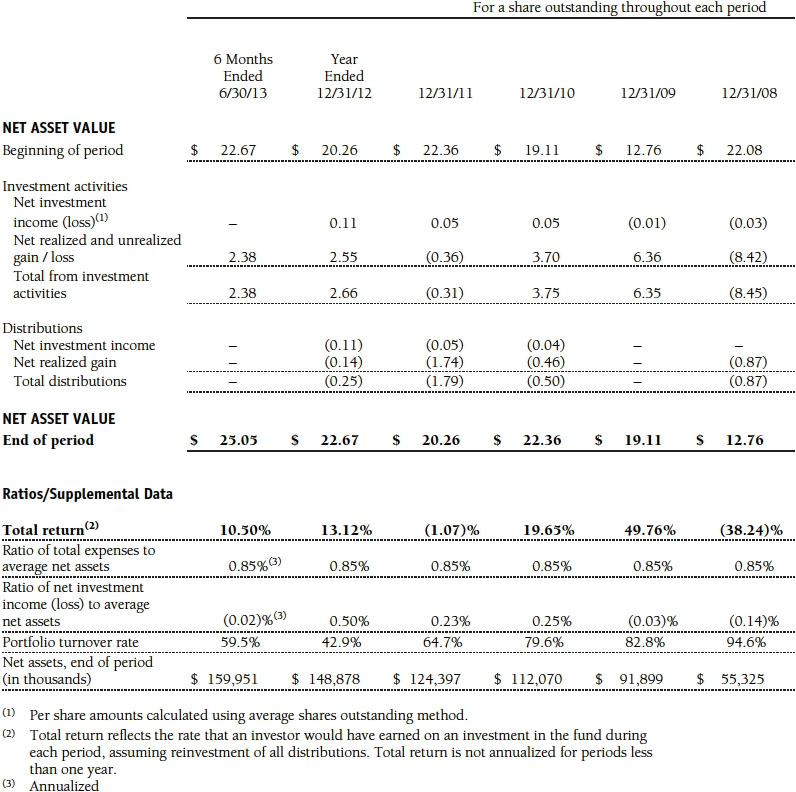
Financial Highlights
T. Rowe Price New America Growth Portfolio
(Unaudited)
The accompanying notes are an integral part of these financial statements.
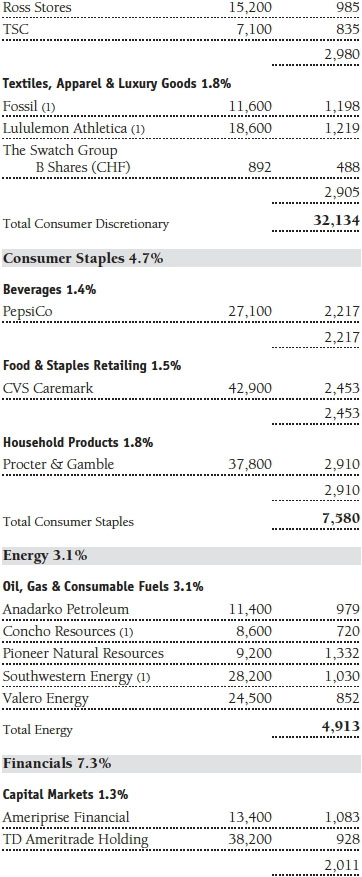
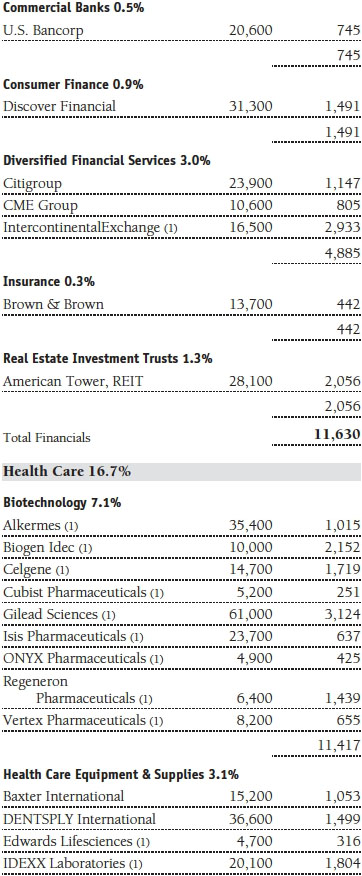
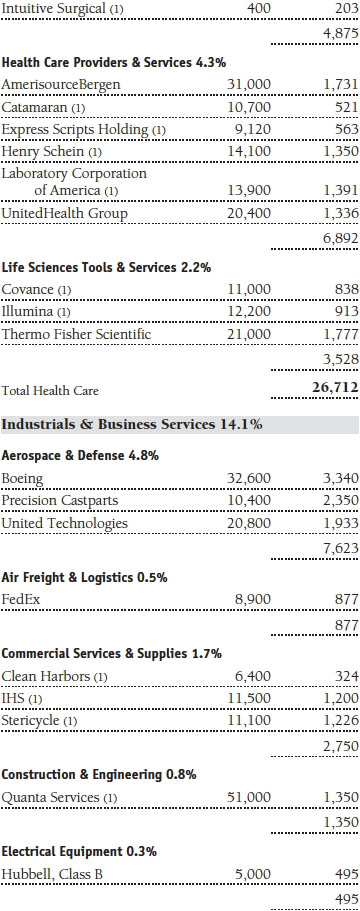
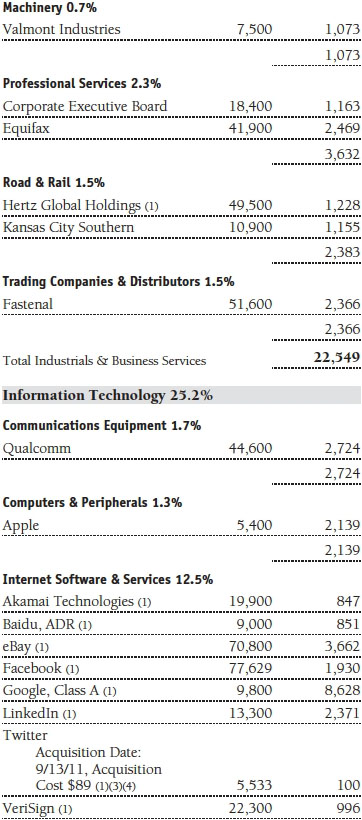
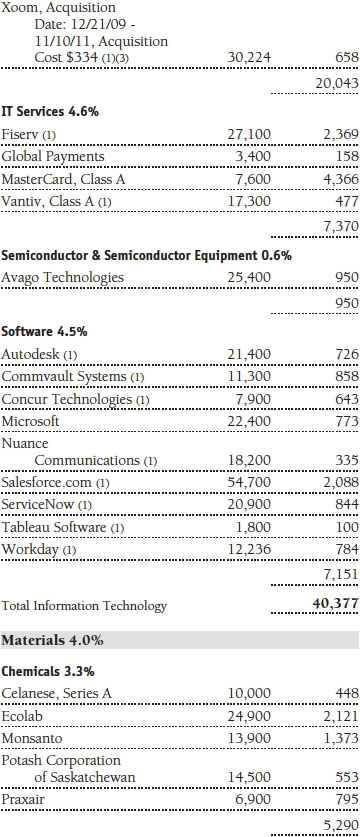
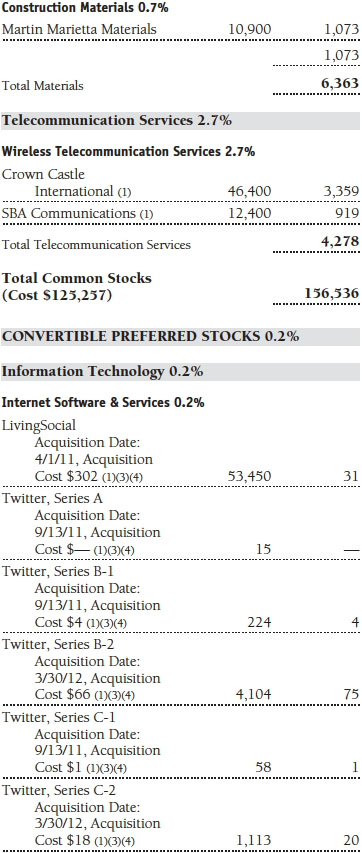
Portfolio of Investments‡
T. Rowe Price New America Growth Portfolio
June 30, 2013 (Unaudited)


The accompanying notes are an integral part of these financial statements.
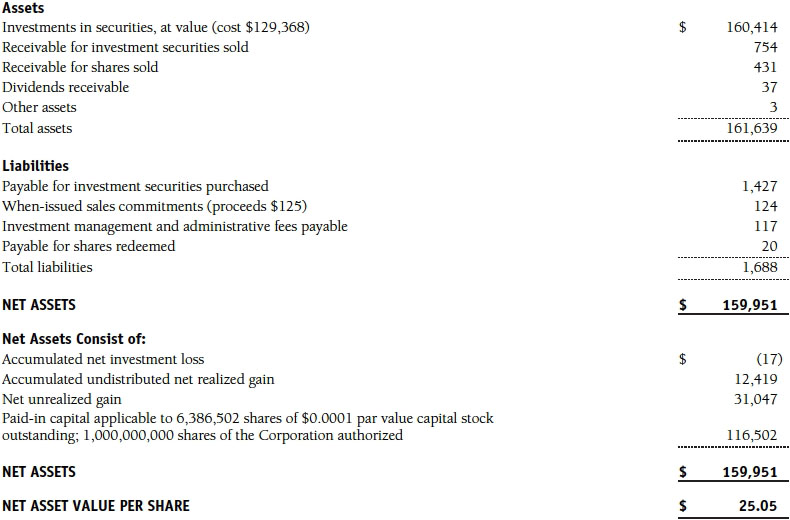
Statement of Assets and Liabilities
T. Rowe Price New America Growth Portfolio
June 30, 2013 (Unaudited)
($000s, except shares and per share amounts)
The accompanying notes are an integral part of these financial statements.
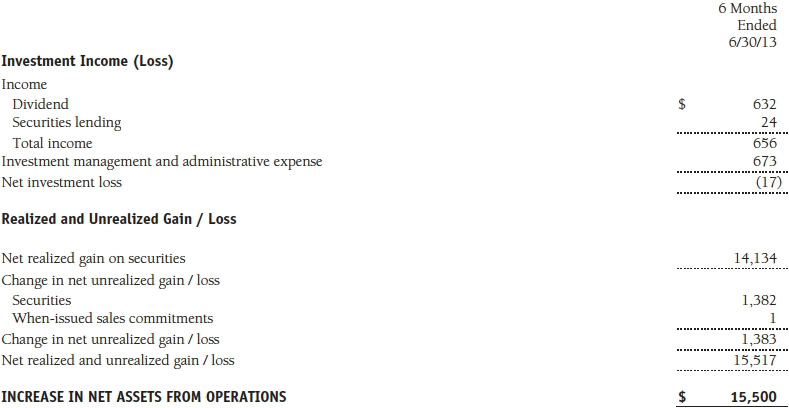
Statement of Operations
T. Rowe Price New America Growth Portfolio
(Unaudited)
($000s)
The accompanying notes are an integral part of these financial statements.
Statement of Changes in Net Assets
T. Rowe Price New America Growth Portfolio
(Unaudited)
($000s)

The accompanying notes are an integral part of these financial statements.
Notes to Financial Statements
T. Rowe Price New America Growth Portfolio
June 30, 2013 (Unaudited)
T. Rowe Price Equity Series, Inc. (the corporation), is registered under the Investment Company Act of 1940 (the 1940 Act). The New America Growth Portfolio (the fund) is a diversified, open-end management investment company established by the corporation. The fund commenced operations on March 31, 1994. The fund seeks to provide long-term capital growth by investing primarily in the common stocks of growth companies. Shares of the fund are currently offered only through certain insurance companies as an investment medium for both variable annuity contracts and variable life insurance policies.
NOTE 1 - SIGNIFICANT ACCOUNTING POLICIES
Basis of Preparation The accompanying financial statements were prepared in accordance with accounting principles generally accepted in the United States of America (GAAP), which require the use of estimates made by management. Management believes that estimates and valuations are appropriate; however, actual results may differ from those estimates, and the valuations reflected in the accompanying financial statements may differ from the value ultimately realized upon sale or maturity.
Investment Transactions, Investment Income, and Distributions Income and expenses are recorded on the accrual basis. Dividends received from mutual fund investments are reflected as dividend income; capital gain distributions are reflected as realized gain/loss. Dividend income and capital gain distributions are recorded on the ex-dividend date. Income tax-related interest and penalties, if incurred, would be recorded as income tax expense. Investment transactions are accounted for on the trade date. Realized gains and losses are reported on the identified cost basis. Distributions to shareholders are recorded on the ex-dividend date. Income distributions are declared and paid annually. Capital gain distributions, if any, are generally declared and paid by the fund annually.
Currency Translation Assets, including investments, and liabilities denominated in foreign currencies are translated into U.S. dollar values each day at the prevailing exchange rate, using the mean of the bid and asked prices of such currencies against U.S. dollars as quoted by a major bank. Purchases and sales of securities, income, and expenses are translated into U.S. dollars at the prevailing exchange rate on the date of the transaction. The effect of changes in foreign currency exchange rates on realized and unrealized security gains and losses is reflected as a component of security gains and losses.
Rebates Subject to best execution, the fund may direct certain security trades to brokers who have agreed to rebate a portion of the related brokerage commission to the fund in cash. Commission rebates are reflected as realized gain on securities in the accompanying financial statements and totaled $3,000 for the six months ended June 30, 2013.
Credits Credits are earned on the fund’s temporarily uninvested cash balances held at the custodian and such credits reduce the amount paid by the manager for custody of the fund’s assets. In order to pass the benefit of custody credits to the fund, the manager has voluntarily reduced its investment management and administrative expense in the accompanying financial statements.
New Accounting Guidance In December 2011, the Financial Accounting Standards Board issued amended guidance requiring an entity to disclose information about offsetting and related arrangements to enable users of its financial statements to understand the effect of those arrangements on its financial position. The guidance is effective for fiscal years and interim periods beginning on or after January 1, 2013. Adoption had no effect on the fund’s net assets or results of operations.
NOTE 2 - VALUATION
The fund’s financial instruments are valued and its net asset value (NAV) per share is computed at the close of the New York Stock Exchange (NYSE), normally 4 p.m. ET, each day the NYSE is open for business.
Fair Value The fund’s financial instruments are reported at fair value, which GAAP defines as the price that would be received to sell an asset or paid to transfer a liability in an orderly transaction between market participants at the measurement date. The T. Rowe Price Valuation Committee (the Valuation Committee) has been established by the fund’s Board of Directors (the Board) to ensure that financial instruments are appropriately priced at fair value in accordance with GAAP and the 1940 Act. Subject to oversight by the Board, the Valuation Committee develops and oversees pricing-related policies and procedures and approves all fair value determinations. Specifically, the Valuation Committee establishes procedures to value securities; determines pricing techniques, sources, and persons eligible to effect fair value pricing actions; oversees the selection, services, and performance of pricing vendors; oversees valuation-related business continuity practices; and provides guidance on internal controls and valuation-related matters. The Valuation Committee reports to the fund’s Board; is chaired by the fund’s treasurer; and has representation from legal, portfolio management and trading, operations, and risk management.
Various valuation techniques and inputs are used to determine the fair value of financial instruments. GAAP establishes the following fair value hierarchy that categorizes the inputs used to measure fair value:
Level 1 – quoted prices (unadjusted) in active markets for identical financial instruments that the fund can access at the reporting date
Level 2 – inputs other than Level 1 quoted prices that are observable, either directly or indirectly (including, but not limited to, quoted prices for similar financial instruments in active markets, quoted prices for identical or similar financial instruments in inactive markets, interest rates and yield curves, implied volatilities, and credit spreads)
Level 3 – unobservable inputs
Observable inputs are developed using market data, such as publicly available information about actual events or transactions, and reflect the assumptions that market participants would use to price the financial instrument. Unobservable inputs are those for which market data are not available and are developed using the best information available about the assumptions that market participants would use to price the financial instrument. GAAP requires valuation techniques to maximize the use of relevant observable inputs and minimize the use of unobservable inputs. When multiple inputs are used to derive fair value, the financial instrument is assigned to the level within the fair value hierarchy based on the lowest-level input that is significant to the fair value of the financial instrument. Input levels are not necessarily an indication of the risk or liquidity associated with financial instruments at that level but rather the degree of judgment used in determining those values.
Valuation Techniques Equity securities listed or regularly traded on a securities exchange or in the over-the-counter (OTC) market are valued at the last quoted sale price or, for certain markets, the official closing price at the time the valuations are made. OTC Bulletin Board securities are valued at the mean of the closing bid and asked prices. A security that is listed or traded on more than one exchange is valued at the quotation on the exchange determined to be the primary market for such security. Listed securities not traded on a particular day are valued at the mean of the closing bid and asked prices for domestic securities and the last quoted sale or closing price for international securities.
For valuation purposes, the last quoted prices of non-U.S. equity securities may be adjusted to reflect the fair value of such securities at the close of the NYSE. If the fund determines that developments between the close of a foreign market and the close of the NYSE will, in its judgment, materially affect the value of some or all of its portfolio securities, the fund will adjust the previous quoted prices to reflect what it believes to be the fair value of the securities as of the close of the NYSE. In deciding whether it is necessary to adjust quoted prices to reflect fair value, the fund reviews a variety of factors, including developments in foreign markets, the performance of U.S. securities markets, and the performance of instruments trading in U.S. markets that represent foreign securities and baskets of foreign securities. The fund may also fair value securities in other situations, such as when a particular foreign market is closed but the fund is open. The fund uses outside pricing services to provide it with quoted prices and information to evaluate and/or adjust those prices. The fund cannot predict how often it will use quoted prices and how often it will determine it necessary to adjust those prices to reflect fair value. As a means of evaluating its security valuation process, the fund routinely compares quoted prices, the next day’s opening prices in the same markets, and adjusted prices.
Actively traded domestic equity securities generally are categorized in Level 1 of the fair value hierarchy. Non-U.S. equity securities generally are categorized in Level 2 of the fair value hierarchy despite the availability of quoted prices because, as described above, the fund evaluates and determines whether those quoted prices reflect fair value at the close of the NYSE or require adjustment. OTC Bulletin Board securities, certain preferred securities, and equity securities traded in inactive markets generally are categorized in Level 2 of the fair value hierarchy.
Investments in mutual funds are valued at the mutual fund’s closing net asset value per share on the day of valuation and are categorized in Level 1 of the fair value hierarchy. Assets and liabilities other than financial instruments, including short-term receivables and payables, are carried at cost, or estimated realizable value, if less, which approximates fair value.
Thinly traded financial instruments and those for which the above valuation procedures are inappropriate or are deemed not to reflect fair value are stated at fair value as determined in good faith by the Valuation Committee. The objective of any fair value pricing determination is to arrive at a price that could reasonably be expected from a current sale. Financial instruments fair valued by the Valuation Committee are primarily private placements, restricted securities, warrants, rights, and other securities that are not publicly traded.
Subject to oversight by the Board, the Valuation Committee regularly makes good faith judgments to establish and adjust the fair valuations of certain securities as events occur and circumstances warrant. For instance, in determining the fair value of an equity investment with limited market activity, such as a private placement or a thinly traded public company stock, the Valuation Committee considers a variety of factors, which may include, but are not limited to, the issuer’s business prospects, its financial standing and performance, recent investment transactions in the issuer, new rounds of financing, negotiated transactions of significant size between other investors in the company, relevant market valuations of peer companies, strategic events affecting the company, market liquidity for the issuer, and general economic conditions and events. In consultation with the investment and pricing teams, the Valuation Committee will determine an appropriate valuation technique based on available information, which may include both observable and unobservable inputs. The Valuation Committee typically will afford greatest weight to actual prices in arm’s length transactions, to the extent they represent orderly transactions between market participants; transaction information can be reliably obtained; and prices are deemed representative of fair value. However, the Valuation Committee may also consider other valuation methods such as market-based valuation multiples; a discount or premium from market value of a similar, freely traded security of the same issuer; or some combination. Fair value determinations are reviewed on a regular basis and updated as information becomes available, including actual purchase and sale transactions of the issue. Because any fair value determination involves a significant amount of judgment, there is a degree of subjectivity inherent in such pricing decisions and fair value prices determined by the Valuation Committee could differ from those of other market participants. Depending on the relative significance of unobservable inputs, including the valuation technique(s) used, fair valued securities may be categorized in Level 2 or 3 of the fair value hierarchy.
Valuation Inputs The following table summarizes the fund’s financial instruments, based on the inputs used to determine their fair values on June 30, 2013:
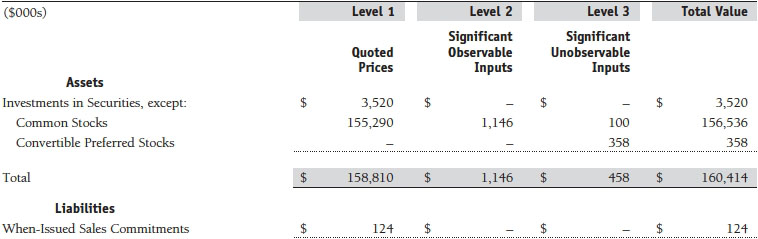
There were no material transfers between Levels 1 and 2 during the period.
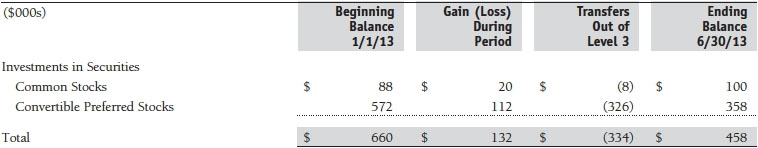
Following is a reconciliation of the fund’s Level 3 holdings for the six months ended June 30, 2013. Gain (loss) reflects both realized and change in unrealized gain/loss on Level 3 holdings during the period, if any, and is included on the accompanying Statement of Operations. The change in unrealized gain/loss on Level 3 instruments held at June 30, 2013, totaled $142,000 for the six months ended June 30, 2013. Transfers into and out of Level 3 are reflected at the value of the financial instrument at the beginning of the period. During the six months, transfers out of Level 3 were because observable market data became available for the securities
NOTE 3 - OTHER INVESTMENT TRANSACTIONS
Consistent with its investment objective, the fund engages in the following practices to manage exposure to certain risks and/or to enhance performance. The investment objective, policies, program, and risk factors of the fund are described more fully in the fund’s prospectus and Statement of Additional Information.
Restricted Securities The fund may invest in securities that are subject to legal or contractual restrictions on resale. Prompt sale of such securities at an acceptable price may be difficult and may involve substantial delays and additional costs.
Securities Lending The fund lends its securities to approved brokers to earn additional income. Its securities lending activities are administered by a lending agent in accordance with a securities lending agreement. It receives as collateral cash and U.S. government securities valued at 102% to 105% of the value of the securities on loan. Collateral is maintained over the life of the loan in an amount not less than the value of loaned securities; any additional collateral required due to changes in security values is delivered to the fund the next business day. Cash collateral is invested by the fund’s lending agent(s) in accordance with investment guidelines approved by management. Additionally, the lending agent indemnifies the fund against losses resulting from borrower default. Although risk is mitigated by the collateral, the fund could experience a delay in recovering its securities and a possible loss of income or value if the borrower fails to return the securities, collateral investments decline in value, or the lending agent fails to perform. Securities lending revenue recognized by the fund consists of earnings on invested collateral and borrowing fees, net of any rebates to the borrower, compensation to the lending agent and other administrative costs. In accordance with GAAP, investments made with cash collateral are reflected in the accompanying financial statements, but collateral received in the form of securities is not. At June 30, 2013, there were no securities on loan.
When-Issued Securities The fund may enter into when-issued purchases and/or sales commitments, pursuant to which it agrees to purchase or sell, respectively, the underlying security for a fixed unit price, with payment and delivery at a scheduled future date generally beyond the customary settlement period for such securities. When-issued refers to securities that have not yet been issued but will be issued in the future and may include new securities or securities obtained through a corporate action on a current holding. The fund normally purchases when-issued securities with the intention of taking possession but may enter into a separate agreement to sell the securities before the settlement date. Until settlement, the fund maintains cash reserves and liquid assets sufficient to settle its when-issued commitments. Amounts realized on when-issued transactions are included with realized gain/loss on securities in the accompanying financial statements.
Other Purchases and sales of portfolio securities other than short-term securities aggregated $91,734,000 and $89,940,000, respectively, for the six months ended June 30, 2013.
NOTE 4 - FEDERAL INCOME TAXES
No provision for federal income taxes is required since the fund intends to continue to qualify as a regulated investment company under Subchapter M of the Internal Revenue Code and distribute to shareholders all of its taxable income and gains. Distributions determined in accordance with federal income tax regulations may differ in amount or character from net investment income and realized gains for financial reporting purposes. Financial reporting records are adjusted for permanent book/tax differences to reflect tax character but are not adjusted for temporary differences. The amount and character of tax-basis distributions and composition of net assets are finalized at fiscal year-end; accordingly, tax-basis balances have not been determined as of the date of this report.
The fund intends to retain realized gains to the extent of available capital loss carryforwards. Net realized capital losses may be carried forward indefinitely to offset future realized capital gains. As of December 31, 2012, the fund had $627,000 of available capital loss carryforwards.
At June 30, 2013, the cost of investments for federal income tax purposes was $130,257,000. Net unrealized gain aggregated $30,158,000 at period-end, of which $33,145,000 related to appreciated investments and $2,987,000 related to depreciated investments.
NOTE 5 - RELATED PARTY TRANSACTIONS
The fund is managed by T. Rowe Price Associates, Inc. (Price Associates), a wholly owned subsidiary of T. Rowe Price Group, Inc. (Price Group). The investment management and administrative agreement between the fund and Price Associates provides for an all-inclusive annual fee equal to 0.85% of the fund’s average daily net assets. The fee is computed daily and paid monthly. The all-inclusive fee covers investment management, shareholder servicing, transfer agency, accounting, and custody services provided to the fund, as well as fund directors’ fees and expenses. Interest, taxes, brokerage commissions, and extraordinary expenses are paid directly by the fund.
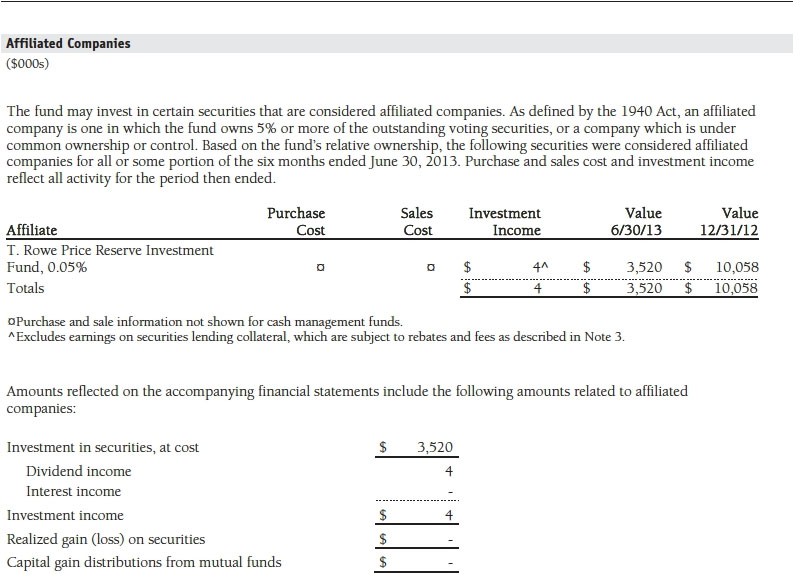
The fund may invest in the T. Rowe Price Reserve Investment Fund and the T. Rowe Price Government Reserve Investment Fund (collectively, the T. Rowe Price Reserve Investment Funds), open-end management investment companies managed by Price Associates and considered affiliates of the fund. The T. Rowe Price Reserve Investment Funds are offered as cash management options to mutual funds, trusts, and other accounts managed by Price Associates and/or its affiliates and are not available for direct purchase by members of the public. The T. Rowe Price Reserve Investment Funds pay no investment management fees.
| Information on Proxy Voting Policies, Procedures, and Records |
A description of the policies and procedures used by T. Rowe Price funds and portfolios to determine how to vote proxies relating to portfolio securities is available in each fund’s Statement of Additional Information. You may request this document by calling 1-800-225-5132 or by accessing the SEC’s website, sec.gov.
The description of our proxy voting policies and procedures is also available on our website, troweprice.com. To access it, click on the words “Social Responsibility” at the top of our corporate homepage. Next, click on the words “Conducting Business Responsibly” on the left side of the page that appears. Finally, click on the words “Proxy Voting Policies” on the left side of the page that appears.
Each fund’s most recent annual proxy voting record is available on our website and through the SEC’s website. To access it through our website, follow the directions above to reach the “Conducting Business Responsibly” page. Click on the words “Proxy Voting Records” on the left side of that page, and then click on the “View Proxy Voting Records” link at the bottom of the page that appears.
| How to Obtain Quarterly Portfolio Holdings |
The fund files a complete schedule of portfolio holdings with the Securities and Exchange Commission for the first and third quarters of each fiscal year on Form N-Q. The fund’s Form N-Q is available electronically on the SEC’s website (sec.gov); hard copies may be reviewed and copied at the SEC’s Public Reference Room, 100 F St. N.E., Washington, DC 20549. For more information on the Public Reference Room, call 1-800-SEC-0330.
| Approval of Investment Management Agreement |
On March 5, 2013, the fund’s Board of Directors (Board), including a majority of the fund’s independent directors, approved the continuation of the investment management agreement (Advisory Contract) between the fund and its investment advisor, T. Rowe Price Associates, Inc. (Advisor). In connection with its deliberations, the Board requested, and the Advisor provided, such information as the Board (with advice from independent legal counsel) deemed reasonably necessary. The Board considered a variety of factors in connection with its review of the Advisory Contract, also taking into account information provided by the Advisor during the course of the year, as discussed below:
Services Provided by the Advisor
The Board considered the nature, quality, and extent of the services provided to the fund by the Advisor. These services included, but were not limited to, directing the fund’s investments in accordance with its investment program and the overall management of the fund’s portfolio, as well as a variety of related activities such as financial, investment operations, and administrative services; compliance; maintaining the fund’s records and registrations; and shareholder communications. The Board also reviewed the background and experience of the Advisor’s senior management team and investment personnel involved in the management of the fund, as well as the Advisor’s compliance record. The Board concluded that it was satisfied with the nature, quality, and extent of the services provided by the Advisor.
Investment Performance of the Fund
The Board reviewed the fund’s three-month, one-year, and year-by-year returns, as well as the fund’s average annualized total returns over the 3-, 5-, and 10-year periods, and compared these returns with a wide variety of previously agreed upon comparable performance measures and market data, including those supplied by Lipper and Morningstar, which are independent providers of mutual fund data.
On the basis of this evaluation and the Board’s ongoing review of investment results, and factoring in the relative market conditions during certain of the performance periods, the Board concluded that the fund’s performance was satisfactory.
Costs, Benefits, Profits, and Economies of Scale
The Board reviewed detailed information regarding the revenues received by the Advisor under the Advisory Contract and other benefits that the Advisor (and its affiliates) may have realized from its relationship with the fund, including any research received under “soft dollar” agreements and commission-sharing arrangements with broker-dealers. The Board considered that the Advisor may receive some benefit from soft-dollar arrangements pursuant to which research is received from broker-dealers that execute the applicable fund’s portfolio transactions. The Board received information on the estimated costs incurred and profits realized by the Advisor from managing T. Rowe Price mutual funds. The Board also reviewed estimates of the profits realized from managing the fund in particular, and the Board concluded that the Advisor’s profits were reasonable in light of the services provided to the fund.
The Board also considered whether the fund benefits under the fee levels set forth in the Advisory Contract from any economies of scale realized by the Advisor. The Board noted that, under the Advisory Contract, the fund pays the Advisor a single fee based on the fund’s average daily net assets that includes investment management services and provides for the Advisor to pay all expenses of the fund’s operations except for interest, taxes, portfolio transaction fees, and any nonrecurring extraordinary expenses that may arise. The Board concluded that, based on the profitability data it reviewed and consistent with this single-fee structure, the Advisory Contract provided for a reasonable sharing of any benefits from economies of scale with the fund.
Fees
The Board was provided with information regarding industry trends in management fees and expenses, and the Board reviewed the fund’s single-fee structure in comparison with fees and expenses of other comparable funds based on information and data supplied by Lipper. For these purposes, the Board assumed that the fund’s management fee rate was equal to the single fee less the fund’s operating expenses. The information provided to the Board indicated that the fund’s management fee rate was above the median for comparable funds and the total expense ratio was below the median for comparable funds.
The Board also reviewed the fee schedules for institutional accounts and private accounts with similar mandates that are advised or subadvised by the Advisor and its affiliates. Management provided the Board with information about the Advisor’s responsibilities and services provided to institutional account clients, including information about how the requirements and economics of the institutional business are fundamentally different from those of the mutual fund business. The Board considered information showing that the mutual fund business is generally more complex from a business and compliance perspective than the institutional business and that the Advisor generally performs significant additional services and assumes greater risk in managing the fund and other T. Rowe Price mutual funds than it does for institutional account clients.
On the basis of the information provided and the factors considered, the Board concluded that the fees paid by the fund under the Advisory Contract are reasonable.
Approval of the Advisory Contract
As noted, the Board approved the continuation of the Advisory Contract. No single factor was considered in isolation or to be determinative to the decision. Rather, the Board concluded, in light of a weighting and balancing of all factors considered, that it was in the best interests of the fund and its shareholders for the Board to approve the continuation of the Advisory Contract (including the fees to be charged for services thereunder). The independent directors were advised throughout the process by independent legal counsel.
Item 2. Code of Ethics.
A code of ethics, as defined in Item 2 of Form N-CSR, applicable to its principal executive officer, principal financial officer, principal accounting officer or controller, or persons performing similar functions is filed as an exhibit to the registrant’s annual Form N-CSR. No substantive amendments were approved or waivers were granted to this code of ethics during the registrant’s most recent fiscal half-year.
Item 3. Audit Committee Financial Expert.
Disclosure required in registrant’s annual Form N-CSR.
Item 4. Principal Accountant Fees and Services.
Disclosure required in registrant’s annual Form N-CSR.
Item 5. Audit Committee of Listed Registrants.
Not applicable.
Item 6. Investments.
(a) Not applicable. The complete schedule of investments is included in Item 1 of this Form N-CSR.
(b) Not applicable.
Item 7. Disclosure of Proxy Voting Policies and Procedures for Closed-End Management Investment Companies.
Not applicable.
Item 8. Portfolio Managers of Closed-End Management Investment Companies.
Not applicable.
Item 9. Purchases of Equity Securities by Closed-End Management Investment Company and Affiliated Purchasers.
Not applicable.
Item 10. Submission of Matters to a Vote of Security Holders.
Not applicable.
Item 11. Controls and Procedures.
(a) The registrant’s principal executive officer and principal financial officer have evaluated the registrant’s disclosure controls and procedures within 90 days of this filing and have concluded that the registrant’s disclosure controls and procedures were effective, as of that date, in ensuring that information required to be disclosed by the registrant in this Form N-CSR was recorded, processed, summarized, and reported timely.
(b) The registrant’s principal executive officer and principal financial officer are aware of no change in the registrant’s internal control over financial reporting that occurred during the registrant’s second fiscal quarter covered by this report that has materially affected, or is reasonably likely to materially affect, the registrant’s internal control over financial reporting.
Item 12. Exhibits.
(a)(1) The registrant’s code of ethics pursuant to Item 2 of Form N-CSR is filed with the registrant’s annual Form N-CSR.
(2) Separate certifications by the registrant's principal executive officer and principal financial officer, pursuant to Section 302 of the Sarbanes-Oxley Act of 2002 and required by Rule 30a-2(a) under the Investment Company Act of 1940, are attached.
(3) Written solicitation to repurchase securities issued by closed-end companies: not applicable.
(b) A certification by the registrant's principal executive officer and principal financial officer, pursuant to Section 906 of the Sarbanes-Oxley Act of 2002 and required by Rule 30a-2(b) under the Investment Company Act of 1940, is attached.
SIGNATURES
Pursuant to the requirements of the Securities Exchange Act of 1934 and the Investment Company Act of 1940, the registrant has duly caused this report to be signed on its behalf by the undersigned, thereunto duly authorized.
T. Rowe Price Equity Series, Inc.
| By | /s/ Edward C. Bernard |
| | Edward C. Bernard |
| | Principal Executive Officer |
| | |
| Date August 16, 2013 | | |
Pursuant to the requirements of the Securities Exchange Act of 1934 and the Investment Company Act of 1940, this report has been signed below by the following persons on behalf of the registrant and in the capacities and on the dates indicated.
| By | /s/ Edward C. Bernard |
| | Edward C. Bernard |
| | Principal Executive Officer |
| | |
| Date August 16, 2013 | | |
| | |
| | |
| By | /s/ Gregory K. Hinkle |
| | Gregory K. Hinkle |
| | Principal Financial Officer |
| | |
| Date August 16, 2013 | | |