UNITED STATES
SECURITIES AND EXCHANGE COMMISSION
Washington, D.C. 20549
FORM N-CSR
CERTIFIED SHAREHOLDER REPORT OF REGISTERED
MANAGEMENT INVESTMENT COMPANIES
Investment Company Act File Number: 811-07143
| T. Rowe Price Equity Series, Inc. |
|
| (Exact name of registrant as specified in charter) |
| |
| 100 East Pratt Street, Baltimore, MD 21202 |
|
| (Address of principal executive offices) |
| |
| David Oestreicher |
| 100 East Pratt Street, Baltimore, MD 21202 |
|
| (Name and address of agent for service) |
Registrant’s telephone number, including area code: (410) 345-2000
Date of fiscal year end: December 31
Date of reporting period: June 30, 2017
Item 1. Report to Shareholders
| Blue Chip Growth Portfolio | June 30, 2017 |
| ● | Large-cap growth stocks posted solid gains in the first half of 2017.
|
| ● | The Blue Chip Growth Portfolio returned 19.19% in the six-month reporting period and outperformed its market benchmarks.
|
| ● | The portfolio is focused on holding high-quality growth stocks. Stock selection and our overweight allocations to the information technology, consumer discretionary, and health care sectors contributed to performance.
|
| ● | We believe that our holdings have durable growth prospects and should perform well over time. |
The views and opinions in this report were current as of June 30, 2017. They are not guarantees of performance or investment results and should not be taken as investment advice. Investment decisions reflect a variety of factors, and the managers reserve the right to change their views about individual stocks, sectors, and the markets at any time. As a result, the views expressed should not be relied upon as a forecast of the fund’s future investment intent. The report is certified under the Sarbanes-Oxley Act, which requires mutual funds and other public companies to affirm that, to the best of their knowledge, the information in their financial reports is fairly and accurately stated in all material respects.
Manager’s Letter
T. Rowe Price Blue Chip Growth Portfolio
Dear Investor
Global equity markets generally performed well in the first half of 2017. Although volatility remained relatively low, there was some fluctuation in stocks as investors considered the likelihood that tax and regulatory reform and new health care legislation might take longer than some had anticipated and could have some unanticipated effects. In contrast to 2016, growth stocks tended to outperform value stocks, and large-cap stocks outperformed small-caps. In the last six months, your portfolio outperformed the Lipper peer group, the style-specific Russell 1000 Growth Index, and the S&P 500 Index by substantial margins. Several large holdings in the information technology, consumer discretionary, and health care sectors were meaningful contributors.
Performance Review
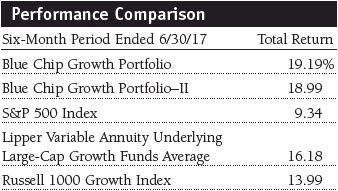
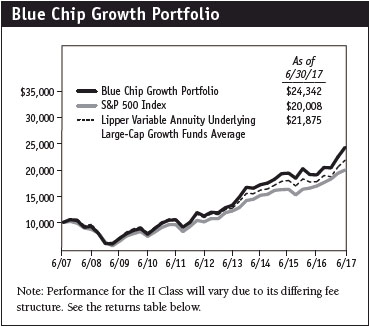
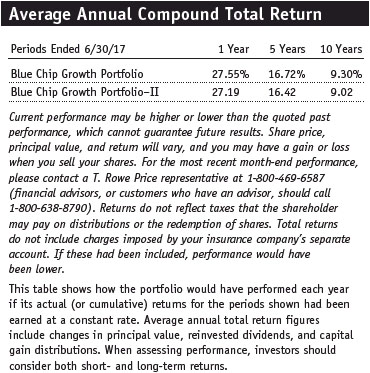
The Blue Chip Growth Portfolio returned 19.19% for the six months ended June 30, 2017, handily outperforming the benchmark S&P 500 Index, the Lipper peer group average, and the style-specific Russell 1000 Growth Index. Our strong relative results contributed to the portfolio’s outperformance over longer-term time frames, as shown in the Growth of $10,000 chart on page 9. The Blue Chip Growth Portfolio has significantly outpaced the S&P 500 Index and the Lipper Variable Annuity Underlying Large-Cap Growth Funds Average for the 10-year period ended June 30, 2017. (Performance for the II Class will vary, reflecting its different fee structure, cash flows, and other factors.)
Your portfolio also continued to compare favorably with its competitors. Lipper ranked the Blue Chip Growth Portfolio in the top quintile of its variable annuity underlying large-cap growth funds universe for the 1-, 3-, 5-, and 10-year periods ended June 30, 2017. (Based on cumulative total return, Lipper ranked the Blue Chip Growth Portfolio 36 of 216, 40 of 212, 21 of 208, and 25 of 170 portfolios in the variable annuity large-cap growth funds universe for the 1-, 3-, 5-, and 10-year periods ended June 30, 2017, respectively. Past performance cannot guarantee future results.)
Investor concern about the breadth and sustainability of global economic growth led to bouts of volatility in the global financial markets. Manufacturing and certain commodity-related industrial businesses continued to struggle, and overall, gross domestic product (GDP) and personal income growth have been lackluster. Perhaps just as important, changing technologies are creating tremendous efficiencies and benefits for consumers but are also disintermediating portions of major industries. For example, e-commerce is having a profound effect on retailing, while cloud-based computing is certainly disrupting traditional information technology businesses. Most of these changes are resulting in the replacement of some forms of labor with technology and also having a disinflationary effect on the prices of many goods and services.
On balance, the benefits of these changes appear to vastly outweigh the drawbacks. Consumers are clearly benefiting from having a broader array of goods, services, and information available more readily and at lower costs. These developments are also dovetailing with the development and improved growth of several major emerging economies, including India and China.
However, lackluster growth in personal incomes and other concerns have resulted in greater urgency for change. Elections in many developed countries, including the U.S., UK, and France, have yielded new leadership. In our last letter, we described some of the proposals and changes we anticipated in the U.S. and their effects on markets and specific stock sectors. One salient part of our commentary bears repeating: While we are supportive of many of President Trump’s proposals and are constructive on the market, we would caution that many programs will not be adopted easily, quickly, or in their entirety. The very important initiatives of tax reform and health care reform are striking examples of this truism.
It is also worth noting that changing technologies and many other trends, including globalization, can align well with our investment strategy. Many of the stocks we have owned are multinationals that have created or adapted to new technologies and provide a valuable product or service more rapidly or at a lower cost to discerning customers. Many of these companies generate substantial recurring or services revenue and free cash flow. They are also often well diversified by geography or product line. These factors tend to provide greater durability to earnings and free cash flow and can mitigate risk to a degree.
Geopolitical tensions have become so substantial that they constitute a more important risk factor for global financial markets. Continued terrorist actions underscore the fact that terrorism can create significant economic disruption in addition to regrettable loss of life and property damage. North Korea’s recent missile launch and nuclear weapons tests could be leading to military actions that could unsettle financial markets. We also recognize that the UK’s exit from the European Union (Brexit) creates uncertainty.
However, there are unmistakable signs of improvement in some sectors of the U.S. economy. Even if many growth initiatives, such as tax reform and business deregulation, are implemented slowly, it appears that progress will be made, and economic growth could improve somewhat. Selected stocks are not particularly dependent on robust economic growth to generate strong profitability, and a backdrop of slow but sustained growth can sometimes be quite supportive for these types of stocks and the overall market. Subdued interest rates and improving corporate profits could offset various risks and drive continued positive stock performance.
Market Environment
The U.S. economy continued to grow, with housing, auto, and retail sales indicating a slow but steady recovery. Although first-quarter GDP growth was lackluster and several jobs reports have been disappointing, job creation was solid in the most recent monthly report, with 222,000 nonfarm payroll jobs being created. Unfortunately, the labor force participation rate is near an all-time low, and the growth in average hourly earnings has been tepid. There has been stronger wage growth in certain industries, and there are enough signs of economic improvement that the Federal Reserve will probably increase rates several more times in this cycle. However, the continued deflationary action of oil and other commodity prices, and the view that inflation is well contained, could limit interest rate increases.
In our view, the U.S. economy is on sounder footing than the economies of many other developed countries, including those of most European nations. Although Europe appeared to be showing improvement, the Brexit vote has introduced a new, and possibly prolonged, period of uncertainty surrounding growth. India continued to show remarkable improvement as it pursues economic reform. China has experienced greater stability and shown signs of improving economic growth. Brazil and other resource-based economies, including several in emerging markets, have experienced moderating or inconsistent growth.
Unfortunately, geopolitical risks are probably as great as we have seen in the last few decades. Syria, Turkey, and countries in the Western Hemisphere, such as Brazil, have experienced a notable amount of internal strife. There have been a number of terrorist actions in the last several months, including tragic mass murders in several developed countries. While we had hoped that the U.S. presidential election would usher in a period of greater cooperation, it is clear that there continue to be sharp political divisions in the U.S. (and in some other developed countries). This may make it more difficult to enact health care reform, tax reform, and other legislation. However, we would note that the U.S. has had a divided government or sharp policy debates in many periods in which economic growth and stock market performance were quite strong. The Trump administration probably can also pursue certain actions in areas such as regulatory reform that do not require legislation. Recent actions regarding capital standards for financial companies are one example of this.
While recognizing the many challenges facing investors, we also want to be clear that there are several powerful positives and solid potential rewards in many stocks. Solid revenue growth, improved efficiency and margins, and, ultimately, robust corporate earnings are being generated despite subdued capital expenditures. As overall demand improves, corporate earnings could be quite vibrant. Many companies have free cash flow yields approaching 10%, which is relatively very favorable compared with the 10-year U.S. Treasury note’s yield. Additionally, companies are consistently repurchasing shares decreasing the net overall amount of shares outstanding. However, some stocks have performed well, and we want to be clear that the opportunity for continued gains is necessarily less substantial for select stocks at current price levels.
Portfolio Review
Strong performance in the information technology, consumer discretionary, and health care sectors drove our first-half results. While most sectors contained several stocks that generated powerful performance contributions, significant detractors were not plentiful, except among our retail holdings.
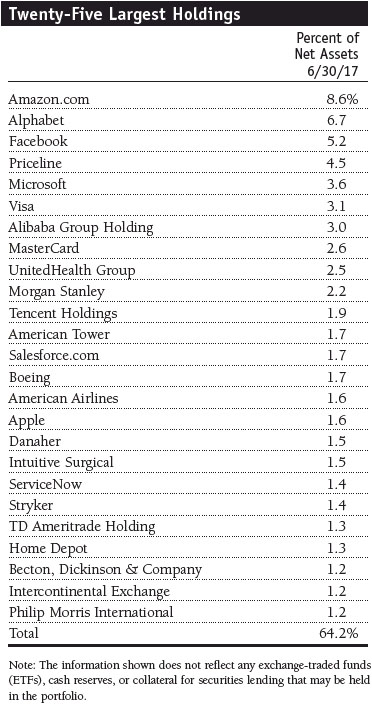
In the technology sector, Facebook was our largest contributor. Its stock surged as investors began to appreciate how well the company’s advertising products, video strategy, and Instagram photo sharing were being received. Its investment in WhatsApp and Messenger also provided solid positioning in the messaging market, which is growing in popularity. The company also has adapted effectively to competitive product offerings like Snapchat. (Please refer to the portfolio of investments for a complete list of holdings and the amount each represents in the portfolio.)
Alibaba Group Holding was also a strong contributor in the technology sector. This company is the leading e-commerce services provider in China, with Tabao (consumer to consumer) and T-Mall (business to consumer) possessing dominant market share. It is also a leading provider of cloud processing, video, and financial services in China through its ownership stake in Ant Financial. The company has impressive capabilities in logistics and artificial intelligence and recently raised its revenue growth outlook substantially. Tencent Holdings has been a holding for many years. Its leading positions in gaming, messaging, and WeChat social networking generated strong growth in users and profits. Our large position in Alphabet (Google’s parent company) also generated solid gains, as the company continued to thrive in search-based advertising, while YouTube has posted rapid growth in viewing and monetization.
Several processing companies and providers of cloud-based services in the technology sector were also major contributors. Our large, longtime holdings in credit card processing giants Visa and MasterCard generated strong and consistent growth in revenue and profits, and both stocks were top 10 performance contributors. ServiceNow also has been a solid performer for several years. The company is growing beyond its dominant position in cloud-based solutions used in its customers’ information technology operations, and it generates prodigious free cash flow. Salesforce.com is a leading cloud-based software and services provider with operations that support sales, services, marketing, and analytics activities. The company has been a holding for several years and continued to contribute. Microsoft also performed well. Its Office 365 suite, corporate cloud, and Azure product offerings appear to be strategically well positioned. PayPal Holdings, a leading online payment services provider, has partnered well with MasterCard and Visa, and its Venmo consumer-to-consumer payments solution is also thriving. It has generated strong margin improvement and stock performance. Broadcom is a leader in semiconductors used in communication devices and industrial applications. The company is a major supplier to Apple (it provides the chips for innovative wireless charging) and has a well-diversified book of business and strong technology. The company’s dividend growth has helped drive strong stock performance. Red Hat provides Linux-based and middleware software solutions that are increasingly used in cloud-based and software-as-a-service applications. The company’s durable growth and substantial free cash flow have continued to power strong gains over time. Fiserv, a leading processing solutions provider to businesses and banks, also has generated consistent earnings growth for decades and again generated strong stock gains. Our positions in electronic games makers Electronic Arts and Activision also performed well.

In the consumer discretionary area, our large position in Amazon.com was the top performer in the first half of the year. Third-party sales and Amazon Web Services (AWS), which provides cloud processing services for other companies, possess margins above the company’s average. As these businesses have grown, they propelled a meaningful recovery in gross margin. Amazon’s acquisition of Whole Foods sent shock waves through the retailing sector. We strive to maintain skepticism regarding acquisitions and recognize that the integration of Whole Foods will be complex. However, the purchase price is about 3% of Amazon’s market capitalization, so it is not overly material. The strategic merit of the transaction is perhaps more positive than many realize. Amazon is an expert at logistics and will acquire over 460 food stores with 63% of the U.S. population living within 20 miles of a store. The demographic profile of the typical Whole Foods customer fits quite well with Amazon’s typical Prime customer. Over time, we would not be surprised to see Amazon grow its already meaningful food-retailing business and also drive sales of other goods and services through this new brick-and-mortar platform.
Priceline was a top first-half contributor. This online travel services provider has strong market positions in Asia and Europe given its ownership of Agoda and Bookings.com. Tesla also generated substantial gains as it appears that the new Model 3 will be produced and sold in large quantities. The company has pre-orders for over 400,000 of these vehicles, and it also appears that the car has been engineered so that profit margins may be stronger than some anticipated. Netflix also was a major winner, thanks to strong growth in international subscriptions. We reduced our position moderately given strong stock gains and concerns regarding competitive products. However, the recent pullback in the share price and a very strong lineup of original programming give us confidence in the company’s competitive position and argues for continued ownership of this stock. Home improvement retail giant Home Depot was a solid contributor as an ongoing housing recovery and improved merchandising and operational improvement drove strong profit growth.
The health care sector endured a pullback in 2016 but rallied and produced several of our top first-half performers in 2017. Intuitive Surgical is a leading provider of robotic systems and consumables used in many general surgical applications. The company’s new single port and da Vinci X™ Surgical System offerings should drive solid growth in the next few years. Vertex Pharmaceuticals is a rapidly growing biotechnology company that has several products that appear to be effective in treating cystic fibrosis. Greater confidence that its new triple-combo solutions will be able to treat a much broader array of patients drove solid stock performance. UnitedHealth Group continued to grow consistently, and its Optum data services business now constitutes approximately 50% of the company’s profits. This business is less subject to reimbursement risk and is growing rapidly over time. Our longtime position in Thermo Fisher Scientific also produced solid gains as investors appreciated that it generates the majority of its profits from the sale of consumables to the health care industry. Aetna performed well as investors concluded that the company is well positioned, even though its proposed merger with Humana was not consummated. Danaher was again a significant contributor. We prize the company for its outstanding management and strong free cash flow generation. Stryker is a leading provider of hip and knee replacements and other health care devices. The company appears positioned to participate in the rapid growth of robotic joint replacement with its Mako robotic-assisted surgery technology. Our longtime holding in Becton, Dickinson & Company was also rewarded as investors approved of its acquisition of C.R. Bard, which was also a small holding in the portfolio. We increased our already substantial position in Becton, Dickinson & Company as the combined company appears to be well positioned for continued earnings and dividend growth.
Other major contributors came from various sectors. Real estate investment trust American Tower is the largest owner and operator of telecommunication towers and a longtime holding. Its consistent growth and strong international footprint should allow the company to generate solid growth in adjusted funds from operations. Our large position in Boeing was a solid performer as investors have shown increased appreciation for the company’s tremendous free cash flow. Boeing is also focusing on building a much larger services business, and its orders for new aircraft at the recent important Paris Air Show were impressive. Intercontinental Exchange, the owner of the New York Stock Exchange and other important trading exchanges and clearing operations, continued to produce strong earnings and stock performance. Philip Morris International is a growing position in the portfolio and outperformed most consumer staples stocks based on the rapid growth of its iQOS heat-not-burn smokeless cigarette. This reduced-risk smoking product has generated strong sales in several markets, including Japan and Italy.
Fortunately, there were not many significant performance detractors in the first half of 2017. However, retailing was volatile based upon several concerns, including the perceived competitive threat of Amazon and other online retailers, the entry of several well-managed traditional European retailers into the U.S. market, and deflation in drug and food pricing. Private-label products are being emphasized by many preeminent retailers, and this is contributing to intense competition and price deflation. O’Reilly Automotive and AutoZone were our largest detractors. Fortunately, we made significant sales of both stocks over the past several months, reducing the losses suffered by your portfolio. While Amazon may not significantly impair the profitability of these auto parts retailers, we were more comfortable having less exposure. Ross Stores was also caught up in the decline in retail stocks. We have been reluctant to make substantial sales of the company because it is well managed and should continue to generate solid growth. However, we will monitor its competitive position relative to online merchants and also consider its valuation relative to a retailing group that has been decimated.
Walgreens Boots Alliance stock has been a lackluster performer and was the fourth-largest detractor in the first half of 2017. The company has not been able to secure approval for its proposed acquisition of Rite Aid. It recently proposed a more limited purchase of selected Rite Aid stores. However, an additional concern has been deflation in drug pricing and aggressive price competition in the front-end merchandising area as well as pharmacy. While Walgreens should be able to compete fairly well in most scenarios, it garners a price premium in certain product areas, and Amazon or certain other competitors could clearly hurt Walgreens’ profits, particularly if they entered the pharmacy business aggressively.
Strategy: Major Purchases and Sales
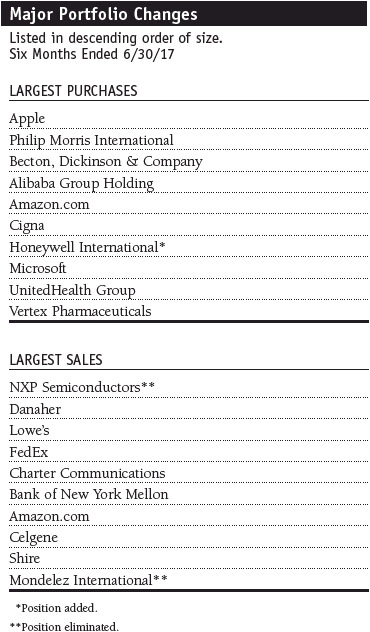
Additions to existing holdings—such as Apple, Philip Morris International, Becton, Dickinson & Company, Alibaba, Amazon.com, Cigna, Microsoft, UnitedHealth Group, and Vertex Pharmaceuticals—were significant enough to be included in the 10 largest purchases for the past six months. The only new position large enough to be included in our largest purchases was Honeywell International, a leading maker of aerospace systems and home and building technologies and controls. This well-managed company is dominant in certain areas of aerospace and is a leader in formulating new technologies that will create a more connected home, factory, and airplane. It has also been a solid operator over time, increasing margins and generating consistent dividend growth.
There were two eliminations large enough to be included in the top 10 sales for the first half of 2017. NXP Semiconductors, a leading semiconductor manufacturer for automotive connectivity, infotainment, and smartphone near-field communication payment applications, has agreed to be acquired by Qualcomm. As the stock approached the all-cash offer of $110 per share, we eliminated this holding. We also sold our entire stake in Mondelez International, the leading food, beverage, and confectionary conglomerate (which owns the Nabisco and Cadbury brands), because its organic revenue growth was somewhat below our projections. The company will probably generate improved growth over time, but the stock price reflects some premium for the company being an acquisition candidate, making it fully valued, in our view.
Outlook
The market performed well in the first half of 2017, and large-cap growth stocks generated standout results. Consequently, there may be less opportunity to generate substantial gains in the second half of the year. However, corporate earnings will be solid, in our view, and the interest rate backdrop is probably more supportive than we initially anticipated. We remain constructive on the market and believe that high-quality growth stocks could continue to perform reasonably well. However, valuations are somewhat above average, which could also cause gains to be more subdued.
Global growth has been lackluster, and Brexit increases the risk of dislocation, especially in the UK. The energy and commodity complex remains under significant stress, and some investors believe the chance of a recession or a significant slowdown has increased. Terrorism is also a factor that could have a more frequent and significant injurious effect on global markets. However, India appears to be enjoying a period of powerful market reforms and stronger growth, and China’s economic growth seems to be stabilizing and, perhaps, improving.
The current political debates in the U.S. between Democrats and Republicans, especially regarding health care but also tax and regulatory reform, must be carefully monitored. On balance, we believe that many of the Republicans’ proposals to lower and simplify corporate and personal taxes and to reduce regulation could drive stronger economic growth and corporate earnings. However, we realize that many of these programs and related legislation will not be adopted easily, quickly, or in their entirety.
Although the most recent employment report in the U.S. was encouraging, slow economic growth, a relatively high level of unemployment, or lackluster income growth in other developed countries represent key concerns. While we have seen improvement in budget deficits and growth in Europe and the U.S., structural reform and spending reductions are almost certainly necessary. In addition to these fiscal actions, monetary policy has begun to tighten. However, the latest data and developments suggest that the Federal Reserve could continue to be deliberate in increasing interest rates.
We would also be quick to acknowledge that policymaking to address all of these situations is complex, risky, and unlikely to yield results that are unequivocally favorable. Said another way, all of the solutions have costs and, perhaps, unintended consequences. One unintended and undesirable side effect could be sharply higher inflation. However, we must acknowledge that the overall level of gold and commodity prices would support the view that inflation is not a major problem at this juncture.
There are other complicating factors that may weigh on markets for some time. Aside from the rising risk posed by terrorism, longstanding but intensifying unrest in the Middle East could affect general global stability. We have also taken note of the major protests and unrest that have occurred in Brazil. Cyberattacks represent an evolving challenge for businesses and financial markets, whether the attackers are governments or terrorists. A possible downgrade of U.S. debt, instability in the dollar or other major currencies, and a sharp increase in interest rates—or pervasive negative interest rates—constitute threats that must be carefully monitored. For these reasons (and several others), we regard the current environment as having more complexity and risk than is typical.
On balance, we continue to be constructive on the performance of stocks. While the challenges we have outlined will certainly require time to resolve and will test the patience of policymakers and investors, corporate earnings at selected companies could continue to impress, interest rates and inflation should remain at acceptable levels, and the valuations of many high-quality companies are reasonable.
Despite the uncertainty surrounding how effective fiscal and monetary actions will be in addressing various risks, there are several things working in our favor:
1. Recent market strength over the past few years does temper the amount of potential appreciation. However, the valuations of stocks are attractive, especially in relation to the very low level of interest rates. The spread between the earnings yield on stocks and the 10-year Treasury note’s yield of approximately 2.4% is very attractive in any historical context. The free cash flow yield of many companies exceeds 10% and also implies attractive valuation.
2. We believe that the high-quality, consistent-growth companies that we seek to purchase are especially attractive and could conceivably do well even if the economy only experiences modest growth. Stringent expense management could also support rapid earnings growth if revenues begin to accelerate.
3. Many large-cap growth companies have strong balance sheets with record amounts of cash and strong capitalization. This should allow them to opportunistically invest in new products or businesses or make acquisitions as change creates dislocation.
4. Many of our holdings generate significant free cash flow. Shareholder-oriented management can use this cash to pay dividends, repurchase shares, or make value-added acquisitions. Several of our holdings have reduced the number of shares outstanding by a meaningful amount over time.
We continue to strive to enhance returns in a difficult environment by investing in quality companies with durable, sustainable earnings and cash flow growth. We appreciate your continued confidence in this endeavor.
Respectfully submitted,

Larry J. Puglia
President and chairman of the Investment Advisory Committee
July 11, 2017
The committee chairman has day-to-day responsibility for managing the portfolio and works with committee members in developing and executing its investment program.
The portfolio’s share price can fall because of weakness in the stock markets, a particular industry, or specific holdings. Stock markets can decline for many reasons, including adverse political or economic developments, changes in investor psychology, or heavy institutional selling. The prospects for an industry or company may deteriorate because of a variety of factors, including disappointing earnings or changes in the competitive environment. In addition, the investment manager’s assessment of companies held in a portfolio may prove incorrect, resulting in losses or poor performance even in rising markets. Growth stocks can be volatile because these companies usually invest a high portion of earnings in their businesses, and earnings disappointments often lead to sharply falling prices. The value approach carries the risk that a security’s intrinsic value may not be recognized for a long time or that the stock may actually be appropriately priced.
Dividend yield: The annual dividend of a stock divided by the stock’s price.
Free cash flow: The excess cash a company is generating from its operations that can be taken out of the business for the benefit of shareholders, such as dividends, share repurchases, investments, and acquisitions.
Gross domestic product (GDP): The total market value of all goods and services produced in a country in a given year.
Lipper averages: The average performance of all portfolios in a particular category as tracked by Lipper Inc.
Price/book ratio: A valuation measure that compares a stock’s market price with its book value, i.e., the company’s net worth divided by the number of outstanding shares.
Price/earnings ratio: A valuation measure calculated by dividing the price of a stock by its current or projected earnings per share. This ratio gives investors an idea of how much they are paying for current or future earnings power.
Russell 1000 Growth Index: A market capitalization-weighted index of those firms in the Russell 1000 with higher price/book ratios and higher forecast growth values.
Russell 1000 Index: A market capitalization-weighted index that tracks the performance of the 1,000 largest U.S. companies.
S&P 500 Index: An unmanaged index that tracks the stocks of 500 primarily large-cap U.S. companies.
Note: Russell Investment Group is the source and owner of the trademarks, service marks, and copyrights related to the Russell indexes. Russell® is a trademark of Russell Investment Group.
Portfolio Highlights
Performance and Expenses
T. Rowe Price Blue Chip Growth Portfolio
This chart shows the value of a hypothetical $10,000 investment in the portfolio over the past 10 fiscal year periods or since inception (for portfolios lacking 10-year records). The result is compared with benchmarks, which may include a broad-based market index and a peer group average or index. Market indexes do not include expenses, which are deducted from portfolio returns as well as mutual fund averages and indexes.
Fund Expense Example
As a mutual fund shareholder, you may incur two types of costs: (1) transaction costs, such as redemption fees or sales loads, and (2) ongoing costs, including management fees, distribution and service (12b-1) fees, and other fund expenses. The following example is intended to help you understand your ongoing costs (in dollars) of investing in the fund and to compare these costs with the ongoing costs of investing in other mutual funds. The example is based on an investment of $1,000 invested at the beginning of the most recent six-month period and held for the entire period.
Shares of the fund are currently offered only through certain insurance companies as an investment medium for both variable annuity contracts and variable life insurance policies. Please note that the fund has two classes of shares: the original share class and II Class. II Class shares are sold through financial intermediaries, which are compensated for distribution, shareholder servicing, and/or certain administrative services under a Board-approved Rule 12b-1 plan.
Actual Expenses
The first line of the following table (Actual) provides information about actual account values and actual expenses. You may use the information on this line, together with your account balance, to estimate the expenses that you paid over the period. Simply divide your account value by $1,000 (for example, an $8,600 account value divided by $1,000 = 8.6), then multiply the result by the number on the first line under the heading “Expenses Paid During Period” to estimate the expenses you paid on your account during this period.
Hypothetical Example for Comparison Purposes
The information on the second line of the table (Hypothetical) is based on hypothetical account values and expenses derived from the fund’s actual expense ratio and an assumed 5% per year rate of return before expenses (not the fund’s actual return). You may compare the ongoing costs of investing in the fund with other funds by contrasting this 5% hypothetical example and the 5% hypothetical examples that appear in the shareholder reports of the other funds. The hypothetical account values and expenses may not be used to estimate the actual ending account balance or expenses you paid for the period.
You should also be aware that the expenses shown in the table highlight only your ongoing costs and do not reflect any transaction costs, such as redemption fees or sales loads. Therefore, the second line of the table is useful in comparing ongoing costs only and will not help you determine the relative total costs of owning different funds. To the extent a fund charges transaction costs, however, the total cost of owning that fund is higher.

Financial Highlights
T. Rowe Price Blue Chip Growth Portfolio
(Unaudited)
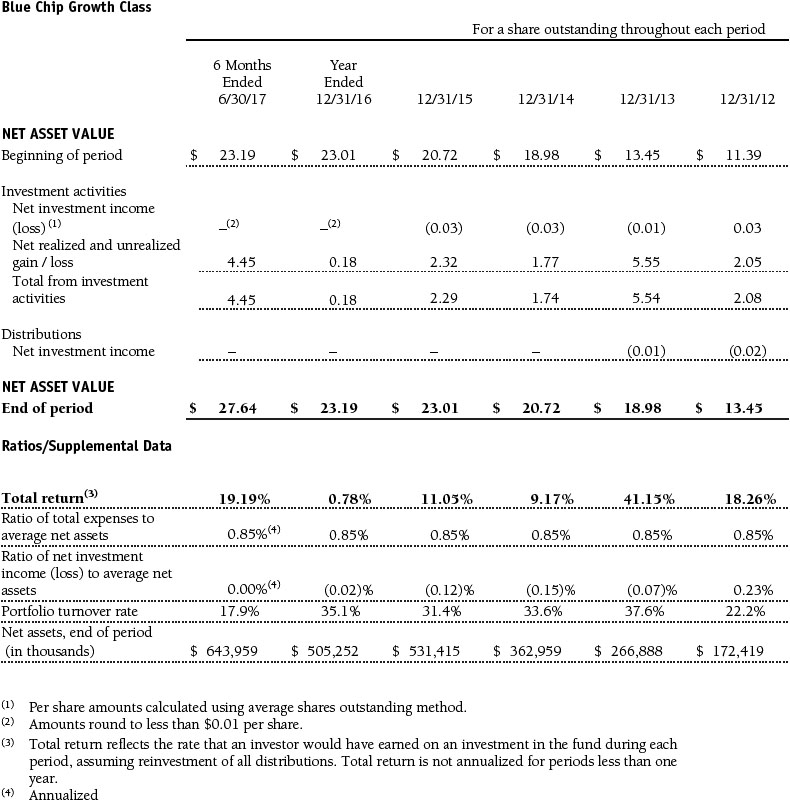
The accompanying notes are an integral part of these financial statements.
Financial Highlights
T. Rowe Price Blue Chip Growth Portfolio
(Unaudited)

The accompanying notes are an integral part of these financial statements.
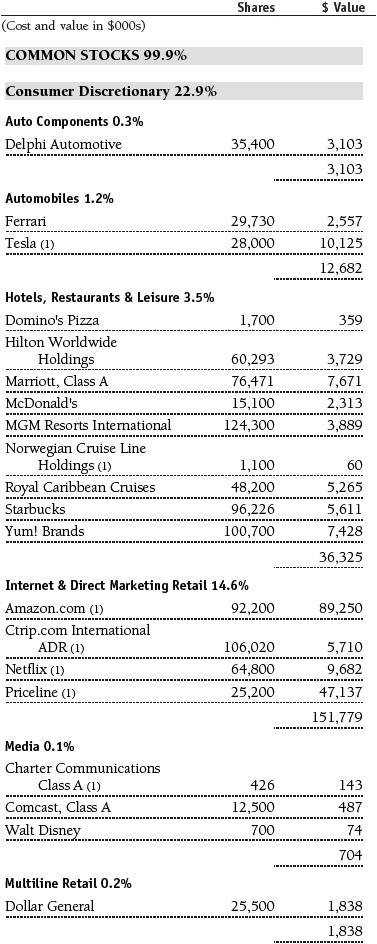
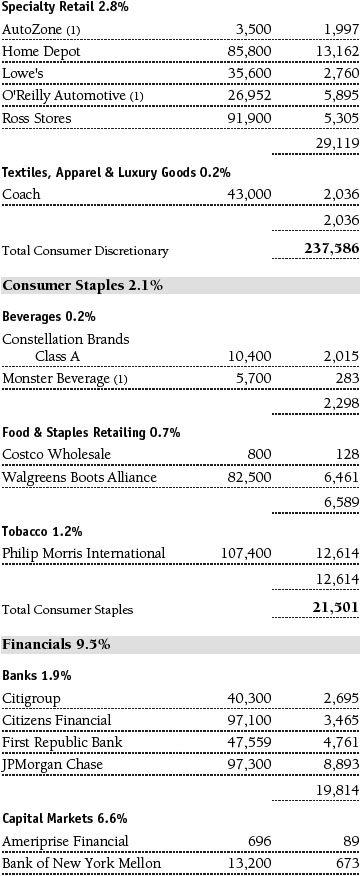
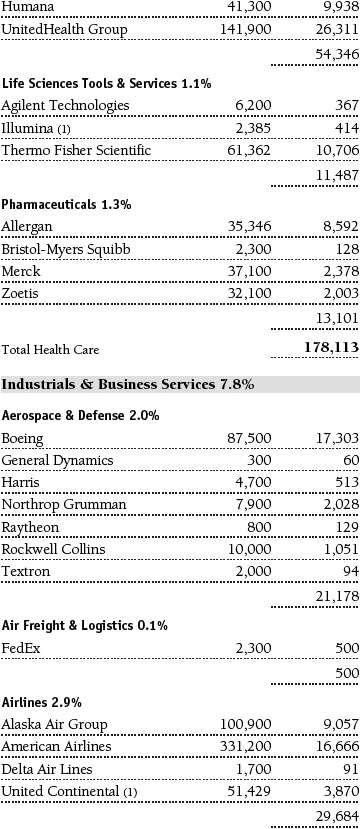
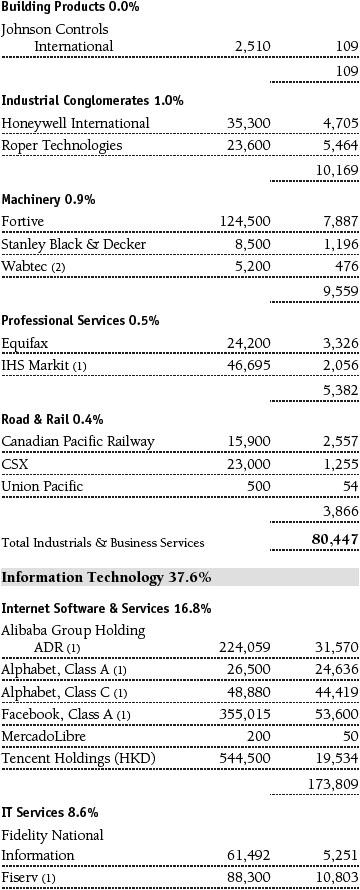
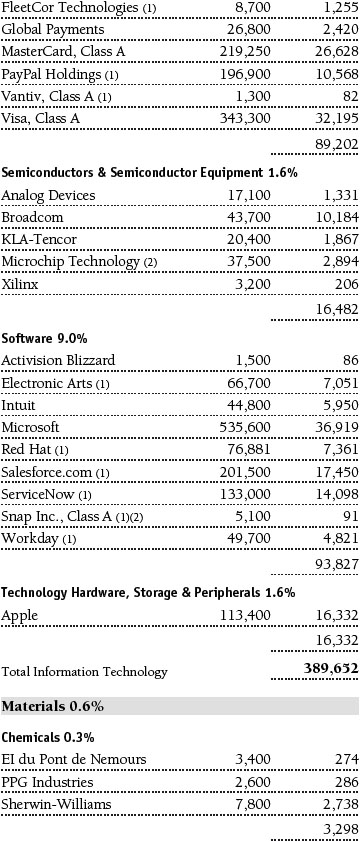
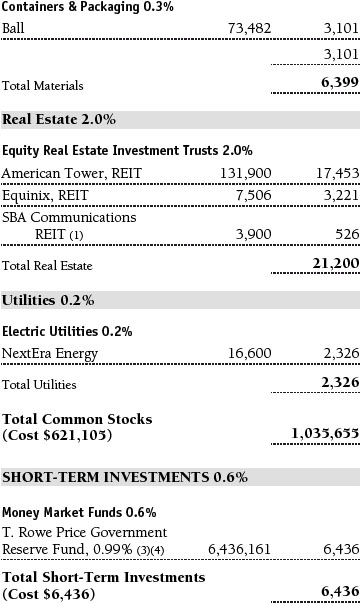
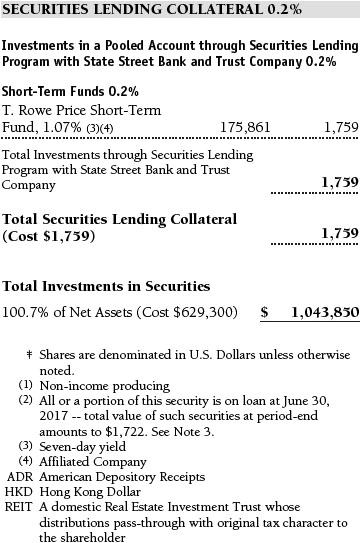
Portfolio of Investments‡
T. Rowe Price Blue Chip Growth Portfolio
June 30, 2017 (Unaudited)

The accompanying notes are an integral part of these financial statements.
Statement of Assets and Liabilities
T. Rowe Price Blue Chip Growth Portfolio
June 30, 2017 (Unaudited)
($000s, except shares and per share amounts)

The accompanying notes are an integral part of these financial statements.
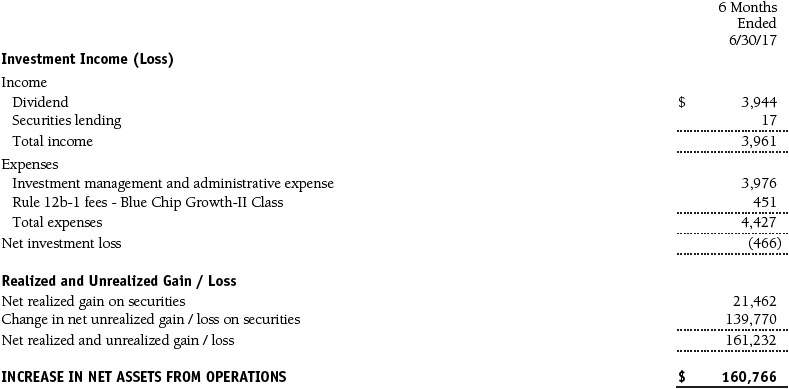
Statement of Operations
T. Rowe Price Blue Chip Growth Portfolio
(Unaudited)
($000s)
The accompanying notes are an integral part of these financial statements.
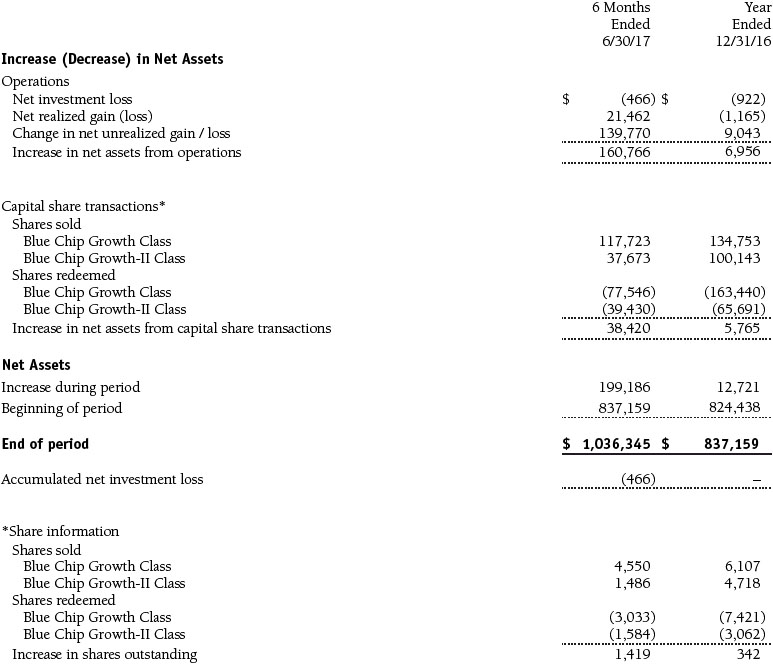
Statement of Changes in Net Assets
T. Rowe Price Blue Chip Growth Portfolio
(Unaudited)
($000s)
The accompanying notes are an integral part of these financial statements.
Notes to Financial Statements
T. Rowe Price Blue Chip Growth Portfolio
June 30, 2017 (Unaudited)
T. Rowe Price Equity Series, Inc. (the corporation), is registered under the Investment Company Act of 1940 (the 1940 Act). The T. Rowe Price Blue Chip Growth Portfolio (the fund) is a diversified, open-end management investment company established by the corporation. Shares of the fund currently are offered only through certain insurance companies as an investment medium for both variable annuity contracts and variable life insurance policies. The fund seeks to provide long-term capital growth. Income is a secondary objective. The fund has two classes of shares: the T. Rowe Price Blue Chip Growth Portfolio (T. Rowe Price Blue Chip Growth Portfolio Class) and the T. Rowe Price Blue Chip Growth Portfolio–II (T. Rowe Price Blue Chip Growth Portfolio–II Class). T. Rowe Price Blue Chip Growth Portfolio–II Class shares are sold through financial intermediaries, which it compensates for distribution, shareholder servicing, and/or certain administrative services under a Board-approved Rule 12b-1 plan. Each class has exclusive voting rights on matters related solely to that class; separate voting rights on matters that relate to both classes; and, in all other respects, the same rights and obligations as the other class.
NOTE 1 - SIGNIFICANT ACCOUNTING POLICIES
Basis of Preparation The fund is an investment company and follows accounting and reporting guidance in the Financial Accounting Standards Board (FASB) Accounting Standards Codification Topic 946 (ASC 946). The accompanying financial statements were prepared in accordance with accounting principles generally accepted in the United States of America (GAAP), including, but not limited to, ASC 946. GAAP requires the use of estimates made by management. Management believes that estimates and valuations are appropriate; however, actual results may differ from those estimates, and the valuations reflected in the accompanying financial statements may differ from the value ultimately realized upon sale or maturity.
Investment Transactions, Investment Income, and Distributions Income and expenses are recorded on the accrual basis. Dividends received from mutual fund investments are reflected as dividend income; capital gain distributions are reflected as realized gain/loss. Dividend income and capital gain distributions are recorded on the ex-dividend date. Income tax-related interest and penalties, if incurred, would be recorded as income tax expense. Investment transactions are accounted for on the trade date. Realized gains and losses are reported on the identified cost basis. Distributions from REITs are initially recorded as dividend income and, to the extent such represent a return of capital or capital gain for tax purposes, are reclassified when such information becomes available. Income distributions are declared and paid by each class annually. Distributions to shareholders are recorded on the ex-dividend date. A capital gain distribution may also be declared and paid by the fund annually.
Currency Translation Assets, including investments, and liabilities denominated in foreign currencies are translated into U.S. dollar values each day at the prevailing exchange rate, using the mean of the bid and asked prices of such currencies against U.S. dollars as quoted by a major bank. Purchases and sales of securities, income, and expenses are translated into U.S. dollars at the prevailing exchange rate on the date of the transaction. The effect of changes in foreign currency exchange rates on realized and unrealized security gains and losses is reflected as a component of security gains and losses.
Class Accounting Investment income, investment management and administrative expense, and realized and unrealized gains and losses are allocated to the classes based upon the relative daily net assets of each class. T. Rowe Price Blue Chip Growth Portfolio–II Class pays Rule 12b-1 fees, in an amount not exceeding 0.25% of the class’s average daily net assets.
Rebates Subject to best execution, the fund may direct certain security trades to brokers who have agreed to rebate a portion of the related brokerage commission to the fund in cash. Commission rebates are reflected as realized gain on securities in the accompanying financial statements and totaled $3,000 for the six months ended June 30, 2017.
New Accounting Guidance In October 2016, the Securities and Exchange Commission (SEC) issued a new rule, Investment Company Reporting Modernization, which, among other provisions, amends Regulation S-X to require standardized, enhanced disclosures, particularly related to derivatives, in investment company financial statements. Compliance with the guidance is effective for financial statements related to periods ending on or after August 1, 2017; adoption will have no effect on the fund’s net assets or results of operations.
NOTE 2 - VALUATION
The fund’s financial instruments are valued and each class’s net asset value (NAV) per share is computed at the close of the New York Stock Exchange (NYSE), normally 4 p.m. ET, each day the NYSE is open for business. However, the NAV per share may be calculated at a time other than the normal close of the NYSE if trading on the NYSE is restricted, if the NYSE closes earlier, or as may be permitted by the SEC.
Fair Value The fund’s financial instruments are reported at fair value, which GAAP defines as the price that would be received to sell an asset or paid to transfer a liability in an orderly transaction between market participants at the measurement date. The T. Rowe Price Valuation Committee (the Valuation Committee) is an internal committee that has been delegated certain responsibilities by the fund’s Board of Directors (the Board) to ensure that financial instruments are appropriately priced at fair value in accordance with GAAP and the 1940 Act. Subject to oversight by the Board, the Valuation Committee develops and oversees pricing-related policies and procedures and approves all fair value determinations. Specifically, the Valuation Committee establishes procedures to value securities; determines pricing techniques, sources, and persons eligible to effect fair value pricing actions; oversees the selection, services, and performance of pricing vendors; oversees valuation-related business continuity practices; and provides guidance on internal controls and valuation-related matters. The Valuation Committee reports to the Board and has representation from legal, portfolio management and trading, operations, risk management, and the fund’s treasurer.
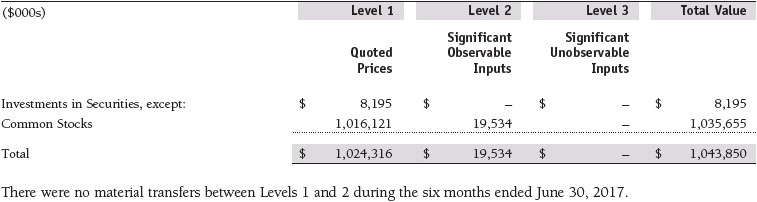
Various valuation techniques and inputs are used to determine the fair value of financial instruments. GAAP establishes the following fair value hierarchy that categorizes the inputs used to measure fair value:
Level 1 – quoted prices (unadjusted) in active markets for identical financial instruments that the fund can access at the reporting date
Level 2 – inputs other than Level 1 quoted prices that are observable, either directly or indirectly (including, but not limited to, quoted prices for similar financial instruments in active markets, quoted prices for identical or similar financial instruments in inactive markets, interest rates and yield curves, implied volatilities, and credit spreads)
Level 3 – unobservable inputs
Observable inputs are developed using market data, such as publicly available information about actual events or transactions, and reflect the assumptions that market participants would use to price the financial instrument. Unobservable inputs are those for which market data are not available and are developed using the best information available about the assumptions that market participants would use to price the financial instrument. GAAP requires valuation techniques to maximize the use of relevant observable inputs and minimize the use of unobservable inputs. When multiple inputs are used to derive fair value, the financial instrument is assigned to the level within the fair value hierarchy based on the lowest-level input that is significant to the fair value of the financial instrument. Input levels are not necessarily an indication of the risk or liquidity associated with financial instruments at that level but rather the degree of judgment used in determining those values.
Valuation Techniques Equity securities listed or regularly traded on a securities exchange or in the over-the-counter (OTC) market are valued at the last quoted sale price or, for certain markets, the official closing price at the time the valuations are made. OTC Bulletin Board securities are valued at the mean of the closing bid and asked prices. A security that is listed or traded on more than one exchange is valued at the quotation on the exchange determined to be the primary market for such security. Listed securities not traded on a particular day are valued at the mean of the closing bid and asked prices for domestic securities and the last quoted sale or closing price for international securities.
For valuation purposes, the last quoted prices of non-U.S. equity securities may be adjusted to reflect the fair value of such securities at the close of the NYSE. If the fund determines that developments between the close of a foreign market and the close of the NYSE will, in its judgment, materially affect the value of some or all of its portfolio securities, the fund will adjust the previous quoted prices to reflect what it believes to be the fair value of the securities as of the close of the NYSE. In deciding whether it is necessary to adjust quoted prices to reflect fair value, the fund reviews a variety of factors, including developments in foreign markets, the performance of U.S. securities markets, and the performance of instruments trading in U.S. markets that represent foreign securities and baskets of foreign securities. The fund may also fair value securities in other situations, such as when a particular foreign market is closed but the fund is open. The fund uses outside pricing services to provide it with quoted prices and information to evaluate or adjust those prices. The fund cannot predict how often it will use quoted prices and how often it will determine it necessary to adjust those prices to reflect fair value. As a means of evaluating its security valuation process, the fund routinely compares quoted prices, the next day’s opening prices in the same markets, and adjusted prices.
Actively traded equity securities listed on a domestic exchange generally are categorized in Level 1 of the fair value hierarchy. Non-U.S. equity securities generally are categorized in Level 2 of the fair value hierarchy despite the availability of quoted prices because, as described above, the fund evaluates and determines whether those quoted prices reflect fair value at the close of the NYSE or require adjustment. OTC Bulletin Board securities, certain preferred securities, and equity securities traded in inactive markets generally are categorized in Level 2 of the fair value hierarchy.
Investments in mutual funds are valued at the mutual fund’s closing NAV per share on the day of valuation and are categorized in Level 1 of the fair value hierarchy. Assets and liabilities other than financial instruments, including short-term receivables and payables, are carried at cost, or estimated realizable value, if less, which approximates fair value.
Thinly traded financial instruments and those for which the above valuation procedures are inappropriate or are deemed not to reflect fair value are stated at fair value as determined in good faith by the Valuation Committee. The objective of any fair value pricing determination is to arrive at a price that could reasonably be expected from a current sale. Financial instruments fair valued by the Valuation Committee are primarily private placements, restricted securities, warrants, rights, and other securities that are not publicly traded.
Subject to oversight by the Board, the Valuation Committee regularly makes good faith judgments to establish and adjust the fair valuations of certain securities as events occur and circumstances warrant. For instance, in determining the fair value of an equity investment with limited market activity, such as a private placement or a thinly traded public company stock, the Valuation Committee considers a variety of factors, which may include, but are not limited to, the issuer’s business prospects, its financial standing and performance, recent investment transactions in the issuer, new rounds of financing, negotiated transactions of significant size between other investors in the company, relevant market valuations of peer companies, strategic events affecting the company, market liquidity for the issuer, and general economic conditions and events. In consultation with the investment and pricing teams, the Valuation Committee will determine an appropriate valuation technique based on available information, which may include both observable and unobservable inputs. The Valuation Committee typically will afford greatest weight to actual prices in arm’s length transactions, to the extent they represent orderly transactions between market participants, transaction information can be reliably obtained, and prices are deemed representative of fair value. However, the Valuation Committee may also consider other valuation methods such as market-based valuation multiples; a discount or premium from market value of a similar, freely traded security of the same issuer; or some combination. Fair value determinations are reviewed on a regular basis and updated as information becomes available, including actual purchase and sale transactions of the issue. Because any fair value determination involves a significant amount of judgment, there is a degree of subjectivity inherent in such pricing decisions, and fair value prices determined by the Valuation Committee could differ from those of other market participants. Depending on the relative significance of unobservable inputs, including the valuation technique(s) used, fair valued securities may be categorized in Level 2 or 3 of the fair value hierarchy.
Valuation Inputs The following table summarizes the fund’s financial instruments, based on the inputs used to determine their fair values on June 30, 2017:
NOTE 3 - OTHER INVESTMENT TRANSACTIONS
Consistent with its investment objective, the fund engages in the following practices to manage exposure to certain risks and/or to enhance performance. The investment objective, policies, program, and risk factors of the fund are described more fully in the fund’s prospectus and Statement of Additional Information.
Securities Lending The fund may lend its securities to approved brokers to earn additional income. Its securities lending activities are administered by a lending agent in accordance with a securities lending agreement. Security loans generally do not have stated maturity dates, and the fund may recall a security at any time. The fund receives collateral in the form of cash or U.S. government securities, valued at 102% to 105% of the value of the securities on loan. Collateral is maintained over the life of the loan in an amount not less than the value of loaned securities; any additional collateral required due to changes in security values is delivered to the fund the next business day. Cash collateral is invested by the lending agent(s) in accordance with investment guidelines approved by fund management. Additionally, the lending agent indemnifies the fund against losses resulting from borrower default. Although risk is mitigated by the collateral and indemnification, the fund could experience a delay in recovering its securities and a possible loss of income or value if the borrower fails to return the securities, collateral investments decline in value, and the lending agent fails to perform. Securities lending revenue consists of earnings on invested collateral and borrowing fees, net of any rebates to the borrower, compensation to the lending agent, and other administrative costs. In accordance with GAAP, investments made with cash collateral are reflected in the accompanying financial statements, but collateral received in the form of securities is not. At June 30, 2017, the value of loaned securities was $1,722,000; the value of cash collateral and related investments was $1,759,000.
Other Purchases and sales of portfolio securities other than short-term securities aggregated $210,726,000 and $166,934,000, respectively, for the six months ended June 30, 2017.
NOTE 4 - FEDERAL INCOME TAXES
No provision for federal income taxes is required since the fund intends to continue to qualify as a regulated investment company under Subchapter M of the Internal Revenue Code and distribute to shareholders all of its taxable income and gains. Distributions determined in accordance with federal income tax regulations may differ in amount or character from net investment income and realized gains for financial reporting purposes. Financial reporting records are adjusted for permanent book/tax differences to reflect tax character but are not adjusted for temporary differences. The amount and character of tax-basis distributions and composition of net assets are finalized at fiscal year-end; accordingly, tax-basis balances have not been determined as of the date of this report.
The fund intends to retain realized gains to the extent of available capital loss carryforwards. Because the fund is required to use capital loss carryforwards that do not expire before those with expiration dates, all or a portion of its capital loss carryforwards subject to expiration could ultimately go unused. As of December 31, 2016, the fund had $20,437,000 of available capital loss carryforwards, which all expire in fiscal 2017.
At June 30, 2017, the cost of investments for federal income tax purposes was $635,003,000. Net unrealized gain aggregated $408,847,000 at period-end, of which $415,291,000 related to appreciated investments and $6,444,000 related to depreciated investments.
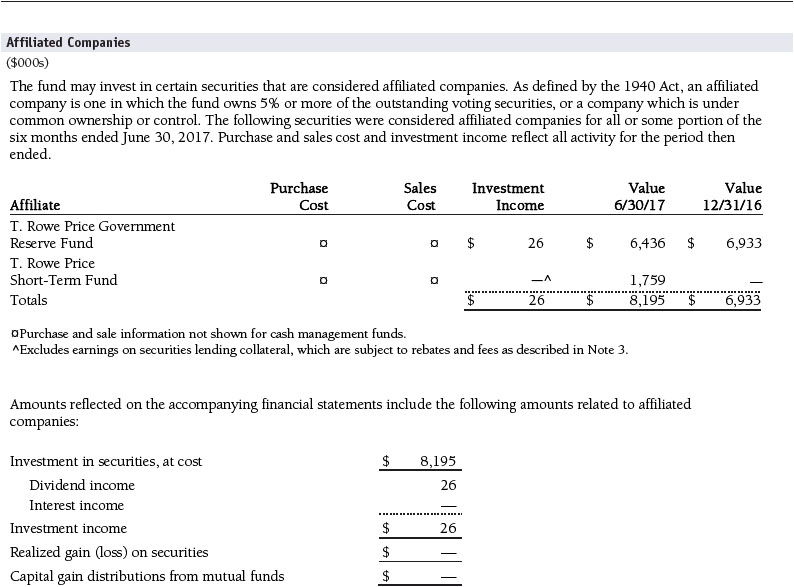
NOTE 5 - RELATED PARTY TRANSACTIONS
The fund is managed by T. Rowe Price Associates, Inc. (Price Associates), a wholly owned subsidiary of T. Rowe Price Group, Inc. (Price Group). The investment management and administrative agreement between the fund and Price Associates provides for an all-inclusive annual fee equal to 0.85% of the fund’s average daily net assets. The fee is computed daily and paid monthly. The all-inclusive fee covers investment management, shareholder servicing, transfer agency, accounting, and custody services provided to the fund, as well as fund directors’ fees and expenses. Interest, taxes, brokerage commissions, and other non-recurring expenses permitted by the investment management agreement are paid directly by the fund.
The fund may invest in the T. Rowe Price Government Reserve Fund, the T. Rowe Price Treasury Reserve Fund, or the T. Rowe Price Short-Term Fund (collectively, the Price Reserve Funds), open-end management investment companies managed by Price Associates and considered affiliates of the fund. The Price Reserve Funds are offered as short-term investment options to mutual funds, trusts, and other accounts managed by Price Associates or its affiliates and are not available for direct purchase by members of the public. The Price Reserve Funds pay no investment management fees.
The fund may participate in securities purchase and sale transactions with other funds or accounts advised by Price Associates (cross trades), in accordance with procedures adopted by the fund’s Board and Securities and Exchange Commission rules, which require, among other things, that such purchase and sale cross trades be effected at the independent current market price of the security. During the six months ended June 30, 2017, the aggregate value of purchases and sales cross trades with other funds or accounts advised by Price Associates was less than 1% of the fund’s net assets as of June 30, 2017.
| Information on Proxy Voting Policies, Procedures, and Records |
A description of the policies and procedures used by T. Rowe Price funds and portfolios to determine how to vote proxies relating to portfolio securities is available in each fund’s Statement of Additional Information. You may request this document by calling 1-800-225-5132 or by accessing the SEC’s website, sec.gov.
The description of our proxy voting policies and procedures is also available on our corporate website. To access it, please visit the following Web page:
https://www3.troweprice.com/usis/corporate/en/utility/policies.html
Scroll down to the section near the bottom of the page that says, “Proxy Voting Policies.” Click on the Proxy Voting Policies link in the shaded box.
Each fund’s most recent annual proxy voting record is available on our website and through the SEC’s website. To access it through T. Rowe Price, visit the website location shown above, and scroll down to the section near the bottom of the page that says, “Proxy Voting Records.” Click on the Proxy Voting Records link in the shaded box.
| How to Obtain Quarterly Portfolio Holdings |
The fund files a complete schedule of portfolio holdings with the Securities and Exchange Commission for the first and third quarters of each fiscal year on Form N-Q. The fund’s Form N-Q is available electronically on the SEC’s website (sec.gov); hard copies may be reviewed and copied at the SEC’s Public Reference Room, 100 F St. N.E., Washington, DC 20549. For more information on the Public Reference Room, call 1-800-SEC-0330.
| Approval of Investment Management Agreement |
Each year, the fund’s Board of Directors (Board) considers the continuation of the investment management agreement (Advisory Contract) between the fund and its investment advisor, T. Rowe Price Associates, Inc. (Advisor). In that regard, at an in-person meeting held on March 6–7, 2017 (Meeting), the Board, including a majority of the fund’s independent directors, approved the continuation of the fund’s Advisory Contract. At the Meeting, the Board considered the factors and reached the conclusions described below relating to the selection of the Advisor and the approval of the Advisory Contract. The independent directors were assisted in their evaluation of the Advisory Contract by independent legal counsel from whom they received separate legal advice and with whom they met separately.
In providing information to the Board, the Advisor was guided by a detailed set of requests for information submitted by independent legal counsel on behalf of the independent directors. In considering and approving the Advisory Contract, the Board considered the information it believed was relevant, including, but not limited to, the information discussed below. The Board considered not only the specific information presented in connection with the Meeting but also the knowledge gained over time through interaction with the Advisor about various topics. The Board meets regularly and, at each of its meetings, covers an extensive agenda of topics and materials and considers factors that are relevant to its annual consideration of the renewal of the T. Rowe Price funds’ advisory contracts, including performance and the services and support provided to the funds and their shareholders.
Services Provided by the Advisor
The Board considered the nature, quality, and extent of the services provided to the fund by the Advisor. These services included, but were not limited to, directing the fund’s investments in accordance with its investment program and the overall management of the fund’s portfolio, as well as a variety of related activities such as financial, investment operations, and administrative services; compliance; maintaining the fund’s records and registrations; and shareholder communications. The Board also reviewed the background and experience of the Advisor’s senior management team and investment personnel involved in the management of the fund, as well as the Advisor’s compliance record. The Board concluded that it was satisfied with the nature, quality, and extent of the services provided by the Advisor.
Investment Performance of the Fund
The Board took into account discussions with the Advisor and reports that it receives throughout the year relating to fund performance. In connection with the Meeting, the Board reviewed the fund’s net annualized total returns for the 1-, 2-, 3-, 4-, 5-, and 10-year periods as of September 30, 2016, and compared these returns with the performance of a peer group of funds with similar investment programs and a wide variety of other previously agreed-upon comparable performance measures and market data, including those supplied by Broadridge, which is an independent provider of mutual fund data.
On the basis of this evaluation and the Board’s ongoing review of investment results, and factoring in the relative market conditions during certain of the performance periods, the Board concluded that the fund’s performance was satisfactory.
Costs, Benefits, Profits, and Economies of Scale
The Board reviewed detailed information regarding the revenues received by the Advisor under the Advisory Contract and other benefits that the Advisor (and its affiliates) may have realized from its relationship with the fund, including any research received under “soft dollar” agreements and commission-sharing arrangements with broker-dealers. The Board considered that the Advisor may receive some benefit from soft-dollar arrangements pursuant to which research is received from broker-dealers that execute the fund’s portfolio transactions. The Board received information on the estimated costs incurred and profits realized by the Advisor from managing the T. Rowe Price funds. The Board also reviewed estimates of the profits realized from managing the fund in particular, and the Board concluded that the Advisor’s profits were reasonable in light of the services provided to the fund.
The Board also considered whether the fund benefits under the fee levels set forth in the Advisory Contract from any economies of scale realized by the Advisor. Under the Advisory Contract, the fund pays the Advisor a single fee, or all-inclusive management fee, which is based on the fund’s average daily net assets. The all-inclusive management fee includes investment management services and provides for the Advisor to pay all of the fund’s ordinary, recurring operating expenses except for interest, taxes, portfolio transaction fees, and any nonrecurring extraordinary expenses that may arise. The Board concluded that, based on the profitability data it reviewed and consistent with this all-inclusive management fee structure, the Advisory Contract provided for a reasonable sharing of any benefits from economies of scale with the fund.
Fees and Expenses
The Board was provided with information regarding industry trends in management fees and expenses. Among other things, the Board reviewed data for peer groups that were compiled by Broadridge, which compared: (i) contractual management fees, total expenses, actual management fees, and non-management expenses of the fund with a group of competitor funds selected by Broadridge (Expense Group) and (ii) total expenses, actual management fees, and non-management expenses of the fund with a broader set of funds within the Lipper investment classification (Expense Universe). The Board considered the fund’s contractual management fee rate, actual management fee rate (which reflects the management fees actually received from the fund by the Advisor after paying the fund’s operating expenses, as well as any applicable waivers, reductions, or reimbursements), operating expenses, and total expenses (which reflects the net total expense ratio of the fund after any waivers, reductions, or reimbursements) in comparison with the information for the Broadridge peer groups. Broadridge generally constructed the peer groups by seeking the most comparable funds based on similar investment classifications and objectives, expense structure, asset size, and operating components and attributes and ranked funds into quintiles, with the first quintile representing the funds with the lowest relative expenses and the fifth quintile representing the funds with the highest relative expenses. The information provided to the Board indicated that the fund’s contractual management fee ranked in the fifth quintile (Expense Group), the fund’s actual management fee rate ranked in the fifth quintile (Expense Group and Expense Universe), and the fund’s total expenses ranked in the fifth quintile (Expense Group) and fourth quintile (Expense Universe). The Board requested additional information from management with respect to the fund’s relative management fees and total expenses ranking in the fourth and fifth quintiles for the Expense Group and Expense Universe and reviewed and considered the information provided relating to the fund, other funds in the peer groups, and other factors that the Board determined to be relevant.
The Board also reviewed the fee schedules for institutional accounts and private accounts with similar mandates that are advised or subadvised by the Advisor and its affiliates. Management provided the Board with information about the Advisor’s responsibilities and services provided to subadvisory and other institutional account clients, including information about how the requirements and economics of the institutional business are fundamentally different from those of the mutual fund business. The Board considered information showing that the Advisor’s mutual fund business is generally more complex from a business and compliance perspective than its institutional account business and considered various relevant factors, such as the broader scope of operations and oversight, more extensive shareholder communication infrastructure, greater asset flows, heightened business risks, and differences in applicable laws and regulations associated with the Advisor’s proprietary mutual fund business. In assessing the reasonableness of the fund’s management fee rate, the Board considered the differences in the nature of the services required for the Advisor to manage its mutual fund business versus managing a discrete pool of assets as a subadvisor to another institution’s mutual fund or for an institutional account and that the Advisor generally performs significant additional services and assumes greater risk in managing the fund and other T. Rowe Price funds than it does for institutional account clients.
On the basis of the information provided and the factors considered, the Board concluded that the fees paid by the fund under the Advisory Contract are reasonable.
Approval of the Advisory Contract
As noted, the Board approved the continuation of the Advisory Contract. No single factor was considered in isolation or to be determinative to the decision. Rather, the Board concluded, in light of a weighting and balancing of all factors considered, that it was in the best interests of the fund and its shareholders for the Board to approve the continuation of the Advisory Contract (including the fees to be charged for services thereunder).
Item 2. Code of Ethics.
A code of ethics, as defined in Item 2 of Form N-CSR, applicable to its principal executive officer, principal financial officer, principal accounting officer or controller, or persons performing similar functions is filed as an exhibit to the registrant’s annual Form N-CSR. No substantive amendments were approved or waivers were granted to this code of ethics during the registrant’s most recent fiscal half-year.
Item 3. Audit Committee Financial Expert.
Disclosure required in registrant’s annual Form N-CSR.
Item 4. Principal Accountant Fees and Services.
Disclosure required in registrant’s annual Form N-CSR.
Item 5. Audit Committee of Listed Registrants.
Not applicable.
Item 6. Investments.
(a) Not applicable. The complete schedule of investments is included in Item 1 of this Form N-CSR.
(b) Not applicable.
Item 7. Disclosure of Proxy Voting Policies and Procedures for Closed-End Management Investment Companies.
Not applicable.
Item 8. Portfolio Managers of Closed-End Management Investment Companies.
Not applicable.
Item 9. Purchases of Equity Securities by Closed-End Management Investment Company and Affiliated Purchasers.
Not applicable.
Item 10. Submission of Matters to a Vote of Security Holders.
Not applicable.
Item 11. Controls and Procedures.
(a) The registrant’s principal executive officer and principal financial officer have evaluated the registrant’s disclosure controls and procedures within 90 days of this filing and have concluded that the registrant’s disclosure controls and procedures were effective, as of that date, in ensuring that information required to be disclosed by the registrant in this Form N-CSR was recorded, processed, summarized, and reported timely.
(b) The registrant’s principal executive officer and principal financial officer are aware of no change in the registrant’s internal control over financial reporting that occurred during the registrant’s second fiscal quarter covered by this report that has materially affected, or is reasonably likely to materially affect, the registrant’s internal control over financial reporting.
Item 12. Exhibits.
(a)(1) The registrant’s code of ethics pursuant to Item 2 of Form N-CSR is filed with the registrant’s annual Form N-CSR.
(2) Separate certifications by the registrant's principal executive officer and principal financial officer, pursuant to Section 302 of the Sarbanes-Oxley Act of 2002 and required by Rule 30a-2(a) under the Investment Company Act of 1940, are attached.
(3) Written solicitation to repurchase securities issued by closed-end companies: not applicable.
(b) A certification by the registrant's principal executive officer and principal financial officer, pursuant to Section 906 of the Sarbanes-Oxley Act of 2002 and required by Rule 30a-2(b) under the Investment Company Act of 1940, is attached.
SIGNATURES
Pursuant to the requirements of the Securities Exchange Act of 1934 and the Investment Company Act of 1940, the registrant has duly caused this report to be signed on its behalf by the undersigned, thereunto duly authorized.
T. Rowe Price Equity Series, Inc.
| By | | /s/ Edward C. Bernard |
| | | Edward C. Bernard |
| | | Principal Executive Officer |
| |
| Date | | August 17, 2017 | | | | |
Pursuant to the requirements of the Securities Exchange Act of 1934 and the Investment Company Act of 1940, this report has been signed below by the following persons on behalf of the registrant and in the capacities and on the dates indicated.
| By | | /s/ Edward C. Bernard |
| | | Edward C. Bernard |
| | | Principal Executive Officer |
| |
| Date | | August 17, 2017 | | | | |
| |
| |
| By | | /s/ Catherine D. Mathews |
| | | Catherine D. Mathews |
| | | Principal Financial Officer |
| |
| Date | | August 17, 2017 | | | | |