UNITED STATES
SECURITIES AND EXCHANGE COMMISSION
Washington, D.C. 20549
FORM N-CSR
CERTIFIED SHAREHOLDER REPORT OF REGISTERED
MANAGEMENT INVESTMENT COMPANIES
Investment Company Act File Number: 811-07143
| T. Rowe Price Equity Series, Inc. |
|
| (Exact name of registrant as specified in charter) |
| |
| 100 East Pratt Street, Baltimore, MD 21202 |
|
| (Address of principal executive offices) |
| |
| David Oestreicher |
| 100 East Pratt Street, Baltimore, MD 21202 |
|
| (Name and address of agent for service) |
Registrant’s telephone number, including area code: (410) 345-2000
Date of fiscal year end: December 31
Date of reporting period: June 30, 2016
Item 1. Report to Shareholders
| Mid-Cap Growth Portfolio | June 30, 2016 |
| ● | Mid-cap growth stocks recorded modest gains in early 2016, despite shrinking corporate profits and bouts of volatility.
|
| ● | The Mid-Cap Growth Portfolio outperformed its peers but lagged its benchmark.
|
| ● | A consensus appears to be emerging that extremely low interest rates are having minimal first-order effects on the global economy but are distorting financial markets substantially.
|
| ● | The search for stability and yield has pushed up valuations for many of the companies we typically favor, but we are finding some opportunities in the “recession bin.” |
The views and opinions in this report were current as of June 30, 2016. They are not guarantees of performance or investment results and should not be taken as investment advice. Investment decisions reflect a variety of factors, and the managers reserve the right to change their views about individual stocks, sectors, and the markets at any time. As a result, the views expressed should not be relied upon as a forecast of the fund’s future investment intent. The report is certified under the Sarbanes-Oxley Act, which requires mutual funds and other public companies to affirm that, to the best of their knowledge, the information in their financial reports is fairly and accurately stated in all material respects.
Manager’s Letter
T. Rowe Price Mid-Cap Growth Portfolio
Dear Investor
The first half of 2016 was hardly a stellar time for the global economy or corporate profits, but mid-cap growth stocks managed to move slightly higher after enduring some volatility. In past letters, we have referenced former Federal Reserve Chair William McChesney Martin’s description of easy money being the “punch bowl” that keeps a party going on Wall Street. Perhaps it is time to change the metaphor, as the market’s mood has hardly been celebratory—even as money has literally never been easier (as we explain below). Instead, it may make sense to think of the party as in the process of winding down, and the central bankers—far from being the chaperones who order the punch bowl removed, as Martin advised—imploring investors to belly up to the bar for one last drink. In our outlook, we reflect on how policymakers’ efforts may have warded off the reckoning of a bear market but at the cost of fundamentally distorting the financial landscape.
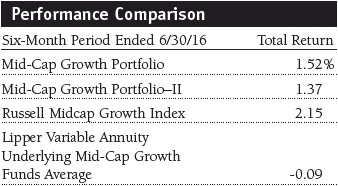
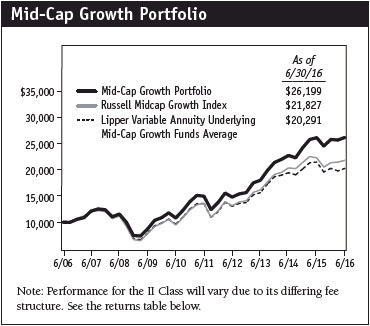
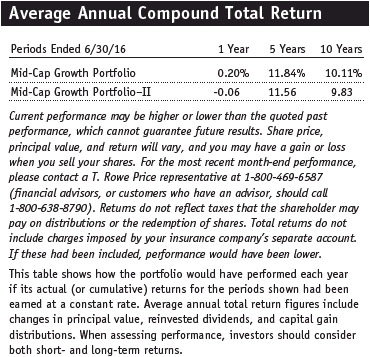
The Mid-Cap Growth Portfolio returned 1.52% in the six months ended June 30, 2016, modestly trailing its benchmark but outperforming its peer group; the Mid-Cap Growth Portfolio–II returned 1.37% over that same period. The portfolio remained favorably ranked relative to its competitors over all time periods. (Based on cumulative total return, Lipper ranked the Mid-Cap Growth Portfolio 9 of 91, 6 of 86, 5 of 85, and 3 of 71 funds in the variable annuity underlying mid-cap growth funds category for the 1-, 3-, 5-, and 10-year periods ended June 30, 2016, respectively. Lipper ranked the Mid-Cap Growth Portfolio–II 13 of 91, 13 of 86, 11 of 85, and 9 of 71 funds in the variable annuity underlying mid-cap growth funds category for the 1-, 3-, 5-, and 10-year periods ended June 30, 2016, respectively. Past performance cannot guarantee future results.)
Stocks began 2016 on a decisively negative note as concerns that had dogged the market in late 2015 intensified. Wall Street followed global markets sharply lower in the first weeks of the year in response to poor Chinese manufacturing data and rising tensions in the Middle East. A further decline in oil prices, which reached their lowest levels in 13 years in early February, also weighed on sentiment. U.S. economic data raised further concerns, and investors worried that the strong U.S. dollar and weakening export markets were taking a toll on the manufacturing sector—previously a bright spot in the weak recovery from the last recession.
Markets reached a turning point in mid-February and began a remarkable recovery, but not because of any notable turnaround in the global economy or in corporate profits. An oil price rebound helped fuel the rally, but this was precipitated in large part by rumors of a coordinated production cut that never materialized. While fears that the U.S. economy would imminently fall back into recession proved to be overblown, growth in the first quarter of the year was still notably weak. Gross domestic product expanded at an annualized rate of only 1.1%, its worst showing in a year. Payroll growth also slowed substantially in early 2016, although a reduced pace of gains might be expected with the unemployment rate below 5%.
The U.S. economy improved somewhat in the spring, with the manufacturing sector appearing to regain its footing and retail sales growing at a decent clip. Still, the economic expansion that began in 2009 and the stock rally that accompanied it started to feel old. Indeed, the current bull market is now the second longest in duration and fifth largest in magnitude dating back to 1932, according to Bank of America research. Certainly, corporate profits were showing the aches and pains of an aging economic cycle. Second-quarter earnings results are not definitive as of this writing, but it appears that earnings growth for the S&P 500 will now have declined for five straight quarters—the first time that has happened since the financial crisis.
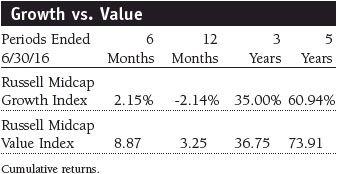
The spring rebound brought the Russell midcap indexes back near the highs they established in mid-2015, and valuations in many segments of the market reached well above historical averages. Britain’s surprise vote to leave the European Union caused another brief bout of volatility at the end of June, but markets recovered quickly, helped in part by even lower expectations for future interest rate increases. Much of the market’s momentum shifted toward value stocks and more stable growth shares, but performance varied widely among sectors: energy stocks in the Russell Midcap Growth Index rose over 29%, technology stocks were flat, and consumer discretionary and health care shares recorded losses. Later, we will discuss the implications of this shift for our portfolio. As we have in past letters, we will also discuss how the extraordinary monetary regime of the last few years has distorted markets and created challenges for long-term investors.
Portfolio Review
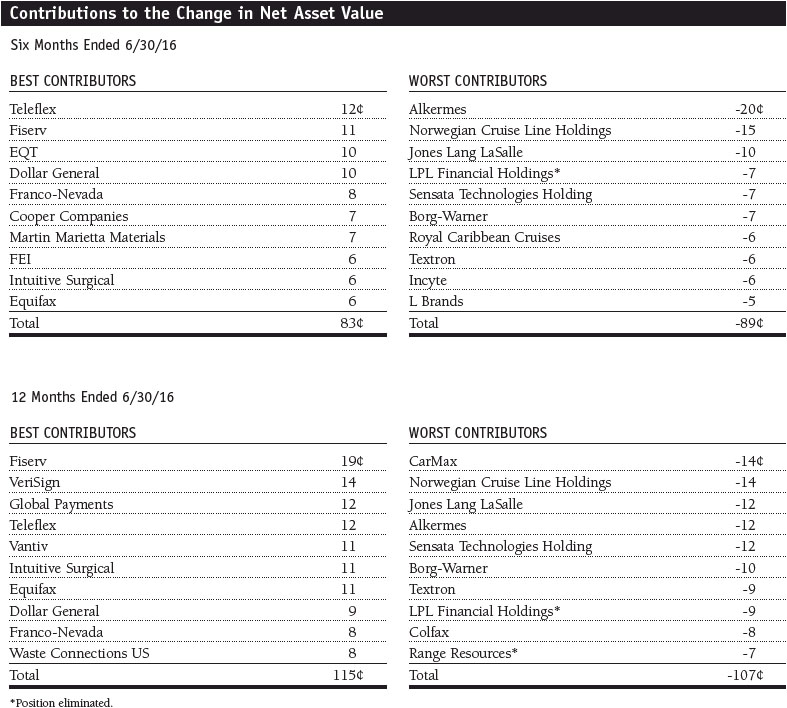
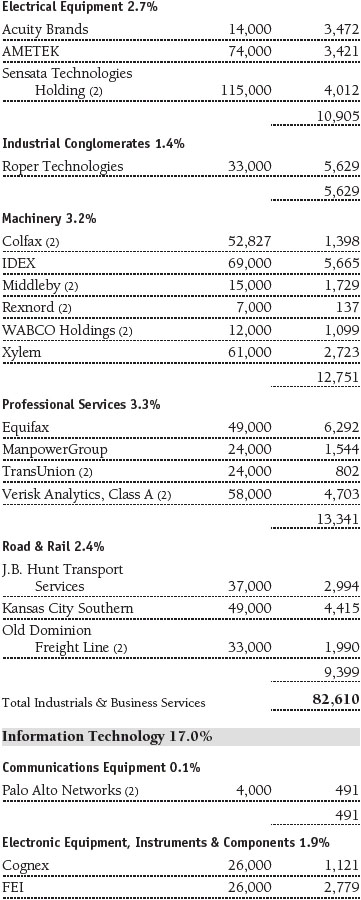
Even as the tech sector generally muddled along, our holdings in the segment provided an important boost to the portfolio in the first half of our fiscal year. Our IT services holdings were particularly strong, with longtime positions Fiserv and Vantiv among our leading contributors. Fiserv, which helps financial firms handle electronic transactions, continued its stellar long-term record of earnings gains. Vantiv, which handles credit card processing, benefited from optimism over the mandated use of microchip technology in card transactions. Electronic instruments firm FEI, which makes electron microscopes and other highly sophisticated equipment, rose after the announcement of its takeover by industry leader Thermo Fisher Scientific. While we avoided many of the major downdrafts in the sector, we did suffer from owning corporate social network LinkedIn, which fell after reporting dismal earnings and guidance. We believed that the company’s future growth prospects were diminished and that, in the wake of the stock’s retreat, LinkedIn’s employee compensation structure, which was highly reliant on its own stock price, would complicate the company’s ability to attract and retain talent; we therefore eliminated the stock. This proved to be a major mistake as Microsoft subsequently announced an agreement to acquire the company at a significant premium. (Please refer to the fund’s portfolio of investments for a complete list of our holdings and the amount each represents in the portfolio.)
Materials stocks are a small part of the portfolio but they provided the second-largest boost to our returns in the period. One of our standout performers was Franco-Nevada, an investment company that focuses primarily on gold royalties. Rising gold prices drove the stock higher, and we remain impressed with management’s ability to find productive mining assets for its portfolio. Martin Marietta Materials produces aggregates, the primary ingredients in concrete and asphalt. Increased spending on highways and residential construction has boosted revenues and helped the stock, while high barriers to entry in the business have helped protect lucrative margins.
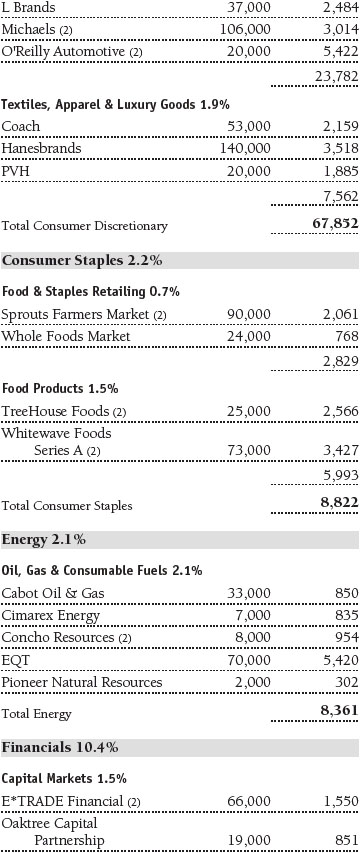
Energy stocks are an even smaller part of the portfolio. Because we are skeptical that oil prices have much further to rise, we have focused on natural gas companies, particularly those that are exploiting the low-cost Marcellus shale reserves in Appalachia. Marcellus operator EQT was our leading performer in this segment.
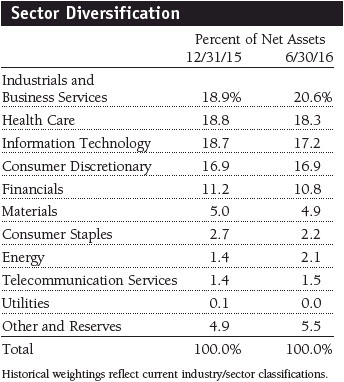
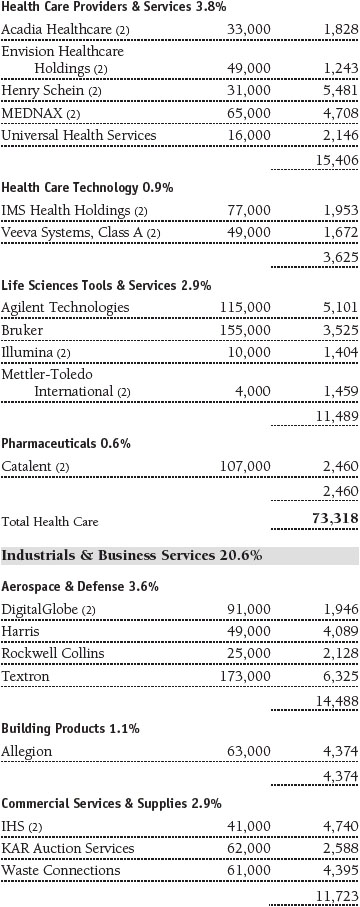
Our largest sector exposure is industrials and business services. Within the group, we own many solidly growing firms that often fly under the radar of many other growth investors. This has led us to a meaningful and longtime emphasis on commercial and professional services stocks that are less cyclical than traditional industrial firms. We added to our services weighting in 2014 and 2015 in anticipation of slowing growth, but we are now reluctantly trimming our holdings—although not because of renewed optimism about the economy, as we discuss below. In the first half of 2016, the portfolio particularly benefited from its large stake in Equifax, one of the leading credit bureaus in the U.S., which reported strong results from its growing information services business. Railroad Kansas City Southern and commercial waste services provider Waste Connections also performed well. Generally, our positions in manufacturers that rely on healthy export markets fared worse. Textron, which has a global business in aircraft and defense systems, performed poorly as investors worried about the slow recovery in its business jet market. We see healthy growth ahead in helicopters, all-terrain vehicles, and several of its other business segments, however. Sensata Technologies Holding, which makes sensors for the auto market, declined as investors worried about a downturn in auto demand.
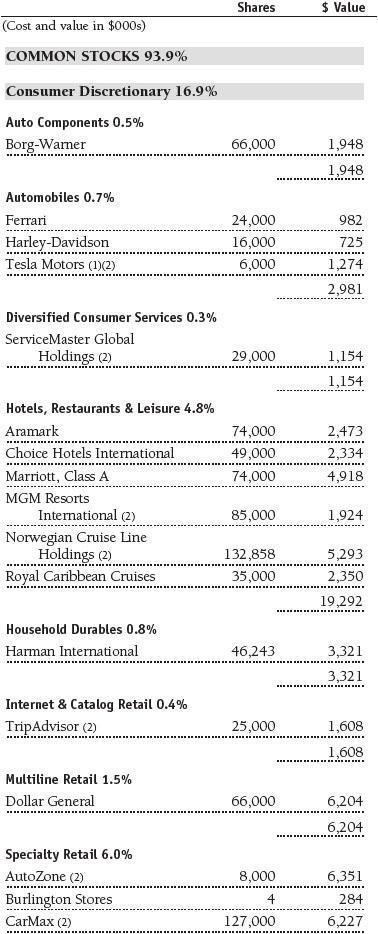
Our consumer discretionary holdings weighed the most on our returns in the period. Cruise operators Royal Caribbean Cruises and Norwegian Cruise Line Holdings performed particularly poorly as investors fretted about falling global demand, especially for Mediterranean itineraries, and about their nascent operations in China. Worries over reduced travel also impacted TripAdvisor, and auto-related stocks Borg-Warner and CarMax suffered from the concerns that the auto market has peaked. A bright spot in the sector was retailer Dollar General, which benefited from some improvement in the prospects for low-end consumers and from a more inwardly-focused competitor, Family Dollar, which is in the midst of a merger with Dollar Tree. Other larger sectors in the portfolio recorded modest (health care) or even negative (financials) returns in the period.
Investment Strategy and Outlook
We were certainly pleased to record a positive return in the first half of the year, but we would rest easier if we thought that the market’s gains stood on a more solid foundation. It has become increasingly clear that the data dependency that the Fed and other central banks assert is their modus operandi is really just code for how global financial markets are performing and that they are intent on driving asset prices higher. Indeed, many of Wall Street’s largest daily gains in 2016 have come on the heels of central bank moves or even encouraging remarks from monetary officials. For example, the major indexes reversed an early slump and reached new 2016 highs on March 29 following Fed Chair Janet Yellen’s speech to the Economic Club of New York in which she promised that the Fed would be cautious in raising rates. Dovish commentary from monetary officials overseas also boosted markets, as did expanded quantitative easing programs from both the European and Japanese central banks. The debate in financial markets is now centered on whether the next rate increase will come in 2016, 2017, or maybe even later.
Regardless of the timing of the next small increase, it is more notable that the world has now moved into financial territory not seen in centuries. Indeed, according to Bank of America’s excellent summary of academic research on very long-term economic and market trends, global long-term interest rates are now the lowest they have been in 5,000 years. Ten-Year Treasury yields are their lowest in U.S. history. Silk Road traders, Flemish merchants, and Virginia plantation owners could not borrow as cheaply as General Electric or the Italian government can today, and if you want to lend money for several years to the German, Japanese, or even Spanish governments, you have to pay them—a situation that would have baffled our ancestors and, quite frankly, astonishes us.
At first glance, this extraordinary situation has left a remarkably small imprint on the global economy. Record-low interest rates have begotten neither rampant inflation nor solid economic growth, leaving both central bank supporters and detractors equally befuddled. A consensus seems to be emerging, however, that powerful deflationary forces are at work in the global economy that conventional (low rates) and even unconventional (quantitative easing) monetary policies are unable to reverse. Demographic changes are making much of the world look more like Japan, where an aging population that is saving rather than spending has resulted in nearly three “lost decades” of economic stagnation. The social spending needed to support aging populations and the high levels of debt before the financial crisis have compelled governments to cut back outlays, while corporations and individuals have been forced to service and pay down debt, suppressing spending. Finally, the impact of technological change and workplace automation is becoming increasingly clear and permeates almost every sector and region of the global economy. Many products are cheaper to make, but the robots making them are not taking home paychecks and stimulating the economy.
While the first-order effects of low rates have been surprisingly small, a consensus also seems to be emerging that the extreme monetary conditions are having much larger second-order effects. We have discussed some of these in past letters: Retirees and others depending on short-term income are being squeezed; pension funds are stretching to be able to meet obligations; and bubbles have emerged in luxury real estate, art, and other areas as the rich—the primary beneficiaries of low rates—have sought assets that promise some return on their money. In our letters over the last several years, we have also described how excess liquidity has fueled mini-bubbles in the stock market sectors such as biotechnology, online media, and software services. Cheap money also fueled the oil boom and therefore bears some responsibility for the bust.
Oil stocks have plummeted since late 2014, of course, and much of the air has also come out of the other market darlings—particularly biotech shares. We now seem to have entered a new phase in which investors, desperately searching for yield, are crowding into low-volatility stocks, especially those with substantial dividends, such as telecom services, utilities, and real estate investment trusts (REITs). Telecom shares in the S&P 500 returned nearly 25% in first half of the year, utilities over 23%, and REITs 11%. In the mid-cap growth arena, this phenomenon has manifested itself most acutely in the hunt for dividend-paying consumer staples stocks, which returned nearly 12% in the first half of the year, as measured by our Russell benchmark.
More generally, investors have recently turned to stable growers—our longtime favorite hunting ground. In the last several quarters, this has worked to our benefit, as the portfolio’s substantial holdings in Fiserv, Vantiv, Gartner, IDEXX Laboratories, and a host of other solid and consistent growth companies have performed especially well as their valuations have swelled. Lower-volatility growth companies that are expanding earnings at a moderate but reliable pace have been this portfolio’s foundation for many years. Yet they suddenly seem to be morphing into the market’s momentum darlings—a very uncomfortable situation for us given our risk-aware approach to valuations. We have slowly and reluctantly begun to trim our position sizes in many of these holdings, even as the market continues to push them to new highs week after week.
Needless to say, this environment also makes replacing these positions more difficult. Shifts in market dynamics are typically uneven, however, and we see some opportunities in the current mania for the slow and steady. We have added to positions in several of the more cyclical sectors of the market, which have been pummeled, and which are close to being priced for recession. Among these more cyclical additions, we have tried to maintain a bias toward quality companies such as Marriott, Harman International, and Sensata, all three of which are dependent on leisure travel or auto sales. We may well have a recession soon, although the balance of the evidence suggests to us that one is unlikely. But if we do, we suspect that their current discounts may help these stocks hold up somewhat better than they have traditionally, while valuations in other areas perceived as more stable could fall back significantly. As a result, we have found ourselves shopping a bit in the “recession bin,” looking for stocks where fairly negative economic scenarios have already been reflected in stock prices.
Economic indicators have been vacillating in a slow growth mode for many quarters now. It is possible that the global economy will shake off much adversity and begin to grow at a faster clip. However, our overall outlook is cautious. Valuations have drifted to somewhat above-average historical levels as investors chase yield and stability, making the risks and rewards of stock investing more asymmetric. Stated more succinctly, the imbalances in the new normal are distinctly abnormal and will eventually equilibrate. We cannot claim any special insight on when this will happen or what the implications will be when it does. Another bear market is possible, but so is a gentle deflation in valuations while earnings gradually catch up with stock prices. In either case, we believe that a historically informed, long-term, and patient approach will best serve our shareholders.
Respectfully submitted,

Brian W.H. Berghuis
Chairman of the portfolio’s Investment Advisory Committee

John F. Wakeman
Executive vice president of the portfolio
July 25, 2016
The committee chairman has day-to-day responsibility for managing the portfolio and works with committee members in developing and executing its investment program.
As with all stock and bond mutual funds, the portfolio’s share price can fall because of weakness in the stock or bond markets, a particular industry, or specific holdings. The financial markets can decline for many reasons, including adverse political or economic developments, changes in investor psychology, or heavy institutional selling. The prospects for an industry or company may deteriorate because of a variety of factors, including disappointing earnings or changes in the competitive environment. In addition, the investment manager’s assessment of companies held in a fund may prove incorrect, resulting in losses or poor performance even in rising markets. The stocks of mid-cap companies entail greater risk and are usually more volatile than the shares of larger companies. In addition, growth stocks can be volatile for several reasons. Since they usually reinvest a high proportion of earnings in their own businesses, they may lack the dividends usually associated with value stocks that can cushion their decline in a falling market. Also, since investors buy these stocks because of their expected superior earnings growth, earnings disappointments often result in sharp price declines.
Gross domestic product (GDP): The total market value of all goods and services produced in a country in a given year.
Lipper indexes: Fund benchmarks that consist of a small number of the largest mutual funds in a particular category as defined by Lipper Inc.
Real estate investment trusts (REITs): Publicly traded companies that own, develop, and operate apartment complexes, hotels, office buildings, and other commercial properties.
Russell Midcap Growth Index: An unmanaged index that measures the performance of those Russell midcap companies with higher price-to-book ratios and higher forecast growth values.
Russell Midcap Value Index: An unmanaged index that measures the performance of those Russell midcap companies with lower price-to-book ratios and lower forecast growth values.
S&P 500 Index: An unmanaged index that tracks the stocks of 500 primarily large-cap U.S. companies.
Note: Russell Investment Group is the source and owner of the trademarks, service marks, and copyrights related to the Russell indexes. Russell™ is a trademark of Russell Investment Group.
Portfolio Highlights

Portfolio Highlights
Performance and Expenses
T. Rowe Price Mid-Cap Growth Portfolio
This chart shows the value of a hypothetical $10,000 investment in the portfolio over the past 10 fiscal year periods or since inception (for portfolios lacking 10-year records). The result is compared with benchmarks, which may include a broad-based market index and a peer group average or index. Market indexes do not include expenses, which are deducted from portfolio returns as well as mutual fund averages and indexes.
Fund Expense Example
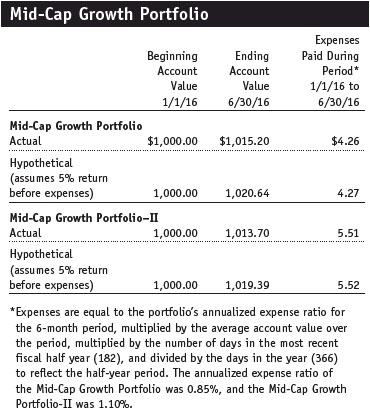
As a mutual fund shareholder, you may incur two types of costs: (1) transaction costs, such as redemption fees or sales loads, and (2) ongoing costs, including management fees, distribution and service (12b-1) fees, and other fund expenses. The following example is intended to help you understand your ongoing costs (in dollars) of investing in the fund and to compare these costs with the ongoing costs of investing in other mutual funds. The example is based on an investment of $1,000 invested at the beginning of the most recent six-month period and held for the entire period.
Shares of the fund are currently offered only through certain insurance companies as an investment medium for both variable annuity contracts and variable life insurance policies. Please note that the fund has two classes of shares: the original share class and II Class. II Class shares are sold through financial intermediaries, which are compensated for distribution, shareholder servicing, and/or certain administrative services under a Board-approved Rule 12b-1 plan.
Actual Expenses
The first line of the following table (Actual) provides information about actual account values and actual expenses. You may use the information on this line, together with your account balance, to estimate the expenses that you paid over the period. Simply divide your account value by $1,000 (for example, an $8,600 account value divided by $1,000 = 8.6), then multiply the result by the number on the first line under the heading “Expenses Paid During Period” to estimate the expenses you paid on your account during this period.
Hypothetical Example for Comparison Purposes
The information on the second line of the table (Hypothetical) is based on hypothetical account values and expenses derived from the fund’s actual expense ratio and an assumed 5% per year rate of return before expenses (not the fund’s actual return). You may compare the ongoing costs of investing in the fund with other funds by contrasting this 5% hypothetical example and the 5% hypothetical examples that appear in the shareholder reports of the other funds. The hypothetical account values and expenses may not be used to estimate the actual ending account balance or expenses you paid for the period.
You should also be aware that the expenses shown in the table highlight only your ongoing costs and do not reflect any transaction costs, such as redemption fees or sales loads. Therefore, the second line of the table is useful in comparing ongoing costs only and will not help you determine the relative total costs of owning different funds. To the extent a fund charges transaction costs, however, the total cost of owning that fund is higher.
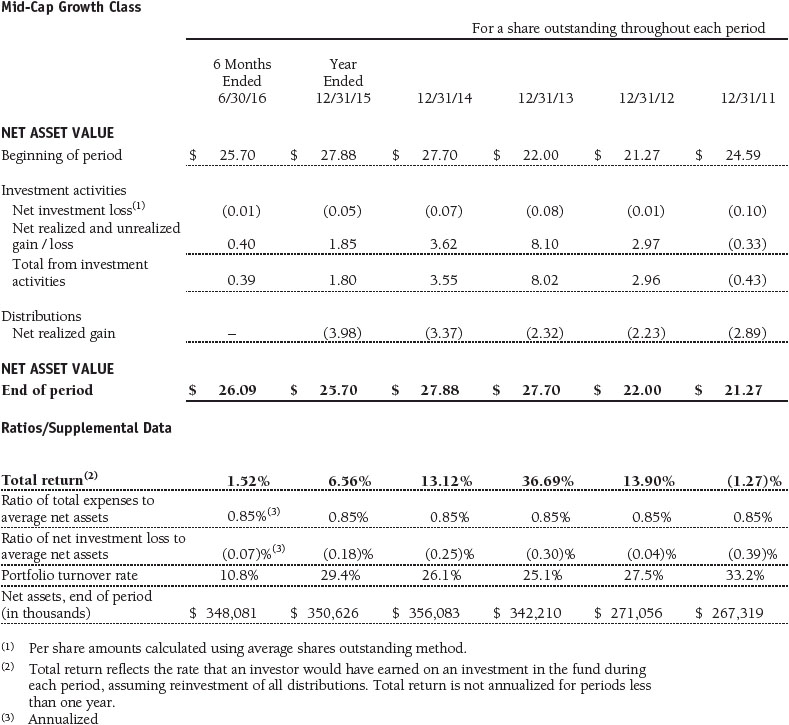
Financial Highlights
T. Rowe Price Mid-Cap Growth Portfolio
(Unaudited)
The accompanying notes are an integral part of these financial statements.
Financial Highlights
T. Rowe Price Mid-Cap Growth Portfolio
(Unaudited)

The accompanying notes are an integral part of these financial statements.
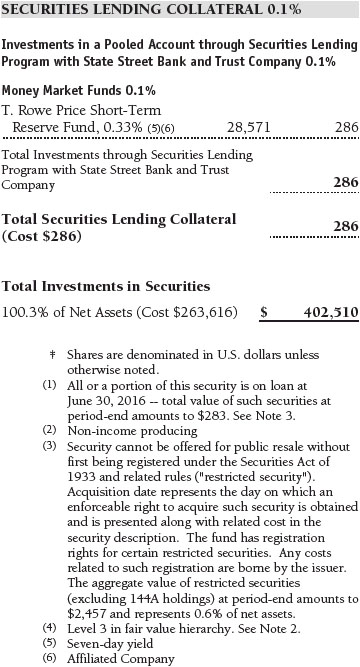
Portfolio of Investments‡
T. Rowe Price Mid-Cap Growth Portfolio
June 30, 2016 (Unaudited)


The accompanying notes are an integral part of these financial statements.
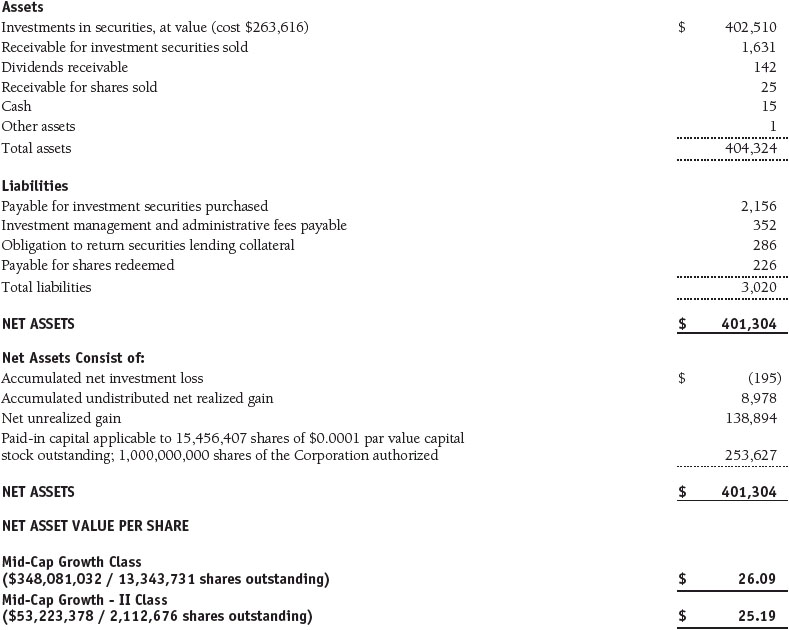
Statement of Assets and Liabilities
T. Rowe Price Mid-Cap Growth Portfolio
June 30, 2016 (Unaudited)
($000s, except shares and per share amounts)
The accompanying notes are an integral part of these financial statements.
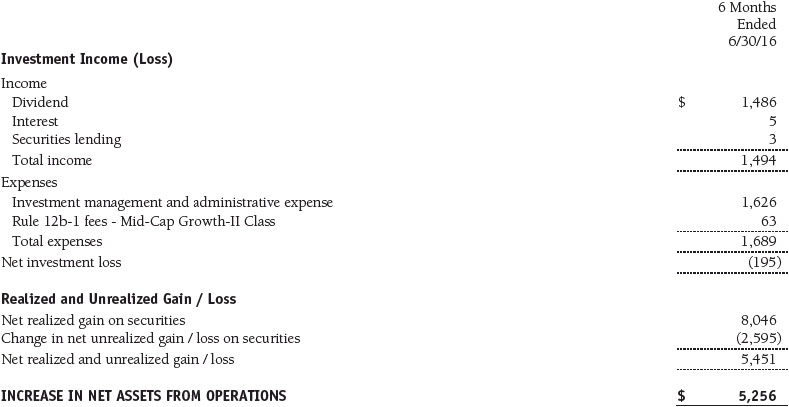
Statement of Operations
T. Rowe Price Mid-Cap Growth Portfolio
(Unaudited)
($000s)
The accompanying notes are an integral part of these financial statements.
Statement of Changes in Net Assets
T. Rowe Price Mid-Cap Growth Portfolio
(Unaudited)
($000s)

The accompanying notes are an integral part of these financial statements.
Notes to Financial Statements
T. Rowe Price Mid-Cap Growth Portfolio
June 30, 2016 (Unaudited)
T. Rowe Price Equity Series, Inc. (the corporation), is registered under the Investment Company Act of 1940 (the 1940 Act). The Mid-Cap Growth Portfolio (the fund) is a diversified, open-end management investment company established by the corporation. Shares of the fund currently are offered only through certain insurance companies as an investment medium for both variable annuity contracts and variable life insurance policies. The fund seeks to provide long-term capital appreciation by investing in mid-cap stocks with potential for above-average earnings growth. The fund has two classes of shares: the Mid-Cap Growth Portfolio original share class (Mid-Cap Growth Class), incepted on December 31, 1996, and the Mid-Cap Growth Portfolio–II (Mid-Cap Growth–II Class), incepted on April 30, 2002. Mid-Cap Growth–II Class shares are sold through financial intermediaries, which it compensates for distribution, shareholder servicing, and/or certain administrative services under a Board-approved Rule 12b-1 plan. Each class has exclusive voting rights on matters related solely to that class; separate voting rights on matters that relate to both classes; and, in all other respects, the same rights and obligations as the other class.
NOTE 1 - SIGNIFICANT ACCOUNTING POLICIES
Basis of Preparation The fund is an investment company and follows accounting and reporting guidance in the Financial Accounting Standards Board (FASB) Accounting Standards Codification Topic 946 (ASC 946). The accompanying financial statements were prepared in accordance with accounting principles generally accepted in the United States of America (GAAP), including, but not limited to, ASC 946. GAAP requires the use of estimates made by management. Management believes that estimates and valuations are appropriate; however, actual results may differ from those estimates, and the valuations reflected in the accompanying financial statements may differ from the value ultimately realized upon sale or maturity.
Investment Transactions, Investment Income, and Distributions Income and expenses are recorded on the accrual basis. Dividends received from mutual fund investments are reflected as dividend income; capital gain distributions, if any, are reflected as realized gain/loss. Earnings on investments recognized as partnerships for federal income tax purposes reflect the tax character of such earnings. Dividend income and capital gain distributions are recorded on the ex-dividend date. Income tax-related interest and penalties, if incurred, would be recorded as income tax expense. Investment transactions are accounted for on the trade date. Realized gains and losses are reported on the identified cost basis. Income distributions are declared and paid by each class annually. Distributions to shareholders are recorded on the ex-dividend date. Capital gain distributions, if any, are generally declared and paid by the fund annually.
Class Accounting Investment income, investment management and administrative expense, and realized and unrealized gains and losses are allocated to the classes based upon the relative daily net assets of each class. Mid-Cap Growth–II Class pays Rule 12b-1 fees, in an amount not exceeding 0.25% of the class’s average daily net assets.
Rebates Subject to best execution, the fund may direct certain security trades to brokers who have agreed to rebate a portion of the related brokerage commission to the fund in cash. Commission rebates are reflected as realized gain on securities in the accompanying financial statements and totaled $3,000 for the six months ended June 30, 2016.
NOTE 2 - VALUATION
The fund’s financial instruments are valued and each class’s net asset value (NAV) per share is computed at the close of the New York Stock Exchange (NYSE), normally 4 p.m. ET, each day the NYSE is open for business.
Fair Value The fund’s financial instruments are reported at fair value, which GAAP defines as the price that would be received to sell an asset or paid to transfer a liability in an orderly transaction between market participants at the measurement date. The T. Rowe Price Valuation Committee (the Valuation Committee) has been established by the fund’s Board of Directors (the Board) to ensure that financial instruments are appropriately priced at fair value in accordance with GAAP and the 1940 Act. Subject to oversight by the Board, the Valuation Committee develops and oversees pricing-related policies and procedures and approves all fair value determinations. Specifically, the Valuation Committee establishes procedures to value securities; determines pricing techniques, sources, and persons eligible to effect fair value pricing actions; oversees the selection, services, and performance of pricing vendors; oversees valuation-related business continuity practices; and provides guidance on internal controls and valuation-related matters. The Valuation Committee reports to the Board and has representation from legal, portfolio management and trading, operations, risk management, and the fund’s treasurer.
Various valuation techniques and inputs are used to determine the fair value of financial instruments. GAAP establishes the following fair value hierarchy that categorizes the inputs used to measure fair value:
Level 1 – quoted prices (unadjusted) in active markets for identical financial instruments that the fund can access at the reporting date
Level 2 – inputs other than Level 1 quoted prices that are observable, either directly or indirectly (including, but not limited to, quoted prices for similar financial instruments in active markets, quoted prices for identical or similar financial instruments in inactive markets, interest rates and yield curves, implied volatilities, and credit spreads)
Level 3 – unobservable inputs
Observable inputs are developed using market data, such as publicly available information about actual events or transactions, and reflect the assumptions that market participants would use to price the financial instrument. Unobservable inputs are those for which market data are not available and are developed using the best information available about the assumptions that market participants would use to price the financial instrument. GAAP requires valuation techniques to maximize the use of relevant observable inputs and minimize the use of unobservable inputs. When multiple inputs are used to derive fair value, the financial instrument is assigned to the level within the fair value hierarchy based on the lowest-level input that is significant to the fair value of the financial instrument. Input levels are not necessarily an indication of the risk or liquidity associated with financial instruments at that level but rather the degree of judgment used in determining those values.
Valuation Techniques Equity securities listed or regularly traded on a securities exchange or in the over-the-counter (OTC) market are valued at the last quoted sale price or, for certain markets, the official closing price at the time the valuations are made. OTC Bulletin Board securities are valued at the mean of the closing bid and asked prices. A security that is listed or traded on more than one exchange is valued at the quotation on the exchange determined to be the primary market for such security. Listed securities not traded on a particular day are valued at the mean of the closing bid and asked prices. Actively traded equity securities listed on a domestic exchange generally are categorized in Level 1 of the fair value hierarchy. OTC Bulletin Board securities, certain preferred securities, and equity securities traded in inactive markets generally are categorized in Level 2 of the fair value hierarchy.
Investments in mutual funds are valued at the mutual fund’s closing NAV per share on the day of valuation and are categorized in Level 1 of the fair value hierarchy. Assets and liabilities other than financial instruments, including short-term receivables and payables, are carried at cost, or estimated realizable value, if less, which approximates fair value.
Thinly traded financial instruments and those for which the above valuation procedures are inappropriate or are deemed not to reflect fair value are stated at fair value as determined in good faith by the Valuation Committee. The objective of any fair value pricing determination is to arrive at a price that could reasonably be expected from a current sale. Financial instruments fair valued by the Valuation Committee are primarily private placements, restricted securities, warrants, rights, and other securities that are not publicly traded.
Subject to oversight by the Board, the Valuation Committee regularly makes good faith judgments to establish and adjust the fair valuations of certain securities as events occur and circumstances warrant. For instance, in determining the fair value of an equity investment with limited market activity, such as a private placement or a thinly traded public company stock, the Valuation Committee considers a variety of factors, which may include, but are not limited to, the issuer’s business prospects, its financial standing and performance, recent investment transactions in the issuer, new rounds of financing, negotiated transactions of significant size between other investors in the company, relevant market valuations of peer companies, strategic events affecting the company, market liquidity for the issuer, and general economic conditions and events. In consultation with the investment and pricing teams, the Valuation Committee will determine an appropriate valuation technique based on available information, which may include both observable and unobservable inputs. The Valuation Committee typically will afford greatest weight to actual prices in arm’s length transactions, to the extent they represent orderly transactions between market participants, transaction information can be reliably obtained, and prices are deemed representative of fair value. However, the Valuation Committee may also consider other valuation methods such as market-based valuation multiples; a discount or premium from market value of a similar, freely traded security of the same issuer; or some combination. Fair value determinations are reviewed on a regular basis and updated as information becomes available, including actual purchase and sale transactions of the issue. Because any fair value determination involves a significant amount of judgment, there is a degree of subjectivity inherent in such pricing decisions, and fair value prices determined by the Valuation Committee could differ from those of other market participants. Depending on the relative significance of unobservable inputs, including the valuation technique(s) used, fair valued securities may be categorized in Level 2 or 3 of the fair value hierarchy.
Valuation Inputs The following table summarizes the fund’s financial instruments, based on the inputs used to determine their fair values on June 30, 2016:
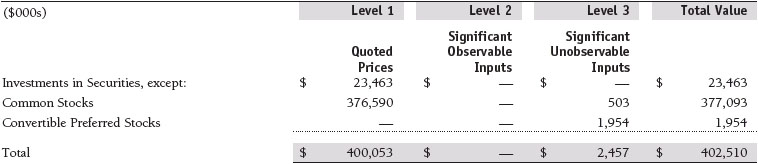
There were no material transfers between Levels 1 and 2 during the six months ended June 30, 2016.
Following is a reconciliation of the fund’s Level 3 holdings for the six months ended June 30, 2016. Gain (loss) reflects both realized and change in unrealized gain/loss on Level 3 holdings during the period, if any, and is included on the accompanying Statement of Operations. The change in unrealized gain/loss on Level 3 instruments held at June 30, 2016, totaled $133,000 for the six months ended June 30, 2016.

NOTE 3 - OTHER INVESTMENT TRANSACTIONS
Consistent with its investment objective, the fund engages in the following practices to manage exposure to certain risks and/or to enhance performance. The investment objective, policies, program, and risk factors of the fund are described more fully in the fund’s prospectus and Statement of Additional Information.
Restricted Securities The fund may invest in securities that are subject to legal or contractual restrictions on resale. Prompt sale of such securities at an acceptable price may be difficult and may involve substantial delays and additional costs.
Securities Lending The fund may lend its securities to approved brokers to earn additional income. Its securities lending activities are administered by a lending agent in accordance with a securities lending agreement. Security loans generally do not have stated maturity dates, and the fund may recall a security at any time. The fund receives collateral in the form of cash or U.S. government securities, valued at 102% to 105% of the value of the securities on loan. Collateral is maintained over the life of the loan in an amount not less than the value of loaned securities; any additional collateral required due to changes in security values is delivered to the fund the next business day. Cash collateral is invested by the lending agent(s) in accordance with investment guidelines approved by fund management. Additionally, the lending agent indemnifies the fund against losses resulting from borrower default. Although risk is mitigated by the collateral and indemnification, the fund could experience a delay in recovering its securities and a possible loss of income or value if the borrower fails to return the securities, collateral investments decline in value, and the lending agent fails to perform. Securities lending revenue consists of earnings on invested collateral and borrowing fees, net of any rebates to the borrower, compensation to the lending agent, and other administrative costs. In accordance with GAAP, investments made with cash collateral are reflected in the accompanying financial statements, but collateral received in the form of securities is not. At June 30, 2016, the value of loaned securities was $283,000; the value of cash collateral and related investments was $286,000.
Other Purchases and sales of portfolio securities other than short-term securities aggregated $39,935,000 and $49,705,000, respectively, for the six months ended June 30, 2016.
NOTE 4 - FEDERAL INCOME TAXES
No provision for federal income taxes is required since the fund intends to continue to qualify as a regulated investment company under Subchapter M of the Internal Revenue Code and distribute to shareholders all of its taxable income and gains. Distributions determined in accordance with federal income tax regulations may differ in amount or character from net investment income and realized gains for financial reporting purposes. Financial reporting records are adjusted for permanent book/tax differences to reflect tax character but are not adjusted for temporary differences. The amount and character of tax-basis distributions and composition of net assets are finalized at fiscal year-end; accordingly, tax-basis balances have not been determined as of the date of this report.
At June 30, 2016, the cost of investments for federal income tax purposes was $265,034,000. Net unrealized gain aggregated $137,476,000 at period-end, of which $144,534,000 related to appreciated investments and $7,058,000 related to depreciated investments.
NOTE 5 - RELATED PARTY TRANSACTIONS
The fund is managed by T. Rowe Price Associates, Inc. (Price Associates), a wholly owned subsidiary of T. Rowe Price Group, Inc. (Price Group). The investment management and administrative agreement between the fund and Price Associates provides for an all-inclusive annual fee equal to 0.85% of the fund’s average daily net assets. The fee is computed daily and paid monthly. The all-inclusive fee covers investment management, shareholder servicing, transfer agency, accounting, and custody services provided to the fund, as well as fund directors’ fees and expenses. Interest, taxes, brokerage commissions, and extraordinary expenses are paid directly by the fund.
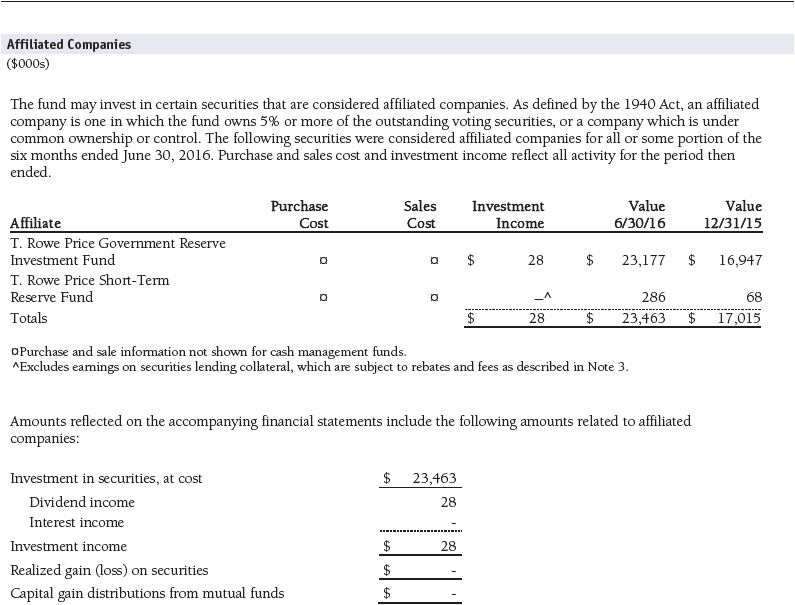
The fund may invest in the T. Rowe Price Reserve Investment Fund, the T. Rowe Price Government Reserve Investment Fund, or the T. Rowe Price Short-Term Reserve Fund (collectively, the Price Reserve Investment Funds), open-end management investment companies managed by Price Associates and considered affiliates of the fund. The Price Reserve Investment Funds are offered as short-term investment options to mutual funds, trusts, and other accounts managed by Price Associates or its affiliates and are not available for direct purchase by members of the public. The Price Reserve Investment Funds pay no investment management fees.
The fund may participate in securities purchase and sale transactions with other funds or accounts advised by Price Associates (cross trades), in accordance with procedures adopted by the fund’s Board and Securities and Exchange Commission rules, which require, among other things, that such purchase and sale cross trades be effected at the independent current market price of the security. During the six months ended June 30, 2016, the aggregate value of purchases and sales cross trades with other funds or accounts advised by Price Associates was less than 1% of the fund’s net assets as of June 30, 2016.
| Information on Proxy Voting Policies, Procedures, and Records |
A description of the policies and procedures used by T. Rowe Price funds and portfolios to determine how to vote proxies relating to portfolio securities is available in each fund’s Statement of Additional Information. You may request this document by calling 1-800-225-5132 or by accessing the SEC’s website, sec.gov.
The description of our proxy voting policies and procedures is also available on our corporate website. To access it, please visit the following Web page
https://www3.troweprice.com/usis/corporate/en/utility/policies.html
and scroll down to the section near the bottom of the page that says, “Proxy Voting Policies.” Click on the Proxy Voting Policies link in the shaded box.
Each fund’s most recent annual proxy voting record is available on our website and through the SEC’s website. To access it through T. Rowe Price, visit the website location shown above, and scroll down to the section near the bottom of the page that says, “Proxy Voting Records.” Click on the Proxy Voting Records link in the shaded box.
| How to Obtain Quarterly Portfolio Holdings |
The fund files a complete schedule of portfolio holdings with the Securities and Exchange Commission for the first and third quarters of each fiscal year on Form N-Q. The fund’s Form N-Q is available electronically on the SEC’s website (sec.gov); hard copies may be reviewed and copied at the SEC’s Public Reference Room, 100 F St. N.E., Washington, DC 20549. For more information on the Public Reference Room, call 1-800-SEC-0330.
| Approval of Investment Management Agreement |
On March 11, 2016, the fund’s Board of Directors (Board), including a majority of the fund’s independent directors, approved the continuation of the investment management agreement (Advisory Contract) between the fund and its investment advisor, T. Rowe Price Associates, Inc. (Advisor). In connection with its deliberations, the Board requested, and the Advisor provided, such information as the Board (with advice from independent legal counsel) deemed reasonably necessary. The Board considered a variety of factors in connection with its review of the Advisory Contract, also taking into account information provided by the Advisor during the course of the year, as discussed below:
Services Provided by the Advisor
The Board considered the nature, quality, and extent of the services provided to the fund by the Advisor. These services included, but were not limited to, directing the fund’s investments in accordance with its investment program and the overall management of the fund’s portfolio, as well as a variety of related activities such as financial, investment operations, and administrative services; compliance; maintaining the fund’s records and registrations; and shareholder communications. The Board also reviewed the background and experience of the Advisor’s senior management team and investment personnel involved in the management of the fund, as well as the Advisor’s compliance record. The Board concluded that it was satisfied with the nature, quality, and extent of the services provided by the Advisor.
Investment Performance of the Fund
The Board reviewed the fund’s three-month, one-year, and year-by-year returns, as well as the fund’s average annualized total returns over the 3-year, 5-year, and 10-year periods, and compared these returns with a wide variety of comparable performance measures and market data, including those supplied by Lipper and Morningstar, which are independent providers of mutual fund data.
On the basis of this evaluation and the Board’s ongoing review of investment results, and factoring in the relative market conditions during certain of the performance periods, the Board concluded that the fund’s performance was satisfactory.
Costs, Benefits, Profits, and Economies of Scale
The Board reviewed detailed information regarding the revenues received by the Advisor under the Advisory Contract and other benefits that the Advisor (and its affiliates) may have realized from its relationship with the fund, including any research received under “soft dollar” agreements and commission-sharing arrangements with broker-dealers. The Board considered that the Advisor may receive some benefit from soft-dollar arrangements pursuant to which research is received from broker-dealers that execute the applicable fund’s portfolio transactions. The Board received information on the estimated costs incurred and profits realized by the Advisor from managing T. Rowe Price mutual funds. The Board also reviewed estimates of the profits realized from managing the fund in particular, and the Board concluded that the Advisor’s profits were reasonable in light of the services provided to the fund.
The Board also considered whether the fund benefits under the fee levels set forth in the Advisory Contract from any economies of scale realized by the Advisor. The Board noted that, under the Advisory Contract, the fund pays the Advisor a single fee, or all-inclusive management fee, which is based on the fund’s average daily net assets. The all-inclusive management fee includes investment management services and provides for the Advisor to pay all of the fund’s ordinary, recurring operating expenses except for interest, taxes, portfolio transaction fees, and any nonrecurring extraordinary expenses that may arise. The Board concluded that, based on the profitability data it reviewed and consistent with this all-inclusive management fee structure, the Advisory Contract provided for a reasonable sharing of any benefits from economies of scale with the fund.
Fees
The Board was provided with information regarding industry trends in management fees and expenses, and the Board reviewed the fund’s management fee rate and total expense ratio (for the Original Class and II Class) in comparison with fees and expenses of other comparable funds based on information and data supplied by Lipper. For these purposes, the Board assumed that the fund’s management fee rate was equal to the all-inclusive management fee rate less the fund’s actual operating expenses, and the total expense ratio was equal to the all-inclusive management fee rate. The information provided to the Board indicated that the fund’s management fee rate was above the median for comparable funds. The information also indicated that the total expense ratio (for the Original Class) was at or below the median for comparable funds and the total expense ratio (for the II Class) was above the median for comparable funds.
The Board also reviewed the fee schedules for institutional accounts (including subadvised mutual funds) and private accounts with similar mandates that are advised or subadvised by the Advisor and its affiliates. Management provided the Board with information about the Advisor’s responsibilities and services provided to subadvisory and other institutional account clients, including information about how the requirements and economics of the institutional business differ from those of the Advisor’s proprietary mutual fund business. The Board considered information showing that the Advisor’s proprietary mutual fund business is generally more complex from a business and compliance perspective than its institutional account business and considered various other relevant factors, including the broader scope of operations and oversight, more extensive shareholder communication infrastructure, greater asset flows, heightened business risks, and differences in applicable laws and regulations associated with the Advisor’s proprietary mutual fund business. In assessing the reasonableness of the fund’s management fee rate, the Board considered the differences in the nature of the services required for the Advisor to manage its proprietary mutual fund business versus managing a discrete pool of assets as a subadvisor to another institution’s mutual fund or for another institutional account and the degree to which the Advisor performs significant additional services and assumes greater risk in managing the fund and other T. Rowe Price mutual funds than it does for institutional account clients.
On the basis of the information provided and the factors considered, the Board concluded that the fees paid by the fund under the Advisory Contract are reasonable.
Approval of the Advisory Contract
As noted, the Board approved the continuation of the Advisory Contract. No single factor was considered in isolation or to be determinative to the decision. Rather, the Board concluded, in light of a weighting and balancing of all factors considered, that it was in the best interests of the fund and its shareholders for the Board to approve the continuation of the Advisory Contract (including the fees to be charged for services thereunder). The independent directors were advised throughout the process by independent legal counsel.
Item 2. Code of Ethics.
A code of ethics, as defined in Item 2 of Form N-CSR, applicable to its principal executive officer, principal financial officer, principal accounting officer or controller, or persons performing similar functions is filed as an exhibit to the registrant’s annual Form N-CSR. No substantive amendments were approved or waivers were granted to this code of ethics during the registrant’s most recent fiscal half-year.
Item 3. Audit Committee Financial Expert.
Disclosure required in registrant’s annual Form N-CSR.
Item 4. Principal Accountant Fees and Services.
Disclosure required in registrant’s annual Form N-CSR.
Item 5. Audit Committee of Listed Registrants.
Not applicable.
Item 6. Investments.
(a) Not applicable. The complete schedule of investments is included in Item 1 of this Form N-CSR.
(b) Not applicable.
Item 7. Disclosure of Proxy Voting Policies and Procedures for Closed-End Management Investment Companies.
Not applicable.
Item 8. Portfolio Managers of Closed-End Management Investment Companies.
Not applicable.
Item 9. Purchases of Equity Securities by Closed-End Management Investment Company and Affiliated Purchasers.
Not applicable.
Item 10. Submission of Matters to a Vote of Security Holders.
Not applicable.
Item 11. Controls and Procedures.
(a) The registrant’s principal executive officer and principal financial officer have evaluated the registrant’s disclosure controls and procedures within 90 days of this filing and have concluded that the registrant’s disclosure controls and procedures were effective, as of that date, in ensuring that information required to be disclosed by the registrant in this Form N-CSR was recorded, processed, summarized, and reported timely.
(b) The registrant’s principal executive officer and principal financial officer are aware of no change in the registrant’s internal control over financial reporting that occurred during the registrant’s second fiscal quarter covered by this report that has materially affected, or is reasonably likely to materially affect, the registrant’s internal control over financial reporting.
Item 12. Exhibits.
(a)(1) The registrant’s code of ethics pursuant to Item 2 of Form N-CSR is filed with the registrant’s annual Form N-CSR.
(2) Separate certifications by the registrant's principal executive officer and principal financial officer, pursuant to Section 302 of the Sarbanes-Oxley Act of 2002 and required by Rule 30a-2(a) under the Investment Company Act of 1940, are attached.
(3) Written solicitation to repurchase securities issued by closed-end companies: not applicable.
(b) A certification by the registrant's principal executive officer and principal financial officer, pursuant to Section 906 of the Sarbanes-Oxley Act of 2002 and required by Rule 30a-2(b) under the Investment Company Act of 1940, is attached.
SIGNATURES
Pursuant to the requirements of the Securities Exchange Act of 1934 and the Investment Company Act of 1940, the registrant has duly caused this report to be signed on its behalf by the undersigned, thereunto duly authorized.
T. Rowe Price Equity Series, Inc.
| | By | /s/ Edward C. Bernard |
| | Edward C. Bernard |
| | Principal Executive Officer |
| |
| Date August 17, 2016 | | |
Pursuant to the requirements of the Securities Exchange Act of 1934 and the Investment Company Act of 1940, this report has been signed below by the following persons on behalf of the registrant and in the capacities and on the dates indicated.
| | By | /s/ Edward C. Bernard |
| | Edward C. Bernard |
| | Principal Executive Officer |
| |
| Date August 17, 2016 | | |
| |
| |
| By | /s/ Catherine D. Mathews |
| | Catherine D. Mathews |
| | Principal Financial Officer |
| |
| Date August 17, 2016 | | |