UNITED STATES
SECURITIES AND EXCHANGE COMMISSION
Washington, D.C. 20549
FORM N-CSR
CERTIFIED SHAREHOLDER REPORT OF REGISTERED
MANAGEMENT INVESTMENT COMPANIES
Investment Company Act File Number: 811-07143
| T. Rowe Price Equity Series, Inc. |
|
| (Exact name of registrant as specified in charter) |
| |
| 100 East Pratt Street, Baltimore, MD 21202 |
|
| (Address of principal executive offices) |
| |
| David Oestreicher |
| 100 East Pratt Street, Baltimore, MD 21202 |
|
| (Name and address of agent for service) |
Registrant’s telephone number, including area code: (410) 345-2000
Date of fiscal year end: December 31
Date of reporting period: June 30, 2019
Item 1. Reports to Shareholders
(a) Report pursuant to Rule 30e-1.
| Health Sciences Portfolio | June 30, 2019 |
| T. ROWE PRICE HEALTH SCIENCES PORTFOLIO |
|
HIGHLIGHTS
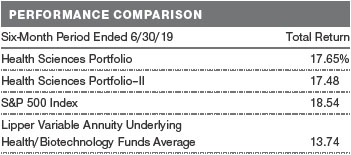
| ■ | The Health Sciences Portfolio returned 17.65% in the six months ended June 30, 2019. The portfolio outperformed its benchmark, the Lipper Variable Annuity Underlying Health/Biotechnology Funds Average, but trailed the broad market as measured by the S&P 500 Index. |
| |
| ■ | Across the board, stock selection powered our strong relative returns, especially within the biotechnology and pharmaceutical segments. Every industry group within the sector contributed to relative results. |
| |
| ■ | While volatility will likely remain a feature of the health care sector in the near term, we believe the fundamental quality of companies will drive long-term performance. |
| |
| ■ | We remain focused on investing in companies that are developing new and effective therapies for unmet medical needs and on businesses that lower costs or improve the quality of the health care system. |
Log in to your account attroweprice.comfor more information.
*Certain mutual fund accounts that are assessed an annual account service fee can also save money by switching to e-delivery.
CIO Market Commentary
Dear Investor
Markets overcame a bout of volatility in May and recorded exceptional returns in the six months ended June 30, 2019. The large-cap S&P 500 Index reached record highs and notched its best start to a year in over two decades. Overseas equity markets were also strong, while bond prices rose as longer-term interest rates fell to their lowest levels since late 2016.
Markets rebounded to start the year, as many of the worries behind the sell-off in late 2018 receded. Investors seemed most relieved by a dovish pivot in monetary policy. The S&P 500 scored its best daily gain for the period on January 4, after Federal Reserve Chair Jerome Powell pledged that the central bank would respond with all the tools at its disposal to counteract an economic downturn or financial turmoil. The Fed soon paused and kept rates steady following a series of quarterly hikes stretching back to late 2017.
Investors also seemed comforted by progress in U.S.-China trade relations. In March, President Donald Trump postponed a threatened tariff increase on Chinese goods and remarked that the two sides were “getting very close” to a deal. Encouraging statements continued to flow from the White House, and speculation grew that Chinese President Xi Jinping would soon visit Washington to sign an agreement.
Hopes for a deal were dashed in early May, however, sending stocks sharply lower. With negotiations at a standstill, on May 10, the administration increased the tariff rate to 25% from 10% on $200 billion in Chinese goods, as the president had long threatened. China soon retaliated with its own tariffs. A technological “cold war” also seemed to be developing, with both sides taking measures to cut off the other’s access to key components and raw materials. Stocks fell sharply in response, and the small- and mid-cap indexes moved back into correction territory, or down more than 10% from the highs they established late in the previous summer.
Another turn in trade policy in June helped stocks recover their losses. The White House abandoned an earlier threat to put tariffs on Mexican imports in response to immigration issues, and President Trump again softened his stance on China. Markets were closed on the final weekend of the month, when the president announced that he and President Xi had agreed to resume trade negotiations and arranged a truce that would at least temporarily prevent the imposition of further tariffs.
An even bigger factor in the June rebound appeared to be growing confidence that the Fed would cut interest rates rather than merely keep them steady. Fed Chair Powell pledged that policymakers were paying close attention to the impact of trade tensions on the economy and would “act as appropriate to sustain the expansion.” Policymakers also dropped references to being “patient” in adjusting monetary policy. By the end of the month, futures markets were pricing in 75 basis points (0.75 percentage point) of cuts in the second half of the year, with a reasonable chance of more to come in 2020.
The dovish shift in Fed policy has been driven by accumulating evidence of slowing global growth. Rising trade barriers have taken a heavy toll on the global manufacturing sector, and business investment has pulled back as managers confront additional sources of uncertainty, such as the possibility of a disorderly Brexit this October. As a result, corporate earnings growth has stalled in the U.S. and turned negative in other major markets. On the positive side, consumers remain in much better shape, particularly domestically.
We see little evidence to suggest a recession is on the horizon. Indeed, with markets at all-time highs, investors seem willing to bet that this decade-long economic recovery still has legs. We will keep a close eye on developments and rely on our careful fundamental research to avoid pitfalls; I am confident our strategic investing approach will continue to serve our shareholders well.
Thank you for your continued confidence in T. Rowe Price.
Sincerely,

Robert Sharps
Group Chief Investment Officer
Management’s Discussion of Fund Performance
INVESTMENT OBJECTIVE
The fund seeks long-term capital appreciation.
FUND COMMENTARY
How did the fund perform in the past six months?
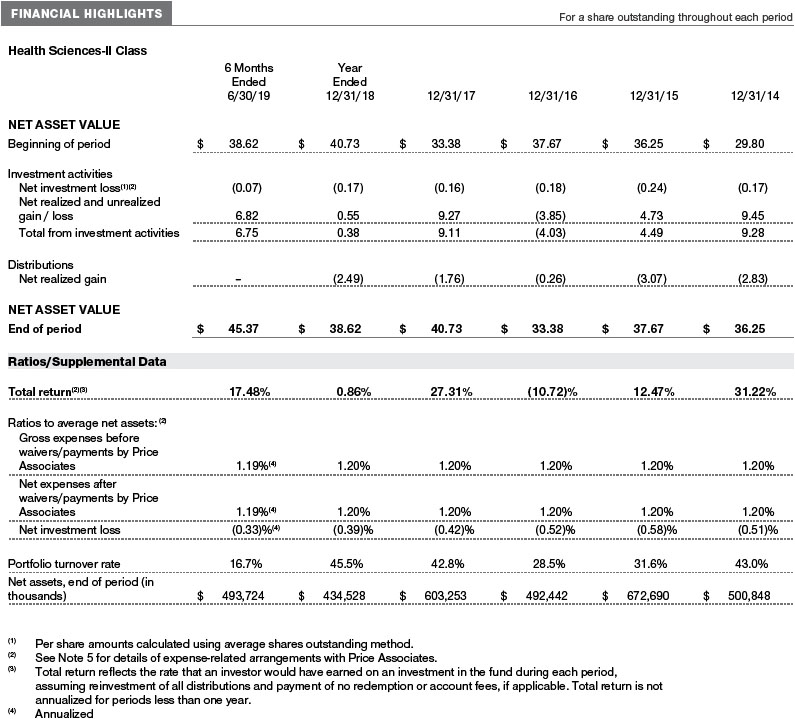
The Health Sciences Portfolio returned 17.65% in the six-month period ended June 30, 2019. The portfolio outperformed its benchmark, the Lipper Variable Annuity Underlying Health/Biotechnology Funds Average, but underperformed the broad U.S. equity market as measured by the S&P 500 Index. (Returns for II Class shares varied slightly, reflecting their different fee structure.Past performance cannot guarantee future results.)
What factors influenced the fund’s performance?
The health care sector endured a volatile start to 2019, in part because health care is shaping up to be one of the principal issues of the 2020 U.S. election cycle. Although volatility will likely persist in the near term, we believe the fundamental underpinnings and the quality of companies we own will drive long-term performance. Stock selection was the key driver of the portfolio’s outperformance through the first six months of the year, and every segment within the sector generated positive absolute and relative returns.
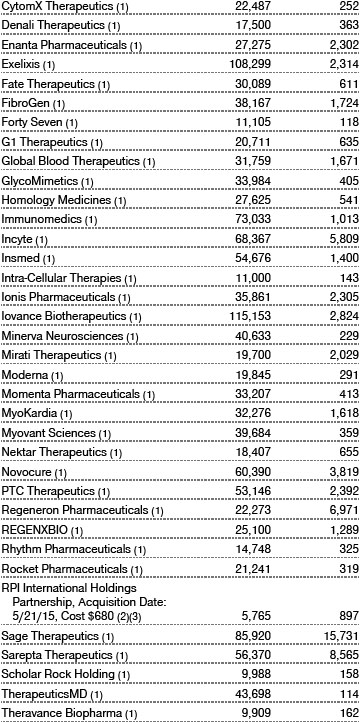
Our biotechnology holdings contributed the most to relative results thanks to stock selection, although our underweight exposure to the group was a modest detractor.SAGE Therapeuticswas the portfolio’s best first-half absolute and relative performance contributor. The company develops novel therapeutics for central nervous system-related indications. Its stock rallied on news of positive results from a Phase 3 trial of SAGE-217 (Zulresso) for the treatment of postpartum depression in women. The drug subsequently gained approval from the U.S. Food and Drug Administration in March. (Please refer to our portfolio of investments for a complete list of holdings and the amount each represents in the portfolio.)
Loxo Oncologywas another strong relative performance contributor. It is developing small molecule therapeutics for the treatment of cancer. The stock surged afterEli Lilly, another portfolio holding, announced an all-cash takeover bid for the firm at a substantial premium.
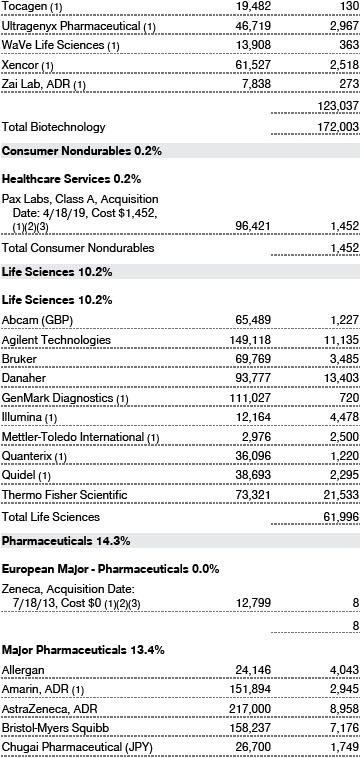
Life sciences posted a solid absolute and relative performance contribution thanks to stock selection and an overweight allocation to the benchmark’s best-performing segment.Brukeris a leading global supplier of high-value scientific and analytical instruments to researchers in academia, the pharmaceutical industry, and other end markets. Its shares surged thanks to solid first-quarter results and increased guidance from management.
Danaherposted solid gains after the company announced in February that it was acquiring GE’s biopharma unit, GE Life Sciences, for roughly $20 billion. While Danaher is highly diversified in many growth areas of technology, we believe the acquisition will provide it with a robust innovation pipeline and favorable exposure to specific therapeutic assets and programs.
An underweight allocation to the services segment and good stock selection contributed to relative performance. Our underweight toCVS Healthhelped relative performance as its shares traded lower after management gave a downbeat full-year financial forecast in February, prompting us to eliminate our position.Guardant Healthhelped relative returns after the diagnostics company reported solid gains. It is the leading player in the emerging field of liquid biopsy-based testing across both clinical and biopharma channels.
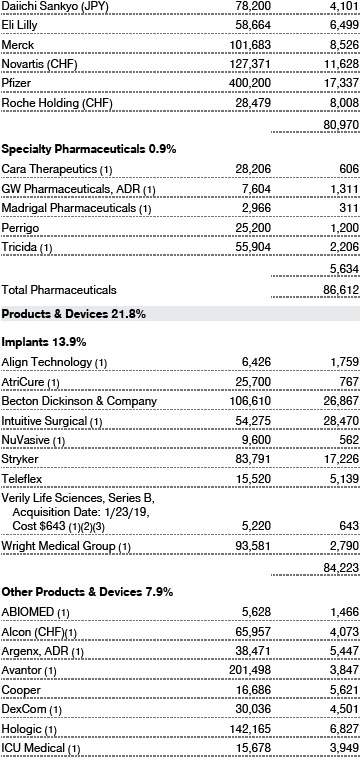
Stock selection in the pharmaceuticals segment contributed to relative performance.Novartishelped relative performance as the company benefited from growth in its branded drug division, led by sales of Entresto, which helps lower blood pressure and sodium levels. Japanese pharmaceutical companyDaiichi Sankyocontributed to relative returns after the company announced it signed a strategic collaboration withAstraZenecain March for its flagship antibody drug conjugate product DS-8201. In our view, the deal with AstraZeneca, a leading oncology company with management members extremely experienced in the field of HER2 cancers, validates the value of its antibody drug.
How is the fund positioned?
We devote most of our efforts to identifying companies that are developing new and innovative medicines or treatments for unmet medical needs. We attempt to maintain broad industry diversification across the entire health care sector. However, we do not attempt to mirror the benchmark’s allocations. The portfolio’s large allocations to the biotechnology and pharmaceuticals segments stem from our belief that the discovery, development, manufacture, and commercialization of innovative, game-changing medicines are the primary drivers of long-term value in the health care sector.
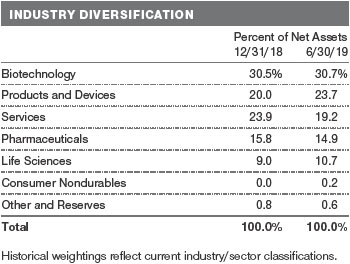
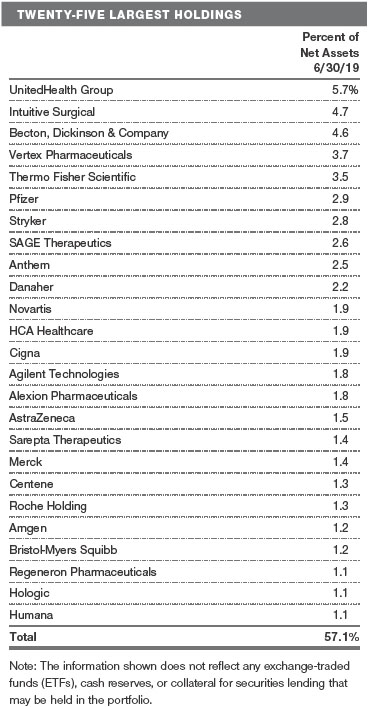
Biotechnology represents our largest allocation within the portfolio. We believe that many of the best investments in health care will come from therapeutics companies or those that produce medicines that prevent disease, relieve symptoms, and provide cures. We added to our positions inRegeneron PharmaceuticalsandAscendis Pharma. We also eliminatedGilead Sciencesand trimmed our stake inAlexion Pharmaceuticals.
Life sciences is the smallest industry allocation in the portfolio, although we are overweight versus the benchmark. Within the segment, we have core positions inThermo Fisher Scientific, Danaher, andAgilent Technologies. We maintained our underweight in the services segment, which is a broad category that includes payers, providers, drug distributors, and health care IT companies. We trimmed our exposures to managed care companiesUnitedHealth Group,Anthem,Cigna, andCenteneand eliminated CVS Health.
Conversely, we have a modest overweight to pharmaceuticals. We generally favor companies that are developing novel therapeutics.Pfizer, Novartis, AstraZeneca, andMerckare our largest positions within the group.
What is portfolio management’s outlook?
Health care innovation remains robust, and we continue to believe that companies producing leading-edge therapeutics and medical devices offer some of the market’s most attractive growth opportunities for investors with a long-term investment horizon. However, political rhetoric surrounding the sector is likely to increase as we move closer to the upcoming U.S. presidential election cycle, which could lead to periods of increased uncertainty and heightened volatility as candidates propose how to contain health care costs.
Regulatory worries weighed on the health care sector over the period, but concerns about drug pricing reform have largely abated. The discussion related to punitive indexing of Medicare Part B drugs, including injectable drugs used largely to treat conditions that affect the elderly, has substantially moderated. Concerns about a “Medicare for All” single-payer health care system have also started to fade with Democratic presidential candidates instead endorsing a buy-in or public option. This has been widely viewed as a positive for Medicare Advantage-focused managed care companies. However, with health care affordability a top concern among voters, we expect substantial discussion on the issue from the presidential candidates, which could create volatility within the health care services segment.
This year has seen an uptick in merger and acquisition activity in biopharma, as larger companies with ample cash on their balance sheets and access to cheap capital have sought to replenish their pipelines and improve their growth prospects. We think that the prospects for more deal-making remain strong, particularly around the areas of oncology, inflammation, and gene therapy, despite the runup in valuations for smaller-cap biotech companies.
While the health care sector faces heightened political risk ahead of the 2020 election, our longer-term view on the sector remains positive because of tailwinds related to aging populations, continual clinical needs, and accelerating innovation. We believe that our disciplined investment approach based on intensive fundamental research into individual health care companies lays the groundwork for solid long-term returns for your portfolio.
The views expressed reflect the opinions of T. Rowe Price as of the date of this report and are subject to change based on changes in market, economic, or other conditions. These views are not intended to be a forecast of future events and are no guarantee of future results.
RISKS OF GROWTH INVESTING
Growth stocks can be volatile for several reasons. Since these companies usually invest a high portion of earnings in their businesses, they may lack the dividends of value stocks that can cushion stock prices in a falling market. Also, earnings disappointments often lead to sharply falling prices because investors buy growth stocks in anticipation of superior earnings growth.
RISKS OF HEALTH SCIENCES INVESTING
Portfolios that invest only in specific industries will experience greater volatility than those investing in a broad range of industries. Companies in the health sciences field are subject to special risks, such as increased competition within the health care industry, changes in legislation or government regulations, reductions in government funding, product liability or other litigation, and the obsolescence of popular products.
GROWTH OF $10,000
This chart shows the value of a hypothetical $10,000 investment in the portfolio over the past 10 fiscal year periods or since inception (for portfolios lacking 10-year records). The result is compared with benchmarks, which include a broad-based market index and may also include a peer group average or index. Market indexes do not include expenses, which are deducted from portfolio returns as well as mutual fund averages and indexes.
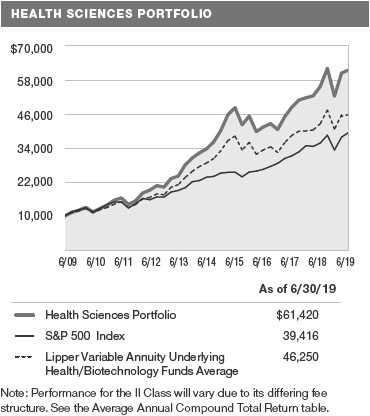
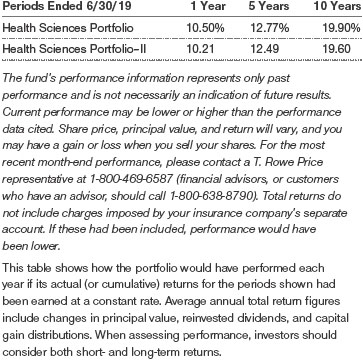
AVERAGE ANNUAL COMPOUND TOTAL RETURN
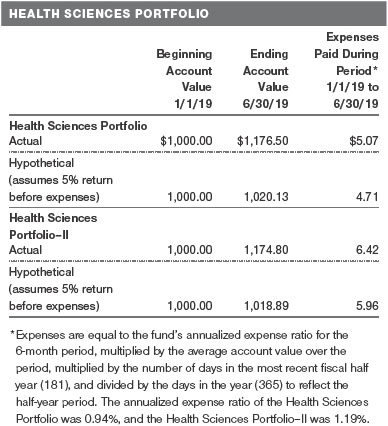
FUND EXPENSE EXAMPLE
As a mutual fund shareholder, you may incur two types of costs: (1) transaction costs, such as redemption fees or sales loads, and (2) ongoing costs, including management fees, distribution and service (12b-1) fees, and other fund expenses. The following example is intended to help you understand your ongoing costs (in dollars) of investing in the fund and to compare these costs with the ongoing costs of investing in other mutual funds. The example is based on an investment of $1,000 invested at the beginning of the most recent six-month period and held for the entire period.
Shares of the fund are currently offered only through certain insurance companies as an investment medium for both variable annuity contracts and variable life insurance policies. Please note that the fund has two classes of shares: the original share class and II Class. II Class shares are sold through financial intermediaries, which are compensated for distribution, shareholder servicing, and/or certain administrative services under a Board-approved Rule 12b-1 plan.
Actual Expenses
The first line of the following table (Actual) provides information about actual account values and actual expenses. You may use the information on this line, together with your account balance, to estimate the expenses that you paid over the period. Simply divide your account value by $1,000 (for example, an $8,600 account value divided by $1,000 = 8.6), then multiply the result by the number on the first line under the heading “Expenses Paid During Period” to estimate the expenses you paid on your account during this period.
Hypothetical Example for Comparison Purposes
The information on the second line of the table (Hypothetical) is based on hypothetical account values and expenses derived from the fund’s actual expense ratio and an assumed 5% per year rate of return before expenses (not the fund’s actual return). You may compare the ongoing costs of investing in the fund with other funds by contrasting this 5% hypothetical example and the 5% hypothetical examples that appear in the shareholder reports of the other funds. The hypothetical account values and expenses may not be used to estimate the actual ending account balance or expenses you paid for the period.
You should also be aware that the expenses shown in the table highlight only your ongoing costs and do not reflect any transaction costs, such as redemption fees or sales loads. Therefore, the second line of the table is useful in comparing ongoing costs only and will not help you determine the relative total costs of owning different funds. To the extent a fund charges transaction costs, however, the total cost of owning that fund is higher.
Unaudited
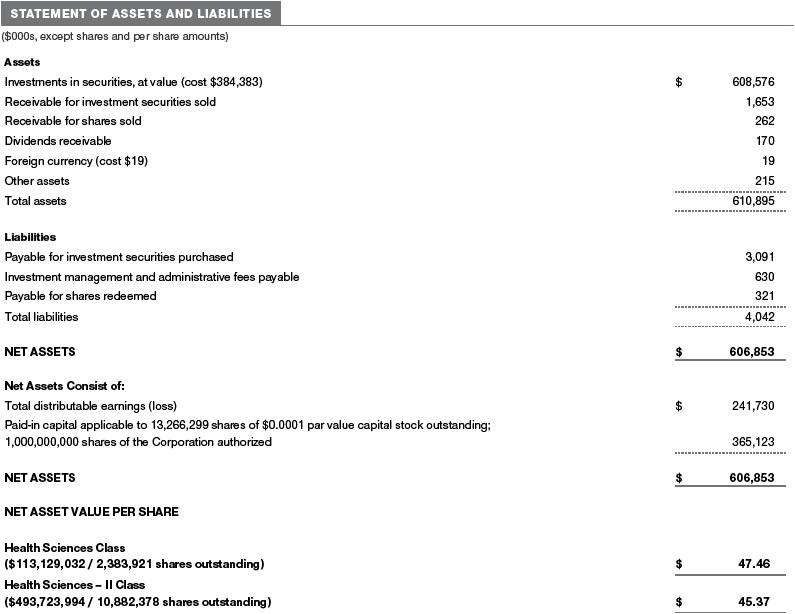
The accompanying notes are an integral part of these financial statements.
Unaudited
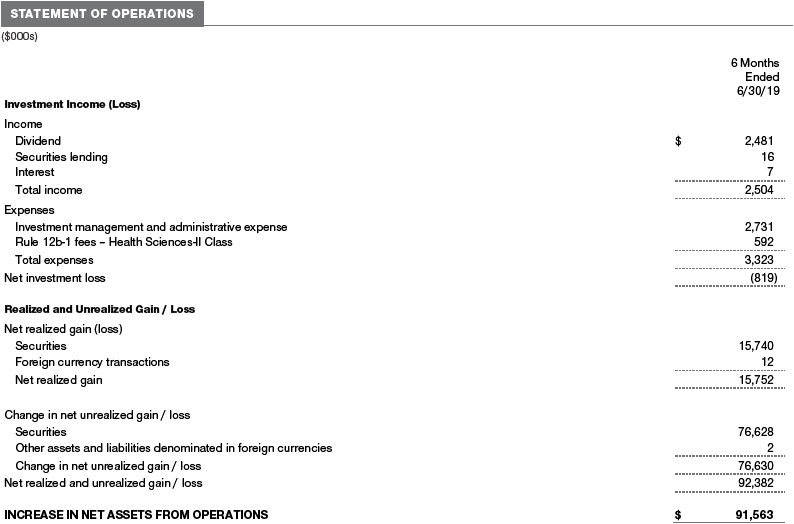
The accompanying notes are an integral part of these financial statements.
Unaudited


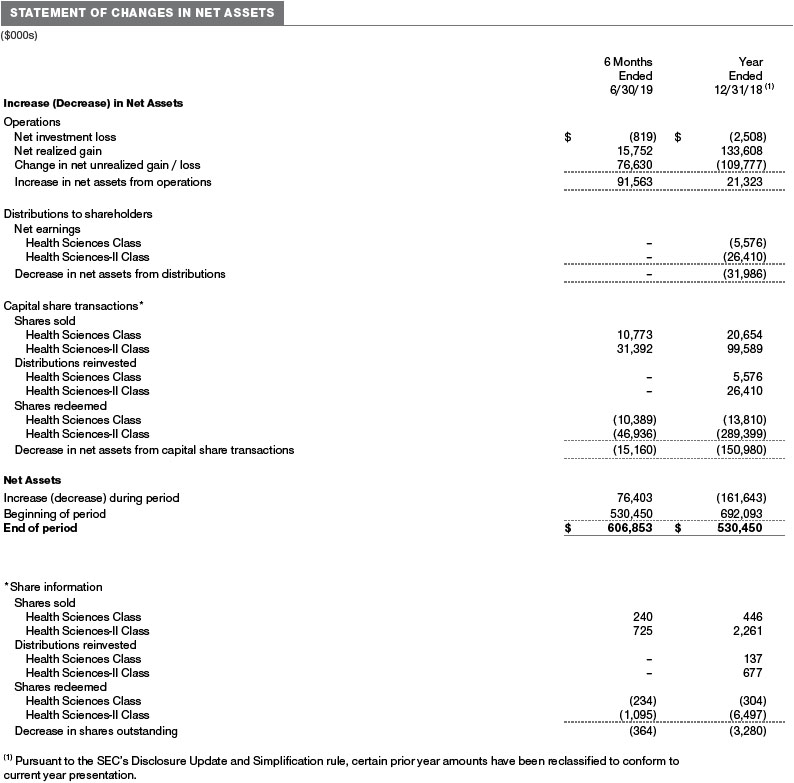
The accompanying notes are an integral part of these financial statements.
Unaudited
The accompanying notes are an integral part of these financial statements.
Unaudited
The accompanying notes are an integral part of these financial statements.
Unaudited
The accompanying notes are an integral part of these financial statements.
Unaudited
| NOTES TO FINANCIAL STATEMENTS |
T. Rowe Price Equity Series, Inc. (the corporation) is registered under the Investment Company Act of 1940 (the 1940 Act). The Health Sciences Portfolio (the fund) is a nondiversified, open-end management investment company established by the corporation. Shares of the fund are currently offered only through certain insurance companies as an investment medium for both variable annuity contracts and variable life insurance policies. The fund seeks long-term capital appreciation. The fund has two classes of shares: the Health Sciences Portfolio (Health Sciences Class) and the Health Sciences Portfolio–II (Health Sciences-II Class). Health Sciences Portfolio–II Class shares are sold through financial intermediaries, which it compensates for distribution, shareholder servicing, and/or certain administrative services under a Board-approved Rule 12b-1 plan. Each class has exclusive voting rights on matters related solely to that class; separate voting rights on matters that relate to both classes; and, in all other respects, the same rights and obligations as the other class.
NOTE 1 - SIGNIFICANT ACCOUNTING POLICIES
Basis of PreparationThe fund is an investment company and follows accounting and reporting guidance in the Financial Accounting Standards Board (FASB)Accounting Standards CodificationTopic 946 (ASC 946). The accompanying financial statements were prepared in accordance with accounting principles generally accepted in the United States of America (GAAP), including, but not limited to, ASC 946. GAAP requires the use of estimates made by management. Management believes that estimates and valuations are appropriate; however, actual results may differ from those estimates, and the valuations reflected in the accompanying financial statements may differ from the value ultimately realized upon sale or maturity. Certain prior year amounts in the accompanying financial statements and financial highlights have been restated to conform to current year presentation.
Investment Transactions, Investment Income, and DistributionsInvestment transactions are accounted for on the trade date basis. Income and expenses are recorded on the accrual basis. Realized gains and losses are reported on the identified cost basis. Income tax-related interest and penalties, if incurred, are recorded as income tax expense. Dividends received from mutual fund investments are reflected as dividend income; capital gain distributions are reflected as realized gain/loss. Dividend income and capital gain distributions are recorded on the ex-dividend date. Distributions to shareholders are recorded on the ex-dividend date. Income distributions, if any, are declared and paid by each class annually. A capital gain distribution may also be declared and paid by the fund annually.
Currency TranslationAssets, including investments, and liabilities denominated in foreign currencies are translated into U.S. dollar values each day at the prevailing exchange rate, using the mean of the bid and asked prices of such currencies against U.S. dollars as quoted by a major bank. Purchases and sales of securities, income, and expenses are translated into U.S. dollars at the prevailing exchange rate on the respective date of such transaction. The effect of changes in foreign currency exchange rates on realized and unrealized security gains and losses is not bifurcated from the portion attributable to changes in market prices.
Class AccountingInvestment income, investment management and administrative expense, and realized and unrealized gains and losses are allocated to the classes based upon the relative daily net assets of each class. Health Sciences–II Class pays Rule 12b-1 fees, in an amount not exceeding 0.25% of the class’s average daily net assets.
New Accounting GuidanceIn March 2017, the FASB issued amended guidance to shorten the amortization period for certain callable debt securities held at a premium. The guidance is effective for fiscal years and interim periods beginning after December 15, 2018. Adoption will have no effect on the fund’s net assets or results of operations.
IndemnificationIn the normal course of business, the fund may provide indemnification in connection with its officers and directors, service providers, and/or private company investments. The fund’s maximum exposure under these arrangements is unknown; however, the risk of material loss is currently considered to be remote.
NOTE 2 - VALUATION
The fund’s financial instruments are valued and each class’s net asset value (NAV) per share is computed at the close of the New York Stock Exchange (NYSE), normally 4 p.m. ET, each day the NYSE is open for business. However, the NAV per share may be calculated at a time other than the normal close of the NYSE if trading on the NYSE is restricted, if the NYSE closes earlier, or as may be permitted by the SEC.
Fair ValueThe fund’s financial instruments are reported at fair value, which GAAP defines as the price that would be received to sell an asset or paid to transfer a liability in an orderly transaction between market participants at the measurement date. The T. Rowe Price Valuation Committee (the Valuation Committee) is an internal committee that has been delegated certain responsibilities by the fund’s Board of Directors (the Board) to ensure that financial instruments are appropriately priced at fair value in accordance with GAAP and the 1940 Act. Subject to oversight by the Board, the Valuation Committee develops and oversees pricing-related policies and procedures and approves all fair value determinations. Specifically, the Valuation Committee establishes procedures to value securities; determines pricing techniques, sources, and persons eligible to effect fair value pricing actions; oversees the selection, services, and performance of pricing vendors; oversees valuation-related business continuity practices; and provides guidance on internal controls and valuation-related matters. The Valuation Committee reports to the Board and has representation from legal, portfolio management and trading, operations, risk management, and the fund’s treasurer.
Various valuation techniques and inputs are used to determine the fair value of financial instruments. GAAP establishes the following fair value hierarchy that categorizes the inputs used to measure fair value:
Level 1 – quoted prices (unadjusted) in active markets for identical financial instruments that the fund can access at the reporting date
Level 2 – inputs other than Level 1 quoted prices that are observable, either directly or indirectly (including, but not limited to, quoted prices for similar financial instruments in active markets, quoted prices for identical or similar financial instruments in inactive markets, interest rates and yield curves, implied volatilities, and credit spreads)
Level 3 – unobservable inputs
Observable inputs are developed using market data, such as publicly available information about actual events or transactions, and reflect the assumptions that market participants would use to price the financial instrument. Unobservable inputs are those for which market data are not available and are developed using the best information available about the assumptions that market participants would use to price the financial instrument. GAAP requires valuation techniques to maximize the use of relevant observable inputs and minimize the use of unobservable inputs. When multiple inputs are used to derive fair value, the financial instrument is assigned to the level within the fair value hierarchy based on the lowest-level input that is significant to the fair value of the financial instrument. Input levels are not necessarily an indication of the risk or liquidity associated with financial instruments at that level but rather the degree of judgment used in determining those values.
Valuation TechniquesEquity securities listed or regularly traded on a securities exchange or in the over-the-counter (OTC) market are valued at the last quoted sale price or, for certain markets, the official closing price at the time the valuations are made. OTC Bulletin Board securities are valued at the mean of the closing bid and asked prices. A security that is listed or traded on more than one exchange is valued at the quotation on the exchange determined to be the primary market for such security. Listed securities not traded on a particular day are valued at the mean of the closing bid and asked prices for domestic securities and the last quoted sale or closing price for international securities.
For valuation purposes, the last quoted prices of non-U.S. equity securities may be adjusted to reflect the fair value of such securities at the close of the NYSE. If the fund determines that developments between the close of a foreign market and the close of the NYSE will affect the value of some or all of its portfolio securities, the fund will adjust the previous quoted prices to reflect what it believes to be the fair value of the securities as of the close of the NYSE. In deciding whether it is necessary to adjust quoted prices to reflect fair value, the fund reviews a variety of factors, including developments in foreign markets, the performance of U.S. securities markets, and the performance of instruments trading in U.S. markets that represent foreign securities and baskets of foreign securities. The fund may also fair value securities in other situations, such as when a particular foreign market is closed but the fund is open. The fund uses outside pricing services to provide it with quoted prices and information to evaluate or adjust those prices. The fund cannot predict how often it will use quoted prices and how often it will determine it necessary to adjust those prices to reflect fair value. As a means of evaluating its security valuation process, the fund routinely compares quoted prices, the next day’s opening prices in the same markets, and adjusted prices.
Actively traded equity securities listed on a domestic exchange generally are categorized in Level 1 of the fair value hierarchy. Non-U.S. equity securities generally are categorized in Level 2 of the fair value hierarchy despite the availability of quoted prices because, as described above, the fund evaluates and determines whether those quoted prices reflect fair value at the close of the NYSE or require adjustment. OTC Bulletin Board securities, certain preferred securities, and equity securities traded in inactive markets generally are categorized in Level 2 of the fair value hierarchy.
Investments in mutual funds are valued at the mutual fund’s closing NAV per share on the day of valuation and are categorized in Level 1 of the fair value hierarchy. Assets and liabilities other than financial instruments, including short-term receivables and payables, are carried at cost, or estimated realizable value, if less, which approximates fair value.
Thinly traded financial instruments and those for which the above valuation procedures are inappropriate or are deemed not to reflect fair value are stated at fair value as determined in good faith by the Valuation Committee. The objective of any fair value pricing determination is to arrive at a price that could reasonably be expected from a current sale. Financial instruments fair valued by the Valuation Committee are primarily private placements, restricted securities, warrants, rights, and other securities that are not publicly traded.
Subject to oversight by the Board, the Valuation Committee regularly makes good faith judgments to establish and adjust the fair valuations of certain securities as events occur and circumstances warrant. For instance, in determining the fair value of an equity investment with limited market activity, such as a private placement or a thinly traded public company stock, the Valuation Committee considers a variety of factors, which may include, but are not limited to, the issuer’s business prospects, its financial standing and performance, recent investment transactions in the issuer, new rounds of financing, negotiated transactions of significant size between other investors in the company, relevant market valuations of peer companies, strategic events affecting the company, market liquidity for the issuer, and general economic conditions and events. In consultation with the investment and pricing teams, the Valuation Committee will determine an appropriate valuation technique based on available information, which may include both observable and unobservable inputs. The Valuation Committee typically will afford greatest weight to actual prices in arm’s length transactions, to the extent they represent orderly transactions between market participants, transaction information can be reliably obtained, and prices are deemed representative of fair value. However, the Valuation Committee may also consider other valuation methods such as market-based valuation multiples; a discount or premium from market value of a similar, freely traded security of the same issuer; or some combination. Fair value determinations are reviewed on a regular basis and updated as information becomes available, including actual purchase and sale transactions of the issue. Because any fair value determination involves a significant amount of judgment, there is a degree of subjectivity inherent in such pricing decisions, and fair value prices determined by the Valuation Committee could differ from those of other market participants. Depending on the relative significance of unobservable inputs, including the valuation technique(s) used, fair valued securities may be categorized in Level 2 or 3 of the fair value hierarchy.
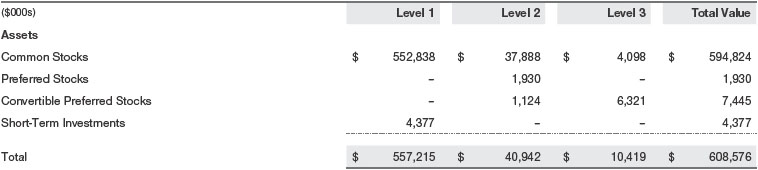
Valuation InputsThe following table summarizes the fund’s financial instruments, based on the inputs used to determine their fair values on June 30, 2019 (for further detail by category, please refer to the accompanying Portfolio of Investments):
Following is a reconciliation of the fund’s Level 3 holdings for the six months ended June 30, 2019. Gain (loss) reflects both realized and change in unrealized gain/loss on Level 3 holdings during the period, if any, and is included on the accompanying Statement of Operations. The change in unrealized gain/loss on Level 3 instruments held at June 30, 2019, totaled $1,000,000 for the six months ended June 30, 2019. During the year, transfers out of Level 3 were because observable market data became available for the security.

NOTE 3 - OTHER INVESTMENT TRANSACTIONS
Consistent with its investment objective, the fund engages in the following practices to manage exposure to certain risks and/or to enhance performance. The investment objective, policies, program, and risk factors of the fund are described more fully in the fund’s prospectus and Statement of Additional Information.
Restricted SecuritiesThe fund may invest in securities that are subject to legal or contractual restrictions on resale. Prompt sale of such securities at an acceptable price may be difficult and may involve substantial delays and additional costs.
Securities LendingThe fund may lend its securities to approved borrowers to earn additional income. Its securities lending activities are administered by a lending agent in accordance with a securities lending agreement. Security loans generally do not have stated maturity dates, and the fund may recall a security at any time. The fund receives collateral in the form of cash or U.S. government securities. Collateral is maintained over the life of the loan in an amount not less than the value of loaned securities; any additional collateral required due to changes in security values is delivered to the fund the next business day. Cash collateral is invested in accordance with investment guidelines approved by fund management. Additionally, the lending agent indemnifies the fund against losses resulting from borrower default. Although risk is mitigated by the collateral and indemnification, the fund could experience a delay in recovering its securities and a possible loss of income or value if the borrower fails to return the securities, collateral investments decline in value, and the lending agent fails to perform. Securities lending revenue consists of earnings on invested collateral and borrowing fees, net of any rebates to the borrower, compensation to the lending agent, and other administrative costs. In accordance with GAAP, investments made with cash collateral are reflected in the accompanying financial statements, but collateral received in the form of securities is not. At June 30, 2019, there were no securities on loan.
OtherPurchases and sales of portfolio securities other than short-term securities aggregated $96,752,000 and $111,231,000, respectively, for the six months ended June 30, 2019.
NOTE 4 - FEDERAL INCOME TAXES
No provision for federal income taxes is required since the fund intends to continue to qualify as a regulated investment company under Subchapter M of the Internal Revenue Code and distribute to shareholders all of its taxable income and gains. Distributions determined in accordance with federal income tax regulations may differ in amount or character from net investment income and realized gains for financial reporting purposes. Financial reporting records are adjusted for permanent book/tax differences to reflect tax character but are not adjusted for temporary differences. The amount and character of tax-basis distributions and composition of net assets are finalized at fiscal year-end; accordingly, tax-basis balances have not been determined as of the date of this report.
At June 30, 2019, the cost of investments for federal income tax purposes was $387,198,000. Net unrealized gain aggregated $221,377,000 at period-end, of which $231,512,000 related to appreciated investments and $10,135,000 related to depreciated investments.
NOTE 5 - RELATED PARTY TRANSACTIONS
The fund is managed by T. Rowe Price Associates, Inc. (Price Associates), a wholly owned subsidiary of T. Rowe Price Group, Inc. (Price Group). The investment management and administrative agreement between the fund and Price Associates provides for an all-inclusive annual fee equal to 0.95% of the fund’s average daily net assets. The fee is computed daily and paid monthly. The all-inclusive fee covers investment management, shareholder servicing, transfer agency, accounting, and custody services provided to the fund, as well as fund directors’ fees and expenses. Interest; expenses related to borrowing, taxes, and brokerage and other transaction costs; and other non-recurring expenses permitted by the investment management agreement are paid directly by the fund. Effective July 1, 2018, T. Rowe Price has contractually agreed to waive a portion of the management fee it is entitled to receive from the fund in order to limit the fund’s overall management fee rate to 0.94% of the fund’s average daily net assets, through at least April 30, 2020. This contractual arrangement will renew automatically for one-year terms thereafter and may be terminated only with approval of the fund’s Board. The fund has no obligation to repay fees reduced under this arrangement.
The fund may invest its cash reserves in certain open-end management investment companies managed by Price Associates and considered affiliates of the fund: the T. Rowe Price Government Reserve Fund or the T. Rowe Price Treasury Reserve Fund, organized as money market funds, or the T. Rowe Price Short-Term Fund, a short-term bond fund (collectively, the Price Reserve Funds). The Price Reserve Funds are offered as short-term investment options to mutual funds, trusts, and other accounts managed by Price Associates or its affiliates and are not available for direct purchase by members of the public. Cash collateral from securities lending is invested in the T. Rowe Price Short-Term Fund. The Price Reserve Funds pay no investment management fees.
The fund may participate in securities purchase and sale transactions with other funds or accounts advised by Price Associates (cross trades), in accordance with procedures adopted by the fund’s Board and Securities and Exchange Commission rules, which require, among other things, that such purchase and sale cross trades be effected at the independent current market price of the security. During the six months ended June 30, 2019, the fund had no purchases or sales cross trades with other funds or accounts advised by Price Associates.
INFORMATION ON PROXY VOTING POLICIES, PROCEDURES, AND RECORDS
A description of the policies and procedures used by T. Rowe Price funds and portfolios to determine how to vote proxies relating to portfolio securities is available in each fund’s Statement of Additional Information. You may request this document by calling 1-800-225-5132 or by accessing the SEC’s website, sec.gov.
The description of our proxy voting policies and procedures is also available on our corporate website. To access it, please visit the following Web page:
https://www3.troweprice.com/usis/corporate/en/utility/policies.html
Scroll down to the section near the bottom of the page that says, “Proxy Voting Policies.” Click on the Proxy Voting Policies link in the shaded box.
Each fund’s most recent annual proxy voting record is available on our website and through the SEC’s website. To access it through T. Rowe Price, visit the website location shown above, and scroll down to the section near the bottom of the page that says, “Proxy Voting Records.” Click on the Proxy Voting Records link in the shaded box.
HOW TO OBTAIN QUARTERLY PORTFOLIO HOLDINGS
Effective for reporting periods on or after March 1, 2019, a fund, except a money market fund, files a complete schedule of portfolio holdings with the Securities and Exchange Commission (SEC) for the first and third quarters of each fiscal year as an exhibit to its reports on Form N-PORT. Prior to March 1, 2019, a fund, including a money market fund, filed a complete schedule of portfolio holdings with the SEC for the first and third quarters of each fiscal year on Form N-Q. A money market fund files detailed month-end portfolio holdings information on Form N-MFP with the SEC each month and posts a complete schedule of portfolio holdings on its website (troweprice.com) as of each month-end for the previous six months. A fund’s Forms N-PORT, N-MFP and N-Q are available electronically on the SEC’s website (sec.gov).
APPROVAL OF INVESTMENT MANAGEMENT AGREEMENT
Each year, the fund’s Board of Directors (Board) considers the continuation of the investment management agreement (Advisory Contract) between the fund and its investment advisor, T. Rowe Price Associates, Inc. (Advisor), on behalf of the fund. In that regard, at an in-person meeting held on March 11–12, 2019 (Meeting), the Board, including a majority of the fund’s independent directors, approved the continuation of the fund’s Advisory Contract. At the Meeting, the Board considered the factors and reached the conclusions described below relating to the selection of the Advisor and the approval of the Advisory Contract. The independent directors were assisted in their evaluation of the Advisory Contract by independent legal counsel from whom they received separate legal advice and with whom they met separately.
In providing information to the Board, the Advisor was guided by a detailed set of requests for information submitted by independent legal counsel on behalf of the independent directors. In considering and approving the Advisory Contract, the Board considered the information it believed was relevant, including, but not limited to, the information discussed below. The Board considered not only the specific information presented in connection with the Meeting, but also the knowledge gained over time through interaction with the Advisor about various topics. The Board meets regularly and, at each of its meetings, covers an extensive agenda of topics and materials and considers factors that are relevant to its annual consideration of the renewal of the T. Rowe Price funds’ advisory contracts, including performance and the services and support provided to the funds and their shareholders.
Services Provided by the Advisor
The Board considered the nature, quality, and extent of the services provided to the fund by the Advisor. These services included, but were not limited to, directing the fund’s investments in accordance with its investment program and the overall management of the fund’s portfolio, as well as a variety of related activities such as financial, investment operations, and administrative services; compliance; maintaining the fund’s records and registrations; and shareholder communications. The Board also reviewed the background and experience of the Advisor’s senior management team and investment personnel involved in the management of the fund, as well as the Advisor’s compliance record. The Board concluded that it was satisfied with the nature, quality, and extent of the services provided by the Advisor.
Investment Performance of the Fund
The Board took into account discussions with the Advisor and reports that it receives throughout the year relating to fund performance. In connection with the Meeting, the Board reviewed the fund’s net annualized total returns for the 1-, 2-, 3-, 4-, 5-, and 10-year periods as of September 30, 2018, and compared these returns with the performance of a peer group of funds with similar investment programs and a wide variety of other previously agreed-upon comparable performance measures and market data, including those supplied by Broadridge, which is an independent provider of mutual fund data.
On the basis of this evaluation and the Board’s ongoing review of investment results, and factoring in the relative market conditions during certain of the performance periods, the Board concluded that the fund’s performance was satisfactory.
Costs, Benefits, Profits, and Economies of Scale
The Board reviewed detailed information regarding the revenues received by the Advisor under the Advisory Contract and other benefits that the Advisor (and its affiliates) may have realized from its relationship with the fund, including any research received under “soft dollar” agreements and commission-sharing arrangements with broker-dealers. The Board considered that the Advisor may receive some benefit from soft-dollar arrangements pursuant to which research is received from broker-dealers that execute the fund’s portfolio transactions. The Board received information on the estimated costs incurred and profits realized by the Advisor from managing the T. Rowe Price funds. The Board also reviewed estimates of the profits realized from managing the fund in particular, and the Board concluded that the Advisor’s profits were reasonable in light of the services provided to the fund.
The Board also considered whether the fund benefits under the fee levels set forth in the Advisory Contract from any economies of scale realized by the Advisor. Under the Advisory Contract, the fund pays the Advisor a single fee, or all-inclusive management fee, which is based on the fund’s average daily net assets. However, the fund has a contractual limitation in place whereby the Advisor has agreed to waive a portion of the management fee it is entitled to receive from the fund in order to limit the fund’s management fee rate to 0.94% of the fund’s average daily net assets. Any fees waived under this management fee waiver agreement are not subject to reimbursement to the Advisor by the fund. The all-inclusive management fee includes investment management services and provides for the Advisor to pay all of the fund’s ordinary, recurring operating expenses except for interest, taxes, portfolio transaction fees, and any nonrecurring extraordinary expenses that may arise. The Advisor has generally implemented an all-inclusive management fee structure in situations where a fixed total expense ratio is useful for purposes of providing certainty of fees and expenses for the investors in these funds and has historically sought to set the initial all-inclusive fee rate at levels below the expense ratios of comparable funds to take into account the potential future economies of scale. Because the fund serves as an underlying option to variable annuity products, the all-inclusive fee structure is utilized to create certainty for the annuity providers’ overall pricing decisions and disclosures. Assets of the fund are included in the calculation of the group fee rate, which serves as a component of the management fee for many T. Rowe Price funds and declines at certain asset levels based on the combined average net assets of most of the T. Rowe Price funds (including the fund). Although the fund does not have a group fee component to its management fee, its assets are included in the calculation because the primary investment resources utilized to manage the fund are shared with other actively managed funds. The Board concluded that, based on the profitability data it reviewed and consistent with this all-inclusive management fee structure, the advisory fee structure for the fund continued to be appropriate.
Fees and Expenses
The Board was provided with information regarding industry trends in management fees and expenses. Among other things, the Board reviewed data for peer groups that were compiled by Broadridge, which compared: (i) contractual management fees, total expenses, actual management fees, and nonmanagement expenses of the fund with a group of competitor funds selected by Broadridge (Expense Group) and (ii) total expenses, actual management fees, and nonmanagement expenses of the fund with a broader set of funds within the Lipper investment classification (Expense Universe). The Board considered the fund’s contractual management fee rate, actual management fee rate, and total expenses (all of which generally reflect the all-inclusive management fee rate and do not deduct the operating expenses paid by the Advisor as part of the overall management fee) in comparison with the information for the Broadridge peer groups. Broadridge generally constructed the peer groups by seeking the most comparable funds based on similar investment classifications and objectives, expense structure, asset size, and operating components and attributes and ranked funds into quintiles, with the first quintile representing the funds with the lowest relative expenses and the fifth quintile representing the funds with the highest relative expenses. The information provided to the Board indicated that the fund’s contractual management fee ranked in the fourth quintile (Expense Group), the fund’s actual management fee rate ranked in the fourth quintile (Expense Group and Expense Universe), and the fund’s total expenses ranked in the fourth quintile (Expense Group and Expense Universe).
The Board requested additional information from management with respect to the fund’s relative management fees and total expenses ranking in the fourth quintile and reviewed and considered the information provided relating to the fund, other funds in the peer groups, and other factors that the Board determined to be relevant.
The Board also reviewed the fee schedules for institutional accounts and private accounts with similar mandates that are advised or subadvised by the Advisor and its affiliates. Management provided the Board with information about the Advisor’s responsibilities and services provided to subadvisory and other institutional account clients, including information about how the requirements and economics of the institutional business are fundamentally different from those of the mutual fund business. The Board considered information showing that the Advisor’s mutual fund business is generally more complex from a business and compliance perspective than its institutional account business and considered various relevant factors, such as the broader scope of operations and oversight, more extensive shareholder communication infrastructure, greater asset flows, heightened business risks, and differences in applicable laws and regulations associated with the Advisor’s proprietary mutual fund business. In assessing the reasonableness of the fund’s management fee rate, the Board considered the differences in the nature of the services required for the Advisor to manage its mutual fund business versus managing a discrete pool of assets as a subadvisor to another institution’s mutual fund or for an institutional account and that the Advisor generally performs significant additional services and assumes greater risk in managing the fund and other T. Rowe Price funds than it does for institutional account clients.
On the basis of the information provided and the factors considered, the Board concluded that the fees paid by the fund under the Advisory Contract are reasonable.
Approval of the Advisory Contract
As noted, the Board approved the continuation of the Advisory Contract. No single factor was considered in isolation or to be determinative to the decision. Rather, the Board concluded, in light of a weighting and balancing of all factors considered, that it was in the best interests of the fund and its shareholders for the Board to approve the continuation of the Advisory Contract (including the fees to be charged for services thereunder).
Item 1. (b) Notice pursuant to Rule 30e-3.
Not applicable.
Item 2. Code of Ethics.
A code of ethics, as defined in Item 2 of Form N-CSR, applicable to its principal executive officer, principal financial officer, principal accounting officer or controller, or persons performing similar functions is filed as an exhibit to the registrant’s annual Form N-CSR. No substantive amendments were approved or waivers were granted to this code of ethics during the registrant’s most recent fiscal half-year.
Item 3. Audit Committee Financial Expert.
Disclosure required in registrant’s annual Form N-CSR.
Item 4. Principal Accountant Fees and Services.
Disclosure required in registrant’s annual Form N-CSR.
Item 5. Audit Committee of Listed Registrants.
Not applicable.
Item 6. Investments.
(a) Not applicable. The complete schedule of investments is included in Item 1 of this Form N-CSR.
(b) Not applicable.
Item 7. Disclosure of Proxy Voting Policies and Procedures for Closed-End Management Investment Companies.
Not applicable.
Item 8. Portfolio Managers of Closed-End Management Investment Companies.
Not applicable.
Item 9. Purchases of Equity Securities by Closed-End Management Investment Company and Affiliated Purchasers.
Not applicable.
Item 10. Submission of Matters to a Vote of Security Holders.
Not applicable.
Item 11. Controls and Procedures.
(a) The registrant’s principal executive officer and principal financial officer have evaluated the registrant’s disclosure controls and procedures within 90 days of this filing and have concluded that the registrant’s disclosure controls and procedures were effective, as of that date, in ensuring that information required to be disclosed by the registrant in this Form N-CSR was recorded, processed, summarized, and reported timely.
(b) The registrant’s principal executive officer and principal financial officer are aware of no change in the registrant’s internal control over financial reporting that occurred during the period covered by this report that has materially affected, or is reasonably likely to materially affect, the registrant’s internal control over financial reporting.
Item 12. Disclosure of Securities Lending Activities for Closed-End Management Investment Companies.
Not applicable.
Item 13. Exhibits.
(a)(1) The registrant’s code of ethics pursuant to Item 2 of Form N-CSR is filed with the registrant’s annual Form N-CSR.
(2) Separate certifications by the registrant's principal executive officer and principal financial officer, pursuant to Section 302 of the Sarbanes-Oxley Act of 2002 and required by Rule 30a-2(a) under the Investment Company Act of 1940, are attached.
(3) Written solicitation to repurchase securities issued by closed-end companies: not applicable.
(b) A certification by the registrant's principal executive officer and principal financial officer, pursuant to Section 906 of the Sarbanes-Oxley Act of 2002 and required by Rule 30a-2(b) under the Investment Company Act of 1940, is attached.
SIGNATURES
Pursuant to the requirements of the Securities Exchange Act of 1934 and the Investment Company Act of 1940, the registrant has duly caused this report to be signed on its behalf by the undersigned, thereunto duly authorized.
T. Rowe Price Equity Series, Inc.
| By | | /s/ David Oestreicher |
| | | David Oestreicher |
| | | Principal Executive Officer |
| |
| Date | | August 16, 2019 | | | | |
Pursuant to the requirements of the Securities Exchange Act of 1934 and the Investment Company Act of 1940, this report has been signed below by the following persons on behalf of the registrant and in the capacities and on the dates indicated.
| By | | /s/ David Oestreicher |
| | | David Oestreicher |
| | | Principal Executive Officer |
| |
| Date | | August 16, 2019 | | | | |
| |
| |
| By | | /s/ Catherine D. Mathews |
| | | Catherine D. Mathews |
| | | Principal Financial Officer |
| |
| Date | | August 16, 2019 | | | | |