UNITED STATES
SECURITIES AND EXCHANGE COMMISSION
Washington, D.C. 20549
FORM N-CSR
CERTIFIED SHAREHOLDER REPORT OF REGISTERED
MANAGEMENT INVESTMENT COMPANIES
Investment Company Act File Number: 811-07143
| T. Rowe Price Equity Series, Inc. |
|
| (Exact name of registrant as specified in charter) |
| |
| 100 East Pratt Street, Baltimore, MD 21202 |
|
| (Address of principal executive offices) |
| |
| David Oestreicher |
| 100 East Pratt Street, Baltimore, MD 21202 |
|
| (Name and address of agent for service) |
Registrant’s telephone number, including area code: (410) 345-2000
Date of fiscal year end: December 31
Date of reporting period: June 30, 2019
Item 1. Reports to Shareholders
(a) Report pursuant to Rule 30e-1.
| Mid-Cap Growth Portfolio | June 30, 2019 |
| T. ROWE PRICE MID-CAP GROWTH PORTFOLIO |
|
HIGHLIGHTS
| ■ | Mid-cap growth stocks posted a double-digit gain in the first half of 2019, outpacing their value counterparts and small-cap shares. |
| | |
| ■ | The Mid-Cap Growth Portfolio underperformed its benchmark in the period but maintained its outstanding long-term relative performance record against its peers. |
| | |
| ■ | Health care and information technology companies comprised many of the top contributors, while detractors hailed from a variety of sectors. |
| | |
| ■ | We observe eerie similarities between today’s stock market and 1999’s run-up to the height of the dot-com bubble. In response, we are leaning against current sentiment practices in the mid-cap growth sector, which has turned into an increasingly aggressive and technology-laden slice of the market. |

Log in to your account attroweprice.comfor more information.
*Certain mutual fund accounts that are assessed an annual account service fee can also save money by switching to e-delivery.
Management’s Discussion of Fund Performance
Fellow Shareholders
Following a sharp sell-off in the final quarter of 2018, U.S. stocks executed one of the market’s quickest rebounds in recent memory and recorded their best first-half performance since 1997. Driving the upswing was an unexpected policy shift by the Federal Reserve: After raising interest rates four times in 2018, the U.S. central bank began to backpedal in December on its plans for future rate hikes as the global growth outlook darkened and stock markets corrected. Unsurprisingly, investors interpreted the Fed’s dovish turn as a green light for speculation and responded by flocking to high-sales growth companies without regard for profitability or valuations. Your portfolio participated in the first-half’s momentum-driven rally but lagged its benchmark as we stuck with our fundamentals-based, valuation-sensitive approach and steered clear of many of the market’s more speculative names.

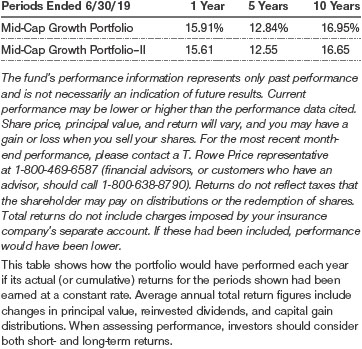
The Mid-Cap Growth Portfolio returned 24.18% in the six months ended June 30, 2019, versus 26.08% for the Russell Midcap Growth Index. The portfolio underperformed the 27.05% return of its peer group, the Lipper Variable Annuity Underlying Mid-Cap Growth Funds Average. Over longer time periods, the portfolio remained favorably ranked relative to its competitors. (Based on cumulative total return, Lipper ranked the Mid-Cap Growth Portfolio 26 of 101, 54 of 98, 13 of 96, 8 of 88, and 2 of 19 funds in the Variable Annuity Underlying Mid-Cap Growth Funds category for the 1-, 3-, 5-, and 10-year and since month-end after inception periods ended June 30, 2019, respectively. Returns for the Mid-Cap Growth Portfolio–II may vary slightly due to a different fee structure.Past performance cannot guarantee future results.)
MARKET ENVIRONMENT
The U.S. central bank’s pivot toward looser monetary policy and hopes for a trade deal with China provided powerful tailwinds for the U.S. stock market, allaying two sources of worry that derailed financial markets in late 2018. After projecting more interest rate hikes in 2019 as recently as December, the Fed signaled after its January policy meeting that it had shifted to a prolonged rate pause, and then indicated in March that it would not likely raise rates this year—sending stocks sharply higher after each pronouncement. Given the U.S. economy’s resilience, the Fed’s policy U-turn reinforced theunsettling notion that the nominally independent central bank had capitulated to market volatility or political pressure from President Trump to keep rates low.
Though some economic indicators weakened in the spring, other data showed that the U.S. economy remained on firm footing. Inflation remained below the Fed’s 2% target and wages picked up, albeit at a subdued pace. Hiring remained robust, and the U.S. jobless rate hovered close to a 50-year low. Regardless of what drove the Fed’s policy shift, investors responded to the prospect of low rates by gravitating to high-sales growth companies without regard for profitability or valuations—continuing a trend of speculative behavior that we have observed for the past several years.
Evidence of slowing global growth that emerged in late 2018 and the trade battle with China remained major sources of investor anxiety. Expectations for a U.S.-China trade accord rose as both countries appeared to inch closer to an agreement throughout the spring, fueling the stock market’s first-quarter gains. While negotiations unexpectedly broke down in May, leading the U.S. and China to increase tariffs on each other’s goods, stocks resumed their climb toward record levels in June amid renewed hopes of a détente after President Trump tweeted that he would meet with China’s president at the G-20 summit. Investor sentiment was further buoyed days later when Fed Chair Jerome Powell said that “the case for somewhat more accommodative policy has strengthened,” cementing expectations for a rate cut in the near term.
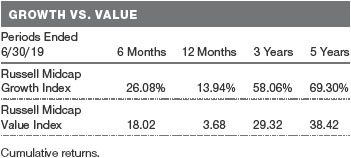
The risk-oblivious atmosphere on Wall Street was reflected in the striking outperformance of mid-cap growth stocks in the first half of the year. Year-to-date, growth stocks outpaced their value counterparts, extending a multiyear trend. Within the growth stock universe, mid-cap stocks had a particularly strong run, outpacing their small- and large-cap peers.
The consistent outperformance of mid-cap growth stocks reflects the technology-heavy composition of the sector, including several so-called unicorn startups valued at over $1 billion. The addition of these newly minted, highflying companies—many of which have yet to turn a profit—has turned our benchmark into an aggressive, technology-oriented index over a relatively brief period: Information technologyaccounted for nearly 33% of the Russell Midcap Growth Index at the end of June, more than the next two largest sectors combined and up from roughly 18% three years ago.
PORTFOLIO REVIEW
Unlike many growth investors who have gravitated to the fastest-growing companies, we remained cautious and continued to pare our positions in highflying stocks as we found their valuations increasingly difficult to justify based on their fundamentals. Our hesitation at fully embracing the market exuberance weighed on the portfolio’s relative performance as a result. Nevertheless, we believe that caution is warranted as signs of market excess have grown more pronounced this year, reinforcing our view that current conditions could lead to increasingly severe consequences the longer they persist.
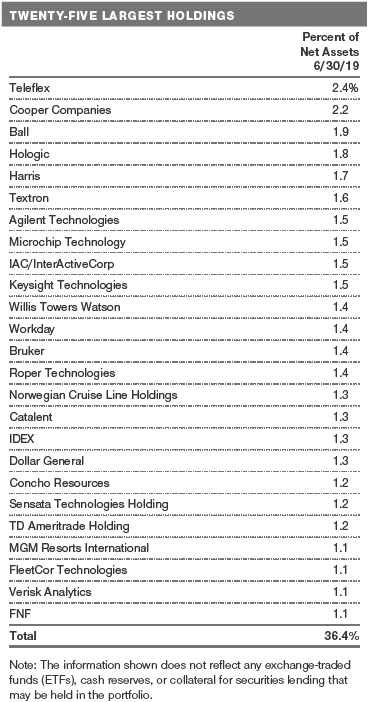
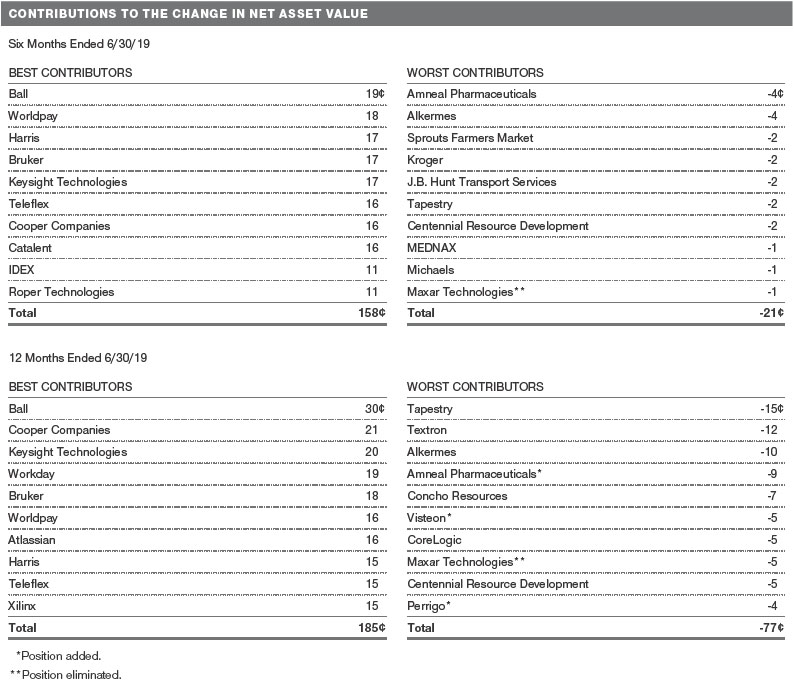
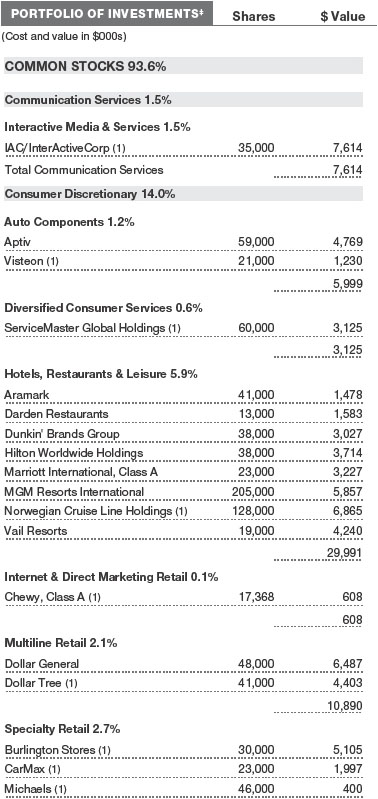
Nearly all your portfolio’s top contributors in the first half of 2019 were companies we have owned for many years, reflecting our long-term investment philosophy. Many were health care holdings.Teleflex, a medical technology company we have owned since 2013, was a top contributor as it continued to deliver solid organic growth and reaps the benefits of a years-long transition from a diversified industrial company to one focused solely on medical devices.Bruker, a holding since 2010, boosted returns after the scientific instrument maker reported strong earnings and raised its full-year forecast in May. We have long posited that Bruker—originally a family-run business that until recently wasn’t overly focused on improving profits—was underearning its long-term potential, and we are pleased that management’s efforts to increase profitability and cash flow in recent years are finally bearing fruit. Other large contributors included contact lens makerCooper Companies(held since 2011), whose shares rose following a string of solid earnings reports, and contract drug manufacturerCatalent(held since its initial public offering (IPO) in 2014). (Please refer to the portfolio of investments for a complete list of our holdings and the amount each represents in the portfolio.)
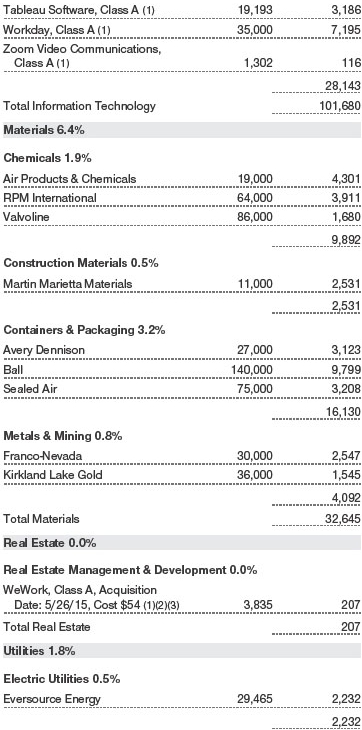
The information technology sector also added value, aided by our position inKeysight Technologies, a leading electronic test and measurement equipment manufacturer. Since splitting fromAgilent Technologiesin 2014, Keysight has stepped up its investment in research and development to capitalize on the shift to 5G networks and other industry growth drivers, a strategy that has paid off well.Worldpaywas also a strong contributor after Fidelity National Information Services agreed to buy the payment processing company at a sizable premium. We reduced our positions in Worldpay and Keysight after their strong performances, but Keysight remains a core holding. In other sectors,Ballwas the top contributor as the aluminum packaging products maker continued to benefit from several trends, including growing demand for recyclable cans over less sustainable options; higher-margin specialty cans; and new beverage categories, such as wine and coffee, that are now sold in cans.

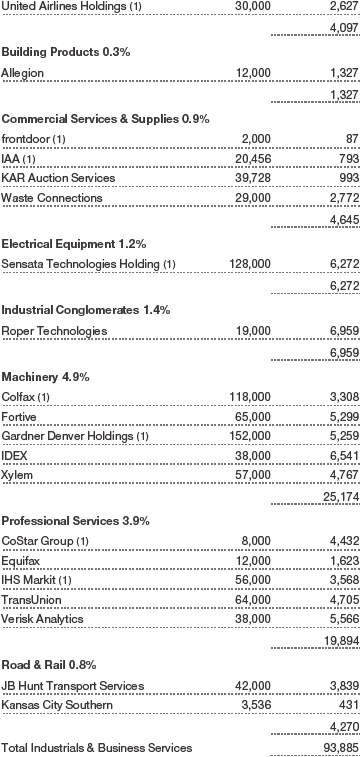
Our top detractors spanned a variety of sectors.Amneal Pharmaceuticalswas the biggest detractor as the generic drugmaker’s shares fell sharply, reflecting heightened competition and significantly diminished prospects. In the consumer staples sector, our holdings in supermarket chainsSprouts Farmers MarketandKrogerdetracted from returns as each grappled with an increasingly competitive food retail environment, weakening consumer sentiment, and, in Sprouts’ case, a high level of management turnover.J.B. Hunt Transport Servicesweighed on performance as the trucking and logistics company experienced lower volumes in its intermodal business. We believe J.B. Hunt is a superior operator in a tough and cyclical business and exemplifies the type of steady-growth, reasonably valued industrial company we have long favored in your portfolio. We took advantage of its share price weakness to add to our holding.
INVESTMENT STRATEGY AND OUTLOOK
For the past several years, we have repeatedly stated our concerns about the Fed’s role in driving stock prices to unsustainable levels by keeping interest rates abnormally low. The Fed’s four rate hikes in 2018 had offered hope that the central bank was at last reverting to a normalized monetary policy, which would help drain away the excess liquidity that has inflated asset prices in recent years. The Fed’s dovish pivot this year has prolonged the party on Wall Street and effectively granted a reprieve to the many subpar companies that have grown dependent on nearly cost-free financing over the past decade. Many fast-growing companies with flawed business models or uncertain profit-making prospects havebeen rewarded by investors, putting off the inevitable market correction that we believe is long overdue.
We are struck by how the Fed’s monetary promiscuity has recently bled into the realm of fiscal policy in the form of modern monetary theory (MMT). Once dismissed as a fringe economic concept, MMT has recently gained traction among academics and politicians who argue that deficits don’t matter for countries that can borrow in their own currency, a key MMT tenet. Though we and most other mainstream investors view MMT as a fundamentally flawed construct, the prospect of U.S. government deficits exceeding $1 trillion a year now seems perfectly acceptable among politicians of both parties. The Fed’s continued suppression of interest rates at a time of economic strength and the specter of a return to trillion-dollar deficits are troubling signs of how far monetary and fiscal policy have drifted from established norms.
The last eighteen months have been very frustrating for us as investors. Momentum, particularly price momentum, has been the dominant factor driving stocks in some new economy sectors, such as software. In other words, stocks that go up continue to go up, regardless of valuation.
Value investing is now considered obsolete by many, and some disconsolate value investors have become closet growth enthusiasts. Contrarians might suggest a regime change is near.
In many ways, 2019 feels like an echo of 1999, the crescendo of the internet bubble exactly twenty years ago. While many of today’s highflying stocks are more serious businesses compared with their 1999 predecessors, their valuations have often become detached from reality. Twenty years ago, many of the disrupters crashed in the subsequent bear market. The “pretenders” disappeared entirely. Though some of today’s dominant companies such as Amazon, eBay, and Priceline.com (renamed Booking Holdings) emerged from the ashes, it’s easy to forget that many companies lost as much as 90% of their value in the bust.
In 1999, investors bid up shares of fiber-based companies to unsustainable levels; today, we see similar (if not as extreme) behavior focused on cloud-based companies. There is a growing acceptance of alternative valuation methodologies, such as price-to-sales, a construct borrowed from the venture capital world. Since profitability is not part of this equation, it is becoming increasingly ignored by many investors. Moreover, what is considered a reasonable price-to-sales ratio has significantly increased and is often based on projections far into the future. Visionary, yes, but hazardous as many of the assumptions are aggressive and dependent on almost perfect conditions.
Many companies in the current and pending IPO class are unprofitable businesses that defy traditional valuation metrics. As of mid-2019, valuations of the unicorn highfliers are very high but are nowhere near the extremes of 1999. Among the growing list of 2019 IPOs, some will ultimately become large companies and others will disappear. But all seem very richly valued here.
The combination of subdued global growth, a submissive Fed, and risk-oblivious investors means that the market’s current exuberance may well continue in the near term. The Fed and other global central banks are now assumed to have omnipotent powers, thanks to their role in driving asset prices higher over the past decade. We are not sure what will change this paradigm. However, we know from experience that the world is cyclical and that bear markets and economic cycles have not yet been eradicated.
Relative to the very aggressive mid-cap growth sector, we are leaning against current sentiment and investing practice. Time will tell whether our investing experience, which spans 38 years, is merely intellectual baggage or will end up rewarding our shareholders with solid returns over the long term.
Respectfully submitted,

Brian W.H. Berghuis
Chairman of the portfolio’s Investment Advisory Committee

John F. Wakeman
Executive vice president of the portfolio
July 26, 2019
The committee chairman has day-to-day responsibility for managing the portfolio and works with committee members in developing and executing the fund’s investment program.
The views expressed reflect the opinions of T. Rowe Price as of the date of this report and are subject to change based on changes in market, economic, or other conditions. These views are not intended to be a forecast of future events and are no guarantee of future results.
RISKS OF STOCK INVESTING
As with all stock and bond mutual funds, the fund’s share price can fall because of weakness in the stock or bond markets, a particular industry, or specific holdings. The financial markets can decline for many reasons, including adverse political or economic developments, changes in investor psychology, or heavy institutional selling. The prospects for an industry or company may deteriorate because of a variety of factors, including disappointing earnings or changes in the competitive environment. In addition, the investment manager’s assessment of companies held in a fund may prove incorrect, resulting in losses or poor performance even in rising markets. The stocks of mid-cap companies entail greater risk and are usually more volatile than the shares of larger companies. In addition, growth stocks can be volatile for several reasons. Since they usually reinvest a high proportion of earnings in their own businesses, they may lack the dividends usually associated with value stocks that can cushion their decline in a falling market. Also, since investors buy these stocks because of their expected superior earnings growth, earnings disappointments often result in sharp price declines.
GLOSSARY
Lipper indexes:Fund benchmarks that consist of a small number of the largest mutual funds in a particular category as defined by Lipper Inc.
Russell Midcap Growth Index:An unmanaged index that measures the performance of those Russell Midcap companies with higher price-to-book ratios and higher forecast growth values.
Russell Midcap Value Index:An unmanaged index that measures the performance of those Russell Midcap companies with lower price-to-book ratios and lower forecast growth values.
S&P 500 Index:An unmanaged index that tracks the stocks of 500 primarily large-cap U.S. companies.
Note: Frank Russell Company (Russell) is the source and owner of the Russell index data contained or reflected in these materials and all trademarks and copyrights related thereto. Russell® is a registered trademark of Russell. Russell is not responsible for the formatting or configuration of these materials or for any inaccuracy in T. Rowe Price Associates’ presentation thereof.
GROWTH OF $10,000
This chart shows the value of a hypothetical $10,000 investment in the portfolio over the past 10 fiscal year periods or since inception (for portfolios lacking 10-year records). The result is compared with benchmarks, which include a broad-based market index and may also include a peer group average or index. Market indexes do not include expenses, which are deducted from portfolio returns as well as mutual fund averages and indexes.

AVERAGE ANNUAL COMPOUND TOTAL RETURN
FUND EXPENSE EXAMPLE
As a mutual fund shareholder, you may incur two types of costs: (1) transaction costs, such as redemption fees or sales loads, and (2) ongoing costs, including management fees, distribution and service (12b-1) fees, and other fund expenses. The following example is intended to help you understand your ongoing costs (in dollars) of investing in the fund and to compare these costs with the ongoing costs of investing in other mutual funds. The example is based on an investment of $1,000 invested at the beginning of the most recent six-month period and held for the entire period.
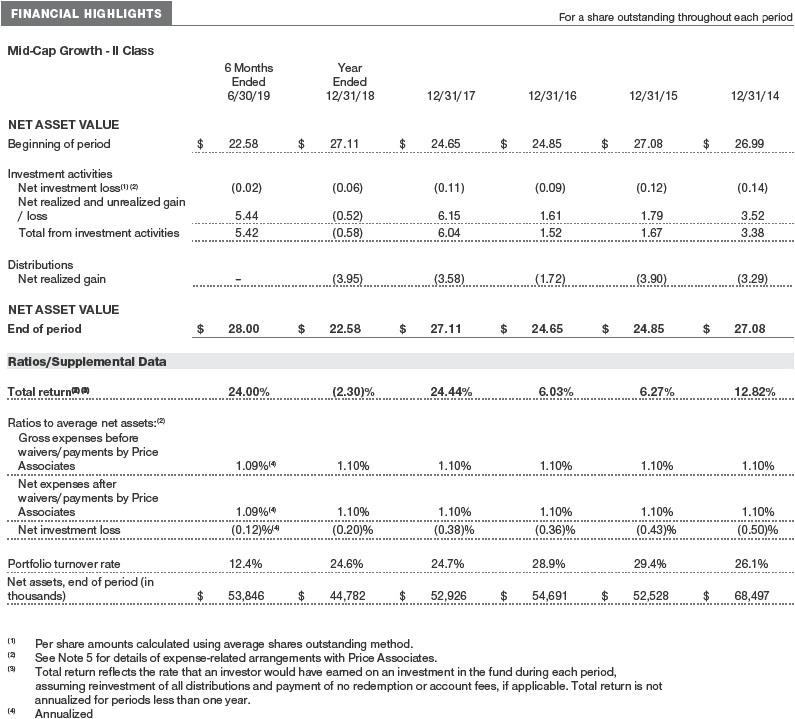
Shares of the fund are currently offered only through certain insurance companies as an investment medium for both variable annuity contracts and variable life insurance policies. Please note that the fund has two classes of shares: the original share class and II Class. II Class shares are sold through financial intermediaries, which are compensated for distribution, shareholder servicing, and/or certain administrative services under a Board-approved Rule 12b-1 plan.
Actual Expenses
The first line of the following table (Actual) provides information about actual account values and actual expenses. You may use the information on this line, together with your account balance, to estimate the expenses that you paid over the period. Simply divide your account value by $1,000 (for example, an $8,600 account value divided by $1,000 = 8.6), then multiply the result by the number on the first line under the heading “Expenses Paid During Period” to estimate the expenses you paid on your account during this period.
Hypothetical Example for Comparison Purposes
The information on the second line of the table (Hypothetical) is based on hypothetical account values and expenses derived from the fund’s actual expense ratio and an assumed 5% per year rate of return before expenses (not the fund’s actual return). You may compare the ongoing costs of investing in the fund with other funds by contrasting this 5% hypothetical example and the 5% hypothetical examples that appear in the shareholder reports of the other funds. The hypothetical account values and expenses may not be used to estimate the actual ending account balance or expenses you paid for the period.
You should also be aware that the expenses shown in the table highlight only your ongoing costs and do not reflect any transaction costs, such as redemption fees or sales loads. Therefore, the second line of the table is useful in comparing ongoing costs only and will not help you determine the relative total costs of owning different funds. To the extent a fund charges transaction costs, however, the total cost of owning that fund is higher.

Unaudited

The accompanying notes are an integral part of these financial statements.
Unaudited
The accompanying notes are an integral part of these financial statements.
Unaudited


The accompanying notes are an integral part of these financial statements.
Unaudited

The accompanying notes are an integral part of these financial statements.
Unaudited
The accompanying notes are an integral part of these financial statements.
Unaudited

The accompanying notes are an integral part of these financial statements.
Unaudited
| NOTES TO FINANCIAL STATEMENTS |
T. Rowe Price Equity Series, Inc. (the corporation) is registered under the Investment Company Act of 1940 (the 1940 Act). The Mid-Cap Growth Portfolio (the fund) is a diversified, open-end management investment company established by the corporation. Shares of the fund are currently offered only through certain insurance companies as an investment medium for both variable annuity contracts and variable life insurance policies. The fund seeks to provide long-term capital appreciation by investing in mid-cap stocks with potential for above-average earnings growth. The fund has two classes of shares: the Mid-Cap Growth Portfolio (Mid-Cap Growth Class) and the Mid-Cap Growth Portfolio–II (Mid-Cap Growth–II Class). Mid-Cap Growth–II Class shares are sold through financial intermediaries, which it compensates for distribution, shareholder servicing, and/or certain administrative services under a Board-approved Rule 12b-1 plan. Each class has exclusive voting rights on matters related solely to that class; separate voting rights on matters that relate to both classes; and, in all other respects, the same rights and obligations as the other class.
NOTE 1 - SIGNIFICANT ACCOUNTING POLICIES
Basis of PreparationThe fund is an investment company and follows accounting and reporting guidance in the Financial Accounting Standards Board (FASB)Accounting Standards CodificationTopic 946 (ASC 946). The accompanying financial statements were prepared in accordance with accounting principles generally accepted in the United States of America (GAAP), including, but not limited to, ASC 946. GAAP requires the use of estimates made by management. Management believes that estimates and valuations are appropriate; however, actual results may differ from those estimates, and the valuations reflected in the accompanying financial statements may differ from the value ultimately realized upon sale or maturity. Certain prior year amounts in the accompanying financial statements and financial highlights have been restated to conform to current year presentation.
Investment Transactions, Investment Income, and DistributionsInvestment transactions are accounted for on the trade date basis. Income and expenses are recorded on the accrual basis. Realized gains and losses are reported on the identified cost basis. Income tax-related interest and penalties, if incurred, are recorded as income tax expense. Dividends received from mutual fund investments are reflected as dividend income; capital gain distributions are reflected as realized gain/loss. Dividend income and capital gain distributions are recorded on the ex-dividend date. Distributions to shareholders are recorded on the ex-dividend date. Income distributions, if any, are declared and paid by each class annually. A capital gain distribution may also be declared and paid by the fund annually.
Currency TranslationAssets, including investments, and liabilities denominated in foreign currencies are translated into U.S. dollar values each day at the prevailing exchange rate, using the mean of the bid and asked prices of such currencies against U.S. dollars as quoted by a major bank. Purchases and sales of securities, income, and expenses are translated into U.S. dollars at the prevailing exchange rate on the respective date of such transaction. The effect of changes in foreign currency exchange rates on realized and unrealized security gains and losses is not bifurcated from the portion attributable to changes in market prices.
Class AccountingInvestment income, investment management and administrative expense, and realized and unrealized gains and losses are allocated to the classes based upon the relative daily net assets of each class. Mid-Cap Growth–II Class pays Rule 12b-1 fees, in an amount not exceeding 0.25% of the class’s average daily net assets.
New Accounting GuidanceIn March 2017, the FASB issued amended guidance to shorten the amortization period for certain callable debt securities held at a premium. The guidance is effective for fiscal years and interim periods beginning after December 15, 2018. Adoption will have no effect on the fund’s net assets or results of operations.
IndemnificationIn the normal course of business, the fund may provide indemnification in connection with its officers and directors, service providers, and/or private company investments. The fund’s maximum exposure under these arrangements is unknown; however, the risk of material loss is currently considered to be remote.
NOTE 2 - VALUATION
The fund’s financial instruments are valued and each class’s net asset value (NAV) per share is computed at the close of the New York Stock Exchange (NYSE), normally 4 p.m. ET, each day the NYSE is open for business. However, the NAV per share may be calculated at a time other than the normal close of the NYSE if trading on the NYSE is restricted, if the NYSE closes earlier, or as may be permitted by the SEC.
Fair ValueThe fund’s financial instruments are reported at fair value, which GAAP defines as the price that would be received to sell an asset or paid to transfer a liability in an orderly transaction between market participants at the measurement date. The T. Rowe Price Valuation Committee (the Valuation Committee) is an internal committee that has been delegated certain responsibilities by the fund’s Board of Directors (the Board) to ensure that financial instruments are appropriately priced at fair value in accordance with GAAP and the 1940 Act. Subject to oversight by the Board, the Valuation Committee develops and oversees pricing-related policies and procedures and approves all fair value determinations. Specifically, the Valuation Committee establishes procedures to value securities; determines pricing techniques, sources, and persons eligible to effect fair value pricing actions; oversees the selection, services, and performance of pricing vendors; oversees valuation-related business continuity practices; and provides guidance on internal controls and valuation-related matters. The Valuation Committee reports to the Board and has representation from legal, portfolio management and trading, operations, risk management, and the fund’s treasurer.
Various valuation techniques and inputs are used to determine the fair value of financial instruments. GAAP establishes the following fair value hierarchy that categorizes the inputs used to measure fair value:
Level 1 – quoted prices (unadjusted) in active markets for identical financial instruments that the fund can access at the reporting date
Level 2 – inputs other than Level 1 quoted prices that are observable, either directly or indirectly (including, but not limited to, quoted prices for similar financial instruments in active markets, quoted prices for identical or similar financial instruments in inactive markets, interest rates and yield curves, implied volatilities, and credit spreads)
Level 3 – unobservable inputs
Observable inputs are developed using market data, such as publicly available information about actual events or transactions, and reflect the assumptions that market participants would use to price the financial instrument. Unobservable inputs are those for which market data are not available and are developed using the best information available about the assumptions that market participants would use to price the financial instrument. GAAP requires valuation techniques to maximize the use of relevant observable inputs and minimize the use of unobservable inputs. When multiple inputs are used to derive fair value, the financial instrument is assigned to the level within the fair value hierarchy based on the lowest-level input that is significant to the fair value of the financial instrument. Input levels are not necessarily an indication of the risk or liquidity associated with financial instruments at that level but rather the degree of judgment used in determining those values.
Valuation TechniquesEquity securities listed or regularly traded on a securities exchange or in the over-the-counter (OTC) market are valued at the last quoted sale price or, for certain markets, the official closing price at the time the valuations are made. OTC Bulletin Board securities are valued at the mean of the closing bid and asked prices. A security that is listed or traded on more than one exchange is valued at the quotation on the exchange determined to be the primary market for such security. Listed securities not traded on a particular day are valued at the mean of the closing bid and asked prices. Actively traded equity securities listed on a domestic exchange generally are categorized in Level 1 of the fair value hierarchy. OTC Bulletin Board securities, certain preferred securities, and equity securities traded in inactive markets generally are categorized in Level 2 of the fair value hierarchy.
Investments in mutual funds are valued at the mutual fund’s closing NAV per share on the day of valuation and are categorized in Level 1 of the fair value hierarchy. Assets and liabilities other than financial instruments, including short-term receivables and payables, are carried at cost, or estimated realizable value, if less, which approximates fair value.
Thinly traded financial instruments and those for which the above valuation procedures are inappropriate or are deemed not to reflect fair value are stated at fair value as determined in good faith by the Valuation Committee. The objective of any fair value pricing determination is to arrive at a price that could reasonably be expected from a current sale. Financial instruments fair valued by the Valuation Committee are primarily private placements, restricted securities, warrants, rights, and other securities that are not publicly traded.
Subject to oversight by the Board, the Valuation Committee regularly makes good faith judgments to establish and adjust the fair valuations of certain securities as events occur and circumstances warrant. For instance, in determining the fair value of an equity investment with limited market activity, such as a private placement or a thinly traded public company stock, the Valuation Committee considers a variety of factors, which may include, but are not limited to, the issuer’s business prospects, its financial standing and performance, recent investment transactions in the issuer, new rounds of financing, negotiated transactions of significant size between other investors in the company, relevant market valuations of peer companies, strategic events affecting the company, market liquidity for the issuer, and general economic conditions and events. In consultation with the investment and pricing teams, the Valuation Committee will determine an appropriate valuation technique based on available information, which may include both observable and unobservable inputs. The Valuation Committee typically will afford greatest weight to actual prices in arm’s length transactions, to the extent they represent orderly transactions between market participants, transaction information can be reliably obtained, and prices are deemed representative of fair value. However, the Valuation Committee may also consider other valuation methods such as market-based valuation multiples; a discount or premium from market value of a similar, freely traded security of the same issuer; or some combination. Fair value determinations are reviewed on a regular basis and updated as information becomes available, including actual purchase and sale transactions of the issue. Because any fair value determination involves a significant amount of judgment, there is a degree of subjectivity inherent in such pricing decisions, and fair value prices determined by the Valuation Committee could differ from those of other market participants. Depending on the relative significance of unobservable inputs, including the valuation technique(s) used, fair valued securities may be categorized in Level 2 or 3 of the fair value hierarchy.
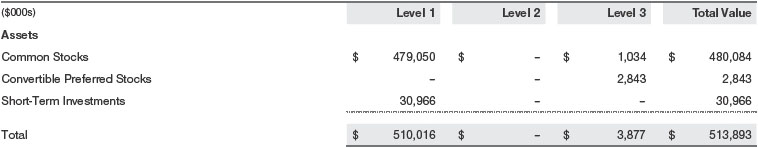
Valuation InputsThe following table summarizes the fund’s financial instruments, based on the inputs used to determine their fair values on June 30, 2019 (for further detail by category, please refer to the accompanying Portfolio of Investments):
Following is a reconciliation of the fund’s Level 3 holdings for the six months ended June 30, 2019. Gain (loss) reflects both realized and change in unrealized gain/loss on Level 3 holdings during the period, if any, and is included on the accompanying Statement of Operations. The change in unrealized gain/loss on Level 3 instruments held at June 30, 2019, totaled $(300,000) for the six months ended June 30, 2019. During the six months, transfers out of Level 3 were because observable market data became available for the security. Additionally, during the period, transfers out of Level 3 include the impact of securities acquired through a corporate action.
NOTE 3 - OTHER INVESTMENT TRANSACTIONS
Consistent with its investment objective, the fund engages in the following practices to manage exposure to certain risks and/or to enhance performance. The investment objective, policies, program, and risk factors of the fund are described more fully in the fund’s prospectus and Statement of Additional Information.
Restricted SecuritiesThe fund may invest in securities that are subject to legal or contractual restrictions on resale. Prompt sale of such securities at an acceptable price may be difficult and may involve substantial delays and additional costs.
Securities LendingThe fund may lend its securities to approved borrowers to earn additional income. Its securities lending activities are administered by a lending agent in accordance with a securities lending agreement. Security loans generally do not have stated maturity dates, and the fund may recall a security at any time. The fund receives collateral in the form of cash or U.S. government securities. Collateral is maintained over the life of the loan in an amount not less than the value of loaned securities; any additional collateral required due to changes in security values is delivered to the fund the next business day. Cash collateral is invested in accordance with investment guidelines approved by fund management. Additionally, the lending agent indemnifies the fund against losses resulting from borrower default. Although risk is mitigated by the collateral and indemnification, the fund could experience a delay in recovering its securities and a possible loss of income or value if the borrower fails to return the securities, collateral investments decline in value, and the lending agent fails to perform. Securities lending revenue consists of earnings on invested collateral and borrowing fees, net of any rebates to the borrower, compensation to the lending agent, and other administrative costs. In accordance with GAAP, investments made with cash collateral are reflected in the accompanying financial statements, but collateral received in the form of securities is not. At June 30, 2019, there were no securities on loan.
OtherPurchases and sales of portfolio securities other than short-term securities aggregated $56,025,000 and $74,882,000, respectively, for the six months ended June 30, 2019.
NOTE 4 - FEDERAL INCOME TAXES
No provision for federal income taxes is required since the fund intends to continue to qualify as a regulated investment company under Subchapter M of the Internal Revenue Code and distribute to shareholders all of its taxable income and gains. Distributions determined in accordance with federal income tax regulations may differ in amount or character from net investment income and realized gains for financial reporting purposes. Financial reporting records are adjusted for permanent book/tax differences to reflect tax character but are not adjusted for temporary differences. The amount and character of tax-basis distributions and composition of net assets are finalized at fiscal year-end; accordingly, tax-basis balances have not been determined as of the date of this report.
At June 30, 2019, the cost of investments for federal income tax purposes was $323,571,000. Net unrealized gain aggregated $190,322,000 at period-end, of which $201,858,000 related to appreciated investments and $11,536,000 related to depreciated investments.
NOTE 5 - RELATED PARTY TRANSACTIONS
The fund is managed by T. Rowe Price Associates, Inc. (Price Associates), a wholly owned subsidiary of T. Rowe Price Group, Inc. (Price Group). The investment management and administrative agreement between the fund and Price Associates provides for an all-inclusive annual fee equal to 0.85% of the fund’s average daily net assets. The fee is computed daily and paid monthly. The all-inclusive fee covers investment management, shareholder servicing, transfer agency, accounting, and custody services provided to the fund, as well as fund directors’ fees and expenses. Interest; expenses related to borrowing, taxes, and brokerage and other transaction costs; and other non-recurring expenses permitted by the investment management agreement are paid directly by the fund. Effective July 1, 2018, T. Rowe Price has contractually agreed to waive a portion of the management fee it is entitled to receive from the fund in order to limit the fund’s overall management fee rate to 0.84% of the fund’s average daily net assets, through at least April 30, 2020. This contractual arrangement will renew automatically for one-year terms thereafter and may be terminated only with approval of the fund’s Board. The fund has no obligation to repay fees reduced under this arrangement.
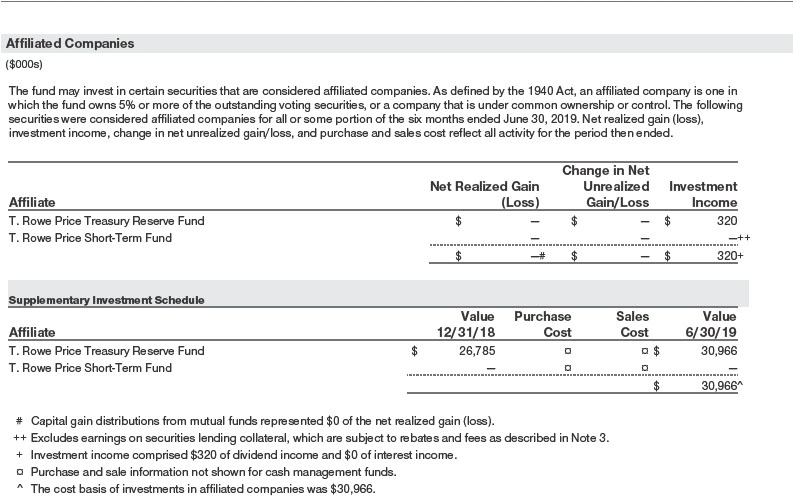
The fund may invest its cash reserves in certain open-end management investment companies managed by Price Associates and considered affiliates of the fund: the T. Rowe Price Government Reserve Fund or the T. Rowe Price Treasury Reserve Fund, organized as money market funds, or the T. Rowe Price Short-Term Fund, a short-term bond fund (collectively, the Price Reserve Funds). The Price Reserve Funds are offered as short-term investment options to mutual funds, trusts, and other accounts managed by Price Associates or its affiliates and are not available for direct purchase by members of the public. Cash collateral from securities lending is invested in the T. Rowe Price Short-Term Fund. The Price Reserve Funds pay no investment management fees.
The fund may participate in securities purchase and sale transactions with other funds or accounts advised by Price Associates (cross trades), in accordance with procedures adopted by the fund’s Board and Securities and Exchange Commission rules, which require, among other things, that such purchase and sale cross trades be effected at the independent current market price of the security. During the six months ended June 30, 2019, the fund had no purchases or sales cross trades with other funds or accounts advised by Price Associates.
INFORMATION ON PROXY VOTING POLICIES, PROCEDURES, AND RECORDS
A description of the policies and procedures used by T. Rowe Price funds and portfolios to determine how to vote proxies relating to portfolio securities is available in each fund’s Statement of Additional Information. You may request this document by calling 1-800-225-5132 or by accessing the SEC’s website, sec.gov.
The description of our proxy voting policies and procedures is also available on our corporate website. To access it, please visit the following Web page:
https://www3.troweprice.com/usis/corporate/en/utility/policies.html
Scroll down to the section near the bottom of the page that says, “Proxy Voting Policies.” Click on the Proxy Voting Policies link in the shaded box.
Each fund’s most recent annual proxy voting record is available on our website and through the SEC’s website. To access it through T. Rowe Price, visit the website location shown above, and scroll down to the section near the bottom of the page that says, “Proxy Voting Records.” Click on the Proxy Voting Records link in the shaded box.
HOW TO OBTAIN QUARTERLY PORTFOLIO HOLDINGS
Effective for reporting periods on or after March 1, 2019, a fund, except a money market fund, files a complete schedule of portfolio holdings with the Securities and Exchange Commission (SEC) for the first and third quarters of each fiscal year as an exhibit to its reports on Form N-PORT. Prior to March 1, 2019, a fund, including a money market fund, filed a complete schedule of portfolio holdings with the SEC for the first and third quarters of each fiscal year on Form N-Q. A money market fund files detailed month-end portfolio holdings information on Form N-MFP with the SEC each month and posts a complete schedule of portfolio holdings on its website (troweprice.com) as of each month-end for the previous six months. A fund’s Forms N-PORT, N-MFP and N-Q are available electronically on the SEC’s website (sec.gov).
APPROVAL OF INVESTMENT MANAGEMENT AGREEMENT
Each year, the fund’s Board of Directors (Board) considers the continuation of the investment management agreement (Advisory Contract) between the fund and its investment advisor, T. Rowe Price Associates, Inc. (Advisor), on behalf of the fund. In that regard, at an in-person meeting held on March 11–12, 2019 (Meeting), the Board, including a majority of the fund’s independent directors, approved the continuation of the fund’s Advisory Contract. At the Meeting, the Board considered the factors and reached the conclusions described below relating to the selection of the Advisor and the approval of the Advisory Contract. The independent directors were assisted in their evaluation of the Advisory Contract by independent legal counsel from whom they received separate legal advice and with whom they met separately.
In providing information to the Board, the Advisor was guided by a detailed set of requests for information submitted by independent legal counsel on behalf of the independent directors. In considering and approving the Advisory Contract, the Board considered the information it believed was relevant, including, but not limited to, the information discussed below. The Board considered not only the specific information presented in connection with the Meeting but also the knowledge gained over time through interaction with the Advisor about various topics. The Board meets regularly and, at each of its meetings, covers an extensive agenda of topics and materials and considers factors that are relevant to its annual consideration of the renewal of the T. Rowe Price funds’ advisory contracts, including performance and the services and support provided to the funds and their shareholders.
Services Provided by the Advisor
The Board considered the nature, quality, and extent of the services provided to the fund by the Advisor. These services included, but were not limited to, directing the fund’s investments in accordance with its investment program and the overall management of the fund’s portfolio, as well as a variety of related activities such as financial, investment operations, and administrative services; compliance; maintaining the fund’s records and registrations; and shareholder communications. The Board also reviewed the background and experience of the Advisor’s senior management team and investment personnel involved in the management of the fund, as well as the Advisor’s compliance record. The Board concluded that it was satisfied with the nature, quality, and extent of the services provided by the Advisor.
Investment Performance of the Fund
The Board took into account discussions with the Advisor and reports that it receives throughout the year relating to fund performance. In connection with the Meeting, the Board reviewed the fund’s net annualized total returns for the 1-, 2-, 3-, 4-, 5-, and 10-year periods as of September 30, 2018, and compared these returns with the performance of a peer group of funds with similar investment programs and a wide variety of other previously agreed-upon comparable performance measures and market data, including those supplied by Broadridge, which is an independent provider of mutual fund data.
On the basis of this evaluation and the Board’s ongoing review of investment results, and factoring in the relative market conditions during certain of the performance periods, the Board concluded that the fund’s performance was satisfactory.
Costs, Benefits, Profits, and Economies of Scale
The Board reviewed detailed information regarding the revenues received by the Advisor under the Advisory Contract and other benefits that the Advisor (and its affiliates) may have realized from its relationship with the fund, including any research received under “soft dollar” agreements and commission-sharing arrangements with broker-dealers. The Board considered that the Advisor may receive some benefit from soft-dollar arrangements pursuant to which research is received from broker-dealers that execute the fund’s portfolio transactions. The Board received information on the estimated costs incurred and profits realized by the Advisor from managing the T. Rowe Price funds. The Board also reviewed estimates of the profits realized from managing the fund in particular, and the Board concluded that the Advisor’s profits were reasonable in light of the services provided to the fund.
The Board also considered whether the fund benefits under the fee levels set forth in the Advisory Contract from any economies of scale realized by the Advisor. Under the Advisory Contract, the fund pays the Advisor a single fee, or all-inclusive management fee, which is based on the fund’s average daily net assets. However, the fund has a contractual limitation in place whereby the Advisor has agreed to waive a portion of the management fee it is entitled to receive from the fund in order to limit the fund’s management fee rate to 0.84% of the fund’s average daily net assets. Any fees waived under this management fee waiver agreement are not subject to reimbursement to the Advisor by the fund. The all-inclusive management fee includes investment management services and provides for the Advisor to pay all of the fund’s ordinary, recurring operating expenses except for interest, taxes, portfolio transaction fees, and any nonrecurring extraordinary expenses that may arise. The Advisor has generally implemented an all-inclusive management fee structure in situations where a fixed total expense ratio is useful for purposes of providing certainty of fees and expenses for the investors in these funds, and has historically sought to set the initial all-inclusive fee rate at levels below the expense ratios of comparable funds to take into account the potential future economies of scale. Because the fund serves as an underlying option to variable annuity products, the all-inclusive fee structure is utilized to create certainty for the annuity providers’ overall pricing decisions and disclosures. Assets of the fund are included in the calculation of the group fee rate, which serves as a component of the management fee for many T. Rowe Price funds and declines at certain asset levels based on the combined average net assets of most of the T. Rowe Price funds (including the fund). Although the fund does not have a group fee component to its management fee, its assets are included in the calculation because the primary investment resources utilized to manage the fund are shared with other actively managed funds. The Board concluded that, based on the profitability data it reviewed and consistent with this all-inclusive management fee structure, the advisory fee structure for the fund continued to be appropriate.
Fees and Expenses
The Board was provided with information regarding industry trends in management fees and expenses. Among other things, the Board reviewed data for peer groups that were compiled by Broadridge, which compared: (i) contractual management fees, total expenses, actual management fees, and nonmanagement expenses of the fund with a group of competitor funds selected by Broadridge (Expense Group) and (ii) total expenses, actual management fees, and nonmanagement expenses of the fund with a broader set of funds within the Lipper investment classification (Expense Universe). The Board considered the fund’s contractual management fee rate, actual management fee rate, and total expenses (all of which generally reflect the all-inclusive management fee rate and do not deduct the operating expenses paid by the Advisor as part of the overall management fee) in comparison with the information for the Broadridge peer groups. Broadridge generally constructed the peer groups by seeking the most comparable funds based on similar investment classifications and objectives, expense structure, asset size, and operating components and attributes and ranked funds into quintiles, with the first quintile representing the funds with the lowest relative expenses and the fifth quintile representing the funds with the highest relative expenses. The information provided to the Board indicated that the fund’s contractual management fee ranked in the fourth quintile (Expense Group), the fund’s actual management fee rate ranked in the fourth quintile (Expense Group) and fifth quintile (Expense Universe), and the fund’s total expenses ranked in the fourth quintile (Expense Group and Expense Universe).
The Board requested additional information from management with respect to the fund’s relative management fees and total expenses ranking in the fourth and fifth quintiles, and reviewed and considered the information provided relating to the fund, other funds in the peer groups, and other factors that the Board determined to be relevant.
The Board also reviewed the fee schedules for institutional accounts and private accounts with similar mandates that are advised or subadvised by the Advisor and its affiliates. Management provided the Board with information about the Advisor’s responsibilities and services provided to subadvisory and other institutional account clients, including information about how the requirements and economics of the institutional business are fundamentally different from those of the mutual fund business. The Board considered information showing that the Advisor’s mutual fund business is generally more complex from a business and compliance perspective than its institutional account business and considered various relevant factors, such as the broader scope of operations and oversight, more extensive shareholder communication infrastructure, greater asset flows, heightened business risks, and differences in applicable laws and regulations associated with the Advisor’s proprietary mutual fund business. In assessing the reasonableness of the fund’s management fee rate, the Board considered the differences in the nature of the services required for the Advisor to manage its mutual fund business versus managing a discrete pool of assets as a subadvisor to another institution’s mutual fund or for an institutional account and that the Advisor generally performs significant additional services and assumes greater risk in managing the fund and other T. Rowe Price funds than it does for institutional account clients.
On the basis of the information provided and the factors considered, the Board concluded that the fees paid by the fund under the Advisory Contract are reasonable.
Approval of the Advisory Contract
As noted, the Board approved the continuation of the Advisory Contract. No single factor was considered in isolation or to be determinative to the decision. Rather, the Board concluded, in light of a weighting and balancing of all factors considered, that it was in the best interests of the fund and its shareholders for the Board to approve the continuation of the Advisory Contract (including the fees to be charged for services thereunder).
Item 1. (b) Notice pursuant to Rule 30e-3.
Not applicable.
Item 2. Code of Ethics.
A code of ethics, as defined in Item 2 of Form N-CSR, applicable to its principal executive officer, principal financial officer, principal accounting officer or controller, or persons performing similar functions is filed as an exhibit to the registrant’s annual Form N-CSR. No substantive amendments were approved or waivers were granted to this code of ethics during the registrant’s most recent fiscal half-year.
Item 3. Audit Committee Financial Expert.
Disclosure required in registrant’s annual Form N-CSR.
Item 4. Principal Accountant Fees and Services.
Disclosure required in registrant’s annual Form N-CSR.
Item 5. Audit Committee of Listed Registrants.
Not applicable.
Item 6. Investments.
(a) Not applicable. The complete schedule of investments is included in Item 1 of this Form N-CSR.
(b) Not applicable.
Item 7. Disclosure of Proxy Voting Policies and Procedures for Closed-End Management Investment Companies.
Not applicable.
Item 8. Portfolio Managers of Closed-End Management Investment Companies.
Not applicable.
Item 9. Purchases of Equity Securities by Closed-End Management Investment Company and Affiliated Purchasers.
Not applicable.
Item 10. Submission of Matters to a Vote of Security Holders.
Not applicable.
Item 11. Controls and Procedures.
(a) The registrant’s principal executive officer and principal financial officer have evaluated the registrant’s disclosure controls and procedures within 90 days of this filing and have concluded that the registrant’s disclosure controls and procedures were effective, as of that date, in ensuring that information required to be disclosed by the registrant in this Form N-CSR was recorded, processed, summarized, and reported timely.
(b) The registrant’s principal executive officer and principal financial officer are aware of no change in the registrant’s internal control over financial reporting that occurred during the period covered by this report that has materially affected, or is reasonably likely to materially affect, the registrant’s internal control over financial reporting.
Item 12. Disclosure of Securities Lending Activities for Closed-End Management Investment Companies.
Not applicable.
Item 13. Exhibits.
(a)(1) The registrant’s code of ethics pursuant to Item 2 of Form N-CSR is filed with the registrant’s annual Form N-CSR.
(2) Separate certifications by the registrant's principal executive officer and principal financial officer, pursuant to Section 302 of the Sarbanes-Oxley Act of 2002 and required by Rule 30a-2(a) under the Investment Company Act of 1940, are attached.
(3) Written solicitation to repurchase securities issued by closed-end companies: not applicable.
(b) A certification by the registrant's principal executive officer and principal financial officer, pursuant to Section 906 of the Sarbanes-Oxley Act of 2002 and required by Rule 30a-2(b) under the Investment Company Act of 1940, is attached.
SIGNATURES
Pursuant to the requirements of the Securities Exchange Act of 1934 and the Investment Company Act of 1940, the registrant has duly caused this report to be signed on its behalf by the undersigned, thereunto duly authorized.
T. Rowe Price Equity Series, Inc.
| By | | /s/ David Oestreicher |
| | | David Oestreicher |
| | | Principal Executive Officer |
| |
| Date | | August 16, 2019 | | | | |
Pursuant to the requirements of the Securities Exchange Act of 1934 and the Investment Company Act of 1940, this report has been signed below by the following persons on behalf of the registrant and in the capacities and on the dates indicated.
| By | | /s/ David Oestreicher |
| | | David Oestreicher |
| | | Principal Executive Officer |
| |
| Date | | August 16, 2019 | | | | |
| |
| |
| By | | /s/ Catherine D. Mathews |
| | | Catherine D. Mathews |
| | | Principal Financial Officer |
| |
| Date | | August 16, 2019 | | | | |