UNITED STATES
SECURITIES AND EXCHANGE COMMISSION
Washington, D.C. 20549
FORM N-CSR
CERTIFIED SHAREHOLDER REPORT OF REGISTERED
MANAGEMENT INVESTMENT COMPANIES
Investment Company Act File Number: 811-07143
| T. Rowe Price Equity Series, Inc. |
|
| (Exact name of registrant as specified in charter) |
| |
| 100 East Pratt Street, Baltimore, MD 21202 |
|
| (Address of principal executive offices) |
| |
| David Oestreicher |
| 100 East Pratt Street, Baltimore, MD 21202 |
|
| (Name and address of agent for service) |
Registrant’s telephone number, including area code: (410) 345-2000
Date of fiscal year end: December 31
Date of reporting period: June 30, 2022
Item 1. Reports to Shareholders
(a) Report pursuant to Rule 30e-1.
Equity Index 500 Portfolio | June 30, 2022 |
| T. ROWE PRICE Equity Index 500 Portfolio |
|
HIGHLIGHTS
| ■ | Large-cap U.S. stocks plunged as Russia’s assault on Ukraine, surging commodity prices, elevated inflation, and rising interest rates weighed heavily on the economy and the financial markets during the six-month period. The Equity Index 500 Portfolio modestly lagged its benchmark, the S&P 500 Index, primarily due to expenses. |
| | |
| ■ | Most sectors in the S&P 500 Index produced negative returns in the last six months. Information technology and consumer discre-tionary stocks were some of our largest absolute detractors. Energy companies surged while utilities companies were flat. |
| | |
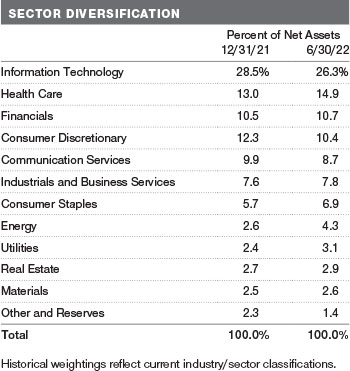
| ■ | The portfolio offers broad exposure to different sectors of the U.S. stock market, and its sector allocations are consistent with those of the benchmark. As such, changes in the portfolio’s sector diversification and other overall characteristics reflect changes in the compo-sition of the S&P 500 Index. |
| | |
| ■ | The trajectories of the pandemic, the economy, corporate earnings, and interest rates are unpredictable, and investor sentiment toward the broad market and various market segments could change without warning. Our main task is not to determine which stocks or sectors may perform best in the period ahead, but rather, to replicate the structure of the S&P 500 Index. |
Log in to your account at troweprice.com for more information.
*Certain mutual fund accounts that are assessed an annual account service fee can also save money by switching to e-delivery.
Market Commentary
Dear Investor
Major stock and bond indexes produced sharply negative results during the first half of 2022 as investors contended with persistently high inflation, tightening financial conditions, and slowing growth.
After reaching an all-time high on January 3, the S&P 500 Index finished the period down about 20%, the worst first half of a calendar year for the index since 1970. Double-digit losses were common in equity markets around the globe, and bond investors also faced a historically tough environment amid a sharp rise in interest rates.
Value shares outperformed growth stocks as equity investors turned risk averse and rising rates put downward pressure on growth stock valuations. Emerging markets stocks held up somewhat better than shares in developed markets due to the strong performance of some oil-exporting countries. Meanwhile, the U.S. dollar strengthened during the period, which weighed on returns for U.S. investors in international securities.
Within the S&P 500, energy was the only bright spot, gaining more than 30% as oil prices jumped in response to Russia’s invasion of Ukraine and the ensuing commodity supply crunch. Typically defensive shares, such as utilities, consumer staples, and health care, finished in negative territory but held up relatively well. The consumer discretionary, communication services, and information technology sectors were the weakest performers. Shares of some major retailers fell sharply following earnings misses driven in part by overstocked inventories.
Inflation remained the leading concern for investors throughout the period. Despite hopes in 2021 that the problem was transitory, and later expectations that inflation would peak in the spring, headline consumer prices continued to grind higher throughout the first half of 2022. The war in Ukraine exacerbated already existing supply chain problems, and other factors, such as the impact of the fiscal and monetary stimulus enacted during the pandemic and strong consumer demand, also pushed prices higher. The May consumer price index report (the last to be issued during our reporting period) showed prices increasing 8.6% over the 12-month period, the largest jump since late 1981.
In response, the Federal Reserve, which at the end of 2021 had forecast that only three 25-basis-point (0.25 percentage point) rate hikes would be necessary in all of 2022, rapidly shifted in a hawkish direction and executed three rate increases in the first six months of the year. The policy moves included hikes of 25, 50, and 75 basis points—the largest single increase since 1994—increasing the central bank’s short-term lending benchmark from near zero to a target range of 1.50% to 1.75% by the end of June. In addition, the Fed ended the purchases of Treasuries and agency mortgage-backed securities that it had begun to support the economy early in the pandemic and started reducing its balance sheet in June.
Longer-term bond yields also increased considerably as the Fed tightened monetary policy, with the yield on the benchmark 10-year U.S. Treasury note reaching 3.49% on June 14, its highest level in more than a decade. (Bond prices and yields move in opposite directions.) Higher mortgage rates led to signs of cooling in the housing market.
The economy continued to add jobs during the period, and other indicators pointed to a slowing but still expanding economy. However, the University of Michigan consumer sentiment index dropped in June to its lowest level since records began in 1978 as higher inflation expectations undermined confidence.
Looking ahead, investors are likely to remain focused on whether the Fed can tame inflation without sending the economy into recession, a backdrop that could produce continued volatility. We believe this environment makes skilled active management a critical tool for identifying risks and opportunities, and our investment teams will continue to use fundamental research to identify companies that can add value to your portfolio over the long term.
Thank you for your continued confidence in T. Rowe Price.
Sincerely,

Robert Sharps
CEO and President
Management’s Discussion of Fund Performance
INVESTMENT OBJECTIVE
The fund seeks to track the performance of a benchmark index that measures the investment return of large-capitalization U.S. stocks.
FUND COMMENTARY
How did the fund perform in the past six months?
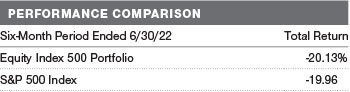
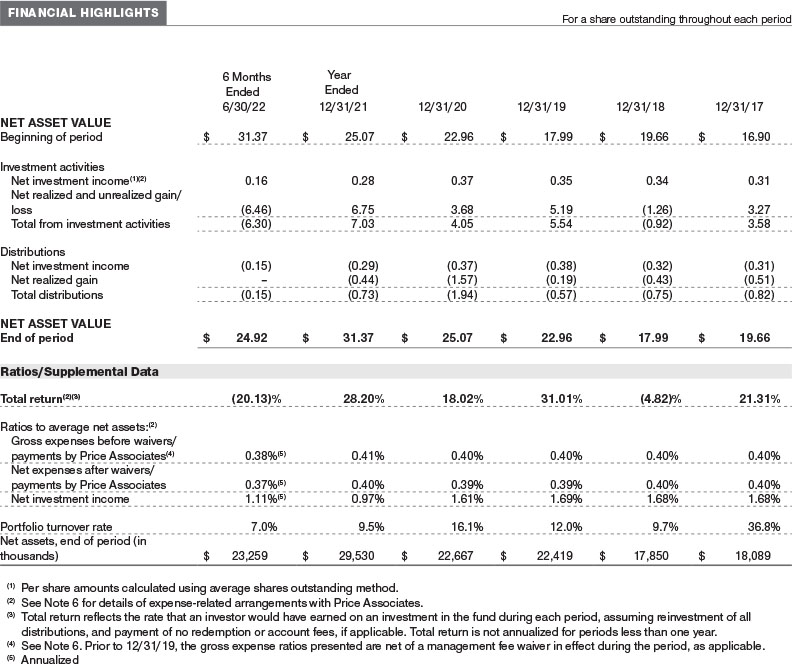
The Equity Index 500 Portfolio returned -20.13% versus -19.96% for its benchmark, the S&P 500 Index. The portfolio’s performance tends to slightly lag that of the index due to operating and management expenses. (Past performance cannot guarantee future results.)
What factors influenced the fund’s performance?
Most sectors in the S&P 500 Index produced negative returns in the first half of 2022. Large-cap U.S. stocks plunged as Russia’s assault on Ukraine, surging commodity prices, elevated inflation, and rising interest rates weighed heavily on the economy and the financial markets during the six-month period. By June, the S&P 500 Index and several other equity indexes entered “bear market” territory, meaning that they had fallen at least 20% from their recent highs.
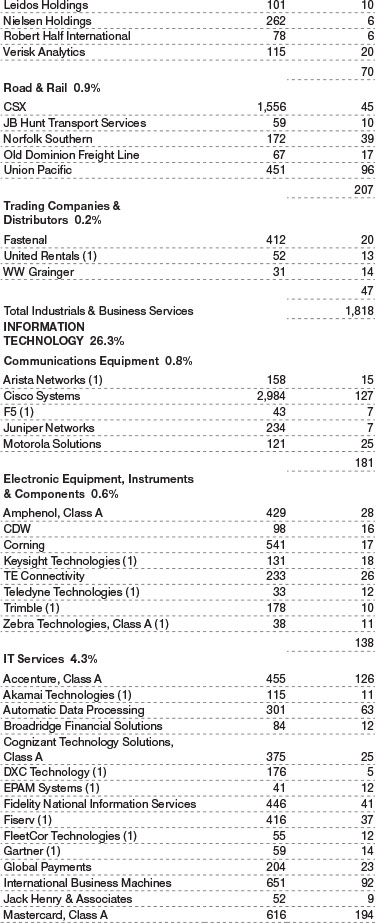
Within our portfolio, information technology stocks detracted the most in absolute terms. Semiconductors, software, and hardware companies were among the worst performers in the portfolio, with bellwethers NVIDIA, Microsoft, and Apple being particularly weak. Shares of these tech giants trended down along with other technology names, as the sector was hit by fears that supply chain issues and inflationary pressures would slow demand. Also, rising interest rates tend to hurt growth stocks by reducing the present value of their future profits. (Please refer to the portfolio of investments for a complete list of holdings and the amount each represents in the portfolio.)
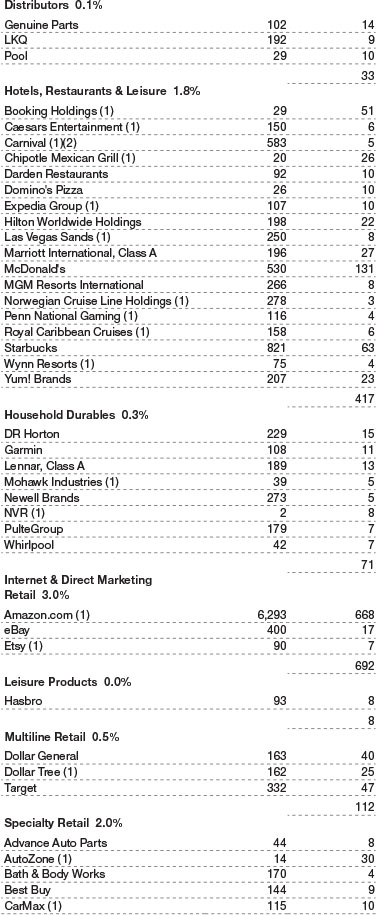
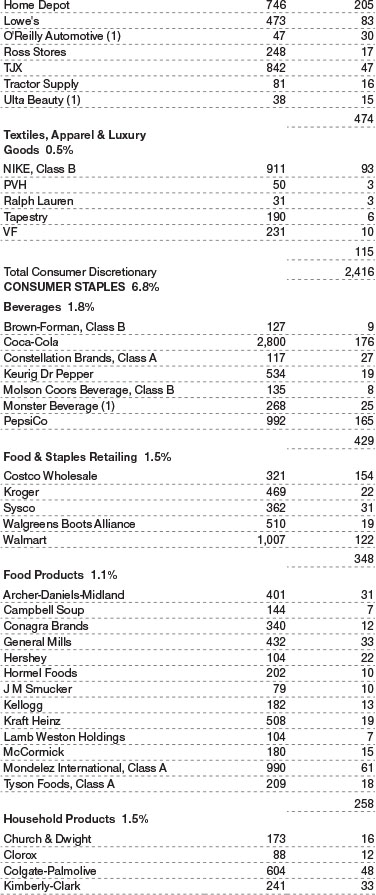
The consumer discretionary sector also exhibited negative returns, as the internet and direct marketing segment lagged. Shares of Amazon.com slid following the firm’s disappointing April earnings report, in which it posted its first quarterly loss since 2015. The company also suffered from generally bearish sentiment for online retail growth names. The automobiles segment also detracted from absolute returns, as leading electric automobile maker Tesla tumbled during the period. Shares sold off amid a flurry of negative news for the company, including CEO Elon Musk’s unexpected offer to buy Twitter, supply chain issues that are delaying production, and concerns about the automaker’s self-driving features and fire hazards. Home Depot and Lowe’s also slid during the period, as rising interest rates weighed on the housing market and home improvement retailers.
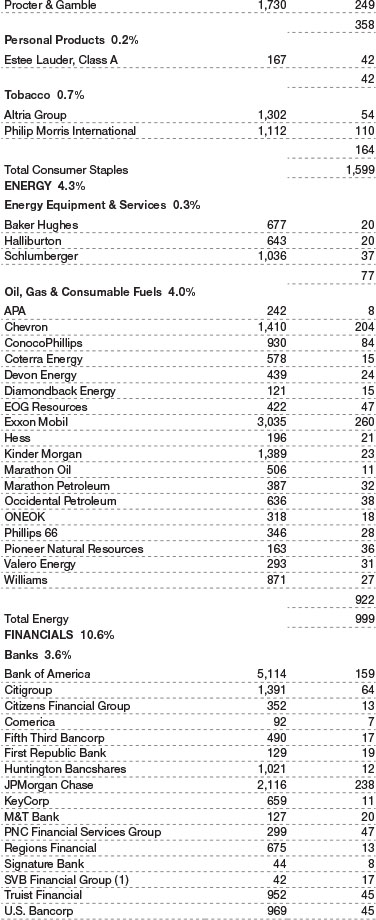
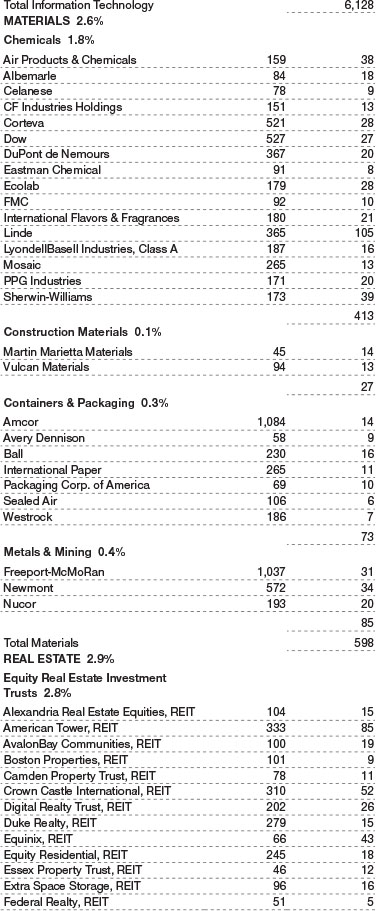
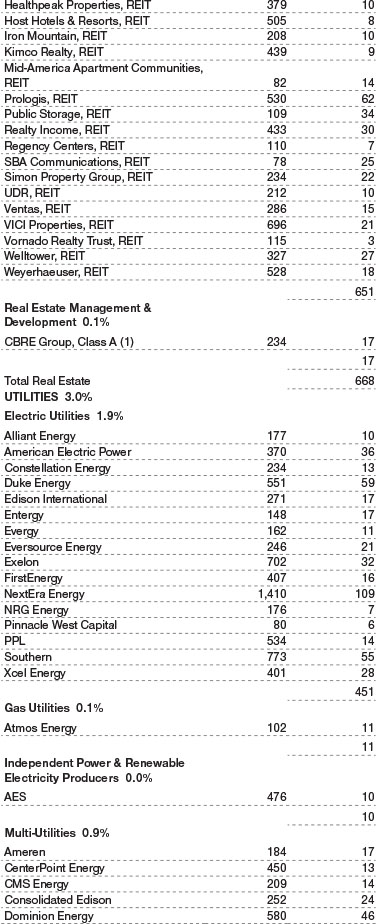
Conversely, energy shares surged for the six-month period and produced robust returns. Energy companies were by far the top performers in our portfolio, led by ExxonMobil and Chevron. Many large oil companies reported record profits during the first quarter of 2022, as many countries were forced to find alternatives to Russian energy exports, resulting in higher oil, gasoline, and natural gas prices. Oil companies Occidental Petroleum and ConocoPhillips also contributed to our results, while energy equipment and services companies Halliburton and Schlumberger added value to a lesser extent.
The utilities sector, one of the smallest in the index and the portfolio, exhibited flat returns during the six-month period. Utilities stocks, which tend to have above-average dividend yields, often behave like bonds in response to interest rate movements. However, during times of economic uncertainty, investors often favor utilities because their businesses tend to be stable. Within the sector, multi-utility companies were the top performers, led by Sempra Energy and Consolidated Edison.
How is the fund positioned?
The Equity Index 500 Portfolio, which tends to closely track its benchmark, offers broad exposure to different sectors of the U.S. stock market, and its sector allocations are consistent with those of the benchmark. As such, changes in the portfolio’s sector diversification and other overall characteristics reflect changes in the composition of the S&P 500 Index, rather than strategic shifts that are typical of an actively managed fund. Since the portfolio is designed to track its index, it lacks the flexibility to shift assets toward stocks or sectors that are rising or away from those that are declining. The portfolio’s expenses are generally low, which allows investors to retain more of their returns.
As a reminder, the T. Rowe Price Equity Index 500 Portfolio is designed for investors who want to harness the potential for long-term capital appreciation from broad exposure to large-cap U.S. stocks. The portfolio could serve as a core holding in an investor’s portfolio, as it offers attributes that many investors will find appealing. The portfolio intends to be diversified in approximately the same proportion as the index it tracks is diversified. (Diversification cannot assure a profit or protect against loss in a declining market.)
What is portfolio management’s outlook?
The Russian invasion of Ukraine, coronavirus lockdowns in China, and central bank monetary tightening around the world are likely to keep the investing environment challenging in the near term. In the immediate future, the situation in Ukraine will likely continue to impact global commodity markets, keeping food, oil, gasoline, and natural gas prices high, but it could accelerate the longer-term shift to renewable energy. Rising interest rates punished equity valuations in the first half, particularly among growth stocks, and slowing economic growth could lead to weaker corporate earnings and put further pressure on stock prices.
The trajectories of the pandemic, the economy, corporate earnings, and interest rates are unpredictable, and investor sentiment toward the broad market and various market segments could change without warning. Our main task is not to determine which stocks or sectors may perform best in the period ahead, but rather, to replicate the structure of the S&P 500 Index. Our intention is to provide you with broad exposure to large-cap U.S. stocks and to closely track the index’s performance.
The views expressed reflect the opinions of T. Rowe Price as of the date of this report and are subject to change based on changes in market, economic, or other conditions. These views are not intended to be a forecast of future events and are no guarantee of future results.
RISKS OF INVESTING IN THE EQUITY INDEX 500 PORTFOLIO
Common stocks generally fluctuate in value more than bonds and may decline significantly over short time periods. There is a chance that stock prices overall will decline because stock markets tend to move in cycles, with periods of rising and falling prices. The value of a stock in which the fund invests may decline due to general weakness in the U.S. stock market, such as when the U.S. financial markets decline, or because of factors that affect a particular company or industry.
Although stocks issued by larger companies tend to have less overall volatility than stocks issued by smaller companies, larger companies may not be able to attain the high growth rates of successful smaller companies, especially during strong economic periods. In addition, larger companies may be less capable of responding quickly to competitive challenges and industry changes and may suffer sharper price declines as a result of earnings disappointments.
Because the portfolio is passively managed and seeks to match the performance of its benchmark index, holdings are generally not reallocated based on changes in market conditions or outlook for a specific security, industry, or market sector. As a result, the portfolio’s performance may lag the performance of actively managed funds.
The returns of the portfolio are expected to be slightly below the returns of its benchmark index (referred to as “tracking error”) because the portfolio incurs fees and transaction expenses while the index has no fees or expenses. The risk of tracking error is increased to the extent that the portfolio is unable to fully replicate its benchmark index, which could result from changes in the composition of the index or the timing of purchases and redemptions of shares.
BENCHMARK INFORMATION
Note: The S&P 500 Index is a product of S&P Dow Jones Indices LLC, a division of S&P Global, or its affiliates (“SPDJI”) and has been licensed for use by T. Rowe Price. Standard & Poor’s® and S&P® are registered trademarks of Standard & Poor’s Financial Services LLC, a division of S&P Global (“S&P”); Dow Jones® is a registered trademark of Dow Jones Trademark Holdings LLC (“Dow Jones”); T. Rowe Price is not sponsored, endorsed, sold or promoted by SPDJI, Dow Jones, S&P, or their respective affiliates, and none of such parties make any representation regarding the advisability of investing in such product(s) nor do they have any liability for any errors, omissions, or interruptions of the S&P 500 Index.

GROWTH OF $10,000
This chart shows the value of a hypothetical $10,000 investment in the portfolio over the past 10 fiscal year periods or since inception (for portfolios lacking 10-year records). The result is compared with benchmarks, which include a broad-based market index and may also include a peer group average or index. Market indexes do not include expenses, which are deducted from portfolio returns as well as mutual fund averages and indexes.

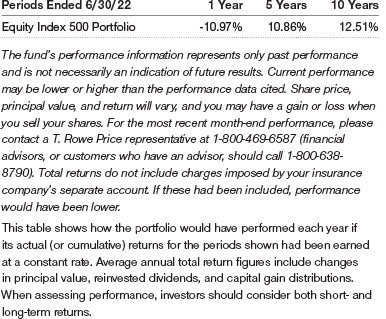
AVERAGE ANNUAL COMPOUND TOTAL RETURN
FUND EXPENSE EXAMPLE
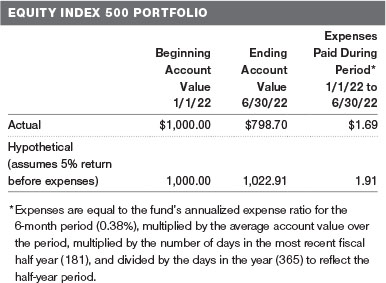
As a mutual fund shareholder, you may incur two types of costs: (1) transaction costs, such as redemption fees or sales loads, and (2) ongoing costs, including management fees, distribution and service (12b-1) fees, and other fund expenses. The following example is intended to help you understand your ongoing costs (in dollars) of investing in the fund and to compare these costs with the ongoing costs of investing in other mutual funds. The example is based on an investment of $1,000 invested at the beginning of the most recent six-month period and held for the entire period.
Actual Expenses
The first line of the following table (Actual) provides information about actual account values and actual expenses. You may use the information on this line, together with your account balance, to estimate the expenses that you paid over the period. Simply divide your account value by $1,000 (for example, an $8,600 account value divided by $1,000 = 8.6), then multiply the result by the number on the first line under the heading “Expenses Paid During Period” to estimate the expenses you paid on your account during this period.
Hypothetical Example for Comparison Purposes
The information on the second line of the table (Hypothetical) is based on hypothetical account values and expenses derived from the fund’s actual expense ratio and an assumed 5% per year rate of return before expenses (not the fund’s actual return). You may compare the ongoing costs of investing in the fund with other funds by contrasting this 5% hypothetical example and the 5% hypothetical examples that appear in the shareholder reports of the other funds. The hypothetical account values and expenses may not be used to estimate the actual ending account balance or expenses you paid for the period.
You should also be aware that the expenses shown in the table highlight only your ongoing costs and do not reflect any transaction costs, such as redemption fees or sales loads. Therefore, the second line of the table is useful in comparing ongoing costs only and will not help you determine the relative total costs of owning different funds. To the extent a fund charges transaction costs, however, the total cost of owning that fund is higher.
Unaudited
The accompanying notes are an integral part of these financial statements.
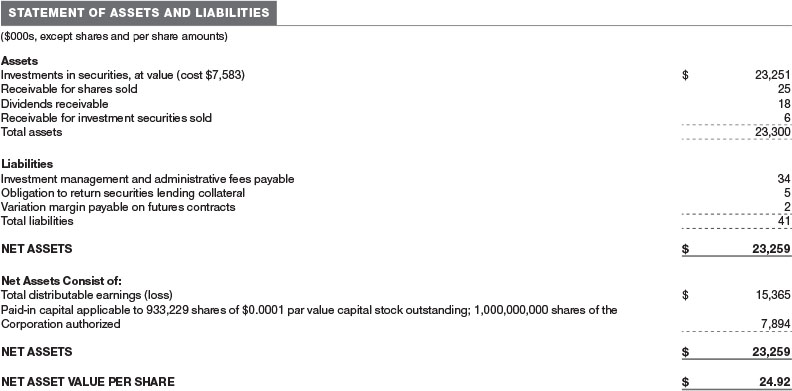
June 30, 2022 (Unaudited)


The accompanying notes are an integral part of these financial statements.
June 30, 2022 (Unaudited)
The accompanying notes are an integral part of these financial statements.
Unaudited

The accompanying notes are an integral part of these financial statements.
Unaudited

The accompanying notes are an integral part of these financial statements.
Unaudited
| NOTES TO FINANCIAL STATEMENTS |
T. Rowe Price Equity Series, Inc. (the corporation) is registered under the Investment Company Act of 1940 (the 1940 Act). The Equity Index 500 Portfolio (the fund) is an open-end management investment company established by the corporation and intends to be diversified in approximately the same proportion as the index it tracks is diversified. The fund may become nondiversified for periods of time solely as a result of changes in the composition of the index (for example, changes in the relative market capitalization or index weighting of one or more securities represented in the index). The fund seeks to track the performance of a benchmark index that measures the investment return of large-capitalization U.S. stocks. Shares of the fund are currently offered only to insurance company separate accounts established for the purpose of funding variable annuity contracts and variable life insurance policies.
NOTE 1 - SIGNIFICANT ACCOUNTING POLICIES
Basis of Preparation The fund is an investment company and follows accounting and reporting guidance in the Financial Accounting Standards Board (FASB) Accounting Standards Codification Topic 946 (ASC 946). The accompanying financial statements were prepared in accordance with accounting principles generally accepted in the United States of America (GAAP), including, but not limited to, ASC 946. GAAP requires the use of estimates made by management. Management believes that estimates and valuations are appropriate; however, actual results may differ from those estimates, and the valuations reflected in the accompanying financial statements may differ from the value ultimately realized upon sale or maturity.
Investment Transactions, Investment Income, and Distributions Investment transactions are accounted for on the trade date basis. Income and expenses are recorded on the accrual basis. Realized gains and losses are reported on the identified cost basis. Premiums and discounts on debt securities are amortized for financial reporting purposes. Income tax-related interest and penalties, if incurred, are recorded as income tax expense. Dividends received from mutual fund investments are reflected as dividend income; capital gain distributions are reflected as realized gain/loss. Dividend income and capital gain distributions are recorded on the ex-dividend date. Distributions from REITs are initially recorded as dividend income and, to the extent such represent a return of capital or capital gain for tax purposes, are reclassified when such information becomes available. Non-cash dividends, if any, are recorded at the fair market value of the asset received. Distributions to shareholders are recorded on the ex-dividend date. Income distributions, if any, are declared and paid quarterly. A capital gain distribution may also be declared and paid by the fund annually.
Capital Transactions Each investor’s interest in the net assets of the fund is represented by fund shares. The fund’s net asset value (NAV) per share is computed at the close of the New York Stock Exchange (NYSE), normally 4 p.m. ET, each day the NYSE is open for business. However, the NAV per share may be calculated at a time other than the normal close of the NYSE if trading on the NYSE is restricted, if the NYSE closes earlier, or as may be permitted by the SEC. Purchases and redemptions of fund shares are transacted at the next-computed NAV per share, after receipt of the transaction order by T. Rowe Price Associates, Inc., or its agents.
Indemnification In the normal course of business, the fund may provide indemnification in connection with its officers and directors, service providers, and/or private company investments. The fund’s maximum exposure under these arrangements is unknown; however, the risk of material loss is currently considered to be remote.
NOTE 2 - VALUATION
Fair Value The fund’s financial instruments are valued at the close of the NYSE and are reported at fair value, which GAAP defines as the price that would be received to sell an asset or paid to transfer a liability in an orderly transaction between market participants at the measurement date. The T. Rowe Price Valuation Committee (the Valuation Committee) is an internal committee that has been delegated certain responsibilities by the fund’s Board of Directors (the Board) to ensure that financial instruments are appropriately priced at fair value in accordance with GAAP and the 1940 Act. Subject to oversight by the Board, the Valuation Committee develops and oversees pricing-related policies and procedures and approves all fair value determinations. Specifically, the Valuation Committee establishes policies and procedures used in valuing financial instruments, including those which cannot be valued in accordance with normal procedures or using pricing vendors; determines pricing techniques, sources, and persons eligible to effect fair value pricing actions; evaluates the services and performance of the pricing vendors; oversees the pricing process to ensure policies and procedures are being followed; and provides guidance on internal controls and valuation-related matters. The Valuation Committee provides periodic reporting to the Board on valuation matters.
Various valuation techniques and inputs are used to determine the fair value of financial instruments. GAAP establishes the following fair value hierarchy that categorizes the inputs used to measure fair value:
Level 1 – quoted prices (unadjusted) in active markets for identical financial instruments that the fund can access at the reporting date
Level 2 – inputs other than Level 1 quoted prices that are observable, either directly or indirectly (including, but not limited to, quoted prices for similar financial instruments in active markets, quoted prices for identical or similar financial instruments in inactive markets, interest rates and yield curves, implied volatilities, and credit spreads)
Level 3 – unobservable inputs (including the fund’s own assumptions in determining fair value)
Observable inputs are developed using market data, such as publicly available information about actual events or transactions, and reflect the assumptions that market participants would use to price the financial instrument. Unobservable inputs are those for which market data are not available and are developed using the best information available about the assumptions that market participants would use to price the financial instrument. GAAP requires valuation techniques to maximize the use of relevant observable inputs and minimize the use of unobservable inputs. When multiple inputs are used to derive fair value, the financial instrument is assigned to the level within the fair value hierarchy based on the lowest-level input that is significant to the fair value of the financial instrument. Input levels are not necessarily an indication of the risk or liquidity associated with financial instruments at that level but rather the degree of judgment used in determining those values.
Valuation Techniques Equity securities, including exchange-traded funds, listed or regularly traded on a securities exchange or in the over-the-counter (OTC) market are valued at the last quoted sale price or, for certain markets, the official closing price at the time the valuations are made. OTC Bulletin Board securities are valued at the mean of the closing bid and asked prices. A security that is listed or traded on more than one exchange is valued at the quotation on the exchange determined to be the primary market for such security. Listed securities not traded on a particular day are valued at the mean of the closing bid and asked prices for domestic securities.
Debt securities generally are traded in the over-the-counter (OTC) market and are valued at prices furnished by independent pricing services or by broker dealers who make markets in such securities. When valuing securities, the independent pricing services consider the yield or price of bonds of comparable quality, coupon, maturity, and type, as well as prices quoted by dealers who make markets in such securities.
Investments in mutual funds are valued at the mutual fund’s closing NAV per share on the day of valuation. Futures contracts are valued at closing settlement prices. Assets and liabilities other than financial instruments, including short-term receivables and payables, are carried at cost, or estimated realizable value, if less, which approximates fair value.
Investments for which market quotations or market-based valuations are not readily available or deemed unreliable are valued at fair value as determined in good faith by the Valuation Committee, in accordance with fair valuation policies and procedures. The objective of any fair value pricing determination is to arrive at a price that could reasonably be expected from a current sale. Financial instruments fair valued by the Valuation Committee are primarily private placements, restricted securities, warrants, rights, and other securities that are not publicly traded. Factors used in determining fair value vary by type of investment and may include market or investment specific considerations. The Valuation Committee typically will afford greatest weight to actual prices in arm’s length transactions, to the extent they represent orderly transactions between market participants, transaction information can be reliably obtained, and prices are deemed representative of fair value. However, the Valuation Committee may also consider other valuation methods such as market-based valuation multiples; a discount or premium from market value of a similar, freely traded security of the same issuer; discounted cash flows; yield to maturity; or some combination. Fair value determinations are reviewed on a regular basis and updated as information becomes available, including actual purchase and sale transactions of the investment. Because any fair value determination involves a significant amount of judgment, there is a degree of subjectivity inherent in such pricing decisions, and fair value prices determined by the Valuation Committee could differ from those of other market participants.
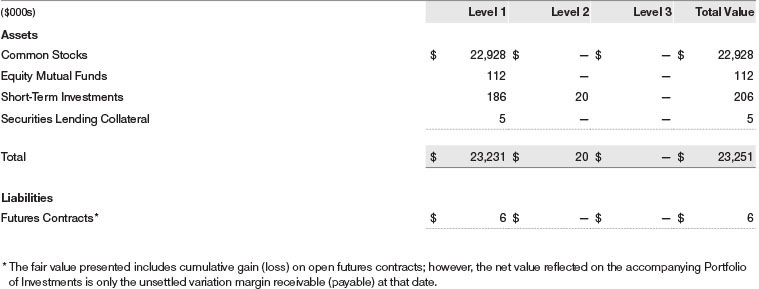
Valuation Inputs The following table summarizes the fund’s financial instruments, based on the inputs used to determine their fair values on June 30, 2022 (for further detail by category, please refer to the accompanying Portfolio of Investments):
NOTE 3 - DERIVATIVE INSTRUMENTS
During the six months ended June 30, 2022, the fund invested in derivative instruments. As defined by GAAP, a derivative is a financial instrument whose value is derived from an underlying security price, foreign exchange rate, interest rate, index of prices or rates, or other variable; it requires little or no initial investment and permits or requires net settlement. The fund invests in derivatives only if the expected risks and rewards are consistent with its investment objectives, policies, and overall risk profile, as described in its prospectus and Statement of Additional Information. The fund may use derivatives for a variety of purposes and may use them to establish both long and short positions within the fund’s portfolio. Potential uses include to hedge against declines in principal value, increase yield, invest in an asset with greater efficiency and at a lower cost than is possible through direct investment, to enhance return, or to adjust credit exposure. The risks associated with the use of derivatives are different from, and potentially much greater than, the risks associated with investing directly in the instruments on which the derivatives are based. The fund at all times maintains sufficient cash reserves, liquid assets, or other SEC-permitted asset types to cover its settlement obligations under open derivative contracts.
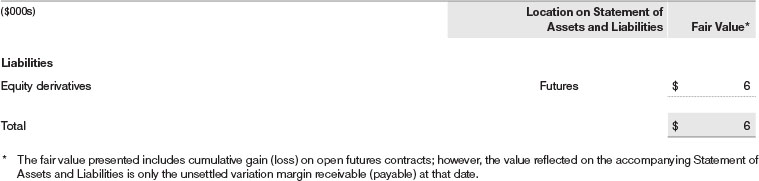
The fund values its derivatives at fair value and recognizes changes in fair value currently in its results of operations. Accordingly, the fund does not follow hedge accounting, even for derivatives employed as economic hedges. Generally, the fund accounts for its derivatives on a gross basis. It does not offset the fair value of derivative liabilities against the fair value of derivative assets on its financial statements, nor does it offset the fair value of derivative instruments against the right to reclaim or obligation to return collateral. The following table summarizes the fair value of the fund’s derivative instruments held as of June 30, 2022, and the related location on the accompanying Statement of Assets and Liabilities, presented by primary underlying risk exposure:
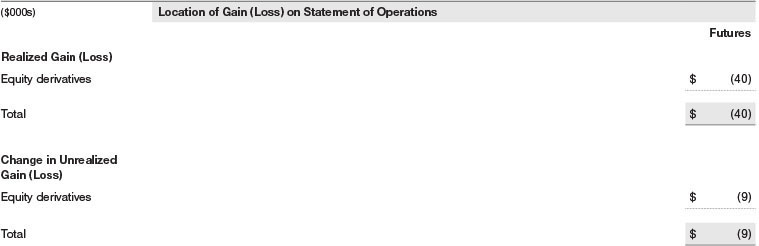
Additionally, the amount of gains and losses on derivative instruments recognized in fund earnings during the six months ended June 30, 2022, and the related location on the accompanying Statement of Operations is summarized in the following table by primary underlying risk exposure:
Counterparty Risk and Collateral The fund invests in exchange-traded and/or centrally cleared derivative contracts, such as futures, exchange-traded options, and centrally cleared swaps. Counterparty risk on such derivatives is minimal because the clearinghouse provides protection against counterparty defaults. For futures and centrally cleared swaps, the fund is required to deposit collateral in an amount specified by the clearinghouse and the clearing firm (margin requirement), and the margin requirement must be maintained over the life of the contract. Each clearinghouse and clearing firm, in its sole discretion, may adjust the margin requirements applicable to the fund.
Collateral may be in the form of cash or debt securities issued by the U.S. government or related agencies. Cash posted by the fund is reflected as cash deposits in the accompanying financial statements and generally is restricted from withdrawal by the fund; securities posted by the fund are so noted in the accompanying Portfolio of Investments; both remain in the fund’s assets. While typically not sold in the same manner as equity or fixed income securities, exchange-traded or centrally cleared derivatives may be closed out only on the exchange or clearinghouse where the contracts were cleared. This ability is subject to the liquidity of underlying positions. As of June 30, 2022, securities valued at $13,000 had been posted by the fund for exchange-traded and/or centrally cleared derivatives.
Futures Contracts The fund is subject to equity price risk in the normal course of pursuing its investment objectives and uses futures contracts to help manage such risk. The fund may enter into futures contracts as an efficient means of maintaining liquidity while being invested in the market, to facilitate trading, or to reduce transaction costs. A futures contract provides for the future sale by one party and purchase by another of a specified amount of a specific underlying financial instrument at an agreed-upon price, date, time, and place. The fund currently invests only in exchange-traded futures, which generally are standardized as to maturity date, underlying financial instrument, and other contract terms. Payments are made or received by the fund each day to settle daily fluctuations in the value of the contract (variation margin), which reflect changes in the value of the underlying financial instrument. Variation margin is recorded as unrealized gain or loss until the contract is closed. The value of a futures contract included in net assets is the amount of unsettled variation margin; net variation margin receivable is reflected as an asset and net variation margin payable is reflected as a liability on the accompanying Statement of Assets and Liabilities. Risks related to the use of futures contracts include possible illiquidity of the futures markets, contract prices that can be highly volatile and imperfectly correlated to movements in hedged security values, and potential losses in excess of the fund’s initial investment. During the six months ended June 30, 2022, the volume of the fund’s activity in futures, based on underlying notional amounts, was generally less than 1% of net assets.
NOTE 4 - OTHER INVESTMENT TRANSACTIONS
Consistent with its investment objective, the fund engages in the following practices to manage exposure to certain risks and/or to enhance performance. The investment objective, policies, program, and risk factors of the fund are described more fully in the fund’s prospectus and Statement of Additional Information.
Securities Lending The fund may lend its securities to approved borrowers to earn additional income. Its securities lending activities are administered by a lending agent in accordance with a securities lending agreement. Security loans generally do not have stated maturity dates, and the fund may recall a security at any time. The fund receives collateral in the form of cash or U.S. government securities. Collateral is maintained over the life of the loan in an amount not less than the value of loaned securities; any additional collateral required due to changes in security values is delivered to the fund the next business day. Cash collateral is invested in accordance with investment guidelines approved by fund management. Additionally, the lending agent indemnifies the fund against losses resulting from borrower default. Although risk is mitigated by the collateral and indemnification, the fund could experience a delay in recovering its securities and a possible loss of income or value if the borrower fails to return the securities, collateral investments decline in value, and the lending agent fails to perform. Securities lending revenue consists of earnings on invested collateral and borrowing fees, net of any rebates to the borrower, compensation to the lending agent, and other administrative costs. In accordance with GAAP, investments made with cash collateral are reflected in the accompanying financial statements, but collateral received in the form of securities is not. At June 30, 2022, the value of loaned securities was $4,000; the value of cash collateral and related investments was $5,000.
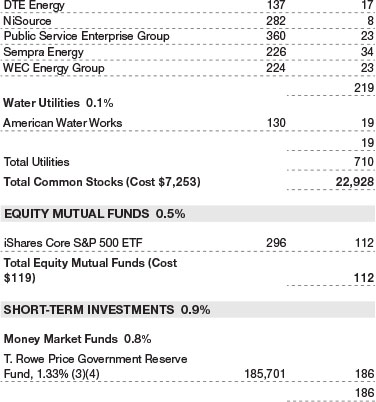
Other Purchases and sales of portfolio securities other than short-term securities aggregated $2,061,000 and $1,872,000, respectively, for the six months ended June 30, 2022.
NOTE 5 - FEDERAL INCOME TAXES
No provision for federal income taxes is required since the fund intends to continue to qualify as a regulated investment company under Subchapter M of the Internal Revenue Code and distribute to shareholders all of its taxable income and gains. Distributions determined in accordance with federal income tax regulations may differ in amount or character from net investment income and realized gains for financial reporting purposes. Financial reporting records are adjusted for permanent book/tax differences to reflect tax character but are not adjusted for temporary differences. The amount and character of tax-basis distributions and composition of net assets are finalized at fiscal year-end; accordingly, tax-basis balances have not been determined as of the date of this report.
At June 30, 2022, the cost of investments for federal income tax purposes was $7,931,000. Net unrealized gain aggregated $15,314,000 at period-end, of which $15,990,000 related to appreciated investments and $676,000 related to depreciated investments.
NOTE 6 - RELATED PARTY TRANSACTIONS
The fund is managed by T. Rowe Price Associates, Inc. (Price Associates), a wholly owned subsidiary of T. Rowe Price Group, Inc. (Price Group). The investment management and administrative agreement between the fund and Price Associates provides for an all-inclusive annual fee equal to 0.40% of the fund’s average daily net assets. The fee is computed daily and paid monthly. The all-inclusive fee covers investment management services and ordinary, recurring operating expenses but does not cover interest expense; expenses related to borrowing, taxes, and brokerage; or nonrecurring expenses. Effective July 1, 2018, Price Associates has contractually agreed, at least through April 30, 2023 to waive a portion of its management fee in order to limit the fund’s management fee to 0.39% of the fund’s average daily net assets. Thereafter, this agreement automatically renews for one-year terms unless terminated or modified by the fund’s Board. Fees waived and expenses paid under this agreement are not subject to reimbursement to Price Associates by the fund. The total management fees waived were $2,000 for the six months ended June 30, 2022.
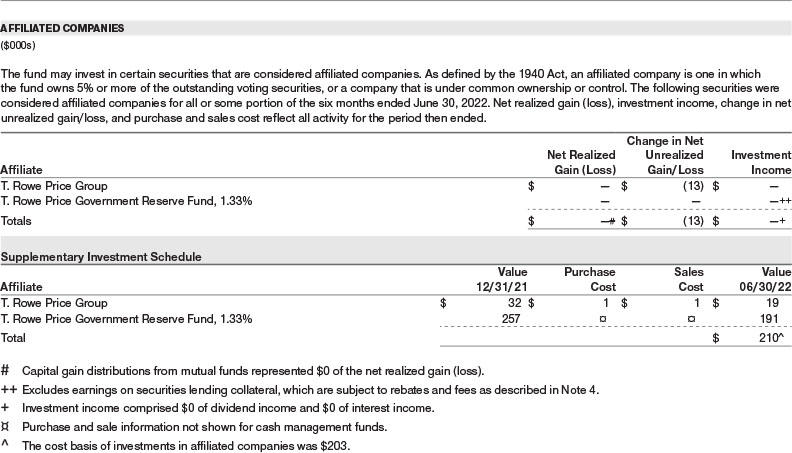
Consistent with its investment objective, the fund may invest in T. Rowe Price Group, Inc. Additionally, the fund may invest its cash reserves in certain open-end management investment companies managed by Price Associates and considered affiliates of the fund: the T. Rowe Price Government Reserve Fund or the T. Rowe Price Treasury Reserve Fund, organized as money market funds, or the T. Rowe Price Short-Term Fund, a short-term bond fund (collectively, the Price Reserve Funds). The Price Reserve Funds are offered as short-term investment options to mutual funds, trusts, and other accounts managed by Price Associates or its affiliates and are not available for direct purchase by members of the public. Cash collateral from securities lending, if any, is invested in the T. Rowe Price Government Reserve Fund; prior to December 13, 2021, the cash collateral from securities lending was invested in the T. Rowe Price Short-Term Fund. The Price Reserve Funds pay no investment management fees.
The fund may participate in securities purchase and sale transactions with other funds or accounts advised by Price Associates (cross trades), in accordance with procedures adopted by the fund’s Board and Securities and Exchange Commission rules, which require, among other things, that such purchase and sale cross trades be effected at the independent current market price of the security. During the six months ended June 30, 2022, the fund had no purchases or sales cross trades with other funds or accounts advised by Price Associates.
NOTE 7 - OTHER MATTERS
Unpredictable events such as environmental or natural disasters, war, terrorism, pandemics, outbreaks of infectious diseases, and similar public health threats may significantly affect the economy and the markets and issuers in which a fund invests. Certain events may cause instability across global markets, including reduced liquidity and disruptions in trading markets, while some events may affect certain geographic regions, countries, sectors, and industries more significantly than others, and exacerbate other pre-existing political, social, and economic risks. Since 2020, a novel strain of coronavirus (COVID-19) has resulted in disruptions to global business activity and caused significant volatility and declines in global financial markets. In February 2022, Russian forces entered Ukraine and commenced an armed conflict leading to economic sanctions being imposed on Russia and certain of its citizens, creating impacts on Russian-related stocks and debt and greater volatility in global markets. These are recent examples of global events which may have an impact on the fund’s performance, which could be negatively impacted if the value of a portfolio holding were harmed by these and such other events. Management is actively monitoring the risks and financial impacts arising from these events.
INFORMATION ON PROXY VOTING POLICIES, PROCEDURES, AND RECORDS
A description of the policies and procedures used by T. Rowe Price funds to determine how to vote proxies relating to portfolio securities is available in each fund’s Statement of Additional Information. You may request this document by calling 1-800-225-5132 or by accessing the SEC’s website, sec.gov.
The description of our proxy voting policies and procedures is also available on our corporate website. To access it, please visit the following Web page:
https://www.troweprice.com/corporate/us/en/utility/policies.html
Scroll down to the section near the bottom of the page that says, “Proxy Voting Guidelines.” Click on the links in the shaded box.
Each fund’s most recent annual proxy voting record is available on our website and through the SEC’s website. To access it through T. Rowe Price, visit the website location shown above, and scroll down to the section near the bottom of the page that says, “Proxy Voting Records.” Click on the Proxy Voting Records link in the shaded box.
HOW TO OBTAIN QUARTERLY PORTFOLIO HOLDINGS
The fund files a complete schedule of portfolio holdings with the Securities and Exchange Commission (SEC) for the first and third quarters of each fiscal year as an exhibit to its reports on Form N-PORT. The fund’s reports on Form N-PORT are available electronically on the SEC’s website (sec.gov). In addition, most T. Rowe Price funds disclose their first and third fiscal quarter-end holdings on troweprice.com.
APPROVAL OF INVESTMENT MANAGEMENT AGREEMENT
Each year, the fund’s Board of Directors (Board) considers the continuation of the investment management agreement (Advisory Contract) between the fund and its investment adviser, T. Rowe Price Associates, Inc. (Adviser). In that regard, at a meeting held on March 7–8, 2022 (Meeting), the Board, including all of the fund’s independent directors, approved the continuation of the fund’s Advisory Contract. At the Meeting, the Board considered the factors and reached the conclusions described below relating to the selection of the Adviser and the approval of the Advisory Contract. The independent directors were assisted in their evaluation of the Advisory Contract by independent legal counsel from whom they received separate legal advice and with whom they met separately.
In providing information to the Board, the Adviser was guided by a detailed set of requests for information submitted by independent legal counsel on behalf of the independent directors. In considering and approving the Advisory Contract, the Board considered the information it believed was relevant, including, but not limited to, the information discussed below. The Board considered not only the specific information presented in connection with the Meeting but also the knowledge gained over time through interaction with the Adviser about various topics. The Board meets regularly and, at each of its meetings, covers an extensive agenda of topics and materials and considers factors that are relevant to its annual consideration of the renewal of the T. Rowe Price funds’ advisory contracts, including performance and the services and support provided to the funds and their shareholders.
Services Provided by the Adviser
The Board considered the nature, quality, and extent of the services provided to the fund by the Adviser. These services included, but were not limited to, directing the fund’s investments in accordance with its investment program and the overall management of the fund’s portfolio, as well as a variety of related activities such as financial, investment operations, and administrative services; compliance; maintaining the fund’s records and registrations; and shareholder communications. The Board also reviewed the background and experience of the Adviser’s senior management team and investment personnel involved in the management of the fund, as well as the Adviser’s compliance record. The Board concluded that it was satisfied with the nature, quality, and extent of the services provided by the Adviser.
Investment Performance of the Fund
The Board took into account discussions with the Adviser and reports that it receives throughout the year relating to fund performance. In connection with the Meeting, the Board reviewed the fund’s total returns for various periods through December 31, 2021, and compared these returns with the performance of a peer group of funds with similar investment programs and a wide variety of other previously agreed-upon comparable performance measures and market data, including relative performance information as of September 30, 2021, supplied by Broadridge, which is an independent provider of mutual fund data.
On the basis of this evaluation and the Board’s ongoing review of investment results, and factoring in the relative market conditions during certain of the performance periods, the Board concluded that the fund’s performance was satisfactory.
Costs, Benefits, Profits, and Economies of Scale
The Board reviewed detailed information regarding the revenues received by the Adviser under the Advisory Contract and other direct and indirect benefits that the Adviser (and its affiliates) may have realized from its relationship with the fund. In considering soft-dollar arrangements pursuant to which research may be received from broker-dealers that execute the fund’s portfolio transactions, the Board noted that the Adviser bears the cost of research services for all client accounts that it advises, including the T. Rowe Price funds. The Board received information on the estimated costs incurred and profits realized by the Adviser from managing the T. Rowe Price funds. While the Board did not review information regarding profits realized from managing the fund in particular because the fund had either not achieved sufficient portfolio asset size or not recognized sufficient revenues to produce meaningful profit margin percentages, the Board concluded that the Adviser’s profits were reasonable in light of the services provided to the T. Rowe Price funds.
The Board also considered whether the fund benefits under the fee levels set forth in the Advisory Contract or otherwise from any economies of scale realized by the Adviser. Under the Advisory Contract, the fund pays the Adviser a single fee, or all-inclusive management fee, which is based on the fund’s average daily net assets. The all-inclusive management fee includes investment management services and provides for the Adviser to pay all of the fund’s ordinary, recurring operating expenses except for interest, taxes, portfolio transaction fees, and any nonrecurring extraordinary expenses that may arise. However, the fund has a contractual limitation in place whereby the Adviser has agreed to waive a portion of the management fee it is entitled to receive from the fund in order to limit the fund’s overall management fee rate to 0.39% of the fund’s average daily net assets. Any fees waived under this management fee waiver agreement are not subject to reimbursement to the Adviser by the fund. The Adviser has generally implemented an all-inclusive management fee structure in situations where a fixed total expense ratio is useful for purposes of providing certainty of fees and expenses for the investors in these funds and has historically sought to set the initial all-inclusive management fee rate at levels below the expense ratios of comparable funds to take into account potential future economies of scale. Because the fund serves as an underlying option to variable annuity products, the all-inclusive fee structure is utilized to create certainty for the annuity providers’ overall pricing decisions and disclosures. Assets of the fund are included in the calculation of the group fee rate, which serves as a component of the management fee for many T. Rowe Price funds and declines at certain asset levels based on the combined average net assets of most of the T. Rowe Price funds (including the fund). Although the fund does not have a group fee component to its management fee, its assets are included in the calculation because certain resources utilized to operate the fund are shared with other T. Rowe Price funds. The Board concluded that, based on the profitability data it reviewed and consistent with this all-inclusive management fee structure, the advisory fee structure for the fund continued to be appropriate.
Fees and Expenses
The Board was provided with information regarding industry trends in management fees and expenses. Among other things, the Board reviewed data for peer groups that were compiled by Broadridge, which compared: (i) contractual management fees, actual management fees, nonmanagement expenses, and total expenses of the fund with a group of competitor funds selected by Broadridge (Expense Group) and (ii) actual management fees, nonmanagement expenses, and total expenses of the fund with a broader set of funds within the Lipper investment classification (Expense Universe). The Board considered the fund’s contractual management fee rate, actual management fee rate, and total expenses (all of which generally reflect the all-inclusive management fee rate and do not deduct the operating expenses paid by the Adviser as part of the overall management fee) in comparison with the information for the Broadridge peer groups. Broadridge generally constructed the peer groups by seeking the most comparable funds based on similar investment classifications and objectives, expense structure, asset size, and operating components and attributes and ranked funds into quintiles, with the first quintile representing the funds with the lowest relative expenses and the fifth quintile representing the funds with the highest relative expenses. The information provided to the Board indicated that the fund’s contractual management fee ranked in the fourth quintile (Expense Group), the fund’s actual management fee rate ranked in the fifth quintile (Expense Group and Expense Universe), and the fund’s total expenses ranked in the fifth quintile (Expense Group and Expense Universe).
Management provided the Board with additional information with respect to the fund’s relative management fees and total expenses ranking in the fourth and fifth quintiles and reviewed and considered the information provided relating to the fund, other funds in the peer groups, and other factors that the Board determined to be relevant.
The Board also reviewed the fee schedules for other investment portfolios with similar mandates that are advised or subadvised by the Adviser and its affiliates, including separately managed accounts for institutional and individual investors; subadvised funds; and other sponsored investment portfolios, including collective investment trusts and pooled vehicles organized and offered to investors outside the United States. Management provided the Board with information about the Adviser’s responsibilities and services provided to subadvisory and other institutional account clients, including information about how the requirements and economics of the institutional business are fundamentally different from those of the proprietary mutual fund business. The Board considered information showing that the Adviser’s mutual fund business is generally more complex from a business and compliance perspective than its institutional account business and considered various relevant factors, such as the broader scope of operations and oversight, more extensive shareholder communication infrastructure, greater asset flows, heightened business risks, and differences in applicable laws and regulations associated with the Adviser’s proprietary mutual fund business. In assessing the reasonableness of the fund’s management fee rate, the Board considered the differences in the nature of the services required for the Adviser to manage its mutual fund business versus managing a discrete pool of assets as a subadviser to another institution’s mutual fund or for an institutional account and that the Adviser generally performs significant additional services and assumes greater risk in managing the fund and other T. Rowe Price funds than it does for institutional account clients, including subadvised funds.
On the basis of the information provided and the factors considered, the Board concluded that the fees paid by the fund under the Advisory Contract are reasonable.
Approval of the Advisory Contract
As noted, the Board approved the continuation of the Advisory Contract. No single factor was considered in isolation or to be determinative to the decision. Rather, the Board concluded, in light of a weighting and balancing of all factors considered, that it was in the best interests of the fund and its shareholders for the Board to approve the continuation of the Advisory Contract (including the fees to be charged for services thereunder).
Item 1. (b) Notice pursuant to Rule 30e-3.
Not applicable.
Item 2. Code of Ethics.
A code of ethics, as defined in Item 2 of Form N-CSR, applicable to its principal executive officer, principal financial officer, principal accounting officer or controller, or persons performing similar functions is filed as an exhibit to the registrant’s annual Form N-CSR. No substantive amendments were approved or waivers were granted to this code of ethics during the registrant’s most recent fiscal half-year.
Item 3. Audit Committee Financial Expert.
Disclosure required in registrant’s annual Form N-CSR.
Item 4. Principal Accountant Fees and Services.
Disclosure required in registrant’s annual Form N-CSR.
Item 5. Audit Committee of Listed Registrants.
Not applicable.
Item 6. Investments.
(a) Not applicable. The complete schedule of investments is included in Item 1 of this Form N-CSR.
(b) Not applicable.
Item 7. Disclosure of Proxy Voting Policies and Procedures for Closed-End Management Investment Companies.
Not applicable.
Item 8. Portfolio Managers of Closed-End Management Investment Companies.
Not applicable.
Item 9. Purchases of Equity Securities by Closed-End Management Investment Company and Affiliated Purchasers.
Not applicable.
Item 10. Submission of Matters to a Vote of Security Holders.
There has been no change to the procedures by which shareholders may recommend nominees to the registrant’s board of directors.
Item 11. Controls and Procedures.
(a) The registrant’s principal executive officer and principal financial officer have evaluated the registrant’s disclosure controls and procedures within 90 days of this filing and have concluded that the registrant’s disclosure controls and procedures were effective, as of that date, in ensuring that information required to be disclosed by the registrant in this Form N-CSR was recorded, processed, summarized, and reported timely.
(b) The registrant’s principal executive officer and principal financial officer are aware of no change in the registrant’s internal control over financial reporting that occurred during the period covered by this report that has materially affected, or is reasonably likely to materially affect, the registrant’s internal control over financial reporting.
Item 12. Disclosure of Securities Lending Activities for Closed-End Management Investment Companies.
Not applicable.
Item 13. Exhibits.
(a)(1) The registrant’s code of ethics pursuant to Item 2 of Form N-CSR is filed with the registrant’s annual Form N-CSR.
(2) Separate certifications by the registrant’s principal executive officer and principal financial officer, pursuant to Section 302 of the Sarbanes-Oxley Act of 2002 and required by Rule 30a-2(a) under the Investment Company Act of 1940, are attached.
(3) Written solicitation to repurchase securities issued by closed-end companies: not applicable.
(b) A certification by the registrant’s principal executive officer and principal financial officer, pursuant to Section 906 of the Sarbanes-Oxley Act of 2002 and required by Rule 30a-2(b) under the Investment Company Act of 1940, is attached.
SIGNATURES
Pursuant to the requirements of the Securities Exchange Act of 1934 and the Investment Company Act of 1940, the registrant has duly caused this report to be signed on its behalf by the undersigned, thereunto duly authorized.
T. Rowe Price Equity Series, Inc.
| By | | /s/ David Oestreicher |
| | | David Oestreicher |
| | | Principal Executive Officer |
| |
| Date | | August 17, 2022 | | | | |
Pursuant to the requirements of the Securities Exchange Act of 1934 and the Investment Company Act of 1940, this report has been signed below by the following persons on behalf of the registrant and in the capacities and on the dates indicated.
| By | | /s/ David Oestreicher |
| | | David Oestreicher |
| | | Principal Executive Officer |
| |
| Date | | August 17, 2022 | | | | |
| |
| |
| By | | /s/ Alan S. Dupski |
| | | Alan S. Dupski |
| | | Principal Financial Officer |
| |
| Date | | August 17, 2022 | | | | |