Table of Contents
UNITED STATES
SECURITIES AND EXCHANGE COMMISSION
Washington, D.C. 20549
FORM N-CSR
CERTIFIED SHAREHOLDER REPORT OF REGISTERED MANAGEMENT
INVESTMENT COMPANIES
Investment Company Act file number 811-8326
MFS VARIABLE INSURANCE TRUST
(Exact name of registrant as specified in charter)
500 Boylston Street, Boston, Massachusetts 02116
(Address of principal executive offices) (Zip code)
Susan S. Newton
Massachusetts Financial Services Company
500 Boylston Street
Boston, Massachusetts 02116
(Name and address of agents for service)
Registrant’s telephone number, including area code: (617) 954-5000
Date of fiscal year end: December 31
Date of reporting period: June 30, 2008
Table of Contents
ITEM 1. REPORTS TO STOCKHOLDERS.
Table of Contents

Table of Contents
MFS® CORE EQUITY SERIES
This report is prepared for the general information of contract owners. It is authorized for distribution to prospective investors only when preceded or accompanied by a current prospectus.
NOT FDIC INSURED Ÿ MAY LOSE VALUE Ÿ NO BANK OR CREDIT UNION GUARANTEE Ÿ NOT A DEPOSIT Ÿ NOT INSURED BY ANY FEDERAL GOVERNMENT AGENCY OR NCUA/NCUSIF
Table of Contents

Dear Contract Owners:
Negative headlines tend to resonate during difficult markets, and we certainly have had more than our share of tough news recently. As a result consumer, and particularly investor, sentiment are at all-time lows. That said, I do think it is helpful to remember there are always silver linings in the storm clouds if you look hard enough.
Through all of the challenges we have faced, there are some positive underlying trends. In the United States, for example, institutional traders and credit market followers are just now showing increasing signs of confidence and are beginning to take on more risk. At the corporate level, earnings continue to be relatively strong as companies have reduced labor costs, controlled inventories, and relied less on debt to finance expansion. More broadly, low interest rates and strong demand for consumer goods and industrial equipment are good signs for the global economy.
While I do not mean to minimize the risks inherent in today’s markets, periods such as these allow the talented fund managers and research analysts we have at MFS® to test their convictions, reevaluate existing positions, and identify new investment ideas. Our investment process also includes a significant risk management component, with constant attention paid to monitoring market risk, so we can do our best to minimize any surprises to your portfolio.
For investors, this is a great time to check in with your advisor and make sure you have a sound investment plan in place — one that can keep your hard-earned money working over the long term through a strategy that involves asset allocation, diversification, and periodic portfolio rebalancing and reviews. A plan tailored to your distinct needs and goals continues to be the best approach to help you take advantage of the inevitable challenges — and opportunities — that present themselves over time.
Respectfully,

Robert J. Manning
Chief Executive Officer and Chief Investment Officer
MFS Investment Management®
August 15, 2008
The opinions expressed in this letter are subject to change, may not be relied upon for investment advice, and no forecasts can be guaranteed.
1
Table of Contents
Portfolio structure

| Top ten holdings | ||
| Danaher Corp. | 3.7% | |
| Merck & Co., Inc. | 3.1% | |
| Chevron Corp. | 2.3% | |
| Exxon Mobil Corp. | 2.1% | |
| AT&T, Inc. | 2.0% | |
| BHP Billiton PLC | 1.9% | |
| International Business Machines Corp. | 1.8% | |
| Schering-Plough Corp. | 1.8% | |
| Hess Corp. | 1.8% | |
| Procter & Gamble Co. | 1.6% |
| Equity sectors | ||
| Financial Services | 15.5% | |
| Energy | 14.8% | |
| Technology | 14.7% | |
| Health Care | 12.0% | |
| Industrial Goods & Services | 9.9% | |
| Utilities & Communications | 7.7% | |
| Consumer Staples | 7.3% | |
| Leisure | 5.0% | |
| Retailing | 4.8% | |
| Basic Materials | 4.1% | |
| Special Products & Services | 2.2% | |
| Autos & Housing | 0.8% |
Percentages are based on net assets as of 6/30/08.
The portfolio is actively managed and current holdings may be different.
2
Table of Contents
Fund Expenses Borne by the Contract Holders During the Period,
January 1, 2008 through June 30, 2008
As a contract holder of the fund, you incur ongoing costs, including management fees; distribution (12b-1) fees; and other fund expenses. This example is intended to help you understand your ongoing costs (in dollars) of investing in the fund and to compare these costs with the ongoing costs of investing in other mutual funds.
The example is based on an investment of $1,000 invested at the beginning of the period and held for the entire period January 1, 2008 through June 30, 2008.
Actual Expenses
The first line for each share class in the following table provides information about actual account values and actual expenses. You may use the information in this line, together with the amount you invested, to estimate the expenses that you paid over the period. Simply divide our account value by $1,000 (for example, an $8,600 account value divided by $1,000 = 8.6), then multiply the result by the number in the first line under the heading entitled “Expenses Paid During Period” to estimate the expenses you paid on your account during this period.
Hypothetical Example for Comparison Purposes
The second line for each share class in the following table provides information about hypothetical account values and hypothetical expenses based on the fund’s actual expense ratio and an assumed rate of return of 5% per year before expenses, which is not the fund’s actual return. The hypothetical account values and expenses may not be used to estimate the actual ending account balance or expenses you paid for the period. You may use this information to compare the ongoing costs of investing in the fund and other funds. To do so, compare this 5% hypothetical example with the 5% hypothetical examples that appear in the shareholder reports of the other funds.
Please note that the expenses shown in the table are meant to highlight the fund’s ongoing costs only and do not take into account the fees and expenses imposed under the variable contracts through which your investment in the fund is made. Therefore, the second line for each share class in the table is useful in comparing ongoing costs associated with an investment in vehicles (such as the fund) which fund benefits under variable annuity and variable life insurance contracts and to qualified pension and retirement plans only, and will not help you determine the relative total costs of investing in the fund through variable annuity and variable life insurance contracts. If the fees and expenses imposed under the variable contracts were included, your costs would have been higher.
| Share Class | Annualized Expense Ratio | Beginning Account Value 1/01/08 | Ending Account Value 6/30/08 | Expenses Paid During Period (p) 1/01/08-6/30/08 | ||||||
| Initial Class | Actual | 0.90% | $1,000.00 | $890.40 | $4.23 | |||||
| Hypothetical (h) | 0.90% | $1,000.00 | $1,020.39 | $4.52 | ||||||
| Service Class | Actual | 1.16% | $1,000.00 | $889.61 | $5.45 | |||||
| Hypothetical (h) | 1.16% | $1,000.00 | $1,019.10 | $5.82 |
| (h) | 5% class return per year before expenses. |
| (p) | Expenses paid is equal to each class’ annualized expense ratio, as shown above, multiplied by the average account value over the period, multiplied by the number of days in the period, divided by the number of days in the year. |
3
Table of Contents
PORTFOLIO OF INVESTMENTS – 6/30/08 (unaudited)
The Portfolio of Investments is a complete list of all securities owned by your fund. It is categorized by broad-based asset classes.
| Issuer | Shares/Par | Value ($) | |||
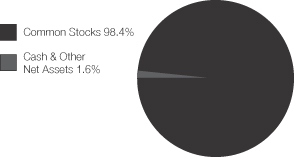
| COMMON STOCKS – 98.8% | |||||
| Aerospace – 2.4% | |||||
| Lockheed Martin Corp. | 8,400 | $ | 828,738 | ||
| Northrop Grumman Corp. | 7,060 | 472,314 | |||
| United Technologies Corp. | 16,540 | 1,020,518 | |||
| $ | 2,321,570 | ||||
| Apparel Manufacturers – 0.9% | |||||
| NIKE, Inc., “B” | 8,680 | $ | 517,415 | ||
| Quiksilver, Inc. (a) | 33,720 | 331,130 | |||
| $ | 848,545 | ||||
| Automotive – 0.3% | |||||
| Johnson Controls, Inc. (l) | 8,750 | $ | 250,950 | ||
| Biotechnology – 1.4% | |||||
| Genzyme Corp. (a) | 18,651 | $ | 1,343,245 | ||
| Broadcasting – 1.9% | |||||
| Omnicom Group, Inc. | 6,990 | $ | 313,711 | ||
| Viacom, Inc., “B” (a) | 21,490 | 656,305 | |||
| Walt Disney Co. | 26,710 | 833,352 | |||
| $ | 1,803,368 | ||||
| Brokerage & Asset Managers – 2.5% | |||||
| Affiliated Managers Group, Inc. (a)(l) | 2,150 | $ | 193,629 | ||
| Deutsche Boerse AG | 3,410 | 382,746 | |||
| Franklin Resources, Inc. | 1,900 | 174,135 | |||
| Goldman Sachs Group, Inc. | 4,520 | 790,548 | |||
| Invesco Ltd. (l) | 8,370 | 200,713 | |||
| Merrill Lynch & Co., Inc. | 11,360 | 360,226 | |||
| TD AMERITRADE Holding Corp. (a)(l) | 17,440 | 315,490 | |||
| $ | 2,417,487 | ||||
| Business Services – 1.7% | |||||
| Amdocs Ltd. (a) | 10,570 | $ | 310,969 | ||
| Fidelity National Information Services, Inc. | 12,460 | 459,899 | |||
| Satyam Computer Services Ltd., ADR (l) | 19,630 | 481,328 | |||
| Visa, Inc., “A” | 5,110 | 415,494 | |||
| $ | 1,667,690 | ||||
| Cable TV – 0.7% | |||||
| Comcast Corp., “Special A” | 20,090 | $ | 376,888 | ||
| Time Warner Cable, Inc. (a)(l) | 9,560 | 253,149 | |||
| $ | 630,037 | ||||
| Chemicals – 0.7% | |||||
| PPG Industries, Inc. (l) | 7,560 | $ | 433,717 | ||
| Rohm & Haas Co. (l) | 5,730 | 266,101 | |||
| $ | 699,818 | ||||
| Computer Software – 3.2% | |||||
| CommVault Systems, Inc. (a) | 7,850 | $ | 130,624 | ||
| MicroStrategy, Inc., “A” (a) | 13,690 | 886,428 | |||
| MSC Software Corp. (a)(l) | 74,451 | 817,472 | |||
| Oracle Corp. (a) | 43,070 | 904,470 | |||
| Salesforce.com, Inc. (a)(l) | 5,670 | 386,864 | |||
| $ | 3,125,858 | ||||
| Issuer | Shares/Par | Value ($) | |||
| COMMON STOCKS – continued | |||||
| Computer Software – Systems – 3.7% | |||||
| Apple, Inc. (a) | 8,960 | $ | 1,500,262 | ||
| EMC Corp. (a) | 22,740 | 334,051 | |||
| International Business Machines Corp. | 14,970 | 1,774,394 | |||
| $ | 3,608,707 | ||||
| Construction – 0.5% | |||||
| Pulte Homes, Inc. (l) | 29,690 | $ | 285,915 | ||
| Sherwin-Williams Co. (l) | 4,740 | 217,708 | |||
| $ | 503,623 | ||||
| Consumer Goods & Services – 2.8% | |||||
| Colgate-Palmolive Co. | 9,560 | $ | 660,596 | ||
| ITT Educational Services, Inc. (a)(l) | 1,880 | 155,344 | |||
| New Oriental Education & Technology Group, Inc., ADR (a)(l) | 3,870 | 226,085 | |||
| Procter & Gamble Co. | 24,900 | 1,514,169 | |||
| Strayer Education, Inc. (l) | 730 | 152,621 | |||
| $ | 2,708,815 | ||||
| Electrical Equipment – 4.0% | |||||
| Danaher Corp. (l) | 46,650 | $ | 3,606,045 | ||
| WESCO International, Inc. (a) | 7,140 | 285,886 | |||
| $ | 3,891,931 | ||||
| Electronics – 3.7% | |||||
| Applied Materials, Inc. | 13,800 | $ | 263,442 | ||
| Flextronics International Ltd. (a) | 44,271 | 416,147 | |||
| Hittite Microwave Corp. (a) | 8,830 | 314,525 | |||
| Intel Corp. | 51,910 | 1,115,027 | |||
| Intersil Corp., “A” | 8,040 | 195,533 | |||
| Marvell Technology Group Ltd. (a)(l) | 27,650 | 488,299 | |||
| National Semiconductor Corp. (l) | 10,630 | 218,340 | |||
| PLX Technology, Inc. (a)(l) | 12,520 | 95,528 | |||
| SanDisk Corp. (a) | 26,610 | 497,607 | |||
| $ | 3,604,448 | ||||
| Energy – Independent – 3.1% | |||||
| Apache Corp. | 9,510 | $ | 1,321,890 | ||
| Chesapeake Energy Corp. (l) | 6,450 | 425,442 | |||
| Peabody Energy Corp. (l) | 4,520 | 397,986 | |||
| XTO Energy, Inc. | 12,780 | 875,558 | |||
| $ | 3,020,876 | ||||
| Energy – Integrated – 7.8% | |||||
| Chevron Corp. | 22,720 | $ | 2,252,234 | ||
| Exxon Mobil Corp. | 23,590 | 2,078,987 | |||
| Hess Corp. | 13,550 | 1,709,875 | |||
| Marathon Oil Corp. | 28,920 | 1,500,080 | |||
| $ | 7,541,176 | ||||
| Engineering – Construction – 2.4% | |||||
| Fluor Corp. | 8,070 | $ | 1,501,666 | ||
| Foster Wheeler Ltd. (a) | 3,990 | 291,869 | |||
| North American Energy Partners, Inc. (a) | 26,530 | 575,170 | |||
| $ | 2,368,705 | ||||
4
Table of Contents
Portfolio of Investments (unaudited) – continued
| Issuer | Shares/Par | Value ($) | |||
| COMMON STOCKS – continued | |||||
| Food & Beverages – 3.3% | |||||
| Coca-Cola Co. | 9,140 | $ | 475,097 | ||
| General Mills, Inc. | 6,770 | 411,413 | |||
| Hain Celestial Group, Inc. (a)(l) | 13,860 | 325,433 | |||
| J.M. Smucker Co. | 3,500 | 142,240 | |||
| Kellogg Co. | 11,720 | 562,794 | |||
| PepsiCo, Inc. | 20,070 | 1,276,251 | |||
| $ | 3,193,228 | ||||
| Food & Drug Stores – 1.1% | |||||
| CVS Caremark Corp. | 27,960 | $ | 1,106,377 | ||
| Gaming & Lodging – 0.7% | |||||
| International Game Technology (l) | 13,100 | $ | 327,238 | ||
| Penn National Gaming, Inc. (a)(l) | 2,340 | 75,231 | |||
| Royal Caribbean Cruises Ltd. (l) | 9,570 | 215,038 | |||
| Wyndham Worldwide | 5,350 | 95,819 | |||
| $ | 713,326 | ||||
| General Merchandise – 0.9% | |||||
| 99 Cents Only Stores (a)(l) | 28,930 | $ | 190,938 | ||
| Kohl’s Corp. (a) | 13,010 | 520,920 | |||
| Stage Stores, Inc. (l) | 17,650 | 205,976 | |||
| $ | 917,834 | ||||
| Health Maintenance Organizations – 0.8% | |||||
| CIGNA Corp. | 15,860 | $ | 561,285 | ||
| WellPoint, Inc. (a) | 5,440 | 259,270 | |||
| $ | 820,555 | ||||
| Insurance – 4.0% | |||||
| Allied World Assurance Co. Holdings Ltd. | 14,340 | $ | 568,151 | ||
| Chubb Corp. | 26,620 | 1,304,646 | |||
| Genworth Financial, Inc., “A” | 16,740 | 298,139 | |||
| Hartford Financial Services Group, Inc. | 12,450 | 803,897 | |||
| MetLife, Inc. | 10,070 | 531,394 | |||
| Prudential Financial, Inc. | 5,970 | 356,648 | |||
| $ | 3,862,875 | ||||
| Internet – 1.4% | |||||
| Google, Inc., “A” (a) | 2,220 | $ | 1,168,652 | ||
| TechTarget, Inc. (a)(l) | 19,520 | 206,131 | |||
| $ | 1,374,783 | ||||
| Leisure & Toys – 0.7% | |||||
| Activision, Inc. (a) | 15,920 | $ | 542,394 | ||
| THQ, Inc. (a) | 9,000 | 182,340 | |||
| $ | 724,734 | ||||
| Machinery & Tools – 1.1% | |||||
| Bucyrus International, Inc., “A” | 6,160 | $ | 449,803 | ||
| Eaton Corp. | 2,040 | 173,339 | |||
| Timken Co. | 12,300 | 405,162 | |||
| $ | 1,028,304 | ||||
| Issuer | Shares/Par | Value ($) | |||
| COMMON STOCKS – continued | |||||
| Major Banks – 5.2% | |||||
| Bank of America Corp. | 47,226 | $ | 1,127,285 | ||
| Bank of New York Mellon Corp. | 19,668 | 744,040 | |||
| JPMorgan Chase & Co. | 35,820 | 1,228,984 | |||
| State Street Corp. | 12,920 | 826,751 | |||
| UnionBanCal Corp. (l) | 8,160 | 329,827 | |||
| Wells Fargo & Co. | 32,380 | 769,025 | |||
| $ | 5,025,912 | ||||
| Medical & Health Technology & Services – 0.5% | |||||
| DaVita, Inc. (a) | 820 | $ | 43,567 | ||
| IDEXX Laboratories, Inc. (a) | 2,010 | 97,967 | |||
| MWI Veterinary Supply, Inc. (a)(l) | 10,590 | 350,635 | |||
| $ | 492,169 | ||||
| Medical Equipment – 3.7% | |||||
| Advanced Medical Optics, Inc. (a)(l) | 27,760 | $ | 520,222 | ||
| Boston Scientific Corp. (a) | 87,050 | 1,069,845 | |||
| Conceptus, Inc. (a)(l) | 41,970 | 776,025 | |||
| Cooper Cos., Inc. (l) | 14,820 | 550,563 | |||
| NxStage Medical, Inc. (a)(l) | 81,340 | 312,346 | |||
| Zimmer Holdings, Inc. (a) | 4,870 | 331,404 | |||
| $ | 3,560,405 | ||||
| Metals & Mining – 1.9% | |||||
| BHP Billiton PLC | 46,870 | $ | 1,801,647 | ||
| Natural Gas – Distribution – 1.1% | |||||
| Equitable Resources, Inc. (l) | 30 | $ | 2,072 | ||
| Questar Corp. (l) | 9,820 | 697,613 | |||
| Sempra Energy | 7,190 | 405,876 | |||
| $ | 1,105,561 | ||||
| Network & Telecom – 2.2% | |||||
| Juniper Networks, Inc. (a) | 16,330 | $ | 362,199 | ||
| NICE Systems Ltd., ADR (a) | 15,110 | 446,803 | |||
| Polycom, Inc. (a)(l) | 12,720 | 309,859 | |||
| Research in Motion Ltd. (a) | 6,090 | 711,921 | |||
| Sonus Networks, Inc. (a)(l) | 89,610 | 306,466 | |||
| $ | 2,137,248 | ||||
| Oil Services – 3.9% | |||||
| Exterran Holdings, Inc. (a)(l) | 7,600 | $ | 543,324 | ||
| Halliburton Co. | 28,350 | 1,504,535 | |||
| National Oilwell Varco, Inc. (a) | 4,080 | 361,978 | |||
| Noble Corp. | 17,210 | 1,117,962 | |||
| TETRA Technologies, Inc. (a)(l) | 10,460 | 248,007 | |||
| $ | 3,775,806 | ||||
| Other Banks & Diversified Financials – 1.9% | |||||
| American Express Co. | 14,700 | $ | 553,749 | ||
| Euro Dekania Ltd. (a)(z) | 50,820 | 390,215 | |||
| Sovereign Bancorp, Inc. | 122,830 | 904,029 | |||
| $ | 1,847,993 | ||||
5
Table of Contents
Portfolio of Investments (unaudited) – continued
| Issuer | Shares/Par | Value ($) | |||
| COMMON STOCKS – continued | |||||
| Personal Computers & Peripherals – 0.5% | |||||
| NetApp, Inc. (a)(l) | 23,453 | $ | 507,992 | ||
| Pharmaceuticals – 5.6% | |||||
| Abbott Laboratories | 6,100 | $ | 323,117 | ||
| Merck & Co., Inc. | 81,030 | 3,054,021 | |||
| Schering-Plough Corp. | 88,020 | 1,733,114 | |||
| Warner Chilcott Ltd., “A” (a)(l) | 19,650 | 333,068 | |||
| $ | 5,443,320 | ||||
| Real Estate – 1.9% | |||||
| Apartment Investment & Management, “A”, REIT | 14,630 | $ | 498,298 | ||
| Mack-Cali Realty Corp., REIT | 38,470 | 1,314,520 | |||
| $ | 1,812,818 | ||||
| Restaurants – 1.0% | |||||
| Panera Bread Co., “A” (a)(l) | 5,710 | $ | 264,145 | ||
| Peet’s Coffee & Tea, Inc. (a)(l) | 10,950 | 217,029 | |||
| Red Robin Gourmet Burgers, Inc. (a)(l) | 8,500 | 235,790 | |||
| Texas Roadhouse, Inc., “A” (a)(l) | 25,700 | 230,529 | |||
| $ | 947,493 | ||||
| Specialty Chemicals – 1.5% | |||||
| Airgas, Inc. | 18,670 | $ | 1,090,141 | ||
| Praxair, Inc. | 3,690 | 347,746 | |||
| $ | 1,437,887 | ||||
| Specialty Stores – 1.9% | |||||
| AnnTaylor Stores Corp. (a)(l) | 13,420 | $ | 321,543 | ||
| Dick’s Sporting Goods, Inc. (a)(l) | 44,460 | 788,720 | |||
| Ethan Allen Interiors, Inc. (l) | 7,170 | 176,382 | |||
| Nordstrom, Inc. (l) | 14,040 | 425,412 | |||
| Pier 1 Imports, Inc. (a)(l) | 43,200 | 148,608 | |||
| $ | 1,860,665 | ||||
| Telecommunications – Wireless – 0.5% | |||||
| Rogers Communications, Inc., “B” | 12,720 | $ | 494,476 | ||
| Issuer | Shares/Par | Value ($) | ||||
| COMMON STOCKS – continued | ||||||
| Telephone Services – 2.5% | ||||||
| AT&T, Inc. | 57,300 | $ | 1,930,437 | |||
| Embarq Corp. | 6,600 | 311,982 | ||||
| Verizon Communications, Inc. | 5,290 | 187,266 | ||||
| $ | 2,429,685 | |||||
| Tobacco – 1.7% | ||||||
| Lorillard, Inc. (a) | 7,770 | $ | 537,373 | |||
| Philip Morris International, Inc. | 23,400 | 1,155,726 | ||||
| $ | 1,693,099 | |||||
| Utilities – Electric Power – 3.6% | ||||||
| American Electric Power Co., Inc. | 14,940 | $ | 601,036 | |||
| Exelon Corp. | 5,500 | 494,780 | ||||
| FirstEnergy Corp. | 6,400 | 526,912 | ||||
| NRG Energy, Inc. (a)(l) | 16,860 | 723,294 | ||||
| PPL Corp. | 11,210 | 585,947 | ||||
| Public Service Enterprise Group, Inc. (l) | 13,170 | 604,898 | ||||
| $ | 3,536,867 | |||||
| Total Common Stocks (Identified Cost, $103,692,464) | $ | 96,009,908 | ||||
| SHORT-TERM OBLIGATIONS – 0.5% | ||||||
| Toyota Motor Credit Corp., 2.57%, due 7/01/08, at Amortized Cost and Value (y) | $495,000 | $ | 495,000 | |||
| COLLATERAL FOR SECURITIES LOANED – 16.4% | ||||||
| Navigator Securities Lending Prime Portfolio, at Cost and Net Asset Value | 15,894,037 | $ | 15,894,037 | |||
| Total Investments (Identified Cost, $120,081,501) | $ | 112,398,945 | ||||
| OTHER ASSETS, LESS LIABILITIES – (15.7)% | (15,253,908 | ) | ||||
| Net Assets – 100.0% | $ | 97,145,037 | ||||
| (a) | Non-income producing security. |
| (l) | All or a portion of this security is on loan. |
| (y) | The rate shown represents an annualized yield at time of purchase. |
| (z) | Restricted securities are not registered under the Securities Act of 1933 and are subject to legal restrictions on resale. These securities generally may be resold in transactions exempt from registration or to the public if the securities are subsequently registered. Disposal of these securities may involve time-consuming negotiations and prompt sale at an acceptable price may be difficult. The fund holds the following restricted securities: |
| Restricted Securities | Acquisition Date | Cost | Current Market Value | |||
| Euro Dekania Ltd. | 6/25/07 | $737,167 | $390,215 | |||
| % of Net Assets | 0.4% |
The following abbreviations are used in this report and are defined:
| ADR | American Depository Receipt |
| REIT | Real Estate Investment Trust |
See Notes to Financial Statements
6
Table of Contents
FINANCIAL STATEMENTS | STATEMENT OF ASSETS AND LIABILITIES (unaudited)
This statement represents your fund’s balance sheet, which details the assets and liabilities comprising the total value of the fund.
At 6/30/08 | |||||
Assets | |||||
Investments, at value, including $15,725,671 of securities on loan (identified cost, $120,081,501) | $112,398,945 | ||||
Cash | 995 | ||||
Receivable for investments sold | 2,309,015 | ||||
Receivable for fund shares sold | 28,314 | ||||
Interest and dividends receivable | 131,586 | ||||
Receivable from investment adviser | 2,801 | ||||
Other assets | 153,356 | ||||
Total assets | $115,025,012 | ||||
Liabilities | |||||
Payable for investments purchased | $1,697,231 | ||||
Payable for fund shares reacquired | 193,484 | ||||
Collateral for securities loaned, at value (c) | 15,894,037 | ||||
Payable to affiliates | |||||
Management fee | 8,031 | ||||
Distribution fees | 225 | ||||
Administrative services fee | 255 | ||||
Payable for independent trustees’ compensation | 348 | ||||
Accrued expenses and other liabilities | 86,364 | ||||
Total liabilities | $17,879,975 | ||||
Net assets | $97,145,037 | ||||
Net assets consist of | |||||
Paid-in capital | $133,452,965 | ||||
Unrealized appreciation (depreciation) on investments and translation of assets and liabilities in foreign currencies | (7,678,051 | ) | |||
Accumulated net realized gain (loss) on investments and foreign currency transactions | (29,147,065 | ) | |||
Undistributed net investment income | 517,188 | ||||
Net assets | $97,145,037 | ||||
Shares of beneficial interest outstanding | 6,396,875 | ||||
Initial Class shares | |||||
Net assets | $88,958,372 | ||||
Shares outstanding | 5,855,736 | ||||
Net asset value per share | $15.19 | ||||
Service Class shares | |||||
Net assets | $8,186,665 | ||||
Shares outstanding | 541,139 | ||||
Net asset value per share | $15.13 |
| (c) | Non-cash collateral is not included. |
See Notes to Financial Statements
7
Table of Contents
FINANCIAL STATEMENTS | STATEMENT OF OPERATIONS (unaudited)
This statement describes how much your fund earned in investment income and accrued in expenses. It also describes any gains and/or losses generated by fund operations.
Six months ended 6/30/08 | ||||||
| Net investment income | ||||||
Income | ||||||
Dividends | $913,374 | |||||
Income on securities loaned | 88,466 | |||||
Interest | 9,069 | |||||
Foreign taxes withheld | (2,816 | ) | ||||
Total investment income | $1,008,093 | |||||
Expenses | ||||||
Management fee | $397,950 | |||||
Distribution fees | 10,878 | |||||
Shareholder servicing costs | 9,643 | |||||
Administrative services fee | 12,148 | |||||
Independent trustees’ compensation | 3,086 | |||||
Custodian fee | 18,895 | |||||
Shareholder communications | 23,471 | |||||
Auditing fees | 23,288 | |||||
Legal fees | 956 | |||||
Miscellaneous | 7,727 | |||||
Total expenses | $508,042 | |||||
Reduction of expenses by investment adviser | (17,614 | ) | ||||
Net expenses | $490,428 | |||||
Net investment income | $517,665 | |||||
Realized and unrealized gain (loss) on investments | ||||||
Realized gain (loss) (identified cost basis) | ||||||
Investment transactions | $(2,355,786 | ) | ||||
Foreign currency transactions | (1,072 | ) | ||||
Net realized gain (loss) on investments and foreign currency transactions | $(2,356,858 | ) | ||||
Change in unrealized appreciation (depreciation) | ||||||
Investments | $(11,197,796 | ) | ||||
Translation of assets and liabilities in foreign currencies | 2,910 | |||||
Net unrealized gain (loss) on investments and foreign currency translation | $(11,194,886 | ) | ||||
Net realized and unrealized gain (loss) on investments and foreign currency | $(13,551,744 | ) | ||||
Change in net assets from operations | $(13,034,079 | ) |
See Notes to Financial Statements
8
Table of Contents
FINANCIAL STATEMENTS | STATEMENTS OF CHANGES IN NET ASSETS
These statements describe the increases and/or decreases in net assets resulting from operations, any distributions, and any shareholder transactions.
| Six months ended 6/30/08 | | Year ended 12/31/07 | | |||
| (unaudited) | ||||||
Change in net assets | ||||||
From operations | ||||||
Net investment income | $517,665 | $697,413 | ||||
Net realized gain (loss) on investments and foreign currency transactions | (2,356,858 | ) | 20,287,523 | |||
Net unrealized gain (loss) on investments and foreign currency translation | (11,194,886 | ) | (5,425,465 | ) | ||
Change in net assets from operations | $(13,034,079 | ) | $15,559,471 | |||
Distributions declared to shareholders | ||||||
From net investment income | ||||||
Initial Class | $(673,155 | ) | $(450,027 | ) | ||
Service Class | (31,987 | ) | (13,403 | ) | ||
Total distributions declared to shareholders | $(705,142 | ) | $(463,430 | ) | ||
Change in net assets from fund share transactions | $(13,654,723 | ) | $(36,556,236 | ) | ||
Total change in net assets | $(27,393,944 | ) | $(21,460,195 | ) | ||
Net assets | ||||||
At beginning of period | 124,538,981 | 145,999,176 | ||||
At end of period (including undistributed net investment income of $517,188 and | $97,145,037 | $124,538,981 |
See Notes to Financial Statements
9
Table of Contents
FINANCIAL STATEMENTS | FINANCIAL HIGHLIGHTS
The financial highlights table is intended to help you understand the fund’s financial performance for the semiannual period and the past 5 fiscal years. Certain information reflects financial results for a single fund share. The total returns in the table represent the rate by which an investor would have earned (or lost) on an investment in the fund share class (assuming reinvestment of all distributions) held for the entire period.
| Initial Class | Six months (unaudited) | Years ended 12/31 | ||||||||||||||||
| 2007 | 2006 | 2005 | 2004 | 2003 | ||||||||||||||
Net asset value, beginning of period | $17.18 | $15.51 | $13.69 | $13.57 | $12.11 | $9.53 | ||||||||||||
Income (loss) from investment operations | ||||||||||||||||||
Net investment income (d) | $0.08 | $0.09 | $0.05 | $0.06 | $0.09 | $0.05 | ||||||||||||
Net realized and unrealized gain (loss) on | (1.96 | ) | 1.64 | 1.83 | 0.16 | 1.41 | 2.55 | |||||||||||
Total from investment operations | $(1.88 | ) | $1.73 | $1.88 | $0.22 | $1.50 | $2.60 | |||||||||||
Less distributions declared to shareholders | ||||||||||||||||||
From net investment income | $(0.11 | ) | $(0.06 | ) | $(0.06 | ) | $(0.10 | ) | $(0.04 | ) | $(0.02 | ) | ||||||
Net asset value, end of period | $15.19 | $17.18 | $15.51 | $13.69 | $13.57 | $12.11 | ||||||||||||
Total return (%) (k)(r)(s) | (10.96 | )(n) | 11.15 | 13.80 | 1.69 | 12.46 | (b) | 27.39 | ||||||||||
| Ratios (%) (to average net assets) and Supplemental data: | ||||||||||||||||||
Expenses before expense reductions (f) | 0.94 | (a) | 1.03 | 0.92 | 0.98 | 0.88 | 0.94 | |||||||||||
Expenses after expense reductions (f) | 0.90 | (a) | 0.90 | 0.90 | 0.90 | 0.90 | (e) | 0.90 | ||||||||||
Net investment income | 1.00 | (a) | 0.53 | 0.35 | 0.42 | 0.74 | 0.45 | |||||||||||
Portfolio turnover | 56 | 151 | 89 | 93 | 76 | 65 | ||||||||||||
Net assets at end of period (000 Omitted) | $88,958 | $115,251 | $131,259 | $137,244 | $158,082 | $150,436 | ||||||||||||
See Notes to Financial Statements
10
Table of Contents
Financial Highlights – continued
| Service Class | Six months (unaudited) | Years ended 12/31 | |||||||||||||||
| 2007 | 2006 | 2005 | 2004 | 2003 | |||||||||||||
Net asset value, beginning of period | $17.07 | $15.41 | $13.60 | $13.48 | $12.05 | $9.48 | |||||||||||
Income (loss) from investment operations | |||||||||||||||||
Net investment income (d) | $0.06 | $0.04 | $0.01 | $0.02 | $0.07 | $0.02 | |||||||||||
Net realized and unrealized gain (loss) on | (1.94 | ) | 1.63 | 1.82 | 0.17 | 1.38 | 2.55 | ||||||||||
Total from investment operations | $(1.88 | ) | $1.67 | $1.83 | $0.19 | $1.45 | $2.57 | ||||||||||
Less distributions declared to shareholders | |||||||||||||||||
From net investment income | $(0.06 | ) | $(0.01 | ) | $(0.02 | ) | $(0.07 | ) | $(0.02 | ) | $— | ||||||
Net asset value, end of period | $15.13 | $17.07 | $15.41 | $13.60 | $13.48 | $12.05 | |||||||||||
Total return (%) (k)(r)(s) | (11.04 | )(n) | 10.87 | 13.50 | 1.46 | 12.09 | (b) | 27.11 | |||||||||
| Ratios (%) (to average net assets) and Supplemental data: | |||||||||||||||||
Expenses before expense reductions (f) | 1.19 | (a) | 1.27 | 1.17 | 1.23 | 1.13 | 1.19 | ||||||||||
Expenses after expense reductions (f) | 1.16 | (a) | 1.15 | 1.15 | 1.15 | 1.15 | (e) | 1.15 | |||||||||
Net investment income | 0.74 | (a) | 0.25 | 0.10 | 0.17 | 0.54 | 0.20 | ||||||||||
Portfolio turnover | 56 | 151 | 89 | 93 | 76 | 65 | |||||||||||
Net assets at end of period (000 Omitted) | $8,187 | $9,288 | $14,740 | $15,823 | $18,372 | $12,214 | |||||||||||
| (a) | Annualized. |
| (b) | The fund’s net asset value and total return calculation include a non-recurring accrual recorded as a result of an administrative proceeding regarding disclosure of brokerage allocation practices in connection with fund sales. The non-recurring accrual did not have a material impact on the net asset value per share based on the shares outstanding on the day the proceeds were recorded. |
| (d) | Per share data are based on average shares outstanding. |
| (e) | Ratio includes a reimbursement fee for expenses borne by MFS in prior years under the then existing expense reimbursement agreement. |
| (f) | Ratios do not reflect reductions from fees paid indirectly, if applicable. |
| (k) | The total return does not reflect expenses that apply to separate accounts. Inclusion of these charges would reduce the total return figures for all periods shown. |
| (n) | Not annualized. |
| (r) | Certain expenses have been reduced without which performance would have been lower. |
| (s) | From time to time the fund may receive proceeds from litigation settlements, without which performance would be lower. |
See Notes to Financial Statements
11
Table of Contents
NOTES TO FINANCIAL STATEMENTS (unaudited)
| (1) | Business and Organization |
MFS Core Equity Series (the fund) is a series of MFS Variable Insurance Trust (the trust). The trust is organized as a Massachusetts business trust and is registered under the Investment Company Act of 1940, as amended, as an open-end management investment company. The shareholders of each series of the trust are separate accounts of insurance companies, which offer variable annuity and/or life insurance products, and qualified retirement and pension plans.
| (2) | Significant Accounting Policies |
General – The preparation of financial statements in conformity with U.S. generally accepted accounting principles requires management to make estimates and assumptions that affect the reported amounts of assets and liabilities, and disclosure of contingent assets and liabilities at the date of the financial statements and the reported amounts of revenues and expenses during the reporting period. Actual results could differ from those estimates. The fund can invest in foreign securities, including securities of emerging market issuers. Investments in foreign securities are vulnerable to the effects of changes in the relative values of the local currency and the U.S. dollar and to the effects of changes in each country’s legal, political, and economic environment. The markets of emerging markets countries are generally more volatile than the markets of developed countries with more mature economies. All of the risks of investing in foreign securities previously described are heightened when investing in emerging markets countries.
In March 2008, FASB Statement No. 161, Disclosures about Derivative Instruments and Hedging Activities (the “Standard”) was issued, and is effective for financial statements issued for fiscal years and interim periods beginning after November 15, 2008. This Standard provides enhanced disclosures about the fund’s use of and accounting for derivative instruments and the effect of derivative instruments on the fund’s results of operations and financial position. Management is evaluating the application of the Standard to the fund, and has not at this time determined the impact, if any, resulting from the adoption of this Standard on the fund’s financial statements.
Investment Valuations – Equity securities, including restricted equity securities, are generally valued at the last sale or official closing price as reported by an independent pricing service on the market or exchange on which they are primarily traded. For securities for which there were no sales reported that day, equity securities are generally valued at the last quoted daily bid quotation as reported by an independent pricing service on the market or exchange on which they are primarily traded. For securities held short for which there were no sales reported for the day, the position is generally valued at the last quoted daily ask quotation as reported by an independent pricing service on the market or exchange on which such securities are primarily traded. Short-term instruments with a maturity at issuance of 60 days or less may be valued at amortized cost, which approximates market value. Open-end investment companies are generally valued at net asset value per share. Securities and other assets generally valued on the basis of information from an independent pricing service may also be valued at a broker-dealer bid quotation. The values of foreign securities and other assets and liabilities expressed in foreign currencies are converted to U.S. dollars using the mean of bid and asked prices for rates reported by an independent pricing service.
The Board of Trustees has delegated primary responsibility for determining or causing to be determined the value of the fund’s investments (including any fair valuation) to the adviser pursuant to valuation policies and procedures approved by the Board. If the adviser determines that reliable market quotations are not readily available, investments are valued at fair value as determined in good faith by the adviser in accordance with such procedures under the oversight of the Board of Trustees. Under the fund’s valuation policies and procedures, market quotations are not considered to be readily available for most types of debt instruments and floating rate loans and many types of derivatives. These investments are generally valued at fair value based on information from independent pricing services. In addition, investments may be valued at fair value if the adviser determines that an investment’s value has been materially affected by events occurring after the close of the exchange or market on which the investment is principally traded (such as foreign exchange or market) and prior to the determination of the fund’s net asset value, or after the halting of trading of a specific security where trading does not resume prior to the close of the exchange or market on which the security is principally traded. Events that occur on a frequent basis after foreign markets close (such as developments in foreign markets and significant movements in the U.S. markets) and prior to the determination of the fund’s net asset value may be deemed to have a material affect on the value of securities traded in foreign markets. Accordingly, the fund’s foreign equity securities may often be valued at fair value. The adviser may rely on independent pricing services or other information (such as the correlation with price movements of similar securities in the same or other markets; the type, cost and investment characteristics of the security; the business and financial condition of the issuer; and trading and other market data) to assist in determining whether to fair value and at what value to fair value an investment. The value of an investment for purposes of calculating the fund’s net asset value can differ depending on the source and method used to determine value. When fair valuation is used, the value of investments used to determine the fund’s net asset value may differ from quoted or published prices for the same investments.
12
Table of Contents
Notes to Financial Statements (unaudited) – continued
The fund adopted FASB Statement No. 157, Fair Value Measurements (the “Statement”) in this reporting period. This Statement provides a single definition of fair value, a hierarchy for measuring fair value and expanded disclosures about fair value measurements.
Various inputs are used in determining the value of the fund’s assets or liabilities carried at market value. These inputs are categorized into three broad levels. Level 1 includes quoted prices in active markets for identical assets or liabilities. Level 2 includes other significant observable market-based inputs (including quoted prices for similar securities, interest rates, prepayment speed, and credit risk). Level 3 includes unobservable inputs, which may include the adviser’s own assumptions in determining the fair value of investments. Other financial instruments are derivative instruments not reflected in total investments, such as futures, forwards, swap contracts and written options, which are valued at the unrealized appreciation/depreciation on the instrument. The following is a summary of the levels used as of June 30, 2008 in valuing the fund’s assets or liabilities carried at market value:
| Level 1 | Level 2 | Level 3 | Total | |||||
| Investments in Securities | $93,435,300 | $18,573,430 | $390,215 | $112,398,945 | ||||
| Other Financial Instruments | $— | $— | $— | $— |
Following is a reconciliation of Level 3 assets for which significant unobservable inputs were used to determine fair value. The table presents the activity of Level 3 securities held at the beginning and the end of the period.
| Investments in Securities | Other Financial Instruments | ||||
| Balance as of 12/31/07 | $702,148 | $— | |||
Accrued discounts/premiums | — | — | |||
Realized gain (loss) | — | — | |||
Change in unrealized appreciation (depreciation) | (311,933 | ) | — | ||
Net purchases (sales) | — | — | |||
Transfers in and/or out of Level 3 | — | — | |||
| Balance as of 6/30/08 | $390,215 | $— |
Repurchase Agreements – The fund may enter into repurchase agreements with institutions that the fund’s investment adviser has determined are creditworthy. Each repurchase agreement is recorded at cost. The fund requires that the securities collateral in a repurchase transaction be transferred to a custodian in a manner sufficient to enable the fund to obtain those securities in the event of a default under the repurchase agreement. The fund monitors, on a daily basis, the value of the collateral to ensure that its value, including accrued interest, is greater than amounts owed to the fund under each such repurchase agreement. The fund and other funds managed by Massachusetts Financial Services Company (MFS), may utilize a joint trading account for the purpose of entering into one or more repurchase agreements.
Foreign Currency Translation – Purchases and sales of foreign investments, income, and expenses are converted into U.S. dollars based upon currency exchange rates prevailing on the respective dates of such transactions. Gains and losses attributable to foreign currency exchange rates on sales of securities are recorded for financial statement purposes as net realized gains and losses on investments. Gains and losses attributable to foreign exchange rate movements on income and expenses are recorded for financial statement purposes as foreign currency transaction gains and losses. That portion of both realized and unrealized gains and losses on investments that results from fluctuations in foreign currency exchange rates is not separately disclosed.
Security Loans – State Street Bank and Trust Company (“State Street”), as lending agent, may loan the securities of the fund to certain qualified institutions (the “Borrowers”) approved by the fund. The loans are collateralized at all times by cash and/or U.S. Treasury and federal agency obligations in an amount at least equal to the market value of the securities loaned. State Street provides the fund with indemnification against Borrower default. The fund bears the risk of loss with respect to the investment of cash collateral. On loans collateralized by cash, the cash collateral is invested in a money market fund or short-term securities. A portion of the income generated upon investment of the collateral is remitted to the Borrowers, and the remainder is allocated between the fund and the lending agent. On loans collateralized by U.S. Treasury and/or federal agency obligations, a fee is received from the Borrower, and is allocated between the fund and the lending agent. Net income from securities lending is separately reported on the Statement of Operations. The dividend and interest income earned on the securities loaned is accounted for in the same manner as other dividend and interest income.
At June 30, 2008, the value of securities loaned was $15,725,671. These loans were collateralized by cash of $15,894,037 and U.S. Treasury obligations of $242,968.
Indemnifications – Under the fund’s organizational documents, its officers and trustees may be indemnified against certain liabilities and expenses arising out of the performance of their duties to the fund. Additionally, in the normal course of
13
Table of Contents
Notes to Financial Statements (unaudited) – continued
business, the fund enters into agreements with service providers that may contain indemnification clauses. The fund’s maximum exposure under these agreements is unknown as this would involve future claims that may be made against the fund that have not yet occurred.
Investment Transactions and Income – Investment transactions are recorded on the trade date. Interest income is recorded on the accrual basis. All premium and discount is amortized or accreted for financial statement purposes in accordance with U.S. generally accepted accounting principles. Dividends received in cash are recorded on the ex-dividend date. Certain dividends from foreign securities will be recorded when the fund is informed of the dividend if such information is obtained subsequent to the ex-dividend date. Dividend and interest payments received in additional securities are recorded on the ex-dividend or ex-interest date in an amount equal to the value of the security on such date.
The fund may receive proceeds from litigation settlements. Any proceeds received from litigation involving portfolio holdings are reflected in the Statement of Operations in realized gain/loss if the security has been disposed of by the fund or in unrealized gain/loss if the security is still held by the fund. Any other proceeds from litigation not related to portfolio holdings are reflected as other income in the Statement of Operations.
Fees Paid Indirectly – The fund’s custody fee may be reduced according to an arrangement that measures the value of cash deposited with the custodian by the fund. For the six months ended June 30, 2008, custody fees were not reduced.
Tax Matters and Distributions – The fund intends to qualify as a regulated investment company, as defined under Subchapter M of the Internal Revenue Code, and to distribute all of its taxable income, including realized capital gains. As a result, no provision for federal income tax is required. The fund adopted the provisions of FASB Interpretation No. 48, Accounting for Uncertainty in Income Taxes (“the Interpretation”). The Interpretation prescribes a minimum threshold for financial statement recognition of the benefit of a tax position taken or expected to be taken in a tax return. There was no impact resulting from the adoption of this Interpretation on the fund’s financial statements. Each of the fund’s federal tax returns for the prior three fiscal years remains subject to examination by the Internal Revenue Service. It is the fund’s policy to record interest and penalty charges on underpaid taxes associated with its tax positions as interest expense and miscellaneous expense, respectively. No such charges were recorded in the current financial statements. Foreign taxes, if any, have been accrued by the fund in the accompanying financial statements.
Distributions to shareholders are recorded on the ex-dividend date. Income and capital gain distributions are determined in accordance with income tax regulations, which may differ from U.S. generally accepted accounting principles. Certain capital accounts in the financial statements are periodically adjusted for permanent differences in order to reflect their tax character. These adjustments have no impact on net assets or net asset value per share. Temporary differences which arise from recognizing certain items of income, expense, gain or loss in different periods for financial statement and tax purposes will reverse at some time in the future. Distributions in excess of net investment income or net realized gains are temporary overdistributions for financial statement purposes resulting from differences in the recognition or classification of income or distributions for financial statement and tax purposes.
Book/tax differences primarily relate to wash sale loss deferrals.
The tax character of distributions made during the current period will be determined at fiscal year end. The tax character of distributions declared to shareholders is as follows:
| 12/31/07 | ||
| Ordinary income (including any short-term capital gains) | $463,430 |
The federal tax cost and the tax basis components of distributable earnings were as follows:
| As of 6/30/08 | |||
| Cost of investments | $120,163,589 | ||
| Gross appreciation | 6,208,890 | ||
| Gross depreciation | (13,973,534 | ) | |
| Net unrealized appreciation (depreciation) | $(7,764,644 | ) | |
| As of 12/31/07 | |||
| Undistributed ordinary income | $704,665 | ||
| Capital loss carryforwards | (26,693,718 | ) | |
| Other temporary differences | (16,391 | ) | |
| Net unrealized appreciation (depreciation) | 3,436,737 | ||
The aggregate cost above includes prior fiscal year end tax adjustments.
14
Table of Contents
Notes to Financial Statements (unaudited) – continued
As of December 31, 2007, the fund had capital loss carryforwards available to offset future realized gains. Such losses expire as follows:
| 12/31/10 | $(26,693,718 | ) |
Multiple Classes of Shares of Beneficial Interest – The fund offers multiple classes of shares, which differ in their respective distribution fees. The fund’s income, realized and unrealized gain (loss), and common expenses are allocated to shareholders based on the daily net assets of each class, without distinction between share classes. Dividends are declared separately for each class. Differences in per share dividend rates are generally due to differences in separate class expenses.
| (3) | Transactions with Affiliates |
Investment Adviser – The fund has an investment advisory agreement with MFS to provide overall investment management and related administrative services and facilities to the fund. The management fee is computed daily and paid monthly at an annual rate of 0.75% of the fund’s average daily net assets. The investment adviser has agreed in writing to reduce its management fee to 0.65% of average daily net assets in excess of $1.0 billion. This written agreement may be rescinded only upon consent of the fund’s Board of Trustees. For the six months ended June 30, 2008, the fund’s average daily net assets did not exceed $1.0 billion and therefore, the management fee was not reduced. The management fee incurred for the six months ended June 30, 2008 was equivalent to an annual effective rate of 0.75% of the fund’s average daily net assets.
The investment adviser has agreed in writing to pay a portion of the fund’s operating expenses, exclusive of management, distribution and certain other fees and expenses, such that operating expenses do not exceed 0.15% annually of the fund’s average daily net assets. This written agreement will continue through April 30, 2009 unless changed or rescinded by the fund’s Board of Trustees. For the six months ended June 30, 2008, this reduction amounted to $17,301 and is reflected as a reduction of total expenses in the Statement of Operations.
Distributor – MFS Fund Distributors, Inc. (MFD), a wholly-owned subsidiary of MFS, is the distributor of shares of the fund. The Trustees have adopted a distribution plan for the Service Class shares pursuant to Rule 12b-1 under the Investment Company Act of 1940.
The fund’s distribution plan provides that the fund will pay MFD distribution fees equal to 0.25% per annum of its average daily net assets attributable to Service Class shares as partial consideration for services performed and expenses incurred by MFD and financial intermediaries (including participating insurance companies that invest in the fund to fund variable annuity and variable life insurance contracts, sponsors of qualified retirement and pension plans that invest in the fund, and affiliates of these participating insurance companies and plan sponsors) in connection with the sale and distribution of the Service Class shares. MFD may subsequently pay all, or a portion, of the distribution fees to financial intermediaries.
Shareholder Servicing Agent – MFS Service Center, Inc. (MFSC), a wholly-owned subsidiary of MFS, receives a fee from the fund for its services as shareholder servicing agent. For the six months ended June 30, 2008, the fee was $9,643, which equated to 0.0182% annually of the fund’s average daily net assets. MFSC also receives payment from the fund for out-of-pocket expenses paid by MFSC on behalf of the fund. For the six months ended June 30, 2008, the fund did not incur any out-of-pocket expenses.
Administrator – MFS provides certain financial, legal, shareholder communications, compliance, and other administrative services to the fund. Under an administrative services agreement, the fund partially reimburses MFS the costs incurred to provide these services. The fund is charged a fixed amount plus a fee based on average daily net assets. The fund’s annual fixed amount is $17,500.
The administrative services fee incurred for the six months ended June 30, 2008 was equivalent to an annual effective rate of 0.0229% of the fund’s average daily net assets.
Trustees’ and Officers’ Compensation – The fund pays compensation to independent trustees in the form of a retainer, attendance fees, and additional compensation to Board and Committee chairpersons. The fund does not pay compensation directly to trustees or officers of the fund who are also officers of the investment adviser, all of whom receive remuneration for their services to the fund from MFS. Certain officers and trustees of the fund are officers or directors of MFS, MFD, and MFSC.
Other – This fund and certain other MFS funds (the funds) have entered into a services agreement (the Agreement) which provides for payment of fees by the funds to Tarantino LLC in return for the provision of services of an Independent Chief Compliance Officer (ICCO) for the funds. The ICCO is an officer of the funds and the sole member of Tarantino LLC. The funds can terminate the Agreement with Tarantino LLC at any time under the terms of the Agreement. For the six months ended June 30, 2008, the fee paid by the fund to Tarantino LLC was $318 and is included in miscellaneous expense on the Statement of Operations. MFS has agreed to reimburse the fund for a portion of the payments made by the fund to Tarantino LLC in the amount of $313, which is shown as a reduction of total expenses in the Statement of Operations. Additionally, MFS has agreed to bear all expenses associated with office space, other administrative support, and supplies provided to the ICCO.
15
Table of Contents
Notes to Financial Statements (unaudited) – continued
| (4) | Portfolio Securities |
Purchases and sales of investments, other than U.S. Government securities, purchased option transactions, and short-term obligations, aggregated $59,068,396 and $72,928,336, respectively.
| (5) | Shares of Beneficial Interest |
The fund’s Declaration of Trust permits the Trustees to issue an unlimited number of full and fractional shares of beneficial interest. Transactions in fund shares were as follows:
| Six months ended 6/30/08 | Year ended 12/31/07 | |||||||||||
| Shares | Amount | Shares | Amount | |||||||||
| Shares sold | ||||||||||||
Initial Class | 92,826 | $1,470,328 | 382,960 | $6,437,043 | ||||||||
Service Class | 68,132 | 1,070,552 | 112,846 | 1,897,750 | ||||||||
| 160,958 | $2,540,880 | 495,806 | $8,334,793 | |||||||||
| Shares issued to shareholders in reinvestment of distributions | ||||||||||||
Initial Class | 42,740 | $673,155 | 27,424 | $450,027 | ||||||||
Service Class | 2,039 | 31,987 | 820 | 13,403 | ||||||||
| 44,779 | $705,142 | 28,244 | $463,430 | |||||||||
| Shares reacquired | ||||||||||||
Initial Class | (988,056 | ) | $(15,748,952 | ) | (2,164,898 | ) | $(36,480,721 | ) | ||||
Service Class | (73,019 | ) | (1,151,793 | ) | (525,947 | ) | (8,873,738 | ) | ||||
| (1,061,075 | ) | $(16,900,745 | ) | (2,690,845 | ) | $(45,354,459 | ) | |||||
| Net change | ||||||||||||
Initial Class | (852,490 | ) | $(13,605,469 | ) | (1,754,514 | ) | $(29,593,651 | ) | ||||
Service Class | (2,848 | ) | (49,254 | ) | (412,281 | ) | (6,962,585 | ) | ||||
| (855,338 | ) | $(13,654,723 | ) | (2,166,795 | ) | $(36,556,236 | ) | |||||
| (6) | Line of Credit |
The fund and other funds managed by MFS participate in a $1 billion unsecured committed line of credit provided by a syndication of banks under a credit agreement. In addition, the fund and other funds managed by MFS have established uncommitted borrowing arrangements with certain banks. Borrowings may be made for temporary financing needs. Interest is charged to each fund, based on its borrowings, generally at a rate equal to the Federal Reserve funds rate plus 0.30%. In addition, a commitment fee, based on the average daily, unused portion of the committed line of credit, is allocated among the participating funds at the end of each calendar quarter. For the six months ended June 30, 2008, the fund’s commitment fee and interest expense were $277 and $0, respectively, and are included in miscellaneous expense on the Statement of Operations.
16
Table of Contents
BOARD REVIEW OF INVESTMENT ADVISORY AGREEMENT
A discussion regarding the Board’s most recent review and renewal of the fund’s Investment Advisory Agreement with MFS will be available on or about November 1, 2008 by clicking on the fund’s name under “Variable Insurance Portfolios - VIT” in the “Products and Performance” section of the MFS Web site (mfs.com).
PROXY VOTING POLICIES AND INFORMATION
A general description of the MFS funds’ proxy voting policies and procedures is available without charge, upon request, by calling 1-800-225-2606, by visiting the Proxy Voting section of mfs.com or by visiting the SEC’s Web site at http://www.sec.gov.
Information regarding how the fund voted proxies relating to portfolio securities during the most recent twelve-month period ended June 30 is available without charge by visiting the Proxy Voting section of mfs.com or by visiting the SEC’s Web site at http://www.sec.gov.
QUARTERLY PORTFOLIO DISCLOSURE
The fund will file a complete schedule of portfolio holdings with the Securities and Exchange Commission (the Commission) for the first and third quarters of each fiscal year on Form N-Q. The fund’s Form N-Q may be reviewed and copied at the:
Public Reference Room
Securities and Exchange Commission
100 F Street, NE, Room 1580
Washington, D.C. 20549
Information on the operation of the Public Reference Room may be obtained by calling the Commission at 1-800-SEC-0330. The fund’s Form N-Q is available on the EDGAR database on the Commission’s Internet Web site at http://www.sec.gov, and copies of this information may be obtained, upon payment of a duplicating fee, by electronic request at the following e-mail address: publicinfo@sec.gov or by writing the Public Reference Section at the above address.
17
Table of Contents
Web site
mfs.com
Account service and literature
Shareholders
1-877-411-3325
9 a.m. to 5 p.m. Eastern Time
Investment professionals
1-800-637-8730
8 a.m. to 5 p.m. Eastern Time
Mailing address
MFS Service Center, Inc.
Attn: Institutional Alliance Services (IAS)
P.O. Box 55824
Boston, MA 02205-5824
Overnight mail
MFS Service Center, Inc.
c/o Boston Financial Data Services
30 Dan Road
Canton, MA 02021-2809

Table of Contents
Table of Contents
MFS® GLOBAL EQUITY SERIES
This report is prepared for the general information of contract owners. It is authorized for distribution to prospective investors only when preceded or accompanied by a current prospectus.
NOT FDIC INSURED Ÿ MAY LOSE VALUE Ÿ NO BANK OR CREDIT UNION GUARANTEE Ÿ NOT A DEPOSIT Ÿ NOT INSURED BY ANY FEDERAL GOVERNMENT AGENCY OR NCUA/NCUSIF
Table of Contents

Dear Contract Owners:
Negative headlines tend to resonate during difficult markets, and we certainly have had more than our share of tough news recently. As a result consumer, and particularly investor, sentiment are at all-time lows. That said, I do think it is helpful to remember there are always silver linings in the storm clouds if you look hard enough.
Through all of the challenges we have faced, there are some positive underlying trends. In the United States, for example, institutional traders and credit market followers are just now showing increasing signs of confidence and are beginning to take on more risk. At the corporate level, earnings continue to be relatively strong as companies have reduced labor costs, controlled inventories, and relied less on debt to finance expansion. More broadly, low interest rates and strong demand for consumer goods and industrial equipment are good signs for the global economy.
While I do not mean to minimize the risks inherent in today’s markets, periods such as these allow the talented fund managers and research analysts we have at MFS® to test their convictions, reevaluate existing positions, and identify new investment ideas. Our investment process also includes a significant risk management component, with constant attention paid to monitoring market risk, so we can do our best to minimize any surprises to your portfolio.
For investors, this is a great time to check in with your advisor and make sure you have a sound investment plan in place — one that can keep your hard-earned money working over the long term through a strategy that involves asset allocation, diversification, and periodic portfolio rebalancing and reviews. A plan tailored to your distinct needs and goals continues to be the best approach to help you take advantage of the inevitable challenges — and opportunities — that present themselves over time.
Respectfully,

Robert J. Manning
Chief Executive Officer and Chief Investment Officer
MFS Investment Management®
August 15, 2008
The opinions expressed in this letter are subject to change, may not be relied upon for investment advice, and no forecasts can be guaranteed.
1
Table of Contents
Portfolio structure
| Top ten holdings | ||
| Nestle S.A. | 3.5% | |
| Roche Holding AG | 2.8% | |
| LVMH Moet Hennessy Louis Vuitton S.A. | 2.6% | |
| Heineken N.V. | 2.5% | |
| Canon, Inc. | 2.2% | |
| Johnson & Johnson | 2.1% | |
| TOTAL S.A. | 2.1% | |
| Diageo PLC | 1.9% | |
| Linde AG | 1.9% | |
| Reckitt Benckiser Group PLC | 1.9% |
| Equity sectors | ||
| Consumer Staples | 18.2% | |
| Health Care | 14.2% | |
| Financial Services | 12.5% | |
| Basic Materials | 7.8% | |
| Technology | 7.6% | |
| Energy | 7.4% | |
| Leisure | 7.2% | |
| Retailing | 6.8% | |
| Industrial Goods & Services | 4.4% | |
| Utilities & Communications | 4.1% | |
| Transportation | 3.4% | |
| Autos & Housing | 2.4% | |
| Special Products & Services | 2.4% | |
| Country weightings | ||
| United States | 33.8% | |
| France | 13.9% | |
| Switzerland | 12.0% | |
| Japan | 9.7% | |
| United Kingdom | 9.1% | |
| Germany | 8.6% | |
| Netherlands | 6.4% | |
| South Korea | 1.2% | |
| Austria | 1.2% | |
| Other Countries | 4.1% | |
Percentages are based on net assets as of 6/30/08.
The portfolio is actively managed and current holdings may be different.
2
Table of Contents
Fund Expenses Borne by the Contract Holders During the Period,
January 1, 2008 through June 30, 2008
As a contract holder of the fund, you incur ongoing costs, including management fees; distribution (12b-1) fees; and other fund expenses. This example is intended to help you understand your ongoing costs (in dollars) of investing in the fund and to compare these costs with the ongoing costs of investing in other mutual funds.
The example is based on an investment of $1,000 invested at the beginning of the period and held for the entire period, January 1, 2008 through June 30, 2008.
Actual Expenses
The first line for each share class in the following table provides information about actual account values and actual expenses. You may use the information in this line, together with the amount you invested, to estimate the expenses that you paid over the period. Simply divide your account value by $1,000 (for example, an $8,600 account value divided by $1,000 = 8.6), then multiply the result by the number in the first line under the heading entitled “Expenses Paid During Period” to estimate the expenses you paid on your account during this period.
Hypothetical Example for Comparison Purposes
The second line for each share class in the following table provides information about hypothetical account values and hypothetical expenses based on the fund’s actual expense ratio and an assumed rate of return of 5% per year before expenses, which is not the fund’s actual return. The hypothetical account values and expenses may not be used to estimate the actual ending account balance or expenses you paid for the period. You may use this information to compare the ongoing costs of investing in the fund and other funds. To do so, compare this 5% hypothetical example with the 5% hypothetical examples that appear in the shareholder reports of the other funds.
Please note that the expenses shown in the table are meant to highlight the fund’s ongoing costs only and do not take into account the fees and expenses imposed under the variable contracts through which your investment in the fund is made. Therefore, the second line for each share class in the table is useful in comparing ongoing costs associated with an investment in vehicles (such as the fund) which fund benefits under variable annuity and variable life insurance contracts and to qualified pension and retirement plans only, and will not help you determine the relative total costs of investing in the fund through variable annuity and variable life insurance contracts. If the fees and expenses imposed under the variable contracts were included, your costs would have been higher.
| Share Class | Annualized Expense Ratio | Beginning Account Value 1/01/08 | Ending Account Value 6/30/08 | Expenses Paid During Period (p) 1/01/08-6/30/08 | ||||||
| Initial Class | Actual | 1.15% | $1,000.00 | $908.53 | $5.46 | |||||
| Hypothetical (h) | 1.15% | $1,000.00 | $1,019.14 | $5.77 | ||||||
| Service Class | Actual | 1.40% | $1,000.00 | $906.78 | $6.64 | |||||
| Hypothetical (h) | 1.40% | $1,000.00 | $1,017.90 | $7.02 |
| (h) | 5% class return per year before expenses. |
| (p) | Expenses paid is equal to each class’ annualized expense ratio, as shown above, multiplied by the average account value over the period, multiplied by the number of days in the period, divided by the number of days in the year. |
3
Table of Contents
PORTFOLIO OF INVESTMENTS – 6/30/08 (unaudited)
The Portfolio of Investments is a complete list of all securities owned by your fund. It is categorized by broad-based asset classes.
| Issuer | Shares/Par | Value ($) | |||
| COMMON STOCKS – 98.4% | |||||
| Alcoholic Beverages – 5.8% | |||||
| Diageo PLC | 55,339 | $ | 1,017,192 | ||
| Grupo Modelo S.A. de C.V., “C” | 39,900 | 200,718 | |||
| Heineken N.V. (l) | 25,930 | 1,318,481 | |||
| Pernod Ricard S.A. | 5,086 | 521,836 | |||
| $ | 3,058,227 | ||||
| Apparel Manufacturers – 4.9% | |||||
| Burberry Group PLC | 26,650 | $ | 239,461 | ||
| LVMH Moet Hennessy Louis Vuitton S.A. | 13,040 | 1,359,569 | |||
| NIKE, Inc., “B” | 15,840 | 944,222 | |||
| $ | 2,543,252 | ||||
| Automotive – 2.4% | |||||
| Bayerische Motoren Werke AG | 11,650 | $ | 559,292 | ||
| Bridgestone Corp. (l) | 14,600 | 223,472 | |||
| Harley-Davidson, Inc. (l) | 13,250 | 480,445 | |||
| $ | 1,263,209 | ||||
| Biotechnology – 0.3% | |||||
| Actelion Ltd. (a) | 2,670 | $ | 142,287 | ||
| Broadcasting – 5.1% | |||||
| Omnicom Group, Inc. | 15,290 | $ | 686,215 | ||
| Viacom, Inc., “B” (a) | 6,775 | 206,909 | |||
| Vivendi S.A. | 10,770 | 407,878 | |||
| Walt Disney Co. (l) | 25,170 | 785,304 | |||
| WPP Group PLC | 58,870 | 567,180 | |||
| $ | 2,653,486 | ||||
| Brokerage & Asset Managers – 1.9% | |||||
| Deutsche Boerse AG | 1,970 | $ | 221,117 | ||
| Goldman Sachs Group, Inc. | 2,010 | 351,549 | |||
| Julius Baer Holding Ltd. | 5,948 | 398,728 | |||
| $ | 971,394 | ||||
| Business Services – 1.4% | |||||
| Accenture Ltd., “A” | 12,580 | $ | 512,258 | ||
| DST Systems, Inc. (a)(l) | 4,090 | 225,155 | |||
| $ | 737,413 | ||||
| Chemicals – 3.1% | |||||
| 3M Co. | 13,290 | $ | 924,851 | ||
| Givaudan S.A. | 790 | 704,690 | |||
| $ | 1,629,541 | ||||
| Computer Software – 1.3% | |||||
| Oracle Corp. (a) | 33,410 | $ | 701,610 | ||
| Conglomerates – 1.0% | |||||
| Smiths Group PLC | 23,113 | $ | 499,463 | ||
| Consumer Goods & Services – 5.9% | |||||
| Alberto-Culver Co. (l) | 6,730 | $ | 176,797 | ||
| Henkel KGaA, IPS | 10,730 | 426,267 | |||
| Kao Corp. | 32,000 | 840,477 | |||
| Issuer | Shares/Par | Value ($) | |||
| COMMON STOCKS – continued | |||||
| Consumer Goods & Services – continued | |||||
| Procter & Gamble Co. | 10,159 | $ | 617,769 | ||
| Reckitt Benckiser Group PLC | 19,840 | 1,005,393 | |||
| $ | 3,066,703 | ||||
| Electrical Equipment – 3.9% | |||||
| Legrand S.A. (l) | 20,920 | $ | 525,147 | ||
| OMRON Corp. | 10,300 | 221,474 | |||
| Rockwell Automation, Inc. (l) | 9,470 | 414,123 | |||
| Schneider Electric S.A. | 8,080 | 871,236 | |||
| $ | 2,031,980 | ||||
| Electronics – 6.3% | |||||
| Canon, Inc. (l) | 22,200 | $ | 1,143,132 | ||
| Hirose Electric Co. Ltd. (l) | 2,200 | 221,172 | |||
| Hoya Corp. | 18,100 | 419,064 | |||
| Intel Corp. | 23,660 | 508,217 | |||
| Ricoh Co. Ltd. | 21,000 | 379,460 | |||
| Samsung Electronics Co. Ltd. | 1,039 | 620,788 | |||
| $ | 3,291,833 | ||||
| Energy – Independent – 1.2% | |||||
| INPEX Holdings, Inc. | 48 | $ | 606,592 | ||
| Energy – Integrated – 6.2% | |||||
| Chevron Corp. | 6,020 | $ | 596,763 | ||
| Exxon Mobil Corp. | 8,860 | 780,832 | |||
| Royal Dutch Shell PLC, “A” | 19,690 | 809,588 | |||
| TOTAL S.A. | 12,610 | 1,076,488 | |||
| $ | 3,263,671 | ||||
| Food & Beverages – 6.5% | |||||
| General Mills, Inc. | 14,680 | $ | 892,104 | ||
| Nestle S.A. | 40,630 | 1,838,797 | |||
| PepsiCo, Inc. | 10,590 | 673,418 | |||
| $ | 3,404,319 | ||||
| Food & Drug Stores – 1.8% | |||||
| Tesco PLC | 37,838 | $ | 278,074 | ||
| Walgreen Co. (l) | 20,820 | 676,858 | |||
| $ | 954,932 | ||||
| Gaming & Lodging – 1.3% | |||||
| Ladbrokes PLC | 76,529 | $ | 388,982 | ||
| William Hill PLC | 46,540 | 295,313 | |||
| $ | 684,295 | ||||
| Insurance – 2.8% | |||||
| AXA | 24,850 | $ | 732,721 | ||
| Genworth Financial, Inc., “A” | 8,450 | 150,495 | |||
| QBE Insurance Group Ltd. | 4,224 | 90,719 | |||
| Swiss Reinsurance Co. | 7,240 | 479,824 | |||
| $ | 1,453,759 | ||||
| Machinery & Tools – 0.5% | |||||
| Fanuc Ltd. | 2,500 | $ | 244,495 | ||
4
Table of Contents
Portfolio of Investments (unaudited) – continued
| Issuer | Shares/Par | Value ($) | |||
| COMMON STOCKS – continued | |||||
| Major Banks – 4.5% | |||||
| Bank of New York Mellon Corp. | 21,050 | $ | 796,322 | ||
| Erste Bank der oesterreichischen Sparkassen AG | 9,790 | 605,830 | |||
| Intesa Sanpaolo S.p.A. | 34,769 | 197,926 | |||
| State Street Corp. | 12,060 | 771,719 | |||
| $ | 2,371,797 | ||||
| Medical Equipment – 5.0% | |||||
| Medtronic, Inc. | 14,060 | $ | 727,605 | ||
| Synthes, Inc. | 5,010 | 688,544 | |||
| Thermo Fisher Scientific, Inc. (a) | 9,380 | 522,747 | |||
| Zimmer Holdings, Inc. (a) | 10,180 | 692,749 | |||
| $ | 2,631,645 | ||||
| Natural Gas – Distribution – 0.9% | |||||
| Gaz de France | 6,150 | $ | 394,135 | ||
| Tokyo Gas Co. Ltd. | 21,000 | 84,764 | |||
| $ | 478,899 | ||||
| Other Banks & Diversified Financials – 3.3% | |||||
| Aeon Credit Service Co. Ltd. | 11,800 | $ | 148,119 | ||
| American Express Co. | 18,080 | 681,074 | |||
| Bangkok Bank Public Co. Ltd. | 39,300 | 141,050 | |||
| Komercni Banka A.S. | 881 | 205,057 | |||
| UBS AG (a) | 27,087 | 560,879 | |||
| $ | 1,736,179 | ||||
| Pharmaceuticals – 8.9% | |||||
| Bayer AG | 8,710 | $ | 731,864 | ||
| GlaxoSmithKline PLC | 19,210 | 424,892 | |||
| Johnson & Johnson | 17,120 | 1,101,501 | |||
| Merck KGaA | 6,640 | 943,205 | |||
| Roche Holding AG | 8,100 | 1,455,751 | |||
| $ | 4,657,213 | ||||
| Printing & Publishing – 0.8% | |||||
| Wolters Kluwer N.V. | 18,680 | $ | 433,487 | ||
| Railroad & Shipping – 0.5% | |||||
| Canadian National Railway Co. | 5,774 | $ | 277,614 | ||
| Specialty Chemicals – 4.7% | |||||
| L’Air Liquide S.A. | 5,543 | $ | 731,050 | ||
| Linde AG (l) | 7,190 | 1,008,403 | |||
| Praxair, Inc. (l) | 2,660 | 250,678 | |||
| Shin-Etsu Chemical Co. Ltd. | 7,200 | 446,796 | |||
| $ | 2,436,927 | ||||
| Specialty Stores – 0.1% | |||||
| Sally Beauty Holdings, Inc. (a)(l) | 10,600 | $ | 68,476 | ||
| Telephone Services – 0.9% | |||||
| Singapore Telecommunications Ltd. | 165,950 | $ | 441,736 | ||
| Trucking – 2.9% | |||||
| TNT N.V. | 22,640 | $ | 769,300 | ||
| United Parcel Service, Inc., “B” | 10,780 | 662,647 | |||
| Yamato Holdings Co. Ltd. | 6,000 | 83,859 | |||
| $ | 1,515,806 | ||||
| Issuer | Shares/Par | Value ($) | |||||
| COMMON STOCKS – continued | |||||||
| Utilities – Electric Power – 2.3% | |||||||
| E.ON AG | 2,890 | $ | 582,203 | ||||
| SUEZ S.A. | 9,320 | 633,215 | |||||
| $ | 1,215,418 | ||||||
| Total Common Stocks (Identified Cost, $47,411,667) | $ | 51,467,658 | |||||
| SHORT-TERM OBLIGATIONS – 1.2% | |||||||
| Toyota Motor Credit Corp., 2.57%, due 7/01/08, at Amortized Cost and Value (y) | $ | 612,000 | $ | 612,000 | |||
| COLLATERAL FOR SECURITIES LOANED – 9.6% | |||||||
| Navigator Securities Lending Prime Portfolio, at Cost and Net Asset Value | 5,037,290 | $ | 5,037,290 | ||||
| Total Investments (Identified Cost, $53,060,957) | $ | 57,116,948 | |||||
| OTHER ASSETS, LESS LIABILITIES – (9.2)% | (4,812,862 | ) | |||||
| Net Assets – 100.0% | $ | 52,304,086 | |||||
| (a) | Non-income producing security. |
| (l) | All or a portion of this security is on loan. |
| (y) | The rate shown represents an annualized yield at time of purchase. |
The following abbreviations are used in this report and are defined:
| IPS | International Preference Stock |
See Notes to Financial Statements
5
Table of Contents
FINANCIAL STATEMENTS | STATEMENT OF ASSETS AND LIABILITIES (unaudited)
This statement represents your fund’s balance sheet, which details the assets and liabilities comprising the total value of the fund.
At 6/30/08 | ||||
Assets | ||||
Investments, at value, including $4,956,286 of securities on loan (identified cost, $53,060,957) | $57,116,948 | |||
Cash | 1,787 | |||
Foreign currency, at value (identified cost, $52,884) | 53,472 | |||
Receivable for investments sold | 81,898 | |||
Receivable for fund shares sold | 269,049 | |||
Interest and dividends receivable | 96,430 | |||
Receivable from investment adviser | 9,704 | |||
Other assets | 665 | |||
Total assets | $57,629,953 | |||
Liabilities | ||||
Payable for investments purchased | $152,255 | |||
Payable for fund shares reacquired | 26,017 | |||
Collateral for securities loaned, at value (c) | 5,037,290 | |||
Payable to affiliates | ||||
Management fee | 5,692 | |||
Shareholder servicing costs | 28 | |||
Distribution fees | 18 | |||
Administrative services fee | 195 | |||
Payable for independent trustees’ compensation | 502 | |||
Accrued expenses and other liabilities | 103,870 | |||
Total liabilities | $5,325,867 | |||
Net assets | $52,304,086 | |||
Net assets consist of | ||||
Paid-in capital | $47,520,268 | |||
Unrealized appreciation (depreciation) on investments and translation of assets and liabilities in foreign currencies (net of $545 deferred country tax) | 4,056,354 | |||
Accumulated net realized gain (loss) on investments and foreign currency transactions | 179,870 | |||
Undistributed net investment income | 547,594 | |||
Net assets | $52,304,086 | |||
Shares of beneficial interest outstanding | 4,075,021 | |||
Initial Class shares | ||||
Net assets | $51,642,637 | |||
Shares outstanding | 4,023,522 | |||
Net asset value per share | $12.84 | |||
Service Class shares | ||||
Net assets | $661,449 | |||
Shares outstanding | 51,499 | |||
Net asset value per share | $12.84 |
| (c) | Non-cash collateral is not included. |
See Notes to Financial Statements
6
Table of Contents
FINANCIAL STATEMENTS | STATEMENT OF OPERATIONS (unaudited)
This statement describes how much your fund earned in investment income and accrued in expenses. It also describes any gains and/or losses generated by fund operations.
Six months ended 6/30/08 | ||||||
| Net investment income | ||||||
Income | ||||||
Dividends | $887,054 | |||||
Income on securities loaned | 48,386 | |||||
Interest | 8,362 | |||||
Foreign taxes withheld | (90,997 | ) | ||||
Total investment income | $852,805 | |||||
Expenses | ||||||
Management fee | $263,056 | |||||
Distribution fees | 796 | |||||
Shareholder servicing costs | 4,780 | |||||
Administrative services fee | �� | 8,905 | ||||
Independent trustees’ compensation | 1,628 | |||||
Custodian fee | 36,210 | |||||
Shareholder communications | 16,739 | |||||
Auditing fees | 22,941 | |||||
Legal fees | 435 | |||||
Miscellaneous | 6,302 | |||||
Total expenses | $361,792 | |||||
Reduction of expenses by investment adviser | (58,192 | ) | ||||
Net expenses | $303,600 | |||||
Net investment income | $549,205 | |||||
Realized and unrealized gain (loss) on investments | ||||||
Realized gain (loss) (identified cost basis) | ||||||
Investment transactions (net of $1,777 country tax) | $272,919 | |||||
Foreign currency transactions | (6,726 | ) | ||||
Net realized gain (loss) on investments and foreign currency transactions | $266,193 | |||||
| Change in unrealized appreciation (depreciation) | ||||||
Investments (net of $268 decrease in deferred country tax) | $(6,095,968 | ) | ||||
Translation of assets and liabilities in foreign currencies | 749 | |||||
Net unrealized gain (loss) on investments and foreign currency translation | $(6,095,219 | ) | ||||
Net realized and unrealized gain (loss) on investments and foreign currency | $(5,829,026 | ) | ||||
Change in net assets from operations | $(5,279,821 | ) |
See Notes to Financial Statements
7
Table of Contents
FINANCIAL STATEMENTS | STATEMENTS OF CHANGES IN NET ASSETS
These statements describe the increases and/or decreases in net assets resulting from operations, any distributions, and any shareholder transactions.
| Six months ended 6/30/08 (unaudited | ) | Year ended 12/31/07 | | |||
| Change in net assets | ||||||
From operations | ||||||
Net investment income | $549,205 | $502,634 | ||||
Net realized gain (loss) on investments and foreign currency transactions | 266,193 | 4,101,773 | ||||
Net unrealized gain (loss) on investments and foreign currency translation | (6,095,219 | ) | 245,712 | |||
Change in net assets from operations | $(5,279,821 | ) | $4,850,119 | |||
Distributions declared to shareholders | ||||||
From net investment income | ||||||
Initial Class | $(490,946 | ) | $(1,128,394 | ) | ||
Service Class | (4,884 | ) | (8,202 | ) | ||
From net realized gain on investments | ||||||
Initial Class | (4,065,455 | ) | (3,544,452 | ) | ||
Service Class | (50,504 | ) | (26,643 | ) | ||
Total distributions declared to shareholders | $(4,611,789 | ) | $(4,707,691 | ) | ||
Change in net assets from fund share transactions | $5,322,264 | $3,071,598 | ||||
Total change in net assets | $(4,569,346 | ) | $3,214,026 | |||
Net assets | ||||||
At beginning of period | 56,873,432 | 53,659,406 | ||||
At end of period (including undistributed net investment income of $547,594 and | $52,304,086 | $56,873,432 |
See Notes to Financial Statements
8
Table of Contents
FINANCIAL STATEMENTS | FINANCIAL HIGHLIGHTS
The financial highlights table is intended to help you understand the fund’s financial performance for the semiannual period and the past 5 fiscal years. Certain information reflects financial results for a single fund share. The total returns in the table represent the rate by which an investor would have earned (or lost) on an investment in the fund share class (assuming reinvestment of all distributions) held for the entire period.
| Initial Class | Six months ended 6/30/08 | Years ended 12/31 | ||||||||||||||||
| 2007 | 2006 | 2005 | 2004 | 2003 | ||||||||||||||
| (unaudited) | ||||||||||||||||||
Net asset value, beginning of period | $15.47 | $15.45 | $13.49 | $12.80 | $10.86 | $8.50 | ||||||||||||
Income (loss) from investment operations | ||||||||||||||||||
Net investment income (d) | $0.15 | $0.13 | $0.37 | $0.09 | $0.06 | $0.06 | ||||||||||||
Net realized and unrealized gain (loss) on investments and foreign currency | (1.48 | ) | 1.22 | 2.76 | 0.86 | 1.92 | 2.30 | |||||||||||
| Total from investment operations | $(1.33 | ) | $1.35 | $3.13 | $0.95 | $1.98 | $2.36 | |||||||||||
Less distributions declared to shareholders | ||||||||||||||||||
From net investment income | $(0.14 | ) | $(0.32 | ) | $(0.07 | ) | $(0.04 | ) | $(0.04 | ) | $(0.00 | )(w) | ||||||
From net realized gain on investments | (1.16 | ) | (1.01 | ) | (1.10 | ) | (0.22 | ) | — | — | ||||||||
Total distributions declared to shareholders | $(1.30 | ) | $(1.33 | ) | $(1.17 | ) | $(0.26 | ) | $(0.04 | ) | $(0.00 | )(w) | ||||||
| Net asset value, end of period | $12.84 | $15.47 | $15.45 | $13.49 | $12.80 | $10.86 | ||||||||||||
| Total return (%) (k)(r)(s) | (9.15 | )(n) | 9.19 | 24.41 | 7.68 | 18.28 | 27.84 | |||||||||||
| Ratios (%) (to average net assets) and Supplemental data: | ||||||||||||||||||
Expenses before expense reductions (f) | 1.37 | (a) | 1.41 | 1.49 | 1.48 | 1.56 | 1.94 | |||||||||||
Expenses after expense reductions (f) | 1.15 | (a) | 1.15 | 1.15 | 1.15 | 1.15 | 1.15 | |||||||||||
Net investment income | 2.09 | (a) | 0.88 | 2.60 | 0.68 | 0.53 | 0.63 | |||||||||||
Portfolio turnover | 15 | 38 | 37 | 52 | 40 | 48 | ||||||||||||
Net assets at end of period (000 Omitted) | $51,643 | $56,246 | $53,388 | $35,415 | $31,983 | $18,212 | ||||||||||||
See Notes to Financial Statements
9
Table of Contents
Financial Highlights – continued
| Service Class | Six months ended 6/30/08 | Years ended 12/31 | ||||||||||||||||
| 2007 | 2006 | 2005 | 2004 | 2003 | ||||||||||||||
| (unaudited) | ||||||||||||||||||
Net asset value, beginning of period | $15.47 | $15.47 | $13.53 | $13.00 | $10.99 | $8.57 | ||||||||||||
Income (loss) from investment operations | ||||||||||||||||||
Net investment income (d) | $0.13 | $0.09 | $0.31 | $0.03 | $0.11 | $0.13 | ||||||||||||
Net realized and unrealized gain (loss) on investments and foreign currency | (1.49 | ) | 1.23 | 2.79 | 0.76 | 1.90 | 2.29 | |||||||||||
| Total from investment operations | $(1.36 | ) | $1.32 | $3.10 | $0.79 | $2.01 | $2.42 | |||||||||||
Less distributions declared to shareholders | ||||||||||||||||||
From net investment income | $(0.11 | ) | $(0.31 | ) | $(0.06 | ) | $(0.04 | ) | $— | $— | ||||||||
From net realized gain on investments | (1.16 | ) | (1.01 | ) | (1.10 | ) | (0.22 | ) | — | — | ||||||||
Total distributions declared to shareholders | $(1.27 | ) | $(1.32 | ) | $(1.16 | ) | $(0.26 | ) | $— | $— | ||||||||
| Net asset value, end of period | $12.84 | $15.47 | $15.47 | $13.53 | $13.00 | $10.99 | ||||||||||||
| Total return (%) (k)(r)(s) | (9.32 | )(n) | 8.97 | 24.02 | 6.30 | 18.29 | 28.24 | |||||||||||
| Ratios (%) (to average net assets) and Supplemental data: | ||||||||||||||||||
Expenses before expense reductions (f) | 1.62 | (a) | 1.65 | 1.76 | 1.73 | 0.60 | (y) | 1.44 | (y) | |||||||||
Expenses after expense reductions (f) | 1.40 | (a) | 1.40 | 1.40 | 1.40 | 0.19 | (y) | 0.65 | (y) | |||||||||
Net investment income | 1.90 | (a) | 0.60 | 2.29 | 0.22 | 0.81 | 1.41 | |||||||||||
Portfolio turnover | 15 | 38 | 37 | 52 | 40 | 48 | ||||||||||||
Net assets at end of period (000 Omitted) | $661 | $628 | $271 | $56 | $27 | $22 | ||||||||||||
| (a) | Annualized. |
| (d) | Per share data is based on average shares outstanding. |
| (f) | Ratios do not reflect reductions from fees paid indirectly, if applicable. |
| (k) | The total return does not reflect expenses that apply to separate accounts. Inclusion of these charges would reduce the total return figures for all periods shown. |
| (n) | Not annualized. |
| (r) | Certain expenses have been reduced without which performance would have been lower. |
| (s) | From time to time the fund may receive proceeds from litigation settlements, without which performance would be lower. |
| (w) | Per share amount was less than $0.01. |
| (y) | Expense ratio is not in correlation with the contractual fee arrangement due to the small size of Service Class assets. |
See Notes to Financial Statements
10
Table of Contents
NOTES TO FINANCIAL STATEMENTS (unaudited)
| (1) | Business and Organization |
MFS Global Equity Series (the fund) is a series of MFS Variable Insurance Trust (the trust). The trust is organized as a Massachusetts business trust and is registered under the Investment Company Act of 1940, as amended, as an open-end management investment company. The shareholders of each series of the trust are separate accounts of insurance companies, which offer variable annuity and/or life insurance products, and qualified retirement and pension plans.
| (2) | Significant Accounting Policies |
General – The preparation of financial statements in conformity with U.S. generally accepted accounting principles requires management to make estimates and assumptions that affect the reported amounts of assets and liabilities, and disclosure of contingent assets and liabilities at the date of the financial statements and the reported amounts of revenues and expenses during the reporting period. Actual results could differ from those estimates. The fund can invest in foreign securities, including securities of emerging market issuers. Investments in foreign securities are vulnerable to the effects of changes in the relative values of the local currency and the U.S. dollar and to the effects of changes in each country’s legal, political, and economic environment. The markets of emerging markets countries are generally more volatile than the markets of developed countries with more mature economies. All of the risks of investing in foreign securities previously described are heightened when investing in emerging markets countries.
In March 2008, FASB Statement No. 161, Disclosures about Derivative Instruments and Hedging Activities (the “Standard”) was issued, and is effective for financial statements issued for fiscal years and interim periods beginning after November 15, 2008. This Standard provides enhanced disclosures about the fund’s use of and accounting for derivative instruments and the effect of derivative instruments on the fund’s results of operations and financial position. Management is evaluating the application of the Standard to the fund, and has not at this time determined the impact, if any, resulting from the adoption of this Standard on the fund’s financial statements.
Investment Valuations – Equity securities, including restricted equity securities, are generally valued at the last sale or official closing price as reported by an independent pricing service on the market or exchange on which they are primarily traded. For securities for which there were no sales reported that day, equity securities are generally valued at the last quoted daily bid quotation as reported by an independent pricing service on the market or exchange on which they are primarily traded. For securities held short for which there were no sales reported for the day, the position is generally valued at the last quoted daily ask quotation as reported by an independent pricing service on the market or exchange on which such securities are primarily traded. Short-term instruments with a maturity at issuance of 60 days or less may be valued at amortized cost, which approximates market value. Open-end investment companies are generally valued at net asset value per share. Securities and other assets generally valued on the basis of information from an independent pricing service may also be valued at a broker-dealer bid quotation. The values of foreign securities and other assets and liabilities expressed in foreign currencies are converted to U.S. dollars using the mean of bid and asked prices for rates reported by an independent pricing service.
The Board of Trustees has delegated primary responsibility for determining or causing to be determined the value of the fund’s investments (including any fair valuation) to the adviser pursuant to valuation policies and procedures approved by the Board. If the adviser determines that reliable market quotations are not readily available, investments are valued at fair value as determined in good faith by the adviser in accordance with such procedures under the oversight of the Board of Trustees. Under the fund’s valuation policies and procedures, market quotations are not considered to be readily available for most types of debt instruments and floating rate loans and many types of derivatives. These investments are generally valued at fair value based on information from independent pricing services. In addition, investments may be valued at fair value if the adviser determines that an investment’s value has been materially affected by events occurring after the close of the exchange or market on which the investment is principally traded (such as foreign exchange or market) and prior to the determination of the fund’s net asset value, or after the halting of trading of a specific security where trading does not resume prior to the close of the exchange or market on which the security is principally traded. Events that occur on a frequent basis after foreign markets close (such as developments in foreign markets and significant movements in the U.S. markets) and prior to the determination of the fund’s net asset value may be deemed to have a material affect on the value of securities traded in foreign markets. Accordingly, the fund’s foreign equity securities may often be valued at fair value. The adviser may rely on independent pricing services or other information (such as the correlation with price movements of similar securities in the same or other markets; the type, cost and investment characteristics of the security; the business and financial condition of the issuer; and trading and other market data) to assist in determining whether to fair value and at what value to fair value an investment. The value of an investment for purposes of calculating the fund’s net asset value can differ depending on the source and method used to determine value. When fair valuation is used, the value of investments used to determine the fund’s net asset value may differ from quoted or published prices for the same investments.
11
Table of Contents
Notes to Financial Statements (unaudited) – continued
The fund adopted FASB Statement No. 157, Fair Value Measurements (the “Statement”) in this reporting period. This Statement provides a single definition of fair value, a hierarchy for measuring fair value and expanded disclosures about fair value measurements.
Various inputs are used in determining the value of the fund’s assets or liabilities carried at market value. These inputs are categorized into three broad levels. Level 1 includes quoted prices in active markets for identical assets or liabilities. Level 2 includes other significant observable market-based inputs (including quoted prices for similar securities, interest rates, prepayment speed, and credit risk). Level 3 includes unobservable inputs, which may include the adviser’s own assumptions in determining the fair value of investments. Other financial instruments are derivative instruments not reflected in total investments, such as futures, forwards, swap contracts and written options, which are valued at the unrealized appreciation/depreciation on the instrument. The following is a summary of the levels used as of June 30, 2008 in valuing the fund’s assets or liabilities carried at market value:
| Level 1 | Level 2 | Level 3 | Total | |||||
| Investments in Securities | $27,537,253 | $29,579,695 | $— | $57,116,948 | ||||
| Other Financial Instruments | $— | $— | $— | $— |
Repurchase Agreements – The fund may enter into repurchase agreements with institutions that the fund’s investment adviser has determined are creditworthy. Each repurchase agreement is recorded at cost. The fund requires that the securities collateral in a repurchase transaction be transferred to a custodian in a manner sufficient to enable the fund to obtain those securities in the event of a default under the repurchase agreement. The fund monitors, on a daily basis, the value of the collateral to ensure that its value, including accrued interest, is greater than amounts owed to the fund under each such repurchase agreement. The fund and other funds managed by Massachusetts Financial Services Company (MFS), may utilize a joint trading account for the purpose of entering into one or more repurchase agreements.
Foreign Currency Translation – Purchases and sales of foreign investments, income, and expenses are converted into U.S. dollars based upon currency exchange rates prevailing on the respective dates of such transactions. Gains and losses attributable to foreign currency exchange rates on sales of securities are recorded for financial statement purposes as net realized gains and losses on investments. Gains and losses attributable to foreign exchange rate movements on income and expenses are recorded for financial statement purposes as foreign currency transaction gains and losses. That portion of both realized and unrealized gains and losses on investments that results from fluctuations in foreign currency exchange rates is not separately disclosed.
Security Loans – State Street Bank and Trust Company (“State Street”), as lending agent, may loan the securities of the fund to certain qualified institutions (the “Borrowers”) approved by the fund. The loans are collateralized at all times by cash and/or U.S. Treasury and federal agency obligations in an amount at least equal to the market value of the securities loaned. State Street provides the fund with indemnification against Borrower default. The fund bears the risk of loss with respect to the investment of cash collateral. On loans collateralized by cash, the cash collateral is invested in a money market fund or short-term securities. A portion of the income generated upon investment of the collateral is remitted to the Borrowers, and the remainder is allocated between the fund and the lending agent. On loans collateralized by U.S. Treasury and/or federal agency obligations, a fee is received from the Borrower, and is allocated between the fund and the lending agent. Net income from securities lending is included in interest income on the Statement of Operations. The dividend and interest income earned on the securities loaned is accounted for in the same manner as other dividend and interest income.
At June 30, 2008, the value of securities loaned was $4,956,286. These loans were collateralized by cash of $5,037,290 and U.S. Treasury obligations of $97,563.
Indemnifications – Under the fund’s organizational documents, its officers and trustees may be indemnified against certain liabilities and expenses arising out of the performance of their duties to the fund. Additionally, in the normal course of business, the fund enters into agreements with service providers that may contain indemnification clauses. The fund’s maximum exposure under these agreements is unknown as this would involve future claims that may be made against the fund that have not yet occurred.
Investment Transactions and Income – Investment transactions are recorded on the trade date. Interest income is recorded on the accrual basis. All premium and discount is amortized or accreted for financial statement purposes in accordance with U.S. generally accepted accounting principles. Dividends received in cash are recorded on the ex-dividend date. Certain dividends from foreign securities will be recorded when the fund is informed of the dividend if such information is obtained subsequent to the ex-dividend date. Dividend and interest payments received in additional securities are recorded on the ex-dividend or ex-interest date in an amount equal to the value of the security on such date.
12
Table of Contents
Notes to Financial Statements (unaudited) – continued
The fund may receive proceeds from litigation settlements. Any proceeds received from litigation involving portfolio holdings are reflected in the Statement of Operations in realized gain/loss if the security has been disposed of by the fund or in unrealized gain/loss if the security is still held by the fund. Any other proceeds from litigation not related to portfolio holdings are reflected as other income in the Statement of Operations.
Fees Paid Indirectly – The fund’s custody fee may be reduced according to an arrangement that measures the value of cash deposited with the custodian by the fund. For the six months ended June 30, 2008, custody fees were not reduced.
Tax Matters and Distributions – The fund intends to qualify as a regulated investment company, as defined under Subchapter M of the Internal Revenue Code, and to distribute all of its taxable income, including realized capital gains. As a result, no provision for federal income tax is required. The fund adopted the provisions of FASB Interpretation No. 48, Accounting for Uncertainty in Income Taxes (“the Interpretation”). The Interpretation prescribes a minimum threshold for financial statement recognition of the benefit of a tax position taken or expected to be taken in a tax return. There was no impact resulting from the adoption of this Interpretation on the fund’s financial statements. Each of the fund’s federal tax returns for the prior three fiscal years remains subject to examination by the Internal Revenue Service. It is the fund’s policy to record interest and penalty charges on underpaid taxes associated with its tax positions as interest expense and miscellaneous expense, respectively. No such charges were recorded in the current financial statements. Foreign taxes, if any, have been accrued by the fund in the accompanying financial statements.
Distributions to shareholders are recorded on the ex-dividend date. Income and capital gain distributions are determined in accordance with income tax regulations, which may differ from U.S. generally accepted accounting principles. Certain capital accounts in the financial statements are periodically adjusted for permanent differences in order to reflect their tax character. These adjustments have no impact on net assets or net asset value per share. Temporary differences which arise from recognizing certain items of income, expense, gain or loss in different periods for financial statement and tax purposes will reverse at some time in the future. Distributions in excess of net investment income or net realized gains are temporary overdistributions for financial statement purposes resulting from differences in the recognition or classification of income or distributions for financial statement and tax purposes.
Book/tax differences primarily relate to wash sale loss deferrals and foreign taxes.
The tax character of distributions made during the current period will be determined at fiscal year end. The tax character of distributions declared to shareholders is as follows:
| 12/31/07 | ||
| Ordinary income (including any short-term capital gains) | $1,603,726 | |
| Long-term capital gain | 3,103,965 | |
| Total distributions | $4,707,691 |
The federal tax cost and the tax basis components of distributable earnings were as follows:
| As of 6/30/08 | |||
| Cost of investments | $53,146,299 | ||
| Gross appreciation | 7,374,911 | ||
| Gross depreciation | (3,404,262 | ) | |
| Net unrealized appreciation (depreciation) | $3,970,649 | ||
| As of 12/31/07 | |||
| Undistributed ordinary income | 824,969 | ||
| Undistributed long-term capital gain | 3,785,341 | ||
| Other temporary differences | (1,767 | ) | |
| Net unrealized appreciation (depreciation) | 10,066,885 | ||
The aggregate cost above includes prior fiscal year end tax adjustments.
Multiple Classes of Shares of Beneficial Interest – The fund offers multiple classes of shares, which differ in their respective distribution fees. The fund’s income, realized and unrealized gain (loss), and common expenses are allocated to shareholders based on the daily net assets of each class, without distinction between share classes. Dividends are declared separately for each class. Differences in per share dividend rates are generally due to differences in separate class expenses.
| (3) | Transactions with Affiliates |
Investment Adviser – The fund has an investment advisory agreement with MFS to provide overall investment management and related administrative services and facilities to the fund. The management fee is computed daily and paid monthly at an annual rate of 1.00% of the fund’s average daily net assets. The investment adviser has agreed in writing to reduce its
13
Table of Contents
Notes to Financial Statements (unaudited) – continued
management fee to 0.90% of average daily net assets in excess of $1 billion. This written agreement may be rescinded only upon consent of the fund’s Board of Trustees. For the six months ended June 30, 2008, the fund’s average daily net assets did not exceed $1 billion and therefore, the management fee was not reduced.
The investment adviser has agreed in writing to pay a portion of the fund’s operating expenses, exclusive of management, distribution, and certain other fees and expenses, such that operating expenses do not exceed 0.15% annually of the fund’s average daily net assets. This written agreement will continue through April 30, 2009 unless changed or rescinded by the fund’s Board of Trustees. For the six months ended June 30, 2008, this reduction amounted to $58,038 and is reflected as a reduction of total expenses in the Statement of Operations.
Distributor – MFS Fund Distributors, Inc. (MFD), a wholly-owned subsidiary of MFS, is the distributor of shares of the fund. The Trustees have adopted a distribution plan for the Service Class shares pursuant to Rule 12b-1 under the Investment Company Act of 1940.
The fund’s distribution plan provides that the fund will pay MFD distribution fees equal to 0.25% per annum of its average daily net assets attributable to Service Class shares as partial consideration for services performed and expenses incurred by MFD and financial intermediaries (including participating insurance companies that invest in the fund to fund variable annuity and variable life insurance contracts, sponsors of qualified retirement and pension plans that invest in the fund, and affiliates of these participating insurance companies and plan sponsors) in connection with the sale and distribution of the Service Class shares. MFD may subsequently pay all, or a portion, of the distribution fees to financial intermediaries.
Shareholder Servicing Agent – MFS Service Center, Inc. (MFSC), a wholly-owned subsidiary of MFS, receives a fee from the fund for its services as shareholder servicing agent. For the six months ended June 30, 2008, the fee was $4,780, which equated to 0.0182% annually of the fund’s average daily net assets. MFSC also receives payment from the fund for out-of-pocket expenses paid by MFSC on behalf of the fund. For the six months ended June 30, 2008, the fund did not incur any out-of-pocket expenses.
Administrator – MFS provides certain financial, legal, shareholder communications, compliance, and other administrative services to the fund. Under an administrative services agreement, the fund partially reimburses MFS the costs incurred to provide these services. The fund is charged a fixed amount plus a fee based on average daily net assets. The fund’s annual fixed amount is $17,500.
The administrative services fee incurred for the six months ended June 30, 2008 was equivalent to an annual effective rate of 0.0339% of the fund’s average daily net assets.
Trustees’ and Officers’ Compensation – The fund pays compensation to independent trustees in the form of a retainer, attendance fees, and additional compensation to Board and Committee chairpersons. The fund does not pay compensation directly to trustees or officers of the fund who are also officers of the investment adviser, all of whom receive remuneration for their services to the fund from MFS. Certain officers and trustees of the fund are officers or directors of MFS, MFD, and MFSC.
Other – This fund and certain other MFS funds (the funds) have entered into a services agreement (the Agreement) which provides for payment of fees by the funds to Tarantino LLC in return for the provision of services of an Independent Chief Compliance Officer (ICCO) for the funds. The ICCO is an officer of the funds and the sole member of Tarantino LLC. The funds can terminate the Agreement with Tarantino LLC at any time under the terms of the Agreement. For the six months ended June 30, 2008, the fee paid by the fund to Tarantino LLC was $159 and is included in miscellaneous expense on the Statement of Operations. MFS has agreed to reimburse the fund for a portion of the payments made by the fund to Tarantino LLC in the amount of $154, which is shown as a reduction of total expenses in the Statement of Operations. Additionally, MFS has agreed to bear all expenses associated with office space, other administrative support, and supplies provided to the ICCO.
| (4) | Portfolio Securities |
Purchases and sales of investments, other than U.S. Government securities, purchased option transactions, and short-term obligations, aggregated $8,570,401, and $7,849,523, respectively.
14
Table of Contents
Notes to Financial Statements (unaudited) – continued
| (5) | Shares of Beneficial Interest |
The fund’s Declaration of Trust permits the Trustees to issue an unlimited number of full and fractional shares of beneficial interest. Transactions in fund shares were as follows:
| Six months ended 6/30/08 | Year ended 12/31/07 | |||||||||||
| Shares | Amount | Shares | Amount | |||||||||
| Shares sold | ||||||||||||
Initial Class | 467,180 | $6,446,225 | 883,086 | $13,713,962 | ||||||||
Service Class | 10,125 | 142,798 | 31,072 | 481,780 | ||||||||
| 477,305 | $6,589,023 | 914,158 | $14,195,742 | |||||||||
| Shares issued to shareholders in reinvestment of distributions | ||||||||||||
Initial Class | 332,827 | $4,556,401 | 317,449 | $4,672,846 | ||||||||
Service Class | 4,043 | 55,388 | 2,364 | 34,845 | ||||||||
| 336,870 | $4,611,789 | 319,813 | $4,707,691 | |||||||||
| Shares reacquired | ||||||||||||
Initial Class | (412,703 | ) | $(5,833,575 | ) | (1,020,908 | ) | $(15,669,492 | ) | ||||
Service Class | (3,240 | ) | (44,973 | ) | (10,397 | ) | (162,343 | ) | ||||
| (415,943 | ) | $(5,878,548 | ) | (1,031,305 | ) | $(15,831,835 | ) | |||||
| Net change | ||||||||||||
Initial Class | 387,304 | $5,169,051 | 179,627 | $2,717,316 | ||||||||
Service Class | 10,928 | 153,213 | 23,039 | 354,282 | ||||||||
| 398,232 | $5,322,264 | 202,666 | $3,071,598 | |||||||||
| (6) | Line of Credit |
The fund and other funds managed by MFS participate in a $1 billion unsecured committed line of credit provided by a syndication of banks under a credit agreement. In addition, the fund and other funds managed by MFS have established uncommitted borrowing arrangements with certain banks. Borrowings may be made for temporary financing needs. Interest is charged to each fund, based on its borrowings, generally at a rate equal to the Federal Reserve funds rate plus 0.30%. In addition, a commitment fee, based on the average daily, unused portion of the committed line of credit, is allocated among the participating funds at the end of each calendar quarter. For the six months ended June 30, 2008, the fund’s commitment fee and interest expense were $123 and $0, respectively, and are included in miscellaneous expense on the Statement of Operations.
15
Table of Contents
BOARD REVIEW OF INVESTMENT ADVISORY AGREEMENT
A discussion regarding the Board’s most recent review and renewal of the fund’s Investment Advisory Agreement with MFS will be available on or about November 1, 2008 by clicking on the fund’s name under “Variable Insurance Portfolios - VIT” in the “Products and Performance” section of the MFS Web site (mfs.com).
PROXY VOTING POLICIES AND INFORMATION
A general description of the MFS funds’ proxy voting policies and procedures is available without charge, upon request, by calling 1-800-225-2606, by visiting the Proxy Voting section of mfs.com or by visiting the SEC’s Web site at http://www.sec.gov.
Information regarding how the fund voted proxies relating to portfolio securities during the most recent twelve-month period ended June 30 is available without charge by visiting the Proxy Voting section of mfs.com or by visiting the SEC’s Web site at http://www.sec.gov.
QUARTERLY PORTFOLIO DISCLOSURE
The fund will file a complete schedule of portfolio holdings with the Securities and Exchange Commission (the Commission) for the first and third quarters of each fiscal year on Form N-Q. The fund’s Form N-Q may be reviewed and copied at the:
Public Reference Room
Securities and Exchange Commission
100 F Street, NE, Room 1580
Washington, D.C. 20549
Information on the operation of the Public Reference Room may be obtained by calling the Commission at 1-800-SEC-0330. The fund’s Form N-Q is available on the EDGAR database on the Commission’s Internet Web site at http://www.sec.gov, and copies of this information may be obtained, upon payment of a duplicating fee, by electronic request at the following e-mail address: publicinfo@sec.gov or by writing the Public Reference Section at the above address.
16
Table of Contents
CONTACT US
Web site
mfs.com
Account service and literature
Shareholders
1-877-411-3325
9 a.m. to 5 p.m. Eastern Time
Investment professionals
1-800-637-8730
8 a.m. to 5 p.m. Eastern Time
Mailing address
MFS Service Center, Inc.
Attn: Institutional Alliance Services (IAS)
P.O. Box 55824
Boston, MA 02205-5824
Overnight mail
MFS Service Center, Inc.
c/o Boston Financial Data Services
30 Dan Road
Canton, MA 02021-2809

Table of Contents

Table of Contents
(formerly MFS® Emerging Growth Series)
This report is prepared for the general information of contract owners. It is authorized for distribution to prospective investors only when preceded or accompanied by a current prospectus.
NOT FDIC INSURED Ÿ MAY LOSE VALUE Ÿ NO BANK OR CREDIT UNION GUARANTEE Ÿ NOT A DEPOSIT Ÿ NOT INSURED BY ANY FEDERAL GOVERNMENT AGENCY OR NCUA/NCUSIF
Table of Contents

Dear Contract Owners:
Negative headlines tend to resonate during difficult markets, and we certainly have had more than our share of tough news recently. As a result consumer, and particularly investor, sentiment are at all-time lows. That said, I do think it is helpful to remember there are always silver linings in the storm clouds if you look hard enough.
Through all of the challenges we have faced, there are some positive underlying trends. In the United States, for example, institutional traders and credit market followers are just now showing increasing signs of confidence and are beginning to take on more risk. At the corporate level, earnings continue to be relatively strong as companies have reduced labor costs, controlled inventories, and relied less on debt to finance expansion. More broadly, low interest rates and strong demand for consumer goods and industrial equipment are good signs for the global economy.
While I do not mean to minimize the risks inherent in today’s markets, periods such as these allow the talented fund managers and research analysts we have at MFS® to test their convictions, reevaluate existing positions, and identify new investment ideas. Our investment process also includes a significant risk management component, with constant attention paid to monitoring market risk, so we can do our best to minimize any surprises to your portfolio.
For investors, this is a great time to check in with your advisor and make sure you have a sound investment plan in place — one that can keep your hard-earned money working over the long term through a strategy that involves asset allocation, diversification, and periodic portfolio rebalancing and reviews. A plan tailored to your distinct needs and goals continues to be the best approach to help you take advantage of the inevitable challenges — and opportunities — that present themselves over time.
Respectfully,

Robert J. Manning
Chief Executive Officer and Chief Investment Officer
MFS Investment Management®
August 15, 2008
The opinions expressed in this letter are subject to change, may not be relied upon for investment advice, and no forecasts can be guaranteed.
1
Table of Contents
Portfolio structure
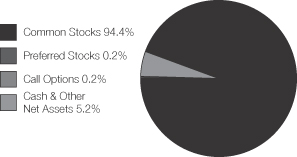
| Top ten holdings | ||
| Google, Inc., “A” | 3.0% | |
| National Oilwell Varco, Inc. | 2.1% | |
| VeriSign, Inc. | 2.0% | |
| Apple, Inc. | 2.0% | |
| Research in Motion Ltd. | 1.9% | |
| Weatherford International Ltd. | 1.8% | |
| Danaher Corp. | 1.8% | |
| Intel Corp. | 1.7% | |
| Lockheed Martin Corp. | 1.6% | |
| CVS Caremark Corp. | 1.5% |
| Equity sectors | ||
| Technology | 20.8% | |
| Energy | 16.4% | |
| Health Care | 11.8% | |
| Industrial Goods & Services | 8.4% | |
| Special Products & Services | 6.5% | |
| Retailing | 6.3% | |
| Consumer Staples | 4.8% | |
| Utilities & Communications | 4.8% | |
| Basic Materials | 4.6% | |
| Leisure | 4.1% | |
| Financial Services | 3.7% | |
| Transportation | 1.5% | |
| Autos & Housing | 0.9% |
Percentages are based on net assets as of 6/30/08.
The portfolio is actively managed and current holdings may be different.
2
Table of Contents
Fund Expenses Borne by the Contract Holders During the Period,
January 1, 2008 through June 30, 2008
As a contract holder of the fund, you incur ongoing costs, including management fees; distribution (12b-1) fees; and other fund expenses. This example is intended to help you understand your ongoing costs (in dollars) of investing in the fund and to compare these costs with the ongoing costs of investing in other mutual funds.
The example is based on an investment of $1,000 invested at the beginning of the period and held for the entire period January 1, 2008 through June 30, 2008.
Actual Expenses
The first line for each share class in the following table provides information about actual account values and actual expenses. You may use the information in this line, together with the amount you invested, to estimate the expenses that you paid over the period. Simply divide your account value by $1,000 (for example, an $8,600 account value divided by $1,000 = 8.6), then multiply the result by the number in the first line under the heading entitled “Expenses Paid During Period” to estimate the expenses you paid on your account during this period.
Hypothetical Example for Comparison Purposes
The second line for each share class in the following table provides information about hypothetical account values and hypothetical expenses based on the fund’s actual expense ratio and an assumed rate of return of 5% per year before expenses, which is not the fund’s actual return. The hypothetical account values and expenses may not be used to estimate the actual ending account balance or expenses you paid for the period. You may use this information to compare the ongoing costs of investing in the fund and other funds. To do so, compare this 5% hypothetical example with the 5% hypothetical examples that appear in the shareholder reports of the other funds.
Please note that the expenses shown in the table are meant to highlight the fund’s ongoing costs only and do not take into account the fees and expenses imposed under the variable contracts through which your investment in the fund is made. Therefore, the second line for each share class in the table is useful in comparing ongoing costs associated with an investment in vehicles (such as the fund) which fund benefits under variable annuity and variable life insurance contracts and to qualified pension and retirement plans only, and will not help you determine the relative total costs of investing in the fund through variable annuity and variable life insurance contracts. If the fees and expenses imposed under the variable contracts were included, your costs would have been higher.
| Share Class | Annualized Expense Ratio | Beginning Account Value 1/01/08 | Ending Account Value 6/30/08 | Expenses Paid During Period (p) 1/01/08-6/30/08 | ||||||
| Initial Class | Actual | 0.84% | $1,000.00 | $952.77 | $4.08 | |||||
| Hypothetical (h) | 0.84% | $1,000.00 | $1,020.69 | $4.22 | ||||||
| Service Class | Actual | 1.09% | $1,000.00 | $951.65 | $5.29 | |||||
| Hypothetical (h) | 1.09% | $1,000.00 | $1,019.44 | $5.47 |
| (h) | 5% class return per year before expenses. |
| (p) | Expenses paid is equal to each class’ annualized expense ratio, as shown above, multiplied by the average account value over the period, multiplied by the number of days in the period, divided by the number of days in the year. |
3
Table of Contents
PORTFOLIO OF INVESTMENTS – 6/30/08 (unaudited)
The Portfolio of Investments is a complete list of all securities owned by your fund. It is categorized by broad-based asset classes.
| Issuer | Shares/Par | Value ($) | |||
| COMMON STOCKS – 94.4% | |||||
| Aerospace – 1.6% | |||||
| Lockheed Martin Corp. | 112,080 | $ | 11,057,812 | ||
| Alcoholic Beverages – 1.0% | |||||
| Molson Coors Brewing Co. | 123,950 | $ | 6,734,203 | ||
| Apparel Manufacturers – 1.1% | |||||
| Li & Fung Ltd. | 418,000 | $ | 1,259,818 | ||
| NIKE, Inc., “B” | 34,536 | 2,058,690 | |||
| Phillips-Van Heusen Corp. | 79,300 | 2,903,965 | |||
| Quiksilver, Inc. (a) | 121,490 | 1,193,031 | |||
| $ | 7,415,504 | ||||
| Automotive – 0.3% | |||||
| BorgWarner Transmission Systems, Inc. | 46,490 | $ | 2,063,225 | ||
| Biotechnology – 4.7% | |||||
| Celgene Corp. (a) | 48,040 | $ | 3,068,315 | ||
| Genentech, Inc. (a) | 125,400 | 9,517,860 | |||
| Genzyme Corp. (a) | 131,670 | 9,482,873 | |||
| Gilead Sciences, Inc. (a) | 184,320 | 9,759,744 | |||
| $ | 31,828,792 | ||||
| Broadcasting – 0.6% | |||||
| Grupo Televisa S.A., ADR | 157,520 | $ | 3,720,622 | ||
| Brokerage & Asset Managers – 3.2% | |||||
| Charles Schwab Corp. | 259,280 | $ | 5,325,611 | ||
| CME Group, Inc. | 6,870 | 2,632,515 | |||
| Deutsche Boerse AG | 29,140 | 3,270,735 | |||
| Goldman Sachs Group, Inc. | 19,080 | 3,337,092 | |||
| Intercontinental Exchange, Inc. (a) | 14,730 | 1,679,220 | |||
| Invesco Ltd. | 212,880 | 5,104,862 | |||
| $ | 21,350,035 | ||||
| Business Services – 3.8% | |||||
| Amdocs Ltd. (a) | 45,830 | $ | 1,348,319 | ||
| CoStar Group, Inc. (a)(l) | 30,560 | 1,358,392 | |||
| LPS Brasil – Consultoria de Imoveis S.A. | 48,500 | 987,131 | |||
| MasterCard, Inc., “A” | 6,090 | 1,617,017 | |||
| Satyam Computer Services Ltd., ADR (l) | 137,390 | 3,368,803 | |||
| Visa, Inc., “A” | 92,290 | 7,504,100 | |||
| Western Union Co. | 380,640 | 9,409,421 | |||
| $ | 25,593,183 | ||||
| Chemicals – 0.5% | |||||
| Monsanto Co. | 24,090 | $ | 3,045,940 | ||
| Computer Software – 4.7% | |||||
| Akamai Technologies, Inc. (a)(l) | 48,310 | $ | 1,680,705 | ||
| Oracle Corp. (a) | 391,710 | 8,225,910 | |||
| Salesforce.com, Inc. (a) | 83,950 | 5,727,909 | |||
| Synopsys, Inc. (a) | 106,690 | 2,550,958 | |||
| VeriSign, Inc. (a) | 348,783 | 13,183,997 | |||
| $ | 31,369,479 | ||||
| Computer Software – Systems – 2.0% | |||||
| Apple Computer, Inc. (a) | 78,490 | $ | 13,142,366 | ||
| Issuer | Shares/Par | Value ($) | |||
| COMMON STOCKS – continued | |||||
| Construction – 0.2% | |||||
| Duratex S.A., IPS | 40,500 | $ | 862,350 | ||
| Pulte Homes, Inc. (l) | 72,630 | 699,427 | |||
| $ | 1,561,777 | ||||
| Consumer Goods & Services – 2.6% | |||||
| Capella Education Co. (a) | 22,420 | $ | 1,337,353 | ||
| ITT Educational Services, Inc. (a)(l) | 33,310 | 2,752,405 | |||
| New Oriental Education & Technology Group, Inc., ADR (a)(l) | 77,230 | 4,511,777 | |||
| Priceline.com, Inc. (a)(l) | 28,610 | 3,303,311 | |||
| Strayer Education, Inc. (l) | 27,610 | 5,772,423 | |||
| $ | 17,677,269 | ||||
| Electrical Equipment – 1.8% | |||||
| Danaher Corp. (l) | 154,160 | $ | 11,916,568 | ||
| Electronics – 6.3% | |||||
| ARM Holdings PLC (l) | 988,630 | $ | 1,666,790 | ||
| First Solar, Inc. (a) | 6,910 | 1,885,186 | |||
| Flextronics International Ltd. (a) | 196,150 | 1,843,810 | |||
| Hittite Microwave Corp. (a) | 73,090 | 2,603,466 | |||
| Intel Corp. | 517,750 | 11,121,270 | |||
| Intersil Corp., “A” | 202,500 | 4,924,800 | |||
| Marvell Technology Group Ltd. (a) | 254,980 | 4,502,947 | |||
| National Semiconductor Corp. | 161,420 | 3,315,567 | |||
| Nintendo Co. Ltd. | 12,600 | 7,117,838 | |||
| SanDisk Corp. (a) | 182,320 | 3,409,384 | |||
| $ | 42,391,058 | ||||
| Energy – Independent – 5.7% | |||||
| Apache Corp. | 65,530 | $ | 9,108,670 | ||
| Chesapeake Energy Corp. (l) | 21,430 | 1,413,523 | |||
| CONSOL Energy, Inc. | 73,000 | 8,203,010 | |||
| Sandridge Energy, Inc. (a) | 29,610 | 1,912,214 | |||
| Ultra Petroleum Corp. (a) | 79,630 | 7,819,666 | |||
| Whiting Petroleum Corp. (a) | 10,380 | 1,101,110 | |||
| XTO Energy, Inc. | 125,162 | 8,574,849 | |||
| $ | 38,133,042 | ||||
| Energy – Integrated – 3.0% | |||||
| Hess Corp. | 82,311 | $ | 10,386,825 | ||
| Petroleo Brasileiro S.A., ADR | 141,090 | 9,993,405 | |||
| $ | 20,380,230 | ||||
| Engineering – Construction – 2.3% | |||||
| Fluor Corp. | 50,230 | $ | 9,346,798 | ||
| Foster Wheeler Ltd. (a) | 43,860 | 3,208,359 | |||
| Quanta Services, Inc. (a) | 82,430 | 2,742,446 | |||
| $ | 15,297,603 | ||||
| Entertainment – 1.0% | |||||
| DreamWorks Animation, Inc., “A” (a) | 215,870 | $ | 6,435,085 | ||
| Food & Beverages – 2.7% | |||||
| General Mills, Inc. | 49,390 | $ | 3,001,430 | ||
4
Table of Contents
Portfolio of Investments (unaudited) – continued
| Issuer | Shares/Par | Value ($) | |||
| COMMON STOCKS – continued | |||||
| Food & Beverages – continued | |||||
| Hain Celestial Group, Inc. (a)(l) | 63,240 | $ | 1,484,875 | ||
| Nestle S.A. | 133,960 | 6,062,644 | |||
| PepsiCo, Inc. | 123,110 | 7,828,565 | |||
| $ | 18,377,514 | ||||
| Food & Drug Stores – 1.5% | |||||
| CVS Caremark Corp. | 262,890 | $ | 10,402,557 | ||
| Furniture & Appliances – 0.4% | |||||
| TiVo, Inc. (a)(l) | 465,960 | $ | 2,874,973 | ||
| Gaming & Lodging – 0.4% | |||||
| International Game Technology | 118,540 | $ | 2,961,129 | ||
| General Merchandise – 0.9% | |||||
| Family Dollar Stores, Inc. (l) | 153,580 | $ | 3,062,385 | ||
| Kohl’s Corp. (a) | 77,920 | 3,119,917 | |||
| $ | 6,182,302 | ||||
| Internet – 3.7% | |||||
| Google, Inc., “A” (a) | 38,580 | $ | 20,309,284 | ||
| Omniture, Inc. (a)(l) | 60,300 | 1,119,771 | |||
| Tencent Holdings Ltd. | 439,400 | 3,398,142 | |||
| $ | 24,827,197 | ||||
| Leisure & Toys – 2.0% | |||||
| Activision, Inc. (a) | 155,290 | $ | 5,290,730 | ||
| Electronic Arts, Inc. (a) | 178,600 | 7,935,198 | |||
| $ | 13,225,928 | ||||
| Machinery & Tools – 2.7% | |||||
| Bucyrus International, Inc., “A” | 129,610 | $ | 9,464,122 | ||
| Flowserve Corp. | 65,600 | 8,967,520 | |||
| $ | 18,431,642 | ||||
| Major Banks – 0.4% | |||||
| Unibanco – Uniao de Bancos Brasileiros S.A., ADR | 13,320 | $ | 1,690,708 | ||
| UnionBanCal Corp. | 22,230 | 898,537 | |||
| $ | 2,589,245 | ||||
| Medical & Health Technology & Services – 2.5% | |||||
| IDEXX Laboratories, Inc. (a)(l) | 169,260 | $ | 8,249,732 | ||
| Medco Health Solutions, Inc. (a) | 127,340 | 6,010,448 | |||
| VCA Antech, Inc. (a) | 101,870 | 2,829,949 | |||
| $ | 17,090,129 | ||||
| Medical Equipment – 3.7% | |||||
| Advanced Medical Optics, Inc. (a)(l) | 200,152 | $ | 3,750,848 | ||
| Becton, Dickinson & Co. | 35,220 | 2,863,386 | |||
| C.R. Bard, Inc. | 42,350 | 3,724,683 | |||
| Conceptus, Inc. (a)(l) | 270,430 | 5,000,251 | |||
| St. Jude Medical, Inc. (a) | 68,080 | 2,783,110 | |||
| Stryker Corp. | 79,660 | 5,009,021 | |||
| Thoratec Corp. (a)(l) | 111,588 | 1,940,515 | |||
| $ | 25,071,814 | ||||
| Issuer | Shares/Par | Value ($) | |||
| COMMON STOCKS – continued | |||||
| Metals & Mining – 2.6% | |||||
| BHP Billiton Ltd., ADR | 51,860 | $ | 4,417,953 | ||
| Century Aluminum Co. (a)(l) | 52,510 | 3,491,390 | |||
| Cleveland-Cliffs, Inc. | 16,520 | 1,969,019 | |||
| Companhia Vale do Rio Doce, ADR | 149,130 | 5,341,837 | |||
| Usinas Siderurgicas de Minas Gerais S.A., IPS | 49,200 | 2,434,118 | |||
| $ | 17,654,317 | ||||
| Network & Telecom – 4.1% | |||||
| Cisco Systems, Inc. (a) | 131,460 | $ | 3,057,760 | ||
| High Tech Computer Corp., GDR | 22,650 | 2,038,500 | |||
| NICE Systems Ltd., ADR (a) | 142,290 | 4,207,515 | |||
| Nokia Corp., ADR | 203,790 | 4,992,855 | |||
| Research in Motion Ltd. (a) | 111,144 | 12,992,734 | |||
| $ | 27,289,364 | ||||
| Oil Services – 7.7% | |||||
| BJ Services Co. | 72,340 | $ | 2,310,540 | ||
| Exterran Holdings, Inc. (a)(l) | 19,729 | 1,410,426 | |||
| Helix Energy Solutions Group, Inc. (a)(l) | 25,300 | 1,053,492 | |||
| National Oilwell Varco, Inc. (a) | 157,771 | 13,997,443 | |||
| Noble Corp. | 159,657 | 10,371,319 | |||
| Oceaneering International, Inc. (a) | 29,400 | 2,265,270 | |||
| Smith International, Inc. | 94,340 | 7,843,428 | |||
| Weatherford International Ltd. (a) | 246,900 | 12,243,771 | |||
| $ | 51,495,689 | ||||
| Other Banks & Diversified Financials – 0.1% | |||||
| Redecard S.A. | 34,200 | $ | 663,739 | ||
| Pharmaceuticals – 0.9% | |||||
| Elan Corp. PLC, ADR (a) | 178,130 | $ | 6,332,522 | ||
| Precious Metals & Minerals – 0.3% | |||||
| Goldcorp, Inc. | 42,820 | $ | 1,976,999 | ||
| Restaurants – 0.1% | |||||
| Red Robin Gourmet Burgers, Inc. (a)(l) | 29,840 | $ | 827,762 | ||
| Special Products & Services – 0.1% | |||||
| Heckmann Corp. (a)(l) | 72,660 | $ | 651,034 | ||
| Specialty Chemicals – 1.0% | |||||
| Airgas, Inc. | 16,790 | $ | 980,368 | ||
| Praxair, Inc. | 61,520 | 5,797,645 | |||
| $ | 6,778,013 | ||||
| Specialty Stores – 2.8% | |||||
| Amazon.com, Inc. (a) | 21,470 | $ | 1,574,395 | ||
| Ctrip.com International Ltd., ADR (l) | 45,290 | 2,073,376 | |||
| Dufry South America Ltd. | 45,300 | 992,923 | |||
| Lowe’s Cos., Inc. | 358,060 | 7,429,745 | |||
| Nordstrom, Inc. (l) | 41,970 | 1,271,691 | |||
| O’Reilly Automotive, Inc. (a) | 105,850 | 2,365,748 | |||
| TJX Cos., Inc. | 108,450 | 3,412,922 | |||
| $ | 19,120,800 | ||||
5
Table of Contents
Portfolio of Investments (unaudited) – continued
| Issuer | Shares/Par | Value ($) | |||
| COMMON STOCKS – continued | |||||
| Telecommunications – Wireless – 1.9% | |||||
| America Movil S.A.B. de C.V., “L”, ADR | 115,240 | $ | 6,078,910 | ||
| Rogers Communications, Inc., “B” | 166,170 | 6,459,672 | |||
| $ | 12,538,582 | ||||
| Telephone Services – 1.7% | |||||
| American Tower Corp., “A” (a) | 159,413 | $ | 6,735,199 | ||
| AT&T, Inc. | 135,410 | 4,561,963 | |||
| $ | 11,297,162 | ||||
| Tobacco – 1.1% | |||||
| Philip Morris International, Inc. | 144,910 | $ | 7,157,105 | ||
| Trucking – 1.5% | |||||
| Expeditors International of Washington, Inc. | 37,910 | $ | 1,630,130 | ||
| J.B. Hunt Transport Services, Inc. (l) | 132,270 | 4,401,946 | |||
| Landstar System, Inc. | 33,020 | 1,823,364 | |||
| Werner Enterprises, Inc. (l) | 122,420 | 2,274,564 | |||
| $ | 10,130,004 | ||||
| Utilities – Electric Power – 1.2% | |||||
| FPL Group, Inc. | 63,970 | $ | 4,195,153 | ||
| NRG Energy, Inc. (a) | 85,780 | 3,679,962 | |||
| $ | 7,875,115 | ||||
| Total Common Stocks (Identified Cost, $583,569,441) | $ | 634,936,430 | |||
| PREFERRED STOCKS – 0.2% | |||||
| Forest & Paper Products – 0.2% | |||||
| Suzano Papel E Celulose S.A., IPS (Identified Cost, $1,604,072) | 92,000 | $ | 1,496,268 | ||
| Issuer/Expiration Date/ Strike Price | Number of Contracts | Value ($) | |||||
| CALL OPTIONS PURCHASED – 0.2% | |||||||
| Elan Corp. Plc – October 2008 @ $30 (a) | 1,395 | $ | 1,129,950 | ||||
| First Solar, Inc. – September 2008 @ $330 (a) | 135 | 243,000 | |||||
| Total Call Options Purchased (Premium Received, $1,034,387) | $ | 1,372,950 | |||||
| Issuer | Shares/Par | ||||||
| REPURCHASE AGREEMENTS – 4.8% | |||||||
| Merrill Lynch, 2.5%, dated 6/30/08, due 7/01/08, total to be received $32,251,240 (secured by U.S. Treasury and Federal Agency obligations and Mortgage Backed securities in a jointly traded account), at Cost | $ | 32,249,000 | $ | 32,249,000 | |||
| COLLATERAL FOR SECURITIES LOANED – 10.3% | |||||||
| Navigator Securities Lending Prime Portfolio, at Cost and Net Asset Value | 69,054,627 | $ | 69,054,627 | ||||
| Total Investments (Identified Cost, $687,511,527) | $ | 739,109,275 | |||||
| OTHER ASSETS, LESS LIABILITIES – (9.9)% | (66,448,359 | ) | |||||
| Net Assets – 100.0% | $ | 672,660,916 | |||||
| (a) | Non-income producing security. |
| (l) | All or a portion of this security is on loan. |
The following abbreviations are used in this report and are defined:
| ADR | American Depository Receipt |
| GDR | Global Depository Receipt |
| IPS | International Preference Stock |
See Notes to Financial Statements
6
Table of Contents
FINANCIAL STATEMENTS | STATEMENT OF ASSETS AND LIABILITIES (unaudited)
This statement represents your fund’s balance sheet, which details the assets and liabilities comprising the total value of the fund.
At 6/30/08 | |||||
Assets | |||||
Investments, at value, including $67,985,570 of securities on loan (identified cost, $687,511,527) | $739,109,275 | ||||
Cash | 431,461 | ||||
Foreign currency, at value (identified cost, $71,424) | 72,691 | ||||
Receivable for investments sold | 8,373,466 | ||||
Receivable for fund shares sold | 13,066,359 | ||||
Interest and dividends receivable | 370,720 | ||||
Other assets | 4,762 | ||||
Total assets | $761,428,734 | ||||
Liabilities | |||||
Payable for investments purchased | $19,048,573 | ||||
Payable for fund shares reacquired | 348,167 | ||||
Collateral for securities loaned, at value (c) | 69,054,627 | ||||
Payable to affiliates | |||||
Management fee | 54,167 | ||||
Shareholder servicing costs | 1,164 | ||||
Distribution fees | 770 | ||||
Administrative services fee | 1,000 | ||||
Payable for independent trustees’ compensation | 2,663 | ||||
Accrued expenses and other liabilities | 256,687 | ||||
Total liabilities | $88,767,818 | ||||
Net assets | $672,660,916 | ||||
Net assets consist of | |||||
Paid-in capital | $1,128,736,066 | ||||
Unrealized appreciation (depreciation) on investments and translation of assets and liabilities in foreign currencies | 51,597,765 | ||||
Accumulated net realized gain (loss) on investments and foreign currency transactions | (508,432,044 | ) | |||
Undistributed net investment income | 759,129 | ||||
Net assets | $672,660,916 | ||||
Shares of beneficial interest outstanding | 28,303,781 | ||||
Initial Class shares | |||||
Net assets | $644,552,884 | ||||
Shares outstanding | 27,103,716 | ||||
Net asset value per share | $23.78 | ||||
Service Class shares | |||||
Net assets | $28,108,032 | ||||
Shares outstanding | 1,200,065 | ||||
Net asset value per share | $23.42 |
| (c) | Non-cash collateral is not included. |
See Notes to Financial Statements
7
Table of Contents
FINANCIAL STATEMENTS | STATEMENT OF OPERATIONS (unaudited)
This statement describes how much your fund earned in investment income and accrued in expenses. It also describes any gains and/or losses generated by fund operations.
| Six months ended 6/30/08 | ||||||
| Net investment income | ||||||
Income | ||||||
Dividends | $3,098,723 | |||||
Interest | 344,633 | |||||
Income on securities loaned | 256,354 | |||||
Foreign taxes withheld | (128,809 | ) | ||||
Total investment income | $3,570,901 | |||||
Expenses | ||||||
Management fee | $2,490,757 | |||||
Distribution fees | 35,199 | |||||
Shareholder servicing costs | 60,382 | |||||
Administrative services fee | 45,952 | |||||
Independent trustees’ compensation | 9,903 | |||||
Custodian fee | 73,591 | |||||
Shareholder communications | 57,186 | |||||
Auditing fees | 23,268 | |||||
Legal fees | 5,622 | |||||
Miscellaneous | 11,218 | |||||
Total expenses | $2,813,078 | |||||
Reduction of expenses by investment adviser | (1,939 | ) | ||||
Net expenses | $2,811,139 | |||||
Net investment income | $759,762 | |||||
Realized and unrealized gain (loss) on investments | ||||||
Realized gain (loss) (identified cost basis) | ||||||
Investment transactions | $12,386,397 | |||||
Foreign currency transactions | (55,426 | ) | ||||
Net realized gain (loss) on investments and foreign currency transactions | $12,330,971 | |||||
Change in unrealized appreciation (depreciation) | ||||||
Investments | $(49,056,665 | ) | ||||
Translation of assets and liabilities in foreign currencies | (388 | ) | ||||
Net unrealized gain (loss) on investments and foreign currency translation | $(49,057,053 | ) | ||||
Net realized and unrealized gain (loss) on investments and foreign currency | $(36,726,082 | ) | ||||
Change in net assets from operations | $(35,966,320 | ) |
See Notes to Financial Statements
8
Table of Contents
FINANCIAL STATEMENTS | STATEMENTS OF CHANGES IN NET ASSETS
These statements describe the increases and/or decreases in net assets resulting from operations, any distributions, and any shareholder transactions.
| Six months ended 6/30/08 (unaudited | ) | Year ended 12/31/07 | | |||
Change in net assets | ||||||
From operations | ||||||
Net investment income | $759,762 | $1,325,116 | ||||
Net realized gain (loss) on investments and foreign currency transactions | 12,330,971 | 105,402,550 | ||||
Net unrealized gain (loss) on investments and foreign currency translation | (49,057,053 | ) | 28,830,264 | |||
Change in net assets from operations | $(35,966,320 | ) | $135,557,930 | |||
Distributions declared to shareholders | ||||||
From net investment income – Initial Class | $(1,293,514 | ) | $— | |||
Change in net assets from fund share transactions | $(32,195,746 | ) | $(95,812,262 | ) | ||
Total change in net assets | $(69,455,580 | ) | $39,745,668 | |||
Net assets | ||||||
At beginning of period | 742,116,496 | 702,370,828 | ||||
At end of period (including undistributed net investment income of $759,129 and | $672,660,916 | $742,116,496 |
See Notes to Financial Statements
9
Table of Contents
FINANCIAL STATEMENTS | FINANCIAL HIGHLIGHTS
The financial highlights table is intended to help you understand the fund’s financial performance for the semiannual period and the past 5 fiscal years. Certain information reflects financial results for a single fund share. The total returns in the table represent the rate by which an investor would have earned (or lost) on an investment in the fund share class (assuming reinvestment of all distributions) held for the entire period.
| Initial Class | Six months ended 6/30/08 | Years ended 12/31 | |||||||||||||||
| 2007 | 2006 | 2005 | 2004 | 2003 | |||||||||||||
| (unaudited) | |||||||||||||||||
Net asset value, beginning of period | $25.01 | $20.64 | $19.13 | $17.52 | $15.51 | $11.91 | |||||||||||
Income (loss) from investment operations | |||||||||||||||||
Net investment income (loss) (d) | $0.03 | $0.05 | $(0.03 | ) | $(0.05 | ) | $(0.03 | ) | $(0.03 | ) | |||||||
Net realized and unrealized gain (loss) on investments and foreign currency | (1.21 | ) | 4.32 | 1.54 | 1.66 | 2.04 | 3.63 | ||||||||||
Total from investment operations | $(1.18 | ) | $4.37 | $1.51 | $1.61 | $2.01 | $3.60 | ||||||||||
Less distributions declared to shareholders | |||||||||||||||||
From net investment income | $(0.05 | ) | $— | $— | $— | $— | $— | ||||||||||
Net asset value, end of period | $23.78 | $25.01 | $20.64 | $19.13 | $17.52 | $15.51 | |||||||||||
Total return (%) (k)(r)(s) | (4.72 | )(n) | 21.17 | 7.89 | 9.19 | 12.96 | (b) | 30.23 | (j) | ||||||||
| Ratios (%) (to average net assets) and Supplemental data: | |||||||||||||||||
Expenses before expense reductions (f) | 0.84 | (a) | 0.87 | 0.87 | 0.88 | 0.87 | 0.87 | ||||||||||
Expenses after expense reductions (f) | 0.84 | (a) | 0.87 | 0.87 | 0.88 | 0.87 | N/A | ||||||||||
Net investment income (loss) | 0.24 | (a) | 0.20 | (0.14 | ) | (0.29 | ) | (0.17 | ) | (0.22 | ) | ||||||
Portfolio turnover | 52 | 84 | 127 | 95 | 99 | 103 | |||||||||||
Net assets at end of period (000 Omitted) | $644,553 | $711,418 | $667,776 | $761,444 | $830,410 | $849,718 | |||||||||||
See Notes to Financial Statements
10
Table of Contents
Financial Highlights – continued
| Service Class | Six months ended 6/30/08 | Years ended 12/31 | ||||||||||||||||
| 2007 | 2006 | 2005 | 2004 | 2003 | ||||||||||||||
| (unaudited) | ||||||||||||||||||
Net asset value, beginning of period | $24.61 | $20.36 | $18.92 | $17.37 | $15.41 | $11.86 | ||||||||||||
Income (loss) from investment operations | ||||||||||||||||||
Net investment income (loss) (d) | $(0.00 | )(w) | $(0.01 | ) | $(0.07 | ) | $(0.09 | ) | $(0.07 | ) | $(0.06 | ) | ||||||
Net realized and unrealized gain (loss) on | (1.19 | ) | 4.26 | 1.51 | 1.64 | 2.03 | 3.61 | |||||||||||
Total from investment operations | $(1.19 | ) | $4.25 | $1.44 | $1.55 | $1.96 | $3.55 | |||||||||||
Net asset value, end of period | $23.42 | $24.61 | $20.36 | $18.92 | $17.37 | $15.41 | ||||||||||||
Total return (%) (k)(r)(s) | (4.84 | )(n) | 20.87 | 7.61 | 8.92 | 12.72 | (b) | 29.93 | (j) | |||||||||
| Ratios (%) (to average net assets) and Supplemental data: | ||||||||||||||||||
Expenses before expense reductions (f) | 1.09 | (a) | 1.12 | 1.12 | 1.13 | 1.12 | 1.12 | |||||||||||
Expenses after expense reductions (f) | 1.09 | (a) | 1.12 | 1.12 | 1.13 | 1.12 | N/A | |||||||||||
Net investment loss | (0.01 | )(a) | (0.05 | ) | (0.39 | ) | (0.53 | ) | (0.41 | ) | (0.47 | ) | ||||||
Portfolio turnover | 52 | 84 | 127 | 95 | 99 | 103 | ||||||||||||
Net assets at end of period (000 Omitted) | $28,108 | $30,698 | $34,595 | $32,332 | $30,996 | $27,771 | ||||||||||||
| (a) | Annualized. |
| (b) | The fund’s net asset value and total return calculation include a non-recurring accrual recorded as a result of an administrative proceeding regarding disclosure of brokerage allocation practices in connection with fund sales. The non-recurring accrual resulted in an increase in the net asset value of $0.01 per share based on shares outstanding on the day the proceeds were recorded. |
| (d) | Per share data are based on average shares outstanding. |
| (f) | Ratios do not reflect reductions from fees paid indirectly, if applicable. |
| (j) | The fund’s net asset value and total return calculation include proceeds received on March 26, 2003 for the partial payment of a non-recurring litigation settlement from Cendant Corporation, recorded as a realized gain on investment transactions. The proceeds resulted in an increase in the net asset value of $0.09 per share based on shares outstanding on the day the proceeds were received. Excluding the effect of this payment from the ending net asset value per share, the Initial Class and Service Class shares total returns for the year ended December 31, 2003 would have each been lower by approximately 0.75%. |
| (k) | The total return does not reflect expenses that apply to separate accounts. Inclusion of these charges would reduce the total return figures for all periods shown. |
| (n) | Not annualized. |
| (r) | Certain expenses have been reduced without which performance would have been lower. |
| (s) | From time to time the fund may receive proceeds from litigation settlements, without which performance would be lower. |
| (w) | Per share amount was less than $0.01. |
See Notes to Financial Statements
11
Table of Contents
NOTES TO FINANCIAL STATEMENTS (unaudited)
| (1) | Business and Organization |
MFS Growth Series (formerly MFS Emerging Growth Series) (the fund) is a series of MFS Variable Insurance Trust (the trust). The trust is organized as a Massachusetts business trust and is registered under the Investment Company Act of 1940, as amended, as an open-end management investment company. The shareholders of each series of the trust are separate accounts of insurance companies, which offer variable annuity and/or life insurance products, and qualified retirement and pension plans.
| (2) | Significant Accounting Policies |
General – The preparation of financial statements in conformity with U.S. generally accepted accounting principles requires management to make estimates and assumptions that affect the reported amounts of assets and liabilities, and disclosure of contingent assets and liabilities at the date of the financial statements and the reported amounts of revenues and expenses during the reporting period. Actual results could differ from those estimates. The fund can invest in foreign securities, including securities of emerging market issuers. Investments in foreign securities are vulnerable to the effects of changes in the relative values of the local currency and the U.S. dollar and to the effects of changes in each country’s legal, political, and economic environment. The markets of emerging markets countries are generally more volatile than the markets of developed countries with more mature economies. All of the risks of investing in foreign securities previously described are heightened when investing in emerging markets countries.
Investment Valuations – Equity securities, including restricted equity securities, are generally valued at the last sale or official closing price as reported by an independent pricing service on the market or exchange on which they are primarily traded. For securities for which there were no sales reported that day, equity securities are generally valued at the last quoted daily bid quotation as reported by an independent pricing service on the market or exchange on which they are primarily traded. For securities held short for which there were no sales reported for the day, the position is generally valued at the last quoted daily ask quotation as reported by an independent pricing service on the market or exchange on which such securities are primarily traded. Short-term instruments with a maturity at issuance of 60 days or less may be valued at amortized cost, which approximates market value. Exchange-traded options are generally valued at the last sale or official closing price as reported by an independent pricing service on the exchange on which such options are primarily traded. Exchange-traded options for which there were no sales reported that day are generally valued at the last daily bid quotation as reported by an independent pricing service on the exchange on which such options are primarily traded. Options not traded on an exchange are generally valued at a broker-dealer bid quotation. Foreign currency options are generally valued using an external pricing model that uses market data from an independent source. Open-end investment companies are generally valued at net asset value per share. Securities and other assets generally valued on the basis of information from an independent pricing service may also be valued at a broker-dealer bid quotation. Values obtained from pricing services can utilize both dealer-supplied valuations and electronic data processing techniques, which take into account factors such as institutional-size trading in similar groups of securities, yield, quality, coupon rate, maturity, type of issue, trading characteristics, and other market data. The values of foreign securities and other assets and liabilities expressed in foreign currencies are converted to U.S. dollars using the mean of bid and asked prices for rates reported by an independent pricing service.
The Board of Trustees has delegated primary responsibility for determining or causing to be determined the value of the fund’s investments (including any fair valuation) to the adviser pursuant to valuation policies and procedures approved by the Board. If the adviser determines that reliable market quotations are not readily available, investments are valued at fair value as determined in good faith by the adviser in accordance with such procedures under the oversight of the Board of Trustees. Under the fund’s valuation policies and procedures, market quotations are not considered to be readily available for most types of debt instruments and floating rate loans and many types of derivatives. These investments are generally valued at fair value based on information from independent pricing services. In addition, investments may be valued at fair value if the adviser determines that an investment’s value has been materially affected by events occurring after the close of the exchange or market on which the investment is principally traded (such as foreign exchange or market) and prior to the determination of the fund’s net asset value, or after the halting of trading of a specific security where trading does not resume prior to the close of the exchange or market on which the security is principally traded. Events that occur on a frequent basis after foreign markets close (such as developments in foreign markets and significant movements in the U.S. markets) and prior to the determination of the fund’s net asset value may be deemed to have a material affect on the value of securities traded in foreign markets. Accordingly, the fund’s foreign equity securities may often be valued at fair value. The adviser may rely on independent pricing services or other information (such as the correlation with price movements of similar securities in the same or other markets; the type, cost and investment characteristics of the security; the business and financial condition of the issuer; and trading and other market data) to assist in determining whether to fair value and at what value to fair value an investment. The value of an investment for purposes of calculating the fund’s net asset value can differ depending on the source and method used to determine value. When fair valuation is used, the value of investments used to determine the fund’s net asset value may differ from quoted or published prices for the same investments.
12
Table of Contents
Notes to Financial Statements (unaudited) – continued
The fund adopted FASB Statement No. 157, Fair Value Measurements (the “Statement”) in this reporting period. This Statement provides a single definition of fair value, a hierarchy for measuring fair value and expanded disclosures about fair value measurements.
Various inputs are used in determining the value of the fund’s assets or liabilities carried at market value. These inputs are categorized into three broad levels. Level 1 includes quoted prices in active markets for identical assets or liabilities. Level 2 includes other significant observable market-based inputs (including quoted prices for similar securities, interest rates, prepayment speed, and credit risk). Level 3 includes unobservable inputs, which may include the adviser’s own assumptions in determining the fair value of investments. Other financial instruments are derivative instruments not reflected in total investments, such as futures, forwards, swap contracts and written options, which are valued at the unrealized appreciation/depreciation on the instrument. The following is a summary of the levels used as of June 30, 2008 in valuing the fund’s assets or liabilities carried at market value:
| Level 1 | Level 2 | Level 3 | Total | |||||
Investments in Securities | $632,868,123 | $106,241,152 | $— | $739,109,275 | ||||
| Other Financial Instruments | $— | $— | $— | $— |
Repurchase Agreements – The fund may enter into repurchase agreements with institutions that the fund’s investment adviser has determined are creditworthy. Each repurchase agreement is recorded at cost. The fund requires that the securities collateral in a repurchase transaction be transferred to a custodian in a manner sufficient to enable the fund to obtain those securities in the event of a default under the repurchase agreement. The fund monitors, on a daily basis, the value of the collateral to ensure that its value, including accrued interest, is greater than amounts owed to the fund under each such repurchase agreement. The fund and other funds managed by Massachusetts Financial Services Company (MFS), may utilize a joint trading account for the purpose of entering into one or more repurchase agreements.
Foreign Currency Translation – Purchases and sales of foreign investments, income, and expenses are converted into U.S. dollars based upon currency exchange rates prevailing on the respective dates of such transactions. Gains and losses attributable to foreign currency exchange rates on sales of securities are recorded for financial statement purposes as net realized gains and losses on investments. Gains and losses attributable to foreign exchange rate movements on income and expenses are recorded for financial statement purposes as foreign currency transaction gains and losses. That portion of both realized and unrealized gains and losses on investments that results from fluctuations in foreign currency exchange rates is not separately disclosed.
Derivative Risk – The fund may invest in derivatives for hedging or non-hedging purposes. While hedging can reduce or eliminate losses, it can also reduce or eliminate gains. When the fund uses derivatives as an investment to gain market exposure, or for hedging purposes, gains and losses from derivative instruments may be substantially greater than the derivative’s original cost. Cash that has been segregated on behalf of certain derivative contracts will be reported separately on the Statement of Assets and Liabilities as restricted cash. On certain over-the-counter derivatives, the fund attempts to reduce its exposure to counterparty credit risk by entering into an ISDA Master Agreement on a bilateral basis with each of the counterparties with whom it undertakes a significant volume of transactions. The ISDA Master Agreement gives the fund the right, upon an event of default by the applicable counterparty, to close out all transactions traded under such agreement and to net amounts owed under each transaction to one net amount payable by one party to the other. This right to close out and net payments across all transactions traded under the ISDA Master Agreement could result in a reduction of the fund’s credit risk to such counterparty equal to any amounts payable by the fund under the applicable transactions, if any. However, absent an event of default by the counterparty, the ISDA Master Agreement does not result in an offset of reported balance sheet assets and liabilities across transactions between the fund and the applicable counterparty. Derivative instruments include purchased options.
Purchased Options – The fund may purchase call or put options for a premium. Purchasing call options may be a hedge against an anticipated increase in the dollar cost of securities to be acquired or to increase the fund’s exposure to the underlying instrument. Purchasing put options may hedge against a decline in the value of portfolio securities. The premium paid is included as an investment in the Statement of Assets and Liabilities and is subsequently adjusted to the current value of the option. Premiums paid for purchased options which have expired are treated as realized losses on investments in the Statement of Operations. Premiums paid for purchased options which are exercised or closed are added to the amount paid or offset against the proceeds on the underlying security or financial instrument to determine the realized gain or loss. The risk of loss associated with purchased options is limited to the premium paid.
In March 2008, FASB Statement No. 161, Disclosures about Derivative Instruments and Hedging Activities (the “Standard”) was issued, and is effective for financial statements issued for fiscal years and interim periods beginning after November 15, 2008. This Standard provides enhanced disclosures about the fund’s use of and accounting for derivative instruments and the effect
13
Table of Contents
Notes to Financial Statements (unaudited) – continued
of derivative instruments on the fund’s results of operations and financial position. Management is evaluating the application of the Standard to the fund, and has not at this time determined the impact, if any, resulting from the adoption of this Standard on the fund’s financial statements.
Security Loans – State Street Bank and Trust Company (“State Street”), as lending agent, may loan the securities of the fund to certain qualified institutions (the “Borrowers”) approved by the fund. The loans are collateralized at all times by cash and/or U.S. Treasury and federal agency obligations in an amount at least equal to the market value of the securities loaned. State Street provides the fund with indemnification against Borrower default. The fund bears the risk of loss with respect to the investment of cash collateral. On loans collateralized by cash, the cash collateral is invested in a money market fund or short-term securities. A portion of the income generated upon investment of the collateral is remitted to the Borrowers, and the remainder is allocated between the fund and the lending agent. On loans collateralized by U.S. Treasury and/or federal agency obligations, a fee is received from the Borrower, and is allocated between the fund and the lending agent. Net income from securities lending is separately reported on the Statement of Operations. The dividend and interest income earned on the securities loaned is accounted for in the same manner as other dividend and interest income.
At June 30, 2008, the value of securities loaned was $67,985,570. These loans were collateralized by cash of $69,054,627 and U.S. Treasury obligations of $671,232.
Indemnifications – Under the fund’s organizational documents, its officers and trustees may be indemnified against certain liabilities and expenses arising out of the performance of their duties to the fund. Additionally, in the normal course of business, the fund enters into agreements with service providers that may contain indemnification clauses. The fund’s maximum exposure under these agreements is unknown as this would involve future claims that may be made against the fund that have not yet occurred.
Investment Transactions and Income – Investment transactions are recorded on the trade date. Interest income is recorded on the accrual basis. All premium and discount is amortized or accreted for financial statement purposes in accordance with U.S. generally accepted accounting principles. Dividends received in cash are recorded on the ex-dividend date. Certain dividends from foreign securities will be recorded when the fund is informed of the dividend if such information is obtained subsequent to the ex-dividend date. Dividend and interest payments received in additional securities are recorded on the ex-dividend or ex-interest date in an amount equal to the value of the security on such date. The fund may receive proceeds from litigation settlements. Any proceeds received from litigation involving portfolio holdings are reflected in the Statement of Operations in realized gain/loss if the security has been disposed of by the fund or in unrealized gain/loss if the security is still held by the fund. Any other proceeds from litigation not related to portfolio holdings are reflected as other income in the Statement of Operations.
Fees Paid Indirectly – The fund’s custody fee may be reduced according to an arrangement that measures the value of cash deposited with the custodian by the fund. For the six months ended June 30, 2008, custody fees were not reduced.
Tax Matters and Distributions – The fund intends to qualify as a regulated investment company, as defined under Subchapter M of the Internal Revenue Code, and to distribute all of its taxable income, including realized capital gains. As a result, no provision for federal income tax is required. The fund adopted the provisions of FASB Interpretation No. 48, Accounting for Uncertainty in Income Taxes (“the Interpretation”). The Interpretation prescribes a minimum threshold for financial statement recognition of the benefit of a tax position taken or expected to be taken in a tax return. There was no impact resulting from the adoption of this Interpretation on the fund’s financial statements. Each of the fund’s federal tax returns for the prior three fiscal years remains subject to examination by the Internal Revenue Service. It is the fund’s policy to record interest and penalty charges on underpaid taxes associated with its tax positions as interest expense and miscellaneous expense, respectively. No such charges were recorded in the current financial statements. Foreign taxes, if any, have been accrued by the fund in the accompanying financial statements.
Distributions to shareholders are recorded on the ex-dividend date. Income and capital gain distributions are determined in accordance with income tax regulations, which may differ from U.S. generally accepted accounting principles. Certain capital accounts in the financial statements are periodically adjusted for permanent differences in order to reflect their tax character. These adjustments have no impact on net assets or net asset value per share. Temporary differences which arise from recognizing certain items of income, expense, gain or loss in different periods for financial statement and tax purposes will reverse at some time in the future. Distributions in excess of net investment income or net realized gains are temporary overdistributions for financial statement purposes resulting from differences in the recognition or classification of income or distributions for financial statement and tax purposes.
Book/tax differences primarily relate to wash sale loss deferrals.
14
Table of Contents
Notes to Financial Statements (unaudited) – continued
The tax character of distributions made during the current period will be determined at fiscal year end. The fund declared no distributions for the year ended December 31, 2007.
The federal tax cost and the tax basis components of distributable earnings were as follows:
| As of 6/30/08 | |||
| Cost of investments | $687,881,854 | ||
| Gross appreciation | 86,818,022 | ||
| Gross depreciation | (35,590,601 | ) | |
| Net unrealized appreciation (depreciation) | $51,227,421 | ||
| As of 12/31/07 | |||
| Undistributed ordinary income | 1,292,881 | ||
| Capital loss carryforwards | (520,040,394 | ) | |
| Other temporary differences | (351,889 | ) | |
| Net unrealized appreciation (depreciation) | 100,284,086 | ||
The aggregate cost above includes prior fiscal year end tax adjustments.
As of December 31, 2007, the fund had capital loss carryforwards available to offset future realized gains. Such losses expire as follows:
| 12/31/09 | $(116,162,407 | ) | |
| 12/31/10 | (403,877,987 | ) | |
| $(520,040,394 | ) |
Multiple Classes of Shares of Beneficial Interest – The fund offers multiple classes of shares, which differ in their respective distribution fees. The fund’s income, realized and unrealized gain (loss), and common expenses are allocated to shareholders based on the daily net assets of each class, without distinction between share classes. Dividends are declared separately for each class. Differences in per share dividend rates are generally due to differences in separate class expenses.
| (3) | Transactions with Affiliates |
Investment Adviser – The fund has an investment advisory agreement with Massachusetts Financial Services Company (MFS) to provide overall investment management and related administrative services and facilities to the fund. The management fee is computed daily and paid monthly at an annual rate of 0.75% of the fund’s average daily net assets.
The investment adviser has agreed in writing to reduce its management fee to 0.65% of average daily net assets in excess of $1 billion. This written agreement may be rescinded only upon consent of the fund’s Board of Trustees. For the six months ended June 30, 2008, the fund’s average daily net assets did not exceed $1 billion and therefore, the management fee was not reduced.
Distributor – MFS Fund Distributors, Inc. (MFD), a wholly-owned subsidiary of MFS, is the distributor of shares of the fund. The Trustees have adopted a distribution plan for the Service Class shares pursuant to Rule 12b-1 under the Investment Company Act of 1940.
The fund’s distribution plan provides that the fund will pay MFD distribution fees equal to 0.25% per annum of its average daily net assets attributable to Service Class shares as partial consideration for services performed and expenses incurred by MFD and financial intermediaries (including participating insurance companies that invest in the fund to fund variable annuity and variable life insurance contracts, sponsors of qualified retirement and pension plans that invest in the fund, and affiliates of these participating insurance companies and plan sponsors) in connection with the sale and distribution of the Service Class shares. MFD may subsequently pay all, or a portion, of the distribution fees to financial intermediaries.
Shareholder Servicing Agent – MFS Service Center, Inc. (MFSC), a wholly-owned subsidiary of MFS, receives a fee from the fund for its services as shareholder servicing agent. For the six months ended June 30, 2008, the fee was $60,355, which equated to 0.0182% annually of the fund’s average daily net assets. MFSC also receives payment from the fund for out-of-pocket expenses paid by MFSC on behalf of the fund. For the six months ended June 30, 2008, these costs amounted to $27.
Administrator – MFS provides certain financial, legal, shareholder communications, compliance, and other administrative services to the fund. Under an administrative services agreement, the fund partially reimburses MFS the costs incurred to provide these services. The fund is charged a fixed amount plus a fee based on average daily net assets. The fund’s annual fixed amount is $17,500.
15
Table of Contents
Notes to Financial Statements (unaudited) – continued
The administrative services fee incurred for the six months ended June 30, 2008 was equivalent to an annual effective rate of 0.0138% of the fund’s average daily net assets.
Trustees’ and Officers’ Compensation – The fund pays compensation to independent trustees in the form of a retainer, attendance fees, and additional compensation to Board and Committee chairpersons. The fund does not pay compensation directly to trustees or officers of the fund who are also officers of the investment adviser, all of whom receive remuneration for their services to the fund from MFS. Certain officers and trustees of the fund are officers or directors of MFS, MFD, and MFSC.
Other – This fund and certain other MFS funds (the funds) have entered into a services agreement (the Agreement) which provides for payment of fees by the funds to Tarantino LLC in return for the provision of services of an Independent Chief Compliance Officer (ICCO) for the funds. The ICCO is an officer of the funds and the sole member of Tarantino LLC. The funds can terminate the Agreement with Tarantino LLC at any time under the terms of the Agreement. For the six months ended June 30, 2008, the fee paid by the fund to Tarantino LLC was $1,957 and is included in miscellaneous expense on the Statement of Operations. MFS has agreed to reimburse the fund for a portion of the payments made by the fund to Tarantino LLC in the amount of $1,939, which is shown as a reduction of total expenses in the Statement of Operations. Additionally, MFS has agreed to bear all expenses associated with office space, other administrative support, and supplies provided to the ICCO.
| (4) | Portfolio Securities |
Purchases and sales of investments, other than U.S. Government securities, purchased option transactions, and short-term obligations, aggregated $342,174,858 and $385,048,836, respectively.
| (5) | Shares of Beneficial Interest |
The fund’s Declaration of Trust permits the Trustees to issue an unlimited number of full and fractional shares of beneficial interest. Transactions in fund shares were as follows:
| Six months ended 6/30/08 | Year ended 12/31/07 | |||||||||||
| Shares | Amount | Shares | Amount | |||||||||
| Shares sold | ||||||||||||
Initial Class | 2,048,312 | $48,861,583 | 2,578,875 | $60,984,061 | ||||||||
Service Class | 158,880 | 3,633,449 | 444,907 | 10,121,772 | ||||||||
| 2,207,192 | $52,495,032 | 3,023,782 | $71,105,833 | |||||||||
| Shares issued to shareholders in reinvestment of distributions | ||||||||||||
Initial Class | 46,829 | $1,088,771 | — | $— | ||||||||
| 46,829 | $1,088,771 | — | $— | |||||||||
| Shares reacquired | ||||||||||||
Initial Class | (3,438,542 | ) | $(80,989,573 | ) | (6,487,098 | ) | $(147,064,670 | ) | ||||
Service Class | (206,129 | ) | (4,789,976 | ) | (896,676 | ) | (19,853,425 | ) | ||||
| (3,644,671 | ) | $(85,779,549 | ) | (7,383,774 | ) | $(166,918,095 | ) | |||||
| Net change | ||||||||||||
Initial Class | (1,343,401 | ) | $(31,039,219 | ) | (3,908,223 | ) | $(86,080,609 | ) | ||||
Service Class | (47,249 | ) | (1,156,527 | ) | (451,769 | ) | (9,731,653 | ) | ||||
| (1,390,650 | ) | $(32,195,746 | ) | (4,359,992 | ) | $(95,812,262 | ) | |||||
| (6) | Line of Credit |
The fund and other funds managed by MFS participate in a $1 billion unsecured committed line of credit provided by a syndication of banks under a credit agreement. In addition, the fund and other funds managed by MFS have established uncommitted borrowing arrangements with certain banks. Borrowings may be made for temporary financing needs. Interest is charged to each fund, based on its borrowings, generally at a rate equal to the Federal Reserve funds rate plus 0.30%. In addition, a commitment fee, based on the average daily, unused portion of the committed line of credit, is allocated among the participating funds at the end of each calendar quarter. For the six months ended June 30, 2008, the fund’s commitment fee and interest expense were $1,520 and $0, respectively, and are included in miscellaneous expense on the Statement of Operations.
16
Table of Contents
BOARD REVIEW OF INVESTMENT ADVISORY AGREEMENT
A discussion regarding the Board’s most recent review and renewal of the fund’s Investment Advisory Agreement with MFS will be available on or about November 1, 2008 by clicking on the fund’s name under “Variable Insurance Portfolios - VIT” in the “Products and Performance” section of the MFS Web site (mfs.com).
PROXY VOTING POLICIES AND INFORMATION
A general description of the MFS funds’ proxy voting policies and procedures is available without charge, upon request, by calling
1-800-225-2606, by visiting the Proxy Voting section of mfs.com or by visiting the SEC’s Web site at http://www.sec.gov.
Information regarding how the fund voted proxies relating to portfolio securities during the most recent twelve-month period ended June 30 is available without charge by visiting the Proxy Voting section of mfs.com or by visiting the SEC’s Web site at http://www.sec.gov.
QUARTERLY PORTFOLIO DISCLOSURE
The fund will file a complete schedule of portfolio holdings with the Securities and Exchange Commission (the Commission) for the first and third quarters of each fiscal year on Form N-Q. The fund’s Form N-Q may be reviewed and copied at the:
Public Reference Room
Securities and Exchange Commission
100 F Street, NE, Room 1580
Washington, D.C. 20549
Information on the operation of the Public Reference Room may be obtained by calling the Commission at 1-800-SEC-0330. The fund’s Form N-Q is available on the EDGAR database on the Commission’s Internet Web site at http://www.sec.gov, and copies of this information may be obtained, upon payment of a duplicating fee, by electronic request at the following e-mail address: publicinfo@sec.gov or by writing the Public Reference Section at the above address.
17
Table of Contents
CONTACT US
Web site
mfs.com
Account service and literature
Shareholders
1-877-411-3325
9 a.m. to 5 p.m. Eastern Time
Investment professionals
1-800-637-8730
8 a.m. to 5 p.m. Eastern Time
Mailing address
MFS Service Center, Inc.
Attn: Institutional Alliance Services (IAS)
P.O. Box 55824
Boston, MA 02205-5824
Overnight mail
MFS Service Center, Inc.
c/o Boston Financial Data Services
30 Dan Road
Canton, MA 02021-2809

Table of Contents
Table of Contents
This report is prepared for the general information of contract owners. It is authorized for distribution to prospective investors only when preceded or accompanied by a current prospectus.
NOT FDIC INSURED Ÿ MAY LOSE VALUE Ÿ NO BANK OR CREDIT UNION GUARANTEE Ÿ NOT A DEPOSIT Ÿ NOT INSURED BY ANY FEDERAL GOVERNMENT AGENCY OR NCUA/NCUSIF
Table of Contents

Dear Contract Owners:
Negative headlines tend to resonate during difficult markets, and we certainly have had more than our share of tough news recently. As a result consumer, and particularly investor, sentiment are at all-time lows. That said, I do think it is helpful to remember there are always silver linings in the storm clouds if you look hard enough.
Through all of the challenges we have faced, there are some positive underlying trends. In the United States, for example, institutional traders and credit market followers are just now showing increasing signs of confidence and are beginning to take on more risk. At the corporate level, earnings continue to be relatively strong as companies have reduced labor costs, controlled inventories, and relied less on debt to finance expansion. More broadly, low interest rates and strong demand for consumer goods and industrial equipment are good signs for the global economy.
While I do not mean to minimize the risks inherent in today’s markets, periods such as these allow the talented fund managers and research analysts we have at MFS® to test their convictions, reevaluate existing positions, and identify new investment ideas. Our investment process also includes a significant risk management component, with constant attention paid to monitoring market risk, so we can do our best to minimize any surprises to your portfolio.
For investors, this is a great time to check in with your advisor and make sure you have a sound investment plan in place — one that can keep your hard-earned money working over the long term through a strategy that involves asset allocation, diversification, and periodic portfolio rebalancing and reviews. A plan tailored to your distinct needs and goals continues to be the best approach to help you take advantage of the inevitable challenges — and opportunities — that present themselves over time.
Respectfully,

Robert J. Manning
Chief Executive Officer and Chief Investment Officer
MFS Investment Management®
August 15, 2008
The opinions expressed in this letter are subject to change, may not be relied upon for investment advice, and no forecasts can be guaranteed.
1
Table of Contents
Portfolio structure (i)
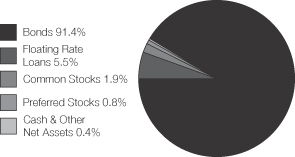
| Top five industries (i) | ||
| Medical & Health Technology & Services | 8.8% | |
| Gaming & Lodging | 7.8% | |
| Utilities – Electric Power | 7.4% | |
| Broadcasting | 6.5% | |
| Energy-Independent | 6.0% |
| Credit quality of bonds (r) | ||
| AAA | 3.2% | |
| AA | 1.0% | |
| A | 1.4% | |
| BBB | 1.0% | |
| BB | 19.6% | |
| B | 52.1% | |
| CCC | 18.1% | |
| D | 0.1% | |
| Not Rated | 3.5% |
| Portfolio facts | ||
| Average Duration (d)(i) | 4.3 | |
| Average Life (i)(m) | 6.9 yrs. | |
| Average Maturity (i)(m) | 8.2 yrs. | |
| Average Credit Quality of Rated Securities (long-term) (a) | B+ | |
| Average Credit Quality of Rated Securities (short-term) (a) | A-1 |
| (a) | The average credit quality of rated securities is based upon a market weighted average of portfolio holdings that are rated by public rating agencies. |
| (d) | Duration is a measure of how much a bond’s price is likely to fluctuate with general changes in interest rates, e.g., if rates rise 1.00%, a bond with a 5-year duration is likely to lose about 5.00% of its value. |
| (i) | For purposes of this presentation, the bond component includes accrued interest amounts and may be positively or negatively impacted by the equivalent exposure from any derivative holdings, if applicable. |
| (m) | The average maturity shown is calculated using the final stated maturity on the portfolio’s holdings without taking into account any holdings which have been pre-refunded or pre-paid to an earlier date or which have a mandatory put date prior to the stated maturity. The average life shown takes into account these earlier dates. |
| (r) | Each security is assigned a rating from Moody’s Investors Service. If not rated by Moody’s, the rating will be that assigned by Standard & Poor’s. Likewise, if not assigned a rating by Standard & Poor’s, it will be based on the rating assigned by Fitch, Inc. For those portfolios that hold a security which is not rated by any of the three agencies, the security is considered Not Rated. Holdings in U.S. Treasuries and government agency mortgage-backed securities, if any, are included in the “AAA”-rating category. Percentages are based on the total market value of investments as of 6/30/08. |
Percentages are based on net assets as of 6/30/08, unless otherwise noted.
The portfolio is actively managed and current holdings may be different.
2
Table of Contents
Fund Expenses Borne by the Contract Holders During the Period,
January 1, 2008 through June 30, 2008
As a contract holder of the fund, you incur ongoing costs, including management fees; distribution (12b-1) fees; and other fund expenses. This example is intended to help you understand your ongoing costs (in dollars) of investing in the fund and to compare these costs with the ongoing costs of investing in other mutual funds.
The example is based on an investment of $1,000 invested at the beginning of the period and held for the entire period January 1, 2008 through June 30, 2008.
Actual Expenses
The first line for each share class in the following table provides information about actual account values and actual expenses. You may use the information in this line, together with the amount you invested, to estimate the expenses that you paid over the period. Simply divide your account value by $1,000 (for example, an $8,600 account value divided by $1,000 = 8.6), then multiply the result by the number in the first line under the heading entitled “Expenses Paid During Period” to estimate the expenses you paid on your account during this period.
Hypothetical Example for Comparison Purposes
The second line for each share class in the following table provides information about hypothetical account values and hypothetical expenses based on the fund’s actual expense ratio and an assumed rate of return of 5% per year before expenses, which is not the fund’s actual return. The hypothetical account values and expenses may not be used to estimate the actual ending account balance or expenses you paid for the period. You may use this information to compare the ongoing costs of investing in the fund and other funds. To do so, compare this 5% hypothetical example with the 5% hypothetical examples that appear in the shareholder reports of the other funds.
Please note that the expenses shown in the table are meant to highlight the fund’s ongoing costs only and do not take into account the fees and expenses imposed under the variable contracts through which your investment in the fund is made. Therefore, the second line for each share class in the table is useful in comparing ongoing costs associated with an investment in vehicles (such as the fund) which fund benefits under variable annuity and variable life insurance contracts and to qualified pension and retirement plans only, and will not help you determine the relative total costs of investing in the fund through variable annuity and variable life insurance contracts. If the fees and expenses imposed under the variable contracts were included, your costs would have been higher.
| Share Class | Annualized Expense Ratio | Beginning Account Value 1/01/08 | Ending Account Value | Expenses Paid During Period (p) 1/01/08-6/30/08 | ||||||
| Initial Class | Actual | 0.81% | $1,000.00 | $984.83 | $4.00 | |||||
| Hypothetical (h) | 0.81% | $1,000.00 | $1,020.84 | $4.07 | ||||||
| Service Class | Actual | 1.06% | $1,000.00 | $983.78 | $5.23 | |||||
| Hypothetical (h) | 1.06% | $1,000.00 | $1,019.59 | $5.32 |
| (h) | 5% class return per year before expenses. |
| (p) | Expenses paid is equal to each class’ annualized expense ratio, as shown above, multiplied by the average account value over the period, multiplied by the number of days in the period, divided by the number of days in the year. |
3
Table of Contents
PORTFOLIO OF INVESTMENTS – 6/30/08 (unaudited)
The Portfolio of Investments is a complete list of all securities owned by your fund. It is categorized by broad-based asset classes.
| Issuer | Shares/Par | Value ($) | ||||
| BONDS – 88.1% | ||||||
| Aerospace – 1.4% | ||||||
| Bombardier, Inc., 8%, 2014 (n) | $ | 441,000 | $ | 452,023 | ||
| Hawker Beechcraft Acquisition Co. LLC, 9.75%, 2017 | 1,585,000 | 1,584,999 | ||||
| Vought Aircraft Industries, Inc., 8%, 2011 | 2,260,000 | 2,101,799 | ||||
| $ | 4,138,821 | |||||
| Airlines – 0.6% | ||||||
| Continental Airlines, Inc., 7.339%, 2014 | $ | 1,898,000 | $ | 1,442,479 | ||
| Continental Airlines, Inc., 6.9%, 2017 | 255,762 | 211,002 | ||||
| Continental Airlines, Inc., 6.748%, 2017 | 158,166 | 130,486 | ||||
| $ | 1,783,967 | |||||
| Asset Backed & Securitized – 5.0% | ||||||
| Airlie LCDO Ltd., CDO, FRN, 4.498%, 2011 (z) | $ | 677,000 | $ | 446,819 | ||
| Anthracite Ltd., CDO, 6%, 2037 (z) | 290,000 | 121,799 | ||||
| Arbor Realty Mortgage Securities, CDO, FRN, 5.117%, 2038 (z) | 668,203 | 396,484 | ||||
| ARCap REIT, Inc., CDO, “H”, 6.1%, 2045 (n) | 906,493 | 317,272 | ||||
| Babson Ltd., CLO, “D”, FRN, 4.213%, 2018 (n) | 655,000 | 432,299 | ||||
| Banc of America Commercial Mortgage, Inc., 5.39%, 2045 | 496,525 | 449,844 | ||||
| Banc of America Commercial Mortgage, Inc., FRN, 5.772%, 2017 | 2,112,356 | 1,910,503 | ||||
| Banc of America Commercial Mortgage, Inc., FRN, 6.002%, 2017 | 484,576 | 443,188 | ||||
| Citigroup Commercial Mortgage Trust, FRN, 5.888%, 2017 | 985,952 | 644,652 | ||||
| Credit Suisse Mortgage Capital Certificate, 5.343%, 2039 | 447,517 | 401,977 | ||||
| Crest Ltd., CDO, 7%, 2040 | 846,250 | 439,441 | ||||
| CWCapital Cobalt Ltd., CDO, 6.23%, 2045 (n) | 938,000 | 462,987 | ||||
| CWCapital Cobalt Ltd., CDO, “F”, FRN, 4.206%, 2050 (z) | 500,000 | 152,080 | ||||
| First Union National Bank Commercial Mortgage Trust, 6.75%, 2032 | 750,000 | 626,853 | ||||
| JPMorgan Chase Commercial Mortgage Securities Corp., 5.44%, 2045 | 1,472,335 | 1,335,990 | ||||
| JPMorgan Chase Commercial Mortgage Securities Corp., 5.372%, 2047 | 752,159 | 678,408 | ||||
| JPMorgan Chase Commercial Mortgage Securities Corp., FRN, 5.466%, 2047 | 980,645 | 875,367 | ||||
| JPMorgan Chase Commercial Mortgage Securities Corp., FRN, 6.26%, 2051 | 750,000 | 550,880 | ||||
| Merrill Lynch Mortgage Trust, FRN, 6.022%, 2050 | 750,000 | 543,857 | ||||
| Merrill Lynch/Countrywide Commercial Mortgage Trust, FRN, 5.204%, 2049 | 1,592,719 | 1,422,149 | ||||
| Merrill Lynch/Countrywide Commercial Mortgage Trust, FRN, 5.902%, 2050 | 408,000 | 371,784 | ||||
| Wachovia Bank Commercial Mortgage Trust, FRN, 5.941%, 2047 | 579,683 | 405,149 | ||||
| Issuer | Shares/Par | Value ($) | ||||
| BONDS – continued | ||||||
| Asset Backed & Securitized – continued | ||||||
| Wachovia Bank Commercial Mortgage Trust, FRN, 6.099%, 2051 | $ | 1,589,805 | $ | 1,460,905 | ||
| Wachovia Credit, CDO, FRN, 4.154%, 2026 (z) | 372,000 | 205,727 | ||||
| $ | 15,096,414 | |||||
| Automotive – 2.9% | ||||||
| Allison Transmission, Inc., 11%, 2015 (n) | $ | 2,380,000 | $ | 2,130,100 | ||
| Ford Motor Credit Co. LLC, 8.625%, 2010 | 1,035,000 | 877,995 | ||||
| Ford Motor Credit Co. LLC, 12%, 2015 | 1,865,000 | 1,640,579 | ||||
| Ford Motor Credit Co. LLC, 8%, 2016 | 3,360,000 | 2,441,920 | ||||
| Ford Motor Credit Co. LLC, FRN, 4.283%, 2010 | 1,030,000 | 906,842 | ||||
| General Motors Corp., 8.375%, 2033 | 1,517,000 | 898,823 | ||||
| $ | 8,896,259 | |||||
| Broadcasting – 5.8% | ||||||
| Allbritton Communications Co., 7.75%, 2012 | $ | 2,150,000 | $ | 2,090,875 | ||
| Bonten Media Acquisition Co., 9%, 2015 (n)(p) | 1,380,000 | 1,007,400 | ||||
| CanWest MediaWorks LP, 9.25%, 2015 (n) | 1,070,000 | 872,050 | ||||
| DIRECTV Holdings LLC, 7.625%, 2016 (z) | 1,635,000 | 1,610,475 | ||||
| Lamar Media Corp., 6.625%, 2015 | 1,545,000 | 1,405,950 | ||||
| Lamar Media Corp., “C”, 6.625%, 2015 | 975,000 | 887,250 | ||||
| LBI Media, Inc., 8.5%, 2017 (n) | 1,025,000 | 789,250 | ||||
| LIN TV Corp., 6.5%, 2013 | 2,175,000 | 1,990,125 | ||||
| Local TV Finance LLC, 9.25%, 2015 (n)(p) | 1,590,000 | 1,240,200 | ||||
| Newport Television LLC, 13%, 2017 (n)(p) | 1,875,000 | 1,650,000 | ||||
| Nexstar Broadcasting Group, Inc., 7%, 2014 | 1,795,000 | 1,561,650 | ||||
| Univision Communications, Inc., 9.75%, 2015 (n)(p) | 2,980,000 | 2,190,300 | ||||
| Young Broadcasting, Inc., 8.75%, 2014 | 545,000 | 294,300 | ||||
| $ | 17,589,825 | |||||
| Brokerage & Asset Managers – 0.7% | ||||||
| Nuveen Investments, Inc., 10.5%, 2015 (n) | $ | 2,375,000 | $ | 2,190,938 | ||
| Building – 1.8% | ||||||
| Associated Materials, Inc., 9.75%, 2012 | $ | 495,000 | $ | 490,050 | ||
| Associated Materials, Inc., 0% to 2009, 11.25% to 2014 | 780,000 | 514,800 | ||||
| Building Materials Corp. of America, 7.75%, 2014 | 1,080,000 | 885,600 | ||||
| Nortek Holdings, Inc., 10%, 2013 (n) | 765,000 | 730,575 | ||||
| Nortek Holdings, Inc., 8.5%, 2014 | 1,305,000 | 835,200 | ||||
| Ply Gem Industries, Inc., 9%, 2012 | 2,305,000 | 1,354,188 | ||||
| Ply Gem Industries, Inc., 11.75%, 2013 (z) | 555,000 | 509,213 | ||||
| $ | 5,319,626 | |||||
| Business Services – 0.7% | ||||||
| SunGard Data Systems, Inc., 10.25%, 2015 | $ | 2,150,000 | $ | 2,160,750 | ||
4
Table of Contents
Portfolio of Investments (unaudited) – continued
| Issuer | Shares/Par | Value ($) | ||||
| BONDS – continued | ||||||
| Cable TV – 3.8% | ||||||
| CCH I Holdings LLC, 11%, 2015 | $ | 678,000 | $ | 502,568 | ||
| CCH II Holdings LLC, 10.25%, 2010 | 2,530,000 | 2,447,775 | ||||
| CCO Holdings LLC, 8.75%, 2013 | 4,725,000 | 4,347,000 | ||||
| CSC Holdings, Inc., 6.75%, 2012 | 1,295,000 | 1,217,300 | ||||
| CSC Holdings, Inc., 8.5%, 2015 (n) | 400,000 | 393,000 | ||||
| Mediacom LLC, 9.5%, 2013 | 1,210,000 | 1,140,425 | ||||
| NTL Cable PLC, 9.125%, 2016 | 1,550,000 | 1,453,125 | ||||
| $ | 11,501,193 | |||||
| Chemicals – 3.1% | ||||||
| Innophos, Inc., 8.875%, 2014 | $ | 1,630,000 | $ | 1,630,000 | ||
| KI Holdings, Inc., 0% to 2009, 9.875% to 2014 | 1,924,000 | 1,741,220 | ||||
| Koppers Holdings, Inc., 9.875%, 2013 | 1,430,000 | 1,501,500 | ||||
| Momentive Performance Materials, Inc., 9.75%, 2014 | 485,000 | 414,675 | ||||
| Momentive Performance Materials, Inc., 11.5%, 2016 | 1,976,000 | 1,472,120 | ||||
| Nalco Co., 7.75%, 2011 | 500,000 | 500,000 | ||||
| Nalco Co., 8.875%, 2013 | 2,120,000 | 2,173,000 | ||||
| $ | 9,432,515 | |||||
| Computer Software – 0.6% | ||||||
| First Data Corp., 9.875%, 2015 (n) | $ | 2,005,000 | $ | 1,744,350 | ||
| Consumer Goods & Services – 2.2% | ||||||
| Corrections Corp. of America, 6.25%, 2013 | $ | 790,000 | $ | 760,375 | ||
| GEO Group, Inc., 8.25%, 2013 | 1,225,000 | 1,249,500 | ||||
| Jarden Corp., 7.5%, 2017 | 500,000 | 435,000 | ||||
| KAR Holdings, Inc., 10%, 2015 | 1,140,000 | 957,600 | ||||
| Service Corp. International, 7.375%, 2014 | 690,000 | 690,000 | ||||
| Service Corp. International, 7%, 2017 | 2,640,000 | 2,521,200 | ||||
| $ | 6,613,675 | |||||
| Containers – 1.5% | ||||||
| Crown Americas LLC, 7.625%, 2013 | $ | 1,035,000 | $ | 1,032,413 | ||
| Graham Packaging Co. LP, 9.875%, 2014 | 1,020,000 | 902,700 | ||||
| Greif, Inc., 6.75%, 2017 | 1,040,000 | 1,003,600 | ||||
| Owens-Brockway Glass Container, Inc., 8.25%, 2013 | 1,610,000 | 1,650,250 | ||||
| $ | 4,588,963 | |||||
| Defense Electronics – 0.9% | ||||||
| L-3 Communications Corp., 6.125%, 2014 | $ | 1,370,000 | $ | 1,284,375 | ||
| L-3 Communications Corp., 5.875%, 2015 | 1,560,000 | 1,439,100 | ||||
| $ | 2,723,475 | |||||
| Electronics – 1.0% | ||||||
| Avago Technologies Finance, 11.875%, 2015 | $ | 760,000 | $ | 817,000 | ||
| Flextronics International Ltd., 6.25%, 2014 | 840,000 | 785,400 | ||||
| Spansion LLC, 11.25%, 2016 (n) | 2,055,000 | 1,274,100 | ||||
| $ | 2,876,500 | |||||
| Emerging Market Sovereign – 0.6% | ||||||
| Republic of Argentina, FRN, 3.092%, 2012 | $ | 2,077,500 | $ | 1,748,690 | ||
| Issuer | Shares/Par | Value ($) | ||||
| BONDS – continued | ||||||
| Energy – Independent – 5.9% | ||||||
| Chaparral Energy, Inc., 8.875%, 2017 | $ | 1,060,000 | $ | 919,550 | ||
| Chesapeake Energy Corp., 7%, 2014 | 1,055,000 | 1,033,900 | ||||
| Chesapeake Energy Corp., 6.375%, 2015 | 1,810,000 | 1,710,450 | ||||
| Forest Oil Corp., 7.25%, 2019 | 960,000 | 921,600 | ||||
| Forest Oil Corp., 7.25%, 2019 (n) | 255,000 | 244,800 | ||||
| Hilcorp Energy I LP, 7.75%, 2015 (n) | 180,000 | 172,800 | ||||
| Hilcorp Energy I LP, 9%, 2016 (n) | 905,000 | 920,838 | ||||
| Mariner Energy, Inc., 8%, 2017 | 920,000 | 890,100 | ||||
| Newfield Exploration Co., 6.625%, 2014 | 1,695,000 | 1,593,300 | ||||
| OPTI Canada, Inc., 8.25%, 2014 | 2,150,000 | 2,139,250 | ||||
| Plains Exploration & Production Co., 7%, 2017 | 2,415,000 | 2,318,400 | ||||
| Plains Exploration & Production Co., 7.625%, 2018 | 425,000 | 425,000 | ||||
| Quicksilver Resources, Inc., 7.125%, 2016 | 2,350,000 | 2,188,438 | ||||
| SandRidge Energy, Inc., 8.625%, 2015 (n)(p) | 615,000 | 630,375 | ||||
| SandRidge Energy, Inc., 8%, 2018 (n) | 885,000 | 889,425 | ||||
| Southwestern Energy Co., 7.5%, 2018 (n) | 945,000 | 972,320 | ||||
| $ | 17,970,546 | |||||
| Entertainment – 0.5% | ||||||
| AMC Entertainment, Inc., 11%, 2016 | $ | 985,000 | $ | 975,150 | ||
| Marquee Holdings, Inc., 9.505%, 2014 | 755,000 | 592,675 | ||||
| $ | 1,567,825 | |||||
| Financial Institutions – 0.9% | ||||||
| General Motors Acceptance Corp., 6.875%, 2011 | $ | 2,302,000 | $ | 1,654,153 | ||
| General Motors Acceptance Corp., 8%, 2031 | 1,459,000 | 949,193 | ||||
| Residential Capital LLC, 9.625%, 2015 (z) | 76,000 | 36,860 | ||||
| $ | 2,640,206 | |||||
| Food & Beverages – 2.4% | ||||||
| ARAMARK Corp., 8.5%, 2015 | $ | 2,730,000 | $ | 2,675,400 | ||
| B&G Foods, Inc., 8%, 2011 | 1,120,000 | 1,100,400 | ||||
| Dean Foods Co., 7%, 2016 | 1,435,000 | 1,244,863 | ||||
| Del Monte Corp., 6.75%, 2015 | 1,425,000 | 1,357,313 | ||||
| Michael Foods, Inc., 8%, 2013 | 890,000 | 876,650 | ||||
| $ | 7,254,626 | |||||
| Forest & Paper Products – 2.3% | ||||||
| Buckeye Technologies, Inc., 8%, 2010 | $ | 280,000 | $ | 280,000 | ||
| Buckeye Technologies, Inc., 8.5%, 2013 | 2,140,000 | 2,129,300 | ||||
| Georgia-Pacific Corp., 7.125%, 2017 (n) | 890,000 | 836,600 | ||||
| Georgia-Pacific Corp., 8%, 2024 | 505,000 | 467,125 | ||||
| Graphic Packaging International Corp., 9.5%, 2013 | 770,000 | 735,350 | ||||
| JSG Funding PLC, 7.75%, 2015 | 150,000 | 136,500 | ||||
| Millar Western Forest Products Ltd., 7.75%, 2013 | 1,555,000 | 1,010,750 | ||||
| NewPage Holding Corp., 10%, 2012 | 545,000 | 551,813 | ||||
| Smurfit-Stone Container Corp., 8%, 2017 | 1,075,000 | 860,000 | ||||
| $ | 7,007,438 | |||||
5
Table of Contents
Portfolio of Investments (unaudited) – continued
| Issuer | Shares/Par | Value ($) | ||||
| BONDS – continued | ||||||
| Gaming & Lodging – 6.7% | ||||||
| Firekeepers Development Authority, 13.875%, 2015 (z) | $ | 1,000,000 | $ | 977,500 | ||
| Fontainebleau Las Vegas Holdings LLC, 10.25%, 2015 (n) | 2,275,000 | 1,478,750 | ||||
| Harrah’s Operating Co., Inc., 5.5%, 2010 | 930,000 | 831,188 | ||||
| Harrah’s Operating Co., Inc., 5.375%, 2013 | 765,000 | 468,563 | ||||
| Harrah’s Operating Co., Inc. , 10.75%, 2016 (n) | 2,755,000 | 2,286,650 | ||||
| Harrah’s Operating Co., Inc., 10.75%, 2018 (n)(p) | 1,975,000 | 1,451,625 | ||||
| Mandalay Resort Group, 9.375%, 2010 | 955,000 | 955,000 | ||||
| MGM Mirage, 8.5%, 2010 | 580,000 | 572,750 | ||||
| MGM Mirage, 8.375%, 2011 | 1,065,000 | 1,027,725 | ||||
| MGM Mirage, 6.75%, 2013 | 1,115,000 | 961,688 | ||||
| MGM Mirage, 5.875%, 2014 | 2,355,000 | 1,907,550 | ||||
| Pinnacle Entertainment, Inc., 7.5%, 2015 | 2,130,000 | 1,629,450 | ||||
| Station Casinos, Inc., 6.5%, 2014 | 3,510,000 | 2,018,250 | ||||
| Station Casinos, Inc., 6.875%, 2016 | 2,540,000 | 1,387,475 | ||||
| Trump Entertainment Resorts Holdings, Inc., 8.5%, 2015 | 2,650,000 | 1,649,625 | ||||
| Wynn Las Vegas LLC, 6.625%, 2014 | 790,000 | 722,850 | ||||
| $ | 20,326,639 | |||||
| General Merchandise – 0.4% | ||||||
| Buhrmann U.S., Inc., 7.875%, 2015 | $ | 985,000 | $ | 1,100,619 | ||
| Industrial – 1.4% | ||||||
| Blount, Inc., 8.875%, 2012 | $ | 1,175,000 | $ | 1,175,000 | ||
| JohnsonDiversey, Inc., 9.625%, 2012 | EUR 460,000 | 702,788 | ||||
| JohnsonDiversey, Inc., “B”, 9.625%, 2012 | 2,255,000 | 2,277,550 | ||||
| $ | 4,155,338 | |||||
| Insurance – Property & Casualty – 0.3% | ||||||
| USI Holdings Corp., 9.75%, 2015 (n) | $ | 1,075,000 | $ | 924,500 | ||
| Machinery & Tools – 0.6% | ||||||
| Case New Holland, Inc., 7.125%, 2014 | $ | 1,830,000 | $ | 1,793,400 | ||
| Major Banks – 1.1% | ||||||
| Bank of America Corp., 8% to 2018, FRN to 2049 | $ | 1,490,000 | $ | 1,395,936 | ||
| JPMorgan Chase & Co., 7.9% to 2018, FRN to 2049 | 2,165,000 | 2,029,991 | ||||
| $ | 3,425,927 | |||||
| Medical & Health Technology & Services – 8.1% | ||||||
| Biomet, Inc., 10%, 2017 | $ | 1,090,000 | $ | 1,163,575 | ||
| Biomet, Inc., 11.625%, 2017 | 2,085,000 | 2,210,100 | ||||
| Community Health Systems, Inc., 8.875%, 2015 | 3,265,000 | 3,285,406 | ||||
| Cooper Cos., Inc., 7.125%, 2015 | 1,415,000 | 1,358,400 | ||||
| DaVita, Inc., 7.25%, 2015 | 2,580,000 | 2,509,050 | ||||
| HCA, Inc., 6.375%, 2015 | 3,380,000 | 2,805,400 | ||||
| HCA, Inc., 9.25%, 2016 | 5,185,000 | 5,340,550 | ||||
| Psychiatric Solutions, Inc., 7.75%, 2015 | 1,150,000 | 1,138,500 | ||||
| U.S. Oncology, Inc., 10.75%, 2014 | 2,140,000 | 2,123,950 | ||||
| Universal Hospital Services, Inc., 8.5%, 2015 (p) | 1,280,000 | 1,280,000 | ||||
| Issuer | Shares/Par | Value ($) | ||||
| BONDS – continued | ||||||
| Medical & Health Technology & Services – continued | ||||||
| Universal Hospital Services, Inc., FRN, 6.302%, 2015 | $ | 310,000 | $ | 289,850 | ||
| VWR Funding, Inc., 10.25%, 2015 (p) | 905,000 | 834,863 | ||||
| $ | 24,339,644 | |||||
| Metals & Mining – 4.6% | ||||||
| Arch Western Finance LLC, 6.75%, 2013 | $ | 1,195,000 | $ | 1,171,100 | ||
| FMG Finance Ltd., 10.625%, 2016 (n) | 2,205,000 | 2,568,825 | ||||
| Freeport-McMoRan Copper & Gold, Inc., 8.375%, 2017 | 4,670,000 | 4,926,850 | ||||
| Freeport-McMoRan Copper & Gold, Inc., FRN, 5.882%, 2015 | 1,655,000 | 1,671,318 | ||||
| Peabody Energy Corp., 5.875%, 2016 | 1,150,000 | 1,075,250 | ||||
| Peabody Energy Corp., 7.375%, 2016 | 1,390,000 | 1,386,525 | ||||
| PNA Group, Inc., 10.75%, 2016 | 885,000 | 1,039,875 | ||||
| $ | 13,839,743 | |||||
| Municipals – 0.4% | ||||||
| Regional Transportation Authority, IL, “A”, MBIA, 4.5%, 2035 | $ | 1,430,000 | $ | 1,326,697 | ||
| Natural Gas – Distribution – 0.9% | ||||||
| AmeriGas Partners LP, 7.125%, 2016 | $ | 1,550,000 | $ | 1,437,625 | ||
| Inergy LP, 6.875%, 2014 | 1,540,000 | 1,432,200 | ||||
| $ | 2,869,825 | |||||
| Natural Gas – Pipeline – 2.1% | ||||||
| Atlas Pipeline Partners LP, 8.125%, 2015 | $ | 980,000 | $ | 962,850 | ||
| Atlas Pipeline Partners LP, 8.75%, 2018 (z) | 940,000 | 932,950 | ||||
| Deutsche Bank (El Paso Performance-Linked Trust, CLN), 7.75%, 2011 (n) | 2,000,000 | 2,014,864 | ||||
| El Paso Corp., 7.25%, 2018 | 955,000 | 940,675 | ||||
| Transcontinental Gas Pipe Line Corp., 7%, 2011 | 286,000 | 297,440 | ||||
| Williams Partners LP, 7.25%, 2017 | 1,255,000 | 1,255,000 | ||||
| $ | 6,403,779 | |||||
| Network & Telecom – 3.5% | ||||||
| Cincinnati Bell, Inc., 8.375%, 2014 | $ | 2,130,000 | $ | 2,060,775 | ||
| Citizens Communications Co., 9.25%, 2011 | 1,301,000 | 1,346,535 | ||||
| Nordic Telephone Co. Holdings, 8.875%, 2016 (n) | 1,230,000 | 1,205,400 | ||||
| Qwest Capital Funding, Inc., 7.25%, 2011 | 2,375,000 | 2,303,750 | ||||
| Qwest Corp., 7.875%, 2011 | 410,000 | 410,000 | ||||
| Qwest Corp., 8.875%, 2012 | 1,740,000 | 1,774,800 | ||||
| Windstream Corp., 8.625%, 2016 | 1,470,000 | 1,466,325 | ||||
| $ | 10,567,585 | |||||
| Oil Services – 0.8% | ||||||
| Basic Energy Services, Inc., 7.125%, 2016 | $ | 1,710,000 | $ | 1,662,975 | ||
| GulfMark Offshore, Inc., 7.75%, 2014 | 695,000 | 700,213 | ||||
| $ | 2,363,188 | |||||
| Printing & Publishing – 3.2% | ||||||
| American Media Operations, Inc., 10.25%, 2009 (z) | $ | 53,413 | $ | 42,997 | ||
| American Media Operations, Inc., “B”, 10.25%, 2009 | 1,469,000 | 1,182,545 | ||||
6
Table of Contents
Portfolio of Investments (unaudited) – continued
| Issuer | Shares/Par | Value ($) | ||||
| BONDS – continued | ||||||
| Printing & Publishing – continued | ||||||
| Dex Media West LLC, 9.875%, 2013 | $ | 333,000 | $ | 299,700 | ||
| Dex Media, Inc., 0% to 2008, 9% to 2013 | 3,580,000 | 2,559,700 | ||||
| Dex Media, Inc., 0% to 2008, 9% to 2013 | 1,690,000 | 1,208,350 | ||||
| Idearc, Inc., 8%, 2016 | 2,603,000 | 1,636,636 | ||||
| Nielsen Finance LLC, 10%, 2014 | 1,515,000 | 1,526,363 | ||||
| Nielsen Finance LLC, 0% to 2011, 12.5% to 2016 | 475,000 | 326,563 | ||||
| Quebecor World, Inc., 6.125%, 2013 (d) | 725,000 | 264,625 | ||||
| R.H. Donnelley Corp., 8.875%, 2016 | 1,100,000 | 660,000 | ||||
| $ | 9,707,479 | |||||
| Retailers – 0.4% | ||||||
| Couche-Tard, Inc., 7.5%, 2013 | $ | 795,000 | $ | 785,063 | ||
| Sally Holdings LLC, 10.5%, 2016 | 315,000 | 300,038 | ||||
| $ | 1,085,101 | |||||
| Specialty Stores – 0.3% | ||||||
| Payless ShoeSource, Inc., 8.25%, 2013 | $ | 1,105,000 | $ | 966,875 | ||
| Steel – 0.3% | ||||||
| Evraz Group S.A., 8.875%, 2013 (z) | $ | 935,000 | $ | 936,122 | ||
| Supermarkets – 0.4% | ||||||
| Stater Brothers Holdings, Inc., 7.75%, 2015 | $ | 1,165,000 | $ | 1,156,263 | ||
| Telecommunications – Wireless – 1.7% | ||||||
| Alltel Corp., 7%, 2012 | $ | 1,631,000 | $ | 1,663,620 | ||
| MetroPCS Wireless, Inc., 9.25%, 2014 | 1,710,000 | 1,645,875 | ||||
| Wind Acquisition Finance S.A., 10.75%, 2015 (n) | 1,620,000 | 1,701,000 | ||||
| $ | 5,010,495 | |||||
| Transportation – Services – 0.3% | ||||||
| Hertz Corp., 8.875%, 2014 | $ | 1,020,000 | $ | 933,300 | ||
| Utilities – Electric Power – 6.0% | ||||||
| Dynegy Holdings, Inc., 7.5%, 2015 | $ | 775,000 | $ | 714,938 | ||
| Edison Mission Energy, 7%, 2017 | 2,265,000 | 2,117,775 | ||||
| Mirant Americas Generation LLC, 8.3%, 2011 | 900,000 | 929,250 | ||||
| Mirant North America LLC, 7.375%, 2013 | 1,390,000 | 1,377,838 | ||||
| NRG Energy, Inc., 7.375%, 2016 | 6,445,000 | 6,066,356 | ||||
| Reliant Energy, Inc., 6.75%, 2014 | 520,000 | 530,400 | ||||
| Reliant Energy, Inc., 7.875%, 2017 | 2,255,000 | 2,204,263 | ||||
| Sierra Pacific Resources, 8.625%, 2014 | 715,000 | 749,545 | ||||
| Texas Competitive Electric Holdings LLC, 10.25%, 2015 (n) | 3,510,000 | 3,439,800 | ||||
| $ | 18,130,165 | |||||
| Total Bonds (Identified Cost, $286,467,484) | $ | 266,209,286 | ||||
| FLOATING RATE LOANS (g)(r) – 5.5% | ||||||
| Aerospace – 0.5% | ||||||
| Hawker Beechcraft Acquisition Co., Letter of Credit, 4.7%, 2014 | $ | 67,579 | $ | 63,314 | ||
| Hawker Beechcraft Acquisition Co., Term Loan, 4.8%, 2014 | 1,691,741 | 1,584,950 | ||||
| $ | 1,648,264 | |||||
| Issuer | Shares/Par | Value ($) | ||||
| FLOATING RATE LOANS (g)(r) – continued | ||||||
| Automotive – 1.1% | ||||||
| Federal-Mogul Corp., Term Loan B, 4.41%, 2014 | $ | 1,253,885 | $ | 1,046,994 | ||
| Ford Motor Co., Term Loan B, 5.48%, 2013 | 2,253,873 | 1,813,804 | ||||
| Mark IV Industries, Inc., Second Lien Term Loan, 11.42%, 2011 | 1,014,271 | 410,780 | ||||
| $ | 3,271,578 | |||||
| Broadcasting – 0.5% | ||||||
| Young Broadcasting, Inc., Term Loan, 5.19%, 2012 | 1,200,041 | $ | 1,080,036 | |||
| Young Broadcasting, Inc., Term Loan B-1, 5.25%, 2012 | 448,623 | 402,730 | ||||
| $ | 1,482,766 | |||||
| Computer Software – 0.5% | ||||||
| First Data Corp., Term Loan B-1, 5.26%, 2014 | 1,605,030 | $ | 1,471,211 | |||
| Forest & Paper Products – 0.1% | ||||||
| Abitibi Consolidated, Inc., Term Loan, 11.5%, 2009 | 398,952 | $ | 399,451 | |||
| Gaming & Lodging – 0.3% | ||||||
| Green Valley Ranch Gaming LLC, Second Lien Term Loan, 5.89%, 2014 (o) | 1,652,646 | $ | 1,041,167 | |||
| Medical & Health Technology & Services – 0.5% | ||||||
| Community Health Systems, Inc., Delayed Draw Term Loan, 2014 (q) | 25,282 | $ | 23,799 | |||
| Community Health Systems, Inc., Term Loan B, 4.86%, 2014 | 494,336 | 465,341 | ||||
| HCA, Inc., Term Loan B, 5.05%, 2013 | 1,138,541 | 1,067,715 | ||||
| $ | 1,556,855 | |||||
| Printing & Publishing – 0.5% | ||||||
| Idearc, Inc., Term Loan B, 4.79%, 2014 | 152,353 | $ | 121,459 | |||
| Tribune Co., Term Loan B, 2014 (o) | 1,912,886 | 1,437,055 | ||||
| $ | 1,558,514 | |||||
| Specialty Stores – 0.2% | ||||||
| Michaels Stores, Inc., Term Loan B, 5.45%, 2013 | 603,797 | $ | 500,774 | |||
| Telecommunications – Wireless – 0.3% | ||||||
| ALLTEL Communications, Inc., Term Loan B-2, 2015 (o) | 843,416 | $ | 837,301 | |||
| Utilities – Electric Power – 1.0% | ||||||
| Calpine Corp., DIP Term Loan, 5.69%, 2009 | $ | 1,335,952 | $ | 1,275,091 | ||
| Texas Competitive Electric Holdings LLC, Term Loan B-3, 6.26%, 2014 | 1,728,497 | 1,597,241 | ||||
| $ | 2,872,332 | |||||
| Total Floating Rate Loans (Identified Cost, $17,762,988) | $ | 16,640,213 | ||||
7
Table of Contents
Portfolio of Investments (unaudited) – continued
| Issuer | Shares/Par | Value ($) | |||
| COMMON STOCKS – 1.9% | |||||
| Automotive – 0.0% | |||||
| Oxford Automotive, Inc. (a) | 82 | $ | 0 | ||
| Cable TV – 0.8% | |||||
| Cablevision Systems Corp., “A” (a) | 14,100 | $ | 318,660 | ||
| Comcast Corp., “A” | 76,800 | 1,456,896 | |||
| Time Warner Cable, Inc. (a) | 18,500 | 489,880 | |||
| $ | 2,265,436 | ||||
| Consumer Goods & Services – 0.0% | |||||
| Central Garden & Pet Co. (a) | 15,100 | $ | 68,705 | ||
| Electronics – 0.1% | |||||
| Intel Corp. | 15,600 | $ | 335,088 | ||
| Energy – Integrated – 0.1% | |||||
| Chevron Corp. | 3,200 | $ | 317,216 | ||
| Forest & Paper Products – 0.0% | |||||
| Louisiana-Pacific Corp. | 16,100 | $ | 136,689 | ||
| Gaming & Lodging – 0.2% | |||||
| MGM Mirage (a) | 8,600 | $ | 291,454 | ||
| Pinnacle Entertainment, Inc. (a) | 16,000 | 167,840 | |||
| $ | 459,294 | ||||
| Major Banks – 0.1% | |||||
| Bank of America Corp. | 8,100 | $ | 193,347 | ||
| JPMorgan Chase & Co. | 3,800 | 130,378 | |||
| $ | 323,725 | ||||
| Issuer | Shares/Par | Value ($) | ||||
| COMMON STOCKS – continued | ||||||
| Printing & Publishing – 0.0% | ||||||
| Golden Books Family Entertainment, Inc. (a) | 2,125 | $ | 0 | |||
| Real Estate – 0.1% | ||||||
| Host Hotels & Resorts, Inc., REIT | 32,300 | $ | 440,895 | |||
| Telephone Services – 0.2% | ||||||
| Windstream Corp. | 49,900 | $ | 615,766 | |||
| Utilities – Electric Power – 0.3% | ||||||
| Reliant Energy, Inc. (a) | 40,700 | $ | 865,689 | |||
| Total Common Stocks (Identified Cost, $7,733,854) | $ | 5,828,503 | ||||
| PREFERRED STOCKS – 0.8% | ||||||
| Brokerage & Asset Managers – 0.8% | ||||||
| Merrill Lynch Co., Inc., 8.625% (Identified Cost, $2,533,125)(a) | 101,325 | $ | 2,350,740 | |||
| SHORT-TERM OBLIGATIONS – 2.2% | ||||||
| Toyota Motor Credit Corp., 2.57%, due 7/01/08, at Amortized Cost and Value (y) | $ | 6,606,000 | $ | 6,606,000 | ||
| Total Investments (Identified Cost, $321,103,451) | $ | 297,634,742 | ||||
| OTHER ASSETS, LESS LIABILITIES – 1.5% | 4,493,726 | |||||
| Net Assets – 100.0% | $ | 302,128,468 | ||||
| (a) | Non-income producing security. |
| (d) | Non-income producing security – in default. |
| (g) | The rate shown represents a weighted average coupon rate on settled positions at period end, unless otherwise indicated. |
| (n) | Securities exempt from registration under Rule 144A of the Securities Act of 1933. These securities may be sold in the ordinary course of business in transactions exempt from registration, normally to qualified institutional buyers. At period end, the aggregate value of these securities was $39,615,417, representing 13.1% of net assets. |
| (o) | All or a portion of this position has not settled. Upon settlement date, interest rates will be determined. |
| (p) | Payment-in-kind security. |
| (q) | All or a portion of this position represents an unfunded loan commitment. The rate shown represents a weighted average coupon rate on the full position, including the unfunded loan commitment which has no current coupon rate. |
| (r) | Remaining maturities of floating rate loans may be less than stated maturities shown as a result of contractual or optional prepayments by the borrower. Such prepayments cannot be predicted with certainty. These loans may be subject to restrictions on resale. Floating rate loans generally have rates of interest which are determined periodically by reference to a base lending rate plus a premium. |
| (y) | The rate shown represents an annualized yield at time of purchase. |
| (z) | Restricted securities are not registered under the Securities Act of 1933 and are subject to legal restrictions on resale. These securities generally may be resold in transactions exempt from registration or to the public if the securities are subsequently registered. Disposal of these securities may involve time-consuming negotiations and prompt sale at an acceptable price may be difficult. The fund holds the following restricted securities: |
8
Table of Contents
Portfolio of Investments (unaudited) – continued
| Restricted Securities | Acquisition Date | Cost | Current Market Value | |||
| Airlie LCDO Ltd., CDO, FRN, 4.498%, 2011 | 10/16/06 | $677,000 | $446,819 | |||
| American Media Operations, Inc., 10.25%, 2009 | 12/01/06 -11/28/07 | 52,396 | 42,997 | |||
| Anthracite Ltd., CDO, 6%, 2037 | 5/14/02 | 244,220 | 121,799 | |||
| Arbor Realty Mortgage Securities, CDO, FRN, 5.117%, 2038 | 12/20/05 | 668,203 | 396,484 | |||
| Atlas Pipeline Partners LP, 8.75%, 2018 | 1/06/06 - 2/23/07 | 940,000 | 932,950 | |||
| CWCapital Cobalt Ltd., CDO, “F”, FRN, 4.206%, 2050 | 4/12/06 | 500,000 | 152,080 | |||
| DIRECTV Holdings LLC, 7.625%, 2016 | 5/07/08 | 1,635,000 | 1,610,475 | |||
| Evraz Group S.A., 8.875%, 2013 | 4/28/08 | 948,835 | 936,122 | |||
| Firekeepers Development Authority, 13.875%, 2015 | 4/22/08 | 971,579 | 977,500 | |||
| Ply Gem Industries, Inc., 11.75%, 2013 | 6/10/08 | 538,610 | 509,213 | |||
| Residential Capital LLC, 9.625%, 2015 | 6/06/08 | 36,635 | 36,860 | |||
| Wachovia Credit, CDO, FRN, 4.154%, 2026 | 6/08/06 | 372,000 | 205,727 | |||
| Total Restricted Securities | $6,369,026 | |||||
| % of Net Assets | 2.1 % |
Derivative Contracts at 6/30/08
Forward Foreign Currency Exchange Contracts at 6/30/08
| Type | Currency | Contracts to Deliver/Receive | Settlement Date Range | In Exchange For | Contracts at Value | Net Unrealized Appreciation (Depreciation) | ||||||||||||
| Appreciation | ||||||||||||||||||
| BUY | EUR | 524,313 | 8/25/08 | $ | 814,384 | $ | 823,491 | $ | 9,107 | |||||||||
| Depreciation | ||||||||||||||||||
| SELL | EUR | 897,545 | 8/25/08 | $ | 1,393,604 | $ | 1,409,693 | $ | (16,089 | ) | ||||||||
Swap Agreements at 6/30/08
| Expiration | Notional Amount | Counterparty | Cash Flows to Receive | Cash Flows to Pay | Value | |||||||
| Credit Default Swaps | ||||||||||||
| 6/20/09 | USD | 1,300,000 | JPMorgan Chase Bank | 4.1% (fixed rate) | (1) | $(200,226) | ||||||
| 6/20/09 | USD | 650,000 | JPMorgan Chase Bank | 4.8% (fixed rate) | (1) | $(96,150) | ||||||
| 6/20/12 | USD | 1,300,000 | Morgan Stanley Capital Services, Inc. | 3.76% (fixed rate) | (2) | $(350,693) | ||||||
| 6/20/12 | USD | 650,000 | Morgan Stanley Capital Services, Inc. | 4.15% (fixed rate) | (2) | $(168,990) | ||||||
6/20/13 | USD | 1,350,000 | Goldman Sachs International (a) | 5.0% (fixed rate) | (3) | $(303,256) | ||||||
| $(1,119,315) | ||||||||||||
| (1) | Fund to pay notional amount upon a defined credit event by Abitibi Consolidated, Inc., 8.375%, 4/01/15. |
| (2) | Fund to pay notional amount upon a defined credit event by Bowater, Inc., 6.5%, 6/15/13. |
| (3) | Fund to pay notional amount upon a defined credit event by Station Casinos, Inc., 6.0%, 4/01/12. |
| (a) | Net unamortized premiums received by the fund amounted to $229,329. |
At June 30, 2008, the fund had sufficient cash and/or other liquid securities to cover any commitments under these derivative contracts.
9
Table of Contents
Portfolio of Investments (unaudited) – continued
The following abbreviations are used in this report and are defined:
| CDO | Collateralized Debt Obligation |
| CLN | Credit-Linked Note |
| CLO | Collateralized Loan Obligation |
| DIP | Debtor-in-Possession |
| FRN | Floating Rate Note. Interest rate resets periodically and may not be the rate reported at period end. |
| REIT | Real Estate Investment Trust |
| Insurers |
| MBIA | MBIA Insurance Corp. |
Abbreviations indicate amounts shown in currencies other than the U.S. dollar. All amounts are stated in U.S. dollars unless otherwise indicated. A list of abbreviations is shown below:
| EUR | Euro |
See Notes to Financial Statements
10
Table of Contents
FINANCIAL STATEMENTS | STATEMENT OF ASSETS AND LIABILITIES (unaudited)
This statement represents your fund’s balance sheet, which details the assets and liabilities comprising the total value of the fund.
At 6/30/08 | |||||
Assets | |||||
Investments, at value (identified cost, $321,103,451) | $297,634,742 | ||||
Cash | 97,375 | ||||
Restricted cash | 960,000 | ||||
Receivable for forward foreign currency exchange contracts | 9,107 | ||||
Receivable for investments sold | 4,400,782 | ||||
Receivable for fund shares sold | 998,343 | ||||
Interest and dividends receivable | 6,036,333 | ||||
Other assets | 2,424 | ||||
Total assets | $310,139,106 | ||||
Liabilities | |||||
Payable for forward foreign currency exchange contracts | $16,089 | ||||
Payable for investments purchased | 4,735,507 | ||||
Payable for fund shares reacquired | 2,005,789 | ||||
Swaps, at value (Net unamortized premiums received, $229,329) | 1,119,315 | ||||
Payable to affiliates | |||||
Management fee | 23,236 | ||||
Shareholder servicing costs | 487 | ||||
Distribution fees | 265 | ||||
Administrative services fee | 527 | ||||
Payable for independent trustees’ compensation | 2,083 | ||||
Accrued expenses and other liabilities | 107,340 | ||||
Total liabilities | $8,010,638 | ||||
Net assets | $302,128,468 | ||||
Net assets consist of | |||||
Paid-in capital | $334,847,961 | ||||
Unrealized appreciation (depreciation) on investments and translation of assets and liabilities in foreign currencies | (24,365,579 | ) | |||
Accumulated net realized gain (loss) on investments and foreign currency transactions | (21,038,011 | ) | |||
Undistributed net investment income | 12,684,097 | ||||
Net assets | $302,128,468 | ||||
Shares of beneficial interest outstanding | 35,226,884 | ||||
Initial Class shares | |||||
Net assets | $292,563,768 | ||||
Shares outstanding | 34,107,799 | ||||
Net asset value per share | $8.58 | ||||
Service Class shares | |||||
Net assets | $9,564,700 | ||||
Shares outstanding | 1,119,085 | ||||
Net asset value per share | $8.55 |
See Notes to Financial Statements
11
Table of Contents
FINANCIAL STATEMENTS | STATEMENT OF OPERATIONS (unaudited)
This statement describes how much your fund earned in investment income and accrued in expenses. It also describes any gains and/or losses generated by fund operations.
| Six months ended 6/30/08 | ||||||
| Net investment income | ||||||
Income | ||||||
Interest | $13,549,726 | |||||
Dividends | 70,658 | |||||
Total investment income | $13,620,384 | |||||
Expenses | ||||||
Management fee | $1,181,122 | |||||
Distribution fees | 12,605 | |||||
Shareholder servicing costs | 28,622 | |||||
Administrative services fee | 24,785 | |||||
Independent trustees’ compensation | 5,371 | |||||
Custodian fee | 41,989 | |||||
Shareholder communications | 24,690 | |||||
Auditing fees | 29,976 | |||||
Legal fees | 2,780 | |||||
Miscellaneous | 8,820 | |||||
Total expenses | $1,360,760 | |||||
Fees paid indirectly | (8,240 | ) | ||||
Reduction of expenses by investment adviser | (79,919 | ) | ||||
Net expenses | $1,272,601 | |||||
Net investment income | $12,347,783 | |||||
Realized and unrealized gain (loss) on investments | ||||||
Realized gain (loss) (identified cost basis) | ||||||
Investment transactions | $(7,015,548 | ) | ||||
Futures contracts | 47,337 | |||||
Swap transactions | 312,420 | |||||
Foreign currency transactions | (96,167 | ) | ||||
Net realized gain (loss) on investments and foreign currency transactions | $(6,751,958 | ) | ||||
Change in unrealized appreciation (depreciation) | ||||||
Investments | $(10,197,142 | ) | ||||
Futures contracts | 12,101 | |||||
Swap transactions | (395,234 | ) | ||||
Translation of assets and liabilities in foreign currencies | (6,884 | ) | ||||
Net unrealized gain (loss) on investments and foreign currency translation | $(10,587,159 | ) | ||||
Net realized and unrealized gain (loss) on investments and foreign currency | $(17,339,117 | ) | ||||
Change in net assets from operations | $(4,991,334 | ) |
See Notes to Financial Statements
12
Table of Contents
FINANCIAL STATEMENTS | STATEMENTS OF CHANGES IN NET ASSETS
These statements describe the increases and/or decreases in net assets resulting from operations, any distributions, and any shareholder transactions.
| Six months ended 6/30/08 (unaudited | ) | Year ended 12/31/07 | | |||
Change in net assets | ||||||
From operations | ||||||
Net investment income | $12,347,783 | $26,362,780 | ||||
Net realized gain (loss) on investments and foreign currency transactions | (6,751,958 | ) | 800,814 | |||
Net unrealized gain (loss) on investments and foreign currency translation | (10,587,159 | ) | (20,776,169 | ) | ||
Change in net assets from operations | $(4,991,334 | ) | $6,387,425 | |||
Distributions declared to shareholders | ||||||
From net investment income | ||||||
Initial Class | $(26,027,953 | ) | $(24,944,300 | ) | ||
Service Class | (817,980 | ) | (830,071 | ) | ||
Total distributions declared to shareholders | $(26,845,933 | ) | $(25,774,371 | ) | ||
Change in net assets from fund share transactions | $(1,201,234 | ) | $(12,454,874 | ) | ||
Total change in net assets | $(33,038,501 | ) | $(31,841,820 | ) | ||
Net assets | ||||||
At beginning of period | 335,166,969 | 367,008,789 | ||||
At end of period (including undistributed net investment income of $12,684,097 and | $302,128,468 | $335,166,969 |
See Notes to Financial Statements
13
Table of Contents
FINANCIAL STATEMENTS | FINANCIAL HIGHLIGHTS
The financial highlights table is intended to help you understand the fund’s financial performance for the semiannual period and the past 5 fiscal years. Certain information reflects financial results for a single fund share. The total returns in the table represent the rate by which an investor would have earned (or lost) on an investment in the fund share class (assuming reinvestment of all distributions) held for the entire period.
| Initial Class | Six months 6/30/08 | Years ended 12/31 | ||||||||||||||||
| 2007 | 2006 | 2005 | 2004 | 2003 | ||||||||||||||
| (unaudited) | ||||||||||||||||||
Net asset value, beginning of period | $9.52 | $10.04 | $9.87 | $10.37 | $9.97 | $8.81 | ||||||||||||
Income (loss) from investment operations | ||||||||||||||||||
Net investment income (d) | $0.35 | $0.71 | $0.68 | $0.67 | $0.68 | $0.68 | ||||||||||||
Net realized and unrealized gain (loss) on investments and foreign currency | (0.49 | ) | (0.52 | ) | 0.29 | (0.48 | ) | 0.19 | 0.87 | |||||||||
| Total from investment operations | $(0.14 | ) | $0.19 | $0.97 | $0.19 | $0.87 | $1.55 | |||||||||||
Less distributions declared to shareholders | ||||||||||||||||||
From net investment income | $(0.80 | ) | $(0.71 | ) | $(0.80 | ) | $(0.69 | ) | $(0.47 | ) | $(0.39 | ) | ||||||
Net asset value, end of period | $8.58 | $9.52 | $10.04 | $9.87 | $10.37 | $9.97 | ||||||||||||
Total return (%) (k)(r)(s) | (1.52 | )(n) | 1.77 | 10.37 | 2.16 | 9.15 | 17.96 | |||||||||||
| Ratios (%) (to average net assets) and Supplemental data: | ||||||||||||||||||
Expenses before expense reductions (f) | 0.86 | (a) | 0.88 | 0.91 | 0.90 | 0.86 | 0.89 | |||||||||||
Expenses after expense reductions (f) | 0.81 | (a) | 0.83 | 0.88 | 0.90 | 0.89 | (e) | 0.90 | (e) | |||||||||
Net investment income | 7.85 | (a) | 7.21 | 7.06 | 6.81 | 6.86 | 7.23 | |||||||||||
Portfolio turnover | 41 | 73 | 92 | 56 | 63 | 82 | ||||||||||||
Net assets at end of period (000 Omitted) | $292,564 | $324,081 | $355,113 | $355,264 | $379,246 | $319,245 | ||||||||||||
See Notes to Financial Statements
14
Table of Contents
Financial Highlights – continued
| Service Class | Six months 6/30/08 | Years ended 12/31 | ||||||||||||||||
| 2007 | 2006 | 2005 | 2004 | 2003 | ||||||||||||||
| (unaudited) | ||||||||||||||||||
Net asset value, beginning of period | $9.47 | $9.99 | $9.80 | $10.29 | $9.91 | $8.77 | ||||||||||||
Income (loss) from investment operations | ||||||||||||||||||
Net investment income (d) | $0.34 | $0.68 | $0.66 | $0.68 | $0.65 | $0.65 | ||||||||||||
Net realized and unrealized gain (loss) on investments | (0.49 | ) | (0.52 | ) | 0.27 | (0.50 | ) | 0.19 | 0.88 | |||||||||
| Total from investment operations | $(0.15 | ) | $0.16 | $0.93 | $0.18 | $0.84 | $1.53 | |||||||||||
Less distributions declared to shareholders | ||||||||||||||||||
From net investment income | $(0.77 | ) | $(0.68 | ) | $(0.74 | ) | $(0.67 | ) | $(0.46 | ) | $(0.39 | ) | ||||||
Net asset value, end of period | $8.55 | $9.47 | $9.99 | $9.80 | $10.29 | $9.91 | ||||||||||||
Total return (%) (k)(r)(s) | (1.62 | )(n) | 1.54 | 9.99 | 2.05 | 8.82 | 17.70 | |||||||||||
| Ratios (%) (to average net assets) and Supplemental data: | ||||||||||||||||||
Expenses before expense reductions (f) | 1.11 | (a) | 1.13 | 1.16 | 1.15 | 1.11 | 1.14 | |||||||||||
Expenses after expense reductions (f) | 1.06 | (a) | 1.08 | 1.13 | 1.15 | 1.14 | (e) | 1.15 | (e) | |||||||||
Net investment income | 7.60 | (a) | 6.96 | 6.81 | 6.38 | 6.62 | 6.99 | |||||||||||
Portfolio turnover | 41 | 73 | 92 | 56 | 63 | 82 | ||||||||||||
Net assets at end of period (000 Omitted) | $9,565 | $11,086 | $11,896 | $10,056 | $55,562 | $40,955 | ||||||||||||
| (a) | Annualized. |
| (d) | Per share data are based on average shares outstanding. |
| (e) | Ratio includes a reimbursement fee for expenses borne by MFS in prior years under the then existing expense reimbursement agreement. |
| (f) | Ratios do not reflect reductions from fees paid indirectly, if applicable. |
| (k) | The total return does not reflect expenses that apply to separate accounts. Inclusion of these charges would reduce the total return figures for all periods shown. |
| (n) | Not annualized. |
| (r) | Certain expenses have been reduced without which performance would have been lower. |
| (s) | From time to time the fund may receive proceeds from litigation settlements, without which performance would be lower. |
See Notes to Financial Statements
15
Table of Contents
NOTES TO FINANCIAL STATEMENTS (unaudited)
| (1) | Business and Organization |
MFS High Income Series (the fund) is a series of MFS Variable Insurance Trust (the trust). The trust is organized as a Massachusetts business trust and is registered under the Investment Company Act of 1940, as amended, as an open-end management investment company. The shareholders of each series of the trust are separate accounts of insurance companies, which offer variable annuity and/or life insurance products, and qualified retirement and pension plans.
| (2) | Significant Accounting Policies |
General – The preparation of financial statements in conformity with U.S. generally accepted accounting principles requires management to make estimates and assumptions that affect the reported amounts of assets and liabilities, and disclosure of contingent assets and liabilities at the date of the financial statements and the reported amounts of revenues and expenses during the reporting period. Actual results could differ from those estimates. The fund can invest up to 100% of its portfolio in high-yield securities rated below investment grade. Investments in high-yield securities involve greater degrees of credit and market risk than investments in higher-rated securities and tend to be more sensitive to economic conditions. The fund can invest in foreign securities, including securities of emerging market issuers. Investments in foreign securities are vulnerable to the effects of changes in the relative values of the local currency and the U.S. dollar and to the effects of changes in each country’s legal, political, and economic environment. The markets of emerging markets countries are generally more volatile than the markets of developed countries with more mature economies. All of the risks of investing in foreign securities previously described are heightened when investing in emerging markets countries.
Investment Valuations – Debt instruments and floating rate loans (other than short-term instruments), including restricted debt instruments, are generally valued at an evaluated or composite bid as reported by an independent pricing service. Equity securities, including restricted equity securities, are generally valued at the last sale or official closing price as reported by an independent pricing service on the market or exchange on which they are primarily traded. For securities for which there were no sales reported that day, equity securities are generally valued at the last quoted daily bid quotation as reported by an independent pricing service on the market or exchange on which they are primarily traded. For securities held short for which there were no sales reported for the day, the position is generally valued at the last quoted daily ask quotation as reported by an independent pricing service on the market or exchange on which such securities are primarily traded. Short-term instruments with a maturity at issuance of 60 days or less may be valued at amortized cost, which approximates market value. Futures contracts are generally valued at last posted settlement price as reported by an independent pricing service on the market on which they are primarily traded. Futures contracts for which there were no trades that day for a particular position are generally valued at the closing bid quotation as reported by an independent pricing service on the market on which such futures contracts are primarily traded. Forward foreign currency contracts are generally valued at the mean of bid and asked prices for the time period interpolated from rates reported by an independent pricing service for proximate time periods. Swaps are generally valued at an evaluated bid as reported by an independent pricing service. Securities and other assets generally valued on the basis of information from an independent pricing service may also be valued at a broker-dealer bid quotation. Values obtained from pricing services can utilize both dealer-supplied valuations and electronic data processing techniques, which take into account factors such as institutional-size trading in similar groups of securities, yield, quality, coupon rate, maturity, type of issue, trading characteristics, and other market data. The values of foreign securities and other assets and liabilities expressed in foreign currencies are converted to U.S. dollars using the mean of bid and asked prices for rates reported by an independent pricing service.
The Board of Trustees has delegated primary responsibility for determining or causing to be determined the value of the fund’s investments (including any fair valuation) to the adviser pursuant to valuation policies and procedures approved by the Board. If the adviser determines that reliable market quotations are not readily available, investments are valued at fair value as determined in good faith by the adviser in accordance with such procedures under the oversight of the Board of Trustees. Under the fund’s valuation policies and procedures, market quotations are not considered to be readily available for most types of debt instruments and floating rate loans and many types of derivatives. These investments are generally valued at fair value based on information from independent pricing services. In addition, investments may be valued at fair value if the adviser determines that an investment’s value has been materially affected by events occurring after the close of the exchange or market on which the investment is principally traded (such as foreign exchange or market) and prior to the determination of the fund’s net asset value, or after the halting of trading of a specific security where trading does not resume prior to the close of the exchange or market on which the security is principally traded. The adviser may rely on independent pricing services or other information (such as the correlation with price movements of similar securities in the same or other markets; the type, cost and investment characteristics of the security; the business and financial condition of the issuer; and trading and other market data) to assist in determining whether to fair value and at what value to fair value an investment. The value of an investment for purposes of calculating the fund’s net asset value can differ depending on the source and method used to determine value. When fair valuation is used, the value of investments used to determine the fund’s net asset value may differ from quoted or published prices for the same investments.
16
Table of Contents
Notes to Financial Statements (unaudited) – continued
The fund adopted FASB Statement No. 157, Fair Value Measurements (the “Statement”) in this reporting period. This Statement provides a single definition of fair value, a hierarchy for measuring fair value and expanded disclosures about fair value measurements.
Various inputs are used in determining the value of the fund’s assets or liabilities carried at market value. These inputs are categorized into three broad levels. Level 1 includes quoted prices in active markets for identical assets or liabilities. Level 2 includes other significant observable market-based inputs (including quoted prices for similar securities, interest rates, prepayment speed, and credit risk). Level 3 includes unobservable inputs, which may include the adviser’s own assumptions in determining the fair value of investments. Other financial instruments are derivative instruments not reflected in total investments, such as futures, forwards, swap contracts and written options, which are valued at the unrealized appreciation/depreciation on the instrument. The following is a summary of the levels used as of June 30, 2008 in valuing the fund’s assets or liabilities carried at market value:
| Level 1 | Level 2 | Level 3 | Total | ||||||||
| Investments in Securities | $8,179,243 | $289,455,499 | $— | $297,634,742 | |||||||
| Other Financial Instruments | $(6,982 | ) | $(1,119,315 | ) | $— | $(1,126,297 | ) |
Repurchase Agreements – The fund may enter into repurchase agreements with institutions that the fund’s investment adviser has determined are creditworthy. Each repurchase agreement is recorded at cost. The fund requires that the securities collateral in a repurchase transaction be transferred to a custodian in a manner sufficient to enable the fund to obtain those securities in the event of a default under the repurchase agreement. The fund monitors, on a daily basis, the value of the collateral to ensure that its value, including accrued interest, is greater than amounts owed to the fund under each such repurchase agreement. The fund and other funds managed by Massachusetts Financial Services Company (MFS), may utilize a joint trading account for the purpose of entering into one or more repurchase agreements.
Foreign Currency Translation – Purchases and sales of foreign investments, income, and expenses are converted into U.S. dollars based upon currency exchange rates prevailing on the respective dates of such transactions. Gains and losses attributable to foreign currency exchange rates on sales of securities are recorded for financial statement purposes as net realized gains and losses on investments. Gains and losses attributable to foreign exchange rate movements on income and expenses are recorded for financial statement purposes as foreign currency transaction gains and losses. That portion of both realized and unrealized gains and losses on investments that results from fluctuations in foreign currency exchange rates is not separately disclosed.
Derivative Risk – The fund may invest in derivatives for hedging or non-hedging purposes. While hedging can reduce or eliminate losses, it can also reduce or eliminate gains. When the fund uses derivatives as an investment to gain market exposure, or for hedging purposes, gains and losses from derivative instruments may be substantially greater than the derivative’s original cost. Cash that has been segregated on behalf of certain derivative contracts will be reported separately on the Statement of Assets and Liabilities as restricted cash. On certain over-the-counter derivatives, the fund attempts to reduce its exposure to counterparty credit risk by entering into an ISDA Master Agreement on a bilateral basis with each of the counterparties with whom it undertakes a significant volume of transactions. The ISDA Master Agreement gives the fund the right, upon an event of default by the applicable counterparty, to close out all transactions traded under such agreement and to net amounts owed under each transaction to one net amount payable by one party to the other. This right to close out and net payments across all transactions traded under the ISDA Master Agreement could result in a reduction of the fund’s credit risk to such counterparty equal to any amounts payable by the fund under the applicable transactions, if any. However, absent an event of default by the counterparty, the ISDA Master Agreement does not result in an offset of reported balance sheet assets and liabilities across transactions between the fund and the applicable counterparty. Derivative instruments include futures contracts, forward foreign currency exchange contracts, and swap agreements.
Futures Contracts – The fund may enter into futures contracts for the delayed delivery of securities or currency, or contracts based on financial indices at a fixed price on a future date. In entering such contracts, the fund is required to deposit with the broker either in cash or securities an amount equal to a certain percentage of the contract amount. Subsequent payments are made or received by the fund each day, depending on the daily fluctuations in the value of the contract, and are recorded for financial statement purposes as unrealized gains or losses by the fund. Upon entering into such contracts, the fund bears the risk of interest or exchange rates or securities prices moving unexpectedly, in which case, the fund may not achieve the anticipated benefits of the futures contracts and may realize a loss.
Forward Foreign Currency Exchange Contracts – The fund may enter into forward foreign currency exchange contracts for the purchase or sale of a specific foreign currency at a fixed price on a future date. Risks may arise upon entering into these contracts from the potential inability of counterparties to meet the terms of their contracts and from unanticipated movements in the value of the contract. The fund may enter into forward foreign currency exchange contracts for hedging purposes as well
17
Table of Contents
Notes to Financial Statements (unaudited) – continued
as for non-hedging purposes. For hedging purposes, the fund may enter into contracts to deliver or receive foreign currency it will receive from or require for its normal investment activities. The fund may also use contracts in a manner intended to protect foreign currency denominated securities from declines in value due to unfavorable exchange rate movements. For non-hedging purposes, the fund may enter into contracts with the intent of changing the relative exposure of the fund’s portfolio of securities to different currencies to take advantage of anticipated changes. The forward foreign currency exchange contracts are adjusted by the daily exchange rate of the underlying currency and any gains or losses are recorded as unrealized until the contract settlement date. On contract settlement date, the gains or losses are recorded as realized gains or losses on foreign currency transactions.
Swap Agreements – The fund may enter into swap agreements. A swap is an exchange of cash payments between the fund and another party. Net cash payments are exchanged at specified intervals and are recorded as a realized gain or loss in the Statement of Operations. The value of the swap is adjusted daily and the change in value, including accruals of periodic amounts of interest to be paid or received, is recorded as unrealized appreciation or depreciation in the Statement of Operations. Amounts paid or received at the inception of the swap are reflected as premiums paid or received on the Statement of Assets and Liabilities and are amortized using the effective interest method over the term of the agreement. A liquidation payment received or made upon early termination is recorded as a realized gain or loss in the Statement of Operations. Collateral, in the form of cash or securities, may be required to be held in segregated accounts with the fund’s custodian in connection with these agreements. Risk of loss may exceed amounts recognized on the Statement of Assets and Liabilities. These risks include the possible lack of a liquid market, failure of the counterparty to perform under the terms of the agreements, and unfavorable market and interest rate movements of the underlying instrument.
The fund holds credit default swaps in which one party makes a stream of payments based on a fixed percentage applied to the notional amount to another party in exchange for the right to receive a specified return in the event of a default by a third party, such as a corporate issuer or foreign issuer, on its obligation. The fund may enter into credit default swaps to limit or to reduce its risk exposure to defaults of corporate and sovereign issuers or to create direct or synthetic short or long exposure to corporate debt securities or certain sovereign debt securities to which it is not otherwise exposed.
In March 2008, FASB Statement No. 161, Disclosures about Derivative Instruments and Hedging Activities (the “Standard”) was issued, and is effective for financial statements issued for fiscal years and interim periods beginning after November 15, 2008. This Standard provides enhanced disclosures about the fund’s use of and accounting for derivative instruments and the effect of derivative instruments on the fund’s results of operations and financial position. Management is evaluating the application of the Standard to the fund, and has not at this time determined the impact, if any, resulting from the adoption of this Standard on the fund’s financial statements.
Hybrid Instruments – The fund may invest in indexed or hybrid securities on which any combination of interest payments, the principal or stated amount payable at maturity is determined by reference to prices of other securities, currencies, indexes, economic factors or other measures, including interest rates, currency exchange rates, or securities indices. The risks of investing in hybrid instruments reflect a combination of the risks of investing in securities, swaps, options, futures and currencies. Hybrid instruments are potentially more volatile and carry greater market risks than traditional debt instruments. Depending on the structure of the particular hybrid instrument, changes in a benchmark, underlying assets or economic indicator may be magnified by the terms of the hybrid instrument and have an even more dramatic and substantial effect upon the value of the hybrid instrument. Also, the prices of the hybrid instrument and the benchmark, underlying asset or economic indicator may not move in the same direction or at the same time.
Loans and Other Direct Debt Instruments – The fund may invest in loans and loan participations or other receivables. These investments may include standby financing commitments, including revolving credit facilities, which obligate the fund to supply additional cash to the borrower on demand. At June 30, 2008, the portfolio had unfunded loan commitments of $23,799, which could be extended at the option of the borrower and which are covered by sufficient cash and/or liquid securities held by the fund. The market value and obligation of the fund on these unfunded loan commitments is included in Investments, at value and Payable for investments purchased, respectively, on the Statement of Assets and Liabilities. Loan participations involve a risk of insolvency of the lending bank or other financial intermediary.
Indemnifications – Under the fund’s organizational documents, its officers and trustees may be indemnified against certain liabilities and expenses arising out of the performance of their duties to the fund. Additionally, in the normal course of business, the fund enters into agreements with service providers that may contain indemnification clauses. The fund’s maximum exposure under these agreements is unknown as this would involve future claims that may be made against the fund that have not yet occurred.
Investment Transactions and Income – Investment transactions are recorded on the trade date. Interest income is recorded on the accrual basis. All premium and discount is amortized or accreted for financial statement purposes in accordance with U.S.
18
Table of Contents
Notes to Financial Statements (unaudited) – continued
generally accepted accounting principles. The fund earns certain fees in connection with its floating rate loan purchasing activities. These fees are in addition to interest payments earned and may include amendment fees, commitment fees, facility fees, consent fees, and prepayment fees. Commitment fees are recorded on an accrual basis as income in the accompanying financial statements. Dividends received in cash are recorded on the ex-dividend date. Certain dividends from foreign securities will be recorded when the fund is informed of the dividend if such information is obtained subsequent to the ex-dividend date. Dividend and interest payments received in additional securities are recorded on the ex-dividend or ex-interest date in an amount equal to the value of the security on such date.
The fund may receive proceeds from litigation settlements. Any proceeds received from litigation involving portfolio holdings are reflected in the Statement of Operations in realized gain/loss if the security has been disposed of by the fund or in unrealized gain/loss if the security is still held by the fund. Any other proceeds from litigation not related to portfolio holdings are reflected as other income in the Statement of Operations.
Fees Paid Indirectly – The fund’s custody fee may be reduced according to an arrangement that measures the value of cash deposited with the custodian by the fund. This amount, for the six months ended June 30, 2008, is shown as a reduction of total expenses on the Statement of Operations.
Tax Matters and Distributions – The fund intends to qualify as a regulated investment company, as defined under Subchapter M of the Internal Revenue Code, and to distribute all of its taxable income, including realized capital gains. As a result, no provision for federal income tax is required. The fund adopted the provisions of FASB Interpretation No. 48, Accounting for Uncertainty in Income Taxes (“the Interpretation”). The Interpretation prescribes a minimum threshold for financial statement recognition of the benefit of a tax position taken or expected to be taken in a tax return. There was no impact resulting from the adoption of this Interpretation on the fund’s financial statements. Each of the fund’s federal tax returns for the prior three fiscal years remains subject to examination by the Internal Revenue Service. It is the fund’s policy to record interest and penalty charges on underpaid taxes associated with its tax positions as interest expense and miscellaneous expense, respectively. No such charges were recorded in the current financial statements. Foreign taxes, if any, have been accrued by the fund in the accompanying financial statements.
Distributions to shareholders are recorded on the ex-dividend date. Income and capital gain distributions are determined in accordance with income tax regulations, which may differ from U.S. generally accepted accounting principles. Certain capital accounts in the financial statements are periodically adjusted for permanent differences in order to reflect their tax character. These adjustments have no impact on net assets or net asset value per share. Temporary differences which arise from recognizing certain items of income, expense, gain or loss in different periods for financial statement and tax purposes will reverse at some time in the future. Distributions in excess of net investment income or net realized gains are temporary overdistributions for financial statement purposes resulting from differences in the recognition or classification of income or distributions for financial statement and tax purposes.
Book/tax differences primarily relate to amortization and accretion of debt securities and derivative transactions. The tax character of distributions made during the current period will be determined at fiscal year end.
The tax character of distributions declared to shareholders is as follows:
| 12/31/07 | ||
| Ordinary income (including any short-term capital gains) | $25,774,371 |
The federal tax cost and the tax basis components of distributable earnings were as follows:
| As of 6/30/08 | |||
| Cost of investments | $321,753,430 | ||
| Gross appreciation | 2,663,289 | ||
| Gross depreciation | (26,781,977 | ) | |
| Net unrealized appreciation (depreciation) | $(24,118,688 | ) | |
| As of 12/31/07 | |||
| Undistributed ordinary income | $26,845,402 | ||
| Capital loss carryforwards | (13,414,589 | ) | |
| Other temporary differences | (3,851 | ) | |
| Net unrealized appreciation (depreciation) | (14,309,188 | ) | |
The aggregate cost above includes prior fiscal year end tax adjustments.
19
Table of Contents
Notes to Financial Statements (unaudited) – continued
As of December 31, 2007, the fund had capital loss carryforwards available to offset future realized gains. Such losses expire as follows:
| 12/31/09 | $(1,979,638 | ) | |
| 12/31/10 | (8,888,518 | ) | |
| 12/31/13 | (192,521 | ) | |
| 12/31/14 | (2,353,912 | ) | |
| $(13,414,589 | ) |
Multiple Classes of Shares of Beneficial Interest – The fund offers multiple classes of shares, which differ in their respective distribution fees. The fund’s income, realized and unrealized gain (loss), and common expenses are allocated to shareholders based on the daily net assets of each class, without distinction between share classes. Dividends are declared separately for each class. Differences in per share dividend rates are generally due to differences in separate class expenses.
| (3) | Transactions with Affiliates |
Investment Adviser – The fund has an investment advisory agreement with Massachusetts Financial Services Company (MFS) to provide overall investment management and related administrative services and facilities to the fund. The management fee is computed daily and paid monthly at an annual rate of 0.75% of the fund’s average daily net assets. The investment adviser has agreed in writing to reduce its management fee to 0.70% for the first $1 billion of average daily net assets and 0.65% of average daily net assets in excess of $1 billion. This written agreement may be rescinded only upon consent of the fund’s Board of Trustees. This management fee reduction amounted to $79,004, which is shown as a reduction of total expenses in the Statement of Operations. The management fee incurred for the six months ended June 30, 2008 was equivalent to an annual effective rate of 0.70% of the fund’s average daily net assets.
The investment adviser has agreed in writing to pay a portion of the fund’s operating expenses, exclusive of management, distribution, and certain other fees and expenses, such that operating expenses do not exceed 0.15% annually of the fund’s average daily net assets. This written agreement will continue through April 30, 2009 unless changed or rescinded by the fund’s Board of Trustees. For the six months ended June 30, 2008, the fund’s actual operating expenses did not exceed the limit and therefore, the investment advisor did not pay any portion of the fund’s expenses.
Distributor – MFS Fund Distributors, Inc. (MFD), a wholly-owned subsidiary of MFS, is the distributor of shares of the fund. The Trustees have adopted a distribution plan for the Service Class shares pursuant to Rule 12b-1 under the Investment Company Act of 1940.
The fund’s distribution plan provides that the fund will pay MFD distribution fees equal to 0.25% per annum of its average daily net assets attributable to Service Class shares as partial consideration for services performed and expenses incurred by MFD and financial intermediaries (including participating insurance companies that invest in the fund to fund variable annuity and variable life insurance contracts, sponsors of qualified retirement and pension plans that invest in the fund, and affiliates of these participating insurance companies and plan sponsors) in connection with the sale and distribution of the Service Class shares. MFD may subsequently pay all, or a portion, of the distribution fees to financial intermediaries.
Shareholder Servicing Agent – MFS Service Center, Inc. (MFSC), a wholly-owned subsidiary of MFS, receives a fee from the fund for its services as shareholder servicing agent. For the six months ended June 30, 2008, the fee was $28,603, which equated to 0.0182% annually of the fund’s average daily net assets. MFSC also receives payment from the fund for out-of-pocket expenses paid by MFSC on behalf of the fund. For the six months ended June 30, 2008, these costs amounted to $19.
Administrator – MFS provides certain financial, legal, shareholder communications, compliance, and other administrative services to the fund. Under an administrative services agreement, the fund partially reimburses MFS the costs incurred to provide these services. The fund is charged a fixed amount plus a fee based on average daily net assets. The fund’s annual fixed amount is $17,500.
The administrative services fee incurred for the six months ended June 30, 2008 was equivalent to an annual effective rate of 0.0158% of the fund’s average daily net assets.
Trustees’ and Officers’ Compensation – The fund pays compensation to independent trustees in the form of a retainer, attendance fees, and additional compensation to Board and Committee chairpersons. The fund does not pay compensation directly to trustees or officers of the fund who are also officers of the investment adviser, all of whom receive remuneration for their services to the fund from MFS. Certain officers and trustees of the fund are officers or directors of MFS, MFD, and MFSC.
Other – This fund and certain other MFS funds (the funds) have entered into a services agreement (the Agreement) which provides for payment of fees by the funds to Tarantino LLC in return for the provision of services of an Independent Chief Compliance Officer (ICCO) for the funds. The ICCO is an officer of the funds and the sole member of Tarantino LLC. The funds can terminate the Agreement with Tarantino LLC at any time under the terms of the Agreement. For the six months ended
20
Table of Contents
Notes to Financial Statements (unaudited) – continued
June 30, 2008, the fee paid by the fund to Tarantino LLC was $925 and is included in miscellaneous expense on the Statement of Operations. MFS has agreed to reimburse the fund for a portion of the payments made by the fund to Tarantino LLC in the amount of $915, which is shown as a reduction of total expenses in the Statement of Operations. Additionally, MFS has agreed to bear all expenses associated with office space, other administrative support, and supplies provided to the ICCO.
| (4) | Portfolio Securities |
Purchases and sales of investments, other than U.S. Government securities, purchased option transactions, and short-term obligations, aggregated $123,329,198 and $ 138,958,972, respectively.
| (5) | Shares of Beneficial Interest |
The fund’s Declaration of Trust permits the Trustees to issue an unlimited number of full and fractional shares of beneficial interest. Transactions in fund shares were as follows:
| Six months ended 6/30/08 | Year ended 12/31/07 | |||||||||||
| Shares | Amount | Shares | Amount | |||||||||
| Shares sold | ||||||||||||
Initial Class | 2,431,798 | $22,035,210 | 3,581,378 | $34,938,097 | ||||||||
Service Class | 10,807 | 98,477 | 198,130 | 1,977,299 | ||||||||
| 2,442,605 | $22,133,687 | 3,779,508 | $36,915,396 | |||||||||
| Shares issued to shareholders in reinvestment of distributions | ||||||||||||
Initial Class | 3,033,561 | $26,027,953 | 2,587,583 | $24,944,300 | ||||||||
Service Class | 95,558 | 817,980 | 86,376 | 830,071 | ||||||||
| 3,129,119 | $26,845,933 | 2,673,959 | $25,774,371 | |||||||||
| Shares reacquired | ||||||||||||
Initial Class | (5,404,012 | ) | $(48,746,533 | ) | (7,496,994 | ) | $(72,180,784 | ) | ||||
Service Class | (157,972 | ) | (1,434,321 | ) | (304,319 | ) | (2,963,857 | ) | ||||
| (5,561,984 | ) | $(50,180,854 | ) | (7,801,313 | ) | $(75,144,641 | ) | |||||
| Net change | ||||||||||||
Initial Class | 61,347 | $(683,370 | ) | (1,328,033 | ) | $(12,298,387 | ) | |||||
Service Class | (51,607 | ) | (517,864 | ) | (19,813 | ) | (156,487 | ) | ||||
| 9,740 | $(1,201,234 | ) | (1,347,846 | ) | $(12,454,874 | ) | ||||||
| (6) | Line of Credit |
The fund and other funds managed by MFS participate in a $1 billion unsecured committed line of credit provided by a syndication of banks under a credit agreement. In addition, the fund and other funds managed by MFS have established uncommitted borrowing arrangements with certain banks. Borrowings may be made for temporary financing needs. Interest is charged to each fund, based on its borrowings, generally at a rate equal to the Federal Reserve funds rate plus 0.30%. In addition, a commitment fee, based on the average daily, unused portion of the committed line of credit, is allocated among the participating funds at the end of each calendar quarter. For the six months ended June 30, 2008, the fund’s commitment fee and interest expense were $757 and $0, respectively, and are included in miscellaneous expense on the Statement of Operations.
21
Table of Contents
BOARD REVIEW OF INVESTMENT ADVISORY AGREEMENT
A discussion regarding the Board’s most recent review and renewal of the fund’s Investment Advisory Agreement with MFS will be available on or about November 1, 2008 by clicking on the fund’s name under “Variable Insurance Portfolios - VIT” in the “Products and Performance” section of the MFS Web site (mfs.com).
PROXY VOTING POLICIES AND INFORMATION
A general description of the MFS funds’ proxy voting policies and procedures is available without charge, upon request, by calling 1-800-225-2606, by visiting the Proxy Voting section of mfs.com or by visiting the SEC’s Web site at http://www.sec.gov.
Information regarding how the fund voted proxies relating to portfolio securities during the most recent twelve-month period ended June 30 is available without charge by visiting the Proxy Voting section of mfs.com or by visiting the SEC’s Web site at http://www.sec.gov.
QUARTERLY PORTFOLIO DISCLOSURE
The fund will file a complete schedule of portfolio holdings with the Securities and Exchange Commission (the Commission) for the first and third quarters of each fiscal year on Form N-Q. The fund’s Form N-Q may be reviewed and copied at the:
Public Reference Room
Securities and Exchange Commission
100 F Street, NE, Room 1580
Washington, D.C. 20549
Information on the operation of the Public Reference Room may be obtained by calling the Commission at 1-800-SEC-0330. The fund’s Form N-Q is available on the EDGAR database on the Commission’s Internet Web site at http://www.sec.gov, and copies of this information may be obtained, upon payment of a duplicating fee, by electronic request at the following e-mail address: publicinfo@sec.gov or by writing the Public Reference Section at the above address.
22
Table of Contents
CONTACT US
Web site
mfs.com
Account service and literature
Shareholders
1-877-411-3325
9 a.m. to 5 p.m. Eastern Time
Investment professionals
1-800-637-8730
8 a.m. to 5 p.m. Eastern Time
Mailing address
MFS Service Center, Inc.
Attn: Institutional Alliance Services (IAS)
P.O. Box 55824
Boston, MA 02205-5824
Overnight mail
MFS Service Center, Inc.
c/o Boston Financial Data Services
30 Dan Road
Canton, MA 02021-2809

Table of Contents

Table of Contents
MFS® INVESTORS GROWTH STOCK SERIES
This report is prepared for the general information of contract owners. It is authorized for distribution to prospective investors only when preceded or accompanied by a current prospectus.
NOT FDIC INSURED Ÿ MAY LOSE VALUE Ÿ NO BANK OR CREDIT UNION GUARANTEE Ÿ NOT A DEPOSIT Ÿ NOT INSURED BY ANY FEDERAL GOVERNMENT AGENCY OR NCUA/NCUSIF
Table of Contents

Dear Contract Owners:
Negative headlines tend to resonate during difficult markets, and we certainly have had more than our share of tough news recently. As a result consumer, and particularly investor, sentiment are at all-time lows. That said, I do think it is helpful to remember there are always silver linings in the storm clouds if you look hard enough.
Through all of the challenges we have faced, there are some positive underlying trends. In the United States, for example, institutional traders and credit market followers are just now showing increasing signs of confidence and are beginning to take on more risk. At the corporate level, earnings continue to be relatively strong as companies have reduced labor costs, controlled inventories, and relied less on debt to finance expansion. More broadly, low interest rates and strong demand for consumer goods and industrial equipment are good signs for the global economy.
While I do not mean to minimize the risks inherent in today’s markets, periods such as these allow the talented fund managers and research analysts we have at MFS® to test their convictions, reevaluate existing positions, and identify new investment ideas. Our investment process also includes a significant risk management component, with constant attention paid to monitoring market risk, so we can do our best to minimize any surprises to your portfolio.
For investors, this is a great time to check in with your advisor and make sure you have a sound investment plan in place — one that can keep your hard-earned money working over the long term through a strategy that involves asset allocation, diversification, and periodic portfolio rebalancing and reviews. A plan tailored to your distinct needs and goals continues to be the best approach to help you take advantage of the inevitable challenges — and opportunities — that present themselves over time.
Respectfully,

Robert J. Manning
Chief Executive Officer and Chief Investment Officer
MFS Investment Management®
August 15, 2008
The opinions expressed in this letter are subject to change, may not be relied upon for investment advice, and no forecasts can be guaranteed.
1
Table of Contents
Portfolio structure

| Top ten holdings | ||
| Cisco Systems, Inc. | 2.7% | |
| Google, Inc., “A” | 2.6% | |
| Oracle Corp. | 2.6% | |
| Microsoft Corp. | 2.3% | |
| Amdocs Ltd. | 2.2% | |
| Genzyme Corp. | 2.2% | |
| LVMH Moet Hennessy Louis Vuitton S.A. | 2.1% | |
| PepsiCo, Inc. | 2.1% | |
| Danaher Corp. | 2.1% | |
| CVS Caremark Corp. | 2.1% |
| Equity sectors | ||
| Technology | 24.0% | |
| Health Care | 17.2% | |
| Consumer Staples | 9.5% | |
| Energy | 9.1% | |
| Retailing | 8.9% | |
| Financial Services | 7.3% | |
| Special Products & Services | 6.5% | |
| Industrial Goods & Services | 6.1% | |
| Leisure | 4.6% | |
| Utilities & Communications | 2.3% | |
| Basic Materials | 2.2% | |
| Transportation | 1.2% |
Percentages are based on net assets as of 6/30/08.
The portfolio is actively managed and current holdings may be different.
2
Table of Contents
Fund Expenses Borne by the Contract Holders During the Period, January 1, 2008 through June 30, 2008
As a contract holder of the fund, you incur ongoing costs, including management fees; distribution (12b-1) fees; and other fund expenses. This example is intended to help you understand your ongoing costs (in dollars) of investing in the fund and to compare these costs with the ongoing costs of investing in other mutual funds.
The example is based on an investment of $1,000 invested at the beginning of the period and held for the entire period January 1, 2008 through June 30, 2008.
Actual Expenses
The first line for each share class in the following table provides information about actual account values and actual expenses. You may use the information in this line, together with the amount you invested, to estimate the expenses that you paid over the period. Simply divide your account value by $1,000 (for example, an $8,600 account value divided by $1,000 = 8.6), then multiply the result by the number in the first line under the heading entitled “Expenses Paid During Period” to estimate the expenses you paid on your account during this period.
Hypothetical Example for Comparison Purposes
The second line for each share class in the following table provides information about hypothetical account values and hypothetical expenses based on the fund’s actual expense ratio and an assumed rate of return of 5% per year before expenses, which is not the fund’s actual return. The hypothetical account values and expenses may not be used to estimate the actual ending account balance or expenses you paid for the period. You may use this information to compare the ongoing costs of investing in the fund and other funds. To do so, compare this 5% hypothetical example with the 5% hypothetical examples that appear in the shareholder reports of the other funds.
Please note that the expenses shown in the table are meant to highlight the fund’s ongoing costs only and do not take into account the fees and expenses imposed under the variable contracts through which your investment in the fund is made. Therefore, the second line for each share class in the table is useful in comparing ongoing costs associated with an investment in vehicles (such as the fund) which fund benefits under variable annuity and variable life insurance contracts and to qualified pension and retirement plans only, and will not help you determine the relative total costs of investing in the fund through variable annuity and variable life insurance contracts. If the fees and expenses imposed under the variable contracts were included, your costs would have been higher.
| Share Class | Annualized Expense Ratio | Beginning Account Value 1/01/08 | Ending Account Value 6/30/08 | Expenses Paid During Period (p) 1/01/08-6/30/08 | ||||||
| Initial Class | Actual | 0.84% | $1,000.00 | $905.13 | $3.98 | |||||
| Hypothetical (h) | 0.84% | $1,000.00 | $1,020.69 | $4.22 | ||||||
| Service Class | Actual | 1.09% | $1,000.00 | $904.06 | $5.16 | |||||
| Hypothetical (h) | 1.09% | $1,000.00 | $1,019.44 | $5.47 |
| (h) | 5% class return per year before expenses. |
| (p) | Expenses paid is equal to each class’ annualized expense ratio, as shown above, multiplied by the average account value over the period, multiplied by the number of days in the period, divided by the number of days in the year. |
3
Table of Contents
PORTFOLIO OF INVESTMENTS – 6/30/08 (unaudited)
The Portfolio of Investments is a complete list of all securities owned by your fund. It is categorized by broad-based asset classes.
| Issuer | Shares/Par | Value ($) | |||
| COMMON STOCKS – 98.9% | |||||
| Aerospace – 2.1% | |||||
| Precision Castparts Corp. | 17,010 | $ | 1,639,250 | ||
| United Technologies Corp. | 101,490 | 6,261,933 | |||
| $ | 7,901,183 | ||||
| Alcoholic Beverages – 1.5% | |||||
| Diageo PLC | 299,410 | $ | 5,503,498 | ||
| Apparel Manufacturers – 3.5% | |||||
| LVMH Moet Hennessy Louis Vuitton S.A. | 75,580 | $ | 7,880,077 | ||
| NIKE, Inc., “B” | 88,050 | 5,248,661 | |||
| $ | 13,128,738 | ||||
| Biotechnology – 3.2% | |||||
| Genentech, Inc. (a) | 30,500 | $ | 2,314,950 | ||
| Genzyme Corp. (a) | 115,620 | 8,326,952 | |||
| Millipore Corp. (a) | 22,310 | 1,513,957 | |||
| $ | 12,155,859 | ||||
| Broadcasting – 2.5% | |||||
| Grupo Televisa S.A., ADR | 106,300 | $ | 2,510,806 | ||
| News Corp., “A” | 174,580 | 2,625,683 | |||
| Omnicom Group, Inc. | 90,490 | 4,061,191 | |||
| $ | 9,197,680 | ||||
| Brokerage & Asset Managers – 2.6% | |||||
| Charles Schwab Corp. | 234,600 | $ | 4,818,684 | ||
| Deutsche Boerse AG | 25,040 | 2,810,542 | |||
| Franklin Resources, Inc. | 24,230 | 2,220,680 | |||
| $ | 9,849,906 | ||||
| Business Services – 6.5% | |||||
| Amdocs Ltd. (a) | 284,900 | $ | 8,381,758 | ||
| Automatic Data Processing, Inc. | 89,950 | 3,768,905 | |||
| Fidelity National Information Services, Inc. | 48,070 | 1,774,264 | |||
| Visa, Inc., “A” | 46,640 | 3,792,298 | |||
| Western Union Co. | 268,210 | 6,630,151 | |||
| $ | 24,347,376 | ||||
| Cable TV – 0.9% | |||||
| Comcast Corp., “A” | 185,345 | $ | 3,515,995 | ||
| Computer Software – 6.2% | |||||
| Citrix Systems, Inc. (a) | 77,580 | $ | 2,281,628 | ||
| Microsoft Corp. | 309,340 | 8,509,943 | |||
| Oracle Corp. (a) | 458,600 | 9,630,600 | |||
| VeriSign, Inc. (a) | 70,180 | 2,652,804 | |||
| $ | 23,074,975 | ||||
| Computer Software – Systems – 3.1% | |||||
| Apple Computer, Inc. (a) | 24,130 | $ | 4,040,327 | ||
| EMC Corp. (a) | 241,640 | 3,549,692 | |||
| International Business Machines Corp. | 34,570 | 4,097,582 | |||
| $ | 11,687,601 | ||||
| Issuer | Shares/Par | Value ($) | |||
| COMMON STOCKS – continued | |||||
| Consumer Goods & Services – 3.4% | |||||
| Colgate-Palmolive Co. | 56,200 | $ | 3,883,420 | ||
| Estee Lauder Cos., Inc., “A” (l) | 42,050 | 1,953,223 | |||
| Procter & Gamble Co. | 115,433 | 7,019,481 | |||
| $ | 12,856,124 | ||||
| Electrical Equipment – 4.0% | |||||
| Danaher Corp. | 101,070 | $ | 7,812,711 | ||
| General Electric Co. | 106,360 | 2,838,748 | |||
| W.W. Grainger, Inc. | 51,170 | 4,185,706 | |||
| $ | 14,837,165 | ||||
| Electronics – 6.4% | |||||
| Intel Corp. | 305,650 | $ | 6,565,362 | ||
| Intersil Corp., “A” | 107,140 | 2,605,645 | |||
| KLA-Tencor Corp. (l) | 98,620 | 4,014,820 | |||
| National Semiconductor Corp. | 97,550 | 2,003,677 | |||
| Samsung Electronics Co. Ltd., GDR | 16,599 | 4,867,192 | |||
| Taiwan Semiconductor Manufacturing Co. Ltd., ADR | 374,371 | 4,084,388 | |||
| $ | 24,141,084 | ||||
| Energy – Integrated – 4.0% | |||||
| Exxon Mobil Corp. | 77,330 | $ | 6,815,093 | ||
| Hess Corp. | 25,780 | 3,253,178 | |||
| Marathon Oil Corp. | 96,140 | 4,986,782 | |||
| $ | 15,055,053 | ||||
| Food & Beverages – 4.6% | |||||
| General Mills, Inc. | 57,490 | $ | 3,493,667 | ||
| Nestle S.A. | 130,600 | 5,910,580 | |||
| PepsiCo, Inc. | 123,350 | 7,843,827 | |||
| $ | 17,248,074 | ||||
| Food & Drug Stores – 2.7% | |||||
| CVS Caremark Corp. | 196,873 | $ | 7,790,265 | ||
| Walgreen Co. | 75,260 | 2,446,703 | |||
| $ | 10,236,968 | ||||
| Gaming & Lodging – 1.2% | |||||
| International Game Technology | 81,290 | $ | 2,030,624 | ||
| Royal Caribbean Cruises Ltd. (l) | 114,990 | 2,583,825 | |||
| $ | 4,614,449 | ||||
| General Merchandise – 0.5% | |||||
| Kohl’s Corp. (a) | 45,900 | $ | 1,837,836 | ||
| Health Maintenance Organizations – 0.5% | |||||
| UnitedHealth Group, Inc. | 64,060 | $ | 1,681,575 | ||
| Insurance – 0.7% | |||||
| MetLife, Inc. | 49,390 | $ | 2,606,310 | ||
4
Table of Contents
Portfolio of Investments (unaudited) – continued
| Issuer | Shares/Par | Value ($) | |||
| COMMON STOCKS – continued | |||||
| Internet – 3.4% | |||||
| eBay, Inc. (a) | 102,810 | $ | 2,809,797 | ||
| Google, Inc., “A” (a) | 18,480 | 9,728,242 | |||
| $ | 12,538,039 | ||||
| Major Banks – 3.0% | |||||
| Bank of New York Mellon Corp. | 98,908 | $ | 3,741,690 | ||
| State Street Corp. | 119,630 | 7,655,124 | |||
| $ | 11,396,814 | ||||
| Medical & Health Technology & Services – 1.2% | |||||
| Cardinal Health, Inc. | 41,210 | $ | 2,125,612 | ||
| VCA Antech, Inc. (a) | 84,550 | 2,348,799 | |||
| $ | 4,474,411 | ||||
| Medical Equipment – 4.8% | |||||
| Advanced Medical Optics, Inc. (a)(l) | 155,020 | $ | 2,905,075 | ||
| Medtronic, Inc. (l) | 119,520 | 6,185,160 | |||
| ResMed, Inc. (a)(l) | 75,170 | 2,686,576 | |||
| Stryker Corp. | 45,580 | 2,866,070 | |||
| Zimmer Holdings, Inc. (a) | 46,610 | 3,171,811 | |||
| $ | 17,814,692 | ||||
| Metals & Mining – 0.7% | |||||
| BHP Billiton Ltd., ADR | 32,250 | $ | 2,747,378 | ||
| Network & Telecom – 4.3% | |||||
| Cisco Systems, Inc. (a) | 431,680 | $ | 10,040,877 | ||
| Juniper Networks, Inc. (a) | 100,520 | 2,229,534 | |||
| QUALCOMM, Inc. | 44,360 | 1,968,253 | |||
| Research in Motion Ltd. (a) | 16,900 | 1,975,610 | |||
| $ | 16,214,274 | ||||
| Oil Services – 5.1% | |||||
| Halliburton Co. | 137,620 | $ | 7,303,493 | ||
| Noble Corp. | 60,080 | 3,902,797 | |||
| Schlumberger Ltd. | 26,460 | 2,842,598 | |||
| Weatherford International Ltd. (a) | 104,160 | 5,165,294 | |||
| $ | 19,214,182 | ||||
| Other Banks & Diversified Financials – 1.0% | |||||
| American Express Co. | 95,900 | $ | 3,612,553 | ||
| Personal Computers & Peripherals – 0.6% | |||||
| NetApp, Inc. (a)(l) | 103,330 | $ | 2,238,128 | ||
| Pharmaceuticals – 7.5% | |||||
| Allergan, Inc. | 74,630 | $ | 3,884,492 | ||
| Johnson & Johnson | 119,480 | 7,687,343 | |||
| Merck KGaA | 27,100 | 3,849,527 | |||
| Roche Holding AG | 30,960 | 5,564,203 | |||
| Wyeth | 147,420 | 7,070,263 | |||
| $ | 28,055,828 | ||||
| Issuer | Shares/Par | Value ($) | |||||
| COMMON STOCKS – continued | |||||||
| Specialty Chemicals – 1.5% | |||||||
| Praxair, Inc. | 57,620 | $ | 5,430,109 | ||||
| Specialty Stores – 2.2% | |||||||
| Lowe’s Cos., Inc. | 97,890 | $ | 2,031,218 | ||||
| Nordstrom, Inc. (l) | 100,270 | 3,038,181 | |||||
| Staples, Inc. | 128,605 | 3,054,369 | |||||
| $ | 8,123,768 | ||||||
| Telecommunications – Wireless – 2.3% | |||||||
| America Movil S.A.B. de C.V., “L”, ADR | 107,030 | $ | 5,645,833 | ||||
| Rogers Communications, Inc., “B” | 76,470 | 2,956,330 | |||||
| $ | 8,602,163 | ||||||
| Trucking – 1.2% | |||||||
| FedEx Corp. | 27,290 | $ | 2,150,179 | ||||
| United Parcel Service, Inc., “B” | 38,880 | 2,389,954 | |||||
| $ | 4,540,133 | ||||||
| Total Common Stocks (Identified Cost, $376,823,655) | $ | 370,479,921 | |||||
| SHORT-TERM OBLIGATIONS – 1.2% | |||||||
| Toyota Motor Credit Corp., 2.57%, due 7/01/08, at Amortized Cost and Value (y) | $ | 4,658,000 | $ | 4,658,000 | |||
| COLLATERAL FOR SECURITIES LOANED – 6.0% | |||||||
| Navigator Securities Lending Prime Portfolio, at Cost and Net Asset Value | 22,547,002 | $ | 22,547,002 | ||||
| Total Investments (Identified Cost, $404,028,657) | $ | 397,684,923 | |||||
| OTHER ASSETS, LESS LIABILITIES – (6.1)% | (22,943,516 | ) | |||||
| Net Assets – 100.0% | $ | 374,741,407 | |||||
| (a) | Non-income producing security. |
| (l) | All or a portion of this security is on loan. |
| (y) | The rate shown represents an annualized yield at time of purchase. |
The following abbreviations are used in this report and are defined:
| ADR | American Depository Receipt |
| GDR | Global Depository Receipt |
See Notes to Financial Statements
5
Table of Contents
FINANCIAL STATEMENTS | STATEMENT OF ASSETS AND LIABILITIES (unaudited)
This statement represents your fund’s balance sheet, which details the assets and liabilities comprising the total value of the fund.
At 6/30/08 | |||||
Assets | |||||
Investments, at value, including $22,513,578 of securities on loan (identified cost, $404,028,657) | $397,684,923 | ||||
Cash | 437 | ||||
Receivable for fund shares sold | 151,450 | ||||
Interest and dividends receivable | 227,554 | ||||
Other assets | 2,944 | ||||
Total assets | $398,067,308 | ||||
Liabilities | |||||
Payable for fund shares reacquired | 641,127 | ||||
Collateral for securities loaned, at value (c) | 22,547,002 | ||||
Payable to affiliates | |||||
Management fee | 30,820 | ||||
Shareholder servicing costs | 486 | ||||
Distribution fees | 7,013 | ||||
Administrative services fee | 623 | ||||
Payable for independent trustees’ compensation | 1,555 | ||||
Accrued expenses and other liabilities | 97,275 | ||||
Total liabilities | $23,325,901 | ||||
Net assets | $374,741,407 | ||||
Net assets consist of | |||||
Paid-in capital | $384,235,079 | ||||
Unrealized appreciation (depreciation) on investments and translation of assets and liabilities in foreign currencies | (6,344,704 | ) | |||
Accumulated distributions in excess of net realized gain on investments and foreign currency transactions | (4,095,710 | ) | |||
Undistributed net investment income | 946,742 | ||||
Net assets | $374,741,407 | ||||
Shares of beneficial interest outstanding | 37,329,913 | ||||
Initial Class shares | |||||
Net assets | $118,884,017 | ||||
Shares outstanding | 11,675,000 | ||||
Net asset value per share | $10.18 | ||||
Service Class shares | |||||
Net assets | $255,857,390 | ||||
Shares outstanding | 25,654,913 | ||||
Net asset value per share | $9.97 |
| (c) | Non-cash collateral is not included. |
See Notes to Financial Statements
6
Table of Contents
FINANCIAL STATEMENTS | STATEMENT OF OPERATIONS (unaudited)
This statement describes how much your fund earned in investment income and accrued in expenses. It also describes any gains and/or losses generated by fund operations.
| Six months ended 6/30/08 | ||||||
| Net investment income | ||||||
Income | ||||||
Dividends | $2,885,543 | |||||
Interest | 226,641 | |||||
Foreign taxes withheld | (151,829 | ) | ||||
Total investment income | $2,960,355 | |||||
Expenses | ||||||
Management fee | $1,494,758 | |||||
Distribution fees | 337,178 | |||||
Shareholder servicing costs | 36,214 | |||||
Administrative services fee | 29,859 | |||||
Independent trustees’ compensation | 5,920 | |||||
Custodian fee | 49,361 | |||||
Shareholder communications | 22,639 | |||||
Auditing fees | 22,918 | |||||
Legal fees | 3,548 | |||||
Miscellaneous | 11,944 | |||||
Total expenses | $2,014,339 | |||||
Reduction of expenses by investment adviser | (1,169 | ) | ||||
Net expenses | $2,013,170 | |||||
Net investment income | $947,185 | |||||
Realized and unrealized gain (loss) on investments | ||||||
Realized gain (loss) (identified cost basis) | ||||||
Investment transactions | $(1,292,524 | ) | ||||
Foreign currency transactions | (11,136 | ) | ||||
Net realized gain (loss) on investments and foreign currency transactions | $(1,303,660 | ) | ||||
Change in unrealized appreciation (depreciation) | ||||||
Investments | $(41,393,995 | ) | ||||
Translation of assets and liabilities in foreign currencies | (1,468 | ) | ||||
Net unrealized gain (loss) on investments and foreign currency translation | $(41,395,463 | ) | ||||
Net realized and unrealized gain (loss) on investments and foreign currency | $(42,699,123 | ) | ||||
Change in net assets from operations | $(41,751,938 | ) |
See Notes to Financial Statements
7
Table of Contents
FINANCIAL STATEMENTS | STATEMENTS OF CHANGES IN NET ASSETS
These statements describe the increases and/or decreases in net assets resulting from operations, any distributions, and any shareholder transactions.
Change in net assets | Six months ended 6/30/08 (unaudited | ) | Year ended 12/31/07 | | ||
From operations | ||||||
Net investment income | $947,185 | $1,395,642 | ||||
Net realized gain (loss) on investments and foreign currency transactions | (1,303,660 | ) | 41,539,340 | |||
Net unrealized gain (loss) on investments and foreign currency translation | (41,395,463 | ) | 5,192,682 | |||
Change in net assets from operations | $(41,751,938 | ) | $48,127,664 | |||
Distributions declared to shareholders | ||||||
From net investment income | ||||||
Initial Class | $(675,481 | ) | $(523,958 | ) | ||
Service Class | (709,104 | ) | (251,139 | ) | ||
From net realized gain on investments | ||||||
Initial Class | (5,520,376 | ) | — | |||
Service Class | (11,834,054 | ) | — | |||
Total distributions declared to shareholders | $(18,739,015 | ) | $(775,097 | ) | ||
Change in net assets from fund share transactions | $(10,049,388 | ) | $(63,177,765 | ) | ||
Total change in net assets | $(70,540,341 | ) | $(15,825,198 | ) | ||
Net assets | ||||||
At beginning of period | 445,281,748 | 461,106,946 | ||||
At end of period (including undistributed net investment income of $946,742 and | $374,741,407 | $445,281,748 |
See Notes to Financial Statements
8
Table of Contents
FINANCIAL STATEMENTS | FINANCIAL HIGHLIGHTS
The financial highlights table is intended to help you understand the fund’s financial performance for the semiannual period and the past 5 fiscal years (or life of a particular share class, if shorter). Certain information reflects financial results for a single fund share. The total returns in the table represent the rate by which an investor would have earned (or lost) on an investment in the fund share class (assuming reinvestment of all distributions) held for the entire period.
| Initial Class | Six months ended 6/30/08 | Years ended 12/31 | |||||||||||||||
| 2007 | 2006 | 2005 | 2004 | 2003 | |||||||||||||
| (unaudited) | |||||||||||||||||
Net asset value, beginning of period | $11.82 | $10.65 | $9.90 | $9.51 | $8.71 | $7.08 | |||||||||||
Income (loss) from investment operations | |||||||||||||||||
Net investment income (d) | $0.03 | $0.05 | $0.03 | $0.01 | $0.03 | $0.00 | (w) | ||||||||||
Net realized and unrealized gain (loss) on investments and foreign currency | (1.13 | ) | 1.16 | 0.72 | 0.41 | 0.77 | 1.63 | ||||||||||
Total from investment operations | $(1.10 | ) | $1.21 | $0.75 | $0.42 | $0.80 | $1.63 | ||||||||||
Less distributions declared to shareholders | |||||||||||||||||
From net investment income | $(0.06 | ) | $(0.04 | ) | $— | $(0.03 | ) | $— | $— | ||||||||
From net realized gain on investments | (0.48 | ) | — | — | — | — | — | ||||||||||
Total distributions declared to shareholders | $(0.54 | ) | $(0.04 | ) | $— | $(0.03 | ) | $— | $— | ||||||||
Net asset value, end of period | $10.18 | $11.82 | $10.65 | $9.90 | $9.51 | $8.71 | |||||||||||
Total return (%) (k)(r)(s) | (9.49 | )(n) | 11.36 | 7.58 | 4.49 | 9.18 | (b) | 23.02 | |||||||||
| Ratios (%) (to average net assets) and Supplemental data: | |||||||||||||||||
Expenses before expense reductions (f) | 0.84 | (a) | 0.86 | 0.87 | 0.90 | 0.86 | 0.88 | ||||||||||
Expenses after expense reductions (f) | 0.84 | (a) | 0.86 | 0.87 | 0.90 | 0.86 | N/A | ||||||||||
Net investment income | 0.64 | (a) | 0.47 | 0.33 | 0.09 | 0.37 | 0.04 | ||||||||||
Portfolio turnover | 17 | 63 | 80 | 146 | 144 | 253 | |||||||||||
Net assets at end of period (000 Omitted) | $118,884 | $148,096 | $161,081 | $176,463 | $217,934 | $199,674 | |||||||||||
See Notes to Financial Statements
9
Table of Contents
Financial Highlights – continued
| Service Class | Six months ended 6/30/08 | Years ended 12/31 | |||||||||||||||
| 2007 | 2006 | 2005 | 2004 | 2003 | |||||||||||||
| (unaudited) | |||||||||||||||||
Net asset value, beginning of period | $11.57 | $10.43 | $9.72 | $9.34 | $8.57 | $6.99 | |||||||||||
Income (loss) from investment operations | |||||||||||||||||
Net investment income (loss) (d) | $0.02 | $0.02 | $0.01 | $(0.01 | ) | $0.01 | $(0.02 | ) | |||||||||
Net realized and unrealized gain (loss) on investments and foreign currency | (1.11 | ) | 1.13 | 0.70 | 0.40 | 0.76 | 1.60 | ||||||||||
Total from investment operations | $(1.09 | ) | $1.15 | $0.71 | $0.39 | $0.77 | $1.58 | ||||||||||
Less distributions declared to shareholders | |||||||||||||||||
From net investment income | $(0.03 | ) | $(0.01 | ) | $— | $(0.01 | ) | $— | $— | ||||||||
From net realized gain on investments | (0.48 | ) | — | — | — | — | — | ||||||||||
Total distributions declared to shareholders | $(0.51 | ) | $(0.01 | ) | $— | $(0.01 | ) | $— | $— | ||||||||
Net asset value, end of period | $9.97 | $11.57 | $10.43 | $9.72 | $9.34 | $8.57 | |||||||||||
Total return (%) (k)(r)(s) | (9.59 | )(n) | 11.02 | 7.30 | 4.23 | 8.98 | (b) | 22.60 | |||||||||
| Ratios (%) (to average net assets) and Supplemental data: | |||||||||||||||||
Expenses before expense reductions (f) | 1.09 | (a) | 1.11 | 1.12 | 1.15 | 1.11 | 1.13 | ||||||||||
Expenses after expense reductions (f) | 1.09 | (a) | 1.11 | 1.12 | 1.15 | 1.11 | N/A | ||||||||||
Net investment income (loss) | 0.40 | (a) | 0.22 | 0.08 | (0.15 | ) | 0.15 | (0.21 | ) | ||||||||
Portfolio turnover | 17 | 63 | 80 | 146 | 144 | 253 | |||||||||||
Net assets at end of period (000 Omitted) | $255,857 | $297,186 | $300,026 | $301,252 | $260,794 | $206,458 | |||||||||||
| (a) | Annualized. |
| (b) | The fund’s net asset value and total return calculation include a non-recurring accrual recorded as a result of an administrative proceeding regarding disclosure of brokerage allocation practices in connection with fund sales. The non-recurring accrual did not have a material impact on the net asset value per share based on the shares outstanding on the day the proceeds were recorded. |
| (d) | Per share data are based on average shares outstanding. |
| (f) | Ratios do not reflect reductions from fees paid indirectly, if applicable. |
| (k) | The total return does not reflect expenses that apply to separate accounts. Inclusion of these charges would reduce the total return figures for all periods shown. |
| (n) | Not annualized. |
| (r) | Certain expenses have been reduced without which performance would have been lower. |
| (s) | From time to time the fund may receive proceeds from litigation settlements, without which performance would be lower. |
| (w) | Per share amount was less than $0.01. |
See Notes to Financial Statements
10
Table of Contents
NOTES TO FINANCIAL STATEMENTS (unaudited)
| (1) | Business and Organization |
MFS Investors Growth Stock Series (the fund) is a series of MFS Variable Insurance Trust (the trust). The trust is organized as a Massachusetts business trust and is registered under the Investment Company Act of 1940, as amended, as an open-end management investment company. The shareholders of each series of the trust are separate accounts of insurance companies, which offer variable annuity and/or life insurance products, and qualified retirement and pension plans.
| (2) | Significant Accounting Policies |
General – The preparation of financial statements in conformity with U.S. generally accepted accounting principles requires management to make estimates and assumptions that affect the reported amounts of assets and liabilities, and disclosure of contingent assets and liabilities at the date of the financial statements and the reported amounts of revenues and expenses during the reporting period. Actual results could differ from those estimates. The fund can invest in foreign securities, including securities of emerging market issuers. Investments in foreign securities are vulnerable to the effects of changes in the relative values of the local currency and the U.S. dollar and to the effects of changes in each country’s legal, political, and economic environment. The markets of emerging markets countries are generally more volatile than the markets of developed countries with more mature economies. All of the risks of investing in foreign securities previously described are heightened when investing in emerging markets countries.
In March 2008, FASB Statement No. 161, Disclosures about Derivative Instruments and Hedging Activities (the “Standard”) was issued, and is effective for financial statements issued for fiscal years and interim periods beginning after November 15, 2008. This Standard provides enhanced disclosures about the fund’s use of and accounting for derivative instruments and the effect of derivative instruments on the fund’s results of operations and financial position. Management is evaluating the application of the Standard to the fund, and has not at this time determined the impact, if any, resulting from the adoption of this Standard on the fund’s financial statements.
Investment Valuations – Equity securities, including restricted equity securities, are generally valued at the last sale or official closing price as reported by an independent pricing service on the market or exchange on which they are primarily traded. For securities for which there were no sales reported that day, equity securities are generally valued at the last quoted daily bid quotation as reported by an independent pricing service on the market or exchange on which they are primarily traded. For securities held short for which there were no sales reported for the day, the position is generally valued at the last quoted daily ask quotation as reported by an independent pricing service on the market or exchange on which such securities are primarily traded. Short-term instruments with a maturity at issuance of 60 days or less may be valued at amortized cost, which approximates market value. Open-end investment companies are generally valued at net asset value per share. Securities and other assets generally valued on the basis of information from an independent pricing service may also be valued at a broker-dealer bid quotation. The values of foreign securities and other assets and liabilities expressed in foreign currencies are converted to U.S. dollars using the mean of bid and asked prices for rates reported by an independent pricing service.
The Board of Trustees has delegated primary responsibility for determining or causing to be determined the value of the fund’s investments (including any fair valuation) to the adviser pursuant to valuation policies and procedures approved by the Board. If the adviser determines that reliable market quotations are not readily available, investments are valued at fair value as determined in good faith by the adviser in accordance with such procedures under the oversight of the Board of Trustees. Under the fund’s valuation policies and procedures, market quotations are not considered to be readily available for most types of debt instruments and floating rate loans and many types of derivatives. These investments are generally valued at fair value based on information from independent pricing services. In addition, investments may be valued at fair value if the adviser determines that an investment’s value has been materially affected by events occurring after the close of the exchange or market on which the investment is principally traded (such as foreign exchange or market) and prior to the determination of the fund’s net asset value, or after the halting of trading of a specific security where trading does not resume prior to the close of the exchange or market on which the security is principally traded. Events that occur on a frequent basis after foreign markets close (such as developments in foreign markets and significant movements in the U.S. markets) and prior to the determination of the fund’s net asset value may be deemed to have a material affect on the value of securities traded in foreign markets. Accordingly, the fund’s foreign equity securities may often be valued at fair value. The adviser may rely on independent pricing services or other information (such as the correlation with price movements of similar securities in the same or other markets; the type, cost and investment characteristics of the security; the business and financial condition of the issuer; and trading and other market data) to assist in determining whether to fair value and at what value to fair value an investment. The value of an investment for purposes of calculating the fund’s net asset value can differ depending on the source and method used to determine value. When fair valuation is used, the value of investments used to determine the fund’s net asset value may differ from quoted or published prices for the same investments.
11
Table of Contents
Notes to Financial Statements (unaudited) – continued
The fund adopted FASB Statement No. 157, Fair Value Measurements (the “Statement”) in this reporting period. This Statement provides a single definition of fair value, a hierarchy for measuring fair value and expanded disclosures about fair value measurements.
Various inputs are used in determining the value of the fund’s assets or liabilities carried at market value. These inputs are categorized into three broad levels. Level 1 includes quoted prices in active markets for identical assets or liabilities. Level 2 includes other significant observable market-based inputs (including quoted prices for similar securities, interest rates, prepayment speed, and credit risk). Level 3 includes unobservable inputs, which may include the adviser’s own assumptions in determining the fair value of investments. Other financial instruments are derivative instruments not reflected in total investments, such as futures, forwards, swap contracts and written options, which are valued at the unrealized appreciation/depreciation on the instrument. The following is a summary of the levels used as of June 30, 2008 in valuing the fund’s assets or liabilities carried at market value:
| Level 1 | Level 2 | Level 3 | Total | |||||
| Investments in Securities | $340,004,880 | $57,680,043 | $— | $397,684,923 | ||||
| Other Financial Instruments | $— | $— | $— | $— |
Repurchase Agreements – The fund may enter into repurchase agreements with institutions that the fund’s investment adviser has determined are creditworthy. Each repurchase agreement is recorded at cost. The fund requires that the securities collateral in a repurchase transaction be transferred to a custodian in a manner sufficient to enable the fund to obtain those securities in the event of a default under the repurchase agreement. The fund monitors, on a daily basis, the value of the collateral to ensure that its value, including accrued interest, is greater than amounts owed to the fund under each such repurchase agreement. The fund and other funds managed by Massachusetts Financial Services Company (MFS), may utilize a joint trading account for the purpose of entering into one or more repurchase agreements.
Foreign Currency Translation – Purchases and sales of foreign investments, income, and expenses are converted into U.S. dollars based upon currency exchange rates prevailing on the respective dates of such transactions. Gains and losses attributable to foreign currency exchange rates on sales of securities are recorded for financial statement purposes as net realized gains and losses on investments. Gains and losses attributable to foreign exchange rate movements on income and expenses are recorded for financial statement purposes as foreign currency transaction gains and losses. That portion of both realized and unrealized gains and losses on investments that results from fluctuations in foreign currency exchange rates is not separately disclosed.
Security Loans – State Street Bank and Trust Company (“State Street”), as lending agent, may loan the securities of the fund to certain qualified institutions (the “Borrowers”) approved by the fund. The loans are collateralized at all times by cash and/or U.S. Treasury and federal agency obligations in an amount at least equal to the market value of the securities loaned. State Street provides the fund with indemnification against Borrower default. The fund bears the risk of loss with respect to the investment of cash collateral. On loans collateralized by cash, the cash collateral is invested in a money market fund or short-term securities. A portion of the income generated upon investment of the collateral is remitted to the Borrowers, and the remainder is allocated between the fund and the lending agent. On loans collateralized by U.S. Treasury and/or federal agency obligations, a fee is received from the Borrower, and is allocated between the fund and the lending agent. Net income from securities lending is included in interest income on the Statement of Operations. The dividend and interest income earned on the securities loaned is accounted for in the same manner as other dividend and interest income.
At June 30, 2008, the value of securities loaned was $22,513,578. These loans were collateralized by cash of $22,547,002 and U.S. Treasury obligations of $512,604.
Indemnifications – Under the fund’s organizational documents, its officers and trustees may be indemnified against certain liabilities and expenses arising out of the performance of their duties to the fund. Additionally, in the normal course of business, the fund enters into agreements with service providers that may contain indemnification clauses. The fund’s maximum exposure under these agreements is unknown as this would involve future claims that may be made against the fund that have not yet occurred.
Investment Transactions and Income – Investment transactions are recorded on the trade date. Interest income is recorded on the accrual basis. All premium and discount is amortized or accreted for financial statement purposes in accordance with U.S. generally accepted accounting principles. Dividends received in cash are recorded on the ex-dividend date. Certain dividends from foreign securities will be recorded when the fund is informed of the dividend if such information is obtained subsequent to the ex-dividend date. Dividend and interest payments received in additional securities are recorded on the ex-dividend or ex-interest date in an amount equal to the value of the security on such date. The fund may receive proceeds from litigation settlements. Any proceeds received from litigation involving portfolio holdings are reflected in the Statement of Operations in realized gain/loss if the security has been disposed of by the fund or in unrealized gain/loss if the security is still held by the fund. Any other proceeds from litigation not related to portfolio holdings are reflected as other income in the Statement of Operations.
12
Table of Contents
Notes to Financial Statements (unaudited) – continued
Fees Paid Indirectly – The fund’s custody fee may be reduced according to an arrangement that measures the value of cash deposited with the custodian by the fund. For the six months ended June 30, 2008, custody fees were not reduced.
Tax Matters and Distributions – The fund intends to qualify as a regulated investment company, as defined under Subchapter M of the Internal Revenue Code, and to distribute all of its taxable income, including realized capital gains. As a result, no provision for federal income tax is required. The fund adopted the provisions of FASB Interpretation No. 48, Accounting for Uncertainty in Income Taxes (“the Interpretation”). The Interpretation prescribes a minimum threshold for financial statement recognition of the benefit of a tax position taken or expected to be taken in a tax return. There was no impact resulting from the adoption of this Interpretation on the fund’s financial statements. Each of the fund’s federal tax returns for the prior three fiscal years remains subject to examination by the Internal Revenue Service. It is the fund’s policy to record interest and penalty charges on underpaid taxes associated with its tax positions as interest expense and miscellaneous expense, respectively. No such charges were recorded in the current financial statements. Foreign taxes, if any, have been accrued by the fund in the accompanying financial statements.
Distributions to shareholders are recorded on the ex-dividend date. Income and capital gain distributions are determined in accordance with income tax regulations, which may differ from U.S. generally accepted accounting principles. Certain capital accounts in the financial statements are periodically adjusted for permanent differences in order to reflect their tax character. These adjustments have no impact on net assets or net asset value per share. Temporary differences which arise from recognizing certain items of income, expense, gain or loss in different periods for financial statement and tax purposes will reverse at some time in the future. Distributions in excess of net investment income or net realized gains are temporary overdistributions for financial statement purposes resulting from differences in the recognition or classification of income or distributions for financial statement and tax purposes.
Book/tax differences primarily relate to wash sale loss deferrals.
The tax character of distributions made during the current period will be determined at fiscal year end. The tax character of distributions declared to shareholders is as follows:
| 12/31/07 | ||
| Ordinary income (including any short-term capital gains) | $775,097 |
The federal tax cost and the tax basis components of distributable earnings were as follows:
| As of 6/30/08 | |||
| Cost of investments | $406,820,145 | ||
| Gross appreciation | 22,040,476 | ||
| Gross depreciation | (31,175,698 | ) | |
| Net unrealized appreciation (depreciation) | $(9,135,222 | ) | |
| As of 12/31/07 | |||
| Undistributed ordinary income | $1,384,142 | ||
| Undistributed long-term capital gain | 17,353,868 | ||
| Other temporary differences | 498 | ||
| Net unrealized appreciation (depreciation) | 32,258,773 | ||
The aggregate cost above includes prior fiscal year end tax adjustments.
Multiple Classes of Shares of Beneficial Interest – The fund offers multiple classes of shares, which differ in their respective distribution fees. The fund’s income, realized and unrealized gain (loss), and common expenses are allocated to shareholders based on the daily net assets of each class, without distinction between share classes. Dividends are declared separately for each class. Differences in per share dividend rates are generally due to differences in separate class expenses.
| (3) | Transactions with Affiliates |
Investment Adviser – The fund has an investment advisory agreement with MFS to provide overall investment management and related administrative services and facilities to the fund. The management fee is computed daily and paid monthly at an annual rate of 0.75% of the fund’s average daily net assets.
The investment adviser has agreed in writing to reduce its management fee to 0.65% of average daily net assets in excess of $1.0 billion. This written agreement may be rescinded only upon consent of the fund’s Board of Trustees. For the six months ended June 30, 2008, the fund’s average daily net assets did not exceed $1.0 billion and therefore, the management fee was not reduced.
The management fee incurred for the six months ended June 30, 2008 was equivalent to an annual effective rate of 0.75% of the fund’s average daily net assets.
13
Table of Contents
Notes to Financial Statements (unaudited) – continued
Distributor – MFS Fund Distributors, Inc. (MFD), a wholly-owned subsidiary of MFS, is the distributor of shares of the fund. The Trustees have adopted a distribution plan for the Service Class shares pursuant to Rule 12b-1 under the Investment Company Act of 1940.
The fund’s distribution plan provides that the fund will pay MFD distribution fees equal to 0.25% per annum of its average daily net assets attributable to Service Class shares as partial consideration for services performed and expenses incurred by MFD and financial intermediaries (including participating insurance companies that invest in the fund to fund variable annuity and variable life insurance contracts, sponsors of qualified retirement and pension plans that invest in the fund, and affiliates of these participating insurance companies and plan sponsors) in connection with the sale and distribution of the Service Class shares. MFD may subsequently pay all, or a portion, of the distribution fees to financial intermediaries.
Shareholder Servicing Agent – MFS Service Center, Inc. (MFSC), a wholly-owned subsidiary of MFS, receives a fee from the fund for its services as shareholder servicing agent. For the six months ended June 30, 2008, the fee was $36,211, which equated to 0.0182% annually of the fund’s average daily net assets. MFSC also receives payment from the fund for out-of-pocket expenses paid by MFSC on behalf of the fund. For the six months ended June 30, 2008, these costs amounted to $3.
Administrator – MFS provides certain financial, legal, shareholder communications, compliance, and other administrative services to the fund. Under an administrative services agreement, the fund partially reimburses MFS the costs incurred to provide these services. The fund is charged a fixed amount plus a fee based on average daily net assets. The fund’s annual fixed amount is $17,500.
The administrative services fee incurred for the six months ended June 30, 2008 was equivalent to an annual effective rate of 0.0150% of the fund’s average daily net assets.
Trustees’ and Officers’ Compensation – The fund pays compensation to independent trustees in the form of a retainer, attendance fees, and additional compensation to Board and Committee chairpersons. The fund does not pay compensation directly to trustees or officers of the fund who are also officers of the investment adviser, all of whom receive remuneration for their services to the fund from MFS. Certain officers and trustees of the fund are officers or directors of MFS, MFD, and MFSC.
Other – This fund and certain other MFS funds (the funds) have entered into a services agreement (the Agreement) which provides for payment of fees by the funds to Tarantino LLC in return for the provision of services of an Independent Chief Compliance Officer (ICCO) for the funds. The ICCO is an officer of the funds and the sole member of Tarantino LLC. The funds can terminate the Agreement with Tarantino LLC at any time under the terms of the Agreement. For the six months ended June 30, 2008, the fee paid by the fund to Tarantino LLC was $1,181 and is included in miscellaneous expense on the Statement of Operations. MFS has agreed to reimburse the fund for a portion of the payments made by the fund to Tarantino LLC in the amount of $1,169, which is shown as a reduction of total expenses in the Statement of Operations. Additionally, MFS has agreed to bear all expenses associated with office space, other administrative support, and supplies provided to the ICCO.
| (4) | Portfolio Securities |
Purchases and sales of investments, other than U.S. Government securities, purchased option transactions, and short-term obligations, aggregated $68,913,951 and $94,254,359, respectively.
| (5) | Shares of Beneficial Interest |
The fund’s Declaration of Trust permits the Trustees to issue an unlimited number of full and fractional shares of beneficial interest. Transactions in fund shares were as follows:
| Six months ended 6/30/08 | Year ended 12/31/07 | |||||||||||
| Shares | Amount | Shares | Amount | |||||||||
| Shares sold | ||||||||||||
Initial Class | 122,185 | $1,325,934 | 428,076 | $4,835,768 | ||||||||
Service Class | 1,769,087 | 18,876,875 | 2,208,069 | 24,826,216 | ||||||||
| 1,891,272 | $20,202,809 | 2,636,145 | $29,661,984 | |||||||||
| Shares issued to shareholders in reinvestment of distributions | ||||||||||||
Initial Class | 590,644 | $6,195,857 | 48,158 | $523,958 | ||||||||
Service Class | 1,221,340 | 12,543,158 | 23,537 | 251,139 | ||||||||
| 1,811,984 | $18,739,015 | 71,695 | $775,097 | |||||||||
| Shares reacquired | ||||||||||||
Initial Class | (1,563,282 | ) | $(16,960,238 | ) | (3,073,141 | ) | $(34,709,192 | ) | ||||
Service Class | (3,011,242 | ) | (32,030,974 | ) | (5,328,671 | ) | (58,905,654 | ) | ||||
| (4,574,524 | ) | $(48,991,212 | ) | (8,401,812 | ) | $(93,614,846 | ) | |||||
| Net change | ||||||||||||
Initial Class | (850,453 | ) | $(9,438,447 | ) | (2,596,907 | ) | $(29,349,466 | ) | ||||
Service Class | (20,815 | ) | (610,941 | ) | (3,097,065 | ) | (33,828,299 | ) | ||||
| (871,268 | ) | $(10,049,388 | ) | (5,693,972 | ) | $(63,177,765 | ) | |||||
14
Table of Contents
Notes to Financial Statements (unaudited) – continued
| (6) | Line of Credit |
The fund and other funds managed by MFS participate in a $1 billion unsecured committed line of credit provided by a syndication of banks under a credit agreement. In addition, the fund and other funds managed by MFS have established uncommitted borrowing arrangements with certain banks. Borrowings may be made for temporary financing needs. Interest is charged to each fund, based on its borrowings, generally at a rate equal to the Federal Reserve funds rate plus 0.30%. In addition, a commitment fee, based on the average daily, unused portion of the committed line of credit, is allocated among the participating funds at the end of each calendar quarter. For the six months ended June 30, 2008, the fund’s commitment fee and interest expense were $946 and $0, respectively, and are included in miscellaneous expense on the Statement of Operations.
��
15
Table of Contents
BOARD REVIEW OF INVESTMENT ADVISORY AGREEMENT
A discussion regarding the Board’s most recent review and renewal of the fund’s Investment Advisory Agreement with MFS will be available on or about November 1, 2008 by clicking on the fund’s name under “Variable Insurance Portfolio - VIT” in the “Products and Performance” section of the MFS Web site (mfs.com).
PROXY VOTING POLICIES AND INFORMATION
A general description of the MFS funds’ proxy voting policies and procedures is available without charge, upon request, by calling
1-800-225-2606, by visiting the Proxy Voting section of mfs.com or by visiting the SEC’s Web site at http://www.sec.gov.
Information regarding how the fund voted proxies relating to portfolio securities during the most recent twelve-month period ended June 30 is available without charge by visiting the Proxy Voting section of mfs.com or by visiting the SEC’s Web site at http://www.sec.gov.
QUARTERLY PORTFOLIO DISCLOSURE
The fund will file a complete schedule of portfolio holdings with the Securities and Exchange Commission (the Commission) for the first and third quarters of each fiscal year on Form N-Q. The fund’s Form N-Q may be reviewed and copied at the:
Public Reference Room
Securities and Exchange Commission
100 F Street, NE, Room 1580
Washington, D.C. 20549
Information on the operation of the Public Reference Room may be obtained by calling the Commission at 1-800-SEC-0330. The fund’s Form N-Q is available on the EDGAR database on the Commission’s Internet Web site at http://www.sec.gov, and copies of this information may be obtained, upon payment of a duplicating fee, by electronic request at the following e-mail address: publicinfo@sec.gov or by writing the Public Reference Section at the above address.
16
Table of Contents
CONTACT US
Web site
mfs.com
Account service and literature
Shareholders
1-877-411-3325
9 a.m. to 5 p.m. Eastern Time
Investment professionals
1-800-637-8730
8 a.m. to 5 p.m. Eastern Time
Mailing address
MFS Service Center, Inc.
Attn: Institutional Alliance Services (IAS)
P.O. Box 55824
Boston, MA 02205-5824
Overnight mail
MFS Service Center, Inc.
c/o Boston Financial Data Services
30 Dan Road
Canton, MA 02021-2809

Table of Contents

Table of Contents
MFS® INVESTORS TRUST SERIES
This report is prepared for the general information of contract owners. It is authorized for distribution to prospective investors only when preceded or accompanied by a current prospectus.
NOT FDIC INSURED Ÿ MAY LOSE VALUE Ÿ NO BANK OR CREDIT UNION GUARANTEE Ÿ NOT A DEPOSIT Ÿ NOT INSURED BY ANY FEDERAL GOVERNMENT AGENCY OR NCUA/NCUSIF
Table of Contents

Dear Contract Owners:
Negative headlines tend to resonate during difficult markets, and we certainly have had more than our share of tough news recently. As a result consumer, and particularly investor, sentiment are at all-time lows. That said, I do think it is helpful to remember there are always silver linings in the storm clouds if you look hard enough.
Through all of the challenges we have faced, there are some positive underlying trends. In the United States, for example, institutional traders and credit market followers are just now showing increasing signs of confidence and are beginning to take on more risk. At the corporate level, earnings continue to be relatively strong as companies have reduced labor costs, controlled inventories, and relied less on debt to finance expansion. More broadly, low interest rates and strong demand for consumer goods and industrial equipment are good signs for the global economy.
While I do not mean to minimize the risks inherent in today’s markets, periods such as these allow the talented fund managers and research analysts we have at MFS® to test their convictions, reevaluate existing positions, and identify new investment ideas. Our investment process also includes a significant risk management component, with constant attention paid to monitoring market risk, so we can do our best to minimize any surprises to your portfolio.
For investors, this is a great time to check in with your advisor and make sure you have a sound investment plan in place — one that can keep your hard-earned money working over the long term through a strategy that involves asset allocation, diversification, and periodic portfolio rebalancing and reviews. A plan tailored to your distinct needs and goals continues to be the best approach to help you take advantage of the inevitable challenges — and opportunities — that present themselves over time.
Respectfully,

Robert J. Manning
Chief Executive Officer and Chief Investment Officer
MFS Investment Management®
August 15, 2008
The opinions expressed in this letter are subject to change, may not be relied upon for investment advice, and no forecasts can be guaranteed.
1
Table of Contents
Portfolio structure

| Top ten holdings | ||
| TOTAL S.A., ADR | 3.1% | |
| Exxon Mobil Corp. | 2.9% | |
| Lockheed Martin Corp. | 2.7% | |
| Hess Corp. | 2.6% | |
| International Business Machines Corp. | 2.5% | |
| Roche Holding AG | 2.1% | |
| Intel Corp. | 2.1% | |
| Johnson & Johnson | 2.0% | |
| Nestle S.A. | 2.0% | |
| Procter & Gamble Co. | 1.9% |
| Equity sectors | ||
| Energy | 14.5% | |
| Health Care | 14.2% | |
| Financial Services | 14.0% | |
| Consumer Staples | 13.2% | |
| Technology | 11.9% | |
| Utilities & Communications | 7.3% | |
| Industrial Goods & Services | 7.0% | |
| Leisure | 4.4% | |
| Basic Materials | 4.4% | |
| Retailing | 4.2% | |
| Special Products & Services | 2.2% | |
| Transportation | 0.6% | |
| Autos & Housing | 0.6% |
Percentages are based on net assets as of 6/30/08.
The portfolio is actively managed and current holdings may be different.
2
Table of Contents
Fund Expenses Borne by the Contract Holders During the Period, January 1, 2008 through June 30, 2008
As a contract holder of the fund, you incur ongoing costs, including management fees; distribution (12b-1) fees; and other fund expenses. This example is intended to help you understand your ongoing costs (in dollars) of investing in the fund and to compare these costs with the ongoing costs of investing in other mutual funds.
The example is based on an investment of $1,000 invested at the beginning of the period and held for the entire period January 1, 2008 through June 30, 2008.
Actual Expenses
The first line for each share class in the following table provides information about actual account values and actual expenses. You may use the information in this line, together with the amount you invested, to estimate the expenses that you paid over the period. Simply divide your account value by $1,000 (for example, an $8,600 account value divided by $1,000 = 8.6), then multiply the result by the number in the first line under the heading entitled “Expenses Paid During Period” to estimate the expenses you paid on your account during this period.
Hypothetical Example for Comparison Purposes
The second line for each share class in the following table provides information about hypothetical account values and hypothetical expenses based on the fund’s actual expense ratio and an assumed rate of return of 5% per year before expenses, which is not the fund’s actual return. The hypothetical account values and expenses may not be used to estimate the actual ending account balance or expenses you paid for the period. You may use this information to compare the ongoing costs of investing in the fund and other funds. To do so, compare this 5% hypothetical example with the 5% hypothetical examples that appear in the shareholder reports of the other funds.
Please note that the expenses shown in the table are meant to highlight the fund’s ongoing costs only and do not take into account the fees and expenses imposed under the variable contracts through which your investment in the fund is made. Therefore, the second line for each share class in the table is useful in comparing ongoing costs associated with an investment in vehicles (such as the fund) which fund benefits under variable annuity and variable life insurance contracts and to qualified pension and retirement plans only, and will not help you determine the relative total costs of investing in the fund through variable annuity and variable life insurance contracts. If the fees and expenses imposed under the variable contracts were included, your costs would have been higher.
| Share Class | Annualized Expense Ratio | Beginning Account Value 1/01/08 | Ending Account Value 6/30/08 | Expenses Paid During Period (p) 1/01/08-6/30/08 | ||||||
| Initial Class | Actual | 0.82% | $1,000.00 | $915.13 | $3.90 | |||||
| Hypothetical (h) | 0.82% | $1,000.00 | $1,020.79 | $4.12 | ||||||
| Service Class | Actual | 1.07% | $1,000.00 | $913.66 | $5.09 | |||||
| Hypothetical (h) | 1.07% | $1,000.00 | $1,019.54 | $5.37 |
| (h) | 5% class return per year before expenses. |
| (p) | Expenses paid is equal to each class’ annualized expense ratio, as shown above, multiplied by the average account value over the period, multiplied by the number of days in the period, divided by the number of days in the year. |
3
Table of Contents
PORTFOLIO OF INVESTMENTS – 6/30/08 (unaudited)
The Portfolio of Investments is a complete list of all securities owned by your fund. It is categorized by broad-based asset classes.
| Issuer | Shares/Par | Value ($) | |||
| COMMON STOCKS – 98.5% | |||||
| Aerospace – 4.4% | |||||
| Lockheed Martin Corp. | 236,370 | $ | 23,320,260 | ||
| United Technologies Corp. | 246,030 | 15,180,051 | |||
| $ | 38,500,311 | ||||
| Alcoholic Beverages – 1.6% | |||||
| Diageo PLC | 786,700 | $ | 14,460,446 | ||
| Apparel Manufacturers – 1.2% | |||||
| NIKE, Inc., “B” | 179,900 | $ | 10,723,839 | ||
| Automotive – 0.6% | |||||
| Bayerische Motoren Werke AG | 103,880 | $ | 4,987,062 | ||
| Biotechnology – 3.5% | |||||
| Amgen, Inc. (a) | 173,950 | $ | 8,203,482 | ||
| Genzyme Corp. (a) | 212,940 | 15,335,939 | |||
| Gilead Sciences, Inc. (a) | 131,430 | 6,959,219 | |||
| $ | 30,498,640 | ||||
| Broadcasting – 2.8% | |||||
| News Corp., “A” | 298,970 | $ | 4,496,509 | ||
| Viacom, Inc., “B” (a) | 205,205 | 6,266,961 | |||
| Walt Disney Co. | 440,600 | 13,746,720 | |||
| $ | 24,510,190 | ||||
| Brokerage & Asset Managers – 2.6% | |||||
| Charles Schwab Corp. | 408,710 | $ | 8,394,903 | ||
| Franklin Resources, Inc. | 38,030 | 3,485,450 | |||
| Goldman Sachs Group, Inc. | 52,990 | 9,267,951 | |||
| Lehman Brothers Holdings, Inc. | 69,690 | 1,380,559 | |||
| $ | 22,528,863 | ||||
| Business Services – 2.2% | |||||
| Amdocs Ltd. (a) | 394,570 | $ | 11,608,249 | ||
| Visa, Inc., “A” | 99,270 | 8,071,644 | |||
| $ | 19,679,893 | ||||
| Chemicals – 2.0% | |||||
| 3M Co. | 150,210 | $ | 10,453,114 | ||
| PPG Industries, Inc. | 121,670 | 6,980,208 | |||
| $ | 17,433,322 | ||||
| Computer Software – 1.8% | |||||
| Oracle Corp. (a) | 766,350 | $ | 16,093,350 | ||
| Computer Software – Systems – 4.1% | |||||
| EMC Corp. (a) | 961,230 | $ | 14,120,469 | ||
| International Business Machines Corp. | 186,370 | 22,090,436 | |||
| $ | 36,210,905 | ||||
| Consumer Goods & Services – 5.0% | |||||
| Colgate-Palmolive Co. | 127,540 | $ | 8,813,014 | ||
| International Flavors & Fragrances, Inc. | 155,520 | 6,074,611 | |||
| Procter & Gamble Co. | 278,340 | 16,925,855 | |||
| Reckitt Benckiser Group PLC | 243,490 | 12,338,869 | |||
| $ | 44,152,349 | ||||
| Issuer | Shares/Par | Value ($) | |||
| COMMON STOCKS – continued | |||||
| Electrical Equipment – 1.8% | |||||
| Danaher Corp. (l) | 135,270 | $ | 10,456,371 | ||
| Rockwell Automation, Inc. | 125,350 | 5,481,556 | |||
| $ | 15,937,927 | ||||
| Electronics – 4.3% | |||||
| Intel Corp. | 846,560 | $ | 18,184,109 | ||
| National Semiconductor Corp. | 318,460 | 6,541,168 | |||
| Samsung Electronics Co. Ltd., GDR | 38,382 | 11,254,447 | |||
| SanDisk Corp. (a) | 81,180 | 1,518,066 | |||
| $ | 37,497,790 | ||||
| Energy – Independent – 0.7% | |||||
| EOG Resources, Inc. | 47,050 | $ | 6,172,960 | ||
| Energy – Integrated – 9.8% | |||||
| Exxon Mobil Corp. | 291,160 | $ | 25,659,931 | ||
| Hess Corp. | 184,310 | 23,258,079 | |||
| Marathon Oil Corp. | 189,310 | 9,819,510 | |||
| TOTAL S.A., ADR | 323,730 | 27,604,457 | |||
| $ | 86,341,977 | ||||
| Food & Beverages – 4.9% | |||||
| General Mills, Inc. | 168,090 | $ | 10,214,829 | ||
| Nestle S.A. | 384,850 | 17,417,203 | |||
| PepsiCo, Inc. | 241,461 | 15,354,505 | |||
| $ | 42,986,537 | ||||
| Gaming & Lodging – 1.6% | |||||
| Carnival Corp. (l) | 225,120 | $ | 7,419,955 | ||
| International Game Technology | 112,240 | 2,803,755 | |||
| Ladbrokes PLC | 806,402 | 4,098,780 | |||
| $ | 14,322,490 | ||||
| General Merchandise – 1.1% | |||||
| Kohl’s Corp. (a) | 118,000 | $ | 4,724,720 | ||
| Macy’s, Inc. | 273,700 | 5,315,254 | |||
| $ | 10,039,974 | ||||
| Insurance – 3.1% | |||||
| Genworth Financial, Inc., “A” | 340,940 | $ | 6,072,141 | ||
| MetLife, Inc. | 253,660 | 13,385,638 | |||
| Travelers Cos., Inc. | 180,810 | 7,847,154 | |||
| $ | 27,304,933 | ||||
| Machinery & Tools – 0.8% | |||||
| Eaton Corp. | 80,760 | $ | 6,862,177 | ||
| Major Banks – 6.6% | |||||
| Bank of America Corp. | 378,880 | $ | 9,043,866 | ||
| Bank of New York Mellon Corp. | 343,263 | 12,985,639 | |||
| JPMorgan Chase & Co. | 454,710 | 15,601,100 | |||
| State Street Corp. | 235,030 | 15,039,570 | |||
| Wells Fargo & Co. | 207,140 | 4,919,575 | |||
| $ | 57,589,750 | ||||
4
Table of Contents
Portfolio of Investments (unaudited) – continued
| Issuer | Shares/Par | Value ($) | |||
| COMMON STOCKS – continued | |||||
| Medical Equipment – 3.6% | |||||
| Boston Scientific Corp. (a) | 298,680 | $ | 3,670,777 | ||
| Medtronic, Inc. | 317,050 | 16,407,338 | |||
| Zimmer Holdings, Inc. (a) | 166,280 | 11,315,354 | |||
| $ | 31,393,469 | ||||
| Natural Gas – Distribution – 1.0% | |||||
| Questar Corp. | 118,090 | $ | 8,389,114 | ||
| Network & Telecom – 1.7% | |||||
| Cisco Systems, Inc. (a) | 454,462 | $ | 10,570,786 | ||
| Nokia Corp., ADR | 189,310 | 4,638,095 | |||
| $ | 15,208,881 | ||||
| Oil Services – 4.0% | |||||
| Halliburton Co. | 197,790 | $ | 10,496,715 | ||
| National Oilwell Varco, Inc. (a) | 124,660 | 11,059,835 | |||
| Noble Corp. | 204,030 | 13,253,789 | |||
| $ | 34,810,339 | ||||
| Other Banks & Diversified Financials – 1.7% | |||||
| American Express Co. | 192,690 | $ | 7,258,632 | ||
| New York Community Bancorp, Inc. (l) | 71,490 | 1,275,382 | |||
| Sovereign Bancorp, Inc. | 929,660 | 6,842,298 | |||
| $ | 15,376,312 | ||||
| Pharmaceuticals – 7.1% | |||||
| Abbott Laboratories | 310,850 | $ | 16,465,725 | ||
| Johnson & Johnson | 276,306 | 17,777,528 | |||
| Merck & Co., Inc. | 238,740 | 8,998,111 | |||
| Roche Holding AG | 104,240 | 18,734,256 | |||
| $ | 61,975,620 | ||||
| Specialty Chemicals – 2.4% | |||||
| Linde AG | 74,340 | $ | 10,426,244 | ||
| Praxair, Inc. | 108,770 | 10,250,485 | |||
| $ | 20,676,729 | ||||
| Specialty Stores – 1.9% | |||||
| Nordstrom, Inc. (l) | 184,550 | $ | 5,591,865 | ||
| Staples, Inc. | 465,975 | 11,066,906 | |||
| $ | 16,658,771 | ||||
| Telecommunications – Wireless – 1.3% | |||||
| America Movil S.A.B. de C.V., “L”, ADR | 55,420 | $ | 2,923,405 | ||
| Rogers Communications, Inc., “B” | 217,520 | 8,455,846 | |||
| $ | 11,379,251 | ||||
| Issuer | Shares/Par | Value ($) | |||||
| COMMON STOCKS – continued | |||||||
| Telephone Services – 1.9% | |||||||
| AT&T, Inc. | 493,780 | $ | 16,635,448 | ||||
| Tobacco – 1.7% | |||||||
| Altria Group, Inc. | 217,630 | $ | 4,474,473 | ||||
| Philip Morris International, Inc. | 217,630 | 10,748,746 | |||||
| $ | 15,223,219 | ||||||
| Trucking – 0.6% | |||||||
| FedEx Corp. (l) | 67,020 | $ | 5,280,506 | ||||
| Utilities – Electric Power – 3.1% | |||||||
| Entergy Corp. | 50,560 | $ | 6,091,469 | ||||
| Exelon Corp. | 154,960 | 13,940,202 | |||||
| FPL Group, Inc. | 108,510 | 7,116,086 | |||||
| $ | 27,147,757 | ||||||
| Total Common Stocks (Identified Cost, $813,831,368) | $ | 864,991,101 | |||||
| SHORT-TERM OBLIGATIONS – 1.5% | |||||||
| Toyota Motor Credit Corp., 2.57%, due 7/01/08, at Amortized Cost and Value (y) | $ | 13,412,000 | $ | 13,412,000 | |||
| COLLATERAL FOR SECURITIES LOANED – 1.9% | |||||||
| Navigator Securities Lending Prime Portfolio, at Cost and Net Asset Value | 16,159,026 | $ | 16,159,026 | ||||
| Total Investments (Identified Cost, $843,402,394) | $ | 894,562,127 | |||||
| OTHER ASSETS, LESS LIABILITIES – (1.9)% | (16,753,623 | ) | |||||
| Net Assets – 100.0% | $ | 877,808,504 | |||||
| (a) | Non-income producing security. |
| (l) | All or a portion of this security is on loan. |
| (y) | The rate shown represents an annualized yield at time of purchase. |
The following abbreviations are used in this report and are defined:
| ADR | American Depository Receipt |
| GDR | Global Depository Receipt |
See Notes to Financial Statements
5
Table of Contents
FINANCIAL STATEMENTS | STATEMENT OF ASSETS AND LIABILITIES (unaudited)
This statement represents your fund’s balance sheet, which details the assets and liabilities comprising the total value of the fund.
At 6/30/08 | |||||
Assets | |||||
Investments, at value, including $15,905,176 of securities on loan (identified cost, $843,402,394) | $894,562,127 | ||||
Cash | 854 | ||||
Receivable for investments sold | 6,269,783 | ||||
Receivable for fund shares sold | 19,144 | ||||
Interest and dividends receivable | 740,901 | ||||
| Other assets | 5,994 | ||||
Total assets | $901,598,803 | ||||
Liabilities | |||||
Payable for investments purchased | $6,341,413 | ||||
Payable for fund shares reacquired | 1,036,209 | ||||
Collateral for securities loaned, at value (c) | 16,159,026 | ||||
Payable to affiliates | |||||
Management fee | 72,387 | ||||
Shareholder servicing costs | 1,524 | ||||
Distribution fees | 1,554 | ||||
Administrative services fee | 1,294 | ||||
Payable for independent trustees’ compensation | 2,690 | ||||
Accrued expenses and other liabilities | 174,202 | ||||
Total liabilities | $23,790,299 | ||||
Net assets | $877,808,504 | ||||
Net assets consist of | |||||
Paid-in capital | $824,257,841 | ||||
Unrealized appreciation (depreciation) on investments and translation of assets and liabilities in foreign currencies | 51,159,710 | ||||
Accumulated distributions in excess of net realized gain on investments and foreign currency transactions | (3,136,025 | ) | |||
Undistributed net investment income | 5,526,978 | ||||
Net assets | $877,808,504 | ||||
Shares of beneficial interest outstanding | 43,861,108 | ||||
Initial Class shares | |||||
Net assets | $821,209,541 | ||||
Shares outstanding | 41,021,855 | ||||
Net asset value per share | $20.02 | ||||
Service Class shares | |||||
Net assets | $56,598,963 | ||||
Shares outstanding | 2,839,253 | ||||
Net asset value per share | $19.93 |
| (c) | Non-cash collateral is not included. |
See Notes to Financial Statements
6
Table of Contents
FINANCIAL STATEMENTS | STATEMENT OF OPERATIONS (unaudited)
This statement describes how much your fund earned in investment income and accrued in expenses. It also describes any gains and/or losses generated by fund operations.
| Six months ended 6/30/08 | ||||||
| Net investment income | ||||||
Income | ||||||
Dividends | $9,399,753 | |||||
Interest | 311,632 | |||||
Foreign taxes withheld | (320,483 | ) | ||||
Total investment income | $9,390,902 | |||||
Expenses | ||||||
Management fee | $3,451,521 | |||||
Distribution fees | 74,881 | |||||
Shareholder servicing costs | 83,607 | |||||
Administrative services fee | 61,451 | |||||
Independent trustees’ compensation | 10,239 | |||||
Custodian fee | 87,588 | |||||
Shareholder communications | 47,042 | |||||
Auditing fees | 22,924 | |||||
Legal fees | 7,450 | |||||
Miscellaneous | 19,487 | |||||
Total expenses | $3,866,190 | |||||
Reduction of expenses by investment adviser | (2,685 | ) | ||||
Net expenses | $3,863,505 | |||||
Net investment income | $5,527,397 | |||||
Realized and unrealized gain (loss) on investments | ||||||
Realized gain (loss) (identified cost basis) | ||||||
Investment transactions | $(106,983 | ) | ||||
Foreign currency transactions | 1,397 | |||||
Net realized gain (loss) on investments and foreign currency transactions | $(105,586 | ) | ||||
Change in unrealized appreciation (depreciation) | ||||||
Investments | $(88,550,915 | ) | ||||
Translation of assets and liabilities in foreign currencies | (12,504 | ) | ||||
Net unrealized gain (loss) on investments and foreign currency translation | $(88,563,419 | ) | ||||
Net realized and unrealized gain (loss) on investments and foreign currency | $(88,669,005 | ) | ||||
Change in net assets from operations | $(83,141,608 | ) |
See Notes to Financial Statements
7
Table of Contents
FINANCIAL STATEMENTS | STATEMENTS OF CHANGES IN NET ASSETS
These statements describe the increases and/or decreases in net assets resulting from operations, any distributions, and any shareholder transactions.
| Six months ended 6/30/08 | | Year ended 12/31/07 | | |||
Change in net assets | (unaudited | ) | ||||
From operations | ||||||
Net investment income | $5,527,397 | $6,851,566 | ||||
Net realized gain (loss) on investments and foreign currency transactions | (105,586 | ) | 57,196,082 | |||
Net unrealized gain (loss) on investments and foreign currency translation | (88,563,419 | ) | 28,642,720 | |||
Change in net assets from operations | $(83,141,608 | ) | $92,690,368 | |||
Distributions declared to shareholders | ||||||
From net investment income | ||||||
Initial Class | $(6,561,488 | ) | $(7,157,401 | ) | ||
Service Class | (283,355 | ) | (464,570 | ) | ||
From net realized gain on investments | ||||||
Initial Class | (54,177,539 | ) | (7,259,502 | ) | ||
Service Class | (3,804,248 | ) | (674,416 | ) | ||
Total distributions declared to shareholders | $(64,826,630 | ) | $(15,555,889 | ) | ||
Change in net assets from fund share transactions | $43,438,010 | $4,644,431 | ||||
Total change in net assets | $(104,530,228 | ) | $81,778,910 | |||
Net assets | ||||||
At beginning of period | 982,338,732 | 900,559,822 | ||||
At end of period (including undistributed net investment income of $5,526,978 and | $877,808,504 | $982,338,732 |
See Notes to Financial Statements
8
Table of Contents
FINANCIAL STATEMENTS | FINANCIAL HIGHLIGHTS
The financial highlights table is intended to help you understand the fund’s financial performance for the semiannual period and the past 5 fiscal years. Certain information reflects financial results for a single fund share. The total returns in the table represent the rate by which an investor would have earned (or lost) on an investment in the fund share class (assuming reinvestment of all distributions) held for the entire period.
| Initial Class | Six months ended 6/30/08 | Years ended 12/31 | ||||||||||||||||
| 2007 | 2006 | 2005 | 2004 | 2003 | ||||||||||||||
| (unaudited) | ||||||||||||||||||
Net asset value, beginning of period | $23.52 | $21.69 | $19.29 | $18.08 | $16.34 | $13.47 | ||||||||||||
Income (loss) from investment operations | ||||||||||||||||||
Net investment income (d) | $0.13 | $0.17 | $0.19 | $0.10 | $0.11 | $0.11 | ||||||||||||
Net realized and unrealized gain (loss) | (2.05 | ) | 2.04 | 2.31 | 1.21 | 1.73 | 2.86 | |||||||||||
Total from investment operations | $(1.92 | ) | $2.21 | $2.50 | $1.31 | $1.84 | $2.97 | |||||||||||
Less distributions declared to shareholders | ||||||||||||||||||
From net investment income | $(0.17 | ) | $(0.19 | ) | $(0.10 | ) | $(0.10 | ) | $(0.10 | ) | $(0.10 | ) | ||||||
From net realized gain on investments | (1.41 | ) | (0.19 | ) | — | — | — | — | ||||||||||
Total distributions declared to shareholders | $(1.58 | ) | $(0.38 | ) | $(0.10 | ) | $(0.10 | ) | $(0.10 | ) | $(0.10 | ) | ||||||
Net asset value, end of period | $20.02 | $23.52 | $21.69 | $19.29 | $18.08 | $16.34 | ||||||||||||
Total return (%) (k)(r)(s) | (8.49 | )(n) | 10.31 | 12.99 | 7.31 | 11.36 | (b) | 22.15 | ||||||||||
| Ratios (%) (to average net assets) and Supplemental data: | ||||||||||||||||||
Expenses before expense reductions (f) | 0.82 | (a) | 0.85 | 0.86 | 0.88 | 0.86 | 0.87 | |||||||||||
Expenses after expense reductions (f) | 0.82 | (a) | 0.85 | 0.86 | 0.88 | 0.86 | N/A | |||||||||||
Net investment income | 1.22 | (a) | 0.74 | 0.93 | 0.55 | 0.68 | 0.78 | |||||||||||
Portfolio turnover | 16 | 37 | 46 | 55 | 89 | 88 | ||||||||||||
Net assets at end of period (000 Omitted) | $821,210 | $917,158 | $820,583 | $722,738 | $631,827 | $481,914 | ||||||||||||
See Notes to Financial Statements
9
Table of Contents
Financial Highlights – continued
| Service Class | Six months ended 6/30/08 | Years ended 12/31 | ||||||||||||||||
| 2007 | 2006 | 2005 | 2004 | 2003 | ||||||||||||||
| (unaudited) | ||||||||||||||||||
Net asset value, beginning of period | $23.39 | $21.57 | $19.19 | $17.99 | $16.26 | $13.41 | ||||||||||||
Income (loss) from investment operations | ||||||||||||||||||
Net investment income (d) | $0.10 | $0.11 | $0.14 | $0.06 | $0.07 | $0.08 | ||||||||||||
Net realized and unrealized gain (loss) | (2.05 | ) | 2.03 | 2.29 | 1.20 | 1.73 | 2.84 | |||||||||||
Total from investment operations | $(1.95 | ) | $2.14 | $2.43 | $1.26 | $1.80 | $2.92 | |||||||||||
Less distributions declared to shareholders | ||||||||||||||||||
From net investment income | $(0.10 | ) | $(0.13 | ) | $(0.05 | ) | $(0.06 | ) | $(0.07 | ) | $(0.07 | ) | ||||||
From net realized gain on investments | (1.41 | ) | (0.19 | ) | — | — | — | — | ||||||||||
Total distributions declared to shareholders | $(1.51 | ) | $(0.32 | ) | $(0.05 | ) | $(0.06 | ) | $(0.07 | ) | $(0.07 | ) | ||||||
Net asset value, end of period | $19.93 | $23.39 | $21.57 | $19.19 | $17.99 | $16.26 | ||||||||||||
Total return (%) (k)(r)(s) | (8.63 | )(n) | 10.03 | 12.69 | 7.02 | 11.12 | (b) | 21.84 | ||||||||||
| Ratios (%) (to average net assets) and Supplemental data: | ||||||||||||||||||
Expenses before expense reductions (f) | 1.08 | (a) | 1.11 | 1.11 | 1.13 | 1.11 | 1.12 | |||||||||||
Expenses after expense reductions (f) | 1.07 | (a) | 1.11 | 1.11 | 1.13 | 1.11 | N/A | |||||||||||
Net investment income | 0.97 | (a) | 0.49 | 0.69 | 0.31 | 0.42 | 0.53 | |||||||||||
Portfolio turnover | 16 | 37 | 46 | 55 | 89 | 88 | ||||||||||||
Net assets at end of period (000 Omitted) | $56,599 | $65,180 | $79,976 | $79,688 | $76,169 | $74,010 | ||||||||||||
| (a) | Annualized. |
| (b) | The fund’s net asset value and total return calculation include a non-recurring accrual recorded as a result of an administrative proceeding regarding disclosure of brokerage allocation practices in connection with fund sales. The non-recurring accrual did not have a material impact on the net asset value per share based on the shares outstanding on the day the proceeds were recorded. |
| (d) | Per share data are based on average shares outstanding. |
| (f) | Ratios do not reflect reductions from fees paid indirectly, if applicable. |
| (k) | The total return does not reflect expenses that apply to separate accounts. Inclusion of these charges would reduce the total return figures for all periods shown. |
| (n) | Not annualized. |
| (r) | Certain expenses have been reduced without which performance would have been lower. |
| (s) | From time to time the fund may receive proceeds from litigation settlements, without which performance would be lower. |
See Notes to Financial Statements
10
Table of Contents
NOTES TO FINANCIAL STATEMENTS (unaudited)
| (1) | Business and Organization |
MFS Investors Trust Series (the fund) is a series of MFS Variable Insurance Trust (the trust). The trust is organized as a Massachusetts business trust and is registered under the Investment Company Act of 1940, as amended, as an open-end management investment company. The shareholders of each series of the trust are separate accounts of insurance companies, which offer variable annuity and/or life insurance products, and qualified retirement and pension plans.
| (2) | Significant Accounting Policies |
General – The preparation of financial statements in conformity with U.S. generally accepted accounting principles requires management to make estimates and assumptions that affect the reported amounts of assets and liabilities, and disclosure of contingent assets and liabilities at the date of the financial statements and the reported amounts of revenues and expenses during the reporting period. Actual results could differ from those estimates. The fund can invest in foreign securities, including securities of emerging market issuers. Investments in foreign securities are vulnerable to the effects of changes in the relative values of the local currency and the U.S. dollar and to the effects of changes in each country’s legal, political, and economic environment. The markets of emerging markets countries are generally more volatile than the markets of developed countries with more mature economies. All of the risks of investing in foreign securities previously described are heightened when investing in emerging markets countries.
In March 2008, FASB Statement No. 161, Disclosures about Derivative Instruments and Hedging Activities (the “Standard”) was issued, and is effective for financial statements issued for fiscal years and interim periods beginning after November 15, 2008. This Standard provides enhanced disclosures about the fund’s use of and accounting for derivative instruments and the effect of derivative instruments on the fund’s results of operations and financial position. Management is evaluating the application of the Standard to the fund, and has not at this time determined the impact, if any, resulting from the adoption of this Standard on the fund’s financial statements.
Investment Valuations – Equity securities, including restricted equity securities, are generally valued at the last sale or official closing price as reported by an independent pricing service on the market or exchange on which they are primarily traded. For securities for which there were no sales reported that day, equity securities are generally valued at the last quoted daily bid quotation as reported by an independent pricing service on the market or exchange on which they are primarily traded. For securities held short for which there were no sales reported for the day, the position is generally valued at the last quoted daily ask quotation as reported by an independent pricing service on the market or exchange on which such securities are primarily traded. Short-term instruments with a maturity at issuance of 60 days or less may be valued at amortized cost, which approximates market value. Open-end investment companies are generally valued at net asset value per share. Securities and other assets generally valued on the basis of information from an independent pricing service may also be valued at a broker-dealer bid quotation. The values of foreign securities and other assets and liabilities expressed in foreign currencies are converted to U.S. dollars using the mean of bid and asked prices for rates reported by an independent pricing service.
The Board of Trustees has delegated primary responsibility for determining or causing to be determined the value of the fund’s investments (including any fair valuation) to the adviser pursuant to valuation policies and procedures approved by the Board. If the adviser determines that reliable market quotations are not readily available, investments are valued at fair value as determined in good faith by the adviser in accordance with such procedures under the oversight of the Board of Trustees. Under the fund’s valuation policies and procedures, market quotations are not considered to be readily available for most types of debt instruments and floating rate loans and many types of derivatives. These investments are generally valued at fair value based on information from independent pricing services. In addition, investments may be valued at fair value if the adviser determines that an investment’s value has been materially affected by events occurring after the close of the exchange or market on which the investment is principally traded (such as foreign exchange or market) and prior to the determination of the fund’s net asset value, or after the halting of trading of a specific security where trading does not resume prior to the close of the exchange or market on which the security is principally traded. Events that occur on a frequent basis after foreign markets close (such as developments in foreign markets and significant movements in the U.S. markets) and prior to the determination of the fund’s net asset value may be deemed to have a material affect on the value of securities traded in foreign markets. Accordingly, the fund’s foreign equity securities may often be valued at fair value. The adviser may rely on independent pricing services or other information (such as the correlation with price movements of similar securities in the same or other markets; the type, cost and investment characteristics of the security; the business and financial condition of the issuer; and trading and other market data) to assist in determining whether to fair value and at what value to fair value an investment. The value of an investment for purposes of calculating the fund’s net asset value can differ depending on the source and method used to determine value. When fair valuation is used, the value of investments used to determine the fund’s net asset value may differ from quoted or published prices for the same investments.
11
Table of Contents
Notes to Financial Statements (unaudited) – continued
The fund adopted FASB Statement No. 157, Fair Value Measurements (the “Statement”) in this reporting period. This Statement provides a single definition of fair value, a hierarchy for measuring fair value and expanded disclosures about fair value measurements.
Various inputs are used in determining the value of the fund’s assets or liabilities carried at market value. These inputs are categorized into three broad levels. Level 1 includes quoted prices in active markets for identical assets or liabilities. Level 2 includes other significant observable market-based inputs (including quoted prices for similar securities, interest rates, prepayment speed, and credit risk). Level 3 includes unobservable inputs, which may include the adviser’s own assumptions in determining the fair value of investments. Other financial instruments are derivative instruments not reflected in total investments, such as futures, forwards, swap contracts and written options, which are valued at the unrealized appreciation/depreciation on the instrument. The following is a summary of the levels used as of June 30, 2008 in valuing the fund’s assets or liabilities carried at market value:
| Level 1 | Level 2 | Level 3 | Total | |||||
| Investments in Securities | $788,690,997 | $105,871,130 | $— | $894,562,127 | ||||
| Other Financial Instruments | $— | $— | $— | $— |
Repurchase Agreements – The fund may enter into repurchase agreements with institutions that the fund’s investment adviser has determined are creditworthy. Each repurchase agreement is recorded at cost. The fund requires that the securities collateral in a repurchase transaction be transferred to a custodian in a manner sufficient to enable the fund to obtain those securities in the event of a default under the repurchase agreement. The fund monitors, on a daily basis, the value of the collateral to ensure that its value, including accrued interest, is greater than amounts owed to the fund under each such repurchase agreement. The fund and other funds managed by Massachusetts Financial Services Company (MFS), may utilize a joint trading account for the purpose of entering into one or more repurchase agreements.
Foreign Currency Translation – Purchases and sales of foreign investments, income, and expenses are converted into U.S. dollars based upon currency exchange rates prevailing on the respective dates of such transactions. Gains and losses attributable to foreign currency exchange rates on sales of securities are recorded for financial statement purposes as net realized gains and losses on investments. Gains and losses attributable to foreign exchange rate movements on income and expenses are recorded for financial statement purposes as foreign currency transaction gains and losses. That portion of both realized and unrealized gains and losses on investments that results from fluctuations in foreign currency exchange rates is not separately disclosed.
Security Loans – State Street Bank and Trust Company (“State Street”), as lending agent, may loan the securities of the fund to certain qualified institutions (the “Borrowers”) approved by the fund. The loans are collateralized at all times by cash and/or U.S. Treasury and federal agency obligations in an amount at least equal to the market value of the securities loaned. State Street provides the fund with indemnification against Borrower default. The fund bears the risk of loss with respect to the investment of cash collateral. On loans collateralized by cash, the cash collateral is invested in a money market fund or short-term securities. A portion of the income generated upon investment of the collateral is remitted to the Borrowers, and the remainder is allocated between the fund and the lending agent. On loans collateralized by U.S. Treasury and/or federal agency obligations, a fee is received from the Borrower, and is allocated between the fund and the lending agent. Net income from securities lending is included in interest income on the Statement of Operations. The dividend and interest income earned on the securities loaned is accounted for in the same manner as other dividend and interest income.
At June 30, 2008, the value of securities loaned was $15,905,176. These loans were collateralized by cash of $16,159,026 and U.S. Treasury obligations of $117,087.
Indemnifications – Under the fund’s organizational documents, its officers and trustees may be indemnified against certain liabilities and expenses arising out of the performance of their duties to the fund. Additionally, in the normal course of business, the fund enters into agreements with service providers that may contain indemnification clauses. The fund’s maximum exposure under these agreements is unknown as this would involve future claims that may be made against the fund that have not yet occurred.
Investment Transactions and Income – Investment transactions are recorded on the trade date. Interest income is recorded on the accrual basis. All premium and discount is amortized or accreted for financial statement purposes in accordance with U.S. generally accepted accounting principles. Dividends received in cash are recorded on the ex-dividend date. Certain dividends from foreign securities will be recorded when the fund is informed of the dividend if such information is obtained subsequent to the ex-dividend date. Dividend and interest payments received in additional securities are recorded on the ex-dividend or ex-interest date in an amount equal to the value of the security on such date. The fund may receive proceeds from litigation settlements. Any proceeds received from litigation involving portfolio holdings are reflected in the Statement of Operations in realized gain/loss if the security has been disposed of by the fund or in unrealized gain/loss if the security is still held by the fund. Any other proceeds from litigation not related to portfolio holdings are reflected as other income in the Statement of Operations.
12
Table of Contents
Notes to Financial Statements (unaudited) – continued
Fees Paid Indirectly – The fund’s custody fee may be reduced according to an arrangement that measures the value of cash deposited with the custodian by the fund. For the six months ended June 30, 2008, custody fees were not reduced.
Tax Matters and Distributions – The fund intends to qualify as a regulated investment company, as defined under Subchapter M of the Internal Revenue Code, and to distribute all of its taxable income, including realized capital gains. As a result, no provision for federal income tax is required. The fund adopted the provisions of FASB Interpretation No. 48, Accounting for Uncertainty in Income Taxes (“the Interpretation”). The Interpretation prescribes a minimum threshold for financial statement recognition of the benefit of a tax position taken or expected to be taken in a tax return. There was no impact resulting from the adoption of this Interpretation on the fund’s financial statements. Each of the fund’s federal tax returns for the prior three fiscal years remains subject to examination by the Internal Revenue Service. It is the fund’s policy to record interest and penalty charges on underpaid taxes associated with its tax positions as interest expense and miscellaneous expense, respectively. No such charges were recorded in the current financial statements. Foreign taxes, if any, have been accrued by the fund in the accompanying financial statements.
Distributions to shareholders are recorded on the ex-dividend date. Income and capital gain distributions are determined in accordance with income tax regulations, which may differ from U.S. generally accepted accounting principles. Certain capital accounts in the financial statements are periodically adjusted for permanent differences in order to reflect their tax character. These adjustments have no impact on net assets or net asset value per share. Temporary differences which arise from recognizing certain items of income, expense, gain or loss in different periods for financial statement and tax purposes will reverse at some time in the future. Distributions in excess of net investment income or net realized gains are temporary overdistributions for financial statement purposes resulting from differences in the recognition or classification of income or distributions for financial statement and tax purposes.
Book/tax differences primarily relate to wash sale loss deferrals.
The tax character of distributions made during the current period will be determined at fiscal year end. The tax character of distributions declared to shareholders is as follows:
| 12/31/07 | ||
| Ordinary income (including any short-term capital gains) | $7,621,971 | |
| Long-term capital gain | 7,933,918 | |
| Total distributions | $15,555,889 |
The federal tax cost and the tax basis components of distributable earnings were as follows:
| As of 6/30/08 | |||
| Cost of investments | $846,431,865 | ||
| Gross appreciation | 119,532,516 | ||
| Gross depreciation | (71,402,254 | ) | |
| Net unrealized appreciation (depreciation) | $48,130,262 | ||
| As of 12/31/07 | |||
| Undistributed ordinary income | 9,435,631 | ||
| Undistributed long-term capital gain | 55,389,612 | ||
| Other temporary differences | 12,481 | ||
| Net unrealized appreciation (depreciation) | 136,681,177 | ||
The aggregate cost above includes prior fiscal year end tax adjustments.
Multiple Classes of Shares of Beneficial Interest – The fund offers multiple classes of shares, which differ in their respective distribution fees. The fund’s income, realized and unrealized gain (loss), and common expenses are allocated to shareholders based on the daily net assets of each class, without distinction between share classes. Dividends are declared separately for each class. Differences in per share dividend rates are generally due to differences in separate class expenses.
| (3) | Transactions with Affiliates |
Investment Adviser – The fund has an investment advisory agreement with MFS to provide overall investment management and related administrative services and facilities to the fund. The management fee is computed daily and paid monthly at an annual rate of 0.75% of the fund’s average daily net assets. The investment adviser has agreed in writing to reduce its management fee to 0.65% of average daily net assets in excess of $1.0 billion. This written agreement may be rescinded only upon consent of the fund’s Board of Trustees. For the six months ended June 30, 2008, the fund’s average daily net assets did not exceed $1.0 billion and therefore, the management fee was not reduced.
13
Table of Contents
Notes to Financial Statements (unaudited) – continued
The management fee incurred for the six months ended June 30, 2008 was equivalent to an annual effective rate of 0.75% of the fund’s average daily net assets.
Distributor – MFS Fund Distributors, Inc. (MFD), a wholly-owned subsidiary of MFS, is the distributor of shares of the fund. The Trustees have adopted a distribution plan for the Service Class shares pursuant to Rule 12b-1 under the Investment Company Act of 1940.
The fund’s distribution plan provides that the fund will pay MFD distribution fees equal to 0.25% per annum of its average daily net assets attributable to Service Class shares as partial consideration for services performed and expenses incurred by MFD and financial intermediaries (including participating insurance companies that invest in the fund to fund variable annuity and variable life insurance contracts, sponsors of qualified retirement and pension plans that invest in the fund, and affiliates of these participating insurance companies and plan sponsors) in connection with the sale and distribution of the Service Class shares. MFD may subsequently pay all, or a portion, of the distribution fees to financial intermediaries.
Shareholder Servicing Agent – MFS Service Center, Inc. (MFSC), a wholly-owned subsidiary of MFS, receives a fee from the fund for its services as shareholder servicing agent. For the six months ended June 30, 2008, the fee was $83,607, which equated to 0.0182% annually of the fund’s average daily net assets. MFSC also receives payment from the fund for out-of-pocket expenses paid by MFSC on behalf of the fund. For the six months ended June 30, 2008, the fund did not incur any out-of-pocket expenses.
Administrator – MFS provides certain financial, legal, shareholder communications, compliance, and other administrative services to the fund. Under an administrative services agreement, the fund partially reimburses MFS the costs incurred to provide these services. The fund is charged a fixed amount plus a fee based on average daily net assets. The fund’s annual fixed amount is $17,500.
The administrative services fee incurred for the six months ended June 30, 2008 was equivalent to an annual effective rate of 0.0134% of the fund’s average daily net assets.
Trustees’ and Officers’ Compensation – The fund pays compensation to independent trustees in the form of a retainer, attendance fees, and additional compensation to Board and Committee chairpersons. The fund does not pay compensation directly to trustees or officers of the fund who are also officers of the investment adviser, all of whom receive remuneration for their services to the fund from MFS. Certain officers and trustees of the fund are officers or directors of MFS, MFD, and MFSC.
Other – This fund and certain other MFS funds (the funds) have entered into a services agreement (the Agreement) which provides for payment of fees by the funds to Tarantino LLC in return for the provision of services of an Independent Chief Compliance Officer (ICCO) for the funds. The ICCO is an officer of the funds and the sole member of Tarantino LLC. The funds can terminate the Agreement with Tarantino LLC at any time under the terms of the Agreement. For the six months ended June 30, 2008, the fee paid by the fund to Tarantino LLC was $2,709 and is included in miscellaneous expense on the Statement of Operations. MFS has agreed to reimburse the fund for a portion of the payments made by the fund to Tarantino LLC in the amount of $2,685, which is shown as a reduction of total expenses in the Statement of Operations. Additionally, MFS has agreed to bear all expenses associated with office space, other administrative support, and supplies provided to the ICCO.
| (4) | Portfolio Securities |
Purchases and sales of investments, other than U.S. Government securities, purchased option transactions, and short-term obligations, aggregated $148,250,904 and $166,100,928, respectively.
14
Table of Contents
Notes to Financial Statements (unaudited) – continued
| (5) | Shares of Beneficial Interest |
The fund’s Declaration of Trust permits the Trustees to issue an unlimited number of full and fractional shares of beneficial interest. Transactions in fund shares were as follows:
| Six months ended 6/30/08 | Year ended 12/31/07 | |||||||||||
| Shares | Amount | Shares | Amount | |||||||||
| Shares sold | ||||||||||||
Initial Class | 1,301,967 | $28,595,537 | 3,920,733 | $89,108,009 | ||||||||
Service Class | 171,393 | 3,718,389 | 158,984 | 3,589,880 | ||||||||
| 1,473,360 | $32,313,926 | 4,079,717 | $92,697,889 | |||||||||
| Shares issued to shareholders in reinvestment of distributions | ||||||||||||
Initial Class | 2,893,713 | $60,739,027 | 656,507 | $14,416,903 | ||||||||
Service Class | 195,486 | 4,087,603 | 52,056 | 1,138,986 | ||||||||
| 3,089,199 | $64,826,630 | 708,563 | $15,555,889 | |||||||||
| Shares reacquired | ||||||||||||
Initial Class | (2,161,851 | ) | $(46,908,147 | ) | (3,421,386 | ) | $(78,057,415 | ) | ||||
Service Class | (314,083 | ) | (6,794,399 | ) | (1,132,604 | ) | (25,551,932 | ) | ||||
| (2,475,934 | ) | $(53,702,546 | ) | (4,553,990 | ) | $(103,609,347 | ) | |||||
| Net change | ||||||||||||
Initial Class | 2,033,829 | $42,426,417 | 1,155,854 | $25,467,497 | ||||||||
Service Class | 52,796 | 1,011,593 | (921,564 | ) | (20,823,066 | ) | ||||||
| 2,086,625 | $43,438,010 | 234,290 | $4,644,431 | |||||||||
| (6) | Line of Credit |
The fund and other funds managed by MFS participate in a $1 billion unsecured committed line of credit provided by a syndication of banks under a credit agreement. In addition, the fund and other funds managed by MFS have established uncommitted borrowing arrangements with certain banks. Borrowings may be made for temporary financing needs. Interest is charged to each fund, based on its borrowings, generally at a rate equal to the Federal Reserve funds rate plus 0.30%. In addition, a commitment fee, based on the average daily, unused portion of the committed line of credit, is allocated among the participating funds at the end of each calendar quarter. For the six months ended June 30, 2008, the fund’s commitment fee and interest expense were $2,082 and $0, respectively, and are included in miscellaneous expense on the Statement of Operations.
15
Table of Contents
BOARD REVIEW OF INVESTMENT ADVISORY AGREEMENT
A discussion regarding the Board’s most recent review and renewal of the fund’s Investment Advisory Agreement with MFS will be available on or about November 1, 2008 by clicking on the fund’s name under ‘‘Variable Insurance Portfolios - VIT’’ in the ‘‘Products and Performance’’ section of the MFS Web site (mfs.com).
PROXY VOTING POLICIES AND INFORMATION
A general description of the MFS funds’ proxy voting policies and procedures is available without charge, upon request, by calling 1-800-225-2606, by visiting the Proxy Voting section of mfs.com or by visiting the SEC’s Web site at http://www.sec.gov.
Information regarding how the fund voted proxies relating to portfolio securities during the most recent twelve-month period ended June 30 is available without charge by visiting the Proxy Voting section of mfs.com or by visiting the SEC’s Web site at http://www.sec.gov.
QUARTERLY PORTFOLIO DISCLOSURE
The fund will file a complete schedule of portfolio holdings with the Securities and Exchange Commission (the Commission) for the first and third quarters of each fiscal year on Form N-Q. The fund’s Form N-Q may be reviewed and copied at the:
Public Reference Room
Securities and Exchange Commission
100 F Street, NE, Room 1580
Washington, D.C. 20549
Information on the operation of the Public Reference Room may be obtained by calling the Commission at 1-800-SEC-0330. The fund’s Form N-Q is available on the EDGAR database on the Commission’s Internet Web site at http://www.sec.gov, and copies of this information may be obtained, upon payment of a duplicating fee, by electronic request at the following e-mail address: publicinfo@sec.gov or by writing the Public Reference Section at the above address.
16
Table of Contents
CONTACT US
Web site
mfs.com
Account service and literature
Shareholders
1-877-411-3325
9 a.m. to 5 p.m. Eastern Time
Investment professionals
1-800-637-8730
8 a.m. to 5 p.m. Eastern Time
Mailing address
MFS Service Center, Inc.
Attn: Institutional Alliance Services (IAS)
P.O. Box 55824
Boston, MA 02205-5824
Overnight mail
MFS Service Center, Inc.
c/o Boston Financial Data Services
30 Dan Road
Canton, MA 02021-2809

Table of Contents

Table of Contents
MFS® MID CAP GROWTH SERIES
This report is prepared for the general information of contract owners. It is authorized for distribution to prospective investors only when preceded or accompanied by a current prospectus.
NOT FDIC INSURED Ÿ MAY LOSE VALUE Ÿ NO BANK OR CREDIT UNION GUARANTEE Ÿ NOT A DEPOSIT Ÿ NOT INSURED BY ANY FEDERAL GOVERNMENT AGENCY OR NCUA/NCUSIF
Table of Contents

Dear Contract Owners:
Negative headlines tend to resonate during difficult markets, and we certainly have had more than our share of tough news recently. As a result consumer, and particularly investor, sentiment are at all-time lows. That said, I do think it is helpful to remember there are always silver linings in the storm clouds if you look hard enough.
Through all of the challenges we have faced, there are some positive underlying trends. In the United States, for example, institutional traders and credit market followers are just now showing increasing signs of confidence and are beginning to take on more risk. At the corporate level, earnings continue to be relatively strong as companies have reduced labor costs, controlled inventories, and relied less on debt to finance expansion. More broadly, low interest rates and strong demand for consumer goods and industrial equipment are good signs for the global economy.
While I do not mean to minimize the risks inherent in today’s markets, periods such as these allow the talented fund managers and research analysts we have at MFS® to test their convictions, reevaluate existing positions, and identify new investment ideas. Our investment process also includes a significant risk management component, with constant attention paid to monitoring market risk, so we can do our best to minimize any surprises to your portfolio.
For investors, this is a great time to check in with your advisor and make sure you have a sound investment plan in place — one that can keep your hard-earned money working over the long term through a strategy that involves asset allocation, diversification, and periodic portfolio rebalancing and reviews. A plan tailored to your distinct needs and goals continues to be the best approach to help you take advantage of the inevitable challenges — and opportunities — that present themselves over time.
Respectfully,

Robert J. Manning
Chief Executive Officer and Chief Investment Officer
MFS Investment Management®
August 15, 2008
The opinions expressed in this letter are subject to change, may not be relied upon for investment advice, and no forecasts can be guaranteed.
1
Table of Contents
Portfolio structure
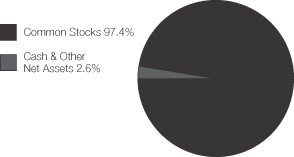
| Top ten holdings | ||
| Noble Corp. | 3.0% | |
| Cleveland-Cliffs, Inc. | 2.7% | |
| Nuance Communications, Inc. | 2.6% | |
| Allergan, Inc. | 2.1% | |
| Williams Cos., Inc. | 2.0% | |
| Eaton Corp. | 2.0% | |
| Cameron International Corp. | 1.9% | |
| Synopsys, Inc. | 1.9% | |
| Flextronics International Ltd. | 1.9% | |
| TETRA Technologies, Inc. | 1.9% |
| Equity sectors | ||
| Energy | 16.4% | |
| Technology | 16.2% | |
| Health Care | 12.5% | |
| Industrial Goods & Services | 9.2% | |
| Financial Services | 7.6% | |
| Basic Materials | 7.0% | |
| Retailing | 6.2% | |
| Utilities & Communications | 6.1% | |
| Leisure | 4.9% | |
| Special Products & Services | 4.9% | |
| Consumer Staples | 3.6% | |
| Transportation | 1.4% | |
| Autos & Housing | 1.4% |
Percentages are based on net assets as of 6/30/08.
The portfolio is actively managed and current holdings may be different.
2
Table of Contents
Fund Expenses Borne by the Contract Holders During the Period,
January 1, 2008 through June 30, 2008
As a contract holder of the fund, you incur ongoing costs, including management fees; distribution (12b-1) fees; and other fund expenses. This example is intended to help you understand your ongoing costs (in dollars) of investing in the fund and to compare these costs with the ongoing costs of investing in other mutual funds.
The example is based on an investment of $1,000 invested at the beginning of the period and held for the entire period January 1, 2008 through June 30, 2008.
Actual Expenses
The first line for each share class in the following table provides information about actual account values and actual expenses. You may use the information in this line, together with the amount you invested, to estimate the expenses that you paid over the period. Simply divide your account value by $1,000 (for example, an $8,600 account value divided by $1,000 = 8.6), then multiply the result by the number in the first line under the heading entitled “Expenses Paid During Period” to estimate the expenses you paid on your account during this period.
Hypothetical Example for Comparison Purposes
The second line for each share class in the following table provides information about hypothetical account values and hypothetical expenses based on the fund’s actual expense ratio and an assumed rate of return of 5% per year before expenses, which is not the fund’s actual return. The hypothetical account values and expenses may not be used to estimate the actual ending account balance or expenses you paid for the period. You may use this information to compare the ongoing costs of investing in the fund and other funds. To do so, compare this 5% hypothetical example with the 5% hypothetical examples that appear in the shareholder reports of the other funds.
Please note that the expenses shown in the table are meant to highlight the fund’s ongoing costs only and do not take into account the fees and expenses imposed under the variable contracts through which your investment in the fund is made. Therefore, the second line for each share class in the table is useful in comparing ongoing costs associated with an investment in vehicles (such as the fund) which fund benefits under variable annuity and variable life insurance contracts and to qualified pension and retirement plans only, and will not help you determine the relative total costs of investing in the fund through variable annuity and variable life insurance contracts. If the fees and expenses imposed under the variable contracts were included, your costs would have been higher.
| Share Class | Annualized Expense Ratio | Beginning Account Value 1/01/08 | Ending Account Value 6/30/08 | Expenses Paid During Period (p) 1/01/08-6/30/08 | ||||||
| Initial Class | Actual | 0.87% | $1,000.00 | $930.31 | $4.18 | |||||
| Hypothetical (h) | 0.87% | $1,000.00 | $1,020.54 | $4.37 | ||||||
| Service Class | Actual | 1.12% | $1,000.00 | $930.32 | $5.38 | |||||
| Hypothetical (h) | 1.12% | $1,000.00 | $1,019.29 | $5.62 |
| (h) | 5% class return per year before expenses. |
| (p) | Expenses paid is equal to each class’ annualized expense ratio, as shown above, multiplied by the average account value over the period, multiplied by the number of days in the period, divided by the number of days in the year. |
3
Table of Contents
PORTFOLIO OF INVESTMENTS – 6/30/08 (unaudited)
The Portfolio of Investments is a complete list of all securities owned by your fund. It is categorized by broad-based asset classes.
| Issuer | Shares/Par | Value ($) | |||
| COMMON STOCKS – 97.4% | |||||
| Aerospace – 0.5% | |||||
| Goodrich Corp. | 19,620 | $ | 931,165 | ||
| Airlines – 0.5% | |||||
| Copa Holdings S.A., “A” | 37,180 | $ | 1,046,989 | ||
| Alcoholic Beverages – 1.2% | |||||
| Molson Coors Brewing Co. | 42,750 | $ | 2,322,608 | ||
| Apparel Manufacturers – 1.4% | |||||
| Phillips-Van Heusen Corp. | 59,260 | $ | 2,170,101 | ||
| Quiksilver, Inc. (a) | 66,260 | 650,673 | |||
| $ | 2,820,774 | ||||
| Automotive – 1.4% | |||||
| Autoliv, Inc. | 24,630 | $ | 1,148,251 | ||
| BorgWarner Transmission Systems, Inc. | 17,560 | 779,313 | |||
| Goodyear Tire & Rubber Co. (a) | 49,750 | 887,043 | |||
| $ | 2,814,607 | ||||
| Biotechnology – 2.4% | |||||
| Cubist Pharmaceuticals, Inc. (a)(l) | 62,430 | $ | 1,115,000 | ||
| Genzyme Corp. (a) | 34,450 | 2,481,089 | |||
| Invitrogen Corp. (a)(l) | 29,210 | 1,146,785 | |||
| $ | 4,742,874 | ||||
| Brokerage & Asset Managers – 1.9% | |||||
| Affiliated Managers Group, Inc. (a)(l) | 15,530 | $ | 1,398,632 | ||
| CME Group, Inc. (l) | 1,920 | 735,725 | |||
| Invesco Ltd. | 30,380 | 728,512 | |||
| TD AMERITRADE Holding Corp. (a)(l) | 49,730 | 899,616 | |||
| $ | 3,762,485 | ||||
| Business Services – 3.7% | |||||
| Amdocs Ltd. (a) | 88,090 | $ | 2,591,608 | ||
| MasterCard, Inc., “A” (l) | 3,660 | 971,803 | |||
| Satyam Computer Services Ltd., ADR (l) | 127,720 | 3,131,694 | |||
| Visa, Inc., “A” | 8,570 | 696,827 | |||
| $ | 7,391,932 | ||||
| Cable TV – 0.5% | |||||
| Dish Network Corp., “A” (a) | 34,570 | $ | 1,012,210 | ||
| Chemicals – 1.7% | |||||
| Intrepid Potash, Inc. (a) | 19,990 | $ | 1,314,942 | ||
| PPG Industries, Inc. (l) | 35,480 | 2,035,488 | |||
| $ | 3,350,430 | ||||
| Computer Software – 7.4% | |||||
| Akamai Technologies, Inc. (a) | 27,840 | $ | 968,554 | ||
| McAfee, Inc. (a) | 35,200 | 1,197,856 | |||
| MicroStrategy, Inc., “A” (a) | 28,130 | 1,821,418 | |||
| Salesforce.com, Inc. (a) | 48,920 | 3,337,812 | |||
| Synopsys, Inc. (a) | 156,710 | 3,746,933 | |||
| VeriSign, Inc. (a) | 95,870 | 3,623,886 | |||
| $ | 14,696,459 | ||||
| Issuer | Shares/Par | Value ($) | |||
| COMMON STOCKS – continued | |||||
| Consumer Goods & Services – 1.2% | |||||
| New Oriental Education & Technology Group, Inc., ADR (a)(l) | 17,340 | $ | 1,013,003 | ||
| Priceline.com, Inc. (a)(l) | 12,510 | 1,444,405 | |||
| $ | 2,457,408 | ||||
| Electrical Equipment – 1.9% | |||||
| Baldor Electric Co. (l) | 28,060 | $ | 981,539 | ||
| Rockwell Automation, Inc. | 28,140 | 1,230,562 | |||
| WESCO International, Inc. (a)(l) | 39,620 | 1,586,385 | |||
| $ | 3,798,486 | ||||
| Electronics – 5.7% | |||||
| First Solar, Inc. (a) | 4,240 | $ | 1,156,757 | ||
| Flextronics International Ltd. (a) | 394,380 | 3,707,170 | |||
| Hittite Microwave Corp. (a) | 21,860 | 778,653 | |||
| Intersil Corp., “A” | 86,180 | 2,095,898 | |||
| MEMC Electronic Materials, Inc. (a) | 27,890 | 1,716,351 | |||
| National Semiconductor Corp. | 95,290 | 1,957,257 | |||
| $ | 11,412,086 | ||||
| Energy – Independent – 2.7% | |||||
| CONSOL Energy, Inc. | 32,900 | $ | 3,696,973 | ||
| Peabody Energy Corp. (l) | 12,490 | 1,099,745 | |||
| Tesoro Corp. (l) | 24,750 | 489,308 | |||
| $ | 5,286,026 | ||||
| Energy – Integrated – 2.3% | |||||
| Hess Corp. | 19,410 | $ | 2,449,348 | ||
| Marathon Oil Corp. | 20,610 | 1,069,041 | |||
| Murphy Oil Corp. | 11,700 | 1,147,185 | |||
| $ | 4,665,574 | ||||
| Engineering – Construction – 0.9% | |||||
| Fluor Corp. | 9,220 | $ | 1,715,658 | ||
| Food & Beverages – 0.7% | |||||
| General Mills, Inc. | 22,360 | $ | 1,358,817 | ||
| Gaming & Lodging – 1.1% | |||||
| International Game Technology (l) | 84,850 | $ | 2,119,553 | ||
| General Merchandise – 1.8% | |||||
| Family Dollar Stores, Inc. (l) | 103,350 | $ | 2,060,799 | ||
| Kohl’s Corp. (a) | 23,300 | 932,932 | |||
| Stage Stores, Inc. | 50,540 | 589,802 | |||
| $ | 3,583,533 | ||||
| Health Maintenance Organizations – 2.4% | |||||
| CIGNA Corp. | 82,310 | $ | 2,912,951 | ||
| Coventry Health Care, Inc. (a) | 62,770 | 1,909,463 | |||
| $ | 4,822,414 | ||||
| Insurance – 2.4% | |||||
| Aspen Insurance Holdings Ltd. | 45,550 | $ | 1,078,168 | ||
| Genworth Financial, Inc., “A” | 120,180 | 2,140,406 | |||
| Max Capital Group Ltd. (l) | 69,440 | 1,481,155 | |||
| $ | 4,699,729 | ||||
4
Table of Contents
Portfolio of Investments (unaudited) – continued
| Issuer | Shares/Par | Value ($) | |||
| COMMON STOCKS – continued | |||||
| Leisure & Toys – 1.8% | |||||
| Activision, Inc. (a) | 24,700 | $ | 841,529 | ||
| Electronic Arts, Inc. (a) | 63,730 | 2,831,524 | |||
| $ | 3,673,053 | ||||
| Machinery & Tools – 5.9% | |||||
| Cummins, Inc. | 54,730 | $ | 3,585,910 | ||
| Eaton Corp. | 45,810 | 3,892,476 | |||
| Kennametal, Inc. | 27,390 | 891,545 | |||
| Timken Co. | 103,770 | 3,418,184 | |||
| $ | 11,788,115 | ||||
| Major Banks – 0.8% | |||||
| UnionBanCal Corp. (l) | 38,530 | $ | 1,557,383 | ||
| Medical & Health Technology & Services – 0.9% | |||||
| Express Scripts, Inc. (a) | 14,020 | $ | 879,334 | ||
| Patterson Cos., Inc. (a) | 28,120 | 826,447 | |||
| $ | 1,705,781 | ||||
| Medical Equipment – 3.1% | |||||
| Advanced Medical Optics, Inc. (a)(l) | 65,400 | $ | 1,225,596 | ||
| St. Jude Medical, Inc. (a) | 45,000 | 1,839,600 | |||
| Zimmer Holdings, Inc. (a) | 45,990 | 3,129,620 | |||
| $ | 6,194,816 | ||||
| Metals & Mining – 4.3% | |||||
| Century Aluminum Co. (a)(l) | 18,760 | $ | 1,247,352 | ||
| Cleveland-Cliffs, Inc. | 44,560 | 5,311,104 | |||
| United States Steel Corp. | 10,340 | 1,910,625 | |||
| $ | 8,469,081 | ||||
| Natural Gas – Distribution – 1.1% | |||||
| Questar Corp. | 30,510 | $ | 2,167,430 | ||
| Natural Gas – Pipeline – 3.2% | |||||
| El Paso Corp. (l) | 102,340 | $ | 2,224,872 | ||
| Williams Cos., Inc. | 100,570 | 4,053,974 | |||
| $ | 6,278,846 | ||||
| Network & Telecom – 0.5% | |||||
| Juniper Networks, Inc. (a) | 46,440 | $ | 1,030,039 | ||
| Oil Services – 11.4% | |||||
| Cameron International Corp. (a) | 69,450 | $ | 3,844,058 | ||
| ENSCO International, Inc. (l) | 19,130 | 1,544,556 | |||
| Helix Energy Solutions Group, Inc. (a)(l) | 24,540 | 1,021,846 | |||
| National Oilwell Varco, Inc. (a) | 34,180 | 3,032,450 | |||
| Noble Corp. | 91,260 | 5,928,250 | |||
| Pride International, Inc. (a) | 74,430 | 3,519,795 | |||
| TETRA Technologies, Inc. (a) | 156,120 | 3,701,605 | |||
| $ | 22,592,560 | ||||
| Other Banks & Diversified Financials – 1.7% | |||||
| East West Bancorp, Inc. (l) | 98,220 | $ | 693,433 | ||
| Northern Trust Corp. | 20,070 | 1,376,200 | |||
| Sovereign Bancorp, Inc. | 189,900 | 1,397,664 | |||
| $ | 3,467,297 | ||||
| Personal Computers & Peripherals – 2.6% | |||||
| Nuance Communications, Inc. (a)(l) | 327,060 | $ | 5,125,030 | ||
| Issuer | Shares/Par | Value ($) | ||||
| COMMON STOCKS – continued | ||||||
| Pharmaceuticals – 3.7% | ||||||
| Allergan, Inc. | 79,880 | $ | 4,157,754 | |||
| Endo Pharmaceuticals Holdings, Inc. (a) | 43,710 | 1,057,345 | ||||
| Sepracor, Inc. (a)(l) | 41,120 | 819,110 | ||||
| United Therapeutics Corp. (a) | 14,080 | 1,376,320 | ||||
| $ | 7,410,529 | |||||
| Railroad & Shipping – 0.9% | ||||||
| Kirby Corp. (a) | 37,260 | $ | 1,788,480 | |||
| Real Estate – 0.8% | ||||||
| Kilroy Realty Corp., REIT (l) | 19,670 | $ | 925,080 | |||
| Mack-Cali Realty Corp., REIT | 21,630 | 739,097 | ||||
| $ | 1,664,177 | |||||
| Restaurants – 1.5% | ||||||
| Panera Bread Co., “A” (a)(l) | 13,550 | $ | 626,823 | |||
| Red Robin Gourmet Burgers, Inc. (a)(l) | 22,510 | 624,427 | ||||
| YUM! Brands, Inc. | 51,440 | 1,805,030 | ||||
| $ | 3,056,280 | |||||
| Specialty Chemicals – 1.0% | ||||||
| Airgas, Inc. | 33,000 | $ | 1,926,870 | |||
| Specialty Stores – 3.0% | ||||||
| Advance Auto Parts, Inc. | 26,100 | $ | 1,013,463 | |||
| Ethan Allen Interiors, Inc. (l) | 34,990 | 860,754 | ||||
| O’Reilly Automotive, Inc. (a) | 31,800 | 710,730 | ||||
| Pier 1 Imports, Inc. (a)(l) | 185,410 | 637,810 | ||||
| Ross Stores, Inc. | 35,980 | 1,278,010 | ||||
| Tiffany & Co. (l) | 13,510 | 550,533 | ||||
| TJX Cos., Inc. | 27,580 | 867,943 | ||||
| $ | 5,919,243 | |||||
| Telephone Services – 0.7% | ||||||
| Embarq Corp. | 31,570 | $ | 1,492,314 | |||
| Tobacco – 1.7% | ||||||
| Lorillard, Inc. (a) | 50,350 | $ | 3,482,206 | |||
| Utilities – Electric Power – 1.1% | ||||||
| NRG Energy, Inc. (a) | 52,700 | $ | 2,260,830 | |||
| Total Common Stocks (Identified Cost, $188,608,361) | $ | 193,862,177 | ||||
| SHORT-TERM OBLIGATIONS – 2.9% | ||||||
| Toyota Motor Credit Corp., 2.57%, due 7/01/08, at Amortized Cost and Value (y) | $5,692,000 | $ | 5,692,000 | |||
| COLLATERAL FOR SECURITIES LOANED – 14.7% | ||||||
| Navigator Securities Lending Prime Portfolio, at Cost and Net Asset Value | 29,307,843 | $ | 29,307,843 | |||
| Total Investments (Identified Cost, $223,608,204) | $ | 228,862,020 | ||||
| OTHER ASSETS, LESS LIABILITIES – (15.0)% | (29,890,320 | ) | ||||
| Net Assets – 100.0% | $ | 198,971,700 | ||||
5
Table of Contents
Portfolio of Investments (unaudited) – continued
| (a) | Non-income producing security. |
| (l) | All or a portion of this security is on loan. |
| (y) | The rate shown represents an annualized yield at time of purchase. |
The following abbreviations are used in this report and are defined:
| ADR | American Depository Receipt |
| REIT | Real Estate Investment Trust |
See Notes to Financial Statements
6
Table of Contents
FINANCIAL STATEMENTS | STATEMENT OF ASSETS AND LIABILITIES (unaudited)
This statement represents your fund’s balance sheet, which details the assets and liabilities comprising the total value of the fund.
At 6/30/08 | ||||
Assets | ||||
Investments, at value, including $31,174,519 of securities on loan (identified cost, $223,608,204) | $228,862,020 | |||
| Cash | 545 | |||
| Receivable for investments sold | 2,772,677 | |||
| Receivable for fund shares sold | 13,295 | |||
| Interest and dividends receivable | 105,606 | |||
| Other assets | 1,701 | |||
Total assets | $231,755,844 | |||
Liabilities | ||||
Payable for investments purchased | $1,652,966 | |||
Payable for fund shares reacquired | 1,704,982 | |||
Collateral for securities loaned, at value (c) | 29,307,843 | |||
Payable to affiliates | ||||
Management fee | 16,490 | |||
Shareholder servicing costs | 303 | |||
Distribution fees | 1,171 | |||
Administrative services fee | 392 | |||
Payable for independent trustees’ compensation | 1,623 | |||
Accrued expenses and other liabilities | 98,374 | |||
Total liabilities | $32,784,144 | |||
Net assets | $198,971,700 | |||
| Net assets consist of | ||||
Paid-in capital | $189,603,527 | |||
Unrealized appreciation (depreciation) on investments and translations of assets and liabilities in foreign currencies | 5,253,816 | |||
Accumulated net realized gain (loss) on investments and foreign currency transactions | 4,008,886 | |||
Undistributed net investment income | 105,471 | |||
Net assets | $198,971,700 | |||
Shares of beneficial interest outstanding | 31,826,009 | |||
Initial Class shares | ||||
Net assets | $157,429,780 | |||
Shares outstanding | 25,065,888 | |||
Net asset value per share | $6.28 | |||
Service Class shares | ||||
Net assets | $41,541,920 | |||
Shares outstanding | 6,760,121 | |||
Net asset value per share | $6.15 |
| (c) | Non-cash collateral is not included. |
See Notes to Financial Statements
7
Table of Contents
FINANCIAL STATEMENTS | STATEMENT OF OPERATIONS (unaudited)
This statement describes how much your fund earned in investment income and accrued in expenses. It also describes any gains and/or losses generated by fund operations.
Six months ended 6/30/08 | ||||||
Net investment income | ||||||
Income | ||||||
Dividends | $865,348 | |||||
Income on securities loaned | 92,025 | |||||
Interest | 57,383 | |||||
Total investment income | $1,014,756 | |||||
Expenses | ||||||
Management fee | $737,774 | |||||
Distribution fees | 53,620 | |||||
Shareholder servicing costs | 17,891 | |||||
Administrative services fee | 17,635 | |||||
Independent trustees’ compensation | 5,490 | |||||
Custodian fee | 24,373 | |||||
Shareholder communications | 20,189 | |||||
Auditing fees | 22,910 | |||||
Legal fees | 1,913 | |||||
Miscellaneous | 8,062 | |||||
Total expenses | $909,857 | |||||
Reduction of expenses by investment adviser | (572 | ) | ||||
Net expenses | $909,285 | |||||
Net investment income | $105,471 | |||||
Realized and unrealized gain (loss) on investments | ||||||
Realized gain (loss) (identified cost basis) on investment transactions | $4,654,410 | |||||
Change in unrealized appreciation (depreciation) on investments | $(20,809,149 | ) | ||||
Net realized and unrealized gain (loss) on investments | $(16,154,739 | ) | ||||
Change in net assets from operations | $(16,049,268 | ) |
See Notes to Financial Statements
8
Table of Contents
FINANCIAL STATEMENTS | STATEMENTS OF CHANGES IN NET ASSETS
These statements describe the increases and/or decreases in net assets resulting from operations, any distributions, and any shareholder transactions.
| Six months ended 6/30/08 (unaudited | ) | Year ended 12/31/07 | | |||
Change in net assets | ||||||
From operations | ||||||
Net investment income (loss) | $105,471 | $(373,281 | ) | |||
Net realized gain (loss) on investments and foreign currency transactions | 4,654,410 | 23,240,055 | ||||
Net unrealized gain (loss) on investments and foreign currency translation | (20,809,149 | ) | (8,715 | ) | ||
Change in net assets from operations | $(16,049,268 | ) | $22,858,059 | |||
Distributions declared to shareholders | ||||||
From net investment income | ||||||
Initial Class | $— | $(361,595 | ) | |||
From net realized gain on investments | ||||||
Initial Class | (17,937,409 | ) | (7,696,033 | ) | ||
Service Class | (5,186,563 | ) | (1,920,387 | ) | ||
Total distributions declared to shareholders | $(23,123,972 | ) | $(9,978,015 | ) | ||
Change in net assets from fund share transactions | $16,888,103 | $(24,236,624 | ) | |||
Total change in net assets | $(22,285,137 | ) | $(11,356,580 | ) | ||
Net assets | ||||||
At beginning of period | 221,256,837 | 232,613,417 | ||||
At end of period (including undistributed net investment income of $105,471 and | $198,971,700 | $221,256,837 |
See Notes to Financial Statements
9
Table of Contents
FINANCIAL STATEMENTS | FINANCIAL HIGHLIGHTS
The financial highlights table is intended to help you understand the fund’s financial performance for the semiannual period and the past 5 fiscal years. Certain information reflects financial results for a single fund share. The total returns in the table represent the rate by which an investor would have earned (or lost) on an investment in the fund share class (assuming reinvestment of all distributions) held for the entire period.
| Initial Class | Six months ended 6/30/08 | Years ended 12/31 | ||||||||||||||||
| 2007 | 2006 | 2005 | 2004 | 2003 | ||||||||||||||
| (unaudited) | ||||||||||||||||||
Net asset value, beginning of period | $7.66 | $7.25 | $7.30 | $7.08 | $6.18 | $4.51 | ||||||||||||
Income (loss) from investment operations | ||||||||||||||||||
Net investment income (loss) (d) | $0.01 | $(0.01 | ) | $0.01 | $(0.03 | ) | $(0.04 | ) | $(0.02 | ) | ||||||||
Net realized and unrealized gain (loss) on | (0.54 | ) | 0.71 | 0.18 | 0.25 | 0.94 | 1.69 | |||||||||||
Total from investment operations | $(0.53 | ) | $0.70 | $0.19 | $0.22 | $0.90 | $1.67 | |||||||||||
Less distributions declared to shareholders | ||||||||||||||||||
From net investment income | $— | $(0.01 | ) | $— | $— | $— | $— | |||||||||||
From net realized gain on investments | (0.85 | ) | (0.28 | ) | (0.24 | ) | — | — | — | |||||||||
Total distributions declared to shareholders | $(0.85 | ) | $(0.29 | ) | $(0.24 | ) | $— | $— | $— | |||||||||
Net asset value, end of period | $6.28 | $7.66 | $7.25 | $7.30 | $7.08 | $6.18 | ||||||||||||
Total return (%) (k)(r)(s) | (6.97 | )(n) | 9.82 | 2.55 | 3.11 | 14.56 | 37.03 | |||||||||||
| Ratios (%) (to average net assets) and Supplemental data: | ||||||||||||||||||
Expenses before expense reductions (f) | 0.87 | (a) | 0.91 | 0.90 | 0.92 | 0.87 | 0.91 | |||||||||||
Expenses after expense reductions (f) | 0.87 | (a) | 0.91 | 0.89 | 0.92 | 0.87 | 0.89 | |||||||||||
Net investment income (loss) | 0.16 | (a) | (0.10 | ) | 0.19 | (0.40 | ) | (0.56 | ) | (0.45 | ) | |||||||
Portfolio turnover | 49 | 91 | 141 | 86 | 83 | 86 | ||||||||||||
Net assets at end of period (000 Omitted) | $157,430 | $173,048 | $190,684 | $216,765 | $221,192 | $165,102 | ||||||||||||
See Notes to Financial Statements
10
Table of Contents
Financial Highlights – continued
| Service Class | Six months ended 6/30/08 | Years ended 12/31 | ||||||||||||||||
| 2007 | 2006 | 2005 | 2004 | 2003 | ||||||||||||||
| (unaudited) | ||||||||||||||||||
Net asset value, beginning of period | $7.52 | $7.13 | $7.20 | $7.00 | $6.12 | $4.48 | ||||||||||||
Income (loss) from investment operations | ||||||||||||||||||
Net investment income (loss) (d) | $(0.00 | )(w) | $(0.03 | ) | $(0.00 | )(w) | $(0.04 | ) | $(0.05 | ) | $(0.04 | ) | ||||||
Net realized and unrealized gain (loss) on | (0.52 | ) | 0.70 | 0.17 | 0.24 | 0.93 | 1.68 | |||||||||||
Total from investment operations | $(0.52 | ) | $0.67 | $0.17 | $0.20 | $0.88 | $1.64 | |||||||||||
Less distributions declared to shareholders | ||||||||||||||||||
From net realized gain on investments | $(0.85 | ) | $(0.28 | ) | $(0.24 | ) | $— | $— | $— | |||||||||
Net asset value, end of period | $6.15 | $7.52 | $7.13 | $7.20 | $7.00 | $6.12 | ||||||||||||
Total return (%) (k)(r)(s) | (6.97 | )(n) | 9.51 | 2.30 | 2.86 | 14.38 | 36.61 | |||||||||||
| Ratios (%) (to average net assets) and Supplemental data: | ||||||||||||||||||
Expenses before expense reductions (f) | 1.12 | (a) | 1.16 | 1.15 | 1.17 | 1.12 | 1.16 | |||||||||||
Expenses after expense reductions (f) | 1.12 | (a) | 1.16 | 1.15 | 1.17 | 1.12 | 1.14 | |||||||||||
Net investment loss | (0.09 | )(a) | (0.35 | ) | (0.02 | ) | (0.66 | ) | (0.81 | ) | (0.70 | ) | ||||||
Portfolio turnover | 49 | 91 | 141 | 86 | 83 | 86 | ||||||||||||
Net assets at end of period (000 Omitted) | $41,542 | $48,209 | $41,929 | $40,116 | $49,849 | $46,588 | ||||||||||||
| (a) | Annualized. |
| (d) | Per share data is based on average shares outstanding. |
| (f) | Ratios do not reflect reductions from fees paid indirectly, if applicable. |
| (k) | The total return does not reflect expenses that apply to separate accounts. Inclusion of these charges would reduce the total return figures for all periods shown. |
| (n) | Not annualized. |
| (r) | Certain expenses have been reduced without which performance would have been lower. |
| (s) | From time to time the fund may receive proceeds from litigation settlements, without which performance would be lower. |
| (w) | Per share amount was less than $0.01. |
See Notes to Financial Statements
11
Table of Contents
NOTES TO FINANCIAL STATEMENTS (unaudited)
| (1) | Business and Organization |
MFS Mid Cap Growth Series (the fund) is a series of MFS Variable Insurance Trust (the trust). The trust is organized as a Massachusetts business trust and is registered under the Investment Company Act of 1940, as amended, as an open-end management investment company. The shareholders of each series of the trust are separate accounts of insurance companies, which offer variable annuity and/or life insurance products, and qualified retirement and pension plans.
| (2) | Significant Accounting Policies |
General – The preparation of financial statements in conformity with U.S. generally accepted accounting principles requires management to make estimates and assumptions that affect the reported amounts of assets and liabilities, and disclosure of contingent assets and liabilities at the date of the financial statements and the reported amounts of revenues and expenses during the reporting period. Actual results could differ from those estimates. The fund can invest in foreign securities, including securities of emerging market issuers. Investments in foreign securities are vulnerable to the effects of changes in the relative values of the local currency and the U.S. dollar and to the effects of changes in each country’s legal, political, and economic environment. The markets of emerging markets countries are generally more volatile than the markets of developed countries with more mature economies. All of the risks of investing in foreign securities previously described are heightened when investing in emerging markets countries.
In March 2008, FASB Statement No. 161, Disclosures about Derivative Instruments and Hedging Activities (the “Standard”) was issued, and is effective for financial statements issued for fiscal years and interim periods beginning after November 15, 2008. This Standard provides enhanced disclosures about the fund’s use of and accounting for derivative instruments and the effect of derivative instruments on the fund’s results of operations and financial position. Management is evaluating the application of the Standard to the fund, and has not at this time determined the impact, if any, resulting from the adoption of this Standard on the fund’s financial statements.
Investment Valuations – Equity securities, including restricted equity securities, are generally valued at the last sale or official closing price as reported by an independent pricing service on the market or exchange on which they are primarily traded. For securities for which there were no sales reported that day, equity securities are generally valued at the last quoted daily bid quotation as reported by an independent pricing service on the market or exchange on which they are primarily traded. For securities held short for which there were no sales reported for the day, the position is generally valued at the last quoted daily ask quotation as reported by an independent pricing service on the market or exchange on which such securities are primarily traded. Short-term instruments with a maturity at issuance of 60 days or less may be valued at amortized cost, which approximates market value. Open-end investment companies are generally valued at net asset value per share. Securities and other assets generally valued on the basis of information from an independent pricing service may also be valued at a broker-dealer bid quotation. The values of foreign securities and other assets and liabilities expressed in foreign currencies are converted to U.S. dollars using the mean of bid and asked prices for rates reported by an independent pricing service.
The Board of Trustees has delegated primary responsibility for determining or causing to be determined the value of the fund’s investments (including any fair valuation) to the adviser pursuant to valuation policies and procedures approved by the Board. If the adviser determines that reliable market quotations are not readily available, investments are valued at fair value as determined in good faith by the adviser in accordance with such procedures under the oversight of the Board of Trustees. Under the fund’s valuation policies and procedures, market quotations are not considered to be readily available for most types of debt instruments and floating rate loans and many types of derivatives. These investments are generally valued at fair value based on information from independent pricing services. In addition, investments may be valued at fair value if the adviser determines that an investment’s value has been materially affected by events occurring after the close of the exchange or market on which the investment is principally traded (such as foreign exchange or market) and prior to the determination of the fund’s net asset value, or after the halting of trading of a specific security where trading does not resume prior to the close of the exchange or market on which the security is principally traded. Events that occur on a frequent basis after foreign markets close (such as developments in foreign markets and significant movements in the U.S. markets) and prior to the determination of the fund’s net asset value may be deemed to have a material affect on the value of securities traded in foreign markets. Accordingly, the fund’s foreign equity securities may often be valued at fair value. The adviser may rely on independent pricing services or other information (such as the correlation with price movements of similar securities in the same or other markets; the type, cost and investment characteristics of the security; the business and financial condition of the issuer; and trading and other market data) to assist in determining whether to fair value and at what value to fair value an investment. The value of an investment for purposes of calculating the fund’s net asset value can differ depending on the source and method used to determine value. When fair valuation is used, the value of investments used to determine the fund’s net asset value may differ from quoted or published prices for the same investments.
12
Table of Contents
Notes to Financial Statements (unaudited) – continued
The fund adopted FASB Statement No. 157, Fair Value Measurements (the “Statement”) in this reporting period. This Statement provides a single definition of fair value, a hierarchy for measuring fair value and expanded disclosures about fair value measurements.
Various inputs are used in determining the value of the fund’s assets or liabilities carried at market value. These inputs are categorized into three broad levels. Level 1 includes quoted prices in active markets for identical assets or liabilities. Level 2 includes other significant observable market-based inputs (including quoted prices for similar securities, interest rates, prepayment speed, and credit risk). Level 3 includes unobservable inputs, which may include the adviser’s own assumptions in determining the fair value of investments. Other financial instruments are derivative instruments not reflected in total investments, such as futures, forwards, swap contracts and written options, which are valued at the unrealized appreciation/depreciation on the instrument. The following is a summary of the levels used as of June 30, 2008 in valuing the fund’s assets or liabilities carried at market value:
| Level 1 | Level 2 | Level 3 | Total | |||||
| Investments in Securities | $193,862,177 | $34,999,843 | $— | $228,862,020 | ||||
| Other Financial Instruments | $— | $— | $— | $— |
Repurchase Agreements – The fund may enter into repurchase agreements with institutions that the fund’s investment adviser has determined are creditworthy. Each repurchase agreement is recorded at cost. The fund requires that the securities collateral in a repurchase transaction be transferred to a custodian in a manner sufficient to enable the fund to obtain those securities in the event of a default under the repurchase agreement. The fund monitors, on a daily basis, the value of the collateral to ensure that its value, including accrued interest, is greater than amounts owed to the fund under each such repurchase agreement. The fund and other funds managed by Massachusetts Financial Services Company (MFS), may utilize a joint trading account for the purpose of entering into one or more repurchase agreements.
Foreign Currency Translation – Purchases and sales of foreign investments, income, and expenses are converted into U.S. dollars based upon currency exchange rates prevailing on the respective dates of such transactions. Gains and losses attributable to foreign currency exchange rates on sales of securities are recorded for financial statement purposes as net realized gains and losses on investments. Gains and losses attributable to foreign exchange rate movements on income and expenses are recorded for financial statement purposes as foreign currency transaction gains and losses. That portion of both realized and unrealized gains and losses on investments that results from fluctuations in foreign currency exchange rates is not separately disclosed.
Security Loans – State Street Bank and Trust Company (“State Street”), as lending agent, may loan the securities of the fund to certain qualified institutions (the “Borrowers”) approved by the fund. The loans are collateralized at all times by cash and/or U.S. Treasury and federal agency obligations in an amount at least equal to the market value of the securities loaned. State Street provides the fund with indemnification against Borrower default. The fund bears the risk of loss with respect to the investment of cash collateral. On loans collateralized by cash, the cash collateral is invested in a money market fund or short-term securities. A portion of the income generated upon investment of the collateral is remitted to the Borrowers, and the remainder is allocated between the fund and the lending agent. On loans collateralized by U.S. Treasury and/or federal agency obligations, a fee is received from the Borrower, and is allocated between the fund and the lending agent. Net income from securities lending is separately reported on the Statement of Operations. The dividend and interest income earned on the securities loaned is accounted for in the same manner as other dividend and interest income.
At June 30, 2008, the value of securities loaned was $31,174,519. These loans were collateralized by cash of $29,307,843 and U.S. Treasury obligations of $2,658,831.
Indemnifications – Under the fund’s organizational documents, its officers and trustees may be indemnified against certain liabilities and expenses arising out of the performance of their duties to the fund. Additionally, in the normal course of business, the fund enters into agreements with service providers that may contain indemnification clauses. The fund’s maximum exposure under these agreements is unknown as this would involve future claims that may be made against the fund that have not yet occurred.
Investment Transactions and Income – Investment transactions are recorded on the trade date. Interest income is recorded on the accrual basis. All premium and discount is amortized or accreted for financial statement purposes in accordance with U.S. generally accepted accounting principles. Dividends received in cash are recorded on the ex-dividend date. Certain dividends from foreign securities will be recorded when the fund is informed of the dividend if such information is obtained subsequent to the ex-dividend date. Dividend and interest payments received in additional securities are recorded on the ex-dividend or ex-interest date in an amount equal to the value of the security on such date.
13
Table of Contents
Notes to Financial Statements (unaudited) – continued
The fund may receive proceeds from litigation settlements. Any proceeds received from litigation involving portfolio holdings are reflected in the Statement of Operations in realized gain/loss if the security has been disposed of by the fund or in unrealized gain/loss if the security is still held by the fund. Any other proceeds from litigation not related to portfolio holdings are reflected as other income in the Statement of Operations.
Fees Paid Indirectly – The fund’s custody fee may be reduced according to an arrangement that measures the value of cash deposited with the custodian by the fund. For the six months ended June 30, 2008, custody fees were not reduced.
Tax Matters and Distributions – The fund intends to qualify as a regulated investment company, as defined under Subchapter M of the Internal Revenue Code, and to distribute all of its taxable income, including realized capital gains. As a result, no provision for federal income tax is required. The fund adopted the provisions of FASB Interpretation No. 48, Accounting for Uncertainty in Income Taxes (“the Interpretation”). The Interpretation prescribes a minimum threshold for financial statement recognition of the benefit of a tax position taken or expected to be taken in a tax return. There was no impact resulting from the adoption of this Interpretation on the fund’s financial statements. Each of the fund’s federal tax returns for the prior three fiscal years remains subject to examination by the Internal Revenue Service. It is the fund’s policy to record interest and penalty charges on underpaid taxes associated with its tax positions as interest expense and miscellaneous expense, respectively. No such charges were recorded in the current financial statements. Foreign taxes, if any, have been accrued by the fund in the accompanying financial statements.
Distributions to shareholders are recorded on the ex-dividend date. Income and capital gain distributions are determined in accordance with income tax regulations, which may differ from U.S. generally accepted accounting principles. Certain capital accounts in the financial statements are periodically adjusted for permanent differences in order to reflect their tax character. These adjustments have no impact on net assets or net asset value per share. Temporary differences which arise from recognizing certain items of income, expense, gain or loss in different periods for financial statement and tax purposes will reverse at some time in the future. Distributions in excess of net investment income or net realized gains are temporary overdistributions for financial statement purposes resulting from differences in the recognition or classification of income or distributions for financial statement and tax purposes.
Book/tax differences primarily relate to net operating losses and wash sale loss deferrals.
The tax character of distributions made during the current period will be determined at fiscal year end. The tax character of distributions declared to shareholders is as follows:
| 12/31/07 | ||
| Ordinary income (including any short-term capital gains) | $3,918,982 | |
| Long-term capital gain | 6,059,033 | |
| Total distributions | $9,978,015 |
The federal tax cost and the tax basis components of distributable earnings were as follows:
| As of 6/30/08 | |||
| Cost of investments | $224,252,719 | ||
| Gross appreciation | 25,119,484 | ||
| Gross depreciation | (20,510,183 | ) | |
| Net unrealized appreciation (depreciation) | $4,609,301 | ||
| As of 12/31/07 | |||
| Undistributed ordinary income | 252,235 | ||
| Undistributed long-term capital gain | 22,870,728 | ||
| Net unrealized appreciation (depreciation) | 25,418,450 |
The aggregate cost above includes prior fiscal year end tax adjustments.
Multiple Classes of Shares of Beneficial Interest – The fund offers multiple classes of shares, which differ in their respective distribution fees. The fund’s income, realized and unrealized gain (loss), and common expenses are allocated to shareholders based on daily net assets of each class, without distinction between share classes. Dividends are declared separately for each class. Differences in per share dividend rates are generally due to differences in separate class expenses.
| (3) | Transactions with Affiliates |
Investment Adviser – The fund has an investment advisory agreement with MFS to provide overall investment management and related administrative services and facilities to the fund. The management fee is computed daily and paid monthly at an annual rate of 0.75% of the fund’s average daily net assets. The investment adviser has agreed in writing to reduce its management fee to 0.70% of average daily net assets in excess of $1 billion. This written agreement may be rescinded only
14
Table of Contents
Notes to Financial Statements (unaudited) – continued
upon consent of the fund’s Board of Trustees. For the six months ended June 30, 2008, the fund’s average daily net assets did not exceed $1 billion and therefore, the management fee was not reduced.
Distributor – MFS Fund Distributors, Inc. (MFD), a wholly-owned subsidiary of MFS, is the distributor of shares of the fund. The Trustees have adopted a distribution plan for the Service Class shares pursuant to Rule 12b-1 under the Investment Company Act of 1940.
The fund’s distribution plan provides that the fund will pay MFD distribution fees equal to 0.25% per annum of its average daily net assets attributable to Service Class shares as partial consideration for services performed and expenses incurred by MFD and financial intermediaries (including participating insurance companies that invest in the fund to fund variable annuity and variable life insurance contracts, sponsors of qualified retirement and pension plans that invest in the fund, and affiliates of these participating insurance companies and plan sponsors) in connection with the sale and distribution of the Service Class shares. MFD may subsequently pay all, or a portion, of the distribution fees to financial intermediaries.
Shareholder Servicing Agent – MFS Service Center, Inc. (MFSC), a wholly-owned subsidiary of MFS, receives a fee from the fund for its services as shareholder servicing agent. For the six months ended June 30, 2008, the fee was $17,877, which equated to 0.0182% annually of the fund’s average daily net assets. MFSC also receives payment from the fund for out-of-pocket expenses paid by MFSC on behalf of the fund. For the six months ended June 30, 2008, these costs amounted to $14.
Administrator – MFS provides certain financial, legal, shareholder communications, compliance, and other administrative services to the fund. Under an administrative services agreement, the fund partially reimburses MFS the costs incurred to provide these services. The fund is charged a fixed amount plus a fee based on average daily net assets. The fund’s annual fixed amount is $17,500.
The administrative services fee incurred for the six months ended June 30, 2008 was equivalent to an annual effective rate of 0.0179% of the fund’s average daily net assets.
Trustees’ and Officers’ Compensation – The fund pays compensation to independent trustees in the form of a retainer, attendance fees, and additional compensation to Board and Committee chairpersons. The fund does not pay compensation directly to trustees or officers of the fund who are also officers of the investment adviser, all of whom receive remuneration for their services to the fund from MFS. Certain officers and trustees of the fund are officers or directors of MFS, MFD, and MFSC.
Other – This fund and certain other MFS funds (the funds) have entered into a services agreement (the Agreement) which provides for payment of fees by the funds to Tarantino LLC in return for the provision of services of an Independent Chief Compliance Officer (ICCO) for the funds. The ICCO is an officer of the funds and the sole member of Tarantino LLC. The funds can terminate the Agreement with Tarantino LLC at any time under the terms of the Agreement. For the six months ended June 30, 2008, the fee paid by the fund to Tarantino LLC was $579 and is included in miscellaneous expense on the Statement of Operations. MFS has agreed to reimburse the fund for a portion of the payments made by the fund to Tarantino LLC in the amount of $572, which is shown as a reduction of total expenses in the Statement of Operations. Additionally, MFS has agreed to bear all expenses associated with office space, other administrative support, and supplies provided to the ICCO.
| (4) | Portfolio Securities |
Purchases and sales of investments, other than U.S. Government securities, purchased option transactions, and short-term obligations, aggregated $95,005,751 and $100,100,740, respectively.
15
Table of Contents
Notes to Financial Statements (unaudited) – continued
| (5) | Shares of Beneficial Interest |
The fund’s Declaration of Trust permits the Trustees to issue an unlimited number of full and fractional shares of beneficial interest. Transactions in fund shares were as follows:
| Six months ended 6/30/08 | Year ended 12/31/07 | |||||||||||
| Shares | Amount | Shares | Amount | |||||||||
| Shares sold | ||||||||||||
Initial Class | 2,190,375 | $14,525,839 | 4,234,333 | $32,366,469 | ||||||||
Service Class | 490,439 | 3,241,311 | 2,611,373 | 19,557,977 | ||||||||
| 2,680,814 | $17,767,150 | 6,845,706 | $51,924,446 | |||||||||
| Shares issued to shareholders in reinvestment of distributions | ||||||||||||
Initial Class | 2,838,198 | $17,937,409 | 1,081,561 | $8,057,628 | ||||||||
Service Class | 837,894 | 5,186,563 | 261,990 | 1,920,387 | ||||||||
| 3,676,092 | $23,123,972 | 1,343,551 | $9,978,015 | |||||||||
| Shares reacquired | ||||||||||||
Initial Class | (2,560,130 | ) | $(17,498,988 | ) | (9,008,183 | ) | $(68,509,129 | ) | ||||
Service Class | (978,798 | ) | (6,504,031 | ) | (2,342,074 | ) | (17,629,956 | ) | ||||
| (3,538,928 | ) | $(24,003,019 | ) | (11,350,257 | ) | $(86,139,085 | ) | |||||
| Net change | ||||||||||||
Initial Class | 2,468,443 | $14,964,260 | (3,692,289 | ) | $(28,085,032 | ) | ||||||
Service Class | 349,535 | 1,923,843 | 531,289 | 3,848,408 | ||||||||
| 2,817,978 | $16,888,103 | (3,161,000 | ) | $(24,236,624 | ) | |||||||
| (6) | Line of Credit |
The fund and other funds managed by MFS participate in a $1 billion unsecured committed line of credit provided by a syndication of banks under a credit agreement. In addition, the fund and other funds managed by MFS have established uncommitted borrowing arrangements with certain banks. Borrowings may be made for temporary financing needs. Interest is charged to each fund, based on its borrowings, generally at a rate equal to the Federal Reserve funds rate plus 0.30%. In addition, a commitment fee, based on the average daily, unused portion of the committed line of credit, is allocated among the participating funds at the end of each calendar quarter. For the six months ended June 30, 2008, the fund’s commitment fee and interest expense were $485 and $0, respectively, and are included in miscellaneous expense on the Statement of Operations.
16
Table of Contents
BOARD REVIEW OF INVESTMENT ADVISORY AGREEMENT
A discussion regarding the Board’s most recent review and renewal of the fund’s Investment Advisory Agreement with MFS will be available on or about November 1, 2008 by clicking on the fund’s name under “Variable Insurance Portfolios - VIT” in the “Products and Performance” section of the MFS Web site (mfs.com).
PROXY VOTING POLICIES AND INFORMATION
A general description of the MFS funds’ proxy voting policies and procedures is available without charge, upon request, by calling 1-800-225-2606, by visiting the Proxy Voting section of mfs.com or by visiting the SEC’s Web site at http://www.sec.gov.
Information regarding how the fund voted proxies relating to portfolio securities during the most recent twelve-month period ended June 30 is available without charge by visiting the Proxy Voting section of mfs.com or by visiting the SEC’s Web site at http://www.sec.gov.
QUARTERLY PORTFOLIO DISCLOSURE
The fund will file a complete schedule of portfolio holdings with the Securities and Exchange Commission (the Commission) for the first and third quarters of each fiscal year on Form N-Q. The fund’s Form N-Q may be reviewed and copied at the:
Public Reference Room
Securities and Exchange Commission
100 F Street, NE, Room 1580
Washington, D.C. 20549
Information on the operation of the Public Reference Room may be obtained by calling the Commission at 1-800-SEC-0330. The fund’s Form N-Q is available on the EDGAR database on the Commission’s Internet Web site at http://www.sec.gov, and copies of this information may be obtained, upon payment of a duplicating fee, by electronic request at the following e-mail address: publicinfo@sec.gov or by writing the Public Reference Section at the above address.
17
Table of Contents
CONTACT US
Web site
mfs.com
Account service and literature
Shareholders
1-877-411-3325
9 a.m. to 5 p.m. Eastern Time
Investment professionals
1-800-637-8730
8 a.m. to 5 p.m. Eastern Time
Mailing address
MFS Service Center, Inc.
Attn: Institutional Alliance Services (IAS)
P.O. Box 55824
Boston, MA 02205-5824
Overnight mail
MFS Service Center, Inc.
c/o Boston Financial Data Services
30 Dan Road
Canton, MA 02021-2809

Table of Contents
Table of Contents
This report is prepared for the general information of contract owners. It is authorized for distribution to prospective investors only when preceded or accompanied by a current prospectus.
NOT FDIC INSURED Ÿ MAY LOSE VALUE Ÿ NO BANK OR CREDIT UNION GUARANTEE Ÿ NOT A DEPOSIT Ÿ NOT INSURED BY ANY FEDERAL GOVERNMENT AGENCY OR NCUA/NCUSIF
Table of Contents

Dear Contract Owners:
Negative headlines tend to resonate during difficult markets, and we certainly have had more than our share of tough news recently. As a result consumer, and particularly investor, sentiment are at all-time lows. That said, I do think it is helpful to remember there are always silver linings in the storm clouds if you look hard enough.
Through all of the challenges we have faced, there are some positive underlying trends. In the United States, for example, institutional traders and credit market followers are just now showing increasing signs of confidence and are beginning to take on more risk. At the corporate level, earnings continue to be relatively strong as companies have reduced labor costs, controlled inventories, and relied less on debt to finance expansion. More broadly, low interest rates and strong demand for consumer goods and industrial equipment are good signs for the global economy.
While I do not mean to minimize the risks inherent in today’s markets, periods such as these allow the talented fund managers and research analysts we have at MFS® to test their convictions, reevaluate existing positions, and identify new investment ideas. Our investment process also includes a significant risk management component, with constant attention paid to monitoring market risk, so we can do our best to minimize any surprises to your portfolio.
For investors, this is a great time to check in with your advisor and make sure you have a sound investment plan in place — one that can keep your hard-earned money working over the long term through a strategy that involves asset allocation, diversification, and periodic portfolio rebalancing and reviews. A plan tailored to your distinct needs and goals continues to be the best approach to help you take advantage of the inevitable challenges — and opportunities — that present themselves over time.
Respectfully,

Robert J. Manning
Chief Executive Officer and Chief Investment Officer
MFS Investment Management®
August 15, 2008
The opinions expressed in this letter are subject to change, may not be relied upon for investment advice, and no forecasts can be guaranteed.
1
Table of Contents
Portfolio structure (u)
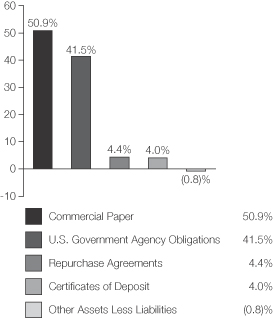
| Short-term credit quality (q) | ||
| Average Credit Quality Short-Term Bonds (a) | A-1 | |
| All holdings are rated “A-1” |
| Maturity breakdown (u) | ||
| 0 - 29 Days | 47.9% | |
| 30 - 59 Days | 19.8% | |
| 60 - 89 Days | 15.5% | |
| 90 - 366 Days | 17.6% | |
| Other Assets Less Liabilities | (0.8)% |
| (a) | The average credit quality is based upon a market weighted average of portfolio holdings that are rated by public rating agencies. |
| (q) | Each security is assigned a rating from Moody’s Investors Service. If not rated by Moody’s, the rating will be that assigned by Standard & Poor’s. Likewise, if not assigned a rating by Standard & Poor’s, it will be based on the rating assigned by Fitch, Inc. If not rated by any of the three agencies, the security is considered Not Rated. U.S. Treasuries and U.S. Agency securities are included in the “A-1”-rating category. Percentages are based on the total market value of investments as of 6/30/08. |
| (u) | For purposes of this presentation, accrued interest, where applicable, is included. |
From time to time “Other Assets Less Liabilities” may be negative due to timing of cash receipts.
Percentages are based on net assets as of 06/30/08, unless otherwise noted.
The portfolio is actively managed and current holdings may be different.
2
Table of Contents
Fund Expenses Borne by the Contract Holders During the Period,
January 1, 2008 through June 30, 2008
As a contract holder of the fund, you incur ongoing costs, including management fees and other fund expenses. This example is intended to help you understand your ongoing costs (in dollars) of investing in the fund and to compare these costs with the ongoing costs of investing in other mutual funds.
The example is based on an investment of $1,000 invested at the beginning of the period and held for the entire period January 1, 2008 through June 30, 2008.
Actual Expenses
The first line of the following table provides information about actual account values and actual expenses. You may use the information in this line, together with the amount you invested, to estimate the expenses that you paid over the period. Simply divide your account value by $1,000 (for example, an $8,600 account value divided by $1,000 = 8.6), then multiply the result by the number in the first line under the heading entitled “Expenses Paid During Period” to estimate the expenses you paid on your account during this period.
Hypothetical Example for Comparison Purposes
The second line of the following table provides information about hypothetical account values and hypothetical expenses based on the fund’s actual expense ratio and an assumed rate of return of 5% per year before expenses, which is not the fund’s actual return. The hypothetical account values and expenses may not be used to estimate the actual ending account balance or expenses you paid for the period. You may use this information to compare the ongoing costs of investing in the fund and other funds. To do so, compare this 5% hypothetical example with the 5% hypothetical examples that appear in the shareholder reports of the other funds.
Please note that the expenses shown in the table are meant to highlight the fund’s ongoing costs only and do not take into account the fees and expenses imposed under the variable contracts through which your investment in the fund is made. Therefore, the second line for each share class in the table is useful in comparing ongoing costs associated with an investment in vehicles (such as the fund) which fund benefits under variable annuity and variable life insurance contracts and to qualified pension and retirement plans only, and will not help you determine the relative total costs of investing in the fund through variable annuity and variable life insurance contracts. If the fees and expenses imposed under the variable contracts were included, your costs would have been higher.
| Share Class | Annualized Expense Ratio | Beginning Account Value 1/01/08 | Ending Account Value 6/30/08 | Expenses Paid During Period (p) 1/01/08-6/30/08 | ||||||
| Initial Class | Actual | 0.60% | $1,000.00 | $1,013.15 | $3.00 | |||||
| Hypothetical (h) | 0.60% | $1,000.00 | $1,021.88 | $3.02 |
| (h) | 5% class return per year before expenses. |
| (p) | Expenses paid is equal to each class’ annualized expense ratio, as shown above, multiplied by the average account value over the period, multiplied by the number of days in the period, divided by the number of days in the year. |
3
Table of Contents
PORTFOLIO OF INVESTMENTS – 6/30/08 (unaudited)
The Portfolio of Investments is a complete list of all securities owned by your fund. It is categorized by broad-based asset classes.
| Issuer | Shares/Par | Value ($) | ||||
| CERTIFICATES OF DEPOSIT – 4.0% | ||||||
| Major Banks – 4.0% | ||||||
| Societe Generale (NY), 2.72%, due 8/12/08, at Amortized Cost and Value | $ | 89,000 | $ | 89,000 | ||
| COMMERCIAL PAPER (y) – 50.9% | ||||||
| Automotive – 3.9% | ||||||
| Toyota Motor Credit Corp., 2.57%, due 7/01/08 | $ | 89,000 | $ | 89,000 | ||
| Brokerage & Asset Managers – 4.0% | ||||||
| Merrill Lynch & Co., Inc., 2.88%, due 7/01/08 | $ | 90,000 | $ | 90,000 | ||
| Financial Institutions – 19.9% | ||||||
| American Express Credit Corp., 2.5%, due 7/01/08 | $ | 89,000 | $ | 89,000 | ||
| American General Finance Corp., 2.58%, due 8/08/08 | 90,000 | 89,755 | ||||
| Cargill, Inc., 2.32%, due 7/30/08 (t) | 89,000 | 88,834 | ||||
| General Electric Capital Corp., 2.33%, due 7/29/08 | 90,000 | 89,837 | ||||
| Swedbank AB, 2.78%, due 7/03/08 | 90,000 | 89,986 | ||||
| $ | 447,412 | |||||
| Food & Beverages – 7.2% | ||||||
| Archer Daniels Midland Co., 2.13%, due 7/14/08 (t) | $ | 90,000 | $ | 89,931 | ||
| Coca-Cola Co., 2.03%, due 7/10/08 (t) | 72,000 | 71,963 | ||||
| $ | 161,894 | |||||
| Major Banks – 7.9% | ||||||
| Bank of America Corp., 2.42%, due 8/01/08 | $ | 89,000 | $ | 88,814 | ||
| JPMorgan Chase & Co., 2.2%, due 7/01/08 | 90,000 | 90,000 | ||||
| $ | 178,814 | |||||
| Other Banks & Diversified Financials – 8.0% | ||||||
| Citigroup Funding Inc., 2.67%, due 9/02/08 | $ | 90,000 | $ | 89,579 | ||
| Svenska Handelsbanken, Inc., 2.52%, due 7/11/08 | 90,000 | 89,937 | ||||
| $ | 179,516 | |||||
| Total Commercial Paper, at Amortized Cost and Value | $ | 1,146,636 | ||||
| Issuer | Shares/Par | Value ($) | |||||
| U.S. GOVERNMENT AGENCIES (y) – 41.5% | |||||||
| Fannie Mae, 2.1%, due 8/29/08 | $ | 100,000 | $ | 99,656 | |||
| Fannie Mae, 1.7%, due 9/10/08 | 60,000 | 59,799 | |||||
| Federal Home Loan Bank, 2.37%, due 9/17/08 | 100,000 | 99,487 | |||||
| Federal Home Loan Bank, 2.1%, due 10/03/08 | 100,000 | 99,452 | |||||
| Federal Home Loan Bank, 2.45%, due 10/03/08 | 100,000 | 99,360 | |||||
| Federal Home Loan Bank, 2.24%, due 11/21/08 | 100,000 | 99,110 | |||||
| Federal Home Loan Bank, 2.7%, due 12/24/08 | 100,000 | 98,680 | |||||
| Freddie Mac, 2.521%, due 7/28/08 | 100,000 | 99,811 | |||||
| Freddie Mac, 2.16%, due 8/08/08 | 80,000 | 79,818 | |||||
| Freddie Mac, 2.09%, due 9/22/08 | 100,000 | 99,518 | |||||
| Total U.S. Government Agencies, at Amortized Cost and Value | $ | 934,691 | |||||
| REPURCHASE AGREEMENTS – 4.4% | |||||||
| Merrill Lynch & Co., 2.50%, dated 6/30/08, due 7/01/08 total to be received $100,007 (secured by U.S. Treasury and Federal Agency obligations and Mortgage Backed securities in a jointly traded account), at Cost | $ | 100,000 | $ | 100,000 | |||
| Total Investments, at Amortized Cost and Value | $ | 2,270,327 | |||||
| OTHER ASSETS, LESS LIABILITIES – (0.8)% | (18,400 | ) | |||||
| Net Assets – 100.0% | $ | 2,251,927 | |||||
| (t) | Security exempt from registration with the U.S. Securities and Exchange Commission under Section 4(2) of the Securities Act of 1933. |
| (y) | The rate shown represents an annualized yield at time of purchase. |
See Notes to Financial Statements
4
Table of Contents
FINANCIAL STATEMENTS | STATEMENT OF ASSETS AND LIABILITIES (unaudited)
This statement represents your fund’s balance sheet, which details the assets and liabilities comprising the total value of the fund.
| At 6/30/08 | |||||
Assets | |||||
Investments, at amortized cost and value | $2,270,327 | ||||
Cash | 30 | ||||
Receivable for fund shares sold | 219 | ||||
Interest receivable | 128 | ||||
Receivable from investment adviser | 5,870 | ||||
Other assets | 103 | ||||
Total assets | $2,276,677 | ||||
Liabilities | |||||
Payable to affiliates | |||||
Management fee | $123 | ||||
Shareholder servicing costs | 12 | ||||
Administrative services fee | 192 | ||||
Payable for independent trustees’ compensation | 292 | ||||
Accrued expenses and other liabilities | 24,131 | ||||
Total liabilities | $24,750 | ||||
Net assets | $2,251,927 | ||||
Net assets consist of | |||||
Paid-in capital | $2,252,056 | ||||
Accumulated net realized gain (loss) on investments | (172 | ) | |||
Undistributed net investment income | 43 | ||||
Net assets | $2,251,927 | ||||
Shares of beneficial interest outstanding | 2,252,056 | ||||
Initial Class shares | |||||
Net assets | $2,251,927 | ||||
Shares outstanding | 2,252,056 | ||||
Net asset value per share | $1.00 |
See Notes to Financial Statements
5
Table of Contents
FINANCIAL STATEMENTS | STATEMENT OF OPERATIONS (unaudited)
This statement describes how much your fund earned in investment income and accrued in expenses. It also describes any gains and/or losses generated by fund operations.
| Six months ended 6/30/08 | |||||
| Net investment income | |||||
Interest income | $35,924 | ||||
| Expenses | |||||
Management fee | $5,561 | ||||
Shareholder servicing costs | 206 | ||||
Administrative services fee | 8,727 | ||||
Independent trustees’ compensation | 635 | ||||
Custodian fee | 3,827 | ||||
Shareholder communications | 2,131 | ||||
Auditing fees | 14,899 | ||||
Legal fees | 105 | ||||
Miscellaneous | 2,644 | ||||
Total expenses | $38,735 | ||||
Reduction of expenses by investment adviser | (32,048 | ) | |||
Net expenses | $6,687 | ||||
Net investment income | $29,237 | ||||
Change in net assets from operations | $29,237 |
See Notes to Financial Statements
6
Table of Contents
FINANCIAL STATEMENTS | STATEMENTS OF CHANGES IN NET ASSETS
These statements describe the increases and/or decreases in net assets resulting from operations, any distributions, and any shareholder transactions.
| Six months ended 6/30/08 | | Year ended 12/31/07 | | |||
| (unaudited) | ||||||
Change in net assets | ||||||
From operations | ||||||
Net investment income | $29,237 | $101,066 | ||||
Net realized gain (loss) on investments | — | (113 | ) | |||
Change in net assets from operations | $29,237 | $100,953 | ||||
Distributions declared to shareholders | ||||||
From net investment income | $(29,237 | ) | $(101,066 | ) | ||
Fund share (principal) transactions at net asset value of $1.00 per share | ||||||
Net proceeds from sale of shares | 15,377 | 21,562 | ||||
Net asset value of shares issued to shareholders in reinvestment of distributions | 29,237 | 101,066 | ||||
Cost of shares reacquired | (16,579 | ) | (25,468 | ) | ||
Change in net assets from fund share transactions | $28,035 | $97,160 | ||||
Total change in net assets | $28,035 | $97,047 | ||||
Net assets | ||||||
At beginning of period | 2,223,892 | 2,126,845 | ||||
At end of period (including undistributed net investment income of $43 and | $2,251,927 | $2,223,892 |
See Notes to Financial Statements
7
Table of Contents
FINANCIAL STATEMENTS | FINANCIAL HIGHLIGHTS
The financial highlights table is intended to help you understand the fund’s financial performance for the semiannual period and the past 5 fiscal years. Certain information reflects financial results for a single fund share. The total returns in the table represent the rate by which an investor would have earned (or lost) on an investment in the fund share class (assuming reinvestment of all distributions) held for the entire period.
| Initial Class | Six months 6/30/08 | Years ended 12/31 | ||||||||||||||||
| 2007 | 2006 | 2005 | 2004 | 2003 | ||||||||||||||
| (unaudited) | ||||||||||||||||||
Net asset value, beginning of period | $1.00 | $1.00 | $1.00 | $1.00 | $1.00 | $1.00 | ||||||||||||
Income (loss) from investment operations | ||||||||||||||||||
Net investment income (d) | $0.01 | $0.05 | $0.05 | $0.03 | $0.01 | $0.01 | ||||||||||||
Net realized and unrealized gain (loss) on investments | — | (0.00 | )(w) | (0.00 | )(w) | (0.00 | )(w) | — | — | |||||||||
Total from investment operations | $0.01 | $0.05 | $0.05 | $0.03 | $0.01 | $0.01 | ||||||||||||
Less distributions declared to shareholders | ||||||||||||||||||
From net investment income | $(0.01 | ) | $(0.05 | ) | $(0.05 | ) | $(0.03 | ) | $(0.01 | ) | $(0.01 | ) | ||||||
Net asset value, end of period | $1.00 | $1.00 | $1.00 | $1.00 | $1.00 | $1.00 | ||||||||||||
Total return (%) (k)(r)(s) | 1.32 | (n) | 4.76 | 4.62 | 2.73 | 0.78 | 0.61 | |||||||||||
| Ratios (%) (to average net assets) and Supplemental data: | ||||||||||||||||||
Expenses before expense reductions (f) | 3.48 | (a) | 3.80 | 3.66 | 2.83 | 1.68 | 0.99 | |||||||||||
Expenses after expense reductions (f) | 0.60 | (a) | 0.60 | 0.60 | 0.60 | 0.60 | 0.60 | |||||||||||
Net investment income | 2.63 | (a) | 4.66 | 4.53 | 2.64 | 0.72 | 0.64 | |||||||||||
Net assets at end of period (000 Omitted) | $2,252 | $2,224 | $2,127 | $2,224 | $2,804 | $5,256 | ||||||||||||
| (a) | Annualized. |
| (d) | Per share data is based on average shares outstanding. |
| (f) | Ratios do not reflect reductions from fees paid indirectly, if applicable. |
| (k) | The total return does not reflect expenses that apply to separate accounts. Inclusion of these charges would reduce the total return figures for all periods shown. |
| (n) | Not annualized. |
| (r) | Certain expenses have been reduced without which performance would have been lower. |
| (s) | From time to time the fund may receive proceeds from litigation settlements, without which performance would be lower. |
| (w) | Per share amount was less than $0.01. |
See Notes to Financial Statements
8
Table of Contents
NOTES TO FINANCIAL STATEMENTS (unaudited)
| (1) | Business and Organization |
MFS Money Market Series (the fund) is a series of MFS Variable Insurance Trust (the trust). The trust is organized as a Massachusetts business trust and is registered under the Investment Company Act of 1940, as amended, as an open-end management investment company. The shareholders of each series of the trust are separate accounts of insurance companies, which offer variable annuity and/or life insurance products, and qualified retirement and pension plans.
| (2) | Significant Accounting Policies |
General – The preparation of financial statements in conformity with U.S. generally accepted accounting principles requires management to make estimates and assumptions that affect the reported amounts of assets and liabilities, and disclosure of contingent assets and liabilities at the date of the financial statements and the reported amounts of revenues and expenses during the reporting period. Actual results could differ from those estimates.
Investment Valuations – Money market instruments are valued at amortized cost, which approximates market value. Amortized cost involves valuing an instrument at its cost as adjusted for amortization of premium or accretion of discount rather than its current market value. Each money market fund’s use of amortized cost is subject to the fund’s compliance with Rule 2a-7 under the Investment Company Act of 1940. The amortized cost value of an instrument can be different from the market value of an instrument.
The fund adopted FASB Statement No. 157, Fair Value Measurements (the “Statement”) in this reporting period. This Statement provides a single definition of fair value, a hierarchy for measuring fair value and expanded disclosures about fair value measurements.
Various inputs are used in determining the value of the fund’s assets or liabilities carried at market value. These inputs are categorized into three broad levels. Level 1 includes quoted prices in active markets for identical assets or liabilities. Level 2 includes other significant observable market-based inputs (including quoted prices for similar securities, interest rates, prepayment speed, and credit risk). Level 3 includes unobservable inputs, which may include the adviser’s own assumptions in determining the fair value of investments. Other financial instruments are derivative instruments not reflected in total investments, such as futures, forwards, swap contracts and written options, which are valued at the unrealized appreciation/depreciation on the instrument. The following is a summary of the levels used as of June 30, 2008 in valuing the fund’s assets or liabilities carried at market value:
| Level 1 | Level 2 | Level 3 | Total | |||||
Investments in Securities | $— | $2,270,327 | $— | $2,270,327 | ||||
Other Financial Instruments | $— | $— | $— | $— |
Repurchase Agreements – The fund may enter into repurchase agreements with institutions that the fund’s investment adviser has determined are creditworthy. Each repurchase agreement is recorded at cost. The fund requires that the securities collateral in a repurchase transaction be transferred to a custodian in a manner sufficient to enable the fund to obtain those securities in the event of a default under the repurchase agreement. The fund monitors, on a daily basis, the value of the collateral to ensure that its value, including accrued interest, is greater than amounts owed to the fund under each such repurchase agreement. The fund and other funds managed by Massachusetts Financial Services Company (MFS), may utilize a joint trading account for the purpose of entering into one or more repurchase agreements.
Indemnifications – Under the fund’s organizational documents, its officers and trustees may be indemnified against certain liabilities and expenses arising out of the performance of their duties to the fund. Additionally, in the normal course of business, the fund enters into agreements with service providers that may contain indemnification clauses. The fund’s maximum exposure under these agreements is unknown as this would involve future claims that may be made against the fund that have not yet occurred.
Investment Transactions and Income – Investment transactions are recorded on the trade date. Interest income is recorded on the accrual basis. All premium and discount is amortized or accreted for financial statement purposes in accordance with U.S. generally accepted accounting principles. The fund may receive proceeds from litigation settlements. Any proceeds received from litigation involving portfolio holdings are reflected in the Statement of Operations in realized gain/loss if the security has been disposed of by the fund or in unrealized gain/loss if the security is still held by the fund. Any other proceeds from litigation not related to portfolio holdings are reflected as other income in the Statement of Operations.
Fees Paid Indirectly – The fund’s custody fee may be reduced according to an arrangement that measures the value of cash deposited with the custodian by the fund. For the six months ended June 30, 2008, custody fees were not reduced.
Tax Matters and Distributions – The fund intends to qualify as a regulated investment company, as defined under Subchapter M of the Internal Revenue Code, and to distribute all of its taxable income, including realized capital gains. As a result, no provision for federal income tax is required. The fund adopted the provisions of FASB Interpretation No. 48, Accounting for
9
Table of Contents
Notes to Financial Statements (unaudited) – continued
Uncertainty in Income Taxes (“the Interpretation”). The Interpretation prescribes a minimum threshold for financial statement recognition of the benefit of a tax position taken or expected to be taken in a tax return. There was no impact resulting from the adoption of this Interpretation on the fund’s financial statements. Each of the fund’s federal tax returns for the prior three fiscal years remains subject to examination by the Internal Revenue Service. It is the fund’s policy to record interest and penalty charges on underpaid taxes associated with its tax positions as interest expense and miscellaneous expense, respectively. No such charges were recorded in the current financial statements. Foreign taxes, if any, have been accrued by the fund in the accompanying financial statements.
Distributions to shareholders are recorded on the ex-dividend date. Income and capital gain distributions are determined in accordance with income tax regulations, which may differ from U.S. generally accepted accounting principles. Certain capital accounts in the financial statements are periodically adjusted for permanent differences in order to reflect their tax character. These adjustments have no impact on net assets or net asset value per share. Temporary differences which arise from recognizing certain items of income, expense, gain or loss in different periods for financial statement and tax purposes will reverse at some time in the future. Distributions in excess of net investment income or net realized gains are temporary overdistributions for financial statement purposes resulting from differences in the recognition or classification of income or distributions for financial statement and tax purposes.
During the year ended December 31, 2007, there were no significant adjustments due to differences between book and tax accounting.
The tax character of distributions made during the current period will be determined at fiscal year end.
The tax character of distributions declared to shareholders is as follows:
| 12/31/07 | ||
| Ordinary income (including any short-term capital gains) | $101,066 |
The federal tax cost and the tax basis components of distributable earnings were as follows:
| As of 6/30/08 | |||
| Cost of investments | $2,270,327 | ||
| As of 12/31/07 | |||
| Undistributed ordinary income | $43 | ||
| Capital loss carryforwards | (172 | ) | |
As of December 31, 2007, the fund had capital loss carryforwards available to offset future realized gains. Such losses expire as follows:
| 12/31/13 | $(43 | ) | |
| 12/31/14 | (16 | ) | |
| 12/31/15 | (113 | ) | |
| $(172 | ) |
| (3) | Transactions with Affiliates |
Investment Adviser – The fund has an investment advisory agreement with Massachusetts Financial Services Company (MFS) to provide overall investment management and related administrative services and facilities to the fund. The management fee is computed daily and paid monthly at an annual rate of 0.50% of the fund’s average daily net assets.
The investment adviser has agreed in writing to pay a portion of the fund’s operating expenses, exclusive of management and certain other fees and expenses, such that operating expenses do not exceed 0.10% annually of the fund’s average daily net assets. This written agreement will continue through April 30, 2009 unless changed or rescinded by the fund’s Board of Trustees. For the six months ended June 30, 2008, this reduction amounted to $32,042 and is reflected as a reduction of total expenses in the Statement of Operations.
Shareholder Servicing Agent – MFS Service Center, Inc. (MFSC), a wholly-owned subsidiary of MFS, receives a fee from the fund for its services as shareholder servicing agent. For the six months ended June 30, 2008, the fee was $202, which equated to 0.0181% annually of the fund’s average daily net assets. MFSC also receives payment from the fund for out-of-pocket expenses paid by MFSC on behalf of the fund. For the six months ended June 30, 2008, these costs amounted to $4.
Administrator – MFS provides certain financial, legal, shareholder communications, compliance, and other administrative services to the fund. Under an administrative services agreement, the fund partially reimburses MFS the costs incurred to provide these services. The fund is charged a fixed amount plus a fee based on average daily net assets. The fund’s annual fixed amount is $17,500.
10
Table of Contents
Notes to Financial Statements (unaudited) – continued
The administrative services fee incurred for the six months ended June 30, 2008 was equivalent to an annual effective rate of 0.7846% of the fund’s average daily net assets.
Trustees’ and Officers’ Compensation – The fund pays compensation to independent trustees in the form of a retainer, attendance fees, and additional compensation to Board and Committee chairpersons. The fund does not pay compensation directly to trustees or officers of the fund who are also officers of the investment adviser, all of whom receive remuneration for their services to the fund from MFS. Certain officers and trustees of the fund are officers or directors of MFS, MFD, and MFSC.
Other – This fund and certain other MFS funds (the funds) have entered into a services agreement (the Agreement) which provides for payment of fees by the funds to Tarantino LLC in return for the provision of services of an Independent Chief Compliance Officer (ICCO) for the funds. The ICCO is an officer of the funds and the sole member of Tarantino LLC. The funds can terminate the Agreement with Tarantino LLC at any time under the terms of the Agreement. For the six months ended June 30, 2008, the fee paid by the fund to Tarantino LLC was $9 and is included in miscellaneous expense on the Statement of Operations. MFS has agreed to reimburse the fund for a portion of the payments made by the fund to Tarantino LLC in the amount of $6, which is shown as a reduction of total expenses in the Statement of Operations. Additionally, MFS has agreed to bear all expenses associated with office space, other administrative support, and supplies provided to the ICCO.
An affiliated entity of the fund’s investment adviser owns 97.3% of the outstanding voting shares of the fund at June 30, 2008.
| (4) | Portfolio Securities |
Purchases and sales of money market securities, exclusive of securities subject to repurchase agreements, aggregated $16,916,155 and $16,725,300, respectively.
| (5) | Shares of Beneficial Interest |
The fund’s Declaration of Trust permits the Trustees to issue an unlimited number of full and fractional shares of beneficial interest.
| (6) | Line of Credit |
The fund and other funds managed by MFS participate in a $1 billion unsecured committed line of credit provided by a syndication of banks under a credit agreement. In addition, the fund and other funds managed by MFS have established uncommitted borrowing arrangements with certain banks. Borrowings may be made for temporary financing needs. Interest is charged to each fund, based on its borrowings, generally at a rate equal to the Federal Reserve funds rate plus 0.30%. In addition, a commitment fee, based on the average daily, unused portion of the committed line of credit, is allocated among the participating funds at the end of each calendar quarter. For the six months ended June 30, 2008, the fund’s commitment fee and interest expense were $6 and $0, respectively, and are included in miscellaneous expense on the Statement of Operations.
11
Table of Contents
BOARD REVIEW OF INVESTMENT ADVISORY AGREEMENT
A discussion regarding the Board’s most recent review and renewal of the fund’s Investment Advisory Agreement with MFS will be available on or about November 1, 2008 by clicking on the fund’s name under ‘‘Variable Insurance Portfolios - VIT’’ in the ‘‘Products and Performance’’ section of the MFS Web site (mfs.com).
PROXY VOTING POLICIES AND INFORMATION
A general description of the MFS funds’ proxy voting policies and procedures is available without charge, upon request, by calling 1-800-225-2606, by visiting the Proxy Voting section of mfs.com or by visiting the SEC’s Web site at http://www.sec.gov.
Information regarding how the fund voted proxies relating to portfolio securities during the most recent twelve-month period ended June 30 is available without charge by visiting the Proxy Voting section of mfs.com or by visiting the SEC’s Web site at http://www.sec.gov.
QUARTERLY PORTFOLIO DISCLOSURE
The fund will file a complete schedule of portfolio holdings with the Securities and Exchange Commission (the Commission) for the first and third quarters of each fiscal year on Form N-Q. The fund’s Form N-Q may be reviewed and copied at the:
Public Reference Room
Securities and Exchange Commission
100 F Street, NE, Room 1580
Washington, D.C. 20549
Information on the operation of the Public Reference Room may be obtained by calling the Commission at 1-800-SEC-0330. The fund’s Form N-Q is available on the EDGAR database on the Commission’s Internet Web site at http://www.sec.gov, and copies of this information may be obtained, upon payment of a duplicating fee, by electronic request at the following e-mail address: publicinfo@sec.gov or by writing the Public Reference Section at the above address.
12
Table of Contents
CONTACT US
Web site
mfs.com
Account service and literature
Shareholders
1-877-411-3325
9 a.m. to 5 p.m. Eastern Time
Investment professionals
1-800-637-8730
8 a.m. to 5 p.m. Eastern Time
Mailing address
MFS Service Center, Inc.
Attn: Institutional Alliance Services (IAS)
P.O. Box 55824
Boston, MA 02205-5824
Overnight mail
MFS Service Center, Inc.
c/o Boston Financial Data Services
30 Dan Road
Canton, MA 02021-2809

Table of Contents

Table of Contents
This report is prepared for the general information of contract owners. It is authorized for distribution to prospective investors only when preceded or accompanied by a current prospectus.
NOT FDIC INSURED Ÿ MAY LOSE VALUE Ÿ NO BANK OR CREDIT UNION GUARANTEE Ÿ NOT A DEPOSIT Ÿ NOT INSURED BY ANY FEDERAL GOVERNMENT AGENCY OR NCUA/NCUSIF
Table of Contents

Dear Contract Owners:
Negative headlines tend to resonate during difficult markets, and we certainly have had more than our share of tough news recently. As a result consumer, and particularly investor, sentiment are at all-time lows. That said, I do think it is helpful to remember there are always silver linings in the storm clouds if you look hard enough.
Through all of the challenges we have faced, there are some positive underlying trends. In the United States, for example, institutional traders and credit market followers are just now showing increasing signs of confidence and are beginning to take on more risk. At the corporate level, earnings continue to be relatively strong as companies have reduced labor costs, controlled inventories, and relied less on debt to finance expansion. More broadly, low interest rates and strong demand for consumer goods and industrial equipment are good signs for the global economy.
While I do not mean to minimize the risks inherent in today’s markets, periods such as these allow the talented fund managers and research analysts we have at MFS® to test their convictions, reevaluate existing positions, and identify new investment ideas. Our investment process also includes a significant risk management component, with constant attention paid to monitoring market risk, so we can do our best to minimize any surprises to your portfolio.
For investors, this is a great time to check in with your advisor and make sure you have a sound investment plan in place — one that can keep your hard-earned money working over the long term through a strategy that involves asset allocation, diversification, and periodic portfolio rebalancing and reviews. A plan tailored to your distinct needs and goals continues to be the best approach to help you take advantage of the inevitable challenges — and opportunities — that present themselves over time.
Respectfully,

Robert J. Manning
Chief Executive Officer and Chief Investment Officer
MFS Investment Management®
August 15, 2008
The opinions expressed in this letter are subject to change, may not be relied upon for investment advice, and no forecasts can be guaranteed.
1
Table of Contents
Portfolio structure

| Top ten holdings | ||
| North American Energy Partners, Inc. | 2.4% | |
| IDEXX Laboratories, Inc. | 2.1% | |
| MWI Veterinary Supply, Inc. | 1.9% | |
| NICE Systems Ltd., ADR | 1.8% | |
| Hittite Microwave Corp. | 1.7% | |
| Quanta Services, Inc. | 1.7% | |
| Citi Trends, Inc. | 1.6% | |
| Dresser-Rand Group, Inc. | 1.6% | |
| Nuance Communications, Inc. | 1.5% | |
| Polypore International, Inc. | 1.5% |
| Equity sectors | ||
| Health Care | 18.1% | |
| Technology | 17.6% | |
| Industrial Goods & Services | 11.4% | |
| Special Products & Services | 10.4% | |
| Energy | 10.4% | |
| Leisure | 8.5% | |
| Retailing | 8.1% | |
| Basic Materials | 4.4% | |
| Autos & Housing | 3.0% | |
| Financial Services | 2.6% | |
| Transportation | 2.6% | |
| Consumer Staples | 1.9% | |
| Utilities & Communications | 0.7% |
Percentages are based on net assets as of 6/30/08.
The portfolio is actively managed and current holdings may be different.
2
Table of Contents
Fund Expenses Borne by the Contract Holders During the Period,
January 1, 2008 through June 30, 2008
As a contract holder of the fund, you incur ongoing costs, including management fees; distribution (12b-1) fees; and other fund expenses. This example is intended to help you understand your ongoing costs (in dollars) of investing in the fund and to compare these costs with the ongoing costs of investing in other mutual funds.
The example is based on an investment of $1,000 invested at the beginning of the period and held for the entire period January 1, 2008 through June 30, 2008.
Actual Expenses
The first line for each share class in the following table provides information about actual account values and actual expenses. You may use the information in this line, together with the amount you invested, to estimate the expenses that you paid over the period. Simply divide your account value by $1,000 (for example, an $8,600 account value divided by $1,000 = 8.6), then multiply the result by the number in the first line under the heading entitled “Expenses Paid During Period” to estimate the expenses you paid on your account during this period.
Hypothetical Example for Comparison Purposes
The second line for each share class in the following table provides information about hypothetical account values and hypothetical expenses based on the fund’s actual expense ratio and an assumed rate of return of 5% per year before expenses, which is not the fund’s actual return. The hypothetical account values and expenses may not be used to estimate the actual ending account balance or expenses you paid for the period. You may use this information to compare the ongoing costs of investing in the fund and other funds. To do so, compare this 5% hypothetical example with the 5% hypothetical examples that appear in the shareholder reports of the other funds.
Please note that the expenses shown in the table are meant to highlight the fund’s ongoing costs only and do not take into account the fees and expenses imposed under the variable contracts through which your investment in the fund is made. Therefore, the second line for each share class in the table is useful in comparing ongoing costs associated with an investment in vehicles (such as the fund) which fund benefits under variable annuity and variable life insurance contracts and to qualified pension and retirement plans only, and will not help you determine the relative total costs of investing in the fund through variable annuity and variable life insurance contracts. If the fees and expenses imposed under the variable contracts were included, your costs would have been higher.
| Share Class | Annualized Expense Ratio | Beginning Account Value 1/01/08 | Ending Account Value 6/30/08 | Expenses Paid During Period (p) 1/01/08-6/30/08 | ||||||
| Initial Class | Actual | 0.99% | $1,000.00 | $919.28 | $4.72 | |||||
| Hypothetical (h) | 0.99% | $1,000.00 | $1,019.94 | $4.97 | ||||||
| Service Class | Actual | 1.24% | $1,000.00 | $918.17 | $5.91 | |||||
| Hypothetical (h) | 1.24% | $1,000.00 | $1,018.70 | $6.22 |
| (h) | 5% class return per year before expenses. |
| (p) | Expenses paid is equal to each class’ annualized expense ratio, as shown above, multiplied by the average account value over the period, multiplied by the number of days in the period, divided by the number of days in the year. |
3
Table of Contents
PORTFOLIO OF INVESTMENTS – 6/30/08 (unaudited)
The Portfolio of Investments is a complete list of all securities owned by your fund. It is categorized by broad-based asset classes.
| Issuer | Shares/Par | Value ($) | |||
| COMMON STOCKS – 99.7% | |||||
| Airlines – 0.5% | |||||
| Allegiant Travel Co. (a)(l) | 171,350 | $ | 3,185,397 | ||
| Apparel Manufacturers – 1.0% | |||||
| Quiksilver, Inc. (a) | 640,730 | $ | 6,291,969 | ||
| Biotechnology – 0.9% | |||||
| Affymetrix, Inc. (a)(l) | 448,940 | $ | 4,619,593 | ||
| Nanosphere, Inc. (a)(l) | 192,770 | 1,515,172 | |||
| $ | 6,134,765 | ||||
| Brokerage & Asset Managers – 1.0% | |||||
| HFF, Inc., “A” (a)(l) | 392,980 | $ | 2,236,056 | ||
| KBW, Inc. (a)(l) | 157,290 | 3,237,028 | |||
| Thomas Weisel Partners Group (a)(l) | 192,540 | 1,053,194 | |||
| $ | 6,526,278 | ||||
| Business Services – 6.3% | |||||
| ATA, Inc., ADR (a)(l) | 183,540 | $ | 2,387,855 | ||
| Concur Technologies, Inc. (a)(l) | 79,650 | 2,646,770 | |||
| Constant Contact, Inc. (a)(l) | 180,412 | 3,400,766 | |||
| Corporate Executive Board Co. | 221,001 | 9,293,092 | |||
| CoStar Group, Inc. (a)(l) | 160,161 | 7,119,156 | |||
| iGate Corp. (a)(l) | 487,100 | 3,960,123 | |||
| Syntel, Inc. (l) | 146,144 | 4,927,976 | |||
| Team, Inc. (a)(l) | 225,540 | 7,740,533 | |||
| $ | 41,476,271 | ||||
| Chemicals – 0.7% | |||||
| Nalco Holding Co. (l) | 217,320 | $ | 4,596,318 | ||
| Computer Software – 3.1% | |||||
| ACI Worldwide, Inc. (a)(l) | 307,955 | $ | 5,416,928 | ||
| ANSYS, Inc. (a)(l) | 84,620 | 3,987,294 | |||
| CommVault Systems, Inc. (a) | 388,840 | 6,470,298 | |||
| Guidance Software, Inc. (a)(l) | 324,035 | 3,094,534 | |||
| NetSuite, Inc. (a)(l) | 72,240 | 1,478,753 | |||
| $ | 20,447,807 | ||||
| Computer Software – Systems – 0.8% | |||||
| Deltek, Inc. (a)(l) | 262,000 | $ | 1,985,960 | ||
| PROS Holdings, Inc. (a)(l) | 315,670 | 3,544,974 | |||
| $ | 5,530,934 | ||||
| Construction – 2.6% | |||||
| Dayton Superior Corp. (a)(l) | 485,605 | $ | 1,281,997 | ||
| Lennar Corp. (l) | 632,780 | 7,808,505 | |||
| Pulte Homes, Inc. (l) | 852,330 | 8,207,938 | |||
| $ | 17,298,440 | ||||
| Consumer Goods & Services – 4.6% | |||||
| Capella Education Co. (a) | 58,710 | $ | 3,502,052 | ||
| Central Garden & Pet Co., “A” (a)(l) | 1,385,757 | 5,681,604 | |||
| ITT Educational Services, Inc. (a)(l) | 66,760 | 5,516,379 | |||
| New Oriental Education & Technology Group, Inc., ADR (a)(l) | 135,690 | 7,927,010 | |||
| Issuer | Shares/Par | Value ($) | |||
| COMMON STOCKS – continued | |||||
| Consumer Goods & Services – continued | |||||
| Physicians Formula Holdings, Inc. (a)(l) | 413,870 | $ | 3,869,685 | ||
| Strayer Education, Inc. (l) | 18,160 | 3,796,711 | |||
| $ | 30,293,441 | ||||
| Electrical Equipment – 1.6% | |||||
| Baldor Electric Co. | 140,940 | $ | 4,930,081 | ||
| Itron, Inc. (a)(l) | 56,330 | 5,540,056 | |||
| $ | 10,470,137 | ||||
| Electronics – 5.4% | |||||
| ARM Holdings PLC | 5,938,890 | $ | 10,012,728 | ||
| Atheros Communications, Inc. (a)(l) | 92,250 | 2,767,500 | |||
| Hittite Microwave Corp. (a)(l) | 319,440 | 11,378,453 | |||
| Intersil Corp., “A” (l) | 259,550 | 6,312,256 | |||
| Mellanox Technologies Ltd. (a)(l) | 380,260 | 5,148,720 | |||
| $ | 35,619,657 | ||||
| Energy – Independent – 1.4% | |||||
| EXCO Resources, Inc. (a)(l) | 119,490 | $ | 4,410,376 | ||
| Goodrich Petroleum Corp. (a)(l) | 58,790 | 4,874,867 | |||
| $ | 9,285,243 | ||||
| Engineering – Construction – 5.9% | |||||
| Foster Wheeler Ltd. (a)(l) | 80,820 | $ | 5,911,983 | ||
| KHD Humboldt Wedag International Ltd. (a) | 193,440 | 6,099,163 | |||
| North American Energy Partners, Inc. (a) | 718,085 | 15,568,083 | |||
| Quanta Services, Inc. (a)(l) | 340,744 | 11,336,553 | |||
| $ | 38,915,782 | ||||
| Food & Beverages – 0.4% | |||||
| Hain Celestial Group, Inc. (a)(l) | 124,190 | $ | 2,915,981 | ||
| Food & Drug Stores – 0.2% | |||||
| Susser Holdings Corp. (a)(l) | 131,429 | $ | 1,272,233 | ||
| Forest & Paper Products – 2.2% | |||||
| Louisiana-Pacific Corp. (l) | 761,000 | $ | 6,460,890 | ||
| Universal Forest Products, Inc. (l) | 275,621 | 8,257,605 | |||
| $ | 14,718,495 | ||||
| Furniture & Appliances – 0.4% | |||||
| TiVo, Inc. (a)(l) | 378,880 | $ | 2,337,690 | ||
| Gaming & Lodging – 2.4% | |||||
| Morgans Hotel Group Co. (a)(l) | 397,720 | $ | 4,096,516 | ||
| Pinnacle Entertainment, Inc. (a)(l) | 521,320 | 5,468,647 | |||
| WMS Industries, Inc. (a)(l) | 203,735 | 6,065,191 | |||
| $ | 15,630,354 | ||||
| General Merchandise – 1.8% | |||||
| 99 Cents Only Stores (a)(l) | 746,450 | $ | 4,926,570 | ||
| Stage Stores, Inc. (l) | 596,189 | 6,957,526 | |||
| $ | 11,884,096 | ||||
| Insurance – 0.2% | |||||
| Ehealth, Inc. (a)(l) | 76,760 | $ | 1,355,582 | ||
4
Table of Contents
Portfolio of Investments (unaudited) – continued
| Issuer | Shares/Par | Value ($) | |||
| COMMON STOCKS – continued | |||||
| Internet – 2.7% | |||||
| Dealertrack Holdings, Inc. (a)(l) | 320,437 | $ | 4,521,366 | ||
| Omniture, Inc. (a)(l) | 191,730 | 3,560,426 | |||
| TechTarget, Inc. (a) | 712,151 | 7,520,315 | |||
| Vocus, Inc. (a)(l) | 77,330 | 2,487,706 | |||
| $ | 18,089,813 | ||||
| Leisure & Toys – 0.8% | |||||
| THQ, Inc. (a)(l) | 243,959 | $ | 4,942,609 | ||
| Machinery & Tools – 3.9% | |||||
| Bucyrus International, Inc., “A” (l) | 55,600 | $ | 4,059,912 | ||
| Colfax Corp. (a) | 241,530 | 6,059,988 | |||
| Polypore International, Inc. (a)(l) | 400,520 | 10,145,172 | |||
| Ritchie Bros. Auctioneers, Inc. | 198,850 | 5,394,801 | |||
| $ | 25,659,873 | ||||
| Medical & Health Technology & Services – 6.1% | |||||
| Athena Health, Inc. (a)(l) | 68,570 | $ | 2,109,213 | ||
| Genoptix, Inc. (a)(l) | 42,780 | 1,349,709 | |||
| Healthcare Services Group, Inc. (l) | 376,040 | 5,719,568 | |||
| IDEXX Laboratories, Inc. (a)(l) | 290,156 | 14,142,203 | |||
| Medassets, Inc. (a)(l) | 264,270 | 4,505,804 | |||
| MWI Veterinary Supply, Inc. (a)(l) | 383,436 | 12,695,566 | |||
| $ | 40,522,063 | ||||
| Medical Equipment – 10.5% | |||||
| ABIOMED, Inc. (a)(l) | 513,020 | $ | 9,106,105 | ||
| Advanced Medical Optics, Inc. (a)(l) | 282,300 | 5,290,302 | |||
| Align Technology, Inc. (a)(l) | 617,180 | 6,474,218 | |||
| AngioDynamics, Inc. (a)(l) | 198,517 | 2,703,802 | |||
| AtriCure, Inc. (a)(l) | 264,400 | 2,852,876 | |||
| Conceptus, Inc. (a)(l) | 527,040 | 9,744,970 | |||
| Cooper Cos., Inc. (l) | 177,520 | 6,594,868 | |||
| Dexcom, Inc. (a)(l) | 355,020 | 2,144,321 | |||
| Immucor, Inc. (a) | 180,627 | 4,674,627 | |||
| Insulet Corp. (a)(l) | 256,210 | 4,030,183 | |||
| NxStage Medical, Inc. (a)(l) | 952,060 | 3,655,910 | |||
| ResMed, Inc. (a) | 99,700 | 3,563,278 | |||
| Thoratec Corp. (a)(l) | 487,880 | 8,484,233 | |||
| $ | 69,319,693 | ||||
| Metals & Mining – 1.5% | |||||
| Century Aluminum Co. (a)(l) | 151,250 | $ | 10,056,613 | ||
| Network & Telecom – 3.3% | |||||
| Cavium Networks, Inc. (a)(l) | 177,320 | $ | 3,723,720 | ||
| NICE Systems Ltd., ADR (a) | 391,230 | 11,568,671 | |||
| Polycom, Inc. (a)(l) | 210,920 | 5,138,011 | |||
| Sonus Networks, Inc. (a)(l) | 482,330 | 1,649,569 | |||
| $ | 22,079,971 | ||||
| Oil Services – 9.0% | |||||
| Cal Dive International, Inc. (a)(l) | 427,720 | $ | 6,112,119 | ||
| Dresser-Rand Group, Inc. (a)(l) | 267,940 | 10,476,454 | |||
| Dril-Quip, Inc. (a)(l) | 59,370 | 3,740,310 | |||
| Exterran Holdings, Inc. (a)(l) | 135,140 | 9,661,159 | |||
| Helix Energy Solutions Group, Inc. (a)(l) | 229,220 | 9,544,721 | |||
| Nabors Industries Ltd. (a)(l) | 167,190 | 8,230,764 | |||
| Issuer | Shares/Par | Value ($) | |||
| COMMON STOCKS – continued | |||||
| Oil Services – continued | |||||
| Natural Gas Services Group, Inc. (a)(l) | 110,850 | $ | 3,378,708 | ||
| Oceaneering International, Inc. (a)(l) | 108,790 | 8,382,270 | |||
| $ | 59,526,505 | ||||
| Other Banks & Diversified Financials – 0.8% | |||||
| East West Bancorp, Inc. (l) | 134,960 | $ | 952,818 | ||
| Signature Bank (a)(l) | 114,080 | 2,938,701 | |||
| Sovereign Bancorp, Inc. | 224,280 | 1,650,701 | |||
| $ | 5,542,220 | ||||
| Personal Computers & Peripherals – 2.3% | |||||
| Nuance Communications, Inc. (a) | 651,854 | $ | 10,214,552 | ||
| Synaptics, Inc. (a)(l) | 133,090 | 5,021,486 | |||
| $ | 15,236,038 | ||||
| Pharmaceuticals – 0.6% | |||||
| Cadence Pharmaceuticals, Inc. (a)(l) | 199,740 | $ | 1,216,417 | ||
| Genomma Lab Internacional SA (a) | 200,200 | 308,715 | |||
| Inspire Pharmaceuticals, Inc. (a)(l) | 304,890 | 1,304,929 | |||
| Synta Pharmaceuticals Corp. (a)(l) | 156,700 | 955,870 | |||
| $ | 3,785,931 | ||||
| Printing & Publishing – 0.9% | |||||
| InnerWorkings, Inc. (a)(l) | 466,950 | $ | 5,584,722 | ||
| Real Estate – 0.6% | |||||
| Jones Lang LaSalle, Inc., REIT (l) | 65,530 | $ | 3,944,251 | ||
| Restaurants – 4.4% | |||||
| McCormick & Schmick’s Seafood Restaurant, Inc. (a)(h)(l) | 854,530 | $ | 8,237,669 | ||
| Panera Bread Co., “A” (a)(l) | 122,420 | 5,663,149 | |||
| Peet’s Coffee & Tea, Inc. (a)(l) | 224,440 | 4,448,401 | |||
| Red Robin Gourmet Burgers, Inc. (a)(l) | 217,740 | 6,040,108 | |||
| Texas Roadhouse, Inc., “A” (a)(l) | 484,250 | 4,343,723 | |||
| $ | 28,733,050 | ||||
| Special Products & Services – 1.0% | |||||
| Heckmann Corp. (a)(l) | 752,670 | $ | 6,743,923 | ||
| Specialty Stores – 5.1% | |||||
| Citi Trends, Inc. (a)(l) | 476,750 | $ | 10,803,155 | ||
| Ctrip.com International Ltd., ADR | 110,040 | 5,037,631 | |||
| Dick’s Sporting Goods, Inc. (a)(l) | 204,450 | 3,626,943 | |||
| Lumber Liquidators, Inc. (a)(l) | 492,017 | 6,396,221 | |||
| Monro Muffler Brake, Inc. | 205,776 | 3,187,470 | |||
| Zumiez, Inc. (a)(l) | 261,860 | 4,341,639 | |||
| $ | 33,393,059 | ||||
| Telephone Services – 0.7% | |||||
| Global Crossing Ltd. (a)(l) | 271,750 | $ | 4,875,195 | ||
| Trucking – 2.1% | |||||
| J.B. Hunt Transport Services, Inc. (l) | 182,030 | $ | 6,057,958 | ||
| Old Dominion Freight Lines, Inc. (a)(l) | 250,720 | 7,526,607 | |||
| $ | 13,584,565 | ||||
| Total Common Stocks (Identified Cost, $692,107,945) | $ | 657,806,964 | |||
5
Table of Contents
Portfolio of Investments (unaudited) – continued
| Issuer | Strike Price | First Exercise | Shares/Par | Value ($) | |||||||
| WARRANTS – 0.0% | |||||||||||
| Alcoholic Beverages – 0.0% | |||||||||||
| Castle Brands, Inc. (1 share for 1 warrant) (Identified Cost, $166,679) (a)(z) | $ | 6.57 | 5/08/07 | 118,680 | $ | 10,872 | |||||
| SHORT-TERM OBLIGATIONS – 0.4% | |||||||||||
| Toyota Motor Credit Corp., 2.57%, due 7/01/08, at Amortized Cost and Value (y) | $ | 2,550,000 | $ | 2,550,000 | |||||||
| Issuer | Shares/Par | Value ($) | ||||
| COLLATERAL FOR SECURITIES LOANED – 23.4% | ||||||
| Navigator Securities Lending Prime Portfolio, at Cost and Net Asset Value | 154,705,861 | $ | 154,705,861 | |||
| Total Investments (Identified Cost, $849,530,485) | $ | 815,073,697 | ||||
| OTHER ASSETS, LESS LIABILITIES – (23.5)% | (154,920,761 | ) | ||||
| Net Assets – 100.0% | $ | 660,152,936 | ||||
| (a) | Non-income producing security. |
| (h) | Affiliated issuers are those in which the fund’s holdings of an issuer represent 5% or more of the outstanding voting securities of the issuer. |
| (l) | All or a portion of this security is on loan. |
| (y) | The rate shown represents an annualized yield at time of purchase. |
| (z) | Restricted securities are not registered under the Securities Act of 1933 and are subject to legal restrictions on resale. These securities generally may be resold in transactions exempt from registration or to the public if the securities are subsequently registered. Disposal of these securities may involve time-consuming negotiations and prompt sale at an acceptable price may be difficult. The fund holds the following restricted securities: |
| Restricted Securities | Acquisition Date | Cost | Current Market Value | |||
| Castle Brands, Inc. (Warrants) | 4/18/07 | $166,679 | $10,872 | |||
| % of Net Assets | 0.0% |
The following abbreviations are used in this report and are defined:
| ADR | American Depository Receipt |
| REIT | Real Estate Investment Trust |
See Notes to Financial Statements
6
Table of Contents
FINANCIAL STATEMENTS | STATEMENT OF ASSETS AND LIABILITIES (unaudited)
This statement represents your fund’s balance sheet, which details the assets and liabilities comprising the total value of the fund.
At 6/30/08 | |||||
Assets | |||||
Investments – | |||||
Non-affiliated issuers, at value (identified cost, $837,557,639) | $806,836,028 | ||||
Other affiliated issuers, at value (identified cost, $11,972,846) | 8,237,669 | ||||
Total investments, at value, including $151,165,486 of securities on loan (identified cost, $849,530,485) | $815,073,697 | ||||
Cash | $829,412 | ||||
Receivable for investments sold | 19,035,653 | ||||
Receivable for fund shares sold | 36,775 | ||||
Interest and dividends receivable | 247,272 | ||||
Other assets | 5,176 | ||||
Total assets | $835,227,985 | ||||
Liabilities | |||||
Payable for investments purchased | $18,995,775 | ||||
Payable for fund shares reacquired | 1,135,732 | ||||
Collateral for securities loaned, at value (c) | 154,705,861 | ||||
Payable to affiliates | |||||
Management fee | 66,132 | ||||
Shareholder servicing costs | 870 | ||||
Distribution fees | 5,569 | ||||
Administrative services fee | 1,015 | ||||
Payable for independent trustees’ compensation | 2,470 | ||||
Accrued expenses and other liabilities | 161,625 | ||||
Total liabilities | $175,075,049 | ||||
Net assets | $660,152,936 | ||||
Net assets consist of | |||||
Paid-in capital | $736,081,931 | ||||
Unrealized appreciation (depreciation) on investments and translation of assets and liabilities in foreign currencies | (34,456,834 | ) | |||
Accumulated distributions in excess of net realized gain on investments and foreign currency transactions | (40,275,738 | ) | |||
Accumulated net investment loss | (1,196,423 | ) | |||
Net assets | $660,152,936 | ||||
Shares of beneficial interest outstanding | 53,336,998 | ||||
Initial Class shares | |||||
Net assets | $460,226,735 | ||||
Shares outstanding | 36,898,969 | ||||
Net asset value per share | $12.47 | ||||
Service Class shares | |||||
Net assets | $199,926,201 | ||||
Shares outstanding | 16,438,029 | ||||
Net asset value per share | $12.16 |
| (c) | Non-cash collateral is not included. |
See Notes to Financial Statements
7
Table of Contents
FINANCIAL STATEMENTS | STATEMENT OF OPERATIONS (unaudited)
This statement describes how much your fund earned in investment income and accrued in expenses. It also describes any gains and/or losses generated by fund operations.
Six months ended 6/30/08 | ||||||
Net investment loss | ||||||
Income | ||||||
Dividends | $1,325,095 | |||||
Income on securities loaned | 1,092,831 | |||||
Interest | 51,684 | |||||
Foreign taxes withheld | (5,400 | ) | ||||
Total investment income | $2,464,210 | |||||
Expenses | ||||||
Management fee | $3,114,520 | |||||
Distribution fees | 265,104 | |||||
Shareholder servicing costs | 62,891 | |||||
Administrative services fee | 47,642 | |||||
Independent trustees’ compensation | 10,087 | |||||
Custodian fee | 72,348 | |||||
Shareholder communications | 49,826 | |||||
Auditing fees | 22,938 | |||||
Legal fees | 5,765 | |||||
Miscellaneous | 21,442 | |||||
Total expenses | $3,672,563 | |||||
Fees paid indirectly | (9,895 | ) | ||||
Reduction of expenses by investment adviser | (2,035 | ) | ||||
Net expenses | $3,660,633 | |||||
Net investment loss | $(1,196,423 | ) | ||||
Realized and unrealized gain (loss) on investments | ||||||
Realized gain (loss) (identified cost basis) | ||||||
Investment transactions: | ||||||
Non-affiliated issuers | $(25,539,953 | ) | ||||
Other affiliated issuers | (596,858 | ) | ||||
Foreign currency transactions | (2,184 | ) | ||||
Net realized gain (loss) on investments and foreign currency transactions | $(26,138,995 | ) | ||||
Change in unrealized appreciation (depreciation) | ||||||
Investments | $(35,239,997 | ) | ||||
Translation of assets and liabilities in foreign currencies | (29 | ) | ||||
Net unrealized gain (loss) on investments and foreign currency translation | $(35,240,026 | ) | ||||
Net realized and unrealized gain (loss) on investments and foreign currency | $(61,379,021 | ) | ||||
Change in net assets from operations | $(62,575,444 | ) |
See Notes to Financial Statements
8
Table of Contents
FINANCIAL STATEMENTS | STATEMENTS OF CHANGES IN NET ASSETS
These statements describe the increases and/or decreases in net assets resulting from operations, any distributions, and any shareholder transactions.
| Six months ended 6/30/08 | | Year ended 12/31/07 | | |||
Change in net assets | (unaudited | ) | ||||
From operations | ||||||
Net investment loss | $(1,196,423 | ) | $(4,848,195 | ) | ||
Net realized gain (loss) on investments and foreign currency transactions | (26,138,995 | ) | 127,045,561 | |||
Net unrealized gain (loss) on investments and foreign currency translation | (35,240,026 | ) | (100,856,351 | ) | ||
Change in net assets from operations | $(62,575,444 | ) | $21,341,015 | |||
Distributions declared to shareholders | ||||||
From net realized gain on investments | ||||||
Initial Class | $(86,808,423 | ) | $(38,920,995 | ) | ||
Service Class | (39,007,565 | ) | (20,313,905 | ) | ||
Total distributions declared to shareholders | $(125,815,988 | ) | $(59,234,900 | ) | ||
Change in net assets from fund share transactions | $85,308,279 | $(17,702,823 | ) | |||
Total change in net assets | $(103,083,153 | ) | $(55,596,708 | ) | ||
Net assets | ||||||
At beginning of period | 763,236,089 | 818,832,797 | ||||
At end of period (including accumulated net investment loss of $1,196,423 and | $660,152,936 | $763,236,089 |
See Notes to Financial Statements
9
Table of Contents
FINANCIAL STATEMENTS | FINANCIAL HIGHLIGHTS
The financial highlights table is intended to help you understand the fund’s financial performance for the semiannual period and the past 5 fiscal years of a particular share class. Certain information reflects financial results for a single fund share. The total returns in the table represent the rate by which an investor would have earned (or lost) on an investment in the fund share class (assuming reinvestment of all distributions) held for the entire period.
| Initial Class | Six months ended 6/30/08 | Years ended 12/31 | ||||||||||||||||
| 2007 | 2006 | 2005 | 2004 | 2003 | ||||||||||||||
| (unaudited) | ||||||||||||||||||
Net asset value, beginning of period | $16.63 | $17.42 | $15.65 | $14.87 | $13.96 | $10.44 | ||||||||||||
Income (loss) from investment operations | ||||||||||||||||||
Net investment loss (d) | $(0.02 | ) | $(0.09 | ) | $(0.10 | ) | $(0.09 | ) | $(0.09 | ) | $(0.08 | ) | ||||||
Net realized and unrealized gain (loss) on | (1.32 | ) | 0.58 | 2.16 | 0.87 | 1.00 | 3.60 | |||||||||||
Total from investment operations | $(1.34 | ) | $0.49 | $2.06 | $0.78 | $0.91 | $3.52 | |||||||||||
Less distributions declared to shareholders | ||||||||||||||||||
From net realized gain on investments | $(2.82 | ) | $(1.28 | ) | $(0.29 | ) | $— | $— | $— | |||||||||
Net asset value, end of period | $12.47 | $16.63 | $17.42 | $15.65 | $14.87 | $13.96 | ||||||||||||
Total return (%) (k)(r)(s) | (8.07 | )(n) | 2.52 | 13.22 | 5.25 | 6.52 | 33.72 | |||||||||||
| Ratios (%) (to average net assets) and Supplemental data: | ||||||||||||||||||
Expenses before expense reductions (f) | 0.99 | (a) | 1.01 | 1.03 | 1.06 | 1.01 | 1.04 | |||||||||||
Expenses after expense reductions (f) | 0.99 | (a) | 1.01 | 1.03 | 1.06 | 1.01 | N/A | |||||||||||
Net investment loss | (0.27 | )(a) | (0.50 | ) | (0.63 | ) | (0.61 | ) | (0.67 | ) | (0.62 | ) | ||||||
Portfolio turnover | 60 | 95 | 106 | 132 | 134 | 88 | ||||||||||||
Net assets at end of period (000 Omitted) | $460,227 | $520,726 | $533,322 | $406,190 | $380,100 | $290,364 | ||||||||||||
See Notes to Financial Statements
10
Table of Contents
Financial Highlights – continued
| Service Class | Six months | Years ended 12/31 | ||||||||||||||||
| 2007 | 2006 | 2005 | 2004 | 2003 | ||||||||||||||
| (unaudited) | ||||||||||||||||||
Net asset value, beginning of period | $16.31 | $17.15 | $15.45 | $14.71 | $13.85 | $10.38 | ||||||||||||
Income (loss) from investment operations | ||||||||||||||||||
Net investment loss (d) | $(0.04 | ) | $(0.13 | ) | $(0.14 | ) | $(0.12 | ) | $(0.13 | ) | $(0.11 | ) | ||||||
Net realized and unrealized gain (loss) on | (1.29 | ) | 0.57 | 2.13 | 0.86 | 0.99 | 3.58 | |||||||||||
Total from investment operations | $(1.33 | ) | $0.44 | $1.99 | $0.74 | $0.86 | $3.47 | |||||||||||
Less distributions declared to shareholders | ||||||||||||||||||
From net realized gain on investments | $(2.82 | ) | $(1.28 | ) | $(0.29 | ) | $— | $— | $— | |||||||||
Net asset value, end of period | $12.16 | $16.31 | $17.15 | $15.45 | $14.71 | $13.85 | ||||||||||||
Total return (%) (k)(r)(s) | (8.18 | )(n) | 2.25 | 12.93 | 5.03 | 6.21 | 33.43 | |||||||||||
| Ratios (%) (to average net assets) and Supplemental data: | ||||||||||||||||||
Expenses before expense reductions (f) | 1.24 | (a) | 1.26 | 1.28 | 1.30 | 1.26 | 1.29 | |||||||||||
Expenses after expense reductions (f) | 1.24 | (a) | 1.26 | 1.28 | 1.30 | 1.26 | N/A | |||||||||||
Net investment loss | (0.52 | )(a) | (0.75 | ) | (0.88 | ) | (0.86 | ) | (0.92 | ) | (0.88 | ) | ||||||
Portfolio turnover | 60 | 95 | 106 | 132 | 134 | 88 | ||||||||||||
Net assets at end of period (000 Omitted) | $199,926 | $242,510 | $285,511 | $296,399 | $386,049 | $349,012 | ||||||||||||
| (a) | Annualized. |
| (d) | Per share data are based on average shares outstanding. |
| (f) | Ratios do not reflect reductions from fees paid indirectly, if applicable. |
| (k) | The total return does not reflect expenses that apply to separate accounts. Inclusion of these charges would reduce the total return figures for all periods shown. |
| (n) | Not annualized. |
| (r) | Certain expenses have been reduced without which performance would have been lower. |
| (s) | From time to time the fund may receive proceeds from litigation settlements, without which performance would be lower. |
See Notes to Financial Statements
11
Table of Contents
NOTES TO FINANCIAL STATEMENTS (unaudited)
| (1) | Business and Organization |
MFS New Discovery Series (the fund) is a series of MFS Variable Insurance Trust (the trust). The trust is organized as a Massachusetts business trust and is registered under the Investment Company Act of 1940, as amended, as an open-end management investment company. The shareholders of each series of the trust are separate accounts of insurance companies, which offer variable annuity and/or life insurance products, and qualified retirement and pension plans.
| (2) | Significant Accounting Policies |
General – The preparation of financial statements in conformity with U.S. generally accepted accounting principles requires management to make estimates and assumptions that affect the reported amounts of assets and liabilities, and disclosure of contingent assets and liabilities at the date of the financial statements and the reported amounts of revenues and expenses during the reporting period. Actual results could differ from those estimates. The fund can invest in foreign securities, including securities of emerging market issuers. Investments in foreign securities are vulnerable to the effects of changes in the relative values of the local currency and the U.S. dollar and to the effects of changes in each country’s legal, political, and economic environment. The markets of emerging markets countries are generally more volatile than the markets of developed countries with more mature economies. All of the risks of investing in foreign securities previously described are heightened when investing in emerging markets countries.
In March 2008, FASB Statement No. 161, Disclosures about Derivative Instruments and Hedging Activities (the “Standard”) was issued, and is effective for financial statements issued for fiscal years and interim periods beginning after November 15, 2008. This Standard provides enhanced disclosures about the fund’s use of and accounting for derivative instruments and the effect of derivative instruments on the fund’s results of operations and financial position. Management is evaluating the application of the Standard to the fund, and has not at this time determined the impact, if any, resulting from the adoption of this Standard on the fund’s financial statements.
Investment Valuations – Equity securities, including restricted equity securities, are generally valued at the last sale or official closing price as reported by an independent pricing service on the market or exchange on which they are primarily traded. For securities for which there were no sales reported that day, equity securities are generally valued at the last quoted daily bid quotation as reported by an independent pricing service on the market or exchange on which they are primarily traded. For securities held short for which there were no sales reported for the day, the position is generally valued at the last quoted daily ask quotation as reported by an independent pricing service on the market or exchange on which such securities are primarily traded. Short-term instruments with a maturity at issuance of 60 days or less may be valued at amortized cost, which approximates market value. Securities and other assets generally valued on the basis of information from an independent pricing service may also be valued at a broker-dealer bid quotation. The values of foreign securities and other assets and liabilities expressed in foreign currencies are converted to U.S. dollars using the mean of bid and asked prices for rates reported by an independent pricing service.
The Board of Trustees has delegated primary responsibility for determining or causing to be determined the value of the fund’s investments (including any fair valuation) to the adviser pursuant to valuation policies and procedures approved by the Board. If the adviser determines that reliable market quotations are not readily available, investments are valued at fair value as determined in good faith by the adviser in accordance with such procedures under the oversight of the Board of Trustees. Under the fund’s valuation policies and procedures, market quotations are not considered to be readily available for most types of debt instruments and floating rate loans and many types of derivatives. These investments are generally valued at fair value based on information from independent pricing services. In addition, investments may be valued at fair value if the adviser determines that an investment’s value has been materially affected by events occurring after the close of the exchange or market on which the investment is principally traded (such as foreign exchange or market) and prior to the determination of the fund’s net asset value, or after the halting of trading of a specific security where trading does not resume prior to the close of the exchange or market on which the security is principally traded. Events that occur on a frequent basis after foreign markets close (such as developments in foreign markets and significant movements in the U.S. markets) and prior to the determination of the fund’s net asset value may be deemed to have a material affect on the value of securities traded in foreign markets. Accordingly, the fund’s foreign equity securities may often be valued at fair value. The adviser may rely on independent pricing services or other information (such as the correlation with price movements of similar securities in the same or other markets; the type, cost and investment characteristics of the security; the business and financial condition of the issuer; and trading and other market data) to assist in determining whether to fair value and at what value to fair value an investment. The value of an investment for purposes of calculating the fund’s net asset value can differ depending on the source and method used to determine value. When fair valuation is used, the value of investments used to determine the fund’s net asset value may differ from quoted or published prices for the same investments.
12
Table of Contents
Notes to Financial Statements (unaudited) – continued
The fund adopted FASB Statement No. 157, Fair Value Measurements (the “Statement”) in this reporting period. This Statement provides a single definition of fair value, a hierarchy for measuring fair value and expanded disclosures about fair value measurements.
Various inputs are used in determining the value of the fund’s assets or liabilities carried at market value. These inputs are categorized into three broad levels. Level 1 includes quoted prices in active markets for identical assets or liabilities. Level 2 includes other significant observable market-based inputs (including quoted prices for similar securities, interest rates, prepayment speed, and credit risk). Level 3 includes unobservable inputs, which may include the adviser’s own assumptions in determining the fair value of investments. Other financial instruments are derivative instruments not reflected in total investments, such as futures, forwards, swap contracts and written options, which are valued at the unrealized appreciation/depreciation on the instrument. The following is a summary of the levels used as of June 30, 2008 in valuing the fund’s assets or liabilities carried at market value:
| Level 1 | Level 2 | Level 3 | Total | |||||
| Investments in Securities | $647,794,236 | $167,279,461 | $— | $815,073,697 | ||||
| Other Financial Instruments | $— | $— | $— | $— |
Repurchase Agreements – The fund may enter into repurchase agreements with institutions that the fund’s investment adviser has determined are creditworthy. Each repurchase agreement is recorded at cost. The fund requires that the securities collateral in a repurchase transaction be transferred to a custodian in a manner sufficient to enable the fund to obtain those securities in the event of a default under the repurchase agreement. The fund monitors, on a daily basis, the value of the collateral to ensure that its value, including accrued interest, is greater than amounts owed to the fund under each such repurchase agreement. The fund and other funds managed by Massachusetts Financial Services Company (MFS), may utilize a joint trading account for the purpose of entering into one or more repurchase agreements.
Foreign Currency Translation – Purchases and sales of foreign investments, income, and expenses are converted into U.S. dollars based upon currency exchange rates prevailing on the respective dates of such transactions. Gains and losses attributable to foreign currency exchange rates on sales of securities are recorded for financial statement purposes as net realized gains and losses on investments. Gains and losses attributable to foreign exchange rate movements on income and expenses are recorded for financial statement purposes as foreign currency transaction gains and losses. That portion of both realized and unrealized gains and losses on investments that results from fluctuations in foreign currency exchange rates is not separately disclosed.
Security Loans – State Street Bank and Trust Company (“State Street”), as lending agent, may loan the securities of the fund to certain qualified institutions (the “Borrowers”) approved by the fund. The loans are collateralized at all times by cash and/or U.S. Treasury and federal agency obligations in an amount at least equal to the market value of the securities loaned. State Street provides the fund with indemnification against Borrower default. The fund bears the risk of loss with respect to the investment of cash collateral. On loans collateralized by cash, the cash collateral is invested in a money market fund or short-term securities. A portion of the income generated upon investment of the collateral is remitted to the Borrowers, and the remainder is allocated between the fund and the lending agent. On loans collateralized by U.S. Treasury and/or federal agency obligations, a fee is received from the Borrower, and is allocated between the fund and the lending agent. Net income from securities lending is included in interest income on the Statement of Operations. Net income from securities lending is separately reported on the Statement of Operations. The dividend and interest income earned on the securities loaned is accounted for in the same manner as other dividend and interest income.
At June 30, 2008, the value of securities loaned was $151,165,486. These loans were collateralized by cash of $154,705,861 and U.S. Treasury obligations of $402,491.
Indemnifications – Under the fund’s organizational documents, its officers and trustees may be indemnified against certain liabilities and expenses arising out of the performance of their duties to the fund. Additionally, in the normal course of business, the fund enters into agreements with service providers that may contain indemnification clauses. The fund’s maximum exposure under these agreements is unknown as this would involve future claims that may be made against the fund that have not yet occurred.
Investment Transactions and Income – Investment transactions are recorded on the trade date. Interest income is recorded on the accrual basis. All premium and discount is amortized or accreted for financial statement purposes in accordance with U.S. generally accepted accounting principles. Dividends received in cash are recorded on the ex-dividend date. Certain dividends from foreign securities will be recorded when the fund is informed of the dividend if such information is obtained subsequent to the ex-dividend date. Dividend and interest payments received in additional securities are recorded on the ex-dividend or ex-interest date in an amount equal to the value of the security on such date.
13
Table of Contents
Notes to Financial Statements (unaudited) – continued
The fund may receive proceeds from litigation settlements. Any proceeds received from litigation involving portfolio holdings are reflected in the Statement of Operations in realized gain/loss if the security has been disposed of by the fund or in unrealized gain/loss if the security is still held by the fund. Any other proceeds from litigation not related to portfolio holdings are reflected as other income in the Statement of Operations.
Fees Paid Indirectly – The fund’s custody fee may be reduced according to an arrangement that measures the value of cash deposited with the custodian by the fund. This amount, for the six months ended June 30, 2008, is shown as a reduction of total expenses on the Statement of Operations.
Tax Matters and Distributions – The fund intends to qualify as a regulated investment company, as defined under Subchapter M of the Internal Revenue Code, and to distribute all of its taxable income, including realized capital gains. As a result, no provision for federal income tax is required. The fund adopted the provisions of FASB Interpretation No. 48, Accounting for Uncertainty in Income Taxes (“the Interpretation”). The Interpretation prescribes a minimum threshold for financial statement recognition of the benefit of a tax position taken or expected to be taken in a tax return. There was no impact resulting from the adoption of this Interpretation on the fund’s financial statements. Each of the fund’s federal tax returns for the prior three fiscal years remains subject to examination by the Internal Revenue Service. It is the fund’s policy to record interest and penalty charges on underpaid taxes associated with its tax positions as interest expense and miscellaneous expense, respectively. No such charges were recorded in the current financial statements. Foreign taxes, if any, have been accrued by the fund in the accompanying financial statements.
Distributions to shareholders are recorded on the ex-dividend date. Income and capital gain distributions are determined in accordance with income tax regulations, which may differ from U.S. generally accepted accounting principles. Certain capital accounts in the financial statements are periodically adjusted for permanent differences in order to reflect their tax character. These adjustments have no impact on net assets or net asset value per share. Temporary differences which arise from recognizing certain items of income, expense, gain or loss in different periods for financial statement and tax purposes will reverse at some time in the future. Distributions in excess of net investment income or net realized gains are temporary overdistributions for financial statement purposes resulting from differences in the recognition or classification of income or distributions for financial statement and tax purposes.
Book/tax differences primarily relate to net operating losses and wash sale loss deferrals.
The tax character of distributions made during the current period will be determined at fiscal year end. The tax character of distributions declared to shareholders is as follows:
| 12/31/07 | ||
| Ordinary income (including any short-term capital gains) | $18,898,749 | |
| Long-term capital gain | 40,336,151 | |
| $59,234,900 |
The federal tax cost and the tax basis components of distributable earnings were as follows:
| As of 6/30/08 | |||
| Cost of investments | $859,366,757 | ||
| Gross appreciation | 56,236,459 | ||
| Gross depreciation | (100,529,519 | ) | |
| Net unrealized appreciation (depreciation) | $(44,293,060 | ) | |
| As of 12/31/07 | |||
| Undistributed ordinary income | $32,123,718 | ||
| Undistributed long-term capital gain | 93,691,082 | ||
| Post-October capital loss deferral | (1,812,285 | ) | |
| Other temporary differences | (2,487,015 | ) | |
| Net unrealized appreciation (depreciation) | (9,053,063 | ) | |
The aggregate cost above includes prior fiscal year end tax adjustments.
Multiple Classes of Shares of Beneficial Interest – The fund offers multiple classes of shares, which differ in their respective distribution fees. The fund’s income, realized and unrealized gain (loss), and common expenses are allocated to shareholders based on daily net assets of each class, without distinction between share classes. Dividends are declared separately for each class. Differences in per share dividend rates are generally due to differences in separate class expenses.
14
Table of Contents
Notes to Financial Statements (unaudited) – continued
| (3) | Transactions with Affiliates |
Investment Adviser – The fund has an investment advisory agreement with Massachusetts Financial Services Company (MFS) to provide overall investment management and related administrative services and facilities to the fund. The management fee is computed daily and paid monthly at an annual rate of 0.90% of the fund’s average daily net assets.
The investment adviser has agreed in writing to reduce its management fee to 0.80% of average daily net assets in excess of $1 billion. This written agreement may be rescinded only upon consent of the fund’s Board of Trustees. For the six months ended June 30, 2008, the fund’s average daily net assets did not exceed $1 billion and therefore, the management fee was not reduced.
The management fee incurred for the six months ended June 30, 2008 was equivalent to an annual effective rate of 0.90% of the fund’s average daily net assets.
Distributor – MFS Fund Distributors, Inc. (MFD), a wholly-owned subsidiary of MFS, is the distributor of shares of the series. The Trustees have adopted a distribution plan for the Service Class shares pursuant to Rule 12b-1 under the Investment Company Act of 1940.
The fund’s distribution plan provides that the fund will pay MFD distribution fees equal to 0.25% per annum of its average daily net assets attributable to Service Class shares as partial consideration for services performed and expenses incurred by MFD and financial intermediaries (including participating insurance companies that invest in the fund to fund variable annuity and variable life insurance contracts, sponsors of qualified retirement and pension plans that invest in the fund, and affiliates of these participating insurance companies and plan sponsors) in connection with the sale and distribution of the Service Class shares. MFD may subsequently pay all, or a portion, of the distribution fees to financial intermediaries.
Shareholder Servicing Agent – MFS Service Center, Inc. (MFSC), a wholly-owned subsidiary of MFS, receives a fee from the fund for its services as shareholder servicing agent. For the six months ended June 30, 2008, the fee was $62,891, which equated to 0.0182% annually of the fund’s average daily net assets. MFSC also receives payment from the fund for out-of-pocket expenses paid by MFSC on behalf of the series. For the six months ended June 30, 2008, the fund did not incur any out-of-pocket expenses.
Administrator – MFS provides certain financial, legal, shareholder communications, compliance, and other administrative services to the fund. Under an administrative services agreement, the fund partially reimburses MFS the costs incurred to provide these services. The fund is charged a fixed amount plus a fee based on average daily net assets. The fund’s annual fixed amount is $17,500.
The administrative services fee incurred for the six months ended June 30, 2008 was equivalent to an annual effective rate of 0.0138% of the fund’s average daily net assets.
Trustees’ and Officers’ Compensation – The fund pays compensation to independent trustees in the form of a retainer, attendance fees, and additional compensation to Board and Committee chairpersons. The fund does not pay compensation directly to trustees or officers of the fund who are also officers of the investment adviser, all of whom receive remuneration for their services to the fund from MFS. Certain officers and trustees of the fund are officers or directors of MFS, MFD, and MFSC.
Other – This fund and certain other MFS funds (the funds) have entered into a services agreement (the Agreement) which provides for payment of fees by the funds to Tarantino LLC in return for the provision of services of an Independent Chief Compliance Officer (ICCO) for the funds. The ICCO is an officer of the funds and the sole member of Tarantino LLC. The funds can terminate the Agreement with Tarantino LLC at any time under the terms of the Agreement. For the six months ended June 30, 2008, the fee paid by the fund to Tarantino LLC was $2,056 and is included in miscellaneous expense on the Statement of Operations. MFS has agreed to reimburse the fund for a portion of the payments made by the fund to Tarantino LLC in the amount of $2,035, which is shown as a reduction of total expenses in the Statement of Operations. Additionally, MFS has agreed to bear all expenses associated with office space, other administrative support, and supplies provided to the ICCO.
| (4) | Portfolio Securities |
Purchases and sales of investments, other than U.S. Government securities, purchased option transactions, and short-term obligations, aggregated $420,165,019 and $459,375,860, respectively.
15
Table of Contents
Notes to Financial Statements (unaudited) – continued
| (5) | Shares of Beneficial Interest |
The fund’s Declaration of Trust permits the Trustees to issue an unlimited number of full and fractional shares of beneficial interest. Transactions in fund shares were as follows:
| Six months ended 6/30/08 | Year ended 12/31/07 | |||||||||||
| Shares | Amount | Shares | Amount | |||||||||
| Shares sold | ||||||||||||
Initial Class | 2,183,368 | $33,523,621 | 3,808,365 | $68,062,060 | ||||||||
Service Class | 497,753 | 6,953,467 | 1,147,752 | 19,988,763 | ||||||||
| 2,681,121 | $40,477,088 | 4,956,117 | $88,050,823 | |||||||||
| Shares issued to shareholders in reinvestment of distributions | ||||||||||||
Initial Class | 6,961,381 | $86,808,423 | 2,249,768 | $38,920,995 | ||||||||
Service Class | 3,205,223 | 39,007,565 | 1,194,936 | 20,313,905 | ||||||||
| 10,166,604 | $125,815,988 | 3,444,704 | $59,234,900 | |||||||||
| Shares reacquired | ||||||||||||
Initial Class | (3,554,913 | ) | $(51,188,471 | ) | (5,357,183 | ) | $(93,663,283 | ) | ||||
Service Class | (2,131,561 | ) | (29,796,326 | ) | (4,120,819 | ) | (71,325,263 | ) | ||||
| (5,686,474 | ) | $(80,984,797 | ) | (9,478,002 | ) | $(164,988,546 | ) | |||||
| Net change | ||||||||||||
Initial Class | 5,589,836 | $69,143,573 | 700,950 | $13,319,772 | ||||||||
Service Class | 1,571,415 | 16,164,706 | (1,778,131 | ) | (31,022,595 | ) | ||||||
| 7,161,251 | $85,308,279 | (1,077,181 | ) | $(17,702,823 | ) | |||||||
| (6) | Line of Credit |
The fund and other funds managed by MFS participate in a $1 billion unsecured committed line of credit provided by a syndication of banks under a credit agreement. In addition, the fund and other funds managed by MFS have established uncommitted borrowing arrangements with certain banks. Borrowings may be made for temporary financing needs. Interest is charged to each fund, based on its borrowings, generally at a rate equal to the Federal Reserve funds rate plus 0.30%. In addition, a commitment fee, based on the average daily, unused portion of the committed line of credit, is allocated among the participating funds at the end of each calendar quarter. For the six months ended June 30, 2008, the fund’s commitment fee and interest expense were $1,707 and $0, respectively, and are included in miscellaneous expense on the Statement of Operations.
| (7) | Transactions in Underlying Funds – Affiliated Issuers |
An affiliated issuer may be considered one in which the fund owns 5% or more of the outstanding voting securities, or a company which is under common control. For the purposes of this report, the fund assumes the following to be affiliated issuers:
| Other Affiliated Issuers | Beginning Shares | Acquisitions Shares | Dispositions Shares | Ending Shares | ||||||
| McCormick & Schmick’s Seafood Restaurant, Inc. | 501,476 | 434,854 | (81,800 | ) | 854,530 | |||||
| Other Affiliated Issuers | Realized Gain (Loss) | Capital Gain Distributions | Dividend Income | Ending Value | ||||||
| McCormick & Schmick’s Seafood Restaurant, Inc. | $(596,858 | ) | $— | $— | $8,237,669 | |||||
16
Table of Contents
BOARD REVIEW OF INVESTMENT ADVISORY AGREEMENT
A discussion regarding the Board’s most recent review and renewal of the fund’s Investment Advisory Agreement with MFS will be available on or about November 1, 2008 by clicking on the fund’s name under “Variable Insurance Portfolios - VIT” in the “Products and Performance” section of the MFS Web site (mfs.com).
PROXY VOTING POLICIES AND INFORMATION
A general description of the MFS funds’ proxy voting policies and procedures is available without charge, upon request, by calling 1-800-225-2606, by visiting the Proxy Voting section of mfs.com or by visiting the SEC’s Web site at http://www.sec.gov.
Information regarding how the fund voted proxies relating to portfolio securities during the most recent twelve-month period ended June 30 is available without charge by visiting the Proxy Voting section of mfs.com or by visiting the SEC’s Web site at http://www.sec.gov.
QUARTERLY PORTFOLIO DISCLOSURE
The fund will file a complete schedule of portfolio holdings with the Securities and Exchange Commission (the Commission) for the first and third quarters of each fiscal year on Form N-Q. The fund’s Form N-Q may be reviewed and copied at the:
Public Reference Room
Securities and Exchange Commission
100 F Street, NE, Room 1580
Washington, D.C. 20549
Information on the operation of the Public Reference Room may be obtained by calling the Commission at 1-800-SEC-0330. The fund’s Form N-Q is available on the EDGAR database on the Commission’s Internet Web site at http://www.sec.gov, and copies of this information may be obtained, upon payment of a duplicating fee, by electronic request at the following e-mail address: publicinfo@sec.gov or by writing the Public Reference Section at the above address.
17
Table of Contents
Web site
mfs.com
Account service and literature
Shareholders
1-877-411-3325
9 a.m. to 5 p.m. Eastern Time
Investment professionals
1-800-637-8730
8 a.m. to 5 p.m. Eastern Time
Mailing address
MFS Service Center, Inc.
Attn: Institutional Alliance Services (IAS)
P.O. Box 55824
Boston, MA 02205-5824
Overnight mail
MFS Service Center, Inc.
c/o Boston Financial Data Services
30 Dan Road
Canton, MA 02021-2809

Table of Contents
Table of Contents
| CONTACT INFORMATION | BACK COVER | |||
This report is prepared for the general information of contract owners. It is authorized for distribution to prospective investors only when preceded or accompanied by a current prospectus.
NOT FDIC INSURED Ÿ MAY LOSE VALUE Ÿ NO BANK OR CREDIT UNION GUARANTEE Ÿ NOT A DEPOSIT Ÿ NOT INSURED BY ANY FEDERAL GOVERNMENT AGENCY OR NCUA/NCUSIF
Table of Contents

Dear Contract Owners:
Negative headlines tend to resonate during difficult markets, and we certainly have had more than our share of tough news recently. As a result consumer, and particularly investor, sentiment are at all-time lows. That said, I do think it is helpful to remember there are always silver linings in the storm clouds if you look hard enough.
Through all of the challenges we have faced, there are some positive underlying trends. In the United States, for example, institutional traders and credit market followers are just now showing increasing signs of confidence and are beginning to take on more risk. At the corporate level, earnings continue to be relatively strong as companies have reduced labor costs, controlled inventories, and relied less on debt to finance expansion. More broadly, low interest rates and strong demand for consumer goods and industrial equipment are good signs for the global economy.
While I do not mean to minimize the risks inherent in today’s markets, periods such as these allow the talented fund managers and research analysts we have at MFS® to test their convictions, reevaluate existing positions, and identify new investment ideas. Our investment process also includes a significant risk management component, with constant attention paid to monitoring market risk, so we can do our best to minimize any surprises to your portfolio.
For investors, this is a great time to check in with your advisor and make sure you have a sound investment plan in place — one that can keep your hard-earned money working over the long term through a strategy that involves asset allocation, diversification, and periodic portfolio rebalancing and reviews. A plan tailored to your distinct needs and goals continues to be the best approach to help you take advantage of the inevitable challenges — and opportunities — that present themselves over time.
Respectfully,

Robert J. Manning
Chief Executive Officer and Chief Investment Officer
MFS Investment Management®
August 15, 2008
The opinions expressed in this letter are subject to change, may not be relied upon for investment advice, and no forecasts can be guaranteed.
1
Table of Contents
Portfolio structure (i)

| Fixed income sectors (i) | ||
| High Grade Corporates | 40.6% | |
| Mortgage-Backed Securities | 23.7% | |
| U.S. Treasury Securities | 14.0% | |
| Commercial Mortgage-Backed Securities | 4.8% | |
| High Yield Corporates | 3.5% | |
| Municipal Bonds | 2.4% | |
| Emerging Market Bonds | 2.3% | |
| U.S. Government Agencies | 1.5% | |
| Floating Rate Loans | 0.6% | |
| Asset-Backed Securities | 0.5% | |
| Collateralized Debt Obligations | 0.2% | |
| Non-U.S. Government Bonds (o) | 0.0% |
| Credit quality of bonds (r) | ||
| AAA | 47.0% | |
| AA | 5.3% | |
| A | 11.3% | |
| BBB | 30.5% | |
| BB | 2.8% | |
| B | 2.2% | |
| Not Rated | 0.9% |
| Portfolio facts | ||
| Average Duration (d)(i) | 5.0 | |
| Average Life (i)(m) | 7.7 yrs. | |
| Average Maturity (i)(m) | 14.6 yrs. | |
| Average Credit Quality of Rated Securities (long-term) (a) | A+ | |
| Average Credit Quality of Rated Securities (short-term) (a) | A-1 |
| (a) | The average credit quality of rated securities is based upon a market weighted average of portfolio holdings that are rated by public rating agencies. |
| (d) | Duration is a measure of how much a bond’s price is likely to fluctuate with general changes in interest rates, e.g., if rates rise 1.00%, a bond with a 5-year duration is likely to lose about 5.00% of its value. |
| (i) | For purposes of this presentation, the bond component includes accrued interest amounts and may be positively or negatively impacted by the equivalent exposure from any derivative holdings, if applicable. |
| (m) | The average maturity shown is calculated using the final stated maturity on the portfolio’s holdings without taking into account any holdings which have been pre-refunded or pre-paid to an earlier date or which have a mandatory put date prior to the stated maturity. The average life shown takes into account these earlier dates. |
| (o) | Less than 0.1% |
| (r) | Each security is assigned a rating from Moody’s Investors Service. If not rated by Moody’s, the rating will be that assigned by Standard & Poor’s. Likewise, if not assigned a rating by Standard & Poor’s, it will be based on the rating assigned by Fitch, Inc. For those portfolios that hold a security which is not rated by any of the three agencies, the security is considered Not Rated. Holdings in U.S. Treasuries and government agency mortgage-backed securities, if any, are included in the “AAA”-rating category. Percentages are based on the total market value of investments as of 6/30/08. |
Percentages are based on net assets as of 6/30/08, unless otherwise noted.
The portfolio is actively managed and current holdings may be different.
2
Table of Contents
Fund Expenses Borne by the Contract Holders During the Period,
January 1, 2008 through June 30, 2008
As a contract holder of the fund, you incur ongoing costs, including management fees; distribution (12b-1) fees; and other fund expenses. This example is intended to help you understand your ongoing costs (in dollars) of investing in the fund and to compare these costs with the ongoing costs of investing in other mutual funds.
The example is based on an investment of $1,000 invested at the beginning of the period and held for the entire period January 1, 2008 through June 30, 2008.
Actual Expenses
The first line for each share class in the following table provides information about actual account values and actual expenses. You may use the information in this line, together with the amount you invested, to estimate the expenses that you paid over the period. Simply divide your account value by $1,000 (for example, an $8,600 account value divided by $1,000 = 8.6), then multiply the result by the number in the first line under the heading entitled “Expenses Paid During Period” to estimate the expenses you paid on your account during this period.
Hypothetical Example for Comparison Purposes
The second line for each share class in the following table provides information about hypothetical account values and hypothetical expenses based on the fund’s actual expense ratio and an assumed rate of return of 5% per year before expenses, which is not the fund’s actual return. The hypothetical account values and expenses may not be used to estimate the actual ending account balance or expenses you paid for the period. You may use this information to compare the ongoing costs of investing in the fund and other funds. To do so, compare this 5% hypothetical example with the 5% hypothetical examples that appear in the shareholder reports of the other funds.
Please note that the expenses shown in the table are meant to highlight the fund’s ongoing costs only and do not take into account the fees and expenses imposed under the variable contracts through which your investment in the fund is made. Therefore, the second line for each share class in the table is useful in comparing ongoing costs associated with an investment in vehicles (such as the fund) which fund benefits under variable annuity and variable life insurance contracts and to qualified pension and retirement plans only, and will not help you determine the relative total costs of investing in the fund through variable annuity and variable life insurance contracts. If the fees and expenses imposed under the variable contracts were included, your costs would have been higher.
| Share Class | Annualized Expense Ratio | Beginning Account Value 1/01/08 | Ending Account Value 6/30/08 | Expenses Paid During Period (p) 1/01/08-6/30/08 | ||||||
| Initial Class | Actual | 0.61% | $1,000.00 | $1,006.52 | $3.04 | |||||
| Hypothetical (h) | 0.61% | $1,000.00 | $1,021.83 | $3.07 | ||||||
| Service Class | Actual | 0.86% | $1,000.00 | $1,004.81 | $4.29 | |||||
| Hypothetical (h) | 0.86% | $1,000.00 | $1,020.59 | $4.32 |
| (h) | 5% class return per year before expenses. |
| (p) | Expenses paid is equal to each class’ annualized expense ratio, as shown above, multiplied by the average account value over the period, multiplied by the number of days in the period, divided by the number of days in the year. |
3
Table of Contents
PORTFOLIO OF INVESTMENTS – 6/30/08 (unaudited)
The Portfolio of Investments is a complete list of all securities owned by your fund. It is categorized by broad-based asset classes.
| Issuer | Shares/Par | Value ($) | ||||
| BONDS – 97.2% | ||||||
| Asset Backed & Securitized – 5.4% | ||||||
| ARCap REIT, Inc., CDO, 6.1%, 2045 (z) | $ | 325,000 | $ | 146,250 | ||
| Asset Securitization Corp., FRN, 8.63%, 2029 | 129,987 | 139,063 | ||||
| Banc of America Commercial Mortgage, Inc., 5.356%, 2045 | 620,000 | 586,483 | ||||
| Bayview Commercial Asset Trust, FRN, 1.6%, 2035 (i)(z) | 812,887 | 55,683 | ||||
| Bayview Commercial Asset Trust, FRN, 1.68%, 2013 (i)(z) | 466,921 | 24,280 | ||||
| Bayview Commercial Asset Trust, FRN, 1.68%, 2036 (i)(z) | 767,830 | 55,591 | ||||
| Bayview Commercial Asset Trust, FRN, 0.878%, 2036 (i)(z) | 582,704 | 47,141 | ||||
| Bayview Commercial Asset Trust, FRN, 1.168%, 2036 (i)(z) | 1,510,259 | 132,903 | ||||
| Bayview Commercial Asset Trust, FRN, 1.139%, 2036 (i)(z) | 742,198 | 82,532 | ||||
| Bayview Commercial Asset Trust, FRN, 1.21%, 2037 (i)(z) | 1,598,412 | 148,652 | ||||
| Bayview Financial Acquisition Trust, FRN, 5.402%, 2035 | 54,939 | 53,592 | ||||
| Bayview Financial Acquisition Trust, FRN, 5.483%, 2041 | 67,000 | 63,256 | ||||
| Bayview Financial Revolving Mortgage Loan Trust, FRN, 3.182%, 2040 (z) | 250,000 | 191,740 | ||||
| Capital Trust Realty CDO Ltd., 5.16%, 2035 (z) | 140,000 | 115,631 | ||||
| Citigroup/Deutsche Bank Commercial Mortgage Trust, FRN, 5.399%, 2044 | 120,000 | 118,131 | ||||
| Citigroup/Deutsche Bank Commercial Mortgage Trust, FRN, 5.399%, 2044 | 500,000 | 472,941 | ||||
| Commercial Mortgage Acceptance Corp., FRN, 1.06%, 2030 (i) | 468,516 | 16,805 | ||||
| Countrywide Asset-Backed Certificates, FRN, 4.575%, 2035 | 3,715 | 3,687 | ||||
| Credit Suisse Mortgage Capital Certificate, 5.343%, 2039 | 467,077 | 419,547 | ||||
| Credit-Based Asset Servicing & Securitization LLC, FRN, 5.303%, 2035 | 74,462 | 72,646 | ||||
| DLJ Commercial Mortgage Corp., 6.04%, 2031 (z) | 100,000 | 97,487 | ||||
| E*TRADE RV & Marine Trust, 3.62%, 2018 | 47,672 | 46,754 | ||||
| Falcon Franchise Loan LLC, FRN, 3.773%, 2025 (i)(z) | 317,091 | 32,651 | ||||
| First Union-Lehman Brothers Commercial Mortgage Trust, 7%, 2029 (n) | 50,275 | 52,273 | ||||
| GMAC Commercial Mortgage Securities, Inc., FRN, 6.02%, 2033 (z) | 60,000 | 55,583 | ||||
| GMAC Commercial Mortgage Securities, Inc., FRN, 7.917%, 2034 (n) | 110,000 | 110,849 | ||||
| Greenwich Capital Commercial Funding Corp., 4.305%, 2042 | 183,329 | 182,012 | ||||
| Issuer | Shares/Par | Value ($) | ||||
| BONDS – continued | ||||||
| Asset Backed & Securitized – continued | ||||||
| Greenwich Capital Commercial Funding Corp., FRN, 5.224%, 2037 | $ | 109,489 | $ | 105,144 | ||
| Greenwich Capital Commercial Funding Corp., FRN, 6.111%, 2038 | 620,000 | 611,612 | ||||
| JPMorgan Chase Commercial Mortgage Securities Corp., 5.552%, 2045 | 725,000 | 693,700 | ||||
| JPMorgan Chase Commercial Mortgage Securities Corp., 5.336%, 2047 | 725,000 | 680,095 | ||||
| JPMorgan Chase Commercial Mortgage Securities Corp., 5.429%, 2043 | 620,000 | 587,266 | ||||
| JPMorgan Chase Commercial Mortgage Securities Corp., FRN, 5.038%, 2046 | 370,000 | 353,441 | ||||
| JPMorgan Chase Commercial Mortgage Securities Corp., FRN, 4.936%, 2042 | 770,411 | 727,161 | ||||
| JPMorgan Chase Commercial Mortgage Securities Corp., FRN, 5.506%, 2042 (n) | 130,000 | 96,810 | ||||
| JPMorgan Chase Commercial Mortgage Securities Corp., FRN, 5.855%, 2043 | 200,000 | 187,647 | ||||
| JPMorgan Chase Commercial Mortgage Securities Corp., FRN, 6.007%, 2049 | 1,000,000 | 949,825 | ||||
| Lehman Brothers Commercial Conduit Mortgage Trust, FRN, 0.973%, 2030 (i) | 261,392 | 9,018 | ||||
| Merrill Lynch Mortgage Trust, FRN, 6.022%, 2050 | 450,000 | 326,314 | ||||
| Merrill Lynch/Countrywide Commercial Mortgage Trust, FRN, 5.172%, 2049 | 620,000 | 576,951 | ||||
| Morgan Stanley Capital I, Inc., 5.72%, 2032 | 55,175 | 55,701 | ||||
| Morgan Stanley Capital I, Inc., FRN, 0.619%, 2030 (i)(n) | 984,673 | 10,975 | ||||
| Mortgage Capital Funding, Inc., FRN, 0.573%, 2031 (i) | 240,223 | 346 | ||||
| New Century Home Equity Loan Trust, FRN, 4.532%, 2035 | 350,000 | 344,257 | ||||
| Nomura Asset Acceptance Corp., FRN, 4.423%, 2034 | 15,074 | 15,053 | ||||
| Preferred Term Securities XIX Ltd., CDO, FRN, 3.126%, 2035 (z) | 99,384 | 83,482 | ||||
| Prudential Securities Secured Financing Corp., FRN, 7.291%, 2013 (z) | 125,000 | 100,280 | ||||
| Residential Funding Mortgage Securities, Inc., FRN, 5.32%, 2035 | 174,000 | 67,122 | ||||
| Structured Asset Securities Corp., FRN, 2.722%, 2035 | 36,240 | 35,272 | ||||
| Wachovia Bank Commercial Mortgage Trust, FRN, 4.847%, 2041 | 150,000 | 142,019 | ||||
| Wachovia Bank Commercial Mortgage Trust, FRN, 5.383%, 2043 | 600,000 | 531,778 | ||||
| Wachovia Bank Commercial Mortgage Trust, FRN, 5.513%, 2043 | 300,000 | 206,512 | ||||
| $ | 11,021,944 | |||||
4
Table of Contents
Portfolio of Investments (unaudited) – continued
| Issuer | Shares/Par | Value ($) | ||||
| BONDS – continued | ||||||
| Automotive – 0.2% | ||||||
| Ford Motor Credit Co., 7.375%, 2009 | $ | 155,000 | $ | 141,171 | ||
| Johnson Controls, Inc., 5.5%, 2016 | 206,000 | 197,628 | ||||
| $ | 338,799 | |||||
| Broadcasting – 1.2% | ||||||
| Allbritton Communications Co., 7.75%, 2012 | $ | 220,000 | $ | 213,950 | ||
| British Sky Broadcasting, 6.1%, 2018 (z) | 570,000 | 560,695 | ||||
| CBS Corp., 6.625%, 2011 | 681,000 | 697,341 | ||||
| Clear Channel Communications, Inc., 7.65%, 2010 | 160,000 | 164,120 | ||||
| Clear Channel Communications, Inc., 6.25%, 2011 | 220,000 | 186,450 | ||||
| Grupo Televisa S.A., 6%, 2018 (z) | 552,000 | 536,843 | ||||
| News America, Inc., 8.5%, 2025 | 152,000 | 171,641 | ||||
| $ | 2,531,040 | |||||
| Brokerage & Asset Managers – 3.0% | ||||||
| Bear Stearns Cos., Inc., 5.85%, 2010 | $ | 550,000 | $ | 558,535 | ||
| Goldman Sachs Group, Inc., 5.625%, 2017 | 489,000 | 453,086 | ||||
| Goldman Sachs Group, Inc., 6.15%, 2018 | 600,000 | 582,095 | ||||
| INVESCO PLC, 4.5%, 2009 | 262,000 | 259,559 | ||||
| INVESCO PLC, 5.625%, 2012 | 230,000 | 219,570 | ||||
| Lehman Brothers Holdings, Inc., 5.625%, 2013 | 440,000 | 416,462 | ||||
| Lehman Brothers Holdings, Inc., 6.5%, 2017 | 280,000 | 259,033 | ||||
| Lehman Brothers Holdings, Inc., 7.5%, 2038 | 508,000 | 471,206 | ||||
| Merrill Lynch & Co., Inc., 6.05%, 2016 | 569,000 | 524,901 | ||||
| Merrill Lynch & Co., Inc., 6.15%, 2013 | 670,000 | 649,365 | ||||
| Morgan Stanley, 5.75%, 2016 | 444,000 | 410,421 | ||||
| Morgan Stanley Group, Inc., 6.625%, 2018 | 1,312,000 | 1,243,153 | ||||
| $ | 6,047,386 | |||||
| Business Services – 0.3% | ||||||
| Xerox Corp., 5.65%, 2013 | $ | 680,000 | $ | 673,239 | ||
| Cable TV – 2.1% | ||||||
| Comcast Corp., 6.4%, 2038 | $ | 740,000 | $ | 682,630 | ||
| Cox Communications, Inc., 6.25%, 2018 (z) | 107,000 | 104,453 | ||||
| Cox Communications, Inc., 7.125%, 2012 | 2,090,000 | 2,181,452 | ||||
| TCI Communications, Inc., 9.8%, 2012 | 72,000 | 81,160 | ||||
| Time Warner Cable, Inc., 5.4%, 2012 | 819,000 | 810,727 | ||||
| Time Warner Entertainment Co. LP, 8.375%, 2033 | 290,000 | 313,854 | ||||
| $ | 4,174,276 | |||||
| Chemicals – 0.3% | ||||||
| Dow Chemical Co., 5.75%, 2008 | $ | 62,000 | $ | 62,468 | ||
| PPG Industries, Inc., 5.75%, 2013 | 504,000 | 512,447 | ||||
| $ | 574,915 | |||||
| Consumer Goods & Services – 0.9% | ||||||
| Clorox Co., 5%, 2013 | $ | 420,000 | $ | 412,789 | ||
| Fortune Brands, Inc., 5.125%, 2011 | 350,000 | 348,139 | ||||
| Western Union Co., 5.4%, 2011 | 1,147,000 | 1,140,748 | ||||
| $ | 1,901,676 | |||||
| Issuer | Shares/Par | Value ($) | ||||
| BONDS – continued | ||||||
| Defense Electronics – 0.4% | ||||||
| BAE Systems Holdings, Inc., 6.4%, 2011 (n) | $ | 354,000 | $ | 363,980 | ||
| BAE Systems Holdings, Inc., 4.75%, 2010 (n) | 168,000 | 170,016 | ||||
| Litton Industries, Inc., 8%, 2009 | 165,000 | 173,223 | ||||
| $ | 707,219 | |||||
| Electronics – 0.3% | ||||||
| Tyco Electronics Group S.A., 7.125%, 2037 | $ | 100,000 | $ | 102,377 | ||
| Tyco Electronics Group S.A., 6.55%, 2017 | 420,000 | 423,767 | ||||
| $ | 526,144 | |||||
| Emerging Market Quasi-Sovereign – 0.3% | ||||||
| OAO Gazprom, 7.343%, 2013 (z) | $ | 250,000 | $ | 255,625 | ||
| OAO Gazprom, 8.146%, 2018 (z) | 353,000 | 364,914 | ||||
| $ | 620,539 | |||||
| Emerging Market Sovereign – 0.2% | ||||||
| Gabonese Republic, 8.2%, 2017 (n) | $ | 398,000 | $ | 413,920 | ||
| Energy – Independent – 1.2% | ||||||
| Nexen, Inc., 6.4%, 2037 | $ | 970,000 | $ | 918,432 | ||
| Ocean Energy, Inc., 7.25%, 2011 | 131,000 | 139,890 | ||||
| SandRidge Energy, Inc., 8%, 2018 (n) | 675,000 | 678,375 | ||||
| XTO Energy, Inc., 6.25%, 2013 | 190,000 | 195,661 | ||||
| XTO Energy, Inc., 5.65%, 2016 | 520,000 | 515,489 | ||||
| $ | 2,447,847 | |||||
| Energy – Integrated – 0.2% | ||||||
| Petro-Canada, 6.05%, 2018 | $ | 494,000 | $ | 486,832 | ||
| Entertainment – 0.1% | ||||||
| Time Warner, Inc., 5.5%, 2011 | $ | 200,000 | $ | 197,060 | ||
| Financial Institutions – 2.1% | ||||||
| American Express Centurion Bank, 5.55%, 2012 | $ | 670,000 | $ | 662,787 | ||
| Capital One Financial Corp., 6.15%, 2016 | 610,000 | 537,739 | ||||
| General Electric Capital Corp., 5.375%, 2016 | 249,000 | 245,030 | ||||
| General Electric Co., 5.625%, 2018 | 560,000 | 541,551 | ||||
| HSBC Finance Corp., 6.75%, 2011 | 46,000 | 47,805 | ||||
| HSBC Finance Corp., 5.5%, 2016 | 753,000 | 723,357 | ||||
| ILFC E-Capital Trust I, 5.9% to 2010, FRN to 2065 (n) | 1,000,000 | 809,488 | ||||
| ORIX Corp., 5.48%, 2011 | 780,000 | 721,313 | ||||
| $ | 4,289,070 | |||||
| Food & Beverages – 2.0% | ||||||
| Diageo Capital PLC, 5.5%, 2016 | $ | 760,000 | $ | 743,692 | ||
| Dr. Pepper Snapple Group, Inc., 6.82%, 2018 (n) | 803,000 | 806,313 | ||||
| General Mills, Inc., 5.65%, 2012 | 340,000 | 346,685 | ||||
| Kraft Foods, Inc., 6.125%, 2018 | 1,070,000 | 1,036,209 | ||||
| Miller Brewing Co., 5.5%, 2013 (n) | 810,000 | 827,808 | ||||
| Tyson Foods, Inc., 6.85%, 2016 | 250,000 | 227,186 | ||||
| $ | 3,987,893 | |||||
5
Table of Contents
Portfolio of Investments (unaudited) – continued
| Issuer | Shares/Par | Value ($) | ||||
| BONDS – continued | ||||||
| Food & Drug Stores – 0.6% | ||||||
| CVS Caremark Corp., 6.125%, 2016 | $ | 620,000 | $ | 625,268 | ||
| CVS Caremark Corp., 5.75%, 2017 | 651,000 | 640,292 | ||||
| $ | 1,265,560 | |||||
| Forest & Paper Products – 0.6% | ||||||
| International Paper Co., 7.95%, 2018 | $ | 720,000 | $ | 715,992 | ||
| Stora Enso Oyj, 7.25%, 2036 (n) | 563,000 | 444,918 | ||||
| $ | 1,160,910 | |||||
| Gaming & Lodging – 1.4% | ||||||
| Marriott International, Inc., 5.625%, 2013 | $ | 1,101,000 | $ | 1,035,766 | ||
| MGM Mirage, 8.375%, 2011 | 700,000 | 675,500 | ||||
| Station Casinos, Inc., 6%, 2012 | 750,000 | 596,250 | ||||
| Wyndham Worldwide Corp., 6%, 2016 | 605,000 | 534,257 | ||||
| $ | 2,841,773 | |||||
| Industrial – 0.1% | ||||||
| Steelcase, Inc., 6.5%, 2011 | $ | 272,000 | $ | 275,814 | ||
| Insurance – 1.2% | ||||||
| Hartford Financial Services Group, Inc., 8.125%, 2068 | $ | 510,000 | $ | 496,360 | ||
| ING Groep N.V., 5.775% to 2015, FRN to 2049 | 518,000 | 429,929 | ||||
| Metropolitan Life Global Funding, 5.125%, 2013 (z) | 420,000 | 413,569 | ||||
| Prudential Financial, Inc., 6%, 2017 | 640,000 | 632,939 | ||||
| UnumProvident Corp., 6.85%, 2015 (n) | 543,000 | 538,987 | ||||
| $ | 2,511,784 | |||||
| Insurance – Health – 0.3% | ||||||
| Humana, Inc., 7.2%, 2018 | $ | 450,000 | $ | 445,864 | ||
| UnitedHealth Group, Inc., 6.875%, 2038 | 190,000 | 179,800 | ||||
| $ | 625,664 | |||||
| Insurance – Property & Casualty – 1.4% | ||||||
| AXIS Capital Holdings Ltd., 5.75%, 2014 | $ | 1,105,000 | $ | 1,049,390 | ||
| Chubb Corp., 5.75%, 2018 | 170,000 | 164,766 | ||||
| Fund American Cos., Inc., 5.875%, 2013 | 804,000 | 777,774 | ||||
| ZFS Finance USA Trust V, 6.5% to 2017, FRN to 2037 (n) | 1,000,000 | 872,806 | ||||
| $ | 2,864,736 | |||||
| Major Banks – 3.2% | ||||||
| BAC Capital Trust XIV, 5.63% to 2012, FRN to 2049 | $ | 240,000 | $ | 187,279 | ||
| Bank of America Corp., 5.65%, 2018 | 900,000 | 840,228 | ||||
| BNP Paribas, 7.195% to 2037, FRN to 2049 (n) | 400,000 | 361,704 | ||||
| Credit Suisse New York, 6%, 2018 | 400,000 | 385,167 | ||||
| JPMorgan Chase Bank N.A., 5.875%, 2016 | 250,000 | 244,118 | ||||
| MUFG Capital Finance 1 Ltd., 6.346% to 2016, FRN to 2049 | 758,000 | 657,028 | ||||
| Natixis S.A., 10% to 2018, FRN to 2049 (z) | 600,000 | 598,818 | ||||
| PNC Funding Corp., 5.625%, 2017 | 740,000 | 690,057 | ||||
| Royal Bank of Scotland Group PLC, 6.99% to 2017, FRN to 2049 (n) | 390,000 | 351,011 | ||||
| UniCredito Italiano Capital Trust II, 9.2% to 2010, FRN to 2049 (n) | 545,000 | 558,808 | ||||
| Issuer | Shares/Par | Value ($) | ||||
| BONDS – continued | ||||||
| Major Banks – continued | ||||||
| Unicredito Luxembourg Finance S.A., 6%, 2017 (n) | $ | 1,000,000 | $ | 960,075 | ||
| Wachovia Capital Trust III, 5.8% to 2011, FRN to 2042 | 648,000 | 440,640 | ||||
| Wachovia Corp., 6.605%, 2025 | 164,000 | 141,537 | ||||
| $ | 6,416,470 | |||||
| Medical & Health Technology & Services – 0.5% | ||||||
| Fisher Scientific International, Inc., 6.125%, 2015 | $ | 485,000 | $ | 480,809 | ||
| Hospira, Inc., 5.55%, 2012 | 170,000 | 167,013 | ||||
| Hospira, Inc., 6.05%, 2017 | 210,000 | 202,664 | ||||
| McKesson Corp., 5.7%, 2017 | 260,000 | 250,018 | ||||
| $ | 1,100,504 | |||||
| Metals & Mining – 1.1% | ||||||
| International Steel Group, Inc., 6.5%, 2014 | $ | 496,000 | $ | 502,851 | ||
| Peabody Energy Corp., 5.875%, 2016 | 670,000 | 626,450 | ||||
| Rio Tinto Finance USA Ltd., 5.875%, 2013 | 1,040,000 | 1,045,766 | ||||
| $ | 2,175,067 | |||||
| Mortgage Backed – 23.6% | ||||||
| Fannie Mae, 4.55%, 2011 | $ | 117,468 | $ | 117,895 | ||
| Fannie Mae, 4.79%, 2012 | 117,568 | 118,254 | ||||
| Fannie Mae, 4.86%, 2012 | 114,845 | 114,574 | ||||
| Fannie Mae, 5.12%, 2012 | 57,515 | 58,053 | ||||
| Fannie Mae, 3.81%, 2013 | 19,658 | 18,677 | ||||
| Fannie Mae, 4.845%, 2013 | 50,789 | 50,377 | ||||
| Fannie Mae, 4.545%, 2014 | 155,248 | 151,147 | ||||
| Fannie Mae, 4.6%, 2014-2015 | 108,620 | 105,325 | ||||
| Fannie Mae, 4.621%, 2014 | 70,501 | 68,868 | ||||
| Fannie Mae, 4.77%, 2014 | 60,169 | 59,049 | ||||
| Fannie Mae, 4.88%, 2014-2020 | 223,531 | 220,755 | ||||
| Fannie Mae, 4.53%, 2015 | 105,493 | 101,392 | ||||
| Fannie Mae, 4.56%, 2015 | 55,088 | 53,224 | ||||
| Fannie Mae, 4.665%, 2015 | 37,699 | 36,627 | ||||
| Fannie Mae, 4.69%, 2015 | 163,803 | 159,455 | ||||
| Fannie Mae, 4.7%, 2015 | 273,651 | 265,942 | ||||
| Fannie Mae, 4.74%, 2015 | 49,150 | 47,919 | ||||
| Fannie Mae, 4.78%, 2015 | 105,467 | 102,808 | ||||
| Fannie Mae, 4.815%, 2015 | 53,000 | 51,816 | ||||
| Fannie Mae, 4.82%, 2015 | 54,836 | 53,531 | ||||
| Fannie Mae, 4.85%, 2015 | 174,615 | 171,392 | ||||
| Fannie Mae, 4.87%, 2015 | 34,079 | 33,437 | ||||
| Fannie Mae, 4.89%, 2015 | 96,232 | 94,364 | ||||
| Fannie Mae, 4.925%, 2015 | 128,405 | 126,614 | ||||
| Fannie Mae, 4.94%, 2015 | 120,000 | 120,289 | ||||
| Fannie Mae, 5.09%, 2016 | 121,245 | 119,876 | ||||
| Fannie Mae, 5.395%, 2016 | 135,381 | 135,812 | ||||
| Fannie Mae, 5.423%, 2016 | 150,661 | 152,082 | ||||
| Fannie Mae, 4.994%, 2017 | 165,694 | 164,014 | ||||
| Fannie Mae, 5.28%, 2017 | 140,000 | 139,387 | ||||
| Fannie Mae, 5.32%, 2017 | 150,464 | 150,125 | ||||
| Fannie Mae, 5.5%, 2017-2038 | 11,100,973 | 11,039,593 | ||||
| Fannie Mae, 5.54%, 2017 | 108,000 | 109,163 | ||||
| Fannie Mae, 5%, 2020-2027 | 2,047,508 | 2,060,287 | ||||
6
Table of Contents
Portfolio of Investments (unaudited) – continued
| Issuer | Shares/Par | Value ($) | ||||
| BONDS – continued | ||||||
| Mortgage Backed – continued | ||||||
| Fannie Mae, 5.19%, 2020 | $ | 207,990 | $ | 203,382 | ||
| Fannie Mae, 5.35%, 2023 | 200,235 | 198,816 | ||||
| Fannie Mae, 6.5%, 2032-2033 | 60,138 | 62,429 | ||||
| Fannie Mae, 6%, 2035-2037 | 2,690,115 | 2,717,659 | ||||
| Freddie Mac, 5%, 2018-2028 | 2,596,458 | 2,621,103 | ||||
| Freddie Mac, 5.5%, 2019-2038 | 8,644,556 | 8,566,360 | ||||
| Freddie Mac, 4%, 2023-2024 | 192,091 | 192,277 | ||||
| Freddie Mac, 6%, 2034-2037 | 1,714,607 | 1,735,010 | ||||
| Ginnie Mae, 6%, 2036-2038 | 6,535,837 | 6,644,093 | ||||
| Ginnie Mae, 5.5%, 2038 | 8,421,834 | 8,390,451 | ||||
| $ | 47,903,703 | |||||
| Municipals – 2.4% | ||||||
| Massachusetts Health & Educational Authority Rev. (Mass Institute Technology), “K”, 5.5%, 2032 | $ | 1,350,000 | $ | 1,496,111 | ||
| Massachusetts Health & Educational Facilities Authority Rev. (Boston College), 5.5%, 2035 | 770,000 | 844,744 | ||||
| Massachusetts Health & Educational Facilities Authority Rev. (Boston College), 5.5%, 2030 | 460,000 | 505,982 | ||||
| Metropolitan Atlanta, GA, Rapid Transit Tax Authority Rev., “A”, FGIC, 5.25%, 2032 | 780,000 | 819,406 | ||||
| Utah Transit Authority Sales Tax Rev., “A”, N, 5%, 2035 | 1,165,000 | 1,187,566 | ||||
| $ | 4,853,809 | |||||
| Natural Gas – Pipeline – 3.0% | ||||||
| CenterPoint Energy, Inc., 7.875%, 2013 | $ | 748,000 | $ | 800,737 | ||
| CenterPoint Energy, Inc., 5.95%, 2017 | 540,000 | 511,238 | ||||
| Enterprise Products Operating LP, 5.65%, 2013 | 227,000 | 226,140 | ||||
| Enterprise Products Partners LP, 4.95%, 2010 | 800,000 | 799,826 | ||||
| Enterprise Products Partners LP, 6.3%, 2017 | 900,000 | 893,707 | ||||
| Kinder Morgan Energy Partners LP, 7.4%, 2031 | 103,000 | 105,854 | ||||
| Kinder Morgan Energy Partners LP, 5.8%, 2035 | 930,000 | 806,875 | ||||
| Kinder Morgan Energy Partners LP, 6%, 2017 | 643,000 | 635,344 | ||||
| Spectra Energy Capital LLC, 8%, 2019 | 613,000 | 670,563 | ||||
| Williams Cos., Inc., 8.75%, 2032 | 573,000 | 650,355 | ||||
| $ | 6,100,639 | |||||
| Network & Telecom – 4.4% | ||||||
| British Telecommunications PLC, 5.15%, 2013 | $ | 683,000 | $ | 665,879 | ||
| CenturyTel, Inc., 8.375%, 2010 | 892,000 | 932,196 | ||||
| Deutsche Telekom International Finance B.V., 5.75%, 2016 | 536,000 | 522,982 | ||||
| Deutsche Telekom International Finance B.V., 5.25%, 2013 | 800,000 | 784,838 | ||||
| Issuer | Shares/Par | Value ($) | ||||
| BONDS – continued | ||||||
| Network & Telecom – continued | ||||||
| GTE Corp., 7.51%, 2009 | $ | 900,000 | $ | 924,068 | ||
| Qwest Capital Funding, Inc., 7.25%, 2011 | 850,000 | 824,500 | ||||
| Telecom Italia Capital, 6.2%, 2011 | 899,000 | 916,730 | ||||
| Telefonica Emisiones S.A.U., 7.045%, 2036 | 713,000 | 731,716 | ||||
| TELUS Corp., 8%, 2011 | 1,175,000 | 1,261,558 | ||||
| Verizon New York, Inc., 6.875%, 2012 | 1,317,000 | 1,373,494 | ||||
| $ | 8,937,961 | |||||
| Oil Services – 0.8% | ||||||
| KazMunaiGaz Finance B.V., 8.375%, 2013 (z) | $ | 517,000 | $ | 515,320 | ||
| Weatherford International Ltd., 6.35%, 2017 | 640,000 | 648,243 | ||||
| Weatherford International Ltd., 5.15%, 2013 | 530,000 | 526,913 | ||||
| $ | 1,690,476 | |||||
| Oils – 0.1% | ||||||
| Premcor Refining Group, Inc., 7.5%, 2015 | $ | 190,000 | $ | 196,019 | ||
| Other Banks & Diversified Financials – 1.0% | ||||||
| Alfa Diversified Payment Rights Finance Co. S.A., FRN, 4.676%, 2011 (n) | $ | 196,000 | $ | 186,200 | ||
| Banco Mercantil del Norte S.A., 5.875% to 2009, FRN to 2014 (n) | 149,000 | 149,000 | ||||
| Citigroup, Inc., 8.4% to 2018, FRN to 2049 | 710,000 | 674,933 | ||||
| Fifth Third Bancorp, 5.45%, 2017 | 33,000 | 26,545 | ||||
| Resona Bank Ltd., 5.85% to 2016, FRN to 2049 (n) | 486,000 | 418,052 | ||||
| UBS Preferred Funding Trust V, 6.243% to 2016, FRN to 2049 | 549,000 | 481,043 | ||||
| $ | 1,935,773 | |||||
| Printing & Publishing – 0.3% | ||||||
| Dex Media West LLC, 9.875%, 2013 | $ | 368,000 | $ | 331,200 | ||
| Idearc, Inc., 8%, 2016 | 47,000 | 29,551 | ||||
| Pearson PLC, 5.5%, 2013 (n) | 200,000 | 198,012 | ||||
| $ | 558,763 | |||||
| Railroad & Shipping – 0.7% | ||||||
| Canadian Pacific Railway Co., 6.5%, 2018 | $ | 1,090,000 | $ | 1,079,900 | ||
| CSX Corp., 6.3%, 2012 | 155,000 | 155,306 | ||||
| TFM S.A. de C.V., 9.375%, 2012 | 258,000 | 268,320 | ||||
| $ | 1,503,526 | |||||
| Real Estate – 2.2% | ||||||
| Boston Properties, Inc., REIT, 5%, 2015 | $ | 137,000 | $ | 125,674 | ||
| ERP Operating LP, REIT, 5.75%, 2017 | 1,020,000 | 941,495 | ||||
| HRPT Properties Trust, REIT, 6.25%, 2016 | 689,000 | 632,461 | ||||
| Kimco Realty Corp., REIT, 5.783%, 2016 | 294,000 | 271,190 | ||||
| Liberty Property LP, REIT, 5.5%, 2016 | 730,000 | 646,363 | ||||
| ProLogis, REIT, 5.75%, 2016 | 655,000 | 616,876 | ||||
| ProLogis, REIT, 5.625%, 2016 | 150,000 | 138,922 | ||||
| Simon Property Group, Inc., REIT, 6.35%, 2012 | 88,000 | 88,181 | ||||
| Simon Property Group, Inc., REIT, 5.75%, 2015 | 18,000 | 17,469 | ||||
7
Table of Contents
Portfolio of Investments (unaudited) – continued
| Issuer | Shares/Par | Value ($) | ||||
| BONDS – continued | ||||||
| Real Estate – continued | ||||||
| Simon Property Group, Inc., REIT, 6.1%, 2016 | $ | 769,000 | $ | 752,453 | ||
| Simon Property Group, Inc., REIT, 5.875%, 2017 | 230,000 | 220,863 | ||||
| $ | 4,451,947 | |||||
| Restaurants – 0.1% | ||||||
| YUM! Brands, Inc., 8.875%, 2011 | $ | 205,000 | $ | 221,584 | ||
| Retailers – 1.5% | ||||||
| Federated Retail Holdings, Inc., 5.35%, 2012 | $ | 430,000 | $ | 399,560 | ||
| Home Depot, Inc., 5.25%, 2013 | 510,000 | 489,146 | ||||
| J.C. Penney Corp., Inc., 8%, 2010 | 34,000 | 35,271 | ||||
| Macy’s, Inc., 6.625%, 2011 | 223,000 | 220,013 | ||||
| Target Corp., 6.5%, 2037 | 261,000 | 251,075 | ||||
| Wal-Mart Stores, Inc., 6.2%, 2038 | 680,000 | 668,137 | ||||
| Wesfarmers Ltd., 6.998%, 2013 (z) | 1,000,000 | 1,032,967 | ||||
| $ | 3,096,169 | |||||
| Specialty Stores – 0.3% | ||||||
| Best Buy, Inc., 6.75%, 2013 (z) | $ | 660,000 | $ | 668,641 | ||
| Steel – 0.2% | ||||||
| Evraz Group S.A., 8.875%, 2013 (z) | $ | 503,000 | $ | 503,604 | ||
| Supermarkets – 0.9% | ||||||
| Delhaize America, Inc., 9%, 2031 | $ | 520,000 | $ | 612,146 | ||
| Kroger Co., 6.4%, 2017 | 651,000 | 663,992 | ||||
| Safeway, Inc., 6.5%, 2011 | 521,000 | 538,848 | ||||
| $ | 1,814,986 | |||||
| Supranational – 0.0% | ||||||
| Corporacion Andina de Fomento, 6.875%, 2012 | $ | 61,000 | $ | 64,108 | ||
| Telecommunications – Wireless – 1.0% | ||||||
| Nextel Communications, Inc., 5.95%, 2014 | $ | 690,000 | $ | 553,725 | ||
| Rogers Cable, Inc., 5.5%, 2014 | 734,000 | 706,570 | ||||
| Vodafone Group PLC, 5.375%, 2015 | 500,000 | 486,422 | ||||
| Vodafone Group PLC, 5.625%, 2017 | 232,000 | 223,481 | ||||
| $ | 1,970,198 | |||||
| Telephone Services – 0.3% | ||||||
| Embarq Corp., 7.082%, 2016 | $ | 560,000 | $ | 531,862 | ||
| Tobacco – 1.6% | ||||||
| Philip Morris International, Inc., 4.875%, 2013 | $ | 1,130,000 | $ | 1,110,030 | ||
| Reynolds American, Inc., 6.75%, 2017 | 1,400,000 | 1,392,705 | ||||
| Reynolds American, Inc., 7.25%, 2012 | 800,000 | 824,918 | ||||
| $ | 3,327,653 | |||||
| Transportation – Services – 0.1% | ||||||
| FedEx Corp., 9.65%, 2012 | $ | 110,000 | $ | 126,649 | ||
| U.S. Government Agencies – 1.5% | ||||||
| Federal Home Loan Bank, 3.625%, 2013 | $ | 2,000,000 | $ | 1,954,562 | ||
| Small Business Administration, 4.34%, 2024 | 162,512 | 154,875 | ||||
| Small Business Administration, 4.93%, 2024 | 123,790 | 122,483 | ||||
| Issuer | Shares/Par | Value ($) | ||||
| BONDS – continued | ||||||
| U.S. Government Agencies – continued | ||||||
| Small Business Administration, 4.99%, 2024 | $ | 128,845 | $ | 126,299 | ||
| Small Business Administration, 4.625%, 2025 | 265,337 | 254,640 | ||||
| Small Business Administration, 4.86%, 2025 | 275,095 | 269,743 | ||||
| Small Business Administration, 5.11%, 2025 | 211,812 | 209,274 | ||||
| $ | 3,091,876 | |||||
| U.S. Treasury Obligations – 15.2% | ||||||
| U.S. Treasury Bonds, 5.375%, 2031 | $ | 1,140,000 | $ | 1,266,647 | ||
| U.S. Treasury Bonds, 6.25%, 2023 | 177,000 | 210,589 | ||||
| U.S. Treasury Bonds, 6%, 2026 | 373,000 | 436,847 | ||||
| U.S. Treasury Bonds, 4.5%, 2036 | 2,043,000 | 2,028,476 | ||||
| U.S. Treasury Bonds, 6.75%, 2026 | 19,000 | 24,051 | ||||
| U.S. Treasury Bonds, 5%, 2037 | 1,968,000 | 2,114,986 | ||||
| U.S. Treasury Notes, 4.625%, 2008 | 6,484,000 | 6,530,095 | ||||
| U.S. Treasury Notes, 6.5%, 2010 | 2,614,000 | 2,781,458 | ||||
| U.S. Treasury Notes, 4%, 2010 | 2,453,000 | 2,515,475 | ||||
| U.S. Treasury Notes, 5.125%, 2011 | 5,439,000 | 5,780,634 | ||||
| U.S. Treasury Notes, 4.5%, 2009 | 2,167,000 | 2,201,366 | ||||
| U.S. Treasury Notes, 4.875%, 2009 (f) | 4,739,000 | 4,865,621 | ||||
| U.S. Treasury Notes, 5.125%, 2016 | 167,000 | 182,082 | ||||
| $ | 30,938,327 | |||||
| Utilities – Electric Power – 5.4% | ||||||
| Allegheny Energy Supply Co. LLC, 8.25%, 2012 (n) | $ | 511,000 | $ | 532,718 | ||
| Bruce Mansfield Unit, 6.85%, 2034 | 590,000 | 597,105 | ||||
| Dominion Resources, Inc., 6.4%, 2018 | 460,000 | 464,086 | ||||
| Duke Energy Corp., 5.65%, 2013 | 1,090,000 | 1,095,279 | ||||
| E.On International Finance B.V., 6.65%, 2038 (n) | 1,210,000 | 1,204,716 | ||||
| EDP Finance B.V., 6%, 2018 (n) | 1,100,000 | 1,095,347 | ||||
| EEB International Ltd., 8.75%, 2014 (n) | 100,000 | 106,000 | ||||
| Enersis S.A., 7.375%, 2014 | 414,000 | 439,737 | ||||
| Exelon Generation Co. LLC, 6.95%, 2011 | 1,267,000 | 1,309,534 | ||||
| FirstEnergy Corp., 6.45%, 2011 | 1,610,000 | 1,652,019 | ||||
| ISA Capital do Brasil S.A., 7.875%, 2012 | 478,000 | 494,730 | ||||
| Israel Electric Corp. Ltd., 7.25%, 2019 (z) | 261,000 | 266,419 | ||||
| NiSource Finance Corp., 7.875%, 2010 | 1,030,000 | 1,068,125 | ||||
| NorthWestern Corp., 5.875%, 2014 | 5,000 | 4,921 | ||||
| NRG Energy, Inc., 7.25%, 2014 | 635,000 | 606,425 | ||||
| Waterford 3 Funding Corp., 8.09%, 2017 | 88,060 | 85,764 | ||||
| $ | 11,022,925 | |||||
| Total Bonds (Identified Cost, $201,697,704) | $ | 197,689,279 | ||||
| FLOATING RATE LOANS (g)(r) – 0.6% | ||||||
| Aerospace – 0.3% | ||||||
| Hawker Beechcraft Acquisition Co., Letter of Credit, 4.69%, 2014 | $ | 50,834 | $ | 47,625 | ||
| Hawker Beechcraft Acquisition Co., Term Loan, 4.8%, 2014 | 566,352 | 530,601 | ||||
| $ | 578,226 | |||||
8
Table of Contents
Portfolio of Investments (unaudited) – continued
| Issuer | Shares/Par | Value ($) | ||||
| FLOATING RATE LOANS – continued | ||||||
| Food & Beverages – 0.2% | ||||||
| ARAMARK Corp., Letter of Credit, 5.02%, 2014 | $ | 20,551 | $ | 19,376 | ||
| ARAMARK Corp., Term Loan B, 4.67%, 2014 | $ | 323,483 | 304,993 | |||
| $ | 324,369 | |||||
| Medical & Health Technology & Services – 0.1% | ||||||
| HCA, Inc., Term Loan B, 5.05%, 2013 | $ | 281,990 | $ | 264,448 | ||
| Printing & Publishing – 0.0% | ||||||
| Idearc, Inc., Term Loan B, 4.78%, 2014 | $ | 91,924 | $ | 73,284 | ||
| Total Floating Rate Loans (Identified Cost, $1,264,158) | $ | 1,240,327 | ||||
| Issuer | Shares/Par | Value ($) | ||||
| SHORT-TERM OBLIGATIONS – 1.6% | ||||||
| Toyota Motor Credit Corp., 2.57%, due 7/01/08, at Amortized Cost and Value (y) | $ | 3,169,000 | $ | 3,169,000 | ||
| Total Investments (Identified Cost, $206,130,862) | $ | 202,098,606 | ||||
| OTHER ASSETS, LESS LIABILITIES – 0.6% | 1,220,657 | |||||
| Net Assets – 100.0% | $ | 203,319,263 | ||||
| (f) | All or a portion of the security has been segregated as collateral for open futures contracts. |
| (g) | The rate shown represents a weighted average coupon rate on settled positions at period end, unless otherwise indicated. |
| (i) | Interest only security for which the fund receives interest on notional principal (Par amount). Par amount shown is the notional principal and does not reflect the cost of the security. |
| (n) | Securities exempt from registration under Rule 144A of the Securities Act of 1933. These securities may be sold in the ordinary course of business in transactions exempt from registration, normally to qualified institutional buyers. At period end, the aggregate value of these securities was $12,319,161 representing 6.1% of net assets. |
| (r) | Remaining maturities of floating rate loans may be less than stated maturities shown as a result of contractual or optional prepayments by the borrower. Such prepayments cannot be predicted with certainty. These loans may be subject to restrictions on resale. Floating rate loans generally have rates of interest which are determined periodically by reference to a base lending rate plus a premium. |
| (y) | The rate shown represents an annualized yield at time of purchase. |
| (z) | Restricted securities are not registered under the Securities Act of 1933 and are subject to legal restrictions on resale. These securities generally may be resold in transactions exempt from registration or to the public if the securities are subsequently registered. Disposal of these securities may involve time-consuming negotiations and prompt sale at an acceptable price may be difficult. The fund holds the following restricted securities: |
| Restricted Securities | Acquisition Date | Cost | Current Market Value | |||
| ARCap REIT, Inc., CDO, 6.1%, 2045 | 12/07/06 | $332,516 | $146,250 | |||
| Bayview Commercial Asset Trust, FRN, 1.68%, 2013 | 3/29/06 | 46,584 | 24,280 | |||
| Bayview Commercial Asset Trust, FRN, 1.6%, 2035 | 10/06/05 | 62,835 | 55,683 | |||
| Bayview Commercial Asset Trust, FRN, 1.68%, 2036 | 2/28/06 | 66,867 | 55,591 | |||
| Bayview Commercial Asset Trust, FRN, 0.878%, 2036 | 5/16/06 | 52,526 | 47,141 | |||
| Bayview Commercial Asset Trust, FRN, 1.168%, 2036 | 9/11/06 | 204,011 | 132,903 | |||
| Bayview Commercial Asset Trust, FRN, 1.139%, 2036 | 10/25/06 | 99,400 | 82,532 | |||
| Bayview Commercial Asset Trust, FRN, 1.21%, 2037 | 1/26/07 | 207,709 | 148,652 | |||
| Bayview Financial Revolving Mortgage Loan Trust, FRN, 3.182%, 2040 | 3/01/06 | 250,000 | 191,740 | |||
| Best Buy, Inc., 6.75%, 2013 | 6/19/08 | 658,838 | 668,641 | |||
| British Sky Broadcasting, 6.1%, 2018 | 2/07/08-2/14/08 | 569,118 | 560,695 | |||
| Capital Trust Realty CDO Ltd., 5.16%, 2035 | 4/07/06 | 134,777 | 115,631 | |||
| Cox Communications, Inc., 6.25%, 2018 | 6/06/08 | 107,590 | 104,453 | |||
| DLJ Commercial Mortgage Corp., 6.04%, 2031 | 7/23/04 | 98,473 | 97,487 | |||
| Evraz Group S.A., 8.875%, 2013 | 4/21/08 | 511,174 | 503,604 | |||
| Falcon Franchise Loan LLC, FRN, 3.773%, 2025 | 1/29/03 | 40,242 | 32,651 | |||
| GMAC Commercial Mortgage Securities, Inc., FRN, 6.02%, 2033 | 3/20/02 | 55,434 | 55,583 | |||
| Grupo Televisa S.A., 6%, 2018 | 5/06/08 | 549,523 | 536,843 | |||
| Israel Electric Corp. Ltd., 7.25%, 2019 | 5/01/08 | 260,559 | 266,419 | |||
| KazMunaiGaz Finance B.V., 8.375%, 2013 | 6/24/08-6/25/08 | 518,062 | 515,320 | |||
| Metropolitan Life Global Funding, 5.125%, 2013 | 4/07/08 | 419,689 | 413,569 | |||
| Natixis S.A., 10% to 2018, FRN to 2049 | 4/24/08 | 600,000 | 598,818 |
9
Table of Contents
Portfolio of Investments (unaudited) – continued
| Restricted Securities | Acquisition Date | Cost | Current Market Value | |||
| OAO Gazprom, 7.343%, 2013 | 4/08/08 | 260,000 | 255,625 | |||
| OAO Gazprom, 8.146%, 2018 | 4/03/08 | 363,590 | 364,914 | |||
| Preferred Term Securities XIX Ltd., CDO, FRN, 3.126%, 2035 | 9/08/05 | 99,384 | 83,482 | |||
| Prudential Securities Secured Financing Corp., FRN, 7.291%, 2013 | 12/06/04 | 138,774 | 100,280 | |||
| Wesfarmers Ltd., 6.998%, 2013 | 4/03/08 | 1,000,000 | 1,032,967 | |||
| Total Restricted Securities | $7,191,754 | |||||
| % of Net Assets | 3.5% |
The following abbreviations are used in this report and are defined:
| CDO | Collateralized Debt Obligation |
| FRN | Floating Rate Note. Interest rate resets periodically and may not be the rate reported at period end. |
| REIT | Real Estate Investment Trust |
Insurers
| FGIC | Financial Guaranty Insurance Co. |
Derivative Contracts at 6/30/08
Futures Contracts Outstanding at 6/30/08
| Description | Contracts | Value | Expiration Date | Unrealized Appreciation/ (Depreciation) | |||||
| U.S. Treasury Note (Short) | 20 | $2,311,875 | Sep-08 | $(35,851 | ) | ||||
| U.S. Treasury Note 10 yr (Short) | 4 | 455,688 | Sep-08 | (5,501 | ) | ||||
| $(41,352 | ) |
Swap Agreements at 6/30/08
| Expiration | Notional Amount | Counterparty | Cash Flows to Receive | Cash Flows to Pay | Unrealized Appreciation (Depreciation) | ||||||||
| Credit Default Swaps | |||||||||||||
| 12/20/12 | USD | 230,000 | Merrill Lynch International | (1) | 1.35% (fixed rate) | $(384 | ) | ||||||
| 12/20/12 | USD | 310,000 | Goldman Sachs International | (2) | 1.55% (fixed rate) | 1,838 | |||||||
| 12/20/12 | USD | 460,000 | Goldman Sachs International | (3) | 1.43% (fixed rate) | 8,357 | |||||||
| 12/20/12 | USD | 150,000 | Morgan Stanley Capital Services, Inc. | (4) | 1.6% (fixed rate) | 4,060 | |||||||
| 12/20/12 | USD | 310,000 | Goldman Sachs International | (5) | 1.3% (fixed rate) | (489 | ) | ||||||
| 3/20/13 | USD | 750,000 | Goldman Sachs International | (5) | 2.129% (fixed rate) | (26,782 | ) | ||||||
| 6/20/13 | USD | 440,000 | Merrill Lynch International | (6) | 0.52% (fixed rate) | 6,642 | |||||||
| 6/20/13 | USD | 440,000 | Morgan Stanley Capital Services, Inc. | (7) | 1.07% (fixed rate) | (5,087 | ) | ||||||
| 6/20/13 | USD | 440,000 | JPMorgan Chase Bank | (8) | 3.1% (fixed rate) | 18,180 | |||||||
| 6/20/13 | USD | 440,000 | Morgan Stanley Capital Services, Inc. | (9) | 1.07% (fixed rate) | 85 | |||||||
| 6/20/13 | USD | 250,000 | JPMorgan Chase Bank | (10) | 1.12% (fixed rate) | (436 | ) | ||||||
| 6/20/13 | USD | 180,000 | JPMorgan Chase Bank | (10) | 1.1% (fixed rate) | (154 | ) | ||||||
| 6/20/13 | USD | 440,000 | JPMorgan Chase Bank | (11) | 0.85% (fixed rate) | 5,506 | |||||||
| 6/20/13 | USD | 430,000 | Morgan Stanley Capital Services, Inc. | (12) | 1.48% (fixed rate) | 12,974 | |||||||
| 9/20/13 | USD | 470,000 | Merrill Lynch International | (13) | 0.77% (fixed rate) | 3,819 | |||||||
| 9/20/13 | USD | 470,000 | Morgan Stanley Capital Services, Inc. | (14) | 0.99% (fixed rate) | 569 | |||||||
| 9/20/13 | USD | 280,000 | Goldman Sachs International | (15) | 0.645% (fixed rate) | 252 | |||||||
| 9/20/13 | USD | 170,000 | Goldman Sachs International | (15) | 0.645% (fixed rate) | 157 | |||||||
| 9/20/13 | USD | 470,000 | Merrill Lynch International | (16) | 1.05% (fixed rate) | 3,840 | |||||||
| $32,947 | |||||||||||||
10
Table of Contents
Portfolio of Investments (unaudited) – continued
| (1) | Fund to receive notional amount upon a defined credit event by Boston Properties, Inc., 6.25%, 1/15/13. |
| (2) | Fund to receive notional amount upon a defined credit event by Equity Residential, 5.75%, 6/15/17. |
| (3) | Fund to receive notional amount upon a defined credit event by Kimco Realty Corp., 5.98%, 7/30/12. |
| (4) | Fund to receive notional amount upon a defined credit event by ProLogis Trust, 7.1%, 4/15/08. |
| (5) | Fund to receive notional amount upon a defined credit event by Simon Properties Group, Inc., 6.35%, 8/28/12. |
| (6) | Fund to receive notional amount upon a defined credit event by Allstate Corp., 6.75%, 5/15/18. |
| (7) | Fund to receive notional amount upon a defined credit event by Arrow Electronics, Inc., 6.875%, 6/01/18. |
| (8) | Fund to receive notional amount upon a defined credit event by Capital One Financial, Inc., 6.25%, 11/15/13. |
| (9) | Fund to receive notional amount upon a defined credit event by Nordstrom, Inc., 6.95%, 3/15/28. |
| (10) | Fund to receive notional amount upon a defined credit event by Universal Health Services, Inc., 7.125%, 6/30/16. |
| (11) | Fund to receive notional amount upon a defined credit event by Wells Fargo & Co., 3.107%, 10/28/15. |
| (12) | Fund to receive notional amount upon a defined credit event by Weyerhaeuser Co., 7.125%, 7/15/23. |
| (13) | Fund to receive notional amount upon a defined credit event by AutoZone, Inc., 5.875%, 10/15/12. |
| (14) | Fund to receive notional amount upon a defined credit event by British Telecom PLC, 5.75%, 12/07/28. |
| (15) | Fund to receive notional amount upon a defined credit event by CIGNA Corp., 7.875%, 5/15/27. |
| (16) | Fund to receive notional amount upon a defined credit event by Whirlpool Corp., 7.75%, 7/15/16. |
At June 30, 2008 the fund had sufficient cash and/or other liquid securities to cover any commitments under these derivative contracts.
See Notes to Financial Statements
11
Table of Contents
FINANCIAL STATEMENTS | STATEMENT OF ASSETS AND LIABILITIES (unaudited)
This statement represents your fund’s balance sheet, which details the assets and liabilities comprising the total value of the fund.
At 6/30/08 | |||||
Assets | |||||
Investments, at value (identified cost, $206,130,862) | $202,098,606 | ||||
Cash | 153,371 | ||||
Receivable for daily variation margin on open futures contracts | 875 | ||||
Receivable for investments sold | 75,475 | ||||
Receivable for fund shares sold | 718,150 | ||||
Interest receivable | 2,193,444 | ||||
Swaps, at value | 66,279 | ||||
Other assets | 1,302 | ||||
Total assets | $205,307,502 | ||||
Liabilities | |||||
Payable for investments purchased | $1,724,081 | ||||
Payable for fund shares reacquired | 165,152 | ||||
Swaps, at value | 33,332 | ||||
Payable to affiliates | |||||
Management fee | 11,208 | ||||
Shareholder servicing costs | 344 | ||||
Distribution fees | 471 | ||||
Administrative services fee | 397 | ||||
Payable for independent trustees’ compensation | 708 | ||||
Accrued expenses and other liabilities | 52,546 | ||||
Total liabilities | $1,988,239 | ||||
Net assets | $203,319,263 | ||||
Net assets consist of | |||||
Paid-in capital | $204,414,687 | ||||
Unrealized appreciation (depreciation) on investments | (4,040,661 | ) | |||
Accumulated net realized gain (loss) on investments | (1,431,233 | ) | |||
Undistributed net investment income | 4,376,470 | ||||
Net assets | $203,319,263 | ||||
Shares of beneficial interest outstanding | 17,946,684 | ||||
Initial Class shares | |||||
Net assets | $186,183,044 | ||||
Shares outstanding | 16,425,285 | ||||
Net asset value per share | $11.34 | ||||
Service Class shares | |||||
Net assets | $17,136,219 | ||||
Shares outstanding | 1,521,399 | ||||
Net asset value per share | $11.26 |
See Notes to Financial Statements
12
Table of Contents
FINANCIAL STATEMENTS | STATEMENT OF OPERATIONS (unaudited)
This statement describes how much your fund earned in investment income and accrued in expenses. It also describes any gains and/or losses generated by fund operations.
| Six months ended 6/30/08 | ||||||
| Net investment income | ||||||
Income | ||||||
Interest | $4,962,339 | |||||
Foreign taxes withheld | (884 | ) | ||||
Total investment income | $4,961,455 | |||||
Expenses | ||||||
Management fee | $579,711 | |||||
Distribution fees | 21,951 | |||||
Shareholder servicing costs | 17,547 | |||||
Administrative services fee | 17,393 | |||||
Independent trustees’ compensation | 2,634 | |||||
Custodian fee | 26,313 | |||||
Shareholder communications | 5,706 | |||||
Auditing fees | 28,185 | |||||
Legal fees | 1,198 | |||||
Miscellaneous | 9,209 | |||||
Total expenses | $709,847 | |||||
Fees paid indirectly | (2,033 | ) | ||||
Reduction of expenses by investment adviser | (97,299 | ) | ||||
Net expenses | $610,515 | |||||
Net investment income | $4,350,940 | |||||
Realized and unrealized gain (loss) on investments | ||||||
Realized gain (loss) (identified cost basis) | ||||||
Investment transactions | $218,212 | |||||
Futures contracts | 12,706 | |||||
Swap transactions | (65,320 | ) | ||||
Net realized gain (loss) on investments | $165,598 | |||||
Change in unrealized appreciation (depreciation) | ||||||
Investments | $(3,776,381 | ) | ||||
Futures contracts | (52,799 | ) | ||||
Swap transactions | 59,517 | |||||
Net unrealized gain (loss) on investments | $(3,769,663 | ) | ||||
Net realized and unrealized gain (loss) on investments | $(3,604,065 | ) | ||||
Change in net assets from operations | $746,875 |
See Notes to Financial Statements
13
Table of Contents
FINANCIAL STATEMENTS | STATEMENTS OF CHANGES IN NET ASSETS
These statements describe the increases and/or decreases in net assets resulting from operations, any distributions, and any shareholder transactions.
| Six months ended 6/30/08 |
| Year ended 12/31/07 | | |||
Change in net assets | (unaudited | ) | ||||
From operations | ||||||
Net investment income | $4,350,940 | $5,492,499 | ||||
Net realized gain (loss) on investments | 165,598 | (7,888 | ) | |||
Net unrealized gain (loss) on investments | (3,769,663 | ) | (435,761 | ) | ||
Change in net assets from operations | $746,875 | $5,048,850 | ||||
Distributions declared to shareholders | ||||||
From net investment income | ||||||
Initial Class | $(5,325,182 | ) | $(2,658,129 | ) | ||
Service Class | (454,581 | ) | (550,439 | ) | ||
Total distributions declared to shareholders | $(5,779,763 | ) | $(3,208,568 | ) | ||
Change in net assets from fund share transactions | $50,730,045 | $72,085,308 | ||||
Total change in net assets | $45,697,157 | $73,925,590 | ||||
Net assets | ||||||
At beginning of period | 157,622,106 | 83,696,516 | ||||
At end of period (including undistributed net investment income of $4,376,470 and | $203,319,263 | $157,622,106 |
See Notes to Financial Statements
14
Table of Contents
FINANCIAL STATEMENTS | FINANCIAL HIGHLIGHTS
The financial highlights table is intended to help you understand the fund’s financial performance for the semiannual period and the past 5 fiscal years. Certain information reflects financial results for a single fund share. The total returns in the table represent the rate by which an investor would have earned (or lost) on an investment in the fund share class (assuming reinvestment of all distributions) held for the entire period.
| Initial Class | Six months ended 6/30/08 | Years ended 12/31 | ||||||||||||||||
| 2007 | 2006 | 2005 | 2004 | 2003 | ||||||||||||||
| (unaudited) | ||||||||||||||||||
Net asset value, beginning of period | $11.60 | $11.51 | $11.61 | $12.16 | $12.19 | $11.82 | ||||||||||||
Income (loss) from investment operations | ||||||||||||||||||
Net investment income (d) | $0.26 | $0.55 | $0.53 | $0.51 | $0.59 | $0.62 | ||||||||||||
Net realized and unrealized gain (loss) on investments | (0.18 | ) | (0.08 | ) | (0.08 | ) | (0.34 | ) | 0.11 | 0.45 | ||||||||
Total from investment operations | $0.08 | $0.47 | $0.45 | $0.17 | $0.70 | $1.07 | ||||||||||||
Less distributions declared to shareholders | ||||||||||||||||||
From net investment income | $(0.34 | ) | $(0.38 | ) | $(0.49 | ) | $(0.62 | ) | $(0.73 | ) | $(0.70 | ) | ||||||
From net realized gain on investments | — | — | (0.06 | ) | (0.10 | ) | — | — | ||||||||||
Total distributions declared to shareholders | $(0.34 | ) | $(0.38 | ) | $(0.55 | ) | $(0.72 | ) | $(0.73 | ) | $(0.70 | ) | ||||||
Net asset value, end of period | $11.34 | $11.60 | $11.51 | $11.61 | $12.16 | $12.19 | ||||||||||||
Total return (%) (k)(r)(s) | 0.65 | (n) | 4.21 | 4.05 | 1.51 | 6.06 | 9.34 | |||||||||||
| Ratios (%) (to average net assets) and Supplemental data: | ||||||||||||||||||
Expenses before expense reductions (f) | 0.71 | (a) | 0.77 | 0.94 | 1.12 | 0.99 | 0.94 | |||||||||||
Expenses after expense reductions (f) | 0.61 | (a) | 0.67 | 0.70 | 0.73 | 0.75 | 0.75 | |||||||||||
Net investment income | 4.52 | (a) | 4.80 | 4.69 | 4.40 | 4.88 | 5.04 | |||||||||||
Portfolio turnover | 79 | 74 | 51 | 88 | 55 | 116 | ||||||||||||
Net assets at end of period (000 Omitted) | $186,183 | $139,275 | $66,875 | $36,738 | $28,881 | $31,981 | ||||||||||||
See Notes to Financial Statements
15
Table of Contents
Financial Highlights – continued
| Service Class | Six months ended 6/30/08 | Years ended 12/31 | ||||||||||||||||
| 2007 | 2006 | 2005 | 2004 | 2003 | ||||||||||||||
| (unaudited) | ||||||||||||||||||
Net asset value, beginning of period | $11.51 | $11.43 | $11.54 | $12.11 | $12.16 | $11.81 | ||||||||||||
Income (loss) from investment operations | ||||||||||||||||||
Net investment income (d) | $0.24 | $0.52 | $0.50 | $0.48 | $0.55 | $0.54 | ||||||||||||
Net realized and unrealized gain (loss) on investments | (0.18 | ) | (0.08 | ) | (0.08 | ) | (0.35 | ) | 0.12 | 0.51 | ||||||||
Total from investment operations | $0.06 | $0.44 | $0.42 | $0.13 | $0.67 | $1.05 | ||||||||||||
Less distributions declared to shareholders | ||||||||||||||||||
From net investment income | $(0.31 | ) | $(0.36 | ) | $(0.47 | ) | $(0.60 | ) | $(0.72 | ) | $(0.70 | ) | ||||||
From net realized gain on investments | — | — | (0.06 | ) | (0.10 | ) | — | — | ||||||||||
Total distributions declared to shareholders | $(0.31 | ) | $(0.36 | ) | $(0.53 | ) | $(0.70 | ) | $(0.72 | ) | $(0.70 | ) | ||||||
Net asset value, end of period | $11.26 | $11.51 | $11.43 | $11.54 | $12.11 | $12.16 | ||||||||||||
Total return (%) (k)(r)(s) | 0.48 | (n) | 3.92 | 3.79 | 1.22 | 5.80 | 9.14 | |||||||||||
| Ratios (%) (to average net assets) and Supplemental data: | ||||||||||||||||||
Expenses before expense reductions (f) | 0.96 | (a) | 1.03 | 1.20 | 1.37 | 1.24 | 1.19 | |||||||||||
Expenses after expense reductions (f) | 0.86 | (a) | 0.93 | 0.95 | 0.98 | 1.00 | 1.01 | |||||||||||
Net investment income | 4.26 | (a) | 4.55 | 4.44 | 4.16 | 4.66 | 4.53 | |||||||||||
Portfolio turnover | 79 | 74 | 51 | 88 | 55 | 116 | ||||||||||||
Net assets at end of period (000 Omitted) | $17,136 | $18,347 | $16,822 | $12,860 | $6,558 | $2,419 | ||||||||||||
| (a) | Annualized. |
| (d) | Per share data is based on average shares outstanding. |
| (f) | Ratios do not reflect reductions from fees paid indirectly, if applicable. |
| (k) | The total return does not reflect expenses that apply to separate accounts. Inclusion of these charges would reduce the total return figures for all periods shown. |
| (n) | Not annualized. |
| (r) | Certain expenses have been reduced without which performance would have been lower. |
| (s) | From time to time the fund may receive proceeds from litigation settlements, without which performance would be lower. |
See Notes to Financial Statements
16
Table of Contents
NOTES TO FINANCIAL STATEMENTS (unaudited)
| (1) | Business and Organization |
MFS Research Bond Series (the fund) is a series of MFS Variable Insurance Trust (the trust). The trust is organized as a Massachusetts business trust and is registered under the Investment Company Act of 1940, as amended, as an open-end management investment company. The shareholders of each series of the trust are separate accounts of insurance companies, which offer variable annuity and/or life insurance products, and qualified retirement and pension plans.
| (2) | Significant Accounting Policies |
General – The preparation of financial statements in conformity with U.S. generally accepted accounting principles requires management to make estimates and assumptions that affect the reported amounts of assets and liabilities, and disclosure of contingent assets and liabilities at the date of the financial statements and the reported amounts of revenues and expenses during the reporting period. Actual results could differ from those estimates. The fund may invest a significant portion of its assets in mortgage-backed securities. The value of mortgage-backed securities may depend, in part, on the issuer’s or borrower’s credit quality or ability to pay principal and interest when due and may fall if an issuer or borrower defaults on its obligation to pay principal or interest or if the instrument’s credit rating is downgraded by a credit rating agency. U.S. Government securities not supported as to the payment of principal or interest by the U.S. Treasury, such as those issued by Fannie Mae, Freddie Mac, and the Federal Home Loan Banks, are subject to greater credit risk than are U.S. Government securities supported by the U.S. Treasury, such as those issued by Ginnie Mae. The fund can invest in foreign securities, including securities of emerging market issuers. Investments in foreign securities are vulnerable to the effects of changes in the relative values of the local currency and the U.S. dollar and to the effects of changes in each country’s legal, political, and economic environment. The markets of emerging markets countries are generally more volatile than the markets of developed countries with more mature economies. All of the risks of investing in foreign securities previously described are heightened when investing in emerging markets countries.
Investment Valuations – Debt instruments and floating rate loans (other than short-term instruments), including restricted debt instruments, are generally valued at an evaluated or composite bid as reported by an independent pricing service. Short-term instruments with a maturity at issuance of 60 days or less may be valued at amortized cost, which approximates market value. Futures contracts are generally valued at last posted settlement price as reported by an independent pricing service on the market on which they are primarily traded. Futures contracts for which there were no trades that day for a particular position are generally valued at the closing bid quotation as reported by an independent pricing service on the market on which such futures contracts are primarily traded. Swaps are generally valued at an evaluated bid as reported by an independent pricing service. Securities and other assets generally valued on the basis of information from an independent pricing service may also be valued at a broker-dealer bid quotation. Values obtained from pricing services can utilize both dealer-supplied valuations and electronic data processing techniques, which take into account factors such as institutional-size trading in similar groups of securities, yield, quality, coupon rate, maturity, type of issue, trading characteristics, and other market data. The values of foreign securities and other assets and liabilities expressed in foreign currencies are converted to U.S. dollars using the mean of bid and asked prices for rates reported by an independent pricing service.
The Board of Trustees has delegated primary responsibility for determining or causing to be determined the value of the fund’s investments (including any fair valuation) to the adviser pursuant to valuation policies and procedures approved by the Board. If the adviser determines that reliable market quotations are not readily available, investments are valued at fair value as determined in good faith by the adviser in accordance with such procedures under the oversight of the Board of Trustees. Under the fund’s valuation policies and procedures, market quotations are not considered to be readily available for most types of debt instruments and floating rate loans and many types of derivatives. These investments are generally valued at fair value based on information from independent pricing services. In addition, investments may be valued at fair value if the adviser determines that an investment’s value has been materially affected by events occurring after the close of the exchange or market on which the investment is principally traded (such as foreign exchange or market) and prior to the determination of the fund’s net asset value, or after the halting of trading of a specific security where trading does not resume prior to the close of the exchange or market on which the security is principally traded. The adviser may rely on independent pricing services or other information (such as the correlation with price movements of similar securities in the same or other markets; the type, cost and investment characteristics of the security; the business and financial condition of the issuer; and trading and other market data) to assist in determining whether to fair value and at what value to fair value an investment. The value of an investment for purposes of calculating the fund’s net asset value can differ depending on the source and method used to determine value. When fair valuation is used, the value of investments used to determine the fund’s net asset value may differ from quoted or published prices for the same investments.
The fund adopted FASB Statement No. 157, Fair Value Measurements (the “Statement”) in this reporting period. This Statement provides a single definition of fair value, a hierarchy for measuring fair value and expanded disclosures about fair value measurements.
17
Table of Contents
Notes to Financial Statements (unaudited) – continued
Various inputs are used in determining the value of the fund’s assets or liabilities carried at market value. These inputs are categorized into three broad levels. Level 1 includes quoted prices in active markets for identical assets or liabilities. Level 2 includes other significant observable market-based inputs (including quoted prices for similar securities, interest rates, prepayment speed, and credit risk). Level 3 includes unobservable inputs, which may include the adviser’s own assumptions in determining the fair value of investments. Other financial instruments are derivative instruments not reflected in total investments, such as futures, forwards, swap contracts and written options, which are valued at the unrealized appreciation/depreciation on the instrument. The following is a summary of the levels used as of June 30, 2008 in valuing the fund’s assets or liabilities carried at market value:
| Level 1 | Level 2 | Level 3 | Total | |||||||
| Investments in Securities | $— | $202,098,606 | $— | $202,098,606 | ||||||
| Other Financial Instruments | $(41,352 | ) | $32,947 | $— | $(8,405 | ) |
Repurchase Agreements – The fund may enter into repurchase agreements with institutions that the fund’s investment adviser has determined are creditworthy. Each repurchase agreement is recorded at cost. The fund requires that the securities collateral in a repurchase transaction be transferred to a custodian in a manner sufficient to enable the fund to obtain those securities in the event of a default under the repurchase agreement. The fund monitors, on a daily basis, the value of the collateral to ensure that its value, including accrued interest, is greater than amounts owed to the fund under each such repurchase agreement. The fund and other funds managed by Massachusetts Financial Services Company (MFS), may utilize a joint trading account for the purpose of entering into one or more repurchase agreements.
Inflation-Adjusted Debt Securities – The fund invests in inflation-adjusted debt securities issued by the U.S. Treasury. The fund may also invest in inflation-adjusted debt securities issued by U.S. Government agencies and instrumentalities other than the U.S. Treasury and by other entities such as U.S. and foreign corporations and foreign governments. The principal value of these debt securities is adjusted through income according to changes in the Consumer Price Index or another general price or wage index. These debt securities typically pay a fixed rate of interest, but this fixed rate is applied to the inflation-adjusted principal amount. The principal paid at maturity of the debt security is typically equal to the inflation-adjusted principal amount, or the security’s original par value, whichever is greater. Other types of inflation-adjusted securities may use other methods to adjust for other measures of inflation.
Foreign Currency Translation – Purchases and sales of foreign investments, income, and expenses are converted into U.S. dollars based upon currency exchange rates prevailing on the respective dates of such transactions. Gains and losses attributable to foreign currency exchange rates on sales of securities are recorded for financial statement purposes as net realized gains and losses on investments. Gains and losses attributable to foreign exchange rate movements on income and expenses are recorded for financial statement purposes as foreign currency transaction gains and losses. That portion of both realized and unrealized gains and losses on investments that results from fluctuations in foreign currency exchange rates is not separately disclosed.
Derivative Risk – The fund may invest in derivatives for hedging or non-hedging purposes. While hedging can reduce or eliminate losses, it can also reduce or eliminate gains. When the fund uses derivatives as an investment to gain market exposure, or for hedging purposes, gains and losses from derivative instruments may be substantially greater than the derivative’s original cost. Cash that has been segregated on behalf of certain derivative contracts will be reported separately on the Statement of Assets and Liabilities as restricted cash. On certain over-the-counter derivatives, the fund attempts to reduce its exposure to counterparty credit risk by entering into an ISDA Master Agreement on a bilateral basis with each of the counterparties with whom it undertakes a significant volume of transactions. The ISDA Master Agreement gives the fund the right, upon an event of default by the applicable counterparty, to close out all transactions traded under such agreement and to net amounts owed under each transaction to one net amount payable by one party to the other. This right to close out and net payments across all transactions traded under the ISDA Master Agreement could result in a reduction of the fund’s credit risk to such counterparty equal to any amounts payable by the fund under the applicable transactions, if any. However, absent an event of default by the counterparty, the ISDA Master Agreement does not result in an offset of reported balance sheet assets and liabilities across transactions between the fund and the applicable counterparty. Derivative instruments include futures contracts and swap agreements.
Futures Contracts – The fund may enter into futures contracts for the delayed delivery of securities or currency, or contracts based on financial indices at a fixed price on a future date. In entering such contracts, the fund is required to deposit with the broker either in cash or securities an amount equal to a certain percentage of the contract amount. Subsequent payments are made or received by the fund each day, depending on the daily fluctuations in the value of the contract, and are recorded for financial statement purposes as unrealized gains or losses by the fund. Upon entering into such contracts, the fund bears the risk of interest or exchange rates or securities prices moving unexpectedly, in which case, the fund may not achieve the anticipated benefits of the futures contracts and may realize a loss.
18
Table of Contents
Notes to Financial Statements (unaudited) – continued
Swap Agreements – The fund may enter into swap agreements. A swap is an exchange of cash payments between the fund and another party. Net cash payments are exchanged at specified intervals and are recorded as a realized gain or loss in the Statement of Operations. The value of the swap is adjusted daily and the change in value, including accruals of periodic amounts of interest to be paid or received, is recorded as unrealized appreciation or depreciation in the Statement of Operations. Amounts paid or received at the inception of the swap are reflected as premiums paid or received on the Statement of Assets and Liabilities and are amortized using the effective interest method over the term of the agreement. A liquidation payment received or made upon early termination is recorded as a realized gain or loss in the Statement of Operations. Collateral, in the form of cash or securities, may be required to be held in segregated accounts with the fund’s custodian in connection with these agreements. Risk of loss may exceed amounts recognized on the Statement of Assets and Liabilities. These risks include the possible lack of a liquid market, failure of the counterparty to perform under the terms of the agreements, and unfavorable market and interest rate movements of the underlying instrument.
The fund holds credit default swaps in which one party makes a stream of payments based on a fixed percentage applied to the notional amount to another party in exchange for the right to receive a specified return in the event of a default by a third party, such as a corporate issuer or foreign issuer, on its obligation. The fund may enter into credit default swaps to limit or to reduce its risk exposure to defaults of corporate and sovereign issuers or to create direct or synthetic short or long exposure to corporate debt securities or certain sovereign debt securities to which it is not otherwise exposed.
In March 2008, FASB Statement No. 161, Disclosures about Derivative Instruments and Hedging Activities (the “Standard”) was issued, and is effective for financial statements issued for fiscal years and interim periods beginning after November 15, 2008. This Standard provides enhanced disclosures about the fund’s use of and accounting for derivative instruments and the effect of derivative instruments on the fund’s results of operations and financial position. Management is evaluating the application of the Standard to the fund, and has not at this time determined the impact, if any, resulting from the adoption of this Standard on the fund’s financial statements.
Loans and Other Direct Debt Instruments – The fund may invest in loans and loan participations or other receivables. These investments may include standby financing commitments, including revolving credit facilities, which obligate the fund to supply additional cash to the borrower on demand. Loan participations involve a risk of insolvency of the lending bank or other financial intermediary.
Indemnifications – Under the fund’s organizational documents, its officers and trustees may be indemnified against certain liabilities and expenses arising out of the performance of their duties to the fund. Additionally, in the normal course of business, the fund enters into agreements with service providers that may contain indemnification clauses. The fund’s maximum exposure under these agreements is unknown as this would involve future claims that may be made against the fund that have not yet occurred.
Investment Transactions and Income – Investment transactions are recorded on the trade date. Interest income is recorded on the accrual basis. All premium and discount is amortized or accreted for financial statement purposes in accordance with U.S. generally accepted accounting principles. The fund earns certain fees in connection with its floating rate loan purchasing activities. These fees are in addition to interest payments earned and may include amendment fees, commitment fees, facility fees, consent fees, and prepayment fees. Commitment fees are recorded on an accrual basis as income in the accompanying financial statements.
The fund may receive proceeds from litigation settlements. Any proceeds received from litigation involving portfolio holdings are reflected in the Statement of Operations in realized gain/loss if the security has been disposed of by the fund or in unrealized gain/loss if the security is still held by the fund. Any other proceeds from litigation not related to portfolio holdings are reflected as other income in the Statement of Operations.
Fees Paid Indirectly – The fund’s custody fee may be reduced according to an arrangement that measures the value of cash deposited with the custodian by the fund. This amount, for the six months ended June 30, 2008, is shown as a reduction of total expenses on the Statement of Operations.
Tax Matters and Distributions – The fund intends to qualify as a regulated investment company, as defined under Subchapter M of the Internal Revenue Code, and to distribute all of its taxable income, including realized capital gains. As a result, no provision for federal income tax is required. The fund adopted the provisions of FASB Interpretation No. 48, Accounting for Uncertainty in Income Taxes (“the Interpretation”). The Interpretation prescribes a minimum threshold for financial statement recognition of the benefit of a tax position taken or expected to be taken in a tax return. There was no impact resulting from the adoption of this Interpretation on the fund’s financial statements. Each of the fund’s federal tax returns for the prior three fiscal years remains subject to examination by the Internal Revenue Service. It is the fund’s policy to record interest and penalty charges on underpaid taxes associated with its tax positions as interest expense and miscellaneous expense, respectively. No such charges were recorded in the current financial statements. Foreign taxes, if any, have been accrued by the fund in the accompanying financial statements.
19
Table of Contents
Notes to Financial Statements (unaudited) – continued
Distributions to shareholders are recorded on the ex-dividend date. Income and capital gain distributions are determined in accordance with income tax regulations, which may differ from U.S. generally accepted accounting principles. Certain capital accounts in the financial statements are periodically adjusted for permanent differences in order to reflect their tax character. These adjustments have no impact on net assets or net asset value per share. Temporary differences which arise from recognizing certain items of income, expense, gain or loss in different periods for financial statement and tax purposes will reverse at some time in the future. Distributions in excess of net investment income or net realized gains are temporary overdistributions for financial statement purposes resulting from differences in the recognition or classification of income or distributions for financial statement and tax purposes.
Book/tax differences primarily relate to amortization and accretion of debt securities, wash sale loss deferrals, and derivative transactions.
The tax character of distributions made during the current period will be determined at fiscal year end. The tax character of distributions declared to shareholders is as follows:
| 12/31/07 | ||
| Ordinary income (including any short-term capital gains) | $3,208,568 | |
| Long-term capital gain | — | |
| Total distributions | $3,208,568 |
The federal tax cost and the tax basis components of distributable earnings were as follows:
| As of 6/30/08 | |||
| Cost of investments | $206,716,864 | ||
| Gross appreciation | 685,588 | ||
| Gross depreciation | (5,303,846 | ) | |
| Net unrealized appreciation (depreciation) | $(4,618,258 | ) | |
| As of 12/31/07 | |||
| Undistributed ordinary income | 5,779,282 | ||
| Capital loss carryforwards | (1,133,068 | ) | |
| Other temporary differences | (9,644 | ) | |
| Net unrealized appreciation (depreciation) | (699,106 | ) | |
The aggregate cost above includes prior fiscal year end tax adjustments.
As of December 31, 2007 the fund had capital loss carryforwards available to offset future realized gains. Such losses expire as follows:
| 12/31/14 | $ (784,459 | ) | |
| 12/31/15 | (348,609 | ) | |
| Total | $(1,133,068 | ) |
Multiple Classes of Shares of Beneficial Interest – The fund offers multiple classes of shares, which differ in their respective distribution and service fees. The fund’s income, realized and unrealized gain (loss), and common expenses are allocated to shareholders based on the daily net assets of each class, without distinction between share classes. Dividends are declared separately for each class. Differences in per share dividend rates are generally due to differences in separate class expenses.
| (3) | Transactions with Affiliates |
Investment Adviser – The fund has an investment advisory agreement with MFS to provide overall investment management and related administrative services and facilities to the fund. The management fee is computed daily and paid monthly at an annual rate of 0.60% of the fund’s average daily net assets. The investment adviser has agreed in writing to reduce its management fee to 0.50% of average daily net assets. This written agreement may be rescinded only upon consent of the fund’s Board of Trustees. This management fee reduction amounted to $96,750, which is shown as a reduction of total expenses in the Statement of Operations. The management fee incurred for the six months ended June 30, 2008 was equivalent to an annual effective rate 0.50% of the fund’s average daily net assets.
The investment adviser has agreed in writing to pay a portion of the fund’s operating expenses, exclusive of management, distribution, and certain other fees and expenses, such that operating expenses do not exceed 0.20% annually of the fund’s average daily net assets. This written agreement will continue through April 30, 2009 unless changed or rescinded by the fund’s Board of Trustees. For the six months ended June 30, 2008, the fund’s actual operating expenses did not exceed the limit and therefore, the investment adviser did not pay any portion of the fund’s expenses.
20
Table of Contents
Notes to Financial Statements (unaudited) – continued
Distributor – MFS Fund Distributors, Inc. (MFD), a wholly-owned subsidiary of MFS, is the distributor of shares of the fund. The Trustees have adopted a distribution plan for the Service Class shares pursuant to Rule 12b-1 under the Investment Company Act of 1940.
The fund’s distribution plan provides that the fund will pay MFD distribution fees equal to 0.25% per annum of its average daily net assets attributable to Service Class shares as partial consideration for services performed and expenses incurred by MFD and financial intermediaries (including participating insurance companies that invest in the fund to fund variable annuity and variable life insurance contracts, sponsors of qualified retirement and pension plans that invest in the fund, and affiliates of these participating insurance companies and plan sponsors) in connection with the sale and distribution of the Service Class shares. MFD may subsequently pay all, or a portion, of the distribution fees to financial intermediaries.
Shareholder Servicing Agent – MFS Service Center, Inc. (MFSC), a wholly-owned subsidiary of MFS, receives a fee from the fund for its services as shareholder servicing agent. For the six months ended June 30, 2008, the fee was $17,519, which equated to 0.0181% annually of the fund’s average daily net assets. MFSC also receives payment from the fund for out-of-pocket expenses paid by MFSC on behalf of the fund. For the six months ended June 30, 2008, these costs amounted to $28.
Administrator – MFS provides certain financial, legal, shareholder communications, compliance, and other administrative services to the fund. Under an administrative services agreement, the fund partially reimburses MFS the costs incurred to provide these services. The fund is charged a fixed amount plus a fee based on average daily net assets. The fund’s annual fixed amount is $17,500.
The administrative services fee incurred for the six months ended June 30, 2008 was equivalent to an annual effective rate of 0.0180% of the fund’s average daily net assets.
Trustees’ and Officers’ Compensation – The fund pays compensation to independent trustees in the form of a retainer, attendance fees, and additional compensation to Board and Committee chairpersons. The fund does not pay compensation directly to trustees or officers of the fund who are also officers of the investment adviser, all of whom receive remuneration for their services to the fund from MFS. Certain officers and trustees of the fund are officers or directors of MFS, MFD, and MFSC.
Other – This fund and certain other MFS funds (the funds) have entered into a services agreement (the Agreement) which provides for payment of fees by the funds to Tarantino LLC in return for the provision of services of an Independent Chief Compliance Officer (ICCO) for the funds. The ICCO is an officer of the funds and the sole member of Tarantino LLC. The funds can terminate the Agreement with Tarantino LLC at any time under the terms of the Agreement. For the six months ended June 30, 2008, the fee paid by the fund to Tarantino LLC was $554 and is included in miscellaneous expense on the Statement of Operations. MFS has agreed to reimburse the fund for a portion of the payments made by the fund to Tarantino LLC in the amount of $549, which is shown as a reduction of total expenses in the Statement of Operations. Additionally, MFS has agreed to bear all expenses associated with office space, other administrative support, and supplies provided to the ICCO.
| (4) | Portfolio Securities |
Purchases and sales of investments, other than purchased option transactions and short-term obligations, were as follows:
| Purchases | Sales | |||
| U.S. Government securities | $129,489,057 | $113,198,152 | ||
| Investments (non-U.S. Government securities) | $76,636,528 | $35,352,245 |
21
Table of Contents
Notes to Financial Statements (unaudited) – continued
| (5) | Shares of Beneficial Interest |
The fund’s Declaration of Trust permits the Trustees to issue an unlimited number of full and fractional shares of beneficial interest. Transactions in fund shares were as follows:
| Six months ended 6/30/08 | Year ended 12/31/07 | |||||||||||
| Shares | Amount | Shares | Amount | |||||||||
| Shares sold | ||||||||||||
Initial Class | 5,910,712 | $68,731,406 | 6,995,632 | $79,873,299 | ||||||||
Service Class | 99,425 | 1,139,689 | 296,200 | 3,362,262 | ||||||||
| 6,010,137 | $69,871,095 | 7,291,832 | $83,235,561 | |||||||||
| Shares issued to shareholders in reinvestment of distributions | ||||||||||||
Initial Class | 470,422 | $5,325,182 | 236,068 | $2,658,129 | ||||||||
Service Class | 40,408 | 454,581 | 49,146 | 550,439 | ||||||||
| 510,830 | $5,779,763 | 285,214 | $3,208,568 | |||||||||
| Shares reacquired | ||||||||||||
Initial Class | (1,964,294 | ) | $(22,478,417 | ) | (1,035,428 | ) | $(11,825,531 | ) | ||||
Service Class | (212,318 | ) | (2,442,396 | ) | (223,580 | ) | (2,533,290 | ) | ||||
| (2,176,612 | ) | $(24,920,813 | ) | (1,259,008 | ) | $(14,358,821 | ) | |||||
| Net change | ||||||||||||
Initial Class | 4,416,840 | $51,578,171 | 6,196,272 | $70,705,897 | ||||||||
Service Class | (72,485 | ) | (848,126 | ) | 121,766 | 1,379,411 | ||||||
| 4,344,355 | $50,730,045 | 6,318,038 | $72,085,308 | |||||||||
| (6) | Line of Credit |
The fund and other funds managed by MFS participate in a $1 billion unsecured committed line of credit provided by a syndication of banks under a credit agreement. In addition, the fund and other funds managed by MFS have established uncommitted borrowing arrangements with certain banks. Borrowings may be made for temporary financing needs. Interest is charged to each fund, based on its borrowings, generally at a rate equal to the Federal Reserve funds rate plus 0.30%. In addition, a commitment fee, based on the average daily, unused portion of the committed line of credit, is allocated among the participating funds at the end of each calendar quarter. For the six months ended June 30, 2008, the fund’s commitment fee and interest expense were $324 and $0, respectively, and are included in miscellaneous expense on the Statement of Operations.
22
Table of Contents
BOARD REVIEW OF INVESTMENT ADVISORY AGREEMENT
A discussion regarding the Board’s most recent review and renewal of the fund’s Investment Advisory Agreement with MFS will be available on or about November 1, 2008 by clicking on the fund’s name under “Variable Insurance Portfolios - VIT” in the “Products and Performance” section of the MFS Web site (mfs.com).
PROXY VOTING POLICIES AND INFORMATION
A general description of the MFS funds’ proxy voting policies and procedures is available without charge, upon request, by calling 1-800-225-2606, by visiting the Proxy Voting section of mfs.com or by visiting the SEC’s Web site at http://www.sec.gov.
Information regarding how the fund voted proxies relating to portfolio securities during the most recent twelve-month period ended June 30 is available without charge by visiting the Proxy Voting section of mfs.com or by visiting the SEC’s Web site at http://www.sec.gov.
QUARTERLY PORTFOLIO DISCLOSURE
The fund will file a complete schedule of portfolio holdings with the Securities and Exchange Commission (the Commission) for the first and third quarters of each fiscal year on Form N-Q. The fund’s Form N-Q may be reviewed and copied at the:
Public Reference Room
Securities and Exchange Commission
100 F Street, NE, Room 1580
Washington, D.C. 20549
Information on the operation of the Public Reference Room may be obtained by calling the Commission at 1-800-SEC-0330. The fund’s Form N-Q is available on the EDGAR database on the Commission’s Internet Web site at http://www.sec.gov, and copies of this information may be obtained, upon payment of a duplicating fee, by electronic request at the following e-mail address: publicinfo@sec.gov or by writing the Public Reference Section at the above address.
23
Table of Contents
Web site
mfs.com
Account service and literature
Shareholders
1-877-411-3325
9 a.m. to 5 p.m. Eastern Time
Investment professionals
1-800-637-8730
8 a.m. to 5 p.m. Eastern Time
Mailing address
MFS Service Center, Inc.
Attn: Institutional Alliance Services (IAS)
P.O. Box 55824
Boston, MA 02205-5824
Overnight mail
MFS Service Center, Inc.
c/o Boston Financial Data Services
30 Dan Road
Canton, MA 02021-2809

Table of Contents
Table of Contents
MFS® RESEARCH INTERNATIONAL SERIES
This report is prepared for the general information of contract owners. It is authorized for distribution to prospective investors only when preceded or accompanied by a current prospectus.
NOT FDIC INSURED Ÿ MAY LOSE VALUE Ÿ NO BANK OR CREDIT UNION GUARANTEE Ÿ NOT A DEPOSIT Ÿ NOT INSURED BY ANY FEDERAL GOVERNMENT AGENCY OR NCUA/NCUSIF
Table of Contents

Dear Contract Owners:
Negative headlines tend to resonate during difficult markets, and we certainly have had more than our share of tough news recently. As a result consumer, and particularly investor, sentiment are at all-time lows. That said, I do think it is helpful to remember there are always silver linings in the storm clouds if you look hard enough.
Through all of the challenges we have faced, there are some positive underlying trends. In the United States, for example, institutional traders and credit market followers are just now showing increasing signs of confidence and are beginning to take on more risk. At the corporate level, earnings continue to be relatively strong as companies have reduced labor costs, controlled inventories, and relied less on debt to finance expansion. More broadly, low interest rates and strong demand for consumer goods and industrial equipment are good signs for the global economy.
While I do not mean to minimize the risks inherent in today’s markets, periods such as these allow the talented fund managers and research analysts we have at MFS® to test their convictions, reevaluate existing positions, and identify new investment ideas. Our investment process also includes a significant risk management component, with constant attention paid to monitoring market risk, so we can do our best to minimize any surprises to your portfolio.
For investors, this is a great time to check in with your advisor and make sure you have a sound investment plan in place — one that can keep your hard-earned money working over the long term through a strategy that involves asset allocation, diversification, and periodic portfolio rebalancing and reviews. A plan tailored to your distinct needs and goals continues to be the best approach to help you take advantage of the inevitable challenges — and opportunities — that present themselves over time.
Respectfully,

Robert J. Manning
Chief Executive Officer and Chief Investment Officer
MFS Investment Management®
August 15, 2008
The opinions expressed in this letter are subject to change, may not be relied upon for investment advice, and no forecasts can be guaranteed.
1
Table of Contents
Portfolio structure
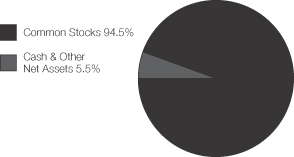
| Top ten holdings | ||
| E.ON AG | 3.0% | |
| TOTAL S.A | 3.0% | |
| BHP Billiton PLC | 3.0% | |
| Roche Holding AG | 2.3% | |
| Nestle S.A. | 2.2% | |
| Statoil A.S.A. | 2.1% | |
| Vodafone Group PLC | 2.0% | |
| Siemens AG | 1.9% | |
| UniCredito Italiano S.p.A. | 1.8% | |
| Akzo Nobel N.V. | 1.8% |
| Equity sectors | ||
| Financial Services | 23.1% | |
| Basic Materials | 11.0% | |
| Utilities & Communications | 10.3% | |
| Energy | 9.6% | |
| Health Care | 7.2% | |
| Consumer Staples | 6.0% | |
| Technology | 5.5% | |
| Industrial Goods & Services | 4.6% | |
| Special Products & Services | 4.4% | |
| Retailing | 3.9% | |
| Autos & Housing | 3.7% | |
| Transportation | 2.8% | |
| Leisure | 2.4% |
| Country weightings | ||
| Japan | 15.1% | |
| United Kingdom | 13.1% | |
| Germany | 11.1% | |
| France | 10.2% | |
| Switzerland | 7.5% | |
| Italy | 5.1% | |
| Netherlands | 3.8% | |
| Brazil | 3.3% | |
| Mexico | 2.9% | |
| Other Countries | 27.9% |
Percentages are based on net assets as of 6/30/08.
The portfolio is actively managed and current holdings may be different.
2
Table of Contents
Fund Expenses Borne by the Contract Holders During the Period,
January 1, 2008 through June 30, 2008
As a contract holder of the fund, you incur ongoing costs, including management fees; distribution (12b-1) fees; and other fund expenses. This example is intended to help you understand your ongoing costs (in dollars) of investing in the fund and to compare these costs with the ongoing costs of investing in other mutual funds.
The example is based on an investment of $1,000 invested at the beginning of the period and held for the entire period January 1, 2008 through June 30, 2008.
Actual Expenses
The first line for each share class in the following table provides information about actual account values and actual expenses. You may use the information in this line, together with the amount you invested, to estimate the expenses that you paid over the period. Simply divide your account value by $1,000 (for example, an $8,600 account value divided by $1,000 = 8.6), then multiply the result by the number in the first line under the heading entitled “Expenses Paid During Period” to estimate the expenses you paid on your account during this period.
Hypothetical Example for Comparison Purposes
The second line for each share class in the following table provides information about hypothetical account values and hypothetical expenses based on the fund's actual expense ratio and an assumed rate of return of 5% per year before expenses, which is not the fund's actual return. The hypothetical account values and expenses may not be used to estimate the actual ending account balance or expenses you paid for the period. You may use this information to compare the ongoing costs of investing in the fund and other funds. To do so, compare this 5% hypothetical example with the 5% hypothetical examples that appear in the shareholder reports of the other funds.
Please note that the expenses shown in the table are meant to highlight the fund's ongoing costs only and do not take into account the fees and expenses imposed under the variable contracts through which your investment in the fund is made. Therefore, the second line for each share class in the table is useful in comparing ongoing costs associated with an investment in vehicles (such as the fund) which fund benefits under variable annuity and variable life insurance contracts and to qualified pension and retirement plans only, and will not help you determine the relative total costs of investing in the fund through variable annuity and variable life insurance contracts. If the fees and expenses imposed under the variable contracts were included, your costs would have been higher.
| Share Class | Annualized Expense Ratio | Beginning Account Value 1/01/08 | Ending Account Value 6/30/08 | Expenses Paid During Period (p) 1/01/08-6/30/08 | ||||||
| Initial Class | Actual | 1.10% | $1,000.00 | $904.60 | $5.21 | |||||
| Hypothetical (h) | 1.10% | $1,000.00 | $1,019.39 | $5.52 | ||||||
| Service Class | Actual | 1.35% | $1,000.00 | $903.49 | $6.39 | |||||
| Hypothetical (h) | 1.35% | $1,000.00 | $1,018.15 | $6.77 |
| (h) | 5% class return per year before expenses. |
| (p) | Expenses paid is equal to each class' annualized expense ratio, as shown above, multiplied by the average account value over the period, multiplied by the number of days in the period, divided by the number of days in the year. |
3
Table of Contents
PORTFOLIO OF INVESTMENTS – 6/30/08 (unaudited)
The Portfolio of Investments is a complete list of all securities owned by your fund. It is categorized by broad-based asset classes.
| Issuer | Shares/Par | Value ($) | |||
| COMMON STOCKS – 94.5% | |||||
| Airlines – 0.2% | |||||
| Grupo Aeroportuario del Centro Norte, S.A.B. de C.V. | 78,200 | $ | 163,134 | ||
| Grupo Aeroportuario del Pacifico S.A. de C.V., ADR | 5,440 | 159,773 | |||
| $ | 322,907 | ||||
| Alcoholic Beverages – 1.6% | |||||
| Diageo PLC | 57,250 | $ | 1,052,320 | ||
| Heineken N.V. | 34,990 | 1,779,162 | |||
| $ | 2,831,482 | ||||
| Apparel Manufacturers – 2.5% | |||||
| Adidas AG | 29,520 | $ | 1,859,353 | ||
| Billabong International Ltd. | 50,353 | 521,408 | |||
| LVMH Moet Hennessy Louis Vuitton S.A. | 19,790 | 2,063,333 | |||
| $ | 4,444,094 | ||||
| Automotive – 1.9% | |||||
| Bayerische Motoren Werke AG | 23,350 | $ | 1,120,985 | ||
| Bridgestone Corp. | 85,100 | 1,302,563 | |||
| Compagnie Generale des Etablissements Michelin | 13,620 | 971,912 | |||
| $ | 3,395,460 | ||||
| Biotechnology – 0.5% | |||||
| Actelion Ltd. (a) | 15,702 | $ | 836,778 | ||
| Broadcasting – 2.4% | |||||
| Grupo Televisa S.A., ADR | 83,810 | $ | 1,979,592 | ||
| WPP Group PLC | 223,130 | 2,149,736 | |||
| $ | 4,129,328 | ||||
| Brokerage & Asset Managers – 1.7% | |||||
| Daiwa Securities Group, Inc. | 237,000 | $ | 2,181,468 | ||
| Julius Baer Holding Ltd. | 12,454 | 834,861 | |||
| $ | 3,016,329 | ||||
| Business Services – 2.5% | |||||
| Bunzl PLC | 62,010 | $ | 807,960 | ||
| JFE Shoji Holdings, Inc. | 35,000 | 263,074 | |||
| Mitsubishi Corp. | 38,700 | 1,277,408 | |||
| Mitsui & Co. Ltd. | 18,000 | 398,076 | |||
| Satyam Computer Services Ltd. | 150,490 | 1,527,985 | |||
| $ | 4,274,503 | ||||
| Chemicals – 0.3% | |||||
| Makhteshim-Agan Industries Ltd. | 62,490 | $ | 583,802 | ||
| Computer Software – Systems – 0.2% | |||||
| HCL Technologies Ltd. | 51,620 | $ | 303,001 | ||
| Conglomerates – 1.9% | |||||
| Siemens AG | 30,050 | $ | 3,328,857 | ||
| Construction – 1.8% | |||||
| Corporacion Moctezuma S.A. de C.V. | 34,900 | $ | 83,907 | ||
| CRH PLC | 30,710 | 894,140 | |||
| Issuer | Shares/Par | Value ($) | |||
| COMMON STOCKS – continued | |||||
| Construction – continued | |||||
| Duratex S.A., IPS | 13,600 | $ | 289,579 | ||
| Geberit AG | 10,339 | 1,516,640 | |||
| SARE Holding S.A. de C.V., “B” (a) | 65,900 | 86,793 | |||
| Urbi Desarrollos Urbanos S.A. de C.V. (a) | 69,800 | 242,007 | |||
| $ | 3,113,066 | ||||
| Consumer Goods & Services – 2.0% | |||||
| Kao Corp. | 51,000 | $ | 1,339,511 | ||
| Kimberly-Clark de Mexico S.A. de C.V., “A” | 197,390 | 803,072 | |||
| Reckitt Benckiser Group PLC | 24,880 | 1,260,795 | |||
| $ | 3,403,378 | ||||
| Containers – 1.1% | |||||
| Brambles Ltd. | 234,140 | $ | 1,959,828 | ||
| Electrical Equipment – 1.9% | |||||
| LS Industrial Systems Co. Ltd. | 14,150 | $ | 695,292 | ||
| OMRON Corp. | 53,500 | 1,150,375 | |||
| Schneider Electric S.A. | 13,349 | 1,439,372 | |||
| $ | 3,285,039 | ||||
| Electronics – 4.0% | |||||
| Konica Minolta Holdings, Inc. | 55,000 | $ | 930,023 | ||
| Ricoh Co. Ltd. | 124,000 | 2,240,619 | |||
| Royal Philips Electronics N.V. | 27,910 | 942,831 | |||
| Samsung Electronics Co. Ltd. | 1,888 | 1,128,053 | |||
| Tokyo Electron Ltd. | 15,500 | 894,610 | |||
| Venture Corp. Ltd. | 110,000 | 793,485 | |||
| $ | 6,929,621 | ||||
| Energy – Independent – 1.3% | |||||
| INPEX Holdings, Inc. | 103 | $ | 1,301,646 | ||
| SK Energy Co. Ltd. | 3,664 | 408,065 | |||
| Talisman Energy, Inc. | 26,780 | 594,205 | |||
| $ | 2,303,916 | ||||
| Energy – Integrated – 7.8% | |||||
| Eni S.p.A. | 59,410 | $ | 2,213,119 | ||
| OAO Gazprom, ADR | 27,010 | 1,563,516 | |||
| Petroleo Brasileiro S.A., ADR | 15,190 | 1,075,908 | |||
| Statoil A.S.A. | 97,200 | 3,627,308 | |||
| TOTAL S.A. | 60,870 | 5,196,336 | |||
| $ | 13,676,187 | ||||
| Engineering – Construction – 0.4% | |||||
| JGC Corp. | 38,000 | $ | 748,998 | ||
| Food & Beverages – 2.4% | |||||
| Nestle S.A. | 84,290 | $ | 3,814,723 | ||
| Nong Shim Co. Ltd. | 1,613 | 344,635 | |||
| $ | 4,159,358 | ||||
| Insurance – 2.1% | |||||
| AXA | 86,920 | $ | 2,562,903 | ||
| Old Mutual PLC | 554,680 | 1,016,685 | |||
| $ | 3,579,588 | ||||
| Internet – 0.2% | |||||
| Universo Online S.A., IPS | 80,900 | $ | 430,643 | ||
4
Table of Contents
Portfolio of Investments (unaudited) – continued
| Issuer | Shares/Par | Value ($) | |||
| COMMON STOCKS – continued | |||||
| Machinery & Tools – 2.3% | |||||
| Assa Abloy AB, “B” | 83,200 | $ | 1,202,936 | ||
| Glory Ltd. | 58,800 | 1,383,562 | |||
| Komatsu Ltd. | 49,800 | 1,390,182 | |||
| $ | 3,976,680 | ||||
| Major Banks – 12.9% | |||||
| Bank of Communications Co. Ltd. | 1,539,000 | $ | 1,802,078 | ||
| Barclays PLC | 345,710 | 2,008,840 | |||
| BNP Paribas | 34,573 | 3,098,656 | |||
| BOC Hong Kong Holdings Ltd. | 681,000 | 1,803,563 | |||
| DBS Group Holdings Ltd. | 160,000 | 2,218,905 | |||
| Erste Bank der oesterreichischen Sparkassen AG | 28,992 | 1,794,097 | |||
| Standard Bank Group Ltd. | 75,124 | 730,882 | |||
| Standard Chartered PLC | 51,629 | 1,461,155 | |||
| Sumitomo Mitsui Financial Group, Inc. | 307 | 2,313,321 | |||
| Unibanco – Uniao de Bancos Brasileiros S.A., ADR | 15,890 | 2,016,918 | |||
| UniCredito Italiano S.p.A. | 523,683 | 3,191,661 | |||
| $ | 22,440,076 | ||||
| Metals & Mining – 5.5% | |||||
| Anglo American PLC | 14,310 | $ | 1,014,353 | ||
| BHP Billiton PLC | 134,620 | 5,174,689 | |||
| Companhia Vale do Rio Doce | 49,700 | 1,786,561 | |||
| Rio Tinto Group | 12,470 | 1,530,118 | |||
| $ | 9,505,721 | ||||
| Natural Gas – Distribution – 0.6% | |||||
| Gaz de France | 16,010 | $ | 1,026,032 | ||
| Network & Telecom – 1.1% | |||||
| Nokia Oyj | 79,290 | $ | 1,943,041 | ||
| Oil Services – 0.5% | |||||
| Saipem S.p.A. | 20,070 | $ | 940,505 | ||
| Other Banks & Diversified Financials – 5.3% | |||||
| Aeon Credit Service Co. Ltd. | 81,700 | $ | 1,025,536 | ||
| Anglo Irish Bank Corp. PLC | 147,492 | 1,391,547 | |||
| Bank of Cyprus Public Co. Ltd. | 145,470 | 1,753,058 | |||
| CSU Cardsystem S.A. (a) | 44,830 | 145,989 | |||
| Fortis S.A./N.V. | 112,670 | 1,788,912 | |||
| Fortis S.A./N.V. (a) | 17,980 | 283 | |||
| Macquarie Group Ltd. | 15,892 | 741,140 | |||
| Unione di Banche Italiane ScpA | 103,188 | 2,412,966 | |||
| $ | 9,259,431 | ||||
| Pharmaceuticals – 6.7% | |||||
| Astellas Pharma, Inc. | 27,800 | $ | 1,179,799 | ||
| Bayer AG | 23,790 | 1,998,973 | |||
| Merck KGaA | 17,690 | 2,512,846 | |||
| Novartis AG | 33,660 | 1,848,693 | |||
| Roche Holding AG | 22,780 | 4,094,075 | |||
| $ | 11,634,386 | ||||
| Precious Metals & Minerals – 0.6% | |||||
| Paladin Resources Ltd. (a) | 160,518 | $ | 986,529 | ||
| Railroad & Shipping – 1.1% | |||||
| East Japan Railway Co. | 233 | $ | 1,900,740 | ||
| Real Estate – 1.1% | |||||
| CapitaLand Ltd. | 473,000 | $ | 1,982,499 | ||
| Issuer | Shares/Par | Value ($) | ||||
| COMMON STOCKS – continued | ||||||
| Specialty Chemicals – 3.5% | ||||||
| Akzo Nobel N.V. | 46,420 | $ | 3,179,224 | |||
| Linde AG | 21,180 | 2,970,512 | ||||
| $ | 6,149,736 | |||||
| Specialty Stores – 1.4% | ||||||
| Industria de Diseno Textil S.A. (Inditex) | 30,690 | $ | 1,411,302 | |||
| Kingfisher PLC | 306,850 | 685,230 | ||||
| NEXT PLC | 20,860 | 403,141 | ||||
| $ | 2,499,673 | |||||
| Telecommunications – Wireless – 3.8% | ||||||
| America Movil S.A.B. de C.V., “L”, ADR | 28,850 | $ | 1,521,837 | |||
| KDDI Corp. | 146 | 903,249 | ||||
| MTN Group Ltd. | 17,920 | 284,051 | ||||
| Rogers Communications, Inc., “B” | 13,730 | 533,738 | ||||
| Vodafone Group PLC | 1,162,630 | 3,428,360 | ||||
| $ | 6,671,235 | |||||
| Telephone Services – 1.7% | ||||||
| Telefonica S.A. | 109,080 | $ | 2,883,967 | |||
| Trucking – 1.5% | ||||||
| TNT N.V. | 20,920 | $ | 710,855 | |||
| Yamato Holdings Co. Ltd. | 132,000 | 1,844,900 | ||||
| $ | 2,555,755 | |||||
| Utilities – Electric Power – 4.2% | ||||||
| Drax Group | 32,943 | $ | 485,291 | |||
| E.ON AG | 25,960 | 5,229,753 | ||||
| NTPC Ltd. | 151,700 | 537,693 | ||||
| SUEZ S.A. | 17,021 | 1,156,432 | ||||
| $ | 7,409,169 | |||||
| Total Common Stocks (Identified Cost, $172,808,172) | $ | 164,821,338 | ||||
| SHORT-TERM OBLIGATIONS – 3.7% | ||||||
| Toyota Motor Credit Corp., 2.57%, due 7/01/08, at Amortized Cost and Value (y) | $ | 6,403,000 | $ | 6,403,000 | ||
| Strike Price | First Exercise | ||||||
| RIGHTS – 0.0% | |||||||
| Major Banks – 0.0% | |||||||
| Barclays PLC (1 share for 1 right) | GBP 2.82 | 6/26/2008 | |||||
| (Identified Cost, $0) (a) | 74,079 | $ | 14,029 | ||||
| Total Investments (Identified Cost, $179,211,172) | $ | 171,238,367 | |||||
| OTHER ASSETS, LESS LIABILITIES – 1.8% | 3,073,283 | ||||||
| Net Assets – 100.0% | $ | 174,311,650 | |||||
5
Table of Contents
Portfolio of Investments (unaudited) – continued
| (a) | Non-income producing security. |
| (y) | The rate shown represents an annualized yield at time of purchase. |
The following abbreviations are used in this report and are defined:
| ADR | American Depository Receipt |
| IPS | International Preference Stock |
Abbreviations indicate amounts shown in currencies other than the U.S. Dollar. All amounts are stated in U.S. dollars unless otherwise indicated. A list of abbreviations is shown below.
| GBP | British Pound |
See Notes to Financial Statements
6
Table of Contents
FINANCIAL STATEMENTS | STATEMENT OF ASSETS AND LIABILITIES (unaudited)
This statement represents your fund’s balance sheet, which details the assets and liabilities comprising the total value of the fund.
At 6/30/08 | |||||
Assets | |||||
Investments, at value (identified cost, $179,211,172) | $171,238,367 | ||||
Cash | 712 | ||||
Foreign currency, at value (identified cost, $219,542) | 221,131 | ||||
Receivable for investments sold | 502,272 | ||||
Receivable for fund shares sold | 3,422,208 | ||||
Interest and dividends receivable | 376,140 | ||||
Receivable from investment adviser | 14,406 | ||||
Other assets | 982 | ||||
Total assets | $175,776,218 | ||||
Liabilities | |||||
Payable for investments purchased | $968,457 | ||||
Payable for fund shares reacquired | 321,223 | ||||
Payable to affiliates | |||||
Management fee | 16,711 | ||||
Shareholder servicing costs | 340 | ||||
Distribution fees | 1,091 | ||||
Administrative services fee | 350 | ||||
Payable for independent trustees’ compensation | 515 | ||||
Accrued expenses and other liabilities | 155,881 | ||||
Total liabilities | $1,464,568 | ||||
Net assets | $174,311,650 | ||||
Net assets consist of | |||||
Paid-in capital | $182,982,385 | ||||
Unrealized appreciation (depreciation) on investments and translation of assets and liabilities in foreign currencies | (7,965,723 | ) | |||
Accumulated distributions in excess of net realized gain on investments and foreign currency transactions | (2,642,936 | ) | |||
Undistributed net investment income | 1,937,924 | ||||
Net assets | $174,311,650 | ||||
Shares of beneficial interest outstanding | 12,503,432 | ||||
Initial Class shares | |||||
Net assets | $134,107,239 | ||||
Shares outstanding | 9,607,416 | ||||
Net asset value per share | $13.96 | ||||
Service Class shares | |||||
Net assets | $40,204,411 | ||||
Shares outstanding | 2,896,016 | ||||
Net asset value per share | $13.88 |
See Notes to Financial Statements
7
Table of Contents
FINANCIAL STATEMENTS | STATEMENT OF OPERATIONS (unaudited)
This statement describes how much your fund earned in investment income and accrued in expenses. It also describes any gains and/or losses generated by fund operations.
| Six months ended 6/30/08 | ||||||
| Net investment income | ||||||
Income | ||||||
Dividends | $3,002,996 | |||||
Interest | 40,212 | |||||
Foreign taxes withheld | (307,451 | ) | ||||
Total investment income | $2,735,757 | |||||
Expenses | ||||||
Management fee | $570,087 | |||||
Distribution fees | 38,190 | |||||
Shareholder servicing costs | 11,482 | |||||
Administrative services fee | 13,363 | |||||
Independent trustees’ compensation | 2,555 | |||||
Custodian fee | 184,289 | |||||
Shareholder communications | 5,302 | |||||
Auditing fees | 22,932 | |||||
Legal fees | 680 | |||||
Miscellaneous | 8,583 | |||||
Total expenses | $857,463 | |||||
Fees paid indirectly | (1,227 | ) | ||||
Reduction of expenses by investment adviser | (122,032 | ) | ||||
Net expenses | $734,204 | |||||
Net investment income | $2,001,553 | |||||
Realized and unrealized gain (loss) on investments | ||||||
Realized gain (loss) (identified cost basis) | ||||||
Investment transactions (net of $84,909 country tax) | $(1,615,352 | ) | ||||
Foreign currency transactions | (53,178 | ) | ||||
Net realized gain (loss) on investments and foreign currency transactions | $(1,668,530 | ) | ||||
Change in unrealized appreciation (depreciation) | ||||||
Investments (net of $99,534 decrease in deferred country tax) | $(14,433,062 | ) | ||||
Translation of assets and liabilities in foreign currencies | 6,569 | |||||
Net unrealized gain (loss) on investments and foreign currency translation | $(14,426,493 | ) | ||||
Net realized and unrealized gain (loss) on investments and foreign currency | $(16,095,023 | ) | ||||
Change in net assets from operations | $(14,093,470 | ) |
See Notes to Financial Statements
8
Table of Contents
FINANCIAL STATEMENTS | STATEMENTS OF CHANGES IN NET ASSETS
These statements describe the increases and/or decreases in net assets resulting from operations, any distributions, and any shareholder transactions.
| Six months ended 6/30/08 (unaudited | ) | Year ended 12/31/07 | | |||
Change in net assets | ||||||
From operations | ||||||
Net investment income | $2,001,553 | $750,513 | ||||
Net realized gain (loss) on investments and foreign currency transactions | (1,668,530 | ) | 4,272,465 | |||
Net unrealized gain (loss) on investments and foreign currency translation | (14,426,493 | ) | 2,070,805 | |||
Change in net assets from operations | $(14,093,470 | ) | $7,093,783 | |||
Distributions declared to shareholders | ||||||
From net investment income | ||||||
Initial Class | $(607,164 | ) | $— | |||
Service Class | (122,669 | ) | — | |||
From net realized gain on investments | ||||||
Initial Class | (3,500,106 | ) | (382,802 | ) | ||
Service Class | (1,010,207 | ) | (181,871 | ) | ||
Total distributions declared to shareholders | $(5,240,146 | ) | $(564,673 | ) | ||
Change in net assets from fund share transactions | $82,419,583 | $58,552,347 | ||||
Total change in net assets | $63,085,967 | $65,081,457 | ||||
Net assets | ||||||
At beginning of period | 111,225,683 | 46,144,226 | ||||
At end of period (including undistributed net investment income of $1,937,924 and | $174,311,650 | $111,225,683 |
See Notes to Financial Statements
9
Table of Contents
FINANCIAL STATEMENTS | FINANCIAL HIGHLIGHTS
The financial highlights table is intended to help you understand the fund’s financial performance for the semiannual period and the past 5 fiscal years (or life of a particular share class, if shorter). Certain information reflects financial results for a single fund share. The total returns in the table represent the rate by which an investor would have earned (or lost) on an investment in the fund share class (assuming reinvestment of all distributions) held for the entire period.
| Initial Class | Six months ended 6/30/08 | Years ended 12/31 | ||||||||||
| 2007 | 2006 | 2005 (c) | ||||||||||
| (unaudited) | ||||||||||||
Net asset value, beginning of period | $16.12 | $14.44 | $11.84 | $10.00 | ||||||||
Income (loss) from investment operations | ||||||||||||
Net investment income (d) | $0.23 | $0.17 | $0.18 | $0.05 | ||||||||
Net realized and unrealized gain (loss) on investments | (1.73 | ) | 1.67 | 2.85 | 2.03 | |||||||
Total from investment operations | $(1.50 | ) | $1.84 | $3.03 | $2.08 | |||||||
Less distributions declared to shareholders | ||||||||||||
From net investment income | $(0.10 | ) | $— | $(0.13 | ) | $(0.07 | ) | |||||
From net realized gain on investments | (0.56 | ) | (0.16 | ) | (0.30 | ) | (0.17 | ) | ||||
Total distributions declared to shareholders | $(0.66 | ) | $(0.16 | ) | $(0.43 | ) | $(0.24 | ) | ||||
Net asset value, end of period | $13.96 | $16.12 | $14.44 | $11.84 | ||||||||
Total return (%) (k)(r)(s) | (9.54 | )(n) | 12.82 | 25.67 | 20.85 | (n) | ||||||
| Ratios (%) (to average net assets) and Supplemental data: | ||||||||||||
Expenses before expense reductions (f) | 1.29 | (a) | 1.56 | 2.77 | 4.03 | (a) | ||||||
Expenses after expense reductions (f) | 1.10 | (a) | 1.10 | 1.10 | 1.10 | (a) | ||||||
Net investment income | 3.20 | (a) | 1.14 | 1.36 | 0.66 | (a) | ||||||
Portfolio turnover | 36 | 64 | 130 | 95 | ||||||||
Net assets at end of period (000 Omitted) | $134,107 | $81,987 | $32,437 | $5,878 | ||||||||
See Notes to Financial Statements
10
Table of Contents
Financial Highlights – continued
| Service Class | Six months ended 6/30/08 | Years ended 12/31 | ||||||||||
| 2007 | 2006 | 2005 (c) | ||||||||||
| (unaudited) | ||||||||||||
Net asset value, beginning of period | $16.02 | $14.39 | $11.83 | $10.00 | ||||||||
Income (loss) from investment operations | ||||||||||||
Net investment income (d) | $0.21 | $0.16 | $0.06 | $0.02 | ||||||||
Net realized and unrealized gain (loss) on investments | (1.72 | ) | 1.63 | 2.91 | 2.04 | |||||||
Total from investment operations | $(1.51 | ) | $1.79 | $2.97 | $2.06 | |||||||
Less distributions declared to shareholders | ||||||||||||
From net investment income | $(0.07 | ) | $— | $(0.11 | ) | $(0.06 | ) | |||||
From net realized gain on investments | (0.56 | ) | (0.16 | ) | (0.30 | ) | (0.17 | ) | ||||
Total distributions declared to shareholders | $(0.63 | ) | $(0.16 | ) | $(0.41 | ) | $(0.23 | ) | ||||
Net asset value, end of period | $13.88 | $16.02 | $14.39 | $11.83 | ||||||||
Total return (%) (k)(r)(s) | (9.65 | )(n) | 12.52 | 25.21 | 20.68 | (n) | ||||||
| Ratios (%) (to average net assets) and Supplemental data: | ||||||||||||
Expenses before expense reductions (f) | 1.55 | (a) | 1.81 | 2.86 | 4.28 | (a) | ||||||
Expenses after expense reductions (f) | 1.35 | (a) | 1.35 | 1.35 | 1.35 | (a) | ||||||
Net investment income | 3.05 | (a) | 1.03 | 0.41 | 0.28 | (a) | ||||||
Portfolio turnover | 36 | 64 | 130 | 95 | ||||||||
Net assets at end of period (000 Omitted) | $40,204 | $29,238 | $13,707 | $241 | ||||||||
| (a) | Annualized. |
| (c) | For the period from the commencement of the fund’s investment operations, April 29, 2005, through the stated period end. |
| (d) | Per share data is based on average shares outstanding. |
| (f) | Ratios do not reflect reductions from fees paid indirectly, if applicable. |
| (k) | The total return does not reflect expenses that apply to separate accounts. Inclusion of these charges would reduce the total return figures for all periods shown. |
| (n) | Not annualized. |
| (r) | Certain expenses have been reduced without which performance would have been lower. |
| (s) | From time to time the fund may receive proceeds from litigation settlements, without which performance would be lower. |
See Notes to Financial Statements
11
Table of Contents
NOTES TO FINANCIAL STATEMENTS (unaudited)
| (1) | Business and Organization |
MFS Research International Series (the fund) is a series of MFS Variable Insurance Trust (the trust). The trust is organized as a Massachusetts business trust and is registered under the Investment Company Act of 1940, as amended, as an open-end management investment company. The shareholders of each series of the trust are separate accounts of insurance companies, which offer variable annuity and/or life insurance products, and qualified retirement and pension plans.
| (2) | Significant Accounting Policies |
General – The preparation of financial statements in conformity with U.S. generally accepted accounting principles requires management to make estimates and assumptions that affect the reported amounts of assets and liabilities, and disclosure of contingent assets and liabilities at the date of the financial statements and the reported amounts of revenues and expenses during the reporting period. Actual results could differ from those estimates. The fund can invest in foreign securities, including securities of emerging market issuers. Investments in foreign securities are vulnerable to the effects of changes in the relative values of the local currency and the U.S. dollar and to the effects of changes in each country’s legal, political, and economic environment. The markets of emerging markets countries are generally more volatile than the markets of developed countries with more mature economies. All of the risks of investing in foreign securities previously described are heightened when investing in emerging markets countries.
In March 2008, FASB Statement No. 161, Disclosures about Derivative Instruments and Hedging Activities (the “Standard”) was issued, and is effective for financial statements issued for fiscal years and interim periods beginning after November 15, 2008. This Standard provides enhanced disclosures about the fund’s use of and accounting for derivative instruments and the effect of derivative instruments on the fund’s results of operations and financial position. Management is evaluating the application of the Standard to the fund, and has not at this time determined the impact, if any, resulting from the adoption of this Standard on the fund’s financial statements.
Investment Valuations – Equity securities, including restricted equity securities, are generally valued at the last sale or official closing price as reported by an independent pricing service on the market or exchange on which they are primarily traded. For securities for which there were no sales reported that day, equity securities are generally valued at the last quoted daily bid quotation as reported by an independent pricing service on the market or exchange on which they are primarily traded. For securities held short for which there were no sales reported for the day, the position is generally valued at the last quoted daily ask quotation as reported by an independent pricing service on the market or exchange on which such securities are primarily traded. Short-term instruments with a maturity at issuance of 60 days or less may be valued at amortized cost, which approximates market value. Securities and other assets generally valued on the basis of information from an independent pricing service may also be valued at a broker-dealer bid quotation. The values of foreign securities and other assets and liabilities expressed in foreign currencies are converted to U.S. dollars using the mean of bid and asked prices for rates reported by an independent pricing service.
The Board of Trustees has delegated primary responsibility for determining or causing to be determined the value of the fund’s investments (including any fair valuation) to the adviser pursuant to valuation policies and procedures approved by the Board. If the adviser determines that reliable market quotations are not readily available, investments are valued at fair value as determined in good faith by the adviser in accordance with such procedures under the oversight of the Board of Trustees. Under the fund’s valuation policies and procedures, market quotations are not considered to be readily available for most types of debt instruments and floating rate loans and many types of derivatives. These investments are generally valued at fair value based on information from independent pricing services. In addition, investments may be valued at fair value if the adviser determines that an investment’s value has been materially affected by events occurring after the close of the exchange or market on which the investment is principally traded (such as foreign exchange or market) and prior to the determination of the fund’s net asset value, or after the halting of trading of a specific security where trading does not resume prior to the close of the exchange or market on which the security is principally traded. Events that occur on a frequent basis after foreign markets close (such as developments in foreign markets and significant movements in the U.S. markets) and prior to the determination of the fund’s net asset value may be deemed to have a material affect on the value of securities traded in foreign markets. Accordingly, the fund’s foreign equity securities may often be valued at fair value. The adviser may rely on independent pricing services or other information (such as the correlation with price movements of similar securities in the same or other markets; the type, cost and investment characteristics of the security; the business and financial condition of the issuer; and trading and other market data) to assist in determining whether to fair value and at what value to fair value an investment. The value of an investment for purposes of calculating the fund’s net asset value can differ depending on the source and method used to determine value. When fair valuation is used, the value of investments used to determine the fund’s net asset value may differ from quoted or published prices for the same investments.
12
Table of Contents
Notes to Financial Statements (unaudited) – continued
The fund adopted FASB Statement No. 157, Fair Value Measurements (the “Statement”) in this reporting period. This Statement provides a single definition of fair value, a hierarchy for measuring fair value and expanded disclosures about fair value measurements.
Various inputs are used in determining the value of the fund’s assets or liabilities carried at market value. These inputs are categorized into three broad levels. Level 1 includes quoted prices in active markets for identical assets or liabilities. Level 2 includes other significant observable market-based inputs (including quoted prices for similar securities, interest rates, prepayment speed, and credit risk). Level 3 includes unobservable inputs, which may include the adviser’s own assumptions in determining the fair value of investments. Other financial instruments are derivative instruments not reflected in total investments, such as futures, forwards, swap contracts and written options, which are valued at the unrealized appreciation/depreciation on the instrument. The following is a summary of the levels used as of June 30, 2008 in valuing the fund’s assets or liabilities carried at market value:
| Level 1 | Level 2 | Level 3 | Total | |||||
| Investments in Securities | $71,757,199 | $99,481,168 | $— | $171,238,367 | ||||
| Other Financial Instruments | $— | $— | $— | $— |
Foreign Currency Translation – Purchases and sales of foreign investments, income, and expenses are converted into U.S. dollars based upon currency exchange rates prevailing on the respective dates of such transactions. Gains and losses attributable to foreign currency exchange rates on sales of securities are recorded for financial statement purposes as net realized gains and losses on investments. Gains and losses attributable to foreign exchange rate movements on income and expenses are recorded for financial statement purposes as foreign currency transaction gains and losses. That portion of both realized and unrealized gains and losses on investments that results from fluctuations in foreign currency exchange rates is not separately disclosed.
Indemnifications – Under the fund’s organizational documents, its officers and trustees may be indemnified against certain liabilities and expenses arising out of the performance of their duties to the fund. Additionally, in the normal course of business, the fund enters into agreements with service providers that may contain indemnification clauses. The fund’s maximum exposure under these agreements is unknown as this would involve future claims that may be made against the fund that have not yet occurred.
Investment Transactions and Income – Investment transactions are recorded on the trade date. Interest income is recorded on the accrual basis. All premium and discount is amortized or accreted for financial statement purposes in accordance with U.S. generally accepted accounting principles. Dividends received in cash are recorded on the ex-dividend date. Certain dividends from foreign securities will be recorded when the fund is informed of the dividend if such information is obtained subsequent to the ex-dividend date. Dividend and interest payments received in additional securities are recorded on the ex-dividend or ex-interest date in an amount equal to the value of the security on such date.
The fund may receive proceeds from litigation settlements. Any proceeds received from litigation involving portfolio holdings are reflected in the Statement of Operations in realized gain/loss if the security has been disposed of by the fund or in unrealized gain/loss if the security is still held by the fund. Any other proceeds from litigation not related to portfolio holdings are reflected as other income in the Statement of Operations.
Fees Paid Indirectly – The fund’s custody fee may be reduced according to an arrangement that measures the value of cash deposited with the custodian by the fund. This amount, for the six months ended June 30, 2008, is shown as a reduction of total expenses on the Statement of Operations.
Tax Matters and Distributions – The fund intends to qualify as a regulated investment company, as defined under Subchapter M of the Internal Revenue Code, and to distribute all of its taxable income, including realized capital gains. As a result, no provision for federal income tax is required. The fund adopted the provisions of FASB Interpretation No. 48, Accounting for Uncertainty in Income Taxes (“the Interpretation”). The Interpretation prescribes a minimum threshold for financial statement recognition of the benefit of a tax position taken or expected to be taken in a tax return. There was no impact resulting from the adoption of this Interpretation on the fund’s financial statements. Each of the fund’s federal tax returns for the prior three fiscal years remains subject to examination by the Internal Revenue Service. It is the fund’s policy to record interest and penalty charges on underpaid taxes associated with its tax positions as interest expense and miscellaneous expense, respectively. No such charges were recorded in the current financial statements. Foreign taxes, if any, have been accrued by the fund in the accompanying financial statements.
Distributions to shareholders are recorded on the ex-dividend date. Income and capital gain distributions are determined in accordance with income tax regulations, which may differ from U.S. generally accepted accounting principles. Certain capital accounts in the financial statements are periodically adjusted for permanent differences in order to reflect their tax character. These adjustments have no impact on net assets or net asset value per share. Temporary differences which arise from
13
Table of Contents
Notes to Financial Statements (unaudited) – continued
recognizing certain items of income, expense, gain or loss in different periods for financial statement and tax purposes will reverse at some time in the future. Distributions in excess of net investment income or net realized gains are temporary overdistributions for financial statement purposes resulting from differences in the recognition or classification of income or distributions for financial statement and tax purposes.
Book/tax differences primarily relate to passive foreign investment companies, wash sale loss deferrals, and foreign taxes.
The tax character of distributions made during the current period will be determined at fiscal year end. The tax character of distributions declared to shareholders is as follows:
| 12/31/07 | ||
| Ordinary income (including any short-term capital gains) | $443,750 | |
| Long-term capital gain | 120,923 | |
| Total distributions | $564,673 |
The federal tax cost and the tax basis components of distributable earnings were as follows:
| As of 6/30/08 | |||
| Cost of investments | $180,195,885 | ||
| Gross appreciation | 6,076,064 | ||
| Gross depreciation | (15,033,582 | ) | |
| Net unrealized appreciation (depreciation) | $(8,957,518 | ) | |
| As of 12/31/07 | |||
| Undistributed ordinary income | $2,729,135 | ||
| Undistributed long-term capital gain | 2,509,453 | ||
| Other temporary differences | (150,785 | ) | |
| Net unrealized appreciation (depreciation) | 5,575,078 | ||
The aggregate cost above includes prior fiscal year end tax adjustments.
Multiple Classes of Shares of Beneficial Interest – The fund offers multiple classes of shares, which differ in their respective distribution fees. The fund’s income, realized and unrealized gain (loss), and common expenses are allocated to shareholders based on the daily net assets of each class, without distinction between share classes. Dividends are declared separately for each class. Differences in per share dividend rates are generally due to differences in separate class expenses.
| (3) | Transactions with Affiliates |
Investment Adviser – The fund has an investment advisory agreement with Massachusetts Financial Services Company (MFS) to provide overall investment management and related administrative services and facilities to the fund. The management fee is computed daily and paid monthly at an annual rate of 0.90% of the fund’s average daily net assets.
The investment adviser has agreed in writing to pay a portion of the fund’s operating expenses, exclusive of certain fees and expenses, such that total annual fund operating expenses do not exceed 1.10% annually of average daily net assets for the Initial Class shares and 1.35% annually of average daily net assets for the Service Class shares. This written agreement may only be rescinded by the fund’s Board of Trustees. The investment adviser has agreed in writing to pay a portion of the fund’s operating expenses, exclusive of management, distribution, and certain other fees and expenses, such that operating expenses do not exceed 0.20% annually of the fund’s average daily net assets. This written agreement will continue through April 30, 2009 unless changed or rescinded by the fund’s Board of Trustees. For the six months ended June 30, 2008, this reduction amounted to $121,677 and is reflected as a reduction of total expenses in the Statement of Operations.
Distributor – MFS Fund Distributors, Inc. (MFD), a wholly-owned subsidiary of MFS, is the distributor of shares of the fund. The Trustees have adopted a distribution plan for the Service Class shares pursuant to Rule 12b-1 under the Investment Company Act of 1940.
The fund’s distribution plan provides that the fund will pay MFD distribution fees equal to 0.25% per annum of its average daily net assets attributable to Service Class shares as partial consideration for services performed and expenses incurred by MFD and financial intermediaries (including participating insurance companies that invest in the fund to fund variable annuity and variable life insurance contracts, sponsors of qualified retirement and pension plans that invest in the fund, and affiliates of these participating insurance companies and plan sponsors) in connection with the sale and distribution of the Service Class shares. MFD may subsequently pay all, or a portion, of the distribution fees to financial intermediaries.
Shareholder Servicing Agent – MFS Service Center, Inc. (MFSC), a wholly-owned subsidiary of MFS, receives a fee from the fund for its services as shareholder servicing agent. For the six months ended June 30, 2008, the fee was $11,482, which equated to
14
Table of Contents
Notes to Financial Statements (unaudited) – continued
0.0181% annually of the fund’s average daily net assets. MFSC also receives payment from the fund for out-of-pocket expenses paid by MFSC on behalf of the fund. For the six months ended June 30, 2008, the fund did not incur any out-of-pocket expenses.
Administrator – MFS provides certain financial, legal, shareholder communications, compliance, and other administrative services to the fund. Under an administrative services agreement, the fund partially reimburses MFS the costs incurred to provide these services. The fund is charged a fixed amount plus a fee based on average daily net assets. The fund’s annual fixed amount is $17,500.
The administrative services fee incurred for the six months ended June 30, 2008 was equivalent to an annual effective rate of 0.0211% of the fund’s average daily net assets.
Trustees’ and Officers’ Compensation – The fund pays compensation to independent trustees in the form of a retainer, attendance fees, and additional compensation to Board and Committee chairpersons. The fund does not pay compensation directly to trustees or officers of the fund who are also officers of the investment adviser, all of whom receive remuneration for their services to the fund from MFS. Certain officers and trustees of the fund are officers or directors of MFS, MFD, and MFSC.
Other – This fund and certain other MFS funds (the funds) have entered into a services agreement (the Agreement) which provides for payment of fees by the funds to Tarantino LLC in return for the provision of services of an Independent Chief Compliance Officer (ICCO) for the funds. The ICCO is an officer of the funds and the sole member of Tarantino LLC. The funds can terminate the Agreement with Tarantino LLC at any time under the terms of the Agreement. For the six months ended June 30, 2008, the fee paid by the fund to Tarantino LLC was $359 and is included in miscellaneous expense on the Statement of Operations. MFS has agreed to reimburse the fund for a portion of the payments made by the fund to Tarantino LLC in the amount of $355, which is shown as a reduction of total expenses in the Statement of Operations. Additionally, MFS has agreed to bear all expenses associated with office space, other administrative support, and supplies provided to the ICCO.
| (4) | Portfolio Securities |
Purchases and sales of investments, other than U.S. Government securities, purchased option transactions, and short-term obligations, aggregated $120,185,105 and $45,788,324, respectively.
| (5) | Shares of Beneficial Interest |
The fund’s Declaration of Trust permits the Trustees to issue an unlimited number of full and fractional shares of beneficial interest. Transactions in fund shares were as follows:
| Six months ended 6/30/08 | Year ended 12/31/07 | |||||||||||
| Shares | Amount | Shares | Amount | |||||||||
| Shares sold | ||||||||||||
Initial Class | 4,721,698 | $69,955,897 | 3,309,142 | $51,937,309 | ||||||||
Service Class | 1,428,479 | 20,801,875 | 1,176,033 | 18,132,158 | ||||||||
| 6,150,177 | $90,757,772 | 4,485,175 | $70,069,467 | |||||||||
| Shares issued to shareholders in reinvestment of distributions | ||||||||||||
Initial Class | 278,648 | $4,107,270 | 25,469 | $382,802 | ||||||||
Service Class | 77,224 | 1,132,876 | 12,149 | 181,871 | ||||||||
| 355,872 | $5,240,146 | 37,618 | $564,673 | |||||||||
| Shares reacquired | ||||||||||||
Initial Class | (479,582 | ) | $(7,226,885 | ) | (493,979 | ) | $(7,296,067 | ) | ||||
Service Class | (434,367 | ) | (6,351,450 | ) | (315,758 | ) | (4,785,726 | ) | ||||
| (913,949 | ) | $(13,578,335 | ) | (809,737 | ) | $(12,081,793 | ) | |||||
| Net change | ||||||||||||
Initial Class | 4,520,764 | $66,836,282 | 2,840,632 | $45,024,044 | ||||||||
Service Class | 1,071,336 | 15,583,301 | 872,424 | 13,528,303 | ||||||||
| 5,592,100 | $82,419,583 | 3,713,056 | $58,552,347 | |||||||||
| (6) | Line of Credit |
The fund and other funds managed by MFS participate in a $1 billion unsecured committed line of credit provided by a syndication of banks under a credit agreement. In addition, the fund and other funds managed by MFS have established uncommitted borrowing arrangements with certain banks. Borrowings may be made for temporary financing needs. Interest is charged to each fund, based on its borrowings, generally at a rate equal to the Federal Reserve funds rate plus 0.30%. In addition, a commitment fee, based on the average daily, unused portion of the committed line of credit, is allocated among the participating funds at the end of each calendar quarter. For the six months ended June 30, 2008, the fund’s commitment fee and interest expense were $194 and $0, respectively, and are included in miscellaneous expense on the Statement of Operations.
15
Table of Contents
BOARD REVIEW OF INVESTMENT ADVISORY AGREEMENT
A discussion regarding the Board’s most recent review and renewal of the fund’s Investment Advisory Agreement with MFS will be available on or about November 1, 2008 by clicking on the fund’s name under “Variable Insurance Portfolios - VIT” in the “Products and Performance” section of the MFS Web site (mfs.com).
PROXY VOTING POLICIES AND INFORMATION
A general description of the MFS funds’ proxy voting policies and procedures is available without charge, upon request, by calling 1-800-225-2606, by visiting the Proxy Voting section of mfs.com or by visiting the SEC’s Web site at http://www.sec.gov.
Information regarding how the fund voted proxies relating to portfolio securities during the most recent twelve-month period ended June 30 is available without charge by visiting the Proxy Voting section of mfs.com or by visiting the SEC’s Web site at http://www.sec.gov.
QUARTERLY PORTFOLIO DISCLOSURE
The fund will file a complete schedule of portfolio holdings with the Securities and Exchange Commission (the Commission) for the first and third quarters of each fiscal year on Form N-Q. The fund’s Form N-Q may be reviewed and copied at the:
Public Reference Room
Securities and Exchange Commission
100 F Street, NE, Room 1580
Washington, D.C. 20549
Information on the operation of the Public Reference Room may be obtained by calling the Commission at 1-800-SEC-0330. The fund’s Form N-Q is available on the EDGAR database on the Commission’s Internet Web site at http://www.sec.gov, and copies of this information may be obtained, upon payment of a duplicating fee, by electronic request at the following e-mail address: publicinfo@sec.gov or by writing the Public Reference Section at the above address.
16
Table of Contents
CONTACT US
Web site
mfs.com
Account service and literature
Shareholders
1-877-411-3325
9 a.m. to 5 p.m. Eastern Time
Investment professionals
1-800-637-8730
8 a.m. to 5 p.m. Eastern Time
Mailing address
MFS Service Center, Inc.
Attn: Institutional Alliance Services (IAS)
P.O. Box 55824
Boston, MA 02205-5824
Overnight mail
MFS Service Center, Inc.
c/o Boston Financial Data Services
30 Dan Road
Canton, MA 02021-2809

Table of Contents

Table of Contents
MFS® RESEARCH SERIES
This report is prepared for the general information of contract owners. It is authorized for distribution to prospective investors only when preceded or accompanied by a current prospectus.
NOT FDIC INSURED Ÿ MAY LOSE VALUE Ÿ NO BANK OR CREDIT UNION GUARANTEE Ÿ NOT A DEPOSIT Ÿ NOT INSURED BY ANY FEDERAL GOVERNMENT AGENCY OR NCUA/NCUSIF
Table of Contents

Dear Contract Owners:
Negative headlines tend to resonate during difficult markets, and we certainly have had more than our share of tough news recently. As a result consumer, and particularly investor, sentiment are at all-time lows. That said, I do think it is helpful to remember there are always silver linings in the storm clouds if you look hard enough.
Through all of the challenges we have faced, there are some positive underlying trends. In the United States, for example, institutional traders and credit market followers are just now showing increasing signs of confidence and are beginning to take on more risk. At the corporate level, earnings continue to be relatively strong as companies have reduced labor costs, controlled inventories, and relied less on debt to finance expansion. More broadly, low interest rates and strong demand for consumer goods and industrial equipment are good signs for the global economy.
While I do not mean to minimize the risks inherent in today’s markets, periods such as these allow the talented fund managers and research analysts we have at MFS® to test their convictions, reevaluate existing positions, and identify new investment ideas. Our investment process also includes a significant risk management component, with constant attention paid to monitoring market risk, so we can do our best to minimize any surprises to your portfolio.
For investors, this is a great time to check in with your advisor and make sure you have a sound investment plan in place — one that can keep your hard-earned money working over the long term through a strategy that involves asset allocation, diversification, and periodic portfolio rebalancing and reviews. A plan tailored to your distinct needs and goals continues to be the best approach to help you take advantage of the inevitable challenges — and opportunities — that present themselves over time.
Respectfully,

Robert J. Manning
Chief Executive Officer and Chief Investment Officer
MFS Investment Management®
August 15, 2008
The opinions expressed in this letter are subject to change, may not be relied upon for investment advice, and no forecasts can be guaranteed.
1
Table of Contents
Portfolio structure
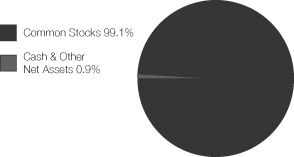
| Top ten holdings | ||
| Merck & Co., Inc. | 3.0% | |
| Chevron Corp. | 2.3% | |
| Danaher Corp. | 2.3% | |
| JPMorgan Chase & Co. | 2.3% | |
| PepsiCo, Inc. | 2.2% | |
| Google, Inc., “A” | 2.1% | |
| Philip Morris International, Inc. | 2.0% | |
| International Business Machines Corp. | 2.0% | |
| AT&T, Inc. | 2.0% | |
| Exxon Mobil Corp. | 1.8% |
| Equity sectors | ||
| Technology | 14.2% | |
| Energy | 14.1% | |
| Financial Services | 14.1% | |
| Health Care | 11.7% | |
| Utilities & Communications | 8.9% | |
| Consumer Staples | 8.0% | |
| Retailing | 7.2% | |
| Industrial Goods & Services | 6.3% | |
| Basic Materials | 5.3% | |
| Special Products & Services | 3.5% | |
| Autos & Housing | 2.4% | |
| Leisure | 2.3% | |
| Transportation | 1.1% |
Percentages are based on net assets as of 6/30/08.
The portfolio is actively managed and current holdings may be different.
2
Table of Contents
Fund Expenses Borne by the Contract Holders During the Period,
January 1, 2008 through June 30, 2008
As a contract holder of the fund, you incur ongoing costs, including management fees; distribution (12b-1) fees; and other fund expenses. This example is intended to help you understand your ongoing costs (in dollars) of investing in the fund and to compare these costs with the ongoing costs of investing in other mutual funds.
The example is based on an investment of $1,000 invested at the beginning of the period and held for the entire period January 1, 2008 through June 30, 2008.
Actual Expenses
The first line for each share class in the following table provides information about actual account values and actual expenses. You may use the information in this line, together with the amount you invested, to estimate the expenses that you paid over the period. Simply divide your account value by $1,000 (for example, an $8,600 account value divided by $1,000 = 8.6), then multiply the result by the number in the first line under the heading entitled “Expenses Paid During Period” to estimate the expenses you paid on your account during this period.
Hypothetical Example for Comparison Purposes
The second line for each share class in the following table provides information about hypothetical account values and hypothetical expenses based on the fund’s actual expense ratio and an assumed rate of return of 5% per year before expenses, which is not the fund’s actual return. The hypothetical account values and expenses may not be used to estimate the actual ending account balance or expenses you paid for the period. You may use this information to compare the ongoing costs of investing in the fund and other funds. To do so, compare this 5% hypothetical example with the 5% hypothetical examples that appear in the shareholder reports of the other funds.
Please note that the expenses shown in the table are meant to highlight the fund’s ongoing costs only and do not take into account the fees and expenses imposed under the variable contracts through which your investment in the fund is made. Therefore, the second line for each share class in the table is useful in comparing ongoing costs associated with an investment in vehicles (such as the fund) which fund benefits under variable annuity and variable life insurance contracts and to qualified pension and retirement plans only, and will not help you determine the relative total costs of investing in the fund through variable annuity and variable life insurance contracts. If the fees and expenses imposed under the variable contracts were included, your costs would have been higher.
| Share Class | Annualized Expense Ratio | Beginning Account Value 1/01/08 | Ending Account Value 6/30/08 | Expenses Paid During Period (p) 1/01/08-6/30/08 | ||||||
| Initial Class | Actual | 0.86% | $1,000.00 | $905.70 | $4.07 | |||||
| Hypothetical (h) | 0.86% | $1,000.00 | $1,020.59 | $4.32 | ||||||
| Service Class | Actual | 1.11% | $1,000.00 | $904.47 | $5.26 | |||||
| Hypothetical (h) | 1.11% | $1,000.00 | $1,019.34 | $5.57 |
| (h) | 5% class return per year before expenses. |
| (p) | Expenses paid is equal to each class’ annualized expense ratio, as shown above, multiplied by the average account value over the period, multiplied by the number of days in the period, divided by the number of days in the year. |
3
Table of Contents
PORTFOLIO OF INVESTMENTS – 6/30/08 (unaudited)
The Portfolio of Investments is a complete list of all securities owned by your fund. It is categorized by broad-based asset classes.
| Issuer | Shares/Par | Value ($) | |||
| COMMON STOCKS – 99.1% | |||||
| Aerospace – 1.9% | |||||
| Lockheed Martin Corp. | 26,700 | $ | 2,634,218 | ||
| United Technologies Corp. | 34,210 | 2,110,757 | |||
| $ | 4,744,975 | ||||
| Apparel Manufacturers – 0.9% | |||||
| NIKE, Inc., “B” | 37,970 | $ | 2,263,392 | ||
| Automotive – 1.1% | |||||
| Bayerische Motoren Werke AG | 24,290 | $ | 1,166,112 | ||
| Johnson Controls, Inc. | 57,520 | 1,649,674 | |||
| $ | 2,815,786 | ||||
| Biotechnology – 1.8% | |||||
| Genentech, Inc. (a) | 14,070 | $ | 1,067,913 | ||
| Genzyme Corp. (a) | 46,410 | 3,342,448 | |||
| $ | 4,410,361 | ||||
| Broadcasting – 1.5% | |||||
| Grupo Televisa S.A., ADR | 26,880 | $ | 634,906 | ||
| Omnicom Group, Inc. | 28,140 | 1,262,923 | |||
| Walt Disney Co. | 61,170 | 1,908,504 | |||
| $ | 3,806,333 | ||||
| Brokerage & Asset Managers – 2.4% | |||||
| Affiliated Managers Group, Inc. (a) | 16,250 | $ | 1,463,475 | ||
| Deutsche Boerse AG | 9,190 | 1,031,505 | |||
| Goldman Sachs Group, Inc. | 8,450 | 1,477,905 | |||
| Invesco Ltd. (l) | 82,610 | 1,980,988 | |||
| $ | 5,953,873 | ||||
| Business Services – 1.8% | |||||
| Satyam Computer Services Ltd., ADR (l) | 64,130 | $ | 1,572,468 | ||
| Visa, Inc., “A” | 22,120 | 1,798,577 | |||
| Western Union Co. | 42,000 | 1,038,240 | |||
| $ | 4,409,285 | ||||
| Cable TV – 0.6% | |||||
| Comcast Corp., “Special A” (l) | 33,370 | $ | 626,021 | ||
| Time Warner Cable, Inc. (a)(l) | 29,030 | 768,714 | |||
| $ | 1,394,735 | ||||
| Chemicals – 1.5% | |||||
| PPG Industries, Inc. | 44,830 | $ | 2,571,897 | ||
| Rohm & Haas Co. (l) | 27,430 | 1,273,849 | |||
| $ | 3,845,746 | ||||
| Computer Software – 2.3% | |||||
| Oracle Corp. (a) | 128,600 | $ | 2,700,600 | ||
| Salesforce.com, Inc. (a) | 21,840 | 1,490,143 | |||
| VeriSign, Inc. (a) | 39,740 | 1,502,172 | |||
| $ | 5,692,915 | ||||
| Computer Software – Systems – 3.3% | |||||
| Apple Computer, Inc. (a) | 20,080 | $ | 3,362,195 | ||
| International Business Machines Corp. | 42,510 | 5,038,710 | |||
| $ | 8,400,905 | ||||
| Issuer | Shares/Par | Value ($) | |||
| COMMON STOCKS – continued | |||||
| Conglomerates – 1.2% | |||||
| Siemens AG | 27,310 | $ | 3,025,327 | ||
| Construction – 1.3% | |||||
| Pulte Homes, Inc. (l) | 141,550 | $ | 1,363,127 | ||
| Stanley Works | 40,000 | 1,793,200 | |||
| $ | 3,156,327 | ||||
| Consumer Goods & Services – 1.7% | |||||
| ITT Educational Services, Inc. (a)(l) | 15,730 | $ | 1,299,770 | ||
| Procter & Gamble Co. | 50,490 | 3,070,297 | |||
| $ | 4,370,067 | ||||
| Electrical Equipment – 2.3% | |||||
| Danaher Corp. (l) | 74,750 | $ | 5,778,175 | ||
| Electronics – 4.1% | |||||
| Applied Materials, Inc. | 95,620 | $ | 1,825,386 | ||
| Flextronics International Ltd. (a) | 195,710 | 1,839,674 | |||
| Intel Corp. | 211,200 | 4,536,576 | |||
| SanDisk Corp. (a) | 113,010 | 2,113,287 | |||
| $ | 10,314,923 | ||||
| Energy – Independent – 3.3% | |||||
| Apache Corp. | 26,770 | $ | 3,721,030 | ||
| Chesapeake Energy Corp. (l) | 17,900 | 1,180,684 | |||
| CONSOL Energy, Inc. | 11,690 | 1,313,605 | |||
| XTO Energy, Inc. | 28,472 | 1,950,617 | |||
| $ | 8,165,936 | ||||
| Energy – Integrated – 6.9% | |||||
| Chevron Corp. | 58,460 | $ | 5,795,140 | ||
| Exxon Mobil Corp. | 51,580 | 4,545,745 | |||
| Hess Corp. | 20,040 | 2,528,848 | |||
| Marathon Oil Corp. | 39,440 | 2,045,753 | |||
| Royal Dutch Shell PLC, ADR | 16,300 | 1,331,873 | |||
| TOTAL S.A., ADR | 12,760 | 1,088,045 | |||
| $ | 17,335,404 | ||||
| Engineering – Construction – 1.1% | |||||
| Fluor Corp. | 14,340 | $ | 2,668,387 | ||
| Food & Beverages – 4.3% | |||||
| Dean Foods Co. (a) | 73,980 | $ | 1,451,488 | ||
| General Mills, Inc. | 23,470 | 1,426,272 | |||
| Kellogg Co. | 18,200 | 873,964 | |||
| Nestle S.A. | 36,180 | 1,637,403 | |||
| PepsiCo, Inc. | 84,710 | 5,386,709 | |||
| $ | 10,775,836 | ||||
| Food & Drug Stores – 1.6% | |||||
| CVS Caremark Corp. | 99,460 | $ | 3,935,632 | ||
| Gaming & Lodging – 0.2% | |||||
| International Game Technology | 25,620 | $ | 639,988 | ||
4
Table of Contents
Portfolio of Investments (unaudited) – continued
| Issuer | Shares/Par | Value ($) | |||
| COMMON STOCKS – continued | |||||
| General Merchandise – 3.2% | |||||
| Family Dollar Stores, Inc. (l) | 101,410 | $ | 2,022,115 | ||
| Kohl’s Corp. (a) | 58,830 | 2,355,553 | |||
| Wal-Mart Stores, Inc. | 64,050 | 3,599,610 | |||
| $ | 7,977,278 | ||||
| Health Maintenance Organizations – 1.7% | |||||
| CIGNA Corp. | 70,810 | $ | 2,505,966 | ||
| WellPoint, Inc. (a) | 34,580 | 1,648,083 | |||
| $ | 4,154,049 | ||||
| Insurance – 4.0% | |||||
| Chubb Corp. | 30,210 | $ | 1,480,592 | ||
| Genworth Financial, Inc., “A” | 67,660 | 1,205,025 | |||
| Hartford Financial Services Group, Inc. | 15,760 | 1,017,623 | |||
| MetLife, Inc. | 81,480 | 4,299,700 | |||
| Prudential Financial, Inc. | 32,550 | 1,944,537 | |||
| $ | 9,947,477 | ||||
| Internet – 2.0% | |||||
| Google, Inc., “A” (a) | 9,780 | $ | 5,148,388 | ||
| Machinery & Tools – 1.0% | |||||
| Cummins, Inc. | 18,800 | $ | 1,231,776 | ||
| GEA Group AG | 39,460 | 1,389,567 | |||
| $ | 2,621,343 | ||||
| Major Banks – 7.2% | |||||
| Bank of America Corp. | 126,680 | $ | 3,023,852 | ||
| Bank of New York Mellon Corp. | 86,609 | 3,276,418 | |||
| JPMorgan Chase & Co. | 164,580 | 5,646,740 | |||
| State Street Corp. | 66,470 | 4,253,415 | |||
| Wells Fargo & Co. | 73,910 | 1,755,363 | |||
| $ | 17,955,788 | ||||
| Medical & Health Technology & Services – 0.8% | |||||
| DaVita, Inc. (a) | 20,240 | $ | 1,075,351 | ||
| VCA Antech, Inc. (a) | 33,150 | 920,907 | |||
| $ | 1,996,258 | ||||
| Medical Equipment – 2.0% | |||||
| Boston Scientific Corp. (a) | 155,550 | $ | 1,911,710 | ||
| Zimmer Holdings, Inc. (a) | 44,690 | 3,041,155 | |||
| $ | 4,952,865 | ||||
| Metals & Mining – 2.5% | |||||
| BHP Billiton PLC | 57,240 | $ | 2,200,262 | ||
| Century Aluminum Co. (a)(l) | 21,050 | 1,399,615 | |||
| Cleveland-Cliffs, Inc. | 12,180 | 1,451,734 | |||
| Uranium One, Inc. (a) | 233,180 | 1,099,852 | |||
| $ | 6,151,463 | ||||
| Natural Gas – Distribution – 1.5% | |||||
| Questar Corp. | 26,500 | $ | 1,882,560 | ||
| Sempra Energy | 33,720 | 1,903,494 | |||
| $ | 3,786,054 | ||||
| Issuer | Shares/Par | Value ($) | |||
| COMMON STOCKS – continued | |||||
| Natural Gas – Pipeline – 1.1% | |||||
| El Paso Corp. | 45,150 | $ | 981,561 | ||
| Williams Cos., Inc. | 45,290 | 1,825,640 | |||
| $ | 2,807,201 | ||||
| Network & Telecom – 2.5% | |||||
| Juniper Networks, Inc. (a) | 52,900 | $ | 1,173,322 | ||
| Nokia Corp., ADR | 108,970 | 2,669,765 | |||
| Research in Motion Ltd. (a) | 20,356 | 2,379,616 | |||
| $ | 6,222,703 | ||||
| Oil Services – 3.9% | |||||
| Halliburton Co. | 66,880 | $ | 3,549,322 | ||
| National Oilwell Varco, Inc. (a) | 17,450 | 1,548,164 | |||
| Noble Corp. | 24,240 | 1,574,630 | |||
| Schlumberger Ltd. | 28,440 | 3,055,309 | |||
| $ | 9,727,425 | ||||
| Other Banks & Diversified Financials – 0.5% | |||||
| American Express Co. | 33,310 | $ | 1,254,788 | ||
| Pharmaceuticals – 5.4% | |||||
| Abbott Laboratories | 31,610 | $ | 1,674,382 | ||
| Merck & Co., Inc. | 199,780 | 7,529,708 | |||
| Schering-Plough Corp. | 219,700 | 4,325,893 | |||
| $ | 13,529,983 | ||||
| Specialty Chemicals – 1.3% | |||||
| Linde AG (l) | 8,290 | $ | 1,162,679 | ||
| Praxair, Inc. | 22,210 | 2,093,070 | |||
| $ | 3,255,749 | ||||
| Specialty Stores – 1.5% | |||||
| Nordstrom, Inc. (l) | 67,170 | $ | 2,035,251 | ||
| O’Reilly Automotive, Inc. (a) | 37,970 | 848,630 | |||
| Tiffany & Co. | 21,400 | 872,050 | |||
| $ | 3,755,931 | ||||
| Telecommunications – Wireless – 0.6% | |||||
| Rogers Communications, Inc., “B” | 5,030 | $ | 195,536 | ||
| Rogers Communications, Inc., “B” | 31,260 | 1,208,512 | |||
| $ | 1,404,048 | ||||
| Telephone Services – 2.7% | |||||
| AT&T, Inc. | 147,770 | $ | 4,978,371 | ||
| Embarq Corp. | 17,150 | 810,681 | |||
| Verizon Communications, Inc. | 29,380 | 1,040,052 | |||
| $ | 6,829,104 | ||||
| Tobacco – 2.5% | |||||
| Lorillard, Inc. (a) | 18,890 | $ | 1,306,432 | ||
| Philip Morris International, Inc. | 102,640 | 5,069,390 | |||
| $ | 6,375,822 | ||||
| Trucking – 1.1% | |||||
| FedEx Corp. | 36,370 | $ | 2,865,592 | ||
5
Table of Contents
Portfolio of Investments (unaudited) – continued
| Issuer | Shares/Par | Value ($) | ||||
| COMMON STOCKS – continued | ||||||
| Utilities – Electric Power – 3.0% | ||||||
| American Electric Power Co., Inc. | 48,840 | $ | 1,964,833 | |||
| FPL Group, Inc. | 11,640 | 763,351 | ||||
| NRG Energy, Inc. (a) | 37,000 | 1,587,300 | ||||
| PG&E Corp. (l) | 41,560 | 1,649,516 | ||||
| PPL Corp. | 27,970 | 1,461,992 | ||||
| $ | 7,426,992 | |||||
| Total Common Stocks (Identified Cost, $263,171,378) | $ | 248,050,609 | ||||
| SHORT-TERM OBLIGATIONS – 0.8% | ||||||
| Toyota Motor Credit Corp., 2.57%, due 7/01/08, at Amortized Cost and Value (y) | $ | 1,951,000 | $ | 1,951,000 | ||
| Issuer | Shares/Par | Value ($) | ||||
| COLLATERAL FOR SECURITIES LOANED – 7.3% | ||||||
| Navigator Securities Lending Prime Portfolio, at Cost and Net Asset Value | 18,426,465 | $ | 18,426,465 | |||
| Total Investments (Identified Cost, $283,548,843) | $ | 268,428,074 | ||||
| OTHER ASSETS, LESS LIABILITIES – (7.2)% | (18,135,596 | ) | ||||
| Net Assets – 100.0% | $ | 250,292,478 | ||||
| (a) | Non-income producing security. |
| (l) | All or a portion of this security is on loan. |
| (y) | The rate shown represents an annualized yield at time of purchase. |
The following abbreviations are used in this report and are defined:
| ADR | American Depository Receipt |
See Notes to Financial Statements
6
Table of Contents
FINANCIAL STATEMENTS | STATEMENT OF ASSETS AND LIABILITIES (unaudited)
This statement represents your fund’s balance sheet, which details the assets and liabilities comprising the total value of the fund.
At 6/30/08 | |||||
Assets | |||||
Investments, at value, including $17,972,004 of securities on loan (identified cost, $283,548,843) | $268,428,074 | ||||
Cash | 665 | ||||
Receivable for investments sold | 4,268,170 | ||||
Receivable for fund shares sold | 33,285 | ||||
Interest and dividends receivable | 320,239 | ||||
Other assets | 2,256 | ||||
Total assets | $273,052,689 | ||||
Liabilities | |||||
Payable for investments purchased | $3,935,470 | ||||
Payable for fund shares reacquired | 285,414 | ||||
Collateral for securities loaned, at value | 18,426,465 | ||||
Payable to affiliates | |||||
Management fee | 20,594 | ||||
Shareholder servicing costs | 267 | ||||
Distribution fees | 524 | ||||
Administrative services fee | 458 | ||||
Payable for independent trustees’ compensation | 1,611 | ||||
Accrued expenses and other liabilities | 89,408 | ||||
Total liabilities | $22,760,211 | ||||
Net assets | $250,292,478 | ||||
Net assets consist of | |||||
Paid-in capital | $489,534,215 | ||||
Unrealized appreciation (depreciation) on investments and translation of assets and liabilities in foreign currencies | (15,121,046 | ) | |||
Accumulated net realized gain (loss) on investments and foreign currency transactions | (225,509,374 | ) | |||
Undistributed net investment income | 1,388,683 | ||||
Net assets | $250,292,478 | ||||
Shares of beneficial interest outstanding | 13,694,051 | ||||
Initial Class shares | |||||
Net assets | $231,312,691 | ||||
Shares outstanding | 12,650,845 | ||||
Net asset value per share | $18.28 | ||||
Service Class shares | |||||
Net assets | $18,979,787 | ||||
Shares outstanding | 1,043,206 | ||||
Net asset value per share | $18.19 |
See Notes to Financial Statements
7
Table of Contents
FINANCIAL STATEMENTS | STATEMENT OF OPERATIONS (unaudited)
This statement describes how much your fund earned in investment income and accrued in expenses. It also describes any gains and/or losses generated by fund operations.
| Six months ended 6/30/08 | ||||||
| Net investment income | ||||||
Income | ||||||
Dividends | $2,533,090 | |||||
Interest | 135,358 | |||||
Foreign taxes withheld | (55,983 | ) | ||||
Total investment income | $2,612,465 | |||||
Expenses | ||||||
Management fee | $1,050,685 | |||||
Distribution fees | 24,602 | |||||
Shareholder servicing costs | 25,640 | |||||
Administrative services fee | 22,693 | |||||
Independent trustees’ compensation | 5,609 | |||||
Custodian fee | 35,014 | |||||
Shareholder communications | 22,552 | |||||
Auditing fees | 23,291 | |||||
Legal fees | 2,285 | |||||
Miscellaneous | 11,755 | |||||
Total expenses | $1,224,126 | |||||
Reduction of expenses by investment adviser | (826 | ) | ||||
Net expenses | $1,223,300 | |||||
Net investment income | $1,389,165 | |||||
Realized and unrealized gain (loss) on investments | ||||||
Realized gain (loss) (identified cost basis) | ||||||
Investment transactions | $7,122,708 | |||||
Written option transactions | 78,338 | |||||
Foreign currency transactions | 4,212 | |||||
Net realized gain (loss) on investments and foreign currency transactions | $7,205,258 | |||||
Change in unrealized appreciation (depreciation) | ||||||
Investments | $(35,991,728 | ) | ||||
Translation of assets and liabilities in foreign currencies | (471 | ) | ||||
Net unrealized gain (loss) on investments and foreign currency translation | $(35,992,199 | ) | ||||
Net realized and unrealized gain (loss) on investments and foreign currency | $(28,786,941 | ) | ||||
Change in net assets from operations | $(27,397,776 | ) |
See Notes to Financial Statements
8
Table of Contents
FINANCIAL STATEMENTS | STATEMENTS OF CHANGES IN NET ASSETS
These statements describe the increases and/or decreases in net assets resulting from operations, any distributions, and any shareholder transactions.
| Six months ended 6/30/08 | | Year ended 12/31/07 | | |||
| Change in net assets | (unaudited) | |||||
From operations | ||||||
Net investment income | $1,389,165 | $1,324,320 | ||||
Net realized gain (loss) on investments and foreign currency transactions | 7,205,258 | 36,536,979 | ||||
Net unrealized gain (loss) on investments and foreign currency translation | (35,992,199 | ) | (1,427,722 | ) | ||
Change in net assets from operations | $(27,397,776 | ) | $36,433,577 | |||
Distributions declared to shareholders | ||||||
From net investment income | ||||||
Initial Class | $(1,264,745 | ) | $(1,919,641 | ) | ||
Service Class | (48,106 | ) | (88,798 | ) | ||
Total distributions declared to shareholders | $(1,312,851 | ) | $(2,008,439 | ) | ||
Change in net assets from fund share transactions | $(23,451,984 | ) | $(16,245,578 | ) | ||
Total change in net assets | $(52,162,611 | ) | $18,179,560 | |||
Net assets | ||||||
At beginning of period | 302,455,089 | 284,275,529 | ||||
At end of period (including undistributed net investment income of $1,388,683 and | $250,292,478 | $302,455,089 |
See Notes to Financial Statements
9
Table of Contents
FINANCIAL STATEMENTS | FINANCIAL HIGHLIGHTS
The financial highlights table is intended to help you understand the fund’s financial performance for the semiannual period and the past 5 fiscal years. Certain information reflects financial results for a single fund share. The total returns in the table represent the rate by which an investor would have earned (or lost) on an investment in the fund share class (assuming reinvestment of all distributions) held for the entire period.
| Initial Class | Six months | Years ended 12/31 | ||||||||||||||||
| 2007 | 2006 | 2005 | 2004 | 2003 | ||||||||||||||
| (unaudited) | ||||||||||||||||||
Net asset value, beginning of period | $20.28 | $18.04 | $16.41 | $15.30 | $13.35 | $10.78 | ||||||||||||
Income (loss) from investment operations | ||||||||||||||||||
Net investment income (d) | $0.10 | $0.09 | $0.12 | $0.07 | $0.06 | $0.10 | ||||||||||||
Net realized and unrealized gain (loss) on investments and foreign currency | (2.01 | ) | 2.28 | 1.59 | 1.11 | 2.04 | 2.55 | |||||||||||
Total from investment operations | $(1.91 | ) | $2.37 | $1.71 | $1.18 | $2.10 | $2.65 | |||||||||||
Less distributions declared to shareholders | ||||||||||||||||||
From net investment income | $(0.09 | ) | $(0.13 | ) | $(0.08 | ) | $(0.07 | ) | $(0.15 | ) | $(0.08 | ) | ||||||
Net asset value, end of period | $18.28 | $20.28 | $18.04 | $16.41 | $15.30 | $13.35 | ||||||||||||
Total return (%) (k)(r)(s) | (9.43 | )(n) | 13.20 | 10.48 | 7.80 | 15.85 | (b) | 24.71 | (j) | |||||||||
| Ratios (%) (to average net assets) and Supplemental data: | ||||||||||||||||||
Expenses before expense reductions (f) | 0.86 | (a) | 0.88 | 0.90 | 0.93 | 0.88 | 0.88 | |||||||||||
Expenses after expense reductions (f) | 0.86 | (a) | 0.88 | 0.89 | 0.93 | 0.88 | N/A | |||||||||||
Net investment income | 1.01 | (a) | 0.46 | 0.71 | 0.47 | 0.47 | 0.83 | |||||||||||
Portfolio turnover | 65 | 87 | 90 | 93 | 118 | 124 | ||||||||||||
Net assets at end of period (000 Omitted) | $231,313 | $281,339 | $267,602 | $289,472 | $339,259 | $352,464 | ||||||||||||
See Notes to Financial Statements
10
Table of Contents
Financial Highlights – continued
| Service Class | Six months ended 6/30/08 | Years ended 12/31 | ||||||||||||||||
| 2007 | 2006 | 2005 | 2004 | 2003 | ||||||||||||||
| (unaudited) | ||||||||||||||||||
Net asset value, beginning of period | $20.16 | $17.94 | $16.33 | $15.23 | $13.30 | $10.74 | ||||||||||||
Income (loss) from investment operations | ||||||||||||||||||
Net investment income (d) | $0.07 | $0.05 | $0.09 | $0.04 | $0.03 | $0.07 | ||||||||||||
Net realized and unrealized gain (loss) on | (1.99 | ) | 2.26 | 1.57 | 1.11 | 2.02 | 2.54 | |||||||||||
Total from investment operations | $(1.92 | ) | $2.31 | $1.66 | $1.15 | $2.05 | $2.61 | |||||||||||
Less distributions declared to shareholders | ||||||||||||||||||
From net investment income | $(0.05 | ) | $(0.09 | ) | $(0.05 | ) | $(0.05 | ) | $(0.12 | ) | $(0.05 | ) | ||||||
Net asset value, end of period | $18.19 | $20.16 | $17.94 | $16.33 | $15.23 | $13.30 | ||||||||||||
Total return (%) (k)(r)(s) | (9.55 | )(n) | 12.93 | 10.20 | 7.57 | 15.57 | (b) | 24.37 | (j) | |||||||||
| Ratios (%) (to average net assets) and Supplemental data: | ||||||||||||||||||
Expenses before expense reductions (f) | 1.11 | (a) | 1.13 | 1.14 | 1.19 | 1.13 | 1.13 | |||||||||||
Expenses after expense reductions (f) | 1.11 | (a) | 1.13 | 1.14 | 1.19 | 1.13 | N/A | |||||||||||
Net investment income | 0.74 | (a) | 0.23 | 0.51 | 0.23 | 0.21 | 0.58 | |||||||||||
Portfolio turnover | 65 | 87 | 90 | 93 | 118 | 124 | ||||||||||||
Net assets at end of period (000 Omitted) | $18,980 | $21,116 | $16,674 | $13,533 | $9,424 | $6,693 | ||||||||||||
| (a) | Annualized. |
| (b) | The fund’s net asset value and total return calculation include a non-recurring accrual recorded as a result of an administrative proceeding regarding disclosure of brokerage allocation practices in connection with fund sales. The non-recurring accrual resulted in an increase in the net asset value of $0.01 per share based on shares outstanding on the day the proceeds were recorded. |
| (d) | Per share data is based on average shares outstanding. |
| (f) | Ratios do not reflect reductions from fees paid indirectly, if applicable. |
| (j) | The fund’s net asset value and total return calculation include proceeds received on March 26, 2003 for the partial payment of a non-recurring litigation settlement from Cendant Corporation, recorded as a realized gain on investment transactions. The proceeds resulted in an increase in the net asset value of $0.02 per share based on shares outstanding on the day the proceeds were received. Excluding the effect of this payment from the ending net asset value per share, the Initial Class and Service Class total returns for the year ended December 31, 2003 would have each been lower by approximately 0.22%. |
| (k) | The total return does not reflect expenses that apply to separate accounts. Inclusion of these charges would reduce the total return figures for all periods shown. |
| (n) | Not annualized. |
| (r) | Certain expenses have been reduced without which performance would have been lower. |
| (s) | From time to time the fund may receive proceeds from litigation settlements, without which performance would be lower. |
See Notes to Financial Statements
11
Table of Contents
NOTES TO FINANCIAL STATEMENTS (unaudited)
| (1) | Business and Organization |
MFS Research Series (the fund) is a series of MFS Variable Insurance Trust (the trust). The trust is organized as a Massachusetts business trust and is registered under the Investment Company Act of 1940, as amended, as an open-end management investment company. The shareholders of each series of the trust are separate accounts of insurance companies, which offer variable annuity and/or life insurance products, and qualified retirement and pension plans.
| (2) | Significant Accounting Policies |
General – The preparation of financial statements in conformity with U.S. generally accepted accounting principles requires management to make estimates and assumptions that affect the reported amounts of assets and liabilities, and disclosure of contingent assets and liabilities at the date of the financial statements and the reported amounts of revenues and expenses during the reporting period. Actual results could differ from those estimates. The fund can invest in foreign securities, including securities of emerging market issuers. Investments in foreign securities are vulnerable to the effects of changes in the relative values of the local currency and the U.S. dollar and to the effects of changes in each country’s legal, political, and economic environment. The markets of emerging markets countries are generally more volatile than the markets of developed countries with more mature economies. All of the risks of investing in foreign securities previously described are heightened when investing in emerging markets countries.
Investment Valuations – Equity securities, including restricted equity securities, are generally valued at the last sale or official closing price as reported by an independent pricing service on the market or exchange on which they are primarily traded. For securities for which there were no sales reported that day, equity securities are generally valued at the last quoted daily bid quotation as reported by an independent pricing service on the market or exchange on which they are primarily traded. For securities held short for which there were no sales reported for the day, the position is generally valued at the last quoted daily ask quotation as reported by an independent pricing service on the market or exchange on which such securities are primarily traded. Short-term instruments with a maturity at issuance of 60 days or less may be valued at amortized cost, which approximates market value. Exchange-traded options are generally valued at the last sale or official closing price as reported by an independent pricing service on the exchange on which such options are primarily traded. Exchange-traded options for which there were no sales reported that day are generally valued at the last daily bid quotation as reported by an independent pricing service on the exchange on which such options are primarily traded. Options not traded on an exchange are generally valued at a broker-dealer bid quotation. Foreign currency options are generally valued using an external pricing model that uses market data from an independent source. Open-end investment companies are generally valued at net asset value per share. Securities and other assets generally valued on the basis of information from an independent pricing service may also be valued at a broker-dealer bid quotation. Values obtained from pricing services can utilize both dealer-supplied valuations and electronic data processing techniques, which take into account factors such as institutional-size trading in similar groups of securities, yield, quality, coupon rate, maturity, type of issue, trading characteristics, and other market data. The values of foreign securities and other assets and liabilities expressed in foreign currencies are converted to U.S. dollars using the mean of bid and asked prices for rates reported by an independent pricing service.
The Board of Trustees has delegated primary responsibility for determining or causing to be determined the value of the fund’s investments (including any fair valuation) to the adviser pursuant to valuation policies and procedures approved by the Board. If the adviser determines that reliable market quotations are not readily available, investments are valued at fair value as determined in good faith by the adviser in accordance with such procedures under the oversight of the Board of Trustees. Under the fund’s valuation policies and procedures, market quotations are not considered to be readily available for most types of debt instruments and floating rate loans and many types of derivatives. These investments are generally valued at fair value based on information from independent pricing services. In addition, investments may be valued at fair value if the adviser determines that an investment’s value has been materially affected by events occurring after the close of the exchange or market on which the investment is principally traded (such as foreign exchange or market) and prior to the determination of the fund’s net asset value, or after the halting of trading of a specific security where trading does not resume prior to the close of the exchange or market on which the security is principally traded. Events that occur on a frequent basis after foreign markets close (such as developments in foreign markets and significant movements in the U.S. markets) and prior to the determination of the fund’s net asset value may be deemed to have a material affect on the value of securities traded in foreign markets. Accordingly, the fund’s foreign equity securities may often be valued at fair value. The adviser may rely on independent pricing services or other information (such as the correlation with price movements of similar securities in the same or other markets; the type, cost and investment characteristics of the security; the business and financial condition of the issuer; and trading and other market data) to assist in determining whether to fair value and at what value to fair value an investment. The value of an investment for purposes of calculating the fund’s net asset value can differ depending on the source and method used to determine value. When fair valuation is used, the value of investments used to determine the fund’s net asset value may differ from quoted or published prices for the same investments.
12
Table of Contents
Notes to Financial Statements (unaudited) – continued
The fund adopted FASB Statement No. 157, Fair Value Measurements (the “Statement”) in this reporting period. This Statement provides a single definition of fair value, a hierarchy for measuring fair value and expanded disclosures about fair value measurements.
Various inputs are used in determining the value of the fund’s assets or liabilities carried at market value. These inputs are categorized into three broad levels. Level 1 includes quoted prices in active markets for identical assets or liabilities. Level 2 includes other significant observable market-based inputs (including quoted prices for similar securities, interest rates, prepayment speed, and credit risk). Level 3 includes unobservable inputs, which may include the adviser’s own assumptions in determining the fair value of investments. Other financial instruments are derivative instruments not reflected in total investments, such as futures, forwards, swap contracts and written options, which are valued at the unrealized appreciation/depreciation on the instrument. The following is a summary of the levels used as of June 30, 2008 in valuing the fund’s assets or liabilities carried at market value:
| Level 1 | Level 2 | Level 3 | Total | |||||
| Investments in Securities | $238,075,157 | $30,352,917 | $— | $268,428,074 | ||||
| Other Financial Instruments | $— | $— | $— | $— |
Repurchase Agreements – The fund may enter into repurchase agreements with institutions that the fund’s investment adviser has determined are creditworthy. Each repurchase agreement is recorded at cost. The fund requires that the securities collateral in a repurchase transaction be transferred to a custodian in a manner sufficient to enable the fund to obtain those securities in the event of a default under the repurchase agreement. The fund monitors, on a daily basis, the value of the collateral to ensure that its value, including accrued interest, is greater than amounts owed to the fund under each such repurchase agreement. The fund and other funds managed by Massachusetts Financial Services Company (MFS), may utilize a joint trading account for the purpose of entering into one or more repurchase agreements.
Foreign Currency Translation – Purchases and sales of foreign investments, income, and expenses are converted into U.S. dollars based upon currency exchange rates prevailing on the respective dates of such transactions. Gains and losses attributable to foreign currency exchange rates on sales of securities are recorded for financial statement purposes as net realized gains and losses on investments. Gains and losses attributable to foreign exchange rate movements on income and expenses are recorded for financial statement purposes as foreign currency transaction gains and losses. That portion of both realized and unrealized gains and losses on investments that results from fluctuations in foreign currency exchange rates is not separately disclosed.
Derivative Risk – The fund may invest in derivatives for hedging or non-hedging purposes. While hedging can reduce or eliminate losses, it can also reduce or eliminate gains. When the fund uses derivatives as an investment to gain market exposure, or for hedging purposes, gains and losses from derivative instruments may be substantially greater than the derivative’s original cost. Cash that has been segregated on behalf of certain derivative contracts will be reported separately on the Statement of Assets and Liabilities as restricted cash. On certain over-the-counter derivatives, the fund attempts to reduce its exposure to counterparty credit risk by entering into an ISDA Master Agreement on a bilateral basis with each of the counterparties with whom it undertakes a significant volume of transactions. The ISDA Master Agreement gives the fund the right, upon an event of default by the applicable counterparty, to close out all transactions traded under such agreement and to net amounts owed under each transaction to one net amount payable by one party to the other. This right to close out and net payments across all transactions traded under the ISDA Master Agreement could result in a reduction of the fund’s credit risk to such counterparty equal to any amounts payable by the fund under the applicable transactions, if any. However, absent an event of default by the counterparty, the ISDA Master Agreement does not result in an offset of reported balance sheet assets and liabilities across transactions between the fund and the applicable counterparty. Derivative instruments include written options and purchased options.
Written Options – The fund may write call or put options in exchange for a premium. The premium is initially recorded as a liability, which is subsequently adjusted to the current value of the option contract. When a written option expires, the fund realizes a gain equal to the amount of the premium received. The difference between the premium and the amount paid on effecting a closing transaction is considered a realized gain or loss. When a written call option is exercised, the premium received is offset against the proceeds to determine the realized gain or loss. When a written put option is exercised, the premium reduces the cost basis of the security purchased by the fund. The fund, as writer of an option, may have no control over whether the underlying securities may be sold (call) or purchased (put) and, as a result, bears the market risk of an unfavorable change in the price of the securities underlying the written option. In general, written call options may serve as a partial hedge against decreases in value in the underlying securities to the extent of the premium received.
13
Table of Contents
Notes to Financial Statements (unaudited) – continued
Written Options Transactions
| Number of contracts | Premiums received | |||||
| Outstanding, beginning of period | — | $— | ||||
| Options written | 489 | 101,820 | ||||
| Options closed | (489 | ) | (101,820 | ) | ||
| Outstanding, end of period | — | $— |
Purchased Options – The fund may purchase call or put options for a premium. Purchasing call options may be a hedge against an anticipated increase in the dollar cost of securities to be acquired or to increase the fund’s exposure to the underlying instrument. Purchasing put options may hedge against a decline in the value of portfolio securities. The premium paid is included as an investment in the Statement of Assets and Liabilities and is subsequently adjusted to the current value of the option. Premiums paid for purchased options which have expired are treated as realized losses on investments in the Statement of Operations. Premiums paid for purchased options which are exercised or closed are added to the amount paid or offset against the proceeds on the underlying security or financial instrument to determine the realized gain or loss. The risk of loss associated with purchased options is limited to the premium paid.
In March 2008, FASB Statement No. 161, Disclosures about Derivative Instruments and Hedging Activities (the “Standard”) was issued, and is effective for financial statements issued for fiscal years and interim periods beginning after November 15, 2008. This Standard provides enhanced disclosures about the fund’s use of and accounting for derivative instruments and the effect of derivative instruments on the fund’s results of operations and financial position. Management is evaluating the application of the Standard to the fund, and has not at this time determined the impact, if any, resulting from the adoption of this Standard on the fund’s financial statements.
Security Loans – State Street Bank and Trust Company (“State Street”), as lending agent, may loan the securities of the fund to certain qualified institutions (the “Borrowers”) approved by the fund. The loans are collateralized at all times by cash and/or U.S. Treasury and federal agency obligations in an amount at least equal to the market value of the securities loaned. State Street provides the fund with indemnification against Borrower default. The fund bears the risk of loss with respect to the investment of cash collateral. On loans collateralized by cash, the cash collateral is invested in a money market fund or short-term securities. A portion of the income generated upon investment of the collateral is remitted to the Borrowers, and the remainder is allocated between the fund and the lending agent. On loans collateralized by U.S. Treasury and/or federal agency obligations, a fee is received from the Borrower, and is allocated between the fund and the lending agent. Net income from securities lending is included in interest income on the Statement of Operations. The dividend and interest income earned on the securities loaned is accounted for in the same manner as other dividend and interest income.
Indemnifications – Under the fund’s organizational documents, its officers and trustees may be indemnified against certain liabilities and expenses arising out of the performance of their duties to the fund. Additionally, in the normal course of business, the fund enters into agreements with service providers that may contain indemnification clauses. The fund’s maximum exposure under these agreements is unknown as this would involve future claims that may be made against the fund that have not yet occurred.
Investment Transactions and Income – Investment transactions are recorded on the trade date. Interest income is recorded on the accrual basis. All premium and discount is amortized or accreted for financial statement purposes in accordance with U.S. generally accepted accounting principles. Dividends received in cash are recorded on the ex-dividend date. Certain dividends from foreign securities will be recorded when the fund is informed of the dividend if such information is obtained subsequent to the ex-dividend date. Dividend and interest payments received in additional securities are recorded on the ex-dividend or ex-interest date in an amount equal to the value of the security on such date.
The fund may receive proceeds from litigation settlements. Any proceeds received from litigation involving portfolio holdings are reflected in the Statement of Operations in realized gain/loss if the security has been disposed of by the fund or in unrealized gain/loss if the security is still held by the fund. Any other proceeds from litigation not related to portfolio holdings are reflected as other income in the Statement of Operations.
Fees Paid Indirectly – The fund’s custody fee may be reduced according to an arrangement that measures the value of cash deposited with the custodian by the fund. For the six months ended June 30, 2008, custody fees were not reduced.
Tax Matters and Distributions – The fund intends to qualify as a regulated investment company, as defined under Subchapter M of the Internal Revenue Code, and to distribute all of its taxable income, including realized capital gains. As a result, no provision for federal income tax is required. The fund adopted the provisions of FASB Interpretation No. 48, Accounting for Uncertainty in Income Taxes (“the Interpretation”). The Interpretation prescribes a minimum threshold for financial statement recognition of the benefit of a tax position taken or expected to be taken in a tax return. There was no impact resulting from
14
Table of Contents
Notes to Financial Statements (unaudited) – continued
the adoption of this Interpretation on the fund’s financial statements. Each of the fund’s federal tax returns for the prior three fiscal years remains subject to examination by the Internal Revenue Service. It is the fund’s policy to record interest and penalty charges on underpaid taxes associated with its tax positions as interest expense and miscellaneous expense, respectively. No such charges were recorded in the current financial statements. Foreign taxes, if any, have been accrued by the fund in the accompanying financial statements.
Distributions to shareholders are recorded on the ex-dividend date. Income and capital gain distributions are determined in accordance with income tax regulations, which may differ from U.S. generally accepted accounting principles. Certain capital accounts in the financial statements are periodically adjusted for permanent differences in order to reflect their tax character. These adjustments have no impact on net assets or net asset value per share. Temporary differences which arise from recognizing certain items of income, expense, gain or loss in different periods for financial statement and tax purposes will reverse at some time in the future. Distributions in excess of net investment income or net realized gains are temporary overdistributions for financial statement purposes resulting from differences in the recognition or classification of income or distributions for financial statement and tax purposes.
Book/tax differences primarily relate to wash sale loss deferrals.
The tax character of distributions made during the current period will be determined at fiscal year end. The tax character of distributions declared to shareholders is as follows:
| 12/31/07 | ||
| Ordinary income (including any short-term capital gains) | $2,008,439 |
The federal tax cost and the tax basis components of distributable earnings were as follows:
| As of 6/30/08 | |||
| Cost of investments | $283,837,929 | ||
| Gross appreciation | $15,722,247 | ||
| Gross depreciation | (31,132,102 | ) | |
| Net unrealized appreciation (depreciation) | $(15,409,855 | ) | |
| As of 12/31/07 | |||
| Undistributed ordinary income | $1,312,369 | ||
| Capital loss carryforwards | (232,424,838 | ) | |
| Other temporary differences | (514 | ) | |
| Net unrealized appreciation (depreciation) | 20,581,873 | ||
The aggregate cost above includes prior fiscal year end tax adjustments.
As of December 31, 2007, the fund had capital loss carryforwards available to offset future realized gains. Such losses expire as follows:
| 12/31/09 | $(69,573,625 | ) | |
| 12/31/10 | (162,851,213 | ) | |
| $(232,424,838 | ) |
Multiple Classes of Shares of Beneficial Interest – The fund offers multiple classes of shares, which differ in their respective distribution fees. The fund’s income, realized and unrealized gain (loss), and common expenses are allocated to shareholders based on the daily net assets of each class, without distinction between share classes. Dividends are declared separately for each class. Differences in per share dividend rates are generally due to differences in separate class expenses.
| (3) | Transactions with Affiliates |
Investment Adviser – The fund has an investment advisory agreement with MFS to provide overall investment management and related administrative services and facilities to the fund. The management fee is computed daily and paid monthly at an annual rate of 0.75% of the fund’s average daily net assets. The investment adviser has agreed in writing to reduce its management fee to 0.65% of average daily net assets in excess of $1 billion. This written agreement may be rescinded only upon consent of the fund’s Board of Trustees. For the six months ended June 30, 2008, the fund’s average daily net assets did not exceed $1 billion and therefore, the management fee was not reduced.
Distributor – MFS Fund Distributors, Inc. (MFD), a wholly-owned subsidiary of MFS, is the distributor of shares of the fund. The Trustees have adopted a distribution plan for the Service Class shares pursuant to Rule 12b-1 under the Investment Company Act of 1940.
The fund’s distribution plan provides that the fund will pay MFD distribution fees equal to 0.25% per annum of its average daily net assets attributable to Service Class shares as partial consideration for services performed and expenses incurred by
15
Table of Contents
Notes to Financial Statements (unaudited) – continued
MFD and financial intermediaries (including participating insurance companies that invest in the fund to fund variable annuity and variable life insurance contracts, sponsors of qualified retirement and pension plans that invest in the fund, and affiliates of these participating insurance companies and plan sponsors) in connection with the sale and distribution of the Service Class shares. MFD may subsequently pay all, or a portion, of the distribution fees to financial intermediaries.
Shareholder Servicing Agent – MFS Service Center, Inc. (MFSC), a wholly-owned subsidiary of MFS, receives a fee from the fund for its services as shareholder servicing agent. For the six months ended June 30, 2008, the fee was $25,466, which equated to 0.0182% annually of the fund’s average daily net assets. MFSC also receives payment from the fund for out-of-pocket expenses paid by MFSC on behalf of the fund. For the six months ended June 30, 2008, these costs amounted to $174.
Administrator – MFS provides certain financial, legal, shareholder communications, compliance, and other administrative services to the fund. Under an administrative services agreement, the fund partially reimburses MFS the costs incurred to provide these services. The fund is charged a fixed amount plus a fee based on average daily net assets. The fund’s annual fixed amount is $17,500.
The administrative services fee incurred for the six months ended June 30, 2008 was equivalent to an annual effective rate of 0.0162% of the fund’s average daily net assets.
Trustees’ and Officers’ Compensation – The fund pays compensation to independent trustees in the form of a retainer, attendance fees, and additional compensation to Board and Committee chairpersons. The fund does not pay compensation directly to trustees or officers of the fund who are also officers of the investment adviser, all of whom receive remuneration for their services to the fund from MFS. Certain officers and trustees of the fund are officers or directors of MFS, MFD, and MFSC.
Other – This fund and certain other MFS funds (the funds) have entered into a services agreement (the Agreement) which provides for payment of fees by the funds to Tarantino LLC in return for the provision of services of an Independent Chief Compliance Officer (ICCO) for the funds. The ICCO is an officer of the funds and the sole member of Tarantino LLC. The funds can terminate the Agreement with Tarantino LLC at any time under the terms of the Agreement. For the six months ended June 30, 2008, the fee paid by the fund to Tarantino LLC was $835 and is included in miscellaneous expense on the Statement of Operations. MFS has agreed to reimburse the fund for a portion of the payments made by the fund to Tarantino LLC in the amount of $826, which is shown as a reduction of total expenses in the Statement of Operations. Additionally, MFS has agreed to bear all expenses associated with office space, other administrative support, and supplies provided to the ICCO.
| (4) | Portfolio Securities |
Purchases and sales of investments, other than U.S. Government securities, purchased option transactions, and short-term obligations, aggregated $182,932,388 and $205,493,708, respectively.
| (5) | Shares of Beneficial Interest |
The fund’s Declaration of Trust permits the Trustees to issue an unlimited number of full and fractional shares of beneficial interest. Transactions in fund shares were as follows:
| Six months ended 6/30/08 | Year ended 12/31/07 | |||||||||||
| Shares | Amount | Shares | Amount | |||||||||
| Shares sold | ||||||||||||
Initial Class | 2,367,391 | $45,510,542 | 2,497,898 | $48,381,164 | ||||||||
Service Class | 94,580 | 1,772,022 | 212,610 | 4,135,391 | ||||||||
| 2,461,971 | $47,282,564 | 2,710,508 | $52,516,555 | |||||||||
| Shares issued to shareholders in reinvestment of distributions | ||||||||||||
Initial Class | 66,741 | $1,264,745 | 101,892 | $1,919,641 | ||||||||
Service Class | 2,551 | 48,106 | 4,733 | 88,798 | ||||||||
| 69,292 | $1,312,851 | 106,625 | $2,008,439 | |||||||||
| Shares reacquired | ||||||||||||
Initial Class | (3,654,556 | ) | $(70,154,609 | ) | (3,559,798 | ) | $(68,846,214 | ) | ||||
Service Class | (101,386 | ) | (1,892,790 | ) | (99,215 | ) | (1,924,358 | ) | ||||
| (3,755,942 | ) | $(72,047,399 | ) | (3,659,013 | ) | $(70,770,572 | ) | |||||
| Net change | ||||||||||||
Initial Class | (1,220,424 | ) | $(23,379,322 | ) | (960,008 | ) | $(18,545,409 | ) | ||||
Service Class | (4,255 | ) | (72,662 | ) | 118,128 | 2,299,831 | ||||||
| (1,224,679 | ) | $(23,451,984 | ) | (841,880 | ) | $(16,245,578 | ) | |||||
16
Table of Contents
Notes to Financial Statements (unaudited) – continued
| (6) | Line of Credit |
The fund and other funds managed by MFS participate in a $1 billion unsecured committed line of credit provided by a syndication of banks under a credit agreement. In addition, the fund and other funds managed by MFS have established uncommitted borrowing arrangements with certain banks. Borrowings may be made for temporary financing needs. Interest is charged to each fund, based on its borrowings, generally at a rate equal to the Federal Reserve funds rate plus 0.30%. In addition, a commitment fee, based on the average daily, unused portion of the committed line of credit, is allocated among the participating funds at the end of each calendar quarter. For the six months ended June 30, 2008, the fund’s commitment fee and interest expense were $639 and $0, respectively, and are included in miscellaneous expense on the Statement of Operations.
17
Table of Contents
BOARD REVIEW OF INVESTMENT ADVISORY AGREEMENT
A discussion regarding the Board’s most recent review and renewal of the fund’s Investment Advisory Agreement with MFS will be available on or about November 1, 2008 by clicking on the fund’s name under “Variable Insurance Portfolios - VIT” in the “Products and Performance” section of the MFS Web site (mfs.com).
PROXY VOTING POLICIES AND INFORMATION
A general description of the MFS funds’ proxy voting policies and procedures is available without charge, upon request, by calling 1-800-225-2606, by visiting the Proxy Voting section of mfs.com or by visiting the SEC’s Web site at http://www.sec.gov.
Information regarding how the fund voted proxies relating to portfolio securities during the most recent twelve-month period ended June 30 is available without charge by visiting the Proxy Voting section of mfs.com or by visiting the SEC’s Web site at http://www.sec.gov.
QUARTERLY PORTFOLIO DISCLOSURE
The fund will file a complete schedule of portfolio holdings with the Securities and Exchange Commission (the Commission) for the first and third quarters of each fiscal year on Form N-Q. The fund’s Form N-Q may be reviewed and copied at the:
Public Reference Room
Securities and Exchange Commission
100 F Street, NE, Room 1580
Washington, D.C. 20549
Information on the operation of the Public Reference Room may be obtained by calling the Commission at 1-800-SEC-0330. The fund’s Form N-Q is available on the EDGAR database on the Commission’s Internet Web site at http://www.sec.gov, and copies of this information may be obtained, upon payment of a duplicating fee, by electronic request at the following e-mail address: publicinfo@sec.gov or by writing the Public Reference Section at the above address.
18
Table of Contents
CONTACT US
Web site
mfs.com
Account service and literature
Shareholders
1-877-411-3325
9 a.m. to 5 p.m. Eastern Time
Investment professionals
1-800-637-8730
8 a.m. to 5 p.m. Eastern Time
Mailing address
MFS Service Center, Inc.
Attn: Institutional Alliance Services (IAS)
P.O. Box 55824
Boston, MA 02205-5824
Overnight mail
MFS Service Center, Inc.
c/o Boston Financial Data Services
30 Dan Road
Canton, MA 02021-2809

Table of Contents
Table of Contents
MFS® STRATEGIC INCOME SERIES
This report is prepared for the general information of contract owners. It is authorized for distribution to prospective investors only when preceded or accompanied by a current prospectus.
NOT FDIC INSURED Ÿ MAY LOSE VALUE Ÿ NO BANK OR CREDIT UNION GUARANTEE Ÿ NOT A DEPOSIT Ÿ NOT INSURED BY ANY FEDERAL GOVERNMENT AGENCY OR NCUA/NCUSIF
Table of Contents

Dear Contract Owners:
Negative headlines tend to resonate during difficult markets, and we certainly have had more than our share of tough news recently. As a result consumer, and particularly investor, sentiment are at all-time lows. That said, I do think it is helpful to remember there are always silver linings in the storm clouds if you look hard enough.
Through all of the challenges we have faced, there are some positive underlying trends. In the United States, for example, institutional traders and credit market followers are just now showing increasing signs of confidence and are beginning to take on more risk. At the corporate level, earnings continue to be relatively strong as companies have reduced labor costs, controlled inventories, and relied less on debt to finance expansion. More broadly, low interest rates and strong demand for consumer goods and industrial equipment are good signs for the global economy.
While I do not mean to minimize the risks inherent in today’s markets, periods such as these allow the talented fund managers and research analysts we have at MFS® to test their convictions, reevaluate existing positions, and identify new investment ideas. Our investment process also includes a significant risk management component, with constant attention paid to monitoring market risk, so we can do our best to minimize any surprises to your portfolio.
For investors, this is a great time to check in with your advisor and make sure you have a sound investment plan in place — one that can keep your hard-earned money working over the long term through a strategy that involves asset allocation, diversification, and periodic portfolio rebalancing and reviews. A plan tailored to your distinct needs and goals continues to be the best approach to help you take advantage of the inevitable challenges — and opportunities — that present themselves over time.
Respectfully,

Robert J. Manning
Chief Executive Officer and Chief Investment Officer
MFS Investment Management®
August 15, 2008
The opinions expressed in this letter are subject to change, may not be relied upon for investment advice, and no forecasts can be guaranteed.
1
Table of Contents
Portfolio structure (i)
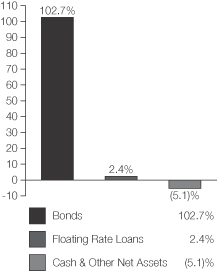
| Fixed income sectors (i) | ||
| High Yield Corporates | 33.4% | |
| Non-U.S. Government Bonds | 22.9% | |
| High Grade Corporates | 18.9% | |
| U.S. Treasury Securities | 11.2% | |
| Emerging Market Bonds | 6.0% | |
| Commercial Mortgage-Backed Securities | 3.4% | |
| Mortgage-Backed Securities | 2.9% | |
| U.S. Government Agencies | 2.7% | |
| Floating Rate Loans | 2.4% | |
| Asset-Backed Securities | 1.0% | |
| Collateralized Debt Obligations | 0.3% |
| Credit quality of bonds (r) | ||
| AAA | 28.7% | |
| AA | 8.3% | |
| A | 9.0% | |
| BBB | 14.9% | |
| BB | 11.7% | |
| B | 19.6% | |
| CCC | 6.5% | |
| D | 0.1% | |
| Not Rated | 1.2% | |
| Portfolio facts | ||
| Average Duration (d)(i) | 5.2 | |
| Average Life (i)(m) | 7.7 yrs. | |
| Average Maturity (i)(m) | 10.5 yrs. | |
| Average Credit Quality of Rated Securities (long-term) (a) | BBB+ | |
| Average Credit Quality of Rated Securities (short-term) (a) | A-1 | |
| Country weightings (i) | ||
| United States | 62.3% | |
| Japan | 6.9% | |
| Germany | 4.0% | |
| France | 3.5% | |
| Netherlands | 3.4% | |
| United Kingdom | 3.0% | |
| Spain | 2.2% | |
| Canada | 2.1% | |
| Ireland | 1.8% | |
| Other Countries | 10.8% | |
| (a) | The average credit quality of rated securities is based upon a market weighted average of portfolio holdings that are rated by public rating agencies. |
| (d) | Duration is a measure of how much a bond’s price is likely to fluctuate with general changes in interest rates, e.g., if rates rise 1.00%, a bond with a 5-year duration is likely to lose about 5.00% of its value. |
| (i) | For purposes of this presentation, the bond component includes accrued interest amounts and may be positively or negatively impacted by the equivalent exposure from any derivative holdings, if applicable, which may result in the investment in a sector less then 0%. |
| (m) | The average maturity shown is calculated using the final stated maturity on the portfolio’s holdings without taking into account any holdings which have been pre-refunded or pre-paid to an earlier date or which have a mandatory put date prior to the stated maturity. The average life shown takes into account these earlier dates. |
| (r) | Each security is assigned a rating from Moody’s Investors Service. If not rated by Moody’s, the rating will be that assigned by Standard & Poor’s. Likewise, if not assigned a rating by Standard & Poor’s, it will be based on the rating assigned by Fitch, Inc. For those portfolios that hold a security which is not rated by any of the three agencies, the security is considered Not Rated. Holdings in U.S. Treasuries and government agency mortgage-backed securities, if any, are included in the “AAA”-rating category. Percentages are based on the total market value of investments as of 6/30/08. |
From time to time “Cash & Other Assets” may be negative due to timing of cash receipts and/or equivalent exposure from any derivative holdings.
Percentages are based on net assets as of 06/30/08, unless otherwise noted.
The portfolio is actively managed and current holdings may be different.
2
Table of Contents
Fund Expenses Borne by the Contract Holders During the Period,
January 1, 2008 through June 30, 2008
As a contract holder of the fund, you incur ongoing costs, including management fees; distribution (12b-1) fees; and other fund expenses. This example is intended to help you understand your ongoing costs (in dollars) of investing in the fund and to compare these costs with the ongoing costs of investing in other mutual funds.
The example is based on an investment of $1,000 invested at the beginning of the period and held for the entire period January 1, 2008 through June 30, 2008.
Actual Expenses
The first line for each share class in the following table provides information about actual account values and actual expenses. You may use the information in this line, together with the amount you invested, to estimate the expenses that you paid over the period. Simply divide your account value by $1,000 (for example, an $8,600 account value divided by $1,000 = 8.6), then multiply the result by the number in the first line under the heading entitled “Expenses Paid During Period” to estimate the expenses you paid on your account during this period.
Hypothetical Example for Comparison Purposes
The second line for each share class in the following table provides information about hypothetical account values and hypothetical expenses based on the fund’s actual expense ratio and an assumed rate of return of 5% per year before expenses, which is not the fund’s actual return. The hypothetical account values and expenses may not be used to estimate the actual ending account balance or expenses you paid for the period. You may use this information to compare the ongoing costs of investing in the fund and other funds. To do so, compare this 5% hypothetical example with the 5% hypothetical examples that appear in the shareholder reports of the other funds.
Please note that the expenses shown in the table are meant to highlight the fund’s ongoing costs only and do not take into account the fees and expenses imposed under the variable contracts through which your investment in the fund is made. Therefore, the second line for each share class in the table is useful in comparing ongoing costs associated with an investment in vehicles (such as the fund) which fund benefits under variable annuity and variable life insurance contracts and to qualified pension and retirement plans only, and will not help you determine the relative total costs of investing in the fund through variable annuity and variable life insurance contracts. If the fees and expenses imposed under the variable contracts were included, your costs would have been higher.
| Share Class | Annualized Expense Ratio | Beginning Account Value 1/01/08 | Ending Account Value | Expenses Paid During Period (p) 1/01/08-6/30/08 | ||||||
| Initial Class | Actual | 0.85% | $1,000.00 | $995.71 | $4.22 | |||||
| Hypothetical (h) | 0.85% | $1,000.00 | $1,020.64 | $4.27 | ||||||
| Service Class | Actual | 1.10% | $1,000.00 | $995.69 | $5.46 | |||||
| Hypothetical (h) | 1.10% | $1,000.00 | $1,019.39 | $5.52 |
| (h) | 5% class return per year before expenses. |
| (p) | Expenses paid is equal to each class’ annualized expense ratio, as shown above, multiplied by the average account value over the period, multiplied by the number of days in the period, divided by the number of days in the year. |
3
Table of Contents
PORTFOLIO OF INVESTMENTS – 6/30/08 (unaudited)
The Portfolio of Investments is a complete list of all securities owned by your fund. It is categorized by broad-based asset classes.
| Issuer | Shares/Par | Value ($) | ||||
| BONDS – 96.3% | ||||||
| Aerospace – 0.4% | ||||||
| Hawker Beechcraft Acquisition Co. LLC, 9.75%, 2017 | $ | 65,000 | $ | 65,000 | ||
| Vought Aircraft Industries, Inc., 8%, 2011 | 85,000 | 79,050 | ||||
| $ | 144,050 | |||||
| Airlines – 0.2% | ||||||
| Continental Airlines, Inc., 7.339%, 2014 | $ | 78,000 | $ | 59,280 | ||
| Asset Backed & Securitized – 4.6% | ||||||
| ARCap REIT, Inc., CDO, “H”, 6.1%, 2045 (n) | $ | 100,000 | $ | 35,000 | ||
| Bayview Financial Revolving Mortgage Loan Trust, FRN, 3.182%, 2040 (z) | 250,000 | 191,740 | ||||
| Brazilian Merchant Voucher Receivables Ltd., 5.911%, 2011 (z) | 135,974 | 135,124 | ||||
| Countrywide Asset-Backed Certificates, FRN, 4.575%, 2035 | 3,715 | 3,687 | ||||
| Crest Ltd., CDO, 7%, 2040 | 137,000 | 71,141 | ||||
| Deutsche Mortgage & Asset Receiving Corp., FRN, 7.5%, 2031 | 153,000 | 158,277 | ||||
| DLJ Commercial Mortgage Corp., 6.04%, 2031 (z) | 185,000 | 180,351 | ||||
| Falcon Franchise Loan LLC, 6.5%, 2014 (z) | 250,000 | 149,570 | ||||
| Falcon Franchise Loan LLC, FRN, 3.773%, 2023 (i)(z) | 516,406 | 53,174 | ||||
| First Union National Bank Commercial Mortgage Trust, FRN, 1.142%, 2043 (i)(n) | 2,046,208 | 40,888 | ||||
| First Union-Lehman Brothers Bank of America, FRN, 0.546%, 2028 (i) | 1,772,353 | 28,986 | ||||
| First Union-Lehman Brothers Commercial Mortgage Trust, 7%, 2029 (n) | 118,339 | 123,043 | ||||
| Lehman Brothers Commercial Conduit Mortgage Trust, FRN, 0.973%, 2028 (i) | 427,244 | 14,739 | ||||
| Morgan Stanley Capital I, Inc., FRN, 1.413%, 2014 (i)(n) | 1,332,449 | 36,122 | ||||
| Mortgage Capital Funding, Inc., FRN, 0.573%, 2031 (i) | 276,333 | 398 | ||||
| Prudential Securities Secured Financing Corp., FRN, 7.291%, 2013 (z) | 171,000 | 137,183 | ||||
| Salomon Brothers Mortgage Securities, Inc., FRN, 7.272%, 2012 (z) | 224,179 | 238,544 | ||||
| $ | 1,597,967 | |||||
| Automotive – 1.1% | ||||||
| Allison Transmission, Inc., 11%, 2015 (n) | $ | 90,000 | $ | 80,550 | ||
| Ford Motor Credit Co. LLC, 12%, 2015 | 200,000 | 175,933 | ||||
| Ford Motor Credit Co. LLC, FRN, 4.283%, 2010 | 45,000 | 39,619 | ||||
| General Motors Corp., 8.375%, 2033 | 89,000 | 52,733 | ||||
| Johnson Controls, Inc., 5.25%, 2011 | 30,000 | 30,338 | ||||
| $ | 379,173 | |||||
| Issuer | Shares/Par | Value ($) | ||||
| BONDS – continued | ||||||
| Broadcasting – 2.5% | ||||||
| Allbritton Communications Co., 7.75%, 2012 | $ | 75,000 | $ | 72,938 | ||
| Bonten Media Acquisition Co., 9%, 2015 (n)(p) | 20,000 | 14,600 | ||||
| CanWest MediaWorks LP, 9.25%, 2015 (n) | 45,000 | 36,675 | ||||
| DIRECTV Holdings LLC, 7.625%, 2016 (z) | 70,000 | 68,950 | ||||
| Grupo Televisa S.A., 8.5%, 2032 | 20,000 | 23,254 | ||||
| Lamar Media Corp., 6.625%, 2015 | 65,000 | 59,150 | ||||
| Lamar Media Corp., “C”, 6.625%, 2015 | 40,000 | 36,400 | ||||
| LBI Media, Inc., 8.5%, 2017 (n) | 40,000 | 30,800 | ||||
| Liberty Media Corp., 5.7%, 2013 | 60,000 | 53,771 | ||||
| LIN TV Corp., 6.5%, 2013 | 90,000 | 82,350 | ||||
| Local TV Finance LLC, 9.25%, 2015 (n)(p) | 65,000 | 50,700 | ||||
| Newport Television LLC, 13%, 2017 (n)(p) | 65,000 | 57,200 | ||||
| News America, Inc., 6.4%, 2035 | 100,000 | 94,632 | ||||
| Nexstar Broadcasting Group, Inc., 7%, 2014 | 80,000 | 69,600 | ||||
| Univision Communications, Inc., 9.75%, 2015 (n)(p) | 125,000 | 91,875 | ||||
| $ | 842,895 | |||||
| Brokerage & Asset Managers – 0.6% | ||||||
| Lehman Brothers Holdings, Inc., 6.5%, 2017 | $ | 100,000 | $ | 92,512 | ||
| Merrill Lynch & Co., Inc., 6.4%, 2017 | 30,000 | 27,799 | ||||
| Nuveen Investments, Inc., 10.5%, 2015 (n) | 110,000 | 101,475 | ||||
| $ | 221,786 | |||||
| Building – 1.0% | ||||||
| Associated Materials, Inc., 0% to 2009, 11.25% to 2014 | $ | 50,000 | $ | 33,000 | ||
| Building Materials Corp. of America, 7.75%, 2014 | 50,000 | 41,000 | ||||
| Lafarge S.A., 6.15%, 2011 | 160,000 | 160,933 | ||||
| Nortek Holdings, Inc., 10%, 2013 (n) | 30,000 | 28,650 | ||||
| Nortek Holdings, Inc., 8.5%, 2014 | 70,000 | 44,800 | ||||
| Ply Gem Industries, Inc., 9%, 2012 | 85,000 | 49,938 | ||||
| $ | 358,321 | |||||
| Business Services – 0.3% | ||||||
| SunGard Data Systems, Inc., 10.25%, 2015 | $ | 86,000 | $ | 86,430 | ||
| Cable TV – 2.1% | ||||||
| CCH I Holdings LLC, 11%, 2015 | $ | 25,000 | $ | 18,531 | ||
| CCH II Holdings LLC, 10.25%, 2010 | 115,000 | 111,263 | ||||
| CCO Holdings LLC, 8.75%, 2013 | 180,000 | 165,600 | ||||
| CSC Holdings, Inc., 6.75%, 2012 | 165,000 | 155,100 | ||||
| Mediacom LLC, 9.5%, 2013 | 80,000 | 75,400 | ||||
| NTL Cable PLC, 9.125%, 2016 | 100,000 | 93,750 | ||||
| TCI Communications, Inc., 9.8%, 2012 | 81,000 | 91,305 | ||||
| $ | 710,949 | |||||
| Chemicals – 1.5% | ||||||
| Innophos, Inc., 8.875%, 2014 | $ | 45,000 | $ | 45,000 | ||
| Koppers Holdings, Inc., 9.875%, 2013 | 45,000 | 47,250 | ||||
| Momentive Performance Materials, Inc., 11.5%, 2016 | 100,000 | 74,500 | ||||
4
Table of Contents
Portfolio of Investments (unaudited) – continued
| Issuer | Shares/Par | Value ($) | ||||
| BONDS – continued | ||||||
| Chemicals – continued | ||||||
| Nalco Co., 7.75%, 2011 | $ | 65,000 | $ | 65,000 | ||
| Nalco Co., 8.875%, 2013 | 70,000 | 71,750 | ||||
| Nalco Finance Holdings, Inc., 0% to 2009, 9% to 2014 | 55,000 | 50,600 | ||||
| Yara International A.S.A., 5.25%, 2014 (n) | 150,000 | 146,174 | ||||
| $ | 500,274 | |||||
| Computer Software – 0.2% | ||||||
| First Data Corp., 9.875%, 2015 (n) | $ | 85,000 | $ | 73,950 | ||
| Construction – 0.3% | ||||||
| Lennar Corp., 5.125%, 2010 | $ | 130,000 | $ | 113,100 | ||
| Consumer Goods & Services – 1.6% | ||||||
| Corrections Corp. of America, 6.25%, 2013 | $ | 35,000 | $ | 33,688 | ||
| Fortune Brands, Inc., 5.125%, 2011 | 107,000 | 106,431 | ||||
| Jarden Corp., 7.5%, 2017 | 20,000 | 17,400 | ||||
| KAR Holdings, Inc., 10%, 2015 | 50,000 | 42,000 | ||||
| Service Corp. International, 7%, 2017 | 80,000 | 76,400 | ||||
| Service Corp. International, 7.625%, 2018 | 69,000 | 68,828 | ||||
| Western Union Co., 5.4%, 2011 | 210,000 | 208,855 | ||||
| $ | 553,602 | |||||
| Containers – 1.2% | ||||||
| Crown Americas LLC, 7.625%, 2013 | $ | 40,000 | $ | 39,900 | ||
| Crown Americas LLC, 7.75%, 2015 | 70,000 | 70,000 | ||||
| Graham Packaging Co. LP, 9.875%, 2014 | 35,000 | 30,975 | ||||
| Greif, Inc., 6.75%, 2017 | 145,000 | 139,925 | ||||
| Owens-Brockway Glass Container, Inc., 8.25%, 2013 | 140,000 | 143,500 | ||||
| $ | 424,300 | |||||
| Defense Electronics – 0.7% | ||||||
| BAE Systems Holdings, Inc., 5.2%, 2015 (n) | $ | 139,000 | $ | 133,240 | ||
| L-3 Communications Corp., 6.125%, 2014 | 110,000 | 103,125 | ||||
| L-3 Communications Corp., 5.875%, 2015 | 15,000 | 13,838 | ||||
| $ | 250,203 | |||||
| Electronics – 0.4% | ||||||
| Avago Technologies Finance, 11.875%, 2015 | $ | 20,000 | $ | 21,500 | ||
| Flextronics International Ltd., 6.25%, 2014 | 75,000 | 70,125 | ||||
| Spansion LLC, 11.25%, 2016 (n) | 65,000 | 40,300 | ||||
| $ | 131,925 | |||||
| Emerging Market Quasi-Sovereign – 1.0% | ||||||
| Banco Nacional de Desenvolvimento Economico e Social, 6.369%, 2018 (n) | $ | 100,000 | $ | 99,500 | ||
| Corporacion Nacional del Cobre de Chile, 4.75%, 2014 | 100,000 | 96,166 | ||||
| National Power Corp., FRN, 6.888%, 2011 | 60,000 | 63,445 | ||||
| Pemex Project Funding Master Trust, 5.75%, 2018 (n) | 92,000 | 90,850 | ||||
| $ | 349,961 | |||||
| Emerging Market Sovereign – 2.0% | ||||||
| Federative Republic of Brazil, 8%, 2018 | $ | 44,000 | $ | 48,862 | ||
| Gabonese Republic, 8.2%, 2017 (n) | 100,000 | 104,000 | ||||
| Issuer | Shares/Par | Value ($) | ||||
| BONDS – continued | ||||||
| Emerging Market Sovereign – continued | ||||||
| Republic of Argentina, FRN, 3.092%, 2012 | $ | 117,188 | $ | 98,640 | ||
| Republic of Colombia, 7.375%, 2017 | 133,000 | 144,172 | ||||
| Republic of Panama, 7.25%, 2015 | 2,000 | 2,150 | ||||
| Republic of Philippines, 9.375%, 2017 | 30,000 | 34,725 | ||||
| Republic of Uruguay, 8%, 2022 | 100,000 | 106,750 | ||||
| United Mexican States, 6.625%, 2015 | 8,000 | 8,580 | ||||
| United Mexican States, 8.3%, 2031 | 45,000 | 56,925 | ||||
| United Mexican States, 6.75%, 2034 | 89,000 | 94,429 | ||||
| $ | 699,233 | |||||
| Energy – Independent – 3.1% | ||||||
| Chaparral Energy, Inc., 8.875%, 2017 | $ | 45,000 | $ | 39,038 | ||
| Chesapeake Energy Corp., 6.375%, 2015 | 225,000 | 212,625 | ||||
| Forest Oil Corp., 7.25%, 2019 | 35,000 | 33,600 | ||||
| Hilcorp Energy I LP, 7.75%, 2015 (n) | 75,000 | 72,000 | ||||
| Hilcorp Energy I LP, 9%, 2016 (n) | 45,000 | 45,788 | ||||
| Mariner Energy, Inc., 8%, 2017 | 40,000 | 38,700 | ||||
| Newfield Exploration Co., 6.625%, 2014 | 70,000 | 65,800 | ||||
| Nexen, Inc., 6.4%, 2037 | 140,000 | 132,557 | ||||
| OPTI Canada, Inc., 8.25%, 2014 | 110,000 | 109,450 | ||||
| Plains Exploration & Production Co., 7%, 2017 | 110,000 | 105,600 | ||||
| Plains Exploration & Production Co., 7.625%, 2018 | 10,000 | 10,000 | ||||
| Quicksilver Resources, Inc., 7.125%, 2016 | 80,000 | 74,500 | ||||
| SandRidge Energy, Inc., 8.625%, 2015 (n)(p) | 30,000 | 30,750 | ||||
| SandRidge Energy, Inc., 8%, 2018 (n) | 45,000 | 45,225 | ||||
| Southwestern Energy Co., 7.5%, 2018 (n) | 35,000 | 36,012 | ||||
| $ | 1,051,645 | |||||
| Energy – Integrated – 0.3% | ||||||
| Petroleum Co. of Trinidad & Tobago Ltd., 6%, 2022 (n) | $ | 100,000 | $ | 95,500 | ||
| Entertainment – 0.4% | ||||||
| AMC Entertainment, Inc., 11%, 2016 | $ | 40,000 | $ | 39,600 | ||
| Marquee Holdings, Inc., 12%, 2014 | 35,000 | 27,475 | ||||
| Time Warner, Inc., 6.5%, 2036 | 10,000 | 8,902 | ||||
| Turner Broadcasting System, Inc., 8.375%, 2013 | 70,000 | 75,226 | ||||
| $ | 151,203 | |||||
| Financial Institutions – 1.9% | ||||||
| American Express Centurion Bank, 5.2%, 2010 | $ | 250,000 | $ | 250,352 | ||
| General Motors Acceptance Corp., 6.875%, 2011 | 43,000 | 30,899 | ||||
| General Motors Acceptance Corp., 8%, 2031 | 61,000 | 39,685 | ||||
| ILFC E-Capital Trust I, 5.9% to 2010, FRN to 2065 (n) | 200,000 | 161,898 | ||||
| ORIX Corp., 5.48%, 2011 | 180,000 | 166,457 | ||||
| Residential Capital LLC, 9.625%, 2015 (z) | 2,000 | 970 | ||||
| $ | 650,261 | |||||
| Food & Beverages – 1.6% | ||||||
| ARAMARK Corp., 8.5%, 2015 | $ | 110,000 | $ | 107,800 | ||
| B&G Foods, Inc., 8%, 2011 | 45,000 | 44,213 | ||||
5
Table of Contents
Portfolio of Investments (unaudited) – continued
| Issuer | Shares/Par | Value ($) | ||||
| BONDS – continued | ||||||
| Food & Beverages – continued | ||||||
| Dean Foods Co., 7%, 2016 | $ | 40,000 | $ | 34,700 | ||
| Del Monte Corp., 6.75%, 2015 | 50,000 | 47,625 | ||||
| Kraft Foods, Inc., 6.125%, 2018 | 80,000 | 77,474 | ||||
| Miller Brewing Co., 5.5%, 2013 (n) | 150,000 | 153,298 | ||||
| Tyson Foods, Inc., 6.85%, 2016 | 90,000 | 81,787 | ||||
| $ | 546,897 | |||||
| Food & Drug Stores – 0.1% | ||||||
| CVS Caremark Corp., 5.75%, 2017 | $ | 19,000 | $ | 18,687 | ||
| Forest & Paper Products – 1.6% | ||||||
| Buckeye Technologies, Inc., 8%, 2010 | $ | 11,000 | $ | 11,000 | ||
| Buckeye Technologies, Inc., 8.5%, 2013 | 130,000 | 129,350 | ||||
| Georgia-Pacific Corp., 7.125%, 2017 (n) | 35,000 | 32,900 | ||||
| Georgia-Pacific Corp., 8%, 2024 | 25,000 | 23,125 | ||||
| Graphic Packaging International Corp., 9.5%, 2013 | 35,000 | 33,425 | ||||
| International Paper Co., 7.95%, 2018 | 50,000 | 49,722 | ||||
| JSG Funding PLC, 7.75%, 2015 | EUR | 65,000 | 90,093 | |||
| Millar Western Forest Products Ltd., 7.75%, 2013 | $ | 75,000 | 48,750 | |||
| NewPage Holding Corp., 10%, 2012 | 20,000 | 20,250 | ||||
| Smurfit-Stone Container Corp., 8%, 2017 | 30,000 | 24,000 | ||||
| Stora Enso Oyj, 6.404%, 2016 (n) | 100,000 | 87,255 | ||||
| $ | 549,870 | |||||
| Gaming & Lodging – 3.1% | ||||||
| Firekeepers Development Authority, 13.875%, 2015 (z) | $ | 85,000 | $ | 83,088 | ||
| Fontainebleau Las Vegas Holdings LLC, 10.25%, 2015 (n) | 105,000 | 68,250 | ||||
| Harrah’s Operating Co., Inc., 5.5%, 2010 | 40,000 | 35,750 | ||||
| Harrah’s Operating Co., Inc., 5.375%, 2013 | 25,000 | 15,313 | ||||
| Harrah’s Operating Co., Inc., 10.75%, 2016 (n) | 120,000 | 99,600 | ||||
| Harrah’s Operating Co., Inc., 10.75%, 2018 (n)(p) | 75,000 | 55,125 | ||||
| MGM Mirage, 8.375%, 2011 | 175,000 | 168,875 | ||||
| MGM Mirage, 6.75%, 2013 | 40,000 | 34,500 | ||||
| Pinnacle Entertainment, Inc., 7.5%, 2015 | 90,000 | 68,850 | ||||
| Scientific Games Corp., 6.25%, 2012 | 85,000 | 81,388 | ||||
| Station Casinos, Inc., 6%, 2012 | 15,000 | 11,925 | ||||
| Station Casinos, Inc., 6.5%, 2014 | 110,000 | 63,250 | ||||
| Station Casinos, Inc., 6.875%, 2016 | 180,000 | 98,325 | ||||
| Trump Entertainment Resorts Holdings, Inc., 8.5%, 2015 | 120,000 | 74,700 | ||||
| Wyndham Worldwide Corp., 6%, 2016 | 40,000 | 35,323 | ||||
| Wynn Las Vegas LLC, 6.625%, 2014 | 80,000 | 73,200 | ||||
| $ | 1,067,462 | |||||
| Industrial – 0.8% | ||||||
| Blount, Inc., 8.875%, 2012 | $ | 80,000 | $ | 80,000 | ||
| JohnsonDiversey Holdings, Inc., 10.67%, 2013 | 35,000 | 34,825 | ||||
| JohnsonDiversey, Inc., 9.625%, 2012 | EUR | 20,000 | 30,556 | |||
| Issuer | Shares/Par | Value ($) | ||||
| BONDS – continued | ||||||
| Industrial – continued | ||||||
| JohnsonDiversey, Inc., “B”, 9.625%, 2012 | $ | 75,000 | $ | 75,750 | ||
| Steelcase, Inc., 6.5%, 2011 | 61,000 | 61,855 | ||||
| $ | 282,986 | |||||
| Insurance – 1.4% | ||||||
| Allianz AG, 5.5% to 2014, FRN to 2049 | EUR | 105,000 | $ | 152,149 | ||
| American International Group, Inc., 6.25%, 2037 | $ | 120,000 | 93,932 | |||
| Hartford Financial Services Group, Inc., 8.125%, 2038 | 65,000 | 63,262 | ||||
| ING Groep N.V., 5.775% to 2015, FRN to 2049 | 210,000 | 174,295 | ||||
| $ | 483,638 | |||||
| Insurance – Property & Casualty – 0.7% | ||||||
| AXIS Capital Holdings Ltd., 5.75%, 2014 | $ | 180,000 | $ | 170,941 | ||
| USI Holdings Corp., 9.75%, 2015 (n) | 95,000 | 81,700 | ||||
| $ | 252,641 | |||||
| International Market Quasi-Sovereign – 0.2% | ||||||
| Canada Housing Trust, 4.6%, 2011 | CAD | 77,000 | $ | 77,499 | ||
| International Market Sovereign – 22.3% | ||||||
| Federal Republic of Germany, 5.25%, 2010 | EUR | 353,000 | $ | 562,087 | ||
| Federal Republic of Germany, 3.75%, 2015 | EUR | 148,000 | 221,406 | |||
| Federal Republic of Germany, 6.25%, 2030 | EUR | 180,000 | 330,679 | |||
| Government of Canada, 4.5%, 2015 | CAD | 130,000 | 134,833 | |||
| Government of Canada, 5.75%, 2033 | CAD | 34,000 | 41,907 | |||
| Government of Japan, 1.5%, 2012 | JPY | 44,000,000 | 422,042 | |||
| Government of Japan, 1.3%, 2014 | JPY | 73,000,000 | 688,444 | |||
| Government of Japan, 1.7%, 2017 | JPY | 54,000,000 | 517,740 | |||
| Government of Japan, 2.2%, 2027 | JPY | 32,000,000 | 302,794 | |||
| Government of Japan, 2.4%, 2037 | JPY | 18,000,000 | 169,570 | |||
| Kingdom of Denmark, 4%, 2015 | DKK | 687,000 | 136,668 | |||
| Kingdom of Netherlands, 3.75%, 2009 | EUR | 484,000 | 755,147 | |||
| Kingdom of Netherlands, 3.75%, 2014 | EUR | 46,000 | 68,673 | |||
| Kingdom of Spain, 5.35%, 2011 | EUR | 380,000 | 606,959 | |||
| Kingdom of Sweden, 4.5%, 2015 | SEK | 415,000 | 68,530 | |||
| Republic of Austria, 4.65%, 2018 | EUR | 293,000 | 455,620 | |||
| Republic of France, 4.75%, 2012 | EUR | 65,000 | 102,086 | |||
| Republic of France, 5%, 2016 | EUR | 160,000 | 255,630 | |||
| Republic of France, 6%, 2025 | EUR | 78,000 | 136,399 | |||
| Republic of France, 4.75%, 2035 | EUR | 297,000 | 449,766 | |||
| Republic of Ireland, 4.6%, 2016 | EUR | 342,000 | 528,589 | |||
| United Kingdom Treasury, 8%, 2015 | GBP | 159,000 | 369,378 | |||
| United Kingdom Treasury, 8%, 2021 | GBP | 51,000 | 127,850 | |||
| United Kingdom Treasury, 4.25%, 2036 | GBP | 110,000 | 202,259 | |||
| $ | 7,655,056 | |||||
| Machinery & Tools – 0.6% | ||||||
| Atlas Copco AB, 5.6%, 2017 (n) | $ | 160,000 | $ | 155,651 | ||
| Case New Holland, Inc., 7.125%, 2014 | 40,000 | 39,200 | ||||
| $ | 194,851 | |||||
6
Table of Contents
Portfolio of Investments (unaudited) – continued
| Issuer | Shares/Par | Value ($) | ||||
| BONDS – continued | ||||||
| Major Banks – 2.3% | ||||||
| BAC Capital Trust XIV, 5.63% to 2012, FRN to 2049 | $ | 240,000 | $ | 187,279 | ||
| BNP Paribas, 5.186% to 2015, FRN to 2049 (n) | 26,000 | 22,583 | ||||
| BNP Paribas, 7.195% to 2037, FRN to 2049 (n) | 100,000 | 90,426 | ||||
| Natixis S.A., 10% to 2018, FRN to 2049 (z) | 130,000 | 129,744 | ||||
| Royal Bank of Scotland Group PLC, 9.118%, 2049 | 93,000 | 93,712 | ||||
| UniCredito Italiano Capital Trust II, 9.2% to 2010, FRN to 2049 (n) | 125,000 | 128,167 | ||||
| Wachovia Capital Trust III, 5.8% to 2011, FRN to 2042 | 210,000 | 142,800 | ||||
| $ | 794,711 | |||||
| Medical & Health Technology & Services – 3.3% | ||||||
| Biomet, Inc., 10%, 2017 | $ | 35,000 | $ | 37,363 | ||
| Biomet, Inc., 11.625%, 2017 | 90,000 | 95,400 | ||||
| Cardinal Health, Inc., 5.8%, 2016 | 94,000 | 91,998 | ||||
| Community Health Systems, Inc., 8.875%, 2015 | 110,000 | 110,688 | ||||
| Cooper Cos., Inc., 7.125%, 2015 | 65,000 | 62,400 | ||||
| DaVita, Inc., 7.25%, 2015 | 150,000 | 145,875 | ||||
| HCA, Inc., 6.375%, 2015 | 160,000 | 132,800 | ||||
| HCA, Inc., 9.25%, 2016 | 100,000 | 103,000 | ||||
| Hospira, Inc., 5.55%, 2012 | 50,000 | 49,122 | ||||
| Hospira, Inc., 6.05%, 2017 | 40,000 | 38,603 | ||||
| McKesson Corp., 5.7%, 2017 | 40,000 | 38,464 | ||||
| Owens & Minor, Inc., 6.35%, 2016 | 70,000 | 68,753 | ||||
| Psychiatric Solutions, Inc., 7.75%, 2015 | 40,000 | 39,600 | ||||
| U.S. Oncology, Inc., 10.75%, 2014 | 55,000 | 54,588 | ||||
| Universal Hospital Services, Inc., 8.5%, 2015 (p) | 35,000 | 35,000 | ||||
| Universal Hospital Services, Inc., FRN, 6.302%, 2015 | 10,000 | 9,350 | ||||
| VWR Funding, Inc., 10.25%, 2015 (p) | 35,000 | 32,288 | ||||
| $ | 1,145,292 | |||||
| Metals & Mining – 1.5% | ||||||
| Arch Western Finance LLC, 6.75%, 2013 | $ | 55,000 | $ | 53,900 | ||
| FMG Finance Ltd., 10.625%, 2016 (n) | 85,000 | 99,025 | ||||
| Freeport-McMoRan Copper & Gold, Inc., 8.375%, 2017 | 140,000 | 147,700 | ||||
| Freeport-McMoRan Copper & Gold, Inc., FRN, 5.882%, 2015 | 70,000 | 70,690 | ||||
| Peabody Energy Corp., 7.375%, 2016 | 20,000 | 19,950 | ||||
| Peabody Energy Corp., “B”, 6.875%, 2013 | 90,000 | 90,225 | ||||
| PNA Group, Inc., 10.75%, 2016 | 35,000 | 41,125 | ||||
| $ | 522,615 | |||||
| Mortgage Backed – 2.9% | ||||||
| Fannie Mae, 6%, 1934-2012 | $ | 126,997 | $ | 130,564 | ||
| Fannie Mae, 5.5%, 2020-2035 | 852,148 | 855,105 | ||||
| $ | 985,669 | |||||
| Issuer | Shares/Par | Value ($) | ||||
| BONDS – continued | ||||||
| Natural Gas – Distribution – 0.3% | ||||||
| AmeriGas Partners LP, 7.125%, 2016 | $ | 65,000 | $ | 60,288 | ||
| Inergy LP, 6.875%, 2014 | 45,000 | 41,850 | ||||
| $ | 102,138 | |||||
| Natural Gas – Pipeline – 2.5% | ||||||
| Atlas Pipeline Partners LP, 8.125%, 2015 | $ | 45,000 | $ | 44,213 | ||
| CenterPoint Energy, Inc., 7.875%, 2013 | 192,000 | 205,537 | ||||
| Deutsche Bank (El Paso Performance-Linked Trust, CLN), 7.75%, 2011 (n) | 75,000 | 75,557 | ||||
| El Paso Corp., 7.25%, 2018 | 40,000 | 39,400 | ||||
| Kinder Morgan Energy Partners LP, 6%, 2017 | 90,000 | 88,928 | ||||
| Kinder Morgan Finance Corp., 5.35%, 2011 | 169,000 | 163,085 | ||||
| Spectra Energy Capital LLC, 8%, 2019 | 66,000 | 72,198 | ||||
| Williams Cos., Inc., 7.125%, 2011 | 130,000 | 134,550 | ||||
| Williams Partners LP, 7.25%, 2017 | 45,000 | 45,000 | ||||
| $ | 868,468 | |||||
| Network & Telecom – 2.4% | ||||||
| Cincinnati Bell, Inc., 8.375%, 2014 | $ | 55,000 | $ | 53,213 | ||
| Citizens Communications Co., 9.25%, 2011 | 178,000 | 184,230 | ||||
| Citizens Communications Co., 9%, 2031 | 75,000 | 67,500 | ||||
| Deutsche Telekom International Finance B.V., 8.5%, 2010 | 58,000 | 61,358 | ||||
| Nordic Telephone Co. Holdings, 8.875%, 2016 (n) | 55,000 | 53,900 | ||||
| Qwest Capital Funding, Inc., 7.25%, 2011 | 105,000 | 101,850 | ||||
| Qwest Corp., 8.875%, 2012 | 35,000 | 35,700 | ||||
| Qwest Corp., 7.5%, 2014 | 65,000 | 62,563 | ||||
| Telecom Italia Capital, 4.875%, 2010 | 26,000 | 25,783 | ||||
| Telefonica Europe B.V., 7.75%, 2010 | 120,000 | 126,474 | ||||
| Windstream Corp., 8.625%, 2016 | 45,000 | 44,888 | ||||
| $ | 817,459 | |||||
| Oil Services – 0.3% | ||||||
| Basic Energy Services, Inc., 7.125%, 2016 | $ | 80,000 | $ | 77,800 | ||
| Weatherford International Ltd., 6.35%, 2017 | 30,000 | 30,386 | ||||
| $ | 108,186 | |||||
| Oils – 0.4% | ||||||
| Premcor Refining Group, Inc., 7.5%, 2015 | $ | 140,000 | $ | 144,435 | ||
| Other Banks & Diversified Financials – 1.4% | ||||||
| Banco Mercantil del Norte S.A., 5.875% to 2009, FRN to 2014 (n) | $ | 82,000 | $ | 82,000 | ||
| Bosphorus Financial Services Ltd., FRN, 4.475%, 2012 (z) | 93,750 | 90,433 | ||||
| Swedbank AB, 9% to 2010, FRN to 2049 (n) | 120,000 | 121,672 | ||||
| UBS Preferred Funding Trust V, 6.243% to 2016, FRN to 2049 | 120,000 | 105,146 | ||||
| UFJ Finance Aruba AEC, 6.75%, 2013 | 70,000 | 73,538 | ||||
| $ | 472,789 | |||||
| Pharmaceuticals – 0.1% | ||||||
| Teva Pharmaceutical Finance LLC, 5.55%, 2016 | $ | 39,000 | $ | 38,108 | ||
7
Table of Contents
Portfolio of Investments (unaudited) – continued
| Issuer | Shares/Par | Value ($) | ||||
| BONDS – continued | ||||||
| Printing & Publishing – 1.4% | ||||||
| American Media Operations, Inc., 10.25%, 2009 (z) | $ | 1,891 | $ | 1,522 | ||
| American Media Operations, Inc., “B”, 10.25%, 2009 | 52,000 | 41,860 | ||||
| Dex Media West LLC, 9.875%, 2013 | 212,000 | 190,800 | ||||
| Idearc, Inc., 8%, 2016 | 115,000 | 72,306 | ||||
| Nielsen Finance LLC, 10%, 2014 | 65,000 | 65,488 | ||||
| Nielsen Finance LLC, 0% to 2011, 12.5% to 2016 | 95,000 | 65,313 | ||||
| Quebecor World, Inc., 6.125%, 2013 (d) | 35,000 | 12,775 | ||||
| R.H. Donnelley Corp., 8.875%, 2016 | 60,000 | 36,000 | ||||
| $ | 486,064 | |||||
| Railroad & Shipping – 0.3% | ||||||
| Panama Canal Railway Co., 7%, 2026 (z) | $ | 100,000 | $ | 90,000 | ||
| Real Estate – 0.7% | ||||||
| ERP Operating LP, REIT, 5.75%, 2017 | $ | 60,000 | $ | 55,382 | ||
| Simon Property Group, Inc., REIT, 6.1%, 2016 | 190,000 | 185,912 | ||||
| $ | 241,294 | |||||
| Retailers – 0.8% | ||||||
| Couche-Tard, Inc., 7.5%, 2013 | $ | 80,000 | $ | 79,000 | ||
| Limited Brands, Inc., 5.25%, 2014 | 68,000 | 57,520 | ||||
| Macy’s Retail Holdings, Inc., 7.875%, 2015 | 120,000 | 120,879 | ||||
| $ | 257,399 | |||||
| Specialty Stores – 0.1% | ||||||
| Payless ShoeSource, Inc., 8.25%, 2013 | $ | 50,000 | $ | 43,750 | ||
| Supermarkets – 0.4% | ||||||
| Safeway, Inc., 4.95%, 2010 | $ | 54,000 | $ | 54,349 | ||
| Safeway, Inc., 6.5%, 2011 | 70,000 | 72,398 | ||||
| $ | 126,747 | |||||
| Supranational – 0.4% | ||||||
| Central American Bank, 4.875%, 2012 (n) | $ | 140,000 | $ | 139,276 | ||
| Telecommunications – Wireless – 1.7% | ||||||
| Alltel Corp., 7%, 2012 | $ | 68,000 | $ | 69,360 | ||
| MetroPCS Wireless, Inc., 9.25%, 2014 | 75,000 | 72,188 | ||||
| Nextel Communications, Inc., 5.95%, 2014 | 195,000 | 156,488 | ||||
| Rogers Cable, Inc., 5.5%, 2014 | 79,000 | 76,048 | ||||
| Vodafone Group PLC, 5.375%, 2015 | 140,000 | 136,198 | ||||
| Wind Acquisition Finance S.A., 10.75%, 2015 (n) | 75,000 | 78,750 | ||||
| $ | 589,032 | |||||
| Tobacco – 0.8% | ||||||
| Reynolds American, Inc., 6.75%, 2017 | $ | 260,000 | $ | 258,645 | ||
| Transportation – 0.4% | ||||||
| IIRSA Norte Finance Ltd., 8.75%, 2024 | $ | 116,726 | $ | 129,566 | ||
| Transportation – Services – 0.1% | ||||||
| Hertz Corp., 8.875%, 2014 | $ | 40,000 | $ | 36,600 | ||
| U.S. Government Agencies – 2.1% | ||||||
| Small Business Administration, 6.35%, 2021 | $ | 90,523 | $ | 93,601 | ||
| Small Business Administration, 4.34%, 2024 | 143,816 | 137,057 | ||||
| Issuer | Shares/Par | Value ($) | ||||
| BONDS – continued | ||||||
| U.S. Government Agencies – continued | ||||||
| Small Business Administration, 4.99%, 2024 | $ | 170,531 | $ | 167,161 | ||
| Small Business Administration, 4.625%, 2025 | 75,811 | 72,754 | ||||
| Small Business Administration, 4.86%, 2025 | 196,496 | 192,674 | ||||
| Small Business Administration, 5.11%, 2025 | 71,962 | 70,858 | ||||
| $ | 734,105 | |||||
| U.S. Treasury Obligations – 5.7% | ||||||
| U.S. Treasury Bonds, 5.375%, 2031 (f) | $ | 51,000 | $ | 56,666 | ||
| U.S. Treasury Bonds, 4.5%, 2036 | 17,000 | 16,879 | ||||
| U.S. Treasury Notes, 4.25%, 2010 | 500,000 | 517,696 | ||||
| U.S. Treasury Notes, 4.75%, 2012 | 1,000,000 | 1,055,234 | ||||
| U.S. Treasury Notes, 4.5%, 2015 | 40,000 | 42,125 | ||||
| U.S. Treasury Notes, 4.625%, 2017 | 250,000 | 263,203 | ||||
| $ | 1,951,803 | |||||
| Utilities – Electric Power – 4.2% | ||||||
| Beaver Valley Funding Corp., 9%, 2017 | $ | 157,000 | $ | 169,109 | ||
| Dynegy Holdings, Inc., 7.5%, 2015 | 40,000 | 36,900 | ||||
| Edison Mission Energy, 7%, 2017 | 225,000 | 210,375 | ||||
| Enersis S.A., 7.375%, 2014 | 89,000 | 94,533 | ||||
| FirstEnergy Corp., 6.45%, 2011 | 94,000 | 96,453 | ||||
| HQI Transelec Chile S.A., 7.875%, 2011 | 130,000 | 139,563 | ||||
| ISA Capital do Brasil S.A., 7.875%, 2012 (n) | 100,000 | 103,500 | ||||
| Mirant North America LLC, 7.375%, 2013 | 65,000 | 64,431 | ||||
| NRG Energy, Inc., 7.375%, 2016 | 250,000 | 235,296 | ||||
| Reliant Energy, Inc., 7.875%, 2017 | 70,000 | 68,425 | ||||
| Sierra Pacific Resources, 8.625%, 2014 | 35,000 | 36,691 | ||||
| Texas Competitive Electric Holdings LLC, 10.25%, 2015 (n) | 185,000 | 181,300 | ||||
| $ | 1,436,576 | |||||
| Total Bonds (Identified Cost, $34,129,904) | $ | 33,096,322 | ||||
| FLOATING RATE LOANS (g)(r) – 2.4% | ||||||
| Aerospace – 0.2% | ||||||
| Hawker Beechcraft Acquisition Co., Letter of Credit, 4.69%, 2014 | 3,861 | $ | 3,617 | |||
| Hawker Beechcraft Acquisition Co., Term Loan, 4.8%, 2014 | 87,637 | 82,105 | ||||
| $ | 85,722 | |||||
| Automotive – 0.6% | ||||||
| Allison Transmission, Inc., Term Loan B, 5.33%, 2014 | 73,363 | $ | 65,308 | |||
| Federal-Mogul Corp., Term Loan B, 4.41%, 2015 | 54,231 | 45,283 | ||||
| Ford Motor Co., Term Loan B, 5.48%, 2013 | 28,094 | 22,609 | ||||
| Goodyear Tire & Rubber Co., Second Lien Term Loan, 4.54%, 2014 | 79,598 | 71,987 | ||||
| $ | 205,187 | |||||
8
Table of Contents
Portfolio of Investments (unaudited) – continued
| Issuer | Shares/Par | Value ($) | |||
| FLOATING RATE LOANS (g)(r) – continued | |||||
| Broadcasting – 0.1% | |||||
| Young Broadcasting, Inc., Term Loan, 5.18%, 2012 | 37,499 | $ | 33,749 | ||
| Young Broadcasting, Inc., Term Loan B-1, 5.25%, 2012 | 19,996 | 17,997 | |||
| $ | 51,746 | ||||
| Cable TV – 0.1% | |||||
| CSC Holdings, Inc., Incremental Term Loan, 4.22%, 2013 | 53,523 | $ | 50,764 | ||
| Computer Software – 0.2% | |||||
| First Data Corp., Term Loan B-1, 5.26%, 2014 | 69,935 | $ | 64,105 | ||
| Forest & Paper Products – 0.1% | |||||
| Abitibi Consolidated, Inc., Term Loan, 11.5%, 2009 | 19,185 | $ | 19,209 | ||
| Gaming & Lodging – 0.1% | |||||
| Green Valley Ranch Gaming LLC, Second Lien Term Loan, 5.89%, 2014 (o) | 47,816 | $ | 30,124 | ||
| Medical & Health Technology & Services – 0.1% | |||||
| Community Health Systems, Inc., Delayed Draw Term Loan, 2014 (q) | 312 | $ | 294 | ||
| Community Health Systems, Inc., Term Loan B, 4.85%, 2014 | 6,104 | 5,746 | |||
| HCA, Inc., Term Loan B, 5.05%, 2013 | 23,233 | 21,787 | |||
| $ | 27,827 | ||||
| Printing & Publishing – 0.2% | |||||
| Idearc, Inc., Term Loan B, 4.78%, 2014 | 6,675 | $ | 5,322 | ||
| Tribune Co., Term Loan B, 2014 (o) | 82,548 | 62,015 | |||
| $ | 67,337 | ||||
| Issuer | Shares/Par | Value ($) | ||||
| FLOATING RATE LOANS(g)(r) – continued | ||||||
| Specialty Stores – 0.2% | ||||||
| Michaels Stores, Inc., Term Loan B, 5.45%, 2013 | 75,415 | $ | 62,547 | |||
| Telecommunications – Wireless – 0.1% | ||||||
| ALLTEL Communications, Inc., Term Loan B-2, 2015 (o) | 36,344 | $ | 36,081 | |||
| Utilities – Electric Power – 0.4% | ||||||
| Calpine Corp., DIP Term Loan, 5.68%, 2009 | 58,269 | $ | 55,615 | |||
| Texas Competitive Electric Holdings LLC, Term Loan B-3, 6.26%, 2014 | 75,974 | 70,205 | ||||
| $ | 125,820 | |||||
| Total Floating Rate Loans (Identified Cost, $848,476) | $ | 826,469 | ||||
| SHORT-TERM OBLIGATIONS – 0.3% | ||||||
| Toyota Motor Credit Corp., 2.57%, due 7/01/08, at Amortized Cost and Value (y) | $ | 104,000 | $ | 104,000 | ||
| Total Investments (Identified Cost, $35,082,380) | $ | 34,026,791 | ||||
| OTHER ASSETS, LESS LIABILITIES – 1.0% | 350,590 | |||||
| Net Assets – 100.0% | $ | 34,377,381 | ||||
9
Table of Contents
Portfolio of Investments (unaudited) – continued
| (d) | Non-income producing security – in default. |
| (f) | All or a portion of the security has been segregated as collateral for open futures contracts. |
| (g) | The rate shown represents a weighted average coupon rate on settled positions at period end, unless otherwise indicated. |
| (i) | Interest only security for which the fund receives interest on notional principal (Par amount). Par amount shown is the notional principal and does not reflect the cost of the security. |
| (n) | Securities exempt from registration under Rule 144A of the Securities Act of 1933. These securities may be sold in the ordinary course of business in transactions exempt from registration, normally to qualified institutional buyers. At period end, the aggregate value of these securities was $3,812,700, representing 11.1% of net assets. |
| (o) | All or a portion of this position has not settled. Upon settlement date, interest rates will be determined. |
| (p) | Payment-in-kind security. |
| (q) | All or a portion of this position represents an unfunded loan commitment. The rate shown represents a weighted average coupon rate on the full position, including the unfunded loan commitment which has no current coupon rate. |
| (r) | Remaining maturities of floating rate loans may be less than stated maturities shown as a result of contractual or optional prepayments by the borrower. Such prepayments cannot be predicted with certainty. These loans may be subject to restrictions on resale. Floating rate loans generally have rates of interest which are determined periodically by reference to a base lending rate plus a premium. |
| (y) | The rate shown represents an annualized yield at time of purchase. |
| (z) | Restricted securities are not registered under the Securities Act of 1933 and are subject to legal restrictions on resale. These securities generally may be resold in transactions exempt from registration or to the public if the securities are subsequently registered. Disposal of these securities may involve time-consuming negotiations and prompt sale at an acceptable price may be difficult. The fund holds the following restricted securities: |
| Restricted Securities | Acquisition Date | Cost | Current Market Value | |||
| American Media Operations, Inc., 10.25%, 2009 | 12/01/06-11/28/07 | $1,852 | $1,522 | |||
| Bayview Financial Revolving Mortgage Loan Trust, FRN, 3.182%, 2040 | 3/01/06 | 250,000 | 191,740 | |||
| Bosphorus Financial Services Ltd., FRN, 4.475%, 2012 | 3/08/05 | 93,750 | 90,433 | |||
| Brazilian Merchant Voucher Receivables Ltd., 5.911%, 2011 | 3/08/07 | 136,653 | 135,124 | |||
| DIRECTV Holdings LLC, 7.625%, 2016 | 5/07/08 | 70,000 | 68,950 | |||
| DLJ Commercial Mortgage Corp., 6.04%, 2031 | 7/23/04 | 182,174 | 180,351 | |||
| Falcon Franchise Loan LLC, 6.5%, 2014 | 7/15/05 | 229,179 | 149,570 | |||
| Falcon Franchise Loan LLC, FRN, 3.773%, 2023 | 1/29/03 | 65,536 | 53,174 | |||
| Firekeepers Development Authority, 13.875%, 2015 | 4/22/08 | 82,434 | 83,088 | |||
| Natixis S.A., 10% to 2018, FRN to 2049 | 4/24/08 | 130,000 | 129,744 | |||
| Panama Canal Railway Co., 7%, 2026 | 10/29/07 | 100,000 | 90,000 | |||
| Prudential Securities Secured Financing Corp., FRN, 7.291%, 2013 | 12/06/04 | 189,843 | 137,183 | |||
| Residential Capital LLC, 9.625%, 2015 | 6/06/08 | 1,156 | 970 | |||
| Salomon Brothers Mortgage Securities, Inc., FRN, 7.272%, 2012 | 1/07/05 | $257,552 | 238,544 | |||
| Total Restricted Securities | $1,550,393 | |||||
| % of Net Assets | 4.5% |
The following abbreviations are used in this report and are defined:
| CDO | Collateralized Debt Obligation |
| CLN | Credit-Linked Note |
| DIP | Debtor-in-Possession |
| FRN | Floating Rate Note. Interest rate resets periodically and may not be the rate reported at period end. |
| REIT | Real Estate Investment Trust |
Abbreviations indicate amounts shown in currencies other than the U.S. dollar. All amounts are stated in U.S. dollars unless otherwise indicated. A list of abbreviations is shown below:
| CAD | Canadian Dollar |
| CLP | Chilean Peso |
| CNY | Chinese Yuan Renminbi |
| DKK | Danish Krone |
| EUR | Euro |
| GBP | British Pound |
| JPY | Japanese Yen |
| MXN | Mexican Peso |
| SEK | Swedish Krona |
10
Table of Contents
Portfolio of Investments (unaudited) – continued
Derivative Contracts at 6/30/08
Forward Foreign Currency Exchange Contracts at 6/30/08
Appreciation and Depreciation in the table below are reported by currency.
| Type | Currency | Contracts to Deliver/Receive | Settlement Date Range | In Exchange For | Contracts at Value | Net Unrealized Appreciation (Depreciation) | ||||||||||||
| Appreciation | ||||||||||||||||||
| BUY | CNY | 794,938 | 8/21/08 | $ | 115,000 | $ | 116,711 | $ | 1,711 | |||||||||
| BUY | EUR | 26,137 | 8/25/08 | 40,582 | 41,051 | 469 | ||||||||||||
| BUY | MXN | 414,872 | 8/11/08 | 39,911 | 39,990 | 79 | ||||||||||||
| $ | 2,259 | |||||||||||||||||
| Depreciation | ||||||||||||||||||
| SELL | CAD | 263,186 | 8/25/08 | $ | 258,317 | $ | 258,421 | $ | (104 | ) | ||||||||
| BUY | CLP | 18,501,520 | 7/17/08 | 37,003 | 35,189 | (1,814 | ) | |||||||||||
| SELL | DKK | 685,992 | 8/12/08 | 141,878 | 144,539 | (2,661 | ) | |||||||||||
| SELL | EUR | 1,463,911 | 8/25/08 | 2,273,365 | 2,299,233 | (25,868 | ) | |||||||||||
| SELL | GBP | 378,200 | 8/26/08 | 740,951 | 750,658 | (9,707 | ) | |||||||||||
| SELL | JPY | 45,833,544 | 8/26/08 | 426,847 | 433,585 | (6,738 | ) | |||||||||||
| SELL | SEK | 429,664 | 7/31/08 | 71,053 | 71,248 | (195 | ) | |||||||||||
| $ | (47,087 | ) | ||||||||||||||||
Futures contracts outstanding at 6/30/08
| Description | Contracts | Value | Expiration Date | Unrealized Appreciation (Depreciation) | ||||
| U.S. Treasury Note 5 yr (Long) | 17 | $1,879,430 | Sep-08 | $7,245 |
Swap Agreements at 6/30/08
| Expiration | Notional Amount | Counterparty | Cash Flows to Receive | Cash Flows to Pay | Value | ||||||||
| Credit Default Swaps | |||||||||||||
| 6/20/09 | USD | 50,000 | JPMorgan Chase Bank | 4.1% (fixed rate) | (1) | $(7,701 | ) | ||||||
| 9/20/10 | USD | 120,000 | Merrill Lynch International | (2) | 0.68% (fixed rate) | 14,627 | |||||||
| 9/20/12 | USD | 160,000 | JPMorgan Chase Bank | 0.36% (fixed rate) | (3) | (1,509 | ) | ||||||
| 3/20/13 | USD | 190,000 | Goldman Sachs International | (4) | 2.129% (fixed rate) | (6,785 | ) | ||||||
| 9/20/13 | USD | 50,000 | Goldman Sachs International | (5) | 0.645% (fixed rate) | 45 | |||||||
| 9/20/13 | USD | 40,000 | Goldman Sachs International | (5) | 0.645% (fixed rate) | 37 | |||||||
| 9/20/13 | USD | 90,000 | Merrill Lynch International | (6) | 0.77% (fixed rate) | 731 | |||||||
| $(555 | ) | ||||||||||||
| (1) | Fund to pay notional amount upon a defined credit event by Abitibi Consolidated, Inc., 8.375%, 4/01/15. |
| (2) | Fund to receive notional amount upon a defined credit event by Lennar Corp., 5.95%, 3/01/13. |
| (3) | Fund to pay notional amount upon a defined credit event by FNMA, 5.5%, 6/09/33. |
| (4) | Fund to receive notional amount upon a defined credit event by Simon Property Group, Inc., 6.35%, 8/28/12. |
| (5) | Fund to receive notional amount upon a defined credit event by CIGNA Corp., 7.875%, 5/15/27. |
| (6) | Fund to receive notional amount upon a defined credit event by AutoZone, Inc., 5.875%, 10/15/12. |
At June 30, 2008, the fund had sufficient cash and/or other liquid securities to cover any commitments under these derivative contracts.
See Notes to Financial Statements
11
Table of Contents
FINANCIAL STATEMENTS | STATEMENT OF ASSETS AND LIABILITIES (unaudited)
This statement represents your fund’s balance sheet, which details the assets and liabilities comprising the total value of the fund.
At 6/30/08 | |||||
Assets | |||||
Investments, at value (identified cost, $35,082,380) | $34,026,791 | ||||
Cash | 6,386 | ||||
Receivable for forward foreign currency exchange contracts | 2,259 | ||||
Receivable for daily variation margin on open futures contracts | 1,992 | ||||
Receivable for investments sold | 466,649 | ||||
Receivable for fund shares sold | 9,462 | ||||
Interest receivable | 603,840 | ||||
Receivable from investment adviser | 8,533 | ||||
Swaps, at value | 15,440 | ||||
Other assets | 520 | ||||
Total assets | $35,141,872 | ||||
Liabilities | |||||
Payable for forward foreign currency exchange contracts | $47,087 | ||||
Payable for investments purchased | 160,482 | ||||
Payable for fund shares reacquired | 474,101 | ||||
Swaps, at value | 15,995 | ||||
Payable to affiliates | |||||
Management fee | 2,677 | ||||
Shareholder servicing costs | 30 | ||||
Distribution fees | 177 | ||||
Administrative services fee | 192 | ||||
Payable for independent trustees’ compensation | 280 | ||||
Accrued expenses and other liabilities | 63,470 | ||||
Total liabilities | $764,491 | ||||
Net assets | $34,377,381 | ||||
Net assets consist of | |||||
Paid-in capital | $35,227,690 | ||||
Unrealized appreciation (depreciation) on investments and translation of assets and liabilities in foreign currencies | (1,087,619 | ) | |||
Accumulated net realized gain (loss) on investments and foreign currency transactions | (573,933 | ) | |||
Undistributed net investment income | 811,243 | ||||
Net assets | $34,377,381 | ||||
Shares of beneficial interest outstanding | 3,487,562 | ||||
Initial Class shares | |||||
Net assets | $27,932,781 | ||||
Shares outstanding | 2,826,927 | ||||
Net asset value per share | $9.88 | ||||
Service Class shares | |||||
Net assets | $6,444,600 | ||||
Shares outstanding | 660,635 | ||||
Net asset value per share | $9.76 |
See Notes to Financial Statements
12
Table of Contents
FINANCIAL STATEMENTS | STATEMENT OF OPERATIONS (unaudited)
This statement describes how much your fund earned in investment income and accrued in expenses. It also describes any gains and/or losses generated by fund operations.
| Six months ended 6/30/08 | ||||||
| Net investment income | ||||||
Interest income | $1,189,891 | |||||
Expenses | ||||||
Management fee | $145,671 | |||||
Distribution fees | 8,566 | |||||
Shareholder servicing costs | 3,567 | |||||
Administrative services fee | 8,727 | |||||
Independent trustees’ compensation | 706 | |||||
Custodian fee | 20,317 | |||||
Shareholder communications | 10,199 | |||||
Auditing fees | 29,013 | |||||
Legal fees | 357 | |||||
Miscellaneous | 3,677 | |||||
Total expenses | $230,800 | |||||
Fees paid indirectly | (530 | ) | ||||
Reduction of expenses by investment adviser | (56,498 | ) | ||||
Net expenses | $173,772 | |||||
Net investment income | $1,016,119 | |||||
Realized and unrealized gain (loss) on investments and foreign currency transactions | ||||||
Realized gain (loss) (identified cost basis) | ||||||
Investment transactions | $(55,644 | ) | ||||
Futures contracts | (13,196 | ) | ||||
Swap transactions | 1,116 | |||||
Foreign currency transactions | (135,912 | ) | ||||
Net realized gain (loss) on investments and foreign currency transactions | $(203,636 | ) | ||||
Change in unrealized appreciation (depreciation) | ||||||
Investments | $(846,591 | ) | ||||
Futures contracts | 5,662 | |||||
Swap transactions | (13,678 | ) | ||||
Translation of assets and liabilities in foreign currencies | (62,368 | ) | ||||
Net unrealized gain (loss) on investments and foreign currency translation | $(916,975 | ) | ||||
Net realized and unrealized gain (loss) on investments and foreign currency | $(1,120,611 | ) | ||||
Change in net assets from operations | $(104,492 | ) |
See Notes to Financial Statements
13
Table of Contents
FINANCIAL STATEMENTS | STATEMENTS OF CHANGES IN NET ASSETS
These statements describe the increases and/or decreases in net assets resulting from operations, any distributions, and any shareholder transactions.
| Six months ended 6/30/08 | | Year ended 12/31/07 | | |||
| (unaudited | ) | |||||
Change in net assets | ||||||
From operations | ||||||
Net investment income | $1,016,119 | $2,179,245 | ||||
Net realized gain (loss) on investments and foreign currency transactions | (203,636 | ) | 26,912 | |||
Net unrealized gain (loss) on investments and foreign currency translation | (916,975 | ) | (813,945 | ) | ||
Change in net assets from operations | $(104,492 | ) | $1,392,212 | |||
Distributions declared to shareholders | ||||||
From net investment income | ||||||
Initial Class | $(1,961,317 | ) | $(1,464,241 | ) | ||
Service Class | (389,438 | ) | (352,339 | ) | ||
Total distributions declared to shareholders | $(2,350,755 | ) | $(1,816,580 | ) | ||
Change in net assets from fund share transactions | $(3,866,478 | ) | $4,432,024 | |||
Total change in net assets | $(6,321,725 | ) | $4,007,656 | |||
Net assets | ||||||
At beginning of period | 40,699,106 | 36,691,450 | ||||
At end of period (including undistributed net investment income of $811,243 and | $34,377,381 | $40,699,106 |
See Notes to Financial Statements
14
Table of Contents
FINANCIAL STATEMENTS | FINANCIAL HIGHLIGHTS
The financial highlights table is intended to help you understand the fund’s financial performance for the semiannual period and the past 5 fiscal years. Certain information reflects financial results for a single fund share. The total returns in the table represent the rate by which an investor would have earned (or lost) on an investment in the fund share class (assuming reinvestment of all distributions) held for the entire period.
| Initial Class | Six months ended 6/30/08 | Years ended 12/31 | ||||||||||||||||
| 2007 | 2006 | 2005 | 2004 | 2003 | ||||||||||||||
| (unaudited) | ||||||||||||||||||
Net asset value, beginning of period | $10.55 | $10.67 | $10.64 | $11.25 | $11.02 | $10.53 | ||||||||||||
Income (loss) from investment operations | ||||||||||||||||||
Net investment income (d) | $0.27 | $0.59 | $0.57 | $0.56 | $0.59 | $0.55 | ||||||||||||
Net realized and unrealized gain (loss) on | (0.31 | ) | (0.20 | ) | 0.11 | (0.37 | ) | 0.22 | 0.51 | |||||||||
Total from investment operations | $(0.04 | ) | $0.39 | $0.68 | $0.19 | $0.81 | $1.06 | |||||||||||
Less distributions declared to shareholders | ||||||||||||||||||
From net investment income | $(0.63 | ) | $(0.51 | ) | $(0.57 | ) | $(0.76 | ) | $(0.58 | ) | $(0.57 | ) | ||||||
From net realized gain on investments | — | — | (0.08 | ) | (0.04 | ) | — | — | ||||||||||
Total distributions declared to shareholders | $(0.63 | ) | $(0.51 | ) | $(0.65 | ) | $(0.80 | ) | $(0.58 | ) | $(0.57 | ) | ||||||
Net asset value, end of period | $9.88 | $10.55 | $10.67 | $10.64 | $11.25 | $11.02 | ||||||||||||
Total return (%) (k)(r)(s) | (0.43 | )(n) | 3.79 | 6.67 | 1.89 | 7.73 | 10.38 | |||||||||||
| Ratios (%) (to average net assets) and Supplemental data: | ||||||||||||||||||
Expenses before expense reductions (f) | 1.15 | (a) | 1.16 | 1.36 | 1.25 | 1.08 | 1.11 | |||||||||||
Expenses after expense reductions (f) | 0.85 | (a) | 0.85 | 0.88 | 0.90 | 0.90 | 0.90 | |||||||||||
Net investment income | 5.28 | (a) | 5.63 | 5.43 | 5.24 | 5.41 | 5.16 | |||||||||||
Portfolio turnover | 31 | 49 | 66 | 64 | 69 | 146 | ||||||||||||
Net assets at end of period (000 Omitted) | $27,933 | $32,507 | $30,008 | $32,323 | $33,700 | $35,888 | ||||||||||||
See Notes to Financial Statements
15
Table of Contents
Financial Highlights – continued
| Service Class | Six months ended 6/30/08 | Years ended 12/31 | ||||||||||||||||
| 2007 | 2006 | 2005 | 2004 | 2003 | ||||||||||||||
| (unaudited) | ||||||||||||||||||
Net asset value, beginning of period | $10.40 | $10.54 | $10.52 | $11.13 | $10.91 | $10.45 | ||||||||||||
Income (loss) from investment operations | ||||||||||||||||||
Net investment income (d) | $0.25 | $0.56 | $0.53 | $0.53 | $0.57 | $0.52 | ||||||||||||
Net realized and unrealized gain (loss) on | (0.29 | ) | (0.21 | ) | 0.11 | (0.37 | ) | 0.21 | 0.50 | |||||||||
Total from investment operations | $(0.04 | ) | $0.35 | $0.64 | $0.16 | $0.78 | $1.02 | |||||||||||
Less distributions declared to shareholders | ||||||||||||||||||
From net investment income | $(0.60 | ) | $(0.49 | ) | $(0.54 | ) | $(0.73 | ) | $(0.56 | ) | $(0.56 | ) | ||||||
From net realized gain on investments | — | — | (0.08 | ) | (0.04 | ) | — | — | ||||||||||
Total distributions declared to shareholders | $(0.60 | ) | $(0.49 | ) | $(0.62 | ) | $(0.77 | ) | $(0.56 | ) | $(0.56 | ) | ||||||
Net asset value, end of period | $9.76 | $10.40 | $10.54 | $10.52 | $11.13 | $10.91 | ||||||||||||
Total return (%) (k)(r)(s) | (0.43 | )(n) | 3.42 | 6.39 | 1.62 | 7.54 | 10.10 | |||||||||||
| Ratios (%) (to average net assets) and Supplemental data: | ||||||||||||||||||
Expenses before expense reductions (f) | 1.40 | (a) | 1.41 | 1.62 | 1.50 | 1.32 | 1.36 | |||||||||||
Expenses after expense reductions (f) | 1.10 | (a) | 1.10 | 1.13 | 1.15 | 1.14 | 1.15 | |||||||||||
Net investment income | 5.05 | (a) | 5.39 | 5.18 | 4.99 | 5.01 | 4.86 | |||||||||||
Portfolio turnover | 31 | 49 | 66 | 64 | 69 | 146 | ||||||||||||
Net assets at end of period (000 Omitted) | $6,445 | $8,192 | $6,684 | $6,191 | $4,500 | $9,106 | ||||||||||||
| (a) | Annualized. |
| (d) | Per share data are based on average shares outstanding. |
| (f) | Ratios do not reflect reductions from fees paid indirectly, if applicable. |
| (k) | The total return does not reflect expenses that apply to separate accounts. Inclusion of these charges would reduce the total return figures for all periods shown. |
| (n) | Not annualized. |
| (r) | Certain expenses have been reduced without which performance would have been lower. |
| (s) | From time to time the fund may receive proceeds from litigation settlements, without which performance would be lower. |
See Notes to Financial Statements
16
Table of Contents
NOTES TO FINANCIAL STATEMENTS (unaudited)
| (1) | Business and Organization |
MFS Strategic Income Series (the fund) is a series of MFS Variable Insurance Trust (the trust). The trust is organized as a Massachusetts business trust and is registered under the Investment Company Act of 1940, as amended, as an open-end management investment company. The shareholders of each series of the trust are separate accounts of insurance companies, which offer variable annuity and/or life insurance products, and qualified retirement and pension plans.
| (2) | Significant Accounting Policies |
General – The preparation of financial statements in conformity with U.S. generally accepted accounting principles requires management to make estimates and assumptions that affect the reported amounts of assets and liabilities, and disclosure of contingent assets and liabilities at the date of the financial statements and the reported amounts of revenues and expenses during the reporting period. Actual results could differ from those estimates. The fund can invest in foreign securities, including securities of emerging market issuers. Investments in foreign securities are vulnerable to the effects of changes in the relative values of the local currency and the U.S. dollar and to the effects of changes in each country’s legal, political, and economic environment. The markets of emerging markets countries are generally more volatile than the markets of developed countries with more mature economies. All of the risks of investing in foreign securities previously described are heightened when investing in emerging markets countries.
Investment Valuations – Debt instruments and floating rate loans (other than short-term instruments), including restricted debt instruments, are generally valued at an evaluated or composite bid as reported by an independent pricing service. Short-term instruments with a maturity at issuance of 60 days or less may be valued at amortized cost, which approximates market value. Futures contracts are generally valued at last posted settlement price as reported by an independent pricing service on the market on which they are primarily traded. Futures contracts for which there were no trades that day for a particular position are generally valued at the closing bid quotation as reported by an independent pricing service on the market on which such futures contracts are primarily traded. Forward foreign currency contracts are generally valued at the mean of bid and asked prices for the time period interpolated from rates reported by an independent pricing service for proximate time periods. Swaps are generally valued at an evaluated bid as reported by an independent pricing service. Securities and other assets generally valued on the basis of information from an independent pricing service may also be valued at a broker-dealer bid quotation. Values obtained from pricing services can utilize both dealer-supplied valuations and electronic data processing techniques, which take into account factors such as institutional-size trading in similar groups of securities, yield, quality, coupon rate, maturity, type of issue, trading characteristics, and other market data. The values of foreign securities and other assets and liabilities expressed in foreign currencies are converted to U.S. dollars using the mean of bid and asked prices for rates reported by an independent pricing service.
The Board of Trustees has delegated primary responsibility for determining or causing to be determined the value of the fund’s investments (including any fair valuation) to the adviser pursuant to valuation policies and procedures approved by the Board. If the adviser determines that reliable market quotations are not readily available, investments are valued at fair value as determined in good faith by the adviser in accordance with such procedures under the oversight of the Board of Trustees. Under the fund’s valuation policies and procedures, market quotations are not considered to be readily available for most types of debt instruments and floating rate loans and many types of derivatives. These investments are generally valued at fair value based on information from independent pricing services. In addition, investments may be valued at fair value if the adviser determines that an investment’s value has been materially affected by events occurring after the close of the exchange or market on which the investment is principally traded (such as foreign exchange or market) and prior to the determination of the fund’s net asset value, or after the halting of trading of a specific security where trading does not resume prior to the close of the exchange or market on which the security is principally traded. The adviser may rely on independent pricing services or other information (such as the correlation with price movements of similar securities in the same or other markets; the type, cost and investment characteristics of the security; the business and financial condition of the issuer; and trading and other market data) to assist in determining whether to fair value and at what value to fair value an investment. The value of an investment for purposes of calculating the fund’s net asset value can differ depending on the source and method used to determine value. When fair valuation is used, the value of investments used to determine the fund’s net asset value may differ from quoted or published prices for the same investments.
The fund adopted FASB Statement No. 157, Fair Value Measurements (the “Statement”) in this reporting period. This Statement provides a single definition of fair value, a hierarchy for measuring fair value and expanded disclosures about fair value measurements.
Various inputs are used in determining the value of the fund’s assets or liabilities carried at market value. These inputs are categorized into three broad levels. Level 1 includes quoted prices in active markets for identical assets or liabilities. Level 2
17
Table of Contents
Notes to Financial Statements (unaudited) – continued
includes other significant observable market-based inputs (including quoted prices for similar securities, interest rates, prepayment speed, and credit risk). Level 3 includes unobservable inputs, which may include the adviser’s own assumptions in determining the fair value of investments. Other financial instruments are derivative instruments not reflected in total investments, such as futures, forwards, swap contracts and written options, which are valued at the unrealized appreciation/depreciation on the instrument. The following is a summary of the levels used as of June 30, 2008 in valuing the fund’s assets or liabilities carried at market value:
| Level 1 | Level 2 | Level 3 | Total | |||||||
| Investments in Securities | $— | $34,026,791 | $— | $34,026,791 | ||||||
| Other Financial Instruments | $7,245 | $(45,383 | ) | $— | $(38,138 | ) |
Repurchase Agreements – The fund may enter into repurchase agreements with institutions that the fund’s investment adviser has determined are creditworthy. Each repurchase agreement is recorded at cost. The fund requires that the securities collateral in a repurchase transaction be transferred to a custodian in a manner sufficient to enable the fund to obtain those securities in the event of a default under the repurchase agreement. The fund monitors, on a daily basis, the value of the collateral to ensure that its value, including accrued interest, is greater than amounts owed to the fund under each such repurchase agreement. The fund and other funds managed by Massachusetts Financial Services Company (MFS), may utilize a joint trading account for the purpose of entering into one or more repurchase agreements.
Foreign Currency Translation – Purchases and sales of foreign investments, income, and expenses are converted into U.S. dollars based upon currency exchange rates prevailing on the respective dates of such transactions. Gains and losses attributable to foreign currency exchange rates on sales of securities are recorded for financial statement purposes as net realized gains and losses on investments. Gains and losses attributable to foreign exchange rate movements on income and expenses are recorded for financial statement purposes as foreign currency transaction gains and losses. That portion of both realized and unrealized gains and losses on investments that results from fluctuations in foreign currency exchange rates is not separately disclosed.
Derivative Risk – The fund may invest in derivatives for hedging or non-hedging purposes. While hedging can reduce or eliminate losses, it can also reduce or eliminate gains. When the fund uses derivatives as an investment to gain market exposure, or for hedging purposes, gains and losses from derivative instruments may be substantially greater than the derivative’s original cost. Cash that has been segregated on behalf of certain derivative contracts will be reported separately on the Statement of Assets and Liabilities as restricted cash. On certain over-the-counter derivatives, the fund attempts to reduce its exposure to counterparty credit risk by entering into an ISDA Master Agreement on a bilateral basis with each of the counterparties with whom it undertakes a significant volume of transactions. The ISDA Master Agreement gives the fund the right, upon an event of default by the applicable counterparty, to close out all transactions traded under such agreement and to net amounts owed under each transaction to one net amount payable by one party to the other. This right to close out and net payments across all transactions traded under the ISDA Master Agreement could result in a reduction of the fund’s credit risk to such counterparty equal to any amounts payable by the fund under the applicable transactions, if any. However, absent an event of default by the counterparty, the ISDA Master Agreement does not result in an offset of reported balance sheet assets and liabilities across transactions between the fund and the applicable counterparty. Derivative instruments include futures contracts, forward foreign currency exchange contracts, and swap agreements.
Futures Contracts – The fund may enter into futures contracts for the delayed delivery of securities or currency, or contracts based on financial indices at a fixed price on a future date. In entering such contracts, the fund is required to deposit with the broker either in cash or securities an amount equal to a certain percentage of the contract amount. Subsequent payments are made or received by the fund each day, depending on the daily fluctuations in the value of the contract, and are recorded for financial statement purposes as unrealized gains or losses by the fund. Upon entering into such contracts, the fund bears the risk of interest or exchange rates or securities prices moving unexpectedly, in which case, the fund may not achieve the anticipated benefits of the futures contracts and may realize a loss.
Forward Foreign Currency Exchange Contracts – The fund may enter into forward foreign currency exchange contracts for the purchase or sale of a specific foreign currency at a fixed price on a future date. Risks may arise upon entering into these contracts from the potential inability of counterparties to meet the terms of their contracts and from unanticipated movements in the value of the contract. The fund may enter into forward foreign currency exchange contracts for hedging purposes as well as for non-hedging purposes. For hedging purposes, the fund may enter into contracts to deliver or receive foreign currency it will receive from or require for its normal investment activities. The fund may also use contracts in a manner intended to protect foreign currency denominated securities from declines in value due to unfavorable exchange rate movements. For non-hedging purposes, the fund may enter into contracts with the intent of changing the relative exposure of the fund’s portfolio of securities to different currencies to take advantage of anticipated changes. The forward foreign currency exchange
18
Table of Contents
Notes to Financial Statements (unaudited) – continued
contracts are adjusted by the daily exchange rate of the underlying currency and any gains or losses are recorded as unrealized until the contract settlement date. On contract settlement date, the gains or losses are recorded as realized gains or losses on foreign currency transactions.
Swap Agreements – The fund may enter into swap agreements. A swap is an exchange of cash payments between the fund and another party. Net cash payments are exchanged at specified intervals and are recorded as a realized gain or loss in the Statement of Operations. The value of the swap is adjusted daily and the change in value, including accruals of periodic amounts of interest to be paid or received, is recorded as unrealized appreciation or depreciation in the Statement of Operations. Amounts paid or received at the inception of the swap are reflected as premiums paid or received on the Statement of Assets and Liabilities and are amortized using the effective interest method over the term of the agreement. A liquidation payment received or made upon early termination is recorded as a realized gain or loss in the Statement of Operations. Collateral, in the form of cash or securities, may be required to be held in segregated accounts with the fund’s custodian in connection with these agreements. Risk of loss may exceed amounts recognized on the Statement of Assets and Liabilities. These risks include the possible lack of a liquid market, failure of the counterparty to perform under the terms of the agreements, and unfavorable market and interest rate movements of the underlying instrument.
The fund holds credit default swaps in which one party makes a stream of payments based on a fixed percentage applied to the notional amount to another party in exchange for the right to receive a specified return in the event of a default by a third party, such as a corporate issuer or foreign issuer, on its obligation. The fund may enter into credit default swaps to limit or to reduce its risk exposure to defaults of corporate and sovereign issuers or to create direct or synthetic short or long exposure to corporate debt securities or certain sovereign debt securities to which it is not otherwise exposed.
In March 2008, FASB Statement No. 161, Disclosures about Derivative Instruments and Hedging Activities (the “Standard”) was issued, and is effective for financial statements issued for fiscal years and interim periods beginning after November 15, 2008. This Standard provides enhanced disclosures about the fund’s use of and accounting for derivative instruments and the effect of derivative instruments on the fund’s results of operations and financial position. Management is evaluating the application of the Standard to the fund, and has not at this time determined the impact, if any, resulting from the adoption of this Standard on the fund’s financial statements.
Hybrid Instruments – The fund may invest in indexed or hybrid securities on which any combination of interest payments, the principal or stated amount payable at maturity is determined by reference to prices of other securities, currencies, indexes, economic factors or other measures, including interest rates, currency exchange rates, or securities indices. The risks of investing in hybrid instruments reflect a combination of the risks of investing in securities, swaps, options, futures and currencies. Hybrid instruments are potentially more volatile and carry greater market risks than traditional debt instruments. Depending on the structure of the particular hybrid instrument, changes in a benchmark, underlying assets or economic indicator may be magnified by the terms of the hybrid instrument and have an even more dramatic and substantial effect upon the value of the hybrid instrument. Also, the prices of the hybrid instrument and the benchmark, underlying asset or economic indicator may not move in the same direction or at the same time.
Loans and Other Direct Debt Instruments – The fund may invest in loans and loan participations or other receivables. These investments may include standby financing commitments, including revolving credit facilities, which obligate the fund to supply additional cash to the borrower on demand. At June 30, 2008, the portfolio had unfunded loan commitments of $312, which could be extended at the option of the borrower and which are covered by sufficient cash and/or liquid securities held by the fund. The market value and obligation of the fund on these unfunded loan commitments is included in Investments, at value and Payable for investments purchased, respectively, on the Statement of Assets and Liabilities. Loan participations involve a risk of insolvency of the lending bank or other financial intermediary.
Indemnifications – Under the fund’s organizational documents, its officers and trustees may be indemnified against certain liabilities and expenses arising out of the performance of their duties to the fund. Additionally, in the normal course of business, the fund enters into agreements with service providers that may contain indemnification clauses. The fund’s maximum exposure under these agreements is unknown as this would involve future claims that may be made against the fund that have not yet occurred.
Investment Transactions and Income – Investment transactions are recorded on the trade date. Interest income is recorded on the accrual basis. All premium and discount is amortized or accreted for financial statement purposes in accordance with U.S. generally accepted accounting principles. The fund earns certain fees in connection with its floating rate loan purchasing activities. These fees are in addition to interest payments earned and may include amendment fees, commitment fees, facility fees, consent fees, and prepayment fees. Commitment fees are recorded on an accrual basis as income in the accompanying financial statements.
19
Table of Contents
Notes to Financial Statements (unaudited) – continued
The fund may receive proceeds from litigation settlements. Any proceeds received from litigation involving portfolio holdings are reflected in the Statement of Operations in realized gain/loss if the security has been disposed of by the fund or in unrealized gain/loss if the security is still held by the fund. Any other proceeds from litigation not related to portfolio holdings are reflected as other income in the Statement of Operations.
Fees Paid Indirectly – The fund’s custody fee may be reduced according to an arrangement that measures the value of cash deposited with the custodian by the fund. This amount, for the six months ended June 30, 2008, is shown as a reduction of total expenses on the Statement of Operations.
Tax Matters and Distributions – The fund intends to qualify as a regulated investment company, as defined under Subchapter M of the Internal Revenue Code, and to distribute all of its taxable income, including realized capital gains. As a result, no provision for federal income tax is required. The fund adopted the provisions of FASB Interpretation No. 48, Accounting for Uncertainty in Income Taxes (“the Interpretation”). The Interpretation prescribes a minimum threshold for financial statement recognition of the benefit of a tax position taken or expected to be taken in a tax return. There was no impact resulting from the adoption of this Interpretation on the fund’s financial statements. Each of the fund’s federal tax returns for the prior three fiscal years remains subject to examination by the Internal Revenue Service. It is the fund’s policy to record interest and penalty charges on underpaid taxes associated with its tax positions as interest expense and miscellaneous expense, respectively. No such charges were recorded in the current financial statements. Foreign taxes, if any, have been accrued by the fund in the accompanying financial statements.
Distributions to shareholders are recorded on the ex-dividend date. Income and capital gain distributions are determined in accordance with income tax regulations, which may differ from U.S. generally accepted accounting principles. Certain capital accounts in the financial statements are periodically adjusted for permanent differences in order to reflect their tax character. These adjustments have no impact on net assets or net asset value per share. Temporary differences which arise from recognizing certain items of income, expense, gain or loss in different periods for financial statement and tax purposes will reverse at some time in the future. Distributions in excess of net investment income or net realized gains are temporary overdistributions for financial statement purposes resulting from differences in the recognition or classification of income or distributions for financial statement and tax purposes.
Book/tax differences primarily relate to amortization and accretion of debt securities, straddle loss deferrals, foreign currency transactions, and derivative transactions.
The tax character of distributions made during the current period will be determined at fiscal year end. The tax character of distributions declared to shareholders is as follows:
| 12/31/07 | ||
| Ordinary income (including any short-term capital gains) | $1,816,580 |
The federal tax cost and the tax basis components of distributable earnings were as follows:
| As of 6/30/08 | |||
| Cost of investments | $35,261,478 | ||
| Gross appreciation | 602,972 | ||
| Gross depreciation | (1,837,659 | ) | |
| Net unrealized appreciation (depreciation) | $(1,234,687 | ) | |
| As of 12/31/07 | |||
| Undistributed ordinary income | 2,350,252 | ||
| Capital loss carryforwards | (202,490 | ) | |
| Other temporary differences | (172,930 | ) | |
| Net unrealized appreciation (depreciation) | (369,894 | ) | |
The aggregate cost above includes prior fiscal year end tax adjustments.
As of December 31, 2007, the fund had capital loss carryforwards available to offset future realized gains. Such losses expire as follows:
| 12/31/14 | $(198,631 | ) | |
| 12/31/15 | (3,859 | ) | |
| $(202,490 | ) |
Multiple Classes of Shares of Beneficial Interest – The fund offers multiple classes of shares, which differ in their respective distribution fees. The fund’s income, realized and unrealized gain (loss), and common expenses are allocated to shareholders based on the daily net assets of each class, without distinction between share classes. Dividends are declared separately for each class. Differences in per share dividend rates are generally due to differences in separate class expenses.
20
Table of Contents
Notes to Financial Statements (unaudited) – continued
(3) Transactions with Affiliates
Investment Adviser – The fund has an investment advisory agreement with MFS to provide overall investment management and related administrative services and facilities to the fund.
The management fee is computed daily and paid monthly at an annual rate of 0.75% of the fund’s average daily net assets. The investment adviser has agreed in writing to reduce its management fee to 0.70% for the first $1.0 billion of average daily net assets and 0.65% of average daily net assets in excess of $1.0 billion. This written agreement may be rescinded only upon consent of the fund’s Board of Trustees. This management fee reduction amounted to $9,712, which is shown as a reduction of total expenses in the Statement of Operations. The management fee incurred for the six months ended June 30, 2008 was equivalent to an annual effective rate of 0.70% of the fund’s average daily net assets.
The investment adviser has agreed in writing to pay a portion of the fund’s operating expenses, exclusive of management, distribution, and certain other fees and expenses, such that operating expenses do not exceed 0.15% annually of the fund’s average daily net assets. This written agreement will continue through April 30, 2009 unless changed or rescinded by the fund’s Board of Trustees. For the six months ended June 30, 2008, this reduction amounted to $46,673 and is reflected as a reduction of total expenses in the Statement of Operations.
Distributor – MFS Fund Distributors, Inc. (MFD), a wholly-owned subsidiary of MFS, is the distributor of shares of the series. The Trustees have adopted a distribution plan for the Service Class shares pursuant to Rule 12b-1 under the Investment Company Act of 1940.
The series’ distribution plan provides that the series will pay MFD distribution fees equal to 0.25% per annum of its average daily net assets attributable to Service Class shares as partial consideration for services performed and expenses incurred by MFD and financial intermediaries (including participating insurance companies that invest in the series to fund variable annuity and variable life insurance contracts, sponsors of qualified retirement and pension plans that invest in the series, and affiliates of these participating insurance companies and plan sponsors) in connection with the sale and distribution of the Service Class shares. MFD may subsequently pay all, or a portion, of the distribution fees to financial intermediaries.
Shareholder Servicing Agent – MFS Service Center, Inc. (MFSC), a wholly-owned subsidiary of MFS, receives a fee from the fund for its services as shareholder servicing agent. For the six months ended June 30, 2008, the fee was $3,525, which equated to 0.0182% annually of the fund’s average daily net assets. MFSC also receives payment from the fund for out-of-pocket expenses paid by MFSC on behalf of the fund. For the six months ended June 30, 2008, these costs amounted to $42.
Administrator – MFS provides certain financial, legal, shareholder communications, compliance, and other administrative services to the fund. Under an administrative services agreement, the fund partially reimburses MFS the costs incurred to provide these services. The fund is charged a fixed amount plus a fee based on average daily net assets. The fund’s annual fixed amount is $17,500.
The administrative services fee incurred for the six months ended June 30, 2008 was equivalent to an annual effective rate of 0.045% of the fund’s average daily net assets.
Trustees’ and Officers’ Compensation – The fund pays compensation to independent trustees in the form of a retainer, attendance fees, and additional compensation to Board and Committee chairpersons. The fund does not pay compensation directly to trustees or officers of the fund who are also officers of the investment adviser, all of whom receive remuneration for their services to the fund from MFS. Certain officers and trustees of the fund are officers or directors of MFS, MFD, and MFSC.
Other – This fund and certain other MFS funds (the funds) have entered into a services agreement (the Agreement) which provides for payment of fees by the funds to Tarantino LLC in return for the provision of services of an Independent Chief Compliance Officer (ICCO) for the funds. The ICCO is an officer of the funds and the sole member of Tarantino LLC. The funds can terminate the Agreement with Tarantino LLC at any time under the terms of the Agreement. For the six months ended June 30, 2008, the fee paid by the fund to Tarantino LLC was $117 and is included in miscellaneous expense on the Statement of Operations. MFS has agreed to reimburse the fund for a portion of the payments made by the fund to Tarantino LLC in the amount of $113, which is shown as a reduction of total expenses in the Statement of Operations. Additionally, MFS has agreed to bear all expenses associated with office space, other administrative support, and supplies provided to the ICCO.
| (4) | Portfolio Securities |
Purchases and sales of investments, other than purchased option transactions and short-term obligations, were as follows:
| Purchases | Sales | |||
| U.S. Government securities | $263,398 | $623,631 | ||
| Investments (non-U.S. Government securities) | $10,869,487 | $11,994,465 |
21
Table of Contents
Notes to Financial Statements (unaudited) – continued
| (5) | Shares of Beneficial Interest |
The fund’s Declaration of Trust permits the Trustees to issue an unlimited number of full and fractional shares of beneficial interest. Transactions in fund shares were as follows:
| Six months ended 6/30/08 | Year ended 12/31/07 | |||||||||||
| Shares | Amount | Shares | Amount | |||||||||
| Shares sold | ||||||||||||
Initial Class | 295,693 | $3,078,221 | 586,120 | $6,148,472 | ||||||||
Service Class | 43,178 | 444,617 | 272,667 | 2,839,173 | ||||||||
| 338,871 | $3,522,838 | 858,787 | $8,987,645 | |||||||||
| Shares issued to shareholders in reinvestment of distributions | ||||||||||||
Initial Class | 197,117 | $1,961,317 | 141,336 | $1,464,241 | ||||||||
Service Class | 39,617 | 389,438 | 34,408 | 352,339 | ||||||||
| 236,734 | $2,350,755 | 175,744 | $1,816,580 | |||||||||
| Shares reacquired | ||||||||||||
Initial Class | (748,548 | ) | $(7,579,415 | ) | (455,979 | ) | $(4,777,970 | ) | ||||
Service Class | (209,707 | ) | (2,160,656 | ) | (153,620 | ) | (1,594,231 | ) | ||||
| (958,255 | ) | $(9,740,071 | ) | (609,599 | ) | $(6,372,201 | ) | |||||
| Net change | ||||||||||||
Initial Class | (255,738 | ) | $(2,539,877 | ) | 271,477 | $2,834,743 | ||||||
Service Class | (126,912 | ) | (1,326,601 | ) | 153,455 | 1,597,281 | ||||||
| (382,650 | ) | $(3,866,478 | ) | 424,932 | $4,432,024 | |||||||
| (6) | Line of Credit |
The fund and other funds managed by MFS participate in a $1 billion unsecured committed line of credit provided by a syndication of banks under a credit agreement. In addition, the fund and other funds managed by MFS have established uncommitted borrowing arrangements with certain banks. Borrowings may be made for temporary financing needs. Interest is charged to each fund, based on its borrowings, generally at a rate equal to the Federal Reserve funds rate plus 0.30%. In addition, a commitment fee, based on the average daily, unused portion of the committed line of credit, is allocated among the participating funds at the end of each calendar quarter. For the six months ended June 30, 2008, the fund’s commitment fee and interest expense were $85 and $0, respectively, and are included in miscellaneous expense on the Statement of Operations.
22
Table of Contents
BOARD REVIEW OF INVESTMENT ADVISORY AGREEMENT
A discussion regarding the Board’s most recent review and renewal of the fund’s Investment Advisory Agreement with MFS will be available on or about November 1, 2008 by clicking on the fund’s name under ‘‘Variable Insurance Portfolios - VIT’’ in the ‘‘Products and Performance’’ section of the MFS Web site (mfs.com).
PROXY VOTING POLICIES AND INFORMATION
A general description of the MFS funds’ proxy voting policies and procedures is available without charge, upon request, by calling 1-800-225-2606, by visiting the Proxy Voting section of mfs.com or by visiting the SEC’s Web site at http://www.sec.gov.
Information regarding how the fund voted proxies relating to portfolio securities during the most recent twelve-month period ended June 30 is available without charge by visiting the Proxy Voting section of mfs.com or by visiting the SEC’s Web site at http://www.sec.gov.
QUARTERLY PORTFOLIO DISCLOSURE
The fund will file a complete schedule of portfolio holdings with the Securities and Exchange Commission (the Commission) for the first and third quarters of each fiscal year on Form N-Q. The fund’s Form N-Q may be reviewed and copied at the:
Public Reference Room
Securities and Exchange Commission
100 F Street, NE, Room 1580
Washington, D.C. 20549
Information on the operation of the Public Reference Room may be obtained by calling the Commission at 1-800-SEC-0330. The fund’s Form N-Q is available on the EDGAR database on the Commission’s Internet Web site at http://www.sec.gov, and copies of this information may be obtained, upon payment of a duplicating fee, by electronic request at the following e-mail address: publicinfo@sec.gov or by writing the Public Reference Section at the above address.
23
Table of Contents
CONTACT US
Web site
mfs.com
Account service and literature
Shareholders
1-877-411-3325
9 a.m. to 5 p.m. Eastern Time
Investment professionals
1-800-637-8730
8 a.m. to 5 p.m. Eastern Time
Mailing address
MFS Service Center, Inc.
Attn: Institutional Alliance Services (IAS)
P.O. Box 55824
Boston, MA 02205-5824
Overnight mail
MFS Service Center, Inc.
c/o Boston Financial Data Services
30 Dan Road
Canton, MA 02021-2809

Table of Contents

Table of Contents
This report is prepared for the general information of contract owners. It is authorized for distribution to prospective investors only when preceded or accompanied by a current prospectus.
NOT FDIC INSURED Ÿ MAY LOSE VALUE Ÿ NO BANK OR CREDIT UNION GUARANTEE Ÿ NOT A DEPOSIT Ÿ NOT INSURED BY ANY FEDERAL GOVERNMENT AGENCY OR NCUA/NCUSIF
Table of Contents

Dear Contract Owners:
Negative headlines tend to resonate during difficult markets, and we certainly have had more than our share of tough news recently. As a result consumer, and particularly investor, sentiment are at all-time lows. That said, I do think it is helpful to remember there are always silver linings in the storm clouds if you look hard enough.
Through all of the challenges we have faced, there are some positive underlying trends. In the United States, for example, institutional traders and credit market followers are just now showing increasing signs of confidence and are beginning to take on more risk. At the corporate level, earnings continue to be relatively strong as companies have reduced labor costs, controlled inventories, and relied less on debt to finance expansion. More broadly, low interest rates and strong demand for consumer goods and industrial equipment are good signs for the global economy.
While I do not mean to minimize the risks inherent in today’s markets, periods such as these allow the talented fund managers and research analysts we have at MFS® to test their convictions, reevaluate existing positions, and identify new investment ideas. Our investment process also includes a significant risk management component, with constant attention paid to monitoring market risk, so we can do our best to minimize any surprises to your portfolio.
For investors, this is a great time to check in with your advisor and make sure you have a sound investment plan in place — one that can keep your hard-earned money working over the long term through a strategy that involves asset allocation, diversification, and periodic portfolio rebalancing and reviews. A plan tailored to your distinct needs and goals continues to be the best approach to help you take advantage of the inevitable challenges — and opportunities — that present themselves over time.
Respectfully,

Robert J. Manning
Chief Executive Officer and Chief Investment Officer
MFS Investment Management®
August 15, 2008
The opinions expressed in this letter are subject to change, may not be relied upon for investment advice, and no forecasts can be guaranteed.
1
Table of Contents
Portfolio structure (i)
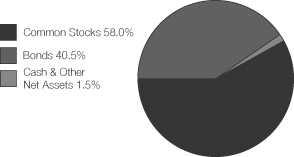
| Top ten holdings (i) | ||
| U.S. Treasury Notes, 4.875%, 2009 | 4.1% | |
| Fannie Mae, 5.5%, 30 years | 3.9% | |
| Fannie Mae, 6.0%, 30 years | 2.4% | |
| Exxon Mobil Corp. | 2.1% | |
| U.S. Treasury Notes, 5.125%, 2011 | 1.9% | |
| Lockheed Martin Corp. | 1.7% | |
| TOTAL S.A., ADR | 1.5% | |
| Philip Morris International, Inc. | 1.2% | |
| AT&T, Inc. | 1.2% | |
| Hess Corp. | 1.2% |
| Equity sectors | ||
| Financial Services | 11.7% | |
| Energy | 9.7% | |
| Utilities & Communications | 7.2% | |
| Consumer Staples | 5.6% | |
| Health Care | 5.4% | |
| Industrial Goods & Services | 5.3% | |
| Technology | 3.5% | |
| Retailing | 3.3% | |
| Leisure | 1.9% | |
| Basic Materials | 1.4% | |
| Autos & Housing | 1.3% | |
| Special Products & Services | 1.0% | |
| Transportation | 0.7% | |
| Fixed income sectors (i) | ||
| Mortgage-Backed Securities | 16.1% | |
| U.S. Treasury Securities | 9.3% | |
| High Grade Corporates | 9.1% | |
| Commercial Mortgage-Backed Securities | 2.4% | |
| U.S. Government Agencies | 1.5% | |
| Non-U.S. Government Bonds | 1.0% | |
| Emerging Market Bonds | 0.4% | |
| Asset-Backed Securities | 0.3% | |
| Municipal Bonds | 0.3% | |
| High Yield Corporates | 0.1% | |
| Residential Mortgage-Backed Securities (o) | 0.0% | |
| (i) | For purposes of this presentation, the bond component includes accrued interest amounts and may be positively or negatively impacted by the equivalent exposure from any derivative holdings, if applicable. |
| (o) | Less than 0.1% |
Percentages are based on net assets as of 6/30/08, unless otherwise noted.
The portfolio is actively managed and current holdings may be different.
2
Table of Contents
Fund Expenses Borne by the Contract Holders During the Period,
January 1, 2008 through June 30, 2008
As a contract holder of the fund, you incur ongoing costs, including management fees; distribution (12b-1) fees; and other fund expenses. This example is intended to help you understand your ongoing costs (in dollars) of investing in the fund and to compare these costs with the ongoing costs of investing in other mutual funds.
The example is based on an investment of $1,000 invested at the beginning of the period and held for the entire period January 1, 2008 through June 30, 2008.
Actual Expenses
The first line for each share class in the following table provides information about actual account values and actual expenses. You may use the information in this line, together with the amount you invested, to estimate the expenses that you paid over the period. Simply divide your account value by $1,000 (for example, an $8,600 account value divided by $1,000 = 8.6), then multiply the result by the number in the first line under the heading entitled “Expenses Paid During Period” to estimate the expenses you paid on your account during this period.
Hypothetical Example for Comparison Purposes
The second line for each share class in the following table provides information about hypothetical account values and hypothetical expenses based on the fund’s actual expense ratio and an assumed rate of return of 5% per year before expenses, which is not the fund’s actual return. The hypothetical account values and expenses may not be used to estimate the actual ending account balance or expenses you paid for the period. You may use this information to compare the ongoing costs of investing in the fund and other funds. To do so, compare this 5% hypothetical example with the 5% hypothetical examples that appear in the shareholder reports of the other funds.
Please note that the expenses shown in the table are meant to highlight the fund’s ongoing costs only and do not take into account the fees and expenses imposed under the variable contracts through which your investment in the fund is made. Therefore, the second line for each share class in the table is useful in comparing ongoing costs associated with an investment in vehicles (such as the fund) which fund benefits under variable annuity and variable life insurance contracts and to qualified pension and retirement plans only, and will not help you determine the relative total costs of investing in the fund through variable annuity and variable life insurance contracts. If the fees and expenses imposed under the variable contracts were included, your costs would have been higher.
| Share Class | Annualized | Beginning Account Value 1/01/08 | Ending 6/30/08 | Expenses Paid During Period (p) 1/01/08-6/30/08 | ||||||
| Initial Class | Actual | 0.78% | $1,000.00 | $931.70 | $3.75 | |||||
| Hypothetical (h) | 0.78% | $1,000.00 | $1,020.98 | $3.92 | ||||||
| Service Class | Actual | 1.03% | $1,000.00 | $930.73 | $4.94 | |||||
| Hypothetical (h) | 1.03% | $1,000.00 | $1,019.74 | $5.17 |
| (h) | 5% class return per year before expenses. |
| (p) | Expenses paid is equal to each class’ annualized expense ratio, as shown above, multiplied by the average account value over the period, multiplied by the number of days in the period, divided by the number of days in the year. |
3
Table of Contents
PORTFOLIO OF INVESTMENTS – 6/30/08 (unaudited)
The Portfolio of Investments is a complete list of all securities owned by your fund. It is categorized by broad-based asset classes.
| Issuer | Shares/Par | Value ($) | |||
| COMMON STOCKS – 58.0% | |||||
| Aerospace – 3.1% | |||||
| Lockheed Martin Corp. | 597,430 | $ | 58,942,434 | ||
| Northrop Grumman Corp. | 344,650 | 23,057,085 | |||
| Raytheon Co. | 33,200 | 1,868,496 | |||
| United Technologies Corp. | 445,300 | 27,475,010 | |||
| $ | 111,343,025 | ||||
| Alcoholic Beverages – 0.6% | |||||
| Diageo PLC | 906,742 | $ | 16,666,956 | ||
| Heineken N.V. | 97,160 | 4,940,365 | |||
| $ | 21,607,321 | ||||
| Apparel Manufacturers – 0.6% | |||||
| NIKE, Inc., “B” | 341,820 | $ | 20,375,890 | ||
| Automotive – 0.6% | |||||
| Harley-Davidson, Inc. (l) | 142,660 | $ | 5,172,852 | ||
| Johnson Controls, Inc. | 567,080 | 16,263,854 | |||
| $ | 21,436,706 | ||||
| Biotechnology – 0.5% | |||||
| Amgen, Inc. (a) | 136,140 | $ | 6,420,362 | ||
| Genzyme Corp. (a) | 163,350 | 11,764,467 | |||
| $ | 18,184,829 | ||||
| Broadcasting – 1.1% | |||||
| Omnicom Group, Inc. | 391,720 | $ | 17,580,394 | ||
| Walt Disney Co. | 557,830 | 17,404,296 | |||
| WPP Group PLC | 296,880 | 2,860,277 | |||
| $ | 37,844,967 | ||||
| Brokerage & Asset Managers – 1.9% | |||||
| Deutsche Boerse AG | 63,130 | $ | 7,085,844 | ||
| Franklin Resources, Inc. | 152,190 | 13,948,214 | |||
| Goldman Sachs Group, Inc. | 154,930 | 27,097,257 | |||
| Invesco Ltd. | 199,460 | 4,783,051 | |||
| Legg Mason, Inc. | 44,720 | 1,948,450 | |||
| Merrill Lynch & Co., Inc. | 364,600 | 11,561,466 | |||
| $ | 66,424,282 | ||||
| Business Services – 1.0% | |||||
| Accenture Ltd., “A” | 335,960 | $ | 13,680,291 | ||
| Automatic Data Processing, Inc. | 177,550 | 7,439,345 | |||
| Fidelity National Information Services, Inc. | 213,800 | 7,891,358 | |||
| Visa, Inc., “A” | 78,860 | 6,412,107 | |||
| Western Union Co. | 58,100 | 1,436,232 | |||
| $ | 36,859,333 | ||||
| Cable TV – 0.2% | |||||
| Time Warner Cable, Inc. (a)(l) | 274,270 | $ | 7,262,670 | ||
| Chemicals – 1.0% | |||||
| 3M Co. | 81,190 | $ | 5,650,012 | ||
| PPG Industries, Inc. | 439,170 | 25,195,183 | |||
| Rohm & Haas Co. (l) | 85,950 | 3,991,518 | |||
| $ | 34,836,713 | ||||
| Issuer | Shares/Par | Value ($) | |||
| COMMON STOCKS – continued | |||||
| Computer Software – 0.9% | |||||
| Oracle Corp. (a) | 1,420,282 | $ | 29,825,922 | ||
| Synopsys, Inc. (a) | 34,090 | 815,092 | |||
| $ | 30,641,014 | ||||
| Computer Software – Systems – 1.4% | |||||
| Hewlett-Packard Co. | 235,600 | $ | 10,415,876 | ||
| International Business Machines Corp. | 320,410 | 37,978,197 | |||
| $ | 48,394,073 | ||||
| Construction – 0.5% | |||||
| Masco Corp. | 374,788 | $ | 5,895,415 | ||
| Pulte Homes, Inc. (l) | 400,720 | 3,858,934 | |||
| Sherwin-Williams Co. (l) | 101,850 | 4,677,971 | |||
| Toll Brothers, Inc. (a)(l) | 156,231 | 2,926,207 | |||
| $ | 17,358,527 | ||||
| Consumer Goods & Services – 0.7% | |||||
| Clorox Co. | 181,860 | $ | 9,493,092 | ||
| Procter & Gamble Co. | 223,450 | 13,587,995 | |||
| $ | 23,081,087 | ||||
| Containers – 0.0% | |||||
| Smurfit-Stone Container Corp. (a)(l) | 14,768 | $ | 60,106 | ||
| Electrical Equipment – 1.1% | |||||
| Danaher Corp. | 105,930 | $ | 8,188,389 | ||
| General Electric Co. | 297,407 | 7,937,793 | |||
| W.W. Grainger, Inc. | 182,050 | 14,891,690 | |||
| WESCO International, Inc. (a) | 194,670 | 7,794,587 | |||
| $ | 38,812,459 | ||||
| Electronics – 1.0% | |||||
| Flextronics International Ltd. (a) | 544,930 | $ | 5,122,342 | ||
| Intel Corp. | 1,132,230 | 24,320,300 | |||
| Samsung Electronics Co. Ltd., GDR | 12,330 | 3,615,427 | |||
| SanDisk Corp. (a) | 115,440 | 2,158,728 | |||
| $ | 35,216,797 | ||||
| Energy – Independent – 2.4% | |||||
| Apache Corp. | 302,570 | $ | 42,057,230 | ||
| Devon Energy Corp. | 263,450 | 31,656,152 | |||
| EOG Resources, Inc. | 59,990 | 7,870,688 | |||
| Sunoco, Inc. (l) | 111,550 | 4,538,970 | |||
| $ | 86,123,040 | ||||
| Energy – Integrated – 6.6% | |||||
| Chevron Corp. | 272,662 | $ | 27,028,984 | ||
| ConocoPhillips | 112,280 | 10,598,109 | |||
| Exxon Mobil Corp. | 846,132 | 74,569,613 | |||
| Hess Corp. | 345,950 | 43,655,431 | |||
| Marathon Oil Corp. | 474,350 | 24,604,535 | |||
| TOTAL S.A., ADR | 629,930 | 53,714,131 | |||
| $ | 234,170,803 | ||||
| Engineering – Construction – 0.0% | |||||
| North American Energy Partners, Inc. (a) | 45,130 | $ | 978,418 | ||
4
Table of Contents
Portfolio of Investments (unaudited) – continued
| Issuer | Shares/Par | Value ($) | |||
| COMMON STOCKS – continued | |||||
| Food & Beverages – 2.7% | |||||
| General Mills, Inc. | 443,190 | $ | 26,932,656 | ||
| Hain Celestial Group, Inc. (a) | 14,200 | 333,416 | |||
| Kellogg Co. | 424,330 | 20,376,327 | |||
| Nestle S.A. | 650,980 | 29,461,480 | |||
| PepsiCo, Inc. | 324,970 | 20,664,842 | |||
| $ | 97,768,721 | ||||
| Food & Drug Stores – 1.4% | |||||
| CVS Caremark Corp. | 621,380 | $ | 24,588,007 | ||
| Kroger Co. | 233,250 | 6,733,928 | |||
| Safeway, Inc. | 336,400 | 9,604,220 | |||
| Walgreen Co. | 307,580 | 9,999,426 | |||
| $ | 50,925,581 | ||||
| Furniture & Appliances – 0.2% | |||||
| Jarden Corp. (a)(l) | 329,900 | $ | 6,017,376 | ||
| Gaming & Lodging – 0.6% | |||||
| Royal Caribbean Cruises Ltd. (l) | 646,890 | $ | 14,535,618 | ||
| Wyndham Worldwide (w) | 351,600 | 6,297,156 | |||
| $ | 20,832,774 | ||||
| General Merchandise – 0.8% | |||||
| Macy’s, Inc. | 1,062,900 | $ | 20,641,518 | ||
| Wal-Mart Stores, Inc. | 161,530 | 9,077,986 | |||
| $ | 29,719,504 | ||||
| Health Maintenance Organizations – 0.6% | |||||
| UnitedHealth Group, Inc. | 277,870 | $ | 7,294,088 | ||
| WellPoint, Inc. (a) | 266,400 | 12,696,624 | |||
| $ | 19,990,712 | ||||
| Insurance – 4.5% | |||||
| Allstate Corp. | 919,920 | $ | 41,939,153 | ||
| Aon Corp. | 54,000 | 2,480,760 | |||
| Aspen Insurance Holdings Ltd. | 89,830 | 2,126,276 | |||
| Chubb Corp. | 87,190 | 4,273,182 | |||
| Conseco, Inc. (a) | 644,837 | 6,396,783 | |||
| Genworth Financial, Inc., “A” | 1,439,700 | 25,641,057 | |||
| Hartford Financial Services Group, Inc. | 229,275 | 14,804,287 | |||
| Max Capital Group Ltd. (l) | 294,810 | 6,288,297 | |||
| MetLife, Inc. | 737,480 | 38,916,820 | |||
| Principal Financial Group, Inc. | 64,490 | 2,706,645 | |||
| Prudential Financial, Inc. | 71,640 | 4,279,774 | |||
| Travelers Cos., Inc. | 217,120 | 9,423,008 | |||
| $ | 159,276,042 | ||||
| Machinery & Tools – 1.1% | |||||
| Eaton Corp. | 129,730 | $ | 11,023,158 | ||
| Ingersoll-Rand Co. Ltd., “A” | 238,750 | 8,936,413 | |||
| Kennametal, Inc. | 225,460 | 7,338,723 | |||
| Timken Co. | 346,535 | 11,414,863 | |||
| $ | 38,713,157 | ||||
| Major Banks – 4.5% | |||||
| Bank of America Corp. | 1,051,981 | $ | 25,110,786 | ||
| Bank of New York Mellon Corp. | 945,902 | 35,783,473 | |||
| JPMorgan Chase & Co. | 1,079,944 | 37,052,879 | |||
| PNC Financial Services Group, Inc. | 360,070 | 20,559,997 | |||
| Issuer | Shares/Par | Value ($) | |||
| COMMON STOCKS – continued | |||||
| Major Banks – continued | |||||
| State Street Corp. | 355,140 | $ | 22,725,409 | ||
| SunTrust Banks, Inc. | 244,480 | 8,855,066 | |||
| UnionBanCal Corp. | 89,290 | 3,609,102 | |||
| Wachovia Corp. | 304,140 | 4,723,294 | |||
| $ | 158,420,006 | ||||
| Medical & Health Technology & Services – 0.1% | |||||
| DaVita, Inc. (a) | 90,700 | $ | 4,818,891 | ||
| Medical Equipment – 0.6% | |||||
| Advanced Medical Optics, Inc. (a)(l) | 302,040 | $ | 5,660,230 | ||
| Boston Scientific Corp. (a) | 432,270 | 5,312,598 | |||
| Cooper Cos., Inc. (l) | 84,900 | 3,154,035 | |||
| Zimmer Holdings, Inc. (a) | 128,440 | 8,740,342 | |||
| $ | 22,867,205 | ||||
| Metals & Mining – 0.1% | |||||
| Century Aluminum Co. (a)(l) | 74,840 | $ | 4,976,112 | ||
| Natural Gas – Distribution – 0.6% | |||||
| Sempra Energy | 381,160 | $ | 21,516,482 | ||
| Natural Gas – Pipeline – 0.8% | |||||
| El Paso Corp. | 480,920 | $ | 10,455,201 | ||
| Williams Cos., Inc. | 443,920 | 17,894,415 | |||
| $ | 28,349,616 | ||||
| Network & Telecom – 0.2% | |||||
| Cisco Systems, Inc. (a) | 47,450 | $ | 1,103,687 | ||
| Nokia Corp., ADR | 250,360 | 6,133,820 | |||
| $ | 7,237,507 | ||||
| Oil Services – 0.7% | |||||
| Halliburton Co. | 193,020 | $ | 10,243,571 | ||
| Helix Energy Solutions Group, Inc. (a) | 61,400 | 2,556,696 | |||
| Nabors Industries Ltd. (a)(l) | 50,680 | 2,494,976 | |||
| Noble Corp. | 140,216 | 9,108,431 | |||
| $ | 24,403,674 | ||||
| Other Banks & Diversified Financials – 0.8% | |||||
| American Express Co. | 256,690 | $ | 9,669,512 | ||
| Assured Guaranty Ltd. (l) | 64,600 | 1,162,154 | |||
| East West Bancorp, Inc. (l) | 138,220 | 975,833 | |||
| New York Community Bancorp, Inc. (l) | 191,896 | 3,423,425 | |||
| Sovereign Bancorp, Inc. | 1,294,090 | 9,524,502 | |||
| UBS AG (a) | 151,692 | 3,141,024 | |||
| $ | 27,896,450 | ||||
| Pharmaceuticals – 3.6% | |||||
| Abbott Laboratories | 60,670 | $ | 3,213,690 | ||
| GlaxoSmithKline PLC | 210,390 | 4,653,468 | |||
| Johnson & Johnson | 464,920 | 29,912,953 | |||
| Merck & Co., Inc. | 733,770 | 27,655,791 | |||
| Merck KGaA | 50,830 | 7,220,349 | |||
| Pfizer, Inc. | 180,190 | 3,147,919 | |||
| Roche Holding AG | 45,490 | 8,175,569 | |||
| Wyeth | 909,000 | 43,595,640 | |||
| $ | 127,575,379 | ||||
5
Table of Contents
Portfolio of Investments (unaudited) – continued
| Issuer | Shares/Par | Value ($) | ||||
| COMMON STOCKS – continued | ||||||
| Railroad & Shipping – 0.5% | ||||||
| Burlington Northern Santa Fe Corp. | 126,130 | $ | 12,599,126 | |||
| Norfolk Southern Corp. | 89,591 | 5,614,668 | ||||
| $ | 18,213,794 | |||||
| Specialty Chemicals – 0.3% | ||||||
| Air Products & Chemicals, Inc. | 98,810 | $ | 9,768,357 | |||
| Praxair, Inc. | 18,520 | 1,745,325 | ||||
| $ | 11,513,682 | |||||
| Specialty Stores – 0.5% | ||||||
| Advance Auto Parts, Inc. | 35,890 | $ | 1,393,609 | |||
| Nordstrom, Inc. | 54,610 | 1,654,683 | ||||
| PetSmart, Inc. | 147,100 | 2,934,645 | ||||
| Staples, Inc. | 443,350 | 10,529,563 | ||||
| $ | 16,512,500 | |||||
| Telecommunications – Wireless – 0.2% | ||||||
| Rogers Communications, Inc., “B” | 46,600 | $ | 1,811,523 | |||
| Vodafone Group PLC, ADR | 234,717 | 6,914,763 | ||||
| $ | 8,726,286 | |||||
| Telephone Services – 2.2% | ||||||
| AT&T, Inc. | 1,315,424 | $ | 44,316,635 | |||
| Embarq Corp. | 554,043 | 26,189,613 | ||||
| TELUS Corp. | 56,530 | 2,304,751 | ||||
| Verizon Communications, Inc. | 191,105 | 6,765,117 | ||||
| $ | 79,576,116 | |||||
| Tobacco – 1.6% | ||||||
| Altria Group, Inc. | 174,703 | $ | 3,591,894 | |||
| Lorillard, Inc. (a) | 149,400 | 10,332,504 | ||||
| Philip Morris International, Inc. | 897,990 | 44,351,726 | ||||
| $ | 58,276,124 | |||||
| Trucking – 0.2% | ||||||
| United Parcel Service, Inc., “B” | 116,350 | $ | 7,152,035 | |||
| Utilities – Electric Power – 3.4% | ||||||
| American Electric Power Co., Inc. | 293,060 | $ | 11,789,804 | |||
| CMS Energy Corp. (l) | 176,640 | 2,631,936 | ||||
| Dominion Resources, Inc. | 209,790 | 9,962,927 | ||||
| DPL, Inc. (l) | 163,290 | 4,307,590 | ||||
| Entergy Corp. | 53,320 | 6,423,994 | ||||
| FPL Group, Inc. | 318,458 | 20,884,476 | ||||
| NRG Energy, Inc. (a) | 336,970 | 14,456,013 | ||||
| Pepco Holdings, Inc. | 177,430 | 4,551,080 | ||||
| PG&E Corp. | 543,100 | 21,555,639 | ||||
| PPL Corp. | 199,910 | 10,449,296 | ||||
| Public Service Enterprise Group, Inc. | 298,710 | 13,719,750 | ||||
| $ | 120,732,505 | |||||
| Total Common Stocks (Identified Cost, $2,013,251,276) | $ | 2,063,020,291 | ||||
| BONDS – 40.1% | ||||||
| Agency – Other – 0.0% | ||||||
| Financing Corp., 9.65%, 2018 | $ | 740,000 | $ | 1,026,908 | ||
| Issuer | Shares/Par | Value ($) | ||||
| BONDS – continued | ||||||
| Asset Backed & Securitized – 2.7% | ||||||
| Banc of America Commercial Mortgage, Inc., FRN, 5.482%, 2049 | $ | 411,524 | $ | 367,615 | ||
| Bayview Financial Revolving Mortgage Loan Trust, FRN, 3.182%, 2040 (z) | 3,009,000 | 2,307,787 | ||||
| Chase Commercial Mortgage Securities Corp., 7.543%, 2032 | 14,346 | 14,488 | ||||
| Citigroup Commercial Mortgage Trust, FRN, 5.888%, 2049 | 5,000,000 | 4,751,304 | ||||
| Countrywide Asset-Backed Certificates, FRN, 4.575%, 2035 | 42,348 | 42,032 | ||||
| Countrywide Asset-Backed Certificates, FRN, 4.823%, 2035 | 903,456 | 899,801 | ||||
| Countrywide Asset-Backed Certificates, FRN, 5.689%, 2046 | 1,911,000 | 1,699,529 | ||||
| Credit Suisse Commercial Mortgage Trust, 5.509%, 2039 | 2,460,763 | 2,240,943 | ||||
| Credit Suisse Mortgage Capital Certificate, 5.343%, 2039 | 1,332,645 | 1,197,034 | ||||
| Credit Suisse Mortgage Capital Certificate, FRN, 5.695%, 2017 | 3,818,128 | 3,598,588 | ||||
| GE Commercial Mortgage Corp., FRN, 5.517%, 2044 | 2,078,000 | 1,904,274 | ||||
| GMAC Mortgage Corp. Loan Trust, FRN, 5.805%, 2036 | 2,232,000 | 1,170,630 | ||||
| Greenwich Capital Commercial Funding Corp., 5.475%, 2039 | 5,978,000 | 5,337,557 | ||||
| Greenwich Capital Commercial Funding Corp., 4.305%, 2042 | 1,626,715 | 1,615,029 | ||||
| Greenwich Capital Commercial Funding Corp., FRN, 5.317%, 2036 | 2,550,000 | 2,506,044 | ||||
| JPMorgan Chase Commercial Mortgage Securities Corp., 4.78%, 2042 | 2,485,000 | 2,294,334 | ||||
| JPMorgan Chase Commercial Mortgage Securities Corp., 5.552%, 2045 | 1,506,000 | 1,440,983 | ||||
| JPMorgan Chase Commercial Mortgage Securities Corp., 5.372%, 2047 | 3,499,000 | 3,155,916 | ||||
| JPMorgan Chase Commercial Mortgage Securities Corp., FRN, 4.948%, 2037 | 2,548,000 | 2,372,292 | ||||
| JPMorgan Chase Commercial Mortgage Securities Corp., FRN, 5.378%, 2041 | 2,550,000 | 2,502,495 | ||||
| JPMorgan Chase Commercial Mortgage Securities Corp., FRN, 5.475%, 2043 | 4,303,000 | 4,113,023 | ||||
| JPMorgan Chase Commercial Mortgage Securities Corp., FRN, 6.065%, 2045 | 4,303,000 | 4,226,769 | ||||
| JPMorgan Chase Commercial Mortgage Securities Corp., FRN, 5.038%, 2046 | 2,755,995 | 2,632,652 | ||||
| Merrill Lynch Mortgage Trust, FRN, 6.022%, 2050 | 1,967,000 | 1,382,567 | ||||
| Merrill Lynch/Countrywide Commercial Mortgage Trust, 5.378%, 2048 | 12,251,000 | 11,350,683 | ||||
| Merrill Lynch/Countrywide Commercial Mortgage Trust, FRN, 5.653%, 2039 | 1,764,000 | 1,632,278 | ||||
| Merrill Lynch/Countrywide Commercial Mortgage Trust, FRN, 5.81%, 2050 | 3,818,128 | 3,625,117 | ||||
| Morgan Stanley Capital I, Inc., 5.168%, 2042 | 1,272,138 | 1,227,146 | ||||
6
Table of Contents
Portfolio of Investments (unaudited) – continued
| Issuer | Shares/Par | Value ($) | ||||
| BONDS – continued | ||||||
| Asset Backed & Securitized – continued | ||||||
| Morgan Stanley Capital I, Inc., FRN, 0.619%, 2030 (i)(n) | $ | 12,327,286 | $ | 137,402 | ||
| Multi-Family Capital Access One, Inc., 6.65%, 2024 | 450,608 | 449,993 | ||||
| Residential Asset Mortgage Products, Inc., 4.109%, 2035 | 144,690 | 144,404 | ||||
| Residential Asset Mortgage Products, Inc., FRN, 4.97%, 2034 | 1,170,000 | 1,118,171 | ||||
| Residential Funding Mortgage Securities, Inc., FRN, 5.32%, 2035 | 2,164,000 | 834,780 | ||||
| Spirit Master Funding LLC, 5.05%, 2023 (z) | 2,379,678 | 1,832,299 | ||||
| Structured Asset Securities Corp., FRN, 4.67%, 2035 | 2,299,631 | 2,208,587 | ||||
| Wachovia Bank Commercial Mortgage Trust, 4.75%, 2044 | 3,430,000 | 3,161,103 | ||||
| Wachovia Bank Commercial Mortgage Trust, FRN, 4.847%, 2041 | 3,085,000 | 2,920,863 | ||||
| Wachovia Bank Commercial Mortgage Trust, FRN, 5.083%, 2042 | 3,091,818 | 2,959,666 | ||||
| Wachovia Bank Commercial Mortgage Trust, FRN, 5.118%, 2042 | 3,283,000 | 3,134,218 | ||||
| Wachovia Bank Commercial Mortgage Trust, FRN, 5.513%, 2043 | 1,298,000 | 893,508 | ||||
| Wachovia Bank Commercial Mortgage Trust, FRN, 6.158%, 2045 | 2,793,000 | 2,650,940 | ||||
| Wachovia Bank Commercial Mortgage Trust, FRN, 5.795%, 2045 | 2,881,000 | 2,679,731 | ||||
| $ | 96,734,575 | |||||
| Automotive – 0.1% | ||||||
| Johnson Controls, Inc., 5.5%, 2016 | $ | 3,555,000 | $ | 3,410,521 | ||
| Broadcasting – 0.2% | ||||||
| CBS Corp., 6.625%, 2011 | $ | 2,815,000 | $ | 2,882,549 | ||
| Hearst-Argyle Television, Inc., 7.5%, 2027 | 1,871,000 | 1,861,306 | ||||
| News America, Inc., 8.5%, 2025 | 1,586,000 | 1,790,937 | ||||
| $ | 6,534,792 | |||||
| Brokerage & Asset Managers – 0.5% | ||||||
| Goldman Sachs Group, Inc., 5.625%, 2017 | $ | 3,914,000 | $ | 3,626,544 | ||
| Lehman Brothers Holdings, Inc., 6.5%, 2017 | 4,067,000 | 3,762,459 | ||||
| Merrill Lynch & Co., Inc., 6.15%, 2013 | 2,480,000 | 2,403,618 | ||||
| Merrill Lynch & Co., Inc., 6.11%, 2037 | 2,391,000 | 1,898,947 | ||||
| Morgan Stanley, 5.75%, 2016 | 2,536,000 | 2,344,205 | ||||
| Morgan Stanley Group, Inc., 6.75%, 2011 | 1,837,000 | 1,884,385 | ||||
| Morgan Stanley Group, Inc., 6.625%, 2018 | 1,521,000 | 1,441,186 | ||||
| $ | 17,361,344 | |||||
| Building – 0.1% | ||||||
| CRH America, Inc., 6.95%, 2012 | $ | 2,824,000 | $ | 2,825,782 | ||
| Issuer | Shares/Par | Value ($) | ||||
| BONDS – continued | ||||||
| Business Services – 0.0% | ||||||
| Xerox Corp., 5.5%, 2012 | $ | 1,637,000 | $ | 1,618,078 | ||
| Cable TV – 0.1% | ||||||
| Cox Communications, Inc., 4.625%, 2013 | $ | 2,714,000 | $ | 2,569,281 | ||
| Time Warner Entertainment Co. LP, 8.375%, 2033 | 2,421,000 | 2,620,142 | ||||
| $ | 5,189,423 | |||||
| Chemicals – 0.1% | ||||||
| PPG Industries, Inc., 5.75%, 2013 | $ | 3,289,000 | $ | 3,344,120 | ||
| Conglomerates – 0.1% | ||||||
| General Electric Co., 5.25%, 2017 | $ | 1,860,000 | $ | 1,788,078 | ||
| Kennametal, Inc., 7.2%, 2012 | 2,140,000 | 2,266,185 | ||||
| $ | 4,054,263 | |||||
| Consumer Goods & Services – 0.2% | ||||||
| Fortune Brands, Inc., 5.125%, 2011 | $ | 2,590,000 | $ | 2,576,229 | ||
| Western Union Co., 5.4%, 2011 | 4,087,000 | 4,064,722 | ||||
| $ | 6,640,951 | |||||
| Defense Electronics – 0.1% | ||||||
| BAE Systems Holdings, Inc., 5.2%, 2015 (n) | $ | 2,440,000 | $ | 2,338,891 | ||
| Electronics – 0.1% | ||||||
| Tyco Electronics Group S.A., 6.55%, 2017 | $ | 2,931,000 | $ | 2,957,285 | ||
| Emerging Market Quasi-Sovereign – 0.1% | ||||||
| Ras Laffan Liquefied Natural Gas Co. Ltd., 5.832%, 2016 (n) | $ | 2,715,000 | $ | 2,636,482 | ||
| Emerging Market Sovereign – 0.1% | ||||||
| State of Israel, 4.625%, 2013 | $ | 2,068,000 | $ | 2,071,487 | ||
| Energy – Independent – 0.1% | ||||||
| Nexen, Inc., 5.875%, 2035 | $ | 716,000 | $ | 639,453 | ||
| Ocean Energy, Inc., 7.25%, 2011 | 2,067,000 | 2,207,271 | ||||
| $ | 2,846,724 | |||||
| Energy – Integrated – 0.1% | ||||||
| Petro-Canada, 6.05%, 2018 | $ | 3,647,000 | $ | 3,594,078 | ||
| Financial Institutions – 0.5% | ||||||
| American Express Co., 5.5%, 2016 | $ | 4,690,000 | $ | 4,455,111 | ||
| Capital One Financial Corp., 6.15%, 2016 | 2,872,000 | 2,531,783 | ||||
| General Electric Capital Corp., 5.45%, 2013 | 1,963,000 | 2,003,917 | ||||
| General Electric Capital Corp., 5.375%, 2016 | 1,428,000 | 1,405,233 | ||||
| HSBC Finance Corp., 5.25%, 2011 | 2,367,000 | 2,372,690 | ||||
| ORIX Corp., 5.48%, 2011 | 4,077,000 | 3,770,247 | ||||
| $ | 16,538,981 | |||||
7
Table of Contents
Portfolio of Investments (unaudited) – continued
| Issuer | Shares/Par | Value ($) | ||||
| BONDS – continued | ||||||
| Food & Beverages – 0.4% | ||||||
| Diageo Finance B.V., 5.5%, 2013 | $ | 4,312,000 | $ | 4,365,822 | ||
| Dr. Pepper Snapple Group, Inc., 6.12%, 2013 (z) | 920,000 | 932,536 | ||||
| Dr. Pepper Snapple Group, Inc., 6.82%, 2018 (n) | 1,158,000 | 1,162,778 | ||||
| Kraft Foods, Inc., 6.125%, 2018 | 1,970,000 | 1,907,787 | ||||
| Miller Brewing Co., 5.5%, 2013 (n) | 5,763,000 | 5,889,700 | ||||
| $ | 14,258,623 | |||||
| Food & Drug Stores – 0.1% | ||||||
| CVS Caremark Corp., 6.125%, 2016 | $ | 2,078,000 | $ | 2,095,657 | ||
| Gaming & Lodging – 0.1% | ||||||
| Marriott International, Inc., 6.375%, 2017 | $ | 3,561,000 | $ | 3,385,172 | ||
| Wyndham Worldwide Corp., 6%, 2016 | 1,997,000 | 1,763,489 | ||||
| $ | 5,148,661 | |||||
| Insurance – 0.2% | ||||||
| American International Group, Inc., 6.25%, 2037 | $ | 3,077,000 | $ | 2,408,568 | ||
| ING Groep N.V., 5.775% to 2015, FRN to 2049 | 2,021,000 | 1,677,386 | ||||
| MetLife, Inc., 6.4%, 2036 | 2,881,000 | 2,515,456 | ||||
| Metropolitan Life Global Funding, 5.125%, 2013 (z) | 1,200,000 | 1,181,626 | ||||
| $ | 7,783,036 | |||||
| Insurance – Property & Casualty – 0.4% | ||||||
| Allstate Corp., 6.125%, 2032 | $ | 1,017,000 | $ | 949,499 | ||
| Allstate Corp., 5.55%, 2035 | 3,147,000 | 2,689,222 | ||||
| Chubb Corp., 6.375% to 2017, FRN to 2067 | 4,156,000 | 3,801,680 | ||||
| Fund American Cos., Inc., 5.875%, 2013 | 2,164,000 | 2,093,412 | ||||
| ZFS Finance USA Trust IV, 5.875% to 2012, FRN to 2032 (n) | 833,000 | 759,813 | ||||
| ZFS Finance USA Trust V, 6.5% to 2017, FRN to 2037 (n) | 3,930,000 | 3,430,128 | ||||
| $ | 13,723,754 | |||||
| International Market Quasi-Sovereign – 0.1% | ||||||
| Hydro-Quebec, 6.3%, 2011 | $ | 3,955,000 | $ | 4,206,720 | ||
| International Market Sovereign – 0.1% | ||||||
| Province of Ontario, 5%, 2011 | $ | 4,126,000 | $ | 4,277,610 | ||
| Machinery & Tools – 0.1% | ||||||
| Atlas Copco AB, 5.6%, 2017 (n) | $ | 3,117,000 | $ | 3,032,277 | ||
| Major Banks – 0.8% | ||||||
| Bank of America Corp., 5.49%, 2019 | $ | 1,260,000 | $ | 1,142,366 | ||
| BNP Paribas, 7.195% to 2037, FRN to 2049 (n) | 1,042,000 | 942,238 | ||||
| Commonwealth Bank, 5%, 2012 (n) | 3,659,000 | 3,689,823 | ||||
| DBS Capital Funding Corp., 7.657% to 2011, FRN to 2049 (n) | 1,866,000 | 1,886,670 | ||||
| MUFG Capital Finance 1 Ltd., 6.346% to 2016, FRN to 2049 | 3,547,000 | 3,074,511 | ||||
| Issuer | Shares/Par | Value ($) | ||||
| BONDS – continued | ||||||
| Major Banks – continued | ||||||
| Natixis S.A., 10% to 2018, FRN to 2049 (z) | $ | 3,841,000 | $ | 3,833,433 | ||
| PNC Funding Corp., 5.625%, 2017 | 2,078,000 | 1,937,754 | ||||
| Royal Bank of Scotland Group PLC, 6.99% to 2017, FRN to 2049 (n) | 750,000 | 675,021 | ||||
| UniCredito Italiano Capital Trust II, 9.2% to 2010, FRN to 2049 (n) | 1,719,000 | 1,762,553 | ||||
| Unicredito Luxembourg Finance S.A., 6%, 2017 (n) | 3,820,000 | 3,667,487 | ||||
| Wachovia Corp., 5.25%, 2014 | 7,433,000 | 6,920,777 | ||||
| $ | 29,532,633 | |||||
| Medical & Health Technology & Services – 0.2% | ||||||
| Baxter International, Inc., 5.9%, 2016 | $ | 2,228,000 | $ | 2,281,363 | ||
| Cardinal Health, Inc., 5.8%, 2016 | 1,498,000 | 1,466,102 | ||||
| HCA, Inc., 8.75%, 2010 | 174,000 | 176,175 | ||||
| Hospira, Inc., 5.55%, 2012 | 1,068,000 | 1,049,235 | ||||
| Hospira, Inc., 6.05%, 2017 | 3,636,000 | 3,508,984 | ||||
| $ | 8,481,859 | |||||
| Metals & Mining – 0.2% | ||||||
| ArcelorMittal, 6.125%, 2018 (z) | $ | 3,666,000 | $ | 3,582,621 | ||
| Vale Overseas Ltd., 6.25%, 2017 | 3,911,000 | 3,785,754 | ||||
| $ | 7,368,375 | |||||
| Mortgage Backed – 16.1% | ||||||
| Fannie Mae, 6.253%, 2011 | $ | 351,072 | $ | 364,847 | ||
| Fannie Mae, 6.33%, 2011 | 334,156 | 354,338 | ||||
| Fannie Mae, 4.791%, 2012 | 1,644,480 | 1,636,821 | ||||
| Fannie Mae, 4.01%, 2013 | 243,471 | 232,667 | ||||
| Fannie Mae, 4.019%, 2013 | 1,104,798 | 1,059,415 | ||||
| Fannie Mae, 4.751%, 2013 | 158,343 | 157,062 | ||||
| Fannie Mae, 4.845%, 2013 | 431,244 | 427,744 | ||||
| Fannie Mae, 5.37%, 2013 | 809,769 | 828,345 | ||||
| Fannie Mae, 4.545%, 2014 | 1,490,539 | 1,451,166 | ||||
| Fannie Mae, 4.63%, 2014 | 600,942 | 586,747 | ||||
| Fannie Mae, 4.849%, 2014 | 1,893,344 | 1,867,953 | ||||
| Fannie Mae, 4.871%, 2014 | 970,367 | 960,453 | ||||
| Fannie Mae, 4.925%, 2015 | 3,644,455 | 3,593,621 | ||||
| Fannie Mae, 4.94%, 2015 | 379,000 | 379,912 | ||||
| Fannie Mae, 5.19%, 2015 | 436,437 | 434,597 | ||||
| Fannie Mae, 5.45%, 2017 | 821,517 | 825,981 | ||||
| Fannie Mae, 5.5%, 2017-2038 | 162,673,204 | 161,493,323 | ||||
| Fannie Mae, 6%, 2017-2037 | 93,715,924 | 94,994,493 | ||||
| Fannie Mae, 4.5%, 2018-2035 | 20,528,915 | 19,659,643 | ||||
| Fannie Mae, 5%, 2018-2038 | 60,590,971 | 58,916,830 | ||||
| Fannie Mae, 4.88%, 2020 | 1,217,629 | 1,214,372 | ||||
| Fannie Mae, 7.5%, 2030-2032 | 397,605 | 428,070 | ||||
| Fannie Mae, 6.5%, 2031-2037 | 24,090,382 | 24,893,459 | ||||
| Freddie Mac, 6%, 2016-2037 | 38,752,539 | 39,344,301 | ||||
| Freddie Mac, 5%, 2017-2035 | 46,089,298 | 44,803,520 | ||||
| Freddie Mac, 4.5%, 2018-2035 | 14,022,271 | 13,589,419 | ||||
| Freddie Mac, 5.5%, 2019-2038 | 46,244,709 | 45,833,443 | ||||
| Freddie Mac, 6.5%, 2034-2038 | 12,783,799 | 13,212,225 | ||||
| Ginnie Mae, 6%, 2032-2038 | 11,819,928 | 12,020,357 | ||||
| Ginnie Mae, 4.5%, 2033-2034 | 2,039,227 | 1,899,769 | ||||
| Ginnie Mae, 5.5%, 2033-2038 | 21,043,830 | 20,985,059 | ||||
| Ginnie Mae, 5%, 2034 | 2,699,448 | 2,625,556 | ||||
| $ | 571,075,508 | |||||
8
Table of Contents
Portfolio of Investments (unaudited) – continued
| Issuer | Shares/Par | Value ($) | ||||
| BONDS – continued | ||||||
| Municipals – 0.3% | ||||||
| California Educational Facilities Authority Rev. (Stanford University), “T-1”, 5%, 2039 | $ | 4,615,000 | $ | 4,792,447 | ||
| Massachusetts Health & Educational Facilities Authority Rev. (Boston College), 5.5%, 2030 | 1,595,000 | 1,754,436 | ||||
| Massachusetts Health & Educational Facilities Authority Rev. (Boston College), 5.5%, 2035 | 2,535,000 | 2,781,072 | ||||
| $ | 9,327,955 | |||||
| Natural Gas – Pipeline – 0.3% | ||||||
| CenterPoint Energy, Inc., 7.875%, 2013 | $ | 2,119,000 | $ | 2,268,398 | ||
| Enterprise Products Operating LLC, 6.5%, 2019 | 3,360,000 | 3,377,808 | ||||
| Kinder Morgan Energy Partners LP, 6.75%, 2011 | 1,866,000 | 1,923,430 | ||||
| Kinder Morgan Energy Partners LP, 7.4%, 2031 | 219,000 | 225,069 | ||||
| Kinder Morgan Energy Partners LP, 7.75%, 2032 | 1,000,000 | 1,082,341 | ||||
| Spectra Energy Capital LLC, 8%, 2019 | 1,694,000 | 1,853,072 | ||||
| $ | 10,730,118 | |||||
| Network & Telecom – 0.7% | ||||||
| AT&T, Inc., 6.5%, 2037 | $ | 2,859,000 | $ | 2,766,995 | ||
| BellSouth Corp., 6.55%, 2034 | 2,642,000 | 2,551,585 | ||||
| Deutsche Telekom International Finance B.V., 5.75%, 2016 | 3,810,000 | 3,717,467 | ||||
| Telecom Italia Capital, 5.25%, 2013 | 2,176,000 | 2,055,550 | ||||
| Telefonica Europe B.V., 7.75%, 2010 | 1,176,000 | 1,239,448 | ||||
| TELUS Corp., 8%, 2011 | 3,887,000 | 4,173,340 | ||||
| Verizon New York, Inc., 6.875%, 2012 | 6,670,000 | 6,956,116 | ||||
| $ | 23,460,501 | |||||
| Oil Services – 0.1% | ||||||
| Weatherford International Ltd., 6.35%, 2017 | $ | 951,000 | $ | 963,249 | ||
| Weatherford International Ltd., 6%, 2018 | 2,668,000 | 2,633,113 | ||||
| $ | 3,596,362 | |||||
| Oils – 0.1% | ||||||
| Valero Energy Corp., 6.875%, 2012 | $ | 4,222,000 | $ | 4,382,618 | ||
| Other Banks & Diversified Financials – 0.4% | ||||||
| Citigroup, Inc., 5%, 2014 | $ | 2,679,000 | $ | 2,481,193 | ||
| Nordea Bank AB, 5.424% to 2015, FRN to 2049 (n) | 1,466,000 | 1,258,724 | ||||
| UBS Preferred Funding Trust V, 6.243% to 2016, FRN to 2049 | 4,738,000 | 4,151,511 | ||||
| UFJ Finance Aruba AEC, 6.75%, 2013 | 2,807,000 | 2,948,869 | ||||
| Woori Bank, 6.125% to 2011, FRN to 2016 (n) | 4,966,000 | 4,809,854 | ||||
| $ | 15,650,151 | |||||
| Pharmaceuticals – 0.1% | ||||||
| Allergan, Inc., 5.75%, 2016 | $ | 4,097,000 | $ | 4,112,073 | ||
| Issuer | Shares/Par | Value ($) | ||||
| BONDS – continued | ||||||
| Pharmaceuticals – continued | ||||||
| Glaxosmithkline Capital, Inc., 4.85%, 2013 | $ | 1,198,000 | $ | 1,196,385 | ||
| $ | 5,308,458 | |||||
| Pollution Control – 0.1% | ||||||
| Waste Management, Inc., 7.375%, 2010 | $ | 1,697,000 | $ | 1,772,654 | ||
| Railroad & Shipping – 0.2% | ||||||
| Burlington Northern Santa Fe Corp., 5.65%, 2017 | $ | 4,244,000 | $ | 4,148,616 | ||
| CSX Corp., 6.75%, 2011 | 262,000 | 271,525 | ||||
| CSX Corp., 7.9%, 2017 | 1,754,000 | 1,864,695 | ||||
| $ | 6,284,836 | |||||
| Real Estate – 0.5% | ||||||
| Boston Properties, Inc., REIT, 5%, 2015 | $ | 1,871,000 | $ | 1,716,315 | ||
| HRPT Properties Trust, REIT, 6.25%, 2016 | 3,320,000 | 3,047,564 | ||||
| HRPT Properties Trust, REIT, 6.65%, 2018 | 1,620,000 | 1,488,203 | ||||
| Kimco Realty Corp., REIT, 6%, 2012 | 936,000 | 911,290 | ||||
| ProLogis, REIT, 5.75%, 2016 | 3,311,000 | 3,118,283 | ||||
| Simon Property Group, Inc., REIT, 5.1%, 2015 | 4,179,000 | 3,781,414 | ||||
| Simon Property Group, Inc., REIT, 5.875%, 2017 | 1,880,000 | 1,805,315 | ||||
| Vornado Realty Trust, REIT, 4.75%, 2010 | 1,708,000 | 1,611,611 | ||||
| $ | 17,479,995 | |||||
| Retailers – 0.2% | ||||||
| Federated Retail Holdings, Inc., 5.35%, 2012 | $ | 921,000 | $ | 855,801 | ||
| Home Depot, Inc., 5.25%, 2013 | 1,662,000 | 1,594,041 | ||||
| Limited Brands, Inc., 5.25%, 2014 | 2,165,000 | 1,831,348 | ||||
| Wal-Mart Stores, Inc., 5.25%, 2035 | 3,606,000 | 3,132,943 | ||||
| $ | 7,414,133 | |||||
| Supermarkets – 0.0% | ||||||
| Kroger Co., 5%, 2013 | $ | 1,175,000 | $ | 1,155,763 | ||
| Kroger Co., 6.4%, 2017 | 559,000 | 570,156 | ||||
| $ | 1,725,919 | |||||
| Supranational – 0.7% | ||||||
| European Investment Bank, 5.125%, 2017 | $ | 23,941,000 | $ | 25,121,459 | ||
| Telecommunications – Wireless – 0.2% | ||||||
| Cingular Wireless LLC, 6.5%, 2011 | $ | 1,498,000 | $ | 1,557,006 | ||
| Nextel Communications, Inc., 5.95%, 2014 | 3,862,000 | 3,099,255 | ||||
| Vodafone Group PLC, 5.625%, 2017 | 809,000 | 779,294 | ||||
| $ | 5,435,555 | |||||
| Tobacco – 0.1% | ||||||
| Philip Morris International, Inc., 4.875%, 2013 | $ | 4,770,000 | $ | 4,685,700 | ||
9
Table of Contents
Portfolio of Investments (unaudited) – continued
| Issuer | Shares/Par | Value ($) | ||||
| BONDS – continued | ||||||
| U.S. Government Agencies – 1.4% | ||||||
| Fannie Mae, 6.625%, 2009 | $ | 6,564,000 | $ | 6,848,904 | ||
| Freddie Mac, 4.625%, 2012 | 13,500,000 | 13,834,166 | ||||
| Freddie Mac, 5.5%, 2017 | 16,600,000 | 17,554,898 | ||||
| Small Business Administration, 4.77%, 2024 | 854,437 | 835,344 | ||||
| Small Business Administration, 4.99%, 2024 | 1,430,942 | 1,402,665 | ||||
| Small Business Administration, 5.18%, 2024 | 1,435,057 | 1,435,419 | ||||
| Small Business Administration, 5.09%, 2025 | 2,076,681 | 2,037,849 | ||||
| Small Business Administration, 5.11%, 2025 | 5,872,397 | 5,782,325 | ||||
| Small Business Administration, 5.39%, 2025 | 1,420,613 | 1,429,884 | ||||
| $ | 51,161,454 | |||||
| U.S. Treasury Obligations – 9.2% | ||||||
| U.S. Treasury Bonds, 4.75%, 2017 | $ | 3,070,000 | $ | 3,252,281 | ||
| U.S. Treasury Bonds, 8%, 2021 | 2,560,000 | 3,472,200 | ||||
| U.S. Treasury Bonds, 6.25%, 2023 | 7,156,000 | 8,513,966 | ||||
| U.S. Treasury Bonds, 6%, 2026 | 11,019,000 | 12,905,144 | ||||
| U.S. Treasury Bonds, 6.75%, 2026 | 8,541,000 | 10,811,702 | ||||
| U.S. Treasury Bonds, 5.375%, 2031 | 28,807,000 | 32,007,285 | ||||
| U.S. Treasury Bonds, 4.5%, 2036 | 8,333,000 | 8,273,761 | ||||
| U.S. Treasury Notes, 4.875%, 2009 | 138,666,000 | 142,371,017 | ||||
| U.S. Treasury Notes, 6.5%, 2010 | 9,219,000 | 9,809,588 | ||||
| U.S. Treasury Notes, 5.125%, 2011 | 63,707,000 | 67,708,564 | ||||
| U.S. Treasury Notes, 4.25%, 2013 | 7,770,000 | 8,106,293 | ||||
| U.S. Treasury Notes, 4.25%, 2013 | 7,011,000 | 7,316,638 | ||||
| U.S. Treasury Notes, 4.5%, 2015 | 1,737,000 | 1,829,278 | ||||
| U.S. Treasury Notes, 9.875%, 2015 | 2,793,000 | 3,887,725 | ||||
| U.S. Treasury Notes, 4.875%, 2016 | 6,300,000 | 6,754,287 | ||||
| $ | 327,019,729 | |||||
| Utilities – Electric Power – 1.5% | ||||||
| Bruce Mansfield Unit, 6.85%, 2034 | $ | 4,989,000 | $ | 5,049,076 | ||
| E.On International Finance B.V., 5.8%, 2018 (z) | 3,830,000 | 3,757,257 | ||||
| EDP Finance B.V., 6%, 2018 (n) | 4,110,000 | 4,092,615 | ||||
| Enel Finance International S.A., 6.25%, 2017 (n) | 4,020,000 | 4,067,729 | ||||
| Issuer | Shares/Par | Value ($) | |||||
| BONDS – continued | |||||||
| Utilities – Electric Power – continued | |||||||
| Exelon Generation Co. LLC, 6.95%, 2011 | $ | 6,028,000 | $ | 6,230,366 | |||
| Exelon Generation Co. LLC, 6.2%, 2017 | 10,390,000 | 10,119,870 | |||||
| FirstEnergy Corp., 6.45%, 2011 | 4,413,000 | 4,528,175 | |||||
| Israel Electric Corp. Ltd., 7.25%, 2019 (z) | 2,205,000 | 2,250,780 | |||||
| MidAmerican Energy Holdings Co., 5.875%, 2012 | 477,000 | 490,613 | |||||
| MidAmerican Energy Holdings Co., 6.125%, 2036 | 3,439,000 | 3,302,351 | |||||
| MidAmerican Funding LLC, 6.927%, 2029 | 387,000 | 418,063 | |||||
| Oncor Electric Delivery Co., 7%, 2022 | 3,162,000 | 3,083,314 | |||||
| Pacific Gas & Electric Co., 4.8%, 2014 | 719,000 | 700,606 | |||||
| PSEG Power LLC, 6.95%, 2012 | 3,745,000 | 3,928,692 | |||||
| PSEG Power LLC, 5.5%, 2015 | 1,583,000 | 1,524,394 | |||||
| System Energy Resources, Inc., 5.129%, 2014 (n) | 981,018 | 953,589 | |||||
| Waterford 3 Funding Corp., 8.09%, 2017 | 207,719 | 202,301 | |||||
| $ | 54,699,791 | ||||||
| Total Bonds (Identified Cost, $1,446,994,086) | $ | 1,427,966,786 | |||||
| REPURCHASE AGREEMENTS – 1.5% | |||||||
| Merrill Lynch, 2.50%, dated 6/30/08, due 7/01/08, total to be received $53,949,746 (secured by U.S. Treasury and Federal Agency obligations and Mortgage Backed securities in a jointly traded account), at Cost | $ | 53,946,000 | $ | 53,946,000 | |||
| COLLATERAL FOR SECURITIES LOANED – 1.8% | |||||||
| Navigator Securities Lending Prime Portfolio, at Cost and Net Asset Value | 64,000,629 | $ | 64,000,629 | ||||
| Total Investments (Identified Cost, $3,578,191,991) | $ | 3,608,933,706 | |||||
| OTHER ASSETS, LESS LIABILITIES – (1.4)% | (51,234,170 | ) | |||||
| Net Assets – 100.0% | $ | 3,557,699,536 | |||||
10
Table of Contents
Portfolio of Investments (unaudited) – continued
| (a) | Non-income producing security. |
| (i) | Interest only security for which the fund receives interest on notional principal (Par amount). Par amount shown is the notional principal and does not reflect the cost of the security. |
| (l) | All or a portion of this security is on loan. |
| (n) | Securities exempt from registration under Rule 144A of the Securities Act of 1933. These securities may be sold in the ordinary course of business in transactions exempt from registration, normally to qualified institutional buyers. At period end, the aggregate value of these securities was $4,193,774 representing 1.3% of net assets. |
| (w) | When-issued security. At June 30, 2008, the fund had sufficient cash and/or securities at least equal to the value of the when-issued security. |
| (z) | Restricted securities are not registered under the Securities Act of 1933 and are subject to legal restrictions on resale. These securities generally may be resold in transactions exempt from registration or to the public if the securities are subsequently registered. Disposal of these securities may involve time-consuming negotiations and prompt sale at an acceptable price may be difficult. The fund holds the following restricted securities: |
| Restricted Securities | Acquisition Date | Cost | Current Market Value | |||
| ArcelorMittal, 6.125%, 2018 | 5/27/08 | $3,650,273 | $3,582,621 | |||
| Bayview Financial Revolving Mortgage Loan Trust, FRN, 3.182%, 2040 | 2/28/06 | 3,009,000 | 2,307,787 | |||
| Dr. Pepper Snapple Group, Inc., 6.12%, 2013 | 4/30/08 | 919,880 | 932,536 | |||
| E.On International Finance B.V., 5.8%, 2018 | 4/22/08 | 3,813,837 | 3,757,257 | |||
| Israel Electric Corp. Ltd., 7.25%, 2019 | 5/07/08 | 2,201,274 | 2,250,780 | |||
| Metropolitan Life Global Funding, 5.125%, 2013 | 4/10/08 | 1,199,112 | 1,181,626 | |||
| Natixis S.A., 10% to 2018, FRN to 2049 | 4/30/08 | 3,841,000 | 3,833,433 | |||
| Spirit Master Funding LLC, 5.05%, 2023 | 1/01/05 | 2,349,002 | 1,832,299 | |||
| Total Restricted Securities | $19,678,339 | |||||
| % of Net Assets | 0.6% |
The following abbreviations are used in this report and are defined:
| ADR | American Depository Receipt |
| FRN | Floating Rate Note. Interest rate resets periodically and may not be the rate reported at period end. |
| GDR | Global Depository Receipt |
| REIT | Real Estate Investment Trust |
See Notes to Financial Statements
11
Table of Contents
FINANCIAL STATEMENTS | STATEMENT OF ASSETS AND LIABILITIES (unaudited)
This statement represents your fund’s balance sheet, which details the assets and liabilities comprising the total value of the fund.
At 6/30/08 | |||||
Assets | |||||
Investments, at value, including $64,499,619 of securities on loan (identified cost, $3,578,191,991) | $3,608,933,706 | ||||
Foreign currency, at value (identified cost, $18) | 18 | ||||
Receivable for investments sold | 6,369,340 | ||||
Receivable for fund shares sold | 640,829 | ||||
Interest and dividends receivable | 16,812,893 | ||||
Other assets | 23,021 | ||||
Total assets | $3,632,779,807 | ||||
Liabilities | |||||
Payable to custodian | $609,905 | ||||
Payable for investments purchased | 6,615,539 | ||||
Payable for fund shares reacquired | 3,196,191 | ||||
Collateral for securities loaned, at value (c) | 64,000,629 | ||||
Payable to affiliates | |||||
Management fee | 285,523 | ||||
Shareholder servicing costs | 6,662 | ||||
Distribution fees | 27,501 | ||||
Administrative services fee | 4,831 | ||||
Payable for independent trustees’ compensation | 7,892 | ||||
Accrued expenses and other liabilities | 325,598 | ||||
Total liabilities | $75,080,271 | ||||
Net assets | $3,557,699,536 | ||||
Net assets consist of | |||||
Paid-in capital | $3,654,132,598 | ||||
Unrealized appreciation (depreciation) on investments and translation of assets and liabilities in foreign currencies | 30,739,791 | ||||
Accumulated distributions in excess of net realized gain on investments and foreign currency transactions | (176,710,913 | ) | |||
Undistributed net investment income | 49,538,060 | ||||
Net assets | $3,557,699,536 | ||||
Shares of beneficial interest outstanding | 193,379,457 | ||||
Initial Class shares | |||||
Net assets | $2,551,494,622 | ||||
Shares outstanding | 138,276,883 | ||||
Net asset value per share | $18.45 | ||||
Service Class shares | |||||
Net assets | $1,006,204,914 | ||||
Shares outstanding | 55,102,574 | ||||
Net asset value per share | $18.26 |
| (c) | Non-cash collateral is not included. |
See Notes to Financial Statements
12
Table of Contents
FINANCIAL STATEMENTS | STATEMENT OF OPERATIONS (unaudited)
This statement describes how much your fund earned in investment income and accrued in expenses. It also describes any gains and/or losses generated by fund operations.
Six months ended 6/30/08 | ||||||
| Net investment income | ||||||
Income | ||||||
Interest | $40,108,990 | |||||
Dividends | 25,732,052 | |||||
Foreign taxes withheld | (375,194 | ) | ||||
Total investment income | $65,465,848 | |||||
Expenses | ||||||
Management fee | $14,001,793 | |||||
Distribution fees | 1,308,281 | |||||
Shareholder servicing costs | 339,064 | |||||
Administrative services fee | 231,736 | |||||
Independent trustees’ compensation | 28,252 | |||||
Custodian fee | 157,457 | |||||
Shareholder communications | 125,385 | |||||
Auditing fees | 29,583 | |||||
Legal fees | 29,921 | |||||
Miscellaneous | 63,215 | |||||
Total expenses | $16,314,687 | |||||
Reduction of expenses by investment adviser | (388,051 | ) | ||||
Net expenses | $15,926,636 | |||||
Net investment income | $49,539,212 | |||||
Realized and unrealized gain (loss) on investments | ||||||
Realized gain (loss) (identified cost basis) | ||||||
Investment transactions | $(87,156,930 | ) | ||||
Foreign currency transactions | (11,795 | ) | ||||
Net realized gain (loss) on investments and foreign currency transactions | $(87,168,725 | ) | ||||
Change in unrealized appreciation (depreciation) | ||||||
Investments | $(231,633,727 | ) | ||||
Translation of assets and liabilities in foreign currencies | (2,725 | ) | ||||
Net unrealized gain (loss) on investments and foreign currency translation | $(231,636,452 | ) | ||||
Net realized and unrealized gain (loss) on investments and foreign currency | $(318,805,177 | ) | ||||
Change in net assets from operations | $(269,265,965 | ) |
See Notes to Financial Statements
13
Table of Contents
FINANCIAL STATEMENTS | STATEMENTS OF CHANGES IN NET ASSETS
These statements describe the increases and/or decreases in net assets resulting from operations, any distributions, and any shareholder transactions.
| Six months ended 6/30/08 | | Year ended 12/31/07 | | |||
Change in net assets | (unaudited | ) | ||||
From operations | ||||||
Net investment income | $49,539,212 | $101,570,670 | ||||
Net realized gain (loss) on investments and foreign currency transactions | (87,168,725 | ) | 171,067,220 | |||
Net unrealized gain (loss) on investments and foreign currency translation | (231,636,452 | ) | (111,748,485 | ) | ||
Change in net assets from operations | $(269,265,965 | ) | $160,889,405 | |||
Distributions declared to shareholders | ||||||
From net investment income | ||||||
Initial Class | $(78,067,283 | ) | $(75,193,567 | ) | ||
Service Class | (28,003,206 | ) | (26,404,691 | ) | ||
From net realized gain on investments | ||||||
Initial Class | (154,626,730 | ) | (71,893,992 | ) | ||
Service Class | (61,063,230 | ) | (27,523,742 | ) | ||
Total distributions declared to shareholders | $(321,760,449 | ) | $(201,015,992 | ) | ||
Change in net assets from fund share transactions | $148,260,523 | $110,243,370 | ||||
Total change in net assets | $(442,765,891 | ) | $70,116,783 | |||
Net assets | ||||||
At beginning of period | 4,000,465,427 | 3,930,348,644 | ||||
At end of period (including undistributed net investment income of $49,538,060 and | $3,557,699,536 | $4,000,465,427 |
See Notes to Financial Statements
14
Table of Contents
FINANCIAL STATEMENTS | FINANCIAL HIGHLIGHTS
The financial highlights table is intended to help you understand the fund’s financial performance for the semiannual period and the past 5 fiscal years. Certain information reflects financial results for a single fund share. The total returns in the table represent the rate by which an investor would have earned (or lost) on an investment in the fund share class (assuming reinvestment of all distributions) held for the entire period.
| Initial Class | Six months ended 6/30/08 | Years ended 12/31 | ||||||||||||||||
| 2007 | 2006 | 2005 | 2004 | 2003 | ||||||||||||||
| (unaudited) | ||||||||||||||||||
Net asset value, beginning of period | $21.68 | $21.90 | $20.69 | $21.43 | $19.58 | $17.14 | ||||||||||||
Income (loss) from investment operations | ||||||||||||||||||
Net investment income (d) | $0.27 | $0.56 | $0.56 | $0.48 | $0.46 | $0.38 | ||||||||||||
Net realized and unrealized gain (loss) on | (1.69 | ) | 0.34 | 1.81 | 0.06 | 1.72 | 2.37 | |||||||||||
Total from investment operations | $(1.42 | ) | $0.90 | $2.37 | $0.54 | $2.18 | $2.75 | |||||||||||
Less distributions declared to shareholders | ||||||||||||||||||
From net investment income | $(0.61 | ) | $(0.57 | ) | $(0.50 | ) | $(0.43 | ) | $(0.33 | ) | $(0.31 | ) | ||||||
From net realized gain on investments | (1.20 | ) | (0.55 | ) | (0.66 | ) | (0.85 | ) | — | — | ||||||||
Total distributions declared to shareholders | $(1.81 | ) | $(1.12 | ) | $(1.16 | ) | $(1.28 | ) | $(0.33 | ) | $(0.31 | ) | ||||||
Net asset value, end of period | $18.45 | $21.68 | $21.90 | $20.69 | $21.43 | $19.58 | ||||||||||||
Total return (%) (k)(r)(s) | (6.83 | )(n) | 4.17 | 11.95 | 2.82 | 11.32 | 16.32 | |||||||||||
| Ratios (%) (to average net assets) and Supplemental data: | ||||||||||||||||||
Expenses before expense reductions (f) | 0.80 | (a) | 0.83 | 0.85 | 0.84 | 0.83 | 0.84 | |||||||||||
Expenses after expense reductions (f) | 0.78 | (a) | 0.80 | 0.83 | 0.84 | 0.83 | N/A | |||||||||||
Net investment income | 2.73 | (a) | 2.55 | 2.68 | 2.32 | 2.28 | 2.14 | |||||||||||
Portfolio turnover | 25 | 60 | 51 | 46 | 57 | 53 | ||||||||||||
Net assets at end of period (000 Omitted) | $2,551,495 | $2,887,256 | $2,859,830 | $2,572,096 | $2,406,156 | $1,790,999 | ||||||||||||
See Notes to Financial Statements
15
Table of Contents
Financial Highlights – continued
| Service Class | Six months | Years ended 12/31 | ||||||||||||||||
| 2007 | 2006 | 2005 | 2004 | 2003 | ||||||||||||||
| (unaudited) | ||||||||||||||||||
Net asset value, beginning of period | $21.44 | $21.67 | $20.50 | $21.25 | $19.44 | $17.05 | ||||||||||||
Income (loss) from investment operations | ||||||||||||||||||
Net investment income (d) | $0.24 | $0.50 | $0.50 | $0.42 | $0.41 | $0.33 | ||||||||||||
Net realized and unrealized gain (loss) on | (1.67 | ) | 0.34 | 1.78 | 0.07 | 1.70 | 2.36 | |||||||||||
Total from investment operations | $(1.43 | ) | $0.84 | $2.28 | $0.49 | $2.11 | $2.69 | |||||||||||
Less distributions declared to shareholders | ||||||||||||||||||
From net investment income | $(0.55 | ) | $(0.52 | ) | $(0.45 | ) | $(0.39 | ) | $(0.30 | ) | $(0.30 | ) | ||||||
From net realized gain on investments | (1.20 | ) | (0.55 | ) | (0.66 | ) | (0.85 | ) | — | — | ||||||||
Total distributions declared to shareholders | $(1.75 | ) | $(1.07 | ) | $(1.11 | ) | $(1.24 | ) | $(0.30 | ) | $(0.30 | ) | ||||||
Net asset value, end of period | $18.26 | $21.44 | $21.67 | $20.50 | $21.25 | $19.44 | ||||||||||||
Total return (%) (k)(r)(s) | (6.93 | )(n) | 3.94 | 11.62 | 2.60 | 11.03 | 16.00 | |||||||||||
| Ratios (%) (to average net assets) and Supplemental data: | ||||||||||||||||||
Expenses before expense reductions (f) | 1.05 | (a) | 1.08 | 1.10 | 1.09 | 1.08 | 1.09 | |||||||||||
Expenses after expense reductions (f) | 1.03 | (a) | 1.05 | 1.09 | 1.09 | 1.08 | N/A | |||||||||||
Net investment income | 2.48 | (a) | 2.30 | 2.44 | 2.08 | 2.04 | 1.87 | |||||||||||
Portfolio turnover | 25 | 60 | 51 | 46 | 57 | 53 | ||||||||||||
Net assets at end of period (000 Omitted) | $1,006,205 | $1,113,209 | $1,070,518 | $865,499 | $637,055 | $394,080 | ||||||||||||
| (a) | Annualized. |
| (d) | Per share data is based on average shares outstanding. |
| (f) | Ratios do not reflect reductions from fees paid indirectly, if applicable. |
| (k) | The total return does not reflect expenses that apply to separate accounts. Inclusion of these charges would reduce the total return figures for all periods shown. |
| (n) | Not annualized. |
| (r) | Certain expenses have been reduced without which performance would have been lower. |
| (s) | From time to time the fund may receive proceeds from litigation settlements, without which performance would be lower. |
See Notes to Financial Statements
16
Table of Contents
NOTES TO FINANCIAL STATEMENTS (unaudited)
| (1) | Business and Organization |
MFS Total Return Series (the fund) is a series of MFS Variable Insurance Trust (the trust). The trust is organized as a Massachusetts business trust and is registered under the Investment Company Act of 1940, as amended, as an open-end management investment company. The shareholders of each series of the trust are separate accounts of insurance companies, which offer variable annuity and/or life insurance products, and qualified retirement and pension plans.
| (2) | Significant Accounting Policies |
General – The preparation of financial statements in conformity with U.S. generally accepted accounting principles requires management to make estimates and assumptions that affect the reported amounts of assets and liabilities, and disclosure of contingent assets and liabilities at the date of the financial statements and the reported amounts of revenues and expenses during the reporting period. Actual results could differ from those estimates. The fund may invest a significant portion of its assets in mortgage-backed securities. The value of mortgage-backed securities may depend, in part, on the issuer’s or borrower’s credit quality or ability to pay principal and interest when due and may fall if an issuer or borrower defaults on its obligation to pay principal or interest or if the instrument’s credit rating is downgraded by a credit rating agency. U.S. Government securities not supported as to the payment of principal or interest by the U.S. Treasury, such as those issued by Fannie Mae, Freddie Mac, and the Federal Home Loan Banks, are subject to greater credit risk than are U.S. Government securities supported by the U.S. Treasury, such as those issued by Ginnie Mae. The fund can invest in foreign securities, including securities of emerging market issuers. Investments in foreign securities are vulnerable to the effects of changes in the relative values of the local currency and the U.S. dollar and to the effects of changes in each country’s legal, political, and economic environment. The markets of emerging markets countries are generally more volatile than the markets of developed countries with more mature economies. All of the risks of investing in foreign securities previously described are heightened when investing in emerging markets countries.
In March 2008, FASB Statement No. 161, Disclosures about Derivative Instruments and Hedging Activities (the “Standard”) was issued, and is effective for financial statements issued for fiscal years and interim periods beginning after November 15, 2008. This Standard provides enhanced disclosures about the fund’s use of and accounting for derivative instruments and the effect of derivative instruments on the fund’s results of operations and financial position. Management is evaluating the application of the Standard to the fund, and has not at this time determined the impact, if any, resulting from the adoption of this Standard on the fund’s financial statements.
Investment Valuations – Equity securities, including restricted equity securities, are generally valued at the last sale or official closing price as reported by an independent pricing service on the market or exchange on which they are primarily traded. For securities for which there were no sales reported that day, equity securities are generally valued at the last quoted daily bid quotation as reported by an independent pricing service on the market or exchange on which they are primarily traded. For securities held short for which there were no sales reported for the day, the position is generally valued at the last quoted daily ask quotation as reported by an independent pricing service on the market or exchange on which such securities are primarily traded. Debt instruments and floating rate loans (other than short-term instruments), including restricted debt instruments, are generally valued at an evaluated or composite bid as reported by an independent pricing service. Short-term instruments with a maturity at issuance of 60 days or less may be valued at amortized cost, which approximates market value. Open-end investment companies are generally valued at net asset value per share. Securities and other assets generally valued on the basis of information from an independent pricing service may also be valued at a broker-dealer bid quotation. Values obtained from pricing services can utilize both dealer-supplied valuations and electronic data processing techniques, which take into account factors such as institutional-size trading in similar groups of securities, yield, quality, coupon rate, maturity, type of issue, trading characteristics, and other market data. The values of foreign securities and other assets and liabilities expressed in foreign currencies are converted to U.S. dollars using the mean of bid and asked prices for rates reported by an independent pricing service.
The Board of Trustees has delegated primary responsibility for determining or causing to be determined the value of the fund’s investments (including any fair valuation) to the adviser pursuant to valuation policies and procedures approved by the Board. If the adviser determines that reliable market quotations are not readily available, investments are valued at fair value as determined in good faith by the adviser in accordance with such procedures under the oversight of the Board of Trustees. Under the fund’s valuation policies and procedures, market quotations are not considered to be readily available for most types of debt instruments and floating rate loans and many types of derivatives. These investments are generally valued at fair value based on information from independent pricing services. In addition, investments may be valued at fair value if the adviser determines that an investment’s value has been materially affected by events occurring after the close of the exchange or market on which the investment is principally traded (such as foreign exchange or market) and prior to the determination of the fund’s net asset value, or after the halting of trading of a specific security where trading does not resume prior to the close
17
Table of Contents
Notes to Financial Statements (unaudited) – continued
of the exchange or market on which the security is principally traded. Events that occur on a frequent basis after foreign markets close (such as developments in foreign markets and significant movements in the U.S. markets) and prior to the determination of the fund’s net asset value may be deemed to have a material affect on the value of securities traded in foreign markets. Accordingly, the fund’s foreign equity securities may often be valued at fair value. The adviser may rely on independent pricing services or other information (such as the correlation with price movements of similar securities in the same or other markets; the type, cost and investment characteristics of the security; the business and financial condition of the issuer; and trading and other market data) to assist in determining whether to fair value and at what value to fair value an investment. The value of an investment for purposes of calculating the fund’s net asset value can differ depending on the source and method used to determine value. When fair valuation is used, the value of investments used to determine the fund’s net asset value may differ from quoted or published prices for the same investments.
The fund adopted FASB Statement No. 157, Fair Value Measurements (the “Statement”) in this reporting period. This Statement provides a single definition of fair value, a hierarchy for measuring fair value and expanded disclosures about fair value measurements.
Various inputs are used in determining the value of the fund’s assets or liabilities carried at market value. These inputs are categorized into three broad levels. Level 1 includes quoted prices in active markets for identical assets or liabilities. Level 2 includes other significant observable market-based inputs (including quoted prices for similar securities, interest rates, prepayment speed, and credit risk). Level 3 includes unobservable inputs, which may include the adviser’s own assumptions in determining the fair value of investments. Other financial instruments are derivative instruments not reflected in total investments, such as futures, forwards, swap contracts and written options, which are valued at the unrealized appreciation/depreciation on the instrument. The following is a summary of the levels used as of June 30, 2008 in valuing the fund’s assets or liabilities carried at market value:
| Level 1 | Level 2 | Level 3 | Total | |||||
| Investments in Securities | $2,004,661,012 | $1,604,272,694 | $— | $3,608,933,706 | ||||
| Other Financial Instruments | $— | $— | $— | $— |
Repurchase Agreements – The fund may enter into repurchase agreements with institutions that the fund’s investment adviser has determined are creditworthy. Each repurchase agreement is recorded at cost. The fund requires that the securities collateral in a repurchase transaction be transferred to a custodian in a manner sufficient to enable the fund to obtain those securities in the event of a default under the repurchase agreement. The fund monitors, on a daily basis, the value of the collateral to ensure that its value, including accrued interest, is greater than amounts owed to the fund under each such repurchase agreement. The fund and other funds managed by Massachusetts Financial Services Company (MFS), may utilize a joint trading account for the purpose of entering into one or more repurchase agreements.
Foreign Currency Translation – Purchases and sales of foreign investments, income, and expenses are converted into U.S. dollars based upon currency exchange rates prevailing on the respective dates of such transactions. Gains and losses attributable to foreign currency exchange rates on sales of securities are recorded for financial statement purposes as net realized gains and losses on investments. Gains and losses attributable to foreign exchange rate movements on income and expenses are recorded for financial statement purposes as foreign currency transaction gains and losses. That portion of both realized and unrealized gains and losses on investments that results from fluctuations in foreign currency exchange rates is not separately disclosed.
Security Loans – State Street Bank and Trust Company (“State Street”), as lending agent, may loan the securities of the fund to certain qualified institutions (the “Borrowers”) approved by the fund. The loans are collateralized at all times by cash and/or U.S. Treasury and federal agency obligations in an amount at least equal to the market value of the securities loaned. State Street provides the fund with indemnification against Borrower default. The fund bears the risk of loss with respect to the investment of cash collateral. On loans collateralized by cash, the cash collateral is invested in a money market fund or short-term securities. A portion of the income generated upon investment of the collateral is remitted to the Borrowers, and the remainder is allocated between the fund and the lending agent. On loans collateralized by U.S. Treasury and/or federal agency obligations, a fee is received from the Borrower, and is allocated between the fund and the lending agent. Net income from securities lending is included in interest income on the Statement of Operations. The dividend and interest income earned on the securities loaned is accounted for in the same manner as other dividend and interest income.
At June 30, 2008, the value of securities loaned was $64,499,619. These loans were collateralized by cash of $64,000,629 and U.S. Treasury obligations of $2,099,301.
Indemnifications – Under the fund’s organizational documents, its officers and trustees may be indemnified against certain liabilities and expenses arising out of the performance of their duties to the fund. Additionally, in the normal course of business, the fund enters into agreements with service providers that may contain indemnification clauses. The fund’s
18
Table of Contents
Notes to Financial Statements (unaudited) – continued
maximum exposure under these agreements is unknown as this would involve future claims that may be made against the fund that have not yet occurred.
Investment Transactions and Income – Investment transactions are recorded on the trade date. Some securities may be purchased on a “when-issued” or “forward delivery” basis, which means that the securities will be delivered to the fund at a future date, usually beyond customary settlement time. Interest income is recorded on the accrual basis. All premium and discount is amortized or accreted for financial statement purposes in accordance with U.S. generally accepted accounting principles. Dividends received in cash are recorded on the ex-dividend date. Certain dividends from foreign securities will be recorded when the fund is informed of the dividend if such information is obtained subsequent to the ex-dividend date. Dividend and interest payments received in additional securities are recorded on the ex-dividend or ex-interest date in an amount equal to the value of the security on such date.
The fund may receive proceeds from litigation settlements. Any proceeds received from litigation involving portfolio holdings are reflected in the Statement of Operations in realized gain/loss if the security has been disposed of by the fund or in unrealized gain/loss if the security is still held by the fund. Any other proceeds from litigation not related to portfolio holdings are reflected as other income in the Statement of Operations.
Fees Paid Indirectly – The fund’s custody fee may be reduced according to an arrangement that measures the value of cash deposited with the custodian by the fund. For the six months ended June 30, 2008, custody fees were not reduced.
Tax Matters and Distributions – The fund intends to qualify as a regulated investment company, as defined under Subchapter M of the Internal Revenue Code, and to distribute all of its taxable income, including realized capital gains. As a result, no provision for federal income tax is required. The fund adopted the provisions of FASB Interpretation No. 48, Accounting for Uncertainty in Income Taxes (“the Interpretation”). The Interpretation prescribes a minimum threshold for financial statement recognition of the benefit of a tax position taken or expected to be taken in a tax return. There was no impact resulting from the adoption of this Interpretation on the fund’s financial statements. Each of the fund’s federal tax returns for the prior three fiscal years remains subject to examination by the Internal Revenue Service. It is the fund’s policy to record interest and penalty charges on underpaid taxes associated with its tax positions as interest expense and miscellaneous expense, respectively. No such charges were recorded in the current financial statements. Foreign taxes, if any, have been accrued by the fund in the accompanying financial statements.
Distributions to shareholders are recorded on the ex-dividend date. Income and capital gain distributions are determined in accordance with income tax regulations, which may differ from U.S. generally accepted accounting principles. Certain capital accounts in the financial statements are periodically adjusted for permanent differences in order to reflect their tax character. These adjustments have no impact on net assets or net asset value per share. Temporary differences which arise from recognizing certain items of income, expense, gain or loss in different periods for financial statement and tax purposes will reverse at some time in the future. Distributions in excess of net investment income or net realized gains are temporary over distributions for financial statement purposes resulting from differences in the recognition or classification of income or distributions for financial statement and tax purposes.
Book/tax differences primarily relate to amortization and accretion of debt securities, wash sale loss deferrals, and redemptions in-kind.
The tax character of distributions made during the current period will be determined at fiscal year end. The tax character of distributions declared to shareholders is as follows:
| 12/31/07 | ||
| Ordinary income (including any short-term capital gains) | $110,963,289 | |
| Long-term capital gain | 90,052,703 | |
| Total distributions | $201,015,992 |
19
Table of Contents
Notes to Financial Statements (unaudited) – continued
The federal tax cost and the tax basis components of distributable earnings were as follows:
| As of 6/30/08 | |||
| Cost of investments | $3,607,697,693 | ||
| Gross appreciation | 228,522,806 | ||
| Gross depreciation | (227,286,793 | ) | |
| Net unrealized appreciation (depreciation) | $1,236,013 | ||
| As of 12/31/07 | |||
| Undistributed ordinary income | $138,920,075 | ||
| Undistributed long-term capital gain | 182,836,622 | ||
| Post-October capital loss deferral | (57,128,821 | ) | |
| Other temporary differences | (575,940 | ) | |
| Net unrealized appreciation (depreciation) | $230,541,416 | ||
The aggregate cost above includes prior fiscal year end tax adjustments.
Multiple Classes of Shares of Beneficial Interest – The fund offers multiple classes of shares, which differ in their respective distribution fees. The fund’s income, realized and unrealized gain (loss), and common expenses are allocated to shareholders based on the daily net assets of each class, without distinction between share classes. Dividends are declared separately for each class. Differences in per share dividend rates are generally due to differences in separate class expenses.
| (3) | Transactions with Affiliates |
Investment Adviser – The fund has an investment advisory agreement with Massachusetts Financial Services Company (MFS) to provide overall investment management and related administrative services and facilities to the fund. The management fee is computed daily and paid monthly at an annual rate of 0.75% of the fund’s average daily net assets.
The investment adviser has agreed in writing to reduce its management fee to 0.65% of average daily net assets in excess of $3 billion. This written agreement may be rescinded only upon consent of the fund’s Board of Trustees. This management fee reduction amounted to $377,139, which is shown as a reduction of total expenses in the Statement of Operations.
The management fee incurred for the six months ended June 30, 2008 was equivalent to an annual effective rate of 0.73% of the fund’s average daily net assets.
Distributor – MFS Fund Distributors, Inc. (MFD), a wholly-owned subsidiary of MFS, is the distributor of shares of the fund. The Trustees have adopted a distribution plan for the Service Class shares pursuant to Rule 12b-1 under the Investment Company Act of 1940.
The fund’s distribution plan provides that the fund will pay MFD distribution fees equal to 0.25% per annum of its average daily net assets attributable to Service Class shares as partial consideration for services performed and expenses incurred by MFD and financial intermediaries (including participating insurance companies that invest in the fund to fund variable annuity and variable life insurance contracts, sponsors of qualified retirement and pension plans that invest in the fund, and affiliates of these participating insurance companies and plan sponsors) in connection with the sale and distribution of the Service Class shares. MFD may subsequently pay all, or a portion, of the distribution fees to financial intermediaries.
Shareholder Servicing Agent – MFS Service Center, Inc. (MFSC), a wholly-owned subsidiary of MFS, receives a fee from the fund for its services as shareholder servicing agent. For the six months ended June 30, 2008, the fee was $339,010, which equated to 0.0182% annually of the fund’s average daily net assets. MFSC also receives payment from the fund for out-of-pocket expenses paid by MFSC on behalf of the fund. For the six months ended June 30, 2008, these costs amounted to $54.
Administrator – MFS provides certain financial, legal, shareholder communications, compliance, and other administrative services to the fund. Under an administrative services agreement, the fund partially reimburses MFS the costs incurred to provide these services. The fund is charged a fixed amount plus a fee based on average daily net assets. The fund’s annual fixed amount is $17,500.
The administrative services fee incurred for the six months ended June 30, 2008 was equivalent to an annual effective rate of 0.0124% of the fund’s average daily net assets.
Trustees’ and Officers’ Compensation – The fund pays compensation to independent trustees in the form of a retainer, attendance fees, and additional compensation to Board and Committee chairpersons. The fund does not pay compensation directly to trustees or officers of the fund who are also officers of the investment adviser, all of whom receive remuneration for their services to the fund from MFS. Certain officers and trustees of the fund are officers or directors of MFS, MFD, and MFSC.
20
Table of Contents
Notes to Financial Statements (unaudited) – continued
Other – This fund and certain other MFS funds (the funds) have entered into a services agreement (the Agreement) which provides for payment of fees by the funds to Tarantino LLC in return for the provision of services of an Independent Chief Compliance Officer (ICCO) for the funds. The ICCO is an officer of the funds and the sole member of Tarantino LLC. The funds can terminate the Agreement with Tarantino LLC at any time under the terms of the Agreement. For the six months ended June 30, 2008, the fee paid by the fund to Tarantino LLC was $10,996 and is included in miscellaneous expense on the Statement of Operations. MFS has agreed to reimburse the fund for a portion of the payments made by the fund to Tarantino LLC in the amount of $10,912, which is shown as a reduction of total expenses in the Statement of Operations. Additionally, MFS has agreed to bear all expenses associated with office space, other administrative support, and supplies provided to the ICCO.
| (4) | Portfolio Securities |
Purchases and sales of investments, other than purchased option transactions and short-term obligations, were as follows:
| Purchases | Sales | |||
| U.S. Government securities | $172,318,259 | $341,230,683 | ||
| Investments (non-U.S. Government securities) | $749,510,335 | $720,779,616 |
| (5) | Shares of Beneficial Interest |
The fund’s Declaration of Trust permits the Trustees to issue an unlimited number of full and fractional shares of beneficial interest. Transactions in fund shares were as follows:
| Six months ended 6/30/08 | Year ended 12/31/07 | |||||||||||
| Shares | Amount | Shares | Amount | |||||||||
| Shares sold | ||||||||||||
Initial Class | 1,985,165 | $40,184,103 | 10,391,529 | $228,699,546 | ||||||||
Service Class | 3,739,470 | 74,478,094 | 10,155,064 | 220,552,720 | ||||||||
| 5,724,635 | $114,662,197 | 20,546,593 | $449,252,266 | |||||||||
| Shares issued to shareholders in reinvestment of distributions | ||||||||||||
Initial Class | 12,176,558 | $232,694,013 | 6,854,034 | $147,087,559 | ||||||||
Service Class | 4,707,528 | 89,066,436 | 2,536,615 | 53,928,433 | ||||||||
| 16,884,086 | $321,760,449 | 9,390,649 | $201,015,992 | |||||||||
| Shares reacquired | ||||||||||||
Initial Class | (9,047,713 | ) | $(183,081,853 | ) | (14,696,139 | ) | $(319,271,689 | ) | ||||
Service Class | (5,254,973 | ) | (105,080,270 | ) | (10,173,426 | ) | (220,753,199 | ) | ||||
| (14,302,686 | ) | $(288,162,123 | ) | (24,869,565 | ) | $(540,024,888 | ) | |||||
| Net change | ||||||||||||
Initial Class | 5,114,010 | $89,796,263 | 2,549,424 | $56,515,416 | ||||||||
Service Class | 3,192,025 | 58,464,260 | 2,518,253 | 53,727,954 | ||||||||
| 8,306,035 | $148,260,523 | 5,067,677 | $110,243,370 | |||||||||
| (6) | Line of Credit |
The fund and other funds managed by MFS participate in a $1 billion unsecured committed line of credit provided by a syndication of banks under a credit agreement. In addition, the fund and other funds managed by MFS have established uncommitted borrowing arrangements with certain banks. Borrowings may be made for temporary financing needs. Interest is charged to each fund, based on its borrowings, generally at a rate equal to the Federal Reserve funds rate plus 0.30%. In addition, a commitment fee, based on the average daily, unused portion of the committed line of credit, is allocated among the participating funds at the end of each calendar quarter. For the six months ended June 30, 2008, the fund’s commitment fee and interest expense were $8,683 and $0, respectively, and are included in miscellaneous expense on the Statement of Operations.
21
Table of Contents
BOARD REVIEW OF INVESTMENT ADVISORY AGREEMENT
A discussion regarding the Board’s most recent review and renewal of the fund’s Investment Advisory Agreement with MFS will be available on or about November 1, 2008 by clicking on the fund’s name under “Variable Insurance Portfolios - VIT” in the ‘‘Products and Performance’’ section of the MFS Web site (mfs.com).
PROXY VOTING POLICIES AND INFORMATION
A general description of the MFS funds’ proxy voting policies and procedures is available without charge, upon request, by calling
1-800-225-2606, by visiting the Proxy Voting section of mfs.com or by visiting the SEC’s Web site at http://www.sec.gov.
Information regarding how the fund voted proxies relating to portfolio securities during the most recent twelve-month period ended June 30 is available without charge by visiting the Proxy Voting section of mfs.com or by visiting the SEC’s Web site at http://www.sec.gov.
QUARTERLY PORTFOLIO DISCLOSURE
The fund will file a complete schedule of portfolio holdings with the Securities and Exchange Commission (the Commission) for the first and third quarters of each fiscal year on Form N-Q. The fund’s Form N-Q may be reviewed and copied at the:
Public Reference Room
Securities and Exchange Commission
100 F Street, NE, Room 1580
Washington, D.C. 20549
Information on the operation of the Public Reference Room may be obtained by calling the Commission at 1-800-SEC-0330. The fund’s Form N-Q is available on the EDGAR database on the Commission’s Internet Web site at http://www.sec.gov, and copies of this information may be obtained, upon payment of a duplicating fee, by electronic request at the following e-mail address: publicinfo@sec.gov or by writing the Public Reference Section at the above address.
22
Table of Contents
CONTACT US
Web site
mfs.com
Account service and
literature
Shareholders
1-877-411-3325
9 a.m. to 5 p.m. Eastern Time
Investment professionals
1-800-637-8730
8 a.m. to 5 p.m. Eastern Time
Mailing address
MFS Service Center, Inc.
Attn: Institutional Alliance Services (IAS)
P.O. Box 55824
Boston, MA 02205-5824
Overnight mail
MFS Service Center, Inc.
c/o Boston Financial Data Services
30 Dan Road
Canton, MA 02021-2809

Table of Contents
Table of Contents
This report is prepared for the general information of contract owners. It is authorized for distribution to prospective investors only when preceded or accompanied by a current prospectus.
NOT FDIC INSURED Ÿ MAY LOSE VALUE Ÿ NO BANK OR CREDIT UNION GUARANTEE Ÿ NOT A DEPOSIT Ÿ NOT INSURED BY ANY FEDERAL GOVERNMENT AGENCY OR NCUA/NCUSIF
Table of Contents

Dear Contract Owners:
Negative headlines tend to resonate during difficult markets, and we certainly have had more than our share of tough news recently. As a result consumer, and particularly investor, sentiment are at all-time lows. That said, I do think it is helpful to remember there are always silver linings in the storm clouds if you look hard enough.
Through all of the challenges we have faced, there are some positive underlying trends. In the United States, for example, institutional traders and credit market followers are just now showing increasing signs of confidence and are beginning to take on more risk. At the corporate level, earnings continue to be relatively strong as companies have reduced labor costs, controlled inventories, and relied less on debt to finance expansion. More broadly, low interest rates and strong demand for consumer goods and industrial equipment are good signs for the global economy.
While I do not mean to minimize the risks inherent in today’s markets, periods such as these allow the talented fund managers and research analysts we have at MFS® to test their convictions, reevaluate existing positions, and identify new investment ideas. Our investment process also includes a significant risk management component, with constant attention paid to monitoring market risk, so we can do our best to minimize any surprises to your portfolio.
For investors, this is a great time to check in with your advisor and make sure you have a sound investment plan in place — one that can keep your hard-earned money working over the long term through a strategy that involves asset allocation, diversification, and periodic portfolio rebalancing and reviews. A plan tailored to your distinct needs and goals continues to be the best approach to help you take advantage of the inevitable challenges — and opportunities — that present themselves over time.
Respectfully,

Robert J. Manning
Chief Executive Officer and Chief Investment Officer
MFS Investment Management®
August 15, 2008
The opinions expressed in this letter are subject to change, may not be relied upon for investment advice, and no forecasts can be guaranteed.
1
Table of Contents
Portfolio structure (i)
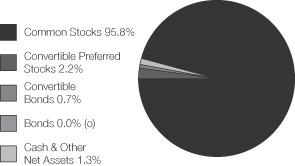
| Top ten holdings (i) | ||
| NRG Energy, Inc. | 3.9% | |
| Equitable Resources, Inc. | 3.2% | |
| E.ON AG | 2.7% | |
| El Paso Corp. | 2.6% | |
| Sempra Energy | 2.6% | |
| AT&T, Inc. | 2.3% | |
| Williams Cos., Inc. | 2.3% | |
| Rogers Communications, Inc., ”B” | 2.1% | |
| Telefonica S.A. | 2.1% | |
| Edison International | 2.0% |
| Top five industries (i) | ||
| Utilites-Electric Power | 44.4% | |
| Telephone Services | 12.9% | |
| Telecommunications-Wireless | 12.4% | |
| Natural Gas-Distribution | 10.7% | |
| Natural Gas-Pipeline | 6.4% |
| Country weightings (i) | ||
| United States | 65.3% | |
| Spain | 4.7% | |
| United Kingdom | 3.7% | |
| Canada | 3.6% | |
| Germany | 3.6% | |
| Brazil | 3.2% | |
| Mexico | 3.0% | |
| Russia | 1.9% | |
| France | 1.7% | |
| Other Countries | 9.3% |
| (i) | For purposes of this presentation, the bond component includes accrued interest amounts and may be positively or negatively impacted by the equivalent exposure from any derivative holdings, if applicable. |
| (o) | Less than 0.1% |
Percentages are based on net assets as of 6/30/08.
The portfolio is actively managed and current holdings may be different.
2
Table of Contents
Fund Expenses Borne by the Contract Holders During the Period,
January 1, 2008 through June 30, 2008
As a contract holder of the fund, you incur ongoing costs, including management fees; distribution (12b-1) fees; and other fund expenses. This example is intended to help you understand your ongoing costs (in dollars) of investing in the fund and to compare these costs with the ongoing costs of investing in other mutual funds.
The example is based on an investment of $1,000 invested at the beginning of the period and held for the entire period January 1, 2008 through June 30, 2008.
Actual Expenses
The first line for each share class in the following table provides information about actual account values and actual expenses. You may use the information in this line, together with the amount you invested, to estimate the expenses that you paid over the period. Simply divide your account value by $1,000 (for example, an $8,600 account value divided by $1,000 = 8.6), then multiply the result by the number in the first line under the heading entitled “Expenses Paid During Period” to estimate the expenses you paid on your account during this period.
Hypothetical Example for Comparison Purposes
The second line for each share class in the following table provides information about hypothetical account values and hypothetical expenses based on the fund’s actual expense ratio and an assumed rate of return of 5% per year before expenses, which is not the fund’s actual return. The hypothetical account values and expenses may not be used to estimate the actual ending account balance or expenses you paid for the period. You may use this information to compare the ongoing costs of investing in the fund and other funds. To do so, compare this 5% hypothetical example with the 5% hypothetical examples that appear in the shareholder reports of the other funds.
Please note that the expenses shown in the table are meant to highlight the fund’s ongoing costs only and do not take into account the fees and expenses imposed under the variable contracts through which your investment in the fund is made. Therefore, the second line for each share class in the table is useful in comparing ongoing costs associated with an investment in vehicles (such as the fund) which fund benefits under variable annuity and variable life insurance contracts and to qualified pension and retirement plans only, and will not help you determine the relative total costs of investing in the fund through variable annuity and variable life insurance contracts. If the fees and expenses imposed under the variable contracts were included, your costs would have been higher.
| Share Class | Annualized Expense Ratio | Beginning Account Value 1/01/08 | Ending Account Value 6/30/08 | Expenses Paid During Period (p) 1/01/08-6/30/08 | ||||||
| Initial Class | Actual | 0.79% | $1,000.00 | $981.10 | $3.89 | |||||
| Hypothetical (h) | 0.79% | $1,000.00 | $1,020.93 | $3.97 | ||||||
| Service Class | Actual | 1.04% | $1,000.00 | $980.01 | $5.12 | |||||
| Hypothetical (h) | 1.04% | $1,000.00 | $1,019.69 | $5.22 |
| (h) | 5% class return per year before expenses. |
| (p) | Expenses paid is equal to each class’ annualized expense ratio, as shown above, multiplied by the average account value over the period, multiplied by the number of days in the period, divided by the number of days in the year. |
3
Table of Contents
PORTFOLIO OF INVESTMENTS – 6/30/08 (unaudited)
The Portfolio of Investments is a complete list of all securities owned by your fund. It is categorized by broad-based asset classes.
| Issuer | Shares/Par | Value ($) | |||
| COMMON STOCKS – 95.8% | |||||
| Broadcasting – 0.8% | |||||
| Grupo Televisa S.A., ADR | 934,590 | $ | 22,075,016 | ||
| Cable TV – 3.7% | |||||
| Comcast Corp., “Special A” | 978,580 | $ | 18,358,161 | ||
| DIRECTV Group, Inc. (a)(l) | 557,600 | 14,447,416 | |||
| Megacable Holdings (a) | 3,514,350 | 10,221,593 | |||
| Net Servicos de Comunicacao S.A., IPS (a) | 658,674 | 8,373,674 | |||
| Time Warner Cable, Inc. (a)(l) | 1,732,150 | 45,867,332 | |||
| $ | 97,268,176 | ||||
| Energy – Independent – 1.4% | |||||
| Chesapeake Energy Corp. (l) | 22,600 | $ | 1,490,696 | ||
| Peabody Energy Corp. | 74,700 | 6,577,335 | |||
| Talisman Energy, Inc. | 684,830 | 15,195,265 | |||
| XTO Energy, Inc. | 192,590 | 13,194,341 | |||
| $ | 36,457,637 | ||||
| Energy – Integrated – 2.3% | |||||
| Chevron Corp. | 145,800 | $ | 14,453,154 | ||
| Marathon Oil Corp. | 204,740 | 10,619,864 | |||
| OAO Gazprom, ADR | 437,580 | 25,329,997 | |||
| TOTAL S.A. | 111,200 | 9,492,896 | |||
| $ | 59,895,911 | ||||
| Internet – 0.3% | |||||
| Iliad S.A. | 82,515 | $ | 7,999,507 | ||
| Natural Gas – Distribution – 10.7% | |||||
| AGL Resources, Inc. | 141,350 | $ | 4,887,883 | ||
| Energen Corp. | 208,700 | 16,284,861 | |||
| Equitable Resources, Inc. | 1,202,980 | 83,077,799 | |||
| MDU Resources Group, Inc. | 926,160 | 32,285,938 | |||
| Questar Corp. | 629,920 | 44,749,517 | |||
| Sempra Energy (l) | 1,211,540 | 68,391,433 | |||
| Spectra Energy Corp. | 1,126,500 | 32,375,610 | |||
| $ | 282,053,041 | ||||
| Natural Gas – Pipeline – 5.5% | |||||
| El Paso Corp. | 3,164,790 | $ | 68,802,536 | ||
| Enagas S.A. | 608,570 | 17,213,561 | |||
| Williams Cos., Inc. | 1,482,605 | 59,763,807 | |||
| $ | 145,779,904 | ||||
| Oil Services – 2.7% | |||||
| Baker Hughes, Inc. | 62,300 | $ | 5,441,282 | ||
| Halliburton Co. | 703,940 | 37,358,096 | |||
| National Oilwell Varco, Inc. (a) | 62,300 | 5,527,256 | |||
| Noble Corp. | 159,600 | 10,367,616 | |||
| Schlumberger Ltd. | 124,100 | 13,332,063 | |||
| $ | 72,026,313 | ||||
| Telecommunications – Wireless – 12.4% | |||||
| America Movil S.A.B. de C.V., “L”, ADR | 904,540 | $ | 47,714,485 | ||
| Bharti Tele-Ventures Ltd. (a) | 396,240 | 6,642,373 | |||
| Cellcom Israel Ltd. | 1,033,310 | 35,349,535 | |||
| Hutchison Telecommunications International Ltd. | 11,959,000 | 16,963,447 | |||
| Mobile TeleSystems OJSC, ADR | 319,600 | 24,484,556 | |||
| Issuer | Shares/Par | Value ($) | |||
| COMMON STOCKS – continued | |||||
| Telecommunications – Wireless – continued | |||||
| MTN Group Ltd. | 874,540 | $ | 13,862,370 | ||
| NII Holdings, Inc. “B” (a) | 951,540 | 45,188,635 | |||
| Philippine Long Distance Telephone Co. | 174,940 | 9,332,471 | |||
| Philippine Long Distance Telephone Co., ADR | 207,100 | 11,063,282 | |||
| Rogers Communications, Inc., “B” | 1,445,160 | 56,178,971 | |||
| Tim Participacoes S.A., ADR (l) | 558,650 | 15,882,419 | |||
| Vodafone Group PLC | 15,254,370 | 44,982,048 | |||
| $ | 327,644,592 | ||||
| Telephone Services – 12.9% | |||||
| AT&T, Inc. | 1,807,370 | $ | 60,890,295 | ||
| Deutsche Telekom AG | 365,700 | 5,990,361 | |||
| Embarq Corp. | 980,740 | 46,359,580 | |||
| Qwest Communications International, Inc. (l) | 4,519,110 | 17,760,102 | |||
| Royal KPN N.V. | 1,734,650 | 29,665,528 | |||
| Telecom Argentina S.A., ADR (a)(l) | 977,360 | 13,927,380 | |||
| Telefonica S.A. | 2,060,020 | 54,464,898 | |||
| Telenor A.S.A. | 1,354,000 | 25,398,139 | |||
| Telkom SA Ltd. | 524,150 | 9,836,906 | |||
| TELUS Corp. | 600,680 | 24,489,965 | |||
| Verizon Communications, Inc. | 1,077,540 | 38,144,916 | |||
| Windstream Corp. | 927,748 | 11,448,410 | |||
| $ | 338,376,480 | ||||
| Utilities – Electric Power – 43.1% | |||||
| Acciona S.A. | 52,160 | $ | 12,310,370 | ||
| AES Corp. (a) | 2,439,890 | 46,870,287 | |||
| AES Tiete S.A., IPS | 2,148,659 | 22,740,692 | |||
| Allegheny Energy, Inc. | 803,900 | 40,283,429 | |||
| American Electric Power Co., Inc. | 1,224,370 | 49,256,405 | |||
| CEZ AS | 465,360 | 41,300,828 | |||
| CMS Energy Corp. (l) | 3,132,630 | 46,676,187 | |||
| Constellation Energy Group, Inc. | 466,850 | 38,328,385 | |||
| Dominion Resources, Inc. (l) | 634,480 | 30,131,455 | |||
| DPL, Inc. (l) | 1,161,860 | 30,649,867 | |||
| DTE Energy Co. (l) | 469,640 | 19,931,522 | |||
| Dynegy, Inc. (a) | 3,468,542 | 29,656,034 | |||
| E.ON AG | 354,400 | 71,395,390 | |||
| Edison International | 1,030,970 | 52,971,239 | |||
| EDP Renovaveis SA (a) | 562,639 | 6,513,461 | |||
| Electricite de France | 161,920 | 15,357,794 | |||
| Eletropaulo Metropolitana S.A., IPS | 1,622,800 | 38,029,294 | |||
| Energias de Portugal S.A. | 440,700 | 2,301,025 | |||
| Enersis S.A., ADR | 416,290 | 6,485,798 | |||
| FirstEnergy Corp. | 262,620 | 21,621,505 | |||
| Fortum Corp. | 94,100 | 4,767,430 | |||
| FPL Group, Inc. | 417,470 | 27,377,683 | |||
| Iberdrola S.A. | 539,346 | 7,212,517 | |||
| Iberdrola S.A. (a) | 986,900 | 7,621,383 | |||
| International Power PLC | 4,506,120 | 38,586,078 | |||
| Northeast Utilities | 1,514,333 | 38,660,921 | |||
| NRG Energy, Inc. (a) | 2,383,260 | 102,241,854 | |||
| Oesterreichische Elektrizitaetswirtschafts AG (Verbund), “A” | 128,750 | 11,542,684 | |||
| Pepco Holdings, Inc. | 382,100 | 9,800,865 | |||
4
Table of Contents
Portfolio of Investments (unaudited) – continued
| Issuer | Shares/Par | Value ($) | ||||
| COMMON STOCKS – continued | ||||||
| Utilities – Electric Power – continued | ||||||
| PG&E Corp. (l) | 872,330 | $ | 34,622,778 | |||
| Portland General Electric Co. | 172,100 | 3,875,692 | ||||
| PPL Corp. | 741,400 | 38,752,978 | ||||
| Public Service Enterprise Group, Inc. | 1,082,860 | 49,735,760 | ||||
| Red Electrica de Espana | 369,180 | 23,997,060 | ||||
| Reliant Energy, Inc. (a) | 1,804,560 | 38,382,991 | ||||
| RWE AG | 124,900 | 15,783,158 | ||||
| Scottish & Southern Energy PLC | 507,500 | 14,173,329 | ||||
| Veolia Environnement S.A. | 227,285 | 12,668,085 | ||||
| Wisconsin Energy Corp. | 110,980 | 5,018,516 | ||||
| Xcel Energy, Inc. | 1,383,880 | 27,774,472 | ||||
| $ | 1,135,407,201 | |||||
| Total Common Stocks (Identified Cost, $2,287,103,086) | $ | 2,524,983,778 | ||||
| BONDS – 0.0% | ||||||
| Asset Backed & Securitized – 0.0% | ||||||
| Falcon Franchise Loan LLC, FRN, 3.323%, 2023 (i)(n) | $ | 475,557 | $ | 37,116 | ||
| Utilities – Electric Power – 0.0% | ||||||
| TXU Eastern Funding Co., 6.75%, 2009 (d) | $ | 16,000 | $ | 1,100 | ||
| Total Bonds (Identified Cost, $50,588) | $ | 38,216 | ||||
| CONVERTIBLE PREFERRED STOCKS – 2.2% | ||||||
| Natural Gas – Pipeline – 0.9% | ||||||
| El Paso Corp., 4.99% | 14,120 | $ | 24,339,349 | |||
| Utilities – Electric Power – 1.3% | ||||||
| NRG Energy, Inc., 5.75% | 89,900 | $ | 32,835,076 | |||
| Total Convertible Preferred Stocks (Identified Cost, $40,902,348) | $ | 57,174,425 | ||||
| CONVERTIBLE BONDS – 0.7% | ||||||
| Energy – Independent – 0.7% | ||||||
| Peabody Energy Corp., 4.75%, 2066 (Identified Cost, $11,632,116) | $ | 10,610,000 | $ | 17,519,762 | ||
| Issuer | Shares/Par | Value ($) | ||||
| COLLATERAL FOR SECURITIES LOANED – 6.8% | ||||||
| Navigator Securities Lending Prime Portfolio, at Cost and Net Asset Value | 178,289,222 | $ | 178,289,222 | |||
| MONEY MARKET FUNDS (v) – 0.7% | ||||||
| MFS Institutional Money Market Portfolio, 2.51%, at Cost and Net Asset Value | 20,131,259 | $ | 20,131,259 | |||
| Total Investments (Identified Cost, $2,538,108,619) | $ | 2,798,136,662 | ||||
| OTHER ASSETS, LESS LIABILITIES – (6.2)% | (162,535,113 | ) | ||||
| Net Assets – 100.0% | $ | 2,635,601,549 | ||||
| (a) | Non-income producing security. |
| (d) | Non-income producing security – in default. |
| (i) | Interest only security for which the series receives interest on notional principal (Par amount). Par amount shown is the notional principal and does not reflect the cost of the security. |
| (l) | All or a portion of this security is on loan. |
| (n) | Securities exempt from registration under Rule 144A of the Securities Act of 1933. These securities may be sold in the ordinary course of business in transactions exempt from registration, normally to qualified institutional buyers. At period end, the aggregate value of these securities was $37,116, representing less than 0.01% of net assets. |
| (v) | Underlying fund that is available only to investment companies managed by MFS. The rate quoted is the annualized seven-day yield of the fund at period end. |
The following abbreviations are used in this report and are defined:
| ADR | American Depository Receipt |
| FRN | Floating Rate Note. Interest rate resets periodically and may not be the rate reported at period end. |
| IPS | International Preference Stock |
Abbreviations indicate amounts shown in currencies other than the U.S. dollar. All amounts are stated in U.S. dollars unless otherwise indicated. A list of abbreviations is shown below:
| EUR | Euro |
| GBP | British Pound |
5
Table of Contents
Portfolio of Investments (unaudited) – continued
Derivative Contracts at 6/30/08
Forward Foreign Currency Exchange Contracts at 6/30/08
| Type | Currency | Contracts to Deliver/Receive | Settlement Date Range | In Exchange For | Contracts at Value | Net Unrealized Appreciation (Depreciation) | ||||||||||||
| Appreciation | ||||||||||||||||||
| BUY | EUR | 3,078,953 | 8/20/08-8/25/08 | $ | 4,772,097 | $ | 4,835,989 | $ | 63,892 | |||||||||
| SELL | EUR | 828,501 | 8/25/08 | 1,301,508 | 1,301,251 | 257 | ||||||||||||
| BUY | GBP | 1,334,950 | 8/26/08 | 2,618,010 | 2,649,630 | 31,620 | ||||||||||||
| $ | 95,769 | |||||||||||||||||
| Depreciation | ||||||||||||||||||
| BUY | EUR | 3,768,425 | 8/25/08 | $ | 5,921,034 | $ | 5,918,724 | $ | (2,310 | ) | ||||||||
| SELL | EUR | 130,096,703 | 8/25/08 | 201,324,780 | 204,331,095 | (3,006,315 | ) | |||||||||||
| SELL | GBP | 32,375,600 | 8/26/08 | 63,464,540 | 64,259,628 | (795,088 | ) | |||||||||||
| $ | (3,803,713 | ) | ||||||||||||||||
At June 30, 2008, the fund had sufficient cash and/or securities to cover any commitments under these derivative contracts.
See Notes to Financial Statements
6
Table of Contents
FINANCIAL STATEMENTS | STATEMENT OF ASSETS AND LIABILITIES (unaudited)
This statement represents your fund’s balance sheet, which details the assets and liabilities comprising the total value of the fund.
At 6/30/08 | ||||
Assets | ||||
Investments – | ||||
Non-affiliated issuers, at value (identified cost, $2,517,977,360) | $2,778,005,403 | |||
Underlying funds, at cost and value | 20,131,259 | |||
Total investments, at value, including $174,914,096 of securities on loan (identified cost, $2,538,108,619) | $2,798,136,662 | |||
Cash | $389,854 | |||
Foreign currency, at value (identified cost, $59,523) | 59,114 | |||
Receivable for forward foreign currency exchange contracts | 95,769 | |||
Receivable for investments sold | 33,535,252 | |||
Receivable for fund shares sold | 1,171,249 | |||
Interest and dividends receivable | 7,400,416 | |||
Other assets | 16,259 | |||
Total assets | $2,840,804,575 | |||
Liabilities | ||||
Payable for forward foreign currency exchange contracts | $3,803,713 | |||
Payable for investments purchased | 19,062,321 | |||
Payable for fund shares reacquired | 3,347,761 | |||
Collateral for securities loaned, at value (c) | 178,289,222 | |||
Payable to affiliates | ||||
Management fee | 204,132 | |||
Shareholder servicing costs | 4,789 | |||
Distribution fees | 46,905 | |||
Administrative services fee | 3,560 | |||
Payable for independent trustees’ compensation | 5,656 | |||
Accrued expenses and other liabilities | 434,967 | |||
Total liabilities | $205,203,026 | |||
Net assets | $2,635,601,549 | |||
Net assets consist of | ||||
Paid-in capital | $2,280,255,405 | |||
Unrealized appreciation (depreciation) on investments and translation of assets and liabilities in foreign currencies | 256,456,429 | |||
Accumulated net realized gain (loss) on investments and foreign currency transactions | 71,012,437 | |||
Undistributed net investment income | 27,877,278 | |||
Net assets | $2,635,601,549 | |||
Shares of beneficial interest outstanding | 92,507,464 | |||
Initial Class shares | ||||
Net assets | $890,734,046 | |||
Shares outstanding | 31,023,106 | |||
Net asset value per share | $28.71 | |||
Service Class shares | ||||
Net assets | $1,744,867,503 | |||
Shares outstanding | 61,484,358 | |||
Net asset value per share | $28.38 |
| (c) | Non-cash collateral is not included. |
See Notes to Financial Statements
7
Table of Contents
FINANCIAL STATEMENTS | STATEMENT OF OPERATIONS (unaudited)
This statement describes how much your fund earned in investment income and accrued in expenses. It also describes any gains and/or losses generated by fund operations.
| Six months ended 6/30/08 | ||||||
| Net investment income | ||||||
Income | ||||||
Dividends | $40,724,897 | |||||
Interest | 2,101,290 | |||||
Dividends from underlying funds | 670,148 | |||||
Foreign taxes withheld | (2,630,492 | ) | ||||
Total investment income | $40,865,843 | |||||
Expenses | ||||||
Management fee | $9,594,451 | |||||
Distribution fees | 2,083,191 | |||||
Shareholder servicing costs | 232,397 | |||||
Administrative services fee | 160,620 | |||||
Independent trustees’ compensation | 26,340 | |||||
Custodian fee | 348,161 | |||||
Shareholder communications | 74,939 | |||||
Auditing fees | 22,933 | |||||
Legal fees | 18,923 | |||||
Miscellaneous | 64,082 | |||||
Total expenses | $12,626,037 | |||||
Fees paid indirectly | (7,379 | ) | ||||
Reduction of expenses by investment adviser | (398,837 | ) | ||||
Net expenses | $12,219,821 | |||||
Net investment income | $28,646,022 | |||||
Realized and unrealized gain (loss) on investments | ||||||
Realized gain (loss) (identified cost basis) | ||||||
Investment transactions | $86,576,747 | |||||
Foreign currency transactions | (13,614,298 | ) | ||||
Net realized gain (loss) on investments and foreign currency transactions | $72,962,449 | |||||
Change in unrealized appreciation (depreciation) | ||||||
Investments (net of $92,200 decrease in deferred country tax) | $(154,522,412 | ) | ||||
Translation of assets and liabilities in foreign currencies | (4,348,394 | ) | ||||
Net unrealized gain (loss) on investments and foreign currency translation | $(158,870,806 | ) | ||||
Net realized and unrealized gain (loss) on investments and foreign currency | $(85,908,357 | ) | ||||
Change in net assets from operations | $(57,262,335 | ) |
See Notes to Financial Statements
8
Table of Contents
FINANCIAL STATEMENTS | STATEMENTS OF CHANGES IN NET ASSETS
These statements describe the increases and/or decreases in net assets resulting from operations, any distributions, and any shareholder transactions.
| Six months ended 6/30/08 (unaudited | ) | Year ended 12/31/07 | | |||
Change in net assets | ||||||
From operations | ||||||
Net investment income | $28,646,022 | $45,902,086 | ||||
Net realized gain (loss) on investments and foreign currency transactions | 72,962,449 | 342,536,435 | ||||
Net unrealized gain (loss) on investments and foreign currency translation | (158,870,806 | ) | 125,133,327 | |||
Change in net assets from operations | $(57,262,335 | ) | $513,571,848 | |||
Distributions declared to shareholders | ||||||
From net investment income | ||||||
Initial Class | $(11,873,805 | ) | $(7,861,253 | ) | ||
Service Class | (19,270,793 | ) | (9,991,006 | ) | ||
From net realized gain on investments | ||||||
Initial Class | (122,912,733 | ) | (56,981,992 | ) | ||
Service Class | (234,593,753 | ) | (85,782,255 | ) | ||
Total distributions declared to shareholders | $(388,651,084 | ) | $(160,616,506 | ) | ||
Change in net assets from fund share transactions | $396,664,331 | $628,469,948 | ||||
Total change in net assets | $(49,249,088 | ) | $981,425,290 | |||
Net assets | ||||||
At beginning of period | 2,684,850,637 | 1,703,425,347 | ||||
At end of period (including undistributed net investment income of $27,877,278 and | $2,635,601,549 | $2,684,850,637 |
See Notes to Financial Statements
9
Table of Contents
FINANCIAL STATEMENTS | FINANCIAL HIGHLIGHTS
The financial highlights table is intended to help you understand the fund’s financial performance for the semiannual period and the past 5 fiscal years Certain information reflects financial results for a single fund share. The total returns in the table represent the rate by which an investor would have earned (or lost) on an investment in the fund share class (assuming reinvestment of all distributions) held for the entire period.
| Initial Class | Six months | Years ended 12/31 | ||||||||||||||||
| 2007 | 2006 | 2005 | 2004 | 2003 | ||||||||||||||
| (unaudited) | ||||||||||||||||||
Net asset value, beginning of period | $34.48 | $29.27 | $23.74 | $20.45 | $15.95 | $12.03 | ||||||||||||
Income (loss) from investment operations | ||||||||||||||||||
Net investment income (d) | $0.36 | $0.71 | $0.59 | $0.40 | $0.36 | $0.29 | ||||||||||||
Net realized and unrealized gain (loss) on investments and foreign currency | (1.10 | ) | 7.10 | 6.47 | 3.02 | 4.39 | 3.95 | |||||||||||
| Total from investment operations | $(0.74 | ) | $7.81 | $7.06 | $3.42 | $4.75 | $4.24 | |||||||||||
Less distributions declared to shareholders | ||||||||||||||||||
From net investment income | $(0.44 | ) | $(0.32 | ) | $(0.53 | ) | $(0.13 | ) | $(0.25 | ) | $(0.32 | ) | ||||||
From net realized gain on investments | (4.59 | ) | (2.28 | ) | (1.00 | ) | — | — | — | |||||||||
Total distributions declared to shareholders | $(5.03 | ) | $(2.60 | ) | $(1.53 | ) | $(0.13 | ) | $(0.25 | ) | $(0.32 | ) | ||||||
Net asset value, end of period | $28.71 | $34.48 | $29.27 | $23.74 | $20.45 | $15.95 | ||||||||||||
Total return (%) (k)(r)(s) | (1.89 | )(n) | 27.90 | 31.26 | 16.84 | 30.20 | (b) | 35.89 | ||||||||||
| Ratios (%) (to average net assets) and Supplemental data: | ||||||||||||||||||
Expenses before expense reductions (f) | 0.82 | (a) | 0.85 | 0.87 | 0.90 | 0.89 | 0.92 | |||||||||||
Expenses after expense reductions (f) | 0.79 | (a) | 0.82 | 0.86 | 0.90 | 0.89 | N/A | |||||||||||
Net investment income | 2.39 | (a) | 2.22 | 2.32 | 1.80 | 2.11 | 2.11 | |||||||||||
Portfolio turnover | 31 | 84 | 94 | 88 | 105 | 134 | ||||||||||||
Net assets at end of period (000 Omitted) | $890,734 | $969,404 | $710,341 | $506,315 | $357,652 | $243,275 | ||||||||||||
See Notes to Financial Statements
10
Table of Contents
Financial Highlights – continued
| Service Class | Six months | Years ended 12/31 | ||||||||||||||||
| 2007 | 2006 | 2005 | 2004 | 2003 | ||||||||||||||
| (unaudited) | ||||||||||||||||||
Net asset value, beginning of period | $34.11 | $29.01 | $23.56 | $20.32 | $15.87 | $11.98 | ||||||||||||
Income (loss) from investment operations | ||||||||||||||||||
Net investment income (d) | $0.33 | $0.62 | $0.53 | $0.34 | $0.32 | $0.24 | ||||||||||||
Net realized and unrealized gain (loss) on | (1.09 | ) | 7.03 | 6.42 | 3.01 | 4.36 | 3.95 | |||||||||||
| Total from investment operations | $(0.76 | ) | $7.65 | $6.95 | $3.35 | $4.68 | $4.19 | |||||||||||
Less distributions declared to shareholders | ||||||||||||||||||
From net investment income | $(0.38 | ) | $(0.27 | ) | $(0.50 | ) | $(0.11 | ) | $(0.23 | ) | $(0.30 | ) | ||||||
From net realized gain on investments | (4.59 | ) | (2.28 | ) | (1.00 | ) | — | — | — | |||||||||
Total distributions declared to shareholders | $(4.97 | ) | $(2.55 | ) | $(1.50 | ) | $(0.11 | ) | $(0.23 | ) | $(0.30 | ) | ||||||
Net asset value, end of period | $28.38 | $34.11 | $29.01 | $23.56 | $20.32 | $15.87 | ||||||||||||
Total return (%) (k)(r)(s) | (2.00 | )(n) | 27.56 | 30.96 | 16.57 | 29.84 | (b) | 35.57 | ||||||||||
| Ratios (%) (to average net assets) and Supplemental data: | ||||||||||||||||||
Expenses before expense reductions (f) | 1.07 | (a) | 1.10 | 1.12 | 1.15 | 1.15 | 1.17 | |||||||||||
Expenses after expense reductions (f) | 1.04 | (a) | 1.07 | 1.11 | 1.15 | 1.15 | N/A | |||||||||||
Net investment income | 2.16 | (a) | 1.96 | 2.11 | 1.56 | 1.87 | 1.79 | |||||||||||
Portfolio turnover | 31 | 84 | 94 | 88 | 105 | 134 | ||||||||||||
Net assets at end of period (000 Omitted) | $1,744,868 | $1,715,446 | $993,085 | $564,978 | $223,952 | $98,100 | ||||||||||||
| (a) | Annualized. |
| (b) | The fund’s net asset value and total return calculation include a non-recurring accrual recorded as a result of an administrative proceeding regarding disclosure of brokerage allocation practices in connection with fund sales. The non-recurring accrual did not have a material impact on the net asset value per share based on the shares outstanding on the day the proceeds were recorded. |
| (d) | Per share data is based on average shares outstanding. |
| (f) | Ratios do not reflect reductions from fees paid indirectly, if applicable. |
| (k) | The total return does not reflect expenses that apply to separate accounts. Inclusion of these charges would reduce the total return figures for all periods shown. |
| (n) | Not annualized. |
| (r) | Certain expenses have been reduced without which performance would have been lower. |
| (s) | From time to time the fund may receive proceeds from litigation settlements, without which performance would be lower. |
See Notes to Financial Statements
11
Table of Contents
NOTES TO FINANCIAL STATEMENTS (unaudited)
| (1) | Business and Organization |
MFS Utilities Series (the fund) is a series of MFS Variable Insurance Trust (the trust). The trust is organized as a Massachusetts business trust and is registered under the Investment Company Act of 1940, as amended, as an open-end management investment company. The shareholders of each series of the trust are separate accounts of insurance companies, which offer variable annuity and/or life insurance products, and qualified retirement and pension plans.
| (2) | Significant Accounting Policies |
General – The preparation of financial statements in conformity with U.S. generally accepted accounting principles requires management to make estimates and assumptions that affect the reported amounts of assets and liabilities, and disclosure of contingent assets and liabilities at the date of the financial statements and the reported amounts of revenues and expenses during the reporting period. Actual results could differ from those estimates. The fund can invest in foreign securities, including securities of emerging market issuers. Investments in foreign securities are vulnerable to the effects of changes in the relative values of the local currency and the U.S. dollar and to the effects of changes in each country’s legal, political, and economic environment. The markets of emerging markets countries are generally more volatile than the markets of developed countries with more mature economies. All of the risks of investing in foreign securities previously described are heightened when investing in emerging markets countries.
Investment Valuations – Equity securities, including restricted equity securities, are generally valued at the last sale or official closing price as reported by an independent pricing service on the market or exchange on which they are primarily traded. For securities for which there were no sales reported that day, equity securities are generally valued at the last quoted daily bid quotation as reported by an independent pricing service on the market or exchange on which they are primarily traded. For securities held short for which there were no sales reported for the day, the position is generally valued at the last quoted daily ask quotation as reported by an independent pricing service on the market or exchange on which such securities are primarily traded. Debt instruments and floating rate loans (other than short-term instruments), including restricted debt instruments, are generally valued at an evaluated or composite bid as reported by an independent pricing service. Short-term instruments with a maturity at issuance of 60 days or less may be valued at amortized cost, which approximates market value. Forward foreign currency contracts are generally valued at the mean of bid and asked prices for the time period interpolated from rates reported by an independent pricing service for proximate time periods. Open-end investment companies are generally valued at net asset value per share. Securities and other assets generally valued on the basis of information from an independent pricing service may also be valued at a broker-dealer bid quotation. Values obtained from pricing services can utilize both dealer-supplied valuations and electronic data processing techniques, which take into account factors such as institutional-size trading in similar groups of securities, yield, quality, coupon rate, maturity, type of issue, trading characteristics, and other market data. The values of foreign securities and other assets and liabilities expressed in foreign currencies are converted to U.S. dollars using the mean of bid and asked prices for rates reported by an independent pricing service.
The Board of Trustees has delegated primary responsibility for determining or causing to be determined the value of the fund’s investments (including any fair valuation) to the adviser pursuant to valuation policies and procedures approved by the Board. If the adviser determines that reliable market quotations are not readily available, investments are valued at fair value as determined in good faith by the adviser in accordance with such procedures under the oversight of the Board of Trustees. Under the fund’s valuation policies and procedures, market quotations are not considered to be readily available for most types of debt instruments and floating rate loans and many types of derivatives. These investments are generally valued at fair value based on information from independent pricing services. In addition, investments may be valued at fair value if the adviser determines that an investment’s value has been materially affected by events occurring after the close of the exchange or market on which the investment is principally traded (such as foreign exchange or market) and prior to the determination of the fund’s net asset value, or after the halting of trading of a specific security where trading does not resume prior to the close of the exchange or market on which the security is principally traded. Events that occur on a frequent basis after foreign markets close (such as developments in foreign markets and significant movements in the U.S. markets) and prior to the determination of the fund’s net asset value may be deemed to have a material affect on the value of securities traded in foreign markets. Accordingly, the fund’s foreign equity securities may often be valued at fair value. The adviser may rely on independent pricing services or other information (such as the correlation with price movements of similar securities in the same or other markets; the type, cost and investment characteristics of the security; the business and financial condition of the issuer; and trading and other market data) to assist in determining whether to fair value and at what value to fair value an investment. The value of an investment for purposes of calculating the fund’s net asset value can differ depending on the source and method used to determine value. When fair valuation is used, the value of investments used to determine the fund’s net asset value may differ from quoted or published prices for the same investments.
12
Table of Contents
Notes to Financial Statements (unaudited) – continued
The fund adopted FASB Statement No. 157, Fair Value Measurements (the “Statement”) in this reporting period. This Statement provides a single definition of fair value, a hierarchy for measuring fair value and expanded disclosures about fair value measurements.
Various inputs are used in determining the value of the fund’s assets or liabilities carried at market value. These inputs are categorized into three broad levels. Level 1 includes quoted prices in active markets for identical assets or liabilities. Level 2 includes other significant observable market-based inputs (including quoted prices for similar securities, interest rates, prepayment speed, and credit risk). Level 3 includes unobservable inputs, which may include the adviser’s own assumptions in determining the fair value of investments. Other financial instruments are derivative instruments not reflected in total investments, such as futures, forwards, swap contracts and written options, which are valued at the unrealized appreciation/depreciation on the instrument. The following is a summary of the levels used as of June 30, 2008 in valuing the fund’s assets or liabilities carried at market value:
| Level 1 | Level 2 | Level 3 | Total | |||||||
| Investments in Securities | $2,150,641,989 | $647,494,673 | $— | $2,798,136,662 | ||||||
| Other Financial Instruments | $— | $(3,707,944 | ) | $— | $(3,707,944 | ) |
Repurchase Agreements – The fund may enter into repurchase agreements with institutions that the fund’s investment adviser has determined are creditworthy. Each repurchase agreement is recorded at cost. The fund requires that the securities collateral in a repurchase transaction be transferred to a custodian in a manner sufficient to enable the fund to obtain those securities in the event of a default under the repurchase agreement. The fund monitors, on a daily basis, the value of the collateral to ensure that its value, including accrued interest, is greater than amounts owed to the fund under each such repurchase agreement. The fund and other funds managed by Massachusetts Financial Services Company (MFS), may utilize a joint trading account for the purpose of entering into one or more repurchase agreements.
Foreign Currency Translation – Purchases and sales of foreign investments, income, and expenses are converted into U.S. dollars based upon currency exchange rates prevailing on the respective dates of such transactions. Gains and losses attributable to foreign currency exchange rates on sales of securities are recorded for financial statement purposes as net realized gains and losses on investments. Gains and losses attributable to foreign exchange rate movements on income and expenses are recorded for financial statement purposes as foreign currency transaction gains and losses. That portion of both realized and unrealized gains and losses on investments that results from fluctuations in foreign currency exchange rates is not separately disclosed.
Derivative Risk – The fund may invest in derivatives for hedging or non-hedging purposes. While hedging can reduce or eliminate losses, it can also reduce or eliminate gains. When the fund uses derivatives as an investment to gain market exposure, or for hedging purposes, gains and losses from derivative instruments may be substantially greater than the derivative’s original cost. Cash that has been segregated on behalf of certain derivative contracts will be reported separately on the Statement of Assets and Liabilities as restricted cash. On certain over-the-counter derivatives, the fund attempts to reduce its exposure to counterparty credit risk by entering into an ISDA Master Agreement on a bilateral basis with each of the counterparties with whom it undertakes a significant volume of transactions. The ISDA Master Agreement gives the fund the right, upon an event of default by the applicable counterparty, to close out all transactions traded under such agreement and to net amounts owed under each transaction to one net amount payable by one party to the other. This right to close out and net payments across all transactions traded under the ISDA Master Agreement could result in a reduction of the fund’s credit risk to such counterparty equal to any amounts payable by the fund under the applicable transactions, if any. However, absent an event of default by the counterparty, the ISDA Master Agreement does not result in an offset of reported balance sheet assets and liabilities across transactions between the fund and the applicable counterparty. Derivative instruments include forward foreign currency exchange contracts.
Forward Foreign Currency Exchange Contracts – The fund may enter into forward foreign currency exchange contracts for the purchase or sale of a specific foreign currency at a fixed price on a future date. Risks may arise upon entering into these contracts from the potential inability of counterparties to meet the terms of their contracts and from unanticipated movements in the value of the contract. The fund may enter into forward foreign currency exchange contracts for hedging purposes as well as for non-hedging purposes. For hedging purposes, the fund may enter into contracts to deliver or receive foreign currency it will receive from or require for its normal investment activities. The fund may also use contracts in a manner intended to protect foreign currency denominated securities from declines in value due to unfavorable exchange rate movements. For non-hedging purposes, the fund may enter into contracts with the intent of changing the relative exposure of the fund’s portfolio of securities to different currencies to take advantage of anticipated changes. The forward foreign currency exchange contracts are adjusted by the daily exchange rate of the underlying currency and any gains or losses are recorded as unrealized until the contract settlement date. On contract settlement date, the gains or losses are recorded as realized gains or losses on foreign currency transactions.
13
Table of Contents
Notes to Financial Statements (unaudited) – continued
In March 2008, FASB Statement No. 161, Disclosures about Derivative Instruments and Hedging Activities (the “Standard”) was issued, and is effective for financial statements issued for fiscal years and interim periods beginning after November 15, 2008. This Standard provides enhanced disclosures about the fund’s use of and accounting for derivative instruments and the effect of derivative instruments on the fund’s results of operations and financial position. Management is evaluating the application of the Standard to the fund, and has not at this time determined the impact, if any, resulting from the adoption of this Standard on the fund’s financial statements.
Security Loans – State Street Bank and Trust Company (“State Street”), as lending agent, may loan the securities of the fund to certain qualified institutions (the “Borrowers”) approved by the fund. The loans are collateralized at all times by cash and/or U.S. Treasury and federal agency obligations in an amount at least equal to the market value of the securities loaned. State Street provides the fund with indemnification against Borrower default. The fund bears the risk of loss with respect to the investment of cash collateral. On loans collateralized by cash, the cash collateral is invested in a money market fund or short-term securities. A portion of the income generated upon investment of the collateral is remitted to the Borrowers, and the remainder is allocated between the fund and the lending agent. On loans collateralized by U.S. Treasury and/or federal agency obligations, a fee is received from the Borrower, and is allocated between the fund and the lending agent. Net income from securities lending is included in interest income on the Statement of Operations. The dividend and interest income earned on the securities loaned is accounted for in the same manner as other dividend and interest income.
At June 30, 2008, the value of securities loaned was $174,914,096. These loans were collateralized by cash of $178,289,222 and U.S. Treasury obligations of $2,061,052.
Indemnifications – Under the fund’s organizational documents, its officers and trustees may be indemnified against certain liabilities and expenses arising out of the performance of their duties to the fund. Additionally, in the normal course of business, the fund enters into agreements with service providers that may contain indemnification clauses. The fund’s maximum exposure under these agreements is unknown as this would involve future claims that may be made against the fund that have not yet occurred.
Investment Transactions and Income – Investment transactions are recorded on the trade date. Interest income is recorded on the accrual basis. All premium and discount is amortized or accreted for financial statement purposes in accordance with U.S. generally accepted accounting principles. Dividends received in cash are recorded on the ex-dividend date. Certain dividends from foreign securities will be recorded when the fund is informed of the dividend if such information is obtained subsequent to the ex-dividend date. Dividend and interest payments received in additional securities are recorded on the ex-dividend or ex-interest date in an amount equal to the value of the security on such date.
The fund may receive proceeds from litigation settlements. Any proceeds received from litigation involving portfolio holdings are reflected in the Statement of Operations in realized gain/loss if the security has been disposed of by the fund or in unrealized gain/loss if the security is still held by the fund. Any other proceeds from litigation not related to portfolio holdings are reflected as other income in the Statement of Operations.
Fees Paid Indirectly – The fund’s custody fee may be reduced according to an arrangement that measures the value of cash deposited with the custodian by the fund. This amount, for the six months ended June 30, 2008, is shown as a reduction of total expenses on the Statement of Operations.
Tax Matters and Distributions – The fund intends to qualify as a regulated investment company, as defined under Subchapter M of the Internal Revenue Code, and to distribute all of its taxable income, including realized capital gains. As a result, no provision for federal income tax is required. The fund adopted the provisions of FASB Interpretation No. 48, Accounting for Uncertainty in Income Taxes (“the Interpretation”). The Interpretation prescribes a minimum threshold for financial statement recognition of the benefit of a tax position taken or expected to be taken in a tax return. There was no impact resulting from the adoption of this Interpretation on the fund’s financial statements. Each of the fund’s federal tax returns for the prior three fiscal years remains subject to examination by the Internal Revenue Service. It is the fund’s policy to record interest and penalty charges on underpaid taxes associated with its tax positions as interest expense and miscellaneous expense, respectively. No such charges were recorded in the current financial statements. Foreign taxes, if any, have been accrued by the fund in the accompanying financial statements.
Distributions to shareholders are recorded on the ex-dividend date. Income and capital gain distributions are determined in accordance with income tax regulations, which may differ from U.S. generally accepted accounting principles. Certain capital accounts in the financial statements are periodically adjusted for permanent differences in order to reflect their tax character. These adjustments have no impact on net assets or net asset value per share. Temporary differences which arise from recognizing certain items of income, expense, gain or loss in different periods for financial statement and tax purposes will reverse at some time in the future. Distributions in excess of net investment income or net realized gains are temporary overdistributions for financial statement purposes resulting from differences in the recognition or classification of income or distributions for financial statement and tax purposes.
14
Table of Contents
Notes to Financial Statements (unaudited) – continued
Book/tax differences primarily relate to amortization and accretion of debt securities, wash sale loss deferrals, foreign currency transactions, and derivative transactions.
The tax character of distributions made during the current period will be determined at fiscal year end. The tax character of distributions declared to shareholders is as follows:
| 12/31/07 | ||
| Ordinary income (including any short-term capital gains) | $73,384,844 | |
| Long-term capital gain | 87,231,662 | |
| $160,616,506 |
The federal tax cost and the tax basis components of distributable earnings were as follows:
| As of 6/30/08 | |||
| Cost of investments | $2,539,979,086 | ||
| Gross appreciation | 372,123,078 | ||
| Gross depreciation | (113,965,502 | ) | |
| Net unrealized appreciation (depreciation) | $258,157,576 | ||
| As of 12/31/07 | |||
| Undistributed ordinary income | $155,834,789 | ||
| Undistributed long-term capital gain | 232,814,191 | ||
| Other temporary differences | (162,507 | ) | |
| Net unrealized appreciation (depreciation) | $412,773,090 | ||
The aggregate cost above includes prior fiscal year end tax adjustments.
Multiple Classes of Shares of Beneficial Interest – The fund offers multiple classes of shares, which differ in their respective distribution fees. The fund’s income, realized and unrealized gain (loss), and common expenses are allocated to shareholders based on the daily net assets of each class, without distinction between share classes. Dividends are declared separately for each class. Differences in per share dividend rates are generally due to differences in separate class expenses.
| (3) | Transactions with Affiliates |
Investment Adviser – The fund has an investment advisory agreement with Massachusetts Financial Services Company (MFS) to provide overall investment management and related administrative services and facilities to the fund. The management fee is computed daily and paid monthly at an annual rate of 0.75% of the fund’s average daily net assets. The investment adviser has agreed in writing to reduce its management fee to 0.70% of average daily net assets in excess of $1 billion. This written agreement may be rescinded only upon consent of the fund’s Board of Trustees. This management fee reduction amounted to $391,455, which is shown as a reduction of total expenses in the Statement of Operations.
The management fee incurred for the six months ended June 30, 2008 was equivalent to an annual effective rate of 0.72% of the fund’s average daily net assets.
Distributor – MFS Fund Distributors, Inc. (MFD), a wholly-owned subsidiary of MFS, is the distributor of shares of the fund. The Trustees have adopted a distribution plan for the Service Class shares pursuant to Rule 12b-1 under the Investment Company Act of 1940.
The fund’s distribution plan provides that the fund will pay MFD distribution fees equal to 0.25% per annum of its average daily net assets attributable to Service Class shares as partial consideration for services performed and expenses incurred by MFD and financial intermediaries (including participating insurance companies that invest in the fund to fund variable annuity and variable life insurance contracts, sponsors of qualified retirement and pension plans that invest in the fund, and affiliates of these participating insurance companies and plan sponsors) in connection with the sale and distribution of the Service Class shares. MFD may subsequently pay all, or a portion, of the distribution fees to financial intermediaries.
Shareholder Servicing Agent – MFS Service Center, Inc. (MFSC), a wholly-owned subsidiary of MFS, receives a fee from the fund for its services as shareholder servicing agent. For the six months ended June 30, 2008, the fee was $232,397, which equated to 0.0182% annually of the fund’s average daily net assets. MFSC also receives payment from the fund for out-of-pocket expenses paid by MFSC on behalf of the fund. For the six months ended June 30, 2008, the fund did not incur any out-of-pocket expenses.
Administrator – MFS provides certain financial, legal, shareholder communications, compliance, and other administrative services to the fund. Under an administrative services agreement, the fund partially reimburses MFS the costs incurred to provide these services. The fund is charged a fixed amount plus a fee based on average daily net assets. The fund’s annual fixed amount is $17,500.
15
Table of Contents
Notes to Financial Statements (unaudited) – continued
The administrative services fee incurred for the six months ended June 30, 2008 was equivalent to an annual effective rate of 0.0126% of the fund’s average daily net assets.
Trustees’ and Officers’ Compensation – The fund pays compensation to independent trustees in the form of a retainer, attendance fees, and additional compensation to Board and Committee chairpersons. The fund does not pay compensation directly to trustees or officers of the fund who are also officers of the investment adviser, all of whom receive remuneration for their services to the fund from MFS. Certain officers and trustees of the fund are officers or directors of MFS, MFD, and MFSC.
Other – This fund and certain other MFS funds (the funds) have entered into a services agreement (the Agreement) which provides for payment of fees by the funds to Tarantino LLC in return for the provision of services of an Independent Chief Compliance Officer (ICCO) for the funds. The ICCO is an officer of the funds and the sole member of Tarantino LLC. The funds can terminate the Agreement with Tarantino LLC at any time under the terms of the Agreement. For the six months ended June 30, 2008, the fee paid by the fund to Tarantino LLC was $7,428 and is included in miscellaneous expense on the Statement of Operations. MFS has agreed to reimburse the fund for a portion of the payments made by the fund to Tarantino LLC in the amount of $7,382, which is shown as a reduction of total expenses in the Statement of Operations. Additionally, MFS has agreed to bear all expenses associated with office space, other administrative support, and supplies provided to the ICCO.
The fund may invest in a money market fund managed by MFS which seeks preservation of capital and current income. Income earned on this investment is included in dividends from underlying funds on the Statement of Operations. This money market fund does not pay a management fee to MFS.
| (4) | Portfolio Securities |
Purchases and sales of investments, other than U.S. Government securities, purchased option transactions, and short-term obligations, aggregated $832,368,674 and $774,733,368, respectively.
| (5) | Shares of Beneficial Interest |
The fund’s Declaration of Trust permits the Trustees to issue an unlimited number of full and fractional shares of beneficial interest. Transactions in fund shares were as follows:
| Six months ended 6/30/08 | Year ended 12/31/07 | |||||||||||
| Shares | Amount | Shares | Amount | |||||||||
| Shares sold | ||||||||||||
Initial Class | 1,818,613 | $57,389,768 | 8,232,895 | $262,750,749 | ||||||||
Service Class | 5,882,973 | 181,696,417 | 16,585,288 | 526,837,557 | ||||||||
| 7,701,586 | $239,086,185 | 24,818,183 | $789,588,306 | |||||||||
| Shares issued to shareholders in reinvestment of distributions | ||||||||||||
Initial Class | 4,776,277 | $134,786,538 | 2,137,220 | $64,843,245 | ||||||||
Service Class | 9,095,827 | 253,864,546 | 3,185,010 | 95,773,261 | ||||||||
| 13,872,104 | $388,651,084 | 5,322,230 | $160,616,506 | |||||||||
| Shares reacquired | ||||||||||||
Initial Class | (3,685,915 | ) | $(114,147,658 | ) | (6,523,641 | ) | $(205,644,304 | ) | ||||
Service Class | (3,783,226 | ) | (116,925,280 | ) | (3,716,396 | ) | (116,090,560 | ) | ||||
| (7,469,141 | ) | $(231,072,938 | ) | (10,240,037 | ) | $(321,734,864 | ) | |||||
| Net change | ||||||||||||
Initial Class | 2,908,975 | $78,028,648 | 3,846,474 | $121,949,690 | ||||||||
Service Class | 11,195,574 | 318,635,683 | 16,053,902 | 506,520,258 | ||||||||
| 14,104,549 | $396,664,331 | 19,900,376 | $628,469,948 | |||||||||
| (6) | Line of Credit |
The fund and other funds managed by MFS participate in a $1 billion unsecured committed line of credit provided by a syndication of banks under a credit agreement. In addition, the fund and other funds managed by MFS have established uncommitted borrowing arrangements with certain banks. Borrowings may be made for temporary financing needs. Interest is charged to each fund, based on its borrowings, generally at a rate equal to the Federal Reserve funds rate plus 0.30%. In addition, a commitment fee, based on the average daily, unused portion of the committed line of credit, is allocated among the participating funds at the end of each calendar quarter. For the six months ended June 30, 2008, the fund’s commitment fee and interest expense were $5,255 and $0, respectively, and are included in miscellaneous expense on the Statement of Operations.
16
Table of Contents
Notes to Financial Statements (unaudited) – continued
| (7) | Transactions in Underlying Funds – Affiliated Issuers |
An affiliated issuer may be considered one in which the fund owns 5% or more of the outstanding voting securities, or a company which is under common control. For the purposes of this report, the fund assumes the following to be affiliated issuers:
| Underlying Funds | Beginning Shares/Par Amount | Acquisitions Shares/Par Amount | Dispositions Shares/Par Amount | Ending Shares/Par Amount | ||||
| MFS Institutional Money Market Portfolio | 64,178,419 | 281,489,414 | 325,536,574 | 20,131,259 | ||||
| Underlying Funds | Realized Gain (Loss) | Capital Gain Distributions | Dividend Income | Ending Value | ||||
| MFS Institutional Money Market Portfolio | $— | $— | $670,148 | $20,131,259 | ||||
17
Table of Contents
BOARD REVIEW OF INVESTMENT ADVISORY AGREEMENT
A discussion regarding the Board’s most recent review and renewal of the fund’s Investment Advisory Agreement with MFS will be available on or about November 1, 2008 by clicking on the fund’s name under “Variable Insurance Portfolios - VIT” in the “Products and Performance” section of the MFS Web site (mfs.com).
PROXY VOTING POLICIES AND INFORMATION
A general description of the MFS funds’ proxy voting policies and procedures is available without charge, upon request, by calling
1-800-225-2606, by visiting the Proxy Voting section of mfs.com or by visiting the SEC’s Web site at http://www.sec.gov.
Information regarding how the fund voted proxies relating to portfolio securities during the most recent twelve-month period ended June 30 is available without charge by visiting the Proxy Voting section of mfs.com or by visiting the SEC’s Web site at http://www.sec.gov.
QUARTERLY PORTFOLIO DISCLOSURE
The fund will file a complete schedule of portfolio holdings with the Securities and Exchange Commission (the Commission) for the first and third quarters of each fiscal year on Form N-Q. The fund’s Form N-Q may be reviewed and copied at the:
Public Reference Room
Securities and Exchange Commission
100 F Street, NE, Room 1580
Washington, D.C. 20549
Information on the operation of the Public Reference Room may be obtained by calling the Commission at 1-800-SEC-0330. The fund’s Form N-Q is available on the EDGAR database on the Commission’s Internet Web site at http://www.sec.gov, and copies of this information may be obtained, upon payment of a duplicating fee, by electronic request at the following e-mail address: publicinfo@sec.gov or by writing the Public Reference Section at the above address.
18
Table of Contents
CONTACT US
Web site
mfs.com
Account service and
literature
Shareholders
1-877-411-3325
9 a.m. to 5 p.m. Eastern Time
Investment professionals
1-800-637-8730
8 a.m. to 5 p.m. Eastern Time
Mailing address
MFS Service Center, Inc.
Attn: Institutional Alliance Services (IAS)
P.O. Box 55824
Boston, MA 02205-5824
Overnight mail
MFS Service Center, Inc.
c/o Boston Financial Data Services
30 Dan Road
Canton, MA 02021-2809

Table of Contents

Table of Contents
| CONTACT INFORMATION | BACK COVER | |||
This report is prepared for the general information of contract owners. It is authorized for distribution to prospective investors only when preceded or accompanied by a current prospectus.
NOT FDIC INSURED Ÿ MAY LOSE VALUE Ÿ NO BANK OR CREDIT UNION GUARANTEE Ÿ NOT A DEPOSIT Ÿ NOT INSURED BY ANY FEDERAL GOVERNMENT AGENCY OR NCUA/NCUSIF
Table of Contents

Dear Contract Owners:
Negative headlines tend to resonate during difficult markets, and we certainly have had more than our share of tough news recently. As a result consumer, and particularly investor, sentiment are at all-time lows. That said, I do think it is helpful to remember there are always silver linings in the storm clouds if you look hard enough.
Through all of the challenges we have faced, there are some positive underlying trends. In the United States, for example, institutional traders and credit market followers are just now showing increasing signs of confidence and are beginning to take on more risk. At the corporate level, earnings continue to be relatively strong as companies have reduced labor costs, controlled inventories, and relied less on debt to finance expansion. More broadly, low interest rates and strong demand for consumer goods and industrial equipment are good signs for the global economy.
While I do not mean to minimize the risks inherent in today’s markets, periods such as these allow the talented fund managers and research analysts we have at MFS® to test their convictions, reevaluate existing positions, and identify new investment ideas. Our investment process also includes a significant risk management component, with constant attention paid to monitoring market risk, so we can do our best to minimize any surprises to your portfolio.
For investors, this is a great time to check in with your advisor and make sure you have a sound investment plan in place — one that can keep your hard-earned money working over the long term through a strategy that involves asset allocation, diversification, and periodic portfolio rebalancing and reviews. A plan tailored to your distinct needs and goals continues to be the best approach to help you take advantage of the inevitable challenges — and opportunities — that present themselves over time.
Respectfully,

Robert J. Manning
Chief Executive Officer and Chief Investment Officer
MFS Investment Management®
August 15, 2008
The opinions expressed in this letter are subject to change, may not be relied upon for investment advice, and no forecasts can be guaranteed.
1
Table of Contents
Portfolio structure

| Top ten holdings | ||
| Lockheed Martin Corp. | 4.4% | |
| TOTAL S.A., ADR | 3.3% | |
| Exxon Mobil Corp. | 3.2% | |
| Allstate Corp. | 3.1% | |
| Philip Morris International, Inc. | 2.9% | |
| MetLife, Inc. | 2.3% | |
| AT&T, Inc. | 2.3% | |
| Oracle Corp. | 2.2% | |
| Wyeth | 2.0% | |
| Johnson & Johnson | 1.9% |
| Equity sectors | ||
| Financial Services | 19.6% | |
| Energy | 17.2% | |
| Consumer Staples | 11.1% | |
| Industrial Goods & Services | 10.4% | |
| Utilities & Communications | 9.7% | |
| Health Care | 8.1% | |
| Technology | 6.5% | |
| Retailing | 4.2% | |
| Leisure | 3.5% | |
| Basic Materials | 2.9% | |
| Autos & Housing | 2.5% | |
| Special Products & Services | 2.3% | |
| Transportation | 0.9% |
Percentages are based on net assets as of 6/30/08.
The portfolio is actively managed and current holdings may be different.
2
Table of Contents
Fund Expenses Borne by the Contract Holders During the Period,
January 1, 2008 through June 30, 2008
As a contract holder of the fund, you incur ongoing costs, including management fees; distribution (12b-1) fees; and other fund expenses. This example is intended to help you understand your ongoing costs (in dollars) of investing in the fund and to compare these costs with the ongoing costs of investing in other mutual funds.
The example is based on an investment of $1,000 invested at the beginning of the period and held for the entire period January 1, 2008 through June 30, 2008.
Actual Expenses
The first line for each share class in the following table provides information about actual account values and actual expenses. You may use the information in this line, together with the amount you invested, to estimate the expenses that you paid over the period. Simply divide your account value by $1,000 (for example, an $8,600 account value divided by $1,000 = 8.6), then multiply the result by the number in the first line under the heading entitled “Expenses Paid During Period” to estimate the expenses you paid on your account during this period.
Hypothetical Example for Comparison Purposes
The second line for each share class in the following table provides information about hypothetical account values and hypothetical expenses based on the fund’s actual expense ratio and an assumed rate of return of 5% per year before expenses, which is not the fund’s actual return. The hypothetical account values and expenses may not be used to estimate the actual ending account balance or expenses you paid for the period. You may use this information to compare the ongoing costs of investing in the fund and other funds. To do so, compare this 5% hypothetical example with the 5% hypothetical examples that appear in the shareholder reports of the other funds.
Please note that the expenses shown in the table are meant to highlight the fund’s ongoing costs only and do not take into account the fees and expenses imposed under the variable contracts through which your investment in the fund is made. Therefore, the second line for each share class in the table is useful in comparing ongoing costs associated with an investment in vehicles (such as the fund) which fund benefits under variable annuity and variable life insurance contracts and to qualified pension and retirement plans only, and will not help you determine the relative total costs of investing in the fund through variable annuity and variable life insurance contracts. If the fees and expenses imposed under the variable contracts were included, your costs would have been higher.
| Share Class | Annualized Expense Ratio | Beginning Account Value 1/01/08 | Ending Account Value 6/30/08 | Expenses Paid During Period (p) 1/01/08-6/30/08 | ||||||
| Initial Class | Actual | 0.82% | $1,000.00 | $893.15 | $3.86 | |||||
| Hypothetical (h) | 0.82% | $1,000.00 | $1,020.79 | $4.12 | ||||||
| Service Class | Actual | 1.07% | $1,000.00 | $891.68 | $5.03 | |||||
| Hypothetical (h) | 1.07% | $1,000.00 | $1,019.54 | $5.37 |
| (h) | 5% class return per year before expenses. |
| (p) | Expenses paid is equal to each class’ annualized expense ratio, as shown above, multiplied by the average account value over the period, multiplied by the number of days in the period, divided by the number of days in the year. |
3
Table of Contents
PORTFOLIO OF INVESTMENTS – 6/30/08 (unaudited)
The Portfolio of Investments is a complete list of all securities owned by your fund. It is categorized by broad-based asset classes.
| Issuer | Shares/Par | Value ($) | |||
| COMMON STOCKS – 98.9% | |||||
| Aerospace – 8.2% | |||||
| Lockheed Martin Corp. | 268,840 | $ | 26,523,756 | ||
| Northrop Grumman Corp. | 165,600 | 11,078,640 | |||
| Raytheon Co. | 28,210 | 1,587,659 | |||
| United Technologies Corp. | 164,510 | 10,150,267 | |||
| $ | 49,340,322 | ||||
| Alcoholic Beverages – 1.2% | |||||
| Diageo PLC | 384,368 | $ | 7,065,124 | ||
| Apparel Manufacturers – 1.5% | |||||
| NIKE, Inc., “B” | 150,980 | $ | 8,999,918 | ||
| Automotive – 0.6% | |||||
| Johnson Controls, Inc. | 127,280 | $ | 3,650,390 | ||
| Broadcasting – 2.7% | |||||
| Omnicom Group, Inc. | 152,100 | $ | 6,826,248 | ||
| Walt Disney Co. | 230,340 | 7,186,608 | |||
| WPP Group PLC | 253,150 | 2,438,963 | |||
| $ | 16,451,819 | ||||
| Brokerage & Asset Managers – 3.8% | |||||
| Deutsche Boerse AG | 6,280 | $ | 704,880 | ||
| Franklin Resources, Inc. | 63,250 | 5,796,863 | |||
| Goldman Sachs Group, Inc. | 62,302 | 10,896,620 | |||
| Invesco Ltd. | 46,960 | 1,126,101 | |||
| Merrill Lynch & Co., Inc. | 142,295 | 4,512,174 | |||
| $ | 23,036,638 | ||||
| Business Services – 2.3% | |||||
| Accenture Ltd., “A” | 285,460 | $ | 11,623,931 | ||
| Automatic Data Processing, Inc. | 29,990 | 1,256,581 | |||
| Western Union Co. | 49,450 | 1,222,404 | |||
| $ | 14,102,916 | ||||
| Chemicals – 2.1% | |||||
| 3M Co. | 36,260 | $ | 2,523,333 | ||
| PPG Industries, Inc. | 177,096 | 10,159,998 | |||
| $ | 12,683,331 | ||||
| Computer Software – 2.2% | |||||
| Oracle Corp. (a) | 636,390 | $ | 13,364,190 | ||
| Computer Software – Systems – 2.3% | |||||
| Hewlett-Packard Co. | 96,500 | $ | 4,266,265 | ||
| International Business Machines Corp. | 78,750 | 9,334,238 | |||
| $ | 13,600,503 | ||||
| Construction – 1.9% | |||||
| Masco Corp. | 312,030 | $ | 4,908,232 | ||
| Sherwin-Williams Co. | 86,800 | 3,986,724 | |||
| Toll Brothers, Inc. (a) | 133,310 | 2,496,896 | |||
| $ | 11,391,852 | ||||
| Consumer Goods & Services – 1.2% | |||||
| Procter & Gamble Co. | 121,230 | $ | 7,371,996 | ||
| Issuer | Shares/Par | Value ($) | |||
| COMMON STOCKS – continued | |||||
| Containers – 0.0% | |||||
| Smurfit-Stone Container Corp. (a) | 8,120 | $ | 33,048 | ||
| Electrical Equipment – 0.9% | |||||
| W.W. Grainger, Inc. | 66,960 | $ | 5,477,328 | ||
| Electronics – 1.8% | |||||
| Intel Corp. | 511,990 | $ | 10,997,545 | ||
| Energy – Independent – 4.6% | |||||
| Apache Corp. | 69,940 | $ | 9,721,660 | ||
| Devon Energy Corp. | 92,310 | 11,091,970 | |||
| EOG Resources, Inc. | 50,380 | 6,609,856 | |||
| $ | 27,423,486 | ||||
| Energy – Integrated – 12.6% | |||||
| Chevron Corp. | 116,330 | $ | 11,531,793 | ||
| ConocoPhillips | 95,490 | 9,013,301 | |||
| Exxon Mobil Corp. | 220,628 | 19,443,946 | |||
| Hess Corp. | 91,570 | 11,555,218 | |||
| Marathon Oil Corp. | 95,260 | 4,941,136 | |||
| TOTAL S.A., ADR | 231,522 | 19,741,881 | |||
| $ | 76,227,275 | ||||
| Food & Beverages – 4.8% | |||||
| General Mills, Inc. | 98,300 | $ | 5,973,691 | ||
| Kellogg Co. | 186,010 | 8,932,200 | |||
| Nestle S.A. | 168,457 | 7,623,879 | |||
| PepsiCo, Inc. | 96,558 | 6,140,123 | |||
| $ | 28,669,893 | ||||
| Food & Drug Stores – 1.2% | |||||
| CVS Caremark Corp. | 184,411 | $ | 7,297,143 | ||
| Gaming & Lodging – 0.8% | |||||
| Royal Caribbean Cruises Ltd. | 221,060 | $ | 4,967,218 | ||
| General Merchandise – 0.8% | |||||
| Macy’s, Inc. | 236,770 | $ | 4,598,073 | ||
| Health Maintenance Organizations – 1.0% | |||||
| UnitedHealth Group, Inc. | 95,340 | $ | 2,502,675 | ||
| WellPoint, Inc. (a) | 74,490 | 3,550,193 | |||
| $ | 6,052,868 | ||||
| Insurance – 8.2% | |||||
| Allstate Corp. | 404,195 | $ | 18,427,250 | ||
| Aon Corp. | 45,360 | 2,083,838 | |||
| Chubb Corp. | 78,210 | 3,833,072 | |||
| Genworth Financial, Inc., “A” | 226,030 | 4,025,594 | |||
| Hartford Financial Services Group, Inc. | 59,553 | 3,845,337 | |||
| MetLife, Inc. | 259,643 | 13,701,361 | |||
| Prudential Financial, Inc. | 60,890 | 3,637,569 | |||
| $ | 49,554,021 | ||||
4
Table of Contents
Portfolio of Investments (unaudited) – continued
| Issuer | Shares/Par | Value ($) | |||
| COMMON STOCKS – continued | |||||
| Machinery & Tools – 1.3% | |||||
| Eaton Corp. | 36,370 | $ | 3,090,359 | ||
| Ingersoll-Rand Co. Ltd., “A” | 87,740 | 3,284,108 | |||
| Timken Co. | 49,580 | 1,633,165 | |||
| $ | 8,007,632 | ||||
| Major Banks – 6.7% | |||||
| Bank of America Corp. | 341,146 | $ | 8,143,155 | ||
| Bank of New York Mellon Corp. | 291,570 | 11,030,093 | |||
| JPMorgan Chase & Co. | 57,180 | 1,961,846 | |||
| PNC Financial Services Group, Inc. | 91,530 | 5,226,363 | |||
| State Street Corp. | 145,590 | 9,316,304 | |||
| SunTrust Banks, Inc. | 125,473 | 4,544,632 | |||
| $ | 40,222,393 | ||||
| Network & Telecom – 0.2% | |||||
| Cisco Systems, Inc. (a) | 40,300 | $ | 937,378 | ||
| Other Banks & Diversified Financials – 0.9% | |||||
| American Express Co. | 68,307 | $ | 2,573,125 | ||
| UBS AG (a) | 127,986 | 2,650,154 | |||
| $ | 5,223,279 | ||||
| Pharmaceuticals – 7.1% | |||||
| Abbott Laboratories | 50,940 | $ | 2,698,292 | ||
| GlaxoSmithKline PLC | 180,440 | 3,991,025 | |||
| Johnson & Johnson | 180,940 | 11,641,680 | |||
| Merck & Co., Inc. | 258,820 | 9,754,926 | |||
| Pfizer, Inc. | 155,060 | 2,708,898 | |||
| Wyeth | 255,380 | 12,248,025 | |||
| $ | 43,042,846 | ||||
| Railroad & Shipping – 0.9% | |||||
| Burlington Northern Santa Fe Corp. | 56,040 | $ | 5,597,836 | ||
| Specialty Chemicals – 0.8% | |||||
| Air Products & Chemicals, Inc. | 35,916 | $ | 3,550,656 | ||
| Praxair, Inc. | 15,966 | 1,504,636 | |||
| $ | 5,055,292 | ||||
| Specialty Stores – 0.7% | |||||
| Advance Auto Parts, Inc. | 30,720 | $ | 1,192,858 | ||
| Staples, Inc. | 135,910 | 3,227,863 | |||
| $ | 4,420,721 | ||||
| Telecommunications – Wireless – 1.2% | |||||
| Rogers Communications, Inc., “B” | 40,110 | $ | 1,559,231 | ||
| Vodafone Group PLC | 1,952,963 | 5,758,892 | |||
| $ | 7,318,123 | ||||
| Issuer | Shares/Par | Value ($) | |||||
| COMMON STOCKS – continued | |||||||
| Telephone Services – 3.0% | |||||||
| AT&T, Inc. | 404,190 | $ | 13,617,161 | ||||
| Embarq Corp. | 46,377 | 2,192,241 | |||||
| Verizon Communications, Inc. | 69,850 | 2,472,690 | |||||
| $ | 18,282,092 | ||||||
| Tobacco – 3.9% | |||||||
| Altria Group, Inc. | 149,411 | $ | 3,071,890 | ||||
| Lorillard, Inc. (a) | 43,720 | 3,023,675 | |||||
| Philip Morris International, Inc. | 357,891 | 17,676,236 | |||||
| $ | 23,771,801 | ||||||
| Utilities – Electric Power – 5.5% | |||||||
| Dominion Resources, Inc. | 182,462 | $ | 8,665,120 | ||||
| Entergy Corp. | 46,500 | 5,602,320 | |||||
| FPL Group, Inc. | 81,640 | 5,353,951 | |||||
| PG&E Corp. | 96,120 | 3,815,003 | |||||
| PPL Corp. | 81,420 | 4,255,823 | |||||
| Public Service Enterprise Group, Inc. | 115,740 | 5,315,938 | |||||
| $ | 33,008,155 | ||||||
| Total Common Stocks (Identified Cost, $590,166,833) | $ | 597,244,445 | |||||
| SHORT-TERM OBLIGATIONS – 1.5% | |||||||
| Toyota Motor Credit Corp., 2.57%, due 7/01/08, at Amortized Cost and Value (y) | $ | 9,060,000 | $ | 9,060,000 | |||
| Total Investments (Identified Cost, $599,226,833) | $ | 606,304,445 | |||||
| OTHER ASSETS, LESS LIABILITIES – (0.4)% | (2,351,728 | ) | |||||
| Net Assets – 100.0% | $ | 603,952,717 | |||||
| (a) | Non-income producing security. |
| (y) | The rate shown represents an annualized yield at time of purchase. |
The following abbreviations are used in this report and are defined:
| ADR | American Depository Receipt |
See Notes to Financial Statements
5
Table of Contents
FINANCIAL STATEMENTS | STATEMENT OF ASSETS AND LIABILITIES (unaudited)
This statement represents your fund’s balance sheet, which details the assets and liabilities comprising the total value of the fund.
At 6/30/08 | |||||
Assets | |||||
Investments, at value (identified cost, $599,226,833) | $606,304,445 | ||||
Cash | 251 | ||||
Foreign currency, at value (identified cost, $15) | 15 | ||||
Receivable for investments sold | 1,959,915 | ||||
Receivable for fund shares sold | 1,605,960 | ||||
Interest and dividends receivable | 1,107,205 | ||||
Other assets | 3,966 | ||||
Total assets | $610,981,757 | ||||
Liabilities | |||||
Payable for investments purchased | $6,293,013 | ||||
Payable for fund shares reacquired | 593,456 | ||||
Payable to affiliates | |||||
Management fee | 49,445 | ||||
Shareholder servicing costs | 909 | ||||
Distribution fees | 5,888 | ||||
Administrative services fee | 923 | ||||
Payable for independent trustees’ compensation | 2,642 | ||||
Accrued expenses and other liabilities | 82,764 | ||||
Total liabilities | $7,029,040 | ||||
Net assets | $603,952,717 | ||||
Net assets consist of | |||||
Paid-in capital | $610,168,999 | ||||
Unrealized appreciation (depreciation) on investments and translation of assets and liabilities in foreign currencies | 7,081,832 | ||||
Accumulated distributions in excess of net realized gain on investments and foreign currency transactions | (17,532,523 | ) | |||
Undistributed net investment income | 4,234,409 | ||||
Net assets | $603,952,717 | ||||
Shares of beneficial interest outstanding | 46,857,311 | ||||
Initial Class shares | |||||
Net assets | $387,097,759 | ||||
Shares outstanding | 29,948,372 | ||||
Net asset value per share | $12.93 | ||||
Service Class shares | |||||
Net assets | $216,854,958 | ||||
Shares outstanding | 16,908,939 | ||||
Net asset value per share | $12.82 |
See Notes to Financial Statements
6
Table of Contents
FINANCIAL STATEMENTS | STATEMENT OF OPERATIONS (unaudited)
This statement describes how much your fund earned in investment income and accrued in expenses. It also describes any gains and/or losses generated by fund operations.
| Six months ended 6/30/08 | ||||||
| Net investment income | ||||||
Income | ||||||
Dividends | $6,868,064 | |||||
Interest | 112,263 | |||||
Foreign taxes withheld | (92,162 | ) | ||||
Total investment income | $6,888,165 | |||||
Expenses | ||||||
Management fee | $2,188,893 | |||||
Distribution fees | 250,333 | |||||
Shareholder servicing costs | 53,063 | |||||
Administrative services fee | 41,062 | |||||
Independent trustees’ compensation | 8,911 | |||||
Custodian fee | 55,863 | |||||
Shareholder communications | 12,103 | |||||
Auditing fees | 23,288 | |||||
Legal fees | 4,219 | |||||
Miscellaneous | 17,104 | |||||
Total expenses | $2,654,839 | |||||
Reduction of expenses by investment adviser | (1,684 | ) | ||||
Net expenses | $2,653,155 | |||||
Net investment income | $4,235,010 | |||||
Realized and unrealized gain (loss) on investments | ||||||
Realized gain (loss) (identified cost basis) | ||||||
Investment transactions | $(16,621,408 | ) | ||||
Foreign currency transactions | 6,198 | |||||
Net realized gain (loss) on investments and foreign currency transactions | $(16,615,210 | ) | ||||
Change in unrealized appreciation (depreciation) | ||||||
Investments | $(54,784,639 | ) | ||||
Translation of assets and liabilities in foreign currencies | 8,068 | |||||
| Net unrealized gain (loss) on investments and foreign currency translation | $(54,776,571 | ) | ||||
Net realized and unrealized gain (loss) on investments and foreign currency | $(71,391,781 | ) | ||||
Change in net assets from operations | $(67,156,771 | ) |
See Notes to Financial Statements
7
Table of Contents
FINANCIAL STATEMENTS | STATEMENTS OF CHANGES IN NET ASSETS
These statements describe the increases and/or decreases in net assets resulting from operations, any distributions, and any shareholder transactions.
| Six months ended 6/30/08 | | Year ended 12/31/07 | | |||
Change in net assets | (unaudited | ) | ||||
From operations | ||||||
Net investment income | $4,235,010 | $6,564,856 | ||||
Net realized gain (loss) on investments and foreign currency transactions | (16,615,210 | ) | 23,304,339 | |||
Net unrealized gain (loss) on investments and foreign currency translation | (54,776,571 | ) | 2,694,524 | |||
Change in net assets from operations | $(67,156,771 | ) | $32,563,719 | |||
Distributions declared to shareholders | ||||||
From net investment income | ||||||
Initial Class | $(4,556,105 | ) | $(2,853,983 | ) | ||
Service Class | (2,012,527 | ) | (1,283,481 | ) | ||
From net realized gain on investments | ||||||
Initial Class | (15,373,508 | ) | (4,887,597 | ) | ||
Service Class | (8,229,686 | ) | (2,574,458 | ) | ||
Total distributions declared to shareholders | $(30,171,826 | ) | $(11,599,519 | ) | ||
Change in net assets from fund share transactions | $113,090,581 | $170,561,899 | ||||
Total change in net assets | $15,761,984 | $191,526,099 | ||||
Net assets | ||||||
At beginning of period | 588,190,733 | 396,664,634 | ||||
At end of period (including undistributed net investment income of $4,234,409 and | $603,952,717 | $588,190,733 |
See Notes to Financial Statements
8
Table of Contents
FINANCIAL STATEMENTS | FINANCIAL HIGHLIGHTS
The financial highlights table is intended to help you understand the fund’s financial performance for the semiannual period and the past 5 fiscal years. Certain information reflects financial results for a single fund share. The total returns in the table represent the rate by which an investor would have earned (or lost) on an investment in the fund share class (assuming reinvestment of all distributions) held for the entire period.
| Initial Class | Six months ended 6/30/08 | Years ended 12/31 | ||||||||||||||||
| 2007 | 2006 | 2005 | 2004 | 2003 | ||||||||||||||
| (unaudited) | ||||||||||||||||||
Net asset value, beginning of period | $15.25 | $14.52 | $12.52 | $12.13 | $10.76 | $8.63 | ||||||||||||
Income (loss) from investment operations | ||||||||||||||||||
Net investment income (d) | $0.11 | $0.21 | $0.22 | $0.18 | $0.16 | $0.14 | ||||||||||||
Net realized and unrealized gain (loss) on | (1.70 | ) | 0.92 | 2.32 | 0.60 | 1.44 | 2.01 | |||||||||||
Total from investment operations | $(1.59 | ) | $1.13 | $2.54 | $0.78 | $1.60 | $2.15 | |||||||||||
Less distributions declared to shareholders | ||||||||||||||||||
From net investment income | $(0.17 | ) | $(0.15 | ) | $(0.14 | ) | $(0.10 | ) | $(0.06 | ) | $(0.02 | ) | ||||||
From net realized gain on investments | (0.56 | ) | (0.25 | ) | (0.40 | ) | (0.29 | ) | (0.17 | ) | — | |||||||
Total distributions declared to shareholders | $(0.73 | ) | $(0.40 | ) | $(0.54 | ) | $(0.39 | ) | $(0.23 | ) | $(0.02 | ) | ||||||
Net asset value, end of period | $12.93 | $15.25 | $14.52 | $12.52 | $12.13 | $10.76 | ||||||||||||
Total return (%) (k)(r)(s) | (10.68 | )(n) | 7.91 | 20.84 | 6.66 | 15.18 | 24.96 | |||||||||||
| Ratios (%) (to average net assets) and Supplemental data: | ||||||||||||||||||
Expenses before expense reductions (f) | 0.82 | (a) | 0.86 | 0.88 | 0.91 | 0.93 | 1.18 | |||||||||||
Expenses after expense reductions (f) | 0.82 | (a) | 0.86 | 0.88 | 0.90 | 0.90 | 0.90 | |||||||||||
Net investment income | 1.53 | (a) | 1.41 | 1.65 | 1.50 | 1.44 | 1.45 | |||||||||||
Portfolio turnover | 17 | 23 | 25 | 20 | 34 | 48 | ||||||||||||
Net assets at end of period (000 Omitted) | $387,098 | $390,346 | $256,529 | $132,371 | $83,704 | $36,981 | ||||||||||||
See Notes to Financial Statements
9
Table of Contents
Financial Highlights – continued
| Service Class | Six months ended 6/30/08 | Years ended 12/31 | ||||||||||||||||
| 2007 | 2006 | 2005 | 2004 | 2003 | ||||||||||||||
| (unaudited) | ||||||||||||||||||
Net asset value, beginning of period | $15.12 | $14.42 | $12.44 | $12.07 | $10.73 | $8.62 | ||||||||||||
Income (loss) from investment operations | ||||||||||||||||||
Net investment income (d) | $0.09 | $0.17 | $0.18 | $0.15 | $0.13 | $0.11 | ||||||||||||
Net realized and unrealized gain (loss) on | (1.69 | ) | 0.91 | 2.32 | 0.59 | 1.43 | 2.02 | |||||||||||
Total from investment operations | $(1.60 | ) | $1.08 | $2.50 | $0.74 | $1.56 | $2.13 | |||||||||||
Less distributions declared to shareholders | ||||||||||||||||||
From net investment income | $(0.14 | ) | $(0.13 | ) | $(0.12 | ) | $(0.08 | ) | $(0.05 | ) | $(0.02 | ) | ||||||
From net realized gain on investments | (0.56 | ) | (0.25 | ) | (0.40 | ) | (0.29 | ) | (0.17 | ) | — | |||||||
Total distributions declared to shareholders | $(0.70 | ) | $(0.38 | ) | $(0.52 | ) | $(0.37 | ) | $(0.22 | ) | $(0.02 | ) | ||||||
Net asset value, end of period | $12.82 | $15.12 | $14.42 | $12.44 | $12.07 | $10.73 | ||||||||||||
Total return (%) (k)(r)(s) | (10.83 | )(n) | 7.59 | 20.60 | 6.38 | 14.82 | 24.71 | |||||||||||
| Ratios (%) (to average net assets) and Supplemental data: | ||||||||||||||||||
Expenses before expense reductions (f) | 1.07 | (a) | 1.11 | 1.13 | 1.16 | 1.18 | 1.43 | |||||||||||
Expenses after expense reductions (f) | 1.07 | (a) | 1.11 | 1.13 | 1.15 | 1.15 | 1.15 | |||||||||||
Net investment income | 1.29 | (a) | 1.16 | 1.40 | 1.25 | 1.19 | 1.22 | |||||||||||
Portfolio turnover | 17 | 23 | 25 | 20 | 34 | 48 | ||||||||||||
Net assets at end of period (000 Omitted) | $216,855 | $197,844 | $140,135 | $60,247 | $35,500 | $18,137 | ||||||||||||
| (a) | Annualized. |
| (d) | Per share data is based on average shares outstanding. |
| (f) | Ratios do not reflect reductions from fees paid indirectly, if applicable. |
| (k) | The total return does not reflect expenses that apply to separate accounts. Inclusion of these charges would reduce the total return figures for all periods shown. |
| (n) | Not annualized. |
| (r) | Certain expenses have been reduced without which performance would have been lower. |
| (s) | From time to time the fund may receive proceeds from litigation settlements, without which performance would be lower. |
See Notes to Financial Statements
10
Table of Contents
NOTES TO FINANCIAL STATEMENTS (unaudited)
| (1) | Business and Organization |
MFS Value Series (the fund) is a series of MFS Variable Insurance Trust (the trust). The trust is organized as a Massachusetts business trust and is registered under the Investment Company Act of 1940, as amended, as an open-end management investment company. The shareholders of each series of the trust are separate accounts of insurance companies, which offer variable annuity and/or life insurance products, and qualified retirement and pension plans.
| (2) | Significant Accounting Policies |
General – The preparation of financial statements in conformity with U.S. generally accepted accounting principles requires management to make estimates and assumptions that affect the reported amounts of assets and liabilities, and disclosure of contingent assets and liabilities at the date of the financial statements and the reported amounts of revenues and expenses during the reporting period. Actual results could differ from those estimates. The fund can invest in foreign securities. Investments in foreign securities are vulnerable to the effects of changes in the relative values of the local currency and the U.S. dollar and to the effects of changes in each country’s legal, political, and economic environment.
In March 2008, FASB Statement No. 161, Disclosures about Derivative Instruments and Hedging Activities (the “Standard”) was issued, and is effective for financial statements issued for fiscal years and interim periods beginning after November 15, 2008. This Standard provides enhanced disclosures about the fund’s use of and accounting for derivative instruments and the effect of derivative instruments on the fund’s results of operations and financial position. Management is evaluating the application of the Standard to the fund, and has not at this time determined the impact, if any, resulting from the adoption of this Standard on the fund’s financial statements.
Investment Valuations – Equity securities, including restricted equity securities, are generally valued at the last sale or official closing price as reported by an independent pricing service on the market or exchange on which they are primarily traded. For securities for which there were no sales reported that day, equity securities are generally valued at the last quoted daily bid quotation as reported by an independent pricing service on the market or exchange on which they are primarily traded. For securities held short for which there were no sales reported for the day, the position is generally valued at the last quoted daily ask quotation as reported by an independent pricing service on the market or exchange on which such securities are primarily traded. Short term instruments with a maturity at issuance of 60 days or less may be valued at amortized cost, which approximates market value. Securities and other assets generally valued on the basis of information from an independent pricing service may also be valued at a broker-dealer bid quotation. The values of foreign securities and other assets and liabilities expressed in foreign currencies are converted to U.S. dollars using the mean of bid and asked prices for rates reported by an independent pricing service.
The Board of Trustees has delegated primary responsibility for determining or causing to be determined the value of the fund’s investments (including any fair valuation) to the adviser pursuant to valuation policies and procedures approved by the Board. If the adviser determines that reliable market quotations are not readily available, investments are valued at fair value as determined in good faith by the adviser in accordance with such procedures under the oversight of the Board of Trustees. Under the fund’s valuation policies and procedures, market quotations are not considered to be readily available for most types of debt instruments and floating rate loans and many types of derivatives. These investments are generally valued at fair value based on information from independent pricing services. In addition, investments may be valued at fair value if the adviser determines that an investment’s value has been materially affected by events occurring after the close of the exchange or market on which the investment is principally traded (such as foreign exchange or market) and prior to the determination of the fund’s net asset value, or after the halting of trading of a specific security where trading does not resume prior to the close of the exchange or market on which the security is principally traded. Events that occur on a frequent basis after foreign markets close (such as developments in foreign markets and significant movements in the U.S. markets) and prior to the determination of the fund’s net asset value may be deemed to have a material affect on the value of securities traded in foreign markets. Accordingly, the fund’s foreign equity securities may often be valued at fair value. The adviser may rely on independent pricing services or other information (such as the correlation with price movements of similar securities in the same or other markets; the type, cost and investment characteristics of the security; the business and financial condition of the issuer; and trading and other market data) to assist in determining whether to fair value and at what value to fair value an investment. The value of an investment for purposes of calculating the fund’s net asset value can differ depending on the source and method used to determine value. When fair valuation is used, the value of investments used to determine the fund’s net asset value may differ from quoted or published prices for the same investments.
The fund adopted FASB Statement No. 157, Fair Value Measurements (the “Statement”) in this reporting period. This Statement provides a single definition of fair value, a hierarchy for measuring fair value and expanded disclosures about fair value measurements.
11
Table of Contents
Notes to Financial Statements (unaudited) – continued
Various inputs are used in determining the value of the fund’s assets or liabilities carried at market value. These inputs are categorized into three broad levels. Level 1 includes quoted prices in active markets for identical assets or liabilities. Level 2 includes other significant observable market-based inputs (including quoted prices for similar securities, interest rates, prepayment speed, and credit risk). Level 3 includes unobservable inputs, which may include the adviser’s own assumptions in determining the fair value of investments. Other financial instruments are derivative instruments not reflected in total investments, such as futures, forwards, swap contracts and written options, which are valued at the unrealized appreciation/depreciation on the instrument. The following is a summary of the levels used as of June 30, 2008 in valuing the fund’s assets or liabilities carried at market value:
| Level 1 | Level 2 | Level 3 | Total | |||||
| Investments in Securities | $574,635,407 | $31,669,038 | $— | $606,304,445 | ||||
| Other Financial Instruments | $— | $— | $— | $— |
Repurchase Agreements – The fund may enter into repurchase agreements with institutions that the fund’s investment adviser has determined are creditworthy. Each repurchase agreement is recorded at cost. The fund requires that the securities collateral in a repurchase transaction be transferred to a custodian in a manner sufficient to enable the fund to obtain those securities in the event of a default under the repurchase agreement. The fund monitors, on a daily basis, the value of the collateral to ensure that its value, including accrued interest, is greater than amounts owed to the fund under each such repurchase agreement. The fund and other funds managed by Massachusetts Financial Services Company (MFS), may utilize a joint trading account for the purpose of entering into one or more repurchase agreements.
Foreign Currency Translation – Purchases and sales of foreign investments, income, and expenses are converted into U.S. dollars based upon currency exchange rates prevailing on the respective dates of such transactions. Gains and losses attributable to foreign currency exchange rates on sales of securities are recorded for financial statement purposes as net realized gains and losses on investments. Gains and losses attributable to foreign exchange rate movements on income and expenses are recorded for financial statement purposes as foreign currency transaction gains and losses. That portion of both realized and unrealized gains and losses on investments that results from fluctuations in foreign currency exchange rates is not separately disclosed.
Indemnifications – Under the fund’s organizational documents, its officers and trustees may be indemnified against certain liabilities and expenses arising out of the performance of their duties to the fund. Additionally, in the normal course of business, the fund enters into agreements with service providers that may contain indemnification clauses. The fund’s maximum exposure under these agreements is unknown as this would involve future claims that may be made against the fund that have not yet occurred.
Investment Transactions and Income – Investment transactions are recorded on the trade date. Interest income is recorded on the accrual basis. All premium and discounts is amortized or accreted for financial statement purposes in accordance with U.S. generally accepted accounting principles. Dividends received in cash are recorded on the ex-dividend date. Certain dividends from foreign securities will be recorded when the fund is informed of the dividend if such information is obtained subsequent to the ex-dividend date. Dividend and interest payments received in additional securities are recorded on the ex-dividend or ex-interest date in an amount equal to the value of the security on such date.
The fund may receive proceeds from litigation settlements. Any proceeds received from litigation involving portfolio holdings are reflected in the Statement of Operations in realized gain/loss if the security has been disposed of by the fund or in unrealized gain/loss if the security is still held by the fund. Any other proceeds from litigation not related to portfolio holdings are reflected as other income in the Statement of Operations.
Fees Paid Indirectly – The fund’s custody fee may be reduced according to an arrangement that measures the value of cash deposited with the custodian by the fund. For the six months ended June 30, 2008 custody fees were not reduced.
Tax Matters and Distributions – The fund intends to qualify as a regulated investment company, as defined under Subchapter M of the Internal Revenue Code, and to distribute all of its taxable income, including realized capital gains. As a result, no provision for federal income tax is required. The fund adopted the provisions of FASB Interpretation No. 48, Accounting for Uncertainty in Income Taxes (“the Interpretation”). The Interpretation prescribes a minimum threshold for financial statement recognition of the benefit of a tax position taken or expected to be taken in a tax return. There was no impact resulting from the adoption of this Interpretation on the fund’s financial statements. Each of the fund’s federal tax returns for the prior three fiscal years remains subject to examination by the Internal Revenue Service. It is the fund’s policy to record interest and penalty charges on underpaid taxes associated with its tax positions as interest expense and miscellaneous expense, respectively. No such charges were recorded in the current financial statements. Foreign taxes, if any, have been accrued by the fund in the accompanying financial statements.
12
Table of Contents
Notes to Financial Statements (unaudited) – continued
Distributions to shareholders are recorded on the ex-dividend date. Income and capital gain distributions are determined in accordance with income tax regulations, which may differ from U.S. generally accepted accounting principles. Certain capital accounts in the financial statements are periodically adjusted for permanent differences in order to reflect their tax character. These adjustments have no impact on net assets or net asset value per share. Temporary differences which arise from recognizing certain items of income, expense, gain or loss in different periods for financial statement and tax purposes will reverse at some time in the future. Distributions in excess of net investment income or net realized gains are temporary overdistributions for financial statement purposes resulting from differences in the recognition or classification of income or distributions for financial statement and tax purposes.
Book/tax differences primarily relate to wash sale loss deferrals.
The tax character of distributions made during the current period will be determined at fiscal year end. The tax character of distributions declared to shareholders is as follows:
| 12/31/07 | ||
| Ordinary income (including any short-term capital gains) | $4,723,190 | |
| Long-term capital gain | 6,876,329 | |
| Total distributions | $11,599,519 |
The federal tax cost and the tax basis components of distributable earnings were as follows:
| As of 6/30/08 | |||
| Cost of investments | $600,143,127 | ||
| Gross appreciation | $61,319,270 | ||
| Gross depreciation | (55,157,952 | ) | |
| Net unrealized appreciation (depreciation) | $6,161,318 | ||
| As of 12/31/07 | |||
| Undistributed ordinary income | $9,641,846 | ||
| Undistributed long-term capital gain | 20,528,360 | ||
| Other temporary differences | (3,848 | ) | |
| Net unrealized appreciation (depreciation) | 60,945,957 | ||
The aggregate cost above includes prior fiscal year end tax adjustments.
Multiple Classes of Shares of Beneficial Interest – The fund offers multiple classes of shares, which differ in their respective distribution fees. The fund’s income, realized and unrealized gain (loss), and common expenses are allocated to shareholders based on the daily net assets of each class, without distinction between share classes. Dividends are declared separately for each class. Differences in per share dividend rates are generally due to differences in separate class expenses.
| (3) | Transactions with Affiliates |
Investment Adviser – The fund has an investment advisory agreement with Massachusetts Financial Services Company (MFS) to provide overall investment management and related administrative services and facilities to the fund.
The management fee is computed daily and paid monthly at an annual rate of 0.75% of the fund’s average daily net assets. The investment adviser has agreed in writing to reduce its management fee to 0.65% of average daily net assets in excess of $1.0 billion. This written agreement may be rescinded only upon consent of the fund’s Board of Trustees. For the six months ended June 30, 2008, the fund’s average daily net assets did not exceed $1.0 billion and therefore, the management fee was not reduced. The management fee incurred for the six months ended June 30, 2008 was equivalent to an annual effective rate of 0.75% of the fund’s average daily net assets.
The investment adviser has agreed in writing to pay a portion of the fund’s operating expenses, exclusive of management, distribution, and certain other fees and expenses, such that operating expenses do not exceed 0.15% annually of the fund’s average daily net assets. This written agreement will continue through April 30, 2009 unless changed or rescinded by the fund’s Board of Trustees. For the six months ended June 30, 2008, the fund’s actual operating expenses did not exceed the limit and therefore, the investment adviser did not pay any portion of the fund’s expenses.
Distributor – MFS Fund Distributors, Inc. (MFD), a wholly-owned subsidiary of MFS, is the distributor of shares of the fund. The Trustees have adopted a distribution plan for the Service Class shares pursuant to Rule 12b-1 under the Investment Company Act of 1940.
The fund’s distribution plan provides that the fund will pay MFD distribution fees equal to 0.25% per annum of its average daily net assets attributable to Service Class shares as partial consideration for services performed and expenses incurred by MFD and financial intermediaries (including participating insurance companies that invest in the fund to fund variable annuity and variable life insurance contracts, sponsors of qualified retirement and pension plans that invest in the fund, and affiliates of these participating insurance companies and plan sponsors) in connection with the sale and distribution of the Service Class shares. MFD may subsequently pay all, or a portion, of the distribution fees to financial intermediaries.
13
Table of Contents
Notes to Financial Statements (unaudited) – continued
Shareholder Servicing Agent – MFS Service Center, Inc. (MFSC), a wholly-owned subsidiary of MFS, receives a fee from the fund for its services as shareholder servicing agent. For the six months ended June 30, 2008, the fee was $53,038, which equated to 0.018% annually of the fund’s average daily net assets. MFSC also receives payment from the fund for out-of-pocket expenses paid by MFSC on behalf of the fund. For the six months ended June 30, 2008, these costs amounted to $25.
Administrator – MFS provides certain financial, legal, shareholder communications, compliance, and other administrative services to the fund. Under an administrative services agreement, the fund partially reimburses MFS the costs incurred to provide these services. The fund is charged a fixed amount plus a fee based on average daily net assets. The fund’s annual fixed amount is $17,500.
The administrative services fee incurred for the six months ended June 30, 2008 was equivalent to an annual effective rate of 0.0182% of the fund’s average daily net assets.
Trustees’ and Officers’ Compensation – The fund pays compensation to independent trustees in the form of a retainer, attendance fees, and additional compensation to Board and Committee chairpersons. The fund does not pay compensation directly to trustees or officers of the fund who are also officers of the investment adviser, all of whom receive remuneration for their services to the fund from MFS. Certain officers and trustees of the fund are officers or directors of MFS, MFD, and MFSC.
Other – This fund and certain other MFS funds (the funds) have entered into a services agreement (the Agreement) which provides for payment of fees by the funds to Tarantino LLC in return for the provision of services of an Independent Chief Compliance Officer (ICCO) for the funds. The ICCO is an officer of the funds and the sole member of Tarantino LLC. The funds can terminate the Agreement with Tarantino LLC at any time under the terms of the Agreement. For the six months ended June 30, 2008, the fee paid by the fund to Tarantino LLC was $1,696 and is included in miscellaneous expense on the Statement of Operations. MFS has agreed to reimburse the fund for a portion of the payments made by the fund to Tarantino LLC in the amount of $1,684, which is shown as a reduction of total expenses in the Statement of Operations. Additionally, MFS has agreed to bear all expenses associated with office space, other administrative support, and supplies provided to the ICCO.
| (4) | Portfolio Securities |
Purchases and sales of investments, other than U.S. Government securities, purchased option transactions, and short-term obligations, aggregated $190,808,941 and $100,806,575, respectively.
| (5) | Shares of Beneficial Interest |
The fund’s Declaration of Trust permits the Trustees to issue an unlimited number of full and fractional shares of beneficial interest. Transactions in fund shares were as follows:
| Six months ended 6/30/08 | Year ended 12/31/07 | |||||||||||
| Shares | Amount | Shares | Amount | |||||||||
| Shares sold | ||||||||||||
Initial Class | 3,844,463 | $53,994,075 | 8,361,424 | $126,372,874 | ||||||||
Service Class | 4,318,433 | 59,701,702 | 5,600,591 | 84,130,095 | ||||||||
| 8,162,896 | $113,695,777 | 13,962,015 | $210,502,969 | |||||||||
| Shares issued to shareholders in reinvestment of distributions | ||||||||||||
Initial Class | 1,458,976 | $19,929,613 | 527,356 | $7,741,580 | ||||||||
Service Class | 755,325 | 10,242,213 | 264,605 | 3,857,939 | ||||||||
| 2,214,301 | $30,171,826 | 791,961 | $11,599,519 | |||||||||
| Shares reacquired | ||||||||||||
Initial Class | (959,100 | ) | $(13,428,625 | ) | (951,777 | ) | $(14,196,859 | ) | ||||
Service Class | (1,249,433 | ) | (17,348,397 | ) | (2,499,324 | ) | (37,343,730 | ) | ||||
| (2,208,533 | ) | $(30,777,022 | ) | (3,451,101 | ) | $(51,540,589 | ) | |||||
| Net change | ||||||||||||
Initial Class | 4,344,339 | $60,495,063 | 7,937,003 | $119,917,595 | ||||||||
Service Class | 3,824,325 | 52,595,518 | 3,365,872 | 50,644,304 | ||||||||
| 8,168,664 | $113,090,581 | 11,302,875 | $170,561,899 | |||||||||
| (6) | Line of Credit |
The fund and other funds managed by MFS participate in a $1 billion unsecured committed line of credit provided by a syndication of banks under a credit agreement. In addition, the fund and other funds managed by MFS have established uncommitted borrowing arrangements with certain banks. Borrowings may be made for temporary financing needs. Interest is charged to each fund, based on its borrowings, generally at a rate equal to the Federal Reserve funds rate plus 0.30%. In addition, a commitment fee, based on the average daily, unused portion of the committed line of credit, is allocated among the participating funds at the end of each calendar quarter. For the six months ended June 30, 2008, the fund’s commitment fee and interest expense were $1,148 and $0, respectively, and are included in miscellaneous expense on the Statement of Operations.
14
Table of Contents
BOARD REVIEW OF INVESTMENT ADVISORY AGREEMENT
A discussion regarding the Board’s most recent review and renewal of the fund’s Investment Advisory Agreement with MFS will be available on or about November 1, 2008 by clicking on the fund’s name under ‘‘Variable Insurance Portfolios - VIT’’ in the ‘‘Products and Performance’’ section of the MFS Web site (mfs.com).
PROXY VOTING POLICIES AND INFORMATION
A general description of the MFS funds’ proxy voting policies and procedures is available without charge, upon request, by calling
1-800-225-2606, by visiting the Proxy Voting section of mfs.com or by visiting the SEC’s Web site at http://www.sec.gov.
Information regarding how the fund voted proxies relating to portfolio securities during the most recent twelve-month period ended June 30 is available without charge by visiting the Proxy Voting section of mfs.com or by visiting the SEC’s Web site at http://www.sec.gov.
QUARTERLY PORTFOLIO DISCLOSURE
The fund will file a complete schedule of portfolio holdings with the Securities and Exchange Commission (the Commission) for the first and third quarters of each fiscal year on Form N-Q. The fund’s Form N-Q may be reviewed and copied at the:
Public Reference Room
Securities and Exchange Commission
100 F Street, NE, Room 1580
Washington, D.C. 20549
Information on the operation of the Public Reference Room may be obtained by calling the Commission at 1-800-SEC-0330. The fund’s Form N-Q is available on the EDGAR database on the Commission’s Internet Web site at http://www.sec.gov, and copies of this information may be obtained, upon payment of a duplicating fee, by electronic request at the following e-mail address: publicinfo@sec.gov or by writing the Public Reference Section at the above address.
15
Table of Contents
CONTACT US
Web site
mfs.com
Account service and literature
Shareholders
1-877-411-3325
9 a.m. to 5 p.m. Eastern Time
Investment professionals
1-800-637-8730
8 a.m. to 5 p.m. Eastern Time
Mailing address
MFS Service Center, Inc.
Attn: Institutional Alliance Services (IAS)
P.O. Box 55824
Boston, MA 02205-5824
Overnight mail
MFS Service Center, Inc.
c/o Boston Financial Data Services
30 Dan Road
Canton, MA 02021-2809

Table of Contents
ITEM 2. CODE OF ETHICS.
The Registrant has not amended any provision in its Code of Ethics (the “Code”) that relates to any element of the Code’s definition enumerated in paragraph (b) of Item 2 of this Form N-CSR.
ITEM 3. AUDIT COMMITTEE FINANCIAL EXPERT.
Not applicable for semi-annual reports.
ITEM 4. PRINCIPAL ACCOUNTANT FEES AND SERVICES.
Not applicable for semi-annual reports.
ITEM 5. AUDIT COMMITTEE OF LISTED REGISTRANTS.
Not applicable to the Registrant.
ITEM 6. INVESTMENTS
A schedule of investments for each series of the Registrant is included as part of the report to shareholders of such series under Item 1 of this Form N-CSR.
ITEM 7. DISCLOSURE OF PROXY VOTING POLICIES AND PROCEDURES FOR CLOSED-END MANAGEMENT
INVESTMENT COMPANIES.
Not applicable to the Registrant.
ITEM 8. PORTFOLIO MANAGERS OF CLOSED-END MANAGEMENT INVESTMENT COMPANIES.
Not applicable to the Registrant.
ITEM 9. PURCHASES OF EQUITY SECURITIES BY CLOSED-END MANAGEMENT INVESTMENT COMPANY AND
AFFILIATED PURCHASERS.
Not applicable to the Registrant.
ITEM 10. SUBMISSION OF MATTERS TO A VOTE OF SECURITY HOLDERS.
There were no material changes to the procedures by which shareholders may send recommendations to the Board for nominees to the Registrant’s Board since the Registrant last provided disclosure as to such procedures in response to the requirements of Item 407 (c)(2)(iv) of Regulation S-K or this Item.
Table of Contents
ITEM 11. CONTROLS AND PROCEDURES.
| (a) | Based upon their evaluation of the effectiveness of the registrant’s disclosure controls and procedures (as defined in Rule 30a-3(c) under the Investment Company Act of 1940 (the “Act”)) as conducted within 90 days of the filing date of this report on Form N-CSR, the registrant’s principal financial officer and principal executive officer have concluded that those disclosure controls and procedures provide reasonable assurance that the material information required to be disclosed by the registrant on this report is recorded, processed, summarized and reported within the time periods specified in the Securities and Exchange Commission’s rules and forms. |
| (b) | There were no changes in the registrant’s internal controls over financial reporting (as defined in Rule 30a-3(d) under the Act) that occurred during the second fiscal quarter of the period covered by the report that have materially affected, or are reasonably likely to materially affect, the registrant’s internal control over financial reporting. |
ITEM 12. EXHIBITS.
| (a) | File the exhibits listed below as part of this form. Letter or number the exhibits in the sequence indicated. |
| (1) | Any code of ethics, or amendment thereto, that is the subject of the disclosure required by Item 2, to the extent that the registrant intends to satisfy the Item 2 requirements through filing of an exhibit. |
| (2) | A separate certification for each principal executive officer and principal financial officer of the registrant as required by Rule 30a-2 under the Act (17 CFR 270.30a-2): Attached hereto. |
| (b) | If the report is filed under Section 13(a) or 15(d) of the Exchange Act, provide the certifications required by Rule 30a-2(b) under the Act (17 CFR 270.30a-2(b)), Rule 13a-14(b) or Rule 15d-14(b) under the Exchange Act (17 CFR 240.13a-14(b) or 240.15d-14(b)) and Section 1350 of Chapter 63 of Title 18 of the United States Code (18 U.S.C. 1350) as an exhibit. A certification furnished pursuant to this paragraph will not be deemed “filed” for the purposes of Section 18 of the Exchange Act (15 U.S.C. 78r), or otherwise subject to the liability of that section. Such certification will not be deemed to be incorporated by reference into any filing under the Securities Act of 1933 or the Exchange Act, except to the extent that the registrant specifically incorporates it by reference: Attached hereto. |
Table of Contents
Notice
A copy of the Amended and Restated Declaration of Trust, as amended, of the Registrant is on file with the Secretary of State of The Commonwealth of Massachusetts and notice is hereby given that this instrument is executed on behalf of the Registrant by an officer of the Registrant as an officer and not individually and the obligations of or arising out of this instrument are not binding upon any of the Trustees or shareholders individually, but are binding only upon the assets and property of the respective constituent series of the Registrant.
Table of Contents
SIGNATURES
Pursuant to the requirements of the Securities Exchange Act of 1934 and the Investment Company Act of 1940, the registrant has duly caused this report to be signed on its behalf by the undersigned, thereunto duly authorized.
| (registrant) | MFS VARIABLE INSURANCE TRUST | |
| By (Signature and Title)* | ROBERT J. MANNING | |
| Robert J. Manning, President | ||
Date: August 15, 2008
Pursuant to the requirements of the Securities Exchange Act of 1934 and the Investment Company Act of 1940, this report has been signed below by the following persons on behalf of the registrant and in the capacities and on the dates indicated.
| By (Signature and Title)* | ROBERT J. MANNING | |
Robert J. Manning, President (Principal Executive Officer) |
Date: August 15, 2008
| By (Signature and Title)* | MARIA F. DWYER | |
| Maria F. Dwyer, Treasurer (Principal Financial Officer and Accounting Officer) |
Date: August 15, 2008
* Print name and title of each signing officer under his or her signature.