Table of Contents
UNITED STATES
SECURITIES AND EXCHANGE COMMISSION
Washington, D.C. 20549
FORM N-CSR
CERTIFIED SHAREHOLDER REPORT OF
REGISTERED MANAGEMENT INVESTMENT COMPANIES
Investment Company Act file number 811-8326
MFS VARIABLE INSURANCE TRUST
(Exact name of registrant as specified in charter)
500 Boylston Street, Boston, Massachusetts 02116
(Address of principal executive offices) (Zip code)
Susan S. Newton
Massachusetts Financial Services Company
500 Boylston Street
Boston, Massachusetts 02116
(Name and address of agents for service)
Registrant’s telephone number, including area code: (617) 954-5000
Date of fiscal year end: December 31
Date of reporting period: June 30, 2010
Table of Contents
| ITEM 1. | REPORTS TO STOCKHOLDERS. |
Table of Contents

Table of Contents
This report is prepared for the general information of contract owners. It is authorized for distribution to prospective investors only when preceded or accompanied by a current prospectus.
NOT FDIC INSURED Ÿ MAY LOSE VALUE Ÿ NO BANK GUARANTEE Ÿ NOT A DEPOSIT Ÿ NOT INSURED BY ANY FEDERAL GOVERNMENT AGENCY OR NCUA/NCUSIF
Table of Contents
MFS Research Series

Dear Contract Owners:
After having suffered their biggest declines since the Great Depression, most global markets experienced an impressive resurgence during the latter months of 2009 and the first quarter of 2010. The global economy was able to reap the benefits of two major trends. The first of these was the massive efforts of governments and central banks to increase liquidity in the financial system as they sought to prevent the credit crisis from further affecting the banking system. The second was the move by companies around the world to cut costs and operations to prepare for rapidly changing market conditions. We believe that these moves not only shortened the length of the downturn but also set the stage for recovery.
Even with the significant market gains of 2009 and the early part of 2010, the recovery is unrolling at a moderate pace, with rebounds in the manufacturing sector and corporate America leading the way. Central bankers are proceeding with caution and many have held benchmark interest rates unchanged as they debate the best way to withdraw stimulus measures without disrupting the fragile growth process. Complicating that debate late in the period was the emergence of the European debt crisis and worries about whether this crisis could derail the global recovery. As that crisis unrolled with no clear resolution, risk aversion rose along with volatility. Weakening economic data late in the period added uncertainty to the mix and sparked a retrenchment in global equity markets.
While hurdles remain, we believe that the global economy is proceeding on the road to recovery. As always, we continue to be mindful of the many challenges faced at the individual, national, and international levels. It is at times such as these that we want to remind investors of the merits of maintaining a long-term view, adhering to basic investing principles such as asset allocation and diversification, and working closely with advisors to identify and research investment opportunities. At MFS®, we take particular pride in how well mutual funds can provide a broad range of products that can fit investor needs in any type of market climate.
Respectfully,

Robert J. Manning
Chairman and Chief Executive Officer
MFS Investment Management®
August 16, 2010
The opinions expressed in this letter are subject to change, may not be relied upon for investment advice, and no forecasts can be guaranteed.
MFS Fund Distributors, Inc., 500 Boylston Street, Boston, MA 02116
1
Table of Contents
MFS Research Series
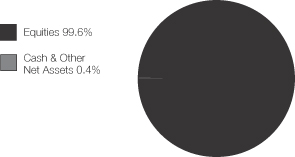
Portfolio structure (i)

| Top ten holdings (i) | ||
| Apple, Inc. | 3.3% | |
| JPMorgan Chase & Co. | 2.3% | |
| Johnson & Johnson | 2.3% | |
| Bank of America Corp. | 2.2% | |
| Danaher Corp. | 2.2% | |
| Exxon Mobil Corp. | 2.1% | |
| Cisco Systems, Inc. | 2.0% | |
| Chevron Corp. | 2.0% | |
| PepsiCo, Inc. | 1.8% | |
| Google, Inc., “A” | 1.7% |
| Global equity sectors (i) | ||
| Technology | 18.5% | |
| Financial Services | 15.9% | |
| Energy | 14.3% | |
| Capital Goods | 14.0% | |
| Health Care | 12.3% | |
| Consumer Cyclicals | 10.8% | |
| Consumer Staples | 9.3% | |
| Telecommunications/Cable Television | 4.2% |
| (i) | For purposes of this presentation, the components include the market value of securities and reflect the impact of the equivalent exposure of derivative positions, if applicable. These amounts may be negative from time to time. Equivalent exposure is a calculated amount that translates the derivative position into a reasonable approximation of the amount of the underlying asset that the portfolio would have to hold at a given point in time to have the same price sensitivity that results from the portfolio’s ownership of the derivative contract. When dealing with derivatives, equivalent exposure is a more representative measure of the potential impact of a position on portfolio performance than market value. |
Percentages are based on net assets as of 6/30/10.
The portfolio is actively managed and current holdings may be different.
2
Table of Contents
MFS Research Series
After having suffered through one of the largest and most concentrated downturns since the 1930s, most asset markets staged a remarkable rebound during 2009 and early 2010. This recovery in global activity has been led importantly by emerging Asian economies, but broadening to include most of the global economy to varying degrees. Primary drivers of the recovery included an unwinding of the inventory destocking that took place earlier, the production of manufacturing and capital goods, as well as massive fiscal and monetary stimulus.
Late in the period, though, heightened risk surrounding the public-debt profiles of several of the peripheral European countries impaired market sentiment. At the same time, the improving trend in global macroeconomic data began to weaken somewhat. These two dynamics caused most asset prices to retrench significantly, as many questioned the durability of the global recovery.
3
Table of Contents
MFS Research Series
Fund Expenses Borne by the Contract Holders During the Period,
January 1, 2010 through June 30, 2010
As a contract holder of the fund, you incur ongoing costs, including management fees; distribution and/or service (12b-1) fees; and other fund expenses. This example is intended to help you understand your ongoing costs (in dollars) of investing in the fund and to compare these costs with the ongoing costs of investing in other mutual funds.
The example is based on an investment of $1,000 invested at the beginning of the period and held for the entire period January 1, 2010 through June 30, 2010.
Actual Expenses
The first line for each share class in the following table provides information about actual account values and actual expenses. You may use the information in this line, together with the amount you invested, to estimate the expenses that you paid over the period. Simply divide your account value by $1,000 (for example, an $8,600 account value divided by $1,000 = 8.6), then multiply the result by the number in the first line under the heading entitled “Expenses Paid During Period” to estimate the expenses you paid on your account during this period.
Hypothetical Example for Comparison Purposes
The second line for each share class in the following table provides information about hypothetical account values and hypothetical expenses based on the fund’s actual expense ratio and an assumed rate of return of 5% per year before expenses, which is not the fund’s actual return. The hypothetical account values and expenses may not be used to estimate the actual ending account balance or expenses you paid for the period. You may use this information to compare the ongoing costs of investing in the fund and other funds. To do so, compare this 5% hypothetical example with the 5% hypothetical examples that appear in the shareholder reports of the other funds.
Please note that the expenses shown in the table are meant to highlight the fund’s ongoing costs only and do not take into account the fees and expenses imposed under the variable contracts through which your investment in the fund is made. Therefore, the second line for each share class in the table is useful in comparing ongoing costs associated with an investment in vehicles (such as the fund) which fund benefits under variable annuity and variable life insurance contracts and to qualified pension and retirement plans only, and will not help you determine the relative total costs of investing in the fund through variable annuity and variable life insurance contracts. If the fees and expenses imposed under the variable contracts were included, your costs would have been higher.
| Share Class | Annualized Expense Ratio | Beginning Account Value 1/01/10 | Ending Account Value 6/30/10 | Expenses Paid During Period (p) 1/01/10-6/30/10 | ||||||
| Initial Class | Actual | 0.89% | $1,000.00 | $921.57 | $4.24 | |||||
| Hypothetical (h) | 0.89% | $1,000.00 | $1,020.38 | $4.46 | ||||||
| Service Class | Actual | 1.14% | $1,000.00 | $920.63 | $5.43 | |||||
| Hypothetical (h) | 1.14% | $1,000.00 | $1,019.14 | $5.71 |
| (h) | 5% class return per year before expenses. |
| (p) | Expenses paid is equal to each class’ annualized expense ratio, as shown above, multiplied by the average account value over the period, multiplied by the number of days in the period, divided by the number of days in the year. |
4
Table of Contents
MFS Research Series
PORTFOLIO OF INVESTMENTS – 6/30/10 (unaudited)
The Portfolio of Investments is a complete list of all securities owned by your fund. It is categorized by broad-based asset classes.
| Issuer | Shares/Par | Value ($) | |||
| COMMON STOCKS – 98.3% | |||||
| Aerospace – 2.5% | |||||
| Goodrich Corp. | 26,220 | $ | 1,737,070 | ||
| Honeywell International, Inc. | 33,460 | 1,305,944 | |||
| Lockheed Martin Corp. | 16,160 | 1,203,920 | |||
| $ | 4,246,934 | ||||
| Apparel Manufacturers – 0.7% | |||||
| NIKE, Inc., “B” | 18,930 | $ | 1,278,722 | ||
| Biotechnology – 1.9% | |||||
| Amgen, Inc. (a) | 34,340 | $ | 1,806,284 | ||
| Gilead Sciences, Inc. (a) | 42,440 | 1,454,843 | |||
| $ | 3,261,127 | ||||
| Broadcasting – 1.1% | |||||
| Discovery Communications, Inc., “A” (a) | 14,000 | $ | 499,940 | ||
| Walt Disney Co. | 45,920 | 1,446,480 | |||
| $ | 1,946,420 | ||||
| Brokerage & Asset Managers – 2.0% | |||||
| Affiliated Managers Group, Inc. (a) | 13,740 | $ | 834,980 | ||
| Charles Schwab Corp. | 41,750 | 592,015 | |||
| CME Group, Inc. | 2,180 | 613,779 | |||
| Franklin Resources, Inc. | 12,420 | 1,070,480 | |||
| GFI Group, Inc. | 67,320 | 375,646 | |||
| $ | 3,486,900 | ||||
| Business Services – 1.5% | |||||
| Accenture Ltd., “A” | 39,610 | $ | 1,530,927 | ||
| MasterCard, Inc., “A” | 5,340 | 1,065,490 | |||
| $ | 2,596,417 | ||||
| Cable TV – 1.0% | |||||
| Comcast Corp., “Special A” | 62,080 | $ | 1,019,974 | ||
| DIRECTV Group, Inc., “A” (a) | 20,850 | 707,232 | |||
| $ | 1,727,206 | ||||
| Chemicals – 1.9% | |||||
| Celanese Corp. | 42,100 | $ | 1,048,711 | ||
| Ecolab, Inc. | 3,400 | 152,694 | |||
| Monsanto Co. | 46,000 | 2,126,120 | |||
| $ | 3,327,525 | ||||
| Computer Software – 2.6% | |||||
| Adobe Systems, Inc. (a) | 35,460 | $ | 937,208 | ||
| Autodesk, Inc. (a) | 33,800 | 823,368 | |||
| Oracle Corp. | 126,250 | 2,709,325 | |||
| $ | 4,469,901 | ||||
| Computer Software – Systems – 7.2% | |||||
| 3Par, Inc. (a) | 50,860 | $ | 473,507 | ||
| Apple, Inc. (a) | 22,860 | 5,749,976 | |||
| Dell, Inc. (a) | 103,460 | 1,247,728 | |||
| EMC Corp. (a) | 117,990 | 2,159,217 | |||
| Hewlett-Packard Co. | 65,370 | 2,829,214 | |||
| $ | 12,459,642 | ||||
| Issuer | Shares/Par | Value ($) | |||
| COMMON STOCKS – continued | |||||
| Construction – 0.6% | |||||
| Sherwin-Williams Co. | 15,580 | $ | 1,077,980 | ||
| Consumer Products – 2.5% | |||||
| Colgate-Palmolive Co. | 33,600 | $ | 2,646,336 | ||
| Procter & Gamble Co. | 28,990 | 1,738,820 | |||
| $ | 4,385,156 | ||||
| Consumer Services – 0.7% | |||||
| DeVry, Inc. | 14,950 | $ | 784,726 | ||
| Monster Worldwide, Inc. (a) | 41,770 | 486,621 | |||
| $ | 1,271,347 | ||||
| Electrical Equipment – 2.2% | |||||
| Danaher Corp. | 102,220 | $ | 3,794,406 | ||
| Electronics – 2.9% | |||||
| First Solar, Inc. (a) | 6,410 | $ | 729,650 | ||
| Intel Corp. | 130,430 | 2,536,864 | |||
| Microchip Technology, Inc. | 34,960 | 969,790 | |||
| Samsung Electronics Co. Ltd., GDR | 2,725 | 852,506 | |||
| $ | 5,088,810 | ||||
| Energy – Independent – 3.2% | |||||
| Anadarko Petroleum Corp. | 26,170 | $ | 944,475 | ||
| Apache Corp. | 18,090 | 1,522,997 | |||
| CONSOL Energy, Inc. | 6,480 | 218,765 | |||
| Massey Energy Co. | 10,860 | 297,021 | |||
| Noble Energy, Inc. | 14,730 | 888,661 | |||
| Occidental Petroleum Corp. | 14,940 | 1,152,621 | |||
| Southwestern Energy Co. (a) | 13,600 | 525,504 | |||
| $ | 5,550,044 | ||||
| Energy – Integrated – 4.5% | |||||
| Chevron Corp. | 50,330 | $ | 3,415,394 | ||
| Exxon Mobil Corp. (s) | 62,250 | 3,552,608 | |||
| Hess Corp. | 15,620 | 786,311 | |||
| $ | 7,754,313 | ||||
| Engineering – Construction – 1.3% | |||||
| Fluor Corp. | 52,480 | $ | 2,230,400 | ||
| Food & Beverages – 4.4% | |||||
| Dr Pepper Snapple Group, Inc. | 28,230 | $ | 1,055,520 | ||
| General Mills, Inc. | 51,370 | 1,824,662 | |||
| Kellogg Co. | 32,220 | 1,620,666 | |||
| PepsiCo, Inc. (s) | 50,260 | 3,063,347 | |||
| $ | 7,564,195 | ||||
| Food & Drug Stores – 0.7% | |||||
| Walgreen Co. | 38,760 | $ | 1,034,892 | ||
| Whole Foods Market, Inc. (a) | 5,110 | 184,062 | |||
| $ | 1,218,954 | ||||
| Gaming & Lodging – 0.4% | |||||
| International Game Technology | 42,430 | $ | 666,151 | ||
5
Table of Contents
MFS Research Series
Portfolio of Investments (unaudited) – continued
| Issuer | Shares/Par | Value ($) | |||
| COMMON STOCKS – continued | |||||
| General Merchandise – 3.0% | |||||
| Dollar General Corp. (a) | 21,510 | $ | 592,601 | ||
| Kohl’s Corp. (a) | 20,490 | 973,275 | |||
| Target Corp. | 42,200 | 2,074,974 | |||
| Wal-Mart Stores, Inc. | 31,130 | 1,496,419 | |||
| $ | 5,137,269 | ||||
| Health Maintenance Organizations – 0.4% | |||||
| WellPoint, Inc. (a) | 15,400 | $ | 753,522 | ||
| Insurance – 3.3% | |||||
| ACE Ltd. | 17,800 | $ | 916,344 | ||
| Aflac, Inc. | 24,040 | 1,025,787 | |||
| Chubb Corp. | 18,220 | 911,182 | |||
| Genworth Financial, Inc. (a) | 27,060 | 353,674 | |||
| MetLife, Inc. | 29,250 | 1,104,480 | |||
| Prudential Financial, Inc. | 24,330 | 1,305,548 | |||
| $ | 5,617,015 | ||||
| Internet – 1.7% | |||||
| Google, Inc., “A” (a) | 6,610 | $ | 2,941,120 | ||
| Machinery & Tools – 0.4% | |||||
| Bucyrus International, Inc. | 13,240 | $ | 628,238 | ||
| Major Banks – 8.1% | |||||
| Bank of America Corp. | 269,950 | $ | 3,879,182 | ||
| Bank of New York Mellon Corp. | 48,819 | 1,205,341 | |||
| Goldman Sachs Group, Inc. | 20,170 | 2,647,716 | |||
| JPMorgan Chase & Co. (s) | 107,280 | 3,927,521 | |||
| KeyCorp | 116,530 | 896,116 | |||
| State Street Corp. | 13,270 | 448,791 | |||
| SunTrust Banks, Inc. | 38,200 | 890,060 | |||
| $ | 13,894,727 | ||||
| Medical & Health Technology & Services – 1.4% | |||||
| DaVita, Inc. (a) | 14,720 | $ | 919,117 | ||
| Patterson Cos., Inc. | 25,220 | 719,527 | |||
| VCA Antech, Inc. (a) | 30,000 | 742,800 | |||
| $ | 2,381,444 | ||||
| Medical Equipment – 4.2% | |||||
| Becton, Dickinson & Co. | 24,150 | $ | 1,633,023 | ||
| Medtronic, Inc. | 46,760 | 1,695,985 | |||
| St. Jude Medical, Inc. (a) | 48,380 | 1,746,034 | |||
| Thermo Fisher Scientific, Inc. (a) | 26,850 | 1,316,993 | |||
| Waters Corp. (a) | 13,500 | 873,450 | |||
| $ | 7,265,485 | ||||
| Metals & Mining – 0.6% | |||||
| Cliffs Natural Resources, Inc. | 7,280 | $ | 343,325 | ||
| United States Steel Corp. | 19,400 | 747,870 | |||
| $ | 1,091,195 | ||||
| Natural Gas – Distribution – 1.0% | |||||
| EQT Corp. | 8,280 | $ | 299,239 | ||
| QEP Resources, Inc. (a)(w) | 23,900 | 736,837 | |||
| Questar Corp. (a)(w) | 37,200 | 600,780 | |||
| $ | 1,636,856 | ||||
| Issuer | Shares/Par | Value ($) | |||
| COMMON STOCKS – continued | |||||
| Natural Gas – Pipeline – 0.3% | |||||
| Williams Cos., Inc. | 23,660 | $ | 432,505 | ||
| Network & Telecom – 2.6% | |||||
| Cisco Systems, Inc. (a) | 160,430 | $ | 3,418,763 | ||
| Juniper Networks, Inc. (a) | 46,780 | 1,067,520 | |||
| $ | 4,486,283 | ||||
| Oil Services – 2.5% | |||||
| Dresser-Rand Group, Inc. (a) | 10,980 | $ | 346,419 | ||
| Halliburton Co. | 64,490 | 1,583,230 | |||
| Noble Corp. | 22,910 | 708,148 | |||
| Schlumberger Ltd. | 31,510 | 1,743,763 | |||
| $ | 4,381,560 | ||||
| Other Banks & Diversified Financials – 1.9% | |||||
| American Express Co. | 28,980 | $ | 1,150,506 | ||
| Citigroup, Inc. (a) | 222,440 | 836,374 | |||
| Marshall & Ilsley Corp. | 65,740 | 472,013 | |||
| Zions Bancorporation | 38,400 | 828,288 | |||
| $ | 3,287,181 | ||||
| Pharmaceuticals – 4.4% | |||||
| Abbott Laboratories | 50,650 | $ | 2,369,407 | ||
| Johnson & Johnson | 66,280 | 3,914,497 | |||
| Teva Pharmaceutical Industries Ltd., ADR | 24,690 | 1,283,633 | |||
| $ | 7,567,537 | ||||
| Precious Metals & Minerals – 0.7% | |||||
| Teck Resources Ltd., “B” | 42,280 | $ | 1,250,270 | ||
| Railroad & Shipping – 0.8% | |||||
| Canadian National Railway Co. | 23,020 | $ | 1,320,888 | ||
| Restaurants – 1.0% | |||||
| McDonald’s Corp. | 25,680 | $ | 1,691,542 | ||
| Specialty Chemicals – 1.5% | |||||
| Albemarle Corp. | 20,440 | $ | 811,672 | ||
| Praxair, Inc. | 16,980 | 1,290,310 | |||
| Rockwood Holdings, Inc. (a) | 19,290 | 437,690 | |||
| $ | 2,539,672 | ||||
| Specialty Stores – 3.2% | |||||
| Abercrombie & Fitch Co., “A” | 25,960 | $ | 796,712 | ||
| Amazon.com, Inc. (a) | 8,310 | 907,951 | |||
| Home Depot, Inc. | 34,470 | 967,573 | |||
| Limited Brands, Inc. | 34,300 | 757,001 | |||
| PetSmart, Inc. | 29,290 | 883,679 | |||
| Staples, Inc. | 63,750 | 1,214,438 | |||
| $ | 5,527,354 | ||||
| Telecommunications – Wireless – 0.3% | |||||
| Cellcom Israel Ltd. | 13,270 | $ | 331,750 | ||
| Sprint Nextel Corp. (a) | 46,450 | 196,948 | |||
| $ | 528,698 | ||||
| Telephone Services – 2.9% | |||||
| American Tower Corp., “A” (a) | 21,010 | $ | 934,945 | ||
| AT&T, Inc. | 102,490 | 2,479,233 | |||
6
Table of Contents
MFS Research Series
Portfolio of Investments (unaudited) – continued
| Issuer | Shares/Par | Value ($) | |||
| COMMON STOCKS – continued | |||||
| Telephone Services – continued | |||||
| Qwest Communications International, Inc. | 206,330 | $ | 1,083,233 | ||
| Virgin Media, Inc. | 28,700 | 479,003 | |||
| $ | 4,976,414 | ||||
| Tobacco – 2.4% | |||||
| Altria Group, Inc. | 80,760 | $ | 1,618,430 | ||
| Philip Morris International, Inc. | 55,650 | 2,550,996 | |||
| $ | 4,169,426 | ||||
| Trucking – 1.3% | |||||
| Expeditors International of Washington, Inc. | 64,990 | $ | 2,242,805 | ||
| Utilities – Electric Power – 2.6% | |||||
| American Electric Power Co., Inc. | 44,410 | $ | 1,434,443 | ||
| Calpine Corp. (a) | 21,310 | 271,063 | |||
| CMS Energy Corp. | 87,280 | 1,278,652 | |||
| PG&E Corp. | 37,470 | 1,540,017 | |||
| $ | 4,524,175 | ||||
| Total Common Stocks (Identified Cost, $182,685,581) | $ | 169,675,731 | |||
| CONVERTIBLE PREFERRED STOCKS – 0.9% | |||||
| Other Banks & Diversified Financials – 0.7% | |||||
| Citigroup, Inc., 7.5% | 10,000 | $ | 1,130,000 | ||
| Utilities – Electric Power – 0.2% | |||||
| PPL Corp., 9.5% | 8,420 | $ | 437,885 | ||
| Total Convertible Preferred Stocks (Identified Cost, $1,690,767) | $ | 1,567,885 | |||
| MONEY MARKET FUNDS (v) – 1.8% | |||||
| MFS Institutional Money Market Portfolio, 0.22%, at Cost and Net Asset Value | 3,078,029 | $ | 3,078,029 | ||
| Issuer/Expiration Date/ Strike Price | Number of Contracts | Value ($) | ||||
| CALL OPTIONS PURCHASED – 0.0% | ||||||
| Metals & Mining – 0.0% | ||||||
| United States Steel Corp. – October 2010 @ $75 | 428 | $ | 4,280 | |||
| Precious Metals & Minerals – 0.0% | ||||||
| Teck Resources Ltd., “B” – August 2010 @ $60 | 2,543 | $ | 0 | |||
| Total Call Options Purchased (Premiums Paid, $306,044) | $ | 4,280 | ||||
| Total Investments (Identified Cost, $187,760,421) | $ | 174,325,925 | ||||
| OTHER ASSETS, LESS LIABILITIES – (1.0)% | (1,695,992 | ) | ||||
| Net Assets – 100.0% | $ | 172,629,933 | ||||
| (a) | Non-income producing security. |
| (s) | Security or a portion of the security was pledged to cover collateral requirements for securities sold short. At June 30, 2010, the value of securities pledged amounted to $162,845. At June 30, 2010, the fund had no short sales outstanding. |
| (v) | Underlying fund that is available only to investment companies managed by MFS. The rate quoted is the annualized seven-day yield of the fund at period end. |
| (w) | When-issued security. At June 30, 2010, the fund had sufficient cash and/or securities at least equal to the value of the when-issued security. |
The following abbreviations are used in this report and are defined:
| ADR | American Depository Receipt |
| GDR | Global Depository Receipt |
See Notes to Financial Statements
7
Table of Contents
MFS Research Series
FINANCIAL STATEMENTS | STATEMENT OF ASSETS AND LIABILITIES (unaudited)
This statement represents your fund’s balance sheet, which details the assets and liabilities comprising the total value of the fund.
At 6/30/10 | |||||
Assets | |||||
Investments – | |||||
Non-affiliated issuers, at value (identified cost, $184,682,392) | $171,247,896 | ||||
Underlying funds, at cost and value | 3,078,029 | ||||
Total investments, at value (identified cost, $187,760,421) | $174,325,925 | ||||
Cash | 9,650 | ||||
Receivables for | |||||
Investments sold | 3,819,205 | ||||
Fund shares sold | 37,835 | ||||
Interest and dividends | 165,061 | ||||
Other assets | 1,269 | ||||
Total assets | $178,358,945 | ||||
Liabilities | |||||
Payables for | |||||
Investments purchased | $5,206,543 | ||||
Fund shares reacquired | 429,207 | ||||
Payable to affiliates | |||||
Investment adviser | 7,295 | ||||
Shareholder servicing costs | 294 | ||||
Distribution and/or service fees | 226 | ||||
Administrative services fee | 190 | ||||
Payable for independent Trustees’ compensation | 795 | ||||
Accrued expenses and other liabilities | 84,462 | ||||
Total liabilities | $5,729,012 | ||||
Net assets | $172,629,933 | ||||
Net assets consist of | |||||
Paid-in capital | $385,555,776 | ||||
Unrealized appreciation (depreciation) on investments and translation of assets and liabilities in foreign currencies | (13,434,496 | ) | |||
Accumulated net realized gain (loss) on investments and foreign currency transactions | (200,198,870 | ) | |||
Undistributed net investment income | 707,523 | ||||
Net assets | $172,629,933 | ||||
Shares of beneficial interest outstanding | 11,404,799 |
| Net assets | Shares outstanding | Net asset value per share | ||||
Initial Class | $156,606,966 | 10,341,713 | $15.14 | |||
Service Class | 16,022,967 | 1,063,086 | 15.07 |
See Notes to Financial Statements
8
Table of Contents
MFS Research Series
FINANCIAL STATEMENTS | STATEMENT OF OPERATIONS (unaudited)
This statement describes how much your fund earned in investment income and accrued in expenses. It also describes any gains and/or losses generated by fund operations.
| Six months ended 6/30/10 | ||||||
| Net investment income | ||||||
| Income | ||||||
Dividends | $1,588,477 | |||||
Interest | 9,526 | |||||
Dividends from underlying funds | 828 | |||||
Foreign taxes withheld | (6,515 | ) | ||||
Total investment income | $1,592,316 | |||||
Expenses | ||||||
Management fee | $728,034 | |||||
Distribution and/or service fees | 21,689 | |||||
Shareholder servicing costs | 12,206 | |||||
Administrative services fee | 18,963 | |||||
Independent Trustees’ compensation | 3,210 | |||||
Custodian fee | 20,770 | |||||
Shareholder communications | 35,160 | |||||
Auditing fees | 24,211 | |||||
Legal fees | 2,026 | |||||
Dividend and interest expense on securities sold short | 9,100 | |||||
Miscellaneous | 9,311 | |||||
Total expenses | $884,680 | |||||
Fees paid indirectly | (5 | ) | ||||
Reduction of expenses by investment adviser | (637 | ) | ||||
Net expenses | $884,038 | |||||
Net investment income | $708,278 | |||||
Realized and unrealized gain (loss) on investments and foreign currency transactions | ||||||
Realized gain (loss) (identified cost basis) | ||||||
Investment transactions | $8,584,441 | |||||
Securities sold short | 120,823 | |||||
Foreign currency transactions | (2,665 | ) | ||||
Net realized gain (loss) on investments and foreign currency transactions | $8,702,599 | |||||
| Change in unrealized appreciation (depreciation) | ||||||
Investments | $(24,003,443 | ) | ||||
Securities sold short | (56,685 | ) | ||||
Translation of assets and liabilities in foreign currencies | (193 | ) | ||||
Net unrealized gain (loss) on investments and foreign currency translation | $(24,060,321 | ) | ||||
Net realized and unrealized gain (loss) on investments and foreign currency | $(15,357,722 | ) | ||||
Change in net assets from operations | $(14,649,444 | ) |
See Notes to Financial Statements
9
Table of Contents
MFS Research Series
FINANCIAL STATEMENTS | STATEMENTS OF CHANGES IN NET ASSETS
These statements describe the increases and/or decreases in net assets resulting from operations, any distributions, and any shareholder transactions.
| Six months ended 6/30/10 (unaudited | ) | Year ended 12/31/09 | | |||
Change in net assets | ||||||
From operations | ||||||
Net investment income | $708,278 | $1,761,950 | ||||
Net realized gain (loss) on investments and foreign currency transactions | 8,702,599 | (24,371,574 | ) | |||
Net unrealized gain (loss) on investments and foreign currency translation | (24,060,321 | ) | 69,287,638 | |||
Change in net assets from operations | $(14,649,444 | ) | $46,678,014 | |||
Distributions declared to shareholders | ||||||
From net investment income | $(1,762,583 | ) | $(2,452,982 | ) | ||
Change in net assets from fund share transactions | $(8,382,902 | ) | $(9,268,512 | ) | ||
Total change in net assets | $(24,794,929 | ) | $34,956,520 | |||
Net assets | ||||||
At beginning of period | 197,424,862 | 162,468,342 | ||||
At end of period (including undistributed net investment income of $707,523 and | $172,629,933 | $197,424,862 |
See Notes to Financial Statements
10
Table of Contents
MFS Research Series
FINANCIAL STATEMENTS | FINANCIAL HIGHLIGHTS
The financial highlights table is intended to help you understand the fund’s financial performance for the semiannual period and the past 5 fiscal years. Certain information reflects financial results for a single fund share. The total returns in the table represent the rate by which an investor would have earned (or lost) on an investment in the fund share class (assuming reinvestment of all distributions) held for the entire period.
| Initial Class | Six months ended 6/30/10 | Years ended 12/31 | ||||||||||||||||
| 2009 | 2008 | 2007 | 2006 | 2005 | ||||||||||||||
| (unaudited) | ||||||||||||||||||
Net asset value, beginning of period | $16.57 | $12.90 | $20.28 | $18.04 | $16.41 | $15.30 | ||||||||||||
| Income (loss) from investment operations | ||||||||||||||||||
Net investment income (d) | $0.06 | $0.15 | $0.18 | $0.09 | $0.12 | $0.07 | ||||||||||||
Net realized and unrealized gain (loss) on investments and foreign currency | (1.34 | ) | 3.72 | (7.47 | ) | 2.28 | 1.59 | 1.11 | ||||||||||
Total from investment operations | $(1.28 | ) | $3.87 | $(7.29 | ) | $2.37 | $1.71 | $1.18 | ||||||||||
| Less distributions declared to shareholders | ||||||||||||||||||
From net investment income | $(0.15 | ) | $(0.20 | ) | $(0.09 | ) | $(0.13 | ) | $(0.08 | ) | $(0.07 | ) | ||||||
Net asset value, end of period | $15.14 | $16.57 | $12.90 | $20.28 | $18.04 | $16.41 | ||||||||||||
Total return (%) (k)(r)(s) | (7.84 | )(n) | 30.54 | (36.09 | )(t) | 13.20 | 10.48 | 7.80 | ||||||||||
| Ratios (%) (to average net assets) and Supplemental data: | ||||||||||||||||||
Expenses before expense reductions (f) | 0.89 | (a) | 0.90 | 0.88 | 0.88 | 0.90 | 0.93 | |||||||||||
Expenses after expense reductions (f) | 0.89 | (a) | 0.90 | 0.88 | 0.88 | 0.89 | 0.93 | |||||||||||
Expenses after expense reductions excluding short sale dividend and interest expense (f) | 0.88 | (a) | 0.90 | N/A | N/A | N/A | N/A | |||||||||||
Net investment income | 0.75 | (a) | 1.05 | 1.04 | 0.46 | 0.71 | 0.47 | |||||||||||
Portfolio turnover | 38 | 107 | 123 | 87 | 90 | 93 | ||||||||||||
Net assets at end of period (000 omitted) | $156,607 | $180,229 | $149,517 | $281,339 | $267,602 | $289,472 | ||||||||||||
See Notes to Financial Statements
11
Table of Contents
MFS Research Series
Financial Highlights – continued
| Service Class | Six months ended 6/30/10 | Years ended 12/31 | ||||||||||||||||
| 2009 | 2008 | 2007 | 2006 | 2005 | ||||||||||||||
| (unaudited) | ||||||||||||||||||
Net asset value, beginning of period | $16.48 | $12.82 | $20.16 | $17.94 | $16.33 | $15.23 | ||||||||||||
| Income (loss) from investment operations | ||||||||||||||||||
Net investment income (d) | $0.04 | $0.11 | $0.13 | $0.05 | $0.09 | $0.04 | ||||||||||||
Net realized and unrealized gain (loss) on | (1.33 | ) | 3.71 | (7.42 | ) | 2.26 | 1.57 | 1.11 | ||||||||||
Total from investment operations | $(1.29 | ) | $3.82 | $(7.29 | ) | $2.31 | $1.66 | $1.15 | ||||||||||
| Less distributions declared to shareholders | ||||||||||||||||||
From net investment income | $(0.12 | ) | $(0.16 | ) | $(0.05 | ) | $(0.09 | ) | $(0.05 | ) | $(0.05 | ) | ||||||
Net asset value, end of period | $15.07 | $16.48 | $12.82 | $20.16 | $17.94 | $16.33 | ||||||||||||
Total return (%) (k)(r)(s) | (7.94 | )(n) | 30.20 | (36.25 | )(t) | 12.93 | 10.20 | 7.57 | ||||||||||
| Ratios (%) (to average net assets) and Supplemental data: | ||||||||||||||||||
Expenses before expense reductions (f) | 1.14 | (a) | 1.15 | 1.14 | 1.13 | 1.14 | 1.19 | |||||||||||
Expenses after expense reductions (f) | 1.14 | (a) | 1.15 | 1.13 | 1.13 | 1.14 | 1.19 | |||||||||||
Expenses after expense reductions excluding short | 1.13 | (a) | 1.15 | N/A | N/A | N/A | N/A | |||||||||||
Net investment income | 0.50 | (a) | 0.80 | 0.78 | 0.23 | 0.51 | 0.23 | |||||||||||
Portfolio turnover | 38 | 107 | 123 | 87 | 90 | 93 | ||||||||||||
Net assets at end of period (000 omitted) | $16,023 | $17,196 | $12,951 | $21,116 | $16,674 | $13,533 | ||||||||||||
| (a) | Annualized. |
| (d) | Per share data is based on average shares outstanding. |
| (f) | Ratios do not reflect reductions from fees paid indirectly, if applicable. |
| (k) | The total return does not reflect expenses that apply to separate accounts. Inclusion of these charges would reduce the total return figures for all periods shown. |
| (n) | Not annualized. |
| (r) | Certain expenses have been reduced without which performance would have been lower. |
| (s) | From time to time the fund may receive proceeds from litigation settlements, without which performance would be lower. |
| (t) | Excluding the effect of the proceeds received from a non-recurring litigation settlement against Enron Corp., the Initial Class and Service Class total returns for the year ended December 31, 2008 would have each been lower by approximately 0.82%. |
See Notes to Financial Statements
12
Table of Contents
MFS Research Series
NOTES TO FINANCIAL STATEMENTS (unaudited)
| (1) | Business and Organization |
MFS Research Series (the fund) is a series of MFS Variable Insurance Trust (the trust). The trust is organized as a Massachusetts business trust and is registered under the Investment Company Act of 1940, as amended, as an open-end management investment company. The shareholders of each series of the trust are separate accounts of insurance companies, which offer variable annuity and/or life insurance products, and qualified retirement and pension plans.
| (2) | Significant Accounting Policies |
General – The preparation of financial statements in conformity with U.S. generally accepted accounting principles requires management to make estimates and assumptions that affect the reported amounts of assets and liabilities, and disclosure of contingent assets and liabilities at the date of the financial statements and the reported amounts of revenues and expenses during the reporting period. Actual results could differ from those estimates. In the preparation of these financial statements, management has evaluated subsequent events occurring after the date of the fund’s Statement of Assets and Liabilities through the date that the financial statements were issued. The fund can invest in foreign securities, including securities of emerging market issuers. Investments in foreign securities are vulnerable to the effects of changes in the relative values of the local currency and the U.S. dollar and to the effects of changes in each country’s legal, political, and economic environment. The markets of emerging markets countries are generally more volatile than the markets of developed countries with more mature economies. All of the risks of investing in foreign securities previously described are heightened when investing in emerging markets countries.
Investment Valuations – Equity securities, including restricted equity securities, are generally valued at the last sale or official closing price as provided by a third-party pricing service on the market or exchange on which they are primarily traded. Equity securities, for which there were no sales reported that day, are generally valued at the last quoted daily bid quotation as provided by a third-party pricing service on the market or exchange on which such securities are primarily traded. Equity securities held short, for which there were no sales reported for that day, are generally valued at the last quoted daily ask quotation as provided by a third-party pricing service on the market or exchange on which such securities are primarily traded. Short-term instruments with a maturity at issuance of 60 days or less generally are valued at amortized cost, which approximates market value. Exchange-traded options are generally valued at the last sale or official closing price as provided by a third-party pricing service on the exchange on which such options are primarily traded. Exchange-traded options for which there were no sales reported that day are generally valued at the last daily bid quotation as provided by a third-party pricing service on the exchange on which such options are primarily traded. Options not traded on an exchange are generally valued at a broker/dealer bid quotation. Foreign currency options are generally valued using an external pricing model that uses market data from a third-party source. Open-end investment companies are generally valued at net asset value per share. Securities and other assets generally valued on the basis of information from a third-party pricing service may also be valued at a broker/dealer bid quotation. Values obtained from third-party pricing services can utilize both transaction data and market information such as yield, quality, coupon rate, maturity, type of issue, trading characteristics, and other market data. The values of foreign securities and other assets and liabilities expressed in foreign currencies are converted to U.S. dollars using the mean of bid and asked prices for rates provided by a third-party pricing service.
The Board of Trustees has delegated primary responsibility for determining or causing to be determined the value of the fund’s investments (including any fair valuation) to the adviser pursuant to valuation policies and procedures approved by the Board. If the adviser determines that reliable market quotations are not readily available, investments are valued at fair value as determined in good faith by the adviser in accordance with such procedures under the oversight of the Board of Trustees. Under the fund’s valuation policies and procedures, market quotations are not considered to be readily available for most types of debt instruments and floating rate loans and many types of derivatives. These investments are generally valued at fair value based on information from third-party pricing services. In addition, investments may be valued at fair value if the adviser determines that an investment’s value has been materially affected by events occurring after the close of the exchange or market on which the investment is principally traded (such as foreign exchange or market) and prior to the determination of the fund’s net asset value, or after the halting of trading of a specific security where trading does not resume prior to the close of the exchange or market on which the security is principally traded. Events that occur on a frequent basis after foreign markets close (such as developments in foreign markets and significant movements in the U.S. markets) and prior to the determination of the fund’s net asset value may be deemed to have a material effect on the value of securities traded in foreign markets. Accordingly, the fund’s foreign equity securities may often be valued at fair value. The adviser generally relies on third-party pricing services or other information (such as the correlation with price movements of similar securities in the same or other markets; the type, cost and investment characteristics of the security; the business and financial condition of the issuer; and trading and other market data) to assist in determining whether to fair value and at what value to fair value an investment. The value of an investment for purposes of calculating the fund’s net asset value can differ depending on the
13
Table of Contents
MFS Research Series
Notes to Financial Statements (unaudited) – continued
source and method used to determine value. When fair valuation is used, the value of an investment used to determine the fund’s net asset value may differ from quoted or published prices for the same investment. There can be no assurance that the fund could obtain the fair value assigned to an investment if it were to sell the investment at the same time at which the fund determines its net asset value per share.
Various inputs are used in determining the value of the fund’s assets or liabilities. These inputs are categorized into three broad levels. In certain cases, the inputs used to measure fair value may fall into different levels of the fair value hierarchy. In such cases, an investment’s level within the fair value hierarchy is based on the lowest level of input that is significant to the fair value measurement. The fund’s assessment of the significance of a particular input to the fair value measurement in its entirety requires judgment, and considers factors specific to the investment. Level 1 includes unadjusted quoted prices in active markets for identical assets or liabilities. Level 2 includes other significant observable market-based inputs (including quoted prices for similar securities, interest rates, prepayment speed, and credit risk). Level 3 includes unobservable inputs, which may include the adviser’s own assumptions in determining the fair value of investments. Other financial instruments are derivative instruments not reflected in total investments, such as futures, forwards, swap contracts, and written options. The following is a summary of the levels used as of June 30, 2010 in valuing the fund’s assets or liabilities:
| Investments at Value | Level 1 | Level 2 | Level 3 | Total | ||||
| Equity Securities: | ||||||||
United States | $165,770,965 | $437,885 | $— | $166,208,850 | ||||
Canada | 2,571,157 | — | — | 2,571,157 | ||||
Israel | 1,615,383 | — | — | 1,615,383 | ||||
South Korea | — | 852,506 | — | 852,506 | ||||
| Mutual Funds | 3,078,029 | — | — | 3,078,029 | ||||
| Total Investments | $173,035,534 | $1,290,391 | $— | $174,325,925 |
For further information regarding security characteristics, see the Portfolio of Investments.
Foreign Currency Translation – Purchases and sales of foreign investments, income, and expenses are converted into U.S. dollars based upon currency exchange rates prevailing on the respective dates of such transactions or on the reporting date for foreign denominated receivables and payables. Gains and losses attributable to foreign currency exchange rates on sales of securities are recorded for financial statement purposes as net realized gains and losses on investments. Gains and losses attributable to foreign exchange rate movements on receivables, payables, income and expenses are recorded for financial statement purposes as foreign currency transaction gains and losses. That portion of both realized and unrealized gains and losses on investments that results from fluctuations in foreign currency exchange rates is not separately disclosed.
Derivatives – The fund may use derivatives for different purposes, including to earn income and enhance returns, to increase or decrease exposure to a particular market, to manage or adjust the risk profile of the fund, or as alternatives to direct investments. Derivatives may be used for hedging or non-hedging purposes. While hedging can reduce or eliminate losses, it can also reduce or eliminate gains. When the fund uses derivatives as an investment to increase market exposure, or for hedging purposes, gains and losses from derivative instruments may be substantially greater than the derivative’s original cost.
Derivative instruments include written options, purchased options, futures contracts, forward foreign currency exchange contracts, and swap agreements. The fund’s period end derivatives, as presented in the Portfolio of Investments and the associated Derivative Contract Tables, generally are indicative of the volume of its derivative activity during the period.
The following table presents, by major type of derivative contract, the fair value, on a gross basis, of the asset and liability components of derivatives held by the fund at June 30, 2010:
| Fair Value (a) | ||||
| Risk | Derivative | Asset Derivatives | ||
| Equity Contracts | Purchased Equity Options | $4,280 |
| (a) | The value of purchased options outstanding is included in total investments, at value, within the fund’s Statement of Assets and Liabilities. |
The following table presents, by major type of derivative contract, the realized gain (loss) on derivatives held by the fund for the six months ended June 30, 2010 as reported in the Statement of Operations:
Investment Transactions | |||
| Equity Contracts | $(177,016 | ) |
14
Table of Contents
MFS Research Series
Notes to Financial Statements (unaudited) – continued
The following table presents, by major type of derivative contract, the change in unrealized appreciation (depreciation) on derivatives held by the fund for the six months ended June 30, 2010 as reported in the Statement of Operations:
Investments | |||
| Equity Contracts | $(325,149 | ) |
Derivative counterparty credit risk is managed through formal evaluation of the creditworthiness of all potential counterparties. On certain over-the-counter derivatives, the fund attempts to reduce its exposure to counterparty credit risk whenever possible by entering into an International Swaps and Derivatives Association (ISDA) Master Agreement on a bilateral basis with each of the counterparties with whom it undertakes a significant volume of transactions. The ISDA Master Agreement gives each party to the agreement the right to terminate all transactions traded under such agreement if there is a certain deterioration in the credit quality of the other party. The ISDA Master Agreement gives the fund the right, upon an event of default by the applicable counterparty or a termination of the agreement, to close out all transactions traded under such agreement and to net amounts owed under each transaction to one net amount payable by one party to the other. This right to close out and net payments across all transactions traded under the ISDA Master Agreement could result in a reduction of the fund’s credit risk to such counterparty equal to any amounts payable by the fund under the applicable transactions, if any. However, absent an event of default by the counterparty or a termination of the agreement, the ISDA Master Agreement does not result in an offset of reported balance sheet assets and liabilities across transactions between the fund and the applicable counterparty.
Collateral requirements differ by type of derivative. Collateral or margin requirements are set by the broker or exchange clearing house for exchange traded derivatives (i.e., futures and exchange-traded options) while collateral terms are contract specific for over-the-counter traded derivatives (i.e., forwards, swaps and over-the-counter options). For derivatives traded under an ISDA Master Agreement, the collateral requirements are netted across all transactions traded under such agreement and one amount is posted from one party to the other to collateralize such obligations. Cash collateral that has been pledged to cover obligations of the fund under derivative contracts will be reported separately on the Statement of Assets and Liabilities as restricted cash. Securities collateral pledged for the same purpose is noted in the Portfolio of Investments.
Purchased Options – The fund may purchase call or put options for a premium. Purchased options entitle the holder to buy or sell a specified number of shares or units of a particular security, currency or index at a specified price at a specified date or within a specified period of time. Purchasing call options may be used to hedge against an anticipated increase in the dollar cost of securities or currency to be acquired or to increase the fund’s exposure to an underlying instrument. Purchasing put options may hedge against a decline in the value of portfolio securities or currency.
The premium paid is initially recorded as an investment in the Statement of Assets and Liabilities. That investment is subsequently marked-to-market daily with the difference between the premium paid and the market value of the purchased option being recorded as unrealized appreciation or depreciation. Premiums paid for purchased options which have expired are treated as realized losses on investments in the Statement of Operations. Upon the exercise or closing of a purchased option, the premium paid is either added to the cost of the security or financial instrument in the case of a call option, or offset against the proceeds on the sale of the underlying security or financial instrument in the case of a put option, in order to determine the realized gain or loss on investments.
The risk in purchasing an option is that the fund pays a premium whether or not the option is exercised. The fund’s maximum risk of loss due to counterparty credit risk is limited to the market value of the option. For over-the-counter options, this risk is mitigated in cases where there is an ISDA Master Agreement between the fund and the counterparty providing for netting as described above and for posting of collateral by the counterparty to the fund to cover the fund’s exposure to the counterparty under such ISDA Master Agreement.
Short Sales – The fund may enter into short sales whereby it sells a security it does not own in anticipation of a decline in the value of that security. The fund will realize a gain if the security price decreases and a loss if the security price increases between the date of the short sale and the date on which the fund replaces the borrowed security. Losses from short sales can exceed the proceeds of the security sold; and they can also exceed the potential loss from an ordinary buy and sell transaction. The amount of any premium, dividends, or interest the fund may be required to pay in connection with a short sale will be recognized as a fund expense. During the six months ended June 30, 2010, this expense amounted to $9,100. The fund segregates cash or marketable securities in an amount that, when combined with the amount of proceeds from the short sale deposited with the broker, at least equals the current market value of the security sold short. At June 30, 2010, the fund had no short sales outstanding.
15
Table of Contents
MFS Research Series
Notes to Financial Statements (unaudited) – continued
Security Loans – State Street Bank and Trust Company (“State Street”), as lending agent, may loan the securities of the fund to certain qualified institutions (the “Borrowers”) approved by the fund. The loans are collateralized by cash and/or U.S. Treasury and federal agency obligations in an amount typically at least equal to the market value of the securities loaned. The market value of the loaned securities is determined at the close of business of the fund and any additional required collateral is delivered to the fund on the next business day. State Street provides the fund with indemnification against Borrower default. The fund bears the risk of loss with respect to the investment of cash collateral. On loans collateralized by cash, the cash collateral is invested in a money market fund or short-term securities. A portion of the income generated upon investment of the collateral is remitted to the Borrowers, and the remainder is allocated between the fund and the lending agent. On loans collateralized by U.S. Treasury and/or federal agency obligations, a fee is received from the Borrower, and is allocated between the fund and the lending agent. Income from securities lending is included in interest income on the Statement of Operations. The dividend and interest income earned on the securities loaned is accounted for in the same manner as other dividend and interest income.
Indemnifications – Under the fund’s organizational documents, its officers and Trustees may be indemnified against certain liabilities and expenses arising out of the performance of their duties to the fund. Additionally, in the normal course of business, the fund enters into agreements with service providers that may contain indemnification clauses. The fund’s maximum exposure under these agreements is unknown as this would involve future claims that may be made against the fund that have not yet occurred.
Investment Transactions and Income – Investment transactions are recorded on the trade date. Some securities may be purchased on a “when-issued” or “forward delivery” basis, which means that the securities will be delivered to the fund at a future date, usually beyond customary settlement time. Interest income is recorded on the accrual basis. All premium and discount is amortized or accreted for financial statement purposes in accordance with U.S. generally accepted accounting principles. Dividends received in cash are recorded on the ex-dividend date. Certain dividends from foreign securities will be recorded when the fund is informed of the dividend if such information is obtained subsequent to the ex-dividend date. Dividend and interest payments received in additional securities are recorded on the ex-dividend or ex-interest date in an amount equal to the value of the security on such date.
The fund may receive proceeds from litigation settlements. Any proceeds received from litigation involving portfolio holdings are reflected in the Statement of Operations in realized gain/loss if the security has been disposed of by the fund or in unrealized gain/loss if the security is still held by the fund. Any other proceeds from litigation not related to portfolio holdings are reflected as other income in the Statement of Operations.
Fees Paid Indirectly – The fund’s custody fee may be reduced according to an arrangement that measures the value of cash deposited with the custodian by the fund. This amount, for the six months ended June 30, 2010, is shown as a reduction of total expenses on the Statement of Operations.
Tax Matters and Distributions – The fund intends to qualify as a regulated investment company, as defined under Subchapter M of the Internal Revenue Code, and to distribute all of its taxable income, including realized capital gains. As a result, no provision for federal income tax is required. The fund’s federal tax returns for the prior three fiscal years remain subject to examination by the Internal Revenue Service. Foreign taxes, if any, have been accrued by the fund in the accompanying financial statements.
Distributions to shareholders are recorded on the ex-dividend date. Income and capital gain distributions are determined in accordance with income tax regulations, which may differ from U.S. generally accepted accounting principles. Certain capital accounts in the financial statements are periodically adjusted for permanent differences in order to reflect their tax character. These adjustments have no impact on net assets or net asset value per share. Temporary differences which arise from recognizing certain items of income, expense, gain or loss in different periods for financial statement and tax purposes will reverse at some time in the future. Distributions in excess of net investment income or net realized gains are temporary overdistributions for financial statement purposes resulting from differences in the recognition or classification of income or distributions for financial statement and tax purposes.
Book/tax differences primarily relate to expiration of capital loss carryforwards, wash sale loss deferrals, and straddle loss deferrals.
The tax character of distributions made during the current period, if any, will be determined at fiscal year end. The tax character of distributions declared to shareholders for the last fiscal year is as follows:
| 12/31/09 | ||
| Ordinary income (including any short-term capital gains) | $2,452,982 |
16
Table of Contents
MFS Research Series
Notes to Financial Statements (unaudited) – continued
The federal tax cost and the tax basis components of distributable earnings were as follows:
| As of 6/30/2010 | |||
| Cost of investments | $188,105,820 | ||
| Gross appreciation | 6,873,971 | ||
| Gross depreciation | (20,653,866 | ) | |
| Net unrealized appreciation (depreciation) | $(13,779,895 | ) | |
| As of 12/31/09 | |||
| Undistributed ordinary income | 1,761,828 | ||
| Capital loss carryforwards | (208,482,108 | ) | |
| Other temporary differences | (17,084 | ) | |
| Net unrealized appreciation (depreciation) | 10,223,548 | ||
The aggregate cost above includes prior fiscal year end tax adjustments, if applicable.
As of December 31, 2009, the fund had capital loss carryforwards available to offset future realized gains. Such losses expire as follows:
| 12/31/10 | $(162,851,213 | ) | |
| 12/31/16 | (20,169,637 | ) | |
| 12/31/17 | (25,461,258 | ) | |
| $(208,482,108 | ) |
Multiple Classes of Shares of Beneficial Interest – The fund offers multiple classes of shares, which differ in their respective distribution and/or service fees. The fund’s income, realized and unrealized gain (loss), and common expenses are allocated to shareholders based on the daily net assets of each class. Dividends are declared separately for each class. Differences in per share dividend rates are generally due to differences in separate class expenses. The fund’s distributions declared to shareholders as reported on the Statements of Changes in Net Assets are presented by class as follows:
| From net investment income | ||||
| Six months ended 6/30/10 | Year ended 12/31/09 | |||
| Initial Class | $1,635,301 | $2,291,426 | ||
| Service Class | 127,282 | 161,556 | ||
| Total | $1,762,583 | $2,452,982 | ||
| (3) | Transactions with Affiliates |
Investment Adviser – The fund has an investment advisory agreement with MFS to provide overall investment management and related administrative services and facilities to the fund. The management fee is computed daily and paid monthly at the following annual rates:
| First $1 billion of average daily net assets | 0.75% | |
| Average daily net assets in excess of $1 billion | 0.65% |
The management fee incurred for the six months ended June 30, 2010 was equivalent to an annual effective rate of 0.75% of the fund’s average daily net assets.
Distributor – MFS Fund Distributors, Inc. (MFD), a wholly-owned subsidiary of MFS, is the distributor of shares of the fund. The Trustees have adopted a distribution plan for the Service Class shares pursuant to Rule 12b-1 under the Investment Company Act of 1940.
The fund’s distribution plan provides that the fund will pay MFD distribution and/or service fees equal to 0.25% per annum of its average daily net assets attributable to Service Class shares as partial consideration for services performed and expenses incurred by MFD and financial intermediaries (including participating insurance companies that invest in the fund to fund variable annuity and variable life insurance contracts, sponsors of qualified retirement and pension plans that invest in the fund, and affiliates of these participating insurance companies and plan sponsors) in connection with the sale and distribution of the Service Class shares. MFD may subsequently pay all, or a portion, of the distribution and/or service fees to financial intermediaries.
17
Table of Contents
MFS Research Series
Notes to Financial Statements (unaudited) – continued
Shareholder Servicing Agent – MFS Service Center, Inc. (MFSC), a wholly-owned subsidiary of MFS, receives a fee from the fund for its services as shareholder servicing agent. For the six months ended June 30, 2010, the fee was $11,618, which equated to 0.0120% annually of the fund’s average daily net assets. MFSC also receives payment from the fund for out-of-pocket expenses paid by MFSC on behalf of the fund. For the six months ended June 30, 2010, these costs amounted to $588.
Administrator – MFS provides certain financial, legal, shareholder communications, compliance, and other administrative services to the fund. Under an administrative services agreement, the fund partially reimburses MFS the costs incurred to provide these services. The fund is charged an annual fixed amount of $17,500 plus a fee based on average daily net assets. The administrative services fee incurred for the six months ended June 30, 2010 was equivalent to an annual effective rate of 0.0195% of the fund’s average daily net assets.
Trustees’ and Officers’ Compensation – The fund pays compensation to independent Trustees in the form of a retainer, attendance fees, and additional compensation to Board and Committee chairpersons. The fund does not pay compensation directly to Trustees or officers of the fund who are also officers of the investment adviser, all of whom receive remuneration for their services to the fund from MFS. Certain officers and Trustees of the fund are officers or directors of MFS, MFD, and MFSC.
Other – This fund and certain other funds managed by MFS (the funds) have entered into services agreements (the Agreements) which provide for payment of fees by the funds to Tarantino LLC and Griffin Compliance LLC in return for the provision of services of an Independent Chief Compliance Officer (ICCO) and Assistant ICCO, respectively, for the funds. The ICCO and Assistant ICCO are officers of the funds and the sole members of Tarantino LLC and Griffin Compliance LLC, respectively. The funds can terminate the Agreements with Tarantino LLC and Griffin Compliance LLC at any time under the terms of the Agreements. For the six months ended June 30, 2010, the aggregate fees paid by the fund to Tarantino LLC and Griffin Compliance LLC were $795 and are included in miscellaneous expense on the Statement of Operations. MFS has agreed to reimburse the fund for a portion of the payments made by the fund in the amount of $637, which is shown as a reduction of total expenses in the Statement of Operations. Additionally, MFS has agreed to bear all expenses associated with office space, other administrative support, and supplies provided to the ICCO and Assistant ICCO.
The fund may invest in the MFS Institutional Money Market Portfolio which is managed by MFS and seeks a high level of current income consistent with preservation of capital and liquidity. Income earned on this investment is included in dividends from underlying funds on the Statement of Operations. This money market fund does not pay a management fee to MFS.
| (4) | Portfolio Securities |
Purchases and sales of investments, other than U.S. Government securities, purchased option transactions, short sales, and short-term obligations, aggregated $72,544,537 and $82,462,973, respectively.
| (5) | Shares of Beneficial Interest |
The fund’s Declaration of Trust permits the Trustees to issue an unlimited number of full and fractional shares of beneficial interest. Transactions in fund shares were as follows:
| Six months ended 6/30/10 | Year ended 12/31/09 | |||||||||||
| Shares | Amount | Shares | Amount | |||||||||
| Shares sold | ||||||||||||
Initial Class | 549,253 | $9,280,336 | 1,367,134 | $18,881,402 | ||||||||
Service Class | 98,193 | 1,638,087 | 183,284 | 2,574,386 | ||||||||
| 647,446 | $10,918,423 | 1,550,418 | $21,455,788 | |||||||||
| Shares issued to shareholders in reinvestment of distributions | ||||||||||||
Initial Class | 91,154 | $1,635,301 | 183,903 | $2,291,426 | ||||||||
Service Class | 7,123 | 127,282 | 13,008 | 161,556 | ||||||||
| 98,277 | $1,762,583 | 196,911 | $2,452,982 | |||||||||
| Shares reacquired | ||||||||||||
Initial Class | (1,178,296 | ) | $(19,648,975 | ) | (2,266,106 | ) | $(30,950,570 | ) | ||||
Service Class | (85,807 | ) | (1,414,933 | ) | (163,311 | ) | (2,226,712 | ) | ||||
| (1,264,103 | ) | $(21,063,908 | ) | (2,429,417 | ) | $(33,177,282 | ) | |||||
| Net change | ||||||||||||
Initial Class | (537,889 | ) | $(8,733,338 | ) | (715,069 | ) | $(9,777,742 | ) | ||||
Service Class | 19,509 | 350,436 | 32,981 | 509,230 | ||||||||
| (518,380 | ) | $(8,382,902 | ) | (682,088 | ) | $(9,268,512 | ) | |||||
18
Table of Contents
MFS Research Series
Notes to Financial Statements (unaudited) – continued
| (6) | Line of Credit |
The fund and certain other funds managed by MFS participate in a $1.1 billion unsecured committed line of credit, subject to a $1 billion sublimit, provided by a syndication of banks under a credit agreement. Borrowings may be made for temporary financing needs. Interest is charged to each fund, based on its borrowings, generally at a rate equal to the higher of the Federal Reserve funds rate or one month LIBOR plus an agreed upon spread. A commitment fee, based on the average daily, unused portion of the committed line of credit, is allocated among the participating funds at the end of each calendar quarter. In addition, the fund and other funds managed by MFS have established unsecured uncommitted borrowing arrangements with certain banks for temporary financing needs. Interest is charged to each fund, based on its borrowings, at a rate equal to the Federal Reserve funds rate plus an agreed upon spread. For the six months ended June 30, 2010, the fund’s commitment fee and interest expense were $1,449 and $0, respectively, and are included in miscellaneous expense on the Statement of Operations.
| (7) | Transactions in Underlying Funds – Affiliated Issuers |
An affiliated issuer may be considered one in which the fund owns 5% or more of the outstanding voting securities, or a company which is under common control. For the purposes of this report, the fund assumes the following to be affiliated issuers:
| Underlying Funds | Beginning Shares/Par Amount | Acquisitions Shares/Par Amount | Dispositions Shares/Par Amount | Ending Shares/Par Amount | |||||
| MFS Institutional Money Market Portfolio | 1,459,456 | 18,540,643 | (16,922,070 | ) | 3,078,029 | ||||
| Underlying Funds | Realized Gain (Loss) | Capital Gain Distributions | Dividend Income | Ending Value | |||||
| MFS Institutional Money Market Portfolio | $— | $— | $828 | $3,078,029 | |||||
19
Table of Contents
MFS Research Series
RESULTS OF SHAREHOLDER MEETING (unaudited)
At a special meeting of shareholders of MFS Variable Insurance Trust, which was held on January 28, 2010, the following actions were taken:
Item 1. To elect the following individuals as Trustees:
| Number of Dollars | ||||
| Nominee | For | Withheld Authority | ||
| Robert E. Butler | 6,823,651,821.26 | 1,818,252,669.55 | ||
| Lawrence H. Cohn, M.D. | 6,813,621,200.14 | 1,828,283,290.67 | ||
| Maureen R. Goldfarb | 6,825,332,620.76 | 1,816,571,870.05 | ||
| David H. Gunning | 6,823,081,841.37 | 1,818,822,649.44 | ||
| William R. Gutow | 6,813,678,877.22 | 1,828,225,613.59 | ||
| Michael Hegarty | 6,827,456,515.87 | 1,814,447,974.94 | ||
| John P. Kavanaugh | 6,830,363,113.12 | 1,811,541,377.69 | ||
| Robert J. Manning | 6,825,511,264.17 | 1,816,393,226.64 | ||
| Robert C. Pozen | 6,824,854,120.27 | 1,817,050,370.54 | ||
| J. Dale Sherratt | 6,816,913,203.87 | 1,824,991,286.94 | ||
| Laurie J. Thomsen | 6,823,590,745.56 | 1,818,313,745.25 | ||
| Robert W. Uek | 6,818,161,803.66 | 1,823,742,687.15 | ||
20
Table of Contents
MFS Research Series
BOARD REVIEW OF INVESTMENT ADVISORY AGREEMENT
A discussion regarding the Board’s most recent review and renewal of the fund’s Investment Advisory Agreement with MFS will be available on or about November 1, 2010 by clicking on the fund’s name under ‘‘Variable Insurance Portfolios — VIT’’ in the ‘‘Products and Performance’’ section of the MFS Web site (mfs.com).
PROXY VOTING POLICIES AND INFORMATION
A general description of the MFS funds’ proxy voting policies and procedures is available without charge, upon request, by calling 1-800-225-2606, by visiting the Proxy Voting section of mfs.com or by visiting the SEC’s Web site at http://www.sec.gov.
Information regarding how the fund voted proxies relating to portfolio securities during the most recent twelve-month period ended June 30 is available without charge by visiting the Proxy Voting section of mfs.com or by visiting the SEC’s Web site at http://www.sec.gov.
QUARTERLY PORTFOLIO DISCLOSURE
The fund will file a complete schedule of portfolio holdings with the Securities and Exchange Commission (the Commission) for the first and third quarters of each fiscal year on Form N-Q. The fund’s Form N-Q may be reviewed and copied at the:
Public Reference Room
Securities and Exchange Commission
100 F Street, NE, Room 1580
Washington, D.C. 20549
Information on the operation of the Public Reference Room may be obtained by calling the Commission at 1-800-SEC-0330. The fund’s Form N-Q is available on the EDGAR database on the Commission’s Internet Web site at http://www.sec.gov, and copies of this information may be obtained, upon payment of a duplicating fee, by electronic request at the following e-mail address: publicinfo@sec.gov or by writing the Public Reference Section at the above address.
From time to time, MFS may post important information about the fund or the MFS funds on the MFS web site (mfs.com). This information is available by visiting the “News & Commentary” section of mfs.com or by clicking on the fund’s name under “Variable Insurance Portfolios — VIT” in the “Products and Performance” section of mfs.com.
21
Table of Contents

Table of Contents

Table of Contents
MFS® RESEARCH INTERNATIONAL SERIES
This report is prepared for the general information of contract owners. It is authorized for distribution to prospective investors only when preceded or accompanied by a current prospectus.
NOT FDIC INSURED Ÿ MAY LOSE VALUE Ÿ NO BANK GUARANTEE Ÿ NOT A DEPOSIT Ÿ NOT INSURED BY ANY FEDERAL GOVERNMENT AGENCY OR NCUA/NCUSIF
Table of Contents
MFS Research International Series

Dear Contract Owners:
After having suffered their biggest declines since the Great Depression, most global markets experienced an impressive resurgence during the latter months of 2009 and the first quarter of 2010. The global economy was able to reap the benefits of two major trends. The first of these was the massive efforts of governments and central banks to increase liquidity in the financial system as they sought to prevent the credit crisis from further affecting the banking system. The second was the move by companies around the world to cut costs and operations to prepare for rapidly changing market conditions. We believe that these moves not only shortened the length of the downturn but also set the stage for recovery.
Even with the significant market gains of 2009 and the early part of 2010, the recovery is unrolling at a moderate pace, with rebounds in the manufacturing sector and corporate America leading the way. Central bankers are proceeding with caution and many have held benchmark interest rates unchanged as they debate the best way to withdraw stimulus measures without disrupting the fragile growth process. Complicating that debate late in the period was the emergence of the European debt crisis and worries about whether this crisis could derail the global recovery. As that crisis unrolled with no clear resolution, risk aversion rose along with volatility. Weakening economic data late in the period added uncertainty to the mix and sparked a retrenchment in global equity markets.
While hurdles remain, we believe that the global economy is proceeding on the road to recovery. As always, we continue to be mindful of the many challenges faced at the individual, national, and international levels. It is at times such as these that we want to remind investors of the merits of maintaining a long-term view, adhering to basic investing principles such as asset allocation and diversification, and working closely with advisors to identify and research investment opportunities. At MFS®, we take particular pride in how well mutual funds can provide a broad range of products that can fit investor needs in any type of market climate.
Respectfully,

Robert J. Manning
Chairman and Chief Executive Officer
MFS Investment Management®
August 16, 2010
The opinions expressed in this letter are subject to change, may not be relied upon for investment advice, and no forecasts can be guaranteed.
MFS Fund Distributors, Inc., 500 Boylston Street, Boston, MA 02116
1
Table of Contents
MFS Research International Series
Portfolio structure
| Top ten holdings | ||
| Nestle S.A. | 3.3% | |
| HSBC Holdings PLC | 2.5% | |
| Roche Holding AG | 2.4% | |
| Vodafone Group PLC | 2.1% | |
| Royal Dutch Shell PLC, “A” | 2.0% | |
| BNP Paribas | 2.0% | |
| TOTAL S.A. | 2.0% | |
| Siemens AG | 1.9% | |
| BHP Billiton PLC | 1.9% | |
| Sanofi-Aventis | 1.8% |
| Global equity sectors | ||
| Financial Services | 24.3% | |
| Capital Goods | 23.8% | |
| Energy | 12.7% | |
| Health Care | 8.7% | |
| Technology | 8.2% | |
| Consumer Staples | 8.1% | |
| Consumer Cyclicals | 7.9% | |
| Telecommunications/Cable Television | 5.9% |
| Issuer country weightings | ||
| Japan | 17.3% | |
| United Kingdom | 16.2% | |
| France | 11.3% | |
| Switzerland | 10.0% | |
| Germany | 9.6% | |
| Netherlands | 6.1% | |
| Hong Kong | 4.3% | |
| China | 3.3% | |
| Australia | 3.0% | |
| Other Countries | 18.9% |
Percentages are based on net assets as of 6/30/10.
The portfolio is actively managed and current holdings may be different.
2
Table of Contents
MFS Research International Series
After having suffered through one of the largest and most concentrated downturns since the 1930s, most asset markets staged a remarkable rebound during 2009 and early 2010. This recovery in global activity has been led importantly by emerging Asian economies, but broadening to include most of the global economy to varying degrees. Primary drivers of the recovery included an unwinding of the inventory destocking that took place earlier, the production of manufacturing and capital goods, as well as massive fiscal and monetary stimulus.
Late in the period, though, heightened risk surrounding the public-debt profiles of several of the peripheral European countries impaired market sentiment. At the same time, the improving trend in global macroeconomic data began to weaken somewhat. These two dynamics caused most asset prices to retrench significantly, as many questioned the durability of the global recovery.
3
Table of Contents
MFS Research International Series
Fund Expenses Borne by the Contract Holders During the Period,
January 1, 2010 through June 30, 2010
As a contract holder of the fund, you incur ongoing costs, including management fees; distribution and/or service (12b-1) fees; and other fund expenses. This example is intended to help you understand your ongoing costs (in dollars) of investing in the fund and to compare these costs with the ongoing costs of investing in other mutual funds.
The example is based on an investment of $1,000 invested at the beginning of the period and held for the entire period January 1, 2010 through June 30, 2010.
Actual Expenses
The first line for each share class in the following table provides information about actual account values and actual expenses. You may use the information in this line, together with the amount you invested, to estimate the expenses that you paid over the period. Simply divide your account value by $1,000 (for example, an $8,600 account value divided by $1,000 = 8.6), then multiply the result by the number in the first line under the heading entitled “Expenses Paid During Period” to estimate the expenses you paid on your account during this period.
Hypothetical Example for Comparison Purposes
The second line for each share class in the following table provides information about hypothetical account values and hypothetical expenses based on the fund’s actual expense ratio and an assumed rate of return of 5% per year before expenses, which is not the fund’s actual return. The hypothetical account values and expenses may not be used to estimate the actual ending account balance or expenses you paid for the period. You may use this information to compare the ongoing costs of investing in the fund and other funds. To do so, compare this 5% hypothetical example with the 5% hypothetical examples that appear in the shareholder reports of the other funds.
Please note that the expenses shown in the table are meant to highlight the fund’s ongoing costs only and do not take into account the fees and expenses imposed under the variable contracts through which your investment in the fund is made. Therefore, the second line for each share class in the table is useful in comparing ongoing costs associated with an investment in vehicles (such as the fund) which fund benefits under variable annuity and variable life insurance contracts and to qualified pension and retirement plans only, and will not help you determine the relative total costs of investing in the fund through variable annuity and variable life insurance contracts. If the fees and expenses imposed under the variable contracts were included, your costs would have been higher.
| Share Class | Annualized Expense Ratio | Beginning 1/01/10 | Ending 6/30/10 | Expenses Paid 1/01/10-6/30/10 | ||||||
| Initial Class | Actual | 1.10% | $1,000.00 | $872.92 | $5.11 | |||||
| Hypothetical (h) | 1.10% | $1,000.00 | $1,019.34 | $5.51 | ||||||
| Service Class | Actual | 1.35% | $1,000.00 | $871.28 | $6.26 | |||||
| Hypothetical (h) | 1.35% | $1,000.00 | $1,018.10 | $6.76 |
| (h) | 5% class return per year before expenses. |
| (p) | Expenses paid is equal to each class’ annualized expense ratio, as shown above, multiplied by the average account value over the period, multiplied by the number of days in the period, divided by the number of days in the year. |
4
Table of Contents
MFS Research International Series
PORTFOLIO OF INVESTMENTS – 6/30/10 (unaudited)
The Portfolio of Investments is a complete list of all securities owned by your fund. It is categorized by broad-based asset classes.
| Issuer | Shares/Par | Value ($) | |||
| COMMON STOCKS – 99.6% | |||||
| Alcoholic Beverages – 1.1% | |||||
| Heineken N.V. | 41,950 | $ | 1,778,234 | ||
| Apparel Manufacturers – 2.2% | |||||
| Li & Fung Ltd. | 166,000 | $ | 743,103 | ||
| LVMH Moet Hennessy Louis Vuitton S.A. | 25,410 | 2,767,851 | |||
| $ | 3,510,954 | ||||
| Automotive – 1.5% | |||||
| Bayerische Motoren Werke AG | 20,050 | $ | 969,783 | ||
| Bridgestone Corp. | 91,600 | 1,452,154 | |||
| $ | 2,421,937 | ||||
| Broadcasting – 1.9% | |||||
| Grupo Televisa S.A., ADR | 9,770 | $ | 170,096 | ||
| Publicis Groupe S.A. (l) | 21,620 | 859,429 | |||
| WPP Group PLC | 206,358 | 1,940,545 | |||
| $ | 2,970,070 | ||||
| Brokerage & Asset Managers – 3.6% | |||||
| Aberdeen Asset Management PLC | 355,170 | $ | 679,873 | ||
| BM&F Bovespa S.A. | 132,300 | 850,238 | |||
| Deutsche Boerse AG | 21,540 | 1,308,702 | |||
| Hong Kong Exchanges & Clearing Ltd. | 117,800 | 1,836,888 | |||
| Nomura Holdings, Inc. | 178,700 | 978,281 | |||
| $ | 5,653,982 | ||||
| Business Services – 2.1% | |||||
| Cognizant Technology Solutions Corp., “A” (a) | 15,760 | $ | 788,946 | ||
| Mitsubishi Corp. | 76,100 | 1,585,758 | |||
| Nomura Research, Inc. | 46,900 | 991,516 | |||
| $ | 3,366,220 | ||||
| Chemicals – 0.5% | |||||
| Monsanto Co. | 9,770 | $ | 451,569 | ||
| Nufarm Ltd. | 89,672 | 403,285 | |||
| $ | 854,854 | ||||
| Computer Software – 0.3% | |||||
| Dassault Systems S.A. | 8,360 | $ | 505,909 | ||
| Computer Software – Systems – 2.6% | |||||
| Acer, Inc. | 786,190 | $ | 1,823,252 | ||
| Konica Minolta Holdings, Inc. | 181,000 | 1,741,813 | |||
| Ricoh Co. Ltd. | 50,000 | 635,467 | |||
| $ | 4,200,532 | ||||
| Conglomerates – 6.1% | |||||
| Hutchison Whampoa Ltd. | 280,000 | $ | 1,728,713 | ||
| Keppel Corp. Ltd. | 262,000 | 1,578,683 | |||
| MAN SE | 16,152 | 1,331,605 | |||
| Siemens AG | 33,460 | 2,994,232 | |||
| Tomkins PLC | 600,140 | 2,016,159 | |||
| $ | 9,649,392 | ||||
| Issuer | Shares/Par | Value ($) | |||
| COMMON STOCKS – continued | |||||
| Construction – 0.7% | |||||
| Geberit AG | 4,649 | $ | 720,934 | ||
| Urbi Desarrollos Urbanos S.A. de C.V. (a) | 173,770 | 321,526 | |||
| $ | 1,042,460 | ||||
| Consumer Products – 1.4% | |||||
| Kimberly-Clark de Mexico S.A. de C.V., “A” | 94,130 | $ | 543,904 | ||
| Reckitt Benckiser Group PLC | 37,600 | 1,739,249 | |||
| $ | 2,283,153 | ||||
| Electrical Equipment – 1.4% | |||||
| Legrand S.A. | 12,640 | $ | 372,386 | ||
| Schneider Electric S.A. | 18,547 | 1,877,231 | |||
| $ | 2,249,617 | ||||
| Electronics – 2.0% | |||||
| Samsung Electronics Co. Ltd. | 2,140 | $ | 1,343,680 | ||
| Taiwan Semiconductor Manufacturing Co. Ltd. | 1,007,174 | 1,883,315 | |||
| $ | 3,226,995 | ||||
| Energy – Independent – 1.3% | |||||
| CNOOC Ltd. | 306,000 | $ | 521,643 | ||
| INPEX Corp. | 185 | 1,028,225 | |||
| Tullow Oil PLC | 32,987 | 491,365 | |||
| $ | 2,041,233 | ||||
| Energy – Integrated – 4.8% | |||||
| BG Group PLC | 91,150 | $ | 1,349,303 | ||
| Royal Dutch Shell PLC, “A” | 127,820 | 3,227,899 | |||
| TOTAL S.A. | 69,580 | 3,096,622 | |||
| $ | 7,673,824 | ||||
| Engineering – Construction – 1.1% | |||||
| Downer EDI Ltd. | 84,720 | $ | 254,280 | ||
| JGC Corp. | 98,000 | 1,485,657 | |||
| $ | 1,739,937 | ||||
| Food & Beverages – 4.8% | |||||
| Groupe Danone | 44,611 | $ | 2,382,314 | ||
| Nestle S.A. | 106,959 | 5,160,769 | |||
| $ | 7,543,083 | ||||
| Food & Drug Stores – 2.0% | |||||
| Lawson, Inc. | 46,500 | $ | 2,032,288 | ||
| Tesco PLC | 193,830 | 1,091,355 | |||
| $ | 3,123,643 | ||||
| Insurance – 4.7% | |||||
| Amlin PLC | 57,927 | $ | 333,091 | ||
| China Pacific Insurance Co. Ltd. | 299,000 | 1,178,793 | |||
| Hiscox Ltd. | 133,766 | 681,345 | |||
| ING Groep N.V. (a) | 265,770 | 1,973,205 | |||
| SNS REAAL Groep N.V. (a) | 161,050 | 698,879 | |||
| Swiss Reinsurance Co. | 25,090 | 1,032,107 | |||
5
Table of Contents
MFS Research International Series
Portfolio of Investments (unaudited) – continued
| Issuer | Shares/Par | Value ($) | |||
| COMMON STOCKS – continued | |||||
| Insurance – continued | |||||
| Zurich Financial Services Ltd. | 6,730 | $ | 1,477,309 | ||
| $ | 7,374,729 | ||||
| Machinery & Tools – 1.2% | |||||
| Beml Ltd. | 22,240 | $ | 474,425 | ||
| Glory Ltd. | 62,400 | 1,358,258 | |||
| $ | 1,832,683 | ||||
| Major Banks – 11.5% | |||||
| Bank of China Ltd. | 2,296,000 | $ | 1,158,307 | ||
| Barclays PLC | 471,240 | 1,868,242 | |||
| BNP Paribas | 59,632 | 3,184,015 | |||
| BOC Hong Kong Holdings Ltd. | 301,500 | 685,329 | |||
| Commonwealth Bank of Australia | 46,890 | 1,900,478 | |||
| Credit Suisse Group AG | 47,480 | 1,784,477 | |||
| HSBC Holdings PLC | 440,245 | 4,016,370 | |||
| Julius Baer Group Ltd. | 26,252 | 747,416 | |||
| KBC Group N.V. (a) | 21,110 | 809,692 | |||
| Sumitomo Mitsui Financial Group, Inc. | 72,100 | 2,035,433 | |||
| $ | 18,189,759 | ||||
| Medical & Health Technology & Services – 1.7% | |||||
| Diagnosticos da America S.A. | 29,600 | $ | 278,617 | ||
| Miraca Holdings, Inc. | 41,400 | 1,240,285 | |||
| Rhoen-Klinikum AG | 54,360 | 1,207,403 | |||
| $ | 2,726,305 | ||||
| Medical Equipment – 0.8% | |||||
| Synthes, Inc. | 10,570 | $ | 1,215,424 | ||
| Metals & Mining – 2.5% | |||||
| BHP Billiton PLC | 114,580 | $ | 2,964,970 | ||
| Iluka Resources Ltd. (a) | 275,720 | 1,067,991 | |||
| $ | 4,032,961 | ||||
| Natural Gas – Distribution – 1.3% | |||||
| Tokyo Gas Co. Ltd. | 434,000 | $ | 1,984,194 | ||
| Network & Telecom – 1.2% | |||||
| Ericsson, Inc., “B” | 118,250 | $ | 1,316,571 | ||
| Nokia Oyj | 75,400 | 615,662 | |||
| $ | 1,932,233 | ||||
| Oil Services – 1.0% | |||||
| Noble Corp. | 19,550 | $ | 604,291 | ||
| Schlumberger Ltd. | 17,250 | 954,615 | |||
| $ | 1,558,906 | ||||
| Other Banks & Diversified Financials – 4.5% | |||||
| Aeon Credit Service Co. Ltd. | 97,200 | $ | 862,077 | ||
| Banco Santander Brasil S.A., ADR | 134,770 | 1,392,174 | |||
| China Construction Bank | 1,934,000 | 1,556,386 | |||
| HDFC Bank Ltd., ADR | 10,260 | 1,466,872 | |||
| ICICI Bank Ltd. | 82,910 | 1,520,352 | |||
| ICICI Bank Ltd., ADR | 8,030 | 290,204 | |||
| K-Green Trust NPV, IEU (a) | 53,600 | 40,220 | |||
| $ | 7,128,285 | ||||
| Issuer | Shares/Par | Value ($) | |||
| COMMON STOCKS – continued | |||||
| Pharmaceuticals – 6.2% | |||||
| Bayer AG | 30,648 | $ | 1,710,007 | ||
| Roche Holding AG | 27,350 | 3,755,801 | |||
| Sanofi-Aventis | 47,420 | 2,859,563 | |||
| Santen, Inc. | 40,200 | 1,446,595 | |||
| $ | 9,771,966 | ||||
| Precious Metals & Minerals – 1.7% | |||||
| Lihir Gold Ltd. | 305,517 | $ | 1,103,016 | ||
| Teck Resources Ltd., “B” | 53,050 | 1,568,751 | |||
| $ | 2,671,767 | ||||
| Railroad & Shipping – 1.4% | |||||
| East Japan Railway Co. | 34,300 | $ | 2,286,447 | ||
| Specialty Chemicals – 4.0% | |||||
| Akzo Nobel N.V. | 50,450 | $ | 2,609,682 | ||
| Linde AG | 25,160 | 2,641,866 | |||
| Symrise AG | 50,523 | 1,043,763 | |||
| $ | 6,295,311 | ||||
| Specialty Stores – 1.8% | |||||
| Esprit Holdings Ltd. | 246,276 | $ | 1,328,121 | ||
| Industria de Diseno Textil S.A. | 27,180 | 1,541,522 | |||
| $ | 2,869,643 | ||||
| Telecommunications – Wireless – 3.6% | |||||
| Cellcom Israel Ltd. | 21,660 | $ | 541,500 | ||
| KDDI Corp. | 231 | 1,097,273 | |||
| Vivo Participacoes S.A., ADR | 23,990 | 621,821 | |||
| Vodafone Group PLC | 1,627,510 | 3,372,562 | |||
| $ | 5,633,156 | ||||
| Telephone Services – 2.3% | |||||
| China Unicom Ltd. | 574,000 | $ | 767,377 | ||
| PT XL Axiata Tbk (a) | 1,204,000 | 539,099 | |||
| Royal KPN N.V. | 156,020 | 1,992,196 | |||
| Virgin Media, Inc. | 25,580 | 426,930 | |||
| $ | 3,725,602 | ||||
| Tobacco – 0.8% | |||||
| Japan Tobacco, Inc. | 395 | $ | 1,227,991 | ||
| Trucking – 1.7% | |||||
| TNT N.V. | 28,075 | $ | 707,609 | ||
| Yamato Holdings Co. Ltd. | 156,000 | 2,064,414 | |||
| $ | 2,772,023 | ||||
| Utilities – Electric Power – 4.3% | |||||
| CEZ AS | 19,810 | $ | 810,913 | ||
| Cheung Kong Infrastructure Holdings Ltd. | 117,000 | 433,180 | |||
| CPFL Energia S.A. | 29,500 | 644,097 | |||
| E.ON AG | 75,020 | 2,019,521 | |||
| Energias de Portugal S.A. | 251,540 | 742,726 | |||
| Fortum Corp. | 37,010 | 814,745 | |||
| Red Electrica de Espana | 19,683 | 703,598 | |||
6
Table of Contents
MFS Research International Series
Portfolio of Investments (unaudited) – continued
| Issuer | Shares/Par | Value ($) | |||
| COMMON STOCKS – continued | |||||
| Utilities – Electric Power – continued | |||||
| Tractebel Energia S.A. | 56,360 | $ | 661,645 | ||
| $ | 6,830,425 | ||||
| Total Common Stocks (Identified Cost, $183,441,290) | $ | 157,895,839 | |||
| MONEY MARKET FUNDS (v) – 0.0% | |||||
| MFS Institutional Money Market Portfolio, 0.22%, at Cost and Net Asset Value | 151 | $ | 151 | ||
| Issuer | Shares/Par | Value ($) | |||
| COLLATERAL FOR SECURITIES LOANED – 0.3% | |||||
| Navigator Securities Lending Prime Portfolio, at Cost and Net Asset Value | 385,562 | $ | 385,562 | ||
| Total Investments (Identified Cost, $183,827,003) | $ | 158,281,552 | |||
| OTHER ASSETS, LESS LIABILITIES – 0.1% | 215,123 | ||||
| Net Assets – 100.0% | $ | 158,496,675 | |||
| (a) | Non-income producing security. |
| (l) | All or a portion of this security is on loan. |
| (v) | Underlying fund that is available only to investment companies managed by MFS. The rate quoted is the annualized seven-day yield of the fund at period end. |
The following abbreviations are used in this report and are defined:
| ADR | American Depository Receipt |
| IEU | International Equity Unit |
| PLC | Public Limited Company |
See Notes to Financial Statements
7
Table of Contents
MFS Research International Series
FINANCIAL STATEMENTS | STATEMENT OF ASSETS AND LIABILITIES (unaudited)
This statement represents your fund’s balance sheet, which details the assets and liabilities comprising the total value of the fund.
At 6/30/10 | |||||
| Assets | |||||
Investments – | |||||
Non-affiliated issuers, at value (identified cost, $183,826,852) | $158,281,401 | ||||
Underlying funds, at cost and value | 151 | ||||
Total investments, at value, including $361,354 of securities on loan (identified cost, $183,827,003) | $158,281,552 | ||||
Foreign currency, at value (identified cost, $122,494) | 123,315 | ||||
Receivables for | |||||
Investments sold | 2,977,595 | ||||
Fund shares sold | 6,613 | ||||
Interest and dividends | 621,179 | ||||
Receivable from investment adviser | 10,547 | ||||
Other assets | 1,151 | ||||
Total assets | $162,021,952 | ||||
Liabilities | |||||
Payable to custodian | $676,009 | ||||
Payables for | |||||
Investments purchased | 1,841,418 | ||||
Fund shares reacquired | 468,197 | ||||
Collateral for securities loaned, at value | 385,562 | ||||
Payable to affiliates | |||||
Investment adviser | 8,207 | ||||
Shareholder servicing costs | 174 | ||||
Distribution and/or service fees | 491 | ||||
Administrative services fee | 181 | ||||
Payable for independent Trustees’ compensation | 819 | ||||
Accrued expenses and other liabilities | 144,219 | ||||
Total liabilities | $3,525,277 | ||||
Net assets | $158,496,675 | ||||
Net assets consist of | |||||
Paid-in capital | $222,367,556 | ||||
Unrealized appreciation (depreciation) on investments and translation of assets and liabilities in foreign currencies | (25,543,614 | ) | |||
Accumulated net realized gain (loss) on investments and foreign currency transactions | (40,538,407 | ) | |||
Undistributed net investment income | 2,211,140 | ||||
Net assets | $158,496,675 | ||||
Shares of beneficial interest outstanding | 16,195,566 |
| Net assets | Shares outstanding | Net asset value per share | ||||
Initial Class | $124,202,186 | 12,675,900 | $9.80 | |||
Service Class | 34,294,489 | 3,519,666 | 9.74 |
See Notes to Financial Statements
8
Table of Contents
MFS Research International Series
FINANCIAL STATEMENTS | STATEMENT OF OPERATIONS (unaudited)
This statement describes how much your fund earned in investment income and accrued in expenses. It also describes any gains and/or losses generated by fund operations.
| Six months ended 6/30/10 | ||||||
| Net investment income | ||||||
Income | ||||||
Dividends | $3,540,618 | |||||
Interest | 66,351 | |||||
Dividends from underlying funds | 1,236 | |||||
Foreign taxes withheld | (363,379 | ) | ||||
Total investment income | $3,244,826 | |||||
Expenses | ||||||
Management fee | $781,131 | |||||
Distribution and/or service fees | 41,061 | |||||
Shareholder servicing costs | 10,737 | |||||
Administrative services fee | 17,492 | |||||
Independent Trustees’ compensation | 3,159 | |||||
Custodian fee | 128,671 | |||||
Shareholder communications | 24,933 | |||||
Auditing fees | 39,876 | |||||
Legal fees | 1,918 | |||||
Miscellaneous | 7,957 | |||||
Total expenses | $1,056,935 | |||||
Fees paid indirectly | (2 | ) | ||||
Reduction of expenses by investment adviser | (61,410 | ) | ||||
Net expenses | $995,523 | |||||
Net investment income | $2,249,303 | |||||
Realized and unrealized gain (loss) on investments and foreign currency transactions | ||||||
Realized gain (loss) (identified cost basis) | ||||||
Investment transactions | $(3,494,908 | ) | ||||
Foreign currency transactions | (100,924 | ) | ||||
Net realized gain (loss) on investments and foreign currency transactions | $(3,595,832 | ) | ||||
Change in unrealized appreciation (depreciation) | ||||||
Investments | $(22,109,960 | ) | ||||
Translation of assets and liabilities in foreign currencies | (2,115 | ) | ||||
Net unrealized gain (loss) on investments and foreign currency translation | $(22,112,075 | ) | ||||
Net realized and unrealized gain (loss) on investments and foreign currency | $(25,707,907 | ) | ||||
Change in net assets from operations | $(23,458,604 | ) |
See Notes to Financial Statements
9
Table of Contents
MFS Research International Series
FINANCIAL STATEMENTS | STATEMENTS OF CHANGES IN NET ASSETS
These statements describe the increases and/or decreases in net assets resulting from operations, any distributions, and any shareholder transactions.
| Six months ended 6/30/10 (unaudited | ) | Year ended 12/31/09 | | |||
Change in net assets | ||||||
From operations | ||||||
Net investment income | $2,249,303 | $2,789,708 | ||||
Net realized gain (loss) on investments and foreign currency transactions | (3,595,832 | ) | 752,157 | |||
Net unrealized gain (loss) on investments and foreign currency translation | (22,112,075 | ) | 43,916,167 | |||
Change in net assets from operations | $(23,458,604 | ) | $47,458,032 | |||
Distributions declared to shareholders | ||||||
From net investment income | $(2,782,074 | ) | $(2,709,838 | ) | ||
Change in net assets from fund share transactions | $4,477,583 | $(2,432,571 | ) | |||
Total change in net assets | $(21,763,095 | ) | $42,315,623 | |||
Net assets | ||||||
At beginning of period | 180,259,770 | 137,944,147 | ||||
At end of period (including undistributed net investment income of $2,211,140 and | $158,496,675 | $180,259,770 |
See Notes To Financial Statements
10
Table of Contents
MFS Research International Series
FINANCIAL STATEMENTS | FINANCIAL HIGHLIGHTS
The financial highlights table is intended to help you understand the fund’s financial performance for the semiannual period and the past 5 fiscal years (or life of a particular share class, if shorter). Certain information reflects financial results for a single fund share. The total returns in the table represent the rate by which an investor would have earned (or lost) on an investment in the fund share class (assuming reinvestment of all distributions) held for the entire period.
| Initial Class | Six months ended 6/30/10 | Years ended 12/31 | ||||||||||||||||
| 2009 | 2008 | 2007 | 2006 | 2005 (c) | ||||||||||||||
| (unaudited) | ||||||||||||||||||
Net asset value, beginning of period | $11.40 | $8.89 | $16.12 | $14.44 | $11.84 | $10.00 | ||||||||||||
| Income (loss) from investment operations | ||||||||||||||||||
Net investment income (d) | $0.14 | $0.17 | $0.25 | $0.17 | $0.18 | $0.05 | ||||||||||||
Net realized and unrealized gain (loss) on investments | (1.57 | ) | 2.51 | (6.82 | ) | 1.67 | 2.85 | 2.03 | ||||||||||
Total from investment operations | $(1.43 | ) | $2.68 | $(6.57 | ) | $1.84 | $3.03 | $2.08 | ||||||||||
| Less distributions declared to shareholders | ||||||||||||||||||
From net investment income | $(0.17 | ) | $(0.17 | ) | $(0.10 | ) | $— | $(0.13 | ) | $(0.07 | ) | |||||||
From net realized gain on investments | — | — | (0.56 | ) | (0.16 | ) | (0.30 | ) | (0.17 | ) | ||||||||
Total distributions declared to shareholders | $(0.17 | ) | $(0.17 | ) | $(0.66 | ) | $(0.16 | ) | $(0.43 | ) | $(0.24 | ) | ||||||
Net asset value, end of period | $9.80 | $11.40 | $8.89 | $16.12 | $14.44 | $11.84 | ||||||||||||
Total return (%) (k)(r)(s) | (12.71 | )(n) | 30.86 | (42.39 | ) | 12.82 | 25.67 | 20.85 | (n) | |||||||||
| Ratios (%) (to average net assets) and Supplemental data: | ||||||||||||||||||
Expenses before expense reductions (f) | 1.17 | (a) | 1.23 | 1.35 | 1.56 | 2.77 | 4.03 | (a) | ||||||||||
Expenses after expense reductions (f) | 1.10 | (a) | 1.10 | 1.10 | 1.10 | 1.10 | 1.10 | (a) | ||||||||||
Net investment income | 2.64 | (a) | 1.78 | 2.06 | 1.14 | 1.36 | 0.66 | (a) | ||||||||||
Portfolio turnover | 35 | 92 | 77 | 64 | 130 | 95 | ||||||||||||
Net assets at end of period (000 omitted) | $124,202 | $146,044 | $115,944 | $81,987 | $32,437 | $5,878 | ||||||||||||
See Notes to Financial Statements
11
Table of Contents
MFS Research International Series
Financial Highlights – continued
| Service Class | Six months ended 6/30/10 | Years ended 12/31 | ||||||||||||||||
| 2009 | 2008 | 2007 | 2006 | 2005 (c) | ||||||||||||||
| (unaudited) | ||||||||||||||||||
Net asset value, beginning of period | $11.33 | $8.83 | $16.02 | $14.39 | $11.83 | $10.00 | ||||||||||||
| Income (loss) from investment operations | ||||||||||||||||||
Net investment income (d) | $0.13 | $0.15 | $0.25 | $0.16 | $0.06 | $0.02 | ||||||||||||
Net realized and unrealized gain (loss) on investments and foreign currency | (1.57 | ) | 2.49 | (6.81 | ) | 1.63 | 2.91 | 2.04 | ||||||||||
Total from investment operations | $(1.44 | ) | $2.64 | $(6.56 | ) | $1.79 | $2.97 | $2.06 | ||||||||||
| Less distributions declared to shareholders | ||||||||||||||||||
From net investment income | $(0.15 | ) | $(0.14 | ) | $(0.07 | ) | $— | $(0.11 | ) | $(0.06 | ) | |||||||
From net realized gain on investments | — | — | (0.56 | ) | (0.16 | ) | (0.30 | ) | (0.17 | ) | ||||||||
Total distributions declared to shareholders | $(0.15 | ) | $(0.14 | ) | $(0.63 | ) | $(0.16 | ) | $(0.41 | ) | $(0.23 | ) | ||||||
Net asset value, end of period | $9.74 | $11.33 | $8.83 | $16.02 | $14.39 | $11.83 | ||||||||||||
Total return (%) (k)(r)(s) | (12.87 | )(n) | 30.57 | (42.52 | ) | 12.52 | 25.21 | 20.68 | (n) | |||||||||
| Ratios (%) (to average net assets) and Supplemental data: | ||||||||||||||||||
Expenses before expense reductions (f) | 1.42 | (a) | 1.49 | 1.58 | 1.81 | 2.86 | 4.28 | (a) | ||||||||||
Expenses after expense reductions (f) | 1.35 | (a) | 1.35 | 1.35 | 1.35 | 1.35 | 1.35 | (a) | ||||||||||
Net investment income | 2.40 | (a) | 1.56 | 2.01 | 1.03 | 0.41 | 0.28 | (a) | ||||||||||
Portfolio turnover | 35 | 92 | 77 | 64 | 130 | 95 | ||||||||||||
Net assets at end of period (000 omitted) | $34,294 | $34,215 | $22,000 | $29,238 | $13,707 | $241 | ||||||||||||
| (a) | Annualized. |
| (c) | For the period from the commencement of the fund’s investment operations, April 29, 2005, through the stated period end. |
| (d) | Per share data is based on average shares outstanding. |
| (f) | Ratios do not reflect reductions from fees paid indirectly, if applicable. |
| (k) | The total return does not reflect expenses that apply to separate accounts. Inclusion of these charges would reduce the total return figures for all periods shown. |
| (n) | Not annualized. |
| (r) | Certain expenses have been reduced without which performance would have been lower. |
| (s) | From time to time the fund may receive proceeds from litigation settlements, without which performance would be lower. |
See Notes to Financial Statements
12
Table of Contents
MFS Research International Series
NOTES TO FINANCIAL STATEMENTS (unaudited)
| (1) | Business and Organization |
MFS Research International Series (the fund) is a series of MFS Variable Insurance Trust (the trust). The trust is organized as a Massachusetts business trust and is registered under the Investment Company Act of 1940, as amended, as an open-end management investment company. The shareholders of each series of the trust are separate accounts of insurance companies, which offer variable annuity and/or life insurance products, and qualified retirement and pension plans.
| (2) | Significant Accounting Policies |
General – The preparation of financial statements in conformity with U.S. generally accepted accounting principles requires management to make estimates and assumptions that affect the reported amounts of assets and liabilities, and disclosure of contingent assets and liabilities at the date of the financial statements and the reported amounts of revenues and expenses during the reporting period. Actual results could differ from those estimates. In the preparation of these financial statements, management has evaluated subsequent events occurring after the date of the fund’s Statement of Assets and Liabilities through the date that the financial statements were issued. The fund can invest in foreign securities, including securities of emerging market issuers. Investments in foreign securities are vulnerable to the effects of changes in the relative values of the local currency and the U.S. dollar and to the effects of changes in each country’s legal, political, and economic environment. The markets of emerging markets countries are generally more volatile than the markets of developed countries with more mature economies. All of the risks of investing in foreign securities previously described are heightened when investing in emerging markets countries.
Investment Valuations – Equity securities, including restricted equity securities, are generally valued at the last sale or official closing price as provided by a third-party pricing service on the market or exchange on which they are primarily traded. Equity securities, for which there were no sales reported that day, are generally valued at the last quoted daily bid quotation as provided by a third-party pricing service on the market or exchange on which such securities are primarily traded. Equity securities held short, for which there were no sales reported for that day, are generally valued at the last quoted daily ask quotation as provided by a third-party pricing service on the market or exchange on which such securities are primarily traded. Short-term instruments with a maturity at issuance of 60 days or less generally are valued at amortized cost, which approximates market value. Open-end investment companies are generally valued at net asset value per share. Securities and other assets generally valued on the basis of information from a third-party pricing service may also be valued at a broker/dealer bid quotation. Values obtained from third-party pricing services can utilize both transaction data and market information such as yield, quality, coupon rate, maturity, type of issue, trading characteristics, and other market data. The values of foreign securities and other assets and liabilities expressed in foreign currencies are converted to U.S. dollars using the mean of bid and asked prices for rates provided by a third-party pricing service.
The Board of Trustees has delegated primary responsibility for determining or causing to be determined the value of the fund’s investments (including any fair valuation) to the adviser pursuant to valuation policies and procedures approved by the Board. If the adviser determines that reliable market quotations are not readily available, investments are valued at fair value as determined in good faith by the adviser in accordance with such procedures under the oversight of the Board of Trustees. Under the fund’s valuation policies and procedures, market quotations are not considered to be readily available for most types of debt instruments and floating rate loans and many types of derivatives. These investments are generally valued at fair value based on information from third-party pricing services. In addition, investments may be valued at fair value if the adviser determines that an investment’s value has been materially affected by events occurring after the close of the exchange or market on which the investment is principally traded (such as foreign exchange or market) and prior to the determination of the fund’s net asset value, or after the halting of trading of a specific security where trading does not resume prior to the close of the exchange or market on which the security is principally traded. Events that occur on a frequent basis after foreign markets close (such as developments in foreign markets and significant movements in the U.S. markets) and prior to the determination of the fund’s net asset value may be deemed to have a material effect on the value of securities traded in foreign markets. Accordingly, the fund’s foreign equity securities may often be valued at fair value. The adviser generally relies on third-party pricing services or other information (such as the correlation with price movements of similar securities in the same or other markets; the type, cost and investment characteristics of the security; the business and financial condition of the issuer; and trading and other market data) to assist in determining whether to fair value and at what value to fair value an investment. The value of an investment for purposes of calculating the fund’s net asset value can differ depending on the source and method used to determine value. When fair valuation is used, the value of an investment used to determine the fund’s net asset value may differ from quoted or published prices for the same investment. There can be no assurance that the fund could obtain the fair value assigned to an investment if it were to sell the investment at the same time at which the fund determines its net asset value per share.
13
Table of Contents
MFS Research International Series
Notes to Financial Statements (unaudited) – continued
Various inputs are used in determining the value of the fund’s assets or liabilities. These inputs are categorized into three broad levels. In certain cases, the inputs used to measure fair value may fall into different levels of the fair value hierarchy. In such cases, an investment’s level within the fair value hierarchy is based on the lowest level of input that is significant to the fair value measurement. The fund’s assessment of the significance of a particular input to the fair value measurement in its entirety requires judgment, and considers factors specific to the investment. Level 1 includes unadjusted quoted prices in active markets for identical assets or liabilities. Level 2 includes other significant observable market-based inputs (including quoted prices for similar securities, interest rates, prepayment speed, and credit risk). Level 3 includes unobservable inputs, which may include the adviser’s own assumptions in determining the fair value of investments. Other financial instruments are derivative instruments not reflected in total investments, such as futures, forwards, swap contracts, and written options. The following is a summary of the levels used as of June 30, 2010 in valuing the fund’s assets or liabilities:
| Investments at Value | Level 1 | Level 2 | Level 3 | Total | ||||
| Equity Securities: | ||||||||
Japan | $— | $27,534,128 | $— | $27,534,128 | ||||
United Kingdom | — | 25,772,328 | — | 25,772,328 | ||||
France | — | 17,905,321 | — | 17,905,321 | ||||
Switzerland | — | 15,894,236 | — | 15,894,236 | ||||
Germany | — | 15,226,881 | — | 15,226,881 | ||||
Netherlands | — | 9,759,804 | — | 9,759,804 | ||||
Hong Kong | — | 6,755,334 | — | 6,755,334 | ||||
China | — | 5,182,507 | — | 5,182,507 | ||||
Australia | — | 4,729,049 | — | 4,729,049 | ||||
Other Countries | 13,428,929 | 15,707,322 | — | 29,136,251 | ||||
| Mutual Funds | 385,713 | — | — | 385,713 | ||||
| Total Investments | $13,814,642 | $144,466,910 | $— | $158,281,552 |
For further information regarding security characteristics, see the Portfolio of Investments.
Of the level 2 investments presented above, equity investments amounting to $23,752,553 were considered level 1 investments at the beginning of the period. Of the level 1 investments presented above, equity investments amounting to $850,238 were considered level 2 investments at the beginning of the period. The primary reason for changes in the classifications between levels 1 and 2 occurs when foreign equity securities are fair valued using other observable market based inputs in place of the closing exchange price due to events occurring after the close of the exchange or market on which the investment is principally traded. The fund’s foreign equity securities may often be valued at fair value.
Foreign Currency Translation – Purchases and sales of foreign investments, income, and expenses are converted into U.S. dollars based upon currency exchange rates prevailing on the respective dates of such transactions or on the reporting date for foreign denominated receivables and payables. Gains and losses attributable to foreign currency exchange rates on sales of securities are recorded for financial statement purposes as net realized gains and losses on investments. Gains and losses attributable to foreign exchange rate movements on receivables, payables, income and expenses are recorded for financial statement purposes as foreign currency transaction gains and losses. That portion of both realized and unrealized gains and losses on investments that results from fluctuations in foreign currency exchange rates is not separately disclosed.
Derivatives – The fund may use derivatives for different purposes, including to earn income and enhance returns, to increase or decrease exposure to a particular market, to manage or adjust the risk profile of the fund, or as alternatives to direct investments. Derivatives may be used for hedging or non-hedging purposes. While hedging can reduce or eliminate losses, it can also reduce or eliminate gains. When the fund uses derivatives as an investment to increase market exposure, or for hedging purposes, gains and losses from derivative instruments may be substantially greater than the derivative’s original cost.
Derivative instruments include written options, purchased options, futures contracts, forward foreign currency exchange contracts, and swap agreements. For the six months ended June 30, 2010, the fund did not invest in any derivative instruments.
Security Loans – State Street Bank and Trust Company (“State Street”), as lending agent, may loan the securities of the fund to certain qualified institutions (the “Borrowers”) approved by the fund. The loans are collateralized by cash and/or U.S. Treasury and federal agency obligations in an amount typically at least equal to the market value of the securities loaned. The market value of the loaned securities is determined at the close of business of the fund and any additional required collateral is delivered to the fund on the next business day. State Street provides the fund with indemnification against Borrower default. The fund bears the risk of loss with respect to the investment of cash collateral. On loans collateralized by cash, the cash collateral is invested in a money market fund or short-term securities. A portion of the income generated upon investment of the collateral is remitted to the Borrowers, and the remainder is allocated between the fund and the lending agent. On loans
14
Table of Contents
MFS Research International Series
Notes to Financial Statements (unaudited) – continued
collateralized by U.S. Treasury and/or federal agency obligations, a fee is received from the Borrower, and is allocated between the fund and the lending agent. Income from securities lending is included in interest income on the Statement of Operations. The dividend and interest income earned on the securities loaned is accounted for in the same manner as other dividend and interest income.
Indemnifications – Under the fund’s organizational documents, its officers and Trustees may be indemnified against certain liabilities and expenses arising out of the performance of their duties to the fund. Additionally, in the normal course of business, the fund enters into agreements with service providers that may contain indemnification clauses. The fund’s maximum exposure under these agreements is unknown as this would involve future claims that may be made against the fund that have not yet occurred.
Investment Transactions and Income – Investment transactions are recorded on the trade date. Interest income is recorded on the accrual basis. All premium and discount is amortized or accreted for financial statement purposes in accordance with U.S. generally accepted accounting principles. Dividends received in cash are recorded on the ex-dividend date. Certain dividends from foreign securities will be recorded when the fund is informed of the dividend if such information is obtained subsequent to the ex-dividend date. Dividend and interest payments received in additional securities are recorded on the ex-dividend or ex-interest date in an amount equal to the value of the security on such date.
The fund may receive proceeds from litigation settlements. Any proceeds received from litigation involving portfolio holdings are reflected in the Statement of Operations in realized gain/loss if the security has been disposed of by the fund or in unrealized gain/loss if the security is still held by the fund. Any other proceeds from litigation not related to portfolio holdings are reflected as other income in the Statement of Operations.
Fees Paid Indirectly – The fund’s custody fee may be reduced according to an arrangement that measures the value of cash deposited with the custodian by the fund. This amount, for the six months ended June 30, 2010, is shown as a reduction of total expenses on the Statement of Operations.
Tax Matters and Distributions – The fund intends to qualify as a regulated investment company, as defined under Subchapter M of the Internal Revenue Code, and to distribute all of its taxable income, including realized capital gains. As a result, no provision for federal income tax is required. The fund’s federal tax returns for the prior three fiscal years remain subject to examination by the Internal Revenue Service. Foreign taxes, if any, have been accrued by the fund in the accompanying financial statements.
Distributions to shareholders are recorded on the ex-dividend date. Income and capital gain distributions are determined in accordance with income tax regulations, which may differ from U.S. generally accepted accounting principles. Certain capital accounts in the financial statements are periodically adjusted for permanent differences in order to reflect their tax character. These adjustments have no impact on net assets or net asset value per share. Temporary differences which arise from recognizing certain items of income, expense, gain or loss in different periods for financial statement and tax purposes will reverse at some time in the future. Distributions in excess of net investment income or net realized gains are temporary overdistributions for financial statement purposes resulting from differences in the recognition or classification of income or distributions for financial statement and tax purposes.
Book/tax differences primarily relate to wash sale loss deferrals and foreign taxes.
The tax character of distributions made during the current period, if any, will be determined at fiscal year end. The tax character of distributions declared to shareholders for the last fiscal year is as follows:
| 12/31/09 | ||
Ordinary income (including any short-term capital gains) | $2,709,838 |
The federal tax cost and the tax basis components of distributable earnings were as follows:
| As of 6/30/10 | |||
| Cost of investments | $186,426,172 | ||
| Gross appreciation | 5,113,820 | ||
| Gross depreciation | (33,258,440 | ) | |
| Net unrealized appreciation (depreciation) | $(28,144,620 | ) | |
| As of 12/31/09 | |||
| Undistributed ordinary income | 2,780,765 | ||
| Capital loss carryforwards | (34,377,473 | ) | |
| Other temporary differences | 1,165 | ||
| Net unrealized appreciation (depreciation) | (6,034,660 | ) | |
The aggregate cost above includes prior fiscal year end tax adjustments, if applicable.
15
Table of Contents
MFS Research International Series
Notes to Financial Statements (unaudited) – continued
As of December 31, 2009, the fund had capital loss carryforwards available to offset future realized gains. Such losses expire as follows:
| 12/31/16 | $(31,373,068 | ) | |
| 12/31/17 | (3,004,405 | ) | |
| $(34,377,473 | ) |
Multiple Classes of Shares of Beneficial Interest – The fund offers multiple classes of shares, which differ in their respective distribution and/or service fees. The fund’s income, realized and unrealized gain (loss), and common expenses are allocated to shareholders based on the daily net assets of each class. Dividends are declared separately for each class. Differences in per share dividend rates are generally due to differences in separate class expenses. The fund’s distributions declared to shareholders as reported on the Statements of Changes in Net Assets are presented by class as follows:
| From net investment income | ||||
| Six months ended 6/30/10 | Year ended 12/31/09 | |||
| Initial Class | $2,316,560 | $2,268,920 | ||
| Service Class | 465,514 | 440,918 | ||
| Total | $2,782,074 | $2,709,838 | ||
| (3) | Transactions with Affiliates |
Investment Adviser – The fund has an investment advisory agreement with MFS to provide overall investment management and related administrative services and facilities to the fund. The management fee is computed daily and paid monthly at an annual rate of 0.90% of the fund’s average daily net assets.
The investment adviser has agreed in writing to pay a portion of the fund’s total annual operating expenses, exclusive of interest, taxes, extraordinary expenses, brokerage and transaction costs, and investment-related expenses, such that total annual operating expenses do not exceed 1.10% of average daily net assets for the Initial Class shares and 1.35% of average daily net assets for the Service Class shares. This written agreement will continue until modified by the fund’s Board of Trustees, but such agreement will continue at least until April 30, 2012. For the six months ended June 30, 2010, this reduction amounted to $60,842 and is reflected as a reduction of total expenses in the Statement of Operations.
Distributor – MFS Fund Distributors, Inc. (MFD), a wholly-owned subsidiary of MFS, is the distributor of shares of the fund. The Trustees have adopted a distribution plan for the Service Class shares pursuant to Rule 12b-1 under the Investment Company Act of 1940.
The fund’s distribution plan provides that the fund will pay MFD distribution and/or service fees equal to 0.25% per annum of its average daily net assets attributable to Service Class shares as partial consideration for services performed and expenses incurred by MFD and financial intermediaries (including participating insurance companies that invest in the fund to fund variable annuity and variable life insurance contracts, sponsors of qualified retirement and pension plans that invest in the fund, and affiliates of these participating insurance companies and plan sponsors) in connection with the sale and distribution of the Service Class shares. MFD may subsequently pay all, or a portion, of the distribution and/or service fees to financial intermediaries.
Shareholder Servicing Agent – MFS Service Center, Inc. (MFSC), a wholly-owned subsidiary of MFS, receives a fee from the fund for its services as shareholder servicing agent. For the six months ended June 30, 2010, the fee was $10,382, which equated to 0.0120% annually of the fund’s average daily net assets. MFSC also receives payment from the fund for out-of-pocket expenses paid by MFSC on behalf of the fund. For the six months ended June 30, 2010, these costs amounted to $355.
Administrator – MFS provides certain financial, legal, shareholder communications, compliance, and other administrative services to the fund. Under an administrative services agreement, the fund partially reimburses MFS the costs incurred to provide these services. The fund is charged an annual fixed amount of $17,500 plus a fee based on average daily net assets. The administrative services fee incurred for the six months ended June 30, 2010 was equivalent to an annual effective rate of 0.0202% of the fund’s average daily net assets.
Trustees’ and Officers’ Compensation – The fund pays compensation to independent Trustees in the form of a retainer, attendance fees, and additional compensation to Board and Committee chairpersons. The fund does not pay compensation directly to Trustees or officers of the fund who are also officers of the investment adviser, all of whom receive remuneration for their services to the fund from MFS. Certain officers and Trustees of the fund are officers or directors of MFS, MFD, and MFSC.
16
Table of Contents
MFS Research International Series
Notes to Financial Statements (unaudited) – continued
Other – This fund and certain other funds managed by MFS (the funds) have entered into services agreements (the Agreements) which provide for payment of fees by the funds to Tarantino LLC and Griffin Compliance LLC in return for the provision of services of an Independent Chief Compliance Officer (ICCO) and Assistant ICCO, respectively, for the funds. The ICCO and Assistant ICCO are officers of the funds and the sole members of Tarantino LLC and Griffin Compliance LLC, respectively. The funds can terminate the Agreements with Tarantino LLC and Griffin Compliance LLC at any time under the terms of the Agreements. For the six months ended June 30, 2010, the aggregate fees paid by the fund to Tarantino LLC and Griffin Compliance LLC were $709 and are included in miscellaneous expense on the Statement of Operations. MFS has agreed to reimburse the fund for a portion of the payments made by the fund in the amount of $568, which is shown as a reduction of total expenses in the Statement of Operations. Additionally, MFS has agreed to bear all expenses associated with office space, other administrative support, and supplies provided to the ICCO and Assistant ICCO.
The fund may invest in the MFS Institutional Money Market Portfolio which is managed by MFS and seeks a high level of current income consistent with preservation of capital and liquidity. Income earned on this investment is included in dividends from underlying funds on the Statement of Operations. This money market fund does not pay a management fee to MFS.
| (4) | Portfolio Securities |
Purchases and sales of investments, other than U.S. Government securities, purchase option transactions, and short-term obligations, aggregated $65,360,098 and $59,946,413, respectively.
| (5) | Shares of Beneficial Interest |
The fund’s Declaration of Trust permits the Trustees to issue an unlimited number of full and fractional shares of beneficial interest. Transactions in fund shares were as follows:
| Six months ended 6/30/10 | Year ended 12/31/09 | |||||||||||
| Shares | Amount | Shares | Amount | |||||||||
| Shares sold | ||||||||||||
Initial Class | 1,049,065 | $11,831,873 | 4,788,847 | $43,782,934 | ||||||||
Service Class | 1,347,994 | 14,185,043 | 2,311,178 | 21,674,607 | ||||||||
| 2,397,059 | $26,016,916 | 7,100,025 | $65,457,541 | |||||||||
| Shares issued to shareholders in reinvestment of distributions | ||||||||||||
Initial Class | 205,551 | $2,316,560 | 281,155 | $2,268,920 | ||||||||
Service Class | 41,527 | 465,514 | 54,909 | 440,918 | ||||||||
| 247,078 | $2,782,074 | 336,064 | $2,709,838 | |||||||||
| Shares reacquired | ||||||||||||
Initial Class | (1,393,306 | ) | $(14,638,926 | ) | (5,304,741 | ) | $(53,896,882 | ) | ||||
Service Class | (890,816 | ) | (9,682,481 | ) | (1,837,897 | ) | (16,703,068 | ) | ||||
| (2,284,122 | ) | $(24,321,407 | ) | (7,142,638 | ) | $(70,599,950 | ) | |||||
| Net change | ||||||||||||
Initial Class | (138,690 | ) | $(490,493 | ) | (234,739 | ) | $(7,845,028 | ) | ||||
Service Class | 498,705 | 4,968,076 | 528,190 | 5,412,457 | ||||||||
| 360,015 | $4,477,583 | 293,451 | $(2,432,571 | ) | ||||||||
| (6) | Line of Credit |
The fund and certain other funds managed by MFS participate in a $1.1 billion unsecured committed line of credit, subject to a $1 billion sublimit, provided by a syndication of banks under a credit agreement. Borrowings may be made for temporary financing needs. Interest is charged to each fund, based on its borrowings, generally at a rate equal to the higher of the Federal Reserve funds rate or one month LIBOR plus an agreed upon spread. A commitment fee, based on the average daily, unused portion of the committed line of credit, is allocated among the participating funds at the end of each calendar quarter. In addition, the fund and other funds managed by MFS have established unsecured uncommitted borrowing arrangements with certain banks for temporary financing needs. Interest is charged to each fund, based on its borrowings, at a rate equal to the Federal Reserve funds rate plus an agreed upon spread. For the six months ended June 30, 2010, the fund’s commitment fee and interest expense were $1,293 and $0, respectively, and are included in miscellaneous expense on the Statement of Operations.
17
Table of Contents
MFS Research International Series
Notes to Financial Statements (unaudited) – continued
| (7) | Transactions in Underlying Funds – Affiliated Issuers |
An affiliated issuer may be considered one in which the fund owns 5% or more of the outstanding voting securities, or a company which is under common control. For the purposes of this report, the fund assumes the following to be affiliated issuers:
| Underlying Funds | Beginning Shares/Par Amount | Acquisitions Shares/Par Amount | Dispositions Shares/Par Amount | Ending Shares/Par Amount | |||||
| MFS Institutional Money Market Portfolio | 1,839,795 | 29,338,444 | (31,178,088 | ) | 151 | ||||
| Underlying Funds | Realized Gain (Loss) | Capital Gain Distributions | Dividend Income | Ending Value | |||||
| MFS Institutional Money Market Portfolio | $— | $— | $1,236 | $151 | |||||
18
Table of Contents
MFS Research International Series
RESULTS OF SHAREHOLDER MEETING (unaudited)
At a special meeting of shareholders of MFS Variable Insurance Trust, which was held on January 28, 2010, the following actions were taken:
Item 1. To elect the following individuals as Trustees:
| Number of Dollars | ||||
| Nominee | For | Withheld Authority | ||
| Robert E. Butler | 6,823,651,821.26 | 1,818,252,669.55 | ||
| Lawrence H. Cohn, M.D. | 6,813,621,200.14 | 1,828,283,290.67 | ||
| Maureen R. Goldfarb | 6,825,332,620.76 | 1,816,571,870.05 | ||
| David H. Gunning | 6,823,081,841.37 | 1,818,822,649.44 | ||
| William R. Gutow | 6,813,678,877.22 | 1,828,225,613.59 | ||
| Michael Hegarty | 6,827,456,515.87 | 1,814,447,974.94 | ||
| John P. Kavanaugh | 6,830,363,113.12 | 1,811,541,377.69 | ||
| Robert J. Manning | 6,825,511,264.17 | 1,816,393,226.64 | ||
| Robert C. Pozen | 6,824,854,120.27 | 1,817,050,370.54 | ||
| J. Dale Sherratt | 6,816,913,203.87 | 1,824,991,286.94 | ||
| Laurie J. Thomsen | 6,823,590,745.56 | 1,818,313,745.25 | ||
| Robert W. Uek | 6,818,161,803.66 | 1,823,742,687.15 | ||
19
Table of Contents
MFS Research International Series
BOARD REVIEW OF INVESTMENT ADVISORY AGREEMENT
A discussion regarding the Board’s most recent review and renewal of the fund’s Investment Advisory Agreement with MFS will be available on or about November 1, 2010 by clicking on the fund’s name under “Variable Insurance Portfolios — VIT” in the “Products and Performance” section of the MFS Web site (mfs.com).
PROXY VOTING POLICIES AND INFORMATION
A general description of the MFS funds’ proxy voting policies and procedures is available without charge, upon request, by calling
1-800-225-2606, by visiting the Proxy Voting section of mfs.com or by visiting the SEC’s Web site at http://www.sec.gov.
Information regarding how the fund voted proxies relating to portfolio securities during the most recent twelve-month period ended June 30 is available without charge by visiting the Proxy Voting section of mfs.com or by visiting the SEC’s Web site at http://www.sec.gov.
QUARTERLY PORTFOLIO DISCLOSURE
The fund will file a complete schedule of portfolio holdings with the Securities and Exchange Commission (the Commission) for the first and third quarters of each fiscal year on Form N-Q. The fund’s Form N-Q may be reviewed and copied at the:
Public Reference Room
Securities and Exchange Commission
100 F Street, NE, Room 1580
Washington, D.C. 20549
Information on the operation of the Public Reference Room may be obtained by calling the Commission at 1-800-SEC-0330. The fund’s Form N-Q is available on the EDGAR database on the Commission’s Internet Web site at http://www.sec.gov, and copies of this information may be obtained, upon payment of a duplicating fee, by electronic request at the following e-mail address: publicinfo@sec.gov or by writing the Public Reference Section at the above address.
From time to time, MFS may post important information about the fund or the MFS funds on the MFS web site (mfs.com). This information is available by visiting the “News & Commentary” section of mfs.com or by clicking on the fund’s name under “Variable Insurance Portfolios — VIT” in the “Products and Performance” section of mfs.com.
20
Table of Contents

Table of Contents

Table of Contents
This report is prepared for the general information of contract owners. It is authorized for distribution to prospective investors only when preceded or accompanied by a current prospectus.
NOT FDIC INSURED Ÿ MAY LOSE VALUE Ÿ NO BANK GUARANTEE Ÿ NOT A DEPOSIT Ÿ NOT INSURED BY ANY FEDERAL GOVERNMENT AGENCY OR NCUA/NCUSIF
Table of Contents
MFS Growth Series

Dear Contract Owners:
After having suffered their biggest declines since the Great Depression, most global markets experienced an impressive resurgence during the latter months of 2009 and the first quarter of 2010. The global economy was able to reap the benefits of two major trends. The first of these was the massive efforts of governments and central banks to increase liquidity in the financial system as they sought to prevent the credit crisis from further affecting the banking system. The second was the move by companies around the world to cut costs and operations to prepare for rapidly changing market conditions. We believe that these moves not only shortened the length of the downturn but also set the stage for recovery.
Even with the significant market gains of 2009 and the early part of 2010, the recovery is unrolling at a moderate pace, with rebounds in the manufacturing sector and corporate America leading the way. Central bankers are proceeding with caution and many have held benchmark interest rates unchanged as they debate the best way to withdraw stimulus measures without disrupting the fragile growth process. Complicating that debate late in the period was the emergence of the European debt crisis and worries about whether this crisis could derail the global recovery. As that crisis unrolled with no clear resolution, risk aversion rose along with volatility. Weakening economic data late in the period added uncertainty to the mix and sparked a retrenchment in global equity markets.
While hurdles remain, we believe that the global economy is proceeding on the road to recovery. As always, we continue to be mindful of the many challenges faced at the individual, national, and international levels. It is at times such as these that we want to remind investors of the merits of maintaining a long-term view, adhering to basic investing principles such as asset allocation and diversification, and working closely with advisors to identify and research investment opportunities. At MFS®, we take particular pride in how well mutual funds can provide a broad range of products that can fit investor needs in any type of market climate.
Respectfully,

Robert J. Manning
Chairman and Chief Executive Officer
MFS Investment Management®
August 16, 2010
The opinions expressed in this letter are subject to change, may not be relied upon for investment advice, and no forecasts can be guaranteed.
MFS Fund Distributors, Inc., 500 Boylston Street, Boston, MA 02116
1
Table of Contents
MFS Growth Series
Portfolio structure
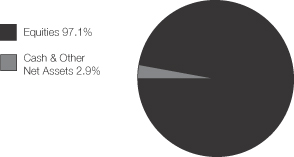
| Top ten holdings | ||
| Apple, Inc. | 4.5% | |
| Google, Inc., “A” | 3.6% | |
| Cisco Systems, Inc. | 2.9% | |
| Danaher Corp. | 2.6% | |
| Hewlett-Packard Co. | 2.0% | |
| American Tower Corp., “A” | 1.9% | |
| EMC Corp. | 1.7% | |
| Visa, Inc., “A” | 1.6% | |
| MasterCard, Inc., “A” | 1.5% | |
| Oracle Corp. | 1.5% |
| Equity sectors | ||
| Technology | 25.3% | |
| Health Care | 15.4% | |
| Consumer Staples | 8.1% | |
| Special Products & Services | 8.0% | |
| Retailing | 7.7% | |
| Leisure | 6.6% | |
| Industrial Goods & Services | 6.5% | |
| Energy | 6.5% | |
| Financial Services | 4.8% | |
| Basic Materials | 3.4% | |
| Utilities & Communications | 2.9% | |
| Transportation | 1.9% |
Percentages are based on net assets as of 6/30/10.
The portfolio is actively managed and current holdings may be different.
2
Table of Contents
MFS Growth Series
After having suffered through one of the largest and most concentrated downturns since the 1930s, most asset markets staged a remarkable rebound during 2009 and early 2010. This recovery in global activity has been led importantly by emerging Asian economies, but broadening to include most of the global economy to varying degrees. Primary drivers of the recovery included an unwinding of the inventory destocking that took place earlier, the production of manufacturing and capital goods, as well as massive fiscal and monetary stimulus.
Late in the period, though, heightened risk surrounding the public-debt profiles of several of the peripheral European countries impaired market sentiment. At the same time, the improving trend in global macroeconomic data began to weaken somewhat. These two dynamics caused most asset prices to retrench significantly, as many questioned the durability of the global recovery.
3
Table of Contents
MFS Growth Series
Fund Expenses Borne by the Contract Holders During the Period, January 1, 2010 through June 30, 2010
As a contract holder of the fund, you incur ongoing costs, including management fees; distribution and/or service (12b-1) fees; and other fund expenses. This example is intended to help you understand your ongoing costs (in dollars) of investing in the fund and to compare these costs with the ongoing costs of investing in other mutual funds.
The example is based on an investment of $1,000 invested at the beginning of the period and held for the entire period January 1, 2010 through June 30, 2010.
Actual Expenses
The first line for each share class in the following table provides information about actual account values and actual expenses. You may use the information in this line, together with the amount you invested, to estimate the expenses that you paid over the period. Simply divide your account value by $1,000 (for example, an $8,600 account value divided by $1,000 = 8.6), then multiply the result by the number in the first line under the heading entitled “Expenses Paid During Period” to estimate the expenses you paid on your account during this period.
Hypothetical Example for Comparison Purposes
The second line for each share class in the following table provides information about hypothetical account values and hypothetical expenses based on the fund’s actual expense ratio and an assumed rate of return of 5% per year before expenses, which is not the fund’s actual return. The hypothetical account values and expenses may not be used to estimate the actual ending account balance or expenses you paid for the period. You may use this information to compare the ongoing costs of investing in the fund and other funds. To do so, compare this 5% hypothetical example with the 5% hypothetical examples that appear in the shareholder reports of the other funds.
Please note that the expenses shown in the table are meant to highlight the fund’s ongoing costs only and do not take into account the fees and expenses imposed under the variable contracts through which your investment in the fund is made. Therefore, the second line for each share class in the table is useful in comparing ongoing costs associated with an investment in vehicles (such as the fund) which fund benefits under variable annuity and variable life insurance contracts and to qualified pension and retirement plans only, and will not help you determine the relative total costs of investing in the fund through variable annuity and variable life insurance contracts. If the fees and expenses imposed under the variable contracts were included, your costs would have been higher.
| Share Class | Annualized Expense Ratio | Beginning Account Value 1/01/10 | Ending Account Value 6/30/10 | Expenses Paid During Period (p) 1/01/10-6/30/10 | ||||||
| Initial Class | Actual | 0.84% | $1,000.00 | $914.66 | $3.99 | |||||
| Hypothetical (h) | 0.84% | $1,000.00 | $1,020.63 | $4.21 | ||||||
| Service Class | Actual | 1.10% | $1,000.00 | $913.27 | $5.22 | |||||
| Hypothetical (h) | 1.10% | $1,000.00 | $1,019.34 | $5.51 |
| (h) | 5% class return per year before expenses. |
| (p) | Expenses paid is equal to each class’ annualized expense ratio, as shown above, multiplied by the average account value over the period, multiplied by the number of days in the period, divided by the number of days in the year. |
4
Table of Contents
MFS Growth Series
PORTFOLIO OF INVESTMENTS – 6/30/10 (unaudited)
The Portfolio of Investments is a complete list of all securities owned by your fund. It is categorized by broad-based asset classes.
| Issuer | Shares/Par | Value ($) | |||
| COMMON STOCKS – 97.1% | |||||
| Aerospace – 2.3% | |||||
| Goodrich Corp. | 78,720 | $ | 5,215,200 | ||
| Honeywell International, Inc. | 39,000 | 1,522,170 | |||
| Precision Castparts Corp. | 34,210 | 3,520,893 | |||
| $ | 10,258,263 | ||||
| Airlines – 0.1% | |||||
| Delta Air Lines, Inc. (a) | 56,700 | $ | 666,225 | ||
| Alcoholic Beverages – 0.8% | |||||
| Diageo PLC | 158,220 | $ | 2,479,160 | ||
| Heineken N.V. | 32,250 | 1,367,057 | |||
| $ | 3,846,217 | ||||
| Apparel Manufacturers – 0.5% | |||||
| NIKE, Inc., “B” | 32,606 | $ | 2,202,535 | ||
| Biotechnology – 2.1% | |||||
| Alexion Pharmaceuticals, Inc. (a) | 59,750 | $ | 3,058,603 | ||
| Celgene Corp. (a) | 56,960 | 2,894,707 | |||
| Gilead Sciences, Inc. (a) | 111,480 | 3,821,534 | |||
| $ | 9,774,844 | ||||
| Broadcasting – 2.6% | |||||
| Discovery Communications, Inc., “A” (a) | 124,040 | $ | 4,429,468 | ||
| Time Warner, Inc. | 59,100 | 1,708,581 | |||
| Walt Disney Co. | 181,180 | 5,707,170 | |||
| $ | 11,845,219 | ||||
| Brokerage & Asset Managers – 1.9% | |||||
| Affiliated Managers Group, Inc. (a) | 26,250 | $ | 1,595,213 | ||
| Charles Schwab Corp. | 64,070 | 908,513 | |||
| CME Group, Inc. | 12,940 | 3,643,257 | |||
| IntercontinentalExchange, Inc. (a) | 21,900 | 2,475,357 | |||
| $ | 8,622,340 | ||||
| Business Services – 6.1% | |||||
| Accenture Ltd., “A” | 118,720 | $ | 4,588,528 | ||
| Cielo S.A. | 75,400 | 634,947 | |||
| Cognizant Technology Solutions Corp., “A” (a) | 81,540 | 4,081,892 | |||
| Concur Technologies, Inc. (a) | 15,900 | 678,612 | |||
| MasterCard, Inc., “A” | 35,100 | 7,003,503 | |||
| Verisk Analytics, Inc., “A” (a) | 122,920 | 3,675,308 | |||
| Visa, Inc., “A” | 100,040 | 7,077,830 | |||
| $ | 27,740,620 | ||||
| Chemicals – 1.8% | |||||
| Ecolab, Inc. | 79,400 | $ | 3,565,854 | ||
| Monsanto Co. | 95,700 | 4,423,254 | |||
| $ | 7,989,108 | ||||
| Computer Software – 5.7% | |||||
| Adobe Systems, Inc. (a) | 118,500 | $ | 3,131,955 | ||
| Akamai Technologies, Inc. (a) | 67,270 | 2,729,144 | |||
| Issuer | Shares/Par | Value ($) | |||
| COMMON STOCKS – continued | |||||
| Computer Software – continued | |||||
| Autodesk, Inc. (a) | 173,340 | $ | 4,222,562 | ||
| Oracle Corp. | 323,540 | 6,943,168 | |||
| Salesforce.com, Inc. (a) | 33,500 | 2,874,970 | |||
| VeriSign, Inc. (a) | 227,653 | 6,044,187 | |||
| $ | 25,945,986 | ||||
| Computer Software – Systems – 8.6% | |||||
| Apple, Inc. (a)(s) | 81,330 | $ | 20,456,935 | ||
| EMC Corp. (a) | 427,140 | 7,816,662 | |||
| Hewlett-Packard Co. | 205,810 | 8,907,457 | |||
| MICROS Systems, Inc. (a) | 54,800 | 1,746,476 | |||
| $ | 38,927,530 | ||||
| Consumer Products – 2.8% | |||||
| Church & Dwight Co., Inc. | 18,600 | $ | 1,166,406 | ||
| Colgate-Palmolive Co. | 70,750 | 5,572,270 | |||
| Natura Cosmeticos S.A. | 105,580 | 2,339,723 | |||
| Procter & Gamble Co. | 57,880 | 3,471,642 | |||
| $ | 12,550,041 | ||||
| Consumer Services – 1.9% | |||||
| Ctrip.com International Ltd., ADR (a) | 37,370 | $ | 1,403,617 | ||
| DeVry, Inc. | 61,350 | 3,220,262 | |||
| Monster Worldwide, Inc. (a) | 88,780 | 1,034,287 | |||
| Sotheby’s | 30,700 | 702,109 | |||
| Strayer Education, Inc. (l) | 11,910 | 2,475,970 | |||
| $ | 8,836,245 | ||||
| Electrical Equipment – 2.6% | |||||
| Danaher Corp. | 323,000 | $ | 11,989,760 | ||
| Electronics – 2.9% | |||||
| Broadcom Corp., “A” | 70,600 | $ | 2,327,682 | ||
| First Solar, Inc. (a)(l) | 9,400 | 1,070,002 | |||
| Intel Corp. | 229,650 | 4,466,693 | |||
| Linear Technology Corp. | 65,540 | 1,822,667 | |||
| Microchip Technology, Inc. | 124,000 | 3,439,760 | |||
| $ | 13,126,804 | ||||
| Energy – Independent – 4.9% | |||||
| EOG Resources, Inc. | 50,000 | $ | 4,918,500 | ||
| Newfield Exploration Co. (a) | 85,600 | 4,182,416 | |||
| Noble Energy, Inc. | 40,240 | 2,427,679 | |||
| Occidental Petroleum Corp. | 46,100 | 3,556,615 | |||
| Southwestern Energy Co. (a) | 130,540 | 5,044,066 | |||
| Ultra Petroleum Corp. (a) | 48,400 | 2,141,700 | |||
| $ | 22,270,976 | ||||
| Engineering – Construction – 1.0% | |||||
| Fluor Corp. | 107,230 | $ | 4,557,275 | ||
| Entertainment – 0.8% | |||||
| DreamWorks Animation, Inc., “A” (a) | 121,790 | $ | 3,477,105 | ||
5
Table of Contents
MFS Growth Series
Portfolio of Investments (unaudited) – continued
| Issuer | Shares/Par | Value ($) | |||
| COMMON STOCKS – continued | |||||
| Food & Beverages – 3.9% | |||||
| Coca-Cola Co. | 91,900 | $ | 4,606,028 | ||
| Dr Pepper Snapple Group, Inc. | 96,600 | 3,611,874 | |||
| General Mills, Inc. | 121,100 | 4,301,472 | |||
| Green Mountain Coffee Roasters, Inc. (a) | 44,900 | 1,153,930 | |||
| Mead Johnson Nutrition Co., “A” | 78,180 | 3,918,382 | |||
| $ | 17,591,686 | ||||
| Food & Drug Stores – 0.6% | |||||
| Walgreen Co. | 60,200 | $ | 1,607,339 | ||
| Whole Foods Market, Inc. (a) | 30,500 | 1,098,610 | |||
| $ | 2,705,949 | ||||
| Gaming & Lodging – 1.4% | |||||
| International Game Technology | 224,190 | $ | 3,519,783 | ||
| Las Vegas Sands Corp. (a) | 66,700 | 1,476,737 | |||
| Marriott International, Inc., “A” | 42,500 | 1,272,450 | |||
| $ | 6,268,970 | ||||
| General Merchandise – 3.5% | |||||
| Costco Wholesale Corp. | 85,890 | $ | 4,709,349 | ||
| Dollar General Corp. (a) | 61,810 | 1,702,866 | |||
| Kohl’s Corp. (a) | 57,630 | 2,737,425 | |||
| Target Corp. | 133,500 | 6,564,195 | |||
| $ | 15,713,835 | ||||
| Insurance – 0.5% | |||||
| Prudential Financial, Inc. | 40,900 | $ | 2,194,694 | ||
| Internet – 4.1% | |||||
| Google, Inc., “A” (a) | 36,820 | $ | 16,383,059 | ||
| OpenTable, Inc. (a) | 29,390 | 1,218,802 | |||
| Tencent Holdings Ltd. | 50,200 | 827,818 | |||
| $ | 18,429,679 | ||||
| Leisure & Toys – 0.1% | |||||
| Hasbro, Inc. | 11,500 | $ | 472,650 | ||
| Machinery & Tools – 0.6% | |||||
| Bucyrus International, Inc. | 55,400 | $ | 2,628,730 | ||
| Major Banks – 1.6% | |||||
| Bank of America Corp. | 198,560 | $ | 2,853,306 | ||
| Goldman Sachs Group, Inc. | 15,460 | 2,029,434 | |||
| JPMorgan Chase & Co. | 62,720 | 2,296,179 | |||
| $ | 7,178,919 | ||||
| Medical & Health Technology & Services – 4.8% | |||||
| Cerner Corp. (a) | 41,200 | $ | 3,126,668 | ||
| DaVita, Inc. (a) | 52,910 | 3,303,700 | |||
| Express Scripts, Inc. (a) | 135,300 | 6,361,806 | |||
| IDEXX Laboratories, Inc. (a) | 49,430 | 3,010,287 | |||
| Lincare Holdings, Inc. | 42,700 | 1,388,177 | |||
| McKesson Corp. | 20,900 | 1,403,644 | |||
| MedAssets, Inc. (a) | 68,270 | 1,575,672 | |||
| MEDNAX, Inc. (a) | 12,100 | 672,881 | |||
| Stericycle, Inc. (a) | 17,800 | 1,167,324 | |||
| $ | 22,010,159 | ||||
| Issuer | Shares/Par | Value ($) | |||
| COMMON STOCKS – continued | |||||
| Medical Equipment – 5.3% | |||||
| Becton, Dickinson & Co. | 66,450 | $ | 4,493,349 | ||
| Conceptus, Inc. (a) | 64,680 | 1,007,714 | |||
| Covidien PLC | 84,360 | 3,389,585 | |||
| DENTSPLY International, Inc. | 80,070 | 2,394,894 | |||
| Edwards Lifesciences Corp. (a) | 30,900 | 1,731,018 | |||
| ResMed, Inc. (a) | 42,000 | 2,554,020 | |||
| Thermo Fisher Scientific, Inc. (a) | 133,470 | 6,546,704 | |||
| Thoratec Corp. (a) | 41,900 | 1,790,387 | |||
| $ | 23,907,671 | ||||
| Network & Telecom – 4.0% | |||||
| Cisco Systems, Inc. (a) | 616,930 | $ | 13,146,778 | ||
| F5 Networks, Inc. (a) | 42,600 | 2,921,082 | |||
| Juniper Networks, Inc. (a) | 97,590 | 2,227,004 | |||
| $ | 18,294,864 | ||||
| Oil Services – 1.6% | |||||
| Halliburton Co. | 134,170 | $ | 3,293,874 | ||
| Schlumberger Ltd. | 69,300 | 3,835,062 | |||
| $ | 7,128,936 | ||||
| Other Banks & Diversified Financials – 0.8% | |||||
| American Express Co. | 97,170 | $ | 3,857,649 | ||
| Pharmaceuticals – 3.2% | |||||
| Allergan, Inc. | 75,760 | $ | 4,413,778 | ||
| Johnson & Johnson | 39,040 | 2,305,702 | |||
| Roche Holding AG | 9,830 | 1,349,891 | |||
| Teva Pharmaceutical Industries Ltd., ADR | 120,750 | 6,277,793 | |||
| $ | 14,347,164 | ||||
| Precious Metals & Minerals – 0.5% | |||||
| Goldcorp, Inc. | 51,900 | $ | 2,275,815 | ||
| Printing & Publishing – 0.9% | |||||
| Moody’s Corp. | 59,330 | $ | 1,181,854 | ||
| MSCI, Inc., “A” (a) | 114,560 | 3,138,944 | |||
| $ | 4,320,798 | ||||
| Railroad & Shipping – 0.8% | |||||
| Union Pacific Corp. | 51,990 | $ | 3,613,825 | ||
| Restaurants – 0.8% | |||||
| McDonald’s Corp. | 55,100 | $ | 3,629,437 | ||
| Specialty Chemicals – 1.1% | |||||
| Albemarle Corp. | 58,100 | $ | 2,307,151 | ||
| Praxair, Inc. | 38,520 | 2,927,135 | |||
| $ | 5,234,286 | ||||
| Specialty Stores – 3.1% | |||||
| Abercrombie & Fitch Co., “A” | 34,060 | $ | 1,045,301 | ||
| Amazon.com, Inc. (a) | 35,830 | 3,914,786 | |||
| Home Depot, Inc. | 62,390 | 1,751,287 | |||
| Limited Brands, Inc. | 114,580 | 2,528,781 | |||
| PetSmart, Inc. | 51,800 | 1,562,806 | |||
| Staples, Inc. | 58,090 | 1,106,615 | |||
| TJX Cos., Inc. | 51,820 | 2,173,849 | |||
| $ | 14,083,425 | ||||
6
Table of Contents
MFS Growth Series
Portfolio of Investments (unaudited) – continued
| Issuer | Shares/Par | Value ($) | |||
| COMMON STOCKS – continued | |||||
| Telecommunications – Wireless – 0.1% | |||||
| Vivo Participacoes S.A., ADR | 18,100 | $ | 469,152 | ||
| Telephone Services – 2.2% | |||||
| American Tower Corp., “A” (a) | 194,383 | $ | 8,650,044 | ||
| Virgin Media, Inc. | 67,900 | 1,133,251 | |||
| $ | 9,783,295 | ||||
| Tobacco – 0.6% | |||||
| Philip Morris International, Inc. | 64,620 | $ | 2,962,181 | ||
| Trucking – 1.0% | |||||
| Expeditors International of Washington, Inc. | 78,150 | $ | 2,696,957 | ||
| Landstar System, Inc. | 41,900 | 1,633,681 | |||
| $ | 4,330,638 | ||||
| Utilities – Electric Power – 0.6% | |||||
| NextEra Energy, Inc. | 58,000 | $ | 2,828,080 | ||
| Total Common Stocks (Identified Cost, $443,466,451) | $ | 440,889,580 | |||
| MONEY MARKET FUNDS (v) – 1.7% | |||||
| MFS Institutional Money Market Portfolio, 0.22%, at Cost and Net Asset Value | 7,772,522 | $ | 7,772,522 | ||
| Issuer | Shares/Par | Value ($) | |||
| COLLATERAL FOR SECURITIES LOANED – 0.6% | |||||
| Navigator Securities Lending Prime Portfolio, at Cost and Net Asset Value | 2,371,166 | $ | 2,371,166 | ||
| Total Investments (Identified Cost, $453,610,139) | $ | 451,033,268 | |||
| OTHER ASSETS, LESS LIABILITIES – 0.6% | 2,946,231 | ||||
| Net Assets – 100.0% | $ | 453,979,499 | |||
| (a) | Non-income producing security. |
| (l) | All or a portion of this security is on loan. |
| (s) | Security or a portion of the security was pledged to cover collateral requirements for securities sold short. At June 30, 2010, the value of securities pledged amounted to $163,495. At June 30, 2010, the fund had no short sales outstanding. |
| (v) | Underlying fund that is available only to investment companies managed by MFS. The rate quoted is the annualized seven-day yield of the fund at period end. |
The following abbreviations are used in this report and are defined:
| ADR | American Depository Receipt |
| PLC | Public Limited Company |
See Notes to Financial Statements
7
Table of Contents
MFS Growth Series
FINANCIAL STATEMENTS | STATEMENT OF ASSETS AND LIABILITIES (unaudited)
This statement represents your fund’s balance sheet, which details the assets and liabilities comprising the total value of the fund.
At 6/30/10 | |||||
Assets | |||||
Investments – | |||||
Non-affiliated issuers, at value (identified cost, $445,837,617) | $443,260,746 | ||||
Underlying funds, at cost and value | 7,772,522 | ||||
Total investments, at value, including $2,285,589 of securities on loan (identified cost, $453,610,139) | $451,033,268 | ||||
Receivables for | |||||
Investments sold | 4,400,850 | ||||
Fund shares sold | 5,172,730 | ||||
Interest and dividends | 315,302 | ||||
Other assets | 3,014 | ||||
Total assets | $460,925,164 | ||||
Liabilities | |||||
Payables for | |||||
Investments purchased | $4,148,232 | ||||
Fund shares reacquired | 274,823 | ||||
Collateral for securities loaned, at value | 2,371,166 | ||||
Payable to affiliates | |||||
Investment adviser | 16,342 | ||||
Shareholder servicing costs | 435 | ||||
Distribution and/or service fees | 449 | ||||
Administrative services fee | 398 | ||||
Payable for independent Trustees’ compensation | 1,846 | ||||
Accrued expenses and other liabilities | 131,974 | ||||
Total liabilities | $6,945,665 | ||||
Net assets | $453,979,499 | ||||
Net assets consist of | |||||
Paid-in capital | $912,642,336 | ||||
Unrealized appreciation (depreciation) on investments and translation of assets and liabilities in foreign currencies | (2,576,910 | ) | |||
Accumulated net realized gain (loss) on investments and foreign currency transactions | (456,330,593 | ) | |||
Undistributed net investment income | 244,666 | ||||
Net assets | $453,979,499 | ||||
Shares of beneficial interest outstanding | 23,215,243 |
| Net assets | Shares outstanding | Net asset value per share | ||||
Initial Class | $421,958,354 | 21,553,382 | $19.58 | |||
Service Class | 32,021,145 | 1,661,861 | 19.27 |
See Notes to Financial Statements
8
Table of Contents
MFS Growth Series
FINANCIAL STATEMENTS | STATEMENT OF OPERATIONS (unaudited)
This statement describes how much your fund earned in investment income and accrued in expenses. It also describes any gains and/or losses generated by fund operations.
Six months ended 6/30/10 | ||||||
| Net investment income | ||||||
Income | ||||||
Dividends | $2,423,817 | |||||
Interest | 24,549 | |||||
Dividends from underlying funds | 10,341 | |||||
Foreign taxes withheld | (25,543 | ) | ||||
Total investment income | $2,433,164 | |||||
Expenses | ||||||
Management fee | $1,903,374 | |||||
Distribution and/or service fees | 41,260 | |||||
Shareholder servicing costs | 31,252 | |||||
Administrative services fee | 41,290 | |||||
Independent Trustees’ compensation | 9,651 | |||||
Custodian fee | 52,488 | |||||
Shareholder communications | 60,474 | |||||
Auditing fees | 26,076 | |||||
Legal fees | 5,190 | |||||
Miscellaneous | 15,688 | |||||
Total expenses | $2,186,743 | |||||
Reduction of expenses by investment adviser | (1,668) | |||||
Net expenses | $2,185,075 | |||||
Net investment income | $248,089 | |||||
Realized and unrealized gain (loss) on investments and foreign currency transactions | ||||||
Realized gain (loss) (identified cost basis) | ||||||
Investment transactions | $30,337,327 | |||||
Foreign currency transactions | (107,399 | ) | ||||
Net realized gain (loss) on investments and foreign currency transactions | $30,229,928 | |||||
Change in unrealized appreciation (depreciation) | ||||||
Investments | $(72,192,795 | ) | ||||
Translation of assets and liabilities in foreign currencies | 1,554 | |||||
Net unrealized gain (loss) on investments and foreign currency translation | $(72,191,241 | ) | ||||
Net realized and unrealized gain (loss) on investments and foreign currency | $(41,961,313 | ) | ||||
Change in net assets from operations | $(41,713,224 | ) |
See Notes to Financial Statements
9
Table of Contents
MFS Growth Series
FINANCIAL STATEMENTS | STATEMENTS OF CHANGES IN NET ASSETS
These statements describe the increases and/or decreases in net assets resulting from operations, any distributions, and any shareholder transactions.
| Six months ended 6/30/10 (unaudited | ) | Year ended 12/31/09 | | |||
Change in net assets | ||||||
From operations | ||||||
Net investment income | $248,089 | $580,066 | ||||
Net realized gain (loss) on investments and foreign currency transactions | 30,229,928 | (23,419,584 | ) | |||
Net unrealized gain (loss) on investments and foreign currency translation | (72,191,241 | ) | 169,084,674 | |||
Change in net assets from operations | $(41,713,224 | ) | $146,245,156 | |||
Distributions declared to shareholders | ||||||
From net investment income | $(550,091 | ) | $(1,356,880 | ) | ||
Change in net assets from fund share transactions | $(33,906,177 | ) | $(23,236,235 | ) | ||
Total change in net assets | $(76,169,492 | ) | $121,652,041 | |||
Net assets | ||||||
At beginning of period | 530,148,991 | 408,496,950 | ||||
At end of period (including undistributed net investment income of $244,666 and | $453,979,499 | $530,148,991 |
See Notes to Financial Statements
10
Table of Contents
MFS Growth Series
FINANCIAL STATEMENTS | FINANCIAL HIGHLIGHTS
The financial highlights table is intended to help you understand the fund’s financial performance for the semiannual period and the past 5 fiscal years. Certain information reflects financial results for a single fund share. The total returns in the table represent the rate by which an investor would have earned (or lost) on an investment in the fund share class (assuming reinvestment of all distributions) held for the entire period.
| Initial Class | Six months ended 6/30/10 | Years ended 12/31 | |||||||||||||||
| 2009 | 2008 | 2007 | 2006 | 2005 | |||||||||||||
| (unaudited) | |||||||||||||||||
Net asset value, beginning of period | $21.43 | $15.62 | $25.01 | $20.64 | $19.13 | $17.52 | |||||||||||
| Income (loss) from investment operations | |||||||||||||||||
Net investment income (loss) (d) | $0.01 | $0.03 | $0.05 | $0.05 | $(0.03 | ) | $(0.05 | ) | |||||||||
Net realized and unrealized gain (loss) on investments and foreign currency | (1.83 | ) | 5.83 | (9.39 | ) | 4.32 | 1.54 | 1.66 | |||||||||
Total from investment operations | $(1.82 | ) | $5.86 | $(9.34 | ) | $4.37 | $1.51 | $1.61 | |||||||||
| Less distributions declared to shareholders | |||||||||||||||||
From net investment income | $(0.03 | ) | $(0.05 | ) | $(0.05 | ) | $— | $— | $— | ||||||||
Net asset value, end of period | $19.58 | $21.43 | $15.62 | $25.01 | $20.64 | $19.13 | |||||||||||
Total return (%) (k)(r)(s) | (8.53 | )(n) | 37.67 | (37.42 | ) | 21.17 | 7.89 | 9.19 | |||||||||
| Ratios (%) (to average net assets) and Supplemental data: | |||||||||||||||||
Expenses before expense reductions (f) | 0.85 | (a) | 0.86 | 0.84 | 0.87 | 0.87 | 0.88 | ||||||||||
Expenses after expense reductions (f) | 0.84 | (a) | 0.86 | 0.84 | 0.87 | 0.87 | 0.88 | ||||||||||
Net investment income (loss) | 0.11 | (a) | 0.14 | 0.25 | 0.20 | (0.14 | ) | (0.29 | ) | ||||||||
Portfolio turnover | 50 | 100 | 129 | 84 | 127 | 95 | |||||||||||
Net assets at end of period (000 omitted) | $421,958 | $498,288 | $389,813 | $711,418 | $667,776 | $761,444 | |||||||||||
See Notes to Financial Statements
11
Table of Contents
MFS Growth Series
Financial Highlights – continued
| Service Class | Six months ended 6/30/10 | Years ended 12/31 | ||||||||||||||||
| 2009 | 2008 | 2007 | 2006 | 2005 | ||||||||||||||
| (unaudited) | ||||||||||||||||||
Net asset value, beginning of period | $21.10 | $15.37 | $24.61 | $20.36 | $18.92 | $17.37 | ||||||||||||
| Income (loss) from investment operations | ||||||||||||||||||
Net investment income (loss) (d) | $(0.01 | ) | $(0.02 | ) | $0.00 | (w) | $(0.01 | ) | $(0.07 | ) | $(0.09 | ) | ||||||
Net realized and unrealized gain (loss) on investments and foreign currency | (1.82 | ) | 5.76 | (9.24 | ) | 4.26 | 1.51 | 1.64 | ||||||||||
Total from investment operations | $(1.83 | ) | $5.74 | $(9.24 | ) | $4.25 | $1.44 | $1.55 | ||||||||||
| Less distributions declared to shareholders | ||||||||||||||||||
From net investment income | $— | $(0.01 | ) | $— | $— | $— | $— | |||||||||||
Net asset value, end of period | $19.27 | $21.10 | $15.37 | $24.61 | $20.36 | $18.92 | ||||||||||||
Total return (%) (k)(r)(s) | (8.67 | )(n) | 37.33 | (37.55 | ) | 20.87 | 7.61 | 8.92 | ||||||||||
| Ratios (%) (to average net assets) and Supplemental data: | ||||||||||||||||||
Expenses before expense reductions (f) | 1.10 | (a) | 1.10 | 1.09 | 1.12 | 1.12 | 1.13 | |||||||||||
Expenses after expense reductions (f) | 1.10 | (a) | 1.10 | 1.08 | 1.12 | 1.12 | 1.13 | |||||||||||
Net investment income (loss) | (0.13 | )(a) | (0.11 | ) | 0.01 | (0.05 | ) | (0.39 | ) | (0.53 | ) | |||||||
Portfolio turnover | 50 | 100 | 129 | 84 | 127 | 95 | ||||||||||||
Net assets at end of period (000 omitted) | $32,021 | $31,861 | $18,684 | $30,698 | $34,595 | $32,332 | ||||||||||||
| (a) | Annualized. |
| (d) | Per share data is based on average shares outstanding. |
| (f) | Ratios do not reflect reductions from fees paid indirectly, if applicable. |
| (k) | The total return does not reflect expenses that apply to separate accounts. Inclusion of these charges would reduce the total return figures for all periods shown. |
| (n) | Not annualized. |
| (r) | Certain expenses have been reduced without which performance would have been lower. |
| (s) | From time to time the fund may receive proceeds from litigation settlements, without which performance would be lower. |
| (w) | Per share amount was less than $0.01. |
See Notes to Financial Statements
12
Table of Contents
MFS Growth Series
NOTES TO FINANCIAL STATEMENTS (unaudited)
| (1) | Business and Organization |
MFS Growth Series (the fund) is a series of MFS Variable Insurance Trust (the trust). The trust is organized as a Massachusetts business trust and is registered under the Investment Company Act of 1940, as amended, as an open-end management investment company. The shareholders of each series of the trust are separate accounts of insurance companies, which offer variable annuity and/or life insurance products, and qualified retirement and pension plans.
| (2) | Significant Accounting Policies |
General – The preparation of financial statements in conformity with U.S. generally accepted accounting principles requires management to make estimates and assumptions that affect the reported amounts of assets and liabilities, and disclosure of contingent assets and liabilities at the date of the financial statements and the reported amounts of revenues and expenses during the reporting period. Actual results could differ from those estimates. In the preparation of these financial statements, management has evaluated subsequent events occurring after the date of the fund’s Statement of Assets and Liabilities through the date that the financial statements were issued. The fund can invest in foreign securities, including securities of emerging market issuers. Investments in foreign securities are vulnerable to the effects of changes in the relative values of the local currency and the U.S. dollar and to the effects of changes in each country’s legal, political, and economic environment. The markets of emerging markets countries are generally more volatile than the markets of developed countries with more mature economies. All of the risks of investing in foreign securities previously described are heightened when investing in emerging markets countries.
Investment Valuations – Equity securities, including restricted equity securities, are generally valued at the last sale or official closing price as provided by a third-party pricing service on the market or exchange on which they are primarily traded. Equity securities, for which there were no sales reported that day, are generally valued at the last quoted daily bid quotation as provided by a third-party pricing service on the market or exchange on which such securities are primarily traded. Equity securities held short, for which there were no sales reported for that day, are generally valued at the last quoted daily ask quotation as provided by a third-party pricing service on the market or exchange on which such securities are primarily traded. Short-term instruments with a maturity at issuance of 60 days or less generally are valued at amortized cost, which approximates market value. Open-end investment companies are generally valued at net asset value per share. Securities and other assets generally valued on the basis of information from a third-party pricing service may also be valued at a broker/dealer bid quotation. Values obtained from third-party pricing services can utilize both transaction data and market information such as yield, quality, coupon rate, maturity, type of issue, trading characteristics, and other market data. The values of foreign securities and other assets and liabilities expressed in foreign currencies are converted to U.S. dollars using the mean of bid and asked prices for rates provided by a third-party pricing service.
The Board of Trustees has delegated primary responsibility for determining or causing to be determined the value of the fund’s investments (including any fair valuation) to the adviser pursuant to valuation policies and procedures approved by the Board. If the adviser determines that reliable market quotations are not readily available, investments are valued at fair value as determined in good faith by the adviser in accordance with such procedures under the oversight of the Board of Trustees. Under the fund’s valuation policies and procedures, market quotations are not considered to be readily available for most types of debt instruments and floating rate loans and many types of derivatives. These investments are generally valued at fair value based on information from third-party pricing services. In addition, investments may be valued at fair value if the adviser determines that an investment’s value has been materially affected by events occurring after the close of the exchange or market on which the investment is principally traded (such as foreign exchange or market) and prior to the determination of the fund’s net asset value, or after the halting of trading of a specific security where trading does not resume prior to the close of the exchange or market on which the security is principally traded. Events that occur on a frequent basis after foreign markets close (such as developments in foreign markets and significant movements in the U.S. markets) and prior to the determination of the fund’s net asset value may be deemed to have a material effect on the value of securities traded in foreign markets. Accordingly, the fund’s foreign equity securities may often be valued at fair value. The adviser generally relies on third-party pricing services or other information (such as the correlation with price movements of similar securities in the same or other markets; the type, cost and investment characteristics of the security; the business and financial condition of the issuer; and trading and other market data) to assist in determining whether to fair value and at what value to fair value an investment. The value of an investment for purposes of calculating the fund’s net asset value can differ depending on the source and method used to determine value. When fair valuation is used, the value of an investment used to determine the fund’s net asset value may differ from quoted or published prices for the same investment. There can be no assurance that the fund could obtain the fair value assigned to an investment if it were to sell the investment at the same time at which the fund determines its net asset value per share.
13
Table of Contents
MFS Growth Series
Notes to Financial Statements (unaudited) – continued
Various inputs are used in determining the value of the fund’s assets or liabilities. These inputs are categorized into three broad levels. In certain cases, the inputs used to measure fair value may fall into different levels of the fair value hierarchy. In such cases, an investment’s level within the fair value hierarchy is based on the lowest level of input that is significant to the fair value measurement. The fund’s assessment of the significance of a particular input to the fair value measurement in its entirety requires judgment, and considers factors specific to the investment. Level 1 includes unadjusted quoted prices in active markets for identical assets or liabilities. Level 2 includes other significant observable market-based inputs (including quoted prices for similar securities, interest rates, prepayment speed, and credit risk). Level 3 includes unobservable inputs, which may include the adviser’s own assumptions in determining the fair value of investments. Other financial instruments are derivative instruments not reflected in total investments, such as futures, forwards, swap contracts, and written options. The following is a summary of the levels used as of June 30, 2010 in valuing the fund’s assets or liabilities:
| Investments at Value | Level 1 | Level 2 | Level 3 | Total | ||||
| Equity Securities: | ||||||||
United States | $421,464,607 | $— | $— | $421,464,607 | ||||
Israel | 6,277,793 | — | — | 6,277,793 | ||||
Brazil | 3,443,822 | — | — | 3,443,822 | ||||
United Kingdom | — | 2,479,160 | — | 2,479,160 | ||||
Canada | 2,275,815 | — | — | 2,275,815 | ||||
China | 1,403,617 | 827,818 | — | 2,231,435 | ||||
Netherlands | — | 1,367,057 | — | 1,367,057 | ||||
Switzerland | — | 1,349,891 | — | 1,349,891 | ||||
| Mutual Funds | 10,143,688 | — | — | 10,143,688 | ||||
| Total Investments | $445,009,342 | $6,023,926 | $— | $451,033,268 |
For further information regarding security characteristics, see the Portfolio of Investments.
Foreign Currency Translation – Purchases and sales of foreign investments, income, and expenses are converted into U.S. dollars based upon currency exchange rates prevailing on the respective dates of such transactions or on the reporting date for foreign denominated receivables and payables. Gains and losses attributable to foreign currency exchange rates on sales of securities are recorded for financial statement purposes as net realized gains and losses on investments. Gains and losses attributable to foreign exchange rate movements on receivables, payables, income and expenses are recorded for financial statement purposes as foreign currency transaction gains and losses. That portion of both realized and unrealized gains and losses on investments that results from fluctuations in foreign currency exchange rates is not separately disclosed.
Derivatives – The fund may use derivatives for different purposes, including to earn income and enhance returns, to increase or decrease exposure to a particular market, to manage or adjust the risk profile of the fund, or as alternatives to direct investments. Derivatives may be used for hedging or non-hedging purposes. While hedging can reduce or eliminate losses, it can also reduce or eliminate gains. When the fund uses derivatives as an investment to increase market exposure, or for hedging purposes, gains and losses from derivative instruments may be substantially greater than the derivative’s original cost.
Derivative instruments include written options, purchased options, futures contracts, forward foreign currency exchange contracts, and swap agreements. For the six months ended June 30, 2010, the fund did not invest in any derivative instruments.
Short Sales – The fund may enter into short sales whereby it sells a security it does not own in anticipation of a decline in the value of that security. The fund will realize a gain if the security price decreases and a loss if the security price increases between the date of the short sale and the date on which the fund replaces the borrowed security. Losses from short sales can exceed the proceeds of the security sold; and they can also exceed the potential loss from an ordinary buy and sell transaction. The amount of any premium, dividends, or interest the fund may be required to pay in connection with a short sale will be recognized as a fund expense. The fund segregates cash or marketable securities in an amount that, when combined with the amount of proceeds from the short sale deposited with the broker, at least equals the current market value of the security sold short. At June 30, 2010, the fund has yet to enter into such transactions.
Security Loans – State Street Bank and Trust Company (“State Street”), as lending agent, may loan the securities of the fund to certain qualified institutions (the “Borrowers”) approved by the fund. The loans are collateralized by cash and/or U.S. Treasury and federal agency obligations in an amount typically at least equal to the market value of the securities loaned. The market value of the loaned securities is determined at the close of business of the fund and any additional required collateral is delivered to the fund on the next business day. State Street provides the fund with indemnification against Borrower default. The fund bears the risk of loss with respect to the investment of cash collateral. On loans collateralized by cash, the cash collateral is invested in a money market fund or short-term securities. A portion of the income generated upon investment of the collateral is remitted to the Borrowers, and the remainder is allocated between the fund and the lending agent. On loans
14
Table of Contents
MFS Growth Series
Notes to Financial Statements (unaudited) – continued
collateralized by U.S. Treasury and/or federal agency obligations, a fee is received from the Borrower, and is allocated between the fund and the lending agent. Income from securities lending is included in interest income on the Statement of Operations. The dividend and interest income earned on the securities loaned is accounted for in the same manner as other dividend and interest income.
Indemnifications – Under the fund’s organizational documents, its officers and Trustees may be indemnified against certain liabilities and expenses arising out of the performance of their duties to the fund. Additionally, in the normal course of business, the fund enters into agreements with service providers that may contain indemnification clauses. The fund’s maximum exposure under these agreements is unknown as this would involve future claims that may be made against the fund that have not yet occurred.
Investment Transactions and Income – Investment transactions are recorded on the trade date. Interest income is recorded on the accrual basis. All premium and discount is amortized or accreted for financial statement purposes in accordance with U.S. generally accepted accounting principles. Dividends received in cash are recorded on the ex-dividend date. Certain dividends from foreign securities will be recorded when the fund is informed of the dividend if such information is obtained subsequent to the ex-dividend date. Dividend and interest payments received in additional securities are recorded on the ex-dividend or ex-interest date in an amount equal to the value of the security on such date.
The fund may receive proceeds from litigation settlements. Any proceeds received from litigation involving portfolio holdings are reflected in the Statement of Operations in realized gain/loss if the security has been disposed of by the fund or in unrealized gain/loss if the security is still held by the fund. Any other proceeds from litigation not related to portfolio holdings are reflected as other income in the Statement of Operations.
Fees Paid Indirectly – The fund’s custody fee may be reduced according to an arrangement that measures the value of cash deposited with the custodian by the fund. For the six months ended June 30, 2010, custody fees were not reduced.
Tax Matters and Distributions – The fund intends to qualify as a regulated investment company, as defined under Subchapter M of the Internal Revenue Code, and to distribute all of its taxable income, including realized capital gains. As a result, no provision for federal income tax is required. The fund’s federal tax returns for the prior three fiscal years remain subject to examination by the Internal Revenue Service. Foreign taxes, if any, have been accrued by the fund in the accompanying financial statements.
Distributions to shareholders are recorded on the ex-dividend date. Income and capital gain distributions are determined in accordance with income tax regulations, which may differ from U.S. generally accepted accounting principles. Certain capital accounts in the financial statements are periodically adjusted for permanent differences in order to reflect their tax character. These adjustments have no impact on net assets or net asset value per share. Temporary differences which arise from recognizing certain items of income, expense, gain or loss in different periods for financial statement and tax purposes will reverse at some time in the future. Distributions in excess of net investment income or net realized gains are temporary overdistributions for financial statement purposes resulting from differences in the recognition or classification of income or distributions for financial statement and tax purposes.
Book/tax differences primarily relate to wash sale loss deferrals and expiration of capital loss carryforwards.
The tax character of distributions made during the current period, if any, will be determined at fiscal year end. The tax character of distributions declared to shareholders for the last fiscal year is as follows:
| 12/31/09 | ||
| Ordinary income (including any short-term capital gains) | $1,356,880 |
The federal tax cost and the tax basis components of distributable earnings were as follows:
| As of 6/30/10 | |||
| Cost of investments | $455,807,239 | ||
| Gross appreciation | 27,268,026 | ||
| Gross depreciation | (32,041,997 | ) | |
| Net unrealized appreciation (depreciation) | $(4,773,971 | ) | |
| As of 12/31/09 | |||
| Undistributed ordinary income | 546,668 | ||
| Capital loss carryforwards | (484,363,421 | ) | |
| Other temporary differences | (1,593 | ) | |
| Net unrealized appreciation (depreciation) | 67,418,824 | ||
The aggregate cost above includes prior fiscal year end tax adjustments, if applicable.
15
Table of Contents
MFS Growth Series
Notes to Financial Statements (unaudited) – continued
As of December 31, 2009 the fund had capital loss carryforwards available to offset future realized gains. Such losses expire as follows:
| 12/31/10 | $(403,877,987 | ) | |
| 12/31/16 | (52,541,803 | ) | |
| 12/31/17 | (27,943,631 | ) | |
| $(484,363,421 | ) |
Multiple Classes of Shares of Beneficial Interest – The fund offers multiple classes of shares, which differ in their respective distribution and/or service fees. The fund’s income, realized and unrealized gain (loss), and common expenses are allocated to shareholders based on the daily net assets of each class. Dividends are declared separately for each class. Differences in per share dividend rates are generally due to differences in separate class expenses. The fund’s distributions declared to shareholders as reported on the Statements of Changes in Net Assets are presented by class as follows:
| From net investment income | ||||
| Six months ended 6/30/10 | Year ended 12/31/09 | |||
| Initial Class | $550,091 | $1,350,026 | ||
| Service Class | — | 6,854 | ||
| Total | $550,091 | $1,356,880 | ||
| (3) | Transactions with Affiliates |
Investment Adviser – The fund has an investment advisory agreement with MFS to provide overall investment management and related administrative services and facilities to the fund. The management fee is computed daily and paid monthly at the following annual rates:
| First $1 billion of average daily net assets | 0.75% | |
| Average daily net assets in excess of $1 billion | 0.65% |
The management fee incurred for the six months ended June 30, 2010 was equivalent to an annual effective rate of 0.75% of the fund’s average daily net assets.
Distributor – MFS Fund Distributors, Inc. (MFD), a wholly-owned subsidiary of MFS, is the distributor of shares of the fund. The Trustees have adopted a distribution plan for the Service Class shares pursuant to Rule 12b-1 under the Investment Company Act of 1940.
The fund’s distribution plan provides that the fund will pay MFD distribution and/or service fees equal to 0.25% per annum of its average daily net assets attributable to Service Class shares as partial consideration for services performed and expenses incurred by MFD and financial intermediaries (including participating insurance companies that invest in the fund to fund variable annuity and variable life insurance contracts, sponsors of qualified retirement and pension plans that invest in the fund, and affiliates of these participating insurance companies and plan sponsors) in connection with the sale and distribution of the Service Class shares. MFD may subsequently pay all, or a portion, of the distribution and/or service fees to financial intermediaries.
Shareholder Servicing Agent – MFS Service Center, Inc. (MFSC), a wholly-owned subsidiary of MFS, receives a fee from the fund for its services as shareholder servicing agent. For the six months ended June 30, 2010, the fee was $30,378, which equated to 0.0120% annually of the fund’s average daily net assets. MFSC also receives payment from the fund for out-of-pocket expenses paid by MFSC on behalf of the fund. For the six months ended June 30, 2010, these costs amounted to $874.
Administrator – MFS provides certain financial, legal, shareholder communications, compliance, and other administrative services to the fund. Under an administrative services agreement, the fund partially reimburses MFS the costs incurred to provide these services. The fund is charged an annual fixed amount of $17,500 plus a fee based on average daily net assets. The administrative services fee incurred for the six months ended June 30, 2010 was equivalent to an annual effective rate of 0.0163% of the fund’s average daily net assets.
Trustees’ and Officers’ Compensation – The fund pays compensation to independent Trustees in the form of a retainer, attendance fees, and additional compensation to Board and Committee chairpersons. The fund does not pay compensation directly to Trustees or officers of the fund who are also officers of the investment adviser, all of whom receive remuneration for their services to the fund from MFS. Certain officers and Trustees of the fund are officers or directors of MFS, MFD, and MFSC.
16
Table of Contents
MFS Growth Series
Notes to Financial Statements (unaudited) – continued
Other – This fund and certain other funds managed by MFS (the funds) have entered into services agreements (the Agreements) which provide for payment of fees by the funds to Tarantino LLC and Griffin Compliance LLC in return for the provision of services of an Independent Chief Compliance Officer (ICCO) and Assistant ICCO, respectively, for the funds. The ICCO and Assistant ICCO are officers of the funds and the sole members of Tarantino LLC and Griffin Compliance LLC, respectively. The funds can terminate the Agreements with Tarantino LLC and Griffin Compliance LLC at any time under the terms of the Agreements. For the six months ended June 30, 2010, the aggregate fees paid by the fund to Tarantino LLC and Griffin Compliance LLC were $2,083 and are included in miscellaneous expense on the Statement of Operations. MFS has agreed to reimburse the fund for a portion of the payments made by the fund in the amount of $1,668, which is shown as a reduction of total expenses in the Statement of Operations. Additionally, MFS has agreed to bear all expenses associated with office space, other administrative support, and supplies provided to the ICCO and Assistant ICCO.
The fund may invest in the MFS Institutional Money Market Portfolio which is managed by MFS and seeks a high level of current income consistent with preservation of capital and liquidity. Income earned on this investment is included in dividends from underlying funds on the Statement of Operations. This money market fund does not pay a management fee to MFS.
| (4) | Portfolio Securities |
Purchases and sales of investments, other than U.S. Government securities, purchased option transactions, and short-term obligations, aggregated $243,528,572 and $270,005,327, respectively.
| (5) | Shares of Beneficial Interest |
The fund’s Declaration of Trust permits the Trustees to issue an unlimited number of full and fractional shares of beneficial interest. Transactions in fund shares were as follows:
| Six months ended 6/30/10 | Year ended 12/31/09 | |||||||||||
| Shares | Amount | Shares | Amount | |||||||||
| Shares sold | ||||||||||||
Initial Class | 1,338,030 | $28,565,497 | 3,598,198 | $64,125,112 | ||||||||
Service Class | 357,577 | 7,630,240 | 790,963 | 13,734,162 | ||||||||
| 1,695,607 | $36,195,737 | 4,389,161 | $77,859,274 | |||||||||
| Shares issued to shareholders in reinvestment of distributions | ||||||||||||
Initial Class | 23,650 | $550,091 | 70,237 | $1,103,429 | ||||||||
Service Class | — | — | 442 | 6,854 | ||||||||
| 23,650 | $550,091 | 70,679 | $1,110,283 | |||||||||
| Shares reacquired | ||||||||||||
Initial Class | (3,059,617 | ) | $(66,277,826 | ) | (5,369,066 | ) | $(93,774,134 | ) | ||||
Service Class | (206,062 | ) | (4,374,179 | ) | (496,838 | ) | (8,431,658 | ) | ||||
| (3,265,679 | ) | $(70,652,005 | ) | (5,865,904 | ) | $(102,205,792 | ) | |||||
| Net change | ||||||||||||
Initial Class | (1,697,937 | ) | $(37,162,238 | ) | (1,700,631 | ) | $(28,545,593 | ) | ||||
Service Class | 151,515 | 3,256,061 | 294,567 | 5,309,358 | ||||||||
| (1,546,422 | ) | $(33,906,177 | ) | (1,406,064 | ) | $(23,236,235 | ) | |||||
| (6) | Line of Credit |
The fund and certain other funds managed by MFS participate in a $1.1 billion unsecured committed line of credit, subject to a $1 billion sublimit, provided by a syndication of banks under a credit agreement. Borrowings may be made for temporary financing needs. Interest is charged to each fund, based on its borrowings, generally at a rate equal to the higher of the Federal Reserve funds rate or one month LIBOR plus an agreed upon spread. A commitment fee, based on the average daily, unused portion of the committed line of credit, is allocated among the participating funds at the end of each calendar quarter. In addition, the fund and other funds managed by MFS have established unsecured uncommitted borrowing arrangements with certain banks for temporary financing needs. Interest is charged to each fund, based on its borrowings, at a rate equal to the Federal Reserve funds rate plus an agreed upon spread. For the six months ended June 30, 2010, the fund’s commitment fee and interest expense were $3,818 and $0, respectively, and are included in miscellaneous expense on the Statement of Operations.
17
Table of Contents
MFS Growth Series
Notes to Financial Statements (unaudited) – continued
| (7) | Transactions in Underlying Funds – Affiliated Issuers |
An affiliated issuer may be considered one in which the fund owns 5% or more of the outstanding voting securities, or a company which is under common control. For the purposes of this report, the fund assumes the following to be affiliated issuers:
| Underlying Funds | Beginning Share/Par Amount | Acquisitions Shares/Par Amount | Dispositions Shares/Par Amount | Ending Share/Par Amount | |||||
| MFS Institutional Money Market Portfolio | 19,873,873 | 61,513,797 | (73,615,148 | ) | 7,772,522 | ||||
| Underlying Funds | Realized Gain (Loss) | Capital Gain Distributions | Dividend Income | Ending Value | |||||
| MFS Institutional Money Market Portfolio | $— | $— | $10,341 | $7,772,522 | |||||
18
Table of Contents
MFS Growth Series
RESULTS OF SHAREHOLDER MEETING (unaudited)
At a special meeting of shareholders of MFS Variable Insurance Trust, which was held on January 28, 2010, the following actions were taken:
Item 1. To elect the following individuals as Trustees:
| Number of Dollars | ||||
| Nominee | For | Withheld Authority | ||
| Robert E. Butler | 6,823,651,821.26 | 1,818,252,669.55 | ||
| Lawrence H. Cohn, M.D. | 6,813,621,200.14 | 1,828,283,290.67 | ||
| Maureen R. Goldfarb | 6,825,332,620.76 | 1,816,571,870.05 | ||
| David H. Gunning | 6,823,081,841.37 | 1,818,822,649.44 | ||
| William R. Gutow | 6,813,678,877.22 | 1,828,225,613.59 | ||
| Michael Hegarty | 6,827,456,515.87 | 1,814,447,974.94 | ||
| John P. Kavanaugh | 6,830,363,113.12 | 1,811,541,377.69 | ||
| Robert J. Manning | 6,825,511,264.17 | 1,816,393,226.64 | ||
| Robert C. Pozen | 6,824,854,120.27 | 1,817,050,370.54 | ||
| J. Dale Sherratt | 6,816,913,203.87 | 1,824,991,286.94 | ||
| Laurie J. Thomsen | 6,823,590,745.56 | 1,818,313,745.25 | ||
| Robert W. Uek | 6,818,161,803.66 | 1,823,742,687.15 | ||
19
Table of Contents
MFS Growth Series
BOARD REVIEW OF INVESTMENT ADVISORY AGREEMENT
A discussion regarding the Board’s most recent review and renewal of the fund’s Investment Advisory Agreement with MFS will be available on or about November 1, 2010 by clicking on the fund’s name under ‘‘Variable Insurance Portfolios — VIT’’ in the ‘‘Products and Performance’’ section of the MFS Web site (mfs.com).
PROXY VOTING POLICIES AND INFORMATION
A general description of the MFS funds’ proxy voting policies and procedures is available without charge, upon request, by calling
1-800-225-2606, by visiting the Proxy Voting section of mfs.com or by visiting the SEC’s Web site at http://www.sec.gov.
Information regarding how the fund voted proxies relating to portfolio securities during the most recent twelve-month period ended June 30 is available without charge by visiting the Proxy Voting section of mfs.com or by visiting the SEC’s Web site at http://www.sec.gov.
QUARTERLY PORTFOLIO DISCLOSURE
The fund will file a complete schedule of portfolio holdings with the Securities and Exchange Commission (the Commission) for the first and third quarters of each fiscal year on Form N-Q. The fund’s Form N-Q may be reviewed and copied at the:
Public Reference Room
Securities and Exchange Commission
100 F Street, NE, Room 1580
Washington, D.C. 20549
Information on the operation of the Public Reference Room may be obtained by calling the Commission at 1-800-SEC-0330. The fund’s Form N-Q is available on the EDGAR database on the Commission’s Internet Web site at http://www.sec.gov, and copies of this information may be obtained, upon payment of a duplicating fee, by electronic request at the following e-mail address: publicinfo@sec.gov or by writing the Public Reference Section at the above address.
From time to time, MFS may post important information about the fund or the MFS funds on the MFS web site (mfs.com). This information is available by visiting the “News & Commentary” section of mfs.com or by clicking on the fund’s name under “Variable Insurance Portfolios — VIT” in the “Products and Performance” section of mfs.com.
20
Table of Contents

Table of Contents

Table of Contents
This report is prepared for the general information of contract owners. It is authorized for distribution to prospective investors only when preceded or accompanied by a current prospectus.
NOT FDIC INSURED Ÿ MAY LOSE VALUE Ÿ NO BANK GUARANTEE Ÿ NOT A DEPOSIT Ÿ NOT INSURED BY ANY FEDERAL GOVERNMENT AGENCY OR NCUA/NCUSIF
Table of Contents
MFS Investors Trust Series

Dear Contract Owners:
After having suffered their biggest declines since the Great Depression, most global markets experienced an impressive resurgence during the latter months of 2009 and the first quarter of 2010. The global economy was able to reap the benefits of two major trends. The first of these was the massive efforts of governments and central banks to increase liquidity in the financial system as they sought to prevent the credit crisis from further affecting the banking system. The second was the move by companies around the world to cut costs and operations to prepare for rapidly changing market conditions. We believe that these moves not only shortened the length of the downturn but also set the stage for recovery.
Even with the significant market gains of 2009 and the early part of 2010, the recovery is unrolling at a moderate pace, with rebounds in the manufacturing sector and corporate America leading the way. Central bankers are proceeding with caution and many have held benchmark interest rates unchanged as they debate the best way to withdraw stimulus measures without disrupting the fragile growth process. Complicating that debate late in the period was the emergence of the European debt crisis and worries about whether this crisis could derail the global recovery. As that crisis unrolled with no clear resolution, risk aversion rose along with volatility. Weakening economic data late in the period added uncertainty to the mix and sparked a retrenchment in global equity markets.
While hurdles remain, we believe that the global economy is proceeding on the road to recovery. As always, we continue to be mindful of the many challenges faced at the individual, national, and international levels. It is at times such as these that we want to remind investors of the merits of maintaining a long-term view, adhering to basic investing principles such as asset allocation and diversification, and working closely with advisors to identify and research investment opportunities. At MFS®, we take particular pride in how well mutual funds can provide a broad range of products that can fit investor needs in any type of market climate.
Respectfully,

Robert J. Manning
Chairman and Chief Executive Officer
MFS Investment Management®
August 16, 2010
The opinions expressed in this letter are subject to change, may not be relied upon for investment advice, and no forecasts can be guaranteed.
MFS Fund Distributors, Inc., 500 Boylston Street, Boston, MA 02116
1
Table of Contents
MFS Investors Trust Series
Portfolio structure

| Top ten holdings | ||
| JPMorgan Chase & Co. | 2.6% | |
| Apple, Inc. | 2.6% | |
| Procter & Gamble Co. | 2.5% | |
| Bank of America Corp. | 2.4% | |
| Johnson & Johnson | 2.4% | |
| Cisco Systems, Inc. | 2.3% | |
| Oracle Corp. | 2.3% | |
| Walt Disney Co. | 2.2% | |
| Hewlett-Packard Co. | 2.2% | |
| Abbott Laboratories | 2.1% |
| Equity sectors | ||
| Technology | 18.9% | |
| Financial Services | 16.6% | |
| Health Care | 13.2% | |
| Consumer Staples | 11.5% | |
| Energy | 9.3% | |
| Retailing | 6.0% | |
| Industrial Goods & Services | 5.3% | |
| Utilities & Communications | 5.1% | |
| Basic Materials | 4.3% | |
| Special Products & Services | 3.7% | |
| Leisure | 3.6% | |
| Autos & Housing | 1.5% | |
| Transportation | 0.5% |
Percentages are based on net assets as of 6/30/10.
The portfolio is actively managed and current holdings may be different.
2
Table of Contents
MFS Investors Trust Series
After having suffered through one of the largest and most concentrated downturns since the 1930s, most asset markets staged a remarkable rebound during 2009 and early 2010. This recovery in global activity has been led importantly by emerging Asian economies, but broadening to include most of the global economy to varying degrees. Primary drivers of the recovery included an unwinding of the inventory destocking that took place earlier, the production of manufacturing and capital goods, as well as massive fiscal and monetary stimulus.
Late in the period, though, heightened risk surrounding the public-debt profiles of several of the peripheral European countries impaired market sentiment. At the same time, the improving trend in global macroeconomic data began to weaken somewhat. These two dynamics caused most asset prices to retrench significantly, as many questioned the durability of the global recovery.
3
Table of Contents
MFS Investors Trust Series
Fund Expenses Borne by the Contract Holders During the Period, January 1, 2010 through June 30, 2010
As a contract holder of the fund, you incur ongoing costs, including management fees; distribution and/or service (12b-1) fees; and other fund expenses. This example is intended to help you understand your ongoing costs (in dollars) of investing in the fund and to compare these costs with the ongoing costs of investing in other mutual funds.
The example is based on an investment of $1,000 invested at the beginning of the period and held for the entire period January 1, 2010 through June 30, 2010.
Actual Expenses
The first line for each share class in the following table provides information about actual account values and actual expenses. You may use the information in this line, together with the amount you invested, to estimate the expenses that you paid over the period. Simply divide your account value by $1,000 (for example, an $8,600 account value divided by $1,000 = 8.6), then multiply the result by the number in the first line under the heading entitled “Expenses Paid During Period” to estimate the expenses you paid on your account during this period.
Hypothetical Example for Comparison Purposes
The second line for each share class in the following table provides information about hypothetical account values and hypothetical expenses based on the fund’s actual expense ratio and an assumed rate of return of 5% per year before expenses, which is not the fund’s actual return. The hypothetical account values and expenses may not be used to estimate the actual ending account balance or expenses you paid for the period. You may use this information to compare the ongoing costs of investing in the fund and other funds. To do so, compare this 5% hypothetical example with the 5% hypothetical examples that appear in the shareholder reports of the other funds.
Please note that the expenses shown in the table are meant to highlight the fund’s ongoing costs only and do not take into account the fees and expenses imposed under the variable contracts through which your investment in the fund is made. Therefore, the second line for each share class in the table is useful in comparing ongoing costs associated with an investment in vehicles (such as the fund) which fund benefits under variable annuity and variable life insurance contracts and to qualified pension and retirement plans only, and will not help you determine the relative total costs of investing in the fund through variable annuity and variable life insurance contracts. If the fees and expenses imposed under the variable contracts were included, your costs would have been higher.
| Share Class | Annualized Expense Ratio | Beginning Account Value 1/01/10 | Ending Account Value 6/30/10 | Expenses Paid During Period (p) 1/01/10-6/30/10 | ||||||
| Initial Class | Actual | 0.84% | $1,000.00 | $918.05 | $3.99 | |||||
| Hypothetical (h) | 0.84% | $1,000.00 | $1,020.63 | $4.21 | ||||||
| Service Class | Actual | 1.09% | $1,000.00 | $917.05 | $5.18 | |||||
| Hypothetical (h) | 1.09% | $1,000.00 | $1,019.39 | $5.46 |
| (h) | 5% class return per year before expenses. |
| (p) | Expenses paid is equal to each class’ annualized expense ratio, as shown above, multiplied by the average account value over the period, multiplied by the number of days in the period, divided by the number of days in the year. |
4
Table of Contents
MFS Investors Trust Series
PORTFOLIO OF INVESTMENTS – 6/30/10 (unaudited)
The Portfolio of Investments is a complete list of all securities owned by your fund. It is categorized by broad-based asset classes.
| Issuer | Shares/Par | Value ($) | |||
| COMMON STOCKS – 99.5% | |||||
| Aerospace – 3.4% | |||||
| Lockheed Martin Corp. | 106,090 | $ | 7,903,705 | ||
| United Technologies Corp. | 176,630 | 11,465,053 | |||
| $ | 19,368,758 | ||||
| Alcoholic Beverages – 2.1% | |||||
| Diageo PLC | 421,300 | $ | 6,601,377 | ||
| Heineken N.V. | 128,960 | 5,466,532 | |||
| $ | 12,067,909 | ||||
| Apparel Manufacturers – 1.6% | |||||
| NIKE, Inc., “B” | 135,620 | $ | 9,161,131 | ||
| Automotive – 0.6% | |||||
| Bayerische Motoren Werke AG | 76,430 | $ | 3,696,783 | ||
| Biotechnology – 2.1% | |||||
| Genzyme Corp. (a) | 116,900 | $ | 5,935,013 | ||
| Gilead Sciences, Inc. (a) | 169,020 | 5,794,006 | |||
| $ | 11,729,019 | ||||
| Broadcasting – 2.2% | |||||
| Walt Disney Co. | 401,870 | $ | 12,658,905 | ||
| Brokerage & Asset Managers – 1.5% | |||||
| Charles Schwab Corp. | 271,280 | $ | 3,846,750 | ||
| Franklin Resources, Inc. | 51,900 | 4,473,261 | |||
| $ | 8,320,011 | ||||
| Business Services – 3.7% | |||||
| Accenture Ltd., “A” | 165,610 | $ | 6,400,826 | ||
| Amdocs Ltd. (a) | 109,290 | 2,934,437 | |||
| MasterCard, Inc., “A” | 33,620 | 6,708,199 | |||
| Visa, Inc., “A” | 76,290 | 5,397,517 | |||
| $ | 21,440,979 | ||||
| Chemicals – 2.0% | |||||
| 3M Co. | 99,330 | $ | 7,846,077 | ||
| Monsanto Co. | 76,820 | 3,550,620 | |||
| $ | 11,396,697 | ||||
| Computer Software – 3.5% | |||||
| Adobe Systems, Inc. (a) | 72,130 | $ | 1,906,396 | ||
| Oracle Corp. | 613,060 | 13,156,268 | |||
| VeriSign, Inc. (a) | 182,780 | 4,852,809 | |||
| $ | 19,915,473 | ||||
| Computer Software – Systems – 7.9% | |||||
| Apple, Inc. (a) | 58,180 | $ | 14,634,015 | ||
| Dell, Inc. (a) | 211,840 | 2,554,790 | |||
| EMC Corp. (a) | 588,250 | 10,764,975 | |||
| Hewlett-Packard Co. | 289,410 | 12,525,665 | |||
| International Business Machines Corp. | 37,710 | 4,656,431 | |||
| $ | 45,135,876 | ||||
| Construction – 0.9% | |||||
| Sherwin-Williams Co. | 78,340 | $ | 5,420,345 | ||
| Issuer | Shares/Par | Value ($) | |||
| COMMON STOCKS – continued | |||||
| Consumer Products – 4.8% | |||||
| Colgate-Palmolive Co. | 88,830 | $ | 6,996,251 | ||
| Procter & Gamble Co. | 238,910 | 14,329,822 | |||
| Reckitt Benckiser Group PLC | 134,480 | 6,220,590 | |||
| $ | 27,546,663 | ||||
| Electrical Equipment – 1.9% | |||||
| Danaher Corp. | 296,140 | $ | 10,992,717 | ||
| Electronics – 3.2% | |||||
| Intel Corp. | 486,180 | $ | 9,456,201 | ||
| Microchip Technology, Inc. | 212,030 | 5,881,712 | |||
| Samsung Electronics Co. Ltd., GDR | 9,592 | 3,000,822 | |||
| $ | 18,338,735 | ||||
| Energy – Independent – 2.8% | |||||
| EOG Resources, Inc. | 42,000 | $ | 4,131,540 | ||
| Noble Energy, Inc. | 74,810 | 4,513,287 | |||
| Occidental Petroleum Corp. | 99,210 | 7,654,052 | |||
| $ | 16,298,879 | ||||
| Energy – Integrated – 3.6% | |||||
| Chevron Corp. | 143,360 | $ | 9,728,410 | ||
| Exxon Mobil Corp. | 83,980 | 4,792,739 | |||
| Hess Corp. | 117,480 | 5,913,943 | |||
| $ | 20,435,092 | ||||
| Food & Beverages – 3.1% | |||||
| General Mills, Inc. | 134,420 | $ | 4,774,598 | ||
| Nestle S.A. | 104,296 | 5,032,279 | |||
| PepsiCo, Inc. | 128,841 | 7,852,859 | |||
| $ | 17,659,736 | ||||
| Gaming & Lodging – 1.4% | |||||
| Carnival Corp. | 83,180 | $ | 2,515,363 | ||
| International Game Technology | 150,220 | 2,358,454 | |||
| Ladbrokes PLC | 694,282 | 1,311,049 | |||
| Starwood Hotels & Resorts Worldwide, Inc. | 50,060 | 2,073,986 | |||
| $ | 8,258,852 | ||||
| General Merchandise – 2.9% | |||||
| Kohl’s Corp. (a) | 117,610 | $ | 5,586,475 | ||
| Target Corp. | 221,510 | 10,891,647 | |||
| $ | 16,478,122 | ||||
| Insurance – 2.1% | |||||
| Aflac, Inc. | 157,390 | $ | 6,715,831 | ||
| Travelers Cos., Inc. | 103,290 | 5,087,032 | |||
| $ | 11,802,863 | ||||
| Internet – 2.0% | |||||
| Google, Inc., “A” (a) | 25,910 | $ | 11,528,654 | ||
| Major Banks – 11.8% | |||||
| Bank of America Corp. | 966,830 | $ | 13,893,347 | ||
| Bank of New York Mellon Corp. | 330,993 | 8,172,217 | |||
5
Table of Contents
MFS Investors Trust Series
Portfolio of Investments (unaudited) – continued
| Issuer | Shares/Par | Value ($) | |||
| COMMON STOCKS – continued | |||||
| Major Banks – continued | |||||
| Goldman Sachs Group, Inc. | 69,430 | $ | 9,114,076 | ||
| JPMorgan Chase & Co. | 402,220 | 14,725,274 | |||
| State Street Corp. | 215,380 | 7,284,152 | |||
| SunTrust Banks, Inc. | 151,100 | 3,520,630 | |||
| Wells Fargo & Co. | 418,960 | 10,725,376 | |||
| $ | 67,435,072 | ||||
| Medical Equipment – 4.7% | |||||
| Baxter International, Inc. | 85,150 | $ | 3,460,496 | ||
| Becton, Dickinson & Co. | 98,960 | 6,691,675 | |||
| Medtronic, Inc. | 286,870 | 10,404,775 | |||
| St. Jude Medical, Inc. (a) | 170,290 | 6,145,766 | |||
| $ | 26,702,712 | ||||
| Natural Gas – Distribution – 1.0% | |||||
| Questar Corp. | 131,890 | $ | 5,999,676 | ||
| Network & Telecom – 2.3% | |||||
| Cisco Systems, Inc. (a) | 619,612 | $ | 13,203,932 | ||
| Oil Services – 2.9% | |||||
| Halliburton Co. | 208,980 | $ | 5,130,459 | ||
| National Oilwell Varco, Inc. | 104,730 | 3,463,421 | |||
| Noble Corp. | 125,050 | 3,865,295 | |||
| Schlumberger Ltd. | 70,020 | 3,874,907 | |||
| $ | 16,334,082 | ||||
| Other Banks & Diversified Financials – 1.2% | |||||
| American Express Co. | 169,230 | $ | 6,718,431 | ||
| Pharmaceuticals – 6.4% | |||||
| Abbott Laboratories | 258,250 | $ | 12,080,935 | ||
| Johnson & Johnson | 228,996 | 13,524,504 | |||
| Roche Holding AG | 30,740 | 4,221,328 | |||
| Teva Pharmaceutical Industries Ltd., ADR | 135,130 | 7,025,409 | |||
| $ | 36,852,176 | ||||
| Specialty Chemicals – 2.3% | |||||
| Linde AG | 68,210 | $ | 7,162,228 | ||
| Praxair, Inc. | 78,570 | 5,970,534 | |||
| $ | 13,132,762 | ||||
| Specialty Stores – 1.5% | |||||
| Nordstrom, Inc. | 77,880 | $ | 2,506,957 | ||
| Staples, Inc. | 313,695 | 5,975,890 | |||
| $ | 8,482,847 | ||||
| Issuer | Shares/Par | Value ($) | |||
| COMMON STOCKS – continued | |||||
| Telephone Services – 2.0% | |||||
| American Tower Corp., “A” (a) | 131,310 | $ | 5,843,295 | ||
| AT&T, Inc. (s) | 229,500 | 5,551,605 | |||
| $ | 11,394,900 | ||||
| Tobacco – 1.5% | |||||
| Philip Morris International, Inc. | 190,510 | $ | 8,732,978 | ||
| Trucking – 0.5% | |||||
| Expeditors International of Washington, Inc. | 86,480 | $ | 2,984,425 | ||
| Utilities – Electric Power – 2.1% | |||||
| Alliant Energy Corp. | 118,060 | $ | 3,747,224 | ||
| American Electric Power Co., Inc. | 110,630 | 3,573,349 | |||
| Wisconsin Energy Corp. | 96,320 | 4,887,277 | |||
| $ | 12,207,850 | ||||
| Total Common Stocks (Identified Cost, $588,068,355) | $ | 569,834,042 | |||
| MONEY MARKET FUNDS (v) – 0.5% | |||||
| MFS Institutional Money Market Portfolio, 0.22%, at Cost and Net Asset Value | 2,854,611 | $ | 2,854,611 | ||
| Total Investments (Identified Cost, $590,922,966) | $ | 572,688,653 | |||
| OTHER ASSETS, LESS LIABILITIES – 0.0% | 50,203 | ||||
| Net Assets – 100.0% | $ | 572,738,856 | |||
| (a) | Non-income producing security. |
| (s) | Security or a portion of the security was pledged to cover collateral requirements for securities sold short. At June 30, 2010, the value of securities pledged amounted to $157,235. At June 30, 2010, the fund had no short sales outstanding. |
| (v) | Underlying fund that is available only to investment companies managed by MFS. The rate quoted is the annualized seven-day yield of the fund at period end. |
The following abbreviations are used in this report and are defined:
| ADR | American Depository Receipt |
| GDR | Global Depository Receipt |
| PLC | Public Limited Company |
See Notes to Financial Statements
6
Table of Contents
MFS Investors Trust Series
FINANCIAL STATEMENTS | STATEMENT OF ASSETS AND LIABILITIES (unaudited)
This statement represents your fund’s balance sheet, which details the assets and liabilities comprising the total value of the fund.
At 6/30/10 | |||||
Assets | |||||
Investments – | |||||
Non-affiliated issuers, at value (identified cost, $588,068,355) | $569,834,042 | ||||
Underlying funds, at cost and value | 2,854,611 | ||||
Total investments, at value (identified cost, $590,922,966) | $572,688,653 | ||||
Receivables for | |||||
Fund shares sold | 380,930 | ||||
Interest and dividends | 581,920 | ||||
Other assets | 3,775 | ||||
Total assets | $573,655,278 | ||||
Liabilities | |||||
Payables for | |||||
Fund shares reacquired | $689,552 | ||||
Payable to affiliates | |||||
Investment adviser | 20,655 | ||||
Shareholder servicing costs | 491 | ||||
Distribution and/or service fees | 627 | ||||
Administrative services fee | 490 | ||||
Payable for independent Trustees’ compensation | 2,746 | ||||
Accrued expenses and other liabilities | 201,861 | ||||
Total liabilities | $916,422 | ||||
Net assets | $572,738,856 | ||||
Net assets consist of | |||||
Paid-in capital | $670,512,641 | ||||
Unrealized appreciation (depreciation) on investments and translation of assets and liabilities in foreign currencies | (18,228,076 | ) | |||
Accumulated net realized gain (loss) on investments and foreign currency transactions | (82,145,811 | ) | |||
Undistributed net investment income | 2,600,102 | ||||
Net assets | $572,738,856 | ||||
Shares of beneficial interest outstanding | 34,604,327 |
| Net assets | Shares outstanding | Net asset value per share | ||||
Initial Class | $527,657,830 | 31,871,517 | $16.56 | |||
Service Class | 45,081,026 | 2,732,810 | 16.50 |
See Notes to Financial Statements
7
Table of Contents
MFS Investors Trust Series
FINANCIAL STATEMENTS | STATEMENT OF OPERATIONS (unaudited)
This statement describes how much your fund earned in investment income and accrued in expenses. It also describes any gains and/or losses generated by fund operations.
| Six months ended 6/30/10 | ||||||
| Net investment income | ||||||
Income | ||||||
Dividends | $5,504,414 | |||||
Dividends from underlying funds | 3,407 | |||||
Foreign taxes withheld | (116,357 | ) | ||||
Total investment income | $5,391,464 | |||||
Expenses | ||||||
Management fee | $2,431,515 | |||||
Distribution and/or service fees | 59,095 | |||||
Shareholder servicing costs | 39,244 | |||||
Administrative services fee | 51,331 | |||||
Independent Trustees’ compensation | 10,869 | |||||
Custodian fee | 59,546 | |||||
Shareholder communications | 90,367 | |||||
Auditing fees | 23,637 | |||||
Legal fees | 7,209 | |||||
Miscellaneous | 19,013 | |||||
Total expenses | $2,791,826 | |||||
Reduction of expenses by investment adviser | (2,140 | ) | ||||
Net expenses | $2,789,686 | |||||
Net investment income | $2,601,778 | |||||
Realized and unrealized gain (loss) on investments and foreign currency transactions | ||||||
Realized gain (loss) (identified cost basis) | ||||||
Investment transactions | $9,843,990 | |||||
Foreign currency transactions | (14,952 | ) | ||||
Net realized gain (loss) on investments and foreign currency transactions | $9,829,038 | |||||
Change in unrealized appreciation (depreciation) | ||||||
Investments | $(63,236,025 | ) | ||||
Translation of assets and liabilities in foreign currencies | (8,954 | ) | ||||
Net unrealized gain (loss) on investments and foreign currency translation | $(63,244,979 | ) | ||||
Net realized and unrealized gain (loss) on investments and foreign currency | $(53,415,941 | ) | ||||
Change in net assets from operations | $(50,814,163 | ) |
See Notes to Financial Statements
8
Table of Contents
MFS Investors Trust Series
FINANCIAL STATEMENTS | STATEMENTS OF CHANGES IN NET ASSETS
These statements describe the increases and/or decreases in net assets resulting from operations, any distributions, and any shareholder transactions.
| Six months ended 6/30/10 (unaudited | ) | Year ended 12/31/09 | | |||
Change in net assets | ||||||
From operations | ||||||
Net investment income | $2,601,778 | $7,566,233 | ||||
Net realized gain (loss) on investments and foreign currency transactions | 9,829,038 | (51,680,300 | ) | |||
Net unrealized gain (loss) on investments and foreign currency translation | (63,244,979 | ) | 192,610,608 | |||
Change in net assets from operations | $(50,814,163 | ) | $148,496,541 | |||
Distributions declared to shareholders | ||||||
From net investment income | $(7,580,322 | ) | $(10,168,612 | ) | ||
Change in net assets from fund share transactions | $(51,941,799 | ) | $(53,868,601 | ) | ||
Total change in net assets | $(110,336,284 | ) | $84,459,328 | |||
Net assets | ||||||
At beginning of period | 683,075,140 | 598,615,812 | ||||
At end of period (including undistributed net investment income of $2,600,102 and | $572,738,856 | $683,075,140 |
See Notes to Financial Statements
9
Table of Contents
MFS Investors Trust Series
FINANCIAL STATEMENTS | FINANCIAL HIGHLIGHTS
The financial highlights table is intended to help you understand the fund’s financial performance for the semiannual period and the past 5 fiscal years. Certain information reflects financial results for a single fund share. The total returns in the table represent the rate by which an investor would have earned (or lost) on an investment in the fund share class (assuming reinvestment of all distributions) held for the entire period.
| Initial Class | Six months ended 6/30/10 | Years ended 12/31 | ||||||||||||||||
| 2009 | 2008 | 2007 | 2006 | 2005 | ||||||||||||||
| (unaudited) | ||||||||||||||||||
Net asset value, beginning of period | $18.24 | $14.64 | $23.52 | $21.69 | $19.29 | $18.08 | ||||||||||||
| Income (loss) from investment operations | ||||||||||||||||||
Net investment income (d) | $0.07 | $0.19 | $0.24 | $0.17 | $0.19 | $0.10 | ||||||||||||
Net realized and unrealized gain (loss) on investments and foreign currency | (1.53 | ) | 3.67 | (7.54 | ) | 2.04 | 2.31 | 1.21 | ||||||||||
Total from investment operations | $(1.46 | ) | $3.86 | $(7.30 | ) | $2.21 | $2.50 | $1.31 | ||||||||||
| Less distributions declared to shareholders | ||||||||||||||||||
From net investment income | $(0.22 | ) | $(0.26 | ) | $(0.17 | ) | $(0.19 | ) | $(0.10 | ) | $(0.10 | ) | ||||||
From net realized gain on investments | — | — | (1.41 | ) | (0.19 | ) | — | — | ||||||||||
Total distributions declared to shareholders | $(0.22 | ) | $(0.26 | ) | $(1.58 | ) | $(0.38 | ) | $(0.10 | ) | $(0.10 | ) | ||||||
Net asset value, end of period | $16.56 | $18.24 | $14.64 | $23.52 | $21.69 | $19.29 | ||||||||||||
Total return (%) (k)(r)(s) | (8.20 | )(n) | 26.90 | (33.08 | ) | 10.31 | 12.99 | 7.31 | ||||||||||
| Ratios (%) (to average net assets) and Supplemental data: | ||||||||||||||||||
Expenses before expense reductions (f) | 0.84 | (a) | 0.86 | 0.84 | 0.85 | 0.86 | 0.88 | |||||||||||
Expenses after expense reductions (f) | 0.84 | (a) | 0.86 | 0.84 | 0.85 | 0.86 | 0.88 | |||||||||||
Net investment income | 0.82 | (a) | 1.25 | 1.25 | 0.74 | 0.93 | 0.55 | |||||||||||
Portfolio turnover | 12 | 34 | 29 | 37 | 46 | 55 | ||||||||||||
Net assets at end of period (000 omitted) | $527,658 | $636,809 | $560,356 | $917,158 | $820,583 | $722,738 | ||||||||||||
See Notes to Financial Statements
10
Table of Contents
MFS Investors Trust Series
Financial Highlights – continued
| Service Class | Six months ended 6/30/10 | Years ended 12/31 | ||||||||||||||||
| 2009 | 2008 | 2007 | 2006 | 2005 | ||||||||||||||
| (unaudited) | ||||||||||||||||||
Net asset value, beginning of period | $18.16 | $14.56 | $23.39 | $21.57 | $19.19 | $17.99 | ||||||||||||
| Income (loss) from investment operations | ||||||||||||||||||
Net investment income (d) | $0.05 | $0.15 | $0.19 | $0.11 | $0.14 | $0.06 | ||||||||||||
Net realized and unrealized gain (loss) on investments and foreign currency | (1.53 | ) | 3.65 | (7.51 | ) | 2.03 | 2.29 | 1.20 | ||||||||||
Total from investment operations | $(1.48 | ) | $3.80 | $(7.32 | ) | $2.14 | $2.43 | $1.26 | ||||||||||
| Less distributions declared to shareholders | ||||||||||||||||||
From net investment income | $(0.18 | ) | $(0.20 | ) | $(0.10 | ) | $(0.13 | ) | $(0.05 | ) | $(0.06 | ) | ||||||
From net realized gain on investments | — | — | (1.41 | ) | (0.19 | ) | — | — | ||||||||||
Total distributions declared to shareholders | $(0.18 | ) | $(0.20 | ) | $(1.51 | ) | $(0.32 | ) | $(0.05 | ) | $(0.06 | ) | ||||||
Net asset value, end of period | $16.50 | $18.16 | $14.56 | $23.39 | $21.57 | $19.19 | ||||||||||||
Total return (%) (k)(r)(s) | (8.30 | )(n) | 26.56 | (33.25 | ) | 10.03 | 12.69 | 7.02 | ||||||||||
| Ratios (%) (to average net assets) and Supplemental data: | ||||||||||||||||||
Expenses before expense reductions (f) | 1.09 | (a) | 1.11 | 1.09 | 1.11 | 1.11 | 1.13 | |||||||||||
Expenses after expense reductions (f) | 1.09 | (a) | 1.11 | 1.09 | 1.11 | 1.11 | 1.13 | |||||||||||
Net investment income | 0.57 | (a) | 0.99 | 1.00 | 0.49 | 0.69 | 0.31 | |||||||||||
Portfolio turnover | 12 | 34 | 29 | 37 | 46 | 55 | ||||||||||||
Net assets at end of period (000 omitted) | $45,081 | $46,267 | $38,259 | $65,180 | $79,976 | $79,688 | ||||||||||||
| (a) | Annualized. |
| (d) | Per share data is based on average shares outstanding. |
| (f) | Ratios do not reflect reductions from fees paid indirectly, if applicable. |
| (k) | The total return does not reflect expenses that apply to separate accounts. Inclusion of these charges would reduce the total return figures for all periods shown. |
| (n) | Not annualized. |
| (r) | Certain expenses have been reduced without which performance would have been lower. |
| (s) | From time to time the fund may receive proceeds from litigation settlements, without which performance would be lower. |
See Notes to Financial Statements
11
Table of Contents
MFS Investors Trust Series
NOTES TO FINANCIAL STATEMENTS (unaudited)
| (1) | Business and Organization |
MFS Investors Trust Series (the fund) is a series of MFS Variable Insurance Trust (the trust). The trust is organized as a Massachusetts business trust and is registered under the Investment Company Act of 1940, as amended, as an open-end management investment company. The shareholders of each series of the trust are separate accounts of insurance companies, which offer variable annuity and/or life insurance products, and qualified retirement and pension plans.
| (2) | Significant Accounting Policies |
General – The preparation of financial statements in conformity with U.S. generally accepted accounting principles requires management to make estimates and assumptions that affect the reported amounts of assets and liabilities, and disclosure of contingent assets and liabilities at the date of the financial statements and the reported amounts of revenues and expenses during the reporting period. Actual results could differ from those estimates. In the preparation of these financial statements, management has evaluated subsequent events occurring after the date of the fund’s Statement of Assets and Liabilities through the date that the financial statements were issued. The fund can invest in foreign securities, including securities of emerging market issuers. Investments in foreign securities are vulnerable to the effects of changes in the relative values of the local currency and the U.S. dollar and to the effects of changes in each country’s legal, political, and economic environment. The markets of emerging markets countries are generally more volatile than the markets of developed countries with more mature economies. All of the risks of investing in foreign securities previously described are heightened when investing in emerging markets countries.
Investment Valuations – Equity securities, including restricted equity securities, are generally valued at the last sale or official closing price as provided by a third-party pricing service on the market or exchange on which they are primarily traded. Equity securities, for which there were no sales reported that day, are generally valued at the last quoted daily bid quotation as provided by a third-party pricing service on the market or exchange on which such securities are primarily traded. Equity securities held short, for which there were no sales reported for that day, are generally valued at the last quoted daily ask quotation as provided by a third-party pricing service on the market or exchange on which such securities are primarily traded. Short-term instruments with a maturity at issuance of 60 days or less generally are valued at amortized cost, which approximates market value. Open-end investment companies are generally valued at net asset value per share. Securities and other assets generally valued on the basis of information from a third-party pricing service may also be valued at a broker/dealer bid quotation. Values obtained from third-party pricing services can utilize both transaction data and market information such as yield, quality, coupon rate, maturity, type of issue, trading characteristics, and other market data. The values of foreign securities and other assets and liabilities expressed in foreign currencies are converted to U.S. dollars using the mean of bid and asked prices for rates provided by a third-party pricing service.
The Board of Trustees has delegated primary responsibility for determining or causing to be determined the value of the fund’s investments (including any fair valuation) to the adviser pursuant to valuation policies and procedures approved by the Board. If the adviser determines that reliable market quotations are not readily available, investments are valued at fair value as determined in good faith by the adviser in accordance with such procedures under the oversight of the Board of Trustees. Under the fund’s valuation policies and procedures, market quotations are not considered to be readily available for most types of debt instruments and floating rate loans and many types of derivatives. These investments are generally valued at fair value based on information from third-party pricing services. In addition, investments may be valued at fair value if the adviser determines that an investment’s value has been materially affected by events occurring after the close of the exchange or market on which the investment is principally traded (such as foreign exchange or market) and prior to the determination of the fund’s net asset value, or after the halting of trading of a specific security where trading does not resume prior to the close of the exchange or market on which the security is principally traded. Events that occur on a frequent basis after foreign markets close (such as developments in foreign markets and significant movements in the U.S. markets) and prior to the determination of the fund’s net asset value may be deemed to have a material effect on the value of securities traded in foreign markets. Accordingly, the fund’s foreign equity securities may often be valued at fair value. The adviser generally relies on third-party pricing services or other information (such as the correlation with price movements of similar securities in the same or other markets; the type, cost and investment characteristics of the security; the business and financial condition of the issuer; and trading and other market data) to assist in determining whether to fair value and at what value to fair value an investment. The value of an investment for purposes of calculating the fund’s net asset value can differ depending on the source and method used to determine value. When fair valuation is used, the value of an investment used to determine the fund’s net asset value may differ from quoted or published prices for the same investment. There can be no assurance that the fund could obtain the fair value assigned to an investment if it were to sell the investment at the same time at which the fund determines its net asset value per share.
12
Table of Contents
MFS Investors Trust Series
Notes to Financial Statements (unaudited) – continued
Various inputs are used in determining the value of the fund’s assets or liabilities. These inputs are categorized into three broad levels. In certain cases, the inputs used to measure fair value may fall into different levels of the fair value hierarchy. In such cases, an investment’s level within the fair value hierarchy is based on the lowest level of input that is significant to the fair value measurement. The fund’s assessment of the significance of a particular input to the fair value measurement in its entirety requires judgment, and considers factors specific to the investment. Level 1 includes unadjusted quoted prices in active markets for identical assets or liabilities. Level 2 includes other significant observable market-based inputs (including quoted prices for similar securities, interest rates, prepayment speed, and credit risk). Level 3 includes unobservable inputs, which may include the adviser’s own assumptions in determining the fair value of investments. Other financial instruments are derivative instruments not reflected in total investments, such as futures, forwards, swap contracts, and written options. The following is a summary of the levels used as of June 30, 2010 in valuing the fund’s assets or liabilities:
| Investments at Value | Level 1 | Level 2 | Level 3 | Total | ||||
| Equity Securities: | ||||||||
United States | $520,095,646 | $— | $— | $520,095,646 | ||||
United Kingdom | — | 14,133,016 | — | 14,133,016 | ||||
Germany | — | 10,859,011 | — | 10,859,011 | ||||
Switzerland | — | 9,253,607 | — | 9,253,607 | ||||
Israel | 7,025,408 | — | — | 7,025,408 | ||||
Netherlands | — | 5,466,532 | — | 5,466,532 | ||||
South Korea | — | 3,000,822 | — | 3,000,822 | ||||
| Mutual Funds | 2,854,611 | — | — | 2,854,611 | ||||
| Total Investments | $529,975,665 | $42,712,988 | $— | $572,688,653 |
For further information regarding security characteristics, see the Portfolio of Investments.
Foreign Currency Translation – Purchases and sales of foreign investments, income, and expenses are converted into U.S. dollars based upon currency exchange rates prevailing on the respective dates of such transactions or on the reporting date for foreign denominated receivables and payables. Gains and losses attributable to foreign currency exchange rates on sales of securities are recorded for financial statement purposes as net realized gains and losses on investments. Gains and losses attributable to foreign exchange rate movements on receivables, payables, income and expenses are recorded for financial statement purposes as foreign currency transaction gains and losses. That portion of both realized and unrealized gains and losses on investments that results from fluctuations in foreign currency exchange rates is not separately disclosed.
Derivatives – The fund may use derivatives for different purposes, including to earn income and enhance returns, to increase or decrease exposure to a particular market, to manage or adjust the risk profile of the fund, or as alternatives to direct investments. Derivatives may be used for hedging or non-hedging purposes. While hedging can reduce or eliminate losses, it can also reduce or eliminate gains. When the fund uses derivatives as an investment to increase market exposure, or for hedging purposes, gains and losses from derivative instruments may be substantially greater than the derivative’s original cost.
Derivative instruments include written options, purchased options, futures contracts, forward foreign currency exchange contracts, and swap agreements. For the six months ended June 30, 2010, the fund did not invest in any derivative instruments.
Short Sales – The fund may enter into short sales whereby it sells a security it does not own in anticipation of a decline in the value of that security. The fund will realize a gain if the security price decreases and a loss if the security price increases between the date of the short sale and the date on which the fund replaces the borrowed security. Losses from short sales can exceed the proceeds of the security sold; and they can also exceed the potential loss from an ordinary buy and sell transaction. The amount of any premium, dividends, or interest the fund may be required to pay in connection with a short sale will be recognized as a fund expense. The fund segregates cash or marketable securities in an amount that, when combined with the amount of proceeds from the short sale deposited with the broker, at least equals the current market value of the security sold short. At June 30, 2010, the fund has yet to enter into such transactions.
Indemnifications – Under the fund’s organizational documents, its officers and Trustees may be indemnified against certain liabilities and expenses arising out of the performance of their duties to the fund. Additionally, in the normal course of business, the fund enters into agreements with service providers that may contain indemnification clauses. The fund’s maximum exposure under these agreements is unknown as this would involve future claims that may be made against the fund that have not yet occurred.
Investment Transactions and Income – Investment transactions are recorded on the trade date. Interest income is recorded on the accrual basis. All premium and discount is amortized or accreted for financial statement purposes in accordance with U.S. generally accepted accounting principles. Dividends received in cash are recorded on the ex-dividend date. Certain dividends
13
Table of Contents
MFS Investors Trust Series
Notes to Financial Statements (unaudited) – continued
from foreign securities will be recorded when the fund is informed of the dividend if such information is obtained subsequent to the ex-dividend date. Dividend and interest payments received in additional securities are recorded on the ex-dividend or ex-interest date in an amount equal to the value of the security on such date.
The fund may receive proceeds from litigation settlements. Any proceeds received from litigation involving portfolio holdings are reflected in the Statement of Operations in realized gain/loss if the security has been disposed of by the fund or in unrealized gain/loss if the security is still held by the fund. Any other proceeds from litigation not related to portfolio holdings are reflected as other income in the Statement of Operations.
Fees Paid Indirectly – The fund’s custody fee may be reduced according to an arrangement that measures the value of cash deposited with the custodian by the fund. For the six months ended June 30, 2010, custody fees were not reduced.
Tax Matters and Distributions – The fund intends to qualify as a regulated investment company, as defined under Subchapter M of the Internal Revenue Code, and to distribute all of its taxable income, including realized capital gains. As a result, no provision for federal income tax is required. The fund’s federal tax returns for the prior three fiscal years remain subject to examination by the Internal Revenue Service. Foreign taxes, if any, have been accrued by the fund in the accompanying financial statements.
Distributions to shareholders are recorded on the ex-dividend date. Income and capital gain distributions are determined in accordance with income tax regulations, which may differ from U.S. generally accepted accounting principles. Certain capital accounts in the financial statements are periodically adjusted for permanent differences in order to reflect their tax character. These adjustments have no impact on net assets or net asset value per share. Temporary differences which arise from recognizing certain items of income, expense, gain or loss in different periods for financial statement and tax purposes will reverse at some time in the future. Distributions in excess of net investment income or net realized gains are temporary overdistributions for financial statement purposes resulting from differences in the recognition or classification of income or distributions for financial statement and tax purposes.
Book/tax differences primarily relate to wash sale loss deferrals.
The tax character of distributions made during the current period, if any, will be determined at fiscal year end. The tax character of distributions declared to shareholders for the last fiscal year is as follows:
| 12/31/09 | ||
| Ordinary income (including any short-term capital gains) | $10,168,612 |
The federal tax cost and the tax basis components of distributable earnings were as follows:
| As of 6/30/10 | |||
| Cost of investments | $593,110,903 | ||
| Gross appreciation | 38,415,235 | ||
| Gross depreciation | (58,837,485 | ) | |
| Net unrealized appreciation (depreciation) | $(20,422,250 | ) | |
| As of 12/31/09 | |||
| Undistributed ordinary income | 7,578,646 | ||
| Capital loss carryforwards | (89,786,912 | ) | |
| Other temporary differences | 15,191 | ||
| Net unrealized appreciation (depreciation) | 42,813,775 |
The aggregate cost above includes prior fiscal year end tax adjustments, if applicable.
As of December 31, 2009, the fund had capital loss carryforwards available to offset future realized gains. Such losses expire as follows:
| 12/31/16 | $(36,298,226 | ) | |
| 12/31/17 | (53,488,686 | ) | |
| $(89,786,912 | ) |
Multiple Classes of Shares of Beneficial Interest – The fund offers multiple classes of shares, which differ in their respective distribution and/or service fees. The fund’s income, realized and unrealized gain (loss), and common expenses are allocated to shareholders based on the daily net assets of each class. Dividends are declared separately for each class. Differences in per
14
Table of Contents
MFS Investors Trust Series
Notes to Financial Statements (unaudited) – continued
share dividend rates are generally due to differences in separate class expenses. The fund’s distributions declared to shareholders as reported on the Statements of Changes in Net Assets are presented by class as follows:
| From net investment income | ||||
| Six months ended 6/30/10 | Year ended 12/31/09 | |||
| Initial Class | $7,105,436 | $9,661,594 | ||
| Service Class | 474,886 | 507,018 | ||
| Total | $7,580,322 | $10,168,612 | ||
| (3) | Transactions with Affiliates |
Investment Adviser – The fund has an investment advisory agreement with MFS to provide overall investment management and related administrative services and facilities to the fund. The management fee is computed daily and paid monthly at the following annual rates:
| First $1 billion of average daily net assets | 0.75% | |
| Average daily net assets in excess of $1 billion | 0.65% |
The management fee incurred for the six months ended June 30, 2010 was equivalent to an annual effective rate of 0.75% of the fund’s average daily net assets.
Effective May 1, 2011, the investment adviser has agreed in writing to reduce its management fee to 0.60% of average daily net assets in excess of $2.5 billion. This written agreement will continue until modified by the fund’s Board of Trustees, but such agreement will continue at least until April 30, 2012.
Distributor – MFS Fund Distributors, Inc. (MFD), a wholly-owned subsidiary of MFS, is the distributor of shares of the fund. The Trustees have adopted a distribution plan for the Service Class shares pursuant to Rule 12b-1 under the Investment Company Act of 1940.
The fund’s distribution plan provides that the fund will pay MFD distribution and/or service fees equal to 0.25% per annum of its average daily net assets attributable to Service Class shares as partial consideration for services performed and expenses incurred by MFD and financial intermediaries (including participating insurance companies that invest in the fund to fund variable annuity and variable life insurance contracts, sponsors of qualified retirement and pension plans that invest in the fund, and affiliates of these participating insurance companies and plan sponsors) in connection with the sale and distribution of the Service Class shares. MFD may subsequently pay all, or a portion, of the distribution and/or service fees to financial intermediaries.
Shareholder Servicing Agent – MFS Service Center, Inc. (MFSC), a wholly-owned subsidiary of MFS, receives a fee from the fund for its services as shareholder servicing agent. For the six months ended June 30, 2010, the fee was $38,804, which equated to 0.0120% annually of the fund’s average daily net assets. MFSC also receives payment from the fund for out-of-pocket expenses paid by MFSC on behalf of the fund. For the six months ended June 30, 2010, these costs amounted to $440.
Administrator – MFS provides certain financial, legal, shareholder communications, compliance, and other administrative services to the fund. Under an administrative services agreement, the fund partially reimburses MFS the costs incurred to provide these services. The fund is charged an annual fixed amount of $17,500 plus a fee based on average daily net assets. The administrative services fee incurred for the six months ended June 30, 2010 was equivalent to an annual effective rate of 0.0158% of the fund’s average daily net assets.
Trustees’ and Officers’ Compensation – The fund pays compensation to independent Trustees in the form of a retainer, attendance fees, and additional compensation to Board and Committee chairpersons. The fund does not pay compensation directly to Trustees or officers of the fund who are also officers of the investment adviser, all of whom receive remuneration for their services to the fund from MFS. Certain officers and Trustees of the fund are officers or directors of MFS, MFD, and MFSC.
Other – This fund and certain other funds managed by MFS (the funds) have entered into services agreements (the Agreements) which provide for payment of fees by the funds to Tarantino LLC and Griffin Compliance LLC in return for the provision of services of an Independent Chief Compliance Officer (ICCO) and Assistant ICCO, respectively, for the funds. The ICCO and Assistant ICCO are officers of the funds and the sole members of Tarantino LLC and Griffin Compliance LLC, respectively. The funds can terminate the Agreements with Tarantino LLC and Griffin Compliance LLC at any time under the terms of the Agreements. For the six months ended June 30, 2010, the aggregate fees paid by the fund to Tarantino LLC and Griffin Compliance LLC were $2,673 and are included in miscellaneous expense on the Statement of Operations. MFS has
15
Table of Contents
MFS Investors Trust Series
Notes to Financial Statements (unaudited) – continued
agreed to reimburse the fund for a portion of the payments made by the fund in the amount of $2,140, which is shown as a reduction of total expenses in the Statement of Operations. Additionally, MFS has agreed to bear all expenses associated with office space, other administrative support, and supplies provided to the ICCO and Assistant ICCO.
The fund may invest in the MFS Institutional Money Market Portfolio which is managed by MFS and seeks a high level of current income consistent with preservation of capital and liquidity. Income earned on this investment is included in dividends from underlying funds on the Statement of Operations. This money market fund does not pay a management fee to MFS.
| (4) | Portfolio Securities |
Purchases and sales of investments, other than U.S. Government securities, purchased option transactions, and short-term obligations, aggregated $75,136,350 and $126,591,996, respectively.
| (5) | Shares of Beneficial Interest |
The fund’s Declaration of Trust permits the Trustees to issue an unlimited number of full and fractional shares of beneficial interest. Transactions in fund shares were as follows:
| Six months ended 6/30/10 | Year ended 12/31/09 | |||||||||||
| Shares | Amount | Shares | Amount | |||||||||
| Shares sold | ||||||||||||
Initial Class | 312,879 | $5,745,440 | 2,161,981 | $31,861,759 | ||||||||
Service Class | 429,615 | 7,794,428 | 500,518 | 7,935,187 | ||||||||
| 742,494 | $13,539,868 | 2,662,499 | $39,796,946 | |||||||||
| Shares issued to shareholders in reinvestment of distributions | ||||||||||||
Initial Class | 364,756 | $7,105,436 | 696,582 | $9,661,594 | ||||||||
Service Class | 24,453 | 474,886 | 36,634 | 507,018 | ||||||||
| 389,209 | $7,580,322 | 733,216 | $10,168,612 | |||||||||
| Shares reacquired | ||||||||||||
Initial Class | (3,720,136 | ) | $(68,186,514 | ) | (6,229,980 | ) | $(94,499,704 | ) | ||||
Service Class | (268,618 | ) | (4,875,475 | ) | (618,189 | ) | (9,334,455 | ) | ||||
| (3,988,754 | ) | $(73,061,989 | ) | (6,848,169 | ) | $(103,834,159 | ) | |||||
| Net change | ||||||||||||
Initial Class | (3,042,501 | ) | $(55,335,638 | ) | (3,371,417 | ) | $(52,976,351 | ) | ||||
Service Class | 185,450 | 3,393,839 | (81,037 | ) | (892,250 | ) | ||||||
| (2,857,051 | ) | $(51,941,799 | ) | (3,452,454 | ) | $(53,868,601 | ) | |||||
| (6) | Line of Credit |
The fund and certain other funds managed by MFS participate in a $1.1 billion unsecured committed line of credit, subject to a $1 billion sublimit, provided by a syndication of banks under a credit agreement. Borrowings may be made for temporary financing needs. Interest is charged to each fund, based on its borrowings, generally at a rate equal to the higher of the Federal Reserve funds rate or one month LIBOR plus an agreed upon spread. A commitment fee, based on the average daily, unused portion of the committed line of credit, is allocated among the participating funds at the end of each calendar quarter. In addition, the fund and other funds managed by MFS have established unsecured uncommitted borrowing arrangements with certain banks for temporary financing needs. Interest is charged to each fund, based on its borrowings, at a rate equal to the Federal Reserve funds rate plus an agreed upon spread. For the six months ended June 30, 2010, the fund’s commitment fee and interest expense were $5,032 and $0, respectively, and are included in miscellaneous expense on the Statement of Operations.
| (7) | Transactions in Underlying Funds – Affiliated Issuers |
An affiliated issuer may be considered one in which the fund owns 5% or more of the outstanding voting securities, or a company which is under common control. For the purposes of this report, the fund assumes the following to be affiliated issuers:
| Underlying Funds | Beginning Shares/Par Amount | Acquisitions Shares/Par Amount | Dispositions Shares/Par Amount | Ending Shares/Par Amount | |||||
| MFS Institutional Money Market Portfolio | 799,317 | 67,440,460 | (65,385,166 | ) | 2,854,611 | ||||
| Underlying Funds | Realized Gain (Loss) | Capital Gain Distributions | Dividend Income | Ending Value | |||||
| MFS Institutional Money Market Portfolio | $— | $— | $3,407 | $2,854,611 | |||||
16
Table of Contents
MFS Investors Trust Series
RESULTS OF SHAREHOLDER MEETING (unaudited)
At a special meeting of shareholders of MFS Variable Insurance Trust, which was held on January 28, 2010, the following actions were taken:
Item 1. To elect the following individuals as Trustees:
| Number of Dollars | ||||
| Nominee | For | Withheld Authority | ||
| Robert E. Butler | 6,823,651,821.26 | 1,818,252,669.55 | ||
| Lawrence H. Cohn, M.D. | 6,813,621,200.14 | 1,828,283,290.67 | ||
| Maureen R. Goldfarb | 6,825,332,620.76 | 1,816,571,870.05 | ||
| David H. Gunning | 6,823,081,841.37 | 1,818,822,649.44 | ||
| William R. Gutow | 6,813,678,877.22 | 1,828,225,613.59 | ||
| Michael Hegarty | 6,827,456,515.87 | 1,814,447,974.94 | ||
| John P. Kavanaugh | 6,830,363,113.12 | 1,811,541,377.69 | ||
| Robert J. Manning | 6,825,511,264.17 | 1,816,393,226.64 | ||
| Robert C. Pozen | 6,824,854,120.27 | 1,817,050,370.54 | ||
| J. Dale Sherratt | 6,816,913,203.87 | 1,824,991,286.94 | ||
| Laurie J. Thomsen | 6,823,590,745.56 | 1,818,313,745.25 | ||
| Robert W. Uek | 6,818,161,803.66 | 1,823,742,687.15 | ||
17
Table of Contents
MFS Investors Trust Series
BOARD REVIEW OF INVESTMENT ADVISORY AGREEMENT
A discussion regarding the Board’s most recent review and renewal of the fund’s Investment Advisory Agreement with MFS will be available on or about November 1, 2010 by clicking on the fund’s name under ‘‘Variable Insurance Portfolios — VIT’’ in the ‘‘Products and Performance’’ section of the MFS Web site (mfs.com).
PROXY VOTING POLICIES AND INFORMATION
A general description of the MFS funds’ proxy voting policies and procedures is available without charge, upon request, by calling
1-800-225-2606, by visiting the Proxy Voting section of mfs.com or by visiting the SEC’s Web site at http://www.sec.gov.
Information regarding how the fund voted proxies relating to portfolio securities during the most recent twelve-month period ended June 30 is available without charge by visiting the Proxy Voting section of mfs.com or by visiting the SEC’s Web site at http://www.sec.gov.
QUARTERLY PORTFOLIO DISCLOSURE
The fund will file a complete schedule of portfolio holdings with the Securities and Exchange Commission (the Commission) for the first and third quarters of each fiscal year on Form N-Q. The fund’s Form N-Q may be reviewed and copied at the:
Public Reference Room
Securities and Exchange Commission
100 F Street, NE, Room 1580
Washington, D.C. 20549
Information on the operation of the Public Reference Room may be obtained by calling the Commission at 1-800-SEC-0330. The fund’s Form N-Q is available on the EDGAR database on the Commission’s Internet Web site at http://www.sec.gov, and copies of this information may be obtained, upon payment of a duplicating fee, by electronic request at the following e-mail address: publicinfo@sec.gov or by writing the Public Reference Section at the above address.
From time to time, MFS may post important information about the fund or the MFS funds on the MFS web site (mfs.com). This information is available by visiting the “News & Commentary” section of mfs.com or by clicking on the fund’s name under “Variable Insurance Portfolios — VIT” in the “Products and Performance” section of mfs.com.
18
Table of Contents

Table of Contents

Table of Contents
This report is prepared for the general information of contract owners. It is authorized for distribution to prospective investors only when preceded or accompanied by a current prospectus.
NOT FDIC INSURED Ÿ MAY LOSE VALUE Ÿ NO BANK GUARANTEE Ÿ NOT A DEPOSIT Ÿ NOT INSURED BY ANY FEDERAL GOVERNMENT AGENCY OR NCUA/NCUSIF
Table of Contents
MFS Value Series

Dear Contract Owners:
After having suffered their biggest declines since the Great Depression, most global markets experienced an impressive resurgence during the latter months of 2009 and the first quarter of 2010. The global economy was able to reap the benefits of two major trends. The first of these was the massive efforts of governments and central banks to increase liquidity in the financial system as they sought to prevent the credit crisis from further affecting the banking system. The second was the move by companies around the world to cut costs and operations to prepare for rapidly changing market conditions. We believe that these moves not only shortened the length of the downturn but also set the stage for recovery.
Even with the significant market gains of 2009 and the early part of 2010, the recovery is unrolling at a moderate pace, with rebounds in the manufacturing sector and corporate America leading the way. Central bankers are proceeding with caution and many have held benchmark interest rates unchanged as they debate the best way to withdraw stimulus measures without disrupting the fragile growth process. Complicating that debate late in the period was the emergence of the European debt crisis and worries about whether this crisis could derail the global recovery. As that crisis unrolled with no clear resolution, risk aversion rose along with volatility. Weakening economic data late in the period added uncertainty to the mix and sparked a retrenchment in global equity markets.
While hurdles remain, we believe that the global economy is proceeding on the road to recovery. As always, we continue to be mindful of the many challenges faced at the individual, national, and international levels. It is at times such as these that we want to remind investors of the merits of maintaining a long-term view, adhering to basic investing principles such as asset allocation and diversification, and working closely with advisors to identify and research investment opportunities. At MFS®, we take particular pride in how well mutual funds can provide a broad range of products that can fit investor needs in any type of market climate.
Respectfully,

Robert J. Manning
Chairman and Chief Executive Officer
MFS Investment Management®
August 16, 2010
The opinions expressed in this letter are subject to change, may not be relied upon for investment advice, and no forecasts can be guaranteed.
MFS Fund Distributors, Inc., 500 Boylston Street, Boston, MA 02116
1
Table of Contents
MFS Value Series
Portfolio structure
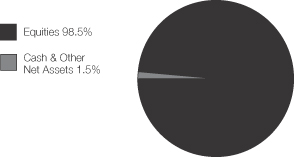
| Top ten holdings | ||
| Lockheed Martin Corp. | 4.2% | |
| AT&T, Inc. | 3.3% | |
| Goldman Sachs Group, Inc. | 3.0% | |
| Philip Morris International, Inc. | 3.0% | |
| Johnson & Johnson | 3.0% | |
| Bank of New York Mellon Corp. | 2.7% | |
| MetLife, Inc. | 2.6% | |
| JPMorgan Chase & Co. | 2.5% | |
| United Technologies Corp. | 2.2% | |
| Chevron Corp. | 2.1% |
| Equity sectors | ||
| Financial Services | 21.6% | |
| Energy | 11.7% | |
| Health Care | 11.6% | |
| Industrial Goods & Services | 10.5% | |
| Consumer Staples | 10.5% | |
| Utilities & Communications | 9.5% | |
| Technology | 5.8% | |
| Retailing | 4.0% | |
| Special Products & Services | 3.9% | |
| Leisure | 3.4% | |
| Basic Materials | 3.2% | |
| Autos & Housing | 2.3% | |
| Transportation | 0.5% |
Percentages are based on net assets as of 6/30/10.
The portfolio is actively managed and current holdings may be different.
2
Table of Contents
MFS Value Series
After having suffered through one of the largest and most concentrated downturns since the 1930s, most asset markets staged a remarkable rebound during 2009 and early 2010. This recovery in global activity has been led importantly by emerging Asian economies, but broadening to include most of the global economy to varying degrees. Primary drivers of the recovery included an unwinding of the inventory destocking that took place earlier, the production of manufacturing and capital goods, as well as massive fiscal and monetary stimulus.
Late in the period, though, heightened risk surrounding the public-debt profiles of several of the peripheral European countries impaired market sentiment. At the same time, the improving trend in global macroeconomic data began to weaken somewhat. These two dynamics caused most asset prices to retrench significantly, as many questioned the durability of the global recovery.
3
Table of Contents
MFS Value Series
Fund Expenses Borne by the Contract Holders During the Period,
January 1, 2010 through June 30, 2010
As a contract holder of the fund, you incur ongoing costs, including management fees; distribution and/or service (12b-1) fees; and other fund expenses. This example is intended to help you understand your ongoing costs (in dollars) of investing in the fund and to compare these costs with the ongoing costs of investing in other mutual funds.
The example is based on an investment of $1,000 invested at the beginning of the period and held for the entire period January 1, 2010 through June 30, 2010.
Actual Expenses
The first line for each share class in the following table provides information about actual account values and actual expenses. You may use the information in this line, together with the amount you invested, to estimate the expenses that you paid over the period. Simply divide your account value by $1,000 (for example, an $8,600 account value divided by $1,000 = 8.6), then multiply the result by the number in the first line under the heading entitled “Expenses Paid During Period” to estimate the expenses you paid on your account during this period.
Hypothetical Example for Comparison Purposes
The second line for each share class in the following table provides information about hypothetical account values and hypothetical expenses based on the fund’s actual expense ratio and an assumed rate of return of 5% per year before expenses, which is not the fund’s actual return. The hypothetical account values and expenses may not be used to estimate the actual ending account balance or expenses you paid for the period. You may use this information to compare the ongoing costs of investing in the fund and other funds. To do so, compare this 5% hypothetical example with the 5% hypothetical examples that appear in the shareholder reports of the other funds.
Please note that the expenses shown in the table are meant to highlight the fund’s ongoing costs only and do not take into account the fees and expenses imposed under the variable contracts through which your investment in the fund is made. Therefore, the second line for each share class in the table is useful in comparing ongoing costs associated with an investment in vehicles (such as the fund) which fund benefits under variable annuity and variable life insurance contracts and to qualified pension and retirement plans only, and will not help you determine the relative total costs of investing in the fund through variable annuity and variable life insurance contracts. If the fees and expenses imposed under the variable contracts were included, your costs would have been higher.
| Share Class | Annualized Expense Ratio | Beginning Account Value 1/01/10 | Ending Account Value 6/30/10 | Expenses Paid During Period (p) 1/01/10-6/30/10 | ||||||
| Initial Class | Actual | 0.82% | $1,000.00 | $928.01 | $3.92 | |||||
| Hypothetical (h) | 0.82% | $1,000.00 | $1,020.73 | $4.11 | ||||||
| Service Class | Actual | 1.07% | $1,000.00 | $926.65 | $5.11 | |||||
| Hypothetical (h) | 1.07% | $1,000.00 | $1,019.49 | $5.36 |
| (h) | 5% class return per year before expenses. |
| (p) | Expenses paid is equal to each class’ annualized expense ratio, as shown above, multiplied by the average account value over the period, multiplied by the number of days in the period, divided by the number of days in the year. |
4
Table of Contents
MFS Value Series
PORTFOLIO OF INVESTMENTS – 6/30/10 (unaudited)
The Portfolio of Investments is a complete list of all securities owned by your fund. It is categorized by broad-based asset classes.
| Issuer | Shares/Par | Value ($) | |||
| COMMON STOCKS – 98.3% | |||||
| Aerospace – 9.4% | |||||
| Honeywell International, Inc. | 263,260 | $ | 10,275,036 | ||
| Lockheed Martin Corp. | 566,140 | 42,177,430 | |||
| Northrop Grumman Corp. | 363,210 | 19,773,152 | |||
| United Technologies Corp. | 332,190 | 21,562,453 | |||
| $ | 93,788,071 | ||||
| Alcoholic Beverages – 1.3% | |||||
| Diageo PLC | 855,628 | $ | 13,406,891 | ||
| Apparel Manufacturers – 1.1% | |||||
| NIKE, Inc., “B” | 164,280 | $ | 11,097,114 | ||
| Automotive – 0.3% | |||||
| Johnson Controls, Inc. | 118,830 | $ | 3,192,962 | ||
| Broadcasting – 2.6% | |||||
| Omnicom Group, Inc. | 303,690 | $ | 10,416,567 | ||
| Walt Disney Co. | 486,550 | 15,326,325 | |||
| $ | 25,742,892 | ||||
| Business Services – 3.8% | |||||
| Accenture Ltd., “A” | 526,290 | $ | 20,341,109 | ||
| Dun & Bradstreet Corp. | 87,460 | 5,870,315 | |||
| MasterCard, Inc., “A” | 30,054 | 5,996,675 | |||
| Western Union Co. | 376,200 | 5,609,142 | |||
| $ | 37,817,241 | ||||
| Chemicals – 2.3% | |||||
| 3M Co. | 153,570 | $ | 12,130,494 | ||
| PPG Industries, Inc. | 169,066 | 10,213,277 | |||
| $ | 22,343,771 | ||||
| Computer Software – 1.7% | |||||
| Oracle Corp. | 768,130 | $ | 16,484,070 | ||
| Computer Software – Systems – 2.2% | |||||
| Hewlett-Packard Co. | 73,800 | $ | 3,194,064 | ||
| International Business Machines Corp. | 148,310 | 18,313,319 | |||
| $ | 21,507,383 | ||||
| Construction – 2.0% | |||||
| Pulte Homes, Inc. (a) | 353,390 | $ | 2,926,069 | ||
| Sherwin-Williams Co. | 149,970 | 10,376,424 | |||
| Stanley Black & Decker, Inc. | 119,533 | 6,038,807 | |||
| $ | 19,341,300 | ||||
| Consumer Products – 0.9% | |||||
| Procter & Gamble Co. | 140,254 | $ | 8,412,435 | ||
| Consumer Services – 0.1% | |||||
| Apollo Group, Inc., “A” (a) | 28,370 | $ | 1,204,874 | ||
| Electrical Equipment – 0.5% | |||||
| Danaher Corp. | 141,860 | $ | 5,265,843 | ||
| Electronics – 1.4% | |||||
| Intel Corp. | 732,200 | $ | 14,241,290 | ||
| Issuer | Shares/Par | Value ($) | |||
| COMMON STOCKS – continued | |||||
| Energy – Independent – 3.7% | |||||
| Apache Corp. | 163,280 | $ | 13,746,543 | ||
| Devon Energy Corp. | 121,480 | 7,400,562 | |||
| EOG Resources, Inc. | 89,170 | 8,771,653 | |||
| Occidental Petroleum Corp. | 89,440 | 6,900,296 | |||
| $ | 36,819,054 | ||||
| Energy – Integrated – 6.4% | |||||
| Chevron Corp. | 306,710 | $ | 20,813,341 | ||
| Exxon Mobil Corp. | 277,918 | 15,860,780 | |||
| Hess Corp. | 234,290 | 11,794,159 | |||
| TOTAL S.A., ADR | 325,122 | 14,513,446 | |||
| $ | 62,981,726 | ||||
| Food & Beverages – 4.8% | |||||
| General Mills, Inc. | 240,640 | $ | 8,547,533 | ||
| J.M. Smucker Co. | 75,136 | 4,524,690 | |||
| Kellogg Co. | 199,900 | 10,054,970 | |||
| Nestle S.A. | 281,542 | 13,584,394 | |||
| PepsiCo, Inc. | 173,588 | 10,580,189 | |||
| $ | 47,291,776 | ||||
| Food & Drug Stores – 1.0% | |||||
| CVS Caremark Corp. | 214,341 | $ | 6,284,478 | ||
| Walgreen Co. | 149,850 | 4,000,995 | |||
| $ | 10,285,473 | ||||
| General Merchandise – 0.6% | |||||
| Wal-Mart Stores, Inc. | 129,970 | $ | 6,247,658 | ||
| Insurance – 7.5% | |||||
| ACE Ltd. | 56,360 | $ | 2,901,413 | ||
| Allstate Corp. | 275,675 | 7,920,143 | |||
| Aon Corp. | 218,930 | 8,126,682 | |||
| Chubb Corp. | 138,630 | 6,932,886 | |||
| MetLife, Inc. | 686,223 | 25,911,780 | |||
| Prudential Financial, Inc. | 230,745 | 12,381,777 | |||
| Travelers Cos., Inc. | 207,560 | 10,222,330 | |||
| $ | 74,397,011 | ||||
| Leisure & Toys – 0.5% | |||||
| Hasbro, Inc. | 125,020 | $ | 5,138,322 | ||
| Machinery & Tools – 0.6% | |||||
| Eaton Corp. | 94,840 | $ | 6,206,330 | ||
| Major Banks – 14.1% | |||||
| Bank of America Corp. | 1,287,700 | $ | 18,504,249 | ||
| Bank of New York Mellon Corp. | 1,076,910 | 26,588,908 | |||
| Goldman Sachs Group, Inc. | 226,382 | 29,717,165 | |||
| JPMorgan Chase & Co. | 674,800 | 24,704,428 | |||
| PNC Financial Services Group, Inc. | 179,460 | 10,139,490 | |||
| Regions Financial Corp. | 210,020 | 1,381,932 | |||
| State Street Corp. | 307,470 | 10,398,635 | |||
| Wells Fargo & Co. | 734,310 | 18,798,336 | |||
| $ | 140,233,143 | ||||
5
Table of Contents
MFS Value Series
Portfolio of Investments (unaudited) – continued
| Issuer | Shares/Par | Value ($) | |||
| COMMON STOCKS – continued | |||||
| Medical Equipment – 3.6% | |||||
| Becton, Dickinson & Co. | 129,910 | $ | 8,784,514 | ||
| Medtronic, Inc. | 344,060 | 12,479,056 | |||
| St. Jude Medical, Inc. (a) | 162,500 | 5,864,625 | |||
| Thermo Fisher Scientific, Inc. (a) | 78,070 | 3,829,334 | |||
| Waters Corp. (a) | 80,120 | 5,183,764 | |||
| $ | 36,141,293 | ||||
| Network & Telecom – 0.5% | |||||
| Cisco Systems, Inc. (a) | 207,950 | $ | 4,431,415 | ||
| Oil Services – 1.6% | |||||
| National Oilwell Varco, Inc. | 207,420 | $ | 6,859,379 | ||
| Noble Corp. | 126,840 | 3,920,624 | |||
| Transocean, Inc. (a) | 103,060 | 4,774,770 | |||
| $ | 15,554,773 | ||||
| Pharmaceuticals – 8.0% | |||||
| Abbott Laboratories | 427,660 | $ | 20,005,935 | ||
| GlaxoSmithKline PLC | 246,830 | 4,183,073 | |||
| Johnson & Johnson | 496,850 | 29,343,961 | |||
| Merck & Co., Inc. | 143,570 | 5,020,643 | |||
| Pfizer, Inc. | 1,249,026 | 17,811,111 | |||
| Roche Holding AG | 23,600 | 3,240,837 | |||
| $ | 79,605,560 | ||||
| Railroad & Shipping – 0.5% | |||||
| Canadian National Railway Co. | 88,200 | $ | 5,060,916 | ||
| Restaurants – 0.3% | |||||
| McDonald’s Corp. | 45,530 | $ | 2,999,061 | ||
| Specialty Chemicals – 0.9% | |||||
| Air Products & Chemicals, Inc. | 143,406 | $ | 9,294,143 | ||
| Specialty Stores – 1.3% | |||||
| Advance Auto Parts, Inc. | 135,820 | $ | 6,815,448 | ||
| Home Depot, Inc. | 98,960 | 2,777,807 | |||
| Staples, Inc. | 178,630 | 3,402,902 | |||
| $ | 12,996,157 | ||||
| Telecommunications – Wireless – 1.6% | |||||
| Vodafone Group PLC | 7,516,023 | $ | 15,574,867 | ||
| Telephone Services – 3.3% | |||||
| AT&T, Inc. | 1,367,360 | $ | 33,076,438 | ||
| Issuer | Shares/Par | Value ($) | ||||
| COMMON STOCKS – continued | ||||||
| Tobacco – 3.5% | ||||||
| Altria Group, Inc. | 272,871 | $ | 5,468,335 | |||
| Philip Morris International, Inc. | 643,791 | 29,511,379 | ||||
| $ | 34,979,714 | |||||
| Utilities – Electric Power – 4.4% | ||||||
| CenterPoint Energy, Inc. | 63,380 | $ | 834,081 | |||
| Dominion Resources, Inc. | 330,312 | 12,796,287 | ||||
| Entergy Corp. | 54,510 | 3,904,006 | ||||
| NextEra Energy, Inc. | 98,190 | 4,787,744 | ||||
| PG&E Corp. | 231,700 | 9,522,870 | ||||
| PPL Corp. | 187,530 | 4,678,874 | ||||
| Public Service Enterprise Group, Inc. | 237,120 | 7,428,970 | ||||
| $ | 43,952,832 | |||||
| Total Common Stocks (Identified Cost, $1,020,556,554) | $ | 977,113,799 | ||||
| CONVERTIBLE PREFERRED STOCKS – 0.2% | ||||||
| Utilities – Electric Power – 0.2% | ||||||
| PPL Corp., 9.5% (Identified Cost, $1,688,500) | 33,770 | $ | 1,756,222 | |||
| MONEY MARKET FUNDS (v) – 1.6% | ||||||
| MFS Institutional Money Market Portfolio, 0.22%, at Cost and Net Asset Value | 15,660,610 | $ | 15,660,610 | |||
| Total Investments (Identified Cost, $1,037,905,664) | $ | 994,530,631 | ||||
| OTHER ASSETS, LESS LIABILITIES – (0.1)% | (720,458 | ) | ||||
| Net Assets – 100.0% | $ | 993,810,173 | ||||
| (a) | Non-income producing security. |
| (v) | Underlying fund that is available only to investment companies managed by MFS. The rate quoted is the annualized seven-day yield of the fund at period end. |
The following abbreviations are used in this report and are defined:
| ADR | American Depository Receipt |
| PLC | Public Limited Company |
See Notes to Financial Statements
6
Table of Contents
MFS Value Series
FINANCIAL STATEMENTS | STATEMENT OF ASSETS AND LIABILITIES (unaudited)
This statement represents your fund’s balance sheet, which details the assets and liabilities comprising the total value of the fund.
At 6/30/10 | |||||
Assets | |||||
Investments – | |||||
Non-affiliated issuers, at value (identified cost, $1,022,245,054) | $978,870,021 | ||||
Underlying funds, at cost and value | 15,660,610 | ||||
Total investments, at value (identified cost, $1,037,905,664) | $994,530,631 | ||||
Cash | 18,900 | ||||
Receivables for | |||||
Investments sold | 3,022,911 | ||||
Fund shares sold | 563,863 | ||||
Interest and dividends | 2,014,604 | ||||
Other assets | 5,717 | ||||
Total assets | $1,000,156,626 | ||||
Liabilities | |||||
Payables for | |||||
Investments purchased | $5,747,307 | ||||
Fund shares reacquired | 434,041 | ||||
Payable to affiliates | |||||
Investment adviser | 41,703 | ||||
Shareholder servicing costs | 715 | ||||
Distribution and/or service fees | 9,147 | ||||
Administrative services fee | 806 | ||||
Payable for independent Trustees’ compensation | 2,626 | ||||
Accrued expenses and other liabilities | 110,108 | ||||
Total liabilities | $6,346,453 | ||||
Net assets | $993,810,173 | ||||
Net assets consist of | |||||
Paid-in capital | $1,070,179,649 | ||||
Unrealized appreciation (depreciation) on investments and translation of assets and liabilities in foreign currencies | (43,355,543 | ) | |||
Accumulated net realized gain (loss) on investments and foreign currency transactions | (40,598,698 | ) | |||
Undistributed net investment income | 7,584,765 | ||||
Net assets | $993,810,173 | ||||
Shares of beneficial interest outstanding | 92,605,823 |
| Net assets | Shares outstanding | Net asset value per share | ||||
Initial Class | $341,035,184 | 31,569,739 | $10.80 | |||
Service Class | 652,774,989 | 61,036,084 | 10.69 |
See Notes to Financial Statements
7
Table of Contents
MFS Value Series
FINANCIAL STATEMENTS | STATEMENT OF OPERATIONS (unaudited)
This statement describes how much your fund earned in investment income and accrued in expenses. It also describes any gains and/or losses generated by fund operations.
| Six months ended 6/30/10 | ||||||
| Net investment income | ||||||
Income | ||||||
Dividends | $12,857,940 | |||||
Interest | 28,920 | |||||
Dividends from underlying funds | 11,601 | |||||
Foreign taxes withheld | (155,517 | ) | ||||
Total investment income | $12,742,944 | |||||
Expenses | ||||||
Management fee | $3,910,828 | |||||
Distribution and/or service fees | 853,645 | |||||
Shareholder servicing costs | 63,181 | |||||
Administrative services fee | 79,679 | |||||
Independent Trustees’ compensation | 11,690 | |||||
Custodian fee | 71,079 | |||||
Shareholder communications | 106,470 | |||||
Auditing fees | 23,992 | |||||
Legal fees | 9,322 | |||||
Miscellaneous | 24,873 | |||||
Total expenses | $5,154,759 | |||||
Fees paid indirectly | (2 | ) | ||||
Reduction of expenses by investment adviser | (3,406 | ) | ||||
Net expenses | $5,151,351 | |||||
Net investment income | $7,591,593 | |||||
Realized and unrealized gain (loss) on investments and foreign currency transactions | ||||||
Realized gain (loss) (identified cost basis) | ||||||
Investment transactions | $17,723,441 | |||||
Foreign currency transactions | (23,510 | ) | ||||
Net realized gain (loss) on investments and foreign currency transactions | $17,699,931 | |||||
Change in unrealized appreciation (depreciation) | ||||||
Investments | $(104,445,828 | ) | ||||
Translation of assets and liabilities in foreign currencies | 21,087 | |||||
Net unrealized gain (loss) on investments and foreign currency translation | $(104,424,741 | ) | ||||
Net realized and unrealized gain (loss) on investments and foreign currency | $(86,724,810 | ) | ||||
Change in net assets from operations | $(79,133,217 | ) |
See Notes to Financial Statements
8
Table of Contents
MFS Value Series
FINANCIAL STATEMENTS | STATEMENTS OF CHANGES IN NET ASSETS
These statements describe the increases and/or decreases in net assets resulting from operations, any distributions, and any shareholder transactions.
| Six months ended 6/30/10 (unaudited | ) | Year ended 12/31/09 | | |||
Change in net assets | ||||||
From operations | ||||||
Net investment income | $7,591,593 | $14,563,856 | ||||
Net realized gain (loss) on investments and foreign currency transactions | 17,699,931 | (5,194,323 | ) | |||
Net unrealized gain (loss) on investments and foreign currency translation | (104,424,741 | ) | 181,134,384 | |||
Change in net assets from operations | $(79,133,217 | ) | $190,503,917 | |||
Distributions declared to shareholders | ||||||
From net investment income | $(14,600,065 | ) | $(9,632,454 | ) | ||
Change in net assets from fund share transactions | $102,129,177 | $290,293,407 | ||||
Total change in net assets | $8,395,895 | $471,164,870 | ||||
Net assets | ||||||
At beginning of period | 985,414,278 | 514,249,408 | ||||
At end of period (including undistributed net investment income of $7,584,765 and | $993,810,173 | $985,414,278 |
See Notes to Financial Statements
9
Table of Contents
MFS Value Series
FINANCIAL STATEMENTS | FINANCIAL HIGHLIGHTS
The financial highlights table is intended to help you understand the fund’s financial performance for the semiannual period and the past 5 fiscal years. Certain information reflects financial results for a single fund share. The total returns in the table represent the rate by which an investor would have earned (or lost) on an investment in the fund share class (assuming reinvestment of all distributions) held for the entire period.
| Initial Class | Six months ended 6/30/10 | Years ended 12/31 | ||||||||||||||||
| 2009 | 2008 | 2007 | 2006 | 2005 | ||||||||||||||
| (unaudited) | ||||||||||||||||||
Net asset value, beginning of period | $11.80 | $9.76 | $15.25 | $14.52 | $12.52 | $12.13 | ||||||||||||
| Income (loss) from investment operations | ||||||||||||||||||
Net investment income (d) | $0.09 | $0.20 | $0.22 | $0.21 | $0.22 | $0.18 | ||||||||||||
Net realized and unrealized gain (loss) on investments and foreign currency | (0.92 | ) | 1.98 | (4.98 | ) | 0.92 | 2.32 | 0.60 | ||||||||||
Total from investment operations | $(0.83 | ) | $2.18 | $(4.76 | ) | $1.13 | $2.54 | $0.78 | ||||||||||
| Less distributions declared to shareholders | ||||||||||||||||||
From net investment income | $(0.17 | ) | $(0.14 | ) | $(0.17 | ) | $(0.15 | ) | $(0.14 | ) | $(0.10 | ) | ||||||
From net realized gain on investments | — | — | (0.56 | ) | (0.25 | ) | (0.40 | ) | (0.29 | ) | ||||||||
Total distributions declared to shareholders | $(0.17 | ) | $(0.14 | ) | $(0.73 | ) | $(0.40 | ) | $(0.54 | ) | $(0.39 | ) | ||||||
Net asset value, end of period | $10.80 | $11.80 | $9.76 | $15.25 | $14.52 | $12.52 | ||||||||||||
Total return (%) (k)(r)(s) | (7.20 | )(n) | 22.71 | (32.58 | ) | 7.91 | 20.84 | 6.66 | ||||||||||
| Ratios (%) (to average net assets) and Supplemental data: | ||||||||||||||||||
Expenses before expense reductions (f) | 0.82 | (a) | 0.84 | 0.84 | 0.86 | 0.88 | 0.91 | |||||||||||
Expenses after expense reductions (f) | 0.82 | (a) | 0.84 | 0.84 | 0.86 | 0.88 | 0.90 | |||||||||||
Net investment income | 1.60 | (a) | 1.99 | 1.77 | 1.41 | 1.65 | 1.50 | |||||||||||
Portfolio turnover | 11 | 26 | 36 | 23 | 25 | 20 | ||||||||||||
Net assets at end of period (000 omitted) | $341,035 | $367,676 | $295,721 | $390,346 | $256,529 | $132,371 | ||||||||||||
See Notes to Financial Statements
10
Table of Contents
MFS Value Series
Financial Highlights – continued
| Service Class | Six months ended 6/30/10 | Years ended 12/31 | ||||||||||||||||
| 2009 | 2008 | 2007 | 2006 | 2005 | ||||||||||||||
| (unaudited) | ||||||||||||||||||
Net asset value, beginning of period | $11.68 | $9.67 | $15.12 | $14.42 | $12.44 | $12.07 | ||||||||||||
| Income (loss) from investment operations | ||||||||||||||||||
Net investment income (d) | $0.08 | $0.18 | $0.19 | $0.17 | $0.18 | $0.15 | ||||||||||||
Net realized and unrealized gain (loss) on investments and foreign currency | (0.92 | ) | 1.95 | (4.94 | ) | 0.91 | 2.32 | 0.59 | ||||||||||
Total from investment operations | $(0.84 | ) | $2.13 | $(4.75 | ) | $1.08 | $2.50 | $0.74 | ||||||||||
| Less distributions declared to shareholders | ||||||||||||||||||
From net investment income | $(0.15 | ) | $(0.12 | ) | $(0.14 | ) | $(0.13 | ) | $(0.12 | ) | $(0.08 | ) | ||||||
From net realized gain on investments | — | — | (0.56 | ) | (0.25 | ) | (0.40 | ) | (0.29 | ) | ||||||||
Total distributions declared to shareholders | $(0.15 | ) | $(0.12 | ) | $(0.70 | ) | $(0.38 | ) | $(0.52 | ) | $(0.37 | ) | ||||||
Net asset value, end of period | $10.69 | $11.68 | $9.67 | $15.12 | $14.42 | $12.44 | ||||||||||||
Total return (%) (k)(r)(s) | (7.33 | )(n) | 22.45 | (32.74 | ) | 7.59 | 20.60 | 6.38 | ||||||||||
| Ratios (%) (to average net assets) and Supplemental data: | ||||||||||||||||||
Expenses before expense reductions (f) | 1.07 | (a) | 1.09 | 1.09 | 1.11 | 1.13 | 1.16 | |||||||||||
Expenses after expense reductions (f) | 1.07 | (a) | 1.09 | 1.09 | 1.11 | 1.13 | 1.15 | |||||||||||
Net investment income | 1.36 | (a) | 1.75 | 1.57 | 1.16 | 1.40 | 1.25 | |||||||||||
Portfolio turnover | 11 | 26 | 36 | 23 | 25 | 20 | ||||||||||||
Net assets at end of period (000 omitted) | $652,775 | $617,739 | $218,528 | $197,844 | $140,135 | $60,247 | ||||||||||||
| (a) | Annualized. |
| (d) | Per share data is based on average shares outstanding. |
| (f) | Ratios do not reflect reductions from fees paid indirectly, if applicable. |
| (k) | The total return does not reflect expenses that apply to separate accounts. Inclusion of these charges would reduce the total return figures for all periods shown. |
| (n) | Not annualized. |
| (r) | Certain expenses have been reduced without which performance would have been lower. |
| (s) | From time to time the fund may receive proceeds from litigation settlements, without which performance would be lower. |
See Notes to Financial Statements
11
Table of Contents
MFS Value Series
NOTES TO FINANCIAL STATEMENTS (unaudited)
| (1) | Business and Organization |
MFS Value Series (the fund) is a series of MFS Variable Insurance Trust (the trust). The trust is organized as a Massachusetts business trust and is registered under the Investment Company Act of 1940, as amended, as an open-end management investment company. The shareholders of each series of the trust are separate accounts of insurance companies, which offer variable annuity and/or life insurance products, and qualified retirement and pension plans.
| (2) | Significant Accounting Policies |
General – The preparation of financial statements in conformity with U.S. generally accepted accounting principles requires management to make estimates and assumptions that affect the reported amounts of assets and liabilities, and disclosure of contingent assets and liabilities at the date of the financial statements and the reported amounts of revenues and expenses during the reporting period. Actual results could differ from those estimates. In the preparation of these financial statements, management has evaluated subsequent events occurring after the date of the fund’s Statement of Assets and Liabilities through the date that the financial statements were issued. The fund can invest in foreign securities. Investments in foreign securities are vulnerable to the effects of changes in the relative values of the local currency and the U.S. dollar and to the effects of changes in each country’s legal, political, and economic environment.
Investment Valuations – Equity securities, including restricted equity securities, are generally valued at the last sale or official closing price as provided by a third-party pricing service on the market or exchange on which they are primarily traded. Equity securities, for which there were no sales reported that day, are generally valued at the last quoted daily bid quotation as provided by a third-party pricing service on the market or exchange on which such securities are primarily traded. Equity securities held short, for which there were no sales reported for that day, are generally valued at the last quoted daily ask quotation as provided by a third-party pricing service on the market or exchange on which such securities are primarily traded. Short-term instruments with a maturity at issuance of 60 days or less generally are valued at amortized cost, which approximates market value. Open-end investment companies are generally valued at net asset value per share. Securities and other assets generally valued on the basis of information from a third-party pricing service may also be valued at a broker/dealer bid quotation. Values obtained from third-party pricing services can utilize both transaction data and market information such as yield, quality, coupon rate, maturity, type of issue, trading characteristics, and other market data. The values of foreign securities and other assets and liabilities expressed in foreign currencies are converted to U.S. dollars using the mean of bid and asked prices for rates provided by a third-party pricing service.
The Board of Trustees has delegated primary responsibility for determining or causing to be determined the value of the fund’s investments (including any fair valuation) to the adviser pursuant to valuation policies and procedures approved by the Board. If the adviser determines that reliable market quotations are not readily available, investments are valued at fair value as determined in good faith by the adviser in accordance with such procedures under the oversight of the Board of Trustees. Under the fund’s valuation policies and procedures, market quotations are not considered to be readily available for most types of debt instruments and floating rate loans and many types of derivatives. These investments are generally valued at fair value based on information from third-party pricing services. In addition, investments may be valued at fair value if the adviser determines that an investment’s value has been materially affected by events occurring after the close of the exchange or market on which the investment is principally traded (such as foreign exchange or market) and prior to the determination of the fund’s net asset value, or after the halting of trading of a specific security where trading does not resume prior to the close of the exchange or market on which the security is principally traded. Events that occur on a frequent basis after foreign markets close (such as developments in foreign markets and significant movements in the U.S. markets) and prior to the determination of the fund’s net asset value may be deemed to have a material effect on the value of securities traded in foreign markets. Accordingly, the fund’s foreign equity securities may often be valued at fair value. The adviser generally relies on third-party pricing services or other information (such as the correlation with price movements of similar securities in the same or other markets; the type, cost and investment characteristics of the security; the business and financial condition of the issuer; and trading and other market data) to assist in determining whether to fair value and at what value to fair value an investment. The value of an investment for purposes of calculating the fund’s net asset value can differ depending on the source and method used to determine value. When fair valuation is used, the value of an investment used to determine the fund’s net asset value may differ from quoted or published prices for the same investment. There can be no assurance that the fund could obtain the fair value assigned to an investment if it were to sell the investment at the same time at which the fund determines its net asset value per share.
Various inputs are used in determining the value of the fund’s assets or liabilities. These inputs are categorized into three broad levels. In certain cases, the inputs used to measure fair value may fall into different levels of the fair value hierarchy. In such cases, an investment’s level within the fair value hierarchy is based on the lowest level of input that is significant to the fair
12
Table of Contents
MFS Value Series
Notes to Financial Statements (unaudited) – continued
value measurement. The fund’s assessment of the significance of a particular input to the fair value measurement in its entirety requires judgment, and considers factors specific to the investment. Level 1 includes unadjusted quoted prices in active markets for identical assets or liabilities. Level 2 includes other significant observable market-based inputs (including quoted prices for similar securities, interest rates, prepayment speed, and credit risk). Level 3 includes unobservable inputs, which may include the adviser’s own assumptions in determining the fair value of investments. Other financial instruments are derivative instruments not reflected in total investments, such as futures, forwards, swap contracts, and written options. The following is a summary of the levels used as of June 30, 2010 in valuing the fund’s assets or liabilities:
| Investments at Value | Level 1 | Level 2 | Level 3 | Total | ||||
| Equity Securities: | ||||||||
United States | $907,549,374 | $1,756,222 | $— | $909,305,596 | ||||
United Kingdom | — | 33,164,832 | — | 33,164,832 | ||||
Switzerland | — | 16,825,231 | — | 16,825,231 | ||||
France | 14,513,446 | — | — | 14,513,446 | ||||
Canada | 5,060,916 | — | — | 5,060,916 | ||||
| Mutual Funds | 15,660,610 | — | — | 15,660,610 | ||||
| Total Investments | $942,784,346 | $51,746,285 | $— | $994,530,631 |
For further information regarding security characteristics, see the Portfolio of Investments.
Foreign Currency Translation – Purchases and sales of foreign investments, income, and expenses are converted into U.S. dollars based upon currency exchange rates prevailing on the respective dates of such transactions or on the reporting date for foreign denominated receivables and payables. Gains and losses attributable to foreign currency exchange rates on sales of securities are recorded for financial statement purposes as net realized gains and losses on investments. Gains and losses attributable to foreign exchange rate movements on receivables, payables, income and expenses are recorded for financial statement purposes as foreign currency transaction gains and losses. That portion of both realized and unrealized gains and losses on investments that results from fluctuations in foreign currency exchange rates is not separately disclosed.
Derivatives – The fund may use derivatives for different purposes, including to earn income and enhance returns, to increase or decrease exposure to a particular market, to manage or adjust the risk profile of the fund, or as alternatives to direct investments. Derivatives may be used for hedging or non-hedging purposes. While hedging can reduce or eliminate losses, it can also reduce or eliminate gains. When the fund uses derivatives as an investment to increase market exposure, or for hedging purposes, gains and losses from derivative instruments may be substantially greater than the derivative’s original cost.
Derivative instruments include written options, purchased options, futures contracts, forward foreign currency exchange contracts, and swap agreements. For the six months ended June 30, 2010, the fund did not invest in any derivative instruments.
Indemnifications – Under the fund’s organizational documents, its officers and Trustees may be indemnified against certain liabilities and expenses arising out of the performance of their duties to the fund. Additionally, in the normal course of business, the fund enters into agreements with service providers that may contain indemnification clauses. The fund’s maximum exposure under these agreements is unknown as this would involve future claims that may be made against the fund that have not yet occurred.
Investment Transactions and Income – Investment transactions are recorded on the trade date. Interest income is recorded on the accrual basis. All premium and discount is amortized or accreted for financial statement purposes in accordance with U.S. generally accepted accounting principles. Dividends received in cash are recorded on the ex-dividend date. Certain dividends from foreign securities will be recorded when the fund is informed of the dividend if such information is obtained subsequent to the ex-dividend date. Dividend and interest payments received in additional securities are recorded on the ex-dividend or ex-interest date in an amount equal to the value of the security on such date.
The fund may receive proceeds from litigation settlements. Any proceeds received from litigation involving portfolio holdings are reflected in the Statement of Operations in realized gain/loss if the security has been disposed of by the fund or in unrealized gain/loss if the security is still held by the fund. Any other proceeds from litigation not related to portfolio holdings are reflected as other income in the Statement of Operations.
Fees Paid Indirectly – The fund’s custody fee may be reduced according to an arrangement that measures the value of cash deposited with the custodian by the fund. This amount, for the six months ended June 30, 2010, is shown as a reduction of total expenses on the Statement of Operations.
Tax Matters and Distributions – The fund intends to qualify as a regulated investment company, as defined under Subchapter M of the Internal Revenue Code, and to distribute all of its taxable income, including realized capital gains. As a result, no
13
Table of Contents
MFS Value Series
Notes to Financial Statements (unaudited) – continued
provision for federal income tax is required. The fund’s federal tax returns for the prior three fiscal years remain subject to examination by the Internal Revenue Service. Foreign taxes, if any, have been accrued by the fund in the accompanying financial statements.
Distributions to shareholders are recorded on the ex-dividend date. Income and capital gain distributions are determined in accordance with income tax regulations, which may differ from U.S. generally accepted accounting principles. Certain capital accounts in the financial statements are periodically adjusted for permanent differences in order to reflect their tax character. These adjustments have no impact on net assets or net asset value per share. Temporary differences which arise from recognizing certain items of income, expense, gain or loss in different periods for financial statement and tax purposes will reverse at some time in the future. Distributions in excess of net investment income or net realized gains are temporary overdistributions for financial statement purposes resulting from differences in the recognition or classification of income or distributions for financial statement and tax purposes.
Book/tax differences primarily relate to wash sale loss deferrals.
The tax character of distributions made during the current period, if any, will be determined at fiscal year end. The tax character of distributions declared to shareholders for the last fiscal year is as follows:
| 12/31/09 | ||
| Ordinary income (including any short-term capital gains) | $9,632,454 |
The federal tax cost and the tax basis components of distributable earnings were as follows:
| As of 6/30/10 | |||
| Cost of investments | $1,046,791,861 | ||
| Gross appreciation | 32,202,352 | ||
| Gross depreciation | (84,463,582 | ) | |
| Net unrealized appreciation (depreciation) | $(52,261,230 | ) | |
| As of 12/31/09 | |||
| Undistributed ordinary income | 14,593,237 | ||
| Capital loss carryforwards | (49,412,432 | ) | |
| Other temporary differences | (1,597 | ) | |
| Net unrealized appreciation (depreciation) | 52,184,598 |
The aggregate cost above includes prior fiscal year end tax adjustments, if applicable.
As of December 31, 2009, the fund had capital loss carryforwards available to offset future realized gains. Such losses expire as follows:
| 12/31/16 | $(43,502,137 | ) | |
| 12/31/17 | (5,910,295 | ) | |
| $(49,412,432 | ) |
Multiple Classes of Shares of Beneficial Interest – The fund offers multiple classes of shares, which differ in their respective distribution and/or service fees. The fund’s income, realized and unrealized gain (loss), and common expenses are allocated to shareholders based on the daily net assets of each class. Dividends are declared separately for each class. Differences in per share dividend rates are generally due to differences in separate class expenses. The fund’s distributions declared to shareholders as reported on the Statements of Changes in Net Assets are presented by class as follows:
| From net investment income | ||||
| Six months ended 6/30/10 | Year ended 12/31/09 | |||
| Initial Class | $5,462,463 | $4,240,834 | ||
| Service Class | 9,137,602 | 5,391,620 | ||
| Total | $14,600,065 | $9,632,454 | ||
| (3) | Transactions with Affiliates |
Investment Adviser – The fund has an investment advisory agreement with MFS to provide overall investment management and related administrative services and facilities to the fund.
The management fee is computed daily and paid monthly at the following annual rates:
| First $1 billion of average daily net assets | 0.75% | |
| Average daily net assets in excess of $1 billion | 0.65% |
14
Table of Contents
MFS Value Series
Notes to Financial Statements (unaudited) – continued
The management fee incurred for the six months ended June 30, 2010 was equivalent to an annual effective rate of 0.75% of the fund’s average daily net assets.
Effective May 1, 2011, the investment adviser has agreed in writing to reduce its management fee to 0.60% of average daily net assets in excess of $2.5 billion. This written agreement will continue until modified by the fund’s Board of Trustees, but such agreement will continue at least until April 30, 2012.
Prior to May 1, 2010, the investment adviser had agreed in writing to pay a portion of the fund’s operating expenses, exclusive of management fee, distribution and/or service fees, interest, taxes, extraordinary expenses, brokerage and transaction costs and investment-related expenses, such that operating expenses did not exceed 0.15% annually of the fund’s average daily net assets. This written agreement terminated on April 30, 2010. For the period January 1, 2010 through April 30, 2010, the fund’s actual operating expenses did not exceed the limit and therefore, the investment adviser did not pay any portion of the fund’s expenses.
Effective May 1, 2010, the investment adviser has agreed in writing to pay a portion of the fund’s total annual operating expenses, exclusive of interest, taxes, extraordinary expenses, brokerage and transaction costs and investment-related expenses, such that total annual operating expenses do not exceed 0.90% of average daily net assets for the Initial Class shares and 1.15% of average daily net assets for the Service Class shares. This written agreement will continue until modified by the fund’s Board of Trustees, but such agreement will continue at least until April 30, 2012. For the period May 1, 2010 through June 30, 2010, the fund’s actual operating expenses did not exceed the limit and therefore, the investment adviser did not pay any portion of the fund’s expenses.
Distributor – MFS Fund Distributors, Inc. (MFD), a wholly-owned subsidiary of MFS, is the distributor of shares of the fund. The Trustees have adopted a distribution plan for the Service Class shares pursuant to Rule 12b-1 under the Investment Company Act of 1940.
The fund’s distribution plan provides that the fund will pay MFD distribution and/or service fees equal to 0.25% per annum of its average daily net assets attributable to Service Class shares as partial consideration for services performed and expenses incurred by MFD and financial intermediaries (including participating insurance companies that invest in the fund to fund variable annuity and variable life insurance contracts, sponsors of qualified retirement and pension plans that invest in the fund, and affiliates of these participating insurance companies and plan sponsors) in connection with the sale and distribution of the Service Class shares. MFD may subsequently pay all, or a portion, of the distribution and/or service fees to financial intermediaries.
Shareholder Servicing Agent – MFS Service Center, Inc. (MFSC), a wholly-owned subsidiary of MFS, receives a fee from the fund for its services as shareholder servicing agent. For the six months ended June 30, 2010, the fee was $62,835, which equated to 0.0120% annually of the fund’s average daily net assets. MFSC also receives payment from the fund for out-of-pocket expenses paid by MFSC on behalf of the fund. For the six months ended June 30, 2010, these costs amounted to $346.
Administrator – MFS provides certain financial, legal, shareholder communications, compliance, and other administrative services to the fund. Under an administrative services agreement, the fund partially reimburses MFS the costs incurred to provide these services. The fund is charged an annual fixed amount of $17,500 plus a fee based on average daily net assets. The administrative services fee incurred for the six months ended June 30, 2010 was equivalent to an annual effective rate of 0.0152% of the fund’s average daily net assets.
Trustees’ and Officers’ Compensation – The fund pays compensation to independent Trustees in the form of a retainer, attendance fees, and additional compensation to Board and Committee chairpersons. The fund does not pay compensation directly to Trustees or officers of the fund who are also officers of the investment adviser, all of whom receive remuneration for their services to the fund from MFS. Certain officers and Trustees of the fund are officers or directors of MFS, MFD, and MFSC.
Other – This fund and certain other funds managed by MFS (the funds) have entered into services agreements (the Agreements) which provide for payment of fees by the funds to Tarantino LLC and Griffin Compliance LLC in return for the provision of services of an Independent Chief Compliance Officer (ICCO) and Assistant ICCO, respectively, for the funds. The ICCO and Assistant ICCO are officers of the funds and the sole members of Tarantino LLC and Griffin Compliance LLC, respectively. The funds can terminate the Agreements with Tarantino LLC and Griffin Compliance LLC at any time under the terms of the Agreements. For the six months ended June 30, 2010, the aggregate fees paid by the fund to Tarantino LLC and Griffin Compliance LLC were $4,244 and are included in miscellaneous expense on the Statement of Operations. MFS has agreed to reimburse the fund for a portion of the payments made by the fund in the amount of $3,406, which is shown as a
15
Table of Contents
MFS Value Series
Notes to Financial Statements (unaudited) – continued
reduction of total expenses in the Statement of Operations. Additionally, MFS has agreed to bear all expenses associated with office space, other administrative support, and supplies provided to the ICCO and Assistant ICCO.
The fund may invest in the MFS Institutional Money Market Portfolio which is managed by MFS and seeks a high level of current income consistent with preservation of capital and liquidity. Income earned on this investment is included in dividends from underlying funds on the Statement of Operations. This money market fund does not pay a management fee to MFS.
| (4) | Portfolio Securities |
Purchases and sales of investments, other than U.S. Government securities, purchased option transactions, and short-term obligations, aggregated $203,596,607 and $109,156,497, respectively.
| (5) | Shares of Beneficial Interest |
The fund’s Declaration of Trust permits the Trustees to issue an unlimited number of full and fractional shares of beneficial interest. Transactions in fund shares were as follows:
| Six months ended 6/30/10 | Year ended 12/31/09 | |||||||||||
| Shares | Amount | Shares | Amount | |||||||||
| Shares sold | ||||||||||||
Initial Class | 1,856,674 | $21,991,904 | 3,549,075 | $34,916,382 | ||||||||
Service Class | 9,489,633 | 112,321,168 | 33,931,032 | 318,762,552 | ||||||||
| 11,346,307 | $134,313,072 | 37,480,107 | $353,678,934 | |||||||||
| Shares issued to shareholders in reinvestment of distributions | ||||||||||||
Initial Class | 435,603 | $5,462,463 | 465,514 | $4,240,834 | ||||||||
Service Class | 735,717 | 9,137,602 | 596,418 | 5,391,620 | ||||||||
| 1,171,320 | $14,600,065 | 1,061,932 | $9,632,454 | |||||||||
| Shares reacquired | ||||||||||||
Initial Class | (1,882,160 | ) | $(22,244,256 | ) | (3,156,296 | ) | $(30,832,457 | ) | ||||
Service Class | (2,079,848 | ) | (24,539,704 | ) | (4,232,788 | ) | (42,185,524 | ) | ||||
| (3,962,008 | ) | $(46,783,960 | ) | (7,389,084 | ) | $(73,017,981 | ) | |||||
| Net change | ||||||||||||
Initial Class | 410,117 | $5,210,111 | 858,293 | $8,324,759 | ||||||||
Service Class | 8,145,502 | 96,919,066 | 30,294,662 | 281,968,648 | ||||||||
| 8,555,619 | $102,129,177 | 31,152,955 | $290,293,407 | |||||||||
| (6) | Line of Credit |
The fund and certain other funds managed by MFS participate in a $1.1 billion unsecured committed line of credit, subject to a $1 billion sublimit, provided by a syndication of banks under a credit agreement. Borrowings may be made for temporary financing needs. Interest is charged to each fund, based on its borrowings, generally at a rate equal to the higher of the Federal Reserve funds rate or one month LIBOR plus an agreed upon spread. A commitment fee, based on the average daily, unused portion of the committed line of credit, is allocated among the participating funds at the end of each calendar quarter. In addition, the fund and other funds managed by MFS have established unsecured uncommitted borrowing arrangements with certain banks for temporary financing needs. Interest is charged to each fund, based on its borrowings, at a rate equal to the Federal Reserve funds rate plus an agreed upon spread. For the six months ended June 30, 2010, the fund’s commitment fee and interest expense were $7,141 and $0, respectively, and are included in miscellaneous expense on the Statement of Operations.
| (7) | Transactions in Underlying Funds – Affiliated Issuers |
An affiliated issuer may be considered one in which the fund owns 5% or more of the outstanding voting securities, or a company which is under common control. For the purposes of this report, the fund assumes the following to be affiliated issuers:
| Underlying Funds | Beginning Shares/Par Amount | Acquisitions Shares/Par Amount | Dispositions Shares/Par Amount | Ending Shares/Par Amount | |||||
| MFS Institutional Money Market Portfolio | 13,580,573 | 115,757,292 | (113,677,255 | ) | 15,660,610 | ||||
| Underlying Funds | Realized Gain (Loss) | Capital Gain Distributions | Dividend Income | Ending Value | |||||
| MFS Institutional Money Market Portfolio | $— | $— | $11,601 | $15,660,610 | |||||
16
Table of Contents
MFS Value Series
RESULTS OF SHAREHOLDER MEETING (unaudited)
At a special meeting of shareholders of MFS Variable Insurance Trust, which was held on January 28, 2010, the following actions were taken:
Item 1. To elect the following individuals as Trustees:
| Number of Dollars | ||||
| Nominee | For | Withheld Authority | ||
| Robert E. Butler | 6,823,651,821.26 | 1,818,252,669.55 | ||
| Lawrence H. Cohn, M.D. | 6,813,621,200.14 | 1,828,283,290.67 | ||
| Maureen R. Goldfarb | 6,825,332,620.76 | 1,816,571,870.05 | ||
| David H. Gunning | 6,823,081,841.37 | 1,818,822,649.44 | ||
| William R. Gutow | 6,813,678,877.22 | 1,828,225,613.59 | ||
| Michael Hegarty | 6,827,456,515.87 | 1,814,447,974.94 | ||
| John P. Kavanaugh | 6,830,363,113.12 | 1,811,541,377.69 | ||
| Robert J. Manning | 6,825,511,264.17 | 1,816,393,226.64 | ||
| Robert C. Pozen | 6,824,854,120.27 | 1,817,050,370.54 | ||
| J. Dale Sherratt | 6,816,913,203.87 | 1,824,991,286.94 | ||
| Laurie J. Thomsen | 6,823,590,745.56 | 1,818,313,745.25 | ||
| Robert W. Uek | 6,818,161,803.66 | 1,823,742,687.15 | ||
17
Table of Contents
MFS Value Series
BOARD REVIEW OF INVESTMENT ADVISORY AGREEMENT
A discussion regarding the Board’s most recent review and renewal of the fund’s Investment Advisory Agreement with MFS will be available on or about November 1, 2010 by clicking on the fund’s name under ‘‘Variable Insurance Portfolios — VIT’’ in the ‘‘Products and Performance’’ section of the MFS Web site (mfs.com).
PROXY VOTING POLICIES AND INFORMATION
A general description of the MFS funds’ proxy voting policies and procedures is available without charge, upon request, by calling 1-800-225-2606, by visiting the Proxy Voting section of mfs.com or by visiting the SEC’s Web site at http://www.sec.gov.
Information regarding how the fund voted proxies relating to portfolio securities during the most recent twelve-month period ended June 30 is available without charge by visiting the Proxy Voting section of mfs.com or by visiting the SEC’s Web site at http://www.sec.gov.
QUARTERLY PORTFOLIO DISCLOSURE
The fund will file a complete schedule of portfolio holdings with the Securities and Exchange Commission (the Commission) for the first and third quarters of each fiscal year on Form N-Q. The fund’s Form N-Q may be reviewed and copied at the:
Public Reference Room
Securities and Exchange Commission
100 F Street, NE, Room 1580
Washington, D.C. 20549
Information on the operation of the Public Reference Room may be obtained by calling the Commission at 1-800-SEC-0330. The fund’s Form N-Q is available on the EDGAR database on the Commission’s Internet Web site at http://www.sec.gov, and copies of this information may be obtained, upon payment of a duplicating fee, by electronic request at the following e-mail address: publicinfo@sec.gov or by writing the Public Reference Section at the above address.
From time to time, MFS may post important information about the fund or the MFS funds on the MFS web site (mfs.com). This information is available by visiting the “News & Commentary” section of mfs.com or by clicking on the fund’s name under “Variable Insurance Portfolios — VIT” in the “Products and Performance” section of mfs.com.
18
Table of Contents

Table of Contents

Table of Contents
This report is prepared for the general information of contract owners. It is authorized for distribution to prospective investors only when preceded or accompanied by a current prospectus.
NOT FDIC INSURED Ÿ MAY LOSE VALUE Ÿ NO BANK GUARANTEE Ÿ NOT A DEPOSIT Ÿ NOT INSURED BY ANY FEDERAL GOVERNMENT AGENCY OR NCUA/NCUSIF
Table of Contents
MFS Mid Cap Growth Series

Dear Contract Owners:
After having suffered their biggest declines since the Great Depression, most global markets experienced an impressive resurgence during the latter months of 2009 and the first quarter of 2010. The global economy was able to reap the benefits of two major trends. The first of these was the massive efforts of governments and central banks to increase liquidity in the financial system as they sought to prevent the credit crisis from further affecting the banking system. The second was the move by companies around the world to cut costs and operations to prepare for rapidly changing market conditions. We believe that these moves not only shortened the length of the downturn but also set the stage for recovery.
Even with the significant market gains of 2009 and the early part of 2010, the recovery is unrolling at a moderate pace, with rebounds in the manufacturing sector and corporate America leading the way. Central bankers are proceeding with caution and many have held benchmark interest rates unchanged as they debate the best way to withdraw stimulus measures without disrupting the fragile growth process. Complicating that debate late in the period was the emergence of the European debt crisis and worries about whether this crisis could derail the global recovery. As that crisis unrolled with no clear resolution, risk aversion rose along with volatility. Weakening economic data late in the period added uncertainty to the mix and sparked a retrenchment in global equity markets.
While hurdles remain, we believe that the global economy is proceeding on the road to recovery. As always, we continue to be mindful of the many challenges faced at the individual, national, and international levels. It is at times such as these that we want to remind investors of the merits of maintaining a long-term view, adhering to basic investing principles such as asset allocation and diversification, and working closely with advisors to identify and research investment opportunities. At MFS®, we take particular pride in how well mutual funds can provide a broad range of products that can fit investor needs in any type of market climate.
Respectfully,

Robert J. Manning
Chairman and Chief Executive Officer
MFS Investment Management®
August 16, 2010
The opinions expressed in this letter are subject to change, may not be relied upon for investment advice, and no forecasts can be guaranteed.
MFS Fund Distributors, Inc., 500 Boylston Street, Boston, MA 02116
1
Table of Contents
MFS Mid Cap Growth Series
Portfolio structure
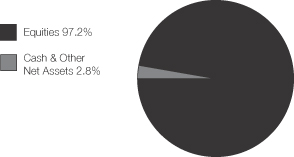
| Top ten holdings | ||
| American Tower Corp., “A” | 1.7% | |
| Goodrich Corp. | 1.6% | |
| MICROS Systems, Inc. | 1.5% | |
| Akamai Technologies, Inc. | 1.5% | |
| Newfield Exploration Co. | 1.4% | |
| VeriSign, Inc. | 1.4% | |
| MasterCard, Inc., “A” | 1.4% | |
| Mead Johnson Nutrition Co., “A” | 1.4% | |
| Capella Education Co. | 1.3% | |
| AMETEK, Inc. | 1.3% |
| Equity sectors | ||
| Technology | 18.2% | |
| Health Care | 15.3% | |
| Special Products & Services | 11.1% | |
| Industrial Goods & Services | 8.5% | |
| Leisure | 8.1% | |
| Retailing | 7.0% | |
| Financial Services | 6.1% | |
| Energy | 6.1% | |
| Consumer Staples | 4.9% | |
| Utilities & Communications | 3.7% | |
| Basic Materials | 3.2% | |
| Transportation | 3.2% | |
| Autos & Housing | 1.8% |
Percentages are based on net assets as of 6/30/10.
The portfolio is actively managed and current holdings may be different.
2
Table of Contents
MFS Mid Cap Growth Series
After having suffered through one of the largest and most concentrated downturns since the 1930s, most asset markets staged a remarkable rebound during 2009 and early 2010. This recovery in global activity has been led importantly by emerging Asian economies, but broadening to include most of the global economy to varying degrees. Primary drivers of the recovery included an unwinding of the inventory destocking that took place earlier, the production of manufacturing and capital goods, as well as massive fiscal and monetary stimulus.
Late in the period, though, heightened risk surrounding the public-debt profiles of several of the peripheral European countries impaired market sentiment. At the same time, the improving trend in global macroeconomic data began to weaken somewhat. These two dynamics caused most asset prices to retrench significantly, as many questioned the durability of the global recovery.
3
Table of Contents
MFS Mid Cap Growth Series
Fund Expenses Borne by the Contract Holders During the Period,
January 1, 2010 through June 30, 2010
As a contract holder of the fund, you incur ongoing costs, including management fees; distribution and/or service (12b-1) fees; and other fund expenses. This example is intended to help you understand your ongoing costs (in dollars) of investing in the fund and to compare these costs with the ongoing costs of investing in other mutual funds.
The example is based on an investment of $1,000 invested at the beginning of the period and held for the entire period January 1, 2010 through June 30, 2010.
Actual Expenses
The first line for each share class in the following table provides information about actual account values and actual expenses. You may use the information in this line, together with the amount you invested, to estimate the expenses that you paid over the period. Simply divide your account value by $1,000 (for example, an $8,600 account value divided by $1,000 = 8.6), then multiply the result by the number in the first line under the heading entitled “Expenses Paid During Period” to estimate the expenses you paid on your account during this period.
Hypothetical Example for Comparison Purposes
The second line for each share class in the following table provides information about hypothetical account values and hypothetical expenses based on the fund’s actual expense ratio and an assumed rate of return of 5% per year before expenses, which is not the fund’s actual return. The hypothetical account values and expenses may not be used to estimate the actual ending account balance or expenses you paid for the period. You may use this information to compare the ongoing costs of investing in the fund and other funds. To do so, compare this 5% hypothetical example with the 5% hypothetical examples that appear in the shareholder reports of the other funds.
Please note that the expenses shown in the table are meant to highlight the fund’s ongoing costs only and do not take into account the fees and expenses imposed under the variable contracts through which your investment in the fund is made. Therefore, the second line for each share class in the table is useful in comparing ongoing costs associated with an investment in vehicles (such as the fund) which fund benefits under variable annuity and variable life insurance contracts and to qualified pension and retirement plans only, and will not help you determine the relative total costs of investing in the fund through variable annuity and variable life insurance contracts. If the fees and expenses imposed under the variable contracts were included, your costs would have been higher.
| Share Class | Annualized Expense Ratio | Beginning Account Value 1/01/10 | Ending Account Value 6/30/10 | Expenses Paid During Period (p) 1/01/10-6/30/10 | ||||||
| Initial Class | Actual | 0.88% | $1,000.00 | $993.51 | $4.35 | |||||
| Hypothetical (h) | 0.88% | $1,000.00 | $1,020.43 | $4.41 | ||||||
| Service Class | Actual | 1.13% | $1,000.00 | $991.15 | $5.58 | |||||
| Hypothetical (h) | 1.13% | $1,000.00 | $1,019.19 | $5.66 |
| (h) | 5% class return per year before expenses. |
| (p) | Expenses paid is equal to each class’ annualized expense ratio, as shown above, multiplied by the average account value over the period, multiplied by the number of days in the period, divided by the number of days in the year. |
4
Table of Contents
MFS Mid Cap Growth Series
PORTFOLIO OF INVESTMENTS – 6/30/10 (unaudited)
The Portfolio of Investments is a complete list of all securities owned by your fund. It is categorized by broad-based asset classes.
| Issuer | Shares/Par | Value ($) | |||
| COMMON STOCKS – 97.2% | |||||
| Aerospace – 2.6% | |||||
| Goodrich Corp. | 32,470 | $ | 2,151,129 | ||
| Moog, Inc., “A” (a) | 8,960 | 288,781 | |||
| Rockwell Collins, Inc. | 20,180 | 1,072,163 | |||
| $ | 3,512,073 | ||||
| Airlines – 0.7% | |||||
| Copa Holdings S.A., “A” | 22,040 | $ | 974,609 | ||
| Biotechnology – 2.0% | |||||
| Alexion Pharmaceuticals, Inc. (a) | 30,670 | $ | 1,569,997 | ||
| Gen-Probe, Inc. (a) | 19,700 | 894,774 | |||
| Human Genome Sciences, Inc. (a) | 8,880 | 201,221 | |||
| $ | 2,665,992 | ||||
| Broadcasting – 1.3% | |||||
| Discovery Communications, Inc., “A” (a) | 43,160 | $ | 1,541,244 | ||
| Scripps Networks Interactive, Inc., “A” | 6,560 | 264,630 | |||
| $ | 1,805,874 | ||||
| Brokerage & Asset Managers – 3.0% | |||||
| Affiliated Managers Group, Inc. (a) | 19,940 | $ | 1,211,754 | ||
| BM&F Bovespa S.A. | 74,000 | 475,568 | |||
| Evercore Partners, Inc. | 13,620 | 318,027 | |||
| GFI Group, Inc. | 103,230 | 576,023 | |||
| IntercontinentalExchange, Inc. (a) | 9,990 | 1,129,170 | |||
| Lazard Ltd. | 14,750 | 393,973 | |||
| $ | 4,104,515 | ||||
| Business Services – 6.3% | |||||
| Cognizant Technology Solutions Corp., “A” (a) | 26,810 | $ | 1,342,109 | ||
| Concur Technologies, Inc. (a) | 30,560 | 1,304,301 | |||
| Constant Contact, Inc. (a) | 30,170 | 643,526 | |||
| CoStar Group, Inc. (a) | 32,370 | 1,255,956 | |||
| MasterCard, Inc., “A” | 9,540 | 1,903,516 | |||
| Ultimate Software Group, Inc. (a) | 2,080 | 68,349 | |||
| Verisk Analytics, Inc., “A” (a) | 48,870 | 1,461,213 | |||
| Visa, Inc., “A” | 9,120 | 645,240 | |||
| $ | 8,624,210 | ||||
| Chemicals – 0.7% | |||||
| Ecolab, Inc. | 22,260 | $ | 999,697 | ||
| Computer Software – 8.7% | |||||
| Adobe Systems, Inc. (a) | 43,060 | $ | 1,138,076 | ||
| Akamai Technologies, Inc. (a) | 49,080 | 1,991,176 | |||
| ANSYS, Inc. (a) | 10,120 | 410,568 | |||
| Autodesk, Inc. (a) | 57,800 | 1,408,008 | |||
| Autonomy Corp. PLC (a) | 36,130 | 975,084 | |||
| Blackboard, Inc. (a) | 23,520 | 878,002 | |||
| MicroStrategy, Inc., “A” (a) | 15,220 | 1,142,870 | |||
| Parametric Technology Corp. (a) | 79,340 | 1,243,258 | |||
| SuccessFactors, Inc. (a) | 39,600 | 823,284 | |||
| VeriSign, Inc. (a)(s) | 73,750 | 1,958,063 | |||
| $ | 11,968,389 | ||||
| Issuer | Shares/Par | Value ($) | |||
| COMMON STOCKS – continued | |||||
| Computer Software – Systems – 1.5% | |||||
| MICROS Systems, Inc. (a) | 65,680 | $ | 2,093,222 | ||
| Construction – 1.8% | |||||
| NVR, Inc. (a) | 760 | $ | 497,823 | ||
| Sherwin-Williams Co. | 15,420 | 1,066,910 | |||
| Stanley Black & Decker, Inc. | 16,568 | 837,015 | |||
| $ | 2,401,748 | ||||
| Consumer Products – 2.3% | |||||
| Church & Dwight Co., Inc. | 26,540 | $ | 1,664,323 | ||
| Hypermarcas S.A. (a) | 56,200 | 721,726 | |||
| Natura Cosmeticos S.A. | 35,250 | 781,163 | |||
| $ | 3,167,212 | ||||
| Consumer Services – 4.8% | |||||
| Anhanguera Educacional Participacoes S.A., IEU | 37,700 | $ | 569,991 | ||
| Capella Education Co. (a) | 21,220 | 1,726,247 | |||
| Ctrip.com International Ltd., ADR (a) | 19,640 | 737,678 | |||
| DeVry, Inc. | 29,300 | 1,537,957 | |||
| Monster Worldwide, Inc. (a) | 52,080 | 606,732 | |||
| Sotheby’s | 25,570 | 584,786 | |||
| Strayer Education, Inc. | 3,870 | 804,534 | |||
| $ | 6,567,925 | ||||
| Containers – 0.9% | |||||
| Ball Corp. | 10,500 | $ | 554,715 | ||
| Owens-Illinois, Inc. (a) | 27,800 | 735,310 | |||
| $ | 1,290,025 | ||||
| Electrical Equipment – 3.4% | |||||
| AMETEK, Inc. | 42,790 | $ | 1,718,019 | ||
| Danaher Corp. | 33,270 | 1,234,982 | |||
| Mettler-Toledo International, Inc. (a) | 6,600 | 736,758 | |||
| Sensata Technologies Holding B.V. (a) | 16,330 | 261,117 | |||
| Tyco Electronics Ltd. | 26,650 | 676,377 | |||
| $ | 4,627,253 | ||||
| Electronics – 5.5% | |||||
| ARM Holdings PLC | 192,310 | $ | 795,663 | ||
| Dolby Laboratories, Inc., “A” (a) | 21,220 | 1,330,282 | |||
| Hittite Microwave Corp. (a) | 17,440 | 780,266 | |||
| Linear Technology Corp. | 41,540 | 1,155,227 | |||
| Microchip Technology, Inc. | 55,820 | 1,548,447 | |||
| NetLogic Microsystems, Inc. (a) | 11,010 | 299,472 | |||
| PMC-Sierra, Inc. (a) | 109,620 | 824,342 | |||
| Silicon Laboratories, Inc. (a) | 18,590 | 754,010 | |||
| $ | 7,487,709 | ||||
| Energy – Independent – 3.8% | |||||
| Concho Resources, Inc. (a) | 7,360 | $ | 407,229 | ||
| EXCO Resources, Inc. | 44,850 | 655,259 | |||
| Newfield Exploration Co. (a) | 40,370 | 1,972,478 | |||
5
Table of Contents
MFS Mid Cap Growth Series
Portfolio of Investments (unaudited) – continued
| Issuer | Shares/Par | Value ($) | |||
| COMMON STOCKS – continued | |||||
| Energy – Independent – continued | |||||
| Ultra Petroleum Corp. (a) | 30,430 | $ | 1,346,528 | ||
| Whiting Petroleum Corp. (a) | 9,790 | 767,732 | |||
| $ | 5,149,226 | ||||
| Entertainment – 0.6% | |||||
| DreamWorks Animation, Inc., “A” (a) | 29,680 | $ | 847,364 | ||
| Food & Beverages – 2.6% | |||||
| Dr Pepper Snapple Group, Inc. | 19,680 | $ | 735,835 | ||
| Green Mountain Coffee Roasters, Inc. (a) | 13,560 | 348,492 | |||
| J.M. Smucker Co. | 10,330 | 622,073 | |||
| Mead Johnson Nutrition Co., “A” | 37,170 | 1,862,960 | |||
| $ | 3,569,360 | ||||
| Gaming & Lodging – 2.6% | |||||
| International Game Technology | 75,700 | $ | 1,188,490 | ||
| Las Vegas Sands Corp. (a) | 60,740 | 1,344,784 | |||
| Pinnacle Entertainment, Inc. (a) | 39,730 | 375,846 | |||
| Royal Caribbean Cruises Ltd. (a) | 27,140 | 617,978 | |||
| $ | 3,527,098 | ||||
| General Merchandise – 0.8% | |||||
| Dollar General Corp. (a) | 38,790 | $ | 1,068,665 | ||
| Insurance – 0.9% | |||||
| Allied World Assurance Co. Holdings Ltd. | 9,870 | $ | 447,901 | ||
| Aspen Insurance Holdings Ltd. | 32,600 | 806,524 | |||
| $ | 1,254,425 | ||||
| Internet – 0.3% | |||||
| OpenTable, Inc. (a) | 8,770 | $ | 363,692 | ||
| Leisure & Toys – 0.8% | |||||
| Hasbro, Inc. | 27,810 | $ | 1,142,991 | ||
| Machinery & Tools – 2.5% | |||||
| Bucyrus International, Inc. | 21,710 | $ | 1,030,140 | ||
| Cummins, Inc. | 7,690 | 500,850 | |||
| Flowserve Corp. | 9,730 | 825,104 | |||
| Kennametal, Inc. | 44,450 | 1,130,364 | |||
| $ | 3,486,458 | ||||
| Major Banks – 0.3% | |||||
| KeyCorp | 54,760 | $ | 421,104 | ||
| Medical & Health Technology & Services – 8.3% | |||||
| Cerner Corp. (a) | 17,220 | $ | 1,306,826 | ||
| DaVita, Inc. (a) | 24,150 | 1,507,926 | |||
| Diagnosticos da America S.A. | 115,100 | 1,083,407 | |||
| Express Scripts, Inc. (a) | 35,400 | 1,664,508 | |||
| IDEXX Laboratories, Inc. (a) | 21,340 | 1,299,606 | |||
| Lincare Holdings, Inc. | 44,315 | 1,440,681 | |||
| MedAssets, Inc. (a) | 29,540 | 681,783 | |||
| MEDNAX, Inc. (a) | 19,190 | 1,067,156 | |||
| Patterson Cos., Inc. | 43,570 | 1,243,052 | |||
| Stericycle, Inc. (a) | 2,200 | 144,276 | |||
| $ | 11,439,221 | ||||
| Issuer | Shares/Par | Value ($) | |||
| COMMON STOCKS – continued | |||||
| Medical Equipment – 5.0% | |||||
| C.R. Bard, Inc. | 13,190 | $ | 1,022,621 | ||
| DENTSPLY International, Inc. | 38,900 | 1,163,499 | |||
| Edwards Lifesciences Corp. (a) | 27,320 | 1,530,466 | |||
| Intuitive Surgical, Inc. (a) | 1,820 | 574,428 | |||
| ResMed, Inc. (a) | 18,890 | 1,148,701 | |||
| Sonova Holding AG | 3,209 | 393,519 | |||
| Thoratec Corp. (a) | 25,150 | 1,074,660 | |||
| $ | 6,907,894 | ||||
| Natural Gas – Distribution – 0.7% | |||||
| EQT Corp. | 12,840 | $ | 464,038 | ||
| Questar Corp. | 10,150 | 461,724 | |||
| $ | 925,762 | ||||
| Network & Telecom – 2.2% | |||||
| Acme Packet, Inc. (a) | 33,680 | $ | 905,318 | ||
| F5 Networks, Inc. (a) | 17,010 | 1,166,376 | |||
| Fortinet, Inc. (a) | 28,330 | 465,745 | |||
| Tellabs, Inc. | 73,360 | 468,770 | |||
| $ | 3,006,209 | ||||
| Oil Services – 2.3% | |||||
| Cameron International Corp. (a) | 14,040 | $ | 456,581 | ||
| Dresser-Rand Group, Inc. (a) | 40,560 | 1,279,668 | |||
| Smith International, Inc. | 37,970 | 1,429,571 | |||
| $ | 3,165,820 | ||||
| Other Banks & Diversified Financials – 1.9% | |||||
| Associated Banc-Corp. | 33,720 | $ | 413,407 | ||
| Cathay General Bancorp, Inc. | 47,600 | 491,708 | |||
| Marshall & Ilsley Corp. | 82,860 | 594,935 | |||
| People’s United Financial, Inc. | 20,080 | 271,080 | |||
| TCF Financial Corp. | 31,430 | 522,052 | |||
| Zions Bancorporation | 16,110 | 347,493 | |||
| $ | 2,640,675 | ||||
| Precious Metals & Minerals – 0.6% | |||||
| Teck Resources Ltd., “B” | 27,850 | $ | 823,803 | ||
| Printing & Publishing – 1.8% | |||||
| Moody’s Corp. | 36,890 | $ | 734,849 | ||
| MSCI, Inc., “A” (a) | 50,720 | 1,389,728 | |||
| VistaPrint Ltd. (a) | 6,160 | 292,538 | |||
| $ | 2,417,115 | ||||
| Restaurants – 1.0% | |||||
| P.F. Chang’s China Bistro, Inc. | 34,050 | $ | 1,350,083 | ||
| Specialty Chemicals – 1.0% | |||||
| Albemarle Corp. | 33,350 | $ | 1,324,329 | ||
| Specialty Stores – 6.2% | |||||
| Abercrombie & Fitch Co., “A” | 28,020 | $ | 859,934 | ||
| Advance Auto Parts, Inc. | 12,520 | 628,254 | |||
| Dick’s Sporting Goods, Inc. (a) | 50,700 | 1,261,923 | |||
| J. Crew Group, Inc. (a) | 6,550 | 241,106 | |||
| Limited Brands, Inc. | 71,770 | 1,583,964 | |||
6
Table of Contents
MFS Mid Cap Growth Series
Portfolio of Investments (unaudited) – continued
| Issuer | Shares/Par | Value ($) | |||
| COMMON STOCKS – continued | |||||
| Specialty Stores – continued | |||||
| Ross Stores, Inc. | 27,620 | $ | 1,471,870 | ||
| Staples, Inc. | 61,520 | 1,171,956 | |||
| Tiffany & Co. | 25,980 | 984,902 | |||
| Urban Outfitters, Inc. (a) | 9,670 | 332,551 | |||
| $ | 8,536,460 | ||||
| Telecommunications – Wireless – 0.9% | |||||
| NII Holdings, Inc. (a) | 15,850 | $ | 515,442 | ||
| SBA Communications Corp. (a) | 10,290 | 349,963 | |||
| Vivo Participacoes S.A., ADR | 14,980 | 388,282 | |||
| $ | 1,253,687 | ||||
| Telephone Services – 1.9% | |||||
| American Tower Corp., “A” (a) | 51,580 | $ | 2,295,310 | ||
| Virgin Media, Inc. | 21,460 | 358,167 | |||
| $ | 2,653,477 | ||||
| Trucking – 2.5% | |||||
| Expeditors International of Washington, Inc. | 29,860 | $ | 1,030,469 | ||
| J.B. Hunt Transport Services, Inc. | 18,020 | 588,713 | |||
| Landstar System, Inc. | 35,260 | 1,374,787 | |||
| Werner Enterprises, Inc. | 19,670 | 430,576 | |||
| $ | 3,424,545 | ||||
| Utilities – Electric Power – 0.2% | |||||
| CMS Energy Corp. | 19,480 | $ | 285,382 | ||
| Total Common Stocks (Identified Cost, $123,265,703) | $ | 133,275,298 | |||
| Issuer | Shares/Par | Value ($) | |||
| MONEY MARKET FUNDS (v) – 1.5% | |||||
| MFS Institutional Money Market Portfolio, 0.22%, at Cost and Net Asset Value | 1,986,842 | $ | 1,986,842 | ||
| Total Investments (Identified Cost, $125,252,545) | $ | 135,262,140 | |||
| OTHER ASSETS, LESS LIABILITIES – 1.3% | 1,847,770 | ||||
| Net Assets – 100.0% | $ | 137,109,910 | |||
| (a) | Non-income producing security. |
| (s) | Security or a portion of the security was pledged to cover collateral requirements for securities sold short. At June 30, 2010, the value of securities pledged amounted to $158,504. At June 30, 2010, the fund had no short sales outstanding. |
| (v) | Underlying fund that is available only to investment companies managed by MFS. The rate quoted is the annualized seven-day yield of the fund at period end. |
The following abbreviations are used in this report and are defined:
| ADR | American Depository Receipt |
| IEU | International Equity Unit |
| PLC | Public Limited Company |
See Notes to Financial Statements
7
Table of Contents
MFS Mid Cap Growth Series
FINANCIAL STATEMENTS | STATEMENT OF ASSETS AND LIABILITIES (unaudited)
This statement represents your fund’s balance sheet, which details the assets and liabilities comprising the total value of the fund.
| At 6/30/10 | |||||
| Assets | |||||
Investments – | |||||
Non-affiliated issuers, at value (identified cost, $123,265,703) | $133,275,298 | ||||
Underlying funds, at cost and value | 1,986,842 | ||||
Total investments, at value (identified cost, $125,252,545) | $135,262,140 | ||||
Cash | 21,878 | ||||
Foreign currency, at value (identified cost, $75) | 72 | ||||
Receivables for | |||||
Investments sold | 2,296,926 | ||||
Fund shares sold | 121,691 | ||||
Interest and dividends | 66,138 | ||||
Other assets | 936 | ||||
Total assets | $137,769,781 | ||||
Liabilities | |||||
Payables for | |||||
Investments purchased | $490,657 | ||||
Fund shares reacquired | 104,297 | ||||
Payable to affiliates | |||||
Investment adviser | 5,792 | ||||
Shareholder servicing costs | 145 | ||||
Distribution and/or service fees | 399 | ||||
Administrative services fee | 163 | ||||
Payable for independent Trustees’ compensation | 518 | ||||
Accrued expenses and other liabilities | 57,900 | ||||
Total liabilities | $659,871 | ||||
Net assets | $137,109,910 | ||||
Net assets consist of | |||||
Paid-in capital | $177,772,446 | ||||
Unrealized appreciation (depreciation) on investments and translation of assets and liabilities in foreign currencies | 10,009,959 | ||||
Accumulated net realized gain (loss) on investments and foreign currency transactions | (50,556,139 | ) | |||
Accumulated net investment loss | (116,356 | ) | |||
Net assets | $137,109,910 | ||||
Shares of beneficial interest outstanding | 30,022,946 |
| Net assets | Shares outstanding | Net asset value per share | ||||
Initial Class | $108,641,797 | 23,672,853 | $4.59 | |||
Service Class | 28,468,113 | 6,350,093 | 4.48 |
See Notes to Financial Statements
8
Table of Contents
MFS Mid Cap Growth Series
FINANCIAL STATEMENTS | STATEMENT OF OPERATIONS (unaudited)
This statement describes how much your fund earned in investment income and accrued in expenses. It also describes any gains and/or losses generated by fund operations.
| Six months ended 6/30/10 | ||||||
| Net investment loss | ||||||
Income | ||||||
Dividends | $551,869 | |||||
Interest | 7,447 | |||||
Dividends from underlying funds | 4,581 | |||||
Foreign taxes withheld | (3,420 | ) | ||||
Total investment income | $560,477 | |||||
Expenses | ||||||
Management fee | $546,797 | |||||
Distribution and/or service fees | 38,410 | |||||
Shareholder servicing costs | 8,971 | |||||
Administrative services fee | 15,488 | |||||
Independent Trustees’ compensation | 2,816 | |||||
Custodian fee | 17,890 | |||||
Shareholder communications | 14,775 | |||||
Auditing fees | 23,637 | |||||
Legal fees | 1,375 | |||||
Miscellaneous | 7,149 | |||||
Total expenses | $677,308 | |||||
Fees paid indirectly | (3 | ) | ||||
Reduction of expenses by investment adviser | (472 | ) | ||||
Net expenses | $676,833 | |||||
Net investment loss | $(116,356 | ) | ||||
Realized and unrealized gain (loss) on investments and foreign currency transactions | ||||||
Realized gain (loss) (identified cost basis) | ||||||
Investment transactions | $12,884,558 | |||||
Foreign currency transactions | (29,266 | ) | ||||
Net realized gain (loss) on investments and foreign currency transactions | $12,855,292 | |||||
Change in unrealized appreciation (depreciation) | ||||||
Investments | $(14,438,743 | ) | ||||
Translation of assets and liabilities in foreign currencies | 355 | |||||
Net unrealized gain (loss) on investments and foreign currency translation | $(14,438,388 | ) | ||||
Net realized and unrealized gain (loss) on investments and foreign currency | $(1,583,096 | ) | ||||
Change in net assets from operations | $(1,699,452 | ) |
See Notes to Financial Statements
9
Table of Contents
MFS Mid Cap Growth Series
FINANCIAL STATEMENTS | STATEMENTS OF CHANGES IN NET ASSETS
These statements describe the increases and/or decreases in net assets resulting from operations, any distributions, and any shareholder transactions.
| Six months ended 6/30/10 (unaudited | ) | Year ended 12/31/09 | | |||
Change in net assets | ||||||
From operations | ||||||
Net investment loss | $(116,356 | ) | $(157,527 | ) | ||
Net realized gain (loss) on investments and foreign currency transactions | 12,855,292 | (6,600,187 | ) | |||
Net unrealized gain (loss) on investments and foreign currency translation | (14,438,388 | ) | 47,421,565 | |||
Change in net assets from operations | $(1,699,452 | ) | $40,663,851 | |||
Distributions declared to shareholders | ||||||
From net investment income | $— | $(255,085 | ) | |||
From tax return of capital | — | (490 | ) | |||
Total distributions declared to shareholders | $— | $(255,575 | ) | |||
Change in net assets from fund share transactions | $1,296,014 | $1,528,270 | ||||
Total change in net assets | $(403,438 | ) | $41,936,546 | |||
Net assets | ||||||
At beginning of period | 137,513,348 | 95,576,802 | ||||
At end of period (including accumulated net investment loss | $137,109,910 | $137,513,348 |
See Notes to Financial Statements
10
Table of Contents
MFS Mid Cap Growth Series
FINANCIAL STATEMENTS | FINANCIAL HIGHLIGHTS
The financial highlights table is intended to help you understand the fund’s financial performance for the semiannual period and the past 5 fiscal years. Certain information reflects financial results for a single fund share. The total returns in the table represent the rate by which an investor would have earned (or lost) on an investment in the fund share class (assuming reinvestment of all distributions) held for the entire period.
| Initial Class | Six months ended 6/30/10 | Years ended 12/31 | ||||||||||||||||
| 2009 | 2008 | 2007 | 2006 | 2005 | ||||||||||||||
| (unaudited) | ||||||||||||||||||
Net asset value, beginning of period | $4.62 | $3.27 | $7.66 | $7.25 | $7.30 | $7.08 | ||||||||||||
| Income (loss) from investment operations | ||||||||||||||||||
Net investment income (loss) (d) | $(0.00 | )(w) | $(0.00 | )(w) | $0.01 | $(0.01 | ) | $0.01 | $(0.03 | ) | ||||||||
Net realized and unrealized gain (loss) on investments | (0.03 | ) | 1.36 | (3.55 | ) | 0.71 | 0.18 | 0.25 | ||||||||||
Total from investment operations | $(0.03 | ) | $1.36 | $(3.54 | ) | $0.70 | $0.19 | $0.22 | ||||||||||
| Less distributions declared to shareholders | ||||||||||||||||||
From net investment income | $— | $(0.01 | ) | $— | $(0.01 | ) | $— | $— | ||||||||||
From net realized gain on investments | — | — | (0.85 | ) | (0.28 | ) | (0.24 | ) | — | |||||||||
From tax return of capital | — | (0.00 | )(w) | — | — | — | — | |||||||||||
Total distributions declared to shareholders | $— | $(0.01 | ) | $(0.85 | ) | $(0.29 | ) | $(0.24 | ) | $— | ||||||||
Net asset value, end of period | $4.59 | $4.62 | $3.27 | $7.66 | $7.25 | $7.30 | ||||||||||||
Total return (%) (k)(r)(s) | (0.65 | )(n) | 41.78 | (51.56 | ) | 9.82 | 2.55 | 3.11 | ||||||||||
| Ratios (%) (to average net assets) and Supplemental data: | ||||||||||||||||||
Expenses before expense reductions (f) | 0.88 | (a) | 0.90 | 0.87 | 0.91 | 0.90 | 0.92 | |||||||||||
Expenses after expense reductions (f) | 0.88 | (a) | 0.90 | 0.87 | 0.91 | 0.89 | 0.92 | |||||||||||
Net investment income (loss) | (0.11 | )(a) | (0.09 | ) | 0.21 | (0.10 | ) | 0.19 | (0.40 | ) | ||||||||
Portfolio turnover | 48 | 114 | 104 | 91 | 141 | 86 | ||||||||||||
Net assets at end of period (000 omitted) | $108,642 | $107,989 | $73,066 | $173,048 | $190,684 | $216,765 | ||||||||||||
See Notes to Financial Statements
11
Table of Contents
MFS Mid Cap Growth Series
Financial Highlights – continued
| Service Class | Six months ended 6/30/10 | Years ended 12/31 | ||||||||||||||||
| 2009 | 2008 | 2007 | 2006 | 2005 | ||||||||||||||
| (unaudited) | ||||||||||||||||||
Net asset value, beginning of period | $4.52 | $3.20 | $7.52 | $7.13 | $7.20 | $7.00 | ||||||||||||
| Income (loss) from investment operations | ||||||||||||||||||
Net investment income (loss) (d) | $(0.01 | ) | $(0.01 | ) | $(0.00 | )(w) | $(0.03 | ) | $(0.00 | )(w) | $(0.04 | ) | ||||||
Net realized and unrealized gain (loss) on investments | (0.03 | ) | 1.33 | (3.47 | ) | 0.70 | 0.17 | 0.24 | ||||||||||
Total from investment operations | $(0.04 | ) | $1.32 | $(3.47 | ) | $0.67 | $0.17 | $0.20 | ||||||||||
| Less distributions declared to shareholders | ||||||||||||||||||
From net realized gain on investments | $— | $— | $(0.85 | ) | $(0.28 | ) | $(0.24 | ) | $— | |||||||||
Net asset value, end of period | $4.48 | $4.52 | $3.20 | $7.52 | $7.13 | $7.20 | ||||||||||||
Total return (%) (k)(r)(s) | (0.88 | )(n) | 41.25 | (51.59 | ) | 9.51 | 2.30 | 2.86 | ||||||||||
| Ratios (%) (to average net assets) and Supplemental data: | ||||||||||||||||||
Expenses before expense reductions (f) | 1.13 | (a) | 1.16 | 1.12 | 1.16 | 1.15 | 1.17 | |||||||||||
Expenses after expense reductions (f) | 1.13 | (a) | 1.15 | 1.12 | 1.16 | 1.15 | 1.17 | |||||||||||
Net investment loss | (0.36 | )(a) | (0.33 | ) | (0.05 | ) | (0.35 | ) | (0.02 | ) | (0.66 | ) | ||||||
Portfolio turnover | 48 | 114 | 104 | 91 | 141 | 86 | ||||||||||||
Net assets at end of period (000 omitted) | $28,468 | $29,524 | $22,511 | $48,209 | $41,929 | $40,116 | ||||||||||||
| (a) | Annualized. |
| (d) | Per share data is based on average shares outstanding. |
| (f) | Ratios do not reflect reductions from fees paid indirectly, if applicable. |
| (k) | The total return does not reflect expenses that apply to separate accounts. Inclusion of these charges would reduce the total return figures for all periods shown. |
| (n) | Not annualized. |
| (r) | Certain expenses have been reduced without which performance would have been lower. |
| (s) | From time to time the fund may receive proceeds from litigation settlements, without which performance would be lower. |
| (w) | Per share amount was less than $0.01. |
See Notes to Financial Statements
12
Table of Contents
MFS Mid Cap Growth Series
NOTES TO FINANCIAL STATEMENTS (unaudited)
| (1) | Business and Organization |
MFS Mid Cap Growth Series (the fund) is a series of MFS Variable Insurance Trust (the trust). The trust is organized as a Massachusetts business trust and is registered under the Investment Company Act of 1940, as amended, as an open-end management investment company. The shareholders of each series of the trust are separate accounts of insurance companies, which offer variable annuity and/or life insurance products, and qualified retirement and pension plans.
| (2) | Significant Accounting Policies |
General – The preparation of financial statements in conformity with U.S. generally accepted accounting principles requires management to make estimates and assumptions that affect the reported amounts of assets and liabilities, and disclosure of contingent assets and liabilities at the date of the financial statements and the reported amounts of revenues and expenses during the reporting period. Actual results could differ from those estimates. In the preparation of these financial statements, management has evaluated subsequent events occurring after the date of the fund’s Statement of Assets and Liabilities through the date that the financial statements were issued. The fund can invest in foreign securities, including securities of emerging market issuers. Investments in foreign securities are vulnerable to the effects of changes in the relative values of the local currency and the U.S. dollar and to the effects of changes in each country’s legal, political, and economic environment. The markets of emerging markets countries are generally more volatile than the markets of developed countries with more mature economies. All of the risks of investing in foreign securities previously described are heightened when investing in emerging markets countries.
Investment Valuations – Equity securities, including restricted equity securities, are generally valued at the last sale or official closing price as provided by a third-party pricing service on the market or exchange on which they are primarily traded. Equity securities, for which there were no sales reported that day, are generally valued at the last quoted daily bid quotation as provided by a third-party pricing service on the market or exchange on which such securities are primarily traded. Equity securities held short, for which there were no sales reported for that day, are generally valued at the last quoted daily ask quotation as provided by a third-party pricing service on the market or exchange on which such securities are primarily traded. Short-term instruments with a maturity at issuance of 60 days or less generally are valued at amortized cost, which approximates market value. Open-end investment companies are generally valued at net asset value per share. Securities and other assets generally valued on the basis of information from a third-party pricing service may also be valued at a broker/dealer bid quotation. Values obtained from third-party pricing services can utilize both transaction data and market information such as yield, quality, coupon rate, maturity, type of issue, trading characteristics, and other market data. The values of foreign securities and other assets and liabilities expressed in foreign currencies are converted to U.S. dollars using the mean of bid and asked prices for rates provided by a third-party pricing service.
The Board of Trustees has delegated primary responsibility for determining or causing to be determined the value of the fund’s investments (including any fair valuation) to the adviser pursuant to valuation policies and procedures approved by the Board. If the adviser determines that reliable market quotations are not readily available, investments are valued at fair value as determined in good faith by the adviser in accordance with such procedures under the oversight of the Board of Trustees. Under the fund’s valuation policies and procedures, market quotations are not considered to be readily available for most types of debt instruments and floating rate loans and many types of derivatives. These investments are generally valued at fair value based on information from third-party pricing services. In addition, investments may be valued at fair value if the adviser determines that an investment’s value has been materially affected by events occurring after the close of the exchange or market on which the investment is principally traded (such as foreign exchange or market) and prior to the determination of the fund’s net asset value, or after the halting of trading of a specific security where trading does not resume prior to the close of the exchange or market on which the security is principally traded. Events that occur on a frequent basis after foreign markets close (such as developments in foreign markets and significant movements in the U.S. markets) and prior to the determination of the fund’s net asset value may be deemed to have a material effect on the value of securities traded in foreign markets. Accordingly, the fund’s foreign equity securities may often be valued at fair value. The adviser generally relies on third-party pricing services or other information (such as the correlation with price movements of similar securities in the same or other markets; the type, cost and investment characteristics of the security; the business and financial condition of the issuer; and trading and other market data) to assist in determining whether to fair value and at what value to fair value an investment. The value of an investment for purposes of calculating the fund’s net asset value can differ depending on the source and method used to determine value. When fair valuation is used, the value of an investment used to determine the fund’s net asset value may differ from quoted or published prices for the same investment. There can be no assurance that the fund could obtain the fair value assigned to an investment if it were to sell the investment at the same time at which the fund determines its net asset value per share.
13
Table of Contents
MFS Mid Cap Growth Series
Notes to Financial Statements (unaudited) – continued
Various inputs are used in determining the value of the fund’s assets or liabilities. These inputs are categorized into three broad levels. In certain cases, the inputs used to measure fair value may fall into different levels of the fair value hierarchy. In such cases, an investment’s level within the fair value hierarchy is based on the lowest level of input that is significant to the fair value measurement. The fund’s assessment of the significance of a particular input to the fair value measurement in its entirety requires judgment, and considers factors specific to the investment. Level 1 includes unadjusted quoted prices in active markets for identical assets or liabilities. Level 2 includes other significant observable market-based inputs (including quoted prices for similar securities, interest rates, prepayment speed, and credit risk). Level 3 includes unobservable inputs, which may include the adviser’s own assumptions in determining the fair value of investments. Other financial instruments are derivative instruments not reflected in total investments, such as futures, forwards, swap contracts, and written options. The following is a summary of the levels used as of June 30, 2010 in valuing the fund’s assets or liabilities:
| Investments at Value | Level 1 | Level 2 | Level 3 | Total | ||||
| Equity Securities: | ||||||||
United States | $123,899,716 | $— | $— | $123,899,716 | ||||
Brazil | 4,020,136 | — | — | 4,020,136 | ||||
United Kingdom | — | 1,770,747 | — | 1,770,747 | ||||
Panama | 974,609 | — | — | 974,609 | ||||
Canada | 823,803 | — | — | 823,803 | ||||
China | 737,678 | — | — | 737,678 | ||||
Bermuda | 393,973 | — | — | 393,973 | ||||
Switzerland | — | 393,519 | — | 393,519 | ||||
Netherlands | 261,117 | — | — | 261,117 | ||||
| Mutual Funds | 1,986,842 | — | — | 1,986,842 | ||||
| Total Investments | $133,097,874 | $2,164,266 | $— | $135,262,140 |
For further information regarding security characteristics, see the Portfolio of Investments.
Foreign Currency Translation – Purchases and sales of foreign investments, income, and expenses are converted into U.S. dollars based upon currency exchange rates prevailing on the respective dates of such transactions or on the reporting date for foreign denominated receivables and payables. Gains and losses attributable to foreign currency exchange rates on sales of securities are recorded for financial statement purposes as net realized gains and losses on investments. Gains and losses attributable to foreign exchange rate movements on receivables, payables, income and expenses are recorded for financial statement purposes as foreign currency transaction gains and losses. That portion of both realized and unrealized gains and losses on investments that results from fluctuations in foreign currency exchange rates is not separately disclosed.
Derivatives – The fund may use derivatives for different purposes, including to earn income and enhance returns, to increase or decrease exposure to a particular market, to manage or adjust the risk profile of the fund, or as alternatives to direct investments. Derivatives may be used for hedging or non-hedging purposes. While hedging can reduce or eliminate losses, it can also reduce or eliminate gains. When the fund uses derivatives as an investment to increase market exposure, or for hedging purposes, gains and losses from derivative instruments may be substantially greater than the derivative’s original cost.
Derivative instruments include written options, purchased options, futures contracts, forward foreign currency exchange contracts, and swap agreements. For the six months ended June 30, 2010, the fund did not invest in any derivative instruments.
Short Sales – The fund may enter into short sales whereby it sells a security it does not own in anticipation of a decline in the value of that security. The fund will realize a gain if the security price decreases and a loss if the security price increases between the date of the short sale and the date on which the fund replaces the borrowed security. Losses from short sales can exceed the proceeds of the security sold; and they can also exceed the potential loss from an ordinary buy and sell transaction. The amount of any premium, dividends, or interest the fund may be required to pay in connection with a short sale will be recognized as a fund expense. The fund segregates cash or marketable securities in an amount that, when combined with the amount of proceeds from the short sale deposited with the broker, at least equals the current market value of the security sold short. At June 30, 2010, the fund has yet to enter into such transactions.
Security Loans – State Street Bank and Trust Company (“State Street”), as lending agent, may loan the securities of the fund to certain qualified institutions (the “Borrowers”) approved by the fund. The loans are collateralized by cash and/or U.S. Treasury and federal agency obligations in an amount typically at least equal to the market value of the securities loaned. The market value of the loaned securities is determined at the close of business of the fund and any additional required collateral is delivered to the fund on the next business day. State Street provides the fund with indemnification against Borrower default. The fund bears the risk of loss with respect to the investment of cash collateral. On loans collateralized by cash, the cash collateral is invested in a money market fund or short-term securities. A portion of the income generated upon investment of the collateral is remitted to the Borrowers, and the remainder is allocated between the fund and the lending agent. On loans
14
Table of Contents
MFS Mid Cap Growth Series
Notes to Financial Statements (unaudited) – continued
collateralized by U.S. Treasury and/or federal agency obligations, a fee is received from the Borrower, and is allocated between the fund and the lending agent. Income from securities lending is included in interest income on the Statement of Operations. The dividend and interest income earned on the securities loaned is accounted for in the same manner as other dividend and interest income.
Indemnifications – Under the fund’s organizational documents, its officers and Trustees may be indemnified against certain liabilities and expenses arising out of the performance of their duties to the fund. Additionally, in the normal course of business, the fund enters into agreements with service providers that may contain indemnification clauses. The fund’s maximum exposure under these agreements is unknown as this would involve future claims that may be made against the fund that have not yet occurred.
Investment Transactions and Income – Investment transactions are recorded on the trade date. Interest income is recorded on the accrual basis. All premium and discount is amortized or accreted for financial statement purposes in accordance with U.S. generally accepted accounting principles. Dividends received in cash are recorded on the ex-dividend date. Certain dividends from foreign securities will be recorded when the fund is informed of the dividend if such information is obtained subsequent to the ex-dividend date. Dividend and interest payments received in additional securities are recorded on the ex-dividend or ex-interest date in an amount equal to the value of the security on such date.
The fund may receive proceeds from litigation settlements. Any proceeds received from litigation involving portfolio holdings are reflected in the Statement of Operations in realized gain/loss if the security has been disposed of by the fund or in unrealized gain/loss if the security is still held by the fund. Any other proceeds from litigation not related to portfolio holdings are reflected as other income in the Statement of Operations.
Fees Paid Indirectly – The fund’s custody fee may be reduced according to an arrangement that measures the value of cash deposited with the custodian by the fund. This amount, for the six months ended June 30, 2010, is shown as a reduction of total expenses on the Statement of Operations.
Tax Matters and Distributions – The fund intends to qualify as a regulated investment company, as defined under Subchapter M of the Internal Revenue Code, and to distribute all of its taxable income, including realized capital gains. As a result, no provision for federal income tax is required. The fund’s federal tax returns for the prior three fiscal years remain subject to examination by the Internal Revenue Service. Foreign taxes, if any, have been accrued by the fund in the accompanying financial statements.
Distributions to shareholders are recorded on the ex-dividend date. Income and capital gain distributions are determined in accordance with income tax regulations, which may differ from U.S. generally accepted accounting principles. Certain capital accounts in the financial statements are periodically adjusted for permanent differences in order to reflect their tax character. These adjustments have no impact on net assets or net asset value per share. Temporary differences which arise from recognizing certain items of income, expense, gain or loss in different periods for financial statement and tax purposes will reverse at some time in the future. Distributions in excess of net investment income or net realized gains are temporary overdistributions for financial statement purposes resulting from differences in the recognition or classification of income or distributions for financial statement and tax purposes.
Book/tax differences primarily relate to net operating losses and wash sale loss deferrals.
The tax character of distributions made during the current period, if any, will be determined at fiscal year end. The tax character of distributions declared to shareholders for the last fiscal year is as follows:
| 12/31/09 | ||
| Ordinary income (including any short-term capital gains) | $255,085 | |
| Tax return of capital (b) | 490 | |
| Total distributions | $255,575 |
| (b) | Distributions in excess of tax basis earnings and profits are reported in the financial statements as a tax return of capital. |
15
Table of Contents
MFS Mid Cap Growth Series
Notes to Financial Statements (unaudited) – continued
The federal tax cost and the tax basis components of distributable earnings were as follows:
| As of 6/30/10 | |||
| Cost of investments | $125,533,430 | ||
| Gross appreciation | 14,222,763 | ||
| Gross depreciation | (4,494,053 | ) | |
| Net unrealized appreciation (depreciation) | $9,728,710 | ||
| As of 12/31/09 | |||
| Capital loss carryforwards | (63,130,546 | ) | |
| Other temporary differences | 9 | ||
| Net unrealized appreciation (depreciation) | 24,167,453 | ||
The aggregate cost above includes prior fiscal year end tax adjustments, if applicable.
As of December 31, 2009, the fund had capital loss carryforwards available to offset future realized gains. Such losses expire as follows:
| 12/31/16 | $(53,689,381 | ) | |
| 12/31/17 | (9,441,165 | ) | |
| $(63,130,546 | ) |
Multiple Classes of Shares of Beneficial Interest – The fund offers multiple classes of shares, which differ in their respective distribution and/or service fees. The fund’s income, realized and unrealized gain (loss), and common expenses are allocated to shareholders based on the daily net assets of each class. Dividends are declared separately for each class. Differences in per share dividend rates are generally due to differences in separate class expenses. The fund’s distributions declared to shareholders as reported on the Statements of Changes in Net Assets are presented by class as follows:
| From net investment income | From tax return of capital | |||||||
| Six months ended 6/30/10 | Year ended 12/31/09 | Six months ended 6/30/10 | Year ended 12/31/09 | |||||
| Initial Class | $— | $255,085 | $— | $490 | ||||
| Service Class | — | — | — | — | ||||
| Total | $— | $255,085 | $— | $490 | ||||
| (3) | Transactions with Affiliates |
Investment Adviser – The fund has an investment advisory agreement with MFS to provide overall investment management and related administrative services and facilities to the fund. The management fee is computed daily and paid monthly at the following annual rates:
| First $1 billion of average daily net assets | 0.75% | |
| Average daily net assets in excess of $1 billion | 0.70% |
The management fee incurred for the six months ended June 30, 2010 was equivalent to an annual effective rate of 0.75% of the fund’s average daily net assets.
Distributor – MFS Fund Distributors, Inc. (MFD), a wholly-owned subsidiary of MFS, is the distributor of shares of the fund. The Trustees have adopted a distribution plan for the Service Class shares pursuant to Rule 12b-1 under the Investment Company Act of 1940.
The fund’s distribution plan provides that the fund will pay MFD distribution and/or service fees equal to 0.25% per annum of its average daily net assets attributable to Service Class shares as partial consideration for services performed and expenses incurred by MFD and financial intermediaries (including participating insurance companies that invest in the fund to fund variable annuity and variable life insurance contracts, sponsors of qualified retirement and pension plans that invest in the fund, and affiliates of these participating insurance companies and plan sponsors) in connection with the sale and distribution of the Service Class shares. MFD may subsequently pay all, or a portion, of the distribution and/or service fees to financial intermediaries.
Shareholder Servicing Agent – MFS Service Center, Inc. (MFSC), a wholly-owned subsidiary of MFS, receives a fee from the fund for its services as shareholder servicing agent. For the six months ended June 30, 2010, the fee was $8,733, which equated to 0.0120% annually of the fund’s average daily net assets. MFSC also receives payment from the fund for out-of-pocket expenses paid by MFSC on behalf of the fund. For the six months ended June 30, 2010, these costs amounted to $238.
16
Table of Contents
MFS Mid Cap Growth Series
Notes to Financial Statements (unaudited) – continued
Administrator – MFS provides certain financial, legal, shareholder communications, compliance, and other administrative services to the fund. Under an administrative services agreement, the fund partially reimburses MFS the costs incurred to provide these services. The fund is charged an annual fixed amount of $17,500 plus a fee based on average daily net assets. The administrative services fee incurred for the six months ended June 30, 2010 was equivalent to an annual effective rate of 0.0213% of the fund’s average daily net assets.
Trustees’ and Officers’ Compensation – The fund pays compensation to independent Trustees in the form of a retainer, attendance fees, and additional compensation to Board and Committee chairpersons. The fund does not pay compensation directly to Trustees or officers of the fund who are also officers of the investment adviser, all of whom receive remuneration for their services to the fund from MFS. Certain officers and Trustees of the fund are officers or directors of MFS, MFD, and MFSC.
Other – This fund and certain other funds managed by MFS (the funds) have entered into services agreements (the Agreements) which provide for payment of fees by the funds to Tarantino LLC and Griffin Compliance LLC in return for the provision of services of an Independent Chief Compliance Officer (ICCO) and Assistant ICCO, respectively, for the funds. The ICCO and Assistant ICCO are officers of the funds and the sole members of Tarantino LLC and Griffin Compliance LLC, respectively. The funds can terminate the Agreements with Tarantino LLC and Griffin Compliance LLC at any time under the terms of the Agreements. For the six months ended June 30, 2010, the aggregate fees paid by the fund to Tarantino LLC and Griffin Compliance LLC were $588 and are included in miscellaneous expense on the Statement of Operations. MFS has agreed to reimburse the fund for a portion of the payments made by the fund in the amount of $472, which is shown as a reduction of total expenses in the Statement of Operations. Additionally, MFS has agreed to bear all expenses associated with office space, other administrative support, and supplies provided to the ICCO and Assistant ICCO.
The fund may invest in the MFS Institutional Money Market Portfolio which is managed by MFS and seeks a high level of current income consistent with preservation of capital and liquidity. Income earned on this investment is included in dividends from underlying funds on the Statement of Operations. This money market fund does not pay a management fee to MFS.
| (4) | Portfolio Securities |
Purchases and sales of investments, other than U.S. Government securities, purchased option transactions, and short-term obligations, aggregated $67,045,415 and $66,567,944, respectively.
| (5) | Shares of Beneficial Interest |
The fund’s Declaration of Trust permits the Trustees to issue an unlimited number of full and fractional shares of beneficial interest. Transactions in fund shares were as follows:
| Six months ended 6/30/10 | Year ended 12/31/09 | |||||||||||
| Shares | Amount | Shares | Amount | |||||||||
| Shares sold | ||||||||||||
Initial Class | 2,697,706 | $13,584,833 | 5,473,232 | $19,964,361 | ||||||||
Service Class | 943,796 | 4,560,537 | 1,547,666 | 5,754,128 | ||||||||
| 3,641,502 | $18,145,370 | 7,020,898 | $25,718,489 | |||||||||
| Shares issued to shareholders in reinvestment of distributions | ||||||||||||
Initial Class | — | $— | 75,614 | $255,575 | ||||||||
| Shares reacquired | ||||||||||||
Initial Class | (2,381,999 | ) | $(11,466,887 | ) | (4,502,144 | ) | $(16,929,603 | ) | ||||
Service Class | (1,122,557 | ) | (5,382,469 | ) | (2,052,405 | ) | (7,516,191 | ) | ||||
| (3,504,556 | ) | $(16,849,356 | ) | (6,554,549 | ) | $(24,445,794 | ) | |||||
| Net change | ||||||||||||
Initial Class | 315,707 | $2,117,946 | 1,046,702 | $3,290,333 | ||||||||
Service Class | (178,761 | ) | (821,932 | ) | (504,739 | ) | (1,762,063 | ) | ||||
| 136,946 | $1,296,014 | 541,963 | $1,528,270 | |||||||||
17
Table of Contents
MFS Mid Cap Growth Series
Notes to Financial Statements (unaudited) – continued
| (6) | Line of Credit |
The fund and certain other funds managed by MFS participate in a $1.1 billion unsecured committed line of credit, subject to a $1 billion sublimit, provided by a syndication of banks under a credit agreement. Borrowings may be made for temporary financing needs. Interest is charged to each fund, based on its borrowings, generally at a rate equal to the higher of the Federal Reserve funds rate or one month LIBOR plus an agreed upon spread. A commitment fee, based on the average daily, unused portion of the committed line of credit, is allocated among the participating funds at the end of each calendar quarter. In addition, the fund and other funds managed by MFS have established unsecured uncommitted borrowing arrangements with certain banks for temporary financing needs. Interest is charged to each fund, based on its borrowings, at a rate equal to the Federal Reserve funds rate plus an agreed upon spread. For the six months ended June 30, 2010, the fund’s commitment fee and interest expense were $991 and $0, respectively, and are included in miscellaneous expense on the Statement of Operations.
| (7) | Transactions in Underlying Funds – Affiliated Issuers |
An affiliated issuer may be considered one in which the fund owns 5% or more of the outstanding voting securities, or a company which is under common control. For the purposes of this report, the fund assumes the following to be affiliated issuers:
| Underlying Funds | Beginning Shares/Par Amount | Acquisitions Shares/Par Amount | Dispositions Shares/Par Amount | Ending Shares/Par Amount | |||||
| MFS Institutional Money Market Portfolio | 3,657,594 | 23,703,272 | (25,374,024 | ) | 1,986,842 | ||||
| Underlying Funds | Realized Gain (Loss) | Capital Gain Distributions | Dividend Income | Ending Value | |||||
| MFS Institutional Money Market Portfolio | $— | $— | $4,581 | $1,986,842 | |||||
18
Table of Contents
MFS Mid Cap Growth Series
RESULTS OF SHAREHOLDER MEETING (unaudited)
At a special meeting of shareholders of MFS Variable Insurance Trust, which was held on January 28, 2010, the following actions were taken:
Item 1. To elect the following individuals as Trustees:
| Number of Dollars | ||||
| Nominee | For | Withheld Authority | ||
| Robert E. Butler | 6,823,651,821.26 | 1,818,252,669.55 | ||
| Lawrence H. Cohn, M.D. | 6,813,621,200.14 | 1,828,283,290.67 | ||
| Maureen R. Goldfarb | 6,825,332,620.76 | 1,816,571,870.05 | ||
| David H. Gunning | 6,823,081,841.37 | 1,818,822,649.44 | ||
| William R. Gutow | 6,813,678,877.22 | 1,828,225,613.59 | ||
| Michael Hegarty | 6,827,456,515.87 | 1,814,447,974.94 | ||
| John P. Kavanaugh | 6,830,363,113.12 | 1,811,541,377.69 | ||
| Robert J. Manning | 6,825,511,264.17 | 1,816,393,226.64 | ||
| Robert C. Pozen | 6,824,854,120.27 | 1,817,050,370.54 | ||
| J. Dale Sherratt | 6,816,913,203.87 | 1,824,991,286.94 | ||
| Laurie J. Thomsen | 6,823,590,745.56 | 1,818,313,745.25 | ||
| Robert W. Uek | 6,818,161,803.66 | 1,823,742,687.15 | ||
19
Table of Contents
MFS Mid Cap Growth Series
BOARD REVIEW OF INVESTMENT ADVISORY AGREEMENT
A discussion regarding the Board’s most recent review and renewal of the fund’s Investment Advisory Agreement with MFS will be available on or about November 1, 2010 by clicking on the fund’s name under “Variable Insurance Portfolios — VIT” in the ‘‘Products and Performance’’ section of the MFS Web site (mfs.com).
PROXY VOTING POLICIES AND INFORMATION
A general description of the MFS funds’ proxy voting policies and procedures is available without charge, upon request, by calling
1-800-225-2606, by visiting the Proxy Voting section of mfs.com or by visiting the SEC’s Web site at http://www.sec.gov.
Information regarding how the fund voted proxies relating to portfolio securities during the most recent twelve-month period ended June 30 is available without charge by visiting the Proxy Voting section of mfs.com or by visiting the SEC’s Web site at http://www.sec.gov.
QUARTERLY PORTFOLIO DISCLOSURE
The fund will file a complete schedule of portfolio holdings with the Securities and Exchange Commission (the Commission) for the first and third quarters of each fiscal year on Form N-Q. The fund’s Form N-Q may be reviewed and copied at the:
Public Reference Room
Securities and Exchange Commission
100 F Street, NE, Room 1580
Washington, D.C. 20549
Information on the operation of the Public Reference Room may be obtained by calling the Commission at 1-800-SEC-0330. The fund’s Form N-Q is available on the EDGAR database on the Commission’s Internet Web site at http://www.sec.gov, and copies of this information may be obtained, upon payment of a duplicating fee, by electronic request at the following e-mail address: publicinfo@sec.gov or by writing the Public Reference Section at the above address.
From time to time, MFS may post important information about the fund or the MFS funds on the MFS web site (mfs.com). This information is available by visiting the “News & Commentary” section of mfs.com or by clicking on the fund’s name under “Variable Insurance Portfolios — VIT” in the “Products and Performance” section of mfs.com.
20
Table of Contents

Table of Contents

Table of Contents
This report is prepared for the general information of contract owners. It is authorized for distribution to prospective investors only when preceded or accompanied by a current prospectus.
NOT FDIC INSURED Ÿ MAY LOSE VALUE Ÿ NO BANK GUARANTEE Ÿ NOT A DEPOSIT Ÿ NOT INSURED BY ANY FEDERAL GOVERNMENT AGENCY OR NCUA/NCUSIF
Table of Contents
MFS New Discovery Series

Dear Contract Owners:
After having suffered their biggest declines since the Great Depression, most global markets experienced an impressive resurgence during the latter months of 2009 and the first quarter of 2010. The global economy was able to reap the benefits of two major trends. The first of these was the massive efforts of governments and central banks to increase liquidity in the financial system as they sought to prevent the credit crisis from further affecting the banking system. The second was the move by companies around the world to cut costs and operations to prepare for rapidly changing market conditions. We believe that these moves not only shortened the length of the downturn but also set the stage for recovery.
Even with the significant market gains of 2009 and the early part of 2010, the recovery is unrolling at a moderate pace, with rebounds in the manufacturing sector and corporate America leading the way. Central bankers are proceeding with caution and many have held benchmark interest rates unchanged as they debate the best way to withdraw stimulus measures without disrupting the fragile growth process. Complicating that debate late in the period was the emergence of the European debt crisis and worries about whether this crisis could derail the global recovery. As that crisis unrolled with no clear resolution, risk aversion rose along with volatility. Weakening economic data late in the period added uncertainty to the mix and sparked a retrenchment in global equity markets.
While hurdles remain, we believe that the global economy is proceeding on the road to recovery. As always, we continue to be mindful of the many challenges faced at the individual, national, and international levels. It is at times such as these that we want to remind investors of the merits of maintaining a long-term view, adhering to basic investing principles such as asset allocation and diversification, and working closely with advisors to identify and research investment opportunities. At MFS®, we take particular pride in how well mutual funds can provide a broad range of products that can fit investor needs in any type of market climate.
Respectfully,

Robert J. Manning
Chairman and Chief Executive Officer
MFS Investment Management®
August 16, 2010
The opinions expressed in this letter are subject to change, may not be relied upon for investment advice, and no forecasts can be guaranteed.
MFS Fund Distributors, Inc., 500 Boylston Street, Boston, MA 02116
1
Table of Contents
MFS New Discovery Series
Portfolio structure
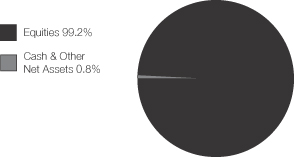
| Top ten holdings | ||
| EXCO Resources, Inc. | 2.1% | |
| NetLogic Microsystems, Inc. | 1.7% | |
| DexCom, Inc. | 1.6% | |
| Hittite Microwave Corp. | 1.6% | |
| Lincare Holdings, Inc. | 1.6% | |
| Iluka Resources Ltd. | 1.5% | |
| NxStage Medical, Inc. | 1.5% | |
| Sensata Technologies Holding B.V. | 1.5% | |
| Gen-Probe, Inc. | 1.5% | |
| Constant Contact, Inc. | 1.5% |
| Equity sectors | ||
| Health Care | 29.0% | |
| Technology | 25.1% | |
| Special Products & Services | 8.3% | |
| Retailing | 6.3% | |
| Energy | 5.4% | |
| Leisure | 5.1% | |
| Consumer Staples | 4.9% | |
| Industrial Goods & Services | 4.5% | |
| Basic Materials | 4.5% | |
| Financial Services | 2.3% | |
| Transportation | 1.9% | |
| Autos & Housing | 1.0% | |
| Utilities & Communications | 0.9% |
Percentages are based on net assets as of 6/30/10.
The portfolio is actively managed and current holdings may be different.
2
Table of Contents
MFS New Discovery Series
After having suffered through one of the largest and most concentrated downturns since the 1930s, most asset markets staged a remarkable rebound during 2009 and early 2010. This recovery in global activity has been led importantly by emerging Asian economies, but broadening to include most of the global economy to varying degrees. Primary drivers of the recovery included an unwinding of the inventory destocking that took place earlier, the production of manufacturing and capital goods, as well as massive fiscal and monetary stimulus.
Late in the period, though, heightened risk surrounding the public-debt profiles of several of the peripheral European countries impaired market sentiment. At the same time, the improving trend in global macroeconomic data began to weaken somewhat. These two dynamics caused most asset prices to retrench significantly, as many questioned the durability of the global recovery.
3
Table of Contents
MFS New Discovery Series
Fund Expenses Borne by the Contract Holders During the Period, January 1, 2010 through June 30, 2010
As a contract holder of the fund, you incur ongoing costs, including management fees; distribution and/or service (12b-1) fees; and other fund expenses. This example is intended to help you understand your ongoing costs (in dollars) of investing in the fund and to compare these costs with the ongoing costs of investing in other mutual funds.
The example is based on an investment of $1,000 invested at the beginning of the period and held for the entire period January 1, 2010 through June 30, 2010.
Actual Expenses
The first line for each share class in the following table provides information about actual account values and actual expenses. You may use the information in this line, together with the amount you invested, to estimate the expenses that you paid over the period. Simply divide your account value by $1,000 (for example, an $8,600 account value divided by $1,000 = 8.6), then multiply the result by the number in the first line under the heading entitled “Expenses Paid During Period” to estimate the expenses you paid on your account during this period.
Hypothetical Example for Comparison Purposes
The second line for each share class in the following table provides information about hypothetical account values and hypothetical expenses based on the fund’s actual expense ratio and an assumed rate of return of 5% per year before expenses, which is not the fund’s actual return. The hypothetical account values and expenses may not be used to estimate the actual ending account balance or expenses you paid for the period. You may use this information to compare the ongoing costs of investing in the fund and other funds. To do so, compare this 5% hypothetical example with the 5% hypothetical examples that appear in the shareholder reports of the other funds.
Please note that the expenses shown in the table are meant to highlight the fund’s ongoing costs only and do not take into account the fees and expenses imposed under the variable contracts through which your investment in the fund is made. Therefore, the second line for each share class in the table is useful in comparing ongoing costs associated with an investment in vehicles (such as the fund) which fund benefits under variable annuity and variable life insurance contracts and to qualified pension and retirement plans only, and will not help you determine the relative total costs of investing in the fund through variable annuity and variable life insurance contracts. If the fees and expenses imposed under the variable contracts were included, your costs would have been higher.
| Share Class | Annualized Expense Ratio | Beginning Account Value 1/01/10 | Ending Account Value 6/30/10 | Expenses Paid During Period (p) 1/01/10-6/30/10 | ||||||
| Initial Class | Actual | 1.02% | $1,000.00 | $1,021.59 | $5.11 | |||||
| Hypothetical (h) | 1.02% | $1,000.00 | $1,019.74 | $5.11 | ||||||
| Service Class | Actual | 1.27% | $1,000.00 | $1,019.92 | $6.36 | |||||
| Hypothetical (h) | 1.27% | $1,000.00 | $1,018.50 | $6.36 |
| (h) | 5% class return per year before expenses. |
| (p) | Expenses paid is equal to each class’ annualized expense ratio, as shown above, multiplied by the average account value over the period, multiplied by the number of days in the period, divided by the number of days in the year. |
4
Table of Contents
MFS New Discovery Series
PORTFOLIO OF INVESTMENTS – 6/30/10 (unaudited)
The Portfolio of Investments is a complete list of all securities owned by your fund. It is categorized by broad-based asset classes.
| Issuer | Shares/Par | Value ($) | |||
| COMMON STOCKS – 99.2% | |||||
| Airlines – 0.5% | |||||
| Copa Holdings S.A., “A” | 66,540 | $ | 2,942,400 | ||
| Apparel Manufacturers – 0.4% | |||||
| Stella International Holdings | 1,157,500 | $ | 2,226,732 | ||
| Biotechnology – 2.5% | |||||
| Alimera Sciences, Inc. (a) | 95,130 | $ | 707,767 | ||
| Gen-Probe, Inc. (a) | 205,040 | 9,312,917 | |||
| Human Genome Sciences, Inc. (a) | 246,360 | 5,582,518 | |||
| $ | 15,603,202 | ||||
| Brokerage & Asset Managers – 0.6% | |||||
| Stifel Financial Corp. (a) | 64,870 | $ | 2,814,709 | ||
| Thomas Weisel Partners Group (a) | 180,400 | 1,062,556 | |||
| $ | 3,877,265 | ||||
| Business Services – 5.9% | |||||
| Concur Technologies, Inc. (a) | 139,870 | $ | 5,969,652 | ||
| Constant Contact, Inc. (a) | 424,342 | 9,051,215 | |||
| CoStar Group, Inc. (a) | 221,880 | 8,608,944 | |||
| Higher One Holdings, Inc. (a) | 136,460 | 1,978,670 | |||
| IFM Investments Ltd., ADR (a) | 161,250 | 843,338 | |||
| Redecard S.A. | 5,400 | 76,288 | |||
| Ultimate Software Group, Inc. (a) | 143,380 | 4,711,467 | |||
| Verisk Analytics, Inc., “A” (a) | 162,500 | 4,858,750 | |||
| $ | 36,098,324 | ||||
| Computer Software – 7.9% | |||||
| ArcSight, Inc. (a) | 228,260 | $ | 5,110,741 | ||
| Ariba, Inc. (a) | 331,820 | 5,285,893 | |||
| Autonomy Corp. PLC (a) | 282,920 | 7,635,505 | |||
| Blackboard, Inc. (a) | 236,110 | 8,813,986 | |||
| Nuance Communications, Inc. (a) | 325,724 | 4,869,574 | |||
| Salesforce.com, Inc. (a) | 71,600 | 6,144,712 | |||
| SolarWinds, Inc. (a) | 253,510 | 4,066,300 | |||
| Sourcefire, Inc. (a) | 82,040 | 1,558,760 | |||
| SuccessFactors, Inc. (a) | 258,800 | 5,380,452 | |||
| $ | 48,865,923 | ||||
| Computer Software – Systems – 0.6% | |||||
| PROS Holdings, Inc. (a) | 534,580 | $ | 3,474,770 | ||
| Construction – 1.0% | |||||
| NVR, Inc. (a) | 9,660 | $ | 6,327,590 | ||
| Consumer Products – 3.3% | |||||
| Colgate-Palmolive (India) Ltd. | 212,423 | $ | 3,794,981 | ||
| Dabur India Ltd. | 615,210 | 2,770,087 | |||
| Hengan International Group Co. Ltd. | 388,500 | 3,134,811 | |||
| Hypermarcas S.A. (a) | 223,700 | 2,872,779 | |||
| L’Occitane International S.A. (a) | 1,952,750 | 4,258,138 | |||
| Natura Cosmeticos S.A. | 166,540 | 3,690,637 | |||
| $ | 20,521,433 | ||||
| Issuer | Shares/Par | Value ($) | |||
| COMMON STOCKS – continued | |||||
| Consumer Services – 1.8% | |||||
| Anhanguera Educacional Participacoes S.A., IEU | 451,300 | $ | 6,823,256 | ||
| Capella Education Co. (a) | 55,380 | 4,505,163 | |||
| $ | 11,328,419 | ||||
| Electrical Equipment – 1.5% | |||||
| Sensata Technologies Holding B.V. (a) | 587,680 | $ | 9,397,003 | ||
| Electronics – 7.3% | |||||
| ARM Holdings PLC | 1,356,810 | $ | 5,613,662 | ||
| DynaVox, Inc., “A” (a) | 345,060 | 5,524,411 | |||
| Fabrinet (a) | 474,740 | 5,079,718 | |||
| Hittite Microwave Corp. (a) | 220,720 | 9,875,013 | |||
| NetLogic Microsystems, Inc. (a) | 374,940 | 10,198,368 | |||
| Silicon Laboratories, Inc. (a) | 210,620 | 8,542,747 | |||
| $ | 44,833,919 | ||||
| Energy – Independent – 4.2% | |||||
| Continental Resources, Inc. (a) | 130,160 | $ | 5,807,739 | ||
| Denbury Resources, Inc. (a) | 195,000 | 2,854,800 | |||
| EXCO Resources, Inc. | 863,930 | 12,622,017 | |||
| Oasis Petroleum LLC (a) | 308,860 | 4,478,470 | |||
| $ | 25,763,026 | ||||
| Engineering – Construction – 1.1% | |||||
| North American Energy Partners, Inc. (a) | 759,130 | $ | 6,703,118 | ||
| Food & Beverages – 1.6% | |||||
| Green Mountain Coffee Roasters, Inc. (a) | 216,840 | $ | 5,572,788 | ||
| Mead Johnson Nutrition Co., “A” | 87,940 | 4,407,553 | |||
| $ | 9,980,341 | ||||
| Forest & Paper Products – 1.0% | |||||
| Universal Forest Products, Inc. | 201,820 | $ | 6,117,164 | ||
| Gaming & Lodging – 0.6% | |||||
| Morgans Hotel Group Co. (a) | 585,790 | $ | 3,608,466 | ||
| Health Maintenance Organizations – 0.4% | |||||
| OdontoPrev S.A. | 73,900 | $ | 2,575,241 | ||
| Internet – 3.4% | |||||
| Art Technology Group, Inc. (a) | 618,760 | $ | 2,116,159 | ||
| GSI Commerce, Inc. (a) | 151,830 | 4,372,704 | |||
| LogMeIn, Inc. (a) | 88,180 | 2,312,961 | |||
| Rackspace Hosting, Inc. (a) | 263,040 | 4,824,154 | |||
| Shutterfly, Inc. (a) | 129,490 | 3,102,580 | |||
| TechTarget, Inc. (a) | 812,716 | 4,372,412 | |||
| $ | 21,100,970 | ||||
| Machinery & Tools – 1.9% | |||||
| Bucyrus International, Inc. | 190,150 | $ | 9,022,618 | ||
| Douglas Dynamics, Inc. (a) | 157,950 | 1,816,425 | |||
| Jain Irrigation Systems Ltd. | 49,467 | 1,130,498 | |||
| $ | 11,969,541 | ||||
5
Table of Contents
MFS New Discovery Series
Portfolio of Investments (unaudited) – continued
| Issuer | Shares/Par | Value ($) | |||
| COMMON STOCKS – continued | |||||
| Medical & Health Technology & Services – 14.4% | |||||
| Allscripts Healthcare Solutions, Inc. (a) | 441,590 | $ | 7,109,599 | ||
| Brookdale Senior Living, Inc. (a) | 548,435 | 8,226,525 | |||
| Cerner Corp. (a) | 89,390 | 6,783,807 | |||
| DaVita, Inc. (a) | 100,300 | 6,262,732 | |||
| Diagnosticos da America S.A. | 702,600 | 6,613,393 | |||
| Fleury S.A. (a) | 321,200 | 3,557,223 | |||
| Healthcare Services Group, Inc. | 361,180 | 6,844,361 | |||
| IDEXX Laboratories, Inc. (a) | 118,826 | 7,236,503 | |||
| IPC The Hospitalist Co., Inc. (a) | 317,710 | 7,974,521 | |||
| Lincare Holdings, Inc. | 299,600 | 9,739,996 | |||
| MedAssets, Inc. (a) | 252,950 | 5,838,086 | |||
| MEDNAX, Inc. (a) | 94,060 | 5,230,677 | |||
| MWI Veterinary Supply, Inc. (a) | 139,545 | 7,013,532 | |||
| $ | 88,430,955 | ||||
| Medical Equipment – 10.5% | |||||
| AGA Medical Holdings, Inc. (a) | 324,160 | $ | 4,113,590 | ||
| Align Technology, Inc. (a) | 157,520 | 2,342,322 | |||
| Conceptus, Inc. (a) | 104,550 | 1,628,889 | |||
| DexCom, Inc. (a) | 871,465 | 10,074,135 | |||
| Edwards Lifesciences Corp. (a) | 126,780 | 7,102,216 | |||
| Heartware International, Inc. (a) | 81,392 | 5,703,137 | |||
| Masimo Corp. | 270,200 | 6,433,462 | |||
| NxStage Medical, Inc. (a) | 633,817 | 9,405,844 | |||
| Orthovita, Inc. (a) | 1,012,670 | 2,055,720 | |||
| ResMed, Inc. (a) | 141,450 | 8,601,575 | |||
| Thoratec Corp. (a) | 161,980 | 6,921,405 | |||
| $ | 64,382,295 | ||||
| Metals & Mining – 2.4% | |||||
| Globe Specialty Metals, Inc. (a) | 534,070 | $ | 5,516,943 | ||
| Iluka Resources Ltd. (a) | 2,433,550 | 9,426,264 | |||
| $ | 14,943,207 | ||||
| Network & Telecom – 5.9% | |||||
| Acme Packet, Inc. (a) | 263,190 | $ | 7,074,547 | ||
| Ciena Corp. (a) | 385,400 | 4,886,872 | |||
| F5 Networks, Inc. (a) | 111,320 | 7,633,212 | |||
| Fortinet, Inc. (a) | 289,100 | 4,752,804 | |||
| Polycom, Inc. (a) | 208,240 | 6,203,470 | |||
| Riverbed Technology, Inc. (a) | 212,970 | 5,882,231 | |||
| $ | 36,433,136 | ||||
| Oil Services – 1.2% | |||||
| Dresser-Rand Group, Inc. (a) | 239,980 | $ | 7,571,369 | ||
| Other Banks & Diversified Financials – 0.8% | |||||
| First Interstate BancSystem, Inc. | 137,730 | $ | 2,166,493 | ||
| Metro Bancorp, Inc. (a) | 209,130 | 2,580,664 | |||
| $ | 4,747,157 | ||||
| Pharmaceuticals – 1.2% | |||||
| Auxilium Pharmaceuticals, Inc. (a) | 63,800 | $ | 1,499,300 | ||
| Eurand N.V. (a) | 264,840 | 2,566,300 | |||
| Genomma Lab Internacional S.A., “B” (a) | 1,000,100 | 3,321,281 | |||
| $ | 7,386,881 | ||||
| Issuer | Shares/Par | Value ($) | |||
| COMMON STOCKS – continued | |||||
| Precious Metals & Minerals – 0.5% | |||||
| Stillwater Mining Co. (a) | 241,210 | $ | 2,802,860 | ||
| Printing & Publishing – 2.4% | |||||
| MSCI, Inc., “A” (a) | 315,430 | $ | 8,642,782 | ||
| VistaPrint Ltd. (a) | 130,080 | 6,177,499 | |||
| $ | 14,820,281 | ||||
| Railroad & Shipping – 1.4% | |||||
| Aegean Marine Petroleum Network, Inc. | 426,700 | $ | 8,525,466 | ||
| Real Estate – 0.9% | |||||
| Brasil Brokers Participacoes | 991,300 | $ | 3,196,325 | ||
| Chesapeake Lodging Trust, REIT (a) | 147,290 | 2,330,128 | |||
| $ | 5,526,453 | ||||
| Restaurants – 2.1% | |||||
| P.F. Chang’s China Bistro, Inc. | 211,780 | $ | 8,397,077 | ||
| Peet’s Coffee & Tea, Inc. (a) | 41,360 | 1,624,207 | |||
| Texas Roadhouse, Inc., “A” (a) | 216,840 | 2,736,521 | |||
| $ | 12,757,805 | ||||
| Special Products & Services – 0.6% | |||||
| PICO Holdings, Inc. (a) | 120,960 | $ | 3,625,171 | ||
| Specialty Chemicals – 0.6% | |||||
| Asian Paints Ltd. | 72,326 | $ | 3,560,636 | ||
| Specialty Stores – 5.9% | |||||
| Blue Nile, Inc. (a) | 77,340 | $ | 3,641,167 | ||
| Citi Trends, Inc. (a) | 192,040 | 6,325,798 | |||
| hhgregg, Inc. (a) | 186,050 | 4,338,686 | |||
| Monro Muffler Brake, Inc. | 158,890 | 6,280,922 | |||
| Rue21, Inc. (a) | 143,820 | 4,363,499 | |||
| Titan Machinery, Inc. (a) | 456,660 | 5,995,946 | |||
| Vitacost.Com, Inc. (a) | 396,590 | 3,565,344 | |||
| Zumiez, Inc. (a) | 90,210 | 1,453,283 | |||
| $ | 35,964,645 | ||||
| Telecommunications – Wireless – 0.9% | |||||
| SBA Communications Corp. (a) | 156,640 | $ | 5,327,326 | ||
| Total Common Stocks (Identified Cost, $594,547,406) | $ | 610,120,490 | |||
| Strike Price | First Exercise | |||||||||
| WARRANTS – 0.0% | ||||||||||
| Alcoholic Beverages – 0.0% | ||||||||||
| Castle Brands, Inc. (1 share for 1 warrant) (Identified Cost, $166,679) (a)(z) | $ | 6.57 | 5/08/07 | 118,680 | $ | 1,374 | ||||
6
Table of Contents
MFS New Discovery Series
Portfolio of Investments (unaudited) – continued
| Issuer | Shares/Par | Value ($) | ||||
| MONEY MARKET FUNDS (v) – 0.9% | ||||||
| MFS Institutional Money Market Portfolio, 0.22%, at Cost and Net Asset Value | 5,305,068 | $ | 5,305,068 | |||
| Total Investments (Identified Cost, $600,019,153) | $ | 615,426,932 | ||||
| OTHER ASSETS, LESS LIABILITIES – (0.1)% | (629,883 | ) | ||||
| Net Assets – 100.0% | $ | 614,797,049 | ||||
| (a) | Non-income producing security. |
| (v) | Underlying fund that is available only to investment companies managed by MFS. The rate quoted is the annualized seven-day yield of the fund at period end. |
| (z) | Restricted securities are not registered under the Securities Act of 1933 and are subject to legal restrictions on resale. These securities generally may be resold in transactions exempt from registration or to the public if the securities are subsequently registered. Disposal of these securities may involve time-consuming negotiations and prompt sale at an acceptable price may be difficult. The fund holds the following restricted securities: |
| Restricted Securities | Acquisition Date | Cost | Current Market Value | |||
| Castle Brands, Inc. (Warrants) | 4/18/07 | $166,679 | $1,374 | |||
| % of Net Assets | 0.0% |
The following abbreviations are used in this report and are defined:
| ADR | American Depository Receipt |
| IEU | International Equity Unit |
| PLC | Public Limited Company |
| REIT | Real Estate Investment Trust |
See Notes to Financial Statements
7
Table of Contents
MFS New Discovery Series
FINANCIAL STATEMENTS | STATEMENT OF ASSETS AND LIABILITIES (unaudited)
This statement represents your fund’s balance sheet, which details the assets and liabilities comprising the total value of the fund.
At 6/30/10 | |||||
Assets | |||||
Investments – | |||||
Non-affiliated issuers, at value (identified cost, $594,714,085) | $610,121,864 | ||||
Underlying funds, at cost and value | 5,305,068 | ||||
Total investments, at value (identified cost, $600,019,153) | $615,426,932 | ||||
Foreign currency, at value (identified cost, $339,280) | 335,811 | ||||
Receivables for | |||||
Investments sold | 8,228,167 | ||||
Fund shares sold | 288,824 | ||||
Interest and dividends | 82,895 | ||||
Other assets | 3,662 | ||||
Total assets | $624,366,291 | ||||
Liabilities | |||||
Payable to custodian | $8,015 | ||||
Payables for | |||||
Investments purchased | 8,084,747 | ||||
Fund shares reacquired | 876,229 | ||||
Payable to affiliates | |||||
Investment adviser | 31,129 | ||||
Shareholder servicing costs | 593 | ||||
Distribution and/or service fees | 3,091 | ||||
Administrative services fee | 523 | ||||
Payable for independent Trustees’ compensation | 1,833 | ||||
Accrued expenses and other liabilities | 563,082 | ||||
Total liabilities | $9,569,242 | ||||
Net assets | $614,797,049 | ||||
Net assets consist of | |||||
Paid-in capital | $641,706,198 | ||||
Unrealized appreciation (depreciation) on investments and translation of assets and liabilities in foreign currencies (net of $290,434 deferred country tax) | 15,113,651 | ||||
Accumulated net realized gain (loss) on investments and foreign currency transactions | (40,217,877 | ) | |||
Accumulated net investment loss | (1,804,923 | ) | |||
Net assets | $614,797,049 | ||||
Shares of beneficial interest outstanding | 45,309,601 |
| Net assets | Shares outstanding | Net asset value per share | ||||
Initial Class | $394,813,775 | 28,780,616 | $13.72 | |||
Service Class | 219,983,274 | 16,528,985 | 13.31 |
See Notes to Financial Statements
8
Table of Contents
MFS New Discovery Series
FINANCIAL STATEMENTS | STATEMENT OF OPERATIONS (unaudited)
This statement describes how much your fund earned in investment income and accrued in expenses. It also describes any gains and/or losses generated by fund operations.
Six months ended 6/30/10 | ||||||
Net investment loss | ||||||
Income | ||||||
Dividends | $1,807,019 | |||||
Interest | 37,956 | |||||
Dividends from underlying funds | 3,938 | |||||
Foreign taxes withheld | (7,708 | ) | ||||
Total investment income | $1,841,205 | |||||
Expenses | ||||||
Management fee | $2,924,023 | |||||
Distribution and/or service fees | 286,213 | |||||
Shareholder servicing costs | 39,764 | |||||
Administrative services fee | 51,271 | |||||
Independent Trustees’ compensation | 9,954 | |||||
Custodian fee | 123,472 | |||||
Shareholder communications | 118,755 | |||||
Auditing fees | 24,372 | |||||
Legal fees | 6,013 | |||||
Miscellaneous | 18,856 | |||||
Total expenses | $3,602,693 | |||||
Fees paid indirectly | (265 | ) | ||||
Reduction of expenses by investment adviser | (2,113 | ) | ||||
Net expenses | $3,600,315 | |||||
Net investment loss | $(1,759,110 | ) | ||||
Realized and unrealized gain (loss) on investments and foreign currency transactions | ||||||
Realized gain (loss) (identified cost basis) | ||||||
Investment transactions (net of $174,406 country tax) | $62,010,137 | |||||
Foreign currency transactions | (135,910 | ) | ||||
Net realized gain (loss) on investments and foreign currency transactions | $61,874,227 | |||||
Change in unrealized appreciation (depreciation) | ||||||
Investments (net of $10,348 increase in deferred country tax) | $(46,826,647 | ) | ||||
Translation of assets and liabilities in foreign currencies | (4,112 | ) | ||||
Net unrealized gain (loss) on investments and foreign currency translation | $(46,830,759 | ) | ||||
Net realized and unrealized gain (loss) on investments and foreign currency | $15,043,468 | |||||
Change in net assets from operations | $13,284,358 |
See Notes to Financial Statements
9
Table of Contents
MFS New Discovery Series
FINANCIAL STATEMENTS | STATEMENTS OF CHANGES IN NET ASSETS
These statements describe the increases and/or decreases in net assets resulting from operations, any distributions, and any shareholder transactions.
| Six months ended 6/30/10 (unaudited | ) | Year ended 12/31/09 | | |||
Change in net assets | ||||||
| From operations | ||||||
Net investment loss | $(1,759,110 | ) | $(3,294,332 | ) | ||
Net realized gain (loss) on investments and foreign currency transactions | 61,874,227 | 60,533,291 | ||||
Net unrealized gain (loss) on investments and foreign currency translation | (46,830,759 | ) | 191,879,268 | |||
Change in net assets from operations | $13,284,358 | $249,118,227 | ||||
Change in net assets from fund share transactions | $(41,510,777 | ) | $(21,111,266 | ) | ||
Total change in net assets | $(28,226,419 | ) | $228,006,961 | |||
Net assets | ||||||
At beginning of period | 643,023,468 | 415,016,507 | ||||
At end of period (including accumulated net investment loss of $1,804,923 and | $614,797,049 | $643,023,468 |
See Notes to Financial Statements
10
Table of Contents
MFS New Discovery Series
FINANCIAL STATEMENTS | FINANCIAL HIGHLIGHTS
The financial highlights table is intended to help you understand the fund’s financial performance for the semiannual period and the past 5 fiscal years. Certain information reflects financial results for a single fund share. The total returns in the table represent the rate by which an investor would have earned (or lost) on an investment in the fund share class (assuming reinvestment of all distributions) held for the entire period.
| Initial Class | Six months ended 6/30/10 | Years ended 12/31 | ||||||||||||||||
| 2009 | 2008 | 2007 | 2006 | 2005 | ||||||||||||||
| (unaudited) | ||||||||||||||||||
Net asset value, beginning of period | $13.43 | $8.23 | $16.63 | $17.42 | $15.65 | $14.87 | ||||||||||||
| Income (loss) from investment operations | ||||||||||||||||||
Net investment loss (d) | $(0.03 | ) | $(0.06 | ) | $(0.04 | ) | $(0.09 | ) | $(0.10 | ) | $(0.09 | ) | ||||||
Net realized and unrealized gain (loss) on | 0.32 | 5.26 | (5.54 | ) | 0.58 | 2.16 | 0.87 | |||||||||||
Total from investment operations | $0.29 | $5.20 | $(5.58 | ) | $0.49 | $2.06 | $0.78 | |||||||||||
| Less distributions declared to shareholders | ||||||||||||||||||
From net realized gain on investments | $— | $— | $(2.82 | ) | $(1.28 | ) | $(0.29 | ) | $— | |||||||||
Net asset value, end of period | $13.72 | $13.43 | $8.23 | $16.63 | $17.42 | $15.65 | ||||||||||||
Total return (%) (k)(r)(s) | 2.16 | (n) | 63.18 | (39.33 | ) | 2.52 | 13.22 | 5.25 | ||||||||||
| Ratios (%) (to average net assets) and Supplemental data: | ||||||||||||||||||
Expenses before expense reductions (f) | 1.02 | (a) | 1.03 | 1.01 | 1.01 | 1.03 | 1.06 | |||||||||||
Expenses after expense reductions (f) | 1.02 | (a) | 1.03 | 1.01 | 1.01 | 1.03 | 1.06 | |||||||||||
Net investment loss | (0.45 | )(a) | (0.57 | ) | (0.36 | ) | (0.50 | ) | (0.63 | ) | (0.61 | ) | ||||||
Portfolio turnover | 81 | 158 | 121 | 95 | 106 | 132 | ||||||||||||
Net assets at end of period (000 omitted) | $394,814 | $423,042 | $289,596 | $520,726 | $533,322 | $406,190 | ||||||||||||
See Notes to Financial Statements
11
Table of Contents
MFS New Discovery Series
Financial Highlights – continued
| Service Class | Six months ended 6/30/10 | Years ended 12/31 | ||||||||||||||||
| 2009 | 2008 | 2007 | 2006 | 2005 | ||||||||||||||
| (unaudited) | ||||||||||||||||||
Net asset value, beginning of period | $13.05 | $8.01 | $16.31 | $17.15 | $15.45 | $14.71 | ||||||||||||
| Income (loss) from investment operations | ||||||||||||||||||
Net investment loss (d) | $(0.05 | ) | $(0.08 | ) | $(0.07 | ) | $(0.13 | ) | $(0.14 | ) | $(0.12 | ) | ||||||
Net realized and unrealized gain (loss) on | 0.31 | 5.12 | (5.41 | ) | 0.57 | 2.13 | 0.86 | |||||||||||
Total from investment operations | $0.26 | $5.04 | $(5.48 | ) | $0.44 | $1.99 | $0.74 | |||||||||||
| Less distributions declared to shareholders | ||||||||||||||||||
From net realized gain on investments | $— | $— | $(2.82 | ) | $(1.28 | ) | $(0.29 | ) | $— | |||||||||
Net asset value, end of period | $13.31 | $13.05 | $8.01 | $16.31 | $17.15 | $15.45 | ||||||||||||
Total return (%) (k)(r)(s) | 1.99 | (n) | 62.92 | (39.52 | ) | 2.25 | 12.93 | 5.03 | ||||||||||
| Ratios (%) (to average net assets) and Supplemental data: | ||||||||||||||||||
Expenses before expense reductions (f) | 1.27 | (a) | 1.28 | 1.26 | 1.26 | 1.28 | 1.30 | |||||||||||
Expenses after expense reductions (f) | 1.27 | (a) | 1.28 | 1.26 | 1.26 | 1.28 | 1.30 | |||||||||||
Net investment loss | (0.70 | )(a) | (0.82 | ) | (0.60 | ) | (0.75 | ) | (0.88 | ) | (0.86 | ) | ||||||
Portfolio turnover | 81 | 158 | 121 | 95 | 106 | 132 | ||||||||||||
Net assets at end of period (000 omitted) | $219,983 | $219,982 | $125,421 | $242,510 | $285,511 | $296,399 | ||||||||||||
| (a) | Annualized. |
| (d) | Per share data is based on average shares outstanding. |
| (f) | Ratios do not reflect reductions from fees paid indirectly, if applicable. |
| (k) | The total return does not reflect expenses that apply to separate accounts. Inclusion of these charges would reduce the total return figures for all periods shown. |
| (n) | Not annualized. |
| (r) | Certain expenses have been reduced without which performance would have been lower. |
| (s) | From time to time the fund may receive proceeds from litigation settlements, without which performance would be lower. |
See Notes to Financial Statements
12
Table of Contents
MFS New Discovery Series
NOTES TO FINANCIAL STATEMENTS (unaudited)
| (1) | Business and Organization |
MFS New Discovery Series (the fund) is a series of MFS Variable Insurance Trust (the trust). The trust is organized as a Massachusetts business trust and is registered under the Investment Company Act of 1940, as amended, as an open-end management investment company. The shareholders of each series of the trust are separate accounts of insurance companies, which offer variable annuity and/or life insurance products, and qualified retirement and pension plans.
| (2) | Significant Accounting Policies |
General – The preparation of financial statements in conformity with U.S. generally accepted accounting principles requires management to make estimates and assumptions that affect the reported amounts of assets and liabilities, and disclosure of contingent assets and liabilities at the date of the financial statements and the reported amounts of revenues and expenses during the reporting period. Actual results could differ from those estimates. In the preparation of these financial statements, management has evaluated subsequent events occurring after the date of the fund’s Statement of Assets and Liabilities through the date that the financial statements were issued. The fund can invest in foreign securities, including securities of emerging market issuers. Investments in foreign securities are vulnerable to the effects of changes in the relative values of the local currency and the U.S. dollar and to the effects of changes in each country’s legal, political, and economic environment. The markets of emerging markets countries are generally more volatile than the markets of developed countries with more mature economies. All of the risks of investing in foreign securities previously described are heightened when investing in emerging markets countries.
Investment Valuations – Equity securities, including restricted equity securities, are generally valued at the last sale or official closing price as provided by a third-party pricing service on the market or exchange on which they are primarily traded. Equity securities, for which there were no sales reported that day, are generally valued at the last quoted daily bid quotation as provided by a third-party pricing service on the market or exchange on which such securities are primarily traded. Equity securities held short, for which there were no sales reported for that day, are generally valued at the last quoted daily ask quotation as provided by a third-party pricing service on the market or exchange on which such securities are primarily traded. Short-term instruments with a maturity at issuance of 60 days or less generally are valued at amortized cost, which approximates market value. Open-end investment companies are generally valued at net asset value per share. Securities and other assets generally valued on the basis of information from a third-party pricing service may also be valued at a broker/dealer bid quotation. Values obtained from third-party pricing services can utilize both transaction data and market information such as yield, quality, coupon rate, maturity, type of issue, trading characteristics, and other market data. The values of foreign securities and other assets and liabilities expressed in foreign currencies are converted to U.S. dollars using the mean of bid and asked prices for rates provided by a third-party pricing service.
The Board of Trustees has delegated primary responsibility for determining or causing to be determined the value of the fund’s investments (including any fair valuation) to the adviser pursuant to valuation policies and procedures approved by the Board. If the adviser determines that reliable market quotations are not readily available, investments are valued at fair value as determined in good faith by the adviser in accordance with such procedures under the oversight of the Board of Trustees. Under the fund’s valuation policies and procedures, market quotations are not considered to be readily available for most types of debt instruments and floating rate loans and many types of derivatives. These investments are generally valued at fair value based on information from third-party pricing services. In addition, investments may be valued at fair value if the adviser determines that an investment’s value has been materially affected by events occurring after the close of the exchange or market on which the investment is principally traded (such as foreign exchange or market) and prior to the determination of the fund’s net asset value, or after the halting of trading of a specific security where trading does not resume prior to the close of the exchange or market on which the security is principally traded. Events that occur on a frequent basis after foreign markets close (such as developments in foreign markets and significant movements in the U.S. markets) and prior to the determination of the fund’s net asset value may be deemed to have a material effect on the value of securities traded in foreign markets. Accordingly, the fund’s foreign equity securities may often be valued at fair value. The adviser generally relies on third-party pricing services or other information (such as the correlation with price movements of similar securities in the same or other markets; the type, cost and investment characteristics of the security; the business and financial condition of the issuer; and trading and other market data) to assist in determining whether to fair value and at what value to fair value an investment. The value of an investment for purposes of calculating the fund’s net asset value can differ depending on the source and method used to determine value. When fair valuation is used, the value of an investment used to determine the fund’s net asset value may differ from quoted or published prices for the same investment. There can be no assurance that the fund could obtain the fair value assigned to an investment if it were to sell the investment at the same time at which the fund determines its net asset value per share.
13
Table of Contents
MFS New Discovery Series
Notes to Financial Statements (unaudited) – continued
Various inputs are used in determining the value of the fund’s assets or liabilities. These inputs are categorized into three broad levels. In certain cases, the inputs used to measure fair value may fall into different levels of the fair value hierarchy. In such cases, an investment’s level within the fair value hierarchy is based on the lowest level of input that is significant to the fair value measurement. The fund’s assessment of the significance of a particular input to the fair value measurement in its entirety requires judgment, and considers factors specific to the investment. Level 1 includes unadjusted quoted prices in active markets for identical assets or liabilities. Level 2 includes other significant observable market-based inputs (including quoted prices for similar securities, interest rates, prepayment speed, and credit risk). Level 3 includes unobservable inputs, which may include the adviser’s own assumptions in determining the fair value of investments. Other financial instruments are derivative instruments not reflected in total investments, such as futures, forwards, swap contracts, and written options. The following is a summary of the levels used as of June 30, 2010 in valuing the fund’s assets or liabilities:
| Investments at Value | Level 1 | Level 2 | Level 3 | Total | ||||
| Equity Securities: | ||||||||
United States | $492,082,275 | $1,374 | $— | $492,083,649 | ||||
Brazil | 29,405,142 | — | — | 29,405,142 | ||||
Australia | 5,703,137 | 9,426,264 | — | 15,129,401 | ||||
United Kingdom | — | 13,249,168 | — | 13,249,168 | ||||
Netherlands | 11,963,303 | — | — | 11,963,303 | ||||
India | — | 11,256,201 | — | 11,256,201 | ||||
Greece | 8,525,466 | — | — | 8,525,466 | ||||
Canada | 6,703,118 | — | — | 6,703,118 | ||||
Cayman Islands | 5,079,718 | — | — | 5,079,718 | ||||
Other Countries | 11,365,155 | 5,361,543 | — | 16,726,698 | ||||
| Mutual Funds | 5,305,068 | — | — | 5,305,068 | ||||
| Total Investments | $576,132,382 | $39,294,550 | $— | $615,426,932 |
For further information regarding security characteristics, see the Portfolio of Investments.
Foreign Currency Translation – Purchases and sales of foreign investments, income, and expenses are converted into U.S. dollars based upon currency exchange rates prevailing on the respective dates of such transactions or on the reporting date for foreign denominated receivables and payables. Gains and losses attributable to foreign currency exchange rates on sales of securities are recorded for financial statement purposes as net realized gains and losses on investments. Gains and losses attributable to foreign exchange rate movements on receivables, payables, income and expenses are recorded for financial statement purposes as foreign currency transaction gains and losses. That portion of both realized and unrealized gains and losses on investments that results from fluctuations in foreign currency exchange rates is not separately disclosed.
Derivatives – The fund may use derivatives for different purposes, including to earn income and enhance returns, to increase or decrease exposure to a particular market, to manage or adjust the risk profile of the fund, or as alternatives to direct investments. Derivatives may be used for hedging or non-hedging purposes. While hedging can reduce or eliminate losses, it can also reduce or eliminate gains. When the fund uses derivatives as an investment to increase market exposure, or for hedging purposes, gains and losses from derivative instruments may be substantially greater than the derivative’s original cost.
Derivative instruments include written options, purchased options, futures contracts, forward foreign currency exchange contracts, and swap agreements. For the six months ended June 30, 2010, the fund did not invest in any derivative instruments.
Security Loans – State Street Bank and Trust Company (“State Street”), as lending agent, may loan the securities of the fund to certain qualified institutions (the “Borrowers”) approved by the fund. The loans are collateralized by cash and/or U.S. Treasury and federal agency obligations in an amount typically at least equal to the market value of the securities loaned. The market value of the loaned securities is determined at the close of business of the fund and any additional required collateral is delivered to the fund on the next business day. State Street provides the fund with indemnification against Borrower default. The fund bears the risk of loss with respect to the investment of cash collateral. On loans collateralized by cash, the cash collateral is invested in a money market fund or short-term securities. A portion of the income generated upon investment of the collateral is remitted to the Borrowers, and the remainder is allocated between the fund and the lending agent. On loans collateralized by U.S. Treasury and/or federal agency obligations, a fee is received from the Borrower, and is allocated between the fund and the lending agent. Income from securities lending is included in interest income on the Statement of Operations. The dividend and interest income earned on the securities loaned is accounted for in the same manner as other dividend and interest income.
Indemnifications – Under the fund’s organizational documents, its officers and Trustees may be indemnified against certain liabilities and expenses arising out of the performance of their duties to the fund. Additionally, in the normal course of
14
Table of Contents
MFS New Discovery Series
Notes to Financial Statements (unaudited) – continued
business, the fund enters into agreements with service providers that may contain indemnification clauses. The fund’s maximum exposure under these agreements is unknown as this would involve future claims that may be made against the fund that have not yet occurred.
Investment Transactions and Income – Investment transactions are recorded on the trade date. Interest income is recorded on the accrual basis. All premium and discount is amortized or accreted for financial statement purposes in accordance with U.S. generally accepted accounting principles. Dividends received in cash are recorded on the ex-dividend date. Certain dividends from foreign securities will be recorded when the fund is informed of the dividend if such information is obtained subsequent to the ex-dividend date. Dividend and interest payments received in additional securities are recorded on the ex-dividend or ex-interest date in an amount equal to the value of the security on such date.
The fund may receive proceeds from litigation settlements. Any proceeds received from litigation involving portfolio holdings are reflected in the Statement of Operations in realized gain/loss if the security has been disposed of by the fund or in unrealized gain/loss if the security is still held by the fund. Any other proceeds from litigation not related to portfolio holdings are reflected as other income in the Statement of Operations.
Fees Paid Indirectly – The fund’s custody fee may be reduced according to an arrangement that measures the value of cash deposited with the custodian by the fund. This amount, for the six months ended June 30, 2010, is shown as a reduction of total expenses on the Statement of Operations.
Tax Matters and Distributions – The fund intends to qualify as a regulated investment company, as defined under Subchapter M of the Internal Revenue Code, and to distribute all of its taxable income, including realized capital gains. As a result, no provision for federal income tax is required. The fund’s federal tax returns for the prior three fiscal years remain subject to examination by the Internal Revenue Service. Foreign taxes, if any, have been accrued by the fund in the accompanying financial statements.
Distributions to shareholders are recorded on the ex-dividend date. Income and capital gain distributions are determined in accordance with income tax regulations, which may differ from U.S. generally accepted accounting principles. Certain capital accounts in the financial statements are periodically adjusted for permanent differences in order to reflect their tax character. These adjustments have no impact on net assets or net asset value per share. Temporary differences which arise from recognizing certain items of income, expense, gain or loss in different periods for financial statement and tax purposes will reverse at some time in the future. Distributions in excess of net investment income or net realized gains are temporary overdistributions for financial statement purposes resulting from differences in the recognition or classification of income or distributions for financial statement and tax purposes.
Book/tax differences primarily relate to net operating losses and wash sale loss deferrals.
The tax character of distributions made during the current period, if any, will be determined at fiscal year end. The fund declared no distributions for the year ended December 31, 2009.
The federal tax cost and the tax basis components of distributable earnings were as follows:
| As of 6/30/10 | |||
| Cost of investments | $606,083,623 | ||
| Gross appreciation | 56,274,039 | ||
| Gross depreciation | (46,930,730 | ) | |
| Net unrealized appreciation (depreciation) | $9,343,309 | ||
| As of 12/31/09 | |||
| Capital loss carryforwards | (96,027,632 | ) | |
| Post-October capital loss deferral | (45,813 | ) | |
| Other temporary differences | (279,668 | ) | |
| Net unrealized appreciation (depreciation) | 56,159,606 |
The aggregate cost above includes prior fiscal year end tax adjustments, if applicable.
As of December 31, 2009, the fund had capital loss carryforwards available to offset future realized gains. Such losses expire as follows:
| 12/31/16 | $(96,027,632 | ) |
Multiple Classes of Shares of Beneficial Interest – The fund offers multiple classes of shares, which differ in their respective distribution and/or service fees. The fund’s income, realized and unrealized gain (loss), and common expenses are allocated to shareholders based on the daily net assets of each class. Dividends are declared separately for each class. Differences in per share dividend rates are generally due to differences in separate class expenses.
15
Table of Contents
MFS New Discovery Series
Notes to Financial Statements (unaudited) – continued
| (3) | Transactions with Affiliates |
Investment Adviser – The fund has an investment advisory agreement with MFS to provide overall investment management and related administrative services and facilities to the fund. The management fee is computed daily and paid monthly at the following annual rates:
| First $1 billion of average daily net assets | 0.90% | |
| Average daily net assets in excess of $1 billion | 0.80% |
The management fee incurred for the six months ended June 30, 2010 was equivalent to an annual effective rate of 0.90% of the fund’s average daily net assets.
Distributor – MFS Fund Distributors, Inc. (MFD), a wholly-owned subsidiary of MFS, is the distributor of shares of the fund. The Trustees have adopted a distribution plan for the Service Class shares pursuant to Rule 12b-1 under the Investment Company Act of 1940.
The fund’s distribution plan provides that the fund will pay MFD distribution and/or service fees equal to 0.25% per annum of its average daily net assets attributable to Service Class shares as partial consideration for services performed and expenses incurred by MFD and financial intermediaries (including participating insurance companies that invest in the fund to fund variable annuity and variable life insurance contracts, sponsors of qualified retirement and pension plans that invest in the fund, and affiliates of these participating insurance companies and plan sponsors) in connection with the sale and distribution of the Service Class shares. MFD may subsequently pay all, or a portion, of the distribution and/or service fees to financial intermediaries.
Shareholder Servicing Agent – MFS Service Center, Inc. (MFSC), a wholly-owned subsidiary of MFS, receives a fee from the fund for its services as shareholder servicing agent. For the six months ended June 30, 2010, the fee was $38,869, which equated to 0.0120% annually of the fund’s average daily net assets. MFSC also receives payment from the fund for out-of-pocket expenses paid by MFSC on behalf of the fund. For the six months ended June 30, 2010, these costs amounted to $895.
Administrator – MFS provides certain financial, legal, shareholder communications, compliance, and other administrative services to the fund. Under an administrative services agreement, the fund partially reimburses MFS the costs incurred to provide these services. The fund is charged an annual fixed amount of $17,500 plus a fee based on average daily net assets. The administrative services fee incurred for the six months ended June 30, 2010 was equivalent to an annual effective rate of 0.0158% of the fund’s average daily net assets.
Trustees’ and Officers’ Compensation – The fund pays compensation to independent Trustees in the form of a retainer, attendance fees, and additional compensation to Board and Committee chairpersons. The fund does not pay compensation directly to Trustees or officers of the fund who are also officers of the investment adviser, all of whom receive remuneration for their services to the fund from MFS. Certain officers and Trustees of the fund are officers or directors of MFS, MFD, and MFSC.
Other – This fund and certain other funds managed by MFS (the funds) have entered into services agreements (the Agreements) which provide for payment of fees by the funds to Tarantino LLC and Griffin Compliance LLC in return for the provision of services of an Independent Chief Compliance Officer (ICCO) and Assistant ICCO, respectively, for the funds. The ICCO and Assistant ICCO are officers of the funds and the sole members of Tarantino LLC and Griffin Compliance LLC, respectively. The funds can terminate the Agreements with Tarantino LLC and Griffin Compliance LLC at any time under the terms of the Agreements. For the six months ended June 30, 2010, the aggregate fees paid by the fund to Tarantino LLC and Griffin Compliance LLC were $2,634 and are included in miscellaneous expense on the Statement of Operations. MFS has agreed to reimburse the fund for a portion of the payments made by the fund in the amount of $2,113, which is shown as a reduction of total expenses in the Statement of Operations. Additionally, MFS has agreed to bear all expenses associated with office space, other administrative support, and supplies provided to the ICCO and Assistant ICCO.
The fund may invest in the MFS Institutional Money Market Portfolio which is managed by MFS and seeks a high level of current income consistent with preservation of capital and liquidity. Income earned on this investment is included in dividends from underlying funds on the Statement of Operations. This money market fund does not pay a management fee to MFS.
| (4) | Portfolio Securities |
Purchases and sales of investments, other than U.S. Government securities, purchased option transactions, and short-term obligations, aggregated $520,843,459 and $562,808,277, respectively.
16
Table of Contents
MFS New Discovery Series
Notes to Financial Statements (unaudited) – continued
| (5) | Shares of Beneficial Interest |
The fund’s Declaration of Trust permits the Trustees to issue an unlimited number of full and fractional shares of beneficial interest. Transactions in fund shares were as follows:
| Six months ended 6/30/10 | Year ended 12/31/09 | |||||||||||
| Shares | Amount | Shares | Amount | |||||||||
| Shares sold | ||||||||||||
Initial Class | 2,235,100 | $31,901,702 | 7,403,523 | $73,426,835 | ||||||||
Service Class | 2,542,801 | 35,028,022 | 5,182,927 | 54,257,791 | ||||||||
| 4,777,901 | $66,929,724 | 12,586,450 | $127,684,626 | |||||||||
| Shares reacquired | ||||||||||||
Initial Class | (4,945,399 | ) | $(69,364,071 | ) | (11,110,651 | ) | $(110,199,556 | ) | ||||
Service Class | (2,871,321 | ) | (39,076,430 | ) | (3,979,125 | ) | (38,596,336 | ) | ||||
| (7,816,720 | ) | $(108,440,501 | ) | (15,089,776 | ) | $(148,795,892 | ) | |||||
| Net change | ||||||||||||
Initial Class | (2,710,299 | ) | $(37,462,369 | ) | (3,707,128 | ) | $(36,772,721 | ) | ||||
Service Class | (328,520 | ) | (4,048,408 | ) | 1,203,802 | 15,661,455 | ||||||
| (3,038,819 | ) | $(41,510,777 | ) | (2,503,326 | ) | $(21,111,266 | ) | |||||
| (6) | Line of Credit |
The fund and certain other funds managed by MFS participate in a $1.1 billion unsecured committed line of credit, subject to a $1 billion sublimit, provided by a syndication of banks under a credit agreement. Borrowings may be made for temporary financing needs. Interest is charged to each fund, based on its borrowings, generally at a rate equal to the higher of the Federal Reserve funds rate or one month LIBOR plus an agreed upon spread. A commitment fee, based on the average daily, unused portion of the committed line of credit, is allocated among the participating funds at the end of each calendar quarter. In addition, the fund and other funds managed by MFS have established unsecured uncommitted borrowing arrangements with certain banks for temporary financing needs. Interest is charged to each fund, based on its borrowings, at a rate equal to the Federal Reserve funds rate plus an agreed upon spread. For the six months ended June 30, 2010, the fund’s commitment fee and interest expense were $4,533 and $0, respectively, and are included in miscellaneous expense on the Statement of Operations.
| (7) | Transactions in Underlying Funds – Affiliated Issuers |
An affiliated issuer may be considered one in which the fund owns 5% or more of the outstanding voting securities, or a company which is under common control. For the purposes of this report, the fund assumes the following to be affiliated issuers:
| Underlying Funds | Beginning Shares/Par Amount | Acquisitions Shares/Par Amount | Dispositions Shares/Par Amount | Ending Shares/Par Amount | |||||
| MFS Institutional Money Market Portfolio | 3,339,409 | 117,077,067 | (115,111,408 | ) | 5,305,068 | ||||
| Underlying Funds | Realized Gain (Loss) | Capital Gain Distributions | Dividend Income | Ending Value | |||||
| MFS Institutional Money Market Portfolio | $— | $— | $3,938 | $5,305,068 | |||||
17
Table of Contents
MFS New Discovery Series
RESULTS OF SHAREHOLDER MEETING (unaudited)
At a special meeting of shareholders of MFS Variable Insurance Trust, which was held on January 28, 2010, the following actions were taken:
Item 1. To elect the following individuals as Trustees:
| Number of Dollars | ||||
| Nominee | For | Withheld Authority | ||
| Robert E. Butler | 6,823,651,821.26 | 1,818,252,669.55 | ||
| Lawrence H. Cohn, M.D. | 6,813,621,200.14 | 1,828,283,290.67 | ||
| Maureen R. Goldfarb | 6,825,332,620.76 | 1,816,571,870.05 | ||
| David H. Gunning | 6,823,081,841.37 | 1,818,822,649.44 | ||
| William R. Gutow | 6,813,678,877.22 | 1,828,225,613.59 | ||
| Michael Hegarty | 6,827,456,515.87 | 1,814,447,974.94 | ||
| John P. Kavanaugh | 6,830,363,113.12 | 1,811,541,377.69 | ||
| Robert J. Manning | 6,825,511,264.17 | 1,816,393,226.64 | ||
| Robert C. Pozen | 6,824,854,120.27 | 1,817,050,370.54 | ||
| J. Dale Sherratt | 6,816,913,203.87 | 1,824,991,286.94 | ||
| Laurie J. Thomsen | 6,823,590,745.56 | 1,818,313,745.25 | ||
| Robert W. Uek | 6,818,161,803.66 | 1,823,742,687.15 | ||
18
Table of Contents
MFS New Discovery Series
BOARD REVIEW OF INVESTMENT ADVISORY AGREEMENT
A discussion regarding the Board’s most recent review and renewal of the fund’s Investment Advisory Agreement with MFS will be available on or about November 1, 2010 by clicking on the fund’s name under ‘‘Variable Insurance Portfolios — VIT’’ in the ‘‘Products and Performance’’ section of the MFS Web site (mfs.com).
PROXY VOTING POLICIES AND INFORMATION
A general description of the MFS funds’ proxy voting policies and procedures is available without charge, upon request, by calling
1-800-225-2606, by visiting the Proxy Voting section of mfs.com or by visiting the SEC’s Web site at http://www.sec.gov.
Information regarding how the fund voted proxies relating to portfolio securities during the most recent twelve-month period ended June 30 is available without charge by visiting the Proxy Voting section of mfs.com or by visiting the SEC’s Web site at http://www.sec.gov.
QUARTERLY PORTFOLIO DISCLOSURE
The fund will file a complete schedule of portfolio holdings with the Securities and Exchange Commission (the Commission) for the first and third quarters of each fiscal year on Form N-Q. The fund’s Form N-Q may be reviewed and copied at the:
Public Reference Room
Securities and Exchange Commission
100 F Street, NE, Room 1580
Washington, D.C. 20549
Information on the operation of the Public Reference Room may be obtained by calling the Commission at 1-800-SEC-0330. The fund’s Form N-Q is available on the EDGAR database on the Commission’s Internet Web site at http://www.sec.gov, and copies of this information may be obtained, upon payment of a duplicating fee, by electronic request at the following e-mail address: publicinfo@sec.gov or by writing the Public Reference Section at the above address.
From time to time, MFS may post important information about the fund or the MFS funds on the MFS web site (mfs.com). This information is available by visiting the “News & Commentary” section of mfs.com or by clicking on the fund’s name under “Variable Insurance Portfolios — VIT” in the “Products and Performance” section of mfs.com.
19
Table of Contents

Table of Contents

Table of Contents
This report is prepared for the general information of contract owners. It is authorized for distribution to prospective investors only when preceded or accompanied by a current prospectus.
NOT FDIC INSURED Ÿ MAY LOSE VALUE Ÿ NO BANK GUARANTEE Ÿ NOT A DEPOSIT Ÿ NOT INSURED BY ANY FEDERAL GOVERNMENT AGENCY OR NCUA/NCUSIF
Table of Contents
MFS Core Equity Series

Dear Contract Owners:
After having suffered their biggest declines since the Great Depression, most global markets experienced an impressive resurgence during the latter months of 2009 and the first quarter of 2010. The global economy was able to reap the benefits of two major trends. The first of these was the massive efforts of governments and central banks to increase liquidity in the financial system as they sought to prevent the credit crisis from further affecting the banking system. The second was the move by companies around the world to cut costs and operations to prepare for rapidly changing market conditions. We believe that these moves not only shortened the length of the downturn but also set the stage for recovery.
Even with the significant market gains of 2009 and the early part of 2010, the recovery is unrolling at a moderate pace, with rebounds in the manufacturing sector and corporate America leading the way. Central bankers are proceeding with caution and many have held benchmark interest rates unchanged as they debate the best way to withdraw stimulus measures without disrupting the fragile growth process. Complicating that debate late in the period was the emergence of the European debt crisis and worries about whether this crisis could derail the global recovery. As that crisis unrolled with no clear resolution, risk aversion rose along with volatility. Weakening economic data late in the period added uncertainty to the mix and sparked a retrenchment in global equity markets.
While hurdles remain, we believe that the global economy is proceeding on the road to recovery. As always, we continue to be mindful of the many challenges faced at the individual, national, and international levels. It is at times such as these that we want to remind investors of the merits of maintaining a long-term view, adhering to basic investing principles such as asset allocation and diversification, and working closely with advisors to identify and research investment opportunities. At MFS®, we take particular pride in how well mutual funds can provide a broad range of products that can fit investor needs in any type of market climate.
Respectfully,

Robert J. Manning
Chairman and Chief Executive Officer
MFS Investment Management®
August 16, 2010
The opinions expressed in this letter are subject to change, may not be relied upon for investment advice, and no forecasts can be guaranteed.
MFS Fund Distributors, Inc., 500 Boylston Street, Boston, MA 02116
1
Table of Contents
MFS Core Equity Series
Portfolio structure
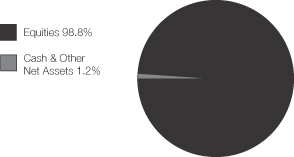
| Top ten holdings | ||
| Apple, Inc. | 2.9% | |
| Johnson & Johnson | 2.5% | |
| JPMorgan Chase & Co. | 1.9% | |
| Exxon Mobil Corp. | 1.8% | |
| Chevron Corp. | 1.8% | |
| Bank of America Corp. | 1.8% | |
| Abbott Laboratories | 1.7% | |
| Colgate-Palmolive Co. | 1.5% | |
| AT&T, Inc. | 1.5% | |
| Google, Inc., “A” | 1.5% |
| Equity sectors | ||
| Technology | 16.7% | |
| Financial Services | 15.5% | |
| Health Care | 12.8% | |
| Energy | 9.2% | |
| Consumer Staples | 8.7% | |
| Utilities & Communications | 7.3% | |
| Retailing | 6.9% | |
| Industrial Goods & Services | 6.4% | |
| Leisure | 5.8% | |
| Basic Materials | 4.3% | |
| Transportation | 2.5% | |
| Special Products & Services | 2.0% | |
| Autos & Housing | 0.7% |
Percentages are based on net assets as of 6/30/10.
The portfolio is actively managed and current holdings may be different.
2
Table of Contents
MFS Core Equity Series
After having suffered through one of the largest and most concentrated downturns since the 1930s, most asset markets staged a remarkable rebound during 2009 and early 2010. This recovery in global activity has been led importantly by emerging Asian economies, but broadening to include most of the global economy to varying degrees. Primary drivers of the recovery included an unwinding of the inventory destocking that took place earlier, the production of manufacturing and capital goods, as well as massive fiscal and monetary stimulus.
Late in the period, though, heightened risk surrounding the public-debt profiles of several of the peripheral European countries impaired market sentiment. At the same time, the improving trend in global macroeconomic data began to weaken somewhat. These two dynamics caused most asset prices to retrench significantly, as many questioned the durability of the global recovery.
3
Table of Contents
MFS Core Equity Series
Fund Expenses Borne by the Contract Holders During the Period,
January 1, 2010 through June 30, 2010
As a contract holder of the fund, you incur ongoing costs, including management fees; distribution and/or service (12b-1) fees; and other fund expenses. This example is intended to help you understand your ongoing costs (in dollars) of investing in the fund and to compare these costs with the ongoing costs of investing in other mutual funds.
The example is based on an investment of $1,000 invested at the beginning of the period and held for the entire period January 1, 2010 through June 30, 2010.
Actual Expenses
The first line for each share class in the following table provides information about actual account values and actual expenses. You may use the information in this line, together with the amount you invested, to estimate the expenses that you paid over the period. Simply divide your account value by $1,000 (for example, an $8,600 account value divided by $1,000 = 8.6), then multiply the result by the number in the first line under the heading entitled “Expenses Paid During Period” to estimate the expenses you paid on your account during this period.
Hypothetical Example for Comparison Purposes
The second line for each share class in the following table provides information about hypothetical account values and hypothetical expenses based on the fund’s actual expense ratio and an assumed rate of return of 5% per year before expenses, which is not the fund’s actual return. The hypothetical account values and expenses may not be used to estimate the actual ending account balance or expenses you paid for the period. You may use this information to compare the ongoing costs of investing in the fund and other funds. To do so, compare this 5% hypothetical example with the 5% hypothetical examples that appear in the shareholder reports of the other funds.
Please note that the expenses shown in the table are meant to highlight the fund’s ongoing costs only and do not take into account the fees and expenses imposed under the variable contracts through which your investment in the fund is made. Therefore, the second line for each share class in the table is useful in comparing ongoing costs associated with an investment in vehicles (such as the fund) which fund benefits under variable annuity and variable life insurance contracts and to qualified pension and retirement plans only, and will not help you determine the relative total costs of investing in the fund through variable annuity and variable life insurance contracts. If the fees and expenses imposed under the variable contracts were included, your costs would have been higher.
| Share Class | Annualized Expense Ratio | Beginning Account Value 1/01/10 | Ending Account Value 6/30/10 | Expenses Paid During Period (p) 1/01/10-6/30/10 | ||||||
| Initial Class | Actual | 0.91% | $1,000.00 | $936.22 | $4.37 | |||||
| Hypothetical (h) | 0.91% | $1,000.00 | $1,020.28 | $4.56 | ||||||
| Service Class | Actual | 1.16% | $1,000.00 | $934.75 | $5.56 | |||||
| Hypothetical (h) | 1.16% | $1,000.00 | $1,019.04 | $5.81 |
| (h) | 5% class return per year before expenses. |
| (p) | Expenses paid is equal to each class’ annualized expense ratio, as shown above, multiplied by the average account value over the period, multiplied by the number of days in the period, divided by the number of days in the year. |
4
Table of Contents
MFS Core Equity Series
PORTFOLIO OF INVESTMENTS – 6/30/10 (unaudited)
The Portfolio of Investments is a complete list of all securities owned by your fund. It is categorized by broad-based asset classes.
| Issuer | Shares/Par | Value ($) | |||
| COMMON STOCKS – 98.3% | |||||
| Aerospace – 2.7% | |||||
| Goodrich Corp. | 3,890 | $ | 257,712 | ||
| Honeywell International, Inc. | 7,370 | 287,651 | |||
| Lockheed Martin Corp. | 3,910 | 291,295 | |||
| Precision Castparts Corp. | 2,120 | 218,190 | |||
| United Technologies Corp. | 8,010 | 519,929 | |||
| $ | 1,574,777 | ||||
| Airlines – 0.3% | |||||
| Copa Holdings S.A., “A” | 2,250 | $ | 99,494 | ||
| UAL Corp. (a) | 3,180 | 65,381 | |||
| $ | 164,875 | ||||
| Alcoholic Beverages – 0.4% | |||||
| Boston Beer Co., Inc., “A” (a) | 3,170 | $ | 213,817 | ||
| Apparel Manufacturers – 0.7% | |||||
| NIKE, Inc., “B” | 6,310 | $ | 426,240 | ||
| Biotechnology – 1.8% | |||||
| Amgen, Inc. (a) | 14,030 | $ | 737,978 | ||
| Gilead Sciences, Inc. (a) | 8,340 | 285,894 | |||
| $ | 1,023,872 | ||||
| Broadcasting – 1.8% | |||||
| CBS Corp., “B” | 12,560 | $ | 162,401 | ||
| Discovery Communications, Inc., “A” (a) | 3,520 | 125,698 | |||
| Walt Disney Co. | 23,330 | 734,895 | |||
| $ | 1,022,994 | ||||
| Brokerage & Asset Managers – 1.5% | |||||
| Affiliated Managers Group, Inc. (a) | 1,810 | $ | 109,994 | ||
| Charles Schwab Corp. | 5,900 | 83,662 | |||
| CME Group, Inc. | 600 | 168,930 | |||
| Franklin Resources, Inc. | 1,680 | 144,798 | |||
| GFI Group, Inc. | 34,030 | 189,887 | |||
| LaBranche & Co., Inc. (a) | 14,000 | 59,920 | |||
| TradeStation Group, Inc. (a) | 13,340 | 90,045 | |||
| $ | 847,236 | ||||
| Business Services – 1.5% | |||||
| Accenture Ltd., “A” | 6,870 | $ | 265,526 | ||
| Dun & Bradstreet Corp. | 2,760 | 185,250 | |||
| MasterCard, Inc., “A” | 1,560 | 311,267 | |||
| Western Union Co. | 7,580 | 113,018 | |||
| $ | 875,061 | ||||
| Cable TV – 1.3% | |||||
| Comcast Corp., “Special A” | 9,830 | $ | 161,507 | ||
| DIRECTV, “A” (a) | 11,830 | 401,274 | |||
| Time Warner Cable, Inc. | 3,295 | 171,603 | |||
| $ | 734,384 | ||||
| Issuer | Shares/Par | Value ($) | |||
| COMMON STOCKS – continued | |||||
| Chemicals – 2.1% | |||||
| Celanese Corp. | 9,980 | $ | 248,602 | ||
| Ecolab, Inc. | 8,650 | 388,472 | |||
| Monsanto Co. | 13,190 | 609,642 | |||
| $ | 1,246,716 | ||||
| Computer Software – 3.6% | |||||
| Adobe Systems, Inc. (a) | 20,110 | $ | 531,507 | ||
| MicroStrategy, Inc., “A” (a) | 8,770 | 658,539 | |||
| Oracle Corp. | 33,670 | 722,558 | |||
| Salesforce.com, Inc. (a) | 1,730 | 148,469 | |||
| $ | 2,061,073 | ||||
| Computer Software – Systems – 5.7% | |||||
| Apple, Inc. (a) | 6,630 | $ | 1,667,644 | ||
| Dell, Inc. (a) | 46,240 | 557,654 | |||
| EMC Corp. (a) | 14,300 | 261,690 | |||
| Hewlett-Packard Co. | 15,250 | 660,020 | |||
| NICE Systems Ltd., ADR (a) | 7,110 | 181,234 | |||
| $ | 3,328,242 | ||||
| Conglomerates – 0.2% | |||||
| Textron, Inc. | 6,170 | $ | 104,705 | ||
| Construction – 0.7% | |||||
| Martin Marietta Materials, Inc. | 1,060 | $ | 89,899 | ||
| NVR, Inc. (a) | 200 | 131,006 | |||
| Sherwin-Williams Co. | 2,650 | 183,354 | |||
| $ | 404,259 | ||||
| Consumer Products – 2.2% | |||||
| Avon Products, Inc. | 14,700 | $ | 389,550 | ||
| Colgate-Palmolive Co. | 11,300 | 889,988 | |||
| $ | 1,279,538 | ||||
| Consumer Services – 0.3% | |||||
| Apollo Group, Inc., “A” (a) | 1,660 | $ | 70,500 | ||
| DeVry, Inc. | 2,240 | 117,578 | |||
| $ | 188,078 | ||||
| Containers – 0.2% | |||||
| Crown Holdings, Inc. (a) | 5,620 | $ | 140,725 | ||
| Electrical Equipment – 2.1% | |||||
| AMETEK, Inc. | 5,590 | $ | 224,439 | ||
| Danaher Corp. | 19,630 | 728,666 | |||
| Sensata Technologies Holding B.V. (a) | 17,500 | 279,825 | |||
| $ | 1,232,930 | ||||
| Electronics – 4.0% | |||||
| Broadcom Corp., “A” | 8,720 | $ | 287,498 | ||
| First Solar, Inc. (a)(l) | 2,950 | 335,799 | |||
| Hittite Microwave Corp. (a) | 1,940 | 86,796 | |||
| Intel Corp. | 40,000 | 778,000 | |||
| Linear Technology Corp. | 12,330 | 342,897 | |||
| Microchip Technology, Inc. | 14,360 | 398,346 | |||
5
Table of Contents
MFS Core Equity Series
Portfolio of Investments (unaudited) – continued
| Issuer | Shares/Par | Value ($) | |||
| COMMON STOCKS – continued | |||||
| Electronics – continued | |||||
| PMC-Sierra, Inc. (a) | 8,000 | $ | 60,160 | ||
| Silicon Laboratories, Inc. (a) | 1,420 | 57,595 | |||
| $ | 2,347,091 | ||||
| Energy – Independent – 3.3% | |||||
| Alpha Natural Resources, Inc. (a) | 1,910 | $ | 64,692 | ||
| Anadarko Petroleum Corp. | 4,680 | 168,901 | |||
| Apache Corp. | 5,510 | 463,887 | |||
| CONSOL Energy, Inc. | 1,540 | 51,990 | |||
| Denbury Resources, Inc. (a) | 6,910 | 101,162 | |||
| Massey Energy Co. | 2,150 | 58,803 | |||
| Nexen, Inc. | 12,300 | 241,944 | |||
| Noble Energy, Inc. | 3,620 | 218,395 | |||
| Occidental Petroleum Corp. | 6,230 | 480,645 | |||
| Walter Energy, Inc. | 740 | 45,029 | |||
| $ | 1,895,448 | ||||
| Energy – Integrated – 4.1% | |||||
| Chevron Corp. | 15,230 | $ | 1,033,508 | ||
| Exxon Mobil Corp. (s) | 18,550 | 1,058,649 | |||
| Hess Corp. | 5,130 | 258,244 | |||
| $ | 2,350,401 | ||||
| Engineering – Construction – 1.3% | |||||
| Fluor Corp. | 13,740 | $ | 583,950 | ||
| North American Energy Partners, Inc. (a) | 17,260 | 152,406 | |||
| $ | 736,356 | ||||
| Food & Beverages – 4.0% | |||||
| Dr Pepper Snapple Group, Inc. | 9,470 | $ | 354,083 | ||
| General Mills, Inc. | 12,870 | 457,142 | |||
| Kellogg Co. | 8,550 | 430,065 | |||
| Kraft Foods, Inc.,”A” | 8,440 | 236,320 | |||
| PepsiCo, Inc. (s) | 13,760 | 838,672 | |||
| $ | 2,316,282 | ||||
| Food & Drug Stores – 0.9% | |||||
| Walgreen Co. | 12,290 | $ | 328,143 | ||
| Whole Foods Market, Inc. (a) | 5,850 | 210,717 | |||
| $ | 538,860 | ||||
| Gaming & Lodging – 0.7% | |||||
| International Game Technology | 9,700 | $ | 152,290 | ||
| Las Vegas Sands Corp. (a) | 5,860 | 129,740 | |||
| Marriott International, Inc., “A” | 4,240 | 126,946 | |||
| $ | 408,976 | ||||
| General Merchandise – 2.6% | |||||
| Dollar General Corp. (a) | 8,030 | $ | 221,227 | ||
| Kohl’s Corp. (a) | 4,330 | 205,675 | |||
| Target Corp. | 12,130 | 596,432 | |||
| Wal-Mart Stores, Inc. | 10,330 | 496,563 | |||
| $ | 1,519,897 | ||||
| Issuer | Shares/Par | Value ($) | |||
| COMMON STOCKS – continued | |||||
| Health Maintenance Organizations – 0.6% | |||||
| Aetna, Inc. | 3,820 | $ | 100,772 | ||
| WellPoint, Inc. (a) | 4,650 | 227,525 | |||
| $ | 328,297 | ||||
| Insurance – 3.1% | |||||
| ACE Ltd. | 7,930 | $ | 408,236 | ||
| Aflac, Inc. | 5,640 | 240,659 | |||
| Allied World Assurance Co. Holdings Ltd. | 8,540 | 387,545 | |||
| Chubb Corp. | 7,720 | 386,077 | |||
| MetLife, Inc. | 3,730 | 140,845 | |||
| Prudential Financial, Inc. | 4,570 | 245,226 | |||
| $ | 1,808,588 | ||||
| Internet – 1.5% | |||||
| Google, Inc., “A” (a) | 1,920 | $ | 854,304 | ||
| Leisure & Toys – 0.6% | |||||
| Hasbro, Inc. | 8,450 | $ | 347,295 | ||
| Machinery & Tools – 0.3% | |||||
| Bucyrus International, Inc. | 3,780 | $ | 179,361 | ||
| Major Banks – 6.5% | |||||
| Bank of America Corp. | 71,260 | $ | 1,024,006 | ||
| Bank of New York Mellon Corp. | 11,208 | 276,726 | |||
| Goldman Sachs Group, Inc. | 4,340 | 569,712 | |||
| JPMorgan Chase & Co. (s) | 29,930 | 1,095,737 | |||
| KeyCorp | 36,450 | 280,301 | |||
| State Street Corp. | 6,220 | 210,360 | |||
| SunTrust Banks, Inc. | 12,760 | 297,308 | |||
| $ | 3,754,150 | ||||
| Medical & Health Technology & Services – 1.6% | |||||
| DaVita, Inc. (a) | 4,370 | $ | 272,863 | ||
| Express Scripts, Inc. (a) | 4,660 | 219,113 | |||
| Medco Health Solutions, Inc. (a) | 1,300 | 71,604 | |||
| Patterson Cos., Inc. | 6,370 | 181,736 | |||
| VCA Antech, Inc. (a) | 6,990 | 173,072 | |||
| $ | 918,388 | ||||
| Medical Equipment – 3.5% | |||||
| Becton, Dickinson & Co. | 4,360 | $ | 294,823 | ||
| Medtronic, Inc. | 10,250 | 371,768 | |||
| NxStage Medical, Inc. (a) | 3,548 | 52,652 | |||
| NxStage Medical, Inc. (a) | 31,430 | 466,421 | |||
| St. Jude Medical, Inc. (a) | 9,040 | 326,254 | |||
| Thermo Fisher Scientific, Inc. (a) | 7,630 | 374,252 | |||
| Waters Corp. (a) | 2,270 | 146,869 | |||
| $ | 2,033,039 | ||||
| Metals & Mining – 0.5% | |||||
| Cliffs Natural Resources, Inc. | 1,850 | $ | 87,246 | ||
| Steel Dynamics, Inc. | 1,650 | 21,764 | |||
| United States Steel Corp. | 4,740 | 182,727 | |||
| $ | 291,737 | ||||
6
Table of Contents
MFS Core Equity Series
Portfolio of Investments (unaudited) – continued
| Issuer | Shares/Par | Value ($) | |||
| COMMON STOCKS – continued | |||||
| Natural Gas – Distribution – 0.3% | |||||
| EQT Corp. | 4,300 | $ | 155,402 | ||
| Natural Gas – Pipeline – 0.4% | |||||
| Niska Gas Storage Partners LLC (a) | 3,460 | $ | 64,218 | ||
| Williams Cos., Inc. | 9,410 | 172,015 | |||
| $ | 236,233 | ||||
| Network & Telecom – 1.9% | |||||
| Cisco Systems, Inc. (a) | 39,020 | $ | 831,516 | ||
| Juniper Networks, Inc. (a) | 8,420 | 192,144 | |||
| Tellabs, Inc. | 8,480 | 54,187 | |||
| $ | 1,077,847 | ||||
| Oil Services – 1.8% | |||||
| Halliburton Co. | 19,620 | $ | 481,671 | ||
| National Oilwell Varco, Inc. | 4,310 | 142,532 | |||
| Noble Corp. | 4,100 | 126,731 | |||
| Schlumberger Ltd. | 5,300 | 293,302 | |||
| $ | 1,044,236 | ||||
| Other Banks & Diversified Financials – 1.9% | |||||
| American Express Co. | 5,120 | $ | 203,264 | ||
| Associated Banc-Corp. | 18,170 | 222,764 | |||
| Cathay General Bancorp, Inc. | 21,590 | 223,025 | |||
| EuroDekania Ltd. (a)(z) | 50,820 | 89,998 | |||
| Marshall & Ilsley Corp. | 33,730 | 242,181 | |||
| Sterling Bancshares, Inc. | 26,460 | 124,627 | |||
| $ | 1,105,859 | ||||
| Pharmaceuticals – 5.3% | |||||
| Abbott Laboratories | 21,540 | $ | 1,007,641 | ||
| Johnson & Johnson | 24,610 | 1,453,467 | |||
| Pfizer, Inc. | 20,259 | 288,893 | |||
| Teva Pharmaceutical Industries Ltd., ADR | 6,570 | 341,574 | |||
| $ | 3,091,575 | ||||
| Precious Metals & Minerals – 0.4% | |||||
| Goldcorp, Inc. | 1,330 | $ | 58,321 | ||
| Teck Resources Ltd., “B” | 5,860 | 173,287 | |||
| $ | 231,608 | ||||
| Printing & Publishing – 0.7% | |||||
| Moody’s Corp. | 8,600 | $ | 171,312 | ||
| MSCI, Inc., “A” (a) | 8,700 | 238,380 | |||
| $ | 409,692 | ||||
| Railroad & Shipping – 1.1% | |||||
| Aegean Marine Petroleum Network, Inc. | 9,340 | $ | 186,613 | ||
| Canadian National Railway Co. | 4,280 | 245,586 | |||
| Union Pacific Corp. | 3,140 | 218,261 | |||
| $ | 650,460 | ||||
| Real Estate – 2.2% | |||||
| Annaly Mortgage Management, Inc., REIT | 20,380 | $ | 349,517 | ||
| Entertainment Property Trust, REIT | 15,030 | �� | 572,192 | ||
| Issuer | Shares/Par | Value ($) | |||
| COMMON STOCKS – continued | |||||
| Real Estate – continued | |||||
| Kilroy Realty Corp., REIT | 6,590 | $ | 195,921 | ||
| Mack-Cali Realty Corp., REIT | 5,390 | 160,245 | |||
| $ | 1,277,875 | ||||
| Restaurants – 0.7% | |||||
| McDonald’s Corp. | 6,300 | $ | 414,981 | ||
| Specialty Chemicals – 1.1% | |||||
| Praxair, Inc. | 8,710 | $ | 661,873 | ||
| Specialty Stores – 2.7% | |||||
| Abercrombie & Fitch Co., “A” | 5,380 | $ | 165,112 | ||
| Amazon.com, Inc. (a) | 3,230 | 352,910 | |||
| Dick’s Sporting Goods, Inc. (a) | 4,390 | 109,267 | |||
| Home Depot, Inc. | 17,770 | 498,804 | |||
| Limited Brands, Inc. | 11,220 | 247,625 | |||
| Staples, Inc. | 11,510 | 219,266 | |||
| $ | 1,592,984 | ||||
| Telecommunications – Wireless – 0.3% | |||||
| Cellcom Israel Ltd. | 4,460 | $ | 111,500 | ||
| Sprint Nextel Corp. (a) | 15,620 | 66,229 | |||
| $ | 177,729 | ||||
| Telephone Services – 2.8% | |||||
| American Tower Corp., “A” (a) | 7,810 | $ | 347,545 | ||
| AT&T, Inc. | 35,550 | 859,955 | |||
| Qwest Communications International, Inc. | 74,880 | 393,120 | |||
| $ | 1,600,620 | ||||
| Tobacco – 2.1% | |||||
| Philip Morris International, Inc. | 18,290 | $ | 838,414 | ||
| Reynolds American, Inc. | 7,610 | 396,633 | |||
| $ | 1,235,047 | ||||
| Trucking – 1.1% | |||||
| Expeditors International of Washington, Inc. | 11,240 | $ | 387,892 | ||
| Werner Enterprises, Inc. | 10,750 | 235,318 | |||
| $ | 623,210 | ||||
| Utilities – Electric Power – 3.3% | |||||
| American Electric Power Co., Inc. | 10,280 | $ | 332,044 | ||
| Calpine Corp. (a) | 8,080 | 102,778 | |||
| CenterPoint Energy, Inc. | 8,540 | 112,386 | |||
| CMS Energy Corp. | 17,230 | 252,420 | |||
| Dominion Resources, Inc. | 5,140 | 199,124 | |||
| PG&E Corp. | 7,840 | 322,224 | |||
| PPL Corp. | 5,970 | 148,952 | |||
| Public Service Enterprise Group, Inc. | 4,740 | 148,504 | |||
| Wisconsin Energy Corp. | 5,650 | 286,681 | |||
| $ | 1,905,113 | ||||
| Total Common Stocks (Identified Cost, $61,722,464) | $ | 56,990,336 | |||
7
Table of Contents
MFS Core Equity Series
Portfolio of Investments (unaudited) – continued
| Issuer | Shares/Par | Value ($) | |||
| CONVERTIBLE PREFERRED STOCKS – 0.5% | |||||
| Other Banks & Diversified Financials – 0.3% | |||||
| Citigroup, Inc., 7.5% | 1,600 | $ | 180,800 | ||
| Utilities – Electric Power – 0.2% | |||||
| PPL Corp., 9.5% | 2,620 | $ | 136,254 | ||
| Total Convertible Preferred Stocks (Identified Cost, $335,216) | $ | 317,054 | |||
| MONEY MARKET FUNDS (v) – 1.3% | |||||
| MFS Institutional Money Market Portfolio, 0.22%, at Cost and Net Asset Value | 747,526 | $ | 747,526 | ||
| Issuer | Shares/Par | Value ($) | ||||
| COLLATERAL FOR SECURITIES LOANED – 0.4% | ||||||
| Navigator Securities Lending Prime Portfolio, at Cost and Net Asset Value | 258,251 | $ | 258,251 | |||
| Total Investments (Identified Cost, $63,063,457) | $ | 58,313,167 | ||||
| OTHER ASSETS, LESS LIABILITIES – (0.5)% | (311,496 | ) | ||||
| Net Assets – 100.0% | $ | 58,001,671 | ||||
| (a) | Non-income producing security. |
| (l) | All or a portion of this security is on loan. |
| (s) | Security or a portion of the security was pledged to cover collateral requirements for securities sold short. At June 30, 2010, the value of securities pledged amounted to $162,845. At June 30, 2010, the fund had no short sales outstanding. |
| (v) | Underlying fund that is available only to investment companies managed by MFS. The rate quoted is the annualized seven-day yield of the fund at period end. |
| (z) | Restricted securities are not registered under the Securities Act of 1933 and are subject to legal restrictions on resale. These securities generally may be resold in transactions exempt from registration or to the public if the securities are subsequently registered. Disposal of these securities may involve time-consuming negotiations and prompt sale at an acceptable price may be difficult. The fund holds the following restricted securities: |
| Restricted Securities | Acquisition Date | Cost | Current Market Value | |||
| EuroDekania Ltd. | 6/25/07 | $737,167 | $89,998 | |||
| % of Net Assets | 0.2% |
The following abbreviations are used in this report and are defined:
| ADR | American Depository Receipt |
| REIT | Real Estate Investment Trust |
See Notes to Financial Statements
8
Table of Contents
MFS Core Equity Series
FINANCIAL STATEMENTS | STATEMENT OF ASSETS AND LIABILITIES (unaudited)
This statement represents your fund’s balance sheet, which details the assets and liabilities comprising the total value of the fund.
| At 6/30/10 | |||||
| Assets | |||||
Investments – | |||||
Non-affiliated issuers, at value (identified cost, $62,315,931) | $57,565,641 | ||||
Underlying funds, at cost and value | 747,526 | ||||
Total investments, at value, including $251,792 of securities on loan (identified cost, $63,063,457) | $58,313,167 | ||||
Cash | 937 | ||||
Receivables for | |||||
Investments sold | 1,615,113 | ||||
Fund shares sold | 6,054 | ||||
Interest and dividends | 72,002 | ||||
Receivable from investment adviser | 6,480 | ||||
Other assets | 504 | ||||
Total assets | $60,014,257 | ||||
Liabilities | |||||
Payables for | |||||
Investments purchased | $1,657,682 | ||||
Fund shares reacquired | 29,815 | ||||
Collateral for securities loaned, at value | 258,251 | ||||
Payable to affiliates | |||||
Investment adviser | 2,447 | ||||
Shareholder servicing costs | 91 | ||||
Distribution and/or service fees | 59 | ||||
Administrative services fee | 103 | ||||
Payable for independent Trustees’ compensation | 464 | ||||
Accrued expenses and other liabilities | 63,674 | ||||
Total liabilities | $2,012,586 | ||||
Net assets | $58,001,671 | ||||
Net assets consist of | |||||
Paid-in capital | $112,144,438 | ||||
Unrealized appreciation (depreciation) on investments and translation of assets and liabilities in foreign currencies | (4,750,332 | ) | |||
Accumulated net realized gain (loss) on investments and foreign currency transactions | (49,664,886 | ) | |||
Undistributed net investment income | 272,451 | ||||
Net assets | $58,001,671 | ||||
Shares of beneficial interest outstanding | 4,640,113 |
| Net assets | Shares outstanding | Net asset value per share | ||||
Initial Class | $53,810,629 | 4,303,995 | $12.50 | |||
Service Class | 4,191,042 | 336,118 | 12.47 |
See Notes to Financial Statements
9
Table of Contents
MFS Core Equity Series
FINANCIAL STATEMENTS | STATEMENT OF OPERATIONS (unaudited)
This statement describes how much your fund earned in investment income and accrued in expenses. It also describes any gains and/or losses generated by fund operations.
| Six months ended 6/30/10 | ||||||
| Net investment income | ||||||
Income | ||||||
Dividends | $572,858 | |||||
Interest | 2,390 | |||||
Dividends from underlying funds | 249 | |||||
Foreign taxes withheld | (1,117 | ) | ||||
Total investment income | $574,380 | |||||
Expenses | ||||||
Management fee | $243,588 | |||||
Distribution and/or service fees | 5,933 | |||||
Shareholder servicing costs | 4,148 | |||||
Administrative services fee | 9,774 | |||||
Independent Trustees’ compensation | 1,783 | |||||
Custodian fee | 10,775 | |||||
Shareholder communications | 19,432 | |||||
Auditing fees | 27,437 | |||||
Legal fees | 735 | |||||
Dividend and interest expense on securities sold short | 2,815 | |||||
Miscellaneous | 6,349 | |||||
Total expenses | $332,769 | |||||
Reduction of expenses by investment adviser | (31,745 | ) | ||||
Net expenses | $301,024 | |||||
Net investment income | $273,356 | |||||
Realized and unrealized gain (loss) on investments and foreign currency transactions | ||||||
Realized gain (loss) (identified cost basis) | ||||||
Investment transactions | $2,307,405 | |||||
Securities sold short | 42,883 | |||||
Foreign currency transactions | 20 | |||||
Net realized gain (loss) on investments and foreign currency transactions | $2,350,308 | |||||
Change in unrealized appreciation (depreciation) | ||||||
Investments | $(6,540,695 | ) | ||||
Translation of assets and liabilities in foreign currencies | (48 | ) | ||||
Net unrealized gain (loss) on investments and foreign currency translation | $(6,540,743 | ) | ||||
Net realized and unrealized gain (loss) on investments and foreign currency | $(4,190,435 | ) | ||||
Change in net assets from operations | $(3,917,079 | ) |
See Notes to Financial Statements
10
Table of Contents
MFS Core Equity Series
FINANCIAL STATEMENTS | STATEMENTS OF CHANGES IN NET ASSETS
These statements describe the increases and/or decreases in net assets resulting from operations, any distributions, and any shareholder transactions.
| Six months ended 6/30/10 (unaudited | ) | Year ended 12/31/09 | | |||
Change in net assets | ||||||
From operations | ||||||
Net investment income | $273,356 | $700,661 | ||||
Net realized gain (loss) on investments and foreign currency transactions | 2,350,308 | (8,608,848 | ) | |||
Net unrealized gain (loss) on investments and foreign currency translation | (6,540,743 | ) | 24,800,445 | |||
Change in net assets from operations | $(3,917,079 | ) | $16,892,258 | |||
Distributions declared to shareholders | ||||||
From net investment income | $(705,029 | ) | $(996,498 | ) | ||
Change in net assets from fund share transactions | $(4,015,291 | ) | $(7,877,578 | ) | ||
Total change in net assets | $(8,637,399 | ) | $8,018,182 | |||
Net assets | ||||||
At beginning of period | 66,639,070 | 58,620,888 | ||||
At end of period (including undistributed net investment income of $272,451 and | $58,001,671 | $66,639,070 |
See Notes to Financial Statements
11
Table of Contents
MFS Core Equity Series
FINANCIAL STATEMENTS | FINANCIAL HIGHLIGHTS
The financial highlights table is intended to help you understand the fund’s financial performance for the semiannual period and the past 5 fiscal years. Certain information reflects financial results for a single fund share. The total returns in the table represent the rate by which an investor would have earned (or lost) on an investment in the fund share class (assuming reinvestment of all distributions) held for the entire period.
| Initial Class | Six months ended 6/30/10 | Years ended 12/31 | ||||||||||||||||
| 2009 | 2008 | 2007 | 2006 | 2005 | ||||||||||||||
| (unaudited) | ||||||||||||||||||
Net asset value, beginning of period | $13.49 | $10.38 | $17.18 | $15.51 | $13.69 | $13.57 | ||||||||||||
| Income (loss) from investment operations | ||||||||||||||||||
Net investment income (d) | $0.06 | $0.14 | $0.16 | $0.09 | $0.05 | $0.06 | ||||||||||||
Net realized and unrealized gain (loss) on investments | (0.90 | ) | 3.16 | (6.85 | ) | 1.64 | 1.83 | 0.16 | ||||||||||
Total from investment operations | $(0.84 | ) | $3.30 | $(6.69 | ) | $1.73 | $1.88 | $0.22 | ||||||||||
| Less distributions declared to shareholders | ||||||||||||||||||
From net investment income | $(0.15 | ) | $(0.19 | ) | $(0.11 | ) | $(0.06 | ) | $(0.06 | ) | $(0.10 | ) | ||||||
Net asset value, end of period | $12.50 | $13.49 | $10.38 | $17.18 | $15.51 | $13.69 | ||||||||||||
Total return (%) (k)(r)(s) | (6.38 | )(n) | 32.43 | (39.15 | )(t) | 11.15 | 13.80 | 1.69 | ||||||||||
| Ratios (%) (to average net assets) and Supplemental data: | ||||||||||||||||||
Expenses before expense reductions (f) | 1.01 | (a) | 1.01 | 0.95 | 1.03 | 0.92 | 0.98 | |||||||||||
Expenses after expense reductions (f) | 0.91 | (a) | 0.90 | 0.90 | 0.90 | 0.90 | 0.90 | |||||||||||
Expenses after expense reductions excluding short sale | 0.90 | (a) | 0.90 | N/A | N/A | N/A | N/A | |||||||||||
Net investment income | 0.86 | (a) | 1.20 | 1.13 | 0.53 | 0.35 | 0.42 | |||||||||||
Portfolio turnover | 35 | 90 | 109 | 151 | 89 | 93 | ||||||||||||
Net assets at end of period (000 omitted) | $53,811 | $61,856 | $54,049 | $115,251 | $131,259 | $137,244 | ||||||||||||
See Notes to Financial Statements
12
Table of Contents
MFS Core Equity Series
Financial Highlights – continued
| Service Class | Six months ended 6/30/10 | Years ended 12/31 | ||||||||||||||||
| 2009 | 2008 | 2007 | 2006 | 2005 | ||||||||||||||
| (unaudited) | ||||||||||||||||||
Net asset value, beginning of period | $13.45 | $10.32 | $17.07 | $15.41 | $13.60 | $13.48 | ||||||||||||
| Income (loss) from investment operations | ||||||||||||||||||
Net investment income (d) | $0.04 | $0.11 | $0.12 | $0.04 | $0.01 | $0.02 | ||||||||||||
Net realized and unrealized gain (loss) on investments | (0.90 | ) | 3.17 | (6.81 | ) | 1.63 | 1.82 | 0.17 | ||||||||||
Total from investment operations | $(0.86 | ) | $3.28 | $(6.69 | ) | $1.67 | $1.83 | $0.19 | ||||||||||
| Less distributions declared to shareholders | ||||||||||||||||||
From net investment income | $(0.12 | ) | $(0.15 | ) | $(0.06 | ) | $(0.01 | ) | $(0.02 | ) | $(0.07 | ) | ||||||
Net asset value, end of period | $12.47 | $13.45 | $10.32 | $17.07 | $15.41 | $13.60 | ||||||||||||
Total return (%) (k)(r)(s) | (6.52 | )(n) | 32.24 | (39.32 | )(t) | 10.87 | 13.50 | 1.46 | ||||||||||
| Ratios (%) (to average net assets) and Supplemental data: | ||||||||||||||||||
Expenses before expense reductions (f) | 1.26 | (a) | 1.26 | 1.20 | 1.27 | 1.17 | 1.23 | |||||||||||
Expenses after expense reductions (f) | 1.16 | (a) | 1.15 | 1.15 | 1.15 | 1.15 | 1.15 | |||||||||||
Expenses after expense reductions excluding short sale | 1.15 | (a) | 1.15 | N/A | N/A | N/A | N/A | |||||||||||
Net investment income | 0.61 | (a) | 0.95 | 0.87 | 0.25 | 0.10 | 0.17 | |||||||||||
Portfolio turnover | 35 | 90 | 109 | 151 | 89 | 93 | ||||||||||||
Net assets at end of period (000 omitted) | $4,191 | $4,783 | $4,571 | $9,288 | $14,740 | $15,823 | ||||||||||||
| (a) | Annualized. |
| (d) | Per share data is based on average shares outstanding. |
| (f) | Ratios do not reflect reductions from fees paid indirectly, if applicable. |
| (k) | The total return does not reflect expenses that apply to separate accounts. Inclusion of these charges would reduce the total return figures for all periods shown. |
| (n) | Not annualized. |
| (r) | Certain expenses have been reduced without which performance would have been lower. |
| (s) | From time to time the fund may receive proceeds from litigation settlements, without which performance would be lower. |
| (t) | Excluding the effect of the proceeds received from a non-recurring litigation settlement against Enron Corp., the Initial Class and Service Class total returns for the year ended December 31, 2008 would have each been lower by approximately 0.87%. |
See Notes to Financial Statements
13
Table of Contents
MFS Core Equity Series
NOTES TO FINANCIAL STATEMENTS (unaudited)
| (1) | Business and Organization |
MFS Core Equity Series (the fund) is a series of MFS Variable Insurance Trust (the trust). The trust is organized as a Massachusetts business trust and is registered under the Investment Company Act of 1940, as amended, as an open-end management investment company. The shareholders of each series of the trust are separate accounts of insurance companies, which offer variable annuity and/or life insurance products, and qualified retirement and pension plans.
| (2) | Significant Accounting Policies |
General – The preparation of financial statements in conformity with U.S. generally accepted accounting principles requires management to make estimates and assumptions that affect the reported amounts of assets and liabilities, and disclosure of contingent assets and liabilities at the date of the financial statements and the reported amounts of revenues and expenses during the reporting period. Actual results could differ from those estimates. In the preparation of these financial statements, management has evaluated subsequent events occurring after the date of the fund’s Statement of Assets and Liabilities through the date that the financial statements were issued. The fund can invest in foreign securities, including securities of emerging market issuers. Investments in foreign securities are vulnerable to the effects of changes in the relative values of the local currency and the U.S. dollar and to the effects of changes in each country’s legal, political, and economic environment. The markets of emerging markets countries are generally more volatile than the markets of developed countries with more mature economies. All of the risks of investing in foreign securities previously described are heightened when investing in emerging markets countries.
Investment Valuations – Equity securities, including restricted equity securities, are generally valued at the last sale or official closing price as provided by a third-party pricing service on the market or exchange on which they are primarily traded. Equity securities, for which there were no sales reported that day, are generally valued at the last quoted daily bid quotation as provided by a third-party pricing service on the market or exchange on which such securities are primarily traded. Equity securities held short, for which there were no sales reported for that day, are generally valued at the last quoted daily ask quotation as provided by a third-party pricing service on the market or exchange on which such securities are primarily traded. Short-term instruments with a maturity at issuance of 60 days or less generally are valued at amortized cost, which approximates market value. Open-end investment companies are generally valued at net asset value per share. Securities and other assets generally valued on the basis of information from a third-party pricing service may also be valued at a broker/dealer bid quotation. Values obtained from third-party pricing services can utilize both transaction data and market information such as yield, quality, coupon rate, maturity, type of issue, trading characteristics, and other market data. The values of foreign securities and other assets and liabilities expressed in foreign currencies are converted to U.S. dollars using the mean of bid and asked prices for rates provided by a third-party pricing service.
The Board of Trustees has delegated primary responsibility for determining or causing to be determined the value of the fund’s investments (including any fair valuation) to the adviser pursuant to valuation policies and procedures approved by the Board. If the adviser determines that reliable market quotations are not readily available, investments are valued at fair value as determined in good faith by the adviser in accordance with such procedures under the oversight of the Board of Trustees. Under the fund’s valuation policies and procedures, market quotations are not considered to be readily available for most types of debt instruments and floating rate loans and many types of derivatives. These investments are generally valued at fair value based on information from third-party pricing services. In addition, investments may be valued at fair value if the adviser determines that an investment’s value has been materially affected by events occurring after the close of the exchange or market on which the investment is principally traded (such as foreign exchange or market) and prior to the determination of the fund’s net asset value, or after the halting of trading of a specific security where trading does not resume prior to the close of the exchange or market on which the security is principally traded. Events that occur on a frequent basis after foreign markets close (such as developments in foreign markets and significant movements in the U.S. markets) and prior to the determination of the fund’s net asset value may be deemed to have a material effect on the value of securities traded in foreign markets. Accordingly, the fund’s foreign equity securities may often be valued at fair value. The adviser generally relies on third-party pricing services or other information (such as the correlation with price movements of similar securities in the same or other markets; the type, cost and investment characteristics of the security; the business and financial condition of the issuer; and trading and other market data) to assist in determining whether to fair value and at what value to fair value an investment. The value of an investment for purposes of calculating the fund’s net asset value can differ depending on the source and method used to determine value. When fair valuation is used, the value of an investment used to determine the fund’s net asset value may differ from quoted or published prices for the same investment. There can be no assurance that the fund could obtain the fair value assigned to an investment if it were to sell the investment at the same time at which the fund determines its net asset value per share.
14
Table of Contents
MFS Core Equity Series
Notes to Financial Statements (unaudited) – continued
Various inputs are used in determining the value of the fund’s assets or liabilities. These inputs are categorized into three broad levels. In certain cases, the inputs used to measure fair value may fall into different levels of the fair value hierarchy. In such cases, an investment’s level within the fair value hierarchy is based on the lowest level of input that is significant to the fair value measurement. The fund’s assessment of the significance of a particular input to the fair value measurement in its entirety requires judgment, and considers factors specific to the investment. Level 1 includes unadjusted quoted prices in active markets for identical assets or liabilities. Level 2 includes other significant observable market-based inputs (including quoted prices for similar securities, interest rates, prepayment speed, and credit risk). Level 3 includes unobservable inputs, which may include the adviser’s own assumptions in determining the fair value of investments. Other financial instruments are derivative instruments not reflected in total investments, such as futures, forwards, swap contracts, and written options. The following is a summary of the levels used as of June 30, 2010 in valuing the fund’s assets or liabilities:
| Investments at Value | Level 1 | Level 2 | Level 3 | Total | ||||
| Equity Securities: | ||||||||
United States | $54,542,932 | $602,675 | $— | $55,145,607 | ||||
Canada | 871,544 | — | — | 871,544 | ||||
Israel | 634,308 | — | — | 634,308 | ||||
Netherlands | 279,825 | — | — | 279,825 | ||||
Greece | 186,613 | — | — | 186,613 | ||||
Panama | 99,495 | — | — | 99,495 | ||||
United Kingdom | — | — | 89,998 | 89,998 | ||||
| Mutual Funds | 1,005,777 | — | — | 1,005,777 | ||||
| Total Investments | $57,620,494 | $602,675 | $89,998 | $58,313,167 |
For further information regarding security characteristics, see the Portfolio of Investments.
The following is a reconciliation of Level 3 assets for which significant unobservable inputs were used to determine fair value. The table presents the activity of Level 3 securities held at the beginning and the end of the period.
| Investments in Securities | ||
| Balance as of 12/31/09 | $77,224 | |
Accrued discounts/premiums | — | |
Realized gain (loss) | — | |
Change in unrealized appreciation (depreciation) | 12,774 | |
Net purchases (sales) | — | |
Transfers in and/or out of Level 3 | — | |
| Balance as of 6/30/10 | $89,998 |
The net change in unrealized appreciation (depreciation) from investments still held as Level 3 at June 30, 2010 is $12,774.
Foreign Currency Translation – Purchases and sales of foreign investments, income, and expenses are converted into U.S. dollars based upon currency exchange rates prevailing on the respective dates of such transactions or on the reporting date for foreign denominated receivables and payables. Gains and losses attributable to foreign currency exchange rates on sales of securities are recorded for financial statement purposes as net realized gains and losses on investments. Gains and losses attributable to foreign exchange rate movements on receivables, payables, income and expenses are recorded for financial statement purposes as foreign currency transaction gains and losses. That portion of both realized and unrealized gains and losses on investments that results from fluctuations in foreign currency exchange rates is not separately disclosed.
Derivatives – The fund may use derivatives for different purposes, including to earn income and enhance returns, to increase or decrease exposure to a particular market, to manage or adjust the risk profile of the fund, or as alternatives to direct investments. Derivatives may be used for hedging or non-hedging purposes. While hedging can reduce or eliminate losses, it can also reduce or eliminate gains. When the fund uses derivatives as an investment to increase market exposure, or for hedging purposes, gains and losses from derivative instruments may be substantially greater than the derivative’s original cost.
Derivative instruments include written options, purchased options, futures contracts, forward foreign currency exchange contracts, and swap agreements. For the six months ended June 30, 2010, the fund did not invest in any derivative instruments.
Short Sales – The fund may enter into short sales whereby it sells a security it does not own in anticipation of a decline in the value of that security. The fund will realize a gain if the security price decreases and a loss if the security price increases between the date of the short sale and the date on which the fund replaces the borrowed security. Losses from short sales can exceed the proceeds of the security sold; and they can also exceed the potential loss from an ordinary buy and sell transaction. The amount of any premium, dividends, or interest the fund may be required to pay in connection with a short sale will be
15
Table of Contents
MFS Core Equity Series
Notes to Financial Statements (unaudited) – continued
recognized as a fund expense. During the six months ended June 30, 2010, this expense amounted to $2,815. The fund segregates cash or marketable securities in an amount that, when combined with the amount of proceeds from the short sale deposited with the broker, at least equals the current market value of the security sold short. At June 30, 2010, the fund had no short sales outstanding.
Security Loans – State Street Bank and Trust Company (“State Street”), as lending agent, may loan the securities of the fund to certain qualified institutions (the “Borrowers”) approved by the fund. The loans are collateralized by cash and/or U.S. Treasury and federal agency obligations in an amount typically at least equal to the market value of the securities loaned. The market value of the loaned securities is determined at the close of business of the fund and any additional required collateral is delivered to the fund on the next business day. State Street provides the fund with indemnification against Borrower default. The fund bears the risk of loss with respect to the investment of cash collateral. On loans collateralized by cash, the cash collateral is invested in a money market fund or short-term securities. A portion of the income generated upon investment of the collateral is remitted to the Borrowers, and the remainder is allocated between the fund and the lending agent. On loans collateralized by U.S. Treasury and/or federal agency obligations, a fee is received from the Borrower, and is allocated between the fund and the lending agent. Income from securities lending is included in interest income on the Statement of Operations. The dividend and interest income earned on the securities loaned is accounted for in the same manner as other dividend and interest income.
Indemnifications – Under the fund’s organizational documents, its officers and Trustees may be indemnified against certain liabilities and expenses arising out of the performance of their duties to the fund. Additionally, in the normal course of business, the fund enters into agreements with service providers that may contain indemnification clauses. The fund’s maximum exposure under these agreements is unknown as this would involve future claims that may be made against the fund that have not yet occurred.
Investment Transactions and Income – Investment transactions are recorded on the trade date. Interest income is recorded on the accrual basis. All premium and discount is amortized or accreted for financial statement purposes in accordance with U.S. generally accepted accounting principles. Dividends received in cash are recorded on the ex-dividend date. Certain dividends from foreign securities will be recorded when the fund is informed of the dividend if such information is obtained subsequent to the ex-dividend date. Dividend and interest payments received in additional securities are recorded on the ex-dividend or ex-interest date in an amount equal to the value of the security on such date.
The fund may receive proceeds from litigation settlements. Any proceeds received from litigation involving portfolio holdings are reflected in the Statement of Operations in realized gain/loss if the security has been disposed of by the fund or in unrealized gain/loss if the security is still held by the fund. Any other proceeds from litigation not related to portfolio holdings are reflected as other income in the Statement of Operations.
Fees Paid Indirectly – The fund’s custody fee may be reduced according to an arrangement that measures the value of cash deposited with the custodian by the fund. For the six months ended June 30, 2010, custody fees were not reduced.
Tax Matters and Distributions – The fund intends to qualify as a regulated investment company, as defined under Subchapter M of the Internal Revenue Code, and to distribute all of its taxable income, including realized capital gains. As a result, no provision for federal income tax is required. The fund’s federal tax returns for the prior three fiscal years remain subject to examination by the Internal Revenue Service. Foreign taxes, if any, have been accrued by the fund in the accompanying financial statements.
Distributions to shareholders are recorded on the ex-dividend date. Income and capital gain distributions are determined in accordance with income tax regulations, which may differ from U.S. generally accepted accounting principles. Certain capital accounts in the financial statements are periodically adjusted for permanent differences in order to reflect their tax character. These adjustments have no impact on net assets or net asset value per share. Temporary differences which arise from recognizing certain items of income, expense, gain or loss in different periods for financial statement and tax purposes will reverse at some time in the future. Distributions in excess of net investment income or net realized gains are temporary overdistributions for financial statement purposes resulting from differences in the recognition or classification of income or distributions for financial statement and tax purposes.
Book/tax differences primarily relate to wash sale loss deferrals.
The tax character of distributions made during the current period, if any, will be determined at fiscal year end. The tax character of distributions declared to shareholders for the last fiscal year is as follows:
| 12/31/09 | ||
| Ordinary income (including any short-term capital gains) | $996,498 |
16
Table of Contents
MFS Core Equity Series
Notes to Financial Statements (unaudited) – continued
The federal tax cost and the tax basis components of distributable earnings were as follows:
| As of 6/30/10 | |||
| Cost of investments | $63,231,729 | ||
| Gross appreciation | 2,981,625 | ||
| Gross depreciation | (7,900,187 | ) | |
| Net unrealized appreciation (depreciation) | $(4,918,562 | ) | |
| As of 12/31/09 | |||
| Undistributed ordinary income | 704,124 | ||
| Capital loss carryforwards | (51,847,821 | ) | |
| Other temporary differences | (10,275 | ) | |
| Net unrealized appreciation (depreciation) | 1,633,313 | ||
The aggregate cost above includes prior fiscal year end tax adjustments, if applicable.
As of December 31, 2009, the fund had capital loss carryforwards available to offset future realized gains. Such losses expire as follows:
| 12/31/10 | $(26,693,718 | ) | |
| 12/31/16 | (16,149,798 | ) | |
| 12/31/17 | (9,004,305 | ) | |
| $(51,847,821 | ) |
Multiple Classes of Shares of Beneficial Interest – The fund offers multiple classes of shares, which differ in their respective distribution and/or service fees. The fund’s income, realized and unrealized gain (loss), and common expenses are allocated to shareholders based on the daily net assets of each class. Dividends are declared separately for each class. Differences in per share dividend rates are generally due to differences in separate class expenses. The fund’s distributions declared to shareholders as reported on the Statements of Changes in Net Assets are presented by class as follows:
| From net investment income | ||||
| Six months ended 6/30/10 | Year ended 12/31/09 | |||
| Initial Class | $663,488 | $936,035 | ||
| Service Class | 41,541 | 60,463 | ||
| Total | $705,029 | $996,498 | ||
| (3) | Transactions with Affiliates |
Investment Adviser – The fund has an investment advisory agreement with MFS to provide overall investment management and related administrative services and facilities to the fund.
The management fee is computed daily and paid monthly at the following annual rates:
| First $1 billion of average daily net assets | 0.75% | |
| Average daily net assets in excess of $1 billion | 0.65% |
The management fee incurred for the six months ended June 30, 2010 was equivalent to an annual effective rate of 0.75% of the fund’s average daily net assets.
Prior to May 1, 2010, the investment adviser had agreed in writing to pay a portion of the fund’s operating expenses, exclusive of management fee, distribution and/or service fees, interest, taxes, extraordinary expenses, brokerage and transaction costs and investment-related expenses, such that operating expenses did not exceed 0.15% annually of the fund’s average daily net assets. This written agreement terminated on April 30, 2010. For the period January 1, 2010 through April 30, 2010, this reduction amounted to $20,589 and is reflected as a reduction of total expenses in the Statement of Operations.
Effective May 1, 2010, the investment adviser has agreed in writing to pay a portion of the fund’s total annual operating expenses, exclusive of interest, taxes, extraordinary expenses, brokerage and transaction costs and investment-related expenses, such that operating expenses do not exceed 0.90% of average daily net assets for the Initial Class shares and 1.15% of average daily net assets for the Service Class shares. This written agreement will continue until modified by the fund’s Board of Trustees, but such an agreement will continue at least until April 30, 2012. For the period May 1, 2010 through June 30, 2010, this reduction amounted to $10,943 and is reflected as a reduction of total expenses in the Statement of Operations.
17
Table of Contents
MFS Core Equity Series
Notes to Financial Statements (unaudited) – continued
Distributor – MFS Fund Distributors, Inc. (MFD), a wholly-owned subsidiary of MFS, is the distributor of shares of the fund. The Trustees have adopted a distribution plan for the Service Class shares pursuant to Rule 12b-1 under the Investment Company Act of 1940.
The fund’s distribution plan provides that the fund will pay MFD distribution and/or service fees equal to 0.25% per annum of its average daily net assets attributable to Service Class shares as partial consideration for services performed and expenses incurred by MFD and financial intermediaries (including participating insurance companies that invest in the fund to fund variable annuity and variable life insurance contracts, sponsors of qualified retirement and pension plans that invest in the fund, and affiliates of these participating insurance companies and plan sponsors) in connection with the sale and distribution of the Service Class shares. MFD may subsequently pay all, or a portion, of the distribution and/or service fees to financial intermediaries.
Shareholder Servicing Agent – MFS Service Center, Inc. (MFSC), a wholly-owned subsidiary of MFS, receives a fee from the fund for its services as shareholder servicing agent. For the six months ended June 30, 2010, the fee was $3,883, which equated to 0.0120% annually of the fund’s average daily net assets. MFSC also receives payment from the fund for out-of-pocket expenses paid by MFSC on behalf of the fund. For the six months ended June 30, 2010, these costs amounted to $265.
Administrator – MFS provides certain financial, legal, shareholder communications, compliance, and other administrative services to the fund. Under an administrative services agreement, the fund partially reimburses MFS the costs incurred to provide these services. The fund is charged an annual fixed amount of $17,500 plus a fee based on average daily net assets. The administrative services fee incurred for the six months ended June 30, 2010 was equivalent to an annual effective rate of 0.0301 % of the fund’s average daily net assets.
Trustees’ and Officers’ Compensation – The fund pays compensation to independent Trustees in the form of a retainer, attendance fees, and additional compensation to Board and Committee chairpersons. The fund does not pay compensation directly to Trustees or officers of the fund who are also officers of the investment adviser, all of whom receive remuneration for their services to the fund from MFS. Certain officers and Trustees of the fund are officers or directors of MFS, MFD, and MFSC.
Other – This fund and certain other funds managed by MFS (the funds) have entered into services agreements (the Agreements) which provide for payment of fees by the funds to Tarantino LLC and Griffin Compliance LLC in return for the provision of services of an Independent Chief Compliance Officer (ICCO) and Assistant ICCO, respectively, for the funds. The ICCO and Assistant ICCO are officers of the funds and the sole members of Tarantino LLC and Griffin Compliance LLC, respectively. The funds can terminate the Agreements with Tarantino LLC and Griffin Compliance LLC at any time under the terms of the Agreements. For the six months ended June 30, 2010, the aggregate fees paid by the fund to Tarantino LLC and Griffin Compliance LLC were $266 and are included in miscellaneous expense on the Statement of Operations. MFS has agreed to reimburse the fund for a portion of the payments made by the fund in the amount of $213, which is shown as a reduction of total expenses in the Statement of Operations. Additionally, MFS has agreed to bear all expenses associated with office space, other administrative support, and supplies provided to the ICCO and Assistant ICCO.
The fund may invest in the MFS Institutional Money Market Portfolio which is managed by MFS and seeks a high level of current income consistent with preservation of capital and liquidity. Income earned on this investment is included in dividends from underlying funds on the Statement of Operations. This money market fund does not pay a management fee to MFS.
| (4) | Portfolio Securities |
Purchases and sales of investments, other than U.S. Government securities, purchased option transactions, and short-term obligations, aggregated $22,225,805 and $26,797,564, respectively.
18
Table of Contents
MFS Core Equity Series
Notes to Financial Statements (unaudited) – continued
| (5) | Shares of Beneficial Interest |
The fund’s Declaration of Trust permits the Trustees to issue an unlimited number of full and fractional shares of beneficial interest. Transactions in fund shares were as follows:
| Six months ended 6/30/10 | Year ended 12/31/09 | |||||||||||
| Shares | Amount | Shares | Amount | |||||||||
| Shares sold | ||||||||||||
Initial Class | 149,109 | $2,080,521 | 237,775 | $2,645,123 | ||||||||
Service Class | 14,612 | 201,015 | 118,024 | 1,296,676 | ||||||||
| 163,721 | $2,281,536 | 355,799 | $3,941,799 | |||||||||
| Shares issued to shareholders in reinvestment of distributions | ||||||||||||
Initial Class | 45,507 | $663,488 | 93,603 | $936,035 | ||||||||
Service Class | 2,855 | 41,541 | 6,058 | 60,463 | ||||||||
| 48,362 | $705,029 | 99,661 | $996,498 | |||||||||
| Shares reacquired | ||||||||||||
Initial Class | (474,640 | ) | $(6,494,299 | ) | (954,669 | ) | $(10,503,945 | ) | ||||
Service Class | (37,053 | ) | (507,557 | ) | (211,205 | ) | (2,311,930 | ) | ||||
| (511,693 | ) | $(7,001,856 | ) | (1,165,874 | ) | $(12,815,875 | ) | |||||
| Net change | ||||||||||||
Initial Class | (280,024 | ) | $(3,750,290 | ) | (623,291 | ) | $(6,922,787 | ) | ||||
Service Class | (19,586 | ) | (265,001 | ) | (87,123 | ) | (954,791 | ) | ||||
| (299,610 | ) | $(4,015,291 | ) | (710,414 | ) | $(7,877,578 | ) | |||||
| (6) | Line of Credit |
The fund and certain other funds managed by MFS participate in a $1.1 billion unsecured committed line of credit, subject to a $1 billion sublimit, provided by a syndication of banks under a credit agreement. Borrowings may be made for temporary financing needs. Interest is charged to each fund, based on its borrowings, generally at a rate equal to the higher of the Federal Reserve funds rate or one month LIBOR plus an agreed upon spread. A commitment fee, based on the average daily, unused portion of the committed line of credit, is allocated among the participating funds at the end of each calendar quarter. In addition, the fund and other funds managed by MFS have established unsecured uncommitted borrowing arrangements with certain banks for temporary financing needs. Interest is charged to each fund, based on its borrowings, at a rate equal to the Federal Reserve funds rate plus an agreed upon spread. For the six months ended June 30, 2010, the fund’s commitment fee and interest expense were $491 and $0, respectively, and are included in miscellaneous expense on the Statement of Operations.
| (7) | Transactions in Underlying Funds – Affiliated Issuers |
An affiliated issuer may be considered one in which the fund owns 5% or more of the outstanding voting securities, or a company which is under common control. For the purposes of this report, the fund assumes the following to be affiliated issuers:
| Underlying Funds | Beginning Share/Par Amount | Acquisitions Shares/Par Amount | Dispositions Shares/Par Amount | Ending Share/Par Amount | |||||
| MFS Institutional Money Market Portfolio | 422,843 | 5,754,045 | (5,429,362 | ) | 747,526 | ||||
| Underlying Funds | Realized Gain (Loss) | Capital Gain Distributions | Dividend Income | Ending Value | |||||
| MFS Institutional Money Market Portfolio | $— | $— | $249 | $747,526 | |||||
19
Table of Contents
MFS Core Equity Series
RESULTS OF SHAREHOLDER MEETING (unaudited)
At a special meeting of shareholders of MFS Variable Insurance Trust, which was held on January 28, 2010, the following actions were taken:
Item 1. To elect the following individuals as Trustees:
| Number of Dollars | ||||
| Nominee | For | Withheld Authority | ||
| Robert E. Butler | 6,823,651,821.26 | 1,818,252,669.55 | ||
| Lawrence H. Cohn, M.D. | 6,813,621,200.14 | 1,828,283,290.67 | ||
| Maureen R. Goldfarb | 6,825,332,620.76 | 1,816,571,870.05 | ||
| David H. Gunning | 6,823,081,841.37 | 1,818,822,649.44 | ||
| William R. Gutow | 6,813,678,877.22 | 1,828,225,613.59 | ||
| Michael Hegarty | 6,827,456,515.87 | 1,814,447,974.94 | ||
| John P. Kavanaugh | 6,830,363,113.12 | 1,811,541,377.69 | ||
| Robert J. Manning | 6,825,511,264.17 | 1,816,393,226.64 | ||
| Robert C. Pozen | 6,824,854,120.27 | 1,817,050,370.54 | ||
| J. Dale Sherratt | 6,816,913,203.87 | 1,824,991,286.94 | ||
| Laurie J. Thomsen | 6,823,590,745.56 | 1,818,313,745.25 | ||
| Robert W. Uek | 6,818,161,803.66 | 1,823,742,687.15 | ||
20
Table of Contents
MFS Core Equity Series
BOARD REVIEW OF INVESTMENT ADVISORY AGREEMENT
A discussion regarding the Board’s most recent review and renewal of the fund’s Investment Advisory Agreement with MFS will be available on or about November 1, 2010 by clicking on the fund’s name under “Variable Insurance Portfolios — VIT” in the “Products and Performance” section of the MFS Web site (mfs.com).
PROXY VOTING POLICIES AND INFORMATION
A general description of the MFS funds’ proxy voting policies and procedures is available without charge, upon request, by calling
1-800-225-2606, by visiting the Proxy Voting section of mfs.com or by visiting the SEC’s Web site at http://www.sec.gov.
Information regarding how the fund voted proxies relating to portfolio securities during the most recent twelve-month period ended June 30 is available without charge by visiting the Proxy Voting section of mfs.com or by visiting the SEC’s Web site at http://www.sec.gov.
QUARTERLY PORTFOLIO DISCLOSURE
The fund will file a complete schedule of portfolio holdings with the Securities and Exchange Commission (the Commission) for the first and third quarters of each fiscal year on Form N-Q. The fund’s Form N-Q may be reviewed and copied at the:
Public Reference Room
Securities and Exchange Commission
100 F Street, NE, Room 1580
Washington, D.C. 20549
Information on the operation of the Public Reference Room may be obtained by calling the Commission at 1-800-SEC-0330. The fund’s Form N-Q is available on the EDGAR database on the Commission’s Internet Web site at http://www.sec.gov, and copies of this information may be obtained, upon payment of a duplicating fee, by electronic request at the following e-mail address: publicinfo@sec.gov or by writing the Public Reference Section at the above address.
From time to time, MFS may post important information about the fund or the MFS funds on the MFS web site (mfs.com). This information is available by visiting the “News & Commentary” section of mfs.com or by clicking on the fund’s name under “Variable Insurance Portfolios — VIT” in the “Products and Performance” section of mfs.com.
21
Table of Contents

Table of Contents

Table of Contents
This report is prepared for the general information of contract owners. It is authorized for distribution to prospective investors only when preceded or accompanied by a current prospectus.
NOT FDIC INSURED Ÿ MAY LOSE VALUE Ÿ NO BANK GUARANTEE Ÿ NOT A DEPOSIT Ÿ NOT INSURED BY ANY FEDERAL GOVERNMENT AGENCY OR NCUA/NCUSIF
Table of Contents
MFS Utilities Series

Dear Contract Owners:
After having suffered their biggest declines since the Great Depression, most global markets experienced an impressive resurgence during the latter months of 2009 and the first quarter of 2010. The global economy was able to reap the benefits of two major trends. The first of these was the massive efforts of governments and central banks to increase liquidity in the financial system as they sought to prevent the credit crisis from further affecting the banking system. The second was the move by companies around the world to cut costs and operations to prepare for rapidly changing market conditions. We believe that these moves not only shortened the length of the downturn but also set the stage for recovery.
Even with the significant market gains of 2009 and the early part of 2010, the recovery is unrolling at a moderate pace, with rebounds in the manufacturing sector and corporate America leading the way. Central bankers are proceeding with caution and many have held benchmark interest rates unchanged as they debate the best way to withdraw stimulus measures without disrupting the fragile growth process. Complicating that debate late in the period was the emergence of the European debt crisis and worries about whether this crisis could derail the global recovery. As that crisis unrolled with no clear resolution, risk aversion rose along with volatility. Weakening economic data late in the period added uncertainty to the mix and sparked a retrenchment in global equity markets.
While hurdles remain, we believe that the global economy is proceeding on the road to recovery. As always, we continue to be mindful of the many challenges faced at the individual, national, and international levels. It is at times such as these that we want to remind investors of the merits of maintaining a long-term view, adhering to basic investing principles such as asset allocation and diversification, and working closely with advisors to identify and research investment opportunities. At MFS®, we take particular pride in how well mutual funds can provide a broad range of products that can fit investor needs in any type of market climate.
Respectfully,

Robert J. Manning
Chairman and Chief Executive Officer
MFS Investment Management®
August 16, 2010
The opinions expressed in this letter are subject to change, may not be relied upon for investment advice, and no forecasts can be guaranteed.
MFS Fund Distributors, Inc., 500 Boylston Street, Boston, MA 02116
1
Table of Contents
MFS Utilities Series
Portfolio structure (i)
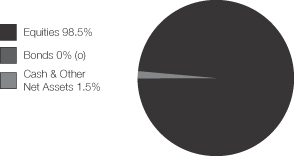
| Top ten holdings (i) | ||
| Virgin Media, Inc. | 3.8% | |
| Questar Corp. | 3.6% | |
| CMS Energy Corp. | 3.6% | |
| Williams Cos, Inc. | 3.4% | |
| EQT Corp. | 3.1% | |
| American Electric Power Co., Inc. | 2.9% | |
| El Paso Corp. | 2.8% | |
| Public Service Enterprise Group, Inc. | 2.7% | |
| Entergy Corp. | 2.6% | |
| Cellcom Israel Ltd. | 2.5% |
| Top five industries (i) | ||
| Utilities – Electric Power | 50.0% | |
| Telephone Services | 13.7% | |
| Telecommunications – Wireless | 10.2% | |
| Natural Gas – Distribution | 10.2% | |
| Natural Gas – Pipeline | 8.0% | |
| Issuer country weightings (i) | ||
| United States | 71.2% | |
| Brazil | 7.8% | |
| Israel | 3.6% | |
| United Kingdom | 3.5% | |
| Spain | 3.1% | |
| Portugal | 2.8% | |
| Germany | 1.7% | |
| Czech Republic | 1.3% | |
| Finland | 1.1% | |
| Other Countries | 3.9% | |
| (i) | For purposes of this presentation, the components include the market value of securities, and reflect the impact of the equivalent exposure of derivative positions, if applicable. These amounts may be negative from time to time. The bond component will include any accrued interest amounts. Equivalent exposure is a calculated amount that translates the derivative position into a reasonable approximation of the amount of the underlying asset that the portfolio would have to hold at a given point in time to have the same price sensitivity that results from the portfolio’s ownership of the derivative contract. When dealing with derivatives, equivalent exposure is a more representative measure of the potential impact of a position on portfolio performance than market value. Where the fund holds convertible bonds, these are treated as part of the equity portion of the portfolio. |
| (o) | Less than 0.1%. |
Percentages are based on net assets as of 6/30/10.
The portfolio is actively managed and current holdings may be different.
2
Table of Contents
MFS Utilities Series
After having suffered through one of the largest and most concentrated downturns since the 1930s, most asset markets staged a remarkable rebound during 2009 and early 2010. This recovery in global activity has been led importantly by emerging Asian economies, but broadening to include most of the global economy to varying degrees. Primary drivers of the recovery included an unwinding of the inventory destocking that took place earlier, the production of manufacturing and capital goods, as well as massive fiscal and monetary stimulus.
Late in the period, though, heightened risk surrounding the public-debt profiles of several of the peripheral European countries impaired market sentiment. At the same time, the improving trend in global macroeconomic data began to weaken somewhat. These two dynamics caused most asset prices to retrench significantly, as many questioned the durability of the global recovery.
3
Table of Contents
MFS Utilities Series
Fund Expenses Borne by the Contract Holders During the Period,
January 1, 2010 through June 30, 2010
As a contract holder of the fund, you incur ongoing costs, including management fees; distribution and/or service (12b-1) fees; and other fund expenses. This example is intended to help you understand your ongoing costs (in dollars) of investing in the fund and to compare these costs with the ongoing costs of investing in other mutual funds.
The example is based on an investment of $1,000 invested at the beginning of the period and held for the entire period January 1, 2010 through June 30, 2010.
Actual Expenses
The first line for each share class in the following table provides information about actual account values and actual expenses. You may use the information in this line, together with the amount you invested, to estimate the expenses that you paid over the period. Simply divide your account value by $1,000 (for example, an $8,600 account value divided by $1,000 = 8.6), then multiply the result by the number in the first line under the heading entitled “Expenses Paid During Period” to estimate the expenses you paid on your account during this period.
Hypothetical Example for Comparison Purposes
The second line for each share class in the following table provides information about hypothetical account values and hypothetical expenses based on the fund’s actual expense ratio and an assumed rate of return of 5% per year before expenses, which is not the fund’s actual return. The hypothetical account values and expenses may not be used to estimate the actual ending account balance or expenses you paid for the period. You may use this information to compare the ongoing costs of investing in the fund and other funds. To do so, compare this 5% hypothetical example with the 5% hypothetical examples that appear in the shareholder reports of the other funds.
Please note that the expenses shown in the table are meant to highlight the fund’s ongoing costs only and do not take into account the fees and expenses imposed under the variable contracts through which your investment in the fund is made. Therefore, the second line for each share class in the table is useful in comparing ongoing costs associated with an investment in vehicles (such as the fund) which fund benefits under variable annuity and variable life insurance contracts and to qualified pension and retirement plans only, and will not help you determine the relative total costs of investing in the fund through variable annuity and variable life insurance contracts. If the fees and expenses imposed under the variable contracts were included, your costs would have been higher.
| Share Class | Annualized Expense Ratio | Beginning Account Value 1/01/10 | Ending 6/30/10 | Expenses Paid 1/01/10-6/30/10 | ||||||
| Initial Class | Actual | 0.81% | $1,000.00 | $926.85 | $3.87 | |||||
| Hypothetical (h) | 0.81% | $1,000.00 | $1,020.78 | $4.06 | ||||||
| Service Class | Actual | 1.07% | $1,000.00 | $925.82 | $5.11 | |||||
| Hypothetical (h) | 1.07% | $1,000.00 | $1,019.49 | $5.36 |
| (h) | 5% class return per year before expenses. |
| (p) | Expenses paid is equal to each class’ annualized expense ratio, as shown above, multiplied by the average account value over the period, multiplied by the number of days in the period, divided by the number of days in the year. |
4
Table of Contents
MFS Utilities Series
PORTFOLIO OF INVESTMENTS – 6/30/10 (unaudited)
The Portfolio of Investments is a complete list of all securities owned by your fund. It is categorized by broad-based asset classes.
| Issuer | Shares/Par | Value ($) | |||
| COMMON STOCKS – 94.8% | |||||
| Cable TV – 4.8% | |||||
| Cablevision Systems Corp., “A” | 245,300 | $ | 5,889,653 | ||
| Comcast Corp., “Special A” | 2,341,600 | 38,472,488 | |||
| Time Warner Cable, Inc. | 630,150 | 32,818,212 | |||
| $ | 77,180,353 | ||||
| Energy – Independent – 1.5% | |||||
| Apache Corp. | 74,700 | $ | 6,288,993 | ||
| CONSOL Energy, Inc. | 403,640 | 13,626,886 | |||
| Southwestern Energy Co. (a) | 93,400 | 3,608,976 | |||
| $ | 23,524,855 | ||||
| Natural Gas – Distribution – 10.2% | |||||
| EQT Corp. | 1,381,430 | $ | 49,924,880 | ||
| NiSource, Inc. | 867,300 | 12,575,850 | |||
| Questar Corp. | 1,272,920 | 57,905,131 | |||
| Sempra Energy | 561,140 | 26,255,741 | |||
| Southern Union Co. | 269,800 | 5,897,828 | |||
| Spectra Energy Corp. | 463,270 | 9,297,829 | |||
| $ | 161,857,259 | ||||
| Natural Gas – Pipeline – 7.0% | |||||
| El Paso Corp. | 3,973,190 | $ | 44,142,141 | ||
| Enagas S.A. | 647,570 | 9,732,048 | |||
| Niska Gas Storage Partners LLC (a) | 193,400 | 3,589,504 | |||
| Williams Cos., Inc. | 2,951,305 | 53,949,855 | |||
| $ | 111,413,548 | ||||
| Oil Services – 0.1% | |||||
| Halliburton Co. | 33,900 | $ | 832,245 | ||
| Telecommunications – Wireless – 10.2% | |||||
| America Movil S.A.B. de C.V., “L”, ADR | 169,540 | $ | 8,053,150 | ||
| Cellcom Israel Ltd. | 1,574,310 | 39,357,750 | |||
| Mobile TeleSystems OJSC, ADR | 544,750 | 10,437,410 | |||
| MTN Group Ltd. | 731,040 | 9,583,567 | |||
| NII Holdings, Inc. (a) | 507,400 | 16,500,648 | |||
| Partner Communication Co. Ltd., ADR | 1,164,000 | 17,762,640 | |||
| Tim Participacoes S.A., ADR | 324,600 | 8,809,644 | |||
| Vivo Participacoes S.A., ADR | 1,008,925 | 26,151,336 | |||
| Vodafone Group PLC | 12,301,470 | 25,491,375 | |||
| $ | 162,147,520 | ||||
| Telephone Services – 12.9% | |||||
| American Tower Corp., “A” (a) | 468,200 | $ | 20,834,900 | ||
| CenturyTel, Inc. | 801,500 | 26,697,965 | |||
| Crown Castle International Corp. (a) | 233,800 | 8,711,388 | |||
| France Telecom S.A. | 359,500 | 6,203,492 | |||
| Portugal Telecom, SGPS, S.A. | 1,668,800 | 16,541,770 | |||
| PT XL Axiata Tbk (a) | 16,302,500 | 7,299,549 | |||
| Qwest Communications International, Inc. | 3,331,600 | 17,490,900 | |||
| Telefonica S.A. | 790,220 | 14,592,595 | |||
| Telenet Group Holding N.V. | 449,233 | 11,797,664 | |||
| Virgin Media, Inc. | 3,618,160 | 60,387,090 | |||
| Windstream Corp. | 1,490,748 | 15,742,299 | |||
| $ | 206,299,612 | ||||
| Issuer | Shares/Par | Value ($) | ||||
| COMMON STOCKS – continued | ||||||
| Utilities – Electric Power – 48.1% | ||||||
| AES Corp. (a) | 3,507,890 | $ | 32,412,904 | |||
| AES Tiete S.A., IPS | 969,359 | 11,143,601 | ||||
| Allegheny Energy, Inc. | 195,700 | 4,047,076 | ||||
| Alliant Energy Corp. | 344,500 | 10,934,430 | ||||
| American Electric Power Co., Inc. | 1,415,710 | 45,727,433 | ||||
| American Water Works Co., Inc. | 513,690 | 10,582,014 | ||||
| Calpine Corp. (a) | 1,394,260 | 17,734,987 | ||||
| CenterPoint Energy, Inc. | 1,260,990 | 16,594,628 | ||||
| CEZ AS | 506,860 | 20,748,077 | ||||
| China Hydroelectric Corp., ADR (a) | 482,890 | 3,626,504 | ||||
| China Longyuan Power Group (a) | 5,029,000 | 4,617,742 | ||||
| CMS Energy Corp. | 3,909,430 | 57,273,150 | ||||
| Companhia de Saneamento de Minas Gerais – Copasa MG | 661,000 | 9,155,125 | ||||
| Companhia Paranaense de Energia, ADR | 301,000 | 6,215,650 | ||||
| Companhia Paranaense de Energia, IPS | 182,800 | 3,767,402 | ||||
| Constellation Energy Group, Inc. | 640,450 | 20,654,513 | ||||
| CPFL Energia S.A. | 403,000 | 8,799,019 | ||||
| CPFL Energia S.A., ADR | 39,700 | 2,657,915 | ||||
| DPL, Inc. | 1,017,560 | 24,319,684 | ||||
| E.ON AG | 754,931 | 20,322,565 | ||||
| EDP Renovaveis S.A. (a) | 264,605 | 1,552,776 | ||||
| Eletropaulo Metropolitana S.A., IPS | 872,300 | 17,378,342 | ||||
| Energias de Portugal S.A. | 9,113,000 | 26,908,079 | ||||
| Energias do Brasil S.A. | 331,530 | 6,575,498 | ||||
| Entergy Corp. | 577,600 | 41,367,712 | ||||
| FirstEnergy Corp. | 442,500 | 15,589,275 | ||||
| Fortum Corp. | 788,500 | 17,358,185 | ||||
| National Grid PLC | 3,822,420 | 28,157,776 | ||||
| NextEra Energy, Inc. | 275,700 | 13,443,132 | ||||
| Northeast Utilities | 827,333 | 21,080,445 | ||||
| NRG Energy, Inc. (a) | 1,327,354 | 28,153,178 | ||||
| NV Energy, Inc. | 345,200 | 4,076,812 | ||||
| OGE Energy Corp. | 598,400 | 21,877,504 | ||||
| PG&E Corp. | 884,700 | 36,361,170 | ||||
| PPL Corp. | 1,258,700 | 31,404,565 | ||||
| Public Service Enterprise Group, Inc. | 1,352,760 | 42,381,971 | ||||
| Red Electrica de Espana | 694,199 | 24,815,155 | ||||
| RWE AG | 96,800 | 6,309,476 | ||||
| Scottish & Southern Energy PLC | 103,700 | 1,719,109 | ||||
| Tractebel Energia S.A. | 2,076,900 | 24,382,001 | ||||
| Verbund AG | 10,000 | 306,308 | ||||
| Wisconsin Energy Corp. | 482,500 | 24,482,050 | ||||
| $ | 767,014,938 | |||||
| Total Common Stocks (Identified Cost, $1,667,785,132) | $ | 1,510,270,330 | ||||
| BONDS – 0.0% | ||||||
| Asset-Backed & Securitized – 0.0% | ||||||
| Falcon Franchise Loan LLC, FRN, 3.398%, 2023 (Identified Cost, $14,606) (i)(z) | $ | 287,574 | $ | 14,005 | ||
5
Table of Contents
MFS Utilities Series
Portfolio of Investments (unaudited) – continued
| Issuer | Shares/Par | Value ($) | ||||
| CONVERTIBLE PREFERRED STOCKS – 2.9% | ||||||
| Natural Gas – Pipeline – 1.0% | ||||||
| El Paso Corp., 4.99% | 15,720 | $ | 15,130,500 | |||
| Utilities – Electric Power – 1.9% | ||||||
| Great Plains Energy, Inc., 12% | 134,230 | $ | 8,020,243 | |||
| NextEra Energy, Inc. , 8.375% | 320,000 | 15,792,000 | ||||
| PPL Corp., 9.5% | 131,790 | 6,853,792 | ||||
| $ | 30,666,035 | |||||
| Total Convertible Preferred Stocks (Identified Cost, $49,588,584) | $ | 45,796,535 | ||||
| CONVERTIBLE BONDS – 0.8% | ||||||
| Telephone Services – 0.8% | ||||||
| Virgin Media, Inc., 6.5%, 2016 (Identified Cost, $10,310,333) | $ | 11,460,000 | $ | 13,422,525 | ||
| Issuer | Shares/Par | Value ($) | |||
| MONEY MARKET FUNDS (v) – 1.2% | |||||
| MFS Institutional Money Market Portfolio, 0.22%, at Cost and Net Asset Value | 18,784,738 | $ | 18,784,738 | ||
| Total Investments (Identified Cost, $1,746,483,393) | $ | 1,588,288,133 | |||
| OTHER ASSETS, LESS LIABILITIES – 0.3% | 4,642,074 | ||||
| Net Assets – 100.0% | $ | 1,592,930,207 | |||
| (a) | Non-income producing security. |
| (i) | Interest only security for which the series receives interest on notional principal (Par amount). Par amount shown is the notional principal and does not reflect the cost of the security. |
| (v) | Underlying fund that is available only to investment companies managed by MFS. The rate quoted is the annualized seven-day yield of the fund at period end. |
| (z) | Restricted securities are not registered under the Securities Act of 1933 and are subject to legal restrictions on resale. These securities generally may be resold in transactions exempt from registration or to the public if the securities are subsequently registered. Disposal of these securities may involve time-consuming negotiations and prompt sale at an acceptable price may be difficult. The fund holds the following restricted securities: |
| Restricted Securities | Acquisition Date | Cost | Current Market Value | |||
| Falcon Franchise Loan LLC, FRN, 3.398%, 2023 | 1/18/02 | $14,606 | $14,005 | |||
| % of Net Assets | 0.0% |
The following abbreviations are used in this report and are defined:
| ADR | American Depository Receipt |
| FRN | Floating Rate Note. Interest rate resets periodically and may not be the rate reported at period end. |
| IPS | International Preference Stock |
| PLC | Public Limited Company |
Abbreviations indicate amounts shown in currencies other than the U.S. dollar. All amounts are stated in U.S. dollars unless otherwise indicated. A list of abbreviations is shown below:
| EUR | Euro |
| GBP | British Pound |
6
Table of Contents
MFS Utilities Series
Portfolio of Investments (unaudited) – continued
Derivative Contracts at 6/30/10
Forward Foreign Currency Exchange Contracts at 6/30/10
| Type | Currency | Counterparty | Contracts to Deliver/Receive | Settlement Date Range | In Exchange For | Contracts at Value | Net Unrealized Appreciation (Depreciation) | |||||||||||||
| Asset Derivatives | ||||||||||||||||||||
| SELL | EUR | Barclays Bank PLC | 4,640,569 | 7/12/10 | $ | 6,088,651 | $ | 5,674,988 | $ | 413,663 | ||||||||||
| SELL | EUR | HSBC Bank | 1,081,198 | 9/14/10 | 1,331,566 | 1,322,666 | 8,900 | |||||||||||||
| BUY | GBP | Barclays Bank PLC | 2,746,446 | 7/12/10 | 3,992,866 | 4,103,431 | 110,565 | |||||||||||||
| BUY | GBP | Deutsche Bank AG | 798,804 | 7/12/10 | 1,147,410 | 1,193,483 | 46,073 | |||||||||||||
| SELL | GBP | Barclays Bank PLC | 11,787,782 | 7/12/10 | 17,984,737 | 17,611,980 | 372,757 | |||||||||||||
| SELL | GBP | Deutsche Bank AG | 11,787,782 | 7/12/10 | 17,984,855 | 17,611,980 | 372,875 | |||||||||||||
| $ | 1,324,833 | |||||||||||||||||||
| Liability Derivatives | ||||||||||||||||||||
| BUY | EUR | Barclays Bank PLC | 444,535 | 7/12/10 | $ | 548,854 | $ | 543,625 | $ | (5,229 | ) | |||||||||
| BUY | EUR | Citibank N.A. | 384,024 | 7/12/10 | 472,789 | 469,626 | (3,163 | ) | ||||||||||||
| BUY | EUR | UBS AG | 1,906,257 | 9/14/10 | 2,335,645 | 2,331,987 | (3,658 | ) | ||||||||||||
| SELL | EUR | Citibank N.A. | 37,901 | 9/14/10 | 45,581 | 46,366 | (785 | ) | ||||||||||||
| SELL | EUR | Credit Suisse Group | 5,274,241 | 9/15/10 | 6,355,265 | 6,452,196 | (96,931 | ) | ||||||||||||
| SELL | EUR | Deutsche Bank AG | 4,414,411 | 9/15/10 | 5,319,189 | 5,400,331 | (81,142 | ) | ||||||||||||
| SELL | EUR | Goldman Sachs International | 19,567 | 7/12/10 | 23,928 | 23,929 | (1 | ) | ||||||||||||
| SELL | EUR | HSBC Bank | 9,645,284 | 9/14/10-9/15/10 | 11,596,643 | 11,799,472 | (202,829 | ) | ||||||||||||
| SELL | EUR | Merrill Lynch International Bank | 9,939,431 | 9/15/10 | 11,976,418 | 12,159,316 | (182,898 | ) | ||||||||||||
| SELL | EUR | UBS AG | 61,917,093 | 7/12/10-9/15/10 | 74,704,761 | 75,743,070 | (1,038,309 | ) | ||||||||||||
| SELL | GBP | Barclays Bank PLC | 18,216,221 | 7/12/10 | 26,556,105 | 27,216,630 | (660,525 | ) | ||||||||||||
| SELL | GBP | Deutsche Bank AG | 8,953,000 | 7/12/10 | 13,197,617 | 13,376,566 | (178,949 | ) | ||||||||||||
| SELL | GBP | JPMorgan Chase Bank | 8,251,000 | 7/12/10 | 12,011,930 | 12,327,718 | (315,788 | ) | ||||||||||||
| $ | (2,770,207 | ) | ||||||||||||||||||
At June 30, 2010, the fund had sufficient cash and/or securities to cover any commitments under these derivative contracts.
See Notes to Financial Statements
7
Table of Contents
MFS Utilities Series
FINANCIAL STATEMENTS | STATEMENT OF ASSETS AND LIABILITIES (unaudited)
This statement represents your fund’s balance sheet, which details the assets and liabilities comprising the total value of the fund.
At 6/30/10 | |||||
Assets | |||||
Investments – | |||||
Non-affiliated issuers, at value (identified cost, $1,727,698,655) | $1,569,503,395 | ||||
Underlying funds, at cost and value | 18,784,738 | ||||
Total investments, at value (identified cost, $1,746,483,393) | $1,588,288,133 | ||||
Restricted cash | 600,000 | ||||
Receivables for | |||||
Forward foreign currency exchange contracts | 1,324,833 | ||||
Investments sold | 1,571,287 | ||||
Fund shares sold | 613,256 | ||||
Interest and dividends | 8,341,796 | ||||
Other assets | 9,416 | ||||
Total assets | $1,600,748,721 | ||||
Liabilities | |||||
Payables for | |||||
Forward foreign currency exchange contracts | $2,770,207 | ||||
Investments purchased | 2,473,334 | ||||
Fund shares reacquired | 2,103,812 | ||||
Payable to affiliates | |||||
Investment adviser | 65,247 | ||||
Shareholder servicing costs | 1,257 | ||||
Distribution and/or service fees | 15,636 | ||||
Administrative services fee | 1,256 | ||||
Payable for independent Trustees’ compensation | 4,809 | ||||
Accrued expenses and other liabilities | 382,956 | ||||
Total liabilities | $7,818,514 | ||||
Net assets | $1,592,930,207 | ||||
Net assets consist of | |||||
Paid-in capital | $1,996,562,578 | ||||
Unrealized appreciation (depreciation) on investments and translation of assets and liabilities in foreign currencies | (159,671,023 | ) | |||
Accumulated net realized gain (loss) on investments and foreign currency transactions | (275,437,222 | ) | |||
Undistributed net investment income | 31,475,874 | ||||
Net assets | $1,592,930,207 | ||||
Shares of beneficial interest outstanding | 78,013,010 |
| Net assets | Shares outstanding | Net asset value per share | ||||
Initial Class | $476,949,918 | 23,170,920 | $20.58 | |||
Service Class | 1,115,980,289 | 54,842,090 | 20.35 |
See Notes to Financial Statements
8
Table of Contents
MFS Utilities Series
FINANCIAL STATEMENTS | STATEMENT OF OPERATIONS (unaudited)
This statement describes how much your fund earned in investment income and accrued in expenses. It also describes any gains and/or losses generated by fund operations.
| Six months ended 6/30/10 | ||||||
| Net investment income | ||||||
Income | ||||||
Dividends | $43,233,132 | |||||
Interest | 517,198 | |||||
Dividends from underlying funds | 21,161 | |||||
Foreign taxes withheld | (2,803,496 | ) | ||||
Total investment income | $40,967,995 | |||||
Expenses | ||||||
Management fee | $6,237,843 | |||||
Distribution and/or service fees | 1,480,541 | |||||
Shareholder servicing costs | 103,149 | |||||
Administrative services fee | 126,789 | |||||
Independent Trustees’ compensation | 22,375 | |||||
Custodian fee | 260,708 | |||||
Shareholder communications | 127,769 | |||||
Auditing fees | 29,929 | |||||
Legal fees | 18,138 | |||||
Miscellaneous | 41,357 | |||||
Total expenses | $8,448,598 | |||||
Fees paid indirectly | (123 | ) | ||||
Reduction of expenses by investment adviser | (5,612 | ) | ||||
Net expenses | $8,442,863 | |||||
Net investment income | $32,525,132 | |||||
Realized and unrealized gain (loss) on investments and foreign currency transactions | ||||||
Realized gain (loss) (identified cost basis) | ||||||
Investment transactions | $10,769,184 | |||||
Foreign currency transactions | 19,553,502 | |||||
Net realized gain (loss) on investments and foreign currency transactions | $30,322,686 | |||||
Change in unrealized appreciation (depreciation) | ||||||
Investments | $(189,851,705 | ) | ||||
Translation of assets and liabilities in foreign currencies | (2,500,083 | ) | ||||
Net unrealized gain (loss) on investments and foreign currency translation | $(192,351,788 | ) | ||||
Net realized and unrealized gain (loss) on investments and foreign currency | $(162,029,102 | ) | ||||
Change in net assets from operations | $(129,503,970 | ) |
See Notes to Financial Statements
9
Table of Contents
MFS Utilities Series
FINANCIAL STATEMENTS | STATEMENTS OF CHANGES IN NET ASSETS
These statements describe the increases and/or decreases in net assets resulting from operations, any distributions, and any shareholder transactions.
| Six months ended 6/30/10 (unaudited | ) | Year ended 12/31/09 | | |||
Change in net assets | ||||||
From operations | ||||||
Net investment income | $32,525,132 | $60,237,761 | ||||
Net realized gain (loss) on investments and foreign currency transactions | 30,322,686 | (98,225,707 | ) | |||
Net unrealized gain (loss) on investments and foreign currency translation | (192,351,788 | ) | 484,691,455 | |||
Change in net assets from operations | $(129,503,970 | ) | $446,703,509 | |||
Distributions declared to shareholders | ||||||
From net investment income | $(53,910,219 | ) | $(73,624,954 | ) | ||
Change in net assets from fund share transactions | $1,757,584 | $(86,291,421 | ) | |||
Total change in net assets | $(181,656,605 | ) | $286,787,134 | |||
Net assets | ||||||
At beginning of period | 1,774,586,812 | 1,487,799,678 | ||||
At end of period (including undistributed net investment income of $31,475,874 and | $1,592,930,207 | $1,774,586,812 |
See Notes to Financial Statements
10
Table of Contents
MFS Utilities Series
FINANCIAL STATEMENTS | FINANCIAL HIGHLIGHTS
The financial highlights table is intended to help you understand the fund’s financial performance for the semiannual period and the past 5 fiscal years. Certain information reflects financial results for a single fund share. The total returns in the table represent the rate by which an investor would have earned (or lost) on an investment in the fund share class (assuming reinvestment of all distributions) held for the entire period.
| Initial Class | Six months ended 6/30/10 | Years ended 12/31 | ||||||||||||||||
| 2009 | 2008 | 2007 | 2006 | 2005 | ||||||||||||||
| (unaudited) | ||||||||||||||||||
Net asset value, beginning of period | $22.92 | $18.21 | $34.48 | $29.27 | $23.74 | $20.45 | ||||||||||||
| Income (loss) from investment operations | ||||||||||||||||||
Net investment income (d) | $0.43 | $0.80 | $0.73 | $0.71 | $0.59 | $0.40 | ||||||||||||
Net realized and unrealized gain (loss) on investments and foreign currency | (2.04 | ) | 4.90 | (11.97 | ) | 7.10 | 6.47 | 3.02 | ||||||||||
Total from investment operations | $(1.61 | ) | $5.70 | $(11.24 | ) | $7.81 | $7.06 | $3.42 | ||||||||||
| Less distributions declared to shareholders | ||||||||||||||||||
From net investment income | $(0.73 | ) | $(0.99 | ) | $(0.44 | ) | $(0.32 | ) | $(0.53 | ) | $(0.13 | ) | ||||||
From net realized gain on investments | — | — | (4.59 | ) | (2.28 | ) | (1.00 | ) | — | |||||||||
Total distributions declared to shareholders | $(0.73 | ) | $(0.99 | ) | $(5.03 | ) | $(2.60 | ) | $(1.53 | ) | $(0.13 | ) | ||||||
Net asset value, end of period | $20.58 | $22.92 | $18.21 | $34.48 | $29.27 | $23.74 | ||||||||||||
Total return (%) (k)(r)(s) | (7.32 | )(n) | 33.44 | (37.77 | ) | 27.90 | 31.26 | 16.84 | ||||||||||
| Ratios (%) (to average net assets) and Supplemental data: | ||||||||||||||||||
Expenses before expense reductions (f) | 0.82 | (a) | 0.83 | 0.84 | 0.85 | 0.87 | 0.90 | |||||||||||
Expenses after expense reductions (f) | 0.81 | (a) | 0.83 | 0.81 | 0.82 | 0.86 | 0.90 | |||||||||||
Net investment income | 3.95 | (a) | 4.11 | 2.76 | 2.22 | 2.32 | 1.80 | |||||||||||
Portfolio turnover | 32 | 70 | 68 | 84 | 94 | 88 | ||||||||||||
Net assets at end of period (000 omitted) | $476,950 | $564,822 | $495,297 | $969,404 | $710,341 | $506,315 | ||||||||||||
See Notes to Financial Statements
11
Table of Contents
MFS Utilities Series
Financial Highlights (unaudited) – continued
| Service Class | Six months ended 6/30/10 | Years ended 12/31 | ||||||||||||||||
| 2009 | 2008 | 2007 | 2006 | 2005 | ||||||||||||||
| (unaudited) | ||||||||||||||||||
Net asset value, beginning of period | $22.65 | $17.98 | $34.11 | $29.01 | $23.56 | $20.32 | ||||||||||||
| Income (loss) from investment operations | ||||||||||||||||||
Net investment income (d) | $0.41 | $0.73 | $0.66 | $0.62 | $0.53 | $0.34 | ||||||||||||
Net realized and unrealized gain (loss) on investments and foreign currency | (2.03 | ) | 4.86 | (11.82 | ) | 7.03 | 6.42 | 3.01 | ||||||||||
Total from investment operations | $(1.62 | ) | $5.59 | $(11.16 | ) | $7.65 | $6.95 | $3.35 | ||||||||||
| Less distributions declared to shareholders | ||||||||||||||||||
From net investment income | $(0.68 | ) | $(0.92 | ) | $(0.38 | ) | $(0.27 | ) | $(0.50 | ) | $(0.11 | ) | ||||||
From net realized gain on investments | — | — | (4.59 | ) | (2.28 | ) | (1.00 | ) | — | |||||||||
Total distributions declared to shareholders | $(0.68 | ) | $(0.92 | ) | $(4.97 | ) | $(2.55 | ) | $(1.50 | ) | $(0.11 | ) | ||||||
Net asset value, end of period | $20.35 | $22.65 | $17.98 | $34.11 | $29.01 | $23.56 | ||||||||||||
Total return (%) (k)(r)(s) | (7.42 | )(n) | 33.09 | (37.91 | ) | 27.56 | 30.96 | 16.57 | ||||||||||
| Ratios (%) (to average net assets) and Supplemental data: | ||||||||||||||||||
Expenses before expense reductions (f) | 1.07 | (a) | 1.08 | 1.09 | 1.10 | 1.12 | 1.15 | |||||||||||
Expenses after expense reductions (f) | 1.07 | (a) | 1.07 | 1.06 | 1.07 | 1.11 | 1.15 | |||||||||||
Net investment income | 3.74 | (a) | 3.83 | 2.54 | 1.96 | 2.11 | 1.56 | |||||||||||
Portfolio turnover | 32 | 70 | 68 | 84 | 94 | 88 | ||||||||||||
Net assets at end of period (000 omitted) | $1,115,980 | $1,209,765 | $992,502 | $1,715,446 | $993,085 | $564,978 | ||||||||||||
| (a) | Annualized. |
| (d) | Per share data is based on average shares outstanding. |
| (f) | Ratios do not reflect reductions from fees paid indirectly, if applicable. |
| (k) | The total return does not reflect expenses that apply to separate accounts. Inclusion of these charges would reduce the total return figures for all periods shown. |
| (n) | Not annualized. |
| (r) | Certain expenses have been reduced without which performance would have been lower. |
| (s) | From time to time the fund may receive proceeds from litigation settlements, without which performance would be lower. |
See Notes to Financial Statements
12
Table of Contents
MFS Utilities Series
NOTES TO FINANCIAL STATEMENTS (unaudited)
| (1) | Business and Organization |
MFS Utilities Series (the fund) is a series of MFS Variable Insurance Trust (the trust). The trust is organized as a Massachusetts business trust and is registered under the Investment Company Act of 1940, as amended, as an open-end management investment company. The shareholders of each series of the trust are separate accounts of insurance companies, which offer variable annuity and/or life insurance products, and qualified retirement and pension plans.
| (2) | Significant Accounting Policies |
General – The preparation of financial statements in conformity with U.S. generally accepted accounting principles requires management to make estimates and assumptions that affect the reported amounts of assets and liabilities, and disclosure of contingent assets and liabilities at the date of the financial statements and the reported amounts of revenues and expenses during the reporting period. Actual results could differ from those estimates. In the preparation of these financial statements, management has evaluated subsequent events occurring after the date of the fund’s Statement of Assets and Liabilities through the date that the financial statements were issued. The fund invests primarily in securities of issuers in the utility industry. Issuers in a single industry can react similarly to market, economic, political and regulatory conditions and developments. The fund can invest in foreign securities, including securities of emerging market issuers. Investments in foreign securities are vulnerable to the effects of changes in the relative values of the local currency and the U.S. dollar and to the effects of changes in each country’s legal, political, and economic environment. The markets of emerging markets countries are generally more volatile than the markets of developed countries with more mature economies. All of the risks of investing in foreign securities previously described are heightened when investing in emerging markets countries.
Investment Valuations – Equity securities, including restricted equity securities, are generally valued at the last sale or official closing price as provided by a third-party pricing service on the market or exchange on which they are primarily traded. Equity securities, for which there were no sales reported that day, are generally valued at the last quoted daily bid quotation as provided by a third-party pricing service on the market or exchange on which such securities are primarily traded. Equity securities held short, for which there were no sales reported for that day, are generally valued at the last quoted daily ask quotation as provided by a third-party pricing service on the market or exchange on which such securities are primarily traded. Debt instruments and floating rate loans (other than short-term instruments), including restricted debt instruments, are generally valued at an evaluated or composite bid as provided by a third-party pricing service. Short-term instruments with a maturity at issuance of 60 days or less generally are valued at amortized cost, which approximates market value. Forward foreign currency contracts are generally valued at the mean of bid and asked prices for the time period interpolated from rates provided by a third-party pricing service for proximate time periods. Open-end investment companies are generally valued at net asset value per share. Securities and other assets generally valued on the basis of information from a third-party pricing service may also be valued at a broker/dealer bid quotation. Values obtained from third-party pricing services can utilize both transaction data and market information such as yield, quality, coupon rate, maturity, type of issue, trading characteristics, and other market data. The values of foreign securities and other assets and liabilities expressed in foreign currencies are converted to U.S. dollars using the mean of bid and asked prices for rates provided by a third-party pricing service.
The Board of Trustees has delegated primary responsibility for determining or causing to be determined the value of the fund’s investments (including any fair valuation) to the adviser pursuant to valuation policies and procedures approved by the Board. If the adviser determines that reliable market quotations are not readily available, investments are valued at fair value as determined in good faith by the adviser in accordance with such procedures under the oversight of the Board of Trustees. Under the fund’s valuation policies and procedures, market quotations are not considered to be readily available for most types of debt instruments and floating rate loans and many types of derivatives. These investments are generally valued at fair value based on information from third-party pricing services. In addition, investments may be valued at fair value if the adviser determines that an investment’s value has been materially affected by events occurring after the close of the exchange or market on which the investment is principally traded (such as foreign exchange or market) and prior to the determination of the fund’s net asset value, or after the halting of trading of a specific security where trading does not resume prior to the close of the exchange or market on which the security is principally traded. Events that occur on a frequent basis after foreign markets close (such as developments in foreign markets and significant movements in the U.S. markets) and prior to the determination of the fund’s net asset value may be deemed to have a material effect on the value of securities traded in foreign markets. Accordingly, the fund’s foreign equity securities may often be valued at fair value. The adviser generally relies on third-party pricing services or other information (such as the correlation with price movements of similar securities in the same or other markets; the type, cost and investment characteristics of the security; the business and financial condition of the issuer; and trading and other market data) to assist in determining whether to fair value and at what value to fair value an investment. The value of an investment for purposes of calculating the fund’s net asset value can differ depending on the source and method used to determine value. When fair valuation is used, the value of an investment used to determine the
13
Table of Contents
MFS Utilities Series
Notes to Financial Statements (unaudited) – continued
fund’s net asset value may differ from quoted or published prices for the same investment. There can be no assurance that the fund could obtain the fair value assigned to an investment if it were to sell the investment at the same time at which the fund determines its net asset value per share.
Various inputs are used in determining the value of the fund’s assets or liabilities. These inputs are categorized into three broad levels. In certain cases, the inputs used to measure fair value may fall into different levels of the fair value hierarchy. In such cases, an investment’s level within the fair value hierarchy is based on the lowest level of input that is significant to the fair value measurement. The fund’s assessment of the significance of a particular input to the fair value measurement in its entirety requires judgment, and considers factors specific to the investment. Level 1 includes unadjusted quoted prices in active markets for identical assets or liabilities. Level 2 includes other significant observable market-based inputs (including quoted prices for similar securities, interest rates, prepayment speed, and credit risk). Level 3 includes unobservable inputs, which may include the adviser’s own assumptions in determining the fair value of investments. Other financial instruments are derivative instruments not reflected in total investments, such as futures, forwards, swap contracts, and written options. The following is a summary of the levels used as of June 30, 2010 in valuing the fund’s assets or liabilities:
| Investments at Value | Level 1 | Level 2 | Level 3 | Total | ||||||
| Equity Securities: | ||||||||||
United States | $1,075,752,277 | $21,984,292 | $— | $1,097,736,569 | ||||||
Brazil | 125,035,533 | — | — | 125,035,533 | ||||||
Israel | 57,120,390 | — | — | 57,120,390 | ||||||
United Kingdom | — | 55,368,260 | — | 55,368,260 | ||||||
Spain | — | 49,139,798 | — | 49,139,798 | ||||||
Portugal | — | 45,002,626 | — | 45,002,626 | ||||||
Germany | — | 26,632,041 | — | 26,632,041 | ||||||
Czech Republic | 20,748,077 | — | — | 20,748,077 | ||||||
Finland | — | 17,358,185 | — | 17,358,185 | ||||||
Other Countries | 22,117,064 | 39,808,322 | — | 61,925,386 | ||||||
| Corporate Bonds | — | 13,422,525 | — | 13,422,525 | ||||||
| Commercial Mortgage-Backed Securities | — | 14,005 | — | 14,005 | ||||||
| Mutual Funds | 18,784,738 | — | — | 18,784,738 | ||||||
| Total Investments | $1,319,558,079 | $268,730,054 | $— | $1,588,288,133 | ||||||
| Other Financial Instruments | ||||||||||
| Forward Currency Contracts | $— | $(1,445,374 | ) | $— | $(1,445,374 | ) | ||||
For further information regarding security characteristics, see the Portfolio of Investments.
Foreign Currency Translation – Purchases and sales of foreign investments, income, and expenses are converted into U.S. dollars based upon currency exchange rates prevailing on the respective dates of such transactions or on the reporting date for foreign denominated receivables and payables. Gains and losses attributable to foreign currency exchange rates on sales of securities are recorded for financial statement purposes as net realized gains and losses on investments. Gains and losses attributable to foreign exchange rate movements on receivables, payables, income and expenses are recorded for financial statement purposes as foreign currency transaction gains and losses. That portion of both realized and unrealized gains and losses on investments that results from fluctuations in foreign currency exchange rates is not separately disclosed.
Derivatives – The fund may use derivatives for different purposes, including to earn income and enhance returns, to increase or decrease exposure to a particular market, to manage or adjust the risk profile of the fund, or as alternatives to direct investments. Derivatives may be used for hedging or non-hedging purposes. While hedging can reduce or eliminate losses, it can also reduce or eliminate gains. When the fund uses derivatives as an investment to increase market exposure, or for hedging purposes, gains and losses from derivative instruments may be substantially greater than the derivative’s original cost.
Derivative instruments include written options, purchased options, futures contracts, forward foreign currency exchange contracts, and swap agreements. The fund’s period end derivatives, as presented in the Portfolio of Investments and the associated Derivative Contract Tables, generally are indicative of the volume of its derivative activity during the period.
The following table presents, by major type of derivative contract, the fair value, on a gross basis, of the asset and liability components of derivatives held by the fund at June 30, 2010 as reported in the Statement of Assets and Liabilities:
| Fair Value | |||||||
| Risk | Derivative | Asset Derivatives | Liability Derivatives | ||||
| Foreign Exchange Contracts | Forward Foreign Currency Exchange Contracts | $1,324,833 | $(2,770,207 | ) | |||
14
Table of Contents
MFS Utilities Series
Notes to Financial Statements (unaudited) – continued
The following table presents, by major type of derivative contract, the realized gain (loss) on derivatives held by the fund for the six months ended June 30, 2010 as reported in the Statement of Operations:
Foreign Currency Transactions | ||
| Foreign Exchange Contracts | $20,150,515 |
The following table presents, by major type of derivative contract, the change in unrealized appreciation (depreciation) on derivatives held by the fund for the six months ended June 30, 2010 as reported in the Statement of Operations:
| Translation of Assets and Liabilities in Foreign Currencies | |||
| Foreign Exchange Contracts | $(2,489,072 | ) |
Derivative counterparty credit risk is managed through formal evaluation of the creditworthiness of all potential counterparties. On certain over-the-counter derivatives, the fund attempts to reduce its exposure to counterparty credit risk whenever possible by entering into an International Swaps and Derivatives Association (ISDA) Master Agreement on a bilateral basis with each of the counterparties with whom it undertakes a significant volume of transactions. The ISDA Master Agreement gives each party to the agreement the right to terminate all transactions traded under such agreement if there is a certain deterioration in the credit quality of the other party. The ISDA Master Agreement gives the fund the right, upon an event of default by the applicable counterparty or a termination of the agreement, to close out all transactions traded under such agreement and to net amounts owed under each transaction to one net amount payable by one party to the other. This right to close out and net payments across all transactions traded under the ISDA Master Agreement could result in a reduction of the fund’s credit risk to such counterparty equal to any amounts payable by the fund under the applicable transactions, if any. However, absent an event of default by the counterparty or a termination of the agreement, the ISDA Master Agreement does not result in an offset of reported balance sheet assets and liabilities across transactions between the fund and the applicable counterparty.
Collateral requirements differ by type of derivative. Collateral or margin requirements are set by the broker or exchange clearing house for exchange traded derivatives (i.e., futures and exchange-traded options) while collateral terms are contract specific for over-the-counter traded derivatives (i.e., forwards, swaps and over-the-counter options). For derivatives traded under an ISDA Master Agreement, the collateral requirements are netted across all transactions traded under such agreement and one amount is posted from one party to the other to collateralize such obligations. Cash collateral that has been pledged to cover obligations of the fund under derivative contracts will be reported separately on the Statement of Assets and Liabilities as restricted cash. Securities collateral pledged for the same purpose is noted in the Portfolio of Investments.
Forward Foreign Currency Exchange Contracts – The fund may enter into forward foreign currency exchange contracts for the purchase or sale of a specific foreign currency at a fixed price on a future date to hedge the fund’s currency risk or for non-hedging purposes. For hedging purposes, the fund may enter into contracts to deliver or receive foreign currency that the fund will receive from or use in its normal investment activities. The fund may also use contracts to hedge against declines in the value of foreign currency denominated securities due to unfavorable exchange rate movements. For non-hedging purposes, the fund may enter into contracts with the intent of changing the relative exposure of the fund’s portfolio of securities to different currencies to take advantage of anticipated exchange rate changes.
Forward foreign currency exchange contracts are adjusted by the daily exchange rate of the underlying currency and any unrealized gains or losses are recorded as a receivable or payable for forward foreign currency exchange contracts until the contract settlement date. On contract settlement date, any gain or loss on the contract is recorded as realized gains or losses on foreign currency transactions.
Risks may arise upon entering into these contracts from unanticipated movements in the value of the contract and from the potential inability of counterparties to meet the terms of their contracts. The fund’s maximum risk due to counterparty credit risk is the notional amount of the contract. This risk is mitigated in cases where there is an ISDA Master Agreement between the fund and the counterparty providing for netting as described above and for posting of collateral by the counterparty to the fund to cover the fund’s exposure to the counterparty under such ISDA Master Agreement.
Security Loans – State Street Bank and Trust Company (“State Street”), as lending agent, may loan the securities of the fund to certain qualified institutions (the “Borrowers”) approved by the fund. The loans are collateralized by cash and/or U.S. Treasury and federal agency obligations in an amount typically at least equal to the market value of the securities loaned. The market
15
Table of Contents
MFS Utilities Series
Notes to Financial Statements (unaudited) – continued
value of the loaned securities is determined at the close of business of the fund and any additional required collateral is delivered to the fund on the next business day. State Street provides the fund with indemnification against Borrower default. The fund bears the risk of loss with respect to the investment of cash collateral. On loans collateralized by cash, the cash collateral is invested in a money market fund or short-term securities. A portion of the income generated upon investment of the collateral is remitted to the Borrowers, and the remainder is allocated between the fund and the lending agent. On loans collateralized by U.S. Treasury and/or federal agency obligations, a fee is received from the Borrower, and is allocated between the fund and the lending agent. Income from securities lending is included in interest income on the Statement of Operations. The dividend and interest income earned on the securities loaned is accounted for in the same manner as other dividend and interest income.
Indemnifications – Under the fund’s organizational documents, its officers and Trustees may be indemnified against certain liabilities and expenses arising out of the performance of their duties to the fund. Additionally, in the normal course of business, the fund enters into agreements with service providers that may contain indemnification clauses. The fund’s maximum exposure under these agreements is unknown as this would involve future claims that may be made against the fund that have not yet occurred.
Investment Transactions and Income – Investment transactions are recorded on the trade date. Interest income is recorded on the accrual basis. All premium and discount is amortized or accreted for financial statement purposes in accordance with U.S. generally accepted accounting principles. Dividends received in cash are recorded on the ex-dividend date. Certain dividends from foreign securities will be recorded when the fund is informed of the dividend if such information is obtained subsequent to the ex-dividend date. Dividend and interest payments received in additional securities are recorded on the ex-dividend or ex-interest date in an amount equal to the value of the security on such date.
The fund may receive proceeds from litigation settlements. Any proceeds received from litigation involving portfolio holdings are reflected in the Statement of Operations in realized gain/loss if the security has been disposed of by the fund or in unrealized gain/loss if the security is still held by the fund. Any other proceeds from litigation not related to portfolio holdings are reflected as other income in the Statement of Operations.
Fees Paid Indirectly – The fund’s custody fee may be reduced according to an arrangement that measures the value of cash deposited with the custodian by the fund. This amount, for the six months ended June 30, 2010, is shown as a reduction of total expenses on the Statement of Operations.
Tax Matters and Distributions – The fund intends to qualify as a regulated investment company, as defined under Subchapter M of the Internal Revenue Code, and to distribute all of its taxable income, including realized capital gains. As a result, no provision for federal income tax is required. The fund’s federal tax returns for the prior three fiscal years remain subject to examination by the Internal Revenue Service. Foreign taxes, if any, have been accrued by the fund in the accompanying financial statements.
Distributions to shareholders are recorded on the ex-dividend date. Income and capital gain distributions are determined in accordance with income tax regulations, which may differ from U.S. generally accepted accounting principles. Certain capital accounts in the financial statements are periodically adjusted for permanent differences in order to reflect their tax character. These adjustments have no impact on net assets or net asset value per share. Temporary differences which arise from recognizing certain items of income, expense, gain or loss in different periods for financial statement and tax purposes will reverse at some time in the future. Distributions in excess of net investment income or net realized gains are temporary overdistributions for financial statement purposes resulting from differences in the recognition or classification of income or distributions for financial statement and tax purposes.
Book/tax differences primarily relate to wash sale loss deferrals, foreign currency transactions, and derivative transactions.
The tax character of distributions made during the current period, if any, will be determined at fiscal year end. The tax character of distributions declared to shareholders for the last fiscal year is as follows:
| 12/31/09 | ||
| Ordinary income (including any short-term capital gains) | $73,624,954 |
16
Table of Contents
MFS Utilities Series
Notes to Financial Statements (unaudited) – continued
The federal tax cost and the tax basis components of distributable earnings were as follows:
| As of 6/30/10 | |||
| Cost of investments | $1,776,100,591 | ||
| Gross appreciation | 54,742,651 | ||
| Gross depreciation | (242,555,109 | ) | |
| Net unrealized appreciation (depreciation) | $(187,812,458 | ) | |
| As of 12/31/09 | |||
| Undistributed ordinary income | 53,904,659 | ||
| Capital loss carryforwards | (276,171,377 | ) | |
| Other temporary differences | (19,378 | ) | |
| Net unrealized appreciation (depreciation) | 2,067,914 | ||
The aggregate cost above includes prior fiscal year end tax adjustments, if applicable.
As of December 31, 2009, the fund had capital loss carryforwards available to offset future realized gains. Such losses expire as follows:
| 12/31/16 | $(155,061,537 | ) | |
| 12/31/17 | (121,109,840 | ) | |
| $(276,171,377 | ) |
Multiple Classes of Shares of Beneficial Interest – The fund offers multiple classes of shares, which differ in their respective distribution and/or service fees. The fund’s income, realized and unrealized gain (loss), and common expenses are allocated to shareholders based on the daily net assets of each class. Dividends are declared separately for each class. Differences in per share dividend rates are generally due to differences in separate class expenses. The fund’s distributions declared to shareholders as reported on the Statements of Changes in Net Assets are presented by class as follows:
| From net investment income | ||||
| Six months ended 6/30/10 | Year ended 12/31/09 | |||
| Initial Class | $17,038,960 | $25,170,305 | ||
| Service Class | 36,871,259 | 48,454,649 | ||
| Total | $53,910,219 | $73,624,954 | ||
| (3) | Transactions with Affiliates |
Investment Adviser – The fund has an investment advisory agreement with MFS to provide overall investment management and related administrative services and facilities to the fund. The management fee is computed daily and paid monthly at the following annual rates:
| First $1 billion of average daily net assets | 0.75% | |
| Average daily net assets in excess of $1 billion | 0.70% |
The management fee incurred for the six months ended June 30, 2010 was equivalent to an annual effective rate of 0.73% of the fund’s average daily net assets.
Distributor – MFS Fund Distributors, Inc. (MFD), a wholly-owned subsidiary of MFS, is the distributor of shares of the fund. The Trustees have adopted a distribution plan for the Service Class shares pursuant to Rule 12b-1 under the Investment Company Act of 1940.
The fund’s distribution plan provides that the fund will pay MFD distribution and/or service fees equal to 0.25% per annum of its average daily net assets attributable to Service Class shares as partial consideration for services performed and expenses incurred by MFD and financial intermediaries (including participating insurance companies that invest in the fund to fund variable annuity and variable life insurance contracts, sponsors of qualified retirement and pension plans that invest in the fund, and affiliates of these participating insurance companies and plan sponsors) in connection with the sale and distribution of the Service Class shares. MFD may subsequently pay all, or a portion, of the distribution and/or service fees to financial intermediaries.
Shareholder Servicing Agent – MFS Service Center, Inc. (MFSC), a wholly-owned subsidiary of MFS, receives a fee from the fund for its services as shareholder servicing agent. For the six months ended June 30, 2010, the fee was $102,291, which equated to 0.0120% annually of the fund’s average daily net assets. MFSC also receives payment from the fund for out-of-pocket expenses paid by MFSC on behalf of the fund. For the six months ended June 30, 2010, these costs amounted to $858.
17
Table of Contents
MFS Utilities Series
Notes to Financial Statements (unaudited) – continued
Administrator – MFS provides certain financial, legal, shareholder communications, compliance, and other administrative services to the fund. Under an administrative services agreement, the fund partially reimburses MFS the costs incurred to provide these services. The fund is charged an annual fixed amount of $17,500 plus a fee based on average daily net assets. The administrative services fee incurred for the six months ended June 30, 2010 was equivalent to an annual effective rate of 0.0148% of the fund’s average daily net assets.
Trustees’ and Officers’ Compensation – The fund pays compensation to independent Trustees in the form of a retainer, attendance fees, and additional compensation to Board and Committee chairpersons. The fund does not pay compensation directly to Trustees or officers of the fund who are also officers of the investment adviser, all of whom receive remuneration for their services to the fund from MFS. Certain officers and Trustees of the fund are officers or directors of MFS, MFD, and MFSC.
Other – This fund and certain other funds managed by MFS (the funds) have entered into services agreements (the Agreements) which provide for payment of fees by the funds to Tarantino LLC and Griffin Compliance LLC in return for the provision of services of an Independent Chief Compliance Officer (ICCO) and Assistant ICCO, respectively, for the funds. The ICCO and Assistant ICCO are officers of the funds and the sole members of Tarantino LLC and Griffin Compliance LLC, respectively. The funds can terminate the Agreements with Tarantino LLC and Griffin Compliance LLC at any time under the terms of the Agreements. For the six months ended June 30, 2010, the aggregate fees paid by the fund to Tarantino LLC and Griffin Compliance LLC were $7,007 and are included in miscellaneous expense on the Statement of Operations. MFS has agreed to reimburse the fund for a portion of the payments made by the fund in the amount of $5,612, which is shown as a reduction of total expenses in the Statement of Operations. Additionally, MFS has agreed to bear all expenses associated with office space, other administrative support, and supplies provided to the ICCO and Assistant ICCO.
The fund may invest in the MFS Institutional Money Market Portfolio which is managed by MFS and seeks a high level of current income consistent with preservation of capital and liquidity. Income earned on this investment is included in dividends from underlying funds on the Statement of Operations. This money market fund does not pay a management fee to MFS.
| (4) | Portfolio Securities |
Purchases and sales of investments, other than U.S. Government securities, purchased option transactions, and short-term obligations, aggregated $567,588,623 and $538,397,594, respectively.
| (5) | Shares of Beneficial Interest |
The fund’s Declaration of Trust permits the Trustees to issue an unlimited number of full and fractional shares of beneficial interest. Transactions in fund shares were as follows:
| Six months ended 6/30/10 | Year ended 12/31/09 | |||||||||||
| Shares | �� | Amount | Shares | Amount | ||||||||
| Shares sold | ||||||||||||
Initial Class | 1,110,381 | $24,882,616 | 2,396,764 | $46,804,076 | ||||||||
Service Class | 3,481,180 | 77,282,437 | 5,257,641 | 101,070,851 | ||||||||
| 4,591,561 | $102,165,053 | 7,654,405 | $147,874,927 | |||||||||
| Shares issued to shareholders in reinvestment of distributions | ||||||||||||
Initial Class | 752,272 | $17,038,960 | 1,531,040 | $25,170,305 | ||||||||
Service Class | 1,646,038 | 36,871,259 | 2,978,159 | 48,454,649 | ||||||||
| 2,398,310 | $53,910,219 | 4,509,199 | $73,624,954 | |||||||||
| Shares reacquired | ||||||||||||
Initial Class | (3,333,079 | ) | $(74,149,416 | ) | (6,484,924 | ) | $(122,829,266 | ) | ||||
Service Class | (3,698,631 | ) | (80,168,272 | ) | (10,032,778 | ) | (184,962,036 | ) | ||||
| (7,031,710 | ) | $(154,317,688 | ) | (16,517,702 | ) | $(307,791,302 | ) | |||||
| Net change | ||||||||||||
Initial Class | (1,470,426 | ) | $(32,227,840 | ) | (2,557,120 | ) | $(50,854,885 | ) | ||||
Service Class | 1,428,587 | 33,985,424 | (1,796,978 | ) | (35,436,536 | ) | ||||||
| (41,839 | ) | $1,757,584 | (4,354,098 | ) | $(86,291,421 | ) | ||||||
| (6) | Line of Credit |
The fund and certain other funds managed by MFS participate in a $1.1 billion unsecured committed line of credit, subject to a $1 billion sublimit, provided by a syndication of banks under a credit agreement. Borrowings may be made for temporary financing needs. Interest is charged to each fund, based on its borrowings, generally at a rate equal to the higher of the Federal
18
Table of Contents
MFS Utilities Series
Notes to Financial Statements (unaudited) – continued
Reserve funds rate or one month LIBOR plus an agreed upon spread. A commitment fee, based on the average daily, unused portion of the committed line of credit, is allocated among the participating funds at the end of each calendar quarter. In addition, the fund and other funds managed by MFS have established unsecured uncommitted borrowing arrangements with certain banks for temporary financing needs. Interest is charged to each fund, based on its borrowings, at a rate equal to the Federal Reserve funds rate plus an agreed upon spread. For the six months ended June 30, 2010, the fund’s commitment fee and interest expense were $12,775 and $0, respectively, and are included in miscellaneous expense on the Statement of Operations.
| (7) | Transactions in Underlying Funds – Affiliated Issuers |
An affiliated issuer may be considered one in which the fund owns 5% or more of the outstanding voting securities, or a company which is under common control. For the purposes of this report, the fund assumes the following to be affiliated issuers:
| Underlying Funds | Beginning Share/Par Amount | Acquisitions Shares/Par Amount | Dispositions Shares/Par Amount | Ending Share/Par Amount | |||||
| MFS Institutional Money Market Portfolio | 45,631,532 | 182,813,036 | (209,659,830 | ) | 18,784,738 | ||||
| Underlying Funds | Realized Gain (Loss) | Capital Gain Distributions | Dividend Income | Ending Value | |||||
| MFS Institutional Money Market Portfolio | $— | $— | $21,161 | $18,784,738 | |||||
19
Table of Contents
MFS Utilities Series
RESULTS OF SHAREHOLDER MEETING (unaudited)
At a special meeting of shareholders of MFS Variable Insurance Trust, which was held on January 28, 2010, the following actions were taken:
Item 1. To elect the following individuals as Trustees:
| Number of Dollars | ||||
| Nominee | For | Withheld Authority | ||
| Robert E. Butler | 6,823,651,821.26 | 1,818,252,669.55 | ||
| Lawrence H. Cohn, M.D. | 6,813,621,200.14 | 1,828,283,290.67 | ||
| Maureen R. Goldfarb | 6,825,332,620.76 | 1,816,571,870.05 | ||
| David H. Gunning | 6,823,081,841.37 | 1,818,822,649.44 | ||
| William R. Gutow | 6,813,678,877.22 | 1,828,225,613.59 | ||
| Michael Hegarty | 6,827,456,515.87 | 1,814,447,974.94 | ||
| John P. Kavanaugh | 6,830,363,113.12 | 1,811,541,377.69 | ||
| Robert J. Manning | 6,825,511,264.17 | 1,816,393,226.64 | ||
| Robert C. Pozen | 6,824,854,120.27 | 1,817,050,370.54 | ||
| J. Dale Sherratt | 6,816,913,203.87 | 1,824,991,286.94 | ||
| Laurie J. Thomsen | 6,823,590,745.56 | 1,818,313,745.25 | ||
| Robert W. Uek | 6,818,161,803.66 | 1,823,742,687.15 | ||
20
Table of Contents
MFS Utilities Series
BOARD REVIEW OF INVESTMENT ADVISORY AGREEMENT
A discussion regarding the Board’s most recent review and renewal of the fund’s Investment Advisory Agreement with MFS will be available on or about November 1, 2010 by clicking on the fund’s name under ‘‘Variable Insurance Portfolios — VIT’’ in the ‘‘Products and Performance’’ section of the MFS Web site (mfs.com).
PROXY VOTING POLICIES AND INFORMATION
A general description of the MFS funds’ proxy voting policies and procedures is available without charge, upon request, by calling
1-800-225-2606, by visiting the Proxy Voting section of mfs.com or by visiting the SEC’s Web site at http://www.sec.gov.
Information regarding how the fund voted proxies relating to portfolio securities during the most recent twelve-month period ended June 30 is available without charge by visiting the Proxy Voting section of mfs.com or by visiting the SEC’s Web site at http://www.sec.gov.
QUARTERLY PORTFOLIO DISCLOSURE
The fund will file a complete schedule of portfolio holdings with the Securities and Exchange Commission (the Commission) for the first and third quarters of each fiscal year on Form N-Q. The fund’s Form N-Q may be reviewed and copied at the:
Public Reference Room
Securities and Exchange Commission
100 F Street, NE, Room 1580
Washington, D.C. 20549
Information on the operation of the Public Reference Room may be obtained by calling the Commission at 1-800-SEC-0330. The fund’s Form N-Q is available on the EDGAR database on the Commission’s Internet Web site at http://www.sec.gov, and copies of this information may be obtained, upon payment of a duplicating fee, by electronic request at the following e-mail address: publicinfo@sec.gov or by writing the Public Reference Section at the above address.
From time to time, MFS may post important information about the fund or the MFS funds on the MFS web site (mfs.com). This information is available by visiting the “News & Commentary” section of mfs.com or by clicking on the fund’s name under “Variable Insurance Portfolios — VIT” in the “Products and Performance” section of mfs.com.
21
Table of Contents

Table of Contents

Table of Contents
MFS® INVESTORS GROWTH STOCK SERIES
This report is prepared for the general information of contract owners. It is authorized for distribution to prospective investors only when preceded or accompanied by a current prospectus.
NOT FDIC INSURED Ÿ MAY LOSE VALUE Ÿ NO BANK GUARANTEE Ÿ NOT A DEPOSIT Ÿ NOT INSURED BY ANY FEDERAL GOVERNMENT AGENCY OR NCUA/NCUSIF
Table of Contents
MFS Investors Growth Stock Series

Dear Contract Owners:
After having suffered their biggest declines since the Great Depression, most global markets experienced an impressive resurgence during the latter months of 2009 and the first quarter of 2010. The global economy was able to reap the benefits of two major trends. The first of these was the massive efforts of governments and central banks to increase liquidity in the financial system as they sought to prevent the credit crisis from further affecting the banking system. The second was the move by companies around the world to cut costs and operations to prepare for rapidly changing market conditions. We believe that these moves not only shortened the length of the downturn but also set the stage for recovery.
Even with the significant market gains of 2009 and the early part of 2010, the recovery is unrolling at a moderate pace, with rebounds in the manufacturing sector and corporate America leading the way. Central bankers are proceeding with caution and many have held benchmark interest rates unchanged as they debate the best way to withdraw stimulus measures without disrupting the fragile growth process. Complicating that debate late in the period was the emergence of the European debt crisis and worries about whether this crisis could derail the global recovery. As that crisis unrolled with no clear resolution, risk aversion rose along with volatility. Weakening economic data late in the period added uncertainty to the mix and sparked a retrenchment in global equity markets.
While hurdles remain, we believe that the global economy is proceeding on the road to recovery. As always, we continue to be mindful of the many challenges faced at the individual, national, and international levels. It is at times such as these that we want to remind investors of the merits of maintaining a long-term view, adhering to basic investing principles such as asset allocation and diversification, and working closely with advisors to identify and research investment opportunities. At MFS®, we take particular pride in how well mutual funds can provide a broad range of products that can fit investor needs in any type of market climate.
Respectfully,

Robert J. Manning
Chairman and Chief Executive Officer
MFS Investment Management®
August 16, 2010
The opinions expressed in this letter are subject to change, may not be relied upon for investment advice, and no forecasts can be guaranteed.
MFS Fund Distributors, Inc., 500 Boylston Street, Boston, MA 02116
1
Table of Contents
MFS Investors Growth Stock Series
Portfolio structure

| Top ten holdings | ||
| Oracle Corp. | 4.4% | |
| Cisco Systems, Inc. | 4.2% | |
| MasterCard, Inc., “A” | 3.6% | |
| Danaher Corp. | 3.6% | |
| Accenture Ltd., “A” | 3.3% | |
| Google, Inc., “A” | 3.0% | |
| Colgate-Palmolive Co. | 2.9% | |
| Johnson & Johnson | 2.7% | |
| Schlumberger Ltd. | 2.6% | |
| Apple, Inc. | 2.5% |
| Equity sectors | ||
| Technology | 24.6% | |
| Health Care | 16.5% | |
| Special Products & Services | 13.0% | |
| Consumer Staples | 12.8% | |
| Financial Services | 8.4% | |
| Industrial Goods & Services | 6.8% | |
| Energy | 5.9% | |
| Retailing | 4.8% | |
| Basic Materials | 3.4% | |
| Leisure | 2.7% |
Percentages are based on net assets as of 6/30/10.
The portfolio is actively managed and current holdings may be different.
2
Table of Contents
MFS Investors Growth Stock Series
After having suffered through one of the largest and most concentrated downturns since the 1930s, most asset markets staged a remarkable rebound during 2009 and early 2010. This recovery in global activity has been led importantly by emerging Asian economies, but broadening to include most of the global economy to varying degrees. Primary drivers of the recovery included an unwinding of the inventory destocking that took place earlier, the production of manufacturing and capital goods, as well as massive fiscal and monetary stimulus.
Late in the period, though, heightened risk surrounding the public-debt profiles of several of the peripheral European countries impaired market sentiment. At the same time, the improving trend in global macroeconomic data began to weaken somewhat. These two dynamics caused most asset prices to retrench significantly, as many questioned the durability of the global recovery.
3
Table of Contents
MFS Investors Growth Stock Series
Fund Expenses Borne by the Contract Holders During the Period,
January 1, 2010 through June 30, 2010
As a contract holder of the fund, you incur ongoing costs, including management fees; distribution and/or service (12b-1) fees; and other fund expenses. This example is intended to help you understand your ongoing costs (in dollars) of investing in the fund and to compare these costs with the ongoing costs of investing in other mutual funds.
The example is based on an investment of $1,000 invested at the beginning of the period and held for the entire period January 1, 2010 through June 30, 2010.
Actual Expenses
The first line for each share class in the following table provides information about actual account values and actual expenses. You may use the information in this line, together with the amount you invested, to estimate the expenses that you paid over the period. Simply divide your account value by $1,000 (for example, an $8,600 account value divided by $1,000 = 8.6), then multiply the result by the number in the first line under the heading entitled “Expenses Paid During Period” to estimate the expenses you paid on your account during this period.
Hypothetical Example for Comparison Purposes
The second line for each share class in the following table provides information about hypothetical account values and hypothetical expenses based on the fund’s actual expense ratio and an assumed rate of return of 5% per year before expenses, which is not the fund’s actual return. The hypothetical account values and expenses may not be used to estimate the actual ending account balance or expenses you paid for the period. You may use this information to compare the ongoing costs of investing in the fund and other funds. To do so, compare this 5% hypothetical example with the 5% hypothetical examples that appear in the shareholder reports of the other funds.
Please note that the expenses shown in the table are meant to highlight the fund’s ongoing costs only and do not take into account the fees and expenses imposed under the variable contracts through which your investment in the fund is made. Therefore, the second line for each share class in the table is useful in comparing ongoing costs associated with an investment in vehicles (such as the fund) which fund benefits under variable annuity and variable life insurance contracts and to qualified pension and retirement plans only, and will not help you determine the relative total costs of investing in the fund through variable annuity and variable life insurance contracts. If the fees and expenses imposed under the variable contracts were included, your costs would have been higher.
| Share Class | Annualized Expense Ratio | Beginning Account Value 1/01/10 | Ending Account Value 6/30/10 | Expenses Paid During Period (p) 1/01/10-6/30/10 | ||||||
| Initial Class | Actual | 0.85% | $1,000.00 | $914.30 | $4.03 | |||||
| Hypothetical (h) | 0.85% | $1,000.00 | $1,020.58 | $4.26 | ||||||
| Service Class | Actual | 1.10% | $1,000.00 | $914.09 | $5.22 | |||||
| Hypothetical (h) | 1.10% | $1,000.00 | $1,019.34 | $5.51 |
| (h) | 5% class return per year before expenses. |
| (p) | Expenses paid is equal to each class’ annualized expense ratio, as shown above, multiplied by the average account value over the period, multiplied by the number of days in the period, divided by the number of days in the year. |
4
Table of Contents
MFS Investors Growth Stock Series
PORTFOLIO OF INVESTMENTS – 6/30/10 (unaudited)
The Portfolio of Investments is a complete list of all securities owned by your fund. It is categorized by broad-based asset classes.
| Issuer | Shares/Par | Value ($) | |||
| COMMON STOCKS – 98.9% | |||||
| Aerospace – 2.8% | |||||
| Precision Castparts Corp. | 10,990 | $ | 1,131,091 | ||
| United Technologies Corp. | 119,260 | 7,741,167 | |||
| $ | 8,872,258 | ||||
| Alcoholic Beverages – 1.6% | |||||
| Companhia de Bebidas das Americas, ADR | 21,220 | $ | 2,143,432 | ||
| Diageo PLC | 178,290 | 2,793,638 | |||
| $ | 4,937,070 | ||||
| Apparel Manufacturers – 2.7% | |||||
| LVMH Moet Hennessy Louis Vuitton S.A. | 24,670 | $ | 2,687,245 | ||
| NIKE, Inc., “B” | 86,360 | 5,833,618 | |||
| $ | 8,520,863 | ||||
| Broadcasting – 0.3% | |||||
| Omnicom Group, Inc. | 29,930 | $ | 1,026,599 | ||
| Brokerage & Asset Managers – 5.2% | |||||
| Charles Schwab Corp. | 433,820 | $ | 6,151,568 | ||
| CME Group, Inc. | 16,370 | 4,608,974 | |||
| Franklin Resources, Inc. | 64,220 | 5,535,122 | |||
| $ | 16,295,664 | ||||
| Business Services – 13.0% | |||||
| Accenture Ltd., “A” | 268,200 | $ | 10,365,930 | ||
| Automatic Data Processing, Inc. | 39,840 | 1,603,958 | |||
| Dun & Bradstreet Corp. | 109,930 | 7,378,502 | |||
| Fidelity National Information Services, Inc. | 66,450 | 1,782,189 | |||
| MasterCard, Inc., “A” | 57,040 | 11,381,191 | |||
| Verisk Analytics, Inc., “A” (a) | 121,130 | 3,621,787 | |||
| Visa, Inc., “A” | 50,180 | 3,550,235 | |||
| Western Union Co. | 89,510 | 1,334,594 | |||
| $ | 41,018,386 | ||||
| Cable TV – 0.4% | |||||
| DIRECTV Group, Inc., “A” (a) | 37,850 | $ | 1,283,872 | ||
| Chemicals – 1.3% | |||||
| Monsanto Co. | 89,580 | $ | 4,140,388 | ||
| Computer Software – 4.4% | |||||
| Oracle Corp. | 646,810 | $ | 13,880,543 | ||
| Computer Software – Systems – 7.9% | |||||
| Apple, Inc. (a) | 31,310 | $ | 7,875,404 | ||
| EMC Corp. (a) | 204,220 | 3,737,226 | |||
| Hewlett-Packard Co. | 146,540 | 6,342,251 | |||
| International Business Machines Corp. | 55,500 | 6,853,140 | |||
| $ | 24,808,021 | ||||
| Consumer Products – 6.0% | |||||
| Church & Dwight Co., Inc. | 74,700 | $ | 4,684,437 | ||
| Colgate-Palmolive Co. | 117,230 | 9,233,035 | |||
| Procter & Gamble Co. | 81,473 | 4,886,751 | |||
| $ | 18,804,223 | ||||
| Issuer | Shares/Par | Value ($) | |||
| COMMON STOCKS – continued | |||||
| Electrical Equipment – 4.0% | |||||
| Danaher Corp. | 306,260 | $ | 11,368,371 | ||
| W.W. Grainger, Inc. | 12,760 | 1,268,982 | |||
| $ | 12,637,353 | ||||
| Electronics – 4.5% | |||||
| Microchip Technology, Inc. | 203,800 | $ | 5,653,412 | ||
| Samsung Electronics Co. Ltd., GDR | 9,772 | 3,057,135 | |||
| Taiwan Semiconductor Manufacturing Co. Ltd., ADR | 574,956 | 5,611,571 | |||
| $ | 14,322,118 | ||||
| Energy – Integrated – 2.0% | |||||
| Chevron Corp. | 34,920 | $ | 2,369,671 | ||
| Exxon Mobil Corp. | 45,680 | 2,606,958 | |||
| Hess Corp. | 29,510 | 1,485,533 | |||
| $ | 6,462,162 | ||||
| Food & Beverages – 5.2% | |||||
| Groupe Danone | 79,382 | $ | 4,239,154 | ||
| Mead Johnson Nutrition Co., “A” | 57,180 | 2,865,862 | |||
| Nestle S.A. | 30,708 | 1,481,660 | |||
| PepsiCo, Inc. | 128,990 | 7,861,941 | |||
| $ | 16,448,617 | ||||
| Food & Drug Stores – 0.4% | |||||
| CVS Caremark Corp. | 44,023 | $ | 1,290,754 | ||
| Gaming & Lodging – 0.3% | |||||
| Starwood Hotels & Resorts Worldwide, Inc. | 24,130 | $ | 999,706 | ||
| General Merchandise – 0.7% | |||||
| Target Corp. | 48,130 | $ | 2,366,552 | ||
| Internet – 3.6% | |||||
| eBay, Inc. (a) | 99,070 | $ | 1,942,763 | ||
| Google, Inc., “A” (a) | 21,360 | 9,504,132 | |||
| $ | 11,446,895 | ||||
| Major Banks – 3.2% | |||||
| Bank of New York Mellon Corp. | 243,088 | $ | 6,001,843 | ||
| State Street Corp. | 119,530 | 4,042,505 | |||
| $ | 10,044,348 | ||||
| Medical & Health Technology & Services – 2.1% | |||||
| Medco Health Solutions, Inc. (a) | 24,050 | $ | 1,324,674 | ||
| Patterson Cos., Inc. | 143,700 | 4,099,761 | |||
| VCA Antech, Inc. (a) | 48,140 | 1,191,946 | |||
| $ | 6,616,381 | ||||
| Medical Equipment – 9.9% | |||||
| Becton, Dickinson & Co. | 68,360 | $ | 4,622,503 | ||
| DENTSPLY International, Inc. | 230,600 | 6,897,246 | |||
| Medtronic, Inc. | 138,260 | 5,014,690 | |||
| St. Jude Medical, Inc. (a) | 45,710 | 1,649,674 | |||
| Synthes, Inc. | 26,700 | 3,070,181 | |||
| Thermo Fisher Scientific, Inc. (a) | 142,420 | 6,985,696 | |||
5
Table of Contents
MFS Investors Growth Stock Series
Portfolio of Investments (unaudited) – continued
| Issuer | Shares/Par | Value ($) | |||
| COMMON STOCKS – continued | |||||
| Medical Equipment – continued | |||||
| Waters Corp. (a) | 46,280 | $ | 2,994,316 | ||
| $ | 31,234,306 | ||||
| Metals & Mining – 0.7% | |||||
| BHP Billiton Ltd., ADR | 35,720 | $ | 2,214,283 | ||
| Network & Telecom – 4.2% | |||||
| Cisco Systems, Inc. (a) | 627,110 | $ | 13,363,714 | ||
| Oil Services – 3.9% | |||||
| National Oilwell Varco, Inc. | 123,900 | $ | 4,097,373 | ||
| Schlumberger Ltd. | 147,770 | 8,177,592 | |||
| $ | 12,274,965 | ||||
| Pharmaceuticals – 4.5% | |||||
| Abbott Laboratories | 67,570 | $ | 3,160,925 | ||
| Allergan, Inc. | 43,690 | 2,545,379 | |||
| Johnson & Johnson | 144,770 | 8,550,116 | |||
| $ | 14,256,420 | ||||
| Printing & Publishing – 1.7% | |||||
| MSCI, Inc., “A” (a) | 192,670 | $ | 5,279,158 | ||
| Specialty Chemicals – 1.4% | |||||
| Praxair, Inc. | 57,510 | $ | 4,370,185 | ||
| Specialty Stores – 1.0% | |||||
| Staples, Inc. | 166,615 | $ | 3,174,016 | ||
| Total Common Stocks (Identified Cost, $322,195,219) | $ | 312,389,820 | |||
| Issuer | Shares/Par | Value ($) | |||
| MONEY MARKET FUNDS (v) – 0.8% | |||||
| MFS Institutional Money Market Portfolio, 0.22%, at Cost and Net Asset Value | 2,566,462 | $ | 2,566,462 | ||
| Total Investments (Identified Cost, $324,761,681) | $ | 314,956,282 | |||
| OTHER ASSETS, LESS LIABILITIES – 0.3% | 1,056,293 | ||||
| Net Assets – 100.0% | $ | 316,012,575 | |||
| (a) | Non-income producing security. |
| (v) | Underlying fund that is available only to investment companies managed by MFS. The rate quoted is the annualized seven-day yield of the fund at period end. |
The following abbreviations are used in this report and are defined:
| ADR | American Depository Receipt |
| GDR | Global Depository Receipt |
| PLC | Public Limited Company |
See Notes to Financial Statements
6
Table of Contents
MFS Investors Growth Stock Series
FINANCIAL STATEMENTS | STATEMENT OF ASSETS AND LIABILITIES (unaudited)
This statement represents your fund’s balance sheet, which details the assets and liabilities comprising the total value of the fund.
At 6/30/10 | |||||
Assets | |||||
Investments – | |||||
Non-affiliated issuers, at value (identified cost, $322,195,219) | $312,389,820 | ||||
Underlying funds, at cost and value | 2,566,462 | ||||
Total investments, at value (identified cost, $324,761,681) | $314,956,282 | ||||
Receivables for | |||||
Investments sold | 10,536,872 | ||||
Fund shares sold | 206,441 | ||||
Interest and dividends | 196,770 | ||||
Other assets | 2,969 | ||||
Total assets | $325,899,334 | ||||
Liabilities | |||||
Payables for | |||||
Investments purchased | $9,615,295 | ||||
Fund shares reacquired | 182,387 | ||||
Payable to affiliates | |||||
Investment adviser | 10,899 | ||||
Shareholder servicing costs | 292 | ||||
Distribution and/or service fees | 3,367 | ||||
Administrative services fee | 297 | ||||
Payable for independent Trustees’ compensation | 1,715 | ||||
Accrued expenses and other liabilities | 72,507 | ||||
Total liabilities | $9,886,759 | ||||
Net assets | $316,012,575 | ||||
Net assets consist of | |||||
Paid-in capital | $344,757,606 | ||||
Unrealized appreciation (depreciation) on investments and translation of assets and liabilities in foreign currencies | (9,803,280 | ) | |||
Accumulated net realized gain (loss) on investments and foreign currency transactions | (19,505,056 | ) | |||
Undistributed net investment income | 563,305 | ||||
Net assets | $316,012,575 | ||||
Shares of beneficial interest outstanding | 35,872,745 |
| Net assets | Shares outstanding | Net asset value per share | ||||
Initial Class | $75,889,310 | 8,477,745 | $8.95 | |||
Service Class | 240,123,265 | 27,395,000 | 8.77 |
See Notes to Financial Statements
7
Table of Contents
MFS Investors Growth Stock Series
FINANCIAL STATEMENTS | STATEMENT OF OPERATIONS (unaudited)
This statement describes how much your fund earned in investment income and accrued in expenses. It also describes any gains and/or losses generated by fund operations.
| Six months ended 6/30/10 | ||||||
| Net investment income | ||||||
Income | ||||||
Dividends | $2,961,187 | |||||
Interest | 7,837 | |||||
Dividends from underlying funds | 6,207 | |||||
Foreign taxes withheld | (49,180 | ) | ||||
Total investment income | $2,926,051 | |||||
Expenses | ||||||
Management fee | $1,683,432 | |||||
Distribution and/or service fees | 452,908 | |||||
Shareholder servicing costs | 27,143 | |||||
Administrative services fee | 37,228 | |||||
Independent Trustees’ compensation | 6,682 | |||||
Custodian fee | 41,392 | |||||
Shareholder communications | 60,839 | |||||
Auditing fees | 25,967 | |||||
Legal fees | 4,222 | |||||
Miscellaneous | 21,473 | |||||
Total expenses | $2,361,286 | |||||
Fees paid indirectly | (3 | ) | ||||
Reduction of expenses by investment adviser | (1,526 | ) | ||||
Net expenses | $2,359,757 | |||||
Net investment income | $566,294 | |||||
Realized and unrealized gain (loss) on investments and foreign currency transactions | ||||||
Realized gain (loss) (identified cost basis) | ||||||
Investment transactions | $40,562,254 | |||||
Foreign currency transactions | (26,339 | ) | ||||
Net realized gain (loss) on investments and foreign currency transactions | $40,535,915 | |||||
Change in unrealized appreciation (depreciation) | ||||||
Investments | $(74,241,051 | ) | ||||
Translation of assets and liabilities in foreign currencies | (1,706 | ) | ||||
Net unrealized gain (loss) on investments and foreign currency translation | $(74,242,757 | ) | ||||
Net realized and unrealized gain (loss) on investments and foreign currency | $(33,706,842 | ) | ||||
Change in net assets from operations | $(33,140,548 | ) |
See Notes to Financial Statements
8
Table of Contents
MFS Investors Growth Stock Series
FINANCIAL STATEMENTS | STATEMENTS OF CHANGES IN NET ASSETS
These statements describe the increases and/or decreases in net assets resulting from operations, any distributions, and any shareholder transactions.
| Six months ended 6/30/10 (unaudited | ) | Year ended 12/31/09 | | |||
Change in net assets | ||||||
From operations | ||||||
Net investment income | $566,294 | $1,551,694 | ||||
Net realized gain (loss) on investments and foreign currency transactions | 40,535,915 | 514,536 | ||||
Net unrealized gain (loss) on investments and foreign currency translation | (74,242,757 | ) | 126,014,844 | |||
Change in net assets from operations | $(33,140,548 | ) | $128,081,074 | |||
Distributions declared to shareholders | ||||||
From net investment income | $(1,540,411 | ) | $(1,500,507 | ) | ||
Change in net assets from fund share transactions | $(148,356,302 | ) | $118,768,903 | |||
Total change in net assets | $(183,037,261 | ) | $245,349,470 | |||
Net assets | ||||||
At beginning of period | 499,049,836 | 253,700,366 | ||||
At end of period (including undistributed net investment income of $563,305 and | $316,012,575 | $499,049,836 |
See Notes to Financial Statements
9
Table of Contents
MFS Investors Growth Stock Series
FINANCIAL STATEMENTS | FINANCIAL HIGHLIGHTS
The financial highlights table is intended to help you understand the fund’s financial performance for the semiannual period and the past 5 fiscal years. Certain information reflects financial results for a single fund share. The total returns in the table represent the rate by which an investor would have earned (or lost) on an investment in the fund share class (assuming reinvestment of all distributions) held for the entire period.
| Initial Class | Six months ended 6/30/10 | Years ended 12/31 | |||||||||||||||
| 2009 | 2008 | 2007 | 2006 | 2005 | |||||||||||||
| (unaudited) | |||||||||||||||||
Net asset value, beginning of period | $9.83 | $7.10 | $11.82 | $10.65 | $9.90 | $9.51 | |||||||||||
| Income (loss) from investment operations | |||||||||||||||||
Net investment income (d) | $0.02 | $0.05 | $0.06 | $0.05 | $0.03 | $0.01 | |||||||||||
Net realized and unrealized gain (loss) on | (0.86 | ) | 2.74 | (4.24 | ) | 1.16 | 0.72 | 0.41 | |||||||||
Total from investment operations | $(0.84 | ) | $2.79 | $(4.18 | ) | $1.21 | $0.75 | $0.42 | |||||||||
| Less distributions declared to shareholders | |||||||||||||||||
From net investment income | $(0.04 | ) | $(0.06 | ) | $(0.06 | ) | $(0.04 | ) | $— | $(0.03 | ) | ||||||
From net realized gain on investments | — | — | (0.48 | ) | — | — | — | ||||||||||
Total distributions declared to shareholders | $(0.04 | ) | $(0.06 | ) | $(0.54 | ) | $(0.04 | ) | $— | $(0.03 | ) | ||||||
Net asset value, end of period | $8.95 | $9.83 | $7.10 | $11.82 | $10.65 | $9.90 | |||||||||||
Total return (%) (k)(r)(s) | (8.57 | )(n) | 39.55 | (36.87 | ) | 11.36 | 7.58 | 4.49 | |||||||||
| Ratios (%) (to average net assets) and Supplemental data: | |||||||||||||||||
Expenses before expense reductions (f) | 0.85 | (a) | 0.86 | 0.85 | 0.86 | 0.87 | 0.90 | ||||||||||
Expenses after expense reductions (f) | 0.85 | (a) | 0.86 | 0.85 | 0.86 | 0.87 | 0.90 | ||||||||||
Net investment income | 0.45 | (a) | 0.63 | 0.60 | 0.47 | 0.33 | 0.09 | ||||||||||
Portfolio turnover | 24 | 50 | 50 | 63 | 80 | 146 | |||||||||||
Net assets at end of period (000 omitted) | $75,889 | $93,011 | $75,444 | $148,096 | $161,081 | $176,463 | |||||||||||
See Notes to Financial Statements
10
Table of Contents
MFS Investors Growth Stock Series
Financial Highlights – continued
| Service Class | Six months ended 6/30/10 | Years ended 12/31 | |||||||||||||||
| 2009 | 2008 | 2007 | 2006 | 2005 | |||||||||||||
| (unaudited) | |||||||||||||||||
Net asset value, beginning of period | $9.62 | $6.95 | $11.57 | $10.43 | $9.72 | $9.34 | |||||||||||
| Income (loss) from investment operations | |||||||||||||||||
Net investment income (loss) (d) | $0.01 | $0.03 | $0.03 | $0.02 | $0.01 | $(0.01 | ) | ||||||||||
Net realized and unrealized gain (loss) on | (0.83 | ) | 2.68 | (4.14 | ) | 1.13 | 0.70 | 0.40 | |||||||||
Total from investment operations | $(0.82 | ) | $2.71 | $(4.11 | ) | $1.15 | $0.71 | $0.39 | |||||||||
| Less distributions declared to shareholders | |||||||||||||||||
From net investment income | $(0.03 | ) | $(0.04 | ) | $(0.03 | ) | $(0.01 | ) | $— | $(0.01 | ) | ||||||
From net realized gain on investments | �� | — | — | (0.48 | ) | — | — | — | |||||||||
Total distributions declared to shareholders | $(0.03 | ) | $(0.04 | ) | $(0.51 | ) | $(0.01 | ) | $— | $(0.01 | ) | ||||||
Net asset value, end of period | $8.77 | $9.62 | $6.95 | $11.57 | $10.43 | $9.72 | |||||||||||
Total return (%) (k)(r)(s) | (8.59 | )(n) | 39.10 | (36.98 | ) | 11.02 | 7.30 | 4.23 | |||||||||
| Ratios (%) (to average net assets) and Supplemental data: | |||||||||||||||||
Expenses before expense reductions (f) | 1.10 | (a) | 1.11 | 1.10 | 1.11 | 1.12 | 1.15 | ||||||||||
Expenses after expense reductions (f) | 1.10 | (a) | 1.11 | 1.10 | 1.11 | 1.12 | 1.15 | ||||||||||
Net investment income (loss) | 0.20 | (a) | 0.38 | 0.35 | 0.22 | 0.08 | (0.15 | ) | |||||||||
Portfolio turnover | 24 | 50 | 50 | 63 | 80 | 146 | |||||||||||
Net assets at end of period (000 omitted) | $240,123 | $406,039 | $178,256 | $297,186 | $300,026 | $301,252 | |||||||||||
| (a) | Annualized. |
| (d) | Per share data is based on average shares outstanding. |
| (f) | Ratios do not reflect reductions from fees paid indirectly, if applicable. |
| (k) | The total return does not reflect expenses that apply to separate accounts. Inclusion of these charges would reduce the total return figures for all periods shown. |
| (n) | Not annualized. |
| (r) | Certain expenses have been reduced without which performance would have been lower. |
| (s) | From time to time the fund may receive proceeds from litigation settlements, without which performance would be lower. |
See Notes to Financial Statements
11
Table of Contents
MFS Investors Growth Stock Series
NOTES TO FINANCIAL STATEMENTS (unaudited)
| (1) | Business and Organization |
MFS Investors Growth Stock Series (the fund) is a series of MFS Variable Insurance Trust (the trust). The trust is organized as a Massachusetts business trust and is registered under the Investment Company Act of 1940, as amended, as an open-end management investment company. The shareholders of each series of the trust are separate accounts of insurance companies, which offer variable annuity and/or life insurance products, and qualified retirement and pension plans.
| (2) | Significant Accounting Policies |
General – The preparation of financial statements in conformity with U.S. generally accepted accounting principles requires management to make estimates and assumptions that affect the reported amounts of assets and liabilities, and disclosure of contingent assets and liabilities at the date of the financial statements and the reported amounts of revenues and expenses during the reporting period. Actual results could differ from those estimates. In the preparation of these financial statements, management has evaluated subsequent events occurring after the date of the fund’s Statement of Assets and Liabilities through the date that the financial statements were issued. The fund can invest in foreign securities, including securities of emerging market issuers. Investments in foreign securities are vulnerable to the effects of changes in the relative values of the local currency and the U.S. dollar and to the effects of changes in each country’s legal, political, and economic environment. The markets of emerging markets countries are generally more volatile than the markets of developed countries with more mature economies. All of the risks of investing in foreign securities previously described are heightened when investing in emerging markets countries.
Investment Valuations – Equity securities, including restricted equity securities, are generally valued at the last sale or official closing price as provided by a third-party pricing service on the market or exchange on which they are primarily traded. Equity securities, for which there were no sales reported that day, are generally valued at the last quoted daily bid quotation as provided by a third-party pricing service on the market or exchange on which such securities are primarily traded. Equity securities held short, for which there were no sales reported for that day, are generally valued at the last quoted daily ask quotation as provided by a third-party pricing service on the market or exchange on which such securities are primarily traded. Short-term instruments with a maturity at issuance of 60 days or less generally are valued at amortized cost, which approximates market value. Open-end investment companies are generally valued at net asset value per share. Securities and other assets generally valued on the basis of information from a third-party pricing service may also be valued at a broker/dealer bid quotation. Values obtained from third-party pricing services can utilize both transaction data and market information such as yield, quality, coupon rate, maturity, type of issue, trading characteristics, and other market data. The values of foreign securities and other assets and liabilities expressed in foreign currencies are converted to U.S. dollars using the mean of bid and asked prices for rates provided by a third-party pricing service.
The Board of Trustees has delegated primary responsibility for determining or causing to be determined the value of the fund’s investments (including any fair valuation) to the adviser pursuant to valuation policies and procedures approved by the Board. If the adviser determines that reliable market quotations are not readily available, investments are valued at fair value as determined in good faith by the adviser in accordance with such procedures under the oversight of the Board of Trustees. Under the fund’s valuation policies and procedures, market quotations are not considered to be readily available for most types of debt instruments and floating rate loans and many types of derivatives. These investments are generally valued at fair value based on information from third-party pricing services. In addition, investments may be valued at fair value if the adviser determines that an investment’s value has been materially affected by events occurring after the close of the exchange or market on which the investment is principally traded (such as foreign exchange or market) and prior to the determination of the fund’s net asset value, or after the halting of trading of a specific security where trading does not resume prior to the close of the exchange or market on which the security is principally traded. Events that occur on a frequent basis after foreign markets close (such as developments in foreign markets and significant movements in the U.S. markets) and prior to the determination of the fund’s net asset value may be deemed to have a material effect on the value of securities traded in foreign markets. Accordingly, the fund’s foreign equity securities may often be valued at fair value. The adviser generally relies on third-party pricing services or other information (such as the correlation with price movements of similar securities in the same or other markets; the type, cost and investment characteristics of the security; the business and financial condition of the issuer; and trading and other market data) to assist in determining whether to fair value and at what value to fair value an investment. The value of an investment for purposes of calculating the fund’s net asset value can differ depending on the source and method used to determine value. When fair valuation is used, the value of an investment used to determine the fund’s net asset value may differ from quoted or published prices for the same investment. There can be no assurance that the fund could obtain the fair value assigned to an investment if it were to sell the investment at the same time at which the fund determines its net asset value per share.
12
Table of Contents
MFS Investors Growth Stock Series
Notes to Financial Statements (unaudited) – continued
Various inputs are used in determining the value of the fund’s assets or liabilities. These inputs are categorized into three broad levels. In certain cases, the inputs used to measure fair value may fall into different levels of the fair value hierarchy. In such cases, an investment’s level within the fair value hierarchy is based on the lowest level of input that is significant to the fair value measurement. The fund’s assessment of the significance of a particular input to the fair value measurement in its entirety requires judgment, and considers factors specific to the investment. Level 1 includes unadjusted quoted prices in active markets for identical assets or liabilities. Level 2 includes other significant observable market-based inputs (including quoted prices for similar securities, interest rates, prepayment speed, and credit risk). Level 3 includes unobservable inputs, which may include the adviser’s own assumptions in determining the fair value of investments. Other financial instruments are derivative instruments not reflected in total investments, such as futures, forwards, swap contracts, and written options. The following is a summary of the levels used as of June 30, 2010 in valuing the fund’s assets or liabilities:
| Investments at Value | Level 1 | Level 2 | Level 3 | Total | ||||
| Equity Securities: | ||||||||
United States | $285,091,522 | $— | $— | $285,091,522 | ||||
France | — | 6,926,398 | — | 6,926,398 | ||||
Taiwan | 5,611,571 | — | — | 5,611,571 | ||||
Switzerland | — | 4,551,841 | — | 4,551,841 | ||||
South Korea | — | 3,057,135 | — | 3,057,135 | ||||
United Kingdom | — | 2,793,638 | — | 2,793,638 | ||||
Australia | 2,214,283 | — | — | 2,214,283 | ||||
Brazil | 2,143,432 | — | — | 2,143,432 | ||||
| Mutual Funds | 2,566,462 | — | — | 2,566,462 | ||||
| Total Investments | $297,627,270 | $17,329,012 | $— | $314,956,282 |
For further information regarding security characteristics, see the Portfolio of Investments.
Foreign Currency Translation – Purchases and sales of foreign investments, income, and expenses are converted into U.S. dollars based upon currency exchange rates prevailing on the respective dates of such transactions or on the reporting date for foreign denominated receivables and payables. Gains and losses attributable to foreign currency exchange rates on sales of securities are recorded for financial statement purposes as net realized gains and losses on investments. Gains and losses attributable to foreign exchange rate movements on receivables, payables, income and expenses are recorded for financial statement purposes as foreign currency transaction gains and losses. That portion of both realized and unrealized gains and losses on investments that results from fluctuations in foreign currency exchange rates is not separately disclosed.
Derivatives – The fund may use derivatives for different purposes, including to earn income and enhance returns, to increase or decrease exposure to a particular market, to manage or adjust the risk profile of the fund, or as alternatives to direct investments. Derivatives may be used for hedging or non-hedging purposes. While hedging can reduce or eliminate losses, it can also reduce or eliminate gains. When the fund uses derivatives as an investment to increase market exposure, or for hedging purposes, gains and losses from derivative instruments may be substantially greater than the derivative’s original cost.
Derivative instruments include written options, purchased options, futures contracts, forward foreign currency exchange contracts, and swap agreements. For the six months ended June 30, 2010, the fund did not invest in any derivative instruments.
Security Loans – State Street Bank and Trust Company (“State Street”), as lending agent, may loan the securities of the fund to certain qualified institutions (the “Borrowers”) approved by the fund. The loans are collateralized by cash and/or U.S. Treasury and federal agency obligations in an amount typically at least equal to the market value of the securities loaned. The market value of the loaned securities is determined at the close of business of the fund and any additional required collateral is delivered to the fund on the next business day. State Street provides the fund with indemnification against Borrower default. The fund bears the risk of loss with respect to the investment of cash collateral. On loans collateralized by cash, the cash collateral is invested in a money market fund or short-term securities. A portion of the income generated upon investment of the collateral is remitted to the Borrowers, and the remainder is allocated between the fund and the lending agent. On loans collateralized by U.S. Treasury and/or federal agency obligations, a fee is received from the Borrower, and is allocated between the fund and the lending agent. Income from securities lending is included in interest income on the Statement of Operations. The dividend and interest income earned on the securities loaned is accounted for in the same manner as other dividend and interest income.
13
Table of Contents
MFS Investors Growth Stock Series
Notes to Financial Statements (unaudited) – continued
Indemnifications – Under the fund’s organizational documents, its officers and Trustees may be indemnified against certain liabilities and expenses arising out of the performance of their duties to the fund. Additionally, in the normal course of business, the fund enters into agreements with service providers that may contain indemnification clauses. The fund’s maximum exposure under these agreements is unknown as this would involve future claims that may be made against the fund that have not yet occurred.
Investment Transactions and Income – Investment transactions are recorded on the trade date. Interest income is recorded on the accrual basis. All premium and discount is amortized or accreted for financial statement purposes in accordance with U.S. generally accepted accounting principles. Dividends received in cash are recorded on the ex-dividend date. Certain dividends from foreign securities will be recorded when the fund is informed of the dividend if such information is obtained subsequent to the ex-dividend date. Dividend and interest payments received in additional securities are recorded on the ex-dividend or ex-interest date in an amount equal to the value of the security on such date.
The fund may receive proceeds from litigation settlements. Any proceeds received from litigation involving portfolio holdings are reflected in the Statement of Operations in realized gain/loss if the security has been disposed of by the fund or in unrealized gain/loss if the security is still held by the fund. Any other proceeds from litigation not related to portfolio holdings are reflected as other income in the Statement of Operations.
Fees Paid Indirectly – The fund’s custody fee may be reduced according to an arrangement that measures the value of cash deposited with the custodian by the fund. This amount, for the six months ended June 30, 2010, is shown as a reduction of total expenses on the Statement of Operations.
Tax Matters and Distributions – The fund intends to qualify as a regulated investment company, as defined under Subchapter M of the Internal Revenue Code, and to distribute all of its taxable income, including realized capital gains. As a result, no provision for federal income tax is required. The fund’s federal tax returns for the prior three fiscal years remain subject to examination by the Internal Revenue Service. Foreign taxes, if any, have been accrued by the fund in the accompanying financial statements.
Distributions to shareholders are recorded on the ex-dividend date. Income and capital gain distributions are determined in accordance with income tax regulations, which may differ from U.S. generally accepted accounting principles. Certain capital accounts in the financial statements are periodically adjusted for permanent differences in order to reflect their tax character. These adjustments have no impact on net assets or net asset value per share. Temporary differences which arise from recognizing certain items of income, expense, gain or loss in different periods for financial statement and tax purposes will reverse at some time in the future. Distributions in excess of net investment income or net realized gains are temporary overdistributions for financial statement purposes resulting from differences in the recognition or classification of income or distributions for financial statement and tax purposes.
Book/tax differences primarily relate to wash sale loss deferrals.
The tax character of distributions made during the current period, if any, will be determined at fiscal year end. The tax character of distributions declared to shareholders for the last fiscal year is as follows:
| 12/31/09 | ||
| Ordinary income (including any short-term capital gains) | $1,500,507 |
The federal tax cost and the tax basis components of distributable earnings were as follows:
| As of 6/30/10 | |||
| Cost of investments | $328,887,437 | ||
| Gross appreciation | 11,666,438 | ||
| Gross depreciation | (25,597,593 | ) | |
| Net unrealized appreciation (depreciation) | $(13,931,155 | ) | |
| As of 12/31/09 | |||
| Undistributed ordinary income | 1,537,422 | ||
| Capital loss carryforwards | (55,915,215 | ) | |
| Other temporary differences | 3,825 | ||
| Net unrealized appreciation (depreciation) | 60,309,896 |
14
Table of Contents
MFS Investors Growth Stock Series
Notes to Financial Statements (unaudited) – continued
As of December 31, 2009, the fund had capital loss carryforwards available to offset future realized gains. Such losses expire as follows:
| 12/31/16 | $(52,769,417 | ) | |
| 12/31/17 | (3,145,798 | ) | |
| $(55,915,215 | ) |
Multiple Classes of Shares of Beneficial Interest – The fund offers multiple classes of shares, which differ in their respective distribution and/or service fees. The fund’s income, realized and unrealized gain (loss), and common expenses are allocated to shareholders based on the daily net assets of each class. Dividends are declared separately for each class. Differences in per share dividend rates are generally due to differences in separate class expenses. The fund’s distributions declared to shareholders as reported on the Statements of Changes in Net Assets are presented by class as follows:
| From net investment income | ||||
| Six months ended 6/30/10 | Year ended 12/31/09 | |||
| Initial Class | $384,739 | $582,919 | ||
| Service Class | 1,155,672 | 917,588 | ||
| Total | $1,540,411 | $1,500,507 | ||
| (3) | Transactions with Affiliates |
Investment Adviser – The fund has an investment advisory agreement with MFS to provide overall investment management and related administrative services and facilities to the fund. The management fee is computed daily and paid monthly at the following annual rates:
| First $1 billion of average daily net assets | 0.75% | |
| Average daily net assets in excess of $1 billion | 0.65% |
The management fee incurred for the six months ended June 30, 2010 was equivalent to an annual effective rate of 0.75% of the fund’s average daily net assets.
Distributor – MFS Fund Distributors, Inc. (MFD), a wholly-owned subsidiary of MFS, is the distributor of shares of the fund. The Trustees have adopted a distribution plan for the Service Class shares pursuant to Rule 12b-1 under the Investment Company Act of 1940.
The fund’s distribution plan provides that the fund will pay MFD distribution and/or service fees equal to 0.25% per annum of its average daily net assets attributable to Service Class shares as partial consideration for services performed and expenses incurred by MFD and financial intermediaries (including participating insurance companies that invest in the fund to fund variable annuity and variable life insurance contracts, sponsors of qualified retirement and pension plans that invest in the fund, and affiliates of these participating insurance companies and plan sponsors) in connection with the sale and distribution of the Service Class shares. MFD may subsequently pay all, or a portion, of the distribution and/or service fees to financial intermediaries.
Shareholder Servicing Agent – MFS Service Center, Inc. (MFSC), a wholly-owned subsidiary of MFS, receives a fee from the fund for its services as shareholder servicing agent. For the six months ended June 30, 2010, the fee was $26,776, which equated to 0.0119% annually of the fund’s average daily net assets. MFSC also receives payment from the fund for out-of-pocket expenses paid by MFSC on behalf of the fund. For the six months ended June 30, 2010, these costs amounted to $367.
Administrator – MFS provides certain financial, legal, shareholder communications, compliance, and other administrative services to the fund. Under an administrative services agreement, the fund partially reimburses MFS the costs incurred to provide these services. The fund is charged an annual fixed amount of $17,500 plus a fee based on average daily net assets. The administrative services fee incurred for the six months ended June 30, 2010 was equivalent to an annual effective rate of 0.0166% of the fund’s average daily net assets.
Trustees’ and Officers’ Compensation – The fund pays compensation to independent Trustees in the form of a retainer, attendance fees, and additional compensation to Board and Committee chairpersons. The fund does not pay compensation directly to Trustees or officers of the fund who are also officers of the investment adviser, all of whom receive remuneration for their services to the fund from MFS. Certain officers and Trustees of the fund are officers or directors of MFS, MFD, and MFSC.
15
Table of Contents
MFS Investors Growth Stock Series
Notes to Financial Statements (unaudited) – continued
Other – This fund and certain other funds managed by MFS (the funds) have entered into services agreements (the Agreements) which provide for payment of fees by the funds to Tarantino LLC and Griffin Compliance LLC in return for the provision of services of an Independent Chief Compliance Officer (ICCO) and Assistant ICCO, respectively, for the funds. The ICCO and Assistant ICCO are officers of the funds and the sole members of Tarantino LLC and Griffin Compliance LLC, respectively. The funds can terminate the Agreements with Tarantino LLC and Griffin Compliance LLC at any time under the terms of the Agreements. For the six months ended June 30, 2010, the aggregate fees paid by the fund to Tarantino LLC and Griffin Compliance LLC were $1,907 and are included in miscellaneous expense on the Statement of Operations. MFS has agreed to reimburse the fund for a portion of the payments made by the fund in the amount of $1,526, which is shown as a reduction of total expenses in the Statement of Operations. Additionally, MFS has agreed to bear all expenses associated with office space, other administrative support, and supplies provided to the ICCO and Assistant ICCO.
The fund may invest in the MFS Institutional Money Market Portfolio which is managed by MFS and seeks a high level of current income consistent with preservation of capital and liquidity. Income earned on this investment is included in dividends from underlying funds on the Statement of Operations. This money market fund does not pay a management fee to MFS.
| (4) | Portfolio Securities |
Purchases and sales of investments, other than U.S. Government securities, purchased option transactions, and short-term obligations, aggregated $105,992,479 and $245,286,679, respectively.
| (5) | Shares of Beneficial Interest |
The fund’s Declaration of Trust permits the Trustees to issue an unlimited number of full and fractional shares of beneficial interest. Transactions in fund shares were as follows:
| Six months ended 6/30/10 | Year ended 12/31/09 | |||||||||||
| Shares | Amount | Shares | Amount | |||||||||
| Shares sold | ||||||||||||
Initial Class | 175,498 | $1,722,125 | 599,902 | $4,946,039 | ||||||||
Service Class | 1,786,298 | 17,176,575 | 20,132,065 | 155,613,777 | ||||||||
| 1,961,796 | $18,898,700 | 20,731,967 | $160,559,816 | |||||||||
| Shares issued to shareholders in reinvestment of distributions | ||||||||||||
Initial Class | 37,065 | $384,739 | 79,852 | $582,919 | ||||||||
Service Class | 113,635 | 1,155,672 | 128,334 | 917,588 | ||||||||
| 150,700 | $1,540,411 | 208,186 | $1,500,507 | |||||||||
| Shares reacquired | ||||||||||||
Initial Class | (1,193,871 | ) | $(11,680,514 | ) | (1,845,057 | ) | $(14,535,700 | ) | ||||
Service Class | (16,692,502 | ) | (157,114,899 | ) | (3,735,727 | ) | (28,755,720 | ) | ||||
| (17,886,373 | ) | $(168,795,413 | ) | (5,580,784 | ) | $(43,291,420 | ) | |||||
| Net change | ||||||||||||
Initial Class | (981,308 | ) | $(9,573,650 | ) | (1,165,303 | ) | $(9,006,742 | ) | ||||
Service Class | (14,792,569 | ) | (138,782,652 | ) | 16,524,672 | 127,775,645 | ||||||
| (15,773,877 | ) | $(148,356,302 | ) | 15,359,369 | $118,768,903 | |||||||
| (6) | Line of Credit |
The fund and certain other funds managed by MFS participate in a $1.1 billion unsecured committed line of credit, subject to a $1 billion sublimit, provided by a syndication of banks under a credit agreement. Borrowings may be made for temporary financing needs. Interest is charged to each fund, based on its borrowings, generally at a rate equal to the higher of the Federal Reserve funds rate or one month LIBOR plus an agreed upon spread. A commitment fee, based on the average daily, unused portion of the committed line of credit, is allocated among the participating funds at the end of each calendar quarter. In addition, the fund and other funds managed by MFS have established unsecured uncommitted borrowing arrangements with certain banks for temporary financing needs. Interest is charged to each fund, based on its borrowings, at a rate equal to the Federal Reserve funds rate plus an agreed upon spread. For the six months ended June 30, 2010, the fund’s commitment fee and interest expense were $3,413 and $6,806, respectively, and are included in miscellaneous expense on the Statement of Operations.
16
Table of Contents
MFS Investors Growth Stock Series
Notes to Financial Statements (unaudited) – continued
| (7) | Transactions in Underlying Funds – Affiliated Issuers |
An affiliated issuer may be considered one in which the fund owns 5% or more of the outstanding voting securities, or a company which is under common control. For the purposes of this report, the fund assumes the following to be affiliated issuers:
| Underlying Funds | Beginning Shares/Par Amount | Acquisitions Shares/Par Amount | Dispositions Shares/Par Amount | Ending Shares/Par Amount | |||||
| MFS Institutional Money Market Portfolio | 13,930,477 | 28,837,024 | (40,201,039 | ) | 2,566,462 | ||||
| Underlying Funds | Realized Gain (Loss) | Capital Gain Distributions | Dividend Income | Ending Value | |||||
| MFS Institutional Money Market Portfolio | $— | $— | $6,207 | $2,566,462 | |||||
17
Table of Contents
MFS Investors Growth Stock Series
RESULTS OF SHAREHOLDER MEETING (unaudited)
At a special meeting of shareholders of MFS Variable Insurance Trust, which was held on January 28, 2010, the following actions were taken:
Item 1. To elect the following individuals as Trustees:
| Number of Dollars | ||||
| Nominee | For | Withheld Authority | ||
| Robert E. Butler | 6,823,651,821.26 | 1,818,252,669.55 | ||
| Lawrence H. Cohn, M.D. | 6,813,621,200.14 | 1,828,283,290.67 | ||
| Maureen R. Goldfarb | 6,825,332,620.76 | 1,816,571,870.05 | ||
| David H. Gunning | 6,823,081,841.37 | 1,818,822,649.44 | ||
| William R. Gutow | 6,813,678,877.22 | 1,828,225,613.59 | ||
| Michael Hegarty | 6,827,456,515.87 | 1,814,447,974.94 | ||
| John P. Kavanaugh | 6,830,363,113.12 | 1,811,541,377.69 | ||
| Robert J. Manning | 6,825,511,264.17 | 1,816,393,226.64 | ||
| Robert C. Pozen | 6,824,854,120.27 | 1,817,050,370.54 | ||
| J. Dale Sherratt | 6,816,913,203.87 | 1,824,991,286.94 | ||
| Laurie J. Thomsen | 6,823,590,745.56 | 1,818,313,745.25 | ||
| Robert W. Uek | 6,818,161,803.66 | 1,823,742,687.15 | ||
18
Table of Contents
MFS Investors Growth Stock Series
BOARD REVIEW OF INVESTMENT ADVISORY AGREEMENT
A discussion regarding the Board’s most recent review and renewal of the fund’s Investment Advisory Agreement with MFS will be available on or about November 1, 2010 by clicking on the fund’s name under “Variable Insurance Portfolios — VIT” in the “Products and Performance” section of the MFS Web site (mfs.com).
PROXY VOTING POLICIES AND INFORMATION
A general description of the MFS funds’ proxy voting policies and procedures is available without charge, upon request, by calling
1-800-225-2606, by visiting the Proxy Voting section of mfs.com or by visiting the SEC’s Web site at http://www.sec.gov.
Information regarding how the fund voted proxies relating to portfolio securities during the most recent twelve-month period ended June 30 is available without charge by visiting the Proxy Voting section of mfs.com or by visiting the SEC’s Web site at http://www.sec.gov.
QUARTERLY PORTFOLIO DISCLOSURE
The fund will file a complete schedule of portfolio holdings with the Securities and Exchange Commission (the Commission) for the first and third quarters of each fiscal year on Form N-Q. The fund’s Form N-Q may be reviewed and copied at the:
Public Reference Room
Securities and Exchange Commission
100 F Street, NE, Room 1580
Washington, D.C. 20549
Information on the operation of the Public Reference Room may be obtained by calling the Commission at 1-800-SEC-0330. The fund’s Form N-Q is available on the EDGAR database on the Commission’s Internet Web site at http://www.sec.gov, and copies of this information may be obtained, upon payment of a duplicating fee, by electronic request at the following e-mail address: publicinfo@sec.gov or by writing the Public Reference Section at the above address.
From time to time, MFS may post important information about the fund or the MFS funds on the MFS web site (mfs.com). This information is available by visiting the “News & Commentary” section of mfs.com or by clicking on the fund’s name under “Variable Insurance Portfolios — VIT” in the “Products and Performance” section of mfs.com.
19
Table of Contents

Table of Contents
Table of Contents
This report is prepared for the general information of contract owners. It is authorized for distribution to prospective investors only when preceded or accompanied by a current prospectus.
NOT FDIC INSURED Ÿ MAY LOSE VALUE Ÿ NO BANK GUARANTEE Ÿ NOT A DEPOSIT Ÿ NOT INSURED BY ANY FEDERAL GOVERNMENT AGENCY OR NCUA/NCUSIF
Table of Contents
MFS Global Equity Series

Dear Contract Owners:
After having suffered their biggest declines since the Great Depression, most global markets experienced an impressive resurgence during the latter months of 2009 and the first quarter of 2010. The global economy was able to reap the benefits of two major trends. The first of these was the massive efforts of governments and central banks to increase liquidity in the financial system as they sought to prevent the credit crisis from further affecting the banking system. The second was the move by companies around the world to cut costs and operations to prepare for rapidly changing market conditions. We believe that these moves not only shortened the length of the downturn but also set the stage for recovery.
Even with the significant market gains of 2009 and the early part of 2010, the recovery is unrolling at a moderate pace, with rebounds in the manufacturing sector and corporate America leading the way. Central bankers are proceeding with caution and many have held benchmark interest rates unchanged as they debate the best way to withdraw stimulus measures without disrupting the fragile growth process. Complicating that debate late in the period was the emergence of the European debt crisis and worries about whether this crisis could derail the global recovery. As that crisis unrolled with no clear resolution, risk aversion rose along with volatility. Weakening economic data late in the period added uncertainty to the mix and sparked a retrenchment in global equity markets.
While hurdles remain, we believe that the global economy is proceeding on the road to recovery. As always, we continue to be mindful of the many challenges faced at the individual, national, and international levels. It is at times such as these that we want to remind investors of the merits of maintaining a long-term view, adhering to basic investing principles such as asset allocation and diversification, and working closely with advisors to identify and research investment opportunities. At MFS®, we take particular pride in how well mutual funds can provide a broad range of products that can fit investor needs in any type of market climate.
Respectfully,

Robert J. Manning
Chairman and Chief Executive Officer
MFS Investment Management®
August 16, 2010
The opinions expressed in this letter are subject to change, may not be relied upon for investment advice, and no forecasts can be guaranteed.
MFS Fund Distributors, Inc., 500 Boylston Street, Boston, MA 02116
1
Table of Contents
MFS Global Equity Series
Portfolio structure
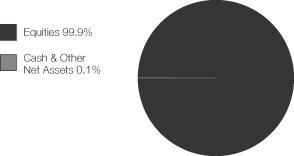
| Top ten holdings | ||
| Nestle S.A. | 3.4% | |
| Linde AG | 2.7% | |
| Heineken N.V. | 2.7% | |
| Roche Holding AG | 2.3% | |
| Reckitt Benckiser Group PLC | 2.2% | |
| Walt Disney Co. | 2.1% | |
| Oracle Corp. | 2.1% | |
| Diageo PLC | 2.1% | |
| 3M Co. | 2.0% | |
| LVMH Moet Hennessy Louis Vuitton S.A. | 1.9% |
| Equity sectors | ||
| Consumer Staples | 20.4% | |
| Health Care | 15.6% | |
| Financial Services | 13.2% | |
| Basic Materials | 10.2% | |
| Retailing | 9.1% | |
| Technology | 8.2% | |
| Leisure | 6.2% | |
| Industrial Goods & Services | 4.2% | |
| Energy | 4.0% | |
| Transportation | 3.9% | |
| Special Products & Services | 2.6% | |
| Utilities & Communications | 1.4% | |
| Autos & Housing | 0.9% | |
| Issuer country weightings | ||
| United States | 43.6% | |
| Switzerland | 11.9% | |
| France | 10.2% | |
| United Kingdom | 9.7% | |
| Germany | 6.6% | |
| Netherlands | 5.7% | |
| Japan | 5.6% | |
| Canada | 1.7% | |
| Sweden | 1.1% | |
| Other Countries | 3.9% | |
Percentages are based on net assets as of 6/30/10.
The portfolio is actively managed and current holdings may be different.
2
Table of Contents
MFS Global Equity Series
After having suffered through one of the largest and most concentrated downturns since the 1930s, most asset markets staged a remarkable rebound during 2009 and early 2010. This recovery in global activity has been led importantly by emerging Asian economies, but broadening to include most of the global economy to varying degrees. Primary drivers of the recovery included an unwinding of the inventory destocking that took place earlier, the production of manufacturing and capital goods, as well as massive fiscal and monetary stimulus.
Late in the period, though, heightened risk surrounding the public-debt profiles of several of the peripheral European countries impaired market sentiment. At the same time, the improving trend in global macroeconomic data began to weaken somewhat. These two dynamics caused most asset prices to retrench significantly, as many questioned the durability of the global recovery.
3
Table of Contents
MFS Global Equity Series
Fund Expenses Borne by the Contract Holders During the Period,
January 1, 2010 through June 30, 2010
As a contract holder of the fund, you incur ongoing costs, including management fees; distribution and/or service (12b-1) fees; and other fund expenses. This example is intended to help you understand your ongoing costs (in dollars) of investing in the fund and to compare these costs with the ongoing costs of investing in other mutual funds.
The example is based on an investment of $1,000 invested at the beginning of the period and held for the entire period January 1, 2010 through June 30, 2010.
Actual Expenses
The first line for each share class in the following table provides information about actual account values and actual expenses. You may use the information in this line, together with the amount you invested, to estimate the expenses that you paid over the period. Simply divide your account value by $1,000 (for example, an $8,600 account value divided by $1,000 = 8.6), then multiply the result by the number in the first line under the heading entitled “Expenses Paid During Period” to estimate the expenses you paid on your account during this period.
Hypothetical Example for Comparison Purposes
The second line for each share class in the following table provides information about hypothetical account values and hypothetical expenses based on the fund’s actual expense ratio and an assumed rate of return of 5% per year before expenses, which is not the fund’s actual return. The hypothetical account values and expenses may not be used to estimate the actual ending account balance or expenses you paid for the period. You may use this information to compare the ongoing costs of investing in the fund and other funds. To do so, compare this 5% hypothetical example with the 5% hypothetical examples that appear in the shareholder reports of the other funds.
Please note that the expenses shown in the table are meant to highlight the fund’s ongoing costs only and do not take into account the fees and expenses imposed under the variable contracts through which your investment in the fund is made. Therefore, the second line for each share class in the table is useful in comparing ongoing costs associated with an investment in vehicles (such as the fund) which fund benefits under variable annuity and variable life insurance contracts and to qualified pension and retirement plans only, and will not help you determine the relative total costs of investing in the fund through variable annuity and variable life insurance contracts. If the fees and expenses imposed under the variable contracts were included, your costs would have been higher.
| Share Class | Annualized Expense Ratio | Beginning Account Value 1/01/10 | Ending Account Value | Expenses Paid During Period (p) 1/01/10-6/30/10 | ||||||
| Initial Class | Actual | 1.15% | $1,000.00 | $900.54 | $5.42 | |||||
| Hypothetical (h) | 1.15% | $1,000.00 | $1,019.09 | $5.76 | ||||||
| Service Class | Actual | 1.40% | $1,000.00 | $899.25 | $6.59 | |||||
| Hypothetical (h) | 1.40% | $1,000.00 | $1,017.85 | $7.00 |
| (h) | 5% class return per year before expenses. |
| (p) | Expenses paid is equal to each class’ annualized expense ratio, as shown above, multiplied by the average account value over the period, multiplied by the number of days in the period, divided by the number of days in the year. |
4
Table of Contents
MFS Global Equity Series
PORTFOLIO OF INVESTMENTS – 6/30/10 (unaudited)
The Portfolio of Investments is a complete list of all securities owned by your fund. It is categorized by broad-based asset classes.
| Issuer | Shares/Par | Value ($) | |||
| COMMON STOCKS – 99.9% | |||||
| Aerospace – 1.2% | |||||
| Honeywell International, Inc. | 11,530 | $ | 450,009 | ||
| Alcoholic Beverages – 5.8% | |||||
| Diageo PLC | 47,209 | $ | 739,721 | ||
| Heineken N.V. | 22,560 | 956,304 | |||
| Pernod Ricard S.A. | 4,945 | 382,529 | |||
| $ | 2,078,554 | ||||
| Apparel Manufacturers – 6.1% | |||||
| Burberry Group PLC | 32,540 | $ | 366,935 | ||
| Compagnie Financiere Richemont S.A. | 12,432 | 432,517 | |||
| LVMH Moet Hennessy Louis Vuitton S.A. | 6,430 | 700,405 | |||
| NIKE, Inc., “B” | 10,190 | 688,335 | |||
| $ | 2,188,192 | ||||
| Automotive – 0.3% | |||||
| Harley-Davidson, Inc. | 4,990 | $ | 110,928 | ||
| Biotechnology – 0.2% | |||||
| Actelion Ltd. (a) | 1,951 | $ | 72,756 | ||
| Broadcasting – 4.8% | |||||
| Omnicom Group, Inc. | 14,420 | $ | 494,606 | ||
| Walt Disney Co. | 24,550 | 773,325 | |||
| WPP Group PLC | 47,700 | 448,560 | |||
| $ | 1,716,491 | ||||
| Brokerage & Asset Managers – 0.9% | |||||
| Deutsche Boerse AG | 5,330 | $ | 323,834 | ||
| Business Services – 1.9% | |||||
| Accenture Ltd., “A” | 15,060 | $ | 582,069 | ||
| DST Systems, Inc. | 2,540 | 91,796 | |||
| $ | 673,865 | ||||
| Chemicals – 3.5% | |||||
| 3M Co. | 9,290 | $ | 733,817 | ||
| Givaudan S.A. | 426 | 360,074 | |||
| Monsanto Co. | 3,350 | 154,837 | |||
| $ | 1,248,728 | ||||
| Computer Software – 2.1% | |||||
| Oracle Corp. | 35,330 | $ | 758,182 | ||
| Computer Software – Systems – 1.0% | |||||
| Canon, Inc. | 9,600 | $ | 357,918 | ||
| Conglomerates – 0.7% | |||||
| Smiths Group PLC | 15,609 | $ | 247,044 | ||
| Construction – 0.6% | |||||
| Sherwin-Williams Co. | 3,110 | $ | 215,181 | ||
| Consumer Products – 6.5% | |||||
| Beiersdorf AG | 3,210 | $ | 176,458 | ||
| International Flavors & Fragrances, Inc. | 2,790 | 118,352 | |||
| Kao Corp. | 14,500 | 340,863 | |||
| Procter & Gamble Co. | 8,313 | 498,614 | |||
| Issuer | Shares/Par | Value ($) | |||
| COMMON STOCKS – continued | |||||
| Consumer Products – continued | |||||
| Reckitt Benckiser Group PLC | 17,370 | $ | 803,477 | ||
| Svenska Cellulosa Aktiebolaget | 35,200 | 414,047 | |||
| $ | 2,351,811 | ||||
| Electrical Equipment – 3.0% | |||||
| Legrand S.A. | 14,000 | $ | 412,453 | ||
| Rockwell Automation, Inc. | 2,670 | 131,070 | |||
| Schneider Electric S.A. | 5,245 | 530,872 | |||
| $ | 1,074,395 | ||||
| Electronics – 3.4% | |||||
| Hirose Electric Co. Ltd. | 700 | $ | 63,912 | ||
| Hoya Corp. | 18,500 | 392,827 | |||
| Intel Corp. | 19,170 | 372,857 | |||
| Samsung Electronics Co. Ltd. | 646 | 405,616 | |||
| $ | 1,235,212 | ||||
| Energy – Independent – 1.0% | |||||
| INPEX Corp. | 62 | $ | 344,594 | ||
| Energy – Integrated – 2.0% | |||||
| Chevron Corp. | 4,280 | $ | 290,441 | ||
| Royal Dutch Shell PLC, “A” | 7,040 | 177,501 | |||
| TOTAL S.A. | 5,940 | 264,357 | |||
| $ | 732,299 | ||||
| Food & Beverages – 8.1% | |||||
| Dr Pepper Snapple Group, Inc. | 700 | $ | 26,173 | ||
| General Mills, Inc. | 14,520 | 515,750 | |||
| Groupe Danone | 7,149 | 381,771 | |||
| J.M. Smucker Co. | 7,715 | 464,597 | |||
| Nestle S.A. | 25,564 | 1,233,462 | |||
| PepsiCo, Inc. | 4,890 | 298,046 | |||
| $ | 2,919,799 | ||||
| Food & Drug Stores – 2.3% | |||||
| Lawson, Inc. | 2,400 | $ | 104,892 | ||
| Tesco PLC | 37,518 | 211,244 | |||
| Walgreen Co. | 19,560 | 522,252 | |||
| $ | 838,388 | ||||
| Gaming & Lodging – 0.9% | |||||
| Ladbrokes PLC | 61,839 | $ | 116,774 | ||
| William Hill PLC | 75,990 | 191,653 | |||
| $ | 308,427 | ||||
| Insurance – 1.4% | |||||
| AXA | 17,270 | $ | 261,915 | ||
| Swiss Reinsurance Co. | 5,880 | 241,881 | |||
| $ | 503,796 | ||||
| Major Banks – 8.0% | |||||
| Bank of New York Mellon Corp. | 28,220 | $ | 696,752 | ||
| Erste Group Bank AG | 8,533 | 271,463 | |||
5
Table of Contents
MFS Global Equity Series
Portfolio of Investments (unaudited) – continued
| Issuer | Shares/Par | Value ($) | |||
| COMMON STOCKS – continued | |||||
| Major Banks – continued | |||||
| Goldman Sachs Group, Inc. | 3,410 | $ | 447,631 | ||
| Intesa Sanpaolo S.p.A. | 36,013 | 94,836 | |||
| Julius Baer Group Ltd. | 12,191 | 347,088 | |||
| Standard Chartered PLC | 15,438 | 374,772 | |||
| State Street Corp. | 19,250 | 651,035 | |||
| $ | 2,883,577 | ||||
| Medical Equipment – 9.3% | |||||
| Alcon, Inc. | 700 | $ | 103,733 | ||
| DENTSPLY International, Inc. | 10,400 | 311,064 | |||
| Essilor International S.A. | 2,890 | 172,072 | |||
| Medtronic, Inc. | 16,450 | 596,642 | |||
| Sonova Holding AG | 774 | 94,916 | |||
| St. Jude Medical, Inc. (a) | 12,730 | 459,426 | |||
| Synthes, Inc. | 3,070 | 353,013 | |||
| Thermo Fisher Scientific, Inc. (a) | 8,850 | 434,093 | |||
| Waters Corp. (a) | 7,560 | 489,132 | |||
| Zimmer Holdings, Inc. (a) | 6,620 | 357,811 | |||
| $ | 3,371,902 | ||||
| Natural Gas – Distribution – 0.5% | |||||
| GDF SUEZ | 6,150 | $ | 173,999 | ||
| Network & Telecom – 1.7% | |||||
| Cisco Systems, Inc. (a) | 29,420 | $ | 626,940 | ||
| Oil Services – 1.0% | |||||
| National Oilwell Varco, Inc. | 11,370 | $ | 376,006 | ||
| Other Banks & Diversified Financials – 2.9% | |||||
| Aeon Credit Service Co. Ltd. | 9,800 | $ | 86,917 | ||
| American Express Co. | 8,520 | 338,244 | |||
| ICICI Bank Ltd. | 10,352 | 189,828 | |||
| Komercni Banka A.S. | 714 | 115,442 | |||
| UBS AG (a) | 23,520 | 311,771 | |||
| $ | 1,042,202 | ||||
| Pharmaceuticals – 6.1% | |||||
| Bayer AG | 9,586 | $ | 534,851 | ||
| Johnson & Johnson | 7,430 | 438,816 | |||
| Merck KGaA | 5,400 | 393,401 | |||
| Roche Holding AG | 6,110 | 839,047 | |||
| $ | 2,206,115 | ||||
| Printing & Publishing – 0.5% | |||||
| Wolters Kluwer N.V. | 8,940 | $ | 170,592 | ||
| Railroad & Shipping – 1.7% | |||||
| Canadian National Railway Co. | 10,944 | $ | 627,967 | ||
| Specialty Chemicals – 6.7% | |||||
| Akzo Nobel N.V. | 7,300 | $ | 377,615 | ||
| L’Air Liquide S.A. | 3,836 | 385,296 | |||
| Linde AG | 9,170 | 962,874 | |||
| Praxair, Inc. | 4,710 | 357,913 | |||
| Shin-Etsu Chemical Co. Ltd. | 6,900 | 321,004 | |||
| $ | 2,404,702 | ||||
| Issuer | Shares/Par | Value ($) | ||||
| COMMON STOCKS – continued | ||||||
| Specialty Stores – 0.7% | ||||||
| Abercrombie & Fitch Co., “A” | 5,260 | $ | 161,429 | |||
| Sally Beauty Holdings, Inc. (a) | 9,030 | 74,046 | ||||
| $ | 235,475 | |||||
| Telephone Services – 0.7% | ||||||
| Singapore Telecommunications Ltd. | 109,950 | $ | 237,498 | |||
| Trucking – 2.2% | ||||||
| TNT N.V. | 14,175 | $ | 357,270 | |||
| United Parcel Service, Inc., “B” | 7,970 | 453,413 | ||||
| $ | 810,683 | |||||
| Utilities – Electric Power – 0.2% | ||||||
| Red Electrica de Espana | 2,401 | $ | 85,827 | |||
| Total Common Stocks (Identified Cost, $38,658,559) | $ | 36,003,888 | ||||
| MONEY MARKET FUNDS (v) – 0.2% | ||||||
| MFS Institutional Money Market Portfolio, 0.22%, at Cost and Net Asset Value | 91,341 | $ | 91,341 | |||
| Total Investments (Identified Cost, $38,749,900) | $ | 36,095,229 | ||||
| OTHER ASSETS, LESS LIABILITIES – (0.1)% | (42,448 | ) | ||||
| Net Assets – 100.0% | $ | 36,052,781 | ||||
| (a) | Non-income producing security. |
| (v) | Underlying fund that is available only to investment companies managed by MFS. The rate quoted is the annualized seven-day yield of the fund at period end. |
The following abbreviations are used in this report and are defined:
| PLC | Public Limited Company |
See Notes to Financial Statements
6
Table of Contents
MFS Global Equity Series
FINANCIAL STATEMENTS | STATEMENT OF ASSETS AND LIABILITIES (unaudited)
This statement represents your fund’s balance sheet, which details the assets and liabilities comprising the total value of the fund.
At 6/30/10 | |||||
Assets | |||||
Investments – | |||||
Non-affiliated issuers, at value (identified cost, $38,658,559) | $36,003,888 | ||||
Underlying funds, at cost and value | 91,341 | ||||
Total investments, at value (identified cost, $38,749,900) | $36,095,229 | ||||
Cash | 2,363 | ||||
Foreign currency, at value (identified cost, $41,316) | 41,210 | ||||
Receivables for | |||||
Investments sold | 17,333 | ||||
Fund shares sold | 12,589 | ||||
Interest and dividends | 61,901 | ||||
Receivable from investment adviser | 8,043 | ||||
Other assets | 368 | ||||
Total assets | $36,239,036 | ||||
Liabilities | |||||
Payables for | |||||
Investments purchased | $120,655 | ||||
Fund shares reacquired | 1,317 | ||||
Payable to affiliates | |||||
Investment adviser | 2,022 | ||||
Shareholder servicing costs | 50 | ||||
Distribution and/or service fees | 32 | ||||
Administrative services fee | 96 | ||||
Payable for independent Trustees’ compensation | 218 | ||||
Accrued expenses and other liabilities | 61,865 | ||||
Total liabilities | $186,255 | ||||
Net assets | $36,052,781 | ||||
Net assets consist of | |||||
Paid-in capital | $40,356,791 | ||||
Unrealized appreciation (depreciation) on investments and translation of assets and liabilities in foreign currencies | (2,654,794 | ) | |||
Accumulated net realized gain (loss) on investments and foreign currency transactions | (1,935,823 | ) | |||
Undistributed net investment income | 286,607 | ||||
Net assets | $36,052,781 | ||||
Shares of beneficial interest outstanding | 3,356,851 |
| Net assets | Shares outstanding | Net asset value per share | ||||
Initial Class | $33,796,951 | 3,146,566 | $10.74 | |||
Service Class | 2,255,830 | 210,285 | 10.73 |
See Notes to Financial Statements
7
Table of Contents
MFS Global Equity Series
FINANCIAL STATEMENTS | STATEMENT OF OPERATIONS (unaudited)
This statement describes how much your fund earned in investment income and accrued in expenses. It also describes any gains and/or losses generated by fund operations.
Six months ended 6/30/10 | ||||||
Net investment income | ||||||
Income | ||||||
Dividends | $563,925 | |||||
Interest | 9,710 | |||||
Dividends from underlying funds | 208 | |||||
Foreign taxes withheld | (53,344 | ) | ||||
Total investment income | $520,499 | |||||
Expenses | ||||||
Management fee | $200,146 | |||||
Distribution and/or service fees | 2,963 | |||||
Shareholder servicing costs | 2,502 | |||||
Administrative services fee | 8,679 | |||||
Independent Trustees’ compensation | 818 | |||||
Custodian fee | 28,222 | |||||
Shareholder communications | 11,662 | |||||
Auditing fees | 26,370 | |||||
Legal fees | 449 | |||||
Miscellaneous | 5,235 | |||||
Total expenses | $287,046 | |||||
Fees paid indirectly | (1 | ) | ||||
Reduction of expenses by investment adviser | (53,793 | ) | ||||
Net expenses | $233,252 | |||||
Net investment income | $287,247 | |||||
Realized and unrealized gain (loss) on investments and foreign currency transactions | ||||||
Realized gain (loss) (identified cost basis) | ||||||
Investment transactions (net of $66 country tax) | $543,848 | |||||
Foreign currency transactions | (6,769 | ) | ||||
Net realized gain (loss) on investments and foreign currency transactions | $537,079 | |||||
Change in unrealized appreciation (depreciation) | ||||||
Investments (net of $662 increase in deferred country tax) | $(4,850,067 | ) | ||||
Translation of assets and liabilities in foreign currencies | (1,083 | ) | ||||
Net unrealized gain (loss) on investments and foreign currency translation | $(4,851,150 | ) | ||||
Net realized and unrealized gain (loss) on investments and foreign currency | $(4,314,071 | ) | ||||
Change in net assets from operations | $(4,026,824 | ) |
See Notes to Financial Statements
8
Table of Contents
MFS Global Equity Series
FINANCIAL STATEMENTS | STATEMENTS OF CHANGES IN NET ASSETS
These statements describe the increases and/or decreases in net assets resulting from operations, any distributions, and any shareholder transactions.
| Six months ended 6/30/10 (unaudited | ) | Year ended 12/31/09 | | |||
Change in net assets | ||||||
| From operations | ||||||
Net investment income | $287,247 | $401,039 | ||||
Net realized gain (loss) on investments and foreign currency transactions | 537,079 | (812,428 | ) | |||
Net unrealized gain (loss) on investments and foreign currency translation | (4,851,150 | ) | 10,018,976 | |||
Change in net assets from operations | $(4,026,824 | ) | $9,607,587 | |||
| Distributions declared to shareholders | ||||||
From net investment income | $(401,053 | ) | $(743,160 | ) | ||
Change in net assets from fund share transactions | $(1,185,963 | ) | $(1,415,546 | ) | ||
Total change in net assets | $(5,613,840 | ) | $7,448,881 | |||
| Net assets | ||||||
At beginning of period | 41,666,621 | 34,217,740 | ||||
At end of period (including undistributed net investment income of $286,607 and | $36,052,781 | $41,666,621 |
See Notes to Financial Statements
9
Table of Contents
MFS Global Equity Series
FINANCIAL STATEMENTS | FINANCIAL HIGHLIGHTS
The financial highlights table is intended to help you understand the fund’s financial performance for the semiannual period and the past 5 fiscal years. Certain information reflects financial results for a single fund share. The total returns in the table represent the rate by which an investor would have earned (or lost) on an investment in the fund share class (assuming reinvestment of all distributions) held for the entire period.
| Initial Class | Six months ended 6/30/10 | Years ended 12/31 | ||||||||||||||||
| 2009 | 2008 | 2007 | 2006 | 2005 | ||||||||||||||
| (unaudited) | ||||||||||||||||||
Net asset value, beginning of period | $12.04 | $9.36 | $15.47 | $15.45 | $13.49 | $12.80 | ||||||||||||
| Income (loss) from investment operations | ||||||||||||||||||
Net investment income (d) | $0.08 | $0.12 | $0.20 | $0.13 | $0.37 | $0.09 | ||||||||||||
Net realized and unrealized gain (loss) on investments | (1.26 | ) | 2.78 | (5.01 | ) | 1.22 | 2.76 | 0.86 | ||||||||||
Total from investment operations | $(1.18 | ) | $2.90 | $(4.81 | ) | $1.35 | $3.13 | $0.95 | ||||||||||
| Less distributions declared to shareholders | ||||||||||||||||||
From net investment income | $(0.12 | ) | $(0.22 | ) | $(0.14 | ) | $(0.32 | ) | $(0.07 | ) | $(0.04 | ) | ||||||
From net realized gain on investments | — | — | (1.16 | ) | (1.01 | ) | (1.10 | ) | (0.22 | ) | ||||||||
Total distributions declared to shareholders | $(0.12 | ) | $(0.22 | ) | $(1.30 | ) | $(1.33 | ) | $(1.17 | ) | $(0.26 | ) | ||||||
Net asset value, end of period | $10.74 | $12.04 | $9.36 | $15.47 | $15.45 | $13.49 | ||||||||||||
Total return (%) (k)(r)(s) | (9.95 | )(n) | 31.98 | (33.77 | ) | 9.19 | 24.41 | 7.68 | ||||||||||
| Ratios (%) (to average net assets) and Supplemental data: | ||||||||||||||||||
Expenses before expense reductions (f) | 1.42 | (a) | 1.52 | 1.36 | 1.41 | 1.49 | 1.48 | |||||||||||
Expenses after expense reductions (f) | 1.15 | (a) | 1.15 | 1.15 | 1.15 | 1.15 | 1.15 | |||||||||||
Net investment income | 1.45 | (a) | 1.18 | 1.61 | 0.88 | 2.60 | 0.68 | |||||||||||
Portfolio turnover | 8 | 23 | 28 | 38 | 37 | 52 | ||||||||||||
Net assets at end of period (000 omitted) | $33,797 | $39,418 | $33,523 | $56,246 | $53,388 | $35,415 | ||||||||||||
See Notes to Financial Statements
10
Table of Contents
MFS Global Equity Series
Financial Highlights – continued
| Service Class | Six months ended 6/30/10 | Years ended 12/31 | ||||||||||||||||
| 2009 | 2008 | 2007 | 2006 | 2005 | ||||||||||||||
| (unaudited) | ||||||||||||||||||
Net asset value, beginning of period | $12.03 | $9.35 | $15.47 | $15.47 | $13.53 | $13.00 | ||||||||||||
| Income (loss) from investment operations | ||||||||||||||||||
Net investment income (d) | $0.07 | $0.08 | $0.16 | $0.09 | $0.31 | $0.03 | ||||||||||||
Net realized and unrealized gain (loss) on investments | (1.27 | ) | 2.81 | (5.01 | ) | 1.23 | 2.79 | 0.76 | ||||||||||
Total from investment operations | $(1.20 | ) | $2.89 | $(4.85 | ) | $1.32 | $3.10 | $0.79 | ||||||||||
| Less distributions declared to shareholders | ||||||||||||||||||
From net investment income | $(0.10 | ) | $(0.21 | ) | $(0.11 | ) | $(0.31 | ) | $(0.06 | ) | $(0.04 | ) | ||||||
From net realized gain on investments | — | — | (1.16 | ) | (1.01 | ) | (1.10 | ) | (0.22 | ) | ||||||||
Total distributions declared to shareholders | $(0.10 | ) | $(0.21 | ) | $(1.27 | ) | $(1.32 | ) | $(1.16 | ) | $(0.26 | ) | ||||||
Net asset value, end of period | $10.73 | $12.03 | $9.35 | $15.47 | $15.47 | $13.53 | ||||||||||||
Total return (%) (k)(r)(s) | (10.07 | )(n) | 31.80 | (33.97 | ) | 8.97 | 24.02 | 6.30 | ||||||||||
| Ratios (%) (to average net assets) and Supplemental data: | ||||||||||||||||||
Expenses before expense reductions (f) | 1.67 | (a) | 1.75 | 1.60 | 1.65 | 1.76 | 1.73 | |||||||||||
Expenses after expense reductions (f) | 1.40 | (a) | 1.40 | 1.40 | 1.40 | 1.40 | 1.40 | |||||||||||
Net investment income | 1.21 | (a) | 0.82 | 1.32 | 0.60 | 2.29 | 0.22 | |||||||||||
Portfolio turnover | 8 | 23 | 28 | 38 | 37 | 52 | ||||||||||||
Net assets at end of period (000 omitted) | $2,256 | $2,248 | $695 | $628 | $271 | $56 | ||||||||||||
| (a) | Annualized. |
| (d) | Per share data is based on average shares outstanding. |
| (f) | Ratios do not reflect reductions from fees paid indirectly, if applicable. |
| (k) | The total return does not reflect expenses that apply to separate accounts. Inclusion of these charges would reduce the total return figures for all periods shown. |
| (n) | Not annualized. |
| (r) | Certain expenses have been reduced without which performance would have been lower. |
| (s) | From time to time the fund may receive proceeds from litigation settlements, without which performance would be lower. |
See Notes to Financial Statements
11
Table of Contents
MFS Global Equity Series
NOTES TO FINANCIAL STATEMENTS (unaudited)
| (1) | Business and Organization |
MFS Global Equity Series (the fund) is a series of MFS Variable Insurance Trust (the trust). The trust is organized as a Massachusetts business trust and is registered under the Investment Company Act of 1940, as amended, as an open-end management investment company. The shareholders of each series of the trust are separate accounts of insurance companies, which offer variable annuity and/or life insurance products, and qualified retirement and pension plans.
| (2) | Significant Accounting Policies |
General – The preparation of financial statements in conformity with U.S. generally accepted accounting principles requires management to make estimates and assumptions that affect the reported amounts of assets and liabilities, and disclosure of contingent assets and liabilities at the date of the financial statements and the reported amounts of revenues and expenses during the reporting period. Actual results could differ from those estimates. In the preparation of these financial statements, management has evaluated subsequent events occurring after the date of the fund’s Statement of Assets and Liabilities through the date that the financial statements were issued. The fund can invest in foreign securities, including securities of emerging market issuers. Investments in foreign securities are vulnerable to the effects of changes in the relative values of the local currency and the U.S. dollar and to the effects of changes in each country’s legal, political, and economic environment. The markets of emerging markets countries are generally more volatile than the markets of developed countries with more mature economies. All of the risks of investing in foreign securities previously described are heightened when investing in emerging markets countries.
Investment Valuations – Equity securities, including restricted equity securities, are generally valued at the last sale or official closing price as provided by a third-party pricing service on the market or exchange on which they are primarily traded. Equity securities, for which there were no sales reported that day, are generally valued at the last quoted daily bid quotation as provided by a third-party pricing service on the market or exchange on which such securities are primarily traded. Equity securities held short, for which there were no sales reported for that day, are generally valued at the last quoted daily ask quotation as provided by a third-party pricing service on the market or exchange on which such securities are primarily traded. Short-term instruments with a maturity at issuance of 60 days or less generally are valued at amortized cost, which approximates market value. Open-end investment companies are generally valued at net asset value per share. Securities and other assets generally valued on the basis of information from a third-party pricing service may also be valued at a broker/dealer bid quotation. Values obtained from third-party pricing services can utilize both transaction data and market information such as yield, quality, coupon rate, maturity, type of issue, trading characteristics, and other market data. The values of foreign securities and other assets and liabilities expressed in foreign currencies are converted to U.S. dollars using the mean of bid and asked prices for rates provided by a third-party pricing service.
The Board of Trustees has delegated primary responsibility for determining or causing to be determined the value of the fund’s investments (including any fair valuation) to the adviser pursuant to valuation policies and procedures approved by the Board. If the adviser determines that reliable market quotations are not readily available, investments are valued at fair value as determined in good faith by the adviser in accordance with such procedures under the oversight of the Board of Trustees. Under the fund’s valuation policies and procedures, market quotations are not considered to be readily available for most types of debt instruments and floating rate loans and many types of derivatives. These investments are generally valued at fair value based on information from third-party pricing services. In addition, investments may be valued at fair value if the adviser determines that an investment’s value has been materially affected by events occurring after the close of the exchange or market on which the investment is principally traded (such as foreign exchange or market) and prior to the determination of the fund’s net asset value, or after the halting of trading of a specific security where trading does not resume prior to the close of the exchange or market on which the security is principally traded. Events that occur on a frequent basis after foreign markets close (such as developments in foreign markets and significant movements in the U.S. markets) and prior to the determination of the fund’s net asset value may be deemed to have a material effect on the value of securities traded in foreign markets. Accordingly, the fund’s foreign equity securities may often be valued at fair value. The adviser generally relies on third-party pricing services or other information (such as the correlation with price movements of similar securities in the same or other markets; the type, cost and investment characteristics of the security; the business and financial condition of the issuer; and trading and other market data) to assist in determining whether to fair value and at what value to fair value an investment. The value of an investment for purposes of calculating the fund’s net asset value can differ depending on the source and method used to determine value. When fair valuation is used, the value of an investment used to determine the fund’s net asset value may differ from quoted or published prices for the same investment. There can be no assurance that the fund could obtain the fair value assigned to an investment if it were to sell the investment at the same time at which the fund determines its net asset value per share.
12
Table of Contents
MFS Global Equity Series
Notes to Financial Statements (unaudited) – continued
Various inputs are used in determining the value of the fund’s assets or liabilities. These inputs are categorized into three broad levels. In certain cases, the inputs used to measure fair value may fall into different levels of the fair value hierarchy. In such cases, an investment’s level within the fair value hierarchy is based on the lowest level of input that is significant to the fair value measurement. The fund’s assessment of the significance of a particular input to the fair value measurement in its entirety requires judgment, and considers factors specific to the investment. Level 1 includes unadjusted quoted prices in active markets for identical assets or liabilities. Level 2 includes other significant observable market-based inputs (including quoted prices for similar securities, interest rates, prepayment speed, and credit risk). Level 3 includes unobservable inputs, which may include the adviser’s own assumptions in determining the fair value of investments. Other financial instruments are derivative instruments not reflected in total investments, such as futures, forwards, swap contracts, and written options. The following is a summary of the levels used as of June 30, 2010 in valuing the fund’s assets or liabilities:
| Investments at Value | Level 1 | Level 2 | Level 3 | Total | ||||
| Equity Securities: | ||||||||
United States | $15,665,366 | $— | $— | $15,665,366 | ||||
Switzerland | — | 4,286,524 | — | 4,286,524 | ||||
France | — | 3,665,667 | — | 3,665,667 | ||||
United Kingdom | — | 3,500,180 | — | 3,500,180 | ||||
Germany | — | 2,391,418 | — | 2,391,418 | ||||
Netherlands | — | 2,039,282 | — | 2,039,282 | ||||
Japan | — | 2,012,927 | — | 2,012,927 | ||||
Canada | 627,967 | — | — | 627,967 | ||||
Sweden | — | 414,047 | — | 414,047 | ||||
Other Countries | 115,442 | 1,285,068 | — | 1,400,510 | ||||
| Mutual Funds | 91,341 | — | — | 91,341 | ||||
| Total Investments | $16,500,116 | $19,595,113 | $— | $36,095,229 |
For further information regarding security characteristics, see the Portfolio of Investments.
Of the level 2 investments presented above, equity investments amounting to $4,277,073 were considered level 1 investments at the beginning of the period. The primary reason for changes in the classifications between levels 1 and 2 occurs when foreign equity securities are fair valued using other observable market based inputs in place of the closing exchange price due to events occurring after the close of the exchange or market on which the investment is principally traded. The fund’s foreign equity securities may often be valued at fair value.
Foreign Currency Translation – Purchases and sales of foreign investments, income, and expenses are converted into U.S. dollars based upon currency exchange rates prevailing on the respective dates of such transactions or on the reporting date for foreign denominated receivables and payables. Gains and losses attributable to foreign currency exchange rates on sales of securities are recorded for financial statement purposes as net realized gains and losses on investments. Gains and losses attributable to foreign exchange rate movements on receivables, payables, income and expenses are recorded for financial statement purposes as foreign currency transaction gains and losses. That portion of both realized and unrealized gains and losses on investments that results from fluctuations in foreign currency exchange rates is not separately disclosed.
Derivatives – The fund may use derivatives for different purposes, including to earn income and enhance returns, to increase or decrease exposure to a particular market, to manage or adjust the risk profile of the fund, or as alternatives to direct investments. Derivatives may be used for hedging or non-hedging purposes. While hedging can reduce or eliminate losses, it can also reduce or eliminate gains. When the fund uses derivatives as an investment to increase market exposure, or for hedging purposes, gains and losses from derivative instruments may be substantially greater than the derivative’s original cost.
Derivative instruments include written options, purchased options, futures contracts, forward foreign currency exchange contracts, and swap agreements. For the six months ended June 30, 2010, the fund did not invest in any derivative instruments.
Security Loans – State Street Bank and Trust Company (“State Street”), as lending agent, may loan the securities of the fund to certain qualified institutions (the “Borrowers”) approved by the fund. The loans are collateralized by cash and/or U.S. Treasury and federal agency obligations in an amount typically at least equal to the market value of the securities loaned. The market value of the loaned securities is determined at the close of business of the fund and any additional required collateral is delivered to the fund on the next business day. State Street provides the fund with indemnification against Borrower default. The fund bears the risk of loss with respect to the investment of cash collateral. On loans collateralized by cash, the cash collateral is invested in a money market fund or short-term securities. A portion of the income generated upon investment of the collateral is remitted to the Borrowers, and the remainder is allocated between the fund and the lending agent. On loans
13
Table of Contents
MFS Global Equity Series
Notes to Financial Statements (unaudited) – continued
collateralized by U.S. Treasury and/or federal agency obligations, a fee is received from the Borrower, and is allocated between the fund and the lending agent. Income from securities lending is included in interest income on the Statement of Operations. The dividend and interest income earned on the securities loaned is accounted for in the same manner as other dividend and interest income.
Indemnifications – Under the fund’s organizational documents, its officers and Trustees may be indemnified against certain liabilities and expenses arising out of the performance of their duties to the fund. Additionally, in the normal course of business, the fund enters into agreements with service providers that may contain indemnification clauses. The fund’s maximum exposure under these agreements is unknown as this would involve future claims that may be made against the fund that have not yet occurred.
Investment Transactions and Income – Investment transactions are recorded on the trade date. Interest income is recorded on the accrual basis. All premium and discount is amortized or accreted for financial statement purposes in accordance with U.S. generally accepted accounting principles. Dividends received in cash are recorded on the ex-dividend date. Certain dividends from foreign securities will be recorded when the fund is informed of the dividend if such information is obtained subsequent to the ex-dividend date. Dividend and interest payments received in additional securities are recorded on the ex-dividend or ex-interest date in an amount equal to the value of the security on such date.
The fund may receive proceeds from litigation settlements. Any proceeds received from litigation involving portfolio holdings are reflected in the Statement of Operations in realized gain/loss if the security has been disposed of by the fund or in unrealized gain/loss if the security is still held by the fund. Any other proceeds from litigation not related to portfolio holdings are reflected as other income in the Statement of Operations.
Fees Paid Indirectly – The fund’s custody fee may be reduced according to an arrangement that measures the value of cash deposited with the custodian by the fund. This amount, for the six months ended June 30, 2010, is shown as a reduction of total expenses on the Statement of Operations.
Tax Matters and Distributions – The fund intends to qualify as a regulated investment company, as defined under Subchapter M of the Internal Revenue Code, and to distribute all of its taxable income, including realized capital gains. As a result, no provision for federal income tax is required. The fund’s federal tax returns for the prior three fiscal years remain subject to examination by the Internal Revenue Service. Foreign taxes, if any, have been accrued by the fund in the accompanying financial statements.
Distributions to shareholders are recorded on the ex-dividend date. Income and capital gain distributions are determined in accordance with income tax regulations, which may differ from U.S. generally accepted accounting principles. Certain capital accounts in the financial statements are periodically adjusted for permanent differences in order to reflect their tax character. These adjustments have no impact on net assets or net asset value per share. Temporary differences which arise from recognizing certain items of income, expense, gain or loss in different periods for financial statement and tax purposes will reverse at some time in the future. Distributions in excess of net investment income or net realized gains are temporary overdistributions for financial statement purposes resulting from differences in the recognition or classification of income or distributions for financial statement and tax purposes.
Book/tax differences primarily relate to wash sale loss deferrals and foreign taxes.
The tax character of distributions made during the current period will be determined at fiscal year end. The tax character of distributions declared to shareholders for the last fiscal year is as follows:
| 12/31/09 | ||
| Ordinary income (including any short-term capital gains) | $743,160 |
14
Table of Contents
MFS Global Equity Series
Notes to Financial Statements (unaudited) – continued
The federal tax cost and the tax basis components of distributable earnings were as follows:
| As of 6/30/10 | |||
| Cost of investments | $38,955,383 | ||
| Gross appreciation | 3,399,101 | ||
| Gross depreciation | (6,259,255 | ) | |
| Net unrealized appreciation (depreciation) | $(2,860,154 | ) | |
| As of 12/31/09 | |||
| Undistributed ordinary income | 400,841 | ||
| Capital loss carryforwards | (2,267,419 | ) | |
| Other temporary differences | 1,194 | ||
| Net unrealized appreciation (depreciation) | 1,989,251 | ||
The aggregate cost above includes prior fiscal year end tax adjustments, if applicable.
As of December 31, 2009, the fund had capital loss carryforwards available to offset future realized gains. Such losses expire as follows:
| 12/31/16 | $(1,342,500 | ) | |
| 12/31/17 | (924,919 | ) | |
| $(2,267,419 | ) |
Multiple Classes of Shares of Beneficial Interest – The fund offers multiple classes of shares, which differ in their respective distribution and/or service fees. The fund’s income, realized and unrealized gain (loss), and common expenses are allocated to shareholders based on the daily net assets of each class. Dividends are declared separately for each class. Differences in per share dividend rates are generally due to differences in separate class expenses. The fund’s distributions declared to shareholders as reported on the Statements of Changes in Net Assets are presented by class as follows:
| From net investment income | ||||
| Six months ended 6/30/10 | Year ended 12/31/09 | |||
| Initial Class | $380,540 | $719,372 | ||
| Service Class | 20,513 | 23,788 | ||
| Total | $401,053 | $743,160 | ||
| (3) | Transactions with Affiliates |
Investment Adviser – The fund has an investment advisory agreement with MFS to provide overall investment management and related administrative services and facilities to the fund.
The management fee is computed daily and paid monthly at the following annual rates:
| First $1 billion of average daily net assets | 1.00% | |
| Average daily net assets in excess of $1 billion | 0.90% |
The management fee incurred for the six months ended June 30, 2010 was equivalent to an annual effective rate of 1.00% of the fund’s average daily net assets.
Effective May 1, 2011, the investment adviser has agreed in writing to reduce its management fee to 0.90% of average daily net assets. This written agreement will continue until modified by the fund’s Board of Trustees, but such agreement will continue at least until April 30, 2012.
Prior to May 1, 2010, the investment adviser had agreed in writing to pay a portion of the fund’s operating expenses, exclusive of management fee, distribution and/or service fees, interest, taxes, extraordinary expenses, brokerage and transaction costs, and investment-related expenses, such that operating expenses did not exceed 0.15% annually of the fund’s average daily net assets. This written agreement terminated on April 30, 2010. For the period January 1, 2010 through April 30, 2010, this reduction amounted to $38,892 and is reflected as a reduction of total expenses in the Statement of Operations. Effective May 1, 2010, the investment adviser has agreed in writing to pay a portion of the fund’s total annual operating expenses, exclusive of interest, taxes, extraordinary expenses, brokerage and transaction costs, and investment-related expenses, such that total annual operating expenses do not exceed 1.15% of average daily net assets for the Initial Class shares and 1.40% of average daily net assets for the Service Class shares. This written agreement will continue until modified by the fund’s Board of Trustees, but such agreement will continue at least until April 30, 2012. For the period May 1, 2010 through June 30, 2010, this reduction amounted to $14,769 and is reflected as a reduction of total expenses in the Statement of Operations.
15
Table of Contents
MFS Global Equity Series
Notes to Financial Statements (unaudited) – continued
Distributor – MFS Fund Distributors, Inc. (MFD), a wholly-owned subsidiary of MFS, is the distributor of shares of the fund. The Trustees have adopted a distribution plan for the Service Class shares pursuant to Rule 12b-1 under the Investment Company Act of 1940.
The fund’s distribution plan provides that the fund will pay MFD distribution and/or service fees equal to 0.25% per annum of its average daily net assets attributable to Service Class shares as partial consideration for services performed and expenses incurred by MFD and financial intermediaries (including participating insurance companies that invest in the fund to fund variable annuity and variable life insurance contracts, sponsors of qualified retirement and pension plans that invest in the fund, and affiliates of these participating insurance companies and plan sponsors) in connection with the sale and distribution of the Service Class shares. MFD may subsequently pay all, or a portion, of the distribution and/or service fees to financial intermediaries.
Shareholder Servicing Agent – MFS Service Center, Inc. (MFSC), a wholly-owned subsidiary of MFS, receives a fee from the fund for its services as shareholder servicing agent. For the six months ended June 30, 2010, the fee was $2,395, which equated to 0.0120% annually of the fund’s average daily net assets. MFSC also receives payment from the fund for out-of-pocket expenses paid by MFSC on behalf of the fund. For the six months ended June 30, 2010, these costs amounted to $107.
Administrator – MFS provides certain financial, legal, shareholder communications, compliance, and other administrative services to the fund. Under an administrative services agreement, the fund partially reimburses MFS the costs incurred to provide these services. The fund is charged an annual fixed amount of $17,500 plus a fee based on average daily net assets. The administrative services fee incurred for the six months ended June 30, 2010 was equivalent to an annual effective rate of 0.0434% of the fund’s average daily net assets.
Trustees’ and Officers’ Compensation – The fund pays compensation to independent Trustees in the form of a retainer, attendance fees, and additional compensation to Board and Committee chairpersons. The fund does not pay compensation directly to Trustees or officers of the fund who are also officers of the investment adviser, all of whom receive remuneration for their services to the fund from MFS. Certain officers and Trustees of the fund are officers or directors of MFS, MFD, and MFSC.
Other – This fund and certain other funds managed by MFS (the funds) have entered into services agreements (the Agreements) which provide for payment of fees by the funds to Tarantino LLC and Griffin Compliance LLC in return for the provision of services of an Independent Chief Compliance Officer (ICCO) and Assistant ICCO, respectively, for the funds. The ICCO and Assistant ICCO are officers of the funds and the sole members of Tarantino LLC and Griffin Compliance LLC, respectively. The funds can terminate the Agreements with Tarantino LLC and Griffin Compliance LLC at any time under the terms of the Agreements. For the six months ended June 30, 2010, the aggregate fees paid by the fund to Tarantino LLC and Griffin Compliance LLC were $165 and are included in miscellaneous expense on the Statement of Operations. MFS has agreed to reimburse the fund for a portion of the payments made by the fund in the amount of $132, which is shown as a reduction of total expenses in the Statement of Operations. Additionally, MFS has agreed to bear all expenses associated with office space, other administrative support, and supplies provided to the ICCO and Assistant ICCO.
The fund may invest in the MFS Institutional Money Market Portfolio which is managed by MFS and seeks a high level of current income consistent with preservation of capital and liquidity. Income earned on this investment is included in dividends from underlying funds on the Statement of Operations. This money market fund does not pay a management fee to MFS.
| (4) | Portfolio Securities |
Purchases and sales of investments, other than U.S. Government securities, purchased option transactions, and short-term obligations, aggregated $3,361,539 and $4,190,829, respectively.
| (5) | Shares of Beneficial Interest |
The fund’s Declaration of Trust permits the Trustees to issue an unlimited number of full and fractional shares of beneficial interest. Transactions in fund shares were as follows:
| Six months ended 6/30/10 | Year ended 12/31/09 | |||||||
| Shares | Amount | Shares | Amount | |||||
| Shares sold | ||||||||
Initial Class | 158,127 | $1,877,322 | 545,383 | $5,715,890 | ||||
Service Class | 41,213 | 490,803 | 138,001 | 1,355,187 | ||||
| 199,340 | $2,368,125 | 683,384 | $7,071,077 | |||||
16
Table of Contents
MFS Global Equity Series
Notes to Financial Statements (unaudited) – continued
| Six months ended 6/30/10 | Year ended 12/31/09 | |||||||||||
| Shares | Amount | Shares | Amount | |||||||||
| Shares issued to shareholders in reinvestment of distributions | ||||||||||||
Initial Class | 30,516 | $380,540 | 84,236 | $719,372 | ||||||||
Service Class | 1,646 | 20,513 | 2,785 | 23,788 | ||||||||
| 32,162 | $401,053 | 87,021 | $743,160 | |||||||||
| Shares reacquired | ||||||||||||
Initial Class | (315,330 | ) | $(3,716,088 | ) | (937,705 | ) | $(8,954,455 | ) | ||||
Service Class | (19,525 | ) | (239,053 | ) | (28,122 | ) | (275,328 | ) | ||||
| (334,855 | ) | $(3,955,141 | ) | (965,827 | ) | $(9,229,783 | ) | |||||
| Net change | ||||||||||||
Initial Class | (126,687 | ) | $(1,458,226 | ) | (308,086 | ) | $(2,519,193 | ) | ||||
Service Class | 23,334 | 272,263 | 112,664 | 1,103,647 | ||||||||
| (103,353 | ) | $(1,185,963 | ) | (195,422 | ) | $(1,415,546 | ) | |||||
| (6) | Line of Credit |
The fund and certain other funds managed by MFS participate in a $1.1 billion unsecured committed line of credit, subject to a $1 billion sublimit, provided by a syndication of banks under a credit agreement. Borrowings may be made for temporary financing needs. Interest is charged to each fund, based on its borrowings, generally at a rate equal to the higher of the Federal Reserve funds rate or one month LIBOR plus an agreed upon spread. A commitment fee, based on the average daily, unused portion of the committed line of credit, is allocated among the participating funds at the end of each calendar quarter. In addition, the fund and other funds managed by MFS have established unsecured uncommitted borrowing arrangements with certain banks for temporary financing needs. Interest is charged to each fund, based on its borrowings, at a rate equal to the Federal Reserve funds rate plus an agreed upon spread. For the six months ended June 30, 2010, the fund’s commitment fee and interest expense were $301 and $0, respectively, and are included in miscellaneous expense on the Statement of Operations.
| (7) | Transactions in Underlying Funds – Affiliated Issuers |
An affiliated issuer may be considered one in which the fund owns 5% or more of the outstanding voting securities, or a company which is under common control. For the purposes of this report, the fund assumes the following to be affiliated issuers:
| Underlying Funds | Beginning Shares/Par Amount | Acquisitions Shares/Par Amount | Dispositions Shares/Par Amount | Ending Shares/Par Amount | |||||
| MFS Institutional Money Market Portfolio | 493,239 | 2,477,784 | (2,879,682 | ) | 91,341 | ||||
| Underlying Funds | Realized Gain (Loss) | Capital Gain Distributions | Dividend Income | Ending Value | |||||
| MFS Institutional Money Market Portfolio | $— | $— | $208 | $91,341 | |||||
17
Table of Contents
MFS Global Equity Series
RESULTS OF SHAREHOLDER MEETING (unaudited)
At a special meeting of shareholders of MFS Variable Insurance Trust, which was held on January 28, 2010, the following actions were taken:
Item 1. To elect the following individuals as Trustees:
| Number of Dollars | ||||
| Nominee | For | Withheld Authority | ||
| Robert E. Butler | 6,823,651,821.26 | 1,818,252,669.55 | ||
| Lawrence H. Cohn, M.D. | 6,813,621,200.14 | 1,828,283,290.67 | ||
| Maureen R. Goldfarb | 6,825,332,620.76 | 1,816,571,870.05 | ||
| David H. Gunning | 6,823,081,841.37 | 1,818,822,649.44 | ||
| William R. Gutow | 6,813,678,877.22 | 1,828,225,613.59 | ||
| Michael Hegarty | 6,827,456,515.87 | 1,814,447,974.94 | ||
| John P. Kavanaugh | 6,830,363,113.12 | 1,811,541,377.69 | ||
| Robert J. Manning | 6,825,511,264.17 | 1,816,393,226.64 | ||
| Robert C. Pozen | 6,824,854,120.27 | 1,817,050,370.54 | ||
| J. Dale Sherratt | 6,816,913,203.87 | 1,824,991,286.94 | ||
| Laurie J. Thomsen | 6,823,590,745.56 | 1,818,313,745.25 | ||
| Robert W. Uek | 6,818,161,803.66 | 1,823,742,687.15 | ||
18
Table of Contents
MFS Global Equity Series
BOARD REVIEW OF INVESTMENT ADVISORY AGREEMENT
A discussion regarding the Board’s most recent review and renewal of the fund’s Investment Advisory Agreement with MFS will be available on or about November 1, 2010 by clicking on the fund’s name under ‘‘Variable Insurance Portfolios — VIT’’ in the ‘‘Products and Performance’’ section of the MFS Web site (mfs.com).
PROXY VOTING POLICIES AND INFORMATION
A general description of the MFS funds’ proxy voting policies and procedures is available without charge, upon request, by calling
1-800-225-2606, by visiting the Proxy Voting section of mfs.com or by visiting the SEC’s Web site at http://www.sec.gov.
Information regarding how the fund voted proxies relating to portfolio securities during the most recent twelve-month period ended June 30 is available without charge by visiting the Proxy Voting section of mfs.com or by visiting the SEC’s Web site at http://www.sec.gov.
QUARTERLY PORTFOLIO DISCLOSURE
The fund will file a complete schedule of portfolio holdings with the Securities and Exchange Commission (the Commission) for the first and third quarters of each fiscal year on Form N-Q. The fund’s Form N-Q may be reviewed and copied at the:
Public Reference Room
Securities and Exchange Commission
100 F Street, NE, Room 1580
Washington, D.C. 20549
Information on the operation of the Public Reference Room may be obtained by calling the Commission at 1-800-SEC-0330. The fund’s Form N-Q is available on the EDGAR database on the Commission’s Internet Web site at http://www.sec.gov, and copies of this information may be obtained, upon payment of a duplicating fee, by electronic request at the following e-mail address: publicinfo@sec.gov or by writing the Public Reference Section at the above address.
From time to time, MFS may post important information about the fund or the MFS funds on the MFS web site (mfs.com). This information is available by visiting the “News & Commentary” section of mfs.com or by clicking on the fund’s name under “Variable Insurance Portfolios — VIT” in the “Products and Performance” section of mfs.com.
19
Table of Contents

Table of Contents

Table of Contents
This report is prepared for the general information of contract owners. It is authorized for distribution to prospective investors only when preceded or accompanied by a current prospectus.
NOT FDIC INSURED Ÿ MAY LOSE VALUE Ÿ NO BANK GUARANTEE Ÿ NOT A DEPOSIT Ÿ NOT INSURED BY ANY FEDERAL GOVERNMENT AGENCY OR NCUA/NCUSIF
Table of Contents
MFS Total Return Series

Dear Contract Owners:
After having suffered their biggest declines since the Great Depression, most global markets experienced an impressive resurgence during the latter months of 2009 and the first quarter of 2010. The global economy was able to reap the benefits of two major trends. The first of these was the massive efforts of governments and central banks to increase liquidity in the financial system as they sought to prevent the credit crisis from further affecting the banking system. The second was the move by companies around the world to cut costs and operations to prepare for rapidly changing market conditions. We believe that these moves not only shortened the length of the downturn but also set the stage for recovery.
Even with the significant market gains of 2009 and the early part of 2010, the recovery is unrolling at a moderate pace, with rebounds in the manufacturing sector and corporate America leading the way. Central bankers are proceeding with caution and many have held benchmark interest rates unchanged as they debate the best way to withdraw stimulus measures without disrupting the fragile growth process. Complicating that debate late in the period was the emergence of the European debt crisis and worries about whether this crisis could derail the global recovery. As that crisis unrolled with no clear resolution, risk aversion rose along with volatility. Weakening economic data late in the period added uncertainty to the mix and sparked a retrenchment in global equity markets.
While hurdles remain, we believe that the global economy is proceeding on the road to recovery. As always, we continue to be mindful of the many challenges faced at the individual, national, and international levels. It is at times such as these that we want to remind investors of the merits of maintaining a long-term view, adhering to basic investing principles such as asset allocation and diversification, and working closely with advisors to identify and research investment opportunities. At MFS®, we take particular pride in how well mutual funds can provide a broad range of products that can fit investor needs in any type of market climate.
Respectfully,

Robert J. Manning
Chairman and Chief Executive Officer
MFS Investment Management®
August 16, 2010
The opinions expressed in this letter are subject to change, may not be relied upon for investment advice, and no forecasts can be guaranteed.
MFS Fund Distributors, Inc., 500 Boylston Street, Boston, MA 02116
1
Table of Contents
MFS Total Return Series
Portfolio structure (i)
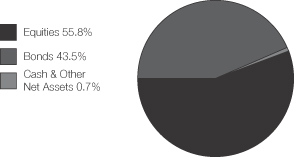
| Top ten holdings (i) | ||
| Fannie Mae, 5.5%, 30 Years | 2.9% | |
| U.S. Treasury Notes, 3.75%, 2018 | 2.7% | |
| JP Morgan Chase & Co. | 1.8% | |
| Lockheed Martin Corp. | 1.8% | |
| Freddie Mac, 5.0%, 30 Years | 1.7% | |
| Fannie Mae, 5.0%, 30 Years | 1.6% | |
| AT&T, Inc. | 1.6% | |
| Johnson & Johnson | 1.5% | |
| U.S. Treasury Notes, 2.75%, 2013 | 1.4% | |
| Philip Morris International Inc | 1.4% | |
| Composition including fixed income credit quality (a)(i) | ||
| AAA | 17.2% | |
| AA | 1.5% | |
| A | 3.6% | |
| BBB | 5.8% | |
| BB | 0.3% | |
| B (o) | 0.0% | |
| CCC | 0.1% | |
| Cash & Other (NR) | 0.8% | |
| U.S. Agency (NR) | 15.0% | |
| Non-Fixed Income (NR) | 55.7% | |
| Equity sectors | ||
| Financial Services | 12.2% | |
| Energy | 6.7% | |
| Consumer Staples | 6.3% | |
| Health Care | 5.9% | |
| Utilities & Communications | 5.8% | |
| Industrial Goods & Services | 5.4% | |
| Technology | 3.2% | |
| Retailing | 3.2% | |
| Leisure | 2.3% | |
| Basic Materials | 2.2% | |
| Special Products & Services | 1.4% | |
| Autos & Housing | 0.8% | |
| Transportation | 0.4% | |
| Fixed income sectors (i) | ||
| Mortgage-Backed Securities | 14.8% | |
| U.S. Treasury Securities | 13.9% | |
| High Grade Corporates | 9.4% | |
| Commercial Mortgage-Backed Securities | 1.6% | |
| U.S. Government Agencies | 0.9% | |
| Non-U.S. Government Bonds | 0.8% | |
| Emerging Markets Bonds | 0.7% | |
| Asset-Backed Securities | 0.4% | |
| Municipal Bonds | 0.4% | |
| Collateralized Debt Obligations | 0.3% | |
| High Yield Corporates | 0.3% | |
| (a) | The rating categories (e.g., AAA) include debt securities and fixed income structured products which have long-term public ratings. All other assets are not rated (NR). All rated securities are assigned a rating in accordance with the following ratings hierarchy: If a security is rated by Moody’s, then that rating is used; if not rated by Moody’s, then a Standard & Poor’s rating is used; if not rated by S&P, then a Fitch rating is used. Ratings from Moody’s (e.g., Aaa) are shown in the S&P and Fitch scale (e.g., AAA). All ratings are subject to change. |
| The Cash & Other (NR) category includes: cash, other assets less liabilities (including any derivative offsets), short-term securities, and unrated fixed income securities. |
| The U.S. Agency (NR) category includes unrated U.S. agency fixed income securities and collateralized mortgage obligations of U.S. agency mortgage-backed securities. |
| The Non-Fixed Income (NR) category includes equity securities (including convertible bonds), commodities, and any associated derivatives. |
| (i) | For purposes of this presentation, the components include the market value of securities, and reflect the impact of the equivalent exposure of derivative positions, if applicable. These amounts may be negative from time to time. The bond component will include any accrued interest amounts. Equivalent exposure is a calculated amount that translates the derivative position into a reasonable approximation of the amount of the underlying asset that the portfolio would have to hold at a given point in time to have the same price sensitivity that results from the portfolio’s ownership of the derivative contract. When dealing with derivatives, equivalent exposure is a more representative measure of the potential impact of a position on portfolio performance than market value. Where the fund holds convertible bonds, these are treated as part of the equity portion of the portfolio. |
| (o) | Less than 0.1%. |
Percentages are based on net assets as of 6/30/10, unless otherwise noted.
The portfolio is actively managed and current holdings may be different.
2
Table of Contents
MFS Total Return Series
After having suffered through one of the largest and most concentrated downturns since the 1930s, most asset markets staged a remarkable rebound during 2009 and early 2010. This recovery in global activity has been led importantly by emerging Asian economies, but broadening to include most of the global economy to varying degrees. Primary drivers of the recovery included an unwinding of the inventory destocking that took place earlier, the production of manufacturing and capital goods, as well as massive fiscal and monetary stimulus.
Late in the period, though, heightened risk surrounding the public-debt profiles of several of the peripheral European countries impaired market sentiment. At the same time, the improving trend in global macroeconomic data began to weaken somewhat. These two dynamics caused most asset prices to retrench significantly, as many questioned the durability of the global recovery.
3
Table of Contents
MFS Total Return Series
Fund Expenses Borne by the Contract Holders During the Period,
January 1, 2010 through June 30, 2010
As a contract holder of the fund, you incur ongoing costs, including management fees; distribution and/or service (12b-1) fees; and other fund expenses. This example is intended to help you understand your ongoing costs (in dollars) of investing in the fund and to compare these costs with the ongoing costs of investing in other mutual funds.
The example is based on an investment of $1,000 invested at the beginning of the period and held for the entire period January 1, 2010 through June 30, 2010.
Actual Expenses
The first line for each share class in the following table provides information about actual account values and actual expenses. You may use the information in this line, together with the amount you invested, to estimate the expenses that you paid over the period. Simply divide your account value by $1,000 (for example, an $8,600 account value divided by $1,000 = 8.6), then multiply the result by the number in the first line under the heading entitled “Expenses Paid During Period” to estimate the expenses you paid on your account during this period.
Hypothetical Example for Comparison Purposes
The second line for each share class in the following table provides information about hypothetical account values and hypothetical expenses based on the fund’s actual expense ratio and an assumed rate of return of 5% per year before expenses, which is not the fund’s actual return. The hypothetical account values and expenses may not be used to estimate the actual ending account balance or expenses you paid for the period. You may use this information to compare the ongoing costs of investing in the fund and other funds. To do so, compare this 5% hypothetical example with the 5% hypothetical examples that appear in the shareholder reports of the other funds.
Please note that the expenses shown in the table are meant to highlight the fund’s ongoing costs only and do not take into account the fees and expenses imposed under the variable contracts through which your investment in the fund is made. Therefore, the second line for each share class in the table is useful in comparing ongoing costs associated with an investment in vehicles (such as the fund) which fund benefits under variable annuity and variable life insurance contracts and to qualified pension and retirement plans only, and will not help you determine the relative total costs of investing in the fund through variable annuity and variable life insurance contracts. If the fees and expenses imposed under the variable contracts were included, your costs would have been higher.
| Share Class | Annualized Expense Ratio | Beginning Account Value 1/01/10 | Ending Account Value 6/30/10 | Expenses Paid During Period (p) 1/01/10-6/30/10 | ||||||
| Initial Class | Actual | 0.81% | $1,000.00 | $974.74 | $3.97 | |||||
| Hypothetical (h) | 0.81% | $1,000.00 | $1,020.78 | $4.06 | ||||||
| Service Class | Actual | 1.06% | $1,000.00 | $973.52 | $5.19 | |||||
| Hypothetical (h) | 1.06% | $1,000.00 | $1,019.54 | $5.31 |
| (h) | 5% class return per year before expenses. |
| (p) | Expenses paid is equal to each class’ annualized expense ratio, as shown above, multiplied by the average account value over the period, multiplied by the number of days in the period, divided by the number of days in the year. |
4
Table of Contents
MFS Total Return Series
PORTFOLIO OF INVESTMENTS – 6/30/10 (unaudited)
The Portfolio of Investments is a complete list of all securities owned by your fund. It is categorized by broad-based asset classes.
| Issuer | Shares/Par | Value ($) | |||
| COMMON STOCKS – 55.7% | |||||
| Aerospace – 4.1% | |||||
| Goodrich Corp. | 46,460 | $ | 3,077,975 | ||
| Honeywell International, Inc. | 197,320 | 7,701,400 | |||
| Lockheed Martin Corp. | 628,613 | 46,831,663 | |||
| Northrop Grumman Corp. | 278,317 | 15,151,577 | |||
| Precision Castparts Corp. | 34,330 | 3,533,244 | |||
| United Technologies Corp. | 497,150 | 32,270,007 | |||
| $ | 108,565,866 | ||||
| Alcoholic Beverages – 0.7% | |||||
| Diageo PLC | 1,012,782 | $ | 15,869,348 | ||
| Heineken N.V. | 85,110 | 3,607,758 | |||
| $ | 19,477,106 | ||||
| Apparel Manufacturers – 0.8% | |||||
| NIKE, Inc., “B” | 296,630 | $ | 20,037,357 | ||
| Automotive – 0.2% | |||||
| Johnson Controls, Inc. | 199,830 | $ | 5,369,432 | ||
| Broadcasting – 1.4% | |||||
| Omnicom Group, Inc. | 386,940 | $ | 13,272,042 | ||
| Time Warner, Inc. | 136,940 | 3,958,935 | |||
| Walt Disney Co. | 629,530 | 19,830,195 | |||
| $ | 37,061,172 | ||||
| Brokerage & Asset Managers – 0.5% | |||||
| Charles Schwab Corp. | 360,690 | $ | 5,114,584 | ||
| Deutsche Boerse AG | 48,090 | 2,921,795 | |||
| Franklin Resources, Inc. | 47,965 | 4,134,103 | |||
| $ | 12,170,482 | ||||
| Business Services – 1.3% | |||||
| Accenture Ltd., “A” | 399,730 | $ | 15,449,565 | ||
| Dun & Bradstreet Corp. | 66,780 | 4,482,274 | |||
| MasterCard, Inc., “A” | 37,590 | 7,500,333 | |||
| Visa, Inc., “A” | 48,000 | 3,396,000 | |||
| Western Union Co. | 283,880 | 4,232,651 | |||
| $ | 35,060,823 | ||||
| Cable TV – 0.2% | |||||
| Comcast Corp., “Special A” | 294,760 | $ | 4,842,907 | ||
| Chemicals – 1.6% | |||||
| 3M Co. | 248,620 | $ | 19,638,494 | ||
| E.I. du Pont de Nemours & Co. | 112,910 | 3,905,557 | |||
| Monsanto Co. | 51,450 | 2,378,019 | |||
| PPG Industries, Inc. | 266,590 | 16,104,702 | |||
| $ | 42,026,772 | ||||
| Computer Software – 0.7% | |||||
| Oracle Corp. | 919,492 | $ | 19,732,298 | ||
| Computer Software – Systems – 1.4% | |||||
| Dell, Inc. (a) | 369,300 | $ | 4,453,758 | ||
| Hewlett-Packard Co. | 325,761 | 14,098,936 | |||
| International Business Machines Corp. | 145,220 | 17,931,766 | |||
| $ | 36,484,460 | ||||
| Issuer | Shares/Par | Value ($) | |||
| COMMON STOCKS – continued | |||||
| Construction – 0.6% | |||||
| Pulte Homes, Inc. (a) | 285,450 | $ | 2,363,526 | ||
| Sherwin-Williams Co. | 114,890 | 7,949,239 | |||
| Stanley Black & Decker, Inc. | 90,519 | 4,573,020 | |||
| $ | 14,885,785 | ||||
| Consumer Products – 1.1% | |||||
| Clorox Co. | 87,230 | $ | 5,422,217 | ||
| Procter & Gamble Co. | 373,201 | 22,384,596 | |||
| $ | 27,806,813 | ||||
| Consumer Services – 0.1% | |||||
| Apollo Group, Inc., “A” (a) | 74,940 | $ | 3,182,702 | ||
| Electrical Equipment – 0.8% | |||||
| Danaher Corp. | 372,100 | $ | 13,812,352 | ||
| General Electric Co. | 253,630 | 3,657,345 | |||
| Tyco Electronics Ltd. | 134,770 | 3,420,463 | |||
| $ | 20,890,160 | ||||
| Electronics – 0.6% | |||||
| Intel Corp. | 842,940 | $ | 16,395,183 | ||
| Energy – Independent – 2.3% | |||||
| Anadarko Petroleum Corp. | 125,610 | $ | 4,533,265 | ||
| Apache Corp. | 323,700 | 27,252,303 | |||
| Devon Energy Corp. | 92,662 | 5,644,969 | |||
| EOG Resources, Inc. | 120,340 | 11,837,846 | |||
| Noble Energy, Inc. | 119,020 | 7,180,477 | |||
| Occidental Petroleum Corp. | 67,860 | 5,235,399 | |||
| $ | 61,684,259 | ||||
| Energy – Integrated – 3.8% | |||||
| Chevron Corp. | 357,772 | $ | 24,278,408 | ||
| Exxon Mobil Corp. | 635,342 | 36,258,968 | |||
| Hess Corp. | 234,170 | 11,788,118 | |||
| Marathon Oil Corp. | 246,390 | 7,660,265 | |||
| TOTAL S.A., ADR | 437,670 | 19,537,589 | |||
| $ | 99,523,348 | ||||
| Engineering – Construction – 0.2% | |||||
| Fluor Corp. | 101,300 | $ | 4,305,250 | ||
| Food & Beverages – 2.9% | |||||
| General Mills, Inc. | 365,760 | $ | 12,991,795 | ||
| Groupe Danone | 73,630 | 3,931,986 | |||
| J.M. Smucker Co. | 57,625 | 3,470,178 | |||
| Kellogg Co. | 150,427 | 7,566,478 | |||
| Nestle S.A. | 554,083 | 26,734,490 | |||
| PepsiCo, Inc. | 353,440 | 21,542,168 | |||
| $ | 76,237,095 | ||||
| Food & Drug Stores – 0.8% | |||||
| CVS Caremark Corp. | 334,800 | $ | 9,816,336 | ||
| Kroger Co. | 187,430 | 3,690,497 | |||
| Walgreen Co. | 329,190 | 8,789,373 | |||
| $ | 22,296,206 | ||||
5
Table of Contents
MFS Total Return Series
Portfolio of Investments (unaudited) – continued
| Issuer | Shares/Par | Value ($) | |||
| COMMON STOCKS – continued | |||||
| Gaming & Lodging – 0.1% | |||||
| Starwood Hotels & Resorts Worldwide, Inc. | 32,190 | $ | 1,333,632 | ||
| General Merchandise – 0.8% | |||||
| Kohl’s Corp. (a) | 71,500 | $ | 3,396,250 | ||
| Target Corp. | 193,850 | 9,531,605 | |||
| Wal-Mart Stores, Inc. | 180,270 | 8,665,579 | |||
| $ | 21,593,434 | ||||
| Health Maintenance Organizations – 0.1% | |||||
| WellPoint, Inc. (a) | 50,790 | $ | 2,485,155 | ||
| Insurance – 3.9% | |||||
| ACE Ltd. | 207,040 | $ | 10,658,419 | ||
| Aflac, Inc. | 75,770 | 3,233,106 | |||
| Allstate Corp. | 208,640 | 5,994,227 | |||
| Aon Corp. | 164,620 | 6,110,694 | |||
| Chubb Corp. | 103,480 | 5,175,035 | |||
| MetLife, Inc. | 831,900 | 31,412,544 | |||
| Prudential Financial, Inc. | 388,240 | 20,832,958 | |||
| Travelers Cos., Inc. | 371,460 | 18,294,405 | |||
| $ | 101,711,388 | ||||
| Internet – 0.3% | |||||
| eBay, Inc. (a) | 84,880 | $ | 1,664,497 | ||
| Google, Inc., “A” (a) | 11,280 | 5,019,036 | |||
| $ | 6,683,533 | ||||
| Leisure & Toys – 0.3% | |||||
| Hasbro, Inc. | 183,190 | $ | 7,529,109 | ||
| Machinery & Tools – 0.3% | |||||
| Eaton Corp. | 134,410 | $ | 8,795,790 | ||
| Major Banks – 7.6% | |||||
| Bank of America Corp. | 1,919,490 | $ | 27,583,071 | ||
| Bank of New York Mellon Corp. | 1,360,192 | 33,583,140 | |||
| Goldman Sachs Group, Inc. | 272,310 | 35,746,134 | |||
| JPMorgan Chase & Co. | 1,330,034 | 48,692,545 | |||
| PNC Financial Services Group, Inc. | 210,800 | 11,910,200 | |||
| Regions Financial Corp. | 160,800 | 1,058,064 | |||
| State Street Corp. | 462,630 | 15,646,147 | |||
| Wells Fargo & Co. | 987,540 | 25,281,024 | |||
| $ | 199,500,325 | ||||
| Medical & Health Technology & Services – 0.2% | |||||
| DaVita, Inc. (a) | 67,060 | $ | 4,187,226 | ||
| Medical Equipment – 1.8% | |||||
| Becton, Dickinson & Co. | 176,570 | $ | 11,939,663 | ||
| Medtronic, Inc. | 407,430 | 14,777,486 | |||
| St. Jude Medical, Inc. (a) | 226,470 | 8,173,302 | |||
| Thermo Fisher Scientific, Inc. (a) | 58,840 | 2,886,102 | |||
| Waters Corp. (a) | 137,820 | 8,916,954 | |||
| $ | 46,693,507 | ||||
| Metals & Mining – 0.1% | |||||
| United States Steel Corp. | 67,810 | $ | 2,614,076 | ||
| Natural Gas – Distribution – 0.1% | |||||
| Sempra Energy | 65,060 | $ | 3,044,157 | ||
| Issuer | Shares/Par | Value ($) | |||
| COMMON STOCKS – continued | |||||
| Natural Gas – Pipeline – 0.2% | |||||
| Williams Cos., Inc. | 314,098 | $ | 5,741,711 | ||
| Network & Telecom – 0.2% | |||||
| Cisco Systems, Inc. (a) | 281,830 | $ | 6,005,797 | ||
| Oil Services – 0.6% | |||||
| Halliburton Co. | 103,680 | $ | 2,545,344 | ||
| National Oilwell Varco, Inc. | 157,260 | 5,200,588 | |||
| Noble Corp. | 95,950 | 2,965,815 | |||
| Schlumberger Ltd. | 52,050 | 2,880,447 | |||
| Transocean, Inc. (a) | 78,430 | 3,633,662 | |||
| $ | 17,225,856 | ||||
| Other Banks & Diversified Financials – 0.2% | |||||
| Marshall & Ilsley Corp. | 471,200 | $ | 3,383,216 | ||
| Zions Bancorporation | 133,920 | 2,888,654 | |||
| $ | 6,271,870 | ||||
| Pharmaceuticals – 3.8% | |||||
| Abbott Laboratories | 520,740 | $ | 24,360,217 | ||
| Bayer AG | 103,459 | 5,772,501 | |||
| GlaxoSmithKline PLC | 185,880 | 3,150,142 | |||
| Johnson & Johnson | 657,660 | 38,841,400 | |||
| Merck & Co., Inc. | 110,540 | 3,865,584 | |||
| Pfizer, Inc. | 1,610,626 | 22,967,527 | |||
| Roche Holding AG | 18,130 | 2,489,677 | |||
| $ | 101,447,048 | ||||
| Railroad & Shipping – 0.2% | |||||
| Canadian National Railway Co. | 66,860 | $ | 3,836,427 | ||
| Union Pacific Corp. | 34,260 | 2,381,413 | |||
| $ | 6,217,840 | ||||
| Restaurants – 0.3% | |||||
| McDonald’s Corp. | 110,920 | $ | 7,306,300 | ||
| Specialty Chemicals – 0.5% | |||||
| Air Products & Chemicals, Inc. | 213,270 | $ | 13,822,029 | ||
| Specialty Stores – 0.8% | |||||
| Advance Auto Parts, Inc. | 180,990 | $ | 9,082,078 | ||
| Home Depot, Inc. | 148,900 | 4,179,623 | |||
| Staples, Inc. | 382,970 | 7,295,579 | |||
| $ | 20,557,280 | ||||
| Telecommunications – Wireless – 0.8% | |||||
| Vodafone Group PLC | 10,230,590 | $ | 21,200,052 | ||
| Telephone Services – 1.8% | |||||
| AT&T, Inc. | 1,753,874 | $ | 42,426,212 | ||
| CenturyTel, Inc. | 153,561 | 5,115,117 | |||
| $ | 47,541,329 | ||||
| Tobacco – 1.6% | |||||
| Altria Group, Inc. | 206,253 | $ | 4,133,310 | ||
| Philip Morris International, Inc. | 816,580 | 37,432,027 | |||
| $ | 41,565,337 | ||||
6
Table of Contents
MFS Total Return Series
Portfolio of Investments (unaudited) – continued
| Issuer | Shares/Par | Value ($) | ||||
| COMMON STOCKS – continued | ||||||
| Trucking – 0.2% | ||||||
| United Parcel Service, Inc., “B” | 87,880 | $ | 4,999,493 | |||
| Utilities – Electric Power – 2.8% | ||||||
| American Electric Power Co., Inc. | 211,060 | $ | 6,817,238 | |||
| CenterPoint Energy, Inc. | 125,110 | 1,646,448 | ||||
| CMS Energy Corp. | 94,030 | 1,377,540 | ||||
| Dominion Resources, Inc. | 250,260 | 9,695,072 | ||||
| Entergy Corp. | 136,580 | 9,781,860 | ||||
| NextEra Energy, Inc. | 159,778 | 7,790,775 | ||||
| Northeast Utilities | 59,300 | 1,510,964 | ||||
| NRG Energy, Inc. (a) | 202,350 | 4,291,844 | ||||
| PG&E Corp. | 231,040 | 9,495,744 | ||||
| PPL Corp. | 399,740 | 9,973,513 | ||||
| Public Service Enterprise Group, Inc. | 392,110 | 12,284,806 | ||||
| $ | 74,665,804 | |||||
| Total Common Stocks (Identified Cost, $1,571,267,615) | $ | 1,468,774,554 | ||||
| BONDS – 43.1% | ||||||
| Agency – Other – 0.0% | ||||||
| Financing Corp., 9.65%, 2018 | $ | 740,000 | $ | 1,081,652 | ||
| Asset-Backed & Securitized – 2.2% | ||||||
| Anthracite Ltd., “A”, CDO, FRN, 0.797%, 2017 (z) | $ | 3,052,679 | $ | 2,838,992 | ||
| Bayview Financial Revolving Mortgage Loan Trust, FRN, 1.947%, 2040 (z) | 2,326,311 | 957,975 | ||||
| Citigroup Commercial Mortgage Trust, FRN, 5.888%, 2049 | 5,000,000 | 5,095,741 | ||||
| Citigroup/Deutsche Bank Commercial Mortgage Trust, 5.322%, 2049 | 3,600,000 | 3,496,513 | ||||
| Countrywide Asset-Backed Certificates, FRN, 4.823%, 2035 | 67,299 | 66,691 | ||||
| Countrywide Asset-Backed Certificates, FRN, 5.689%, 2046 | 1,911,000 | 1,236,845 | ||||
| Credit Suisse Mortgage Capital Certificate, 5.695%, 2040 | 3,818,128 | 3,625,300 | ||||
| Crest G-Star, CDO, FRN, 1.007%, 2016 | 3,948,478 | 3,820,153 | ||||
| GMAC Mortgage Corp. Loan Trust, FRN, 5.805%, 2036 | 1,889,070 | 983,779 | ||||
| Greenwich Capital Commercial Funding Corp., 5.475%, 2039 | 5,978,000 | 4,746,832 | ||||
| HSBC Credit Card Master Note Trust, FRN, 0.899%, 2013 | 4,996,000 | 4,994,188 | ||||
| JPMorgan Chase Commercial Mortgage Securities Corp., 4.78%, 2042 | 2,485,000 | 2,319,155 | ||||
| JPMorgan Chase Commercial Mortgage Securities Corp., 5.552%, 2045 | 1,551,006 | 1,625,912 | ||||
| JPMorgan Chase Commercial Mortgage Securities Corp., FRN, 4.948%, 2037 | 2,548,000 | 2,316,496 | ||||
| JPMorgan Chase Commercial Mortgage Securities Corp., FRN, 5.407%, 2041 | 2,550,000 | 2,706,044 | ||||
| JPMorgan Chase Commercial Mortgage Securities Corp., FRN, 5.475%, 2043 | 4,339,145 | 4,607,348 | ||||
| JPMorgan Chase Commercial Mortgage Securities Corp., FRN, 6.064%, 2045 | 4,332,626 | 4,617,086 | ||||
| Issuer | Shares/Par | Value ($) | ||||
| BONDS – continued | ||||||
| Asset-Backed & Securitized – continued | ||||||
| Merrill Lynch Mortgage Trust, FRN, 6.019%, 2050 | $ | 1,967,000 | $ | 529,419 | ||
| Merrill Lynch/Countrywide Commercial Mortgage Trust, FRN, 5.81%, 2050 | 3,818,128 | 3,733,846 | ||||
| Morgan Stanley Capital I, Inc., FRN, 1.133%, 2030 (i)(n) | 3,956,781 | 159,809 | ||||
| Residential Asset Mortgage Products, Inc., FRN, 4.97%, 2034 | 1,170,000 | 1,168,321 | ||||
| Residential Funding Mortgage Securities, Inc., 5.32%, 2035 | 2,164,000 | 786,398 | ||||
| Spirit Master Funding LLC, 5.05%, 2023 (z) | 2,090,538 | 1,819,270 | ||||
| Structured Asset Securities Corp., FRN, 4.67%, 2035 | 786,413 | 768,142 | ||||
| $ | 59,020,255 | |||||
| Automotive – 0.1% | ||||||
| Toyota Motor Credit Corp., 3.2%, 2015 | $ | 1,430,000 | $ | 1,459,547 | ||
| Broadcasting – 0.1% | ||||||
| Hearst-Argyle Television, Inc., 7.5%, 2027 | $ | 1,871,000 | $ | 1,491,462 | ||
| News America, Inc., 8.5%, 2025 | 1,586,000 | 1,962,702 | ||||
| $ | 3,454,164 | |||||
| Building – 0.0% | ||||||
| CRH America, Inc., 6.95%, 2012 | $ | 539,000 | $ | 583,721 | ||
| Cable TV – 0.2% | ||||||
| Cox Communications, Inc., 4.625%, 2013 | $ | 1,949,000 | $ | 2,078,115 | ||
| Time Warner Entertainment Co. LP, 8.375%, 2033 | 2,421,000 | 3,005,144 | ||||
| $ | 5,083,259 | |||||
| Computer Software – 0.1% | ||||||
| Adobe Systems, Inc., 3.25%, 2015 | $ | 739,000 | $ | 758,918 | ||
| Adobe Systems, Inc., 4.75%, 2020 | 1,750,000 | 1,804,264 | ||||
| $ | 2,563,182 | |||||
| Conglomerates – 0.1% | ||||||
| Kennametal, Inc., 7.2%, 2012 | $ | 2,140,000 | $ | 2,274,929 | ||
| Consumer Products – 0.1% | ||||||
| Fortune Brands, Inc., 5.125%, 2011 | $ | 2,519,000 | $ | 2,567,398 | ||
| Consumer Services – 0.1% | ||||||
| Western Union Co., 5.4%, 2011 | $ | 3,514,000 | $ | 3,704,055 | ||
| Defense Electronics – 0.1% | ||||||
| BAE Systems Holdings, Inc., 5.2%, 2015 (n) | $ | 2,440,000 | $ | 2,616,758 | ||
| Electronics – 0.1% | ||||||
| Tyco Electronics Group S.A., 6.55%, 2017 | $ | 2,931,000 | $ | 3,365,996 | ||
| Emerging Market Quasi-Sovereign – 0.2% | ||||||
| Petroleos Mexicanos, 8%, 2019 | $ | 1,753,000 | $ | 2,086,070 | ||
| Qtel International Finance Ltd., 7.875%, 2019 (n) | 684,000 | 790,922 | ||||
| Ras Laffan Liquefied Natural Gas Co. Ltd., 5.832%, 2016 (n) | 2,715,000 | 2,919,983 | ||||
| $ | 5,796,975 | |||||
7
Table of Contents
MFS Total Return Series
Portfolio of Investments (unaudited) – continued
| Issuer | Shares/Par | Value ($) | ||||
| BONDS – continued | ||||||
| Emerging Market Sovereign – 0.2% | ||||||
| Republic of Peru, 7.35%, 2025 | $ | 184,000 | $ | 220,340 | ||
| Russian Federation, 3.625%, 2015 (z) | 5,000,000 | 4,837,500 | ||||
| $ | 5,057,840 | |||||
| Energy – Independent – 0.1% | ||||||
| Anadarko Petroleum Corp., 6.45%, 2036 | $ | 3,000,000 | $ | 2,386,437 | ||
| Energy – Integrated – 0.3% | ||||||
| Hess Corp., 8.125%, 2019 | $ | 700,000 | $ | 872,589 | ||
| Husky Energy, Inc., 5.9%, 2014 | 1,758,000 | 1,956,884 | ||||
| Husky Energy, Inc., 7.25%, 2019 | 1,793,000 | 2,166,828 | ||||
| Petro-Canada, 6.05%, 2018 | 3,647,000 | 4,106,610 | ||||
| $ | 9,102,911 | |||||
| Financial Institutions – 0.1% | ||||||
| General Electric Capital Corp., 5.45%, 2013 | $ | 1,963,000 | $ | 2,109,522 | ||
| Food & Beverages – 0.4% | ||||||
| Anheuser-Busch Cos., Inc., 8%, 2039 (n) | $ | 2,880,000 | $ | 3,763,204 | ||
| Dr. Pepper Snapple Group, Inc., 6.82%, 2018 | 1,158,000 | 1,381,101 | ||||
| Miller Brewing Co., 5.5%, 2013 (n) | 5,763,000 | 6,304,693 | ||||
| $ | 11,448,998 | |||||
| Food & Drug Stores – 0.1% | ||||||
| CVS Caremark Corp., 6.125%, 2016 | $ | 2,078,000 | $ | 2,377,012 | ||
| Gaming & Lodging – 0.1% | ||||||
| Wyndham Worldwide Corp., 6%, 2016 | $ | 1,997,000 | $ | 1,937,429 | ||
| Insurance – 0.2% | ||||||
| ING Groep N.V., 5.775% to 2015, FRN to 2049 | $ | 2,021,000 | $ | 1,424,805 | ||
| Metropolitan Life Global Funding, 5.125%, 2013 (n) | 1,200,000 | 1,297,885 | ||||
| Metropolitan Life Global Funding, 5.125%, 2014 (n) | 1,060,000 | 1,151,502 | ||||
| Prudential Financial, Inc., 5.375%, 2020 | 600,000 | 607,666 | ||||
| Prudential Financial, Inc., 6.625%, 2040 | 980,000 | 997,337 | ||||
| $ | 5,479,195 | |||||
| Insurance – Property & Casualty – 0.3% | ||||||
| Allstate Corp., 6.125%, 2032 | $ | 1,017,000 | $ | 1,063,482 | ||
| Allstate Corp., 5.55%, 2035 | 2,417,000 | 2,376,143 | ||||
| Chubb Corp., 6.375% to 2017, FRN to 2067 | 4,156,000 | 3,989,760 | ||||
| ZFS Finance USA Trust IV, 5.875% to 2012, FRN to 2032 (n) | 243,000 | 214,878 | ||||
| ZFS Finance USA Trust V, 6.5% to 2017, FRN to 2067 (n) | 990,000 | 886,050 | ||||
| $ | 8,530,313 | |||||
| International Market Quasi-Sovereign – 0.7% | ||||||
| Achmea Hypotheekbank N.V., 3.2%, 2014 (n) | $ | 2,020,000 | $ | 2,086,977 | ||
| ING Bank N.V., 3.9%, 2014 (n) | 2,900,000 | 3,108,820 | ||||
| Irish Life & Permanent PLC, 3.6%, 2013 (n) | 3,600,000 | 3,566,768 | ||||
| Issuer | Shares/Par | Value ($) | ||||
| BONDS – continued | ||||||
| International Market Quasi-Sovereign – continued | ||||||
| KFW International Finance, Inc., 4.875%, 2019 | $ | 2,980,000 | $ | 3,318,293 | ||
| Royal Bank of Scotland Group PLC, 2.625%, 2012 (n) | 5,190,000 | 5,308,265 | ||||
| Societe Financement de l’ Economie Francaise, 3.375%, 2014 (n) | 1,664,000 | 1,738,264 | ||||
| $ | 19,127,387 | |||||
| Local Authorities – 0.2% | ||||||
| Metropolitan Transportation Authority, NY (Build America Bonds), 7.336%, 2039 | $ | 2,435,000 | $ | 2,973,305 | ||
| New Jersey Turnpike Authority Rev. (Build America Bonds), “F”, 7.414%, 2040 | 2,405,000 | 2,929,531 | ||||
| $ | 5,902,836 | |||||
| Machinery & Tools – 0.1% | ||||||
| Atlas Copco AB, 5.6%, 2017 (n) | $ | 3,117,000 | $ | 3,374,592 | ||
| Major Banks – 1.6% | ||||||
| Bank of America Corp., 7.375%, 2014 | $ | 1,160,000 | $ | 1,300,083 | ||
| Bank of America Corp., 5.49%, 2019 | 1,260,000 | 1,218,448 | ||||
| Bank of America Corp., 7.625%, 2019 | 1,640,000 | 1,878,633 | ||||
| BNP Paribas, 7.195% to 2037, FRN to 2049 (n) | 1,042,000 | 906,540 | ||||
| Commonwealth Bank of Australia, 5%, 2019 (n) | 1,620,000 | 1,681,631 | ||||
| Credit Suisse New York, 5.5%, 2014 | 3,360,000 | 3,673,622 | ||||
| DBS Group Holdings Ltd., 7.657% to 2011, FRN to 2049 (n) | 1,261,000 | 1,283,068 | ||||
| Goldman Sachs Group, Inc., 5.625%, 2017 | 2,680,000 | 2,709,775 | ||||
| JPMorgan Chase & Co., 6.3%, 2019 | 2,760,000 | 3,117,406 | ||||
| JPMorgan Chase Capital XXVII, 7%, 2039 | 1,640,000 | 1,667,778 | ||||
| Merrill Lynch & Co., Inc., 6.15%, 2013 | 2,480,000 | 2,651,467 | ||||
| Morgan Stanley, 5.75%, 2016 | 2,536,000 | 2,554,817 | ||||
| Morgan Stanley, 6.625%, 2018 | 1,980,000 | 2,075,305 | ||||
| PNC Funding Corp., 5.625%, 2017 | 2,078,000 | 2,210,728 | ||||
| UniCredito Italiano Capital Trust II, 9.2% to 2010, FRN to 2049 (n) | 1,719,000 | 1,624,455 | ||||
| UniCredito Luxembourg Finance S.A., 6%, 2017 (n) | 3,820,000 | 3,812,459 | ||||
| Wachovia Corp., 5.25%, 2014 | 7,433,000 | 7,871,443 | ||||
| $ | 42,237,658 | |||||
| Medical & Health Technology & Services – 0.3% | ||||||
| Cardinal Health, Inc., 5.8%, 2016 | $ | 1,498,000 | $ | 1,677,523 | ||
| CareFusion Corp., 6.375%, 2019 | 2,550,000 | 2,912,942 | ||||
| Hospira, Inc., 5.55%, 2012 | 1,068,000 | 1,137,153 | ||||
| Hospira, Inc., 6.05%, 2017 | 1,927,000 | 2,169,573 | ||||
| $ | 7,897,191 | |||||
| Metals & Mining – 0.2% | ||||||
| ArcelorMittal, 6.125%, 2018 | $ | 3,666,000 | $ | 3,834,200 | ||
| Vale Overseas Ltd., 6.875%, 2039 | 1,243,000 | 1,298,560 | ||||
| $ | 5,132,760 | |||||
8
Table of Contents
MFS Total Return Series
Portfolio of Investments (unaudited) – continued
| Issuer | Shares/Par | Value ($) | ||||
| BONDS – continued | ||||||
| Mortgage-Backed – 14.8% | ||||||
| Fannie Mae, 6.253%, 2011 | $ | 339,309 | $ | 350,939 | ||
| Fannie Mae, 6.33%, 2011 | 300,153 | 306,482 | ||||
| Fannie Mae, 4.791%, 2012 | 1,581,368 | 1,671,870 | ||||
| Fannie Mae, 4.01%, 2013 | 233,497 | 245,825 | ||||
| Fannie Mae, 4.02%, 2013 | 1,050,177 | 1,106,447 | ||||
| Fannie Mae, 4.767%, 2013 | 125,961 | 133,673 | ||||
| Fannie Mae, 4.845%, 2013 | 414,015 | 443,333 | ||||
| Fannie Mae, 5.371%, 2013 | 785,473 | 834,990 | ||||
| Fannie Mae, 4.589%, 2014 | 1,078,584 | 1,157,848 | ||||
| Fannie Mae, 4.841%, 2014 | 1,760,090 | 1,900,391 | ||||
| Fannie Mae, 4.872%, 2014 | 935,634 | 1,001,682 | ||||
| Fannie Mae, 4.94%, 2015 | 379,000 | 403,177 | ||||
| Fannie Mae, 5.19%, 2015 | 421,911 | 465,812 | ||||
| Fannie Mae, 5.27%, 2016 | 1,125,000 | 1,241,360 | ||||
| Fannie Mae, 5.66%, 2016 | 326,403 | 362,978 | ||||
| Fannie Mae, 5.724%, 2016 | 602,744 | 667,524 | ||||
| Fannie Mae, 5.45%, 2017 | 799,630 | 889,844 | ||||
| Fannie Mae, 5.5%, 2017 - 2038 | 79,758,090 | 85,980,297 | ||||
| Fannie Mae, 6%, 2017 - 2037 | 38,696,211 | 42,370,763 | ||||
| Fannie Mae, 4.5%, 2018 - 2035 | 11,648,932 | 12,309,133 | ||||
| Fannie Mae, 5%, 2018 - 2039 | 48,560,146 | 51,634,017 | ||||
| Fannie Mae, 5.37%, 2018 | 1,740,000 | 1,936,447 | ||||
| Fannie Mae, 4.88%, 2020 | 1,059,862 | 1,159,298 | ||||
| Fannie Mae, 7.5%, 2030 - 2032 | 277,357 | 316,153 | ||||
| Fannie Mae, 6.5%, 2031 - 2037 | 11,419,957 | 12,630,119 | ||||
| Freddie Mac, 6%, 2016 - 2037 | 22,411,862 | 24,494,644 | ||||
| Freddie Mac, 5%, 2017 - 2039 | 47,644,622 | 50,591,174 | ||||
| Freddie Mac, 4.5%, 2018 - 2039 | 23,979,819 | 25,165,900 | ||||
| Freddie Mac, 5.085%, 2019 | 2,793,000 | 3,056,767 | ||||
| Freddie Mac, 5.5%, 2019 - 2037 | 14,128,188 | 15,257,312 | ||||
| Freddie Mac, 6.5%, 2034 - 2038 | 7,021,647 | 7,748,096 | ||||
| Ginnie Mae, 6%, 2032 - 2038 | 7,350,458 | 8,072,209 | ||||
| Ginnie Mae, 4.5%, 2033 - 2040 | 3,922,046 | 4,108,448 | ||||
| Ginnie Mae, 5.5%, 2033 - 2035 | 9,206,600 | 10,016,478 | ||||
| Ginnie Mae, 5%, 2034 - 2039 | 17,930,085 | 19,161,183 | ||||
| $ | 389,192,613 | |||||
| Municipals – 0.4% | ||||||
| California Educational Facilities Authority Rev. (Stanford University), “T-1”, 5%, 2039 | $ | 1,425,000 | $ | 1,669,516 | ||
| Massachusetts Health & Educational Facilities Authority Rev. (Boston College), 5.5%, 2030 | 1,595,000 | 1,863,279 | ||||
| Massachusetts Health & Educational Facilities Authority Rev. (Massachusetts Institute of Technology), “K”, 5.5%, 2032 | 4,905,000 | 6,007,006 | ||||
| $ | 9,539,801 | |||||
| Natural Gas – Pipeline – 0.5% | ||||||
| CenterPoint Energy, Inc., 7.875%, 2013 | $ | 2,119,000 | $ | 2,428,105 | ||
| Enterprise Products Operating LLC, 6.5%, 2019 | 1,953,000 | 2,189,708 | ||||
| Kinder Morgan Energy Partners LP, 6.75%, 2011 | 3,906,000 | 4,043,327 | ||||
| Issuer | Shares/Par | Value ($) | ||||
| BONDS – continued | ||||||
| Natural Gas – Pipeline – continued | ||||||
| Kinder Morgan Energy Partners LP, 7.4%, 2031 | $ | 219,000 | $ | 242,286 | ||
| Kinder Morgan Energy Partners LP, 7.75%, 2032 | 1,000,000 | 1,132,747 | ||||
| Spectra Energy Capital LLC, 8%, 2019 | 1,694,000 | 2,037,470 | ||||
| $ | 12,073,643 | |||||
| Network & Telecom – 0.6% | ||||||
| AT&T, Inc., 6.55%, 2039 | $ | 2,940,000 | $ | 3,293,068 | ||
| BellSouth Corp., 6.55%, 2034 | 2,642,000 | 2,909,724 | ||||
| Telecom Italia Capital, 5.25%, 2013 | 2,176,000 | 2,247,582 | ||||
| Telefonica Europe B.V., 7.75%, 2010 | 882,000 | 893,032 | ||||
| Verizon New York, Inc., 6.875%, 2012 | 5,030,000 | 5,435,267 | ||||
| $ | 14,778,673 | |||||
| Oils – 0.2% | ||||||
| Valero Energy Corp., 6.875%, 2012 | $ | 4,222,000 | $ | 4,545,511 | ||
| Other Banks & Diversified Financials – 1.0% | ||||||
| American Express Co., 5.5%, 2016 | $ | 2,287,000 | $ | 2,450,962 | ||
| Banco Bradesco S.A., 6.75%, 2019 (n) | 1,391,000 | 1,474,460 | ||||
| Capital One Financial Corp., 6.15%, 2016 | 2,872,000 | 3,038,969 | ||||
| Citigroup, Inc., 5%, 2014 | 2,679,000 | 2,679,536 | ||||
| Groupe BPCE S.A., 12.5% to 2019, FRN to 2049 (n) | 3,021,000 | 3,360,228 | ||||
| Nordea Bank AB, 5.424% to 2015, FRN to 2049 (n) | 862,000 | 770,881 | ||||
| Svenska Handelsbanken AB, 4.875%, 2014 (n) | 3,040,000 | 3,209,796 | ||||
| UBS Preferred Funding Trust V, 6.243% to 2016, FRN to 2049 | 4,738,000 | 4,062,835 | ||||
| Woori Bank, 6.125% to 2011, FRN to 2016 (n) | 4,966,000 | 5,003,747 | ||||
| $ | 26,051,414 | |||||
| Pharmaceuticals – 0.4% | ||||||
| Allergan, Inc., 5.75%, 2016 | $ | 4,097,000 | $ | 4,793,109 | ||
| Pfizer, Inc., 7.2%, 2039 | 1,240,000 | 1,630,078 | ||||
| Roche Holdings, Inc., 6%, 2019 (n) | 4,080,000 | 4,752,763 | ||||
| $ | 11,175,950 | |||||
| Railroad & Shipping – 0.0% | ||||||
| CSX Corp., 6.75%, 2011 | $ | 262,000 | $ | 271,397 | ||
| Real Estate – 0.5% | ||||||
| Boston Properties, Inc., REIT, 5%, 2015 | $ | 1,871,000 | $ | 1,940,152 | ||
| HRPT Properties Trust, REIT, 6.25%, 2016 | 3,320,000 | 3,380,600 | ||||
| HRPT Properties Trust, REIT, 6.65%, 2018 | 1,620,000 | 1,673,358 | ||||
| Kimco Realty Corp., REIT, 6%, 2012 | 936,000 | 1,010,550 | ||||
| Simon Property Group, Inc., REIT, 5.875%, 2017 | 1,880,000 | 2,032,590 | ||||
| Vornado Realty Trust, REIT, 4.75%, 2010 | 1,708,000 | 1,724,457 | ||||
| WEA Finance LLC, REIT, 6.75%, 2019 (n) | 837,000 | 930,288 | ||||
| $ | 12,691,995 | |||||
9
Table of Contents
MFS Total Return Series
Portfolio of Investments (unaudited) – continued
| Issuer | Shares/Par | Value ($) | ||||
| BONDS – continued | ||||||
| Retailers – 0.4% | ||||||
| Home Depot, Inc., 5.875%, 2036 | $ | 4,000,000 | $ | 4,100,396 | ||
| Limited Brands, Inc., 5.25%, 2014 | 779,000 | 773,158 | ||||
| Wal-Mart Stores, Inc., 5.25%, 2035 | 5,106,000 | 5,377,665 | ||||
| $ | 10,251,219 | |||||
| Supermarkets – 0.0% | ||||||
| Kroger Co., 5%, 2013 | $ | 1,045,000 | $ | 1,118,512 | ||
| Supranational – 0.1% | ||||||
| Asian Development Bank, 2.75%, 2014 | $ | 2,220,000 | $ | 2,302,122 | ||
| Telecommunications – Wireless – 0.2% | ||||||
| Crown Castle Towers LLC, 6.113%, 2040 (n) | $ | 1,605,000 | $ | 1,761,574 | ||
| Rogers Communications, Inc., 6.8%, 2018 | 3,340,000 | 3,948,234 | ||||
| $ | 5,709,808 | |||||
| Tobacco – 0.1% | ||||||
| Philip Morris International, Inc., 4.875%, 2013 | $ | 1,823,000 | $ | 1,971,627 | ||
| Transportation – Services – 0.1% | ||||||
| Erac USA Finance Co., 7%, 2037 (n) | $ | 2,572,000 | $ | 2,802,706 | ||
| U.S. Government Agencies and Equivalents – 0.9% | ||||||
| Freddie Mac, 4.625%, 2012 | $ | 13,500,000 | $ | 14,666,900 | ||
| Small Business Administration, 4.77%, 2024 | 703,386 | 747,880 | ||||
| Small Business Administration, 5.18%, 2024 | 1,169,401 | 1,251,873 | ||||
| Small Business Administration, 4.99%, 2024 | 1,138,836 | 1,214,641 | ||||
| Small Business Administration, 5.11%, 2025 | 4,708,318 | 5,076,030 | ||||
| $ | 22,957,324 | |||||
| U.S. Treasury Obligations – 13.8% | ||||||
| U.S. Treasury Bonds, 2%, 2013 | $ | 4,762,000 | $ | 4,888,488 | ||
| U.S. Treasury Bonds, 8.5%, 2020 | 4,816,000 | 7,064,470 | ||||
| U.S. Treasury Bonds, 8%, 2021 | 2,560,000 | 3,723,200 | ||||
| U.S. Treasury Bonds, 6%, 2026 | 2,840,000 | 3,659,607 | ||||
| U.S. Treasury Bonds, 6.75%, 2026 | 2,129,000 | 2,955,650 | ||||
| U.S. Treasury Bonds, 5.25%, 2029 | 7,300,000 | 8,785,097 | ||||
| U.S. Treasury Bonds, 5.375%, 2031 | 8,423,000 | 10,362,918 | ||||
| U.S. Treasury Bonds, 4.5%, 2036 | 3,417,000 | 3,774,719 | ||||
| U.S. Treasury Bonds, 5%, 2037 | 6,508,000 | 7,756,723 | ||||
| U.S. Treasury Bonds, 4.5%, 2039 | 12,605,900 | 13,884,214 | ||||
| U.S. Treasury Notes, 2.375%, 2010 | 23,626,000 | 23,711,833 | ||||
| U.S. Treasury Notes, 1.5%, 2010 | 1,514,000 | 1,520,506 | ||||
| U.S. Treasury Notes, 0.875%, 2011 | 25,197,000 | 25,294,437 | ||||
| U.S. Treasury Notes, 5.125%, 2011 | 23,128,000 | 24,216,635 | ||||
| U.S. Treasury Notes, 1.375%, 2012 | 14,232,400 | 14,426,985 | ||||
| U.S. Treasury Notes, 1.375%, 2013 | 15,539,000 | 15,747,813 | ||||
| U.S. Treasury Notes, 3.5%, 2013 | 8,400,000 | 9,026,716 | ||||
| U.S. Treasury Notes, 3.125%, 2013 | 16,178,000 | 17,224,522 | ||||
| U.S. Treasury Notes, 2.75%, 2013 | 36,007,000 | 37,894,559 | ||||
| U.S. Treasury Notes, 1.5%, 2013 | 6,564,000 | 6,619,387 | ||||
| Issuer | Shares/Par | Value ($) | ||||
| BONDS – continued | ||||||
| U.S. Treasury Obligations – continued | ||||||
| U.S. Treasury Notes, 1.875%, 2014 | $ | 28,754,000 | $ | 29,272,923 | ||
| U.S. Treasury Notes, 4.125%, 2015 | 6,910,000 | 7,677,121 | ||||
| U.S. Treasury Notes, 9.875%, 2015 | 2,793,000 | 3,926,346 | ||||
| U.S. Treasury Notes, 2.625%, 2016 | 1,737,000 | 1,787,074 | ||||
| U.S. Treasury Notes, 4.875%, 2016 | 6,300,000 | 7,292,250 | ||||
| U.S. Treasury Notes, 3.75%, 2018 | 66,982,000 | 72,173,105 | ||||
| $ | 364,667,298 | |||||
| Utilities – Electric Power – 0.8% | ||||||
| Bruce Mansfield Unit, 6.85%, 2034 | $ | 4,894,739 | $ | 5,113,332 | ||
| EDP Finance B.V., 6%, 2018 (n) | 2,259,000 | 2,224,810 | ||||
| Enel Finance International S.A., 6.25%, 2017 (n) | 2,306,000 | 2,499,409 | ||||
| MidAmerican Funding LLC, 6.927%, 2029 | 387,000 | 456,552 | ||||
| Oncor Electric Delivery Co., 7%, 2022 | 3,162,000 | 3,811,927 | ||||
| PSEG Power LLC, 6.95%, 2012 | 3,745,000 | 4,091,454 | ||||
| PSEG Power LLC, 5.32%, 2016 (n) | 1,603,000 | 1,727,505 | ||||
| System Energy Resources, Inc., 5.129%, 2014 (z) | 604,814 | 617,418 | ||||
| Waterford 3 Funding Corp., 8.09%, 2017 | 173,716 | 180,765 | ||||
| $ | 20,723,172 | |||||
| Total Bonds (Identified Cost, $1,086,074,484) | $ | 1,138,498,757 | ||||
| CONVERTIBLE PREFERRED STOCKS – 0.1% | ||||||
| Utilities – Electric Power – 0.1% | ||||||
| PPL Corp., 9.5% (Identified Cost, $1,283,500) | 25,670 | $ | 1,334,979 | |||
| MONEY MARKET FUNDS (v) – 1.0% | ||||||
| MFS Institutional Money Market Portfolio, 0.22%, at Cost and Net Asset Value | 27,005,781 | $ | 27,005,781 | |||
| Total Investments (Identified Cost, $2,685,631,380) | $ | 2,635,614,071 | ||||
| OTHER ASSETS, LESS LIABILITIES – 0.1% | 1,884,101 | |||||
| Net Assets – 100.0% | $ | 2,637,498,172 | ||||
10
Table of Contents
MFS Total Return Series
Portfolio of Investments (unaudited) – continued
| (a) | Non-income producing security. |
| (i) | Interest only security for which the fund receives interest on notional principal (Par amount). Par amount shown is the notional principal and does not reflect the cost of the security. |
| (n) | Securities exempt from registration under Rule 144A of the Securities Act of 1933. These securities may be sold in the ordinary course of business in transactions exempt from registration, normally to qualified institutional buyers. At period end, the aggregate value of these securities was $79,115,690, representing 3% of net assets. |
| (v) | Underlying fund that is available only to investment companies managed by MFS. The rate quoted is the annualized seven-day yield of the fund at period end. |
| (z) | Restricted securities are not registered under the Securities Act of 1933 and are subject to legal restrictions on resale. These securities generally may be resold in transactions exempt from registration or to the public if the securities are subsequently registered. Disposal of these securities may involve time-consuming negotiations and prompt sale at an acceptable price may be difficult. The fund holds the following restricted securities: |
| Restricted Securities | Acquisition Date | Cost | Current Market Value | |||
| Anthracite Ltd., “A”, CDO, FRN, 0.797%, 2017 | 3/19/10 | $2,831,809 | $2,838,992 | |||
| Bayview Financial Revolving Mortgage Loan Trust, FRN, 1.947%, 2040 | 3/01/06 | 2,326,311 | 957,975 | |||
| Russia Foreign Bond, 3.625%, 2015 | 4/22/10 | 4,973,750 | 4,837,500 | |||
| Spirit Master Funding LLC, 5.05%, 2023 | 10/04/05 | 2,063,590 | 1,819,270 | |||
| System Energy Resources, Inc., 5.129%, 2014 | 4/16/04-11/22/04 | 606,049 | 617,418 | |||
| Total Restricted Securities | $11,071,155 | |||||
| % of Net Assets | 0.4% |
The following abbreviations are used in this report and are defined:
| ADR | American Depository Receipt |
| CDO | Collateralized Debt Obligation |
| FRN | Floating Rate Note. Interest rate resets periodically and may not be the rate reported at period end. |
| PLC | Public Limited Company |
| REIT | Real Estate Investment Trust |
See Notes to Financial Statements
11
Table of Contents
MFS Total Return Series
FINANCIAL STATEMENTS | STATEMENT OF ASSETS AND LIABILITIES (unaudited)
This statement represents your fund’s balance sheet, which details the assets and liabilities comprising the total value of the fund.
At 6/30/10 | |||||
Assets | |||||
Investments – | |||||
Non-affiliated issuers, at value (identified cost, $2,658,625,599) | $2,608,608,290 | ||||
Underlying funds, at cost and value | 27,005,781 | ||||
Total investments, at value (identified cost, $2,685,631,380) | $2,635,614,071 | ||||
Cash | 14,705 | ||||
Receivables for | |||||
Investments sold | 3,857,079 | ||||
Fund shares sold | 808,798 | ||||
Interest and dividends | 11,198,641 | ||||
Other assets | 15,370 | ||||
Total assets | $2,651,508,664 | ||||
Liabilities | |||||
Payables for | |||||
Investments purchased | $10,165,803 | ||||
Fund shares reacquired | 3,312,489 | ||||
Payable to affiliates | |||||
Investment adviser | 109,938 | ||||
Shareholder servicing costs | 2,001 | ||||
Distribution and/or service fees | 11,645 | ||||
Administrative services fee | 2,023 | ||||
Payable for independent Trustees’ compensation | 7,555 | ||||
Accrued expenses and other liabilities | 399,038 | ||||
Total liabilities | $14,010,492 | ||||
Net assets | $2,637,498,172 | ||||
Net assets consist of | |||||
Paid-in capital | $3,111,343,830 | ||||
Unrealized appreciation (depreciation) on investments and translation of assets and liabilities in foreign currencies | (49,987,297 | ) | |||
Accumulated net realized gain (loss) on investments and foreign currency transactions | (456,126,986 | ) | |||
Undistributed net investment income | 32,268,625 | ||||
Net assets | $2,637,498,172 | ||||
Shares of beneficial interest outstanding | 159,551,873 |
| Net assets | Shares outstanding | Net asset value per share | ||||
Initial Class | $1,798,688,120 | 108,437,314 | $16.59 | |||
Service Class | 838,810,052 | 51,114,559 | 16.41 |
See Notes to Financial Statements
12
Table of Contents
MFS Total Return Series
FINANCIAL STATEMENTS | STATEMENT OF OPERATIONS (unaudited)
This statement describes how much your fund earned in investment income and accrued in expenses. It also describes any gains and/or losses generated by fund operations.
Six months ended 6/30/10 | ||||||
Net investment income | ||||||
Income | ||||||
Interest | $25,346,380 | |||||
Dividends | 19,621,958 | |||||
Dividends from underlying funds | 27,406 | |||||
Foreign taxes withheld | (306,211 | ) | ||||
Total investment income | $44,689,533 | |||||
Expenses | ||||||
Management fee | $10,513,442 | |||||
Distribution and/or service fees | 1,095,265 | |||||
Shareholder servicing costs | 168,543 | |||||
Administrative services fee | 204,231 | |||||
Independent Trustees’ compensation | 31,048 | |||||
Custodian fee | 121,107 | |||||
Shareholder communications | 164,730 | |||||
Auditing fees | 30,392 | |||||
Legal fees | 30,934 | |||||
Miscellaneous | 66,267 | |||||
Total expenses | $12,425,959 | |||||
Reduction of expenses by investment adviser | (9,191 | ) | ||||
Net expenses | $12,416,768 | |||||
Net investment income | $32,272,765 | |||||
Realized and unrealized gain (loss) on investments and foreign currency transactions | ||||||
Realized gain (loss) (identified cost basis) | ||||||
Investment transactions | $31,780,615 | |||||
Foreign currency transactions | (86,436 | ) | ||||
Net realized gain (loss) on investments and foreign currency transactions | $31,694,179 | |||||
Change in unrealized appreciation (depreciation) | ||||||
Investments | $(132,186,815 | ) | ||||
Translation of assets and liabilities in foreign currencies | 29,662 | |||||
Net unrealized gain (loss) on investments and foreign currency translation | $(132,157,153 | ) | ||||
Net realized and unrealized gain (loss) on investments and foreign currency | $(100,462,974 | ) | ||||
Change in net assets from operations | $(68,190,209 | ) |
See Notes to Financial Statements
13
Table of Contents
MFS Total Return Series
FINANCIAL STATEMENTS | STATEMENTS OF CHANGES IN NET ASSETS
These statements describe the increases and/or decreases in net assets resulting from operations, any distributions, and any shareholder transactions.
| Six months ended 6/30/10 (unaudited | ) | Year ended 12/31/09 | | |||
Change in net assets | ||||||
| From operations | ||||||
Net investment income | $32,272,765 | $71,669,102 | ||||
Net realized gain (loss) on investments and foreign currency transactions | 31,694,179 | (3,349,520 | ) | |||
Net unrealized gain (loss) on investments and foreign currency translation | (132,157,153 | ) | 362,251,393 | |||
Change in net assets from operations | $(68,190,209 | ) | $430,570,975 | |||
| Distributions declared to shareholders | ||||||
From net investment income | $(75,285,859 | ) | $(97,769,214 | ) | ||
Change in net assets from fund share transactions | $(58,716,868 | ) | $(198,909,992 | ) | ||
Total change in net assets | $(202,192,936 | ) | $133,891,769 | |||
| Net assets | ||||||
At beginning of period | 2,839,691,108 | 2,705,799,339 | ||||
At end of period (including undistributed net investment income of $32,268,625 and | $2,637,498,172 | $2,839,691,108 |
See Notes to Financial Statements
14
Table of Contents
MFS Total Return Series
FINANCIAL STATEMENTS | FINANCIAL HIGHLIGHTS
The financial highlights table is intended to help you understand the fund’s financial performance for the semiannual period and the past 5 fiscal years. Certain information reflects financial results for a single fund share. The total returns in the table represent the rate by which an investor would have earned (or lost) on an investment in the fund share class (assuming reinvestment of all distributions) held for the entire period.
| Initial Class | Six months ended 6/30/10 | Years ended 12/31 | ||||||||||||||||
| 2009 | 2008 | 2007 | 2006 | 2005 | ||||||||||||||
| (unaudited) | ||||||||||||||||||
Net asset value, beginning of period | $17.48 | $15.42 | $21.68 | $21.90 | $20.69 | $21.43 | ||||||||||||
| Income (loss) from investment operations | ||||||||||||||||||
Net investment income (d) | $0.21 | $0.44 | $0.52 | $0.56 | $0.56 | $0.48 | ||||||||||||
Net realized and unrealized gain (loss) on investments and foreign currency | (0.61 | ) | 2.20 | (4.97 | ) | 0.34 | 1.81 | 0.06 | ||||||||||
Total from investment operations | $(0.40 | ) | $2.64 | $(4.45 | ) | $0.90 | $2.37 | $0.54 | ||||||||||
| Less distributions declared to shareholders | ||||||||||||||||||
From net investment income | $(0.49 | ) | $(0.58 | ) | $(0.61 | ) | $(0.57 | ) | $(0.50 | ) | $(0.43 | ) | ||||||
From net realized gain on investments | — | — | (1.20 | ) | (0.55 | ) | (0.66 | ) | (0.85 | ) | ||||||||
Total distributions declared to shareholders | $(0.49 | ) | $(0.58 | ) | $(1.81 | ) | $(1.12 | ) | $(1.16 | ) | $(1.28 | ) | ||||||
Net asset value, end of period | $16.59 | $17.48 | $15.42 | $21.68 | $21.90 | $20.69 | ||||||||||||
Total return (%) (k)(r)(s) | (2.53 | )(n) | 18.03 | (22.13 | ) | 4.17 | 11.95 | 2.82 | ||||||||||
| Ratios (%) (to average net assets) and Supplemental data: | ||||||||||||||||||
Expenses before expense reductions (f) | 0.81 | (a) | 0.82 | 0.82 | 0.83 | 0.85 | 0.84 | |||||||||||
Expenses after expense reductions (f) | 0.81 | (a) | 0.82 | 0.80 | 0.80 | 0.83 | 0.84 | |||||||||||
Net investment income | 2.38 | (a) | 2.80 | 2.80 | 2.55 | 2.68 | 2.32 | |||||||||||
Portfolio turnover | 12 | 43 | 55 | 60 | 51 | 46 | ||||||||||||
Net assets at end of period (000 omitted) | $1,798,688 | $1,967,226 | $1,901,307 | $2,887,256 | $2,859,830 | $2,572,096 | ||||||||||||
See Notes to Financial Statements
15
Table of Contents
MFS Total Return Series
Financial Highlights – continued
| Service Class | Six months ended 6/30/10 | Years ended 12/31 | ||||||||||||||||
| 2009 | 2008 | 2007 | 2006 | 2005 | ||||||||||||||
| (unaudited) | ||||||||||||||||||
Net asset value, beginning of period | $17.28 | $15.24 | $21.44 | $21.67 | $20.50 | $21.25 | ||||||||||||
| Income (loss) from investment operations | ||||||||||||||||||
Net investment income (d) | $0.18 | $0.39 | $0.46 | $0.50 | $0.50 | $0.42 | ||||||||||||
Net realized and unrealized gain (loss) on investments and foreign currency | (0.60 | ) | 2.18 | (4.91 | ) | 0.34 | 1.78 | 0.07 | ||||||||||
Total from investment operations | $(0.42 | ) | $2.57 | $(4.45 | ) | $0.84 | $2.28 | $0.49 | ||||||||||
| Less distributions declared to shareholders | ||||||||||||||||||
From net investment income | $(0.45 | ) | $(0.53 | ) | $(0.55 | ) | $(0.52 | ) | $(0.45 | ) | $(0.39 | ) | ||||||
From net realized gain on investments | — | — | (1.20 | ) | (0.55 | ) | (0.66 | ) | (0.85 | ) | ||||||||
Total distributions declared to shareholders | $(0.45 | ) | $(0.53 | ) | $(1.75 | ) | $(1.07 | ) | $(1.11 | ) | $(1.24 | ) | ||||||
Net asset value, end of period | $16.41 | $17.28 | $15.24 | $21.44 | $21.67 | $20.50 | ||||||||||||
Total return (%) (k)(r)(s) | (2.65 | )(n) | 17.72 | (22.32 | ) | 3.94 | 11.62 | 2.60 | ||||||||||
| Ratios (%) (to average net assets) and Supplemental data: | ||||||||||||||||||
Expenses before expense reductions (f) | 1.06 | (a) | 1.07 | 1.07 | 1.08 | 1.10 | 1.09 | |||||||||||
Expenses after expense reductions (f) | 1.06 | (a) | 1.07 | 1.05 | 1.05 | 1.09 | 1.09 | |||||||||||
Net investment income | 2.13 | (a) | 2.54 | 2.55 | 2.30 | 2.44 | 2.08 | |||||||||||
Portfolio turnover | 12 | 43 | 55 | 60 | 51 | 46 | ||||||||||||
Net assets at end of period (000 omitted) | $838,810 | $872,466 | $804,493 | $1,113,209 | $1,070,518 | $865,499 | ||||||||||||
| (a) | Annualized. |
| (d) | Per share data is based on average shares outstanding. |
| (f) | Ratios do not reflect reductions from fees paid indirectly, if applicable. |
| (k) | The total return does not reflect expenses that apply to separate accounts. Inclusion of these charges would reduce the total return figures for all periods shown. |
| (n) | Not annualized. |
| (r) | Certain expenses have been reduced without which performance would have been lower. |
| (s) | From time to time the fund may receive proceeds from litigation settlements, without which performance would be lower. |
See Notes to Financial Statements
16
Table of Contents
MFS Total Return Series
NOTES TO FINANCIAL STATEMENTS (unaudited)
| (1) | Business and Organization |
MFS Total Return Series (the fund) is a series of MFS Variable Insurance Trust (the trust). The trust is organized as a Massachusetts business trust and is registered under the Investment Company Act of 1940, as amended, as an open-end management investment company. The shareholders of each series of the trust are separate accounts of insurance companies, which offer variable annuity and/or life insurance products, and qualified retirement and pension plans.
| (2) | Significant Accounting Policies |
General – The preparation of financial statements in conformity with U.S. generally accepted accounting principles requires management to make estimates and assumptions that affect the reported amounts of assets and liabilities, and disclosure of contingent assets and liabilities at the date of the financial statements and the reported amounts of revenues and expenses during the reporting period. Actual results could differ from those estimates. In the preparation of these financial statements, management has evaluated subsequent events occurring after the date of the fund’s Statement of Assets and Liabilities through the date that the financial statements were issued. The fund may invest a significant portion of its assets in asset-backed and/or mortgage-backed securities. The value of these securities may depend, in part, on the issuer’s or borrower’s credit quality or ability to pay principal and interest when due and may fall if an issuer or borrower defaults on its obligation to pay principal or interest or if the instrument’s credit rating is downgraded by a credit rating agency. U.S. Government securities not supported as to the payment of principal or interest by the U.S. Treasury, such as those issued by Fannie Mae, Freddie Mac, and the Federal Home Loan Banks, are subject to greater credit risk than are U.S. Government securities supported by the U.S. Treasury, such as those issued by Ginnie Mae. The fund can invest in foreign securities, including securities of emerging market issuers. Investments in foreign securities are vulnerable to the effects of changes in the relative values of the local currency and the U.S. dollar and to the effects of changes in each country’s legal, political, and economic environment. The markets of emerging markets countries are generally more volatile than the markets of developed countries with more mature economies. All of the risks of investing in foreign securities previously described are heightened when investing in emerging markets countries.
Investment Valuations – Equity securities, including restricted equity securities, are generally valued at the last sale or official closing price as provided by a third-party pricing service on the market or exchange on which they are primarily traded. Equity securities, for which there were no sales reported that day, are generally valued at the last quoted daily bid quotation as provided by a third-party pricing service on the market or exchange on which such securities are primarily traded. Equity securities held short, for which there were no sales reported for that day, are generally valued at the last quoted daily ask quotation as provided by a third-party pricing service on the market or exchange on which such securities are primarily traded. Debt instruments and floating rate loans (other than short-term instruments), including restricted debt instruments, are generally valued at an evaluated or composite bid as provided by a third-party pricing service. Short-term instruments with a maturity at issuance of 60 days or less generally are valued at amortized cost, which approximates market value. Open-end investment companies are generally valued at net asset value per share. Securities and other assets generally valued on the basis of information from a third-party pricing service may also be valued at a broker/dealer bid quotation. Values obtained from third-party pricing services can utilize both transaction data and market information such as yield, quality, coupon rate, maturity, type of issue, trading characteristics, and other market data. The values of foreign securities and other assets and liabilities expressed in foreign currencies are converted to U.S. dollars using the mean of bid and asked prices for rates provided by a third-party pricing service.
The Board of Trustees has delegated primary responsibility for determining or causing to be determined the value of the fund’s investments (including any fair valuation) to the adviser pursuant to valuation policies and procedures approved by the Board. If the adviser determines that reliable market quotations are not readily available, investments are valued at fair value as determined in good faith by the adviser in accordance with such procedures under the oversight of the Board of Trustees. Under the fund’s valuation policies and procedures, market quotations are not considered to be readily available for most types of debt instruments and floating rate loans and many types of derivatives. These investments are generally valued at fair value based on information from third-party pricing services. In addition, investments may be valued at fair value if the adviser determines that an investment’s value has been materially affected by events occurring after the close of the exchange or market on which the investment is principally traded (such as foreign exchange or market) and prior to the determination of the fund’s net asset value, or after the halting of trading of a specific security where trading does not resume prior to the close of the exchange or market on which the security is principally traded. Events that occur on a frequent basis after foreign markets close (such as developments in foreign markets and significant movements in the U.S. markets) and prior to the determination of the fund’s net asset value may be deemed to have a material effect on the value of securities traded in foreign markets. Accordingly, the fund’s foreign equity securities may often be valued at fair value. The adviser generally relies on third-party pricing services or other information (such as the correlation with price movements of similar securities in the same
17
Table of Contents
MFS Total Return Series
Notes to Financial Statements (unaudited) – continued
or other markets; the type, cost and investment characteristics of the security; the business and financial condition of the issuer; and trading and other market data) to assist in determining whether to fair value and at what value to fair value an investment. The value of an investment for purposes of calculating the fund’s net asset value can differ depending on the source and method used to determine value. When fair valuation is used, the value of an investment used to determine the fund’s net asset value may differ from quoted or published prices for the same investment. There can be no assurance that the fund could obtain the fair value assigned to an investment if it were to sell the investment at the same time at which the fund determines its net asset value per share.
Various inputs are used in determining the value of the fund’s assets or liabilities. These inputs are categorized into three broad levels. In certain cases, the inputs used to measure fair value may fall into different levels of the fair value hierarchy. In such cases, an investment’s level within the fair value hierarchy is based on the lowest level of input that is significant to the fair value measurement. The fund’s assessment of the significance of a particular input to the fair value measurement in its entirety requires judgment, and considers factors specific to the investment. Level 1 includes unadjusted quoted prices in active markets for identical assets or liabilities. Level 2 includes other significant observable market-based inputs (including quoted prices for similar securities, interest rates, prepayment speed, and credit risk). Level 3 includes unobservable inputs, which may include the adviser’s own assumptions in determining the fair value of investments. Other financial instruments are derivative instruments not reflected in total investments, such as futures, forwards, swap contracts, and written options. The following is a summary of the levels used as of June 30, 2010 in valuing the fund’s assets or liabilities:
| Investments at Value | Level 1 | Level 2 | Level 3 | Total | ||||
| Equity Securities: | ||||||||
United States | $1,359,722,790 | $1,334,978 | $— | $1,361,057,768 | ||||
United Kingdom | — | 40,219,542 | — | 40,219,542 | ||||
Switzerland | — | 29,224,167 | — | 29,224,167 | ||||
France | 19,537,589 | 3,931,986 | — | 23,469,575 | ||||
Germany | — | 8,694,296 | — | 8,694,296 | ||||
Canada | 3,836,427 | — | — | 3,836,427 | ||||
Netherlands | — | 3,607,758 | — | 3,607,758 | ||||
| U.S. Treasury Bonds & U.S. Government Agency & Equivalents | — | 388,706,274 | — | 388,706,274 | ||||
| Non-U.S. Sovereign Debt | — | 32,284,324 | — | 32,284,324 | ||||
| Municipal Bonds | — | 9,539,801 | — | 9,539,801 | ||||
| Corporate Bonds | — | 193,183,603 | — | 193,183,603 | ||||
| Residential Mortgage-Backed Securities | — | 394,202,792 | — | 394,202,792 | ||||
| Commercial Mortgage-Backed Securities | — | 41,398,769 | — | 41,398,769 | ||||
| Asset-Backed Securities (including CDOs) | — | 12,611,307 | — | 12,611,307 | ||||
| Foreign Bonds | — | 66,571,887 | — | 66,571,887 | ||||
| Mutual Funds | 27,005,781 | — | — | 27,005,781 | ||||
| Total Investments | $1,410,102,587 | $1,225,511,484 | $— | $2,635,614,071 |
For further information regarding security characteristics, see the Portfolio of Investments.
Foreign Currency Translation – Purchases and sales of foreign investments, income, and expenses are converted into U.S. dollars based upon currency exchange rates prevailing on the respective dates of such transactions or on the reporting date for foreign denominated receivables and payables. Gains and losses attributable to foreign currency exchange rates on sales of securities are recorded for financial statement purposes as net realized gains and losses on investments. Gains and losses attributable to foreign exchange rate movements on receivables, payables, income and expenses are recorded for financial statement purposes as foreign currency transaction gains and losses. That portion of both realized and unrealized gains and losses on investments that results from fluctuations in foreign currency exchange rates is not separately disclosed.
Derivatives – The fund may use derivatives for different purposes, including to earn income and enhance returns, to increase or decrease exposure to a particular market, to manage or adjust the risk profile of the fund, or as alternatives to direct investments. Derivatives may be used for hedging or non-hedging purposes. While hedging can reduce or eliminate losses, it can also reduce or eliminate gains. When the fund uses derivatives as an investment to increase market exposure, or for hedging purposes, gains and losses from derivative instruments may be substantially greater than the derivative’s original cost.
Derivative instruments include written options, purchased options, futures contracts, forward foreign currency exchange contracts, and swap agreements. For the six months ended June 30, 2010, the fund did not invest in any derivative instruments.
18
Table of Contents
MFS Total Return Series
Notes to Financial Statements (unaudited) – continued
Security Loans – State Street Bank and Trust Company (“State Street”), as lending agent, may loan the securities of the fund to certain qualified institutions (the “Borrowers”) approved by the fund. The loans are collateralized by cash and/or U.S. Treasury and federal agency obligations in an amount typically at least equal to the market value of the securities loaned. The market value of the loaned securities is determined at the close of business of the fund and any additional required collateral is delivered to the fund on the next business day. State Street provides the fund with indemnification against Borrower default. The fund bears the risk of loss with respect to the investment of cash collateral. On loans collateralized by cash, the cash collateral is invested in a money market fund or short-term securities. A portion of the income generated upon investment of the collateral is remitted to the Borrowers, and the remainder is allocated between the fund and the lending agent. On loans collateralized by U.S. Treasury and/or federal agency obligations, a fee is received from the Borrower, and is allocated between the fund and the lending agent. Income from securities lending is included in interest income on the Statement of Operations. The dividend and interest income earned on the securities loaned is accounted for in the same manner as other dividend and interest income.
Indemnifications – Under the fund’s organizational documents, its officers and Trustees may be indemnified against certain liabilities and expenses arising out of the performance of their duties to the fund. Additionally, in the normal course of business, the fund enters into agreements with service providers that may contain indemnification clauses. The fund’s maximum exposure under these agreements is unknown as this would involve future claims that may be made against the fund that have not yet occurred.
Investment Transactions and Income – Investment transactions are recorded on the trade date. Interest income is recorded on the accrual basis. All premium and discount is amortized or accreted for financial statement purposes in accordance with U.S. generally accepted accounting principles. Dividends received in cash are recorded on the ex-dividend date. Certain dividends from foreign securities will be recorded when the fund is informed of the dividend if such information is obtained subsequent to the ex-dividend date. Dividend and interest payments received in additional securities are recorded on the ex-dividend or ex-interest date in an amount equal to the value of the security on such date.
The fund may receive proceeds from litigation settlements. Any proceeds received from litigation involving portfolio holdings are reflected in the Statement of Operations in realized gain/loss if the security has been disposed of by the fund or in unrealized gain/loss if the security is still held by the fund. Any other proceeds from litigation not related to portfolio holdings are reflected as other income in the Statement of Operations.
Fees Paid Indirectly – The fund’s custody fee may be reduced according to an arrangement that measures the value of cash deposited with the custodian by the fund. For the six months ended June 30, 2010, custody fees were not reduced
Tax Matters and Distributions – The fund intends to qualify as a regulated investment company, as defined under Subchapter M of the Internal Revenue Code, and to distribute all of its taxable income, including realized capital gains. As a result, no provision for federal income tax is required. The fund’s federal tax returns for the prior three fiscal years remain subject to examination by the Internal Revenue Service. Foreign taxes, if any, have been accrued by the fund in the accompanying financial statements.
Distributions to shareholders are recorded on the ex-dividend date. Income and capital gain distributions are determined in accordance with income tax regulations, which may differ from U.S. generally accepted accounting principles. Certain capital accounts in the financial statements are periodically adjusted for permanent differences in order to reflect their tax character. These adjustments have no impact on net assets or net asset value per share. Temporary differences which arise from recognizing certain items of income, expense, gain or loss in different periods for financial statement and tax purposes will reverse at some time in the future. Distributions in excess of net investment income or net realized gains are temporary overdistributions for financial statement purposes resulting from differences in the recognition or classification of income or distributions for financial statement and tax purposes.
Book/tax differences primarily relate to amortization and accretion of debt securities and wash sale loss deferrals.
The tax character of distributions made during the current period, if any, will be determined at fiscal year end. The tax character of distributions declared to shareholders for the last fiscal year is as follows:
| 12/31/09 | ||
| Ordinary income (including any short-term capital gains) | $97,769,214 |
19
Table of Contents
MFS Total Return Series
Notes to Financial Statements (unaudited) – continued
The federal tax cost and the tax basis components of distributable earnings were as follows:
| As of 6/30/10 | |||
| Cost of investments | $2,733,374,906 | ||
| Gross appreciation | 82,785,746 | ||
| Gross depreciation | (180,546,581 | ) | |
| Net unrealized appreciation (depreciation) | $(97,760,835 | ) | |
| As of 12/31/09 | |||
| Undistributed ordinary income | 75,281,719 | ||
| Capital loss carryforwards | (440,417,692 | ) | |
| Other temporary differences | 350 | ||
| Net unrealized appreciation (depreciation) | 34,766,033 | ||
As of December 31, 2009, the fund had capital loss carryforwards available to offset future realized gains. Such losses expire as follows:
| 12/31/16 | $(379,511,832 | ) | |
| 12/31/17 | (60,905,860 | ) | |
| $(440,417,692 | ) |
Multiple Classes of Shares of Beneficial Interest – The fund offers multiple classes of shares, which differ in their respective distribution and/or service fees. The fund’s income, realized and unrealized gain (loss), and common expenses are allocated to shareholders based on the daily net assets of each class. Dividends are declared separately for each class. Differences in per share dividend rates are generally due to differences in separate class expenses. The fund’s distributions declared to shareholders as reported on the Statements of Changes in Net Assets are presented by class as follows:
| From net investment income | ||||
| Six months ended 6/30/10 | Year ended 12/31/09 | |||
| Initial Class | $52,744,422 | $69,761,189 | ||
| Service Class | 22,541,437 | 28,008,025 | ||
| Total | $75,285,859 | $97,769,214 | ||
| (3) | Transactions with Affiliates |
Investment Adviser – The fund has an investment advisory agreement with MFS to provide overall investment management and related administrative services and facilities to the fund. The management fee is computed daily and paid monthly at the following annual rates:
| First $3 billion of average daily net assets | 0.75% | |
| Next $2 billion of average daily net assets | 0.65% | |
| Average daily net assets in excess of $5 billion | 0.50% |
The management fee incurred for the six months ended June 30, 2010 was equivalent to an annual effective rate of 0.75% of the fund’s average daily net assets.
Effective May 1, 2011, the investment adviser has agreed in writing to reduce its management fee to 0.70% of average daily net assets in excess of $1 billion up to $2.5 billion, and 0.65% of average daily net assets in excess of $2.5 billion up to $3 billion. This written agreement will continue until modified by the fund’s Board of Trustees, but such agreement will continue at least until April 30, 2012.
Distributor – MFS Fund Distributors, Inc. (MFD), a wholly-owned subsidiary of MFS, is the distributor of shares of the fund. The Trustees have adopted a distribution plan for the Service Class shares pursuant to Rule 12b-1 under the Investment Company Act of 1940.
The fund’s distribution plan provides that the fund will pay MFD distribution and/or service fees equal to 0.25% per annum of its average daily net assets attributable to Service Class shares as partial consideration for services performed and expenses incurred by MFD and financial intermediaries (including participating insurance companies that invest in the fund to fund variable annuity and variable life insurance contracts, sponsors of qualified retirement and pension plans that invest in the fund, and affiliates of these participating insurance companies and plan sponsors) in connection with the sale and distribution of the Service Class shares. MFD may subsequently pay all, or a portion, of the distribution and/or service fees to financial intermediaries.
20
Table of Contents
MFS Total Return Series
Notes to Financial Statements (unaudited) – continued
Shareholder Servicing Agent – MFS Service Center, Inc. (MFSC), a wholly-owned subsidiary of MFS, receives a fee from the fund for its services as shareholder servicing agent. For the six months ended June 30, 2010, the fee was $167,505, which equated to 0.0120% annually of the fund’s average daily net assets. MFSC also receives payment from the fund for out-of-pocket expenses paid by MFSC on behalf of the fund. For the six months ended June 30, 2010, these costs amounted to $1,038.
Administrator – MFS provides certain financial, legal, shareholder communications, compliance, and other administrative services to the fund. Under an administrative services agreement, the fund partially reimburses MFS the costs incurred to provide these services. The fund is charged an annual fixed amount of $17,500 plus a fee based on average daily net assets. The administrative services fee incurred for the six months ended June 30, 2010 was equivalent to an annual effective rate of 0.0146% of the fund’s average daily net assets.
Trustees’ and Officers’ Compensation – The fund pays compensation to independent Trustees in the form of a retainer, attendance fees, and additional compensation to Board and Committee chairpersons. The fund does not pay compensation directly to Trustees or officers of the fund who are also officers of the investment adviser, all of whom receive remuneration for their services to the fund from MFS. Certain officers and Trustees of the fund are officers or directors of MFS, MFD, and MFSC.
Other – This fund and certain other funds managed by MFS (the funds) have entered into services agreements (the Agreements) which provide for payment of fees by the funds to Tarantino LLC and Griffin Compliance LLC in return for the provision of services of an Independent Chief Compliance Officer (ICCO) and Assistant ICCO, respectively, for the funds. The ICCO and Assistant ICCO are officers of the funds and the sole members of Tarantino LLC and Griffin Compliance LLC, respectively. The funds can terminate the Agreements with Tarantino LLC and Griffin Compliance LLC at any time under the terms of the Agreements. For the six months ended June 30, 2010, the aggregate fees paid by the fund to Tarantino LLC and Griffin Compliance LLC were $11,473 and are included in miscellaneous expense on the Statement of Operations. MFS has agreed to reimburse the fund for a portion of the payments made by the fund in the amount of $9,191, which is shown as a reduction of total expenses in the Statement of Operations. Additionally, MFS has agreed to bear all expenses associated with office space, other administrative support, and supplies provided to the ICCO and Assistant ICCO.
The fund may invest in the MFS Institutional Money Market Portfolio which is managed by MFS and seeks a high level of current income consistent with preservation of capital and liquidity. Income earned on this investment is included in dividends from underlying funds on the Statement of Operations. This money market fund does not pay a management fee to MFS.
| (4) | Portfolio Securities |
Purchases and sales of investments, other than purchased option transactions and short-term obligations, were as follows:
| Purchases | Sales | |||
| U.S. Government securities | $77,860,547 | $90,044,107 | ||
| Investments (non-U.S. Government securities) | $249,497,185 | $328,232,515 |
| (5) | Shares of Beneficial Interest |
The fund’s Declaration of Trust permits the Trustees to issue an unlimited number of full and fractional shares of beneficial interest. Transactions in fund shares were as follows:
| Six months ended 6/30/10 | Year ended 12/31/09 | |||||||||||
| Shares | Amount | Shares | Amount | |||||||||
| Shares sold | ||||||||||||
Initial Class | 1,639,719 | $28,897,336 | 3,300,883 | $51,511,873 | ||||||||
Service Class | 4,024,484 | 70,024,326 | 10,587,928 | 163,207,065 | ||||||||
| 5,664,203 | $98,921,662 | 13,888,811 | $214,718,938 | |||||||||
| Shares issued to shareholders in reinvestment of distributions | ||||||||||||
Initial Class | 2,935,137 | $52,744,422 | 4,972,287 | $69,761,189 | ||||||||
Service Class | 1,267,085 | 22,541,437 | 2,014,966 | 28,008,025 | ||||||||
| 4,202,222 | $75,285,859 | 6,987,253 | $97,769,214 | |||||||||
| Shares reacquired | ||||||||||||
Initial Class | (8,672,572 | ) | $(152,218,497 | ) | (19,052,079 | ) | $(292,270,543 | ) | ||||
Service Class | (4,654,886 | ) | (80,705,892 | ) | (14,916,345 | ) | (219,127,601 | ) | ||||
| (13,327,458 | ) | $(232,924,389 | ) | (33,968,424 | ) | $(511,398,144 | ) | |||||
| Net change | ||||||||||||
Initial Class | (4,097,716 | ) | $(70,576,739 | ) | (10,778,909 | ) | $(170,997,481 | ) | ||||
Service Class | 636,683 | 11,859,871 | (2,313,451 | ) | (27,912,511 | ) | ||||||
| (3,461,033 | ) | $(58,716,868 | ) | (13,092,360 | ) | $(198,909,992 | ) | |||||
21
Table of Contents
MFS Total Return Series
Notes to Financial Statements (unaudited) – continued
| (6) | Line of Credit |
The fund and certain other funds managed by MFS participate in a $1.1 billion unsecured committed line of credit, subject to a $1 billion sublimit, provided by a syndication of banks under a credit agreement. Borrowings may be made for temporary financing needs. Interest is charged to each fund, based on its borrowings, generally at a rate equal to the higher of the Federal Reserve funds rate or one month LIBOR plus an agreed upon spread. A commitment fee, based on the average daily, unused portion of the committed line of credit, is allocated among the participating funds at the end of each calendar quarter. In addition, the fund and other funds managed by MFS have established unsecured uncommitted borrowing arrangements with certain banks for temporary financing needs. Interest is charged to each fund, based on its borrowings, at a rate equal to the Federal Reserve funds rate plus an agreed upon spread. For the six months ended June 30, 2010, the fund’s commitment fee and interest expense were $21,323 and $0, respectively, and are included in miscellaneous expense on the Statement of Operations.
| (7) | Transactions in Underlying Funds – Affiliated Issuers |
An affiliated issuer may be considered one in which the fund owns 5% or more of the outstanding voting securities, or a company which is under common control. For the purposes of this report, the fund assumes the following to be affiliated issuers:
| Underlying Funds | Beginning Shares/Par Amount | Acquisitions Shares/Par Amount | Dispositions Shares/Par Amount | Ending Shares/Par Amount | |||||
| MFS International Money Market Portfolio | 26,210,280 | 252,662,451 | (251,866,950 | ) | 27,005,781 | ||||
| Underlying Funds | Realized Gain (Loss) | Capital Gain Distributions | Dividend Income | Ending Value | |||||
| MFS International Money Market Portfolio | $— | $— | $27,406 | $27,005,781 | |||||
22
Table of Contents
MFS Total Return Series
RESULTS OF SHAREHOLDER MEETING (unaudited)
At a special meeting of shareholders of MFS Variable Insurance Trust, which was held on January 28, 2010, the following actions were taken:
Item 1. To elect the following individuals as Trustees:
| Number of Dollars | ||||
| Nominee | For | Withheld Authority | ||
| Robert E. Butler | 6,823,651,821.26 | 1,818,252,669.55 | ||
| Lawrence H. Cohn, M.D. | 6,813,621,200.14 | 1,828,283,290.67 | ||
| Maureen R. Goldfarb | 6,825,332,620.76 | 1,816,571,870.05 | ||
| David H. Gunning | 6,823,081,841.37 | 1,818,822,649.44 | ||
| William R. Gutow | 6,813,678,877.22 | 1,828,225,613.59 | ||
| Michael Hegarty | 6,827,456,515.87 | 1,814,447,974.94 | ||
| John P. Kavanaugh | 6,830,363,113.12 | 1,811,541,377.69 | ||
| Robert J. Manning | 6,825,511,264.17 | 1,816,393,226.64 | ||
| Robert C. Pozen | 6,824,854,120.27 | 1,817,050,370.54 | ||
| J. Dale Sherratt | 6,816,913,203.87 | 1,824,991,286.94 | ||
| Laurie J. Thomsen | 6,823,590,745.56 | 1,818,313,745.25 | ||
| Robert W. Uek | 6,818,161,803.66 | 1,823,742,687.15 | ||
23
Table of Contents
MFS Total Return Series
BOARD REVIEW OF INVESTMENT ADVISORY AGREEMENT
A discussion regarding the Board’s most recent review and renewal of the fund’s Investment Advisory Agreement with MFS will be available on or about November 1, 2010 by clicking on the fund’s name under “Variable Insurance Portfolios — VIT” in the “Products and Performance” section of the MFS Web site (mfs.com).
PROXY VOTING POLICIES AND INFORMATION
A general description of the MFS funds’ proxy voting policies and procedures is available without charge, upon request, by calling
1-800-225-2606, by visiting the Proxy Voting section of mfs.com or by visiting the SEC’s Web site at http://www.sec.gov.
Information regarding how the fund voted proxies relating to portfolio securities during the most recent twelve-month period ended June 30 is available without charge by visiting the Proxy Voting section of mfs.com or by visiting the SEC’s Web site at http://www.sec.gov.
QUARTERLY PORTFOLIO DISCLOSURE
The fund will file a complete schedule of portfolio holdings with the Securities and Exchange Commission (the Commission) for the first and third quarters of each fiscal year on Form N-Q. The fund’s Form N-Q may be reviewed and copied at the:
Public Reference Room
Securities and Exchange Commission
100 F Street, NE, Room 1580
Washington, D.C. 20549
Information on the operation of the Public Reference Room may be obtained by calling the Commission at 1-800-SEC-0330. The fund’s Form N-Q is available on the EDGAR database on the Commission’s Internet Web site at http://www.sec.gov, and copies of this information may be obtained, upon payment of a duplicating fee, by electronic request at the following e-mail address: publicinfo@sec.gov or by writing the Public Reference Section at the above address.
From time to time, MFS may post important information about the fund or the MFS funds on the MFS web site (mfs.com). This information is available by visiting the “News & Commentary” section of mfs.com or by clicking on the fund’s name under “Variable Insurance Portfolios — VIT” in the “Products and Performance” section of mfs.com.
24
Table of Contents

Table of Contents

Table of Contents
This report is prepared for the general information of contract owners. It is authorized for distribution to prospective investors only when preceded or accompanied by a current prospectus.
NOT FDIC INSURED Ÿ MAY LOSE VALUE Ÿ NO BANK GUARANTEE Ÿ NOT A DEPOSIT Ÿ NOT INSURED BY ANY FEDERAL GOVERNMENT AGENCY OR NCUA/NCUSIF
Table of Contents
MFS Research Bond Series

Dear Contract Owners:
After having suffered their biggest declines since the Great Depression, most global markets experienced an impressive resurgence during the latter months of 2009 and the first quarter of 2010. The global economy was able to reap the benefits of two major trends. The first of these was the massive efforts of governments and central banks to increase liquidity in the financial system as they sought to prevent the credit crisis from further affecting the banking system. The second was the move by companies around the world to cut costs and operations to prepare for rapidly changing market conditions. We believe that these moves not only shortened the length of the downturn but also set the stage for recovery.
Even with the significant market gains of 2009 and the early part of 2010, the recovery is unrolling at a moderate pace, with rebounds in the manufacturing sector and corporate America leading the way. Central bankers are proceeding with caution and many have held benchmark interest rates unchanged as they debate the best way to withdraw stimulus measures without disrupting the fragile growth process. Complicating that debate late in the period was the emergence of the European debt crisis and worries about whether this crisis could derail the global recovery. As that crisis unrolled with no clear resolution, risk aversion rose along with volatility. Weakening economic data late in the period added uncertainty to the mix and sparked a retrenchment in global equity markets.
While hurdles remain, we believe that the global economy is proceeding on the road to recovery. As always, we continue to be mindful of the many challenges faced at the individual, national, and international levels. It is at times such as these that we want to remind investors of the merits of maintaining a long-term view, adhering to basic investing principles such as asset allocation and diversification, and working closely with advisors to identify and research investment opportunities. At MFS®, we take particular pride in how well mutual funds can provide a broad range of products that can fit investor needs in any type of market climate.
Respectfully,

Robert J. Manning
Chairman and Chief Executive Officer
MFS Investment Management®
August 16, 2010
The opinions expressed in this letter are subject to change, may not be relied upon for investment advice, and no forecasts can be guaranteed.
MFS Fund Distributors, Inc., 500 Boylston Street, Boston, MA 02116
1
Table of Contents
MFS Research Bond Series
Portfolio structure (i)
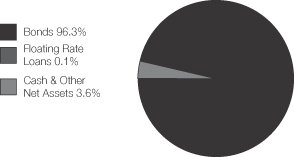
| Fixed income sectors (i) | ||
| High Grade Corporates | 29.4% | |
| U.S. Treasury Securities | 26.9% | |
| Mortgage-Backed Securities | 14.5% | |
| High Yield Corporates | 6.3% | |
| U.S. Government Agencies | 6.2% | |
| Commercial Mortgage-Backed Securities | 5.3% | |
| Emerging Markets Bonds | 2.2% | |
| Municipal Bonds | 1.6% | |
| Non-U.S. Government Bonds | 1.5% | |
| Asset-Backed Securities | 1.3% | |
| Collateralized Debt Obligations | 1.1% | |
| Floating Rate Loans | 0.1% |
| Composition including fixed income credit quality (a)(i) | ||
| AAA | 41.1% | |
| AA | 3.9% | |
| A | 8.0% | |
| BBB | 21.5% | |
| BB | 6.2% | |
| B | 0.7% | |
| CCC (o) | 0.0% | |
| Cash & Other (NR) | 3.7% | |
| U.S. Agency (NR) | 14.9% | |
| Portfolio facts (i) | ||
| Average Duration (d) | 4.3 | |
| Average Effective Maturity (m) | 6.8 yrs. | |
| (a) | The rating categories (e.g., AAA) include debt securities and fixed income structured products which have long-term public ratings. All other assets are not rated (NR). All rated securities are assigned a rating in accordance with the following ratings hierarchy: If a security is rated by Moody’s, then that rating is used; if not rated by Moody’s, then a Standard & Poor’s rating is used; if not rated by S&P, then a Fitch rating is used. Ratings from Moody’s (e.g., Aaa) are shown in the S&P and Fitch scale (e.g., AAA). All ratings are subject to change. |
| The Cash & Other (NR) category includes: cash, other assets less liabilities (including any derivative offsets), short-term securities, and unrated fixed income securities. |
| The U.S. Agency (NR) category includes unrated U.S. agency fixed income securities and collateralized mortgage obligations of U.S. agency mortgage-backed securities. |
| (d) | Duration is a measure of how much a bond’s price is likely to fluctuate with general changes in interest rates, e.g., if rates rise 1.00%, a bond with a 5-year duration is likely to lose about 5.00% of its value. |
| (i) | For purposes of this presentation, the components include the market value of securities, and reflect the impact of the equivalent exposure of derivative positions, if applicable. These amounts may be negative from time to time. The bond component will include any accrued interest amounts. Equivalent exposure is a calculated amount that translates the derivative position into a reasonable approximation of the amount of the underlying asset that the portfolio would have to hold at a given point in time to have the same price sensitivity that results from the portfolio’s ownership of the derivative contract. When dealing with derivatives, equivalent exposure is a more representative measure of the potential impact of a position on portfolio performance than market value. Where the fund holds convertible bonds, these are treated as part of the equity portion of the portfolio. |
| (m) | In determining an instrument’s effective maturity for purposes of calculating the fund’s dollar-weighted average effective maturity, MFS uses the instrument’s stated maturity or, if applicable, an earlier date on which MFS believes it is probable that a maturity-shortening device (such as a put, pre-refunding or prepayment) will cause the instrument to be repaid. Such an earlier date can be substantially shorter than the instrument’s stated maturity. |
| (o) | Less than 0.1%. |
Percentages are based on net assets as of 6/30/10, unless otherwise noted.
The portfolio is actively managed and current holdings may be different.
2
Table of Contents
MFS Research Bond Series
After having suffered through one of the largest and most concentrated downturns since the 1930s, most asset markets staged a remarkable rebound during 2009 and early 2010. This recovery in global activity has been led importantly by emerging Asian economies, but broadening to include most of the global economy to varying degrees. Primary drivers of the recovery included an unwinding of the inventory destocking that took place earlier, the production of manufacturing and capital goods, as well as massive fiscal and monetary stimulus.
Late in the period, though, heightened risk surrounding the public-debt profiles of several of the peripheral European countries impaired market sentiment. At the same time, the improving trend in global macroeconomic data began to weaken somewhat. These two dynamics caused most asset prices to retrench significantly, as many questioned the durability of the global recovery.
3
Table of Contents
MFS Research Bond Series
Fund Expenses Borne by the Contract Holders During the Period,
January 1, 2010 through June 30, 2010
As a contract holder of the fund, you incur ongoing costs, including management fees; distribution and/or service (12b-1) fees; and other fund expenses. This example is intended to help you understand your ongoing costs (in dollars) of investing in the fund and to compare these costs with the ongoing costs of investing in other mutual funds.
The example is based on an investment of $1,000 invested at the beginning of the period and held for the entire period January 1, 2010 through June 30, 2010.
Actual Expenses
The first line for each share class in the following table provides information about actual account values and actual expenses. You may use the information in this line, together with the amount you invested, to estimate the expenses that you paid over the period. Simply divide your account value by $1,000 (for example, an $8,600 account value divided by $1,000 = 8.6), then multiply the result by the number in the first line under the heading entitled “Expenses Paid During Period” to estimate the expenses you paid on your account during this period.
Hypothetical Example for Comparison Purposes
The second line for each share class in the following table provides information about hypothetical account values and hypothetical expenses based on the fund’s actual expense ratio and an assumed rate of return of 5% per year before expenses, which is not the fund’s actual return. The hypothetical account values and expenses may not be used to estimate the actual ending account balance or expenses you paid for the period. You may use this information to compare the ongoing costs of investing in the fund and other funds. To do so, compare this 5% hypothetical example with the 5% hypothetical examples that appear in the shareholder reports of the other funds.
Please note that the expenses shown in the table are meant to highlight the fund’s ongoing costs only and do not take into account the fees and expenses imposed under the variable contracts through which your investment in the fund is made. Therefore, the second line for each share class in the table is useful in comparing ongoing costs associated with an investment in vehicles (such as the fund) which fund benefits under variable annuity and variable life insurance contracts and to qualified pension and retirement plans only, and will not help you determine the relative total costs of investing in the fund through variable annuity and variable life insurance contracts. If the fees and expenses imposed under the variable contracts were included, your costs would have been higher.
| Share Class | Annualized Expense Ratio | Beginning Account Value 1/01/10 | Ending Account Value | Expenses Paid During Period (p) 1/01/10-6/30/10 | ||||||
| Initial Class | Actual | 0.59% | $1,000.00 | $1,049.19 | $3.00 | |||||
| Hypothetical (h) | 0.59% | $1,000.00 | $1,021.87 | $2.96 | ||||||
| Service Class | Actual | 0.84% | $1,000.00 | $1,048.08 | $4.27 | |||||
| Hypothetical (h) | 0.84% | $1,000.00 | $1,020.63 | $4.21 |
| (h) | 5% class return per year before expenses. |
| (p) | Expenses paid is equal to each class’ annualized expense ratio, as shown above, multiplied by the average account value over the period, multiplied by the number of days in the period, divided by the number of days in the year. |
4
Table of Contents
MFS Research Bond Series
PORTFOLIO OF INVESTMENTS – 6/30/10 (unaudited)
The Portfolio of Investments is a complete list of all securities owned by your fund. It is categorized by broad-based asset classes.
| Issuer | Shares/Par | Value ($) | ||||
| BONDS – 95.5% | ||||||
| Aerospace – 0.2% | ||||||
| Bombardier, Inc., 7.75%, 2020 (z) | $ | 1,020,000 | $ | 1,058,250 | ||
| Airlines – 0.1% | ||||||
| Continental Airlines, Inc., 7.25%, 2019 | $ | 230,000 | $ | 244,950 | ||
| Asset-Backed & Securitized – 7.8% | ||||||
| Anthracite Ltd., “A” CDO, FRN, 0.707%, 2019 (z) | $ | 1,528,303 | $ | 1,100,378 | ||
| Anthracite Ltd., CDO, FRN, 1.197%, 2037 (z) | 400,000 | 312,000 | ||||
| ARCap REIT, Inc., CDO, 6.083%, 2045 (z) | 325,000 | 39,812 | ||||
| Bayview Commercial Asset Trust, FRN, 2.257%, 2036 (i)(z) | 395,888 | 20,982 | ||||
| Bayview Commercial Asset Trust, FRN, 2.257%, 2036 (i)(z) | 605,678 | 34,463 | ||||
| Bayview Commercial Asset Trust, FRN, 2.415%, 2036 (i)(z) | 477,181 | 31,208 | ||||
| Bayview Commercial Asset Trust, FRN, 2.39%, 2036 (i)(z) | 1,247,891 | 97,959 | ||||
| Bayview Commercial Asset Trust, FRN, 2.331%, 2036 (i)(z) | 621,741 | 51,605 | ||||
| Bayview Commercial Asset Trust, FRN, 2.462%, 2037 (i)(z) | 1,378,370 | 113,991 | ||||
| Bayview Commercial Asset Trust, FRN, 2.15%, 2035 (i)(z) | 644,288 | 32,601 | ||||
| Bayview Financial Acquisition Trust, FRN, 5.483%, 2041 | 66,379 | 64,971 | ||||
| Bayview Financial Acquisition Trust, FRN, 5.402%, 2035 | 16,086 | 15,823 | ||||
| Bayview Financial Revolving Mortgage Loan Trust, FRN, 1.947%, 2040 (z) | 193,279 | 79,592 | ||||
| Capital Trust Realty Ltd., CDO, 5.16%, 2035 (z) | 795,312 | 767,476 | ||||
| Citigroup/Deutsche Bank Commercial Mortgage Trust, 5.322%, 2049 | 2,377,957 | 2,309,599 | ||||
| Citigroup/Deutsche Bank Commercial Mortgage Trust, FRN, 5.397%, 2044 | 500,000 | 479,366 | ||||
| Commercial Mortgage Acceptance Corp., FRN, 1.846%, 2030 (i) | 216,283 | 12,040 | ||||
| Commercial Mortgage Pass-Through Certificates, 5.306%, 2046 | 1,203,489 | 1,173,986 | ||||
| Compagnie de Financement Foncier, 2.125%, 2013 (n) | 900,000 | 908,713 | ||||
| Credit Suisse First Boston Mortgage Securities Corp., 4.485%, 2036 | 951,579 | 959,331 | ||||
| Credit Suisse Mortgage Capital Certificate, 5.311%, 2039 | 1,600,000 | 1,583,220 | ||||
| Credit-Based Asset Servicing & Securitization LLC, FRN, 5.303%, 2035 | 31,204 | 30,090 | ||||
| Crest Ltd., “A1” CDO, FRN, 1.017%, 2018 (z) | 1,166,239 | 932,991 | ||||
| Crest Ltd., “A2”, CDO, 4.669%, 2018 (z) | 400,147 | 344,126 | ||||
| Crest Ltd., “B”, CDO, FRN, 1.673%, 2035 (z) | 897,000 | 789,360 | ||||
| CWCapital LLC, 5.223%, 2048 | 600,000 | 599,389 | ||||
| Issuer | Shares/Par | Value ($) | ||||
| BONDS – continued | ||||||
| Asset-Backed & Securitized – continued | ||||||
| DLJ Commercial Mortgage Corp., 6.04%, 2031 (z) | $ | 97,560 | $ | 99,766 | ||
| E*TRADE RV & Marine Trust, 3.62%, 2018 | 12,064 | 12,103 | ||||
| Falcon Franchise Loan LLC, FRN, 3.965%, 2025 (i)(z) | 249,363 | 20,223 | ||||
| First Union-Lehman Brothers Commercial Mortgage Trust, 7%, 2029 (n) | 38,107 | 39,971 | ||||
| Ford Credit Auto Lease Trust, 1.04%, 2013 (n) | 2,550,000 | 2,552,514 | ||||
| GMAC LLC, 6.465%, 2034 | 2,383,087 | 2,433,838 | ||||
| GMAC LLC, FRN, 7.911%, 2034 (n) | 110,000 | 101,887 | ||||
| GMAC LLC, FRN, 6.02%, 2033 (z) | 60,000 | 58,546 | ||||
| HSBC Credit Card Master Note Trust, FRN, 0.899%, 2013 | 1,892,000 | 1,891,314 | ||||
| JPMorgan Chase Commercial Mortgage Securities Corp., 5.552%, 2045 | 725,000 | 760,014 | ||||
| JPMorgan Chase Commercial Mortgage Securities Corp., 5.42%, 2049 | 5,629,597 | 5,501,611 | ||||
| JPMorgan Chase Commercial Mortgage Securities Corp., FRN, 5.983%, 2049 | 1,000,000 | 1,024,527 | ||||
| JPMorgan Chase Commercial Mortgage Securities Corp., FRN, 5.551%, 2042 (n) | 130,000 | 49,590 | ||||
| JPMorgan Chase Commercial Mortgage Securities Corp., FRN, 6.187%, 2051 | 2,123,552 | 2,171,719 | ||||
| Lehman Brothers Commercial Conduit Mortgage Trust, FRN, 1.049%, 2030 (i) | 200,559 | 5,306 | ||||
| Mach One Trust Commercial Mortgage, “B”, 5.43%, 2040 (z) | 851,000 | 802,067 | ||||
| Merrill Lynch Mortgage Trust, FRN, 6.019%, 2050 | 450,000 | 137,961 | ||||
| Merrill Lynch Mortgage Trust, FRN, “A3”, 6.019%, 2050 | 2,500,000 | 2,586,718 | ||||
| Merrill Lynch/Countrywide Commercial Mortgage Trust, FRN, 5.81%, 2050 | 540,000 | 528,080 | ||||
| Morgan Stanley Capital I, Inc., 5.72%, 2032 | 2,639 | 2,672 | ||||
| Morgan Stanley Capital I, Inc., FRN, 1.133%, 2030 (i)(n) | 316,058 | 12,765 | ||||
| Mortgage Capital Funding, Inc., FRN, 1.866%, 2031 (i) | 6,869 | 2 | ||||
| Preferred Term Securities XIX Ltd., CDO, FRN, 0.887%, 2035 (z) | 95,567 | 57,818 | ||||
| Prudential Securities Secured Financing Corp., FRN, 7.256%, 2013 (z) | 125,000 | 114,727 | ||||
| Residential Funding Mortgage Securities, Inc., 5.32%, 2035 | 174,000 | 63,232 | ||||
| Structured Asset Securities Corp., FRN, 0.587%, 2035 | 7,915 | 7,555 | ||||
| Swift Master Auto Receivables Trust, FRN, 0.999%, 2012 | 1,668,000 | 1,663,789 | ||||
| Wachovia Bank Commercial Mortgage Trust, FRN, 6.099%, 2051 | 2,278,443 | 2,238,007 | ||||
| $ | 37,823,394 | |||||
5
Table of Contents
MFS Research Bond Series
Portfolio of Investments (unaudited) – continued
| Issuer | Shares/Par | Value ($) | ||||
| BONDS – continued | ||||||
| Broadcasting – 0.7% | ||||||
| CBS Corp., 5.75%, 2020 | $ | 1,940,000 | $ | 2,082,252 | ||
| Inmarsat Finance PLC, 7.375%, 2017 (n) | 855,000 | 874,238 | ||||
| News America, Inc., 8.5%, 2025 | 152,000 | 188,103 | ||||
| $ | 3,144,593 | |||||
| Brokerage & Asset Managers – 0.2% | ||||||
| INVESCO PLC, 5.625%, 2012 | $ | 191,000 | $ | 201,093 | ||
| TD AMERITRADE Holding Corp., 5.6%, 2019 | 859,000 | 904,943 | ||||
| $ | 1,106,036 | |||||
| Cable TV – 1.8% | ||||||
| Cox Communications, Inc., 9.375%, 2019 (z) | $ | 1,622,000 | $ | 2,149,564 | ||
| DIRECTV Holdings LLC, 7.625%, 2016 | 1,157,000 | 1,256,791 | ||||
| DIRECTV Holdings LLC, 5.2%, 2020 | 1,050,000 | 1,094,324 | ||||
| TCI Communications, Inc., 9.8%, 2012 | 72,000 | 80,550 | ||||
| Time Warner Cable, Inc., 5%, 2020 | 3,652,000 | 3,734,685 | ||||
| Time Warner Entertainment Co. LP, 8.375%, 2033 | 290,000 | 359,972 | ||||
| $ | 8,675,886 | |||||
| Chemicals – 1.1% | ||||||
| Ashland, Inc., 9.125%, 2017 | $ | 620,000 | $ | 678,900 | ||
| Dow Chemical Co., 8.55%, 2019 | 1,700,000 | 2,080,992 | ||||
| Dow Chemical Co., 9.4%, 2039 | 529,000 | 735,728 | ||||
| Nalco Co., 8.25%, 2017 (z) | 1,700,000 | 1,759,500 | ||||
| $ | 5,255,120 | |||||
| Consumer Products – 0.6% | ||||||
| Fortune Brands, Inc., 5.125%, 2011 | $ | 341,000 | $ | 347,552 | ||
| Hasbro, Inc., 6.35%, 2040 | 540,000 | 550,127 | ||||
| Newell Rubbermaid, Inc., 5.5%, 2013 | 1,971,000 | 2,112,061 | ||||
| $ | 3,009,740 | |||||
| Consumer Services – 0.3% | ||||||
| Western Union Co., 5.4%, 2011 | $ | 1,147,000 | $ | 1,209,036 | ||
| Containers – 0.5% | ||||||
| Greif, Inc., 7.75%, 2019 | $ | 725,000 | $ | 746,750 | ||
| Owens-Illinois, Inc., 7.375%, 2016 | 1,370,000 | 1,428,225 | ||||
| $ | 2,174,975 | |||||
| Defense Electronics – 0.5% | ||||||
| BAE Systems Holdings, Inc., 6.375%, 2019 (n) | $ | 500,000 | $ | 570,091 | ||
| BAE Systems Holdings, Inc., 6.4%, 2011 (n) | 354,000 | 375,832 | ||||
| BAE Systems Holdings, Inc., 4.75%, 2010 (n) | 168,000 | 168,648 | ||||
| L-3 Communications Corp., 5.875%, 2015 | 1,535,000 | 1,515,813 | ||||
| $ | 2,630,384 | |||||
| Electronics – 0.1% | ||||||
| Tyco Electronics Group S.A., 6.55%, 2017 | $ | 420,000 | $ | 482,333 | ||
| Emerging Market Quasi-Sovereign – 0.7% | ||||||
| Gaz Capital S.A., 8.125%, 2014 (n) | $ | 633,000 | $ | 689,210 | ||
| KazMunaiGaz Finance B.V., 7%, 2020 (n) | 101,000 | 101,384 | ||||
| KazMunaiGaz Finance B.V., 9.125%, 2018 | 483,000 | 554,243 | ||||
| KazMunaiGaz Finance B.V., 11.75%, 2015 (n) | 536,000 | 655,957 | ||||
| Issuer | Shares/Par | Value ($) | ||||
| BONDS – continued | ||||||
| Emerging Market Quasi-Sovereign – continued | ||||||
| Petroleum Co. of Trinidad & Tobago Ltd., 9.75%, 2019 (n) | $ | 825,000 | $ | 940,500 | ||
| Qtel International Finance Ltd., 7.875%, 2019 (n) | 267,000 | 308,737 | ||||
| $ | 3,250,031 | |||||
| Energy – Independent – 0.4% | ||||||
| Anadarko Petroleum Corp., 6.95%, 2019 | $ | 460,000 | $ | 401,597 | ||
| Pioneer Natural Resources Co., 6.65%, 2017 | 715,000 | 718,619 | ||||
| Questar Market Resources, Inc., 6.8%, 2020 | 715,000 | 743,104 | ||||
| Talisman Energy, Inc., 7.75%, 2019 | 200,000 | 245,536 | ||||
| $ | 2,108,856 | |||||
| Energy – Integrated – 0.7% | ||||||
| ConocoPhillips, 6%, 2020 | $ | 740,000 | $ | 867,142 | ||
| Petro-Canada, 6.05%, 2018 | 1,494,000 | 1,682,280 | ||||
| Royal Dutch Shell PLC, 3.1%, 2015 | 960,000 | 974,856 | ||||
| $ | 3,524,278 | |||||
| Financial Institutions – 0.9% | ||||||
| CIT Group, Inc., 10.25%, 2017 | $ | 965,000 | $ | 989,125 | ||
| General Electric Capital Corp., 5.5%, 2020 | 1,360,000 | 1,437,187 | ||||
| HSBC Finance Corp., 6.75%, 2011 | 46,000 | 47,886 | ||||
| International Lease Finance Corp., 5.875%, 2013 | 308,000 | 284,130 | ||||
| International Lease Finance Corp., 6.375%, 2013 | 1,692,000 | 1,586,250 | ||||
| $ | 4,344,578 | |||||
| Food & Beverages – 1.6% | ||||||
| Anheuser-Busch InBev, 7.75%, 2019 (n) | $ | 3,440,000 | $ | 4,175,341 | ||
| Del Monte Foods Co., 7.5%, 2019 (n) | 55,000 | 56,238 | ||||
| Kraft Foods, Inc., 6.5%, 2040 | 1,990,000 | 2,225,475 | ||||
| Miller Brewing Co., 5.5%, 2013 (n) | 1,310,000 | 1,433,133 | ||||
| $ | 7,890,187 | |||||
| Forest & Paper Products – 0.6% | ||||||
| Fibria Overseas Finance Ltd., 7.5%, 2020 (n) | $ | 1,455,000 | $ | 1,476,825 | ||
| Georgia-Pacific Corp., 7.125%, 2017 (n) | 1,500,000 | 1,530,000 | ||||
| $ | 3,006,825 | |||||
| Gaming & Lodging – 0.5% | ||||||
| Wyndham Worldwide Corp., 7.375%, 2020 | $ | 600,000 | $ | 615,510 | ||
| Wyndham Worldwide Corp., 6%, 2016 | 1,605,000 | 1,557,123 | ||||
| $ | 2,172,633 | |||||
| Insurance – 1.4% | ||||||
| ING Groep N.V., 5.775% to 2015, FRN to 2049 | $ | 518,000 | $ | 365,190 | ||
| Lincoln National Corp., 7%, 2040 | 2,010,000 | 2,117,022 | ||||
| Metropolitan Life Global Funding, 5.125%, 2013 (n) | 420,000 | 454,260 | ||||
| Metropolitan Life Global Funding, 5.125%, 2014 (n) | 290,000 | 315,034 | ||||
| Prudential Financial, Inc., 5.375%, 2020 | 750,000 | 759,582 | ||||
6
Table of Contents
MFS Research Bond Series
Portfolio of Investments (unaudited) – continued
| Issuer | Shares/Par | Value ($) | ||||
| BONDS – continued | ||||||
| Insurance – continued | ||||||
| Unum Group, 7.125%, 2016 | $ | 290,000 | $ | 318,638 | ||
| UnumProvident Corp., 6.85%, 2015 (n) | 2,243,000 | 2,382,216 | ||||
| $ | 6,711,942 | |||||
| Insurance – Health – 0.6% | ||||||
| Humana, Inc., 7.2%, 2018 | $ | 450,000 | $ | 502,326 | ||
| Unitedhealth Group, Inc., 4.875%, 2013 | 2,000,000 | 2,149,072 | ||||
| $ | 2,651,398 | |||||
| Insurance – Property & Casualty – 1.0% | ||||||
| AXIS Capital Holdings Ltd., 5.75%, 2014 | $ | 1,405,000 | $ | 1,457,616 | ||
| PartnerRe Ltd., 5.5%, 2020 | 1,409,000 | 1,361,669 | ||||
| ZFS Finance USA Trust II, 6.45% to 2016, FRN to 2065 (n) | 542,000 | 485,090 | ||||
| ZFS Finance USA Trust V, 6.5% to 2017, FRN to 2067 (n) | 1,452,000 | 1,299,540 | ||||
| $ | 4,603,915 | |||||
| International Market Quasi-Sovereign – 1.5% | ||||||
| Achmea Hypotheekbank N.V., 3.2%, 2014 (n) | $ | 1,150,000 | $ | 1,188,131 | ||
| FIH Erhvervsbank A.S., 1.75%, 2012 (z) | 766,000 | 773,788 | ||||
| ING Bank N.V., 3.9%, 2014 (n) | 1,500,000 | 1,608,011 | ||||
| NIBC Bank N.V., 2.8%, 2014 (z) | 1,500,000 | 1,519,269 | ||||
| Royal Bank of Scotland Group PLC, 2.625%, 2012 (n) | 1,080,000 | 1,104,610 | ||||
| Societe Financement de l’ Economie Francaise, 3.375%, 2014 (n) | 842,000 | 879,578 | ||||
| $ | 7,073,387 | |||||
| Local Authorities – 0.1% | ||||||
| Metropolitan Transportation Authority, NY (Build America Bonds), 7.336%, 2039 | $ | 425,000 | $ | 518,955 | ||
| Machinery & Tools – 0.2% | ||||||
| Case New Holland, Inc., 7.75%, 2013 | $ | 637,000 | $ | 651,332 | ||
| Case New Holland, Inc., 7.875%, 2017 (z) | 485,000 | 488,637 | ||||
| $ | 1,139,969 | |||||
| Major Banks – 5.3% | ||||||
| BAC Capital Trust XIV, 5.63% to 2012, FRN to 2049 | $ | 120,000 | $ | 81,000 | ||
| Banco Santander Chile, 2.875%, 2012 (n) | 2,031,000 | 2,015,150 | ||||
| Bank of America Corp., 5.65%, 2018 | 2,600,000 | 2,664,511 | ||||
| Bank of America Corp., 8% to 2018, FRN to 2049 | 529,000 | 510,977 | ||||
| BNP Paribas, 7.195% to 2037, FRN to 2049 (n) | 1,200,000 | 1,044,000 | ||||
| Credit Suisse (USA), Inc., 6%, 2018 | 1,160,000 | 1,210,419 | ||||
| Goldman Sachs Group, Inc., 7.5%, 2019 | 1,438,000 | 1,607,366 | ||||
| Goldman Sachs Group, Inc., 5.375%, 2020 | 907,000 | 896,221 | ||||
| Goldman Sachs Group, Inc., 5.625%, 2017 | 336,000 | 339,733 | ||||
| JPMorgan Chase & Co., 6%, 2017 | 2,680,000 | 2,918,418 | ||||
| JPMorgan Chase Bank N.A., 5.875%, 2016 | 250,000 | 273,494 | ||||
| JPMorgan Chase Capital XXVII, 7%, 2039 | 1,070,000 | 1,088,124 | ||||
| Macquarie Group Ltd., 6%, 2020 (n) | 1,073,000 | 1,087,496 | ||||
| Issuer | Shares/Par | Value ($) | ||||
| BONDS – continued | ||||||
| Major Banks – continued | ||||||
| Merrill Lynch & Co., Inc., 6.15%, 2013 | $ | 1,170,000 | $ | 1,250,894 | ||
| Merrill Lynch & Co., Inc., 6.05%, 2016 | 1,569,000 | 1,621,314 | ||||
| Morgan Stanley, 6.625%, 2018 | 2,260,000 | 2,368,783 | ||||
| Morgan Stanley, 5.75%, 2016 | 944,000 | 951,004 | ||||
| PNC Funding Corp., 5.625%, 2017 | 2,415,000 | 2,569,253 | ||||
| UniCredito Italiano Capital Trust II, 9.2% to 2010, FRN to 2049 (n) | 545,000 | 515,025 | ||||
| Wachovia Corp., 6.605%, 2025 | 164,000 | 170,817 | ||||
| Wells Fargo & Co., 7.98% to 2018, FRN to 2049 | 657,000 | 676,710 | ||||
| $ | 25,860,709 | |||||
| Medical & Health Technology & Services – 0.8% | ||||||
| CareFusion Corp., 6.375%, 2019 | $ | 480,000 | $ | 548,318 | ||
| HCA, Inc., 7.875%, 2020 | 1,505,000 | 1,548,269 | ||||
| Hospira, Inc., 5.55%, 2012 | 670,000 | 713,383 | ||||
| Hospira, Inc., 6.05%, 2017 | 210,000 | 236,435 | ||||
| McKesson Corp., 5.7%, 2017 | 510,000 | 576,672 | ||||
| $ | 3,623,077 | |||||
| Metals & Mining – 2.3% | ||||||
| ArcelorMittal, 9.85%, 2019 | $ | 965,000 | $ | 1,205,904 | ||
| Freeport-McMoRan Copper & Gold, Inc., 8.25%, 2015 | 2,290,000 | 2,484,650 | ||||
| International Steel Group, Inc., 6.5%, 2014 | 496,000 | 530,854 | ||||
| Peabody Energy Corp., 5.875%, 2016 | 830,000 | 814,437 | ||||
| Rio Tinto Finance USA Ltd., 5.875%, 2013 | 880,000 | 964,174 | ||||
| Southern Copper Corp., 6.75%, 2040 | 1,021,000 | 1,009,236 | ||||
| Teck Resources Ltd., 10.25%, 2016 | 2,451,000 | 2,892,180 | ||||
| Vale Overseas Ltd., 6.875%, 2039 | 1,182,000 | 1,234,833 | ||||
| $ | 11,136,268 | |||||
| Mortgage-Backed – 14.4% | ||||||
| Fannie Mae, 4.55%, 2011 | $ | 113,527 | $ | 116,063 | ||
| Fannie Mae, 4.79%, 2012 | 4,765 | 4,966 | ||||
| Fannie Mae, 4.86%, 2012 | 110,370 | 115,460 | ||||
| Fannie Mae, 5.12%, 2012 | 55,651 | 58,789 | ||||
| Fannie Mae, 3.81%, 2013 | 18,394 | 19,256 | ||||
| Fannie Mae, 4.517%, 2013 | 315,437 | 333,906 | ||||
| Fannie Mae, 4.845%, 2013 | 48,760 | 52,213 | ||||
| Fannie Mae, 5.145%, 2013 | 1,503,608 | 1,626,393 | ||||
| Fannie Mae, 4.589%, 2014 | 112,341 | 120,596 | ||||
| Fannie Mae, 4.6%, 2014 - 2015 | 104,792 | 112,850 | ||||
| Fannie Mae, 4.61%, 2014 | 67,930 | 72,920 | ||||
| Fannie Mae, 4.77%, 2014 - 2019 | 499,562 | 543,535 | ||||
| Fannie Mae, 4.88%, 2014 - 2020 | 211,245 | 229,758 | ||||
| Fannie Mae, 4.53%, 2015 | 101,884 | 109,777 | ||||
| Fannie Mae, 4.56%, 2015 | 53,161 | 57,219 | ||||
| Fannie Mae, 4.665%, 2015 | 36,404 | 39,368 | ||||
| Fannie Mae, 4.69%, 2015 | 158,157 | 171,114 | ||||
| Fannie Mae, 4.7%, 2015 | 333,892 | 361,855 | ||||
| Fannie Mae, 4.74%, 2015 | 47,569 | 51,599 | ||||
| Fannie Mae, 4.78%, 2015 | 101,840 | 110,778 | ||||
| Fannie Mae, 4.815%, 2015 | 53,000 | 57,692 | ||||
| Fannie Mae, 4.85%, 2015 | 168,915 | 183,764 | ||||
| Fannie Mae, 4.87%, 2015 | 32,942 | 35,875 | ||||
7
Table of Contents
MFS Research Bond Series
Portfolio of Investments (unaudited) – continued
| Issuer | Shares/Par | Value ($) | ||||
| BONDS – continued | ||||||
| Mortgage-Backed – continued | ||||||
| Fannie Mae, 4.89%, 2015 | $ | 93,198 | $ | 101,779 | ||
| Fannie Mae, 4.922%, 2015 | 111,547 | 121,810 | ||||
| Fannie Mae, 4.94%, 2015 | 120,000 | 127,655 | ||||
| Fannie Mae, 5.1%, 2015 | 275,000 | 299,159 | ||||
| Fannie Mae, 5.466%, 2015 | 802,337 | 886,894 | ||||
| Fannie Mae, 5.09%, 2016 | 117,620 | 129,570 | ||||
| Fannie Mae, 5.157%, 2016 | 3,456,295 | 3,829,881 | ||||
| Fannie Mae, 5.395%, 2016 | 131,514 | 146,046 | ||||
| Fannie Mae, 5.424%, 2016 | 1,176,195 | 1,303,413 | ||||
| Fannie Mae, 5.724%, 2016 | 1,124,872 | 1,245,768 | ||||
| Fannie Mae, 4.99%, 2017 | 153,330 | 166,993 | ||||
| Fannie Mae, 5.28%, 2017 | 139,602 | 154,862 | ||||
| Fannie Mae, 5.486%, 2017 | 662,363 | 738,366 | ||||
| Fannie Mae, 5.5%, 2017 - 2039 | 19,773,832 | 21,260,967 | ||||
| Fannie Mae, 5.54%, 2017 | 106,553 | 118,762 | ||||
| Fannie Mae, 5%, 2020 - 2040 | 2,513,119 | 2,661,651 | ||||
| Fannie Mae, 5.19%, 2020 | 198,020 | 215,628 | ||||
| Fannie Mae, 6%, 2022 - 2038 | 3,594,246 | 3,900,692 | ||||
| Fannie Mae, 5.35%, 2023 | 182,106 | 199,277 | ||||
| Fannie Mae, 6.5%, 2032 - 2033 | 39,980 | 44,636 | ||||
| Freddie Mac, 5%, 2017 - 2037 | 5,212,218 | 5,461,679 | ||||
| Freddie Mac, 5.5%, 2019 - 2038 | 5,484,252 | 5,886,561 | ||||
| Freddie Mac, 4.251%, 2020 | 807,000 | 838,946 | ||||
| Freddie Mac, 4.5%, 2028 | 913,867 | 957,150 | ||||
| Freddie Mac, 6%, 2034 - 2039 | 2,978,523 | 3,239,371 | ||||
| Ginnie Mae, 4%, 2032 | 215,131 | 220,635 | ||||
| Ginnie Mae, 6%, 2036 - 2039 | 2,247,868 | 2,454,947 | ||||
| Ginnie Mae, 5.5%, 2038 - 2039 | 3,219,269 | 3,482,003 | ||||
| Ginnie Mae, 4.5%, 2039 - 2040 | 4,752,312 | 4,961,266 | ||||
| $ | 69,742,113 | |||||
| Municipals – 1.6% | ||||||
| California Educational Facilities Authority Rev. (Stanford University), “T-1”, 5%, 2039 | $ | 2,690,000 | $ | 3,151,577 | ||
| Massachusetts Bay Transportation Authority Sales Tax Rev., 5%, 2031 | 1,115,000 | 1,251,944 | ||||
| Massachusetts Health & Educational Facilities Authority Rev. (Boston College), 5.5%, 2030 | 460,000 | 537,372 | ||||
| Massachusetts Health & Educational Facilities Authority Rev. (Massachusetts Institute of Technology), “K”, 5.5%, 2032 | 2,225,000 | 2,724,891 | ||||
| $ | 7,665,784 | |||||
| Natural Gas – Pipeline – 1.7% | ||||||
| CenterPoint Energy, Inc., 7.875%, 2013 | $ | 748,000 | $ | 857,113 | ||
| El Paso Pipeline Partners LP, 6.5%, 2020 | 460,000 | 469,817 | ||||
| Enterprise Products Operating LP, 5.2%, 2020 | 1,600,000 | 1,643,218 | ||||
| Enterprise Products Operating LP, 5.65%, 2013 | 227,000 | 246,246 | ||||
| Enterprise Products Partners LP, 6.3%, 2017 | 900,000 | 1,006,762 | ||||
| Kinder Morgan Energy Partners LP, 5.3%, 2020 | 2,590,000 | 2,678,669 | ||||
| Issuer | Shares/Par | Value ($) | ||||
| BONDS – continued | ||||||
| Natural Gas – Pipeline – continued | ||||||
| Kinder Morgan Energy Partners LP, 7.4%, 2031 | $ | 103,000 | $ | 113,952 | ||
| Kinder Morgan Energy Partners LP, 6%, 2017 | 643,000 | 700,439 | ||||
| Spectra Energy Capital LLC, 8%, 2019 | 613,000 | 737,290 | ||||
| $ | 8,453,506 | |||||
| Network & Telecom – 2.1% | ||||||
| CenturyTel, Inc., 7.6%, 2039 | $ | 1,339,000 | $ | 1,269,381 | ||
| New Communications Holdings, Inc., 8.5%, 2020 (n) | 725,000 | 726,812 | ||||
| Telecom Italia Capital, 7.175%, 2019 | 1,329,000 | 1,430,819 | ||||
| Telefonica Emisiones S.A.U., 2.582%, 2013 | 892,000 | 885,864 | ||||
| Telefonica Emisiones S.A.U., 5.134%, 2020 | 1,700,000 | 1,703,898 | ||||
| Telemar Norte Leste S.A., 9.5%, 2019 (n) | 571,000 | 683,773 | ||||
| Verizon New York, Inc., 6.875%, 2012 | 1,317,000 | 1,423,111 | ||||
| Windstream Corp., 8.625%, 2016 | 2,205,000 | 2,221,538 | ||||
| $ | 10,345,196 | |||||
| Oil Services – 0.4% | ||||||
| Smith International, Inc., 9.75%, 2019 | $ | 1,500,000 | $ | 2,041,665 | ||
| Other Banks & Diversified Financials – 2.3% | ||||||
| Capital One Financial Corp., 6.15%, 2016 | $ | 610,000 | $ | 645,464 | ||
| Capital One Financial Corp., 8.8%, 2019 | 1,660,000 | 2,072,362 | ||||
| Citigroup, Inc., 6.125%, 2018 | 1,810,000 | 1,889,064 | ||||
| Citigroup, Inc., 8.5%, 2019 | 2,400,000 | 2,861,098 | ||||
| Discover Bank, 7%, 2020 | 720,000 | 727,006 | ||||
| Groupe BPCE S.A., 12.5% to 2019, FRN to 2049 (n) | 472,000 | 525,001 | ||||
| Resona Bank Ltd., 5.85% to 2016, FRN to 2049 (n) | 334,000 | 315,652 | ||||
| UBS Preferred Funding Trust V, 6.243% to 2016, FRN to 2049 | 1,249,000 | 1,071,018 | ||||
| VTB Capital S.A., 6.465%, 2015 (n) | 793,000 | 793,000 | ||||
| $ | 10,899,665 | |||||
| Pollution Control – 0.3% | ||||||
| Allied Waste North America, Inc., 6.875%, 2017 | $ | 1,250,000 | $ | 1,362,500 | ||
| Printing & Publishing – 0.0% | ||||||
| Pearson PLC, 5.5%, 2013 (n) | $ | 200,000 | $ | 215,520 | ||
| Real Estate – 1.8% | ||||||
| HRPT Properties Trust, REIT, 6.25%, 2016 | $ | 1,689,000 | $ | 1,719,829 | ||
| Kimco Realty Corp., REIT, 5.783%, 2016 | 294,000 | 314,691 | ||||
| Liberty Property LP, REIT, 5.5%, 2016 | 1,730,000 | 1,795,034 | ||||
| Simon Property Group, Inc., REIT, 10.35%, 2019 | 2,440,000 | 3,247,774 | ||||
| WEA Finance LLC, REIT, 6.75%, 2019 (n) | 1,510,000 | 1,678,297 | ||||
| $ | 8,755,625 | |||||
| Restaurants – 0.0% | ||||||
| YUM! Brands, Inc., 8.875%, 2011 | $ | 205,000 | $ | 216,573 | ||
| Retailers – 0.2% | ||||||
| Wesfarmers Ltd., 6.998%, 2013 (n) | $ | 1,000,000 | $ | 1,091,560 | ||
8
Table of Contents
MFS Research Bond Series
Portfolio of Investments (unaudited) – continued
| Issuer | Shares/Par | Value ($) | ||||
| BONDS – continued | ||||||
| Specialty Stores – 0.7% | ||||||
| Advance Auto Parts, Inc., 5.75%, 2020 | $ | 1,512,000 | $ | 1,545,999 | ||
| Best Buy Co., Inc., 6.75%, 2013 | 1,660,000 | 1,856,707 | ||||
| $ | 3,402,706 | |||||
| Supermarkets – 0.2% | ||||||
| Delhaize America, Inc., 9%, 2031 | $ | 520,000 | $ | 710,721 | ||
| Supranational – 0.0% | ||||||
| Corporacion Andina de Fomento, 6.875%, 2012 | $ | 61,000 | $ | 65,887 | ||
| Telecommunications – Wireless – 0.4% | ||||||
| Crown Castle Towers LLC, 6.113%, 2020 (n) | $ | 1,096,000 | $ | 1,202,919 | ||
| Rogers Cable, Inc., 5.5%, 2014 | 734,000 | 810,480 | ||||
| $ | 2,013,399 | |||||
| Tobacco – 1.6% | ||||||
| Altria Group, Inc., 9.7%, 2018 | $ | 1,020,000 | $ | 1,291,708 | ||
| Altria Group, Inc., 9.25%, 2019 | 800,000 | 998,485 | ||||
| Altria Group, Inc., 9.95%, 2038 | 650,000 | 853,947 | ||||
| Lorillard Tobacco Co., 6.875%, 2020 | 1,350,000 | 1,371,373 | ||||
| Lorillard Tobacco Co., 8.125%, 2019 | 815,000 | 903,878 | ||||
| Reynolds American, Inc., 7.25%, 2012 | 800,000 | 860,112 | ||||
| Reynolds American, Inc., 6.75%, 2017 | 1,400,000 | 1,516,743 | ||||
| $ | 7,796,246 | |||||
| Transportation – Services – 0.6% | ||||||
| Erac USA Finance Co., 7%, 2037 (n) | $ | 1,413,000 | $ | 1,539,745 | ||
| Erac USA Finance Co., 5.25%, 2020 (n) | 1,570,000 | 1,586,509 | ||||
| $ | 3,126,254 | |||||
| U.S. Government Agencies and Equivalents – 6.2% | ||||||
| Bank of America Corp., FRN, 0.918%, 2012 (m) | $ | 2,353,000 | $ | 2,373,848 | ||
| Citigroup, Inc., FRN, 0.667%, 2012 (m) | 5,650,000 | 5,694,850 | ||||
| FDIC Structured Sale Guarantee Note, 0%, 2012 (n) | 396,000 | 381,891 | ||||
| General Electric Capital Corp., FRN, 0.323%, 2012 (m) | 3,034,000 | 3,037,695 | ||||
| Goldman Sachs Group, Inc., FRN, 0.737%, 2012 (m) | 1,157,000 | 1,160,366 | ||||
| JPMorgan Chase & Co., FRN, 0.787%, 2012 (m) | 5,650,000 | 5,702,455 | ||||
| Morgan Stanley, FRN, 0.889%, 2012 (m) | 5,173,000 | 5,221,347 | ||||
| PNC Funding Corp., FRN, 0.49%, 2012 (m) | 2,960,000 | 2,977,431 | ||||
| Small Business Administration, 4.34%, 2024 | 129,984 | 136,591 | ||||
| Small Business Administration, 4.99%, 2024 | 102,543 | 109,369 | ||||
| Small Business Administration, 4.43%, 2029 | 1,192,937 | 1,267,015 | ||||
| Small Business Administration, 4.93%, 2024 | 95,354 | 101,778 | ||||
| Small Business Administration, 4.86%, 2025 | 222,967 | 238,256 | ||||
| Small Business Administration, 4.625%, 2025 | 218,025 | 231,408 | ||||
| Small Business Administration, 5.11%, 2025 | 167,048 | 178,677 | ||||
| Wells Fargo & Co., FRN, 0.757%, 2012 (m) | 1,289,000 | 1,297,137 | ||||
| $ | 30,110,114 | |||||
| Issuer | Shares/Par | Value ($) | |||||
| BONDS – continued | |||||||
| U.S. Treasury Obligations – 26.8% | |||||||
| U.S. Treasury Bonds, 6.25%, 2023 | $ | 177,000 | $ | 229,436 | |||
| U.S. Treasury Bonds, 6%, 2026 | 373,000 | 480,646 | |||||
| U.S. Treasury Bonds, 6.75%, 2026 | 19,000 | 26,377 | |||||
| U.S. Treasury Bonds, 5.25%, 2029 | 103,000 | 123,954 | |||||
| U.S. Treasury Bonds, 4.5%, 2036 | 110,000 | 121,516 | |||||
| U.S. Treasury Bonds, 5%, 2037 | 5,246,000 | 6,252,576 | |||||
| U.S. Treasury Bonds, 4.5%, 2039 | 5,875,600 | 6,471,421 | |||||
| U.S. Treasury Notes, 2.375%, 2010 | 23,527,000 | 23,612,474 | |||||
| U.S. Treasury Notes, 1.25%, 2010 | 6,676,000 | 6,704,687 | |||||
| U.S. Treasury Notes, 5.125%, 2011 | 3,207,000 | 3,357,953 | |||||
| U.S. Treasury Notes, 4.5%, 2011 | 8,594,000 | 9,086,814 | |||||
| U.S. Treasury Notes, 1.375%, 2012 | 28,625,600 | 29,016,969 | |||||
| U.S. Treasury Notes, 3.125%, 2013 | 201,000 | 214,002 | |||||
| U.S. Treasury Notes, 1.875%, 2014 | 24,673,000 | 25,118,274 | |||||
| U.S. Treasury Notes, 5.125%, 2016 | 167,000 | 194,881 | |||||
| U.S. Treasury Notes, 3.75%, 2018 | 14,368,000 | 15,481,520 | |||||
| U.S. Treasury Notes, TIPS, 2%, 2014 | 740,958 | 789,352 | |||||
| U.S. Treasury Notes, TIPS, 1.625%, 2015 | 787,801 | 831,622 | |||||
| U.S. Treasury Notes, TIPS, 2%, 2016 | 1,351,044 | 1,457,544 | |||||
| $ | 129,572,018 | ||||||
| Utilities – Electric Power – 1.7% | |||||||
| CenterPoint Energy, Inc., 5.95%, 2017 | $ | 540,000 | $ | 583,991 | |||
| Duke Energy Corp., 5.65%, 2013 | 1,090,000 | 1,201,844 | |||||
| EDP Finance B.V., 6%, 2018 (n) | 2,600,000 | 2,560,649 | |||||
| Enel Finance International S.A., 6%, 2039 (n) | 1,800,000 | 1,731,762 | |||||
| NiSource Finance Corp., 7.875%, 2010 | 1,030,000 | 1,052,631 | |||||
| NRG Energy, Inc., 7.375%, 2016 | 240,000 | 238,800 | |||||
| TECO Energy, Inc., 5.15%, 2020 | 610,000 | 635,810 | |||||
| Waterford 3 Funding Corp., 8.09%, 2017 | 73,645 | 76,634 | |||||
| $ | 8,082,121 | ||||||
| Total Bonds (Identified Cost, $443,697,443) | $ | 462,100,878 | |||||
| FLOATING RATE LOANS (g)(r) – 0.1% | |||||||
| Automotive – 0.1% | |||||||
| Ford Motor Co., Term Loan, 3.33%, 2013 (Identified Cost, $669,306) | $ | 721,291 | $ | 680,718 | |||
| MONEY MARKET FUNDS (v) – 7.3% | |||||||
| MFS Institutional Money Market Portfolio, 0.22%, at Cost and Net Asset Value | 35,144,813 | $ | 35,144,813 | ||||
| Total Investments (Identified Cost, $479,511,562) | $ | 497,926,409 | |||||
| OTHER ASSETS, LESS LIABILITIES – (2.9)% | (13,830,796 | ) | |||||
| Net Assets – 100.0% | $ | 484,095,613 | |||||
9
Table of Contents
MFS Research Bond Series
Portfolio of Investments (unaudited) – continued
| (g) | The rate shown represents a weighted average coupon rate on settled positions at period end, unless otherwise indicated. |
| (i) | Interest only security for which the fund receives interest on notional principal (Par amount). Par amount shown is the notional principal and does not reflect the cost of the security. |
| (m) | The debt is guaranteed under the Federal Deposit Insurance Corporation’s (FDIC) Temporary Liquidity Guarantee Program and is backed by the full faith and credit of the United States. The expiration date of the FDIC’s guarantee is the earlier of the maturity date of the debt or June 30, 2012. |
| (n) | Securities exempt from registration under Rule 144A of the Securities Act of 1933. These securities may be sold in the ordinary course of business in transactions exempt from registration, normally to qualified institutional buyers. At period end, the aggregate value of these securities was $46,432,806 representing 9.6% of net assets. |
| (r) | Remaining maturities of floating rate loans may be less than stated maturities shown as a result of contractual or optional prepayments by the borrower. Such prepayments cannot be predicted with certainty. These loans may be subject to restrictions on resale. Floating rate loans generally have rates of interest which are determined periodically by reference to a base lending rate plus a premium. |
| (v) | Underlying fund that is available only to investment companies managed by MFS. The rate quoted is the annualized seven-day yield of the fund at period end. |
| (z) | Restricted securities are not registered under the Securities Act of 1933 and are subject to legal restrictions on resale. These securities generally may be resold in transactions exempt from registration or to the public if the securities are subsequently registered. Disposal of these securities may involve time-consuming negotiations and prompt sale at an acceptable price may be difficult. The fund holds the following restricted securities: |
| Restricted Securities | Acquisition Date | Cost | Current Market Value | |||
| Anthracite Ltd., “A” CDO, FRN, 0.707%, 2019 | 1/15/10-1/28/10 | $1,078,761 | $1,100,378 | |||
| Anthracite Ltd., CDO, FRN, 1.197%, 2037 | 2/24/10 | 310,013 | 312,000 | |||
| ARCap REIT, Inc., CDO, 6.083%, 2045 | 12/07/06 | 332,065 | 39,812 | |||
| Bayview Commercial Asset Trust, FRN, 2.15%, 2035 | 10/06/05 | 50,081 | 32,601 | |||
| Bayview Commercial Asset Trust, FRN, 2.257%, 2036 | 3/29/06 | 39,579 | 20,982 | |||
| Bayview Commercial Asset Trust, FRN, 2.257%, 2036 | 2/28/06 | 52,571 | 34,463 | |||
| Bayview Commercial Asset Trust, FRN, 2.415%, 2036 | 5/16/06 | 35,927 | 31,208 | |||
| Bayview Commercial Asset Trust, FRN, 2.39%, 2036 | 9/11/06 | 167,965 | 97,959 | |||
| Bayview Commercial Asset Trust, FRN, 2.331%, 2036 | 10/25/06 | 83,895 | 51,605 | |||
| Bayview Commercial Asset Trust, FRN, 2.462%, 2037 | 1/26/07 | 152,989 | 113,991 | |||
| Bayview Financial Revolving Mortgage Loan Trust, FRN, 1.947%, 2040 | 3/01/06 | 193,279 | 79,592 | |||
| Bombardier, Inc., 7.75%, 2020 | 3/15/10 | 1,022,947 | 1,058,250 | |||
| Capital Trust Realty Ltd., CDO, 5.16%, 2035 | 4/07/06-3/04/10 | 767,830 | 767,476 | |||
| Case New Holland, Inc., 7.875%, 2017 | 6/22/10 | 486,833 | 488,637 | |||
| Cox Communications, Inc., 9.375%, 2019 | 1/07/10-1/15/10 | 2,074,717 | 2,149,564 | |||
| Crest Ltd., “A1” CDO, FRN, 1.017%, 2018 | 1/21/10-3/04/10 | 874,318 | 932,991 | |||
| Crest Ltd., “A2”, CDO, 4.669%, 2018 | 3/02/10 | 322,180 | 344,126 | |||
| Crest Ltd., “B”, CDO, FRN, 1.673%, 2035 | 1/12/10 | 748,701 | 789,360 | |||
| DLJ Commercial Mortgage Corp., 6.04%, 2031 | 7/23/04 | 96,276 | 99,766 | |||
| FIH Erhvervsbank A.S., 1.75%, 2012 | 12/02/09 | 764,348 | 773,788 | |||
| Falcon Franchise Loan LLC, FRN, 3.965%, 2025 | 1/29/03 | 25,001 | 20,223 | |||
| GMAC LLC, FRN, 6.02%, 2033 | 3/20/02 | 59,860 | 58,546 | |||
| Mach One Trust Commercial Mortgage, “B”, 5.43%, 2040 | 3/10/10 | 800,236 | 802,067 | |||
| NIBC Bank N.V., 2.8%, 2014 | 11/24/09 | 1,497,086 | 1,519,269 | |||
| Nalco Co., 8.25%, 2017 | 12/18/09 | 1,813,439 | 1,759,500 | |||
| Preferred Term Securities XIX Ltd., CDO, FRN, 0.887%, 2035 | 9/08/05 | 95,567 | 57,818 | |||
| Prudential Securities Secured Financing Corp., FRN, 7.256%, 2013 | 12/06/04 | 129,716 | 114,727 | |||
| Total Restricted Securities | $13,650,699 | |||||
| % of Net Assets | 2.8% |
10
Table of Contents
MFS Research Bond Series
Portfolio of Investments (unaudited) – continued
The following abbreviations are used in this report and are defined:
| CDO | Collateralized Debt Obligation |
| FRN | Floating Rate Note. Interest rate resets periodically and may not be the rate reported at period end. |
| PLC | Public Limited Company |
| REIT | Real Estate Investment Trust |
| TIPS | Treasury Inflation Protected Security |
See Notes to Financial Statements
11
Table of Contents
MFS Research Bond Series
FINANCIAL STATEMENTS | STATEMENT OF ASSETS AND LIABILITIES (unaudited)
This statement represents your fund’s balance sheet, which details the assets and liabilities comprising the total value of the fund.
At 6/30/10 | ||||
Assets | ||||
Investments – | ||||
Non-affiliated issuers, at value (identified cost, $444,366,749) | $462,781,596 | |||
Underlying funds, at cost and value | 35,144,813 | |||
Total investments, at value (identified cost, $479,511,562) | $497,926,409 | |||
Cash | 1,219 | |||
Receivables for | ||||
Investments sold | 1,791,612 | |||
Fund shares sold | 1,402,470 | |||
Interest | 4,128,005 | |||
Other assets | 2,290 | |||
Total assets | $505,252,005 | |||
Liabilities | ||||
Payables for | ||||
Investments purchased | $21,051,363 | |||
Fund shares reacquired | 5,984 | |||
Payable to affiliates | ||||
Investment adviser | 13,201 | |||
Shareholder servicing costs | 371 | |||
Distribution and/or service fees | 1,680 | |||
Administrative services fee | 413 | |||
Payable for independent Trustees’ compensation | 883 | |||
Accrued expenses and other liabilities | 82,497 | |||
Total liabilities | $21,156,392 | |||
Net assets | $484,095,613 | |||
Net assets consist of | ||||
Paid-in capital | $455,446,624 | |||
Unrealized appreciation (depreciation) on investments | 18,414,847 | |||
Accumulated net realized gain (loss) on investments | 2,804,129 | |||
Undistributed net investment income | 7,430,013 | |||
Net assets | $484,095,613 | |||
Shares of beneficial interest outstanding | 39,250,293 |
| Net assets | Shares outstanding | Net asset value per share | ||||
Initial Class | $360,437,051 | 29,157,812 | $12.36 | |||
Service Class | 123,658,562 | 10,092,481 | 12.25 |
See Notes to Financial Statements
12
Table of Contents
MFS Research Bond Series
FINANCIAL STATEMENTS | STATEMENT OF OPERATIONS (unaudited)
This statement describes how much your fund earned in investment income and accrued in expenses. It also describes any gains and/or losses generated by fund operations.
| Six months ended 6/30/10 | |||||
| Net investment income | |||||
Income | |||||
Interest | $8,749,319 | ||||
Dividends from underlying funds | 9,245 | ||||
Foreign taxes withheld | (571 | ) | |||
Total investment income | $8,757,993 | ||||
Expenses | |||||
Management fee | $1,036,458 | ||||
Distribution and/or service fees | 100,389 | ||||
Shareholder servicing costs | 24,983 | ||||
Administrative services fee | 34,411 | ||||
Independent Trustees’ compensation | 5,739 | ||||
Custodian fee | 41,530 | ||||
Shareholder communications | 37,185 | ||||
Auditing fees | 30,776 | ||||
Legal fees | 3,489 | ||||
Miscellaneous | 12,961 | ||||
Total expenses | $1,327,921 | ||||
Fees paid indirectly | (201 | ) | |||
Reduction of expenses by investment adviser | (1,323 | ) | |||
Net expenses | $1,326,397 | ||||
Net investment income | $7,431,596 | ||||
Realized and unrealized gain (loss) on investments | |||||
Realized gain (loss) (identified cost basis) | |||||
Investment transactions | $5,230,251 | ||||
Swap transactions | (78,080 | ) | |||
Net realized gain (loss) on investments | $5,152,171 | ||||
Change in unrealized appreciation (depreciation) on investments | $7,515,115 | ||||
Net realized and unrealized gain (loss) on investments | $12,667,286 | ||||
Change in net assets from operations | $20,098,882 |
See Notes to Financial Statements
13
Table of Contents
MFS Research Bond Series
FINANCIAL STATEMENTS | STATEMENTS OF CHANGES IN NET ASSETS
These statements describe the increases and/or decreases in net assets resulting from operations, any distributions, and any shareholder transactions.
| Six months ended 6/30/10 (unaudited | ) | Year ended 12/31/09 | | |||
Change in net assets | ||||||
From operations | ||||||
Net investment income | $7,431,596 | $11,978,050 | ||||
Net realized gain (loss) on investments | 5,152,171 | 6,327,998 | ||||
Net unrealized gain (loss) on investments | 7,515,115 | 22,614,637 | ||||
Change in net assets from operations | $20,098,882 | $40,920,685 | ||||
Distributions declared to shareholders | ||||||
From net investment income | $(13,266,265 | ) | $(10,538,492 | ) | ||
From net realized gain on investments | (1,375,381 | ) | — | |||
Total distributions declared to shareholders | $(14,641,646 | ) | $(10,538,492 | ) | ||
Change in net assets from fund share transactions | $116,010,986 | $132,743,276 | ||||
Total change in net assets | $121,468,222 | $163,125,469 | ||||
Net assets | ||||||
At beginning of period | 362,627,391 | 199,501,922 | ||||
At end of period (including undistributed net investment income of $7,430,013 and | $484,095,613 | $362,627,391 |
See Notes to Financial Statements
14
Table of Contents
MFS Research Bond Series
FINANCIAL STATEMENTS | FINANCIAL HIGHLIGHTS
The financial highlights table is intended to help you understand the fund’s financial performance for the semiannual period and the past 5 fiscal years. Certain information reflects financial results for a single fund share. The total returns in the table represent the rate by which an investor would have earned (or lost) on an investment in the fund share class (assuming reinvestment of all distributions) held for the entire period.
| Initial Class | Six months ended 6/30/10 | Years ended 12/31 | ||||||||||||||||
| 2009 | 2008 | 2007 | 2006 | 2005 | ||||||||||||||
| (unaudited) | ||||||||||||||||||
Net asset value, beginning of period | $12.20 | $11.00 | $11.60 | $11.51 | $11.61 | $12.16 | ||||||||||||
| Income (loss) from investment operations | ||||||||||||||||||
Net investment income (d) | �� | $0.22 | $0.51 | $0.52 | $0.55 | $0.53 | $0.51 | |||||||||||
Net realized and unrealized gain (loss) on | 0.37 | 1.20 | (0.78 | ) | (0.08 | ) | (0.08 | ) | (0.34 | ) | ||||||||
Total from investment operations | $0.59 | $1.71 | $(0.26 | ) | $0.47 | $0.45 | $0.17 | |||||||||||
| Less distributions declared to shareholders | ||||||||||||||||||
From net investment income | $(0.39 | ) | $(0.51 | ) | $(0.34 | ) | $(0.38 | ) | $(0.49 | ) | $(0.62 | ) | ||||||
From net realized gain on investments | (0.04 | ) | — | — | — | (0.06 | ) | (0.10 | ) | |||||||||
Total distributions declared to shareholders | $(0.43 | ) | $(0.51 | ) | $(0.34 | ) | $(0.38 | ) | $(0.55 | ) | $(0.72 | ) | ||||||
Net asset value, end of period | $12.36 | $12.20 | $11.00 | $11.60 | $11.51 | $11.61 | ||||||||||||
Total return (%) (k)(r)(s) | 4.92 | (n) | 16.16 | (2.37 | ) | 4.21 | 4.05 | 1.51 | ||||||||||
| Ratios (%) (to average net assets) and Supplemental data: | ||||||||||||||||||
Expenses before expense reductions (f) | 0.59 | (a) | 0.62 | 0.74 | 0.77 | 0.94 | 1.12 | |||||||||||
Expenses after expense reductions (f) | 0.59 | (a) | 0.62 | 0.64 | 0.67 | 0.70 | 0.73 | |||||||||||
Net investment income | 3.64 | (a) | 4.38 | 4.63 | 4.80 | 4.69 | 4.40 | |||||||||||
Portfolio turnover | 41 | 113 | 115 | 74 | 51 | 88 | ||||||||||||
Net assets at end of period (000 omitted) | $360,437 | $317,851 | $184,984 | $139,275 | $66,875 | $36,738 | ||||||||||||
See Notes to Financial Statements
15
Table of Contents
MFS Research Bond Series
Financial Highlights – continued
| Service Class | Six months ended 6/30/10 | Years ended 12/31 | ||||||||||||||||
| 2009 | 2008 | 2007 | 2006 | 2005 | ||||||||||||||
| (unaudited) | ||||||||||||||||||
Net asset value, beginning of period | $12.10 | $10.91 | $11.51 | $11.43 | $11.54 | $12.11 | ||||||||||||
| Income (loss) from investment operations | ||||||||||||||||||
Net investment income (d) | $0.20 | $0.47 | $0.49 | $0.52 | $0.50 | $0.48 | ||||||||||||
Net realized and unrealized gain (loss) on | 0.37 | 1.20 | (0.78 | ) | (0.08 | ) | (0.08 | ) | (0.35 | ) | ||||||||
Total from investment operations | $0.57 | $1.67 | $(0.29 | ) | $0.44 | $0.42 | $0.13 | |||||||||||
| Less distributions declared to shareholders | ||||||||||||||||||
From net investment income | $(0.38 | ) | $(0.48 | ) | $(0.31 | ) | $(0.36 | ) | $(0.47 | ) | $(0.60 | ) | ||||||
From net realized gain on investments | (0.04 | ) | — | — | — | (0.06 | ) | (0.10 | ) | |||||||||
Total distributions declared to shareholders | $(0.42 | ) | $(0.48 | ) | $(0.31 | ) | $(0.36 | ) | $(0.53 | ) | $(0.70 | ) | ||||||
Net asset value, end of period | $12.25 | $12.10 | $10.91 | $11.51 | $11.43 | $11.54 | ||||||||||||
Total return (%) (k)(r)(s) | 4.81 | (n) | 15.91 | (2.64 | ) | 3.92 | 3.79 | 1.22 | ||||||||||
| Ratios (%) (to average net assets) and Supplemental data: | ||||||||||||||||||
Expenses before expense reductions (f) | 0.84 | (a) | 0.87 | 0.99 | 1.03 | 1.20 | 1.37 | |||||||||||
Expenses after expense reductions (f) | 0.84 | (a) | 0.87 | 0.89 | 0.93 | 0.95 | 0.98 | |||||||||||
Net investment income | 3.34 | (a) | 4.07 | 4.37 | 4.55 | 4.44 | 4.16 | |||||||||||
Portfolio turnover | 41 | 113 | 115 | 74 | 51 | 88 | ||||||||||||
Net assets at end of period (000 omitted) | $123,659 | $44,776 | $14,518 | $18,347 | $16,822 | $12,860 | ||||||||||||
| (a) | Annualized. |
| (d) | Per share data is based on average shares outstanding. |
| (f) | Ratios do not reflect reductions from fees paid indirectly, if applicable. |
| (k) | The total return does not reflect expenses that apply to separate accounts. Inclusion of these charges would reduce the total return figures for all periods shown. |
| (n) | Not annualized. |
| (r) | Certain expenses have been reduced without which performance would have been lower. |
| (s) | From time to time the fund may receive proceeds from litigation settlements, without which performance would be lower. |
See Notes to Financial Statements
16
Table of Contents
MFS Research Bond Series
NOTES TO FINANCIAL STATEMENTS (unaudited)
| (1) | Business and Organization |
MFS Research Bond Series (the fund) is a series of MFS Variable Insurance Trust (the trust). The trust is organized as a Massachusetts business trust and is registered under the Investment Company Act of 1940, as amended, as an open-end management investment company. The shareholders of each series of the trust are separate accounts of insurance companies, which offer variable annuity and/or life insurance products, and qualified retirement and pension plans.
| (2) | Significant Accounting Policies |
General – The preparation of financial statements in conformity with U.S. generally accepted accounting principles requires management to make estimates and assumptions that affect the reported amounts of assets and liabilities, and disclosure of contingent assets and liabilities at the date of the financial statements and the reported amounts of revenues and expenses during the reporting period. Actual results could differ from those estimates. In the preparation of these financial statements, management has evaluated subsequent events occurring after the date of the fund’s Statement of Assets and Liabilities through the date that the financial statements were issued. The fund may invest a significant portion of its assets in asset-backed and/or mortgage-backed securities. The value of these securities may depend, in part, on the issuer’s or borrower’s credit quality or ability to pay principal and interest when due and may fall if an issuer or borrower defaults on its obligation to pay principal or interest or if the instrument’s credit rating is downgraded by a credit rating agency. U.S. Government securities not supported as to the payment of principal or interest by the U.S. Treasury, such as those issued by Fannie Mae, Freddie Mac, and the Federal Home Loan Banks, are subject to greater credit risk than are U.S. Government securities supported by the U.S. Treasury, such as those issued by Ginnie Mae. The fund can invest in foreign securities, including securities of emerging market issuers. Investments in foreign securities are vulnerable to the effects of changes in the relative values of the local currency and the U.S. dollar and to the effects of changes in each country’s legal, political, and economic environment. The markets of emerging markets countries are generally more volatile than the markets of developed countries with more mature economies. All of the risks of investing in foreign securities previously described are heightened when investing in emerging markets countries.
Investment Valuations – Debt instruments and floating rate loans (other than short-term instruments), including restricted debt instruments, are generally valued at an evaluated or composite bid as provided by a third-party pricing service. Short-term instruments with a maturity at issuance of 60 days or less generally are valued at amortized cost, which approximates market value. Swaps are generally valued at valuations provided by a third-party pricing service. Open-end investment companies are generally valued at net asset value per share. Securities and other assets generally valued on the basis of information from a third-party pricing service may also be valued at a broker/dealer bid quotation. Values obtained from third-party pricing services can utilize both transaction data and market information such as yield, quality, coupon rate, maturity, type of issue, trading characteristics, and other market data. The values of foreign securities and other assets and liabilities expressed in foreign currencies are converted to U.S. dollars using the mean of bid and asked prices for rates provided by a third-party pricing service.
The Board of Trustees has delegated primary responsibility for determining or causing to be determined the value of the fund’s investments (including any fair valuation) to the adviser pursuant to valuation policies and procedures approved by the Board. If the adviser determines that reliable market quotations are not readily available, investments are valued at fair value as determined in good faith by the adviser in accordance with such procedures under the oversight of the Board of Trustees. Under the fund’s valuation policies and procedures, market quotations are not considered to be readily available for most types of debt instruments and floating rate loans and many types of derivatives. These investments are generally valued at fair value based on information from third-party pricing services. In addition, investments may be valued at fair value if the adviser determines that an investment’s value has been materially affected by events occurring after the close of the exchange or market on which the investment is principally traded (such as foreign exchange or market) and prior to the determination of the fund’s net asset value, or after the halting of trading of a specific security where trading does not resume prior to the close of the exchange or market on which the security is principally traded. The adviser generally relies on third-party pricing services or other information (such as the correlation with price movements of similar securities in the same or other markets; the type, cost and investment characteristics of the security; the business and financial condition of the issuer; and trading and other market data) to assist in determining whether to fair value and at what value to fair value an investment. The value of an investment for purposes of calculating the fund’s net asset value can differ depending on the source and method used to determine value. When fair valuation is used, the value of an investment used to determine the fund’s net asset value may differ from quoted or published prices for the same investment. There can be no assurance that the fund could obtain the fair value assigned to an investment if it were to sell the investment at the same time at which the fund determines its net asset value per share.
17
Table of Contents
MFS Research Bond Series
Notes to Financial Statements (unaudited) – continued
Various inputs are used in determining the value of the fund’s assets or liabilities. These inputs are categorized into three broad levels. In certain cases, the inputs used to measure fair value may fall into different levels of the fair value hierarchy. In such cases, an investment’s level within the fair value hierarchy is based on the lowest level of input that is significant to the fair value measurement. The fund’s assessment of the significance of a particular input to the fair value measurement in its entirety requires judgment, and considers factors specific to the investment. Level 1 includes unadjusted quoted prices in active markets for identical assets or liabilities. Level 2 includes other significant observable market-based inputs (including quoted prices for similar securities, interest rates, prepayment speed, and credit risk). Level 3 includes unobservable inputs, which may include the adviser’s own assumptions in determining the fair value of investments. Other financial instruments are derivative instruments not reflected in total investments, such as futures, forwards, swap contracts, and written options. The following is a summary of the levels used as of June 30, 2010 in valuing the fund’s assets or liabilities:
| Investments at Value | Level 1 | Level 2 | Level 3 | Total | ||||
| U.S. Treasury Bonds & U.S. Government Agency & Equivalents | $— | $159,682,132 | $— | $159,682,132 | ||||
| Non-U.S. Sovereign Debt | — | 10,389,305 | — | 10,389,305 | ||||
| Municipal Bonds | — | 7,665,784 | — | 7,665,784 | ||||
| Corporate Bonds | — | 139,413,079 | — | 139,413,079 | ||||
| Residential Mortgage-Backed Securities | — | 69,923,784 | — | 69,923,784 | ||||
| Commercial Mortgage-Backed Securities | — | 25,387,670 | — | 25,387,670 | ||||
| Asset-Backed Securities (including CDOs) | — | 11,345,340 | — | 11,345,340 | ||||
| Foreign Bonds | — | 38,293,784 | — | 38,293,784 | ||||
| Floating Rate Loans | — | 680,718 | — | 680,718 | ||||
| Mutual Funds | 35,144,813 | — | — | 35,144,813 | ||||
| Total Investments | $35,144,813 | $462,781,596 | $— | $497,926,409 |
For further information regarding security characteristics, see the Portfolio of Investments.
Inflation-Adjusted Debt Securities – The fund invests in inflation-adjusted debt securities issued by the U.S. Treasury. The fund may also invest in inflation-adjusted debt securities issued by U.S. Government agencies and instrumentalities other than the U.S. Treasury and by other entities such as U.S. and foreign corporations and foreign governments. The principal value of these debt securities is adjusted through income according to changes in the Consumer Price Index or another general price or wage index. These debt securities typically pay a fixed rate of interest, but this fixed rate is applied to the inflation-adjusted principal amount. The principal paid at maturity of the debt security is typically equal to the inflation-adjusted principal amount, or the security’s original par value, whichever is greater. Other types of inflation-adjusted securities may use other methods to adjust for other measures of inflation.
Derivatives – The fund may use derivatives for different purposes, including to earn income and enhance returns, to increase or decrease exposure to a particular market, to manage or adjust the risk profile of the fund, or as alternatives to direct investments. Derivatives may be used for hedging or non-hedging purposes. While hedging can reduce or eliminate losses, it can also reduce or eliminate gains. When the fund uses derivatives as an investment to increase market exposure, or for hedging purposes, gains and losses from derivative instruments may be substantially greater than the derivative’s original cost.
Derivative instruments include written options, purchased options, futures contracts, forward foreign currency exchange contracts, and swap agreements. At June 30, 2010, the fund did not have any outstanding derivative instruments.
The following table presents, by major type of derivative contract, the realized gain (loss) on derivatives held by the fund for the six months ended June 30, 2010 as reported in the Statement of Operations:
| Swap Transactions | |||
| Credit Contracts | $(78,080 | ) |
Derivative counterparty credit risk is managed through formal evaluation of the creditworthiness of all potential counterparties. On certain over-the-counter derivatives, the fund attempts to reduce its exposure to counterparty credit risk whenever possible by entering into an International Swaps and Derivatives Association (ISDA) Master Agreement on a bilateral basis with each of the counterparties with whom it undertakes a significant volume of transactions. The ISDA Master Agreement gives each party to the agreement the right to terminate all transactions traded under such agreement if there is a certain deterioration in the credit quality of the other party. The ISDA Master Agreement gives the fund the right, upon an event of default by the applicable counterparty or a termination of the agreement, to close out all transactions traded under such agreement and to net amounts owed under each transaction to one net amount payable by one party to the other. This right to close out and net payments across all transactions traded under the ISDA Master Agreement could result in a reduction of the fund’s credit risk to such counterparty equal to any amounts payable by the fund under the applicable transactions, if
18
Table of Contents
MFS Research Bond Series
Notes to Financial Statements (unaudited) – continued
any. However, absent an event of default by the counterparty or a termination of the agreement, the ISDA Master Agreement does not result in an offset of reported balance sheet assets and liabilities across transactions between the fund and the applicable counterparty.
Collateral requirements differ by type of derivative. Collateral or margin requirements are set by the broker or exchange clearing house for exchange traded derivatives (i.e., futures and exchange-traded options) while collateral terms are contract specific for over-the-counter traded derivatives (i.e., forwards, swaps and over-the-counter options). For derivatives traded under an ISDA Master Agreement, the collateral requirements are netted across all transactions traded under such agreement and one amount is posted from one party to the other to collateralize such obligations. Cash collateral that has been pledged to cover obligations of the fund under derivative contracts will be reported separately on the Statement of Assets and Liabilities as restricted cash. Securities collateral pledged for the same purpose is noted in the Portfolio of Investments.
Swap Agreements – The fund may enter into swap agreements. A swap is generally an exchange of cash payments, at specified intervals or upon the occurrence of specified events, between the fund and a counterparty. The net cash payments exchanged are recorded as a realized gain or loss on swap transactions in the Statement of Operations. The value of the swap, which is adjusted daily and includes any related interest accruals to be paid or received by the fund, is recorded on the Statement of Assets and Liabilities. The daily change in value, including any related interest accruals to be paid or received, is recorded as unrealized appreciation or depreciation on swap transactions in the Statement of Operations. Amounts paid or received at the inception of the swap are reflected as premiums paid or received on the Statement of Assets and Liabilities and are amortized using the effective interest method over the term of the agreement. A liquidation payment received or made upon early termination is recorded as a realized gain or loss on swap transactions in the Statement of Operations.
Risks related to swap agreements include the possible lack of a liquid market, unfavorable market and interest rate movements of the underlying instrument and the failure of the counterparty to perform under the terms of the agreements. To address counterparty risk, swap transactions are limited to only highly-rated counterparties. The risk is further mitigated by having an ISDA Master Agreement between the fund and the counterparty providing for netting as described above and by the posting of collateral by the counterparty to the fund to cover the fund’s exposure to the counterparty under such ISDA Master Agreement.
The fund may enter into credit default swaps to manage its exposure to the market or certain sectors of the market, to reduce its credit risk exposure to defaults of corporate and sovereign issuers or to create exposure to corporate or sovereign issuers to which it is not otherwise exposed. In a credit default swap, the protection buyer can make an upfront payment and will make a stream of payments based on a fixed percentage applied to the contract notional amount to the protection seller in exchange for the right to receive a specified return upon the occurrence of a defined credit event on the reference obligation (which may be either a single security or a basket of securities issued by corporate or sovereign issuers) and, with respect to the rare cases where physical settlement applies, the delivery by the buyer to the seller of a defined deliverable obligation. Although contract-specific, credit events generally consist of a combination of the following: bankruptcy, failure to pay, restructuring, obligation acceleration, obligation default, or repudiation/moratorium, each as defined in the 2003 ISDA Credit Derivatives Definitions as amended by the relevant contract. Restructuring is generally not applicable when the reference obligation is issued by a North American corporation and obligation acceleration, obligation default, or repudiation/moratorium are generally only applicable when the reference obligation is issued by a sovereign entity or an entity in an emerging country. Upon determination of the final price for the deliverable obligation (or upon delivery of the deliverable obligation in the case of physical settlement), the difference between the value of the deliverable obligation and the swap’s notional amount is recorded as realized gain or loss on swap transactions in the Statement of Operations.
The fund’s maximum risk of loss from counterparty risk, either as the protection seller or as the protection buyer, is the fair value of the contract. This risk is mitigated by having an ISDA Master Agreement between the fund and the counterparty providing for netting as described above and by the posting of collateral by the counterparty to the fund to cover the fund’s exposure to the counterparty under such ISDA Master Agreement.
Loans and Other Direct Debt Instruments – The fund may invest in loans and loan participations or other receivables. These investments may include standby financing commitments, including revolving credit facilities, which obligate the fund to supply additional cash to the borrower on demand. Loan participations involve a risk of insolvency of the lending bank or other financial intermediary.
Indemnifications – Under the fund’s organizational documents, its officers and Trustees may be indemnified against certain liabilities and expenses arising out of the performance of their duties to the fund. Additionally, in the normal course of business, the fund enters into agreements with service providers that may contain indemnification clauses. The fund’s maximum exposure under these agreements is unknown as this would involve future claims that may be made against the fund that have not yet occurred.
19
Table of Contents
MFS Research Bond Series
Notes to Financial Statements (unaudited) – continued
Investment Transactions and Income – Investment transactions are recorded on the trade date. Interest income is recorded on the accrual basis. All premium and discount is amortized or accreted for financial statement purposes in accordance with U.S. generally accepted accounting principles. The fund earns certain fees in connection with its floating rate loan purchasing activities. These fees are in addition to interest payments earned and may include amendment fees, commitment fees, facility fees, consent fees, and prepayment fees. Commitment fees are recorded on an accrual basis as income in the accompanying financial statements. Inflation-indexed bonds are fixed-income securities whose principal value is periodically adjusted upward or downward to the rate of inflation. Interest is accrued based on the principal value, which is adjusted for inflation. Any increase or decrease in the principal amount of an inflation-indexed bond is generally recorded as an increase or decrease in interest income, respectively, even though the adjusted principal is not received until maturity. Dividends received in cash are recorded on the ex-dividend date. Dividend and interest payments received in additional securities are recorded on the ex-dividend or ex-interest date in an amount equal to the value of the security on such date.
The fund may receive proceeds from litigation settlements. Any proceeds received from litigation involving portfolio holdings are reflected in the Statement of Operations in realized gain/loss if the security has been disposed of by the fund or in unrealized gain/loss if the security is still held by the fund. Any other proceeds from litigation not related to portfolio holdings are reflected as other income in the Statement of Operations.
The fund may enter into “TBA” (to be announced) purchase commitments to purchase securities for a fixed unit price at a future date. Although the unit price has been established, the principal value has not been finalized. However, the principal amount of the commitments will not fluctuate more than 0.01%. The fund holds, and maintains until settlement date, cash or high-grade debt obligations in an amount sufficient to meet the purchase price, or the fund may enter into offsetting contracts for the forward sale of other securities it owns. Income on the securities will not be earned until settlement date. TBA purchase commitments may be considered securities in themselves, and involve a risk of loss if the value of the security to be purchased declines prior to settlement date, which is in addition to the risk of decline in the value of the fund’s other assets. Unsettled TBA purchase commitments are valued at the current market value of the underlying securities.
Fees Paid Indirectly – The fund’s custody fee may be reduced according to an arrangement that measures the value of cash deposited with the custodian by the fund. This amount, for the six months ended June 30, 2010, is shown as a reduction of total expenses on the Statement of Operations.
Tax Matters and Distributions – The fund intends to qualify as a regulated investment company, as defined under Subchapter M of the Internal Revenue Code, and to distribute all of its taxable income, including realized capital gains. As a result, no provision for federal income tax is required. The fund’s federal tax returns for the prior three fiscal years remain subject to examination by the Internal Revenue Service. Foreign taxes, if any, have been accrued by the fund in the accompanying financial statements.
Distributions to shareholders are recorded on the ex-dividend date. Income and capital gain distributions are determined in accordance with income tax regulations, which may differ from U.S. generally accepted accounting principles. Certain capital accounts in the financial statements are periodically adjusted for permanent differences in order to reflect their tax character. These adjustments have no impact on net assets or net asset value per share. Temporary differences which arise from recognizing certain items of income, expense, gain or loss in different periods for financial statement and tax purposes will reverse at some time in the future. Distributions in excess of net investment income or net realized gains are temporary overdistributions for financial statement purposes resulting from differences in the recognition or classification of income or distributions for financial statement and tax purposes.
Book/tax differences primarily relate to amortization and accretion of debt securities and wash sale loss deferrals.
The tax character of distributions made during the current period, if any, will be determined at fiscal year end. The tax character of distributions declared to shareholders for the last fiscal year is as follows:
| 12/31/09 | ||
| Ordinary income (including any short-term capital gains) | $10,538,492 |
20
Table of Contents
MFS Research Bond Series
Notes to Financial Statements (unaudited) – continued
The federal tax cost and the tax basis components of distributable earnings were as follows:
| As of 6/30/10 | |||
| Cost of investments | $481,184,693 | ||
| Gross appreciation | 19,565,898 | ||
| Gross depreciation | (2,824,182 | ) | |
| Net unrealized appreciation (depreciation) | $16,741,716 | ||
| As of 12/31/09 | |||
| Undistributed ordinary income | 14,639,963 | ||
| Post-October capital loss deferral | (875,594 | ) | |
| Other temporary differences | (140,143 | ) | |
| Net unrealized appreciation (depreciation) | 9,567,527 | ||
The aggregate cost above includes prior fiscal year end tax adjustments, if applicable.
Multiple Classes of Shares of Beneficial Interest – The fund offers multiple classes of shares, which differ in their respective distribution and/or service fees. The fund’s income, realized and unrealized gain (loss), and common expenses are allocated to shareholders based on the daily net assets of each class. Dividends are declared separately for each class. Differences in per share dividend rates are generally due to differences in separate class expenses. The fund’s distributions declared to shareholders as reported on the Statements of Changes in Net Assets are presented by class as follows:
| From net investment income | From net realized gain on investments | |||||||
| Six months ended 6/30/10 | Year ended 12/31/09 | Six months ended 6/30/10 | Year ended 12/31/09 | |||||
| Initial Class | $10,520,871 | $9,789,031 | $1,086,136 | $— | ||||
| Service Class | 2,745,394 | 749,461 | 289,245 | — | ||||
| Total | $13,266,265 | $10,538,492 | $1,375,381 | $— | ||||
| (3) | Transactions with Affiliates |
Investment Adviser – The fund has an investment advisory agreement with MFS to provide overall investment management and related administrative services and facilities to the fund. The management fee is computed daily and paid monthly at an annual rate of 0.50% of the fund’s average daily net assets.
Prior to May 1, 2010, the investment adviser had agreed in writing to pay a portion of the fund’s operating expenses, exclusive of management fee, distribution and/or service fees, interest, taxes, extraordinary expenses, brokerage and transaction costs and investment-related expenses, such that operating expenses do not exceed 0.20% of the fund’s average daily net assets. This written agreement terminated on April 30, 2010. For the period January 1, 2010 through April 30, 2010, the fund’s actual operating expenses did not exceed the limit and therefore, the investment adviser did not pay any portion of the fund’s expenses.
Effective May 1, 2010, the investment adviser has agreed in writing to pay a portion of the fund’s total annual operating expenses, exclusive of interest, taxes, extraordinary expenses, brokerage and transaction costs and investment-related expenses, such that total annual operating expenses do not exceed 0.70% of average daily net assets for the Initial Class shares and 0.95% of average daily net assets for the Service Class shares. This written agreement will continue until modified by the fund’s Board of Trustees, but such agreement will continue at least until April 30, 2012. For the period May 1, 2010 through June 30, 2010, the fund’s actual operating expenses did not exceed the limit and therefore, the investment adviser did not pay any portion of the fund’s expenses.
Distributor – MFS Fund Distributors, Inc. (MFD), a wholly-owned subsidiary of MFS, is the distributor of shares of the fund. The Trustees have adopted a distribution plan for the Service Class shares pursuant to Rule 12b-1 under the Investment Company Act of 1940.
The fund’s distribution plan provides that the fund will pay MFD distribution and/or service fees equal to 0.25% per annum of its average daily net assets attributable to Service Class shares as partial consideration for services performed and expenses incurred by MFD and financial intermediaries (including participating insurance companies that invest in the fund to fund variable annuity and variable life insurance contracts, sponsors of qualified retirement and pension plans that invest in the fund, and affiliates of these participating insurance companies and plan sponsors) in connection with the sale and distribution of the Service Class shares. MFD may subsequently pay all, or a portion, of the distribution and/or service fees to financial intermediaries.
Shareholder Servicing Agent – MFS Service Center, Inc. (MFSC), a wholly-owned subsidiary of MFS, receives a fee from the fund for its services as shareholder servicing agent. For the six months ended June 30, 2010, the fee was $24,781, which
21
Table of Contents
MFS Research Bond Series
Notes to Financial Statements (unaudited) – continued
equated to 0.0120% annually of the fund’s average daily net assets. MFSC also receives payment from the fund for out-of-pocket expenses paid by MFSC on behalf of the fund. For the six months ended June 30, 2010, these costs amounted to $202.
Administrator – MFS provides certain financial, legal, shareholder communications, compliance, and other administrative services to the fund. Under an administrative services agreement, the fund partially reimburses MFS the costs incurred to provide these services. The fund is charged an annual fixed amount of $17,500 plus a fee based on average daily net assets. The administrative services fee incurred for the six months ended June 30, 2010 was equivalent to an annual effective rate of 0.0166% of the fund’s average daily net assets.
Trustees’ and Officers’ Compensation – The fund pays compensation to independent Trustees in the form of a retainer, attendance fees, and additional compensation to Board and Committee chairpersons. The fund does not pay compensation directly to Trustees or officers of the fund who are also officers of the investment adviser, all of whom receive remuneration for their services to the fund from MFS. Certain officers and Trustees of the fund are officers or directors of MFS, MFD, and MFSC.
Other – This fund and certain other funds managed by MFS (the funds) have entered into services agreements (the Agreements) which provide for payment of fees by the funds to Tarantino LLC and Griffin Compliance LLC in return for the provision of services of an Independent Chief Compliance Officer (ICCO) and Assistant ICCO, respectively, for the funds. The ICCO and Assistant ICCO are officers of the funds and the sole members of Tarantino LLC and Griffin Compliance LLC, respectively. The funds can terminate the Agreements with Tarantino LLC and Griffin Compliance LLC at any time under the terms of the Agreements. For the six months ended June 30, 2010, the aggregate fees paid by the fund to Tarantino LLC and Griffin Compliance LLC were $1,647 and are included in miscellaneous expense on the Statement of Operations. MFS has agreed to reimburse the fund for a portion of the payments made by the fund in the amount of $1,323, which is shown as a reduction of total expenses in the Statement of Operations. Additionally, MFS has agreed to bear all expenses associated with office space, other administrative support, and supplies provided to the ICCO and Assistant ICCO.
The fund may invest in the MFS Institutional Money Market Portfolio which is managed by MFS and seeks a high level of current income consistent with preservation of capital and liquidity. Income earned on this investment is included in dividends from underlying funds on the Statement of Operations. This money market fund does not pay a management fee to MFS.
| (4) | Portfolio Securities |
Purchases and sales of investments, other than purchased option transactions, and short-term obligations, were as follows:
| Purchases | Sales | |||
| U.S. Government securities | $141,586,169 | $89,539,219 | ||
| Investments (non-U.S. Government securities) | $115,314,805 | $75,743,725 |
| (5) | Shares of Beneficial Interest |
The fund’s Declaration of Trust permits the Trustees to issue an unlimited number of full and fractional shares of beneficial interest. Transactions in fund shares were as follows:
| Six months ended 6/30/10 | Year ended 12/31/09 | |||||||||||
| Shares | Amount | Shares | Amount | |||||||||
| Shares sold | ||||||||||||
Initial Class | 3,830,330 | $47,139,291 | 10,898,490 | $124,223,834 | ||||||||
Service Class | 6,441,622 | 78,734,321 | 2,666,457 | 31,302,047 | ||||||||
| 10,271,952 | $125,873,612 | 13,564,947 | $155,525,881 | |||||||||
| Shares issued to shareholders in reinvestment of distributions | ||||||||||||
Initial Class | 955,309 | $11,607,007 | 908,073 | $9,789,031 | ||||||||
Service Class | 251,837 | 3,034,639 | 69,978 | 749,461 | ||||||||
| 1,207,146 | $14,641,646 | 978,051 | $10,538,492 | |||||||||
| Shares reacquired | ||||||||||||
Initial Class | (1,684,221 | ) | $(20,833,187 | ) | (2,569,223 | ) | $(29,173,094 | ) | ||||
Service Class | (300,982 | ) | (3,671,085 | ) | (366,587 | ) | (4,148,003 | ) | ||||
| (1,985,203 | ) | $(24,504,272 | ) | (2,935,810 | ) | $(33,321,097 | ) | |||||
| Net change | ||||||||||||
Initial Class | 3,101,418 | $37,913,111 | 9,237,340 | $104,839,771 | ||||||||
Service Class | 6,392,477 | 78,097,875 | 2,369,848 | 27,903,505 | ||||||||
| 9,493,895 | $116,010,986 | 11,607,188 | $132,743,276 | |||||||||
22
Table of Contents
MFS Research Bond Series
Notes to Financial Statements (unaudited) – continued
| (6) | Line of Credit |
The fund and certain other funds managed by MFS participate in a $1.1 billion unsecured committed line of credit, subject to a $1 billion sublimit, provided by a syndication of banks under a credit agreement. Borrowings may be made for temporary financing needs. Interest is charged to each fund, based on its borrowings, generally at a rate equal to the higher of the Federal Reserve funds rate or one month LIBOR plus an agreed upon spread. A commitment fee, based on the average daily, unused portion of the committed line of credit, is allocated among the participating funds at the end of each calendar quarter. In addition, the fund and other funds managed by MFS have established unsecured uncommitted borrowing arrangements with certain banks for temporary financing needs. Interest is charged to each fund, based on its borrowings, at a rate equal to the Federal Reserve funds rate plus an agreed upon spread. For the six months ended June 30, 2010, the fund’s commitment fee and interest expense were $2,587 and $0, respectively, and are included in miscellaneous expense on the Statement of Operations.
| (7) | Transactions in Underlying Funds – Affiliated Issuers |
An affiliated issuer may be considered one in which the fund owns 5% or more of the outstanding voting securities, or a company which is under common control. For the purposes of this report, the fund assumes the following to be affiliated issuers:
| Underlying Funds | Beginning Share/Par Amount | Acquisitions Shares/Par Amount | Dispositions Shares/Par Amount | Ending Share/Par Amount | |||||
| MFS Institutional Money Market Portfolio | 5,260,136 | 147,131,855 | (117,247,178 | ) | 35,144,813 | ||||
| Underlying Funds | Realized Gain (Loss) | Capital Gain Distributions | Dividend Income | Ending Value | |||||
| MFS Institutional Money Market Portfolio | $— | $— | $9,245 | $35,144,813 | |||||
23
Table of Contents
MFS Research Bond Series
RESULTS OF SHAREHOLDER MEETING (unaudited)
At a special meeting of shareholders of MFS Variable Insurance Trust, which was held on January 28, 2010, the following actions were taken:
Item 1. To elect the following individuals as Trustees:
| Number of Dollars | ||||
| Nominee | For | Withheld Authority | ||
| Robert E. Butler | 6,823,651,821.26 | 1,818,252,669.55 | ||
| Lawrence H. Cohn, M.D. | 6,813,621,200.14 | 1,828,283,290.67 | ||
| Maureen R. Goldfarb | 6,825,332,620.76 | 1,816,571,870.05 | ||
| David H. Gunning | 6,823,081,841.37 | 1,818,822,649.44 | ||
| William R. Gutow | 6,813,678,877.22 | 1,828,225,613.59 | ||
| Michael Hegarty | 6,827,456,515.87 | 1,814,447,974.94 | ||
| John P. Kavanaugh | 6,830,363,113.12 | 1,811,541,377.69 | ||
| Robert J. Manning | 6,825,511,264.17 | 1,816,393,226.64 | ||
| Robert C. Pozen | 6,824,854,120.27 | 1,817,050,370.54 | ||
| J. Dale Sherratt | 6,816,913,203.87 | 1,824,991,286.94 | ||
| Laurie J. Thomsen | 6,823,590,745.56 | 1,818,313,745.25 | ||
| Robert W. Uek | 6,818,161,803.66 | 1,823,742,687.15 | ||
24
Table of Contents
MFS Research Bond Series
BOARD REVIEW OF INVESTMENT ADVISORY AGREEMENT
A discussion regarding the Board’s most recent review and renewal of the fund’s Investment Advisory Agreement with MFS will be available on or about November 1, 2010 by clicking on the fund’s name under ‘‘Variable Insurance Portfolios — VIT’’ in the ‘‘Products and Performance’’ section of the MFS Web site (mfs.com).
PROXY VOTING POLICIES AND INFORMATION
A general description of the MFS funds’ proxy voting policies and procedures is available without charge, upon request, by calling 1-800-225-2606, by visiting the Proxy Voting section of mfs.com or by visiting the SEC’s Web site at http://www.sec.gov.
Information regarding how the fund voted proxies relating to portfolio securities during the most recent twelve-month period ended June 30 is available without charge by visiting the Proxy Voting section of mfs.com or by visiting the SEC’s Web site at http://www.sec.gov.
QUARTERLY PORTFOLIO DISCLOSURE
The fund will file a complete schedule of portfolio holdings with the Securities and Exchange Commission (the Commission) for the first and third quarters of each fiscal year on Form N-Q. The fund’s Form N-Q may be reviewed and copied at the:
Public Reference Room
Securities and Exchange Commission
100 F Street, NE, Room 1580
Washington, D.C. 20549
Information on the operation of the Public Reference Room may be obtained by calling the Commission at 1-800-SEC-0330. The fund’s Form N-Q is available on the EDGAR database on the Commission’s Internet Web site at http://www.sec.gov, and copies of this information may be obtained, upon payment of a duplicating fee, by electronic request at the following e-mail address: publicinfo@sec.gov or by writing the Public Reference Section at the above address.
From time to time, MFS may post important information about the fund or the MFS funds on the MFS web site (mfs.com). This information is available by visiting the “News & Commentary” section of mfs.com or by clicking on the fund’s name under “Variable Insurance Portfolios — VIT” in the “Products and Performance” section of mfs.com.
25
Table of Contents

Table of Contents
Table of Contents
This report is prepared for the general information of contract owners. It is authorized for distribution to prospective investors only when preceded or accompanied by a current prospectus.
NOT FDIC INSURED Ÿ MAY LOSE VALUE Ÿ NO BANK GUARANTEE Ÿ NOT A DEPOSIT Ÿ NOT INSURED BY ANY FEDERAL GOVERNMENT AGENCY OR NCUA/NCUSIF
Table of Contents
MFS High Income Series

Dear Contract Owners:
After having suffered their biggest declines since the Great Depression, most global markets experienced an impressive resurgence during the latter months of 2009 and the first quarter of 2010. The global economy was able to reap the benefits of two major trends. The first of these was the massive efforts of governments and central banks to increase liquidity in the financial system as they sought to prevent the credit crisis from further affecting the banking system. The second was the move by companies around the world to cut costs and operations to prepare for rapidly changing market conditions. We believe that these moves not only shortened the length of the downturn but also set the stage for recovery.
Even with the significant market gains of 2009 and the early part of 2010, the recovery is unrolling at a moderate pace, with rebounds in the manufacturing sector and corporate America leading the way. Central bankers are proceeding with caution and many have held benchmark interest rates unchanged as they debate the best way to withdraw stimulus measures without disrupting the fragile growth process. Complicating that debate late in the period was the emergence of the European debt crisis and worries about whether this crisis could derail the global recovery. As that crisis unrolled with no clear resolution, risk aversion rose along with volatility. Weakening economic data late in the period added uncertainty to the mix and sparked a retrenchment in global equity markets.
While hurdles remain, we believe that the global economy is proceeding on the road to recovery. As always, we continue to be mindful of the many challenges faced at the individual, national, and international levels. It is at times such as these that we want to remind investors of the merits of maintaining a long-term view, adhering to basic investing principles such as asset allocation and diversification, and working closely with advisors to identify and research investment opportunities. At MFS®, we take particular pride in how well mutual funds can provide a broad range of products that can fit investor needs in any type of market climate.
Respectfully,

Robert J. Manning
Chairman and Chief Executive Officer
MFS Investment Management®
August 16, 2010
The opinions expressed in this letter are subject to change, may not be relied upon for investment advice, and no forecasts can be guaranteed.
MFS Fund Distributors, Inc., 500 Boylston Street, Boston, MA 02116
1
Table of Contents
MFS High Income Series
Portfolio structure (i)
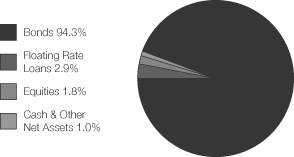
| Top five industries (i) | ||
| Medical & Health Technology & Services | 7.9% | |
| Energy – Independent | 6.3% | |
| Broadcasting | 6.1% | |
| Gaming & Lodging | 5.1% | |
| Telecommunications – Wireless | 5.0% |
| Composition including fixed income credit quality (a)(i) | ||
| A | 0.1% | |
| BBB | 3.7% | |
| BB | 28.0% | |
| B | 43.3% | |
| CCC | 19.9% | |
| CC | 0.1% | |
| C | 0.3% | |
| D | 0.3% | |
| Cash & Other (NR) | 2.5% | |
| Non-Fixed Income (NR) | 1.8% | |
| Portfolio facts (i) | ||
| Average Duration (d) | 4.5 | |
| Average Effective Maturity (m) | 7.0 yrs. | |
| (a) | The rating categories (e.g., AAA) include debt securities and fixed income structured products which have long-term public ratings. All other assets are not rated (NR). All rated securities are assigned a rating in accordance with the following ratings hierarchy: If a security is rated by Moody’s, then that rating is used; if not rated by Moody’s, then a Standard & Poor’s rating is used; if not rated by S&P, then a Fitch rating is used. Ratings from Moody’s (e.g., Aaa) are shown in the S&P and Fitch scale (e.g., AAA). All ratings are subject to change. |
| The Cash & Other (NR) category includes: cash, other assets less liabilities (including any derivative offsets), short-term securities, and unrated fixed income securities. |
| The Non-Fixed Income (NR) category includes equity securities (including convertible bonds), commodities, and any associated derivatives. |
| (d) | Duration is a measure of how much a bond’s price is likely to fluctuate with general changes in interest rates, e.g., if rates rise 1.00%, a bond with a 5-year duration is likely to lose about 5.00% of its value. |
| (i) | For purposes of this presentation, the components include the market value of securities, and reflect the impact of the equivalent exposure of derivative positions, if applicable. These amounts may be negative from time to time. The bond component will include any accrued interest amounts. Equivalent exposure is a calculated amount that translates the derivative position into a reasonable approximation of the amount of the underlying asset that the portfolio would have to hold at a given point in time to have the same price sensitivity that results from the portfolio’s ownership of the derivative contract. When dealing with derivatives, equivalent exposure is a more representative measure of the potential impact of a position on portfolio performance than market value. Where the fund holds convertible bonds, these are treated as part of the equity portion of the portfolio. |
| (m) | In determining an instrument’s effective maturity for purposes of calculating the fund’s dollar-weighted average effective maturity, MFS uses the instrument’s stated maturity or, if applicable, an earlier date on which MFS believes it is probable that a maturity-shortening device (such as a put, pre-refunding or prepayment) will cause the instrument to be repaid. Such an earlier date can be substantially shorter than the instrument’s stated maturity. |
Percentages are based on net assets as of 6/30/10, unless otherwise noted.
The portfolio is actively managed and current holdings may be different.
2
Table of Contents
MFS High Income Series
After having suffered through one of the largest and most concentrated downturns since the 1930s, most asset markets staged a remarkable rebound during 2009 and early 2010. This recovery in global activity has been led importantly by emerging Asian economies, but broadening to include most of the global economy to varying degrees. Primary drivers of the recovery included an unwinding of the inventory destocking that took place earlier, the production of manufacturing and capital goods, as well as massive fiscal and monetary stimulus.
Late in the period, though, heightened risk surrounding the public-debt profiles of several of the peripheral European countries impaired market sentiment. At the same time, the improving trend in global macroeconomic data began to weaken somewhat. These two dynamics caused most asset prices to retrench significantly, as many questioned the durability of the global recovery.
3
Table of Contents
MFS High Income Series
Fund Expenses Borne by the Contract Holders During the Period,
January 1, 2010 through June 30, 2010
As a contract holder of the fund, you incur ongoing costs, including management fees; distribution and/or service (12b-1) fees; and other fund expenses. This example is intended to help you understand your ongoing costs (in dollars) of investing in the fund and to compare these costs with the ongoing costs of investing in other mutual funds.
The example is based on an investment of $1,000 invested at the beginning of the period and held for the entire period January 1, 2010 through June 30, 2010.
Actual Expenses
The first line for each share class in the following table provides information about actual account values and actual expenses. You may use the information in this line, together with the amount you invested, to estimate the expenses that you paid over the period. Simply divide your account value by $1,000 (for example, an $8,600 account value divided by $1,000 = 8.6), then multiply the result by the number in the first line under the heading entitled “Expenses Paid During Period” to estimate the expenses you paid on your account during this period.
Hypothetical Example for Comparison Purposes
The second line for each share class in the following table provides information about hypothetical account values and hypothetical expenses based on the fund’s actual expense ratio and an assumed rate of return of 5% per year before expenses, which is not the fund’s actual return. The hypothetical account values and expenses may not be used to estimate the actual ending account balance or expenses you paid for the period. You may use this information to compare the ongoing costs of investing in the fund and other funds. To do so, compare this 5% hypothetical example with the 5% hypothetical examples that appear in the shareholder reports of the other funds.
Please note that the expenses shown in the table are meant to highlight the fund’s ongoing costs only and do not take into account the fees and expenses imposed under the variable contracts through which your investment in the fund is made. Therefore, the second line for each share class in the table is useful in comparing ongoing costs associated with an investment in vehicles (such as the fund) which fund benefits under variable annuity and variable life insurance contracts and to qualified pension and retirement plans only, and will not help you determine the relative total costs of investing in the fund through variable annuity and variable life insurance contracts. If the fees and expenses imposed under the variable contracts were included, your costs would have been higher.
| Share Class | Annualized Expense Ratio | Beginning Account Value 1/01/10 | Ending Account Value | Expenses Paid During Period (p) 1/01/10-6/30/10 | ||||||
| Initial Class | Actual | 0.80% | $1,000.00 | $1,040.17 | $4.05 | |||||
| Hypothetical (h) | 0.80% | $1,000.00 | $1,020.83 | $4.01 | ||||||
| Service Class | Actual | 1.05% | $1,000.00 | $1,039.26 | $5.31 | |||||
| Hypothetical (h) | 1.05% | $1,000.00 | $1,019.59 | $5.26 |
| (h) | 5% class return per year before expenses. |
| (p) | Expenses paid is equal to each class’ annualized expense ratio, as shown above, multiplied by the average account value over the period, multiplied by the number of days in the period, divided by the number of days in the year. |
4
Table of Contents
MFS High Income Series
PORTFOLIO OF INVESTMENTS – 6/30/10 (unaudited)
The Portfolio of Investments is a complete list of all securities owned by your fund. It is categorized by broad-based asset classes.
| Issuer | Shares/Par | Value ($) | ||||
| BONDS – 92.4% | ||||||
| Aerospace – 1.4% | ||||||
| BE Aerospace, Inc., 8.5%, 2018 | $ | 1,010,000 | $ | 1,060,500 | ||
| Bombardier, Inc., 7.5%, 2018 (n) | 850,000 | 875,500 | ||||
| Bombardier, Inc., 7.45%, 2034 (n) | 250,000 | 232,500 | ||||
| Hawker Beechcraft Acquisition Co. LLC, 8.5%, 2015 | 1,465,000 | 1,173,831 | ||||
| Oshkosh Corp., 8.25%, 2017 | 160,000 | 166,400 | ||||
| Oshkosh Corp., 8.5%, 2020 | 555,000 | 577,200 | ||||
| Spirit AeroSystems Holdings, Inc., 7.5%, 2017 | 485,000 | 475,300 | ||||
| $ | 4,561,231 | |||||
| Airlines – 0.7% | ||||||
| American Airlines Pass-Through Trust, 7.377%, 2019 | $ | 774,717 | $ | 635,268 | ||
| Continental Airlines, Inc., 7.339%, 2014 | 1,679,868 | 1,608,474 | ||||
| Continental Airlines, Inc., 6.748%, 2017 | 84,884 | 77,371 | ||||
| $ | 2,321,113 | |||||
| Apparel Manufacturers – 0.5% | ||||||
| Hanesbrands, Inc., 8%, 2016 | $ | 990,000 | $ | 1,003,613 | ||
| Phillips-Van Heusen Corp., 7.375%, 2020 | 710,000 | 716,213 | ||||
| $ | 1,719,826 | |||||
| Asset-Backed & Securitized – 0.8% | ||||||
| Airlie LCDO Ltd., CDO, FRN, 2.44%, 2011 (a)(p)(z) | $ | 721,695 | $ | 317,546 | ||
| Anthracite Ltd., CDO, 6%, 2037 (z) | 290,000 | 14,500 | ||||
| Arbor Realty Mortgage Securities, CDO, FRN, 2.605%, 2038 (z) | 595,494 | 29,775 | ||||
| ARCap REIT, Inc., CDO, “H”, 6.083%, 2045 (z) | 906,493 | 56,656 | ||||
| Babson Ltd., CLO, “D”, FRN, 1.802%, 2018 (n) | 655,000 | 384,813 | ||||
| Citigroup Commercial Mortgage Trust, FRN, 5.888%, 2049 | 985,952 | 206,656 | ||||
| Crest Ltd., CDO, 7%, 2040 | 846,250 | 42,313 | ||||
| CWCapital Cobalt Ltd., CDO, 6.23%, 2045 (a)(p)(z) | 1,029,141 | 20,583 | ||||
| CWCapital Cobalt Ltd., CDO, “F”, FRN, 1.615%, 2050 (z) | 503,966 | 10,079 | ||||
| First Union National Bank Commercial Mortgage Trust, 6.75%, 2032 | 750,000 | 712,668 | ||||
| JPMorgan Chase Commercial Mortgage Securities Corp., FRN, 6.259%, 2051 | 750,000 | 216,655 | ||||
| Merrill Lynch Mortgage Trust, FRN, 6.019%, 2050 | 750,000 | 229,935 | ||||
| Merrill Lynch/Countrywide Commercial Mortgage Trust, FRN, 5.902%, 2050 | 408,000 | 302,727 | ||||
| Wachovia Bank Commercial Mortgage Trust, FRN, 5.943%, 2047 | 579,683 | 103,109 | ||||
| Wachovia Credit, CDO, FRN, 1.888%, 2026 (z) | 372,000 | 14,880 | ||||
| $ | 2,662,895 | |||||
| Issuer | Shares/Par | Value ($) | ||||
| BONDS – continued | ||||||
| Automotive – 2.8% | ||||||
| Allison Transmission, Inc., 11%, 2015 (n) | $ | 1,395,000 | $ | 1,461,263 | ||
| Ford Motor Credit Co. LLC, 12%, 2015 | 4,903,000 | 5,675,718 | ||||
| General Motors Corp., 7.125%, 2013 (d) | 1,965,000 | 584,588 | ||||
| Goodyear Tire & Rubber Co., 9%, 2015 | 1,415,000 | 1,453,913 | ||||
| Goodyear Tire & Rubber Co., 10.5%, 2016 | 210,000 | 228,375 | ||||
| $ | 9,403,857 | |||||
| Basic Industry – 0.3% | ||||||
| TriMas Corp., 9.75%, 2017 (n) | $ | 1,050,000 | $ | 1,063,125 | ||
| Broadcasting – 5.3% | ||||||
| Allbritton Communications Co., 8%, 2018 (n) | $ | 610,000 | $ | 603,900 | ||
| Bonten Media Acquisition Co., 9%, 2015 (p)(z) | 1,237,343 | 712,117 | ||||
| Gray Television, Inc., 10.5%, 2015 (n) | 415,000 | 402,550 | ||||
| Inmarsat Finance PLC, 7.375%, 2017 (n) | 1,410,000 | 1,441,725 | ||||
| Intelsat Jackson Holdings Ltd., 9.5%, 2016 | 3,425,000 | 3,596,250 | ||||
| Lamar Media Corp., 6.625%, 2015 | 1,460,000 | 1,397,950 | ||||
| Lamar Media Corp., “C”, 6.625%, 2015 | 345,000 | 326,888 | ||||
| LBI Media, Inc., 8.5%, 2017 (z) | 645,000 | 553,088 | ||||
| LIN TV Corp., 6.5%, 2013 | 695,000 | 677,625 | ||||
| Local TV Finance LLC, 10%, 2015 (p)(z) | 1,591,340 | 1,311,529 | ||||
| Newport Television LLC, 13%, 2017 (n)(p) | 1,608,568 | 1,266,915 | ||||
| Nexstar Broadcasting Group, Inc., 0.5% to 2011, 7% to 2014 (n)(p) | 1,344,269 | 1,193,207 | ||||
| Nexstar Broadcasting Group, Inc., 7%, 2014 | 444,000 | 395,160 | ||||
| Salem Communications Corp., 9.625%, 2016 | 348,000 | 358,440 | ||||
| Sinclair Broadcast Group, Inc., 9.25%, 2017 (n) | 585,000 | 590,850 | ||||
| SIRIUS XM Radio, Inc., 8.75%, 2015 (n) | 1,095,000 | 1,078,575 | ||||
| Univision Communications, Inc., 12%, 2014 (n) | 705,000 | 756,113 | ||||
| Univision Communications, Inc., 9.75%, 2015 (n)(p) | 1,603,130 | 1,282,704 | ||||
| Young Broadcasting, Inc., 8.75%, 2014 (d) | 545,000 | 327 | ||||
| $ | 17,945,913 | |||||
| Brokerage & Asset Managers – 1.0% | ||||||
| E*TRADE Financial Corp., 7.875%, 2015 | $ | 430,000 | $ | 384,850 | ||
| E*TRADE Financial Corp., 12.5%, 2017 | 550,000 | 584,375 | ||||
| Janus Capital Group, Inc., 6.95%, 2017 | 1,655,000 | 1,661,402 | ||||
5
Table of Contents
MFS High Income Series
Portfolio of Investments (unaudited) – continued
| Issuer | Shares/Par | Value ($) | |||
| BONDS – continued | |||||
| Brokerage & Asset Managers – continued | |||||
| Nuveen Investments, Inc., 10.5%, 2015 | $ 920,000 | $ | 800,400 | ||
| $ | 3,431,027 | ||||
| Building – 2.0% | |||||
| Associated Materials, Inc., 11.25%, 2014 | $ 780,000 | $ | 795,600 | ||
| Building Materials Holding Corp., 7%, 2020 (n) | 480,000 | 475,200 | |||
| CEMEX Finance Europe B.V., 9.625%, 2017 (n) | EUR 660,000 | 755,347 | |||
| Masco Corp., 7.125%, 2020 | $ 520,000 | 504,913 | |||
| Nortek, Inc., 11%, 2013 | 2,207,755 | 2,301,585 | |||
| Owens Corning, 9%, 2019 | 905,000 | 1,070,053 | |||
| Ply Gem Industries, Inc., 11.75%, 2013 | 730,000 | 762,850 | |||
| $ | 6,665,548 | ||||
| Business Services – 2.0% | |||||
| First Data Corp., 9.875%, 2015 | $ 2,350,000 | $ | 1,786,000 | ||
| Iron Mountain, Inc., 6.625%, 2016 | 1,765,000 | 1,734,113 | |||
| Iron Mountain, Inc., 8.375%, 2021 | 285,000 | 290,700 | |||
| SunGard Data Systems, Inc., 9.125%, 2013 | 1,435,000 | 1,458,319 | |||
| SunGard Data Systems, Inc., 10.25%, 2015 | 1,210,000 | 1,249,325 | |||
| Terremark Worldwide, Inc., 12%, 2017 | 225,000 | 253,125 | |||
| $ | 6,771,582 | ||||
| Cable TV – 3.1% | |||||
| Cablevision Systems Corp., 8.625%, 2017 (n) | $750,000 | $ | 765,000 | ||
| CCH II LLC, 13.5%, 2016 | 320,000 | 372,800 | |||
| Charter Communications Holding Co. LLC, 7.875%, 2018 (n) | 305,000 | 306,525 | |||
| Charter Communications Holding Co. LLC, 8.125%, 2020 (n) | 205,000 | 209,613 | |||
| Charter Communications, Inc., 10.875%, 2014 (n) | 1,555,000 | 1,726,050 | |||
| CSC Holdings LLC, 8.5%, 2014 | 1,575,000 | 1,641,938 | |||
| EchoStar Corp., 7.125%, 2016 | 520,000 | 521,300 | |||
| Insight Communications Co., Inc., 9.375%, 2018 (z) | 680,000 | 680,000 | |||
| Mediacom LLC, 9.125%, 2019 | 1,065,000 | 1,027,725 | |||
| Videotron LTEE, 6.875%, 2014 | 615,000 | 618,075 | |||
| Virgin Media Finance PLC, 9.125%, 2016 | 2,025,000 | 2,095,875 | |||
| Virgin Media Finance PLC, 9.5%, 2016 | 410,000 | 433,063 | |||
| $ | 10,397,964 | ||||
| Chemicals – 2.5% | |||||
| Ashland, Inc., 9.125%, 2017 | $ 1,715,000 | $ | 1,877,925 | ||
| Hexion Specialty Chemicals, Inc., 9.75%, 2014 | 975,000 | 921,375 | |||
| Hexion U.S. Finance Corp., 8.875%, 2018 | 1,245,000 | 1,123,613 | |||
| Lumena Resources Corp., 12%, 2014 (n) | 718,000 | 617,480 | |||
| Issuer | Shares/Par | Value ($) | ||||
| BONDS – continued | ||||||
| Chemicals – continued | ||||||
| Lyondell Chemical Co., 11%, 2018 | $ | 689,755 | $ | 739,762 | ||
| Momentive Performance Materials, Inc., 12.5%, 2014 | 1,240,000 | 1,351,600 | ||||
| Momentive Performance Materials, Inc., 11.5%, 2016 | 730,000 | 644,225 | ||||
| Solutia, Inc., 7.875%, 2020 | 1,100,000 | 1,097,250 | ||||
| $ | 8,373,230 | |||||
| Computer Software – Systems – 0.3% | ||||||
| DuPont Fabros Technology, Inc., 8.5%, 2017 (n) | $ | 1,045,000 | $ | 1,071,125 | ||
| Consumer Products – 1.5% | ||||||
| ACCO Brands Corp., 10.625%, 2015 | $ | 150,000 | $ | 162,750 | ||
| ACCO Brands Corp., 7.625%, 2015 | 525,000 | 483,000 | ||||
| Central Garden & Pet Co., 8.25%, 2018 | 750,000 | 743,438 | ||||
| Easton-Bell Sports, Inc., 9.75%, 2016 (n) | 590,000 | 610,650 | ||||
| Jarden Corp., 7.5%, 2017 | 1,295,000 | 1,269,100 | ||||
| Libbey Glass, Inc., 10%, 2015 (n) | 895,000 | 926,325 | ||||
| Visant Holding Corp., 8.75%, 2013 | 825,000 | 833,250 | ||||
| $ | 5,028,513 | |||||
| Consumer Services – 2.0% | ||||||
| KAR Holdings, Inc., 10%, 2015 | $ | 1,490,000 | $ | 1,519,800 | ||
| KAR Holdings, Inc., FRN, 4.344%, 2014 | 555,000 | 507,825 | ||||
| Live Nation Entertainment, Inc., 8.125%, 2018 (n) | 350,000 | 339,500 | ||||
| Service Corp. International, 7.375%, 2014 | 1,480,000 | 1,509,600 | ||||
| Service Corp. International, 7%, 2017 | 1,640,000 | 1,615,400 | ||||
| Ticketmaster Entertainment, Inc., 10.75%, 2016 | 1,310,000 | 1,411,525 | ||||
| $ | 6,903,650 | |||||
| Containers – 1.1% | ||||||
| Graham Packaging Holdings Co., 9.875%, 2014 | $ | 1,975,000 | $ | 2,019,438 | ||
| Greif, Inc., 6.75%, 2017 | 1,070,000 | 1,049,938 | ||||
| Owens-Illinois, Inc., 7.375%, 2016 | 100,000 | 104,250 | ||||
| Reynolds Group, 7.75%, 2016 (n) | 475,000 | 464,313 | ||||
| $ | 3,637,939 | |||||
| Defense Electronics – 0.2% | ||||||
| ManTech International Corp., 7.25%, 2018 (n) | $ | 740,000 | $ | 747,400 | ||
| Electronics – 1.0% | ||||||
| Freescale Semiconductor, Inc., 8.875%, 2014 | $ | 460,000 | $ | 419,750 | ||
| Freescale Semiconductor, Inc., 10.125%, 2018 (n) | 535,000 | 545,700 | ||||
| Freescale Semiconductor, Inc., 9.25%, 2018 (n) | 720,000 | 711,000 | ||||
| Jabil Circuit, Inc., 7.75%, 2016 | 1,045,000 | 1,092,025 | ||||
| NXP B.V., 7.875%, 2014 | 525,000 | 481,688 | ||||
| $ | 3,250,163 | |||||
| Emerging Market Sovereign – 0.1% | ||||||
| Republic of Argentina, FRN, 0.389%, 2012 | $ | 400,800 | $ | 368,088 | ||
6
Table of Contents
MFS High Income Series
Portfolio of Investments (unaudited) – continued
| Issuer | Shares/Par | Value ($) | ||||
| BONDS – continued | ||||||
| Energy – Independent – 6.2% | ||||||
| Anadarko Petroleum Corp., 5.95%, 2016 | $ | 715,000 | $ | 615,398 | ||
| Chaparral Energy, Inc., 8.875%, 2017 | 1,445,000 | 1,329,400 | ||||
| Chesapeake Energy Corp., 7%, 2014 | 614,000 | 623,978 | ||||
| Chesapeake Energy Corp., 6.375%, 2015 | 295,000 | 304,588 | ||||
| Hilcorp Energy I LP, 9%, 2016 (n) | 1,600,000 | 1,640,000 | ||||
| Newfield Exploration Co., 6.625%, 2014 | 795,000 | 799,969 | ||||
| Newfield Exploration Co., 6.625%, 2016 | 855,000 | 859,275 | ||||
| OPTI Canada, Inc., 8.25%, 2014 | 1,550,000 | 1,348,500 | ||||
| Penn Virginia Corp., 10.375%, 2016 | 1,430,000 | 1,522,950 | ||||
| Petrohawk Energy Corp., 10.5%, 2014 | 810,000 | 870,750 | ||||
| Pioneer Natural Resources Co., 6.875%, 2018 | 1,080,000 | 1,084,513 | ||||
| Pioneer Natural Resources Co., 7.5%, 2020 | 2,195,000 | 2,262,160 | ||||
| Plains Exploration & Production Co., 7%, 2017 | 2,490,000 | 2,377,950 | ||||
| Quicksilver Resources, Inc., 8.25%, 2015 | 1,025,000 | 1,012,188 | ||||
| Quicksilver Resources, Inc., 9.125%, 2019 | 340,000 | 345,100 | ||||
| Range Resources Corp., 8%, 2019 | 1,145,000 | 1,195,094 | ||||
| SandRidge Energy, Inc., 8%, 2018 (n) | 1,685,000 | 1,596,538 | ||||
| Southwestern Energy Co., 7.5%, 2018 | 1,080,000 | 1,147,500 | ||||
| $ | 20,935,851 | |||||
| Entertainment – 1.2% | ||||||
| AMC Entertainment, Inc., 11%, 2016 | $ | 2,035,000 | $ | 2,136,750 | ||
| AMC Entertainment, Inc., 8.75%, 2019 | 1,010,000 | 1,015,050 | ||||
| Cinemark USA, Inc., 8.625%, 2019 | 790,000 | 793,950 | ||||
| $ | 3,945,750 | |||||
| Financial Institutions – 3.9% | ||||||
| CIT Group, Inc., 7%, 2014 | $ | 1,345,000 | $ | 1,267,663 | ||
| CIT Group, Inc., 7%, 2017 | 3,185,000 | 2,866,500 | ||||
| CIT Group, Inc., 10.25%, 2017 | 1,240,000 | 1,271,000 | ||||
| GMAC, Inc., 6.75%, 2014 | 2,235,000 | 2,162,363 | ||||
| GMAC, Inc., 8%, 2031 | 2,254,000 | 2,079,315 | ||||
| International Lease Finance Corp., 5.625%, 2013 | 1,735,000 | 1,565,838 | ||||
| International Lease Finance Corp., 8.75%, 2017 (n) | 1,710,000 | 1,620,225 | ||||
| Nationstar Mortgage LLC, 10.875%, 2015 (z) | 475,000 | 372,875 | ||||
| $ | 13,205,779 | |||||
| Food & Beverages – 2.3% | ||||||
| ARAMARK Corp., 8.5%, 2015 | $ | 765,000 | $ | 772,650 | ||
| B&G Foods, Inc., 7.625%, 2018 | 750,000 | 753,750 | ||||
| CEDC Finance Corp. International, Inc., 9.125%, 2016 (n) | 1,165,000 | 1,124,225 | ||||
| Constellation Brands, Inc., 7.25%, 2016 | 550,000 | 554,813 | ||||
| Del Monte Foods Co., 6.75%, 2015 | 1,425,000 | 1,444,594 | ||||
| Pinnacle Foods Finance LLC, 9.25%, 2015 | 1,335,000 | 1,361,700 | ||||
| Smithfield Foods, Inc., 7.75%, 2017 | 555,000 | 530,025 | ||||
| TreeHouse Foods, Inc., 7.75%, 2018 | 1,120,000 | 1,162,000 | ||||
| $ | 7,703,757 | |||||
| Issuer | Shares/Par | Value ($) | |||
| BONDS – continued | |||||
| Forest & Paper Products – 2.8% | |||||
| Boise, Inc., 8%, 2020 (n) | $ 1,065,000 | $ | 1,062,338 | ||
| Buckeye Technologies, Inc., 8.5%, 2013 | 680,000 | 688,500 | |||
| Cascades, Inc., 7.75%, 2017 | 695,000 | 691,525 | |||
| Georgia-Pacific Corp., 7.125%, 2017 (n) | 1,185,000 | 1,208,700 | |||
| Georgia-Pacific Corp., 8%, 2024 | 2,050,000 | 2,173,000 | |||
| Georgia-Pacific Corp., 7.25%, 2028 | �� | 320,000 | 316,000 | ||
| Graphic Packaging International Corp., 9.5%, 2013 | 1,000,000 | 1,017,500 | |||
| JSG Funding PLC, 7.75%, 2015 | 215,000 | 212,313 | |||
| Millar Western Forest Products Ltd., 7.75%, 2013 | 1,555,000 | 1,337,300 | |||
| Smurfit Kappa Group PLC, 7.75%, 2019 (n) | EUR 715,000 | 874,338 | |||
| $ | 9,581,514 | ||||
| Gaming & Lodging – 4.9% | |||||
| Ameristar Casinos, Inc., 9.25%, 2014 | $ 865,000 | $ | 906,088 | ||
| FelCor Lodging Trust, Inc., 10%, 2014 | 415,000 | 433,675 | |||
| Firekeepers Development Authority, 13.875%, 2015 (n) | 640,000 | 739,200 | |||
| Fontainebleau Las Vegas Holdings LLC, 10.25%, 2015 (d)(n) | 1,190,000 | 4,463 | |||
| Gaylord Entertainment Co., 6.75%, 2014 | 1,445,000 | 1,390,813 | |||
| GWR Operating Partnership LLP, 10.875%, 2017 (n) | 770,000 | 765,188 | |||
| Harrah’s Operating Co., Inc., 11.25%, 2017 | 830,000 | 873,575 | |||
| Harrah’s Operating Co., Inc., 10%, 2018 | 461,000 | 378,020 | |||
| Harrah’s Operating Co., Inc., 10%, 2018 | 612,000 | 501,840 | |||
| Host Hotels & Resorts, Inc., 6.75%, 2016 | 1,270,000 | 1,255,713 | |||
| Host Hotels & Resorts, Inc., 9%, 2017 | 620,000 | 663,400 | |||
| MGM Mirage, 10.375%, 2014 | 195,000 | 212,063 | |||
| MGM Mirage, 7.5%, 2016 | 990,000 | 779,625 | |||
| MGM Mirage, 11.125%, 2017 | 485,000 | 534,713 | |||
| MGM Mirage, 11.375%, 2018 (n) | 1,495,000 | 1,405,300 | |||
| MGM Mirage, 9%, 2020 (n) | 940,000 | 965,850 | |||
| Penn National Gaming, Inc., 8.75%, 2019 | 1,085,000 | 1,114,838 | |||
| Pinnacle Entertainment, Inc., 7.5%, 2015 | 870,000 | 815,625 | |||
| Royal Caribbean Cruises Ltd., 7%, 2013 | 385,000 | 383,075 | |||
| Royal Caribbean Cruises Ltd., 11.875%, 2015 | 880,000 | 1,012,000 | |||
| Starwood Hotels & Resorts Worldwide, Inc., 6.75%, 2018 | 580,000 | 580,000 | |||
| Station Casinos, Inc., 6%, 2012 (d) | 1,343,000 | 79,741 | |||
| Station Casinos, Inc., 6.5%, 2014 (d) | 2,175,000 | 16,313 | |||
| Station Casinos, Inc., 6.875%, 2016 (d) | 2,540,000 | 1,905 | |||
7
Table of Contents
MFS High Income Series
Portfolio of Investments (unaudited) – continued
| Issuer | Shares/Par | Value ($) | ||||
| BONDS – continued | ||||||
| Gaming & Lodging – continued | ||||||
| Station Casinos, Inc., 7.75%, 2016 (d) | $ | 472,000 | $ | 29,795 | ||
| Wyndham Worldwide Corp., 6%, 2016 | 730,000 | 708,224 | ||||
| $ | 16,551,042 | |||||
| Industrial – 1.5% | ||||||
| Altra Holdings, Inc., 8.125%, 2016 (n) | $ | 710,000 | $ | 703,788 | ||
| Aquilex Corp., 11.125%, 2016 (n) | 275,000 | 275,000 | ||||
| Baldor Electric Co., 8.625%, 2017 | 1,785,000 | 1,847,475 | ||||
| Great Lakes Dredge & Dock Corp., 7.75%, 2013 | 860,000 | 851,400 | ||||
| Johnsondiversey Holdings, Inc., 8.25%, 2019 (n) | 725,000 | 746,750 | ||||
| RBS Global, Inc. & Rexnord LLC, 8.5%, 2018 (n) | 520,000 | 504,400 | ||||
| $ | 4,928,813 | |||||
| Insurance – 1.5% | ||||||
| American International Group, Inc., 8.175% to 2038, FRN to 2058 | $ | 2,340,000 | $ | 1,848,600 | ||
| ING Groep N.V., 5.775% to 2015, FRN to 2049 | 2,250,000 | 1,586,250 | ||||
| MetLife, Inc., 9.25% to 2038, FRN to 2068 (n) | 1,600,000 | 1,728,000 | ||||
| $ | 5,162,850 | |||||
| Insurance – Property & Casualty – 1.3% | ||||||
| Liberty Mutual Group, Inc., 10.75% to 2038, FRN to 2058 (n) | $ | 1,625,000 | $ | 1,755,000 | ||
| USI Holdings Corp., 9.75%, 2015 (z) | 1,075,000 | 986,313 | ||||
| XL Group PLC, FRN, 6.5%, 2049 | 895,000 | 617,550 | ||||
| ZFS Finance USA Trust II, 6.45% to 2016, FRN to 2065 (n) | 980,000 | 877,100 | ||||
| $ | 4,235,963 | |||||
| Machinery & Tools – 1.0% | ||||||
| Case Corp., 7.25%, 2016 | $ | 545,000 | $ | 546,363 | ||
| Case New Holland, Inc., 7.125%, 2014 | 940,000 | 972,900 | ||||
| Case New Holland, Inc., 7.875%, 2017 (z) | 930,000 | 936,975 | ||||
| Rental Service Corp., 9.5%, 2014 | 855,000 | 849,656 | ||||
| $ | 3,305,894 | |||||
| Major Banks – 1.8% | ||||||
| Bank of America Corp., 8% to 2018, FRN to 2049 | $ | 2,725,000 | $ | 2,632,159 | ||
| JPMorgan Chase & Co., 7.9% to 2018, FRN to 2049 | 1,630,000 | 1,680,090 | ||||
| Royal Bank of Scotland Group PLC, 6.99% to 2017, FRN to 2049 (n) | 530,000 | 344,500 | ||||
| Royal Bank of Scotland Group PLC, FRN, 7.648%, 2049 | 1,850,000 | 1,387,500 | ||||
| $ | 6,044,249 | |||||
| Medical & Health Technology & Services – 7.7% | ||||||
| Biomet, Inc., 10%, 2017 | $ | 200,000 | $ | 215,000 | ||
| Biomet, Inc., 11.625%, 2017 | 1,585,000 | 1,715,763 | ||||
| Capella Healthcare, Inc., 9.25%, 2017 (z) | 245,000 | 247,450 | ||||
| Issuer | Shares/Par | Value ($) | ||||
| BONDS – continued | ||||||
| Medical & Health Technology & Services – continued | ||||||
| Community Health Systems, Inc., 8.875%, 2015 | $ | 2,245,000 | $ | 2,315,156 | ||
| Cooper Cos., Inc., 7.125%, 2015 | 805,000 | 807,013 | ||||
| DaVita, Inc., 6.625%, 2013 | 370,000 | 370,463 | ||||
| DaVita, Inc., 7.25%, 2015 | 1,140,000 | 1,140,000 | ||||
| Fresenius Medical Care AG & Co. KGaA, 9%, 2015 (n) | 865,000 | 937,444 | ||||
| HCA, Inc., 9.25%, 2016 | 4,760,000 | 5,045,600 | ||||
| HCA, Inc., 8.5%, 2019 | 1,515,000 | 1,605,900 | ||||
| HealthSouth Corp., 8.125%, 2020 | 1,555,000 | 1,527,788 | ||||
| Psychiatric Solutions, Inc., 7.75%, 2015 | 605,000 | 620,125 | ||||
| Psychiatric Solutions, Inc., 7.75%, 2015 | 415,000 | 425,375 | ||||
| Tenet Healthcare Corp., 9.25%, 2015 | 1,745,000 | 1,801,713 | ||||
| U.S. Oncology, Inc., 10.75%, 2014 | 1,285,000 | 1,317,125 | ||||
| United Surgical Partners International, Inc., 8.875%, 2017 | 315,000 | 314,213 | ||||
| United Surgical Partners International, Inc., 9.25%, 2017 (p) | 495,000 | 495,000 | ||||
| Universal Hospital Services, Inc., 8.5%, 2015 (p) | 1,630,000 | 1,605,550 | ||||
| Universal Hospital Services, Inc., FRN, 4.133%, 2015 | 310,000 | 260,400 | ||||
| Vanguard Health Systems, Inc., 8%, 2018 | 1,170,000 | 1,123,200 | ||||
| VWR Funding, Inc., 10.25%, 2015 (p) | 1,932,937 | 1,952,266 | ||||
| $ | 25,842,544 | |||||
| Metals & Mining – 2.7% | ||||||
| Arch Western Finance LLC, 6.75%, 2013 | $ | 1,080,000 | $ | 1,082,700 | ||
| Cloud Peak Energy, Inc., 8.25%, 2017 (n) | 860,000 | 851,400 | ||||
| Cloud Peak Energy, Inc., 8.5%, 2019 (n) | 860,000 | 855,700 | ||||
| CONSOL Energy, Inc., 8%, 2017 (n) | 765,000 | 789,863 | ||||
| CONSOL Energy, Inc., 8.25%, 2020 (n) | 510,000 | 531,675 | ||||
| FMG Finance Ltd., 10.625%, 2016 (n) | 1,200,000 | 1,320,000 | ||||
| Peabody Energy Corp., 5.875%, 2016 | 225,000 | 220,781 | ||||
| Peabody Energy Corp., 7.375%, 2016 | 1,040,000 | 1,082,900 | ||||
| Teck Resources Ltd., 10.25%, 2016 | 300,000 | 354,000 | ||||
| Teck Resources Ltd., 10.75%, 2019 | 905,000 | 1,108,897 | ||||
| U.S. Steel Corp., 7.375%, 2020 | 780,000 | 771,225 | ||||
| $ | 8,969,141 | |||||
| Natural Gas – Distribution – 1.0% | ||||||
| AmeriGas Partners LP, 7.125%, 2016 | $ | 1,380,000 | $ | 1,373,100 | ||
| Ferrellgas Partners LP, 8.625%, 2020 | 1,080,000 | 1,080,000 | ||||
| Inergy LP, 6.875%, 2014 | 995,000 | 980,075 | ||||
| $ | 3,433,175 | |||||
| Natural Gas – Pipeline – 2.0% | ||||||
| Atlas Pipeline Partners LP, 8.125%, 2015 | $ | 805,000 | $ | 740,600 | ||
| Atlas Pipeline Partners LP, 8.75%, 2018 | 940,000 | 874,200 | ||||
| Crosstex Energy, Inc., 8.875%, 2018 | 1,145,000 | 1,143,569 | ||||
| El Paso Corp., 8.25%, 2016 | 890,000 | 932,275 | ||||
| El Paso Corp., 7%, 2017 | 1,485,000 | 1,476,638 | ||||
| El Paso Corp., 7.75%, 2032 | 535,000 | 528,699 | ||||
| MarkWest Energy Partners LP, 6.875%, 2014 | 980,000 | 940,800 | ||||
| MarkWest Energy Partners LP, 8.75%, 2018 | 265,000 | 267,650 | ||||
| $ | 6,904,431 | |||||
8
Table of Contents
MFS High Income Series
Portfolio of Investments (unaudited) – continued
| Issuer | Shares/Par | Value ($) | ||||
| BONDS – continued | ||||||
| Network & Telecom – 2.8% | ||||||
| Cincinnati Bell, Inc., 8.25%, 2017 | $ | 315,000 | $ | 294,525 | ||
| Cincinnati Bell, Inc., 8.75%, 2018 | 1,255,000 | 1,138,913 | ||||
| Citizens Communications Co., 9%, 2031 | 440,000 | 408,100 | ||||
| New Communications Holdings, Inc., 8.25%, 2017 (n) | 295,000 | 296,106 | ||||
| New Communications Holdings, Inc., 8.5%, 2020 (n) | 1,145,000 | 1,147,863 | ||||
| Nordic Telephone Co. Holdings, 8.875%, 2016 (n) | 1,605,000 | 1,649,138 | ||||
| Qwest Communications International, Inc., 8%, 2015 (n) | 505,000 | 518,888 | ||||
| Qwest Communications International, Inc., 7.125%, 2018 (n) | 1,050,000 | 1,047,375 | ||||
| Qwest Corp., 8.375%, 2016 | 448,000 | 489,440 | ||||
| Windstream Corp., 8.625%, 2016 | 2,390,000 | 2,407,925 | ||||
| $ | 9,398,273 | |||||
| Oil Services – 1.2% | ||||||
| Allis-Chalmers Energy, Inc., 8.5%, 2017 | $ | 1,125,000 | $ | 973,125 | ||
| Basic Energy Services, Inc., 7.125%, 2016 | 410,000 | 340,300 | ||||
| Edgen Murray Corp., 12.25%, 2015 (n) | 435,000 | 367,575 | ||||
| Expro Finance Luxembourg, 8.5%, 2016 (n) | 780,000 | 744,900 | ||||
| McJunkin Red Man Holding Corp., 9.5%, 2016 (n) | 880,000 | 853,600 | ||||
| Pioneer Drilling Co., 9.875%, 2018 (n) | 855,000 | 837,900 | ||||
| $ | 4,117,400 | |||||
| Oils – 0.2% | ||||||
| Petroplus Holdings AG, 9.375%, 2019 (n) | $ | 785,000 | $ | 675,100 | ||
| Other Banks & Diversified Financials – 1.6% | ||||||
| Capital One Financial Corp., 10.25%, 2039 | $ | 1,345,000 | $ | 1,418,975 | ||
| Citigroup Capital XXI, FRN, 8.3%, 2057 | 1,795,000 | 1,748,219 | ||||
| LBG Capital No.1 PLC, 7.875%, 2020 (n) | 1,380,000 | 1,110,900 | ||||
| Santander UK PLC, 8.963% to 2030, FRN to 2049 | 1,030,000 | 1,035,592 | ||||
| $ | 5,313,686 | |||||
| Printing & Publishing – 1.1% | ||||||
| American Media Operations, Inc., 9%, 2013 (p)(z) | $ | 90,184 | $ | 57,199 | ||
| American Media Operations, Inc., 14%, 2013 (p)(z) | 988,409 | 639,391 | ||||
| McClatchy Co., 11.5%, 2017 (n) | 575,000 | 583,625 | ||||
| Nielsen Finance LLC, 10%, 2014 | 1,289,000 | 1,318,003 | ||||
| Nielsen Finance LLC, 11.5%, 2016 | 770,000 | 841,225 | ||||
| Nielsen Finance LLC, 0% to 2011, 12.5% to 2016 | 326,000 | 310,515 | ||||
| $ | 3,749,958 | |||||
| Railroad & Shipping – 0.6% | ||||||
| Kansas City Southern Railway, 8%, 2015 | $ | 1,825,000 | $ | 1,879,750 | ||
| Real Estate – 0.1% | ||||||
| CB Richard Ellis Group, Inc., 11.625%, 2017 | $ | 400,000 | $ | 448,000 | ||
| Issuer | Shares/Par | Value ($) | ||||
| BONDS – continued | ||||||
| Retailers – 3.3% | ||||||
| Couche-Tard, Inc., 7.5%, 2013 | $ | 340,000 | $ | 341,700 | ||
| Dollar General Corp., 11.875%, 2017 (p) | 539,000 | 612,439 | ||||
| Express Parent LLC, 8.75%, 2018 (n) | 665,000 | 676,638 | ||||
| Limited Brands, Inc., 6.9%, 2017 | 760,000 | 761,900 | ||||
| Limited Brands, Inc., 6.95%, 2033 | 430,000 | 377,863 | ||||
| Macy’s, Inc., 5.75%, 2014 | 795,000 | 798,975 | ||||
| Macy’s, Inc., 5.9%, 2016 | 1,285,000 | 1,288,213 | ||||
| Neiman Marcus Group, Inc., 10.375%, 2015 | 975,000 | 992,063 | ||||
| QVC, Inc., 7.375%, 2020 (n) | 870,000 | 846,075 | ||||
| Sally Beauty Holdings, Inc., 10.5%, 2016 | 1,585,000 | 1,695,950 | ||||
| Toys “R” Us, Inc., 10.75%, 2017 (n) | 1,260,000 | 1,376,550 | ||||
| Toys “R” Us, Inc., 8.5%, 2017 (n) | 1,175,000 | 1,204,375 | ||||
| $ | 10,972,741 | |||||
| Specialty Stores – 0.4% | ||||||
| Michaels Stores, Inc., 11.375%, 2016 | $ | 415,000 | $ | 431,600 | ||
| Payless ShoeSource, Inc., 8.25%, 2013 | 982,000 | 991,820 | ||||
| $ | 1,423,420 | |||||
| Telecommunications – Wireless – 4.9% | ||||||
| Clearwire Corp., 12%, 2015 (n) | $ | 1,655,000 | $ | 1,640,519 | ||
| Cricket Communications, Inc., 7.75%, 2016 | 790,000 | 805,800 | ||||
| Crown Castle International Corp., 9%, 2015 | 1,120,000 | 1,184,400 | ||||
| Crown Castle International Corp., 7.75%, 2017 (n) | 475,000 | 502,313 | ||||
| Crown Castle International Corp., 7.125%, 2019 | 1,190,000 | 1,163,225 | ||||
| Digicel Group Ltd., 12%, 2014 (n) | 200,000 | 223,500 | ||||
| Digicel Group Ltd., 8.25%, 2017 (n) | 1,155,000 | 1,143,450 | ||||
| Digicel Group Ltd., 10.5%, 2018 (n) | 930,000 | 959,063 | ||||
| Nextel Communications, Inc., 6.875%, 2013 | 805,000 | 779,844 | ||||
| NII Holdings, Inc., 10%, 2016 | 975,000 | 1,026,188 | ||||
| SBA Communications Corp., 8%, 2016 (n) | 390,000 | 403,650 | ||||
| SBA Communications Corp., 8.25%, 2019 (n) | 330,000 | 347,325 | ||||
| Sprint Capital Corp., 6.875%, 2028 | 545,000 | 452,350 | ||||
| Sprint Nextel Corp., 8.375%, 2017 | 1,455,000 | 1,455,000 | ||||
| Sprint Nextel Corp., 8.75%, 2032 | 2,335,000 | 2,229,925 | ||||
| Wind Acquisition Finance S.A., 12%, 2015 (n) | 1,985,000 | 2,054,475 | ||||
| $ | 16,371,027 | |||||
| Telephone Services – 0.4% | ||||||
| Frontier Communications Corp., 8.125%, 2018 | $ | 1,205,000 | $ | 1,197,469 | ||
| Tobacco – 0.2% | ||||||
| Alliance One International, Inc., 10%, 2016 (n) | $ | 645,000 | $ | 656,288 | ||
| Transportation – Services – 1.3% | ||||||
| American Petroleum Tankers LLC, 10.25%, 2015 (z) | $ | 265,000 | $ | 265,663 | ||
| Commercial Barge Line Co., 12.5%, 2017 | 1,740,000 | 1,837,875 | ||||
| Hertz Corp., 8.875%, 2014 | 2,100,000 | 2,126,250 | ||||
| $ | 4,229,788 | |||||
9
Table of Contents
MFS High Income Series
Portfolio of Investments (unaudited) – continued
| Issuer | Shares/Par | Value ($) | ||||
| BONDS – continued | ||||||
| Utilities – Electric Power – 3.9% | ||||||
| AES Corp., 8%, 2017 | $ | 2,805,000 | $ | 2,833,015 | ||
| Calpine Corp., 8%, 2016 (n) | 1,080,000 | 1,104,300 | ||||
| Dynegy Holdings, Inc., 7.5%, 2015 | 1,145,000 | 905,981 | ||||
| Dynegy Holdings, Inc., 7.5%, 2015 (n) | 745,000 | 585,756 | ||||
| Dynegy Holdings, Inc., 7.75%, 2019 | 1,085,000 | 750,006 | ||||
| Edison Mission Energy, 7%, 2017 | 2,540,000 | 1,625,600 | ||||
| Energy Future Holdings Corp., 10.875%, 2017 | 395,000 | 292,300 | ||||
| Energy Future Holdings Corp., 10%, 2020 (n) | 1,040,000 | 1,034,800 | ||||
| Mirant North America LLC, 7.375%, 2013 | 405,000 | 414,113 | ||||
| NRG Energy, Inc., 7.375%, 2016 | 2,060,000 | 2,049,700 | ||||
| Texas Competitive Electric Holdings LLC, 10.25%, 2015 | 2,580,000 | 1,702,800 | ||||
| $ | 13,298,371 | |||||
| Total Bonds (Identified Cost, $318,502,884) | $ | 310,806,213 | ||||
| FLOATING RATE LOANS (g)(r) – 2.9% | ||||||
| Aerospace – 0.2% | ||||||
| Hawker Beechcraft Acquisition Co. LLC, Term Loan, 10.5%, 2014 | $ | 587,778 | $ | 579,451 | ||
| Automotive – 1.2% | ||||||
| Accuride Corp., Term Loan, 9.75%, 2013 | $ | 148,718 | $ | 147,975 | ||
| Ford Motor Co., Term Loan, 3.33%, 2013 | 4,031,063 | 3,804,316 | ||||
| $ | 3,952,291 | |||||
| Broadcasting – 0.2% | ||||||
| Gray Television, Inc., Term Loan B, 3.8%, 2014 | $ | 345,246 | $ | 322,229 | ||
| Local TV Finance LLC, Term Loan B, 2.35%, 2013 | 100,669 | 88,085 | ||||
| New Young Broadcasting Holding Co., Inc., Term Loan, 2015 (o) | 363,559 | 361,263 | ||||
| $ | 771,577 | |||||
| Consumer Services – 0.1% | ||||||
| Realogy Corp., Letter of Credit, 3.39%, 2013 | $ | 136,577 | $ | 115,271 | ||
| Realogy Corp., Term Loan, 3.29%, 2013 | 507,285 | 428,149 | ||||
| $ | 543,420 | |||||
| Financial Institutions – 0.1% | ||||||
| American General Financial Corp., Term Loan B, 7.25%, 2015 | $ | 190,230 | $ | 184,808 | ||
| Gaming & Lodging – 0.0% | ||||||
| Green Valley Ranch Gaming LLC, Second Lien Term Loan, 3.5%, 2014 (d) | $ | 1,652,646 | $ | 57,843 | ||
| Printing & Publishing – 0.3% | ||||||
| Tribune Co., Incremental Term Loan B, 5.25%, 2014 (d) | $ | 1,576,410 | $ | 930,649 | ||
| Issuer | Shares/Par | Value ($) | ||||
| FLOATING RATE LOANS (g)(r) – continued | ||||||
| Utilities – Electric Power – 0.8% | ||||||
| Texas Competitive Electric Holdings Co. LLC, Term Loan B-2, 3.97%, 2014 (o) | $ | 2,288,342 | $ | 1,686,222 | ||
| Texas Competitive Electric Holdings Co. LLC, Term Loan B-3, 3.85%, 2014 | 1,323,222 | 974,428 | ||||
| $ | 2,660,650 | |||||
| Total Floating Rate Loans (Identified Cost, $11,393,472) | $ | 9,680,689 | ||||
| COMMON STOCKS – 1.1% | ||||||
| Automotive – 0.1% | ||||||
| Accuride Corp. (a) | 163,927 | $ | 208,186 | |||
| Oxford Automotive, Inc. (a) | 82 | 0 | ||||
| $ | 208,186 | |||||
| Broadcasting – 0.2% | ||||||
| Dex One Corp. (a) | 14,655 | $ | 278,445 | |||
| New Young Broadcasting Holding Co., Inc. | 163 | 323,605 | ||||
| Supermedia, Inc. (a) | 1,010 | 18,473 | ||||
| $ | 620,523 | |||||
| Chemicals – 0.5% | ||||||
| LyondellBasell Industries N.V., “A” (a) | 44,685 | $ | 721,663 | |||
| LyondellBasell Industries N.V., “B” (a) | 53,237 | 859,778 | ||||
| $ | 1,581,441 | |||||
| Construction – 0.2% | ||||||
| Nortek, Inc. (a) | 18,995 | $ | 797,790 | |||
| Gaming & Lodging – 0.1% | ||||||
| Ameristar Casinos, Inc. | 13,200 | $ | 198,792 | |||
| Printing & Publishing – 0.0% | ||||||
| American Media, Inc. (a) | 15,806 | $ | 96,731 | |||
| Golden Books Family Entertainment, Inc. (a) | 2,125 | 0 | ||||
| World Color Press, Inc. (a) | 5,010 | 55,862 | ||||
| $ | 152,593 | |||||
| Special Products & Services – 0.0% | ||||||
| Mark IV Industries LLC, Common Units, “A” (a) | 676 | $ | 28,392 | |||
| Total Common Stocks (Identified Cost, $5,905,092) | $ | 3,587,717 | ||||
| PREFERRED STOCKS – 0.1% | ||||||
| Other Banks & Diversified Financials – 0.1% | ||||||
| Ally Financial, Inc., 7% (z) (Identified Cost, $326,480) | 424 | $ | 329,567 | |||
10
Table of Contents
MFS High Income Series
Portfolio of Investments (unaudited) – continued
| Issuer | Strike Price | First Exercise | Shares/Par | Value ($) | |||||||
| WARRANTS – 0.3% | |||||||||||
| Broadcasting – 0.3% | |||||||||||
| New Young Broadcasting Holding Co., Inc. (1 share for 1 warrant) (a) | $ | 0.01 | 7/14/10 | $ | 443 | $ | 877,687 | ||||
| Printing & Publishing – 0.0% | |||||||||||
| World Color Press, Inc. (1 share for 1 warrant) (a) | $ | 13.00 | 10/08/09 | $ | 2,840 | $ | 4,260 | ||||
| World Color Press, Inc. (1 share for 1 warrant) (a) | $ | 16.30 | 10/08/09 | 2,543 | 2,111 | ||||||
| $ | 6,371 | ||||||||||
| Total Warrants (Identified Cost, $921,477) | $ | 884,058 | |||||||||
| Issuer | Shares/Par | Value ($) | ||||
| CONVERTIBLE BONDS – 0.3% | ||||||
| Automotive – 0.2% | ||||||
| Accuride Corp., 7.5%, 2020 | $ | 275,005 | $ | 705,539 | ||
| Oil Services – 0.1% | ||||||
| Transocean, Inc., 1.5%, 2037 | $ | 415,000 | $ | 343,413 | ||
| Total Convertible Bonds (Identified Cost, $687,682) | $ | 1,048,952 | ||||
| MONEY MARKET FUNDS (v) – 1.4% | ||||||
| MFS Institutional Money Market Portfolio, 0.22%, at Cost and Net Asset Value | 4,844,296 | $ | 4,844,296 | |||
| Total Investments (Identified Cost, $342,581,383) | $ | 331,181,492 | ||||
| OTHER ASSETS, LESS LIABILITIES – 1.5% | 5,106,334 | |||||
| Net Assets – 100.0% | $ | 336,287,826 | ||||
| (a) | Non-income producing security. |
| (d) | Non-income producing security – in default. |
| (g) | The rate shown represents a weighted average coupon rate on settled positions at period end, unless otherwise indicated. |
| (n) | Securities exempt from registration under Rule 144A of the Securities Act of 1933. These securities may be sold in the ordinary course of business in transactions exempt from registration, normally to qualified institutional buyers. At period end, the aggregate value of these securities was $72,724,000, representing 21.6% of net assets. |
| (o) | All or a portion of this position has not settled. Upon settlement date, interest rates for unsettled amounts will be determined. The rate shown represents the weighted average coupon rate for settled amounts. |
| (p) | Payment-in-kind security. |
| (r) | Remaining maturities of floating rate loans may be less than stated maturities shown as a result of contractual or optional prepayments by the borrower. Such prepayments cannot be predicted with certainty. These loans may be subject to restrictions on resale. Floating rate loans generally have rates of interest which are determined periodically by reference to a base lending rate plus a premium. |
| (v) | Underlying fund that is available only to investment companies managed by MFS. The rate quoted is the annualized seven-day yield of the fund at period end. |
| (z) | Restricted securities are not registered under the Securities Act of 1933 and are subject to legal restrictions on resale. These securities generally may be resold in transactions exempt from registration or to the public if the securities are subsequently registered. Disposal of these securities may involve time-consuming negotiations and prompt sale at an acceptable price may be difficult. The fund holds the following restricted securities: |
| Restricted Securities | Acquisition Date | Cost | Current Market Value | |||
| ARCap REIT, Inc., CDO, “H”, 6.083%, 2045 | 9/21/04 | $790,726 | $56,656 | |||
| Airlie LCDO Ltd., CDO, FRN, 2.44%, 2011 | 10/13/06 | 721,695 | 317,546 | |||
| Ally Financial, Inc., 7% (Preferred Stock) | 12/26/08 | 326,480 | 329,567 | |||
| American Media Operations, Inc., 9%, 2013 | 1/29/09-4/15/10 | 65,643 | 57,199 | |||
| American Media Operations, Inc., 14%, 2013 | 1/29/09-5/01/10 | 639,777 | 639,391 | |||
| American Petroleum Tankers LLC, 10.25%, 2015 | 5/06/10 | 257,730 | 265,663 | |||
| Anthracite Ltd., CDO, 6%, 2037 | 5/14/02 | 254,762 | 14,500 | |||
| Arbor Realty Mortgage Securities, CDO, FRN, 2.605%, 2038 | 12/20/05 | 595,494 | 29,775 | |||
| Bonten Media Acquisition Co., 9%, 2015 | 5/22/07-5/15/10 | 1,242,579 | 712,117 | |||
| CWCapital Cobalt Ltd., CDO, 6.23%, 2045 | 3/20/06 | 940,141 | 20,583 | |||
| CWCapital Cobalt Ltd., CDO, “F”, FRN, 1.615%, 2050 | 4/12/06 | 503,966 | 10,079 | |||
| Capella Healthcare, Inc., 9.25%, 2017 | 6/21/10 | 241,916 | 247,450 | |||
| Case New Holland, Inc., 7.875%, 2017 | 6/22/10 | 923,683 | 936,975 | |||
| Insight Communications Co., Inc., 9.375%, 2018 | 6/30/10 | 680,000 | 680,000 | |||
| LBI Media, Inc., 8.5%, 2017 | 7/18/07 | 634,358 | 553,088 | |||
| Local TV Finance LLC, 10%, 2015 | 11/09/07-5/31/10 | 1,553,467 | 1,311,529 |
11
Table of Contents
MFS High Income Series
Portfolio of Investments (unaudited) – continued
| Restricted Securities – continued | Acquisition Date | Cost | Current Market Value | |||
| Nationstar Mortgage LLC, 10.875%, 2015 | 3/23/10 | $462,261 | $372,875 | |||
| USI Holdings Corp., 9.75%, 2015 | 4/26/07-6/08/07 | 1,087,194 | 986,313 | |||
| Wachovia Credit, CDO, FRN, 1.888%, 2026 | 6/08/06 | 372,000 | 14,880 | |||
| Total Restricted Securities | $7,556,186 | |||||
| % of Net Assets | 2.2% |
The following abbreviations are used in this report and are defined:
| CDO | Collateralized Debt Obligation |
| CLO | Collateralized Loan Obligation |
| FRN | Floating Rate Note. Interest rate resets periodically and may not be the rate reported at period end. |
| PLC | Public Limited Company |
| REIT | Real Estate Investment Trust |
Abbreviations indicate amounts shown in currencies other than the U.S. dollar. All amounts are stated in U.S. dollars unless otherwise indicated. A list of abbreviations is shown below:
| EUR | Euro |
Derivative Contracts at 6/30/10
Forward Foreign Currency Exchange Contracts at 6/30/10
| Type | Currency | Counterparty | Contracts to Deliver/Receive | Settlement Date Range | In Exchange For | Contracts at Value | Net Unrealized Appreciation (Depreciation) | |||||||||||
| Liability Derivatives | ||||||||||||||||||
| SELL | EUR | UBS AG | 1,317,261 | 9/15/10 | $ | 1,587,062 | $ | 1,611,459 | $ | (24,397 | ) | |||||||
At June 30, 2010, the fund had sufficient cash and/or securities to cover any commitments under these derivative contracts.
See Notes to Financial Statements
12
Table of Contents
MFS High Income Series
FINANCIAL STATEMENTS | STATEMENT OF ASSETS AND LIABILITIES (unaudited)
This statement represents your fund’s balance sheet, which details the assets and liabilities comprising the total value of the fund.
| At 6/30/10 | |||||
Assets | |||||
Investments – | |||||
Non-affiliated issuers, at value (identified cost, $337,737,087) | $326,337,196 | ||||
Underlying funds, at cost and value | 4,844,296 | ||||
Total investments, at value (identified cost, $342,581,383) | $331,181,492 | ||||
Cash | 94,070 | ||||
Receivables for | |||||
Investments sold | 3,800,954 | ||||
Fund shares sold | 400,865 | ||||
Interest and dividends | 6,394,190 | ||||
Other assets | 2,335 | ||||
Total assets | $341,873,906 | ||||
Liabilities | |||||
Payables for | |||||
Forward foreign currency exchange contracts | $24,397 | ||||
Investments purchased | 3,613,662 | ||||
Fund shares reacquired | 1,849,992 | ||||
Payable to affiliates | |||||
Investment adviser | 12,990 | ||||
Shareholder servicing costs | 269 | ||||
Distribution and/or service fees | 98 | ||||
Administrative services fee | 308 | ||||
Payable for independent Trustees’ compensation | 1,567 | ||||
Accrued expenses and other liabilities | 82,797 | ||||
Total liabilities | $5,586,080 | ||||
Net assets | $336,287,826 | ||||
Net assets consist of | |||||
Paid-in capital | $370,217,700 | ||||
Unrealized appreciation (depreciation) on investments and translation of assets and liabilities in foreign currencies | (11,424,352 | ) | |||
Accumulated net realized gain (loss) on investments and foreign currency transactions | (36,082,466 | ) | |||
Undistributed net investment income | 13,576,944 | ||||
Net assets | $336,287,826 | ||||
Shares of beneficial interest outstanding | 42,226,619 |
| Net assets | Shares outstanding | Net asset value per share | ||||
Initial Class | $329,295,360 | 41,345,936 | $7.96 | |||
Service Class | 6,992,466 | 880,683 | 7.94 |
See Notes to Financial Statements
13
Table of Contents
MFS High Income Series
FINANCIAL STATEMENTS | STATEMENT OF OPERATIONS (unaudited)
This statement describes how much your fund earned in investment income and accrued in expenses. It also describes any gains and/or losses generated by fund operations.
| Six months ended 6/30/10 | ||||||
| Net investment income | ||||||
Income | ||||||
Interest | $15,579,824 | |||||
Dividends | 62,993 | |||||
Dividends from underlying funds | 9,066 | |||||
Total investment income | $15,651,883 | |||||
Expenses | ||||||
Management fee | $1,245,490 | |||||
Distribution and/or service fees | 9,089 | |||||
Shareholder servicing costs | 21,448 | |||||
Administrative services fee | 30,420 | |||||
Independent Trustees’ compensation | 6,298 | |||||
Custodian fee | 36,688 | |||||
Shareholder communications | 27,804 | |||||
Auditing fees | 32,432 | |||||
Legal fees | 3,843 | |||||
Miscellaneous | 12,511 | |||||
Total expenses | $1,426,023 | |||||
Fees paid indirectly | (382 | ) | ||||
Reduction of expenses by investment adviser | (1,175 | ) | ||||
Net expenses | $1,424,466 | |||||
Net investment income | $14,227,417 | |||||
Realized and unrealized gain (loss) on investments and foreign currency transactions | ||||||
Realized gain (loss) (identified cost basis) | ||||||
Investment transactions | $6,499,388 | |||||
Foreign currency transactions | 435,873 | |||||
Net realized gain (loss) on investments and foreign currency transactions | $6,935,261 | |||||
Change in unrealized appreciation (depreciation) | ||||||
Investments | $(7,273,889 | ) | ||||
Translation of assets and liabilities in foreign currencies | (92,649 | ) | ||||
Net unrealized gain (loss) on investments and foreign currency translation | $(7,366,538 | ) | ||||
Net realized and unrealized gain (loss) on investments and foreign currency | $(431,277 | ) | ||||
Change in net assets from operations | $13,796,140 |
See Notes to Financial Statements
14
Table of Contents
MFS High Income Series
FINANCIAL STATEMENTS | STATEMENTS OF CHANGES IN NET ASSETS
These statements describe the increases and/or decreases in net assets resulting from operations, any distributions, and any shareholder transactions.
| Six months ended 6/30/10 (unaudited | ) | Year ended 12/31/09 | | |||
Change in net assets | ||||||
From operations | ||||||
Net investment income | $14,227,417 | $26,075,899 | ||||
Net realized gain (loss) on investments and foreign currency transactions | 6,935,261 | (10,012,091 | ) | |||
Net unrealized gain (loss) on investments and foreign currency translation | (7,366,538 | ) | 94,015,816 | |||
Change in net assets from operations | $13,796,140 | $110,079,624 | ||||
Distributions declared to shareholders | ||||||
From net investment income | $(27,232,133 | ) | $(22,631,405 | ) | ||
Change in net assets from fund share transactions | $(1,673,008 | ) | $53,706,035 | |||
Total change in net assets | $(15,109,001 | ) | $141,154,254 | |||
Net assets | ||||||
At beginning of period | 351,396,827 | 210,242,573 | ||||
At end of period (including undistributed net investment income of $13,576,944 and | $336,287,826 | $351,396,827 |
See Notes to Financial Statements
15
Table of Contents
MFS High Income Series
FINANCIAL STATEMENTS | FINANCIAL HIGHLIGHTS
The financial highlights table is intended to help you understand the fund’s financial performance for the semiannual period and the past 5 fiscal years. Certain information reflects financial results for a single fund share. The total returns in the table represent the rate by which an investor would have earned (or lost) on an investment in the fund share class (assuming reinvestment of all distributions) held for the entire period.
| Initial Class | Six months ended 6/30/10 | Years ended 12/31 | ||||||||||||||||
| 2009 | 2008 | 2007 | 2006 | 2005 | ||||||||||||||
| (unaudited) | ||||||||||||||||||
Net asset value, beginning of period | $8.25 | $6.25 | $9.52 | $10.04 | $9.87 | $10.37 | ||||||||||||
| Income (loss) from investment operations | ||||||||||||||||||
Net investment income (d) | $0.33 | $0.63 | $0.71 | $0.71 | $0.68 | $0.67 | ||||||||||||
Net realized and unrealized gain (loss) on investments and foreign currency | 0.01 | 1.98 | (3.18 | ) | (0.52 | ) | 0.29 | (0.48 | ) | |||||||||
Total from investment operations | $0.34 | $2.61 | $(2.47 | ) | $0.19 | $0.97 | $0.19 | |||||||||||
| Less distributions declared to shareholders | ||||||||||||||||||
From net investment income | $(0.63 | ) | $(0.61 | ) | $(0.80 | ) | $(0.71 | ) | $(0.80 | ) | $(0.69 | ) | ||||||
Net asset value, end of period | $7.96 | $8.25 | $6.25 | $9.52 | $10.04 | $9.87 | ||||||||||||
Total return (%) (k)(r)(s) | 4.02 | (n) | 45.08 | (28.26 | ) | 1.77 | 10.37 | 2.16 | ||||||||||
| Ratios (%) (to average net assets) and Supplemental data: | ||||||||||||||||||
Expenses before expense reductions (f) | 0.80 | (a) | 0.81 | 0.87 | 0.88 | 0.91 | 0.90 | |||||||||||
Expenses after expense reductions (f) | 0.80 | (a) | 0.81 | 0.82 | 0.83 | 0.88 | 0.90 | |||||||||||
Net investment income | 8.01 | (a) | 8.89 | 8.66 | 7.21 | 7.06 | 6.81 | |||||||||||
Portfolio turnover | 36 | 52 | 60 | 73 | 92 | 56 | ||||||||||||
Net assets at end of period (000 omitted) | $329,295 | $344,186 | $203,800 | $324,081 | $355,113 | $355,264 | ||||||||||||
See Notes to Financial Statements
16
Table of Contents
MFS High Income Series
Financial Highlights – continued
| Service Class | Six months ended 6/30/10 | Years ended 12/31 | ||||||||||||||||
| 2009 | 2008 | 2007 | 2006 | 2005 | ||||||||||||||
| (unaudited) | ||||||||||||||||||
Net asset value, beginning of period | $8.22 | $6.22 | $9.47 | $9.99 | $9.80 | $10.29 | ||||||||||||
| Income (loss) from investment operations | ||||||||||||||||||
Net investment income (d) | $0.32 | $0.62 | $0.69 | $0.68 | $0.66 | $0.68 | ||||||||||||
Net realized and unrealized gain (loss) on investments and foreign currency | 0.02 | 1.96 | (3.17 | ) | (0.52 | ) | 0.27 | (0.50 | ) | |||||||||
Total from investment operations | $0.34 | $2.58 | $(2.48 | ) | $0.16 | $0.93 | $0.18 | |||||||||||
| Less distributions declared to shareholders | ||||||||||||||||||
From net investment income | $(0.62 | ) | $(0.58 | ) | $(0.77 | ) | $(0.68 | ) | $(0.74 | ) | $(0.67 | ) | ||||||
Net asset value, end of period | $7.94 | $8.22 | $6.22 | $9.47 | $9.99 | $9.80 | ||||||||||||
Total return (%) (k)(r)(s) | 3.93 | (n) | 44.75 | (28.43 | ) | 1.54 | 9.99 | 2.05 | ||||||||||
| Ratios (%) (to average net assets) and Supplemental data: | ||||||||||||||||||
Expenses before expense reductions (f) | 1.05 | (a) | 1.07 | 1.12 | 1.13 | 1.16 | 1.15 | |||||||||||
Expenses after expense reductions (f) | 1.05 | (a) | 1.06 | 1.07 | 1.08 | 1.13 | 1.15 | |||||||||||
Net investment income | 7.77 | (a) | 8.78 | 8.40 | 6.96 | 6.81 | 6.38 | |||||||||||
Portfolio turnover | 36 | 52 | 60 | 73 | 92 | 56 | ||||||||||||
Net assets at end of period (000 omitted) | $6,992 | $7,210 | $6,442 | $11,086 | $11,896 | $10,056 | ||||||||||||
| (a) | Annualized. |
| (d) | Per share data is based on average shares outstanding. |
| (f) | Ratios do not reflect reductions from fees paid indirectly, if applicable. |
| (k) | The total return does not reflect expenses that apply to separate accounts. Inclusion of these charges would reduce the total return figures for all periods shown. |
| (n) | Not annualized. |
| (r) | Certain expenses have been reduced without which performance would have been lower. |
| (s) | From time to time the fund may receive proceeds from litigation settlements, without which performance would be lower. |
See Notes to Financial Statements
17
Table of Contents
MFS High Income Series
NOTES TO FINANCIAL STATEMENTS (unaudited)
| (1) | Business and Organization |
MFS High Income Series (the fund) is a series of MFS Variable Insurance Trust (the trust). The trust is organized as a Massachusetts business trust and is registered under the Investment Company Act of 1940, as amended, as an open-end management investment company. The shareholders of each series of the trust are separate accounts of insurance companies, which offer variable annuity and/or life insurance products, and qualified retirement and pension plans.
| (2) | Significant Accounting Policies |
General – The preparation of financial statements in conformity with U.S. generally accepted accounting principles requires management to make estimates and assumptions that affect the reported amounts of assets and liabilities, and disclosure of contingent assets and liabilities at the date of the financial statements and the reported amounts of revenues and expenses during the reporting period. Actual results could differ from those estimates. In the preparation of these financial statements, management has evaluated subsequent events occurring after the date of the fund’s Statement of Assets and Liabilities through the date that the financial statements were issued. The fund may invest up to 100% of its portfolio in high-yield securities rated below investment grade. Investments in high-yield securities involve greater degrees of credit and market risk than investments in higher-rated securities and tend to be more sensitive to economic conditions. The fund can invest in foreign securities, including securities of emerging market issuers. Investments in foreign securities are vulnerable to the effects of changes in the relative values of the local currency and the U.S. dollar and to the effects of changes in each country’s legal, political, and economic environment. The markets of emerging markets countries are generally more volatile than the markets of developed countries with more mature economies. All of the risks of investing in foreign securities previously described are heightened when investing in emerging markets countries.
Investment Valuations – Debt instruments and floating rate loans (other than short-term instruments), including restricted debt instruments, are generally valued at an evaluated or composite bid as provided by a third-party pricing service. Equity securities, including restricted equity securities, are generally valued at the last sale or official closing price as provided by a third-party pricing service on the market or exchange on which they are primarily traded. Equity securities, for which there were no sales reported that day, are generally valued at the last quoted daily bid quotation as provided by a third-party pricing service on the market or exchange on which such securities are primarily traded. Equity securities held short, for which there were no sales reported for that day, are generally valued at the last quoted daily ask quotation as provided by a third-party pricing service on the market or exchange on which such securities are primarily traded. Short-term instruments with a maturity at issuance of 60 days or less generally are valued at amortized cost, which approximates market value. Forward foreign currency contracts are generally valued at the mean of bid and asked prices for the time period interpolated from rates provided by a third-party pricing service for proximate time periods. Open-end investment companies are generally valued at net asset value per share. Securities and other assets generally valued on the basis of information from a third-party pricing service may also be valued at a broker/dealer bid quotation. Values obtained from third-party pricing services can utilize both transaction data and market information such as yield, quality, coupon rate, maturity, type of issue, trading characteristics, and other market data. The values of foreign securities and other assets and liabilities expressed in foreign currencies are converted to U.S. dollars using the mean of bid and asked prices for rates provided by a third-party pricing service.
The Board of Trustees has delegated primary responsibility for determining or causing to be determined the value of the fund’s investments (including any fair valuation) to the adviser pursuant to valuation policies and procedures approved by the Board. If the adviser determines that reliable market quotations are not readily available, investments are valued at fair value as determined in good faith by the adviser in accordance with such procedures under the oversight of the Board of Trustees. Under the fund’s valuation policies and procedures, market quotations are not considered to be readily available for most types of debt instruments and floating rate loans and many types of derivatives. These investments are generally valued at fair value based on information from third-party pricing services. In addition, investments may be valued at fair value if the adviser determines that an investment’s value has been materially affected by events occurring after the close of the exchange or market on which the investment is principally traded (such as foreign exchange or market) and prior to the determination of the fund’s net asset value, or after the halting of trading of a specific security where trading does not resume prior to the close of the exchange or market on which the security is principally traded. Events that occur on a frequent basis after foreign markets close (such as developments in foreign markets and significant movements in the U.S. markets) and prior to the determination of the fund’s net asset value may be deemed to have a material effect on the value of securities traded in foreign markets. Accordingly, the fund’s foreign equity securities may often be valued at fair value. The adviser generally relies on third-party pricing services or other information (such as the correlation with price movements of similar securities in the same or other markets; the type, cost and investment characteristics of the security; the business and financial condition of the issuer; and trading and other market data) to assist in determining whether to fair value and at what value to fair value an investment. The value of an investment for purposes of calculating the fund’s net asset value can differ depending on the
18
Table of Contents
MFS High Income Series
Notes to Financial Statements (unaudited) – continued
source and method used to determine value. When fair valuation is used, the value of an investment used to determine the fund’s net asset value may differ from quoted or published prices for the same investment. There can be no assurance that the fund could obtain the fair value assigned to an investment if it were to sell the investment at the same time at which the fund determines its net asset value per share.
Various inputs are used in determining the value of the fund’s assets or liabilities. These inputs are categorized into three broad levels. In certain cases, the inputs used to measure fair value may fall into different levels of the fair value hierarchy. In such cases, an investment’s level within the fair value hierarchy is based on the lowest level of input that is significant to the fair value measurement. The fund’s assessment of the significance of a particular input to the fair value measurement in its entirety requires judgment, and considers factors specific to the investment. Level 1 includes unadjusted quoted prices in active markets for identical assets or liabilities. Level 2 includes other significant observable market-based inputs (including quoted prices for similar securities, interest rates, prepayment speed, and credit risk). Level 3 includes unobservable inputs, which may include the adviser’s own assumptions in determining the fair value of investments. Other financial instruments are derivative instruments not reflected in total investments, such as futures, forwards, swap contracts, and written options. The following is a summary of the levels used as of June 30, 2010 in valuing the fund’s assets or liabilities:
| Investments at Value | Level 1 | Level 2 | Level 3 | Total | ||||||
| Equity Securities: | ||||||||||
United States | $703,897 | $1,155,749 | $1,298,023 | $3,157,669 | ||||||
Netherlands | 1,581,440 | — | — | 1,581,440 | ||||||
Canada | 62,232 | — | — | 62,232 | ||||||
| Non-U.S. Sovereign Debt | — | 368,088 | — | 368,088 | ||||||
| Corporate Bonds | — | 273,044,376 | — | 273,044,376 | ||||||
| Residential Mortgage-Backed Securities | — | 29,775 | — | 29,775 | ||||||
| Commercial Mortgage-Backed Securities | — | 1,771,750 | — | 1,771,750 | ||||||
| Asset-Backed Securities (including CDOs) | — | 543,823 | 317,546 | 861,369 | ||||||
| Foreign Bonds | — | 35,779,808 | — | 35,779,808 | ||||||
| Floating Rate Loans | — | 9,319,426 | 361,263 | 9,680,689 | ||||||
| Mutual Funds | 4,844,296 | — | — | 4,844,296 | ||||||
| Total Investments | $7,191,865 | $322,012,795 | $1,976,832 | $331,181,492 | ||||||
| Other Financial Instruments | ||||||||||
| Forward Currency Contracts | $— | $(24,397 | ) | $— | $(24,397 | ) | ||||
For further information regarding security characteristics, see the Portfolio of Investments.
The following is a reconciliation of Level 3 assets for which significant unobservable inputs were used to determine fair value. The table presents the activity of Level 3 securities held at the beginning and the end of the period.
| Equity Securities | Asset-Backed Securities | Floating Rate Loans | Total | ||||||
| Balance as of 12/31/09 | $45,362 | $349,798 | $— | $395,160 | |||||
Accrued discounts/premiums | — | — | — | — | |||||
Realized gain (loss) | — | — | — | — | |||||
Change in unrealized appreciation (depreciation) | 105,191 | (40,074 | ) | 16,186 | 81,303 | ||||
Net purchases (sales) | 1,147,470 | 7,822 | 345,077 | 1,500,369 | |||||
Transfers in and/or out of Level 3 | — | — | — | — | |||||
| Balance as of 6/30/10 | $1,298,023 | $317,546 | $361,263 | $1,976,832 |
The net change in unrealized (depreciation) from investments still held as Level 3 at June 30, 2010 is $81,303.
Foreign Currency Translation – Purchases and sales of foreign investments, income, and expenses are converted into U.S. dollars based upon currency exchange rates prevailing on the respective dates of such transactions or on the reporting date for foreign denominated receivables and payables. Gains and losses attributable to foreign currency exchange rates on sales of securities are recorded for financial statement purposes as net realized gains and losses on investments. Gains and losses attributable to foreign exchange rate movements on receivables, payables, income and expenses are recorded for financial statement purposes as foreign currency transaction gains and losses. That portion of both realized and unrealized gains and losses on investments that results from fluctuations in foreign currency exchange rates is not separately disclosed.
Derivatives – The fund may use derivatives for different purposes, including to earn income and enhance returns, to increase or decrease exposure to a particular market, to manage or adjust the risk profile of the fund, or as alternatives to direct investments. Derivatives may be used for hedging or non-hedging purposes. While hedging can reduce or eliminate losses, it
19
Table of Contents
MFS High Income Series
Notes to Financial Statements (unaudited) – continued
can also reduce or eliminate gains. When the fund uses derivatives as an investment to increase market exposure, or for hedging purposes, gains and losses from derivative instruments may be substantially greater than the derivative’s original cost.
Derivative instruments include written options, purchased options, futures contracts, forward foreign currency exchange contracts, and swap agreements. The fund’s period end derivatives, as presented in the Portfolio of Investments and the associated Derivative Contract Tables, generally are indicative of the volume of its derivative activity during the period.
The following table presents, by major type of derivative contract, the fair value, on a gross basis, of the asset and liability components of derivatives held by the fund at June 30, 2010 as reported in the Statement of Assets and Liabilities:
| Fair Value | |||||
| Risk | Derivative | Liability Derivatives | |||
| Foreign Exchange Contracts | Forward Foreign Currency Exchange Contracts | $(24,397 | ) |
The following table presents, by major type of derivative contract, the realized gain (loss) on derivatives held by the fund for the six months ended June 30, 2010 as reported in the Statement of Operations:
| Foreign Currency Transactions | ||
| Foreign Exchange Contracts | $440,115 |
The following table presents, by major type of derivative contract, the change in unrealized appreciation (depreciation) on derivatives held by the fund for the six months ended June 30, 2010 as reported in the Statement of Operations:
| Translation of Assets and Liabilities in Foreign Currencies | |||
| Foreign Exchange Contracts | $(87,342 | ) |
Derivative counterparty credit risk is managed through formal evaluation of the creditworthiness of all potential counterparties. On certain over-the-counter derivatives, the fund attempts to reduce its exposure to counterparty credit risk whenever possible by entering into an International Swaps and Derivatives Association (ISDA) Master Agreement on a bilateral basis with each of the counterparties with whom it undertakes a significant volume of transactions. The ISDA Master Agreement gives each party to the agreement the right to terminate all transactions traded under such agreement if there is a certain deterioration in the credit quality of the other party. The ISDA Master Agreement gives the fund the right, upon an event of default by the applicable counterparty or a termination of the agreement, to close out all transactions traded under such agreement and to net amounts owed under each transaction to one net amount payable by one party to the other. This right to close out and net payments across all transactions traded under the ISDA Master Agreement could result in a reduction of the fund’s credit risk to such counterparty equal to any amounts payable by the fund under the applicable transactions, if any. However, absent an event of default by the counterparty or a termination of the agreement, the ISDA Master Agreement does not result in an offset of reported balance sheet assets and liabilities across transactions between the fund and the applicable counterparty.
Collateral requirements differ by type of derivative. Collateral or margin requirements are set by the broker or exchange clearing house for exchange traded derivatives (i.e., futures and exchange-traded options) while collateral terms are contract specific for over-the-counter traded derivatives (i.e., forwards, swaps and over-the-counter options). For derivatives traded under an ISDA Master Agreement, the collateral requirements are netted across all transactions traded under such agreement and one amount is posted from one party to the other to collateralize such obligations. Cash collateral that has been pledged to cover obligations of the fund under derivative contracts will be reported separately on the Statement of Assets and Liabilities as restricted cash. Securities collateral pledged for the same purpose is noted in the Portfolio of Investments.
Forward Foreign Currency Exchange Contracts – The fund may enter into forward foreign currency exchange contracts for the purchase or sale of a specific foreign currency at a fixed price on a future date to hedge the fund’s currency risk or for non-hedging purposes. For hedging purposes, the fund may enter into contracts to deliver or receive foreign currency that the fund will receive from or use in its normal investment activities. The fund may also use contracts to hedge against declines in the value of foreign currency denominated securities due to unfavorable exchange rate movements. For non-hedging purposes, the fund may enter into contracts with the intent of changing the relative exposure of the fund’s portfolio of securities to different currencies to take advantage of anticipated exchange rate changes.
20
Table of Contents
MFS High Income Series
Notes to Financial Statements (unaudited) – continued
Forward foreign currency exchange contracts are adjusted by the daily exchange rate of the underlying currency and any unrealized gains or losses are recorded as a receivable or payable for forward foreign currency exchange contracts until the contract settlement date. On contract settlement date, any gain or loss on the contract is recorded as realized gains or losses on foreign currency transactions.
Risks may arise upon entering into these contracts from unanticipated movements in the value of the contract and from the potential inability of counterparties to meet the terms of their contracts. The fund’s maximum risk due to counterparty credit risk is the notional amount of the contract. This risk is mitigated in cases where there is an ISDA Master Agreement between the fund and the counterparty providing for netting as described above and for posting of collateral by the counterparty to the fund to cover the fund’s exposure to the counterparty under such ISDA Master Agreement.
Hybrid Instruments – The fund may invest in indexed or hybrid securities on which any combination of interest payments, the principal or stated amount payable at maturity is determined by reference to prices of other securities, currencies, indices, economic factors or other measures, including interest rates, currency exchange rates, or securities indices. The risks of investing in hybrid instruments reflect a combination of the risks of investing in securities, swaps, options, futures and currencies. Hybrid instruments are potentially more volatile and carry greater market risks than traditional debt instruments. Depending on the structure of the particular hybrid instrument, changes in a benchmark, underlying assets or economic indicator may be magnified by the terms of the hybrid instrument and have an even more dramatic and substantial effect upon the value of the hybrid instrument. Also, the prices of the hybrid instrument and the benchmark, underlying asset or economic indicator may not move in the same direction or at the same time.
Loans and Other Direct Debt Instruments – The fund may invest in loans and loan participations or other receivables. These investments may include standby financing commitments, including revolving credit facilities, which obligate the fund to supply additional cash to the borrower on demand. Loan participations involve a risk of insolvency of the lending bank or other financial intermediary.
Indemnifications – Under the fund’s organizational documents, its officers and Trustees may be indemnified against certain liabilities and expenses arising out of the performance of their duties to the fund. Additionally, in the normal course of business, the fund enters into agreements with service providers that may contain indemnification clauses. The fund’s maximum exposure under these agreements is unknown as this would involve future claims that may be made against the fund that have not yet occurred.
Investment Transactions and Income – Investment transactions are recorded on the trade date. Interest income is recorded on the accrual basis. All premium and discount is amortized or accreted for financial statement purposes in accordance with U.S. generally accepted accounting principles. The fund earns certain fees in connection with its floating rate loan purchasing activities. These fees are in addition to interest payments earned and may include amendment fees, commitment fees, facility fees, consent fees, and prepayment fees. Commitment fees are recorded on an accrual basis as income in the accompanying financial statements. Dividends received in cash are recorded on the ex-dividend date. Certain dividends from foreign securities will be recorded when the fund is informed of the dividend if such information is obtained subsequent to the ex-dividend date. Dividend and interest payments received in additional securities are recorded on the ex-dividend or ex-interest date in an amount equal to the value of the security on such date. Debt obligations may be placed on non-accrual status or set to accrue at a rate of interest less than the contractual coupon when the collection of all or a portion of interest has become doubtful. Interest income for those debt obligations may be further reduced by the write-off of the related interest receivables when deemed uncollectible.
The fund may receive proceeds from litigation settlements. Any proceeds received from litigation involving portfolio holdings are reflected in the Statement of Operations in realized gain/loss if the security has been disposed of by the fund or in unrealized gain/loss if the security is still held by the fund. Any other proceeds from litigation not related to portfolio holdings are reflected as other income in the Statement of Operations.
Fees Paid Indirectly – The fund’s custody fee may be reduced according to an arrangement that measures the value of cash deposited with the custodian by the fund. This amount, for the six months ended June 30, 2010, is shown as a reduction of total expenses on the Statement of Operations.
Tax Matters and Distributions – The fund intends to qualify as a regulated investment company, as defined under Subchapter M of the Internal Revenue Code, and to distribute all of its taxable income, including realized capital gains. As a result, no provision for federal income tax is required. The fund’s federal tax returns for the prior three fiscal years remain subject to examination by the Internal Revenue Service. Foreign taxes, if any, have been accrued by the fund in the accompanying financial statements.
21
Table of Contents
MFS High Income Series
Notes to Financial Statements (unaudited) – continued
Distributions to shareholders are recorded on the ex-dividend date. Income and capital gain distributions are determined in accordance with income tax regulations, which may differ from U.S. generally accepted accounting principles. Certain capital accounts in the financial statements are periodically adjusted for permanent differences in order to reflect their tax character. These adjustments have no impact on net assets or net asset value per share. Temporary differences which arise from recognizing certain items of income, expense, gain or loss in different periods for financial statement and tax purposes will reverse at some time in the future. Distributions in excess of net investment income or net realized gains are temporary overdistributions for financial statement purposes resulting from differences in the recognition or classification of income or distributions for financial statement and tax purposes.
Book/tax differences primarily relate to expiration of capital loss carryforwards, amortization and accretion of debt securities, defaulted bonds, and derivatives transactions.
The tax character of distributions made during the current period, if any, will be determined at fiscal year end. The tax character of distributions declared to shareholders for the last fiscal year is as follows:
| 12/31/09 | ||
| Ordinary income (including any short-term capital gains) | $22,631,405 |
The federal tax cost and the tax basis components of distributable earnings were as follows:
| As of 6/30/10 | |||
| Cost of investments | $343,578,155 | ||
| Gross appreciation | 13,914,229 | ||
| Gross depreciation | (26,310,892 | ) | |
| Net unrealized appreciation (depreciation) | $(12,396,663 | ) | |
| As of 12/31/09 | |||
| Undistributed ordinary income | 27,229,903 | ||
| Capital loss carryforwards | (41,899,718 | ) | |
| Other temporary differences | (580,055 | ) | |
| Net unrealized appreciation (depreciation) | (5,244,011 | ) |
As of December 31, 2009, the fund had capital loss carryforwards available to offset future realized gains. Such losses expire as follows:
| 12/31/10 | $(8,888,518 | ) | |
| 12/31/13 | (192,521 | ) | |
| 12/31/14 | (2,353,912 | ) | |
| 12/31/16 | (22,939,919 | ) | |
| 12/31/17 | (7,524,848 | ) | |
| $(41,899,718 | ) |
Multiple Classes of Shares of Beneficial Interest – The fund offers multiple classes of shares, which differ in their respective distribution and/or service fees. The fund’s income, realized and unrealized gain (loss), and common expenses are allocated to shareholders based on the daily net assets of each class. Dividends are declared separately for each class. Differences in per share dividend rates are generally due to differences in separate class expenses. The fund’s distributions declared to shareholders as reported on the Statements of Changes in Net Assets are presented by class as follows:
| From net investment income | ||||
| Six months ended 6/30/10 | Year ended 12/31/09 | |||
| Initial Class | $26,701,187 | $22,085,619 | ||
| Service Class | 530,946 | 545,786 | ||
| Total | $27,232,133 | $22,631,405 | ||
| (3) | Transactions with Affiliates |
Investment Adviser – The fund has an investment advisory agreement with MFS to provide overall investment management and related administrative services and facilities to the fund. The management fee is computed daily and paid monthly at the following annual rates:
| First $1 billion of average daily net assets | 0.70% | |
| Average daily net assets in excess of $1 billion | 0.65% |
22
Table of Contents
MFS High Income Series
Notes to Financial Statements (unaudited) – continued
The management fee incurred for the six months ended June 30, 2010 was equivalent to an annual effective rate of 0.70% of the fund’s average daily net assets.
Prior to May 1, 2010, the investment adviser had agreed in writing to pay a portion of the fund’s operating expenses, exclusive of management fee, distribution and/or service fees, interest, taxes, extraordinary expenses, brokerage and transaction costs, and investment-related expenses, such that operating expenses did not exceed 0.15% annually of the fund’s average daily net assets. This written agreement terminated on April 30, 2010. For the period January 1, 2010 through April 30, 2010, the fund’s actual operating expenses did not exceed the limit and therefore, the investment adviser did not pay any portion of the fund’s expenses.
Effective May 1, 2010, the investment adviser has agreed in writing to pay a portion of the fund’s total annual operating expenses, exclusive of interest, taxes, extraordinary expenses, brokerage and transaction costs, and investment-related expenses, such that total annual operating expenses do not exceed 0.85% of average daily net assets for the Initial Class shares and 1.10% of average daily net assets for the Service Class shares. This written agreement will continue until modified by the fund’s Board of Trustees, but such agreement will continue at least until April 30, 2012. For the period May 1, 2010 through June 30, 2010, the fund’s actual operating expenses did not exceed the limit and therefore, the investment adviser did not pay any portion of the fund’s expenses.
Distributor – MFS Fund Distributors, Inc. (MFD), a wholly-owned subsidiary of MFS, is the distributor of shares of the fund. The Trustees have adopted a distribution plan for the Service Class shares pursuant to Rule 12b-1 under the Investment Company Act of 1940.
The fund’s distribution plan provides that the fund will pay MFD distribution and/or service fees equal to 0.25% per annum of its average daily net assets attributable to Service Class shares as partial consideration for services performed and expenses incurred by MFD and financial intermediaries (including participating insurance companies that invest in the fund to fund variable annuity and variable life insurance contracts, sponsors of qualified retirement and pension plans that invest in the fund, and affiliates of these participating insurance companies and plan sponsors) in connection with the sale and distribution of the Service Class shares. MFD may subsequently pay all, or a portion, of the distribution and/or service fees to financial intermediaries.
Shareholder Servicing Agent – MFS Service Center, Inc. (MFSC), a wholly-owned subsidiary of MFS, receives a fee from the fund for its services as shareholder servicing agent. For the six months ended June 30, 2010, the fee was $21,250, which equated to 0.0120% annually of the fund’s average daily net assets. MFSC also receives payment from the fund for out-of-pocket expenses paid by MFSC on behalf of the fund. For the six months ended June 30, 2010, these costs amounted to $198.
Administrator – MFS provides certain financial, legal, shareholder communications, compliance, and other administrative services to the fund. Under an administrative services agreement, the fund partially reimburses MFS the costs incurred to provide these services. The fund is charged an annual fixed amount of $17,500 plus a fee based on average daily net assets . The administrative services fee incurred for the six months ended June 30, 2010 was equivalent to an annual effective rate of 0.0171% of the fund’s average daily net assets.
Trustees’ and Officers’ Compensation – The fund pays compensation to independent Trustees in the form of a retainer, attendance fees, and additional compensation to Board and Committee chairpersons. The fund does not pay compensation directly to Trustees or officers of the fund who are also officers of the investment adviser, all of whom receive remuneration for their services to the fund from MFS. Certain officers and Trustees of the fund are officers or directors of MFS, MFD, and MFSC.
Other – This fund and certain other funds managed by MFS (the funds) have entered into services agreements (the Agreements) which provide for payment of fees by the funds to Tarantino LLC and Griffin Compliance LLC in return for the provision of services of an Independent Chief Compliance Officer (ICCO) and Assistant ICCO, respectively, for the funds. The ICCO and Assistant ICCO are officers of the funds and the sole members of Tarantino LLC and Griffin Compliance LLC, respectively. The funds can terminate the Agreements with Tarantino LLC and Griffin Compliance LLC at any time under the terms of the Agreements. For the six months ended June 30, 2010, the aggregate fees paid by the fund to Tarantino LLC and Griffin Compliance LLC were $1,466 and are included in miscellaneous expense on the Statement of Operations. MFS has agreed to reimburse the fund for a portion of the payments made by the fund in the amount of $1,175, which is shown as a reduction of total expenses in the Statement of Operations. Additionally, MFS has agreed to bear all expenses associated with office space, other administrative support, and supplies provided to the ICCO and Assistant ICCO.
23
Table of Contents
MFS High Income Series
Notes to Financial Statements (unaudited) – continued
The fund may invest in the MFS Institutional Money Market Portfolio which is managed by MFS and seeks a high level of current income consistent with preservation of capital and liquidity. Income earned on this investment is included in dividends from underlying funds on the Statement of Operations. This money market fund does not pay a management fee to MFS.
| (4) | Portfolio Securities |
Purchases and sales of investments, other than U.S. Government securities, purchased option transactions, and short-term obligations, aggregated $122,822,535 and $136,677,665, respectively.
| (5) | Shares of Beneficial Interest |
The fund’s Declaration of Trust permits the Trustees to issue an unlimited number of full and fractional shares of beneficial interest. Transactions in fund shares were as follows:
| Six months ended 6/30/10 | Year ended 12/31/09 | |||||||||||
| Shares | Amount | Shares | Amount | |||||||||
| Shares sold | ||||||||||||
Initial Class | 5,189,795 | $43,937,437 | 14,856,612 | $100,282,166 | ||||||||
Service Class | 48,416 | 401,955 | 89,329 | 635,190 | ||||||||
| 5,238,211 | $44,339,392 | 14,945,941 | $100,917,356 | |||||||||
| Shares issued to shareholders in reinvestment of distributions | ||||||||||||
Initial Class | 3,284,279 | $26,701,187 | 3,597,006 | $22,085,619 | ||||||||
Service Class | 65,468 | 530,946 | 89,035 | 545,786 | ||||||||
| 3,349,747 | $27,232,133 | 3,686,041 | $22,631,405 | |||||||||
| Shares reacquired | ||||||||||||
Initial Class | (8,838,860 | ) | $(72,344,014 | ) | (9,367,614 | ) | $(67,563,729 | ) | ||||
Service Class | (110,406 | ) | (900,519 | ) | (337,448 | ) | (2,278,997 | ) | ||||
| (8,949,266 | ) | $(73,244,533 | ) | (9,705,062 | ) | $(69,842,726 | ) | |||||
| Net change | ||||||||||||
Initial Class | (364,786 | ) | $(1,705,390 | ) | 9,086,004 | $54,804,056 | ||||||
Service Class | 3,478 | 32,382 | (159,084 | ) | (1,098,021 | ) | ||||||
| (361,308 | ) | $(1,673,008 | ) | 8,926,920 | $53,706,035 | |||||||
| (6) | Line of Credit |
The fund and certain other funds managed by MFS participate in a $1.1 billion unsecured committed line of credit, subject to a $1 billion sublimit, provided by a syndication of banks under a credit agreement. Borrowings may be made for temporary financing needs. Interest is charged to each fund, based on its borrowings, generally at a rate equal to the higher of the Federal Reserve funds rate or one month LIBOR plus an agreed upon spread. A commitment fee, based on the average daily, unused portion of the committed line of credit, is allocated among the participating funds at the end of each calendar quarter. In addition, the fund and other funds managed by MFS have established unsecured uncommitted borrowing arrangements with certain banks for temporary financing needs. Interest is charged to each fund, based on its borrowings, at a rate equal to the Federal Reserve funds rate plus an agreed upon spread. For the six months ended June 30, 2010, the fund’s commitment fee and interest expense were $2,544 and $0, respectively, and are included in miscellaneous expense on the Statement of Operations.
| (7) | Transactions in Underlying Funds – Affiliated Issuers |
An affiliated issuer may be considered one in which the fund owns 5% or more of the outstanding voting securities, or a company which is under common control. For the purposes of this report, the fund assumes the following to be affiliated issuers:
| Underlying Funds | Beginning Shares/Par Amount | Acquisitions Shares/Par Amount | Dispositions Shares/Par Amount | Ending Shares/Par Amount | |||||
| MFS Institutional Money Market Portfolio | 6,280,113 | 87,295,688 | (88,731,505 | ) | 4,844,296 | ||||
| Underlying Funds | Realized Gain (Loss) | Capital Gain Distributions | Dividend Income | Ending Value | |||||
| MFS Institutional Money Market Portfolio | $— | $— | $9,066 | $4,844,296 | |||||
24
Table of Contents
MFS High Income Series
RESULTS OF SHAREHOLDER MEETING (unaudited)
At a special meeting of shareholders of MFS Variable Insurance Trust, which was held on January 28, 2010, the following actions were taken:
Item 1. To elect the following individuals as Trustees:
| Number of Dollars | ||||
| Nominee | For | Withheld Authority | ||
| Robert E. Butler | 6,823,651,821.26 | 1,818,252,669.55 | ||
| Lawrence H. Cohn, M.D. | 6,813,621,200.14 | 1,828,283,290.67 | ||
| Maureen R. Goldfarb | 6,825,332,620.76 | 1,816,571,870.05 | ||
| David H. Gunning | 6,823,081,841.37 | 1,818,822,649.44 | ||
| William R. Gutow | 6,813,678,877.22 | 1,828,225,613.59 | ||
| Michael Hegarty | 6,827,456,515.87 | 1,814,447,974.94 | ||
| John P. Kavanaugh | 6,830,363,113.12 | 1,811,541,377.69 | ||
| Robert J. Manning | 6,825,511,264.17 | 1,816,393,226.64 | ||
| Robert C. Pozen | 6,824,854,120.27 | 1,817,050,370.54 | ||
| J. Dale Sherratt | 6,816,913,203.87 | 1,824,991,286.94 | ||
| Laurie J. Thomsen | 6,823,590,745.56 | 1,818,313,745.25 | ||
| Robert W. Uek | 6,818,161,803.66 | 1,823,742,687.15 | ||
25
Table of Contents
MFS Research Bond Series
BOARD REVIEW OF INVESTMENT ADVISORY AGREEMENT
A discussion regarding the Board’s most recent review and renewal of the fund’s Investment Advisory Agreement with MFS will be available on or about November 1, 2010 by clicking on the fund’s name under “Variable Insurance Portfolios — VIT” in the “Products and Performance” section of the MFS Web site (mfs.com).
PROXY VOTING POLICIES AND INFORMATION
A general description of the MFS funds’ proxy voting policies and procedures is available without charge, upon request, by calling
1-800-225-2606, by visiting the Proxy Voting section of mfs.com or by visiting the SEC’s Web site at http://www.sec.gov.
Information regarding how the fund voted proxies relating to portfolio securities during the most recent twelve-month period ended June 30 is available without charge by visiting the Proxy Voting section of mfs.com or by visiting the SEC’s Web site at http://www.sec.gov.
QUARTERLY PORTFOLIO DISCLOSURE
The fund will file a complete schedule of portfolio holdings with the Securities and Exchange Commission (the Commission) for the first and third quarters of each fiscal year on Form N-Q. The fund’s Form N-Q may be reviewed and copied at the:
Public Reference Room
Securities and Exchange Commission
100 F Street, NE, Room 1580
Washington, D.C. 20549
Information on the operation of the Public Reference Room may be obtained by calling the Commission at 1-800-SEC-0330. The fund’s Form N-Q is available on the EDGAR database on the Commission’s Internet Web site at http://www.sec.gov, and copies of this information may be obtained, upon payment of a duplicating fee, by electronic request at the following e-mail address: publicinfo@sec.gov or by writing the Public Reference Section at the above address.
From time to time, MFS may post important information about the fund or the MFS funds on the MFS web site (mfs.com). This information is available by visiting the “News & Commentary” section of mfs.com or by clicking on the fund’s name under “Variable Insurance Portfolios — VIT” in the “Products and Performance” section of mfs.com.
26
Table of Contents

Table of Contents
Table of Contents
This report is prepared for the general information of contract owners. It is authorized for distribution to prospective investors only when preceded or accompanied by a current prospectus.
NOT FDIC INSURED Ÿ MAY LOSE VALUE Ÿ NO BANK GUARANTEE Ÿ NOT A DEPOSIT Ÿ NOT INSURED BY ANY FEDERAL GOVERNMENT AGENCY OR NCUA/NCUSIF
Table of Contents
MFS Strategic Income Series

Dear Contract Owners:
After having suffered their biggest declines since the Great Depression, most global markets experienced an impressive resurgence during the latter months of 2009 and the first quarter of 2010. The global economy was able to reap the benefits of two major trends. The first of these was the massive efforts of governments and central banks to increase liquidity in the financial system as they sought to prevent the credit crisis from further affecting the banking system. The second was the move by companies around the world to cut costs and operations to prepare for rapidly changing market conditions. We believe that these moves not only shortened the length of the downturn but also set the stage for recovery.
Even with the significant market gains of 2009 and the early part of 2010, the recovery is unrolling at a moderate pace, with rebounds in the manufacturing sector and corporate America leading the way. Central bankers are proceeding with caution and many have held benchmark interest rates unchanged as they debate the best way to withdraw stimulus measures without disrupting the fragile growth process. Complicating that debate late in the period was the emergence of the European debt crisis and worries about whether this crisis could derail the global recovery. As that crisis unrolled with no clear resolution, risk aversion rose along with volatility. Weakening economic data late in the period added uncertainty to the mix and sparked a retrenchment in global equity markets.
While hurdles remain, we believe that the global economy is proceeding on the road to recovery. As always, we continue to be mindful of the many challenges faced at the individual, national, and international levels. It is at times such as these that we want to remind investors of the merits of maintaining a long-term view, adhering to basic investing principles such as asset allocation and diversification, and working closely with advisors to identify and research investment opportunities. At MFS®, we take particular pride in how well mutual funds can provide a broad range of products that can fit investor needs in any type of market climate.
Respectfully,

Robert J. Manning
Chairman and Chief Executive Officer
MFS Investment Management®
August 16, 2010
The opinions expressed in this letter are subject to change, may not be relied upon for investment advice, and no forecasts can be guaranteed.
MFS Fund Distributors, Inc., 500 Boylston Street, Boston, MA 02116
1
Table of Contents
MFS Strategic Income Series
Portfolio structure (i)
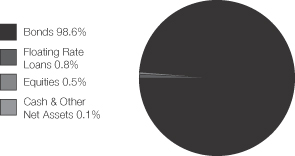
| Fixed income sectors (i) | ||
| High Grade Corporates | 34.1% | |
| High Yield Corporates | 30.6% | |
| Non-U.S. Government Bonds | 16.3% | |
| U.S. Treasury Securities | 5.3% | |
| Emerging Markets Bonds | 4.8% | |
| Commercial Mortgage-Backed Securities | 2.7% | |
| U.S. Government Agencies | 1.9% | |
| Mortgage-Backed Securities | 1.9% | |
| Floating Rate Loans | 0.8% | |
| Asset-Backed Securities | 0.7% | |
| Collateralized Debt Obligations | 0.3% |
| Composition including fixed income credit quality (a)(i) | ||
| AAA | 11.3% | |
| AA | 11.7% | |
| A | 13.9% | |
| BBB | 22.1% | |
| BB | 11.6% | |
| B | 14.2% | |
| CCC | 6.6% | |
| CC (o) | 0.0% | |
| C (o) | 0.0% | |
| D | 0.1% | |
| Cash & Other (NR) | 5.0% | |
| U.S. Agency (NR) | 3.0% | |
| Non-Fixed Income (NR) | 0.5% | |
| Portfolio facts (i) | ||
| Average Duration (d) | 4.7 | |
| Average Effective Maturity (m) | 7.0 yrs. | |
| Issuer country weightings (i) | ||
| United States | 66.9% | |
| Japan | 4.7% | |
| United Kingdom | 3.9% | |
| France | 3.1% | |
| Italy | 2.8% | |
| Netherlands | 2.6% | |
| Germany | 2.6% | |
| Canada | 2.4% | |
| Australia | 1.2% | |
| Other Countries | 9.8% | |
| (a) | The rating categories (e.g., AAA) include: (1) debt securities and fixed income structured products which have long-term public ratings; and (2) credit default swaps for which the underlying security has a long-term public rating. All other assets are not rated (NR). All rated securities are assigned a rating in accordance with the following ratings hierarchy: If a security is rated by Moody’s, then that rating is used; if not rated by Moody’s, then a Standard & Poor’s rating is used; if not rated by S&P, then a Fitch rating is used. Ratings from Moody’s (e.g., Aaa) are shown in the S&P and Fitch scale (e.g., AAA). All ratings are subject to change. |
| The Cash & Other (NR) category includes: cash, other assets less liabilities (including any derivative offsets), short-term securities, and unrated fixed income securities. |
| The U.S. Agency (NR) category includes unrated U.S. agency fixed income securities and collateralized mortgage obligations of U.S. agency mortgage-backed securities. |
| The Non-Fixed Income (NR) category includes equity securities (including convertible bonds), commodities, and any associated derivatives. |
| (d) | Duration is a measure of how much a bond’s price is likely to fluctuate with general changes in interest rates, e.g., if rates rise 1.00%, a bond with a 5-year duration is likely to lose about 5.00% of its value. |
| (i) | For purposes of this presentation, the components include the market value of securities, and reflect the impact of the equivalent exposure of derivative positions, if applicable. These amounts may be negative from time to time. The bond component will include any accrued interest amounts. Equivalent exposure is a calculated amount that translates the derivative position into a reasonable approximation of the amount of the underlying asset that the portfolio would have to hold at a given point in time to have the same price sensitivity that results from the portfolio’s ownership of the derivative contract. When dealing with derivatives, equivalent exposure is a more representative measure of the potential impact of a position on portfolio performance than market value. Where the fund holds convertible bonds, these are treated as part of the equity portion of the portfolio. |
| (m) | In determining an instrument’s effective maturity for purposes of calculating the fund’s dollar-weighted average effective maturity, MFS uses the instrument’s stated maturity or, if applicable, an earlier date on which MFS believes it is probable that a maturity-shortening device (such as a put, pre-refunding or prepayment) will cause the instrument to be repaid. Such an earlier date can be substantially shorter than the instrument’s stated maturity. |
| (o) | Less than 0.1%. |
Percentages are based on net assets as of 6/30/10, unless otherwise noted.
The portfolio is actively managed and current holdings may be different.
2
Table of Contents
MFS Strategic Income Series
After having suffered through one of the largest and most concentrated downturns since the 1930s, most asset markets staged a remarkable rebound during 2009 and early 2010. This recovery in global activity has been led importantly by emerging Asian economies, but broadening to include most of the global economy to varying degrees. Primary drivers of the recovery included an unwinding of the inventory destocking that took place earlier, the production of manufacturing and capital goods, as well as massive fiscal and monetary stimulus.
Late in the period, though, heightened risk surrounding the public-debt profiles of several of the peripheral European countries impaired market sentiment. At the same time, the improving trend in global macroeconomic data began to weaken somewhat. These two dynamics caused most asset prices to retrench significantly, as many questioned the durability of the global recovery.
3
Table of Contents
MFS Strategic Income Series
Fund Expenses Borne by the Contract Holders During the Period,
January 1, 2010 through June 30, 2010
As a contract holder of the fund, you incur ongoing costs, including management fees; distribution and/or service (12b-1) fees; and other fund expenses. This example is intended to help you understand your ongoing costs (in dollars) of investing in the fund and to compare these costs with the ongoing costs of investing in other mutual funds.
The example is based on an investment of $1,000 invested at the beginning of the period and held for the entire period January 1, 2010 through June 30, 2010.
Actual Expenses
The first line for each share class in the following table provides information about actual account values and actual expenses. You may use the information in this line, together with the amount you invested, to estimate the expenses that you paid over the period. Simply divide your account value by $1,000 (for example, an $8,600 account value divided by $1,000 = 8.6), then multiply the result by the number in the first line under the heading entitled “Expenses Paid During Period” to estimate the expenses you paid on your account during this period.
Hypothetical Example for Comparison Purposes
The second line for each share class in the following table provides information about hypothetical account values and hypothetical expenses based on the fund’s actual expense ratio and an assumed rate of return of 5% per year before expenses, which is not the fund’s actual return. The hypothetical account values and expenses may not be used to estimate the actual ending account balance or expenses you paid for the period. You may use this information to compare the ongoing costs of investing in the fund and other funds. To do so, compare this 5% hypothetical example with the 5% hypothetical examples that appear in the shareholder reports of the other funds.
Please note that the expenses shown in the table are meant to highlight the fund’s ongoing costs only and do not take into account the fees and expenses imposed under the variable contracts through which your investment in the fund is made. Therefore, the second line for each share class in the table is useful in comparing ongoing costs associated with an investment in vehicles (such as the fund) which fund benefits under variable annuity and variable life insurance contracts and to qualified pension and retirement plans only, and will not help you determine the relative total costs of investing in the fund through variable annuity and variable life insurance contracts. If the fees and expenses imposed under the variable contracts were included, your costs would have been higher.
| Share Class | Annualized Expense Ratio | Beginning Account Value 1/01/10 | Ending Account Value 6/30/10 | Expenses Paid During Period (p) 1/01/10-6/30/10 | ||||||
| Initial Class | Actual | 0.83% | $1,000.00 | $1,039.19 | $4.20 | |||||
| Hypothetical (h) | 0.83% | $1,000.00 | $1,020.68 | $4.16 | ||||||
| Service Class | Actual | 1.08% | $1,000.00 | $1,038.43 | $5.46 | |||||
| Hypothetical (h) | 1.08% | $1,000.00 | $1,019.44 | $5.41 |
| (h) | 5% class return per year before expenses. |
| (p) | Expenses paid is equal to each class’ annualized expense ratio, as shown above, multiplied by the average account value over the period, multiplied by the number of days in the period, divided by the number of days in the year. |
Expense Changes Impacting the Table
Changes to the fund’s fee arrangements occurred during the six month period. Had these fee changes been in effect throughout the entire six month period, the annualized expense ratios would have been 0.80% and 1.05% for Classes IC and SC respectively; the actual expenses paid during the period would have been approximately $4.05 and $5.31 for Initial Class and Service Class, respectively; and the hypothetical expenses paid during the period would have been approximately $4.01 and $5.26 for Initial Class and Service Class, respectively. For further information about the fund’s fee arrangements and changes to those fee arrangements, please see Note 3 in the Notes to Financial Statements.
4
Table of Contents
MFS Strategic Income Series
PORTFOLIO OF INVESTMENTS – 6/30/10 (unaudited)
The Portfolio of Investments is a complete list of all securities owned by your fund. It is categorized by broad-based asset classes.
| Issuer | Shares/Par | Value ($) | ||||
| BONDS – 92.4% | ||||||
| Aerospace – 0.6% | ||||||
| BE Aerospace, Inc., 8.5%, 2018 | $ | 30,000 | $ | 31,500 | ||
| Bombardier, Inc., 7.5%, 2018 (n) | 55,000 | 56,650 | ||||
| Hawker Beechcraft Acquisition Co. LLC, 8.5%, 2015 | 50,000 | 40,063 | ||||
| Oshkosh Corp., 8.25%, 2017 | 15,000 | 15,600 | ||||
| Oshkosh Corp., 8.5%, 2020 | 20,000 | 20,800 | ||||
| Spirit AeroSystems Holdings, Inc., 7.5%, 2017 | 35,000 | 34,300 | ||||
| $ | 198,913 | |||||
| Airlines – 0.3% | ||||||
| American Airlines Pass-Through Trust, 7.377%, 2019 | $ | 22,719 | $ | 18,630 | ||
| Continental Airlines, Inc., 7.339%, 2014 | 69,036 | 66,102 | ||||
| Delta Air Lines, Inc., 7.711%, 2011 | 15,000 | 14,850 | ||||
| $ | 99,582 | |||||
| Apparel Manufacturers – 0.2% | ||||||
| Hanesbrands, Inc., 8%, 2016 | $ | 30,000 | $ | 30,413 | ||
| Phillips-Van Heusen Corp., 7.375%, 2020 | 20,000 | 20,175 | ||||
| $ | 50,588 | |||||
| Asset-Backed & Securitized – 3.6% | ||||||
| ARCap REIT, Inc., CDO, “H”, 6.083%, 2045 (z) | $ | 100,000 | $ | 6,250 | ||
| Bayview Financial Revolving Mortgage Loan Trust, FRN, 1.947%, 2040 (z) | 193,279 | 79,592 | ||||
| Brazilian Merchant Voucher Receivables Ltd., 5.911%, 2011 (z) | 48,009 | 48,009 | ||||
| Crest Ltd., “A1” CDO, FRN, 1.017%, 2018 (z) | 102,602 | 82,081 | ||||
| Crest Ltd., CDO, 7%, 2040 | 137,000 | 6,850 | ||||
| Deutsche Mortgage & Asset Receiving Corp., FRN, 7.5%, 2031 | 117,200 | 121,070 | ||||
| DLJ Commercial Mortgage Corp., 6.04%, 2031 (z) | 180,486 | 184,568 | ||||
| Falcon Franchise Loan LLC, 6.5%, 2014 (z) | 250,000 | 94,375 | ||||
| Falcon Franchise Loan LLC, FRN, 3.965%, 2025 (i)(z) | 406,106 | 32,935 | ||||
| First Union National Bank Commercial Mortgage Trust, FRN, 1.156%, 2043 (i)(n) | 1,805,656 | 6,404 | ||||
| First Union-Lehman Brothers Bank of America, FRN, 0.578%, 2035 (i) | 1,301,665 | 24,457 | ||||
| First Union-Lehman Brothers Commercial Mortgage Trust, 7%, 2029 (n) | 89,699 | 94,085 | ||||
| Hertz Global Holdings, Inc., 4.26%, 2014 (n) | 100,000 | 104,207 | ||||
| Lehman Brothers Commercial Conduit Mortgage Trust, FRN, 1.049%, 2030 (i) | 327,812 | 8,673 | ||||
| Morgan Stanley Capital I, Inc., FRN, 1.239%, 2039 (i)(z) | 1,126,960 | 34,372 | ||||
| Mortgage Capital Funding, Inc., FRN, 1.866%, 2031 (i) | 7,902 | 3 | ||||
| Prudential Securities Secured Financing Corp., FRN, 7.256%, 2013 (z) | 171,000 | 156,946 | ||||
| Issuer | Shares/Par | Value ($) | ||||
| BONDS – continued | ||||||
| Asset-Backed & Securitized – continued | ||||||
| Salomon Brothers Mortgage Securities, Inc., FRN, 6.948%, 2032 (z) | $ | 134,179 | $ | 141,979 | ||
| $ | 1,226,856 | |||||
| Automotive – 1.1% | ||||||
| Allison Transmission, Inc., 11%, 2015 (n) | $ | 50,000 | $ | 52,375 | ||
| Ford Motor Credit Co. LLC, 12%, 2015 | 200,000 | 231,520 | ||||
| General Motors Corp., 7.125%, 2013 (d) | 35,000 | 10,412 | ||||
| Goodyear Tire & Rubber Co., 10.5%, 2016 | 50,000 | 54,375 | ||||
| Johnson Controls, Inc., 5.25%, 2011 | 30,000 | 30,475 | ||||
| $ | 379,157 | |||||
| Basic Industry – 0.1% | ||||||
| TriMas Corp., 9.75%, 2017 (n) | $ | 35,000 | $ | 35,438 | ||
| Broadcasting – 2.0% | ||||||
| Allbritton Communications Co., 8%, 2018 (n) | $ | 15,000 | $ | 14,850 | ||
| Bonten Media Acquisition Co., 9%, 2015 (p)(z) | 19,923 | 11,466 | ||||
| CBS Corp., 5.75%, 2020 | 20,000 | 21,467 | ||||
| Gray Television, Inc., 10.5%, 2015 (n) | 10,000 | 9,700 | ||||
| Intelsat Jackson Holdings Ltd., 9.5%, 2016 | 85,000 | 89,250 | ||||
| Lamar Media Corp., 6.625%, 2015 | 40,000 | 38,300 | ||||
| Lamar Media Corp., “C”, 6.625%, 2015 | 20,000 | 18,950 | ||||
| LBI Media, Inc., 8.5%, 2017 (z) | 30,000 | 25,725 | ||||
| LIN TV Corp., 6.5%, 2013 | 25,000 | 24,375 | ||||
| Local TV Finance LLC, 10%, 2015 (p)(z) | 54,245 | 44,707 | ||||
| Newport Television LLC, 13%, 2017 (n)(p) | 55,533 | 43,738 | ||||
| News America, Inc., 6.4%, 2035 | 100,000 | 108,834 | ||||
| News America, Inc., 6.9%, 2039 | 29,000 | 33,282 | ||||
| Nexstar Broadcasting Group, Inc., 0.5% to 2011, 7% to 2014 (n)(p) | 59,699 | 52,990 | ||||
| Nexstar Broadcasting Group, Inc., 7%, 2014 | 20,000 | 17,800 | ||||
| Salem Communications Corp., 9.625%, 2016 | 9,000 | 9,270 | ||||
| Sinclair Broadcast Group, Inc., 9.25%, 2017 (n) | 15,000 | 15,150 | ||||
| SIRIUS XM Radio, Inc., 8.75%, 2015 (n) | 20,000 | 19,700 | ||||
| Univision Communications, Inc., 12%, 2014 (n) | 20,000 | 21,450 | ||||
| Univision Communications, Inc., 9.75%, 2015 (n)(p) | 55,698 | 44,565 | ||||
| $ | 665,569 | |||||
| Brokerage & Asset Managers – 1.2% | ||||||
| BlackRock, Inc., 3.5%, 2014 | $ | 90,000 | $ | 93,339 | ||
| E*TRADE Financial Corp., 7.875%, 2015 | 30,000 | 26,850 | ||||
| E*TRADE Financial Corp., 12.5%, 2017 | 5,000 | 5,312 | ||||
| Janus Capital Group, Inc., 6.95%, 2017 | 45,000 | 45,174 | ||||
| Nuveen Investments, Inc., 10.5%, 2015 | 35,000 | 30,450 | ||||
| TD AMERITRADE Holding Corp., 5.6%, 2019 | 200,000 | 210,697 | ||||
| $ | 411,822 | |||||
5
Table of Contents
MFS Strategic Income Series
Portfolio of Investments (unaudited) – continued
| Issuer | Shares/Par | Value ($) | ||||
| BONDS – continued | ||||||
| Building – 1.6% | ||||||
| Associated Materials, Inc., 11.25%, 2014 | $ | 50,000 | $ | 51,000 | ||
| Building Materials Holding Corp., 7%, 2020 (n) | 15,000 | 14,850 | ||||
| CEMEX Finance LLC, 9.5%, 2016 (n) | 119,000 | 114,835 | ||||
| CRH PLC, 8.125%, 2018 | 80,000 | 96,476 | ||||
| Lafarge S.A., 6.15%, 2011 | 160,000 | 163,973 | ||||
| Masco Corp., 7.125%, 2020 | 15,000 | 14,565 | ||||
| Nortek, Inc., 11%, 2013 | 70,177 | 73,160 | ||||
| Ply Gem Industries, Inc., 11.75%, 2013 | 25,000 | 26,125 | ||||
| $ | 554,984 | |||||
| Business Services – 0.5% | ||||||
| First Data Corp., 9.875%, 2015 | $ | 80,000 | $ | 60,800 | ||
| Iron Mountain, Inc., 6.625%, 2016 | 40,000 | 39,300 | ||||
| Iron Mountain, Inc., 8.375%, 2021 | 15,000 | 15,300 | ||||
| SunGard Data Systems, Inc., 10.25%, 2015 | 61,000 | 62,983 | ||||
| $ | 178,383 | |||||
| Cable TV – 1.8% | ||||||
| Cablevision Systems Corp., 8.625%, 2017 (n) | $ | 25,000 | $ | 25,500 | ||
| CCH II LLC, 13.5%, 2016 | 10,000 | 11,650 | ||||
| Charter Communications Holding Co. LLC, 7.875%, 2018 (n) | 5,000 | 5,025 | ||||
| Charter Communications Holding Co. LLC, 8.125%, 2020 (n) | 5,000 | 5,112 | ||||
| Charter Communications, Inc., 10.875%, 2014 (n) | 15,000 | 16,650 | ||||
| CSC Holdings LLC, 8.5%, 2014 | 50,000 | 52,125 | ||||
| DIRECTV Holdings LLC, 5.875%, 2019 | 40,000 | 43,695 | ||||
| EchoStar Corp., 7.125%, 2016 | 15,000 | 15,037 | ||||
| Insight Communications Co., Inc., 9.375%, 2018 (z) | 20,000 | 20,000 | ||||
| Mediacom LLC, 9.125%, 2019 | 35,000 | 33,775 | ||||
| TCI Communications, Inc., 9.8%, 2012 | 81,000 | 90,619 | ||||
| Time Warner Cable, Inc., 8.25%, 2019 | 120,000 | 147,576 | ||||
| Videotron LTEE, 6.875%, 2014 | 25,000 | 25,125 | ||||
| Virgin Media Finance PLC, 9.125%, 2016 | 100,000 | 103,500 | ||||
| $ | 595,389 | |||||
| Chemicals – 1.6% | ||||||
| Ashland, Inc., 9.125%, 2017 | $ | 60,000 | $ | 65,700 | ||
| Dow Chemical Co., 8.55%, 2019 | 170,000 | 208,099 | ||||
| Hexion Specialty Chemicals, Inc., 9.75%, 2014 | 35,000 | 33,075 | ||||
| Hexion U.S. Finance Corp., 8.875%, 2018 | 40,000 | 36,100 | ||||
| Lyondell Chemical Co., 11%, 2018 | 24,207 | 25,962 | ||||
| Momentive Performance Materials, Inc., 12.5%, 2014 | 44,000 | 47,960 | ||||
| Momentive Performance Materials, Inc., 11.5%, 2016 | 24,000 | 21,180 | ||||
| Nalco Finance Holdings, Inc., 9%, 2014 | 55,000 | 55,825 | ||||
| Solutia, Inc., 7.875%, 2020 | 35,000 | 34,913 | ||||
| $ | 528,814 | |||||
| Issuer | Shares/Par | Value ($) | ||||
| BONDS – continued | ||||||
| Computer Software – Systems – 0.1% | ||||||
| DuPont Fabros Technology, Inc., 8.5%, 2017 (n) | $ | 30,000 | $ | 30,750 | ||
| Construction – 0.4% | ||||||
| Lennar Corp., 5.125%, 2010 | $ | 130,000 | $ | 130,000 | ||
| Consumer Products – 1.1% | ||||||
| ACCO Brands Corp., 10.625%, 2015 | $ | 5,000 | $ | 5,425 | ||
| ACCO Brands Corp., 7.625%, 2015 | 15,000 | 13,800 | ||||
| Central Garden & Pet Co., 8.25%, 2018 | 25,000 | 24,781 | ||||
| Easton-Bell Sports, Inc., 9.75%, 2016 (n) | 20,000 | 20,700 | ||||
| Fortune Brands, Inc., 5.125%, 2011 | 147,000 | 149,824 | ||||
| Hasbro, Inc., 6.125%, 2014 | 20,000 | 21,290 | ||||
| Jarden Corp., 7.5%, 2017 | 35,000 | 34,300 | ||||
| Libbey Glass, Inc., 10%, 2015 (n) | 30,000 | 31,050 | ||||
| Visant Holding Corp., 8.75%, 2013 | 25,000 | 25,250 | ||||
| Whirlpool Corp., 8%, 2012 | 48,000 | 52,510 | ||||
| $ | 378,930 | |||||
| Consumer Services – 1.2% | ||||||
| KAR Holdings, Inc., 10%, 2015 | $ | 30,000 | $ | 30,600 | ||
| KAR Holdings, Inc., FRN, 4.344%, 2014 | 20,000 | 18,300 | ||||
| Service Corp. International, 7%, 2017 | 80,000 | 78,800 | ||||
| Service Corp. International, 7.625%, 2018 | 39,000 | 39,488 | ||||
| Ticketmaster Entertainment, Inc., 10.75%, 2016 | 25,000 | 26,938 | ||||
| Western Union Co., 5.4%, 2011 | 210,000 | 221,358 | ||||
| $ | 415,484 | |||||
| Containers – 0.6% | ||||||
| Graham Packaging Holdings Co., 9.875%, 2014 | $ | 55,000 | $ | 56,237 | ||
| Greif, Inc., 6.75%, 2017 | 145,000 | 142,281 | ||||
| $ | 198,518 | |||||
| Defense Electronics – 0.7% | ||||||
| BAE Systems Holdings, Inc., 5.2%, 2015 (n) | $ | 139,000 | $ | 149,069 | ||
| BAE Systems Holdings, Inc., 6.375%, 2019 (n) | 40,000 | 45,607 | ||||
| ManTech International Corp., 7.25%, 2018 (n) | 25,000 | 25,250 | ||||
| $ | 219,926 | |||||
| Electronics – 0.2% | ||||||
| Freescale Semiconductor, Inc., 8.875%, 2014 | $ | 20,000 | $ | 18,250 | ||
| Freescale Semiconductor, Inc., 10.125%, 2018 (n) | 15,000 | 15,300 | ||||
| Freescale Semiconductor, Inc., 9.25%, 2018 (n) | 20,000 | 19,750 | ||||
| Jabil Circuit, Inc., 7.75%, 2016 | 25,000 | 26,125 | ||||
| $ | 79,425 | |||||
| Emerging Market Quasi-Sovereign – 1.1% | ||||||
| IIRSA Norte Finance Ltd., 8.75%, 2024 | $ | 112,438 | $ | 124,244 | ||
| KazMunaiGaz Finance B.V., 11.75%, 2015 (n) | 100,000 | 122,380 | ||||
6
Table of Contents
MFS Strategic Income Series
Portfolio of Investments (unaudited) – continued
| Issuer | Shares/Par | Value ($) | ||||
| BONDS – continued | ||||||
| Emerging Market Quasi-Sovereign – continued | ||||||
| Petrobras International Finance Co., 7.875%, 2019 | $ | 66,000 | $ | 75,514 | ||
| Petroleos Mexicanos, 6%, 2020 (n) | 60,000 | 63,000 | ||||
| $ | 385,138 | |||||
| Emerging Market Sovereign – 0.5% | ||||||
| Republic of Argentina, FRN, 0.389%, 2012 | $ | 73,613 | $ | 67,604 | ||
| Republic of South Africa, 5.5%, 2020 | 100,000 | 103,375 | ||||
| $ | 170,979 | |||||
| Energy – Independent – 2.9% | ||||||
| Anadarko Petroleum Corp., 5.95%, 2016 | $ | 20,000 | $ | 17,214 | ||
| Chaparral Energy, Inc., 8.875%, 2017 | 45,000 | 41,400 | ||||
| Chesapeake Energy Corp., 6.375%, 2015 | 40,000 | 41,300 | ||||
| EnCana Corp., 6.5%, 2019 | 50,000 | 57,461 | ||||
| Hilcorp Energy I LP, 9%, 2016 (n) | 55,000 | 56,375 | ||||
| Newfield Exploration Co., 6.625%, 2014 | 40,000 | 40,250 | ||||
| Newfield Exploration Co., 6.625%, 2016 | 30,000 | 30,150 | ||||
| OPTI Canada, Inc., 8.25%, 2014 | 40,000 | 34,800 | ||||
| Penn Virginia Corp., 10.375%, 2016 | 100,000 | 106,500 | ||||
| Petrohawk Energy Corp., 10.5%, 2014 | 20,000 | 21,500 | ||||
| Pioneer Natural Resources Co., 6.875%, 2018 | 35,000 | 35,146 | ||||
| Pioneer Natural Resources Co., 7.5%, 2020 | 90,000 | 92,754 | ||||
| Plains Exploration & Production Co., 7%, 2017 | 70,000 | 66,850 | ||||
| Questar Market Resources, Inc., 6.8%, 2020 | 78,000 | 81,066 | ||||
| Quicksilver Resources, Inc., 8.25%, 2015 | 35,000 | 34,563 | ||||
| Quicksilver Resources, Inc., 9.125%, 2019 | 10,000 | 10,150 | ||||
| Range Resources Corp., 8%, 2019 | 30,000 | 31,313 | ||||
| SandRidge Energy, Inc., 8%, 2018 (n) | 45,000 | 42,638 | ||||
| Southwestern Energy Co., 7.5%, 2018 | 35,000 | 37,188 | ||||
| Talisman Energy, Inc., 7.75%, 2019 | 10,000 | 12,277 | ||||
| Williams Cos., Inc., FRN, 2.29%, 2010 (n) | 80,000 | 79,985 | ||||
| $ | 970,880 | |||||
| Energy – Integrated – 0.6% | ||||||
| Cenovus Energy, Inc., 4.5%, 2014 | $ | 30,000 | $ | 32,046 | ||
| Hess Corp., 8.125%, 2019 | 30,000 | 37,397 | ||||
| Petro-Canada, 5%, 2014 | 110,000 | 118,665 | ||||
| $ | 188,108 | |||||
| Entertainment – 0.3% | ||||||
| AMC Entertainment, Inc., 11%, 2016 | $ | 40,000 | $ | 42,000 | ||
| AMC Entertainment, Inc., 8.75%, 2019 | 30,000 | 30,150 | ||||
| Cinemark USA, Inc., 8.625%, 2019 | 45,000 | 45,225 | ||||
| $ | 117,375 | |||||
| Financial Institutions – 2.3% | ||||||
| CIT Group, Inc., 7%, 2014 | $ | 40,000 | $ | 37,700 | ||
| CIT Group, Inc., 7%, 2017 | 100,000 | 90,000 | ||||
| General Electric Capital Corp., 6%, 2019 | 30,000 | 32,477 | ||||
| General Electric Capital Corp., 5.5%, 2020 | 80,000 | 84,540 | ||||
| General Electric Capital Corp., FRN, 0.474%, 2012 | 90,000 | 87,688 | ||||
| GMAC, Inc., 6.75%, 2014 | 125,000 | 120,937 | ||||
| Issuer | Shares/Par | Value ($) | ||||
| BONDS – continued | ||||||
| Financial Institutions – continued | ||||||
| GMAC, Inc., 8%, 2031 | $ | 73,000 | $ | 67,342 | ||
| International Lease Finance Corp., 5.625%, 2013 | 60,000 | 54,150 | ||||
| International Lease Finance Corp., 8.75%, 2017 (n) | 50,000 | 47,375 | ||||
| Nationstar Mortgage LLC, 10.875%, 2015 (z) | 15,000 | 11,775 | ||||
| ORIX Corp., 5.48%, 2011 | 130,000 | 134,509 | ||||
| $ | 768,493 | |||||
| Food & Beverages – 2.1% | ||||||
| Anheuser-Busch InBev, 7.75%, 2019 (n) | $ | 140,000 | $ | 169,927 | ||
| ARAMARK Corp., 8.5%, 2015 | 30,000 | 30,300 | ||||
| B&G Foods, Inc., 7.625%, 2018 | 25,000 | 25,125 | ||||
| Constellation Brands, Inc., 7.25%, 2016 | 15,000 | 15,131 | ||||
| Del Monte Foods Co., 6.75%, 2015 | 50,000 | 50,687 | ||||
| Kraft Foods, Inc., 6.125%, 2018 | 80,000 | 91,160 | ||||
| Miller Brewing Co., 5.5%, 2013 (n) | 150,000 | 164,099 | ||||
| Pinnacle Foods Finance LLC, 9.25%, 2015 | 45,000 | 45,900 | ||||
| Smithfield Foods, Inc., 7.75%, 2017 | 20,000 | 19,100 | ||||
| TreeHouse Foods, Inc., 7.75%, 2018 | 35,000 | 36,313 | ||||
| Tyson Foods, Inc., 7.85%, 2016 | 70,000 | 76,125 | ||||
| $ | 723,867 | |||||
| Forest & Paper Products – 1.1% | ||||||
| Boise, Inc., 8%, 2020 (n) | $ | 30,000 | $ | 29,925 | ||
| Buckeye Technologies, Inc., 8.5%, 2013 | 25,000 | 25,312 | ||||
| Cascades, Inc., 7.75%, 2017 | 25,000 | 24,875 | ||||
| Georgia-Pacific Corp., 7.125%, 2017 (n) | 35,000 | 35,700 | ||||
| Georgia-Pacific Corp., 8%, 2024 | 55,000 | 58,300 | ||||
| Georgia-Pacific Corp., 7.25%, 2028 | 10,000 | 9,875 | ||||
| Graphic Packaging International Corp., 9.5%, 2013 | 25,000 | 25,437 | ||||
| Millar Western Forest Products Ltd., 7.75%, 2013 | 75,000 | 64,500 | ||||
| Votorantim Participacoes S.A., 6.75%, 2021 (n) | 100,000 | 101,000 | ||||
| $ | 374,924 | |||||
| Gaming & Lodging – 1.6% | ||||||
| Fontainebleau Las Vegas Holdings LLC, 10.25%, 2015 (d)(n) | $ | 65,000 | $ | 244 | ||
| Gaylord Entertainment Co., 6.75%, 2014 | 30,000 | 28,875 | ||||
| GWR Operating Partnership LLP, 10.875%, 2017 (n) | 20,000 | 19,875 | ||||
| Harrah’s Operating Co., Inc., 11.25%, 2017 | 70,000 | 73,675 | ||||
| Harrah’s Operating Co., Inc., 10%, 2018 | 24,000 | 19,680 | ||||
| Harrah’s Operating Co., Inc., 10%, 2018 | 2,000 | 1,640 | ||||
| Host Hotels & Resorts, Inc., 6.75%, 2016 | 40,000 | 39,550 | ||||
| Host Hotels & Resorts, Inc., 9%, 2017 | 5,000 | 5,350 | ||||
| Marriott International, Inc., 5.625%, 2013 | 80,000 | 85,231 | ||||
| MGM Mirage, 10.375%, 2014 | 5,000 | 5,438 | ||||
| MGM Mirage, 7.5%, 2016 | 35,000 | 27,563 | ||||
| MGM Mirage, 11.125%, 2017 | 10,000 | 11,025 | ||||
| MGM Mirage, 11.375%, 2018 (n) | 45,000 | 42,300 | ||||
| MGM Mirage, 9%, 2020 (n) | 30,000 | 30,825 | ||||
7
Table of Contents
MFS Strategic Income Series
Portfolio of Investments (unaudited) – continued
| Issuer | Shares/Par | Value ($) | |||
| BONDS – continued | |||||
| Gaming & Lodging – continued | |||||
| Penn National Gaming, Inc., 8.75%, 2019 | $ 35,000 | $ | 35,963 | ||
| Pinnacle Entertainment, Inc., 7.5%, 2015 | 30,000 | 28,125 | |||
| Royal Caribbean Cruises Ltd., 7%, 2013 | 15,000 | 14,925 | |||
| Royal Caribbean Cruises Ltd., 11.875%, 2015 | 20,000 | 23,000 | |||
| Station Casinos, Inc., 6%, 2012 (d) | 35,000 | 2,078 | |||
| Station Casinos, Inc., 6.5%, 2014 (d) | 85,000 | 638 | |||
| Station Casinos, Inc., 6.875%, 2016 (d) | 180,000 | 135 | |||
| Wyndham Worldwide Corp., 6%, 2016 | 40,000 | 38,807 | |||
| $ | 534,942 | ||||
| Industrial – 0.6% | |||||
| Altra Holdings, Inc., 8.125%, 2016 (n) | $ 25,000 | $ | 24,781 | ||
| Aquilex Corp., 11.125%, 2016 (n) | 5,000 | 5,000 | |||
| Baldor Electric Co., 8.625%, 2017 | 55,000 | 56,925 | |||
| Great Lakes Dredge & Dock Corp., 7.75%, 2013 | 30,000 | 29,700 | |||
| Johnsondiversey Holdings, Inc., 8.25%, 2019 (n) | 20,000 | 20,600 | |||
| RBS Global, Inc. & Rexnord LLC, 8.5%, 2018 (n) | 15,000 | 14,550 | |||
| Steelcase, Inc., 6.5%, 2011 | 61,000 | 62,256 | |||
| $ | 213,812 | ||||
| Insurance – 2.7% | |||||
| Allianz AG, 5.5% to 2014, FRN to 2049 | EUR 105,000 | $ | 115,559 | ||
| American International Group, Inc., 8.175%, to 2038, FRN to 2058 | $ 75,000 | 59,250 | |||
| ING Groep N.V., 5.775% to 2015, FRN to 2049 | 210,000 | 148,050 | |||
| Lincoln National Corp., 7%, 2040 | 60,000 | 63,195 | |||
| Metropolitan Life Global Funding, 2.875%, 2012 (n) | 140,000 | 143,326 | |||
| Metropolitan Life Global Funding, 5.125%, 2014 (n) | 40,000 | 43,453 | |||
| Principal Financial Group, Inc., 8.875%, 2019 | 80,000 | 98,092 | |||
| Prudential Financial, Inc., 6.2%, 2015 | 80,000 | 88,043 | |||
| Prudential Financial, Inc., 5.375%, 2020 | 50,000 | 50,639 | |||
| Unum Group, 7.125%, 2016 | 90,000 | 98,888 | |||
| $ | 908,495 | ||||
| Insurance – Property & Casualty – 1.1% | |||||
| AXIS Capital Holdings Ltd., 5.75%, 2014 | $ 130,000 | $ | 134,868 | ||
| AXIS Capital Holdings Ltd., 5.875%, 2020 | 40,000 | 38,329 | |||
| Liberty Mutual Group, Inc., 10.75% to 2038, FRN to 2058 (n) | 50,000 | 54,000 | |||
| PartnerRe Ltd., 5.5%, 2020 | 66,000 | 63,783 | |||
| USI Holdings Corp., 9.75%, 2015 (z) | 95,000 | 87,163 | |||
| $ | 378,143 | ||||
| International Market Quasi-Sovereign – 3.5% | |||||
| Canada Housing Trust, 4.6%, 2011 (n) | CAD 63,000 | $ | 61,553 | ||
| EDF Energies Nouvelles S.A., 6.5%, 2019 (n) | $ 120,000 | 139,633 | |||
| Issuer | Shares/Par | Value ($) | |||
| BONDS – continued | |||||
| International Market Quasi-Sovereign – continued | |||||
| Finance for Danish Industry A.S., FRN, 0.685%, 2012 (n) | $ 110,000 | $ | 110,799 | ||
| ING Bank N.V., 3.9%, 2014 (n) | 150,000 | 160,801 | |||
| Irish Life & Permanent PLC, 3.6%, 2013 (n) | 200,000 | 198,154 | |||
| LeasePlan Corp. N.V., 3%, 2012 (n) | 60,000 | 61,710 | |||
| Nationwide Building Society, FRN, 0.615%, 2012 (n) | 160,000 | 159,625 | |||
| Royal Bank of Scotland PLC, FRN, 1.121%, 2012 (n) | 183,000 | 183,152 | |||
| Westpac Banking Corp., 3.45%, 2014 (n) | 100,000 | 104,453 | |||
| $ | 1,179,880 | ||||
| International Market Sovereign – 12.2% | |||||
| Federal Republic of Germany, 3.75%, 2015 | EUR 252,000 | $ | 339,988 | ||
| Federal Republic of Germany, 4.25%, 2018 | EUR 177,000 | 246,887 | |||
| Federal Republic of Germany, 6.25%, 2030 | EUR 93,000 | 162,852 | |||
| Government of Canada, 4.5%, 2015 | CAD 59,000 | 61,030 | |||
| Government of Canada, 5.75%, 2033 | CAD 11,000 | 13,642 | |||
| Government of Japan, 1.5%, 2012 | JPY 14,000,000 | 162,503 | |||
| Government of Japan, 1.3%, 2014 | JPY 30,000,000 | 353,899 | |||
| Government of Japan, 1.7%, 2017 | JPY 43,000,000 | 523,284 | |||
| Government of Japan, 2.2%, 2027 | JPY 13,000,000 | 158,001 | |||
| Government of Japan, 2.4%, 2037 | JPY 14,000,000 | 174,083 | |||
| Kingdom of Belgium, 5.5%, 2017 | EUR 83,000 | 118,046 | |||
| Kingdom of the Netherlands, 3.75%, 2014 | EUR 209,000 | 279,513 | |||
| Kingdom of the Netherlands, 5.5%, 2028 | EUR 25,000 | 39,717 | |||
| Republic of Austria, 4.65%, 2018 | EUR 55,000 | 75,673 | |||
| Republic of France, 4.75%, 2012 | EUR 93,000 | 123,550 | |||
| Republic of France, 6%, 2025 | EUR 79,000 | 125,439 | |||
| Republic of France, 4.75%, 2035 | EUR 107,000 | 153,409 | |||
| Republic of Ireland, 4.6%, 2016 | EUR 120,000 | 146,104 | |||
| Republic of Italy, 4.75%, 2013 | EUR 190,000 | 245,601 | |||
| Republic of Italy, 5.25%, 2017 | EUR 216,000 | 290,509 | |||
| United Kingdom Treasury, 8%, 2015 | GBP 98,000 | 189,167 | |||
| United Kingdom Treasury, 8%, 2021 | GBP 36,000 | 76,315 | |||
| United Kingdom Treasury, 4.25%, 2036 | GBP 50,000 | 75,579 | |||
| $ | 4,134,791 | ||||
| Local Authorities – 0.6% | |||||
| Louisiana Gas & Fuels Tax Rev. (Build America Bonds), FRN, 3%, 2043 | $ 100,000 | $ | 101,151 | ||
| Province of Ontario, 5.45%, 2016 | 95,000 | 109,201 | |||
| $ | 210,352 | ||||
| Machinery & Tools – 0.8% | |||||
| Atlas Copco AB, 5.6%, 2017 (n) | $ 135,000 | $ | 146,157 | ||
| Case Corp., 7.25%, 2016 | 15,000 | 15,037 | |||
| Case New Holland, Inc., 7.125%, 2014 | 45,000 | 46,575 | |||
| Case New Holland, Inc., 7.875%, 2017 (z) | 25,000 | 25,187 | |||
8
Table of Contents
MFS Strategic Income Series
Portfolio of Investments (unaudited) – continued
| Issuer | Shares/Par | Value ($) | ||||
| BONDS – continued | ||||||
| Machinery & Tools – continued | ||||||
| Rental Service Corp., 9.5%, 2014 | $ | 30,000 | $ | 29,813 | ||
| $ | 262,769 | |||||
| Major Banks – 4.9% | ||||||
| BAC Capital Trust XIV, 5.63% to 2012, FRN to 2049 | $ | 240,000 | $ | 162,000 | ||
| Bank of America Corp., 7.375%, 2014 | 50,000 | 56,038 | ||||
| Bank of America Corp., 8% to 2018, FRN to 2049 | 45,000 | 43,467 | ||||
| Bank of New York Mellon Corp., 4.3%, 2014 | 140,000 | 150,365 | ||||
| Barclays Bank PLC, 5.125%, 2020 | 100,000 | 99,471 | ||||
| BNP Paribas, 5.186% to 2015, FRN to 2049 (n) | 26,000 | 21,320 | ||||
| BNP Paribas, 7.195% to 2037, FRN to 2049 (n) | 100,000 | 87,000 | ||||
| Commonwealth Bank of Australia, 5%, 2019 (n) | 80,000 | 83,043 | ||||
| Goldman Sachs Group, Inc., 6%, 2014 | �� | 50,000 | 53,733 | |||
| Goldman Sachs Group, Inc., 7.5%, 2019 | 86,000 | 96,129 | ||||
| JPMorgan Chase Capital XXVII, 7%, 2039 | 90,000 | 91,524 | ||||
| Macquarie Group Ltd., 6%, 2020 (n) | 108,000 | 109,459 | ||||
| Merrill Lynch & Co., Inc., 6.4%, 2017 | 30,000 | 31,282 | ||||
| Morgan Stanley, 6.75%, 2011 | 40,000 | 41,385 | ||||
| Morgan Stanley, 6%, 2014 | 100,000 | 105,959 | ||||
| Morgan Stanley, 5.625%, 2019 | 100,000 | 96,741 | ||||
| Royal Bank of Scotland Group PLC, FRN, 7.648%, 2049 | 55,000 | 41,250 | ||||
| Standard Chartered PLC, 3.85%, 2015 (n) | 100,000 | 100,893 | ||||
| UniCredito Italiano Capital Trust II, 9.2% to 2010, FRN to 2049 (n) | 125,000 | 118,125 | ||||
| Wells Fargo & Co., 7.98% to 2018, FRN to 2049 | 49,000 | 50,470 | ||||
| $ | 1,639,654 | |||||
| Medical & Health Technology & Services – 3.4% | ||||||
| Biomet, Inc., 10%, 2017 | $ | 5,000 | $ | 5,375 | ||
| Biomet, Inc., 11.625%, 2017 | 55,000 | 59,537 | ||||
| Capella Healthcare, Inc., 9.25%, 2017 (z) | 5,000 | 5,050 | ||||
| Cardinal Health, Inc., 5.8%, 2016 | 94,000 | 105,265 | ||||
| Community Health Systems, Inc., 8.875%, 2015 | 80,000 | 82,500 | ||||
| Cooper Cos., Inc., 7.125%, 2015 | 35,000 | 35,087 | ||||
| DaVita, Inc., 6.625%, 2013 | 14,000 | 14,017 | ||||
| DaVita, Inc., 7.25%, 2015 | 73,000 | 73,000 | ||||
| Fresenius Medical Care AG & Co. KGaA, 9%, 2015 (n) | 20,000 | 21,675 | ||||
| HCA, Inc., 9.25%, 2016 | 115,000 | 121,900 | ||||
| HCA, Inc., 8.5%, 2019 | 25,000 | 26,500 | ||||
| HealthSouth Corp., 8.125%, 2020 | 50,000 | 49,125 | ||||
| Hospira, Inc., 5.55%, 2012 | 50,000 | 53,238 | ||||
| Hospira, Inc., 6.05%, 2017 | 60,000 | 67,553 | ||||
| McKesson Corp., 5.7%, 2017 | 40,000 | 45,229 | ||||
| Owens & Minor, Inc., 6.35%, 2016 | 70,000 | 70,496 | ||||
| Psychiatric Solutions, Inc., 7.75%, 2015 | 20,000 | 20,500 | ||||
| Psychiatric Solutions, Inc., 7.75%, 2015 | 15,000 | 15,375 | ||||
| Issuer | Shares/Par | Value ($) | ||||
| BONDS – continued | ||||||
| Medical & Health Technology & Services – continued | ||||||
| Tenet Healthcare Corp., 9.25%, 2015 | $ | 55,000 | $ | 56,788 | ||
| U.S. Oncology, Inc., 10.75%, 2014 | 45,000 | 46,125 | ||||
| United Surgical Partners International, Inc., 8.875%, 2017 | 15,000 | 14,963 | ||||
| United Surgical Partners International, Inc., 9.25%, 2017 (p) | 15,000 | 15,000 | ||||
| Universal Hospital Services, Inc., 8.5%, 2015 (p) | 55,000 | 54,175 | ||||
| Universal Hospital Services, Inc., FRN, 4.133%, 2015 | 10,000 | 8,400 | ||||
| Vanguard Health Systems, Inc., 8%, 2018 | 40,000 | 38,400 | ||||
| VWR Funding, Inc., 10.25%, 2015 (p) | 47,531 | 48,006 | ||||
| $ | 1,153,279 | |||||
| Metals & Mining – 1.2% | ||||||
| Arch Western Finance LLC, 6.75%, 2013 | $ | 35,000 | $ | 35,087 | ||
| Cloud Peak Energy, Inc., 8.25%, 2017 (n) | 30,000 | 29,700 | ||||
| Cloud Peak Energy, Inc., 8.5%, 2019 (n) | 30,000 | 29,850 | ||||
| CONSOL Energy, Inc., 8%, 2017 (n) | 20,000 | 20,650 | ||||
| CONSOL Energy, Inc., 8.25%, 2020 (n) | 15,000 | 15,637 | ||||
| FMG Finance Ltd., 10.625%, 2016 (n) | 40,000 | 44,000 | ||||
| Peabody Energy Corp., “B”, 6.875%, 2013 | 65,000 | 65,488 | ||||
| Rio Tinto Finance USA Ltd., 5.875%, 2013 | 30,000 | 32,870 | ||||
| Southern Copper Corp., 6.75%, 2040 | 100,000 | 98,848 | ||||
| Teck Resources Ltd., 10.25%, 2016 | 10,000 | 11,800 | ||||
| Teck Resources Ltd., 10.75%, 2019 | 15,000 | 18,380 | ||||
| U.S. Steel Corp., 7.375%, 2020 | 20,000 | 19,775 | ||||
| $ | 422,085 | |||||
| Mortgage-Backed – 1.9% | ||||||
| Fannie Mae, 6%, 2017 | $ | 69,387 | $ | 75,658 | ||
| Fannie Mae, 5.5%, 2020-2034 | 424,998 | 460,662 | ||||
| Freddie Mac, 4.224%, 2020 | 94,792 | 98,214 | ||||
| $ | 634,534 | |||||
| Natural Gas – Distribution – 0.4% | ||||||
| AmeriGas Partners LP, 7.125%, 2016 | $ | 55,000 | $ | 54,725 | ||
| Ferrellgas Partners LP, 8.625%, 2020 | 35,000 | 35,000 | ||||
| Inergy LP, 6.875%, 2014 | 35,000 | 34,475 | ||||
| $ | 124,200 | |||||
| Natural Gas – Pipeline – 1.9% | ||||||
| Atlas Pipeline Partners LP, 8.125%, 2015 | $ | 45,000 | $ | 41,400 | ||
| CenterPoint Energy, Inc., 7.875%, 2013 | 142,000 | 162,714 | ||||
| Crosstex Energy, Inc., 8.875%, 2018 | 35,000 | 34,956 | ||||
| El Paso Corp., 8.25%, 2016 | 35,000 | 36,662 | ||||
| El Paso Corp., 7%, 2017 | 45,000 | 44,747 | ||||
| El Paso Corp., 7.75%, 2032 | 15,000 | 14,823 | ||||
| Enterprise Products Partners LP, FRN, 8.375%, 2066 | 20,000 | 19,975 | ||||
| Kinder Morgan Finance Corp., 5.35%, 2011 | 169,000 | 169,845 | ||||
| MarkWest Energy Partners LP, 6.875%, 2014 | 30,000 | 28,800 | ||||
| Spectra Energy Capital LLC, 8%, 2019 | 66,000 | 79,382 | ||||
| $ | 633,304 | |||||
9
Table of Contents
MFS Strategic Income Series
Portfolio of Investments (unaudited) – continued
| Issuer | Shares/Par | Value ($) | ||||
| BONDS – continued | ||||||
| Network & Telecom – 2.8% | ||||||
| AT&T, Inc., 5.8%, 2019 | $ | 70,000 | $ | 78,809 | ||
| Axtel S.A.B. de C.V., 9%, 2019 (n) | 100,000 | 89,000 | ||||
| CenturyTel, Inc., 7.6%, 2039 | 90,000 | 85,321 | ||||
| Cincinnati Bell, Inc., 8.25%, 2017 | 10,000 | 9,350 | ||||
| Cincinnati Bell, Inc., 8.75%, 2018 | 35,000 | 31,762 | ||||
| Citizens Communications Co., 9%, 2031 | 15,000 | 13,912 | ||||
| France Telecom, 4.375%, 2014 | 80,000 | 86,270 | ||||
| New Communications Holdings, Inc., 8.5%, 2020 (n) | 35,000 | 35,087 | ||||
| Nordic Telephone Co. Holdings, 8.875%, 2016 (n) | 55,000 | 56,513 | ||||
| Qwest Communications International, Inc., 8%, 2015 (n) | 10,000 | 10,275 | ||||
| Qwest Communications International, Inc., 7.125%, 2018 (n) | 35,000 | 34,913 | ||||
| Qwest Corp., 7.5%, 2014 | 65,000 | 69,144 | ||||
| Telecom Italia Capital, 4.875%, 2010 | 26,000 | 26,192 | ||||
| Telefonica S.A., 5.877%, 2019 | 80,000 | 85,326 | ||||
| Verizon Communications, Inc., 8.75%, 2018 | 80,000 | 103,998 | ||||
| Verizon New England, Inc., 6.5%, 2011 | 60,000 | 63,366 | ||||
| Windstream Corp., 8.625%, 2016 | 70,000 | 70,525 | ||||
| $ | 949,763 | |||||
| Oil Services – 0.7% | ||||||
| Allis-Chalmers Energy, Inc., 8.5%, 2017 | $ | 35,000 | $ | 30,275 | ||
| Basic Energy Services, Inc., 7.125%, 2016 | 15,000 | 12,450 | ||||
| Edgen Murray Corp., 12.25%, 2015 (n) | 15,000 | 12,675 | ||||
| McJunkin Red Man Holding Corp., 9.5%, 2016 (n) | 30,000 | 29,100 | ||||
| Pioneer Drilling Co., 9.875%, 2018 (n) | 25,000 | 24,500 | ||||
| Smith International, Inc., 9.75%, 2019 | 100,000 | 136,111 | ||||
| $ | 245,111 | |||||
| Other Banks & Diversified Financials – 4.4% | ||||||
| American Express Centurion Bank, 5.2%, 2010 | $ | 250,000 | $ | 253,793 | ||
| Banco Votorantim S.A., 7.375%, 2020 (n) | 100,000 | 102,250 | ||||
| Bank of China (Hong Kong) Ltd., 5.55%, 2020 (n) | 135,000 | 134,269 | ||||
| Bosphorus Financial Services Ltd., FRN, 2.235%, 2012 (z) | 43,750 | 42,823 | ||||
| Capital One Financial Corp., 10.25%, 2039 | 100,000 | 105,500 | ||||
| Citigroup, Inc., 6.375%, 2014 | 80,000 | 84,972 | ||||
| Citigroup, Inc., 5.5%, 2014 | 60,000 | 61,687 | ||||
| Citigroup, Inc., 8.5%, 2019 | 52,000 | 61,990 | ||||
| Groupe BPCE S.A., 12.5% to 2019, FRN to 2049 (n) | 102,000 | 113,454 | ||||
| Lloyds TSB Bank PLC, 5.8%, 2020 (n) | 110,000 | 103,828 | ||||
| Svenska Handelsbanken AB, 4.875%, 2014 (n) | 110,000 | 116,144 | ||||
| UBS Preferred Funding Trust V, 6.243% to 2016, FRN to 2049 | 120,000 | 102,900 | ||||
| UFJ Finance Aruba AEC, 6.75%, 2013 | 70,000 | 78,398 | ||||
| VTB Capital S.A., 6.465%, 2015 (n) | 123,000 | 123,000 | ||||
| $ | 1,485,008 | |||||
| Issuer | Shares/Par | Value ($) | ||||
| BONDS – continued | ||||||
| Pharmaceuticals – 1.2% | ||||||
| Pfizer, Inc., 6.2%, 2019 | $ | 160,000 | $ | 190,144 | ||
| Roche Holdings, Inc., 6%, 2019 (n) | 140,000 | 163,085 | ||||
| Teva Pharmaceutical Finance LLC, 5.55%, 2016 | 39,000 | 44,440 | ||||
| $ | 397,669 | |||||
| Pollution Control – 0.6% | ||||||
| Allied Waste North America, Inc., 7.125%, 2016 | $ | 125,000 | $ | 134,062 | ||
| Republic Services, Inc., 5.25%, 2021 (n) | 80,000 | 84,172 | ||||
| $ | 218,234 | |||||
| Printing & Publishing – 0.6% | ||||||
| American Media Operations, Inc., 9%, 2013 (p)(z) | $ | 3,191 | $ | 2,024 | ||
| American Media Operations, Inc., 14%, 2013 (p)(z) | 34,987 | 22,633 | ||||
| McClatchy Co., 11.5%, 2017 (n) | 15,000 | 15,225 | ||||
| Nielsen Finance LLC, 10%, 2014 | 65,000 | 66,463 | ||||
| Nielsen Finance LLC, 11.5%, 2016 | 20,000 | 21,850 | ||||
| Nielsen Finance LLC, 0% to 2011, 12.5% to 2016 | 66,000 | 62,865 | ||||
| $ | 191,060 | |||||
| Railroad & Shipping – 0.4% | ||||||
| Kansas City Southern Railway, 8%, 2015 | $ | 45,000 | $ | 46,350 | ||
| Panama Canal Railway Co., 7%, 2026 (n) | 95,100 | 76,080 | ||||
| $ | 122,430 | |||||
| Real Estate – 1.1% | ||||||
| Entertainment Properties Trust, REIT, 7.75%, 2020 (z) | $ | 15,000 | $ | 15,037 | ||
| Kimco Realty Corp., REIT, 6.875%, 2019 | 22,000 | 24,511 | ||||
| Simon Property Group, Inc., REIT, 6.1%, 2016 | 190,000 | 210,888 | ||||
| WEA Finance LLC, REIT, 5.4%, 2012 (n) | 50,000 | 52,997 | ||||
| WEA Finance LLC, REIT, 6.75%, 2019 (n) | 60,000 | 66,687 | ||||
| $ | 370,120 | |||||
| Retailers – 2.4% | ||||||
| AutoZone, Inc., 6.5%, 2014 | $ | 150,000 | $ | 168,753 | ||
| Couche-Tard, Inc., 7.5%, 2013 | 65,000 | 65,325 | ||||
| Dollar General Corp., 11.875%, 2017 (p) | 17,000 | 19,316 | ||||
| Express Parent LLC, 8.75%, 2018 (n) | 20,000 | 20,350 | ||||
| Limited Brands, Inc., 5.25%, 2014 | 25,000 | 24,813 | ||||
| Limited Brands, Inc., 6.9%, 2017 | 25,000 | 25,063 | ||||
| Limited Brands, Inc., 6.95%, 2033 | 15,000 | 13,181 | ||||
| Macy’s, Inc., 5.75%, 2014 | 30,000 | 30,150 | ||||
| Macy’s, Inc., 8.375%, 2015 | 120,000 | 132,300 | ||||
| Macy’s, Inc., 5.9%, 2016 | 40,000 | 40,100 | ||||
| Neiman Marcus Group, Inc., 10.375%, 2015 | 35,000 | 35,613 | ||||
| QVC, Inc., 7.375%, 2020 (n) | 25,000 | 24,313 | ||||
| Sally Beauty Holdings, Inc., 10.5%, 2016 | 45,000 | 48,150 | ||||
| Staples, Inc., 9.75%, 2014 | 80,000 | 98,134 | ||||
| Toys “R” Us, Inc., 10.75%, 2017 (n) | 30,000 | 32,775 | ||||
| Toys “R” Us, Inc., 8.5%, 2017 (n) | 15,000 | 15,375 | ||||
| $ | 793,711 | |||||
10
Table of Contents
MFS Strategic Income Series
Portfolio of Investments (unaudited) – continued
| Issuer | Shares/Par | Value ($) | ||||
| BONDS – continued | ||||||
| Specialty Stores – 0.2% | ||||||
| Michaels Stores, Inc., 11.375%, 2016 | $ | 15,000 | $ | 15,600 | ||
| Payless ShoeSource, Inc., 8.25%, 2013 | 44,000 | 44,440 | ||||
| $ | 60,040 | |||||
| Supermarkets – 0.3% | ||||||
| Delhaize Group, 5.875%, 2014 | $ | 90,000 | $ | 100,444 | ||
| Supranational – 0.4% | ||||||
| Central American Bank, 4.875%, 2012 (n) | $ | 140,000 | $ | 144,857 | ||
| Telecommunications – Wireless – 2.0% | ||||||
| American Tower Corp., 4.625%, 2015 | $ | 40,000 | $ | 41,609 | ||
| Clearwire Corp., 12%, 2015 (n) | 30,000 | 29,737 | ||||
| Cricket Communications, Inc., 7.75%, 2016 | 20,000 | 20,400 | ||||
| Crown Castle International Corp., 9%, 2015 | 20,000 | 21,150 | ||||
| Crown Castle International Corp., 7.75%, 2017 (n) | 15,000 | 15,862 | ||||
| Crown Castle International Corp., 7.125%, 2019 | 60,000 | 58,650 | ||||
| Crown Castle Towers LLC, 6.113%, 2020 (n) | 104,000 | 114,146 | ||||
| Nextel Communications, Inc., 6.875%, 2013 | 30,000 | 29,063 | ||||
| NII Capital Corp., 8.875%, 2019 | 20,000 | 20,200 | ||||
| NII Holdings, Inc., 10%, 2016 | 30,000 | 31,575 | ||||
| Rogers Cable, Inc., 5.5%, 2014 | 79,000 | 87,231 | ||||
| SBA Communications Corp., 8.25%, 2019 (n) | 10,000 | 10,525 | ||||
| Sprint Capital Corp., 6.875%, 2028 | 15,000 | 12,450 | ||||
| Sprint Nextel Corp., 8.375%, 2017 | 70,000 | 70,000 | ||||
| Sprint Nextel Corp., 8.75%, 2032 | 20,000 | 19,100 | ||||
| Wind Acquisition Finance S.A., 12%, 2015 (n) | 75,000 | 77,625 | ||||
| $ | 659,323 | |||||
| Telephone Services – 0.1% | ||||||
| Frontier Communications Corp., 8.125%, 2018 | $ | 40,000 | $ | 39,750 | ||
| Tobacco – 1.2% | ||||||
| Alliance One International, Inc., 10%, 2016 (n) | $ | 20,000 | $ | 20,350 | ||
| Altria Group, Inc., 9.25%, 2019 | 130,000 | 162,254 | ||||
| Lorillard Tobacco Co., 8.125%, 2019 | 37,000 | 41,035 | ||||
| Lorillard Tobacco Co., 6.875%, 2020 | 50,000 | 50,792 | ||||
| Reynolds American, Inc., 6.75%, 2017 | 135,000 | 146,257 | ||||
| $ | 420,688 | |||||
| Transportation – Services – 0.7% | ||||||
| American Petroleum Tankers LLC, 10.25%, 2015 (z) | $ | 5,000 | $ | 5,012 | ||
| Commercial Barge Line Co., 12.5%, 2017 | 40,000 | 42,250 | ||||
| Erac USA Finance Co., 6.375%, 2017 (n) | 110,000 | 123,825 | ||||
| Hertz Corp., 8.875%, 2014 | 55,000 | 55,688 | ||||
| $ | 226,775 | |||||
| U.S. Government Agencies and Equivalents – 1.9% | ||||||
| Small Business Administration, 6.35%, 2021 | $ | 57,890 | $ | 62,881 | ||
| Issuer | Shares/Par | Value ($) | ||||
| BONDS – continued | ||||||
| U.S. Government Agencies and Equivalents – continued | ||||||
| Small Business Administration, 4.34%, 2024 | $ | 115,030 | $ | 120,877 | ||
| Small Business Administration, 4.99%, 2024 | 135,719 | 144,753 | ||||
| Small Business Administration, 4.86%, 2025 | 159,262 | 170,183 | ||||
| Small Business Administration, 4.625%, 2025 | 62,293 | 66,116 | ||||
| Small Business Administration, 5.11%, 2025 | 57,697 | 62,203 | ||||
| $ | 627,013 | |||||
| U.S. Treasury Obligations – 0.7% | ||||||
| U.S. Treasury Bonds, 5.375%, 2031 (f) | $ | 51,000 | $ | 62,746 | ||
| U.S. Treasury Bonds, 4.5%, 2036 | 17,000 | 18,780 | ||||
| U.S. Treasury Notes, 2.625%, 2016 | 40,000 | 41,153 | ||||
| U.S. Treasury Notes, 4.625%, 2017 | 100,000 | 114,242 | ||||
| $ | 236,921 | |||||
| Utilities – Electric Power – 4.1% | ||||||
| AES Corp., 8%, 2017 | $ | 65,000 | $ | 65,650 | ||
| Allegheny Energy, Inc., 5.75%, 2019 (n) | 90,000 | 89,334 | ||||
| Calpine Corp., 8%, 2016 (n) | 35,000 | 35,787 | ||||
| Colbun S.A., 6%, 2020 (n) | 100,000 | 104,403 | ||||
| Duke Energy Corp., 3.35%, 2015 | 230,000 | 234,594 | ||||
| Dynegy Holdings, Inc., 7.5%, 2015 (n) | 15,000 | 11,794 | ||||
| Dynegy Holdings, Inc., 7.5%, 2015 | 45,000 | 35,606 | ||||
| Dynegy Holdings, Inc., 7.75%, 2019 | 30,000 | 20,737 | ||||
| Edison Mission Energy, 7%, 2017 | 85,000 | 54,400 | ||||
| EDP Finance B.V., 6%, 2018 (n) | 130,000 | 128,032 | ||||
| Enel Finance International S.A., 5.125%, 2019 (n) | 183,000 | 183,815 | ||||
| Energy Future Holdings Corp., 10.875%, 2017 | 15,000 | 11,100 | ||||
| Energy Future Holdings Corp., 10%, 2020 (n) | 35,000 | 34,825 | ||||
| Exelon Generation Co. LLC, 5.2%, 2019 | 40,000 | 42,551 | ||||
| Exelon Generation Co. LLC, 6.25%, 2039 | 80,000 | 85,456 | ||||
| FirstEnergy Corp., 6.45%, 2011 | 4,000 | 4,225 | ||||
| Mirant North America LLC, 7.375%, 2013 | 45,000 | 46,013 | ||||
| NRG Energy, Inc., 7.375%, 2016 | 70,000 | 69,650 | ||||
| Pacific Gas & Electric Co., 4.2%, 2011 | 80,000 | 81,638 | ||||
| Texas Competitive Electric Holdings LLC, 10.25%, 2015 | 90,000 | 59,400 | ||||
| $ | 1,399,010 | |||||
| Total Bonds (Identified Cost, $31,030,816) | $ | 31,196,459 | ||||
| FLOATING RATE LOANS (g)(r) – 0.8% | ||||||
| Automotive – 0.3% | ||||||
| Accuride Corp., Term Loan, 9.75%, 2013 | $ | 5,802 | $ | 5,773 | ||
| Allison Transmission, Inc., Term Loan B, 3.09%, 2014 | 69,070 | 62,832 | ||||
| Ford Motor Co., Term Loan, 3.33%, 2013 | 37,202 | 35,109 | ||||
| $ | 103,714 | |||||
11
Table of Contents
MFS Strategic Income Series
Portfolio of Investments (unaudited) – continued
| Issuer | Shares/Par | Value ($) | ||||
| FLOATING RATE LOANS (g)(r) – continued | ||||||
| Broadcasting – 0.1% | ||||||
| Gray Television, Inc., Term Loan B, 3.8%, 2014 | $ | 13,522 | $ | 12,621 | ||
| New Young Broadcasting Holding Co., Inc, Term Loan, 2015 (o) | 12,688 | 12,607 | ||||
| $ | 25,228 | |||||
| Consumer Services – 0.1% | ||||||
| Realogy Corp., Letter of Credit, 3.39%, 2013 | $ | 4,343 | $ | 3,665 | ||
| Realogy Corp., Term Loan, 3.29%, 2013 | 16,130 | 13,614 | ||||
| $ | 17,279 | |||||
| Financial Institutions – 0.0% | ||||||
| American General Financial Corp., Term Loan B, 7.25%, 2015 | $ | 6,129 | $ | 5,954 | ||
| Gaming & Lodging – 0.0% | ||||||
| Green Valley Ranch Gaming LLC, Second Lien Term Loan, 3.5%, 2014 (d) | $ | 47,816 | $ | 1,674 | ||
| Printing & Publishing – 0.1% | ||||||
| Tribune Co., Incremental Term Loan B, 5.25%, 2014 (d) | $ | 50,259 | $ | 29,671 | ||
| Utilities – Electric Power – 0.2% | ||||||
| Texas Competitive Electric Holdings Co. LLC, Term Loan B-2, 3.97%, 2014 (o) | $ | 73,819 | $ | 54,395 | ||
| Texas Competitive Electric Holdings Co. LLC, Term Loan B-3, 3.85%, 2014 | 42,069 | 30,980 | ||||
| $ | 85,375 | |||||
| Total Floating Rate Loans (Identified Cost, $320,862) | $ | 268,895 | ||||
| COMMON STOCKS – 0.3% | ||||||
| Automotive – 0.0% | ||||||
| Accuride Corp. (a) | 5,345 | $ | 6,788 | |||
| Broadcasting – 0.1% | ||||||
| Dex One Corp. (a) | 521 | $ | 9,899 | |||
| New Young Broadcasting Holding Co., Inc. (a) | 6 | 11,293 | ||||
| Supermedia, Inc. (a) | 35 | 640 | ||||
| $ | 21,832 | |||||
| Chemicals – 0.1% | ||||||
| LyondellBasell Industries N.V., “A” (a) | 775 | $ | 12,516 | |||
| LyondellBasell Industries N.V., “B” (a) | 1,693 | 27,342 | ||||
| $ | 39,858 | |||||
| Construction – 0.1% | ||||||
| Nortek, Inc. (a) | 1,028 | $ | 43,176 | |||
| Issuer | Shares/Par | Value ($) | |||||||||
| COMMON STOCKS – continued | |||||||||||
| Printing & Publishing – 0.0% | |||||||||||
| American Media, Inc. (a) | 559 | $ | 3,424 | ||||||||
| World Color Press, Inc. (a) | 241 | 2,687 | |||||||||
| $ | 6,111 | ||||||||||
| Total Common Stocks (Identified Cost, $171,717) | $ | 117,765 | |||||||||
| CONVERTIBLE BONDS – 0.1% | |||||||||||
| Automotive – 0.1% | |||||||||||
| Accuride Corp., 7.5%, 2020 | $ | 7,636 | $ | 19,591 | |||||||
| Oil Services – 0.0% | |||||||||||
| Transocean, Inc., 1.5%, 2037 | $ | 15,000 | $ | 12,413 | |||||||
| Total Convertible Bonds (Identified Cost, $20,128) | $ | 32,004 | |||||||||
| Strike Price | First Exercise | ||||||||||
| WARRANTS – 0.1% | |||||||||||
| Broadcasting – 0.1% | |||||||||||
| New Young Broadcasting Holding Co., Inc. (1 share for 1 warrant) (a) | $ | 0.01 | 7/14/10 | 15 | $ | 30,630 | |||||
| Printing & Publishing – 0.0% | |||||||||||
| World Color Press, Inc. (1 share for 1 warrant) (a) | $ | 13.00 | 8/26/09 | 136 | $ | 204 | |||||
| World Color Press, Inc. (1 share for 1 warrant) (a) | $ | 16.30 | 8/26/09 | 122 | 101 | ||||||
| $ | 305 | ||||||||||
| Total Warrants (Identified Cost, $33,142) | $ | 30,935 | |||||||||
| PREFERRED STOCKS – 0.0% | |||||||||||
| Other Banks & Diversified Financials – 0.0% | |||||||||||
| Ally Financial, Inc., 7% (Identified Cost, $11,550) (z) | 15 | $ | 11,659 | ||||||||
| MONEY MARKET FUNDS (v) – 4.5% | |||||||||||
| MFS Institutional Money Market Portfolio, 0.22%, at Cost and Net Asset Value | 1,510,581 | $ | 1,510,581 | ||||||||
| Total Investments (Identified Cost, $33,098,796) | $ | 33,168,298 | |||||||||
| OTHER ASSETS, LESS LIABILITIES – 1.8% | 611,654 | ||||||||||
| Net Assets – 100.0% | $ | 33,779,952 | |||||||||
12
Table of Contents
MFS Strategic Income Series
Portfolio of Investments (unaudited) – continued
| (a) | Non-income producing security. |
| (d) | Non-income producing security – in default. |
| (f) | All or a portion of the security has been segregated as collateral for open futures contracts. |
| (g) | The rate shown represents a weighted average coupon rate on settled positions at period end, unless otherwise indicated. |
| (i) | Interest only security for which the fund receives interest on notional principal (Par amount). Par amount shown is the notional principal and does not reflect the cost of the security. |
| (n) | Securities exempt from registration under Rule 144A of the Securities Act of 1933. These securities may be sold in the ordinary course of business in transactions exempt from registration, normally to qualified institutional buyers. At period end, the aggregate value of these securities was $7,070,481 representing 20.9% of net assets. |
| (o) | All or a portion of this position has not settled. Upon settlement date, interest rates for unsettled amounts will be determined. The rate shown represents the weighted average coupon rate for settled amounts. |
| (p) | Payment-in-kind security. |
| (r) | Remaining maturities of floating rate loans may be less than stated maturities shown as a result of contractual or optional prepayments by the borrower. Such prepayments cannot be predicted with certainty. These loans may be subject to restrictions on resale. Floating rate loans generally have rates of interest which are determined periodically by reference to a base lending rate plus a premium. |
| (v) | Underlying fund that is available only to investment companies managed by MFS. The rate quoted is the annualized seven-day yield of the fund at period end. |
| (z) | Restricted securities are not registered under the Securities Act of 1933 and are subject to legal restrictions on resale. These securities generally may be resold in transactions exempt from registration or to the public if the securities are subsequently registered. Disposal of these securities may involve time-consuming negotiations and prompt sale at an acceptable price may be difficult. The fund holds the following restricted securities: |
| Restricted Securities | Acquisition Date | Cost | Current Market Value | |||
| Ally Financial, Inc., 7% (Preferred Stock) | 12/26/08 | $11,550 | $11,659 | |||
| American Media Operations, Inc., 9%, 2013 | 1/29/09-4/15/10 | 2,323 | 2,024 | |||
| American Media Operations, Inc., 14%, 2013 | 1/29/09-5/01/10 | 22,647 | 22,633 | |||
| American Petroleum Tankers LLC, 10.25%, 2015 | 5/06/10 | 4,863 | 5,012 | |||
| ARCap REIT, Inc., CDO, “H”, 6.083%, 2045 | 9/21/04 | 87,237 | 6,250 | |||
| Bayview Financial Revolving Mortgage Loan Trust, FRN, 1.947%, 2040 | 3/01/06 | 193,279 | 79,592 | |||
| Bonten Media Acquisition Co., 9%, 2015 | 5/31/07-5/15/10 | 19,956 | 11,466 | |||
| Bosphorus Financial Services Ltd., FRN, 2.235%, 2012 | 3/08/05 | 43,750 | 42,823 | |||
| Brazilian Merchant Voucher Receivables Ltd., 5.911%, 2011 | 3/08/07 | 48,068 | 48,009 | |||
| Capella Healthcare, Inc., 9.25%, 2017 | 6/21/10 | 4,937 | 5,050 | |||
| Case New Holland, Inc., 7.875%, 2017 | 6/22/10 | 24,830 | 25,187 | |||
| Crest Ltd., “A1” CDO, FRN, 1.017%, 2018 | 1/21/10 | 76,469 | 82,081 | |||
| DLJ Commercial Mortgage Corp., 6.04%, 2031 | 7/23/04 | 178,111 | 184,568 | |||
| Entertainment Properties Trust, REIT, 7.75%, 2020 | 6/25/10 | 14,743 | 15,037 | |||
| Falcon Franchise Loan LLC, 6.5%, 2014 | 7/15/05 | 233,236 | 94,375 | |||
| Falcon Franchise Loan LLC, FRN, 3.965%, 2025 | 1/29/03 | 107,053 | 32,935 | |||
| Insight Communications Co., Inc., 9.375%, 2018 | 6/30/10 | 20,000 | 20,000 | |||
| LBI Media, Inc., 8.5%, 2017 | 7/18/07 | 29,609 | 25,725 | |||
| Local TV Finance LLC, 10%, 2015 | 11/13/07-5/31/10 | 53,031 | 44,707 | |||
| Morgan Stanley Capital I, Inc., FRN, 1.239%, 2039 | 7/20/04 | 18,129 | 34,372 | |||
| Nationstar Mortgage LLC, 10.875%, 2015 | 3/23/10 | 14,598 | 11,775 | |||
| Prudential Securities Secured Financing Corp., FRN, 7.256%, 2013 | 12/06/04 | 177,452 | 156,946 | |||
| Salomon Brothers Mortgage Securities, Inc., FRN, 6.948%, 2032 | 7/01/05 | 140,311 | 141,979 | |||
| USI Holdings Corp., 9.75%, 2015 | 4/26/07-6/08/07 | 96,284 | 87,163 | |||
| Total Restricted Securities | $1,191,368 | |||||
| % of Net Assets | 3.5% |
13
Table of Contents
MFS Strategic Income Series
Portfolio of Investments (unaudited) – continued
The following abbreviations are used in this report and are defined:
| CDO | Collateralized Debt Obligation |
| FRN | Floating Rate Note. Interest rate resets periodically and may not be the rate reported at period end. |
| PLC | Public Limited Company |
| REIT | Real Estate Investment Trust |
Abbreviations indicate amounts shown in currencies other than the U.S. dollar. All amounts are stated in U.S. dollars unless otherwise indicated. A list of abbreviations is shown below:
| CAD | Canadian Dollar |
| CNY | Chinese Yuan Renminbi |
| EUR | Euro |
| GBP | British Pound |
| JPY | Japanese Yen |
| SEK | Swedish Krona |
Derivative Contracts at 6/30/10
Forward Foreign Currency Exchange Contracts at 6/30/10
| Type | Currency | Counterparty | Contracts to Deliver/Receive | Settlement Date Range | In Exchange For | Contracts at Value | Net Unrealized Appreciation (Depreciation) | |||||||||||||
| Asset Derivatives | ||||||||||||||||||||
| SELL | CAD | UBS AG | 153,202 | 8/06/10 | $ | 146,504 | $ | 143,882 | $ | 2,622 | ||||||||||
| SELL | GBP | Barclays Bank PLC | 105,801 | 7/12/10 | 161,421 | 158,075 | 3,346 | |||||||||||||
| SELL | GBP | Deutsche Bank AG | 105,801 | 7/12/10 | 161,422 | 158,075 | 3,347 | |||||||||||||
| BUY | JPY | Barclays Bank PLC | 5,987,000 | 7/12/10 | 67,576 | 67,725 | 149 | |||||||||||||
| $ | 9,464 | |||||||||||||||||||
| Liability Derivatives | ||||||||||||||||||||
| BUY | CNY | Barclays Bank PLC | 384,000 | 10/18/10 | $ | 57,331 | $ | 56,736 | $ | (595 | ) | |||||||||
| BUY | CNY | JPMorgan Chase Bank N.A. | 765,000 | 10/18/10 | 113,992 | 113,028 | (964 | ) | ||||||||||||
| BUY | EUR | Barclays Bank PLC | 50,000 | 7/12/10 | 61,453 | 61,146 | (307 | ) | ||||||||||||
| SELL | EUR | UBS AG | 946,204 | 9/15/10 | 1,140,005 | 1,157,530 | (17,525 | ) | ||||||||||||
| SELL | GBP | Barclays Bank PLC | 13,896 | 7/12/10 | 20,242 | 20,761 | (519 | ) | ||||||||||||
| SELL | JPY | JPMorgan Chase Bank N.A. | 26,760,517 | 7/12/10 | 286,905 | 302,717 | (15,812 | ) | ||||||||||||
| SELL | JPY | UBS AG | 6,343,419 | 9/14/10 | 69,544 | 71,833 | (2,289 | ) | ||||||||||||
| BUY | SEK | Credit Suisse Group | 36,840 | 7/12/10 | 5,100 | 4,725 | (375 | ) | ||||||||||||
| $ | (38,386 | ) | ||||||||||||||||||
Futures Contracts Outstanding at 6/30/10
| Description | Currency | Contracts | Value | Expiration Date | Unrealized Appreciation | |||||
| Asset Derivatives | ||||||||||
| Interest Rate Futures | ||||||||||
| U.S. Treasury Note 5 yr (Long) | USD | 13 | $1,538,570 | September-2010 | $21,753 | |||||
14
Table of Contents
MFS Strategic Income Series
Portfolio of Investments (unaudited) – continued
Swap Agreements at 6/30/10
| Expiration | Notional | Counterparty | Cash Flows to Receive | Cash Flows to Pay | Fair Value | |||||||
| Asset Derivatives | ||||||||||||
| Credit Default Swaps | ||||||||||||
| 9/20/10 | USD | 120,000 | Merrill Lynch International | (1) | 0.68% (fixed rate) | $355 | ||||||
| 9/20/14 | USD | 160,000 | Goldman Sachs International (a) | 1.00% (fixed rate) | (2) | 2,485 | ||||||
| $2,840 | ||||||||||||
| (1) | Fund, as protection buyer, to receive notional amount upon a defined credit event by Lennar Corp., 5.95%, 3/01/13. |
| (2) | Fund, as protection seller, to pay notional amount upon a defined credit event by Cargill, Inc., 7.375%, 10/01/25, an A2 rated bond. The fund entered into the contract to gain issuer exposure. |
| (a) | Net unamortized premiums received by the fund amounted to $310. |
| The credit ratings presented here are an indicator of the current payment/performance risk of the related swap, the reference obligation for which may be either a single security or, in the case of a credit default index, a basket of securities issued by corporate or sovereign issuers. Each reference security, including each individual security within a reference basket of securities, is assigned a rating from Moody’s Investor Service. If not rated by Moody’s, the rating will be that assigned by Standard & Poor’s. Likewise, if not assigned by Standard & Poor’s, it will be based on the rating assigned by Fitch, Inc. The ratings for a credit default index are calculated by MFS as a weighted average of the external credit ratings of the individual securities that compose the index’s reference basket of securities. |
| At June 30, 2010, the fund had sufficient cash and/or other liquid securities to cover any commitments under these derivative contracts. |
See Notes to Financial Statements
15
Table of Contents
MFS Strategic Income Series
FINANCIAL STATEMENTS | STATEMENT OF ASSETS AND LIABILITIES (unaudited)
This statement represents your fund’s balance sheet, which details the assets and liabilities comprising the total value of the fund.
At 6/30/10 | |||||
Assets | |||||
Investments – | |||||
Non-affiliated issuers, at value (identified cost, $31,588,215) | $31,657,717 | ||||
Underlying funds, at cost and value | 1,510,581 | ||||
Total investments, at value (identified cost, $33,098,796) | $33,168,298 | ||||
Cash | 17,244 | ||||
Receivables for | |||||
Forward foreign currency exchange contracts | 9,464 | ||||
Investments sold | 361,223 | ||||
Fund shares sold | 4,363 | ||||
Interest | 509,145 | ||||
Swaps, at value (net unamortized premiums received, $310) | 2,840 | ||||
Receivable from investment adviser | 11,938 | ||||
Other assets | 318 | ||||
Total assets | $34,084,833 | ||||
Liabilities | |||||
Payables for | |||||
Forward foreign currency exchange contracts | $38,386 | ||||
Daily variation margin on open futures contracts | 1,016 | ||||
Investments purchased | 165,839 | ||||
Fund shares reacquired | 43,229 | ||||
Payable to affiliates | |||||
Investment adviser | 1,297 | ||||
Shareholder servicing costs | 70 | ||||
Distribution and/or service fees | 93 | ||||
Administrative services fee | 96 | ||||
Payable for independent Trustees’ compensation | 215 | ||||
Accrued expenses and other liabilities | 54,640 | ||||
Total liabilities | $304,881 | ||||
Net assets | $33,779,952 | ||||
Net assets consist of | |||||
Paid-in capital | $35,083,557 | ||||
Unrealized appreciation (depreciation) on investments and translation of assets and liabilities in foreign currencies | 60,389 | ||||
Accumulated net realized gain (loss) on investments and foreign currency transactions | (1,851,118 | ) | |||
Undistributed net investment income | 487,124 | ||||
Net assets | $33,779,952 | ||||
Shares of beneficial interest outstanding | 3,539,231 |
| Net assets | Shares outstanding | Net asset value per share | ||||
Initial Class | $26,992,581 | 2,819,511 | $9.57 | |||
Service Class | 6,787,371 | 719,720 | 9.43 |
See Notes to Financial Statements
16
Table of Contents
MFS Strategic Income Series
FINANCIAL STATEMENTS | STATEMENT OF OPERATIONS (unaudited)
This statement describes how much your fund earned in investment income and accrued in expenses. It also describes any gains and/or losses generated by fund operations.
| Six months ended 6/30/10 | ||||||
Net investment income | ||||||
Income | ||||||
Interest | $1,046,309 | |||||
Dividends | 1,046 | |||||
Dividends from underlying funds | 812 | |||||
Total investment income | $1,048,167 | |||||
Expenses | ||||||
Management fee | $117,803 | |||||
Distribution and/or service fees | 8,385 | |||||
Shareholder servicing costs | 2,238 | |||||
Administrative services fee | 8,679 | |||||
Independent Trustees’ compensation | 796 | |||||
Custodian fee | 17,031 | |||||
Shareholder communications | 11,111 | |||||
Auditing fees | 30,693 | |||||
Legal fees | 572 | |||||
Miscellaneous | 5,549 | |||||
Total expenses | $202,857 | |||||
Fees paid indirectly | (27 | ) | ||||
Reduction of expenses by investment adviser | (53,979 | ) | ||||
Net expenses | $148,851 | |||||
Net investment income | $899,316 | |||||
Realized and unrealized gain (loss) on investments and foreign currency transactions | ||||||
Realized gain (loss) (identified cost basis) | ||||||
Investment transactions | $163,930 | |||||
Futures contracts | 283 | |||||
Swap transactions | 433 | |||||
Foreign currency transactions | 323,740 | |||||
Net realized gain (loss) on investments and foreign currency transactions | $488,386 | |||||
Change in unrealized appreciation (depreciation) | ||||||
Investments | $(67,781 | ) | ||||
Futures contracts | 55,321 | |||||
Swap transactions | (740 | ) | ||||
Translation of assets and liabilities in foreign currencies | (69,559 | ) | ||||
Net unrealized gain (loss) on investments and foreign currency translation | $(82,759 | ) | ||||
Net realized and unrealized gain (loss) on investments and foreign currency | $405,627 | |||||
Change in net assets from operations | $1,304,943 |
See Notes to Financial Statements
17
Table of Contents
MFS Strategic Income Series
FINANCIAL STATEMENTS | STATEMENTS OF CHANGES IN NET ASSETS
These statements describe the increases and/or decreases in net assets resulting from operations, any distributions, and any shareholder transactions.
| Six months ended 6/30/10 (unaudited |
) | Year ended 12/31/09 | | |||
Change in net assets | ||||||
From operations | ||||||
Net investment income | $899,316 | $1,658,870 | ||||
Net realized gain (loss) on investments and foreign currency transactions | 488,386 | (677,492 | ) | |||
Net unrealized gain (loss) on investments and foreign currency translation | (82,759 | ) | 5,387,843 | |||
Change in net assets from operations | $1,304,943 | $6,369,221 | ||||
Distributions declared to shareholders | ||||||
From net investment income | $(1,656,044 | ) | $(2,840,435 | ) | ||
Change in net assets from fund share transactions | $(269,973 | ) | $4,707,311 | |||
Total change in net assets | $(621,074 | ) | $8,236,097 | |||
Net assets | ||||||
At beginning of period | 34,401,026 | 26,164,929 | ||||
At end of period (including undistributed net investment income of $487,124 and $1,243,852, respectively) | $33,779,952 | $34,401,026 |
See Notes to Financial Statements
18
Table of Contents
MFS Strategic Income Series
FINANCIAL STATEMENTS | FINANCIAL HIGHLIGHTS
The financial highlights table is intended to help you understand the fund’s financial performance for the semiannual period and the past 5 fiscal years. Certain information reflects financial results for a single fund share. The total returns in the table represent the rate by which an investor would have earned (or lost) on an investment in the fund share class (assuming reinvestment of all distributions) held for the entire period.
| Initial Class | Six months ended 6/30/10 | Years ended 12/31 | ||||||||||||||||
| 2009 | 2008 | 2007 | 2006 | 2005 | ||||||||||||||
| (unaudited) | ||||||||||||||||||
Net asset value, beginning of period | $9.68 | $8.72 | $10.55 | $10.67 | $10.64 | $11.25 | ||||||||||||
| Income (loss) from investment operations | ||||||||||||||||||
Net investment income (d) | $0.26 | $0.51 | $0.56 | $0.59 | $0.57 | $0.56 | ||||||||||||
Net realized and unrealized gain (loss) on investments and foreign currency | 0.12 | 1.41 | (1.76 | ) | (0.20 | ) | 0.11 | (0.37 | ) | |||||||||
Total from investment operations | $0.38 | $1.92 | $(1.20 | ) | $0.39 | $0.68 | $0.19 | |||||||||||
| Less distributions declared to shareholders | ||||||||||||||||||
From net investment income | $(0.49 | ) | $(0.96 | ) | $(0.63 | ) | $(0.51 | ) | $(0.57 | ) | $(0.76 | ) | ||||||
From net realized gain on investments | — | — | — | — | (0.08 | ) | (0.04 | ) | ||||||||||
Total distributions declared to shareholders | $(0.49 | ) | $(0.96 | ) | $(0.63 | ) | $(0.51 | ) | $(0.65 | ) | $(0.80 | ) | ||||||
Net asset value, end of period | $9.57 | $9.68 | $8.72 | $10.55 | $10.67 | $10.64 | ||||||||||||
Total return (%) (k)(r)(s) | 3.92 | (n) | 24.25 | (12.12 | ) | 3.79 | 6.67 | 1.89 | ||||||||||
| Ratios (%) (to average net assets) and Supplemental data: | ||||||||||||||||||
Expenses before expense reductions (f) | 1.16 | (a) | 1.18 | 1.21 | 1.16 | 1.36 | 1.25 | |||||||||||
Expenses after expense reductions (f) | 0.83 | (a) | 0.85 | 0.85 | 0.85 | 0.88 | 0.90 | |||||||||||
Net investment income | 5.39 | (a) | 5.63 | 5.66 | 5.63 | 5.43 | 5.24 | |||||||||||
Portfolio turnover | 23 | 52 | 41 | 49 | 66 | 64 | ||||||||||||
Net assets at end of period (000 omitted) | $26,993 | $27,652 | $20,331 | $32,507 | $30,008 | $32,323 | ||||||||||||
See Notes to Financial Statements
19
Table of Contents
MFS Strategic Income Series
Financial Highlights – continued
| Service Class | Six months ended 6/30/10 | Years ended 12/31 | ||||||||||||||||
| 2009 | 2008 | 2007 | 2006 | 2005 | ||||||||||||||
| (unaudited) | ||||||||||||||||||
Net asset value, beginning of period | $9.53 | $8.60 | $10.40 | $10.54 | $10.52 | $11.13 | ||||||||||||
| Income (loss) from investment operations | ||||||||||||||||||
Net investment income (d) | $0.24 | $0.48 | $0.53 | $0.56 | $0.53 | $0.53 | ||||||||||||
Net realized and unrealized gain (loss) on investments | 0.13 | 1.39 | (1.73 | ) | (0.21 | ) | 0.11 | (0.37 | ) | |||||||||
Total from investment operations | $0.37 | $1.87 | $(1.20 | ) | $0.35 | $0.64 | $0.16 | |||||||||||
| Less distributions declared to shareholders | ||||||||||||||||||
From net investment income | $(0.47 | ) | $(0.94 | ) | $(0.60 | ) | $(0.49 | ) | $(0.54 | ) | $(0.73 | ) | ||||||
From net realized gain on investments | — | — | — | — | (0.08 | ) | (0.04 | ) | ||||||||||
Total distributions declared to shareholders | $(0.47 | ) | $(0.94 | ) | $(0.60 | ) | $(0.49 | ) | $(0.62 | ) | $(0.77 | ) | ||||||
Net asset value, end of period | $9.43 | $9.53 | $8.60 | $10.40 | $10.54 | $10.52 | ||||||||||||
Total return (%) (k)(r)(s) | 3.84 | (n) | 23.88 | (12.26 | ) | 3.42 | 6.39 | 1.62 | ||||||||||
| Ratios (%) (to average net assets) and Supplemental data: | ||||||||||||||||||
Expenses before expense reductions (f) | 1.41 | (a) | 1.43 | 1.47 | 1.41 | 1.62 | 1.50 | |||||||||||
Expenses after expense reductions (f) | 1.08 | (a) | 1.10 | 1.10 | 1.10 | 1.13 | 1.15 | |||||||||||
Net investment income | 5.14 | (a) | 5.40 | 5.46 | 5.39 | 5.18 | 4.99 | |||||||||||
Portfolio turnover | 23 | 52 | 41 | 49 | 66 | 64 | ||||||||||||
Net assets at end of period (000 omitted) | $6,787 | $6,749 | $5,834 | $8,192 | $6,684 | $6,191 | ||||||||||||
| (a) | Annualized. |
| (d) | Per share data is based on average shares outstanding. |
| (f) | Ratios do not reflect reductions from fees paid indirectly, if applicable. |
| (k) | The total return does not reflect expenses that apply to separate accounts. Inclusion of these charges would reduce the total return figures for all periods shown. |
| (n) | Not annualized. |
| (r) | Certain expenses have been reduced without which performance would have been lower. |
| (s) | From time to time the fund may receive proceeds from litigation settlements, without which performance would be lower. |
See Notes to Financial Statements
20
Table of Contents
MFS Strategic Income Series
NOTES TO FINANCIAL STATEMENTS (unaudited)
| (1) | Business and Organization |
MFS Strategic Income Series (the fund) is a series of MFS Variable Insurance Trust (the trust). The trust is organized as a Massachusetts business trust and is registered under the Investment Company Act of 1940, as amended, as an open-end management investment company. The shareholders of each series of the trust are separate accounts of insurance companies, which offer variable annuity and/or life insurance products, and qualified retirement and pension plans.
| (2) | Significant Accounting Policies |
General – The preparation of financial statements in conformity with U.S. generally accepted accounting principles requires management to make estimates and assumptions that affect the reported amounts of assets and liabilities, and disclosure of contingent assets and liabilities at the date of the financial statements and the reported amounts of revenues and expenses during the reporting period. Actual results could differ from those estimates. In the preparation of these financial statements, management has evaluated subsequent events occurring after the date of the fund’s Statement of Assets and Liabilities through the date that the financial statements were issued. The fund can invest in foreign securities, including securities of emerging market issuers. Investments in foreign securities are vulnerable to the effects of changes in the relative values of the local currency and the U.S. dollar and to the effects of changes in each country’s legal, political, and economic environment. The markets of emerging markets countries are generally more volatile than the markets of developed countries with more mature economies. All of the risks of investing in foreign securities previously described are heightened when investing in emerging markets countries.
Investment Valuations – Debt instruments and floating rate loans (other than short-term instruments), including restricted debt instruments, are generally valued at an evaluated or composite bid as provided by a third-party pricing service. Equity securities, including restricted equity securities, are generally valued at the last sale or official closing price as provided by a third-party pricing service on the market or exchange on which they are primarily traded. Equity securities, for which there were no sales reported that day, are generally valued at the last quoted daily bid quotation as provided by a third-party pricing service on the market or exchange on which such securities are primarily traded. Equity securities held short, for which there were no sales reported for that day, are generally valued at the last quoted daily ask quotation as provided by a third-party pricing service on the market or exchange on which such securities are primarily traded. Short-term instruments with a maturity at issuance of 60 days or less generally are valued at amortized cost, which approximates market value. Futures contracts are generally valued at last posted settlement price as provided by a third-party pricing service on the market on which they are primarily traded. Futures contracts for which there were no trades that day for a particular position are generally valued at the closing bid quotation as provided by a third-party pricing service on the market on which such futures contracts are primarily traded. Forward foreign currency contracts are generally valued at the mean of bid and asked prices for the time period interpolated from rates provided by a third-party pricing service for proximate time periods. Swaps are generally valued at valuations provided by a third-party pricing service. Open-end investment companies are generally valued at net asset value per share. Securities and other assets generally valued on the basis of information from a third-party pricing service may also be valued at a broker/dealer bid quotation. Values obtained from third-party pricing services can utilize both transaction data and market information such as yield, quality, coupon rate, maturity, type of issue, trading characteristics, and other market data. The values of foreign securities and other assets and liabilities expressed in foreign currencies are converted to U.S. dollars using the mean of bid and asked prices for rates provided by a third-party pricing service.
The Board of Trustees has delegated primary responsibility for determining or causing to be determined the value of the fund’s investments (including any fair valuation) to the adviser pursuant to valuation policies and procedures approved by the Board. If the adviser determines that reliable market quotations are not readily available, investments are valued at fair value as determined in good faith by the adviser in accordance with such procedures under the oversight of the Board of Trustees. Under the fund’s valuation policies and procedures, market quotations are not considered to be readily available for most types of debt instruments and floating rate loans and many types of derivatives. These investments are generally valued at fair value based on information from third-party pricing services. In addition, investments may be valued at fair value if the adviser determines that an investment’s value has been materially affected by events occurring after the close of the exchange or market on which the investment is principally traded (such as foreign exchange or market) and prior to the determination of the fund’s net asset value, or after the halting of trading of a specific security where trading does not resume prior to the close of the exchange or market on which the security is principally traded. The adviser generally relies on third-party pricing services or other information (such as the correlation with price movements of similar securities in the same or other markets; the type, cost and investment characteristics of the security; the business and financial condition of the issuer; and trading and other market data) to assist in determining whether to fair value and at what value to fair value an investment. The value of an investment for purposes of calculating the fund’s net asset value can differ depending on the source and method used to determine value. When fair valuation is used, the value of an investment used to determine the fund’s net asset value may
21
Table of Contents
MFS Strategic Income Series
Notes to Financial Statements (unaudited) – continued
differ from quoted or published prices for the same investment. There can be no assurance that the fund could obtain the fair value assigned to an investment if it were to sell the investment at the same time at which the fund determines its net asset value per share.
Various inputs are used in determining the value of the fund’s assets or liabilities. These inputs are categorized into three broad levels. In certain cases, the inputs used to measure fair value may fall into different levels of the fair value hierarchy. In such cases, an investment’s level within the fair value hierarchy is based on the lowest level of input that is significant to the fair value measurement. The fund’s assessment of the significance of a particular input to the fair value measurement in its entirety requires judgment, and considers factors specific to the investment. Level 1 includes unadjusted quoted prices in active markets for identical assets or liabilities. Level 2 includes other significant observable market-based inputs (including quoted prices for similar securities, interest rates, prepayment speed, and credit risk). Level 3 includes unobservable inputs, which may include the adviser’s own assumptions in determining the fair value of investments. Other financial instruments are derivative instruments not reflected in total investments, such as futures, forwards, swap contracts, and written options. The following is a summary of the levels used as of June 30, 2010 in valuing the fund’s assets or liabilities:
| Investments at Value | Level 1 | Level 2 | Level 3 | Total | ||||||
| Equity Securities | $60,177 | $54,835 | $45,347 | $160,359 | ||||||
| U.S. Treasury Bonds & U.S. Government Agency & Equivalents | — | 863,934 | — | 863,934 | ||||||
| Non-U.S. Sovereign Debt | — | 6,015,645 | — | 6,015,645 | ||||||
| Corporate Bonds | — | 17,574,104 | — | 17,574,104 | ||||||
| Residential Mortgage-Backed Securities | — | 634,534 | — | 634,534 | ||||||
| Commercial Mortgage-Backed Securities | — | 899,867 | — | 899,867 | ||||||
| Asset-Backed Securities (including CDOs) | — | 326,989 | — | 326,989 | ||||||
| Foreign Bonds | — | 4,913,390 | — | 4,913,390 | ||||||
| Floating Rate Loans | — | 256,288 | 12,607 | 268,895 | ||||||
| Mutual Funds | 1,510,581 | — | — | 1,510,581 | ||||||
| Total Investments | $1,570,758 | $31,539,586 | $57,954 | $33,168,298 | ||||||
| Other Financial Instruments | ||||||||||
| Futures | $21,753 | $— | $— | $21,753 | ||||||
| Swaps | — | 2,840 | — | 2,840 | ||||||
| Forward Currency Contracts | — | (28,922 | ) | — | (28,922 | ) | ||||
For further information regarding security characteristics, see the Portfolio of Investments.
The following is a reconciliation of Level 3 assets for which significant unobservable inputs were used to determine fair value. The table presents the activity of Level 3 securities held at the beginning and the end of the period.
| Equity Securities | Floating Rate Loans | Total | ||||
| Balance as of 12/31/09 | $1,606 | $— | $1,606 | |||
Accrued discounts/premiums | — | — | — | |||
Realized gain (loss) | — | — | — | |||
Change in unrealized appreciation (depreciation) | 3,868 | 616 | 4,484 | |||
Net purchases (sales) | 39,873 | 11,991 | 51,864 | |||
Transfers in and/or out of Level 3 | — | — | — | |||
| Balance as of 6/30/10 | $45,347 | $12,607 | $57,954 |
The net change in unrealized appreciation (depreciation) from investments still held as Level 3 at June 30, 2010 is $4,484.
Foreign Currency Translation – Purchases and sales of foreign investments, income, and expenses are converted into U.S. dollars based upon currency exchange rates prevailing on the respective dates of such transactions or on the reporting date for foreign denominated receivables and payables. Gains and losses attributable to foreign currency exchange rates on sales of securities are recorded for financial statement purposes as net realized gains and losses on investments. Gains and losses attributable to foreign exchange rate movements on receivables, payables, income and expenses are recorded for financial statement purposes as foreign currency transaction gains and losses. That portion of both realized and unrealized gains and losses on investments that results from fluctuations in foreign currency exchange rates is not separately disclosed.
Derivatives – The fund may use derivatives for different purposes, including to earn income and enhance returns, to increase or decrease exposure to a particular market, to manage or adjust the risk profile of the fund, or as alternatives to direct investments. Derivatives may be used for hedging or non-hedging purposes. While hedging can reduce or eliminate losses, it can also reduce or eliminate gains. When the fund uses derivatives as an investment to increase market exposure, or for hedging purposes, gains and losses from derivative instruments may be substantially greater than the derivative’s original cost.
22
Table of Contents
MFS Strategic Income Series
Notes to Financial Statements (unaudited) – continued
Derivative instruments include written options, purchased options, futures contracts, forward foreign currency exchange contracts, and swap agreements. The fund’s period end derivatives, as presented in the Portfolio of Investments and the associated Derivative Contract Tables, generally are indicative of the volume of its derivative activity during the period.
The following table presents, by major type of derivative contract, the fair value, on a gross basis, of the asset and liability components of derivatives held by the fund at June 30, 2010 as reported in the Statement of Assets and Liabilities:
| Fair Value (a) | |||||||
| Risk | Derivative | Asset Derivatives | Liability Derivatives | ||||
| Interest Rate Contracts | Interest Rate Futures | $21,753 | $— | ||||
| Foreign Exchange Contracts | Forward Foreign Currency Exchange Contracts | 9,464 | (38,386 | ) | |||
| Credit Contracts | Credit Default Swaps | 2,840 | — | ||||
| Total | $34,057 | $(38,386 | ) | ||||
| (a) | The value of futures contracts outstanding includes cumulative appreciation/depreciation as reported in the fund’s Portfolio of Investments. Only the current day variation margin for futures contracts is separately reported within the fund’s Statement of Assets and Liabilities. |
The following table presents, by major type of derivative contract, the realized gain (loss) on derivatives held by the fund for the six months ended June 30, 2010 as reported in the Statement of Operations:
| Futures Contracts | Swap Transactions | Foreign Currency Transactions | ||||
| Interest Rate Contracts | $283 | $— | $— | |||
| Foreign Exchange Contracts | — | — | 332,373 | |||
| Credit Contracts | — | 433 | — | |||
| Total | $283 | $433 | $332,373 |
The following table presents, by major type of derivative contract, the change in unrealized appreciation (depreciation) on derivatives held by the fund for the six months ended June 30, 2010 as reported in the Statement of Operations:
| Futures Contracts | Swap Transactions | Translation of Assets and Liabilities in Foreign Currencies | ||||||
| Interest Rate Contracts | $55,321 | $— | $— | |||||
| Foreign Exchange Contracts | — | — | (64,395 | ) | ||||
| Credit Contracts | — | (740 | ) | — | ||||
| Total | $55,321 | $(740 | ) | $(64,395 | ) |
Derivative counterparty credit risk is managed through formal evaluation of the creditworthiness of all potential counterparties. On certain over-the-counter derivatives, the fund attempts to reduce its exposure to counterparty credit risk whenever possible by entering into an International Swaps and Derivatives Association (ISDA) Master Agreement on a bilateral basis with each of the counterparties with whom it undertakes a significant volume of transactions. The ISDA Master Agreement gives each party to the agreement the right to terminate all transactions traded under such agreement if there is a certain deterioration in the credit quality of the other party. The ISDA Master Agreement gives the fund the right, upon an event of default by the applicable counterparty or a termination of the agreement, to close out all transactions traded under such agreement and to net amounts owed under each transaction to one net amount payable by one party to the other. This right to close out and net payments across all transactions traded under the ISDA Master Agreement could result in a reduction of the fund’s credit risk to such counterparty equal to any amounts payable by the fund under the applicable transactions, if any. However, absent an event of default by the counterparty or a termination of the agreement, the ISDA Master Agreement does not result in an offset of reported balance sheet assets and liabilities across transactions between the fund and the applicable counterparty.
Collateral requirements differ by type of derivative. Collateral or margin requirements are set by the broker or exchange clearing house for exchange traded derivatives (i.e., futures and exchange-traded options) while collateral terms are contract specific for over-the-counter traded derivatives (i.e., forwards, swaps and over-the-counter options). For derivatives traded under an ISDA Master Agreement, the collateral requirements are netted across all transactions traded under such agreement and one amount is posted from one party to the other to collateralize such obligations. Cash collateral that has been pledged to cover obligations of the fund under derivative contracts will be reported separately on the Statement of Assets and Liabilities as restricted cash. Securities collateral pledged for the same purpose is noted in the Portfolio of Investments.
23
Table of Contents
MFS Strategic Income Series
Notes to Financial Statements (unaudited) – continued
Futures Contracts – The fund may use futures contracts to gain or to hedge against broad market, interest rate or currency exposure. A futures contract represents a commitment for the future purchase or sale of an asset at a specified price on a specified date.
Upon entering into a futures contract, the fund is required to deposit with the broker, either in cash or securities, an initial margin in an amount equal to a certain percentage of the notional amount of the contract. Subsequent payments (variation margin) are made or received by the fund each day, depending on the daily fluctuations in the value of the contract, and are recorded for financial statement purposes as unrealized gain or loss by the fund until the contract is closed or expires at which point the gain or loss on futures is realized.
The fund bears the risk of interest rates, exchange rates or securities prices moving unexpectedly, in which case, the fund may not achieve the anticipated benefits of the futures contracts and may realize a loss. While futures may present less counterparty risk to the fund since the contracts are exchange traded and the exchange’s clearinghouse guarantees payments to the broker, there is still counterparty credit risk due to the insolvency of the broker. The fund’s maximum risk of loss due to counterparty credit risk is equal to the margin posted by the fund to the broker plus any gains or minus any losses on the outstanding futures contracts.
Forward Foreign Currency Exchange Contracts – The fund may enter into forward foreign currency exchange contracts for the purchase or sale of a specific foreign currency at a fixed price on a future date to hedge the fund’s currency risk or for non-hedging purposes. For hedging purposes, the fund may enter into contracts to deliver or receive foreign currency that the fund will receive from or use in its normal investment activities. The fund may also use contracts to hedge against declines in the value of foreign currency denominated securities due to unfavorable exchange rate movements. For non-hedging purposes, the fund may enter into contracts with the intent of changing the relative exposure of the fund’s portfolio of securities to different currencies to take advantage of anticipated exchange rate changes.
Forward foreign currency exchange contracts are adjusted by the daily exchange rate of the underlying currency and any unrealized gains or losses are recorded as a receivable or payable for forward foreign currency exchange contracts until the contract settlement date. On contract settlement date, any gain or loss on the contract is recorded as realized gains or losses on foreign currency transactions.
Risks may arise upon entering into these contracts from unanticipated movements in the value of the contract and from the potential inability of counterparties to meet the terms of their contracts. The fund’s maximum risk due to counterparty credit risk is the notional amount of the contract. This risk is mitigated in cases where there is an ISDA Master Agreement between the fund and the counterparty providing for netting as described above and for posting of collateral by the counterparty to the fund to cover the fund’s exposure to the counterparty under such ISDA Master Agreement.
Swap Agreements – The fund may enter into swap agreements. A swap is generally an exchange of cash payments, at specified intervals or upon the occurrence of specified events, between the fund and a counterparty. The net cash payments exchanged are recorded as a realized gain or loss on swap transactions in the Statement of Operations. The value of the swap, which is adjusted daily and includes any related interest accruals to be paid or received by the fund, is recorded on the Statement of Assets and Liabilities. The daily change in value, including any related interest accruals to be paid or received, is recorded as unrealized appreciation or depreciation on swap transactions in the Statement of Operations. Amounts paid or received at the inception of the swap are reflected as premiums paid or received on the Statement of Assets and Liabilities and are amortized using the effective interest method over the term of the agreement. A liquidation payment received or made upon early termination is recorded as a realized gain or loss on swap transactions in the Statement of Operations.
Risks related to swap agreements include the possible lack of a liquid market, unfavorable market and interest rate movements of the underlying instrument and the failure of the counterparty to perform under the terms of the agreements. To address counterparty risk, swap transactions are limited to only highly-rated counterparties. The risk is further mitigated by having an ISDA Master Agreement between the fund and the counterparty providing for netting as described above and by the posting of collateral by the counterparty to the fund to cover the fund’s exposure to the counterparty under such ISDA Master Agreement.
The fund may enter into credit default swaps to manage its exposure to the market or certain sectors of the market, to reduce its credit risk exposure to defaults of corporate and sovereign issuers or to create exposure to corporate or sovereign issuers to which it is not otherwise exposed. In a credit default swap, the protection buyer can make an upfront payment and will make a stream of payments based on a fixed percentage applied to the contract notional amount to the protection seller in exchange for the right to receive a specified return upon the occurrence of a defined credit event on the reference obligation (which may be either a single security or a basket of securities issued by corporate or sovereign issuers) and, with respect to the rare cases where physical settlement applies, the delivery by the buyer to the seller of a defined deliverable obligation. Although contract-specific, credit events generally consist of a combination of the following: bankruptcy, failure to pay, restructuring, obligation
24
Table of Contents
MFS Strategic Income Series
Notes to Financial Statements (unaudited) – continued
acceleration, obligation default, or repudiation/moratorium, each as defined in the 2003 ISDA Credit Derivatives Definitions as amended by the relevant contract. Restructuring is generally not applicable when the reference obligation is issued by a North American corporation and obligation acceleration, obligation default, or repudiation/moratorium are generally only applicable when the reference obligation is issued by a sovereign entity or an entity in an emerging country. Upon determination of the final price for the deliverable obligation (or upon delivery of the deliverable obligation in the case of physical settlement), the difference between the value of the deliverable obligation and the swap’s notional amount is recorded as realized gain or loss on swap transactions in the Statement of Operations.
Credit default swaps are considered to have credit-risk-related contingent features since they trigger payment by the protection seller to the protection buyer upon the occurrence of a defined credit event. The aggregate fair value of credit default swaps in a net liability position, if any, as of June 30, 2010 is disclosed in the footnotes to the Portfolio of Investments. As discussed earlier in this note, any collateral requirements for these swaps are based generally on the market value of the swap netted against collateral requirements for other types of over-the-counter derivatives traded under each counterparty’s ISDA Master Agreement. The maximum amount of future, undiscounted payments that the fund, as protection seller, could be required to make is equal to the swap’s notional amount. The protection seller’s payment obligation would be offset to the extent of the value of the contract’s deliverable obligation. At June 30, 2010, the fund did not hold any credit default swaps at an unrealized loss where it is the protection seller.
The fund’s maximum risk of loss from counterparty risk, either as the protection seller or as the protection buyer, is the fair value of the contract. This risk is mitigated by having an ISDA Master Agreement between the fund and the counterparty providing for netting as described above and by the posting of collateral by the counterparty to the fund to cover the fund’s exposure to the counterparty under such ISDA Master Agreement.
Hybrid Instruments – The fund may invest in indexed or hybrid securities on which any combination of interest payments, the principal or stated amount payable at maturity is determined by reference to prices of other securities, currencies, indices, economic factors or other measures, including interest rates, currency exchange rates, or securities indices. The risks of investing in hybrid instruments reflect a combination of the risks of investing in securities, swaps, options, futures and currencies. Hybrid instruments are potentially more volatile and carry greater market risks than traditional debt instruments. Depending on the structure of the particular hybrid instrument, changes in a benchmark, underlying assets or economic indicator may be magnified by the terms of the hybrid instrument and have an even more dramatic and substantial effect upon the value of the hybrid instrument. Also, the prices of the hybrid instrument and the benchmark, underlying asset or economic indicator may not move in the same direction or at the same time.
Loans and Other Direct Debt Instruments – The fund may invest in loans and loan participations or other receivables. These investments may include standby financing commitments, including revolving credit facilities, which obligate the fund to supply additional cash to the borrower on demand. Loan participations involve a risk of insolvency of the lending bank or other financial intermediary.
Indemnifications – Under the fund’s organizational documents, its officers and Trustees may be indemnified against certain liabilities and expenses arising out of the performance of their duties to the fund. Additionally, in the normal course of business, the fund enters into agreements with service providers that may contain indemnification clauses. The fund’s maximum exposure under these agreements is unknown as this would involve future claims that may be made against the fund that have not yet occurred.
Investment Transactions and Income – Investment transactions are recorded on the trade date. Interest income is recorded on the accrual basis. All premium and discount is amortized or accreted for financial statement purposes in accordance with U.S. generally accepted accounting principles. The fund earns certain fees in connection with its floating rate loan purchasing activities. These fees are in addition to interest payments earned and may include amendment fees, commitment fees, facility fees, consent fees, and prepayment fees. Commitment fees are recorded on an accrual basis as income in the accompanying financial statements. Dividends received in cash are recorded on the ex-dividend date. Dividend and interest payments received in additional securities are recorded on the ex-dividend or ex-interest date in an amount equal to the value of the security on such date. Debt obligations may be placed on non-accrual status or set to accrue at a rate of interest less than the contractual coupon when the collection of all or a portion of interest has become doubtful. Interest income for those debt obligations may be further reduced by the write-off of the related interest receivables when deemed uncollectible.
The fund may receive proceeds from litigation settlements. Any proceeds received from litigation involving portfolio holdings are reflected in the Statement of Operations in realized gain/loss if the security has been disposed of by the fund or in unrealized gain/loss if the security is still held by the fund. Any other proceeds from litigation not related to portfolio holdings are reflected as other income in the Statement of Operations.
25
Table of Contents
MFS Strategic Income Series
Notes to Financial Statements (unaudited) – continued
Fees Paid Indirectly – The fund’s custody fee may be reduced according to an arrangement that measures the value of cash deposited with the custodian by the fund. This amount, for the six months ended June 30, 2010, is shown as a reduction of total expenses on the Statement of Operations.
Tax Matters and Distributions – The fund intends to qualify as a regulated investment company, as defined under Subchapter M of the Internal Revenue Code, and to distribute all of its taxable income, including realized capital gains. As a result, no provision for federal income tax is required. The fund’s federal tax returns for the prior three fiscal years remain subject to examination by the Internal Revenue Service. Foreign taxes, if any, have been accrued by the fund in the accompanying financial statements.
Distributions to shareholders are recorded on the ex-dividend date. Income and capital gain distributions are determined in accordance with income tax regulations, which may differ from U.S. generally accepted accounting principles. Certain capital accounts in the financial statements are periodically adjusted for permanent differences in order to reflect their tax character. These adjustments have no impact on net assets or net asset value per share. Temporary differences which arise from recognizing certain items of income, expense, gain or loss in different periods for financial statement and tax purposes will reverse at some time in the future. Distributions in excess of net investment income or net realized gains are temporary overdistributions for financial statement purposes resulting from differences in the recognition or classification of income or distributions for financial statement and tax purposes.
Book/tax differences primarily relate to amortization and accretion of debt securities, defaulted bonds, straddle loss deferrals, foreign currency transactions, and derivative transactions.
The tax character of distributions made during the current period, if any, will be determined at fiscal year end. The tax character of distributions declared to shareholders for the last fiscal year is as follows:
| 12/31/09 | ||
| Ordinary income (including any short-term capital gains) | $2,840,435 |
The federal tax cost and the tax basis components of distributable earnings were as follows:
| As of 6/30/10 | |||
| Cost of investments | $33,262,428 | ||
| Gross appreciation | 1,642,922 | ||
| Gross depreciation | (1,737,052 | ) | |
| Net unrealized appreciation (depreciation) | $(94,130 | ) | |
| As of 12/31/09 | |||
| Undistributed ordinary income | 1,654,968 | ||
| Capital loss carryforwards | (2,153,011 | ) | |
| Other temporary differences | (404,964 | ) | |
| Net unrealized appreciation (depreciation) | (49,497 | ) | |
The aggregate cost above includes prior fiscal year end tax adjustments, if applicable.
As of December 31, 2009, the fund had capital loss carryforwards available to offset future realized gains. Such losses expire as follows:
| 12/31/14 | $(198,631 | ) | |
| 12/31/15 | (3,859 | ) | |
| 12/31/16 | (1,000,271 | ) | |
| 12/31/17 | (950,250 | ) | |
| $(2,153,011 | ) |
Multiple Classes of Shares of Beneficial Interest – The fund offers multiple classes of shares, which differ in their respective distribution and/or service fees. The fund’s income, realized and unrealized gain (loss), and common expenses are allocated to shareholders based on the daily net assets of each class. Dividends are declared separately for each class. Differences in per share dividend rates are generally due to differences in separate class expenses. The fund’s distributions declared to shareholders as reported on the Statements of Changes in Net Assets are presented by class as follows:
| From net investment income | ||||
| Six months ended 6/30/10 | Year ended 12/31/09 | |||
| Initial Class | $1,336,828 | $2,204,105 | ||
| Service Class | 319,216 | 636,330 | ||
| Total | $1,656,044 | $2,840,435 | ||
26
Table of Contents
MFS Strategic Income Series
Notes to Financial Statements (unaudited) – continued
| (3) | Transactions with Affiliates |
Investment Adviser – The fund has an investment advisory agreement with MFS to provide overall investment management and related administrative services and facilities to the fund. The management fee is computed daily and paid monthly at the following annual rates:
| First $1 billion of average daily net assets | 0.70% | |
| Average daily net assets in excess of $1 billion | 0.65% |
The management fee incurred for the six months ended June 30, 2010 was equivalent to an annual effective rate of 0.70% of the fund’s average daily net assets.
Prior to May 1, 2010, the investment adviser had agreed in writing to pay a portion of the fund’s operating expenses, exclusive of management fee, distribution and/or service fees, interest, taxes, extraordinary expenses, brokerage and transaction costs and investment-related expenses, such that operating expenses did not exceed 0.15% of the fund’s average daily net assets. This written agreement terminated on April 30, 2010. For the period January 1, 2010 through April 30, 2010, this reduction amounted to $33,165 and is reflected as a reduction of total expenses in the Statements of Operations.
Effective May 1, 2010 the investment adviser has agreed in writing to pay a portion of the fund’s total annual operating expenses, exclusive of interest, taxes, extraordinary expenses, brokerage and transaction costs and investment-related expenses, such that total annual operating expenses do not exceed 0.80% of average daily net assets for the Initial Class shares and 1.05% of average daily net assets for the Service Class shares. This written agreement will continue until modified by the fund’s Board of Trustees, but such agreement will continue at least until April 30, 2012. For the period May 1, 2010 through June 30, 2010, this reduction amounted to $20,703 and is reflected as a reduction of total expenses in the Statements of Operations.
Distributor – MFS Fund Distributors, Inc. (MFD), a wholly-owned subsidiary of MFS, is the distributor of shares of the fund. The Trustees have adopted a distribution plan for the Service Class shares pursuant to Rule 12b-1 under the Investment Company Act of 1940.
The fund’s distribution plan provides that the fund will pay MFD distribution and/or service fees equal to 0.25% per annum of its average daily net assets attributable to Service Class shares as partial consideration for services performed and expenses incurred by MFD and financial intermediaries (including participating insurance companies that invest in the fund to fund variable annuity and variable life insurance contracts, sponsors of qualified retirement and pension plans that invest in the fund, and affiliates of these participating insurance companies and plan sponsors) in connection with the sale and distribution of the Service Class shares. MFD may subsequently pay all, or a portion, of the distribution and/or service fees to financial intermediaries.
Shareholder Servicing Agent – MFS Service Center, Inc. (MFSC), a wholly-owned subsidiary of MFS, receives a fee from the fund for its services as shareholder servicing agent. For the six months ended June 30, 2010, the fee was $2,012, which equated to 0.0120% annually of the fund’s average daily net assets. MFSC also receives payment from the fund for out-of-pocket expenses paid by MFSC on behalf of the fund. For the six months ended June 30, 2010, these costs amounted to $226.
Administrator – MFS provides certain financial, legal, shareholder communications, compliance, and other administrative services to the fund. Under an administrative services agreement, the fund partially reimburses MFS the costs incurred to provide these services. The fund is charged an annual fixed amount of $17,500 plus a fee based on average daily net assets. The administrative services fee incurred for the six months ended June 30, 2010 was equivalent to an annual effective rate of 0.0516% of the fund’s average daily net assets.
Trustees’ and Officers’ Compensation – The fund pays compensation to independent Trustees in the form of a retainer, attendance fees, and additional compensation to Board and Committee chairpersons. The fund does not pay compensation directly to Trustees or officers of the fund who are also officers of the investment adviser, all of whom receive remuneration for their services to the fund from MFS. Certain officers and Trustees of the fund are officers or directors of MFS, MFD, and MFSC.
Other – This fund and certain other funds managed by MFS (the funds) have entered into services agreements (the Agreements) which provide for payment of fees by the funds to Tarantino LLC and Griffin Compliance LLC in return for the provision of services of an Independent Chief Compliance Officer (ICCO) and Assistant ICCO, respectively, for the funds. The ICCO and Assistant ICCO are officers of the funds and the sole members of Tarantino LLC and Griffin Compliance LLC, respectively. The funds can terminate the Agreements with Tarantino LLC and Griffin Compliance LLC at any time under the terms of the Agreements. For the six months ended June 30, 2010, the aggregate fees paid by the fund to Tarantino LLC and Griffin Compliance LLC were $138 and are included in miscellaneous expense on the Statement of Operations. MFS has agreed to reimburse the fund for a portion of the payments made by the fund in the amount of $111, which is shown as a reduction of total expenses in the Statement of Operations. Additionally, MFS has agreed to bear all expenses associated with office space, other administrative support, and supplies provided to the ICCO and Assistant ICCO.
27
Table of Contents
MFS Strategic Income Series
Notes to Financial Statements (unaudited) – continued
The fund may invest in the MFS Institutional Money Market Portfolio which is managed by MFS and seeks a high level of current income consistent with preservation of capital and liquidity. Income earned on this investment is included in dividends from underlying funds on the Statement of Operations. This money market fund does not pay a management fee to MFS.
| (4) | Portfolio Securities |
Purchases and sales of investments, other than purchased option transactions, and short-term obligations, were as follows:
| Purchases | Sales | |||
| U.S. Government securities | $95,733 | $89,079 | ||
| Investments (non-U.S. Government securities) | $7,450,012 | $7,637,032 |
| (5) | Shares of Beneficial Interest |
The fund’s Declaration of Trust permits the Trustees to issue an unlimited number of full and fractional shares of beneficial interest. Transactions in fund shares were as follows:
| Six months ended 6/30/10 | Year ended 12/31/09 | |||||||||||
| Shares | Amount | Shares | Amount | |||||||||
| Shares sold | ||||||||||||
Initial Class | 194,759 | $1,905,393 | 929,062 | $8,390,344 | ||||||||
Service Class | 184,287 | 1,759,583 | 240,607 | 2,104,494 | ||||||||
| 379,046 | $3,664,976 | 1,169,669 | $10,494,838 | |||||||||
| Shares issued to shareholders in reinvestment of distributions | ||||||||||||
Initial Class | 139,689 | $1,336,828 | 272,448 | $2,204,105 | ||||||||
Service Class | 33,851 | 319,216 | 79,741 | 636,330 | ||||||||
| 173,540 | $1,656,044 | 352,189 | $2,840,435 | |||||||||
| Shares reacquired | ||||||||||||
Initial Class | (371,150 | ) | $(3,620,573 | ) | (675,769 | ) | $(6,084,617 | ) | ||||
Service Class | (206,348 | ) | (1,970,420 | ) | (290,605 | ) | (2,543,345 | ) | ||||
| (577,498 | ) | $(5,590,993 | ) | (966,374 | ) | $(8,627,962 | ) | |||||
| Net change | ||||||||||||
Initial Class | (36,702 | ) | $(378,352 | ) | 525,741 | $4,509,832 | ||||||
Service Class | 11,790 | 108,379 | 29,743 | 197,479 | ||||||||
| (24,912 | ) | $(269,973 | ) | 555,484 | $4,707,311 | |||||||
| (6) | Line of Credit |
The fund and certain other funds managed by MFS participate in a $1.1 billion unsecured committed line of credit, subject to a $1 billion sublimit, provided by a syndication of banks under a credit agreement. Borrowings may be made for temporary financing needs. Interest is charged to each fund, based on its borrowings, generally at a rate equal to the higher of the Federal Reserve funds rate or one month LIBOR plus an agreed upon spread. A commitment fee, based on the average daily, unused portion of the committed line of credit, is allocated among the participating funds at the end of each calendar quarter. In addition, the fund and other funds managed by MFS have established unsecured uncommitted borrowing arrangements with certain banks for temporary financing needs. Interest is charged to each fund, based on its borrowings, at a rate equal to the Federal Reserve funds rate plus an agreed upon spread. For the six months ended June 30, 2010, the fund’s commitment fee and interest expense were $253 and $0, respectively, and are included in miscellaneous expense on the Statement of Operations.
| (7) | Transactions in Underlying Funds–Affiliated Issuers |
An affiliated issuer may be considered one in which the fund owns 5% or more of the outstanding voting securities, or a company which is under common control. For the purposes of this report, the fund assumes the following to be affiliated issuers:
| Underlying Funds | Beginning Share/Par Amount | Acquisitions Shares/Par Amount | Dispositions Shares/Par Amount | Ending Share/Par Amount | |||||
| MFS Institutional Money Market Portfolio | 1,997,163 | 6,196,324 | (6,682,906 | ) | 1,510,581 | ||||
| Underlying Funds | Realized Gain (Loss) | Capital Gain Distributions | Dividend Income | Ending Value | |||||
| MFS Institutional Money Market Portfolio | $— | $— | $812 | $1,510,581 | |||||
28
Table of Contents
MFS Strategic Income Series
RESULTS OF SHAREHOLDER MEETINGS (unaudited)
At a special meeting of shareholders of MFS Variable Insuranse Trust, which was held on January 28, 2010, the following actions were taken:
Item 1. To elect the following individuals as Trustees:
| Number of Dollars | ||||
| Nominee | For | Withheld Authority | ||
| Robert E. Butler | 6,823,651,821.26 | 1,818,252,669.55 | ||
| Lawrence H. Cohn, M.D. | 6,813,621,200.14 | 1,828,283,290.67 | ||
| Maureen R. Goldfarb | 6,825,332,620.76 | 1,816,571,870.05 | ||
| David H. Gunning | 6,823,081,841.37 | 1,818,822,649.44 | ||
| William R. Gutow | 6,813,678,877.22 | 1,828,225,613.59 | ||
| Michael Hegarty | 6,827,456,515.87 | 1,814,447,974.94 | ||
| John P. Kavanaugh | 6,830,363,113.12 | 1,811,541,377.69 | ||
| Robert J. Manning | 6,825,511,264.17 | 1,816,393,226.64 | ||
| Robert C. Pozen | 6,824,854,120.27 | 1,817,050,370.54 | ||
| J. Dale Sherratt | 6,816,913,203.87 | 1,824,991,286.94 | ||
| Laurie J. Thomsen | 6,823,590,745.56 | 1,818,313,745.25 | ||
| Robert W. Uek | 6,818,161,803.66 | 1,823,742,687.15 | ||
29
Table of Contents
MFS Strategic Income Series
BOARD REVIEW OF INVESTMENT ADVISORY AGREEMENT
A discussion regarding the Board’s most recent review and renewal of the fund’s Investment Advisory Agreement with MFS will be available on or about November 1, 2010 by clicking on the fund’s name under “Variable Insurance Portfolios — VIT” in the ‘‘Products and Performance’’ section of the MFS Web site (mfs.com).
PROXY VOTING POLICIES AND INFORMATION
A general description of the MFS funds’ proxy voting policies and procedures is available without charge, upon request, by calling
1-800-225-2606, by visiting the Proxy Voting section of mfs.com or by visiting the SEC’s Web site at http://www.sec.gov.
Information regarding how the fund voted proxies relating to portfolio securities during the most recent twelve-month period ended June 30 is available without charge by visiting the Proxy Voting section of mfs.com or by visiting the SEC’s Web site at http://www.sec.gov.
QUARTERLY PORTFOLIO DISCLOSURE
The fund will file a complete schedule of portfolio holdings with the Securities and Exchange Commission (the Commission) for the first and third quarters of each fiscal year on Form N-Q. The fund’s Form N-Q may be reviewed and copied at the:
Public Reference Room
Securities and Exchange Commission
100 F Street, NE, Room 1580
Washington, D.C. 20549
Information on the operation of the Public Reference Room may be obtained by calling the Commission at 1-800-SEC-0330. The fund’s Form N-Q is available on the EDGAR database on the Commission’s Internet Web site at http://www.sec.gov, and copies of this information may be obtained, upon payment of a duplicating fee, by electronic request at the following e-mail address: publicinfo@sec.gov or by writing the Public Reference Section at the above address.
From time to time, MFS may post important information about the fund or the MFS funds on the MFS web site (mfs.com). This information is available by visiting the “News & Commentary” section of mfs.com or by clicking on the fund’s name under “Variable Insurance Portfolios — VIT” in the “Products and Performance” section of mfs.com.
30
Table of Contents

Table of Contents
| ITEM 2. | CODE OF ETHICS. |
The Registrant has not amended any provision in its Code of Ethics (the “Code”) that relates to any element of the Code’s definition enumerated in paragraph (b) of Item 2 of this Form N-CSR.
| ITEM 3. | AUDIT COMMITTEE FINANCIAL EXPERT. |
Not applicable for semi-annual reports.
| ITEM 4. | PRINCIPAL ACCOUNTANT FEES AND SERVICES. |
Not applicable for semi-annual reports.
| ITEM 5. | AUDIT COMMITTEE OF LISTED REGISTRANTS. |
Not applicable to the Registrant.
| ITEM 6. | INVESTMENTS |
A schedule of investments for each series of the Registrant is included as part of the report to shareholders of such series under Item 1 of this Form N-CSR.
| ITEM 7. | DISCLOSURE OF PROXY VOTING POLICIES AND PROCEDURES FOR CLOSED-END MANAGEMENT INVESTMENT COMPANIES. |
Not applicable to the Registrant.
| ITEM 8. | PORTFOLIO MANAGERS OF CLOSED-END MANAGEMENT INVESTMENT COMPANIES. |
Not applicable to the Registrant.
| ITEM 9. | PURCHASES OF EQUITY SECURITIES BY CLOSED-END MANAGEMENT INVESTMENT COMPANY AND AFFILIATED PURCHASERS. |
Not applicable to the Registrant.
| ITEM 10. | SUBMISSION OF MATTERS TO A VOTE OF SECURITY HOLDERS. |
There were no material changes to the procedures by which shareholders may send recommendations to the Board for nominees to the Registrant’s Board since the Registrant last provided disclosure as to such procedures in response to the requirements of Item 407 (c)(2)(iv) of Regulation S-K or this Item.
Table of Contents
| ITEM 11. | CONTROLS AND PROCEDURES. |
| (a) | Based upon their evaluation of the effectiveness of the registrant’s disclosure controls and procedures (as defined in Rule 30a-3(c) under the Investment Company Act of 1940 (the “Act”)) as conducted within 90 days of the filing date of this report on Form N-CSR, the registrant’s principal financial officer and principal executive officer have concluded that those disclosure controls and procedures provide reasonable assurance that the material information required to be disclosed by the registrant on this report is recorded, processed, summarized and reported within the time periods specified in the Securities and Exchange Commission’s rules and forms. |
| (b) | There were no changes in the registrant’s internal controls over financial reporting (as defined in Rule 30a-3(d) under the Act) that occurred during the second fiscal quarter of the period covered by the report that have materially affected, or are reasonably likely to materially affect, the registrant’s internal control over financial reporting. |
| ITEM 12. | EXHIBITS. |
| (a) | File the exhibits listed below as part of this form. Letter or number the exhibits in the sequence indicated. |
| (1) | Any code of ethics, or amendment thereto, that is the subject of the disclosure required by Item 2, to the extent that the registrant intends to satisfy the Item 2 requirements through filing of an exhibit. |
| (2) | A separate certification for each principal executive officer and principal financial officer of the registrant as required by Rule 30a-2 under the Act (17 CFR 270.30a-2): Attached hereto. |
| (b) | If the report is filed under Section 13(a) or 15(d) of the Exchange Act, provide the certifications required by Rule 30a-2(b) under the Act (17 CFR 270.30a-2(b)), Rule 13a-14(b) or Rule 15d-14(b) under the Exchange Act (17 CFR 240.13a-14(b) or 240.15d-14(b)) and Section 1350 of Chapter 63 of Title 18 of the United States Code (18 U.S.C. 1350) as an exhibit. A certification furnished pursuant to this paragraph will not be deemed “filed” for the purposes of Section 18 of the Exchange Act (15 U.S.C. 78r), or otherwise subject to the liability of that section. Such certification will not be deemed to be incorporated by reference into any filing under the Securities Act of 1933 or the Exchange Act, except to the extent that the registrant specifically incorporates it by reference: Attached hereto. |
Table of Contents
Notice
A copy of the Amended and Restated Declaration of Trust, as amended, of the Registrant is on file with the Secretary of State of The Commonwealth of Massachusetts and notice is hereby given that this instrument is executed on behalf of the Registrant by an officer of the Registrant as an officer and not individually and the obligations of or arising out of this instrument are not binding upon any of the Trustees or shareholders individually, but are binding only upon the assets and property of the respective constituent series of the Registrant.
Table of Contents
SIGNATURES
Pursuant to the requirements of the Securities Exchange Act of 1934 and the Investment Company Act of 1940, the registrant has duly caused this report to be signed on its behalf by the undersigned, thereunto duly authorized.
(Registrant) MFS VARIABLE INSURANCE TRUST
| By (Signature and Title)* | MARIA F. DWYER | |
| Maria F. Dwyer, President |
Date: August 17, 2010
Pursuant to the requirements of the Securities Exchange Act of 1934 and the Investment Company Act of 1940, this report has been signed below by the following persons on behalf of the registrant and in the capacities and on the dates indicated.
| By (Signature and Title)* | MARIA F. DWYER | |
| Maria F. Dwyer, President (Principal Executive Officer) |
Date: August 17, 2010
| By (Signature and Title)* | JOHN M. CORCORAN | |
| John M. Corcoran, Treasurer (Principal Financial Officer and Accounting Officer) |
Date: August 17, 2010
| * | Print name and title of each signing officer under his or her signature. |